Purdue University Purdue University Purdue e-Pubs Purdue e-Pubs Open Access Dissertations Theses and Dissertations 12-2017 A New Transduction Mechanism for Detecting Biological A New Transduction Mechanism for Detecting Biological Radiation Damage using Metabolic Response of Yeast as a Radiation Damage using Metabolic Response of Yeast as a Surrogate Marker Surrogate Marker Chang Keun Yoon Purdue University Follow this and additional works at: https://docs.lib.purdue.edu/open_access_dissertations Recommended Citation Recommended Citation Yoon, Chang Keun, "A New Transduction Mechanism for Detecting Biological Radiation Damage using Metabolic Response of Yeast as a Surrogate Marker" (2017). Open Access Dissertations. 1666. https://docs.lib.purdue.edu/open_access_dissertations/1666 This document has been made available through Purdue e-Pubs, a service of the Purdue University Libraries. Please contact [email protected] for additional information.

Welcome message from author
This document is posted to help you gain knowledge. Please leave a comment to let me know what you think about it! Share it to your friends and learn new things together.
Transcript
Purdue University Purdue University
Purdue e-Pubs Purdue e-Pubs
Open Access Dissertations Theses and Dissertations
12-2017
A New Transduction Mechanism for Detecting Biological A New Transduction Mechanism for Detecting Biological
Radiation Damage using Metabolic Response of Yeast as a Radiation Damage using Metabolic Response of Yeast as a
Surrogate Marker Surrogate Marker
Chang Keun Yoon Purdue University
Follow this and additional works at: https://docs.lib.purdue.edu/open_access_dissertations
Recommended Citation Recommended Citation Yoon, Chang Keun, "A New Transduction Mechanism for Detecting Biological Radiation Damage using Metabolic Response of Yeast as a Surrogate Marker" (2017). Open Access Dissertations. 1666. https://docs.lib.purdue.edu/open_access_dissertations/1666
This document has been made available through Purdue e-Pubs, a service of the Purdue University Libraries. Please contact [email protected] for additional information.
A NEW TRANSDUCTION MECHANISM FOR DETECTING
BIOLOGICAL RADIATION DAMAGE USING METABOLIC
RESPONSE OF YEAST AS A SURROGATE MARKER
by
Chang Keun Yoon
A Dissertation
Submitted to the Faculty of Purdue University
In Partial Fulfillment of the Requirements for the degree of
Doctor of Philosophy
School of Electrical and Computer Engineering
West Lafayette, Indiana
December 2017
ii
THE PURDUE UNIVERSITY GRADUATE SCHOOL
STATEMENT OF COMMITTEE APPROVAL
Dr. Babak Ziaie, Chair
Department of Electrical and Computer Engineering
Dr. Zhihong Chen
Department of Electrical and Computer Engineering
Dr. Çağri Savran
Department of Mechanical Engineering
Dr. Peide Ye
Department of Electrical and Computer Engineering
Approved by:
Dr. Venkataramanan Balakrishnan
Head of the Graduate Program
iii
ACKNOWLEDGMENTS
This thesis would not have been possible without boundless support, insightful discussion in
research, creative critiques, and mentoring by my advisor Professor Ziaie. I would like to thank
him for his guidance to accomplish my works this far through all my years in research at Purdue
University. He inspired me to fulfill my goals, discover countless noble ideas, and think creatively
in research with his insights and knowledge in science. Moreover, I would like to thank my
committee members, Professor Cağri Savran, Professor Peter (Peide) Ye, and Professor Zhihong
Chen for their advice and wisdom.
I give my special thanks to my colleagues: Dr. Charilaos Mousoulis, Dr. Girish Chitnis,
Dr. Manuel Ochoa, Dr. Albert Kim, Dr. Jun Hyeong Park, Dr. Seung Hyun Song, Dr. Seung Seob
Lee, Rahim Rahimi, Junyoung Kim, Hongjie Jiang, Jiawei Zhou, Tejasvi Parupudi, Tianshuo
(Tony) Zhang, and Wuyang Yu for their brilliant ideas; moreover, numerous efforts and time that
we spent together in our laboratory. I also would like to thank my friends around me whom spared
their time and love to help me finish this long difficult journey with enjoyment and pleasance.
This thesis is dedicated to my parents Ja Am Yoon, Jung Nam Park, and my lovely sister So Young
Yoon, who truly supported me with all their heart, and kept praying for my happiness. I would not
have successfully finished this work without you.
iv
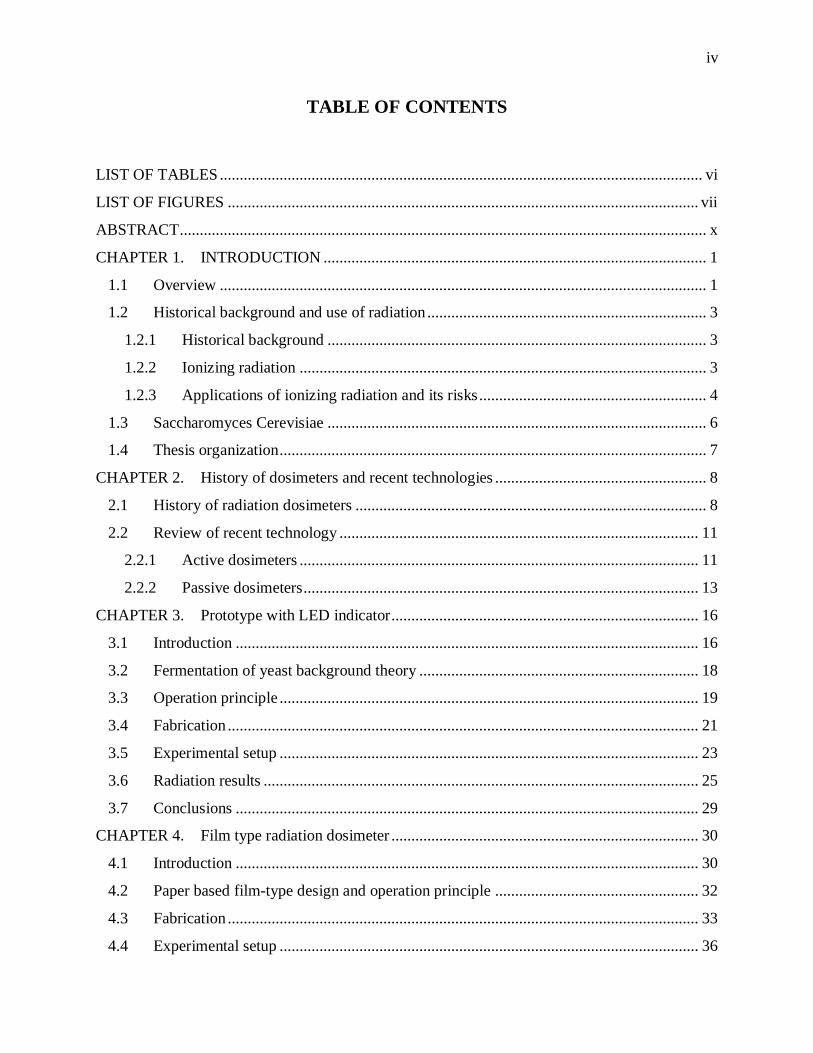
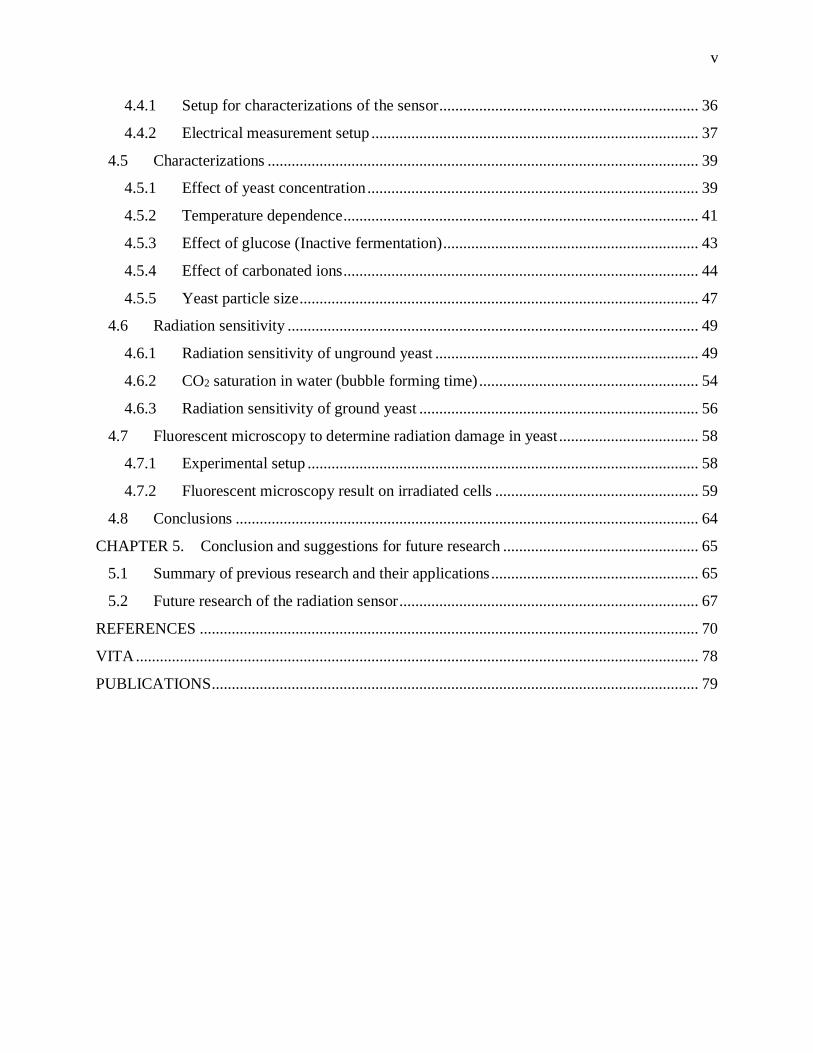
TABLE OF CONTENTS
LIST OF TABLES ......................................................................................................................... vi
LIST OF FIGURES ...................................................................................................................... vii
ABSTRACT .................................................................................................................................... x
CHAPTER 1. INTRODUCTION ................................................................................................ 1
1.1 Overview .......................................................................................................................... 1
1.2 Historical background and use of radiation ...................................................................... 3
1.2.1 Historical background ............................................................................................... 3
1.2.2 Ionizing radiation ...................................................................................................... 3
1.2.3 Applications of ionizing radiation and its risks ......................................................... 4
1.3 Saccharomyces Cerevisiae ............................................................................................... 6
1.4 Thesis organization ........................................................................................................... 7
CHAPTER 2. History of dosimeters and recent technologies ..................................................... 8
2.1 History of radiation dosimeters ........................................................................................ 8
2.2 Review of recent technology .......................................................................................... 11
2.2.1 Active dosimeters .................................................................................................... 11
2.2.2 Passive dosimeters ................................................................................................... 13
CHAPTER 3. Prototype with LED indicator ............................................................................. 16
3.1 Introduction .................................................................................................................... 16
3.2 Fermentation of yeast background theory ...................................................................... 18
3.3 Operation principle ......................................................................................................... 19
3.4 Fabrication ...................................................................................................................... 21
3.5 Experimental setup ......................................................................................................... 23
3.6 Radiation results ............................................................................................................. 25
3.7 Conclusions .................................................................................................................... 29
CHAPTER 4. Film type radiation dosimeter ............................................................................. 30
4.1 Introduction .................................................................................................................... 30
4.2 Paper based film-type design and operation principle ................................................... 32
4.3 Fabrication ...................................................................................................................... 33
4.4 Experimental setup ......................................................................................................... 36
v
4.4.1 Setup for characterizations of the sensor ................................................................. 36
4.4.2 Electrical measurement setup .................................................................................. 37
4.5 Characterizations ............................................................................................................ 39
4.5.1 Effect of yeast concentration ................................................................................... 39
4.5.2 Temperature dependence ......................................................................................... 41
4.5.3 Effect of glucose (Inactive fermentation) ................................................................ 43
4.5.4 Effect of carbonated ions ......................................................................................... 44
4.5.5 Yeast particle size .................................................................................................... 47
4.6 Radiation sensitivity ....................................................................................................... 49
4.6.1 Radiation sensitivity of unground yeast .................................................................. 49
4.6.2 CO2 saturation in water (bubble forming time) ....................................................... 54
4.6.3 Radiation sensitivity of ground yeast ...................................................................... 56
4.7 Fluorescent microscopy to determine radiation damage in yeast ................................... 58
4.7.1 Experimental setup .................................................................................................. 58
4.7.2 Fluorescent microscopy result on irradiated cells ................................................... 59
4.8 Conclusions .................................................................................................................... 64
CHAPTER 5. Conclusion and suggestions for future research ................................................. 65
5.1 Summary of previous research and their applications .................................................... 65
5.2 Future research of the radiation sensor ........................................................................... 67
REFERENCES ............................................................................................................................. 70
VITA ............................................................................................................................................. 78
PUBLICATIONS .......................................................................................................................... 79
vi
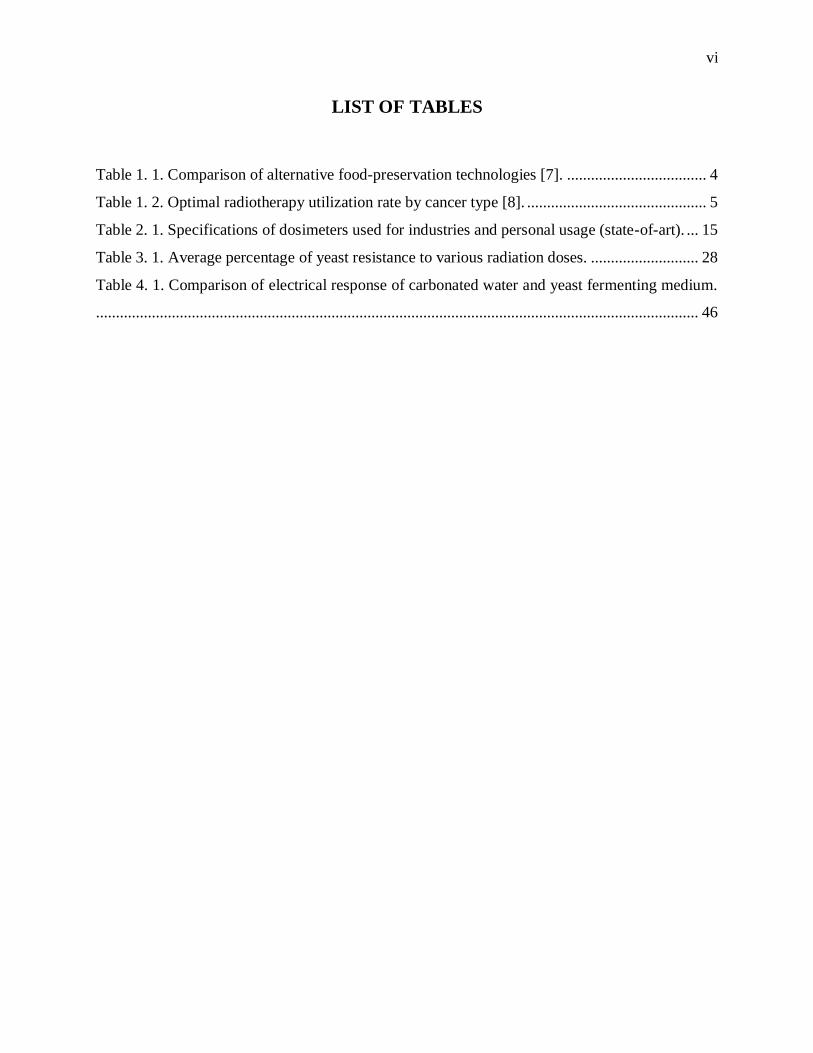
LIST OF TABLES
Table 1. 1. Comparison of alternative food-preservation technologies [7]. ................................... 4
Table 1. 2. Optimal radiotherapy utilization rate by cancer type [8]. ............................................. 5
Table 2. 1. Specifications of dosimeters used for industries and personal usage (state-of-art). ... 15
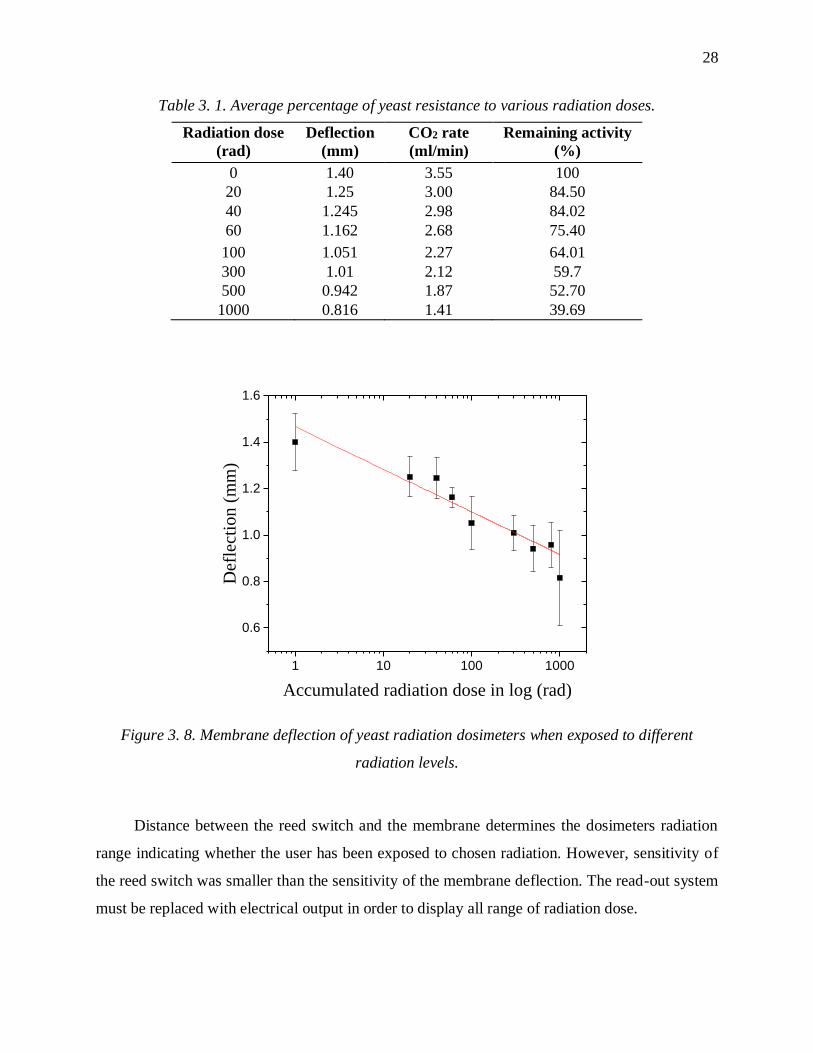
Table 3. 1. Average percentage of yeast resistance to various radiation doses. ........................... 28
Table 4. 1. Comparison of electrical response of carbonated water and yeast fermenting medium.
....................................................................................................................................................... 46
vii
LIST OF FIGURES
Figure 2. 1. A photographic film-badge invented by Ernest Wollan from the Metallurgical
Laboratory in 1943 [14]. ............................................................................................. 8
Figure 2. 2. The chromoradiometer measures color changed (shaded) portion of the platinocyanide
coated pastilles to detect radiation exposure [14]........................................................ 9
Figure 2. 3. Hand-built Geiger-Muller tube in 1940s and a working principle illustration of the
device [14]. ................................................................................................................ 10
Figure 2. 4. Interior view of the pocket dosimeter [20]. ............................................................... 11
Figure 2. 5. The working principle of RADFET. It utilizes the trap charges from the oxide and
interface trap created during the growth of insulator layer [19]. ............................... 12
Figure 2. 6. SiO2 band diagram with hole trap illustrated [26]. ................................................... 13
Figure 2. 7. Basic principles of TL, and OSL process. [36]. ........................................................ 14
Figure 3. 1. Average measurable dose in DOE [39]. .................................................................... 16
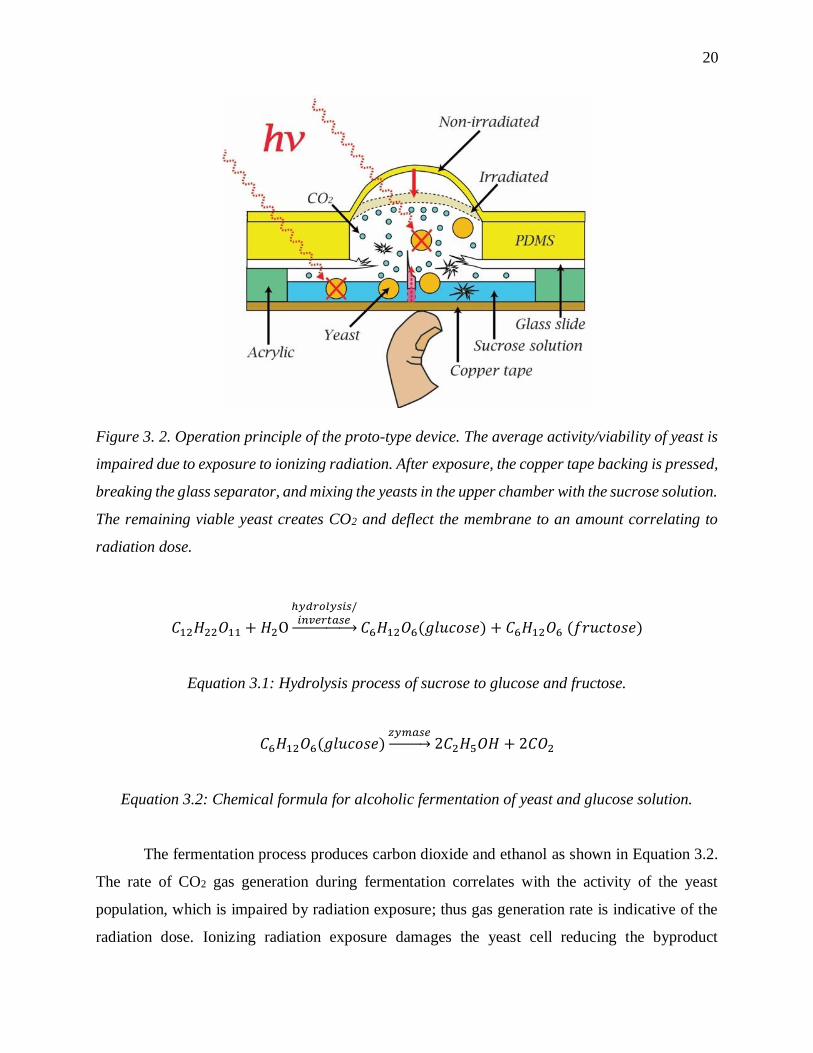
Figure 3. 2. Operation principle of the proto-type device. The average activity/viability of yeast is
impaired due to exposure to ionizing radiation. After exposure, the copper tape
backing is pressed, breaking the glass separator, and mixing the yeasts in the upper
chamber with the sucrose solution. The remaining viable yeast creates CO2 and deflect
the membrane to an amount correlating to radiation dose. ....................................... 20
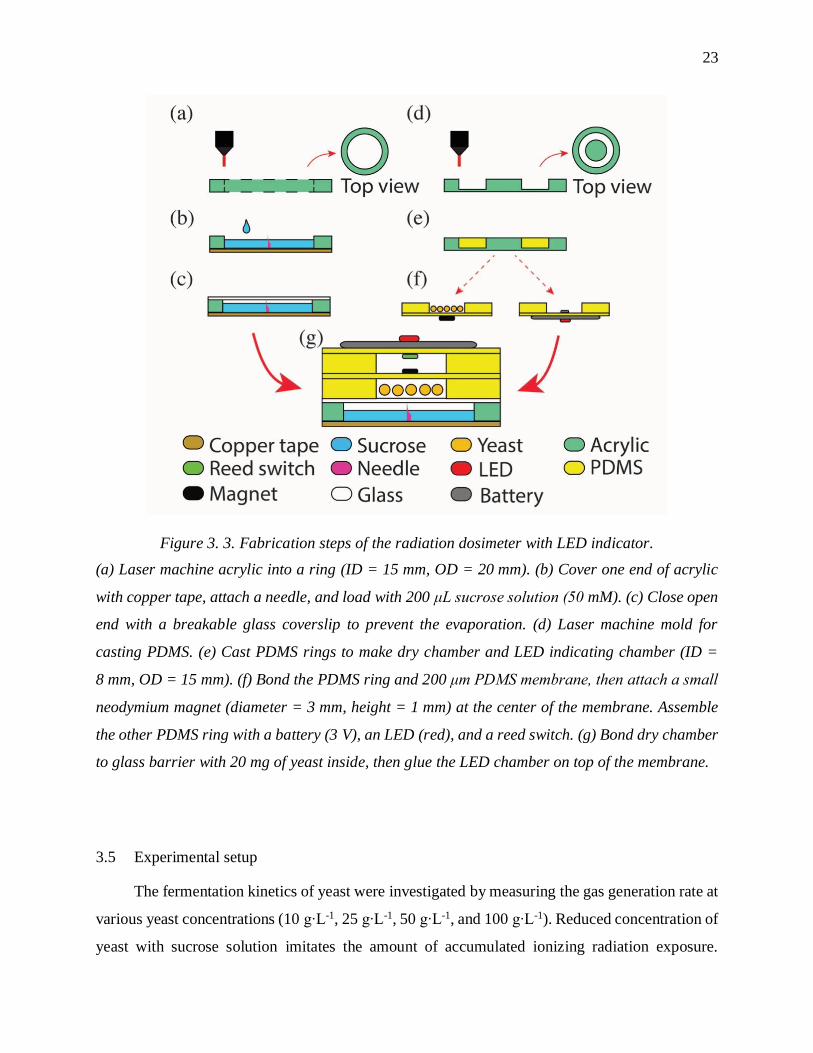
Figure 3. 3. Fabrication steps of the radiation dosimeter with LED indicator.............................. 23
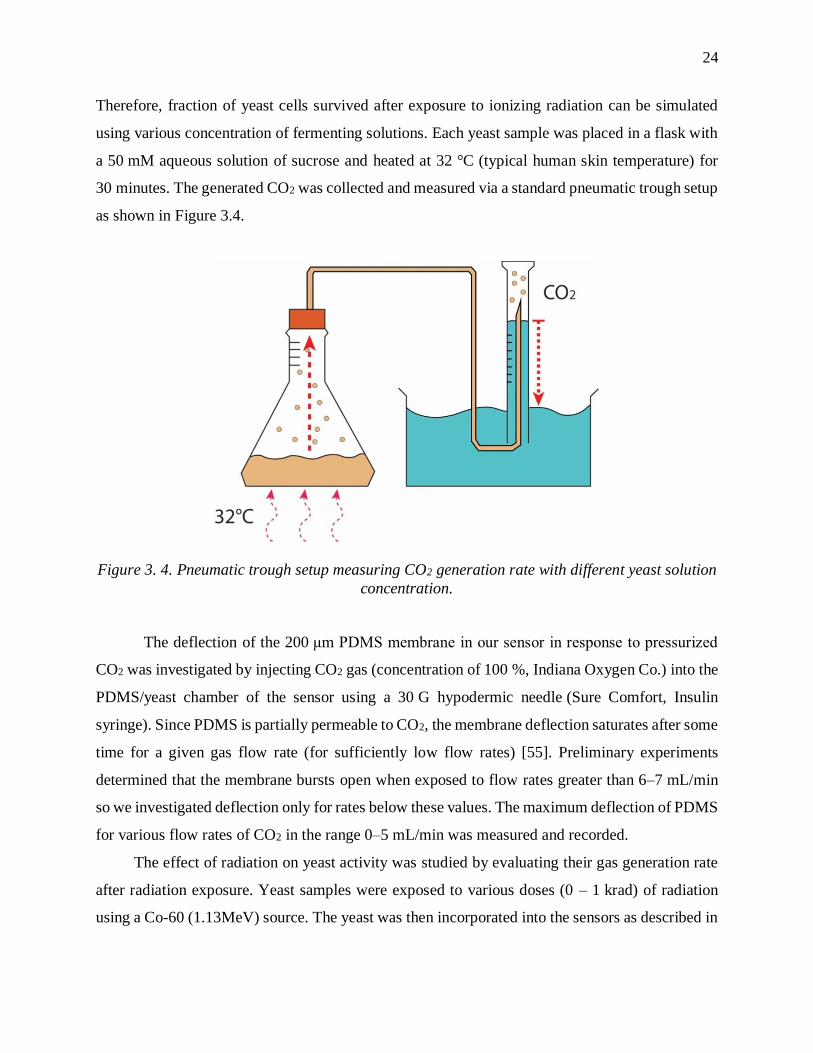
Figure 3. 4. Pneumatic trough setup measuring CO2 generation rate with different yeast solution
concentration. ............................................................................................................ 24
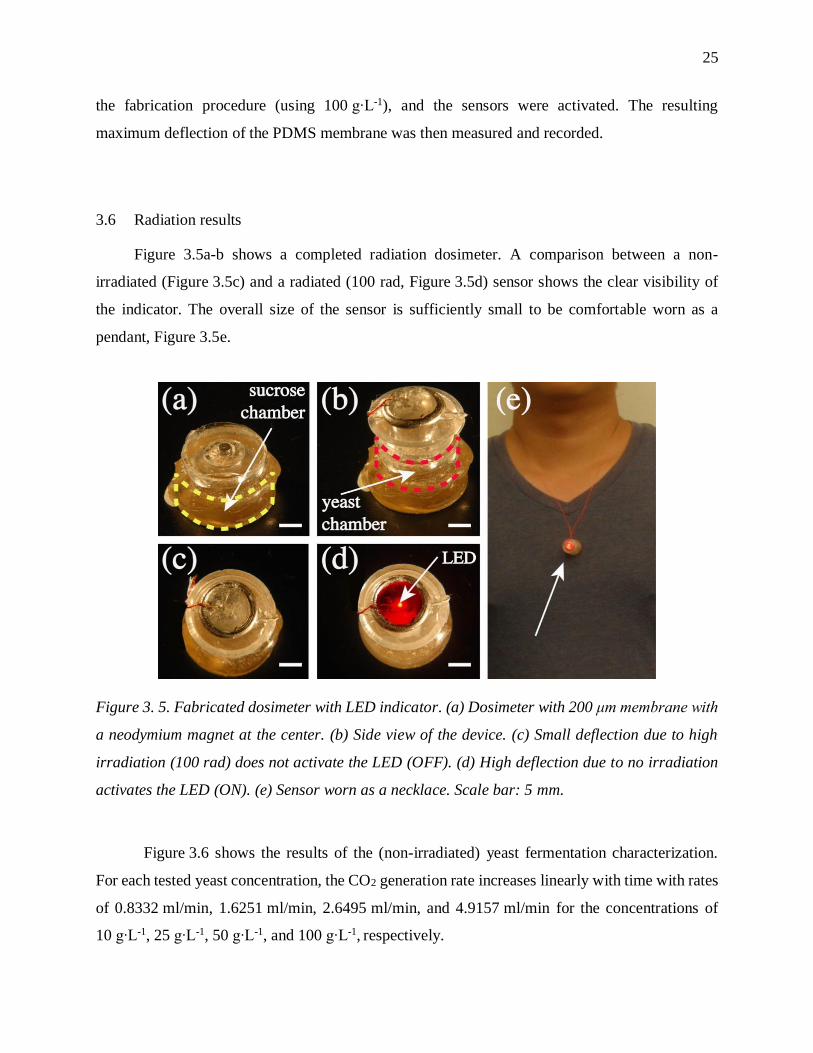
Figure 3. 5. Fabricated dosimeter with LED indicator. (a) Dosimeter with 200 μm membrane with
a neodymium magnet at the center. (b) Side view of the device. (c) Small deflection
due to high irradiation (100 rad) does not activate the LED (OFF). (d) High deflection
due to no irradiation activates the LED (ON). (e) Sensor worn as a necklace. Scale bar:
5 mm. ......................................................................................................................... 25
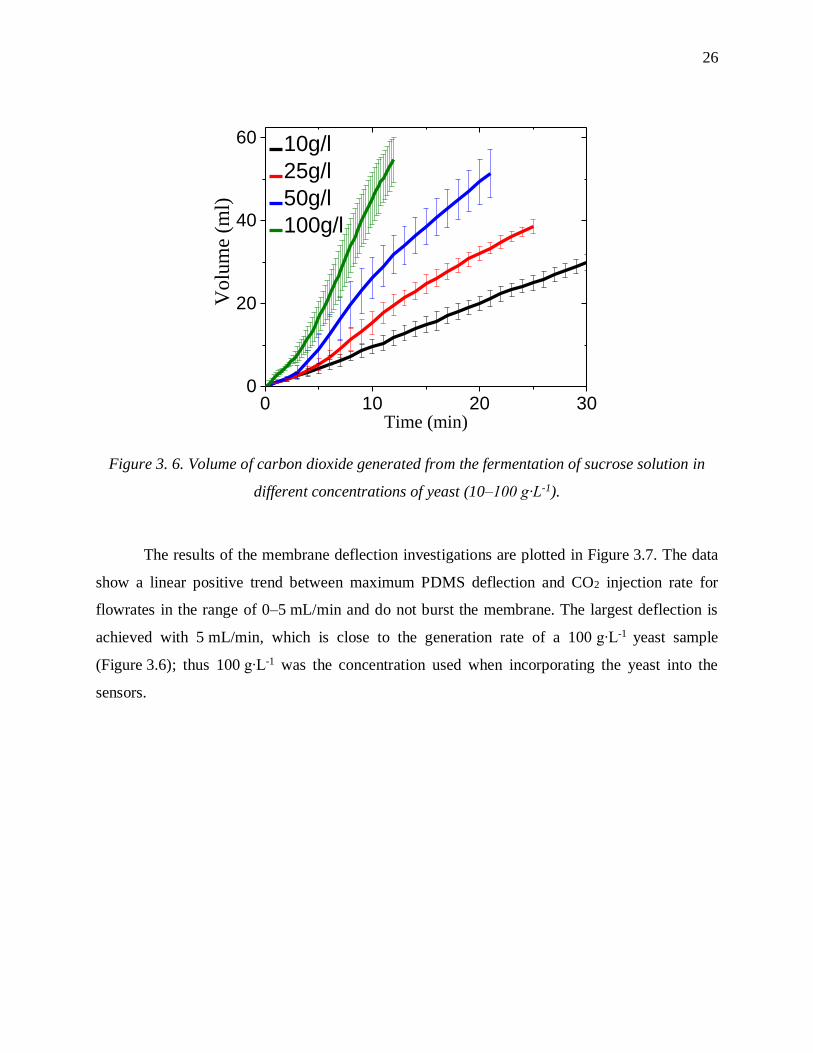
Figure 3. 6. Volume of carbon dioxide generated from the fermentation of sucrose solution in
different concentrations of yeast (10–100 g∙L-1). ...................................................... 26
viii
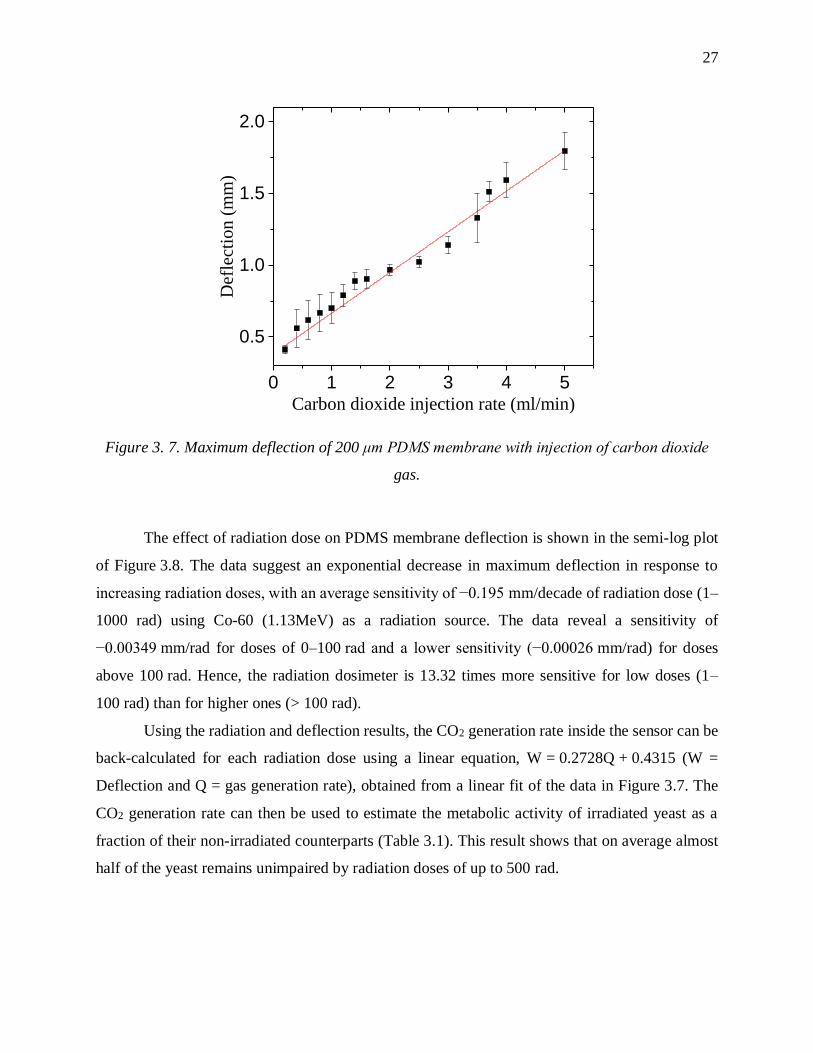
Figure 3. 7. Maximum deflection of 200 μm PDMS membrane with injection of carbon dioxide
gas. ............................................................................................................................. 27
Figure 3. 8. Membrane deflection of yeast radiation dosimeters when exposed to different radiation
levels. ......................................................................................................................... 28
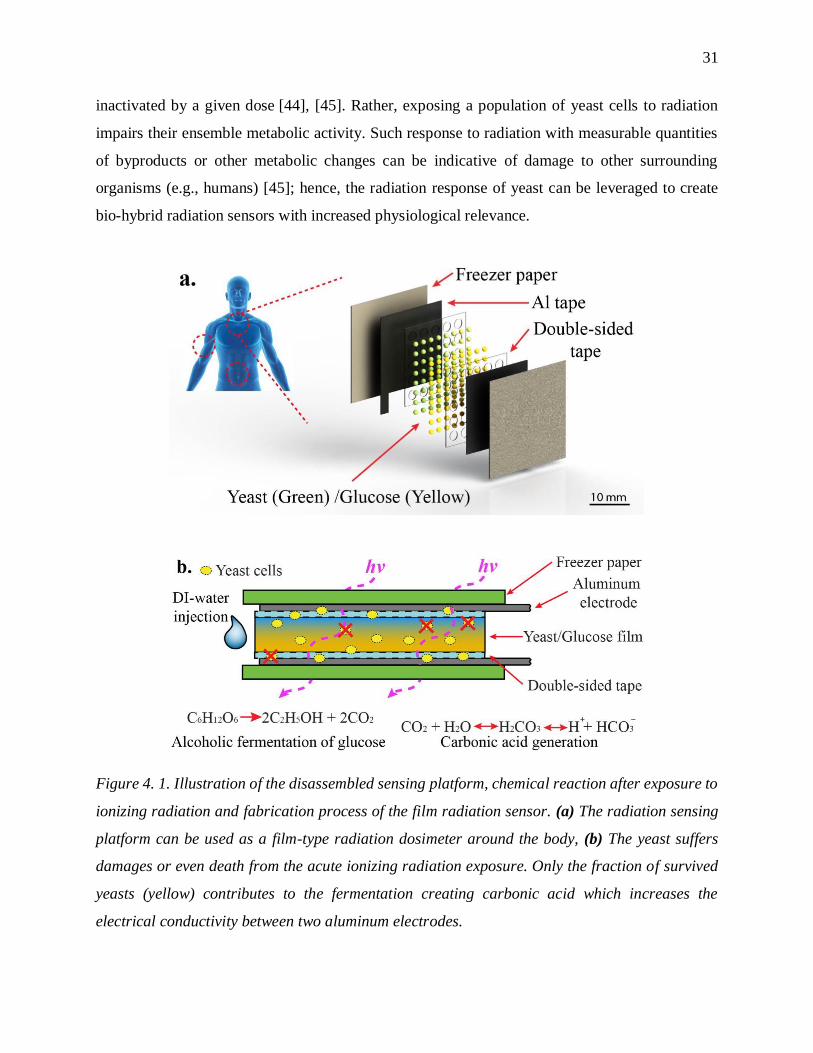
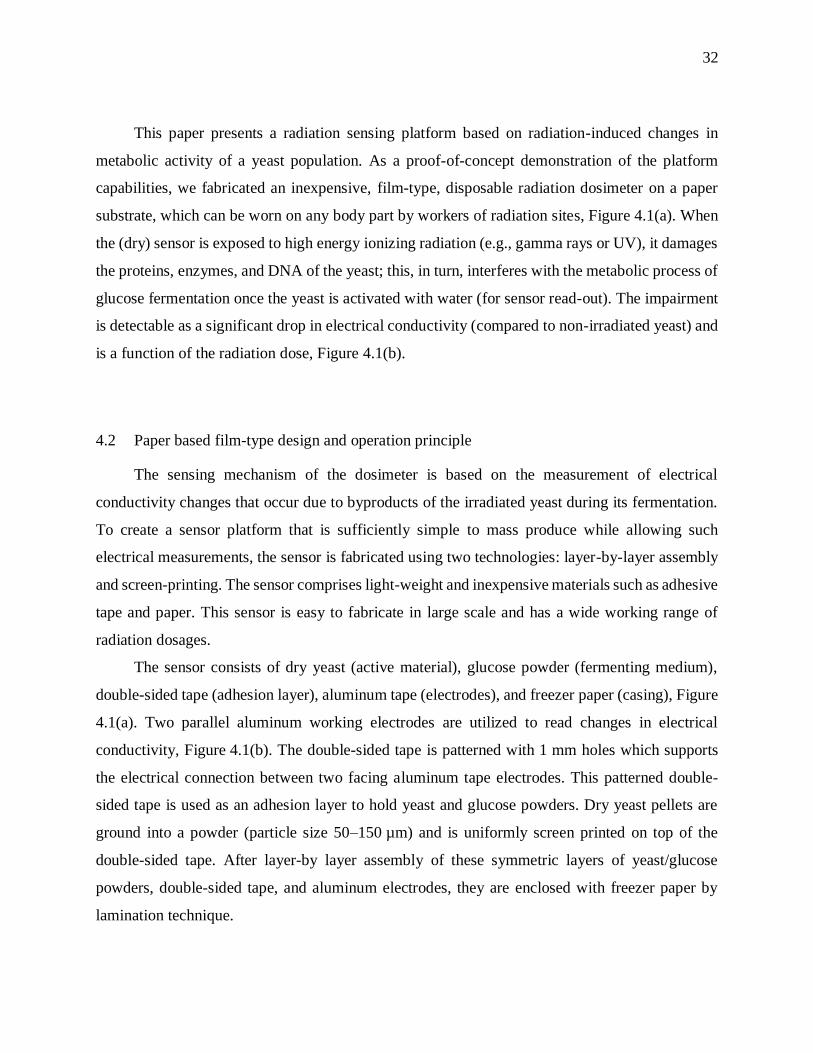
Figure 4. 1. Illustration of the disassembled sensing platform, chemical reaction after exposure to
ionizing radiation and fabrication process of the film radiation sensor. (a) The
radiation sensing platform can be used as a film-type radiation dosimeter around the
body, (b) The yeast suffers damages or even death from the acute ionizing radiation
exposure. Only the fraction of survived yeasts (yellow) contributes to the fermentation
creating carbonic acid which increases the electrical conductivity between two
aluminum electrodes. ................................................................................................. 31
Figure 4. 2. Fabrication process of the film-type dosimeter. (a-b) laser machine aluminum
(10 × 10 mm2) and tape (5 × 5 array that are a millimeter apart from each other) using
laser engraver; (c) laser machine the Freezer paper; (d) assemble tape and aluminum
on hydrophobic side of freezer paper substrate; (e) plasma treat the double sided layer
surface to increase the hydrophilicity; (f) deposit yeast powder on top of the double-
sided tape side, then repeat the process through (a-f) to make a symmetric glucose
layer; (g) sandwich tapes together (h) seal edges of the freezer paper to package with
thermal lamination except the open-end at electrical connection side. ..................... 33
Figure 4. 3. Image of film-type dosimeter after lamination. ......................................................... 35
Figure 4. 4. Setup for electrical conductivity measurement. ........................................................ 38
Figure 4. 5. Yeast sensors (red) tested in normal condition without radiation exposure and sensors
with only glucose (blue). ........................................................................................... 39
Figure 4. 6. Electrical response of the normal yeast in temperature controlled experiment (a) overall
graph measured in 10 minutes, and (b) exploit view of graph within 2 minutes. ..... 40
Figure 4. 7. Normalized impedance of the sensors in different temperature conditions. ............. 42
Figure 4. 8. Normalized impedance during the fermentation without glucose. ............................ 43
Figure 4. 9. Average capacitance and resistance change with different concentrations of carbonated
water. ......................................................................................................................... 45
Figure 4. 10. Normalized capacitance and resistance of the fermenting yeast particles after ionizing
radiation exposure. .................................................................................................... 46
ix
Figure 4. 11. Particle size, uniformity and its electrical conductance. (a) Average particle size after
grinding and filtering, (b) Uniformity of the particle sizes, (c) Electrical conductance
change in different particle size. ................................................................................ 48
Figure 4. 12. Change in electrical impedance of irradiated film dosimeters with unground yeast
particles in response to 0-1000 rad. (a) Unground yeasts expose to Cs-137, (b)
Unground yeasts exposed to Co-60, (c) Rate of change in impedance of unground
samples at 1 min. ....................................................................................................... 52
Figure 4. 13. Initial pressure built inside the sensor. (a) Initial pressure built up of different
concentration of yeasts, (b) Comparison of theoretically calculated pressure build-up
inside and experimental result. .................................................................................. 55
Figure 4. 14. Video recorded bubble forming time using unground yeast sensor. (a) At the onset
of liquid injection at 0 minute, (b) First CO2 bubble was observed at 6 minutes,
(c) More bubbles were formed in different sizes and locations after 6 minutes. ...... 56
Figure 4. 15. Change in electrical impedance of irradiated film dosimeters with ground yeast
particles in response to 0-1000 rad. (a) 50 µm yeasts exposed to Cs-137, (b) 50 µm
yeasts exposed to Co-60, (c) Rate of change in impedance of 50 µm ground samples
at 1 min (50 ± 5.13 µm). ............................................................................................ 58
Figure 4. 16. TEM of Saccharomyces cerevisiae (a) non-irradiated and (b) irradiated [69]. ..... 59
Figure 4. 17. Saccharomyces cerevisiae viability after UV light irradiation [69]. ....................... 60
Figure 4. 18. Bright field and fluorescence microscopy conducted to non-irradiated ground yeast
samples. (Circles indicate damaged cells in the same picture, scale bar = 50µm) .... 61
Figure 4. 19. Irradiated yeasts stained with PI (propidium iodide) dye. ....................................... 62
Figure 4. 20. Fluorescence intensity and percentage of number of radiation damaged cells respect
to accumulated radiation dose. (a)Fluorescence intensity of the stained yeast cells
that are exposed to gamma radiation showing intensity of brightest cell (CTCF) and
overall integrated fluorescence of the cells, (b) Number of cells damaged under
radiation exposure. ................................................................................................... 63
Figure 5. 1. Number of ionizations in the reference cell as a function of incident electron and
photon energy applied [70]. ..................................................................................... 68
Figure 5. 2. Hermetically sealed sensor including water reservoir. .............................................. 69
x
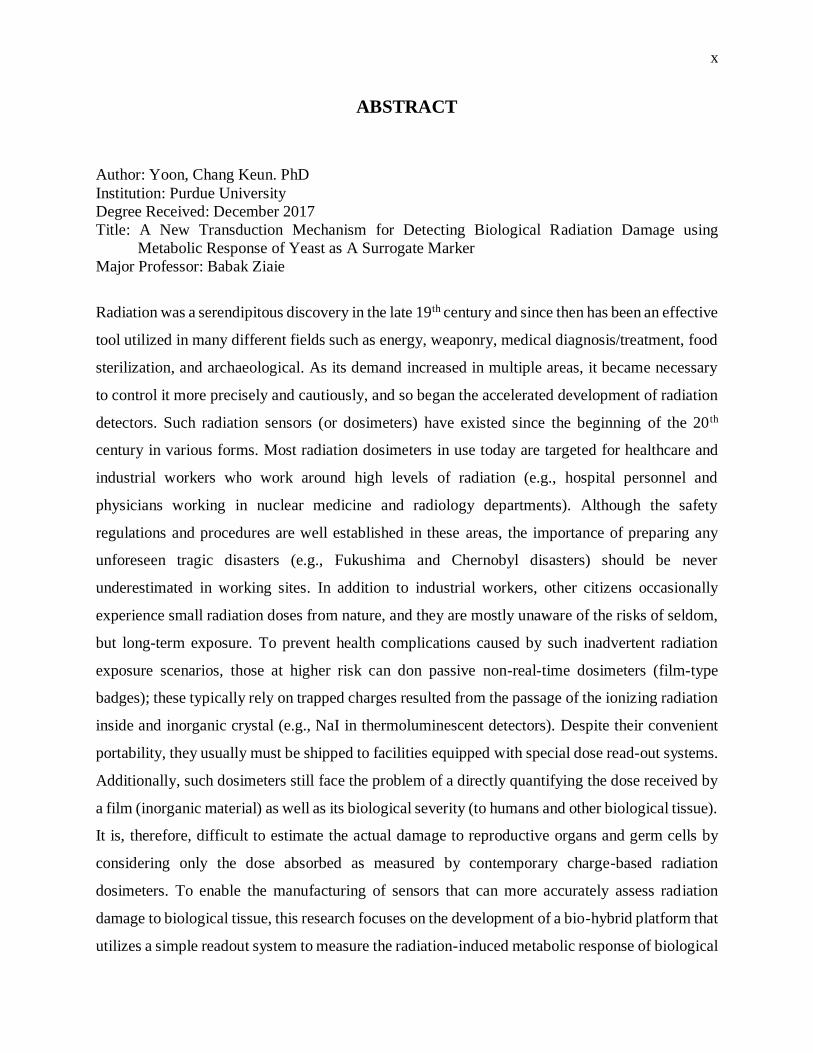
ABSTRACT
Author: Yoon, Chang Keun. PhD
Institution: Purdue University
Degree Received: December 2017
Title: A New Transduction Mechanism for Detecting Biological Radiation Damage using
Metabolic Response of Yeast as A Surrogate Marker
Major Professor: Babak Ziaie
Radiation was a serendipitous discovery in the late 19th century and since then has been an effective
tool utilized in many different fields such as energy, weaponry, medical diagnosis/treatment, food
sterilization, and archaeological. As its demand increased in multiple areas, it became necessary
to control it more precisely and cautiously, and so began the accelerated development of radiation
detectors. Such radiation sensors (or dosimeters) have existed since the beginning of the 20th
century in various forms. Most radiation dosimeters in use today are targeted for healthcare and
industrial workers who work around high levels of radiation (e.g., hospital personnel and
physicians working in nuclear medicine and radiology departments). Although the safety
regulations and procedures are well established in these areas, the importance of preparing any
unforeseen tragic disasters (e.g., Fukushima and Chernobyl disasters) should be never
underestimated in working sites. In addition to industrial workers, other citizens occasionally
experience small radiation doses from nature, and they are mostly unaware of the risks of seldom,
but long-term exposure. To prevent health complications caused by such inadvertent radiation
exposure scenarios, those at higher risk can don passive non-real-time dosimeters (film-type
badges); these typically rely on trapped charges resulted from the passage of the ionizing radiation
inside and inorganic crystal (e.g., NaI in thermoluminescent detectors). Despite their convenient
portability, they usually must be shipped to facilities equipped with special dose read-out systems.
Additionally, such dosimeters still face the problem of a directly quantifying the dose received by
a film (inorganic material) as well as its biological severity (to humans and other biological tissue).
It is, therefore, difficult to estimate the actual damage to reproductive organs and germ cells by
considering only the dose absorbed as measured by contemporary charge-based radiation
dosimeters. To enable the manufacturing of sensors that can more accurately assess radiation
damage to biological tissue, this research focuses on the development of a bio-hybrid platform that
utilizes a simple readout system to measure the radiation-induced metabolic response of biological
xi
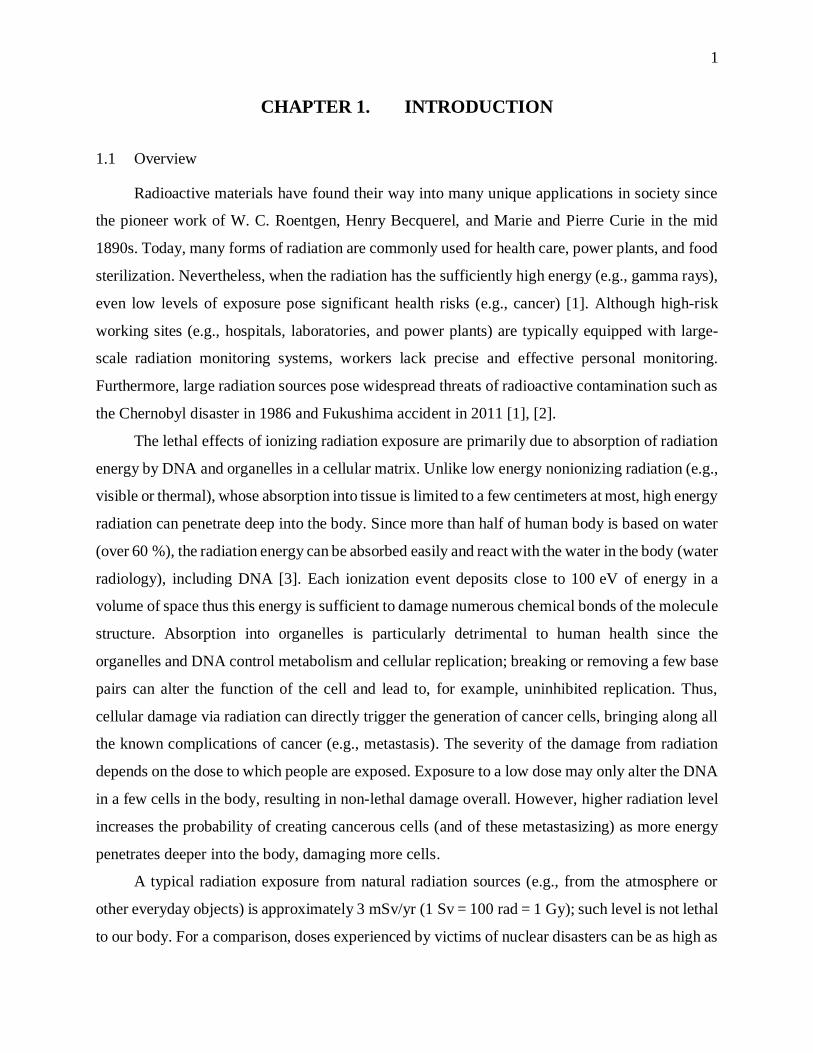
microorganisms such as yeast immediately after exposure. The sensor can be manufactured in
large quantities with a low fabrication cost using screen printing or roll-to-roll techniques and
provide a response that has a direct biological correlation to the radiation exposure (in terms of
either DNA or protein damage in cell). In this thesis, I first discuss a preliminary prototype
developed and tested in the lab (a MEMS-type device with a deflectable polymer membrane
switch); then I will discuss mainly a film-type capacitive radiation sensor using yeast as a surrogate
for detecting biological radiation damage. The complete optimization of sensitivity, response time,
and dynamic range of the sensor are discussed. Finally, I present an experiment conducted to
classify the cause of metabolic instability of yeast after radiation exposure (studied using
fluorescence microscopy).
1
CHAPTER 1. INTRODUCTION
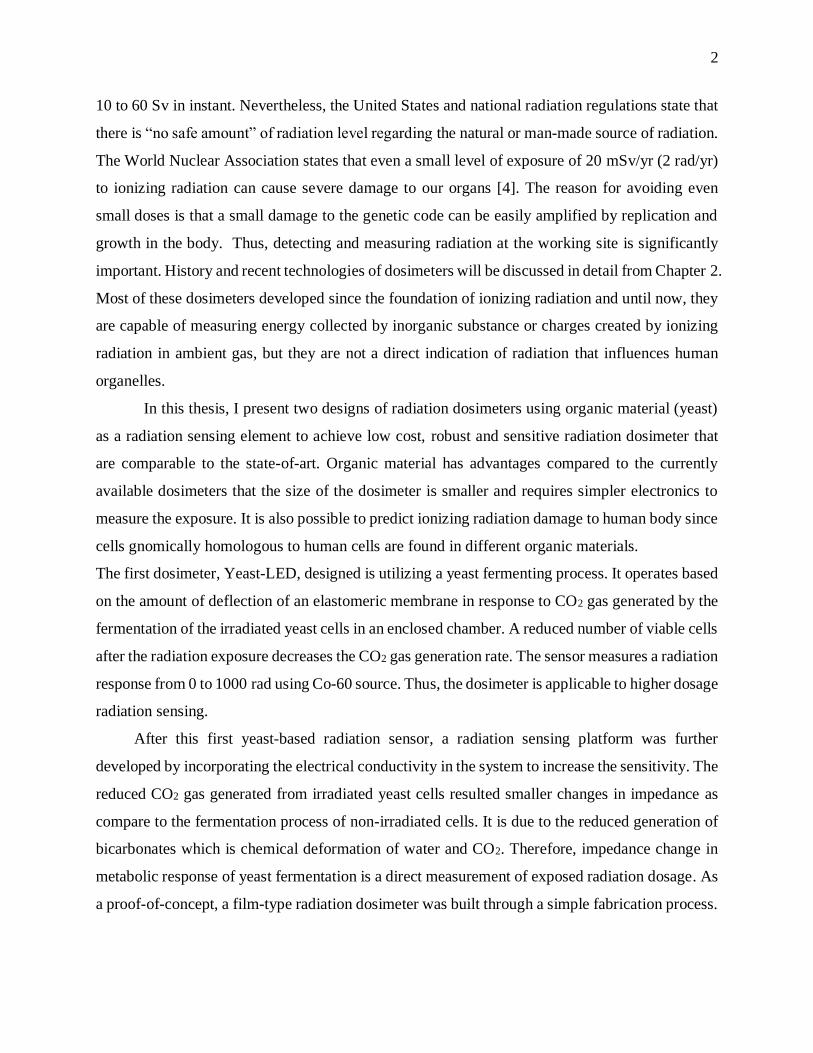
1.1 Overview
Radioactive materials have found their way into many unique applications in society since
the pioneer work of W. C. Roentgen, Henry Becquerel, and Marie and Pierre Curie in the mid
1890s. Today, many forms of radiation are commonly used for health care, power plants, and food
sterilization. Nevertheless, when the radiation has the sufficiently high energy (e.g., gamma rays),
even low levels of exposure pose significant health risks (e.g., cancer) [1]. Although high-risk
working sites (e.g., hospitals, laboratories, and power plants) are typically equipped with large-
scale radiation monitoring systems, workers lack precise and effective personal monitoring.
Furthermore, large radiation sources pose widespread threats of radioactive contamination such as
the Chernobyl disaster in 1986 and Fukushima accident in 2011 [1], [2].
The lethal effects of ionizing radiation exposure are primarily due to absorption of radiation
energy by DNA and organelles in a cellular matrix. Unlike low energy nonionizing radiation (e.g.,
visible or thermal), whose absorption into tissue is limited to a few centimeters at most, high energy
radiation can penetrate deep into the body. Since more than half of human body is based on water
(over 60 %), the radiation energy can be absorbed easily and react with the water in the body (water
radiology), including DNA [3]. Each ionization event deposits close to 100 eV of energy in a
volume of space thus this energy is sufficient to damage numerous chemical bonds of the molecule
structure. Absorption into organelles is particularly detrimental to human health since the
organelles and DNA control metabolism and cellular replication; breaking or removing a few base
pairs can alter the function of the cell and lead to, for example, uninhibited replication. Thus,
cellular damage via radiation can directly trigger the generation of cancer cells, bringing along all
the known complications of cancer (e.g., metastasis). The severity of the damage from radiation
depends on the dose to which people are exposed. Exposure to a low dose may only alter the DNA
in a few cells in the body, resulting in non-lethal damage overall. However, higher radiation level
increases the probability of creating cancerous cells (and of these metastasizing) as more energy
penetrates deeper into the body, damaging more cells.
A typical radiation exposure from natural radiation sources (e.g., from the atmosphere or
other everyday objects) is approximately 3 mSv/yr (1 Sv = 100 rad = 1 Gy); such level is not lethal
to our body. For a comparison, doses experienced by victims of nuclear disasters can be as high as
2
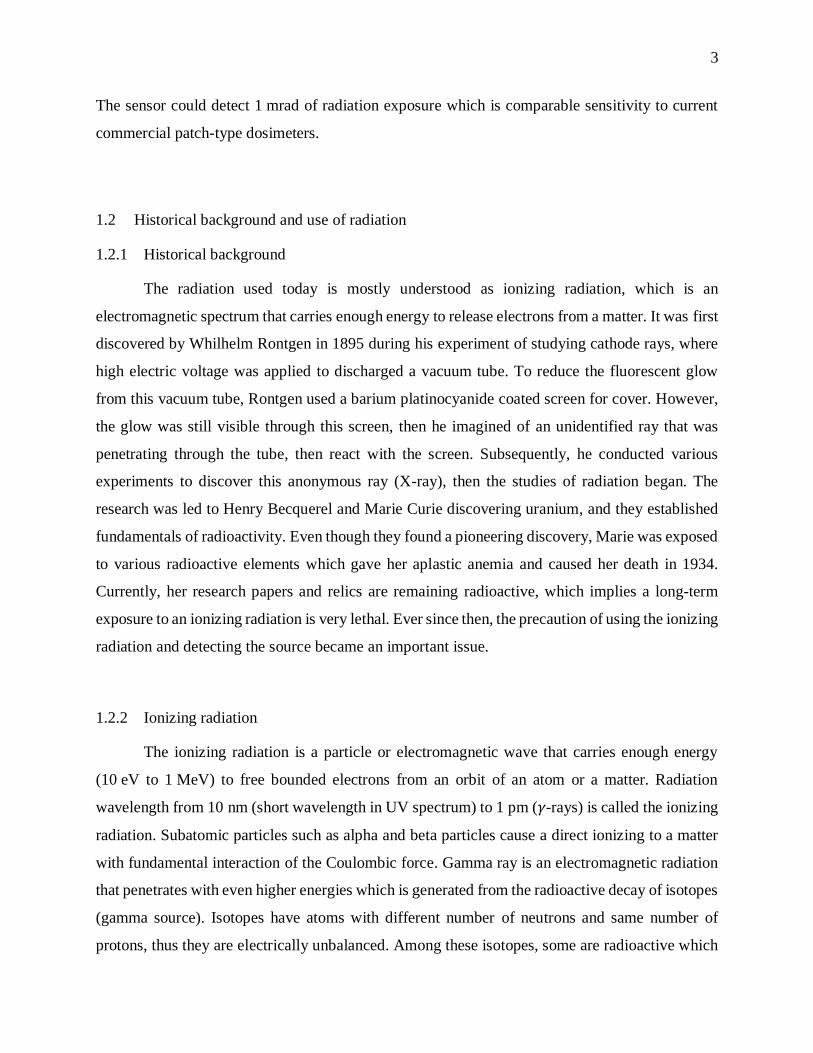
10 to 60 Sv in instant. Nevertheless, the United States and national radiation regulations state that
there is “no safe amount” of radiation level regarding the natural or man-made source of radiation.
The World Nuclear Association states that even a small level of exposure of 20 mSv/yr (2 rad/yr)
to ionizing radiation can cause severe damage to our organs [4]. The reason for avoiding even
small doses is that a small damage to the genetic code can be easily amplified by replication and
growth in the body. Thus, detecting and measuring radiation at the working site is significantly
important. History and recent technologies of dosimeters will be discussed in detail from Chapter 2.
Most of these dosimeters developed since the foundation of ionizing radiation and until now, they
are capable of measuring energy collected by inorganic substance or charges created by ionizing
radiation in ambient gas, but they are not a direct indication of radiation that influences human
organelles.
In this thesis, I present two designs of radiation dosimeters using organic material (yeast)
as a radiation sensing element to achieve low cost, robust and sensitive radiation dosimeter that
are comparable to the state-of-art. Organic material has advantages compared to the currently
available dosimeters that the size of the dosimeter is smaller and requires simpler electronics to
measure the exposure. It is also possible to predict ionizing radiation damage to human body since
cells gnomically homologous to human cells are found in different organic materials.
The first dosimeter, Yeast-LED, designed is utilizing a yeast fermenting process. It operates based
on the amount of deflection of an elastomeric membrane in response to CO2 gas generated by the
fermentation of the irradiated yeast cells in an enclosed chamber. A reduced number of viable cells
after the radiation exposure decreases the CO2 gas generation rate. The sensor measures a radiation
response from 0 to 1000 rad using Co-60 source. Thus, the dosimeter is applicable to higher dosage
radiation sensing.
After this first yeast-based radiation sensor, a radiation sensing platform was further
developed by incorporating the electrical conductivity in the system to increase the sensitivity. The
reduced CO2 gas generated from irradiated yeast cells resulted smaller changes in impedance as
compare to the fermentation process of non-irradiated cells. It is due to the reduced generation of
bicarbonates which is chemical deformation of water and CO2. Therefore, impedance change in
metabolic response of yeast fermentation is a direct measurement of exposed radiation dosage. As
a proof-of-concept, a film-type radiation dosimeter was built through a simple fabrication process.
3
The sensor could detect 1 mrad of radiation exposure which is comparable sensitivity to current
commercial patch-type dosimeters.
1.2 Historical background and use of radiation
1.2.1 Historical background
The radiation used today is mostly understood as ionizing radiation, which is an
electromagnetic spectrum that carries enough energy to release electrons from a matter. It was first
discovered by Whilhelm Rontgen in 1895 during his experiment of studying cathode rays, where
high electric voltage was applied to discharged a vacuum tube. To reduce the fluorescent glow
from this vacuum tube, Rontgen used a barium platinocyanide coated screen for cover. However,
the glow was still visible through this screen, then he imagined of an unidentified ray that was
penetrating through the tube, then react with the screen. Subsequently, he conducted various
experiments to discover this anonymous ray (X-ray), then the studies of radiation began. The
research was led to Henry Becquerel and Marie Curie discovering uranium, and they established
fundamentals of radioactivity. Even though they found a pioneering discovery, Marie was exposed
to various radioactive elements which gave her aplastic anemia and caused her death in 1934.
Currently, her research papers and relics are remaining radioactive, which implies a long-term
exposure to an ionizing radiation is very lethal. Ever since then, the precaution of using the ionizing
radiation and detecting the source became an important issue.
1.2.2 Ionizing radiation
The ionizing radiation is a particle or electromagnetic wave that carries enough energy
(10 eV to 1 MeV) to free bounded electrons from an orbit of an atom or a matter. Radiation
wavelength from 10 nm (short wavelength in UV spectrum) to 1 pm (𝛾-rays) is called the ionizing
radiation. Subatomic particles such as alpha and beta particles cause a direct ionizing to a matter
with fundamental interaction of the Coulombic force. Gamma ray is an electromagnetic radiation
that penetrates with even higher energies which is generated from the radioactive decay of isotopes
(gamma source). Isotopes have atoms with different number of neutrons and same number of
protons, thus they are electrically unbalanced. Among these isotopes, some are radioactive which
4
generates ionizing radiations. These unstable wave particles react with medium creating reactive
oxygen species (ROS), or breaking chemical bonds of organic elements (e.g., proteins and DNA).
Thus, the ionizing radiation and its source should be controlled precisely with a care in different
applications.
1.2.3 Applications of ionizing radiation and its risks
The application of using radiation source expanded to a large scale in the industry due to
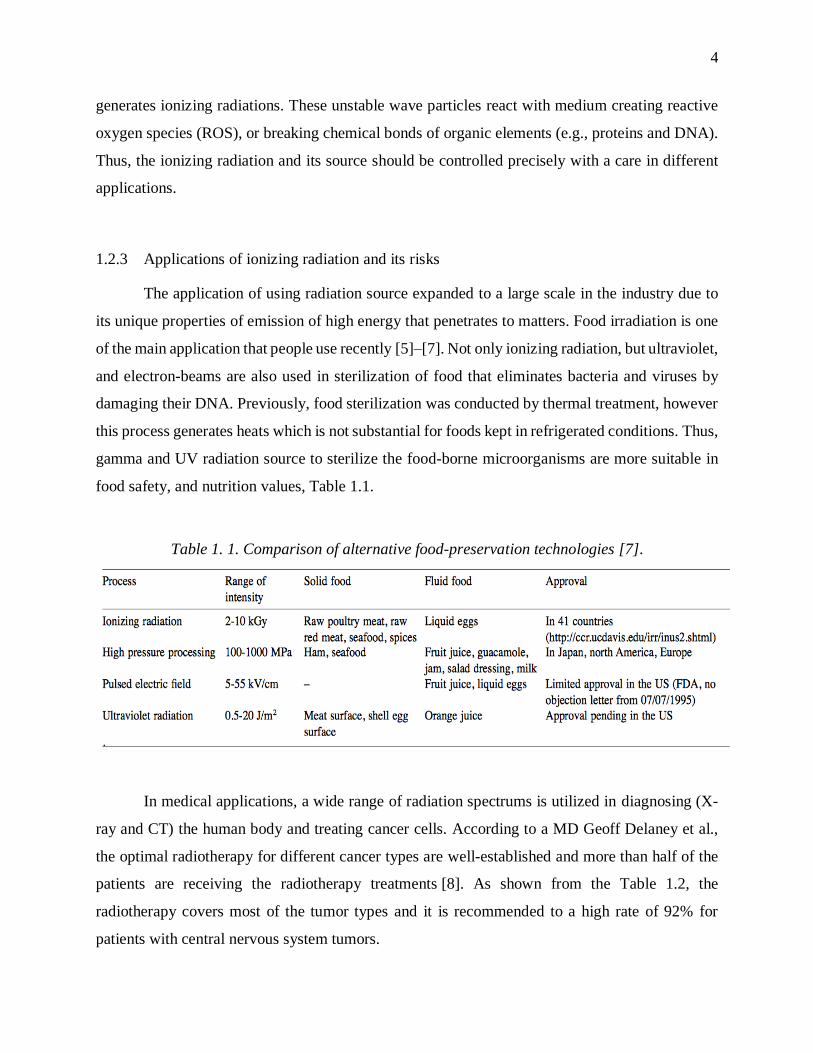
its unique properties of emission of high energy that penetrates to matters. Food irradiation is one
of the main application that people use recently [5]–[7]. Not only ionizing radiation, but ultraviolet,
and electron-beams are also used in sterilization of food that eliminates bacteria and viruses by
damaging their DNA. Previously, food sterilization was conducted by thermal treatment, however
this process generates heats which is not substantial for foods kept in refrigerated conditions. Thus,
gamma and UV radiation source to sterilize the food-borne microorganisms are more suitable in
food safety, and nutrition values, Table 1.1.
Table 1. 1. Comparison of alternative food-preservation technologies [7].
In medical applications, a wide range of radiation spectrums is utilized in diagnosing (X-
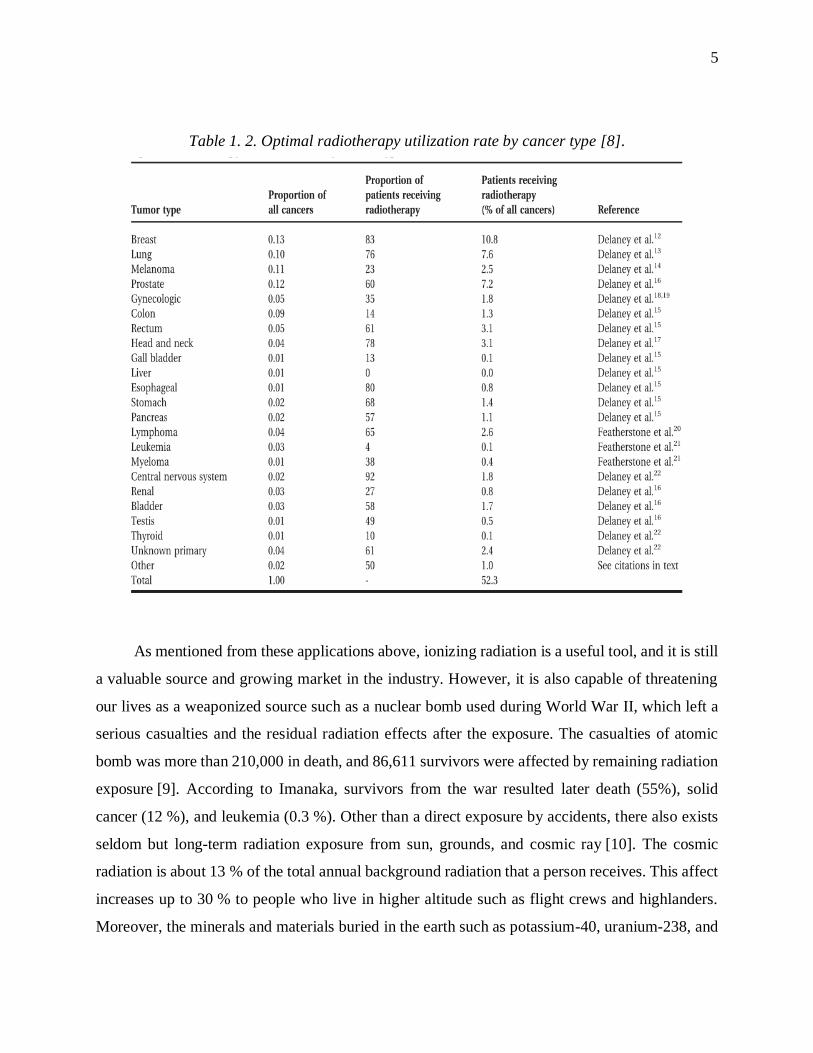
ray and CT) the human body and treating cancer cells. According to a MD Geoff Delaney et al.,
the optimal radiotherapy for different cancer types are well-established and more than half of the
patients are receiving the radiotherapy treatments [8]. As shown from the Table 1.2, the
radiotherapy covers most of the tumor types and it is recommended to a high rate of 92% for
patients with central nervous system tumors.
5
Table 1. 2. Optimal radiotherapy utilization rate by cancer type [8].
As mentioned from these applications above, ionizing radiation is a useful tool, and it is still
a valuable source and growing market in the industry. However, it is also capable of threatening
our lives as a weaponized source such as a nuclear bomb used during World War II, which left a
serious casualties and the residual radiation effects after the exposure. The casualties of atomic
bomb was more than 210,000 in death, and 86,611 survivors were affected by remaining radiation
exposure [9]. According to Imanaka, survivors from the war resulted later death (55%), solid
cancer (12 %), and leukemia (0.3 %). Other than a direct exposure by accidents, there also exists
seldom but long-term radiation exposure from sun, grounds, and cosmic ray [10]. The cosmic
radiation is about 13 % of the total annual background radiation that a person receives. This affect
increases up to 30 % to people who live in higher altitude such as flight crews and highlanders.
Moreover, the minerals and materials buried in the earth such as potassium-40, uranium-238, and
6
thorium-232 have long half-lives resulting long-term radiation exposure. Radon is also a cause of
radiation exposure mostly exist around southeast Pennsylvania and Iowa. For those who has
chance of getting radiation exposure or for the safe use of radiation, it is important to know about
the ionizing radiation and keep a dosimeter nearby.
1.3 Saccharomyces Cerevisiae
As discussed in the previous section, the ionizing radiation possesses both practicality and
precaution of its usage. Thus, the importance of using it wisely with a precaution is never enough
to point out. However, gaining an insight to biological damage to human from such high-energy
source is limited and prohibited because humans are not experimental. Thus, researchers consider
on simpler systems that has similar protein sequence and function to human.
David Bostein mentioned in his article that some eukaryotic microorganisms (i.e. Saccharomyces
cerevisiae and Schizosaccharomyces pombe) share a number of fundamental cellular and
molecular properties with human [11], [12]. Many proteins in yeast such as ubiquitin, actin, and
tubulin are identical to human in 96, 89, and 75 %, respectively. These homologous
microorganisms offer us a simpler blueprint of human gene structure supporting us to estimate
human biology. Moreover, it has benefits in research that includes simplicity, rapid growth, large
number of subjects for experiments. Among such candidates, S. cerevisiae is a free-living yeast
that is well-developed as a miniature model of human.
Saccharomyces cerevisiae is a eukaryotic single cell experimented in many biology
researches due to its genomic sequence like human and easy manipulation. Discoveries of gene or
protein functions in yeast can be also modeled in higher eukaryotes (e.g. human). Thus, S.
cerevisiae has contributed in understanding cellular process such as the cell cycle, aging, metabolic
process and cell death [13]. Among these cellular processes studied, we focused our interest in a
metabolic process of the yeast during its fermentation with glucose. Both aerobic and anaerobic
conditions, carbon dioxide (CO2) are generated inside the fermenting medium. Subsequently, the
generated byproduct dissolves into fermenting medium then increases the electrical conductivity
of the solution (bicarbonate acid). However, these generation rate of byproducts is reduced by the
radiation-induced damages in cell metabolic activity. Thus, accumulated radiation dose to yeast
cells creates the metabolic disorder inducing lower electrical impedance change compared to the
7
normal fermentation of the yeast cells. Utilizing this unique behavior of yeast microorganism, we
developed a first radiation dosimeter that detects minimum dosage of 1 mrad, which is a
comparable sensitivity of patch-type radiation dosimeters used in the industry.
1.4 Thesis organization
In the next chapter 2, a detailed description of background history of radiation dosimeters,
and moreover recently developed dosimeters will be reviewed. Based on these dosimeters used in
industries and research facilities, unique radiation dosimeters were invented using an organic
material (yeast) which are described in the following chapters. The advantages of using the
microorganism, yeast, as a surrogate marker for radiation response are identified by the biological
damages observed from a fluorescence microscopy. Its practicality as wearable/portable
dosimeters is discussed and compared to current dosimeters as a state-of-art. Further advanced
film-type radiation dosimeters are fabricated and characterized to introduce its noble approach to
next generation radiation dosimeters in Chapter 4.
Chapter 3 describes the first prototype yeast-based wearable radiation sensor which is
integrated in microdevice structure with a yeast as a surrogate marker. The sensor is capable of
detecting radiation dose between 0 to 1 krad by controlling the thickness of the deflecting
membrane and the diameter of the yeast chamber. Chapter 4 describes an advanced platform
utilizing the yeast into a film-type dosimeter. The reduced generation of the byproducts of
irradiated yeast directly correlates to the biological damage accumulated. The radiation detection
range is from 0 to 1 krad, and it has minimum radiation sensing of 1 mrad which is comparable
measurement limits to current dosimeters. Lastly, the thesis will be concluded and discussed on
the future research in Chapter 5.
8
CHAPTER 2. HISTORY OF DOSIMETERS AND RECENT
TECHNOLOGIES
2.1 History of radiation dosimeters
Both quantitative and qualitative measurement of the radiation dosage was an important
issue for physicists in earlier 1900’s. To protect people from radiation, researchers have developed
various types of dosimeters. First inventions of radiation dosimeters were in different forms and
had various working principles: photographic film (1907), chromoradiometer (1897), ionization
chambers (1896), Geiger Mueller counters (1913), and semiconductor detectors (Jaffe 1932 and
Van Heerden 1945) [14].
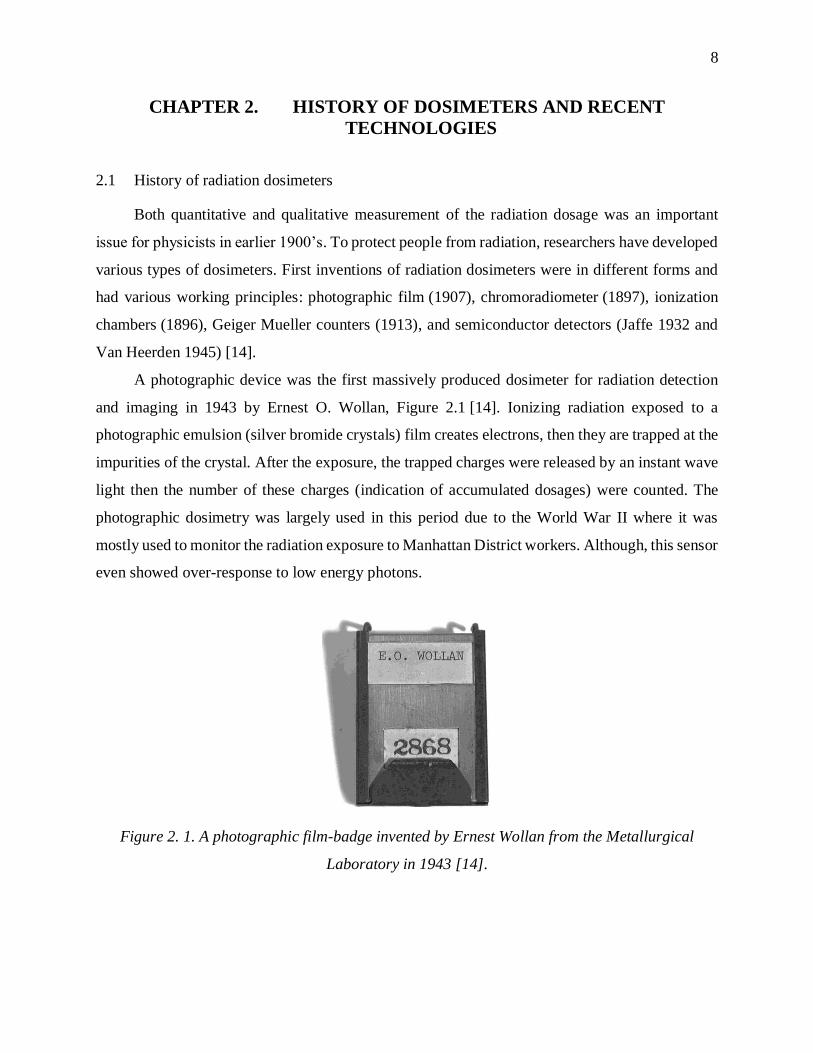
A photographic device was the first massively produced dosimeter for radiation detection
and imaging in 1943 by Ernest O. Wollan, Figure 2.1 [14]. Ionizing radiation exposed to a
photographic emulsion (silver bromide crystals) film creates electrons, then they are trapped at the
impurities of the crystal. After the exposure, the trapped charges were released by an instant wave
light then the number of these charges (indication of accumulated dosages) were counted. The
photographic dosimetry was largely used in this period due to the World War II where it was
mostly used to monitor the radiation exposure to Manhattan District workers. Although, this sensor
even showed over-response to low energy photons.
Figure 2. 1. A photographic film-badge invented by Ernest Wollan from the Metallurgical
Laboratory in 1943 [14].
9
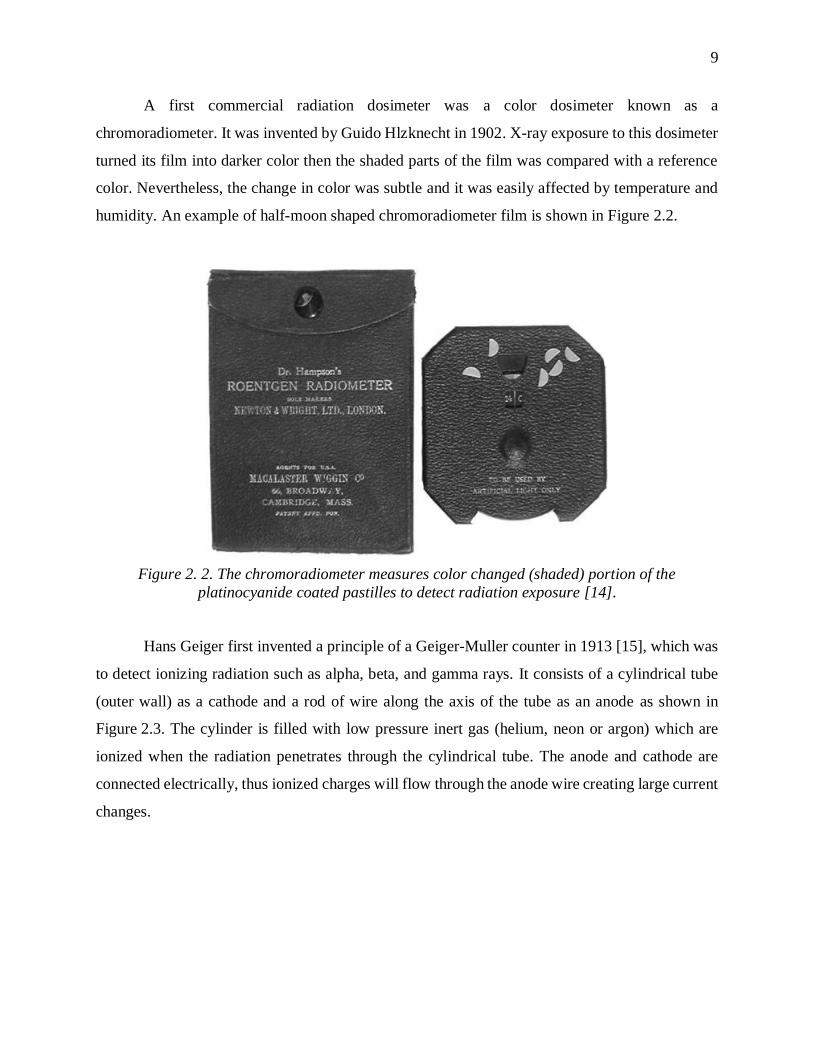
A first commercial radiation dosimeter was a color dosimeter known as a
chromoradiometer. It was invented by Guido Hlzknecht in 1902. X-ray exposure to this dosimeter
turned its film into darker color then the shaded parts of the film was compared with a reference
color. Nevertheless, the change in color was subtle and it was easily affected by temperature and
humidity. An example of half-moon shaped chromoradiometer film is shown in Figure 2.2.
Figure 2. 2. The chromoradiometer measures color changed (shaded) portion of the
platinocyanide coated pastilles to detect radiation exposure [14].
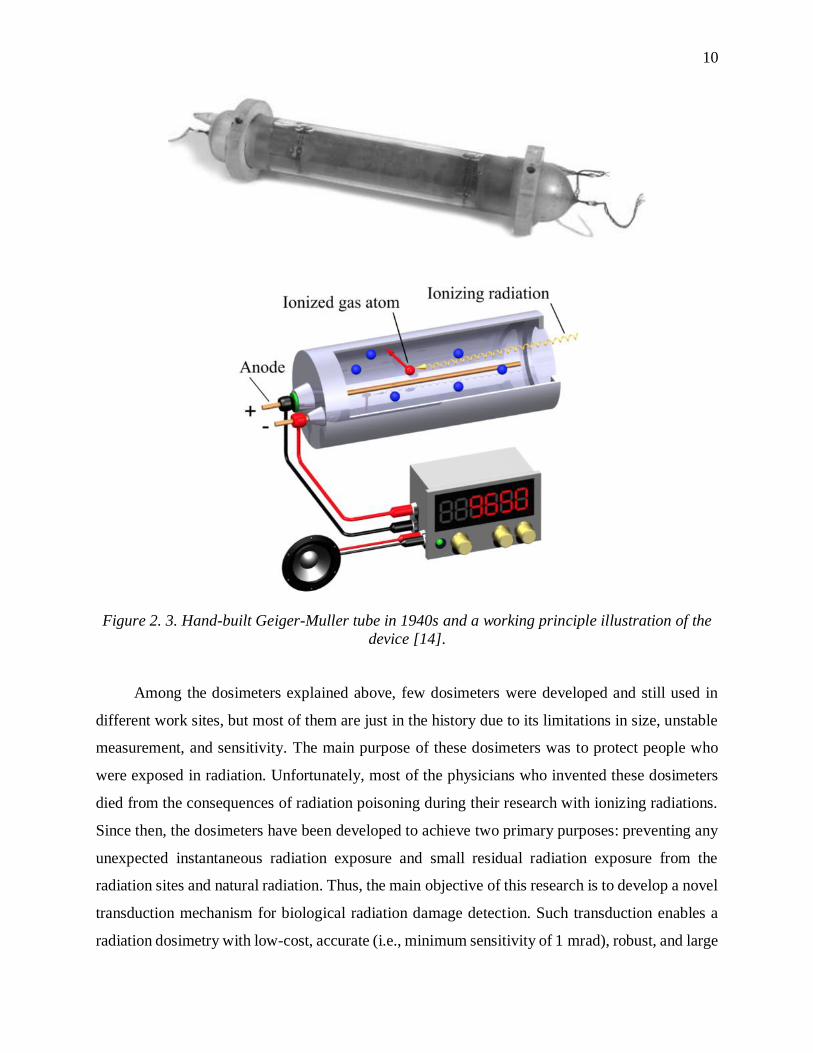
Hans Geiger first invented a principle of a Geiger-Muller counter in 1913 [15], which was
to detect ionizing radiation such as alpha, beta, and gamma rays. It consists of a cylindrical tube
(outer wall) as a cathode and a rod of wire along the axis of the tube as an anode as shown in
Figure 2.3. The cylinder is filled with low pressure inert gas (helium, neon or argon) which are
ionized when the radiation penetrates through the cylindrical tube. The anode and cathode are
connected electrically, thus ionized charges will flow through the anode wire creating large current
changes.
10
Figure 2. 3. Hand-built Geiger-Muller tube in 1940s and a working principle illustration of the
device [14].
Among the dosimeters explained above, few dosimeters were developed and still used in
different work sites, but most of them are just in the history due to its limitations in size, unstable
measurement, and sensitivity. The main purpose of these dosimeters was to protect people who
were exposed in radiation. Unfortunately, most of the physicians who invented these dosimeters
died from the consequences of radiation poisoning during their research with ionizing radiations.
Since then, the dosimeters have been developed to achieve two primary purposes: preventing any
unexpected instantaneous radiation exposure and small residual radiation exposure from the
radiation sites and natural radiation. Thus, the main objective of this research is to develop a novel
transduction mechanism for biological radiation damage detection. Such transduction enables a
radiation dosimetry with low-cost, accurate (i.e., minimum sensitivity of 1 mrad), robust, and large
11
scale production. To achieve this goal, it is important to investigate current dosimeters used in the
industries and research areas.
2.2 Review of recent technology
2.2.1 Active dosimeters
Active (Real-time) dosimeters such as Geiger-Muller counter [15], ionization chambers
[16], self-reading dosimeters [17] and solid state (RADFETs) [18], [19] are used to detect
instantaneous radiation exposure and to alert the people nearby. These are real-time dosimeters
used for active radiation sites such as hazardous nuclear power plants, or hospitals where the
ionizing radiation is used as treatment for patients.
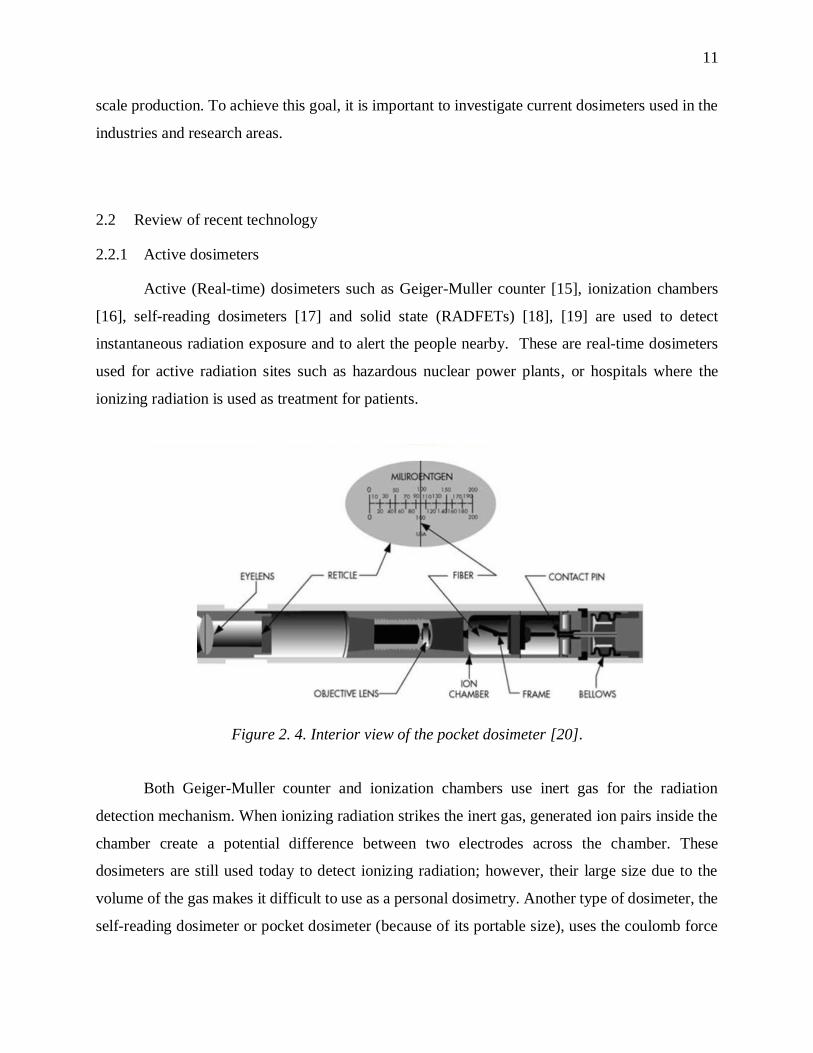
Figure 2. 4. Interior view of the pocket dosimeter [20].
Both Geiger-Muller counter and ionization chambers use inert gas for the radiation
detection mechanism. When ionizing radiation strikes the inert gas, generated ion pairs inside the
chamber create a potential difference between two electrodes across the chamber. These
dosimeters are still used today to detect ionizing radiation; however, their large size due to the
volume of the gas makes it difficult to use as a personal dosimetry. Another type of dosimeter, the
self-reading dosimeter or pocket dosimeter (because of its portable size), uses the coulomb force
12
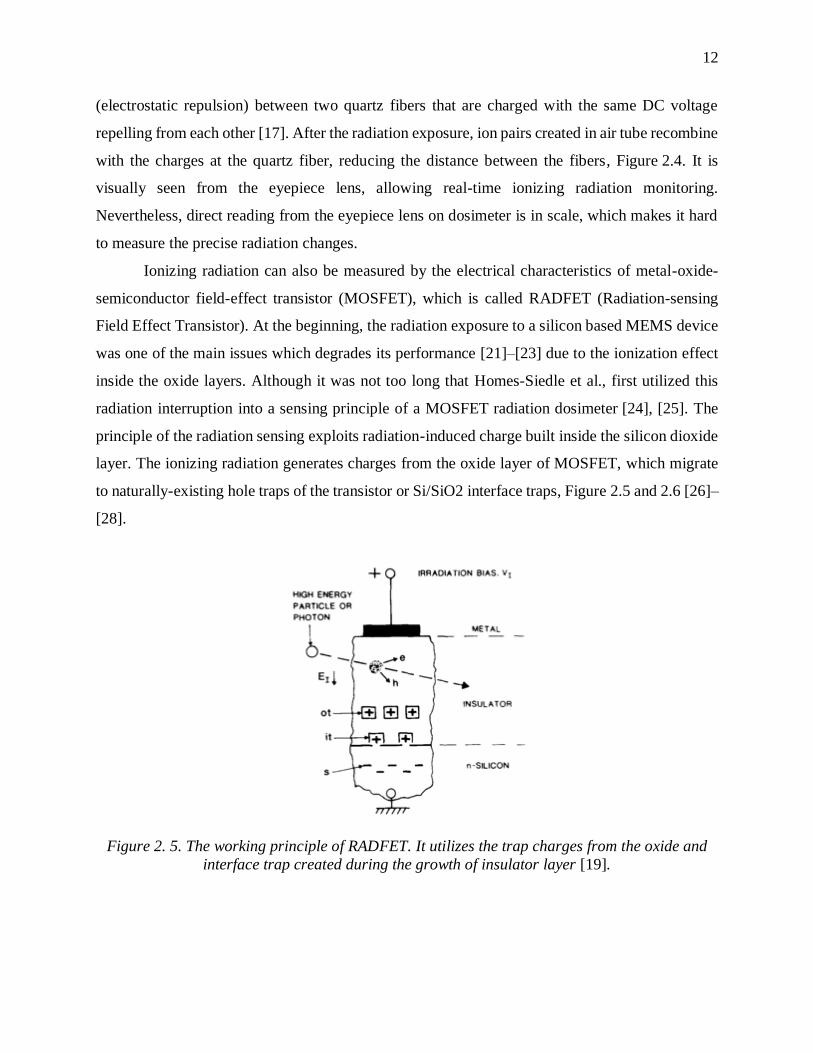
(electrostatic repulsion) between two quartz fibers that are charged with the same DC voltage
repelling from each other [17]. After the radiation exposure, ion pairs created in air tube recombine
with the charges at the quartz fiber, reducing the distance between the fibers, Figure 2.4. It is
visually seen from the eyepiece lens, allowing real-time ionizing radiation monitoring.
Nevertheless, direct reading from the eyepiece lens on dosimeter is in scale, which makes it hard
to measure the precise radiation changes.
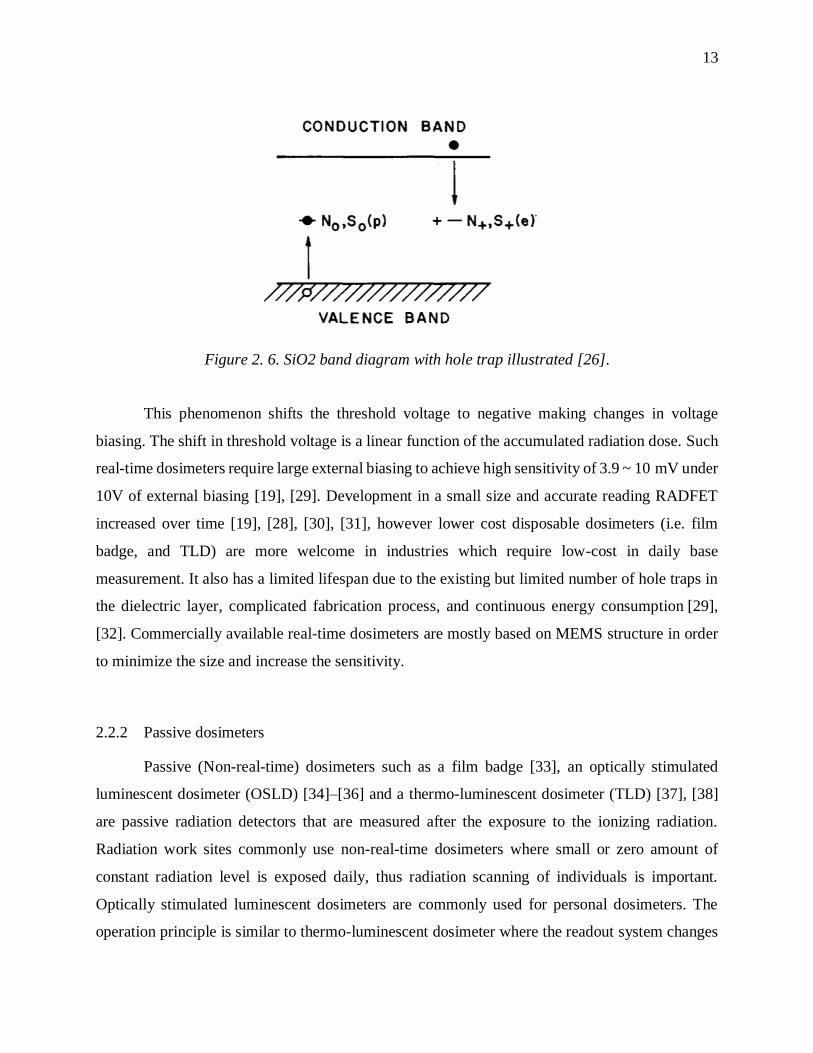
Ionizing radiation can also be measured by the electrical characteristics of metal-oxide-
semiconductor field-effect transistor (MOSFET), which is called RADFET (Radiation-sensing
Field Effect Transistor). At the beginning, the radiation exposure to a silicon based MEMS device
was one of the main issues which degrades its performance [21]–[23] due to the ionization effect
inside the oxide layers. Although it was not too long that Homes-Siedle et al., first utilized this
radiation interruption into a sensing principle of a MOSFET radiation dosimeter [24], [25]. The
principle of the radiation sensing exploits radiation-induced charge built inside the silicon dioxide
layer. The ionizing radiation generates charges from the oxide layer of MOSFET, which migrate
to naturally-existing hole traps of the transistor or Si/SiO2 interface traps, Figure 2.5 and 2.6 [26]–
[28].
Figure 2. 5. The working principle of RADFET. It utilizes the trap charges from the oxide and
interface trap created during the growth of insulator layer [19].
13
Figure 2. 6. SiO2 band diagram with hole trap illustrated [26].
This phenomenon shifts the threshold voltage to negative making changes in voltage
biasing. The shift in threshold voltage is a linear function of the accumulated radiation dose. Such
real-time dosimeters require large external biasing to achieve high sensitivity of 3.9 ~ 10 mV under
10V of external biasing [19], [29]. Development in a small size and accurate reading RADFET
increased over time [19], [28], [30], [31], however lower cost disposable dosimeters (i.e. film
badge, and TLD) are more welcome in industries which require low-cost in daily base
measurement. It also has a limited lifespan due to the existing but limited number of hole traps in
the dielectric layer, complicated fabrication process, and continuous energy consumption [29],
[32]. Commercially available real-time dosimeters are mostly based on MEMS structure in order
to minimize the size and increase the sensitivity.
2.2.2 Passive dosimeters
Passive (Non-real-time) dosimeters such as a film badge [33], an optically stimulated
luminescent dosimeter (OSLD) [34]–[36] and a thermo-luminescent dosimeter (TLD) [37], [38]
are passive radiation detectors that are measured after the exposure to the ionizing radiation.
Radiation work sites commonly use non-real-time dosimeters where small or zero amount of
constant radiation level is exposed daily, thus radiation scanning of individuals is important.
Optically stimulated luminescent dosimeters are commonly used for personal dosimeters. The
operation principle is similar to thermo-luminescent dosimeter where the readout system changes
14
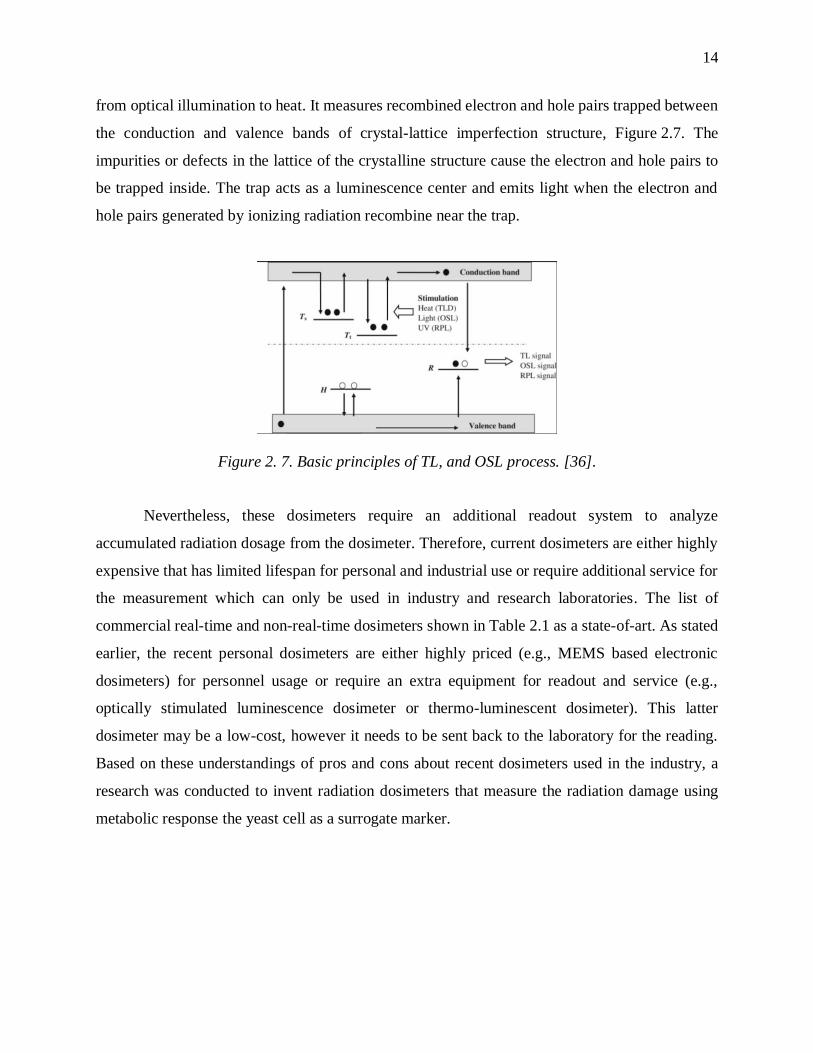
from optical illumination to heat. It measures recombined electron and hole pairs trapped between
the conduction and valence bands of crystal-lattice imperfection structure, Figure 2.7. The
impurities or defects in the lattice of the crystalline structure cause the electron and hole pairs to
be trapped inside. The trap acts as a luminescence center and emits light when the electron and
hole pairs generated by ionizing radiation recombine near the trap.
Figure 2. 7. Basic principles of TL, and OSL process. [36].
Nevertheless, these dosimeters require an additional readout system to analyze
accumulated radiation dosage from the dosimeter. Therefore, current dosimeters are either highly
expensive that has limited lifespan for personal and industrial use or require additional service for
the measurement which can only be used in industry and research laboratories. The list of
commercial real-time and non-real-time dosimeters shown in Table 2.1 as a state-of-art. As stated
earlier, the recent personal dosimeters are either highly priced (e.g., MEMS based electronic
dosimeters) for personnel usage or require an extra equipment for readout and service (e.g.,
optically stimulated luminescence dosimeter or thermo-luminescent dosimeter). This latter
dosimeter may be a low-cost, however it needs to be sent back to the laboratory for the reading.
Based on these understandings of pros and cons about recent dosimeters used in the industry, a
research was conducted to invent radiation dosimeters that measure the radiation damage using
metabolic response the yeast cell as a surrogate marker.
15
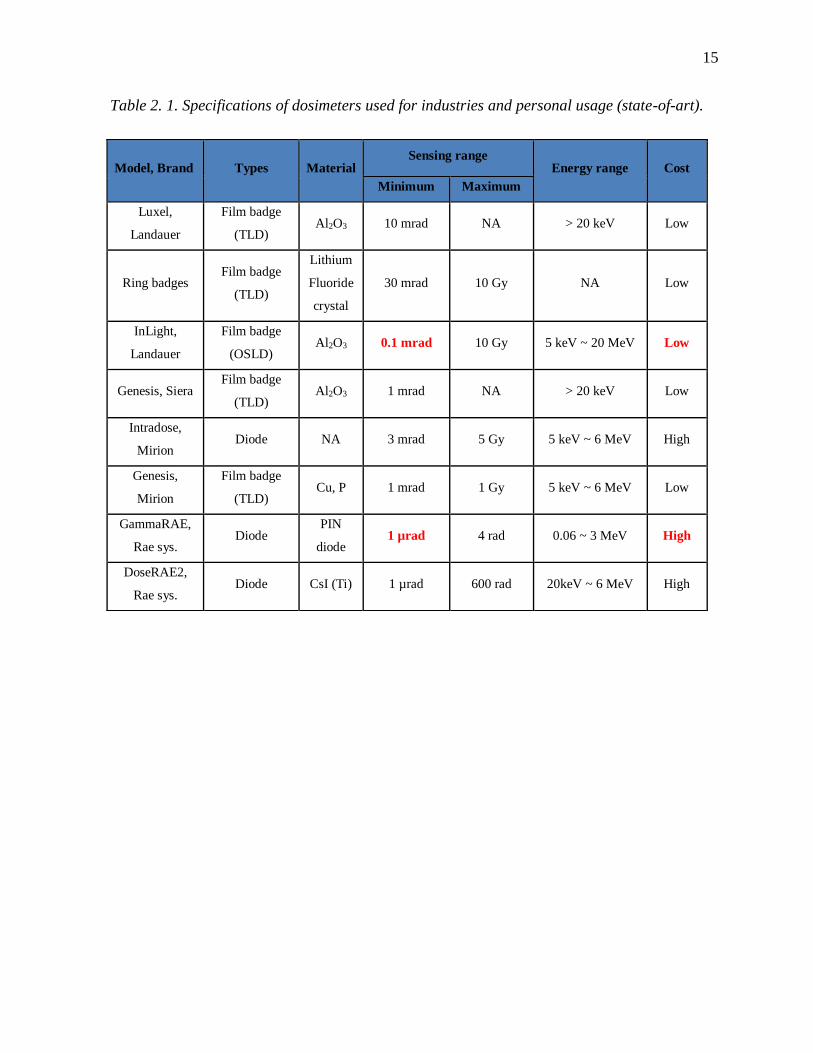
Table 2. 1. Specifications of dosimeters used for industries and personal usage (state-of-art).
Model, Brand Types Material Sensing range
Energy range Cost
Minimum Maximum
Luxel,
Landauer
Film badge
(TLD) Al2O3 10 mrad NA > 20 keV Low
Ring badges Film badge
(TLD)
Lithium
Fluoride
crystal
30 mrad 10 Gy NA Low
InLight,
Landauer
Film badge
(OSLD) Al2O3 0.1 mrad 10 Gy 5 keV ~ 20 MeV Low
Genesis, Siera Film badge
(TLD) Al2O3 1 mrad NA > 20 keV Low
Intradose,
Mirion Diode NA 3 mrad 5 Gy 5 keV ~ 6 MeV High
Genesis,
Mirion
Film badge
(TLD) Cu, P 1 mrad 1 Gy 5 keV ~ 6 MeV Low
GammaRAE,
Rae sys. Diode
PIN
diode 1 µrad 4 rad 0.06 ~ 3 MeV High
DoseRAE2,
Rae sys. Diode CsI (Ti) 1 µrad 600 rad 20keV ~ 6 MeV High
16
CHAPTER 3. PROTOTYPE WITH LED INDICATOR
3.1 Introduction
Excessive exposure to the ionizing radiation can pose health risks that may be detrimental
or fatal to the people who are affected; thus, it is important to monitor radiation exposure among
individuals who work in high-risk environments (e.g., nuclear plant operators) or are exposed to
accidents (e.g., Fukushima disaster) that involves ionizing radiation [1]. Considering practical
cases, most of the ionizing radiation are found in the form of a semblance but long-term exposure
such as natural sources, occupational therapy, and nuclear work sites. The occupational radiation
exposure to DOE (department of energy) in 5 years showed 68 mrad/yr, and nearly 64 % of these
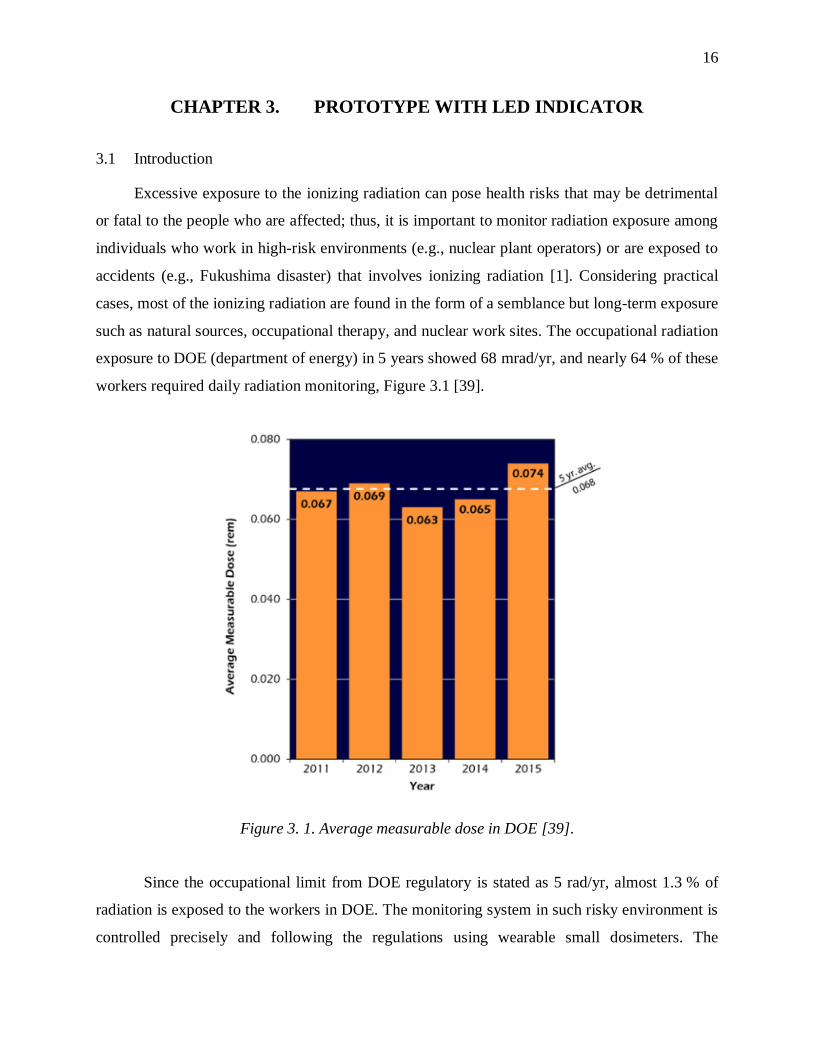
workers required daily radiation monitoring, Figure 3.1 [39].
Figure 3. 1. Average measurable dose in DOE [39].
Since the occupational limit from DOE regulatory is stated as 5 rad/yr, almost 1.3 % of
radiation is exposed to the workers in DOE. The monitoring system in such risky environment is
controlled precisely and following the regulations using wearable small dosimeters. The
17
commercial miniature dosimeters for personal monitoring are solid-state (luminescence-based [40]
or RADFETs [18], [19]) devices that can be integrated onto wearable items; however, their
measurement does not directly correlate with biological damage of the ionizing radiation (i.e.,
DNA damage, mutation, and cell death). Although many studies have demonstrated the lethal
effect of ionizing radiation on a living matter, there are no dosimeter which has taken advantage
of such sensitivity for creating a direct indicator of radiation-induced biological damage.
Using biological matter as a radiation-sensitive material, a novel approach to create
dosimeters which can faithfully recapitulate the response of living tissue to ionizing radiation. One
particularly suitable sensing material is Saccharomyces cerevisiae yeast. This yeast has a history
of being an invaluable research tool for studying the fundamental underpinnings of many cellular
phenomena in eukaryotic organisms, including human genome sequencing [41], [42], protein
structuring [43], and biological response to ionizing radiation [44]–[46]. As D. Bostein mentioned
in his article, these eukaryotic microorganisms have a similar fundamental cellular and molecular
properties with human [11]. Moreover in particular, investigations with S. cerevisiae have revealed
that it is semi-resistant to ionizing radiation; thus, exposing a population of yeast cells to ionizing
radiation impairs their average cellular/metabolic activity rather than completely inactivating them.
As a result, kinetics of yeast fermentation can be used as quantitative indicators of ionizing
radiation exposure. Specifically, our investigations have revealed that the rate of gas generation
by irradiated yeast is significantly lower than that of non-irradiated yeast further explained in this
Chapter. Such sensing capabilities with a biological material render yeast suitable for creating low-
cost wearable radiation sensors with more physiologically-relevant information regarding an
individual’s radiation exposure; furthermore, its established robustness (50 °C, > 250 MPa, 5–8 %
humidity) allows for the creation of devices which have a long stable shelf life [47], [48] and does
not require special handling during fabrication.
By overcoming the expensive fabrication challenges of solid-state personal dosimeters and
embracing the advantage of the semi-resistant characteristic of an organic material, we present the
first low-cost wearable radiation sensor that integrates a MEMS structure with a microorganism
(yeast). The dose responses viability of yeast cells and the resulting gas generation in the presence
of sucrose solution is used to deflect a PDMS membrane and activate an LED indicator.
18
3.2 Fermentation of yeast background theory
As described in the introduction, yeast was studied intensively because of its comparability
to human homologies. Most researches were related to discovery of human genes that are lethal to
radiation exposure or are utilized in replicating genes after the radiation damage [44], [45], [49],
[50]. However, radiation resistant genes included in yeast cells cannot totally prevent yeasts from
its destructions to ionizing radiation. Instead, its semi-resistant characteristic to radiation
introduces linear response to accumulated radiation exposure. Radiation studies to yeast were
mostly conducted to investigate human genome but we can also discover how yeast can be used
as a sensing source to measure the accumulated radiation dose.
The pH and electrical impedance change were observed during the yeast (S. Cerevisiae)
fermentation process by Y. Ebina et al. [51]. According to this literature, conducting ions (carbonic
acids) created during the fermentation was utilized as a nutrient to the culture broth of non-
conducting substances, which eventually increased the impedance. Two main mechanisms caused
the rise in impedance during the fermentation even with the decrease in impedance was expected
knowing that H+ ions and carbonic acids are created. First, conducting ions produced by yeast
fermentation introduced as a nutrient in the culture broth. Reduced ions could not affect the
decrease in impedance. Second, the body effect of yeast used as an insulator. These major
phenomenon overcome impedance decreased by ions. Based on this result, electrical measurement
with irradiated yeast samples can be observed showing lower impedance compared to the non-
irradiated.
Effects of ionizing radiation to different yeasts (Candida zylanoides, Debaryomyces hansenii,
Sporobolomyces roseus, and Trichosporon cutaneum) were discovered by J. A. McCarthy [52].
Commonly radiation exposure in dose levels of 0.75–2.5 kGy was used to sterilize organic foods
(e.g. British fresh sausage for this paper) to inhibit the growth of bacteria, however it triggered
yeasts to spoil meat. Therefore, radiation study of four yeasts were characterized and discussed.
Lethality of ionizing radiation to yeast cells was observed from the result that reduced total number
of survived cells from four yeasts isolated from British fresh sausage. The decreasing number of
survived cells were linear from 0–5 kGy for 3 yeasts (Candida zylanoides, Debaryomyces hansenii,
and Sporobolomyces roseus) and 4–10 kGy for other yeast (Trichosporon cutaneum). Highly
sensitive and a wide range of radiation sensing device can be fabricated using different organic
materials.
19
Current market preference on dosimeters is mostly focused on four main features; robustness
(long-period shelf life), sensitivity, cost efficiency and portability (scale). As described in the
introduction, commercially available yeast (Fleischmann’s® Instant Dry®) used in the
experiments is robust microorganism. It can be purchased in large quantities in low price, which
satisfies the massive production. Literatures described prove its high sensitivity and a wide range
of sensing. Yeast is a reactant completely satisfies the requirements.
3.3 Operation principle
The operation principle of the radiation dosimeter is based on the amount of deflection of an
elastomeric membrane in response to CO2 gas generated by the fermentation of irradiated yeast
cells. The sensor structure is illustrated in Figure 3.2. The sensor consists primarily of two
chambers separated by a thin glass slide coverslip. A glass slide of 200 µm was used in order to
connect these two chambers and initiate the measurement of the sensor. It was also necessary to
keep sucrose solution from drying out. The upper chamber houses a small colony of powdered
yeast cells and the other contains an aqueous sucrose solution. Rather than using fresh yeast, we
use commercial dry yeast (Fleischmann’s® Instant Dry®) to increase the shelf life of the device; in
typical refrigerator conditions, dry yeast can survive for up to 6 months [53]. The sucrose solution
serves as a disaccharide nutrition source for fermenting yeast; in a yeast solution, sucrose is
hydrolyzed into glucose and fructose (accelerated by the invertase enzyme from yeast as shown in
Equation 3.1) [54]. The resulting glucose is then readily consumed by yeast via its enzyme zymase,
as shown in Equation 3.1 and 3.2.
20
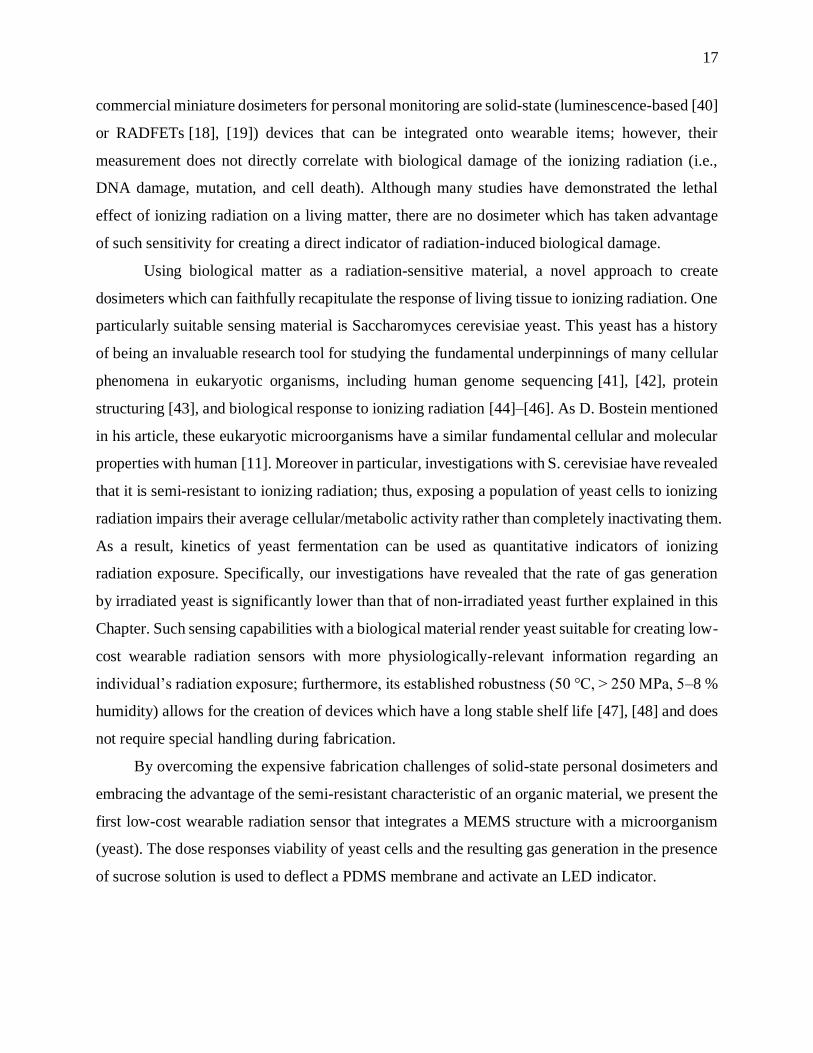
Figure 3. 2. Operation principle of the proto-type device. The average activity/viability of yeast is
impaired due to exposure to ionizing radiation. After exposure, the copper tape backing is pressed,
breaking the glass separator, and mixing the yeasts in the upper chamber with the sucrose solution.
The remaining viable yeast creates CO2 and deflect the membrane to an amount correlating to
radiation dose.
𝐶12𝐻22𝑂11 + 𝐻2O
ℎ𝑦𝑑𝑟𝑜𝑙𝑦𝑠𝑖𝑠/𝑖𝑛𝑣𝑒𝑟𝑡𝑎𝑠𝑒→ 𝐶6𝐻12𝑂6(𝑔𝑙𝑢𝑐𝑜𝑠𝑒) + 𝐶6𝐻12𝑂6 (𝑓𝑟𝑢𝑐𝑡𝑜𝑠𝑒)
Equation 3.1: Hydrolysis process of sucrose to glucose and fructose.
𝐶6𝐻12𝑂6(𝑔𝑙𝑢𝑐𝑜𝑠𝑒)𝑧𝑦𝑚𝑎𝑠𝑒→ 2𝐶2𝐻5𝑂𝐻 + 2𝐶𝑂2
Equation 3.2: Chemical formula for alcoholic fermentation of yeast and glucose solution.
The fermentation process produces carbon dioxide and ethanol as shown in Equation 3.2.
The rate of CO2 gas generation during fermentation correlates with the activity of the yeast
population, which is impaired by radiation exposure; thus gas generation rate is indicative of the
radiation dose. Ionizing radiation exposure damages the yeast cell reducing the byproduct
21
generation which results in the reduced rate of CO2 gas generation. The generation rate of CO2 gas
from non-irradiated yeast was comparable to ionizing radiation exposed samples.
During typical use of the sensor, the user wears it during radiation exposure. After exposure,
the user breaks the thin glass separator by pressing the back of the sucrose chamber, thus mixing
the yeast cells with the sucrose solution. The resulting fermentation produces CO2 that can deflects
a PDMS membrane (dashed line), Figure 3.2. In the absence of radiation, the generated CO2 is
sufficiently large to deflect the membrane (solid line) enough in order to close a switch and turn
on an LED indicator. If radiation exposure is large enough to deactivate a significant number of
yeast cells, the diminished CO2 byproduct cannot turn on the LED. Thus, this sensor translates the
irradiation-induced biological damage of yeast to a visual LED indicator.
3.4 Fabrication
The radiation dosimeter includes three components with fabrication sequences as follows: a
sucrose solution reservoir (Figure 3.3a-c), a yeast chamber, and a LED indicator (Figure 3.3d-f).
The sucrose solution reservoir used acrylic to encapsulate sucrose solution and kept it out from
drying. It was hermetically sealed with a thin glass slide and a copper tape. The yeast chamber
consists of a PDMS ring hydrogen bonded with a PDMS membrane that deflects due to the
generation of CO2 gas inside the chamber. The LED indicator platform was also built with PDMS
ring in order to make a solid connection with the yeast chamber. All chambers and other
components are created by rapid prototyping techniques (i.e., laser machining and layer-by-layer
assembly). The overall process was completed with a planar fabrication methods thus the sensor
can be produced in large scale for its practical use in the industry.
The sucrose reservoir is fabricated as follows, using impermeable materials to prevent
evaporation. First, an acrylic ring (ID 15 mm, OD 20 mm, thickness 5.6 mm) is laser cut using
10.6 µm CO2 laser engraver system (PLS6MW, Universal Laser Systems, Inc.), Figure 3.3a. A
power used to laser cut acrylic was 33.75 W with cutting speed in 45 %. It was laser cut twice in
order to have a sharp cutting around the edges. A laser cutting with high power (above 60 W) and
low speed (below 30 %) was avoided because it resulted slanted shape of the acrylic ring at the
cutting edges. It was due to a long-term exposure to a high temperature laser. Thus, thick acrylics
were laser cut multiple times in fast cutting speed with 45 % of its original power. A copper disc
22
(20 mm diameter, 100 μm thick) was cut from copper tape using the same system but with a
1.06 μm-wavelength fiber laser. The power of 32 W was used with laser cutting speed of 30 %.
The acrylic ring is then bonded to the copper disc with UV-curable adhesive (Loctite 3105) to
create a chamber. Next, a sharp needle tip is glued to the center of the flexible copper tape to assist
with breaking the glass or sensor read-out, Figure 3.3b. 200 μL of a 50 mM sucrose solution (de-
ionized water and sucrose) is poured into the chamber, and a microscope glass coverslip (Ted Pella,
Inc., thickness 0.2 mm) is bonded over the acrylic ring with two-part epoxy, Figure 3.3c. The
sealed chamber is watertight and prevents evaporation of the water from the sucrose solution.
Two PDMS rings are created using PDMS cast on a laser-machined acrylic mold (ID 8 mm,
OD 15 mm, 5.6 mm height), Figure 3.3d-e. A 200 μm PDMS membrane is created by spin-coating
3 mg of PDMS prepolymer on a silanized silicon wafer (500 rmp, 30 s) and curing it at 80 °C for
one hour. A small permanent magnet (K&J magnetics, Inc. diameter = 3 mm, height = 1 mm) is
glued to the membrane, and the membrane is then removed from the wafer and bonded to one of
the rings using oxygen plasma, forming a chamber. This chamber is subsequently loaded with
20 mg of yeast, Figure 3.3f, left.
The other PDMS ring is bonded to a 5 mm-thick PDMS substrate embedded with a circuit
connecting a reed switch (ORD311, Standex-Meder Electronics), a battery (3V, CR 1216,
Radioshack), and a red LED (Visual communications company) in series, Figure 3.3f, right. The
two chambers are then stacked and bonded on top of the glass coverslip to complete the fabrication
process, Figure 3.3g. Samples were kept in refrigerated condition (5 °C) until testing time to
prevent any fermentation caused by permeation of ambient gas through PDMS.
23
Figure 3. 3. Fabrication steps of the radiation dosimeter with LED indicator.
(a) Laser machine acrylic into a ring (ID = 15 mm, OD = 20 mm). (b) Cover one end of acrylic
with copper tape, attach a needle, and load with 200 μL sucrose solution (50 mM). (c) Close open
end with a breakable glass coverslip to prevent the evaporation. (d) Laser machine mold for
casting PDMS. (e) Cast PDMS rings to make dry chamber and LED indicating chamber (ID =
8 mm, OD = 15 mm). (f) Bond the PDMS ring and 200 μm PDMS membrane, then attach a small
neodymium magnet (diameter = 3 mm, height = 1 mm) at the center of the membrane. Assemble
the other PDMS ring with a battery (3 V), an LED (red), and a reed switch. (g) Bond dry chamber
to glass barrier with 20 mg of yeast inside, then glue the LED chamber on top of the membrane.
3.5 Experimental setup
The fermentation kinetics of yeast were investigated by measuring the gas generation rate at
various yeast concentrations (10 g∙L-1, 25 g∙L-1, 50 g∙L-1, and 100 g∙L-1). Reduced concentration of
yeast with sucrose solution imitates the amount of accumulated ionizing radiation exposure.
24
Therefore, fraction of yeast cells survived after exposure to ionizing radiation can be simulated
using various concentration of fermenting solutions. Each yeast sample was placed in a flask with
a 50 mM aqueous solution of sucrose and heated at 32 °C (typical human skin temperature) for
30 minutes. The generated CO2 was collected and measured via a standard pneumatic trough setup
as shown in Figure 3.4.
Figure 3. 4. Pneumatic trough setup measuring CO2 generation rate with different yeast solution
concentration.
The deflection of the 200 μm PDMS membrane in our sensor in response to pressurized
CO2 was investigated by injecting CO2 gas (concentration of 100 %, Indiana Oxygen Co.) into the
PDMS/yeast chamber of the sensor using a 30 G hypodermic needle (Sure Comfort, Insulin
syringe). Since PDMS is partially permeable to CO2, the membrane deflection saturates after some
time for a given gas flow rate (for sufficiently low flow rates) [55]. Preliminary experiments
determined that the membrane bursts open when exposed to flow rates greater than 6–7 mL/min
so we investigated deflection only for rates below these values. The maximum deflection of PDMS
for various flow rates of CO2 in the range 0–5 mL/min was measured and recorded.
The effect of radiation on yeast activity was studied by evaluating their gas generation rate
after radiation exposure. Yeast samples were exposed to various doses (0 – 1 krad) of radiation
using a Co-60 (1.13MeV) source. The yeast was then incorporated into the sensors as described in
25
the fabrication procedure (using 100 g∙L-1), and the sensors were activated. The resulting
maximum deflection of the PDMS membrane was then measured and recorded.
3.6 Radiation results
Figure 3.5a-b shows a completed radiation dosimeter. A comparison between a non-
irradiated (Figure 3.5c) and a radiated (100 rad, Figure 3.5d) sensor shows the clear visibility of
the indicator. The overall size of the sensor is sufficiently small to be comfortable worn as a
pendant, Figure 3.5e.
Figure 3. 5. Fabricated dosimeter with LED indicator. (a) Dosimeter with 200 μm membrane with
a neodymium magnet at the center. (b) Side view of the device. (c) Small deflection due to high
irradiation (100 rad) does not activate the LED (OFF). (d) High deflection due to no irradiation
activates the LED (ON). (e) Sensor worn as a necklace. Scale bar: 5 mm.
Figure 3.6 shows the results of the (non-irradiated) yeast fermentation characterization.
For each tested yeast concentration, the CO2 generation rate increases linearly with time with rates
of 0.8332 ml/min, 1.6251 ml/min, 2.6495 ml/min, and 4.9157 ml/min for the concentrations of
10 g∙L-1, 25 g∙L-1, 50 g∙L-1, and 100 g∙L-1, respectively.
26
Figure 3. 6. Volume of carbon dioxide generated from the fermentation of sucrose solution in
different concentrations of yeast (10–100 g∙L-1).
The results of the membrane deflection investigations are plotted in Figure 3.7. The data
show a linear positive trend between maximum PDMS deflection and CO2 injection rate for
flowrates in the range of 0–5 mL/min and do not burst the membrane. The largest deflection is
achieved with 5 mL/min, which is close to the generation rate of a 100 g∙L-1 yeast sample
(Figure 3.6); thus 100 g∙L-1 was the concentration used when incorporating the yeast into the
sensors.
0 10 20 300
20
40
60
Vo
lum
e (m
l)
Time (min)
10g/l
25g/l
50g/l
100g/l
27
Figure 3. 7. Maximum deflection of 200 μm PDMS membrane with injection of carbon dioxide
gas.
The effect of radiation dose on PDMS membrane deflection is shown in the semi-log plot
of Figure 3.8. The data suggest an exponential decrease in maximum deflection in response to
increasing radiation doses, with an average sensitivity of −0.195 mm/decade of radiation dose (1–
1000 rad) using Co-60 (1.13MeV) as a radiation source. The data reveal a sensitivity of
−0.00349 mm/rad for doses of 0–100 rad and a lower sensitivity (−0.00026 mm/rad) for doses
above 100 rad. Hence, the radiation dosimeter is 13.32 times more sensitive for low doses (1–
100 rad) than for higher ones (> 100 rad).
Using the radiation and deflection results, the CO2 generation rate inside the sensor can be
back-calculated for each radiation dose using a linear equation, W = 0.2728Q + 0.4315 (W =
Deflection and Q = gas generation rate), obtained from a linear fit of the data in Figure 3.7. The
CO2 generation rate can then be used to estimate the metabolic activity of irradiated yeast as a
fraction of their non-irradiated counterparts (Table 3.1). This result shows that on average almost
half of the yeast remains unimpaired by radiation doses of up to 500 rad.
0 1 2 3 4 5
0.5
1.0
1.5
2.0
Def
lect
ion
(m
m)
Carbon dioxide injection rate (ml/min)
28
Table 3. 1. Average percentage of yeast resistance to various radiation doses.
Radiation dose
(rad)
Deflection
(mm)
CO2 rate
(ml/min)
Remaining activity
(%)
0 1.40 3.55 100
20 1.25 3.00 84.50
40 1.245 2.98 84.02
60 1.162 2.68 75.40
100 1.051 2.27 64.01
300 1.01 2.12 59.7
500 0.942 1.87 52.70
1000 0.816 1.41 39.69
Figure 3. 8. Membrane deflection of yeast radiation dosimeters when exposed to different
radiation levels.
Distance between the reed switch and the membrane determines the dosimeters radiation
range indicating whether the user has been exposed to chosen radiation. However, sensitivity of
the reed switch was smaller than the sensitivity of the membrane deflection. The read-out system
must be replaced with electrical output in order to display all range of radiation dose.
1 10 100 1000
0.6
0.8
1.0
1.2
1.4
1.6
Def
lect
ion
(m
m)
Accumulated radiation dose in log (rad)
29
3.7 Conclusions
In conclusion, we have developed a low-cost, practical, and wearable personal radiation
dosimeter with sensitivity of −0.195 mm/decade-rad (1–1000 rad) using S. cerevisiae yeast as the
sensing material. The average fermentation rate is characterized as a function of the exposure dose.
The use of yeast (a biological material) for sensing produces results, which are more
physiologically relevant to the effect of radiation on living matter (e.g., tissue, humans). For
specific applications, the sensitivity can be tuned by controlling the thickness of the deflecting
membrane and the diameter of the yeast chamber. Membrane thickness and diameter can be
controlled to enhance the sensitivity of the sensor.
30
CHAPTER 4. FILM TYPE RADIATION DOSIMETER
4.1 Introduction
Ionizing radiation offers many societal benefits when managed at careful energy doses,
including high-quality food sterilization [6], [52], numerous scientific analysis applications
(Archaeologists determining ages of fossils and historical objects), and many medical therapies
(X-ray imaging and gamma-ray exposure to eradicate cancerous tissue or tumor) [56].
Nevertheless, direct exposure to excessively high doses can be detrimental to human health,
causing a wide range of medical conditions including cancer and death [57]–[59]. For this reason,
it is of utmost importance to continuously monitor radiation exposure among individuals who are
or may be exposed to radiation, including radiation workers, residence exposed to radon, and
victims of nuclear disasters (e.g., Fukushima Daiichi disaster) [2], [60]. A convenient method for
monitoring radiation is donning a small, personal, wearable dosimeter. Various such devices are
currently available including film badges [33], [61], silicon diodes [62], luminescence
dosimeters [40] and RADFETs [19], [63]; however, these wearable dosimeters are only suitable
for very specific applications; their various drawbacks such as high cost (e.g., RADFETs) or a lack
of simple, real-time user feedback (e.g., film patches with luminescence) make them impractical
for large-scale public dissemination (which would be convenient in the event of a nuclear disaster,
for instance). Moreover, most of these sensors operate on the principle of charge sensing which is
not a direct indication of the ionizing radiation damage to biological matter. To establish a
measurable damage to humans, it is reasonable to examine the use of a biological radiation sensing
material which is gnomically homologous to human cells.
It is well known that ionizing radiation introduces detrimental effects on living matter and
can even eradicate cells [64], but certain microorganisms exhibit a particularly interesting semi-
resistance to ionizing radiation enabled by their cell regeneration process [41], [65]. One of these
is baker’s yeast (S. cerevisiae). Over several millennia, this unassuming eukaryotic microorganism
has flourished into a staple of many culinary and industrial applications (e.g., brewing beer/wine,
bakery, bioremediation, and ethanol production). It has more recently established itself in
numerous scientific laboratories, where it is commonly compared to human cells due to its
homologous genetic sequence [41], [42]. Researchers working with various strains of S. cerevisiae
have also found it to be semi-resistant to ionizing radiation, i.e., not all yeast cells are completely
31
inactivated by a given dose [44], [45]. Rather, exposing a population of yeast cells to radiation
impairs their ensemble metabolic activity. Such response to radiation with measurable quantities
of byproducts or other metabolic changes can be indicative of damage to other surrounding
organisms (e.g., humans) [45]; hence, the radiation response of yeast can be leveraged to create
bio-hybrid radiation sensors with increased physiological relevance.
Figure 4. 1. Illustration of the disassembled sensing platform, chemical reaction after exposure to
ionizing radiation and fabrication process of the film radiation sensor. (a) The radiation sensing
platform can be used as a film-type radiation dosimeter around the body, (b) The yeast suffers
damages or even death from the acute ionizing radiation exposure. Only the fraction of survived
yeasts (yellow) contributes to the fermentation creating carbonic acid which increases the
electrical conductivity between two aluminum electrodes.
32
This paper presents a radiation sensing platform based on radiation-induced changes in
metabolic activity of a yeast population. As a proof-of-concept demonstration of the platform
capabilities, we fabricated an inexpensive, film-type, disposable radiation dosimeter on a paper
substrate, which can be worn on any body part by workers of radiation sites, Figure 4.1(a). When
the (dry) sensor is exposed to high energy ionizing radiation (e.g., gamma rays or UV), it damages
the proteins, enzymes, and DNA of the yeast; this, in turn, interferes with the metabolic process of
glucose fermentation once the yeast is activated with water (for sensor read-out). The impairment
is detectable as a significant drop in electrical conductivity (compared to non-irradiated yeast) and
is a function of the radiation dose, Figure 4.1(b).
4.2 Paper based film-type design and operation principle
The sensing mechanism of the dosimeter is based on the measurement of electrical
conductivity changes that occur due to byproducts of the irradiated yeast during its fermentation.
To create a sensor platform that is sufficiently simple to mass produce while allowing such
electrical measurements, the sensor is fabricated using two technologies: layer-by-layer assembly
and screen-printing. The sensor comprises light-weight and inexpensive materials such as adhesive
tape and paper. This sensor is easy to fabricate in large scale and has a wide working range of
radiation dosages.
The sensor consists of dry yeast (active material), glucose powder (fermenting medium),
double-sided tape (adhesion layer), aluminum tape (electrodes), and freezer paper (casing), Figure
4.1(a). Two parallel aluminum working electrodes are utilized to read changes in electrical
conductivity, Figure 4.1(b). The double-sided tape is patterned with 1 mm holes which supports
the electrical connection between two facing aluminum tape electrodes. This patterned double-
sided tape is used as an adhesion layer to hold yeast and glucose powders. Dry yeast pellets are
ground into a powder (particle size 50–150 µm) and is uniformly screen printed on top of the
double-sided tape. After layer-by layer assembly of these symmetric layers of yeast/glucose
powders, double-sided tape, and aluminum electrodes, they are enclosed with freezer paper by
lamination technique.
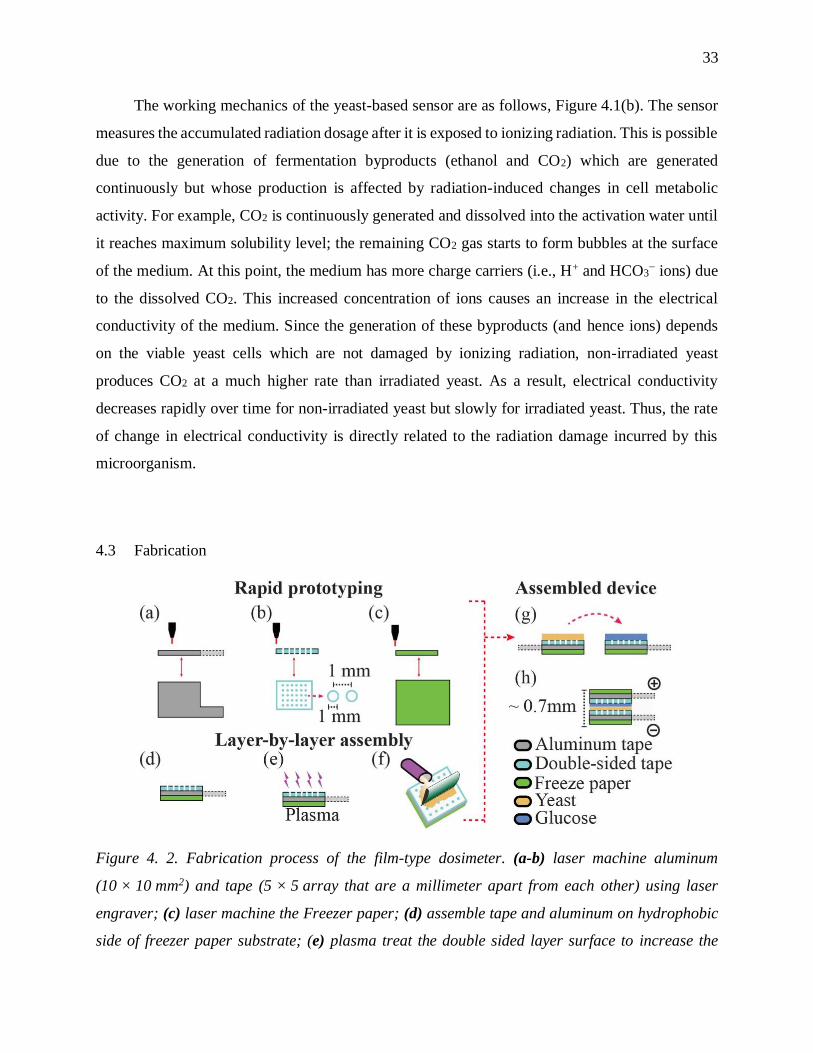
33
The working mechanics of the yeast-based sensor are as follows, Figure 4.1(b). The sensor
measures the accumulated radiation dosage after it is exposed to ionizing radiation. This is possible
due to the generation of fermentation byproducts (ethanol and CO2) which are generated
continuously but whose production is affected by radiation-induced changes in cell metabolic
activity. For example, CO2 is continuously generated and dissolved into the activation water until
it reaches maximum solubility level; the remaining CO2 gas starts to form bubbles at the surface
of the medium. At this point, the medium has more charge carriers (i.e., H+ and HCO3− ions) due
to the dissolved CO2. This increased concentration of ions causes an increase in the electrical
conductivity of the medium. Since the generation of these byproducts (and hence ions) depends
on the viable yeast cells which are not damaged by ionizing radiation, non-irradiated yeast
produces CO2 at a much higher rate than irradiated yeast. As a result, electrical conductivity
decreases rapidly over time for non-irradiated yeast but slowly for irradiated yeast. Thus, the rate
of change in electrical conductivity is directly related to the radiation damage incurred by this
microorganism.
4.3 Fabrication
Figure 4. 2. Fabrication process of the film-type dosimeter. (a-b) laser machine aluminum
(10 × 10 mm2) and tape (5 × 5 array that are a millimeter apart from each other) using laser
engraver; (c) laser machine the Freezer paper; (d) assemble tape and aluminum on hydrophobic
side of freezer paper substrate; (e) plasma treat the double sided layer surface to increase the
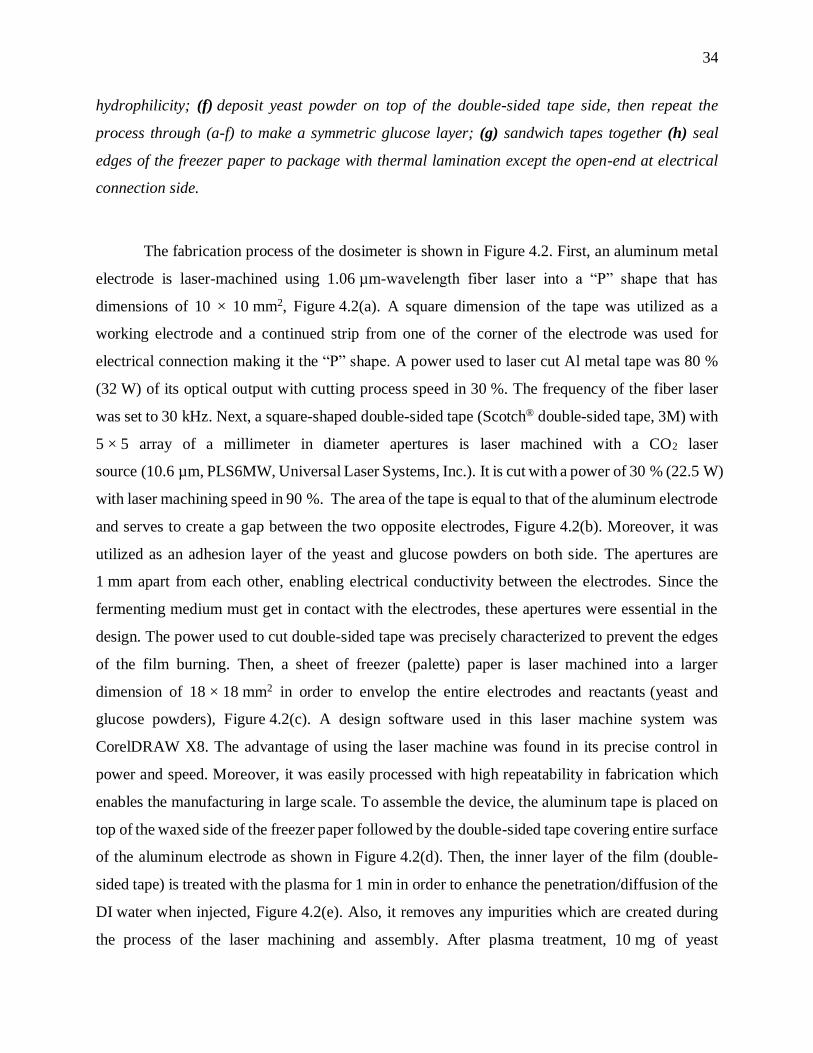
34
hydrophilicity; (f) deposit yeast powder on top of the double-sided tape side, then repeat the
process through (a-f) to make a symmetric glucose layer; (g) sandwich tapes together (h) seal
edges of the freezer paper to package with thermal lamination except the open-end at electrical
connection side.
The fabrication process of the dosimeter is shown in Figure 4.2. First, an aluminum metal
electrode is laser-machined using 1.06 µm-wavelength fiber laser into a “P” shape that has
dimensions of 10 × 10 mm2, Figure 4.2(a). A square dimension of the tape was utilized as a
working electrode and a continued strip from one of the corner of the electrode was used for
electrical connection making it the “P” shape. A power used to laser cut Al metal tape was 80 %
(32 W) of its optical output with cutting process speed in 30 %. The frequency of the fiber laser
was set to 30 kHz. Next, a square-shaped double-sided tape (Scotch® double-sided tape, 3M) with
5 × 5 array of a millimeter in diameter apertures is laser machined with a CO2 laser
source (10.6 µm, PLS6MW, Universal Laser Systems, Inc.). It is cut with a power of 30 % (22.5 W)
with laser machining speed in 90 %. The area of the tape is equal to that of the aluminum electrode
and serves to create a gap between the two opposite electrodes, Figure 4.2(b). Moreover, it was
utilized as an adhesion layer of the yeast and glucose powders on both side. The apertures are
1 mm apart from each other, enabling electrical conductivity between the electrodes. Since the
fermenting medium must get in contact with the electrodes, these apertures were essential in the
design. The power used to cut double-sided tape was precisely characterized to prevent the edges
of the film burning. Then, a sheet of freezer (palette) paper is laser machined into a larger
dimension of 18 × 18 mm2 in order to envelop the entire electrodes and reactants (yeast and
glucose powders), Figure 4.2(c). A design software used in this laser machine system was
CorelDRAW X8. The advantage of using the laser machine was found in its precise control in
power and speed. Moreover, it was easily processed with high repeatability in fabrication which
enables the manufacturing in large scale. To assemble the device, the aluminum tape is placed on
top of the waxed side of the freezer paper followed by the double-sided tape covering entire surface
of the aluminum electrode as shown in Figure 4.2(d). Then, the inner layer of the film (double-
sided tape) is treated with the plasma for 1 min in order to enhance the penetration/diffusion of the
DI water when injected, Figure 4.2(e). Also, it removes any impurities which are created during
the process of the laser machining and assembly. After plasma treatment, 10 mg of yeast
35
(Fleischmann’s® Instant Dry®) and 10 mg of glucose powder (D-(+) Glucose ≥99.5%, Sigma-
Aldrich® Co.) are screen printed on top of the double-sided tape separately, Figure 4.2(f). Both
powders are ground into fine particles of 50–200 µm for a uniform coating with an electric burr
grinder (preparation of the various test conditions is described below). After the grinding, the yeast
pellets are filtered in 50, 100, and 200 µm diameter mesh then assembled for different test
conditions. These films are sandwiched facing each other where the edges of the two freezer papers
are in contact, Figure 4.2 (g). The polymer-coated sides of the freezer paper sheets are thermally
sealed using a roller laminating machine, Figure 4.2(h). The laminated side of the freezer paper is
hydrophobic; thus it prevents any absorption of water after injection. The lamination heat is
controlled at 380 ºC and is totally isolated from the yeast of the sensor since they can be damaged
at temperatures above 50 ºC, leading to cell death [48], [66]. After the lamination, only the side
where the aluminum electrode strip extend outward remains open to allow introduction of water
to initiate fermentation. The samples are stored in refrigerated condition (3 °C) before in use. The
exposed Al metal strips were connected to LCR meter to read its electrical conductivity and
capacitance. This prolongs their shelf life, lasting up to 6 months. The final device is shown in
Figure 4.3. After the fabrication, all sensors were stored in a refrigerated (3 ºC) condition for 24
hours.
Figure 4. 3. Image of film-type dosimeter after lamination.
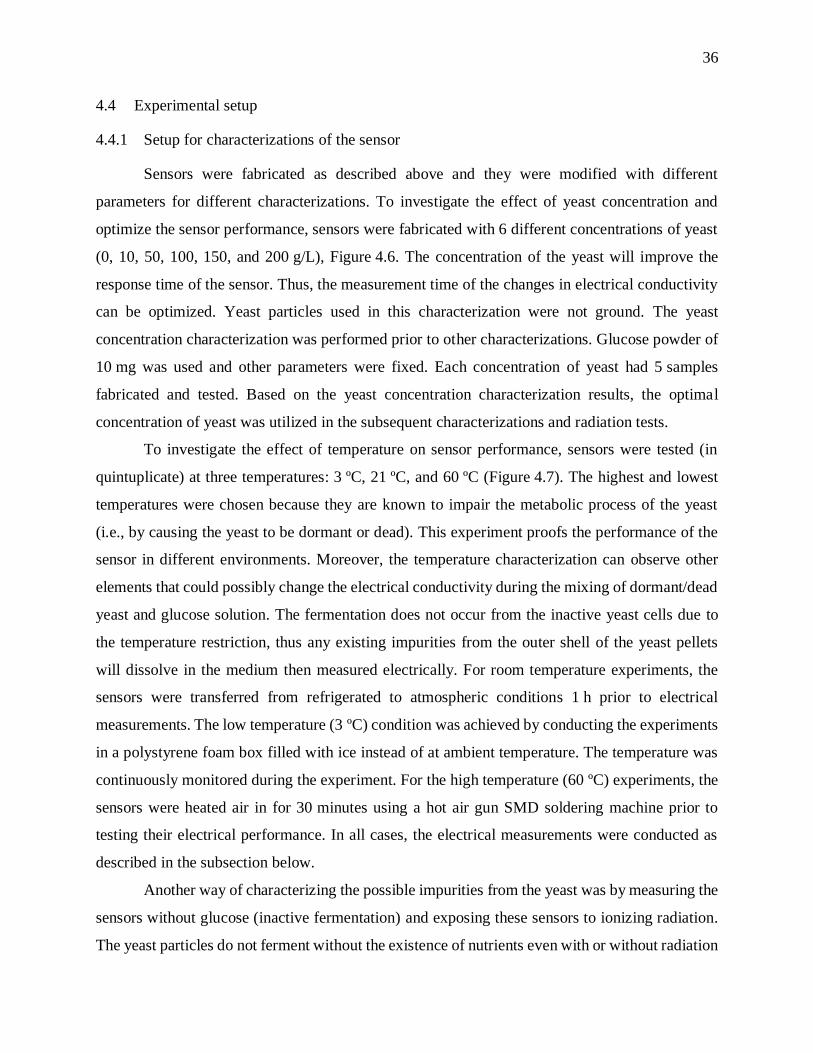
36
4.4 Experimental setup
4.4.1 Setup for characterizations of the sensor
Sensors were fabricated as described above and they were modified with different
parameters for different characterizations. To investigate the effect of yeast concentration and
optimize the sensor performance, sensors were fabricated with 6 different concentrations of yeast
(0, 10, 50, 100, 150, and 200 g/L), Figure 4.6. The concentration of the yeast will improve the
response time of the sensor. Thus, the measurement time of the changes in electrical conductivity
can be optimized. Yeast particles used in this characterization were not ground. The yeast
concentration characterization was performed prior to other characterizations. Glucose powder of
10 mg was used and other parameters were fixed. Each concentration of yeast had 5 samples
fabricated and tested. Based on the yeast concentration characterization results, the optimal
concentration of yeast was utilized in the subsequent characterizations and radiation tests.
To investigate the effect of temperature on sensor performance, sensors were tested (in
quintuplicate) at three temperatures: 3 ºC, 21 ºC, and 60 ºC (Figure 4.7). The highest and lowest
temperatures were chosen because they are known to impair the metabolic process of the yeast
(i.e., by causing the yeast to be dormant or dead). This experiment proofs the performance of the
sensor in different environments. Moreover, the temperature characterization can observe other
elements that could possibly change the electrical conductivity during the mixing of dormant/dead
yeast and glucose solution. The fermentation does not occur from the inactive yeast cells due to
the temperature restriction, thus any existing impurities from the outer shell of the yeast pellets
will dissolve in the medium then measured electrically. For room temperature experiments, the
sensors were transferred from refrigerated to atmospheric conditions 1 h prior to electrical
measurements. The low temperature (3 ºC) condition was achieved by conducting the experiments
in a polystyrene foam box filled with ice instead of at ambient temperature. The temperature was
continuously monitored during the experiment. For the high temperature (60 ºC) experiments, the
sensors were heated air in for 30 minutes using a hot air gun SMD soldering machine prior to
testing their electrical performance. In all cases, the electrical measurements were conducted as
described in the subsection below.
Another way of characterizing the possible impurities from the yeast was by measuring the
sensors without glucose (inactive fermentation) and exposing these sensors to ionizing radiation.
The yeast particles do not ferment without the existence of nutrients even with or without radiation
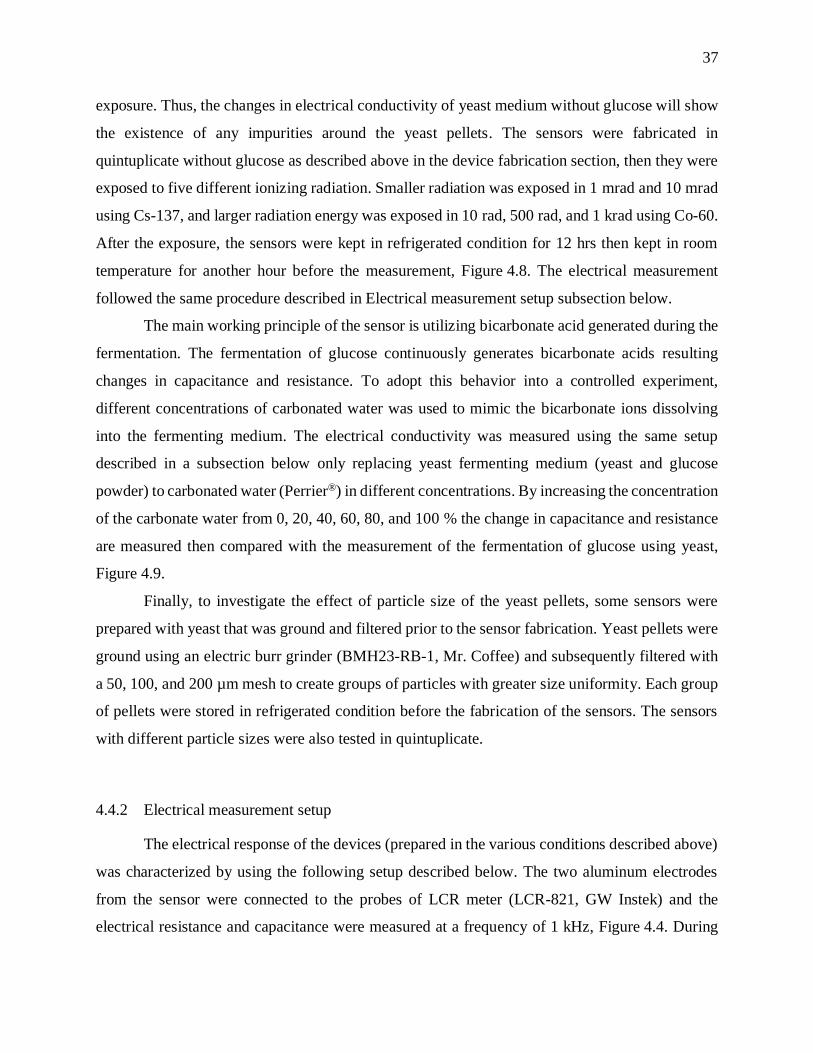
37
exposure. Thus, the changes in electrical conductivity of yeast medium without glucose will show
the existence of any impurities around the yeast pellets. The sensors were fabricated in
quintuplicate without glucose as described above in the device fabrication section, then they were
exposed to five different ionizing radiation. Smaller radiation was exposed in 1 mrad and 10 mrad
using Cs-137, and larger radiation energy was exposed in 10 rad, 500 rad, and 1 krad using Co-60.
After the exposure, the sensors were kept in refrigerated condition for 12 hrs then kept in room
temperature for another hour before the measurement, Figure 4.8. The electrical measurement
followed the same procedure described in Electrical measurement setup subsection below.
The main working principle of the sensor is utilizing bicarbonate acid generated during the
fermentation. The fermentation of glucose continuously generates bicarbonate acids resulting
changes in capacitance and resistance. To adopt this behavior into a controlled experiment,
different concentrations of carbonated water was used to mimic the bicarbonate ions dissolving
into the fermenting medium. The electrical conductivity was measured using the same setup
described in a subsection below only replacing yeast fermenting medium (yeast and glucose
powder) to carbonated water (Perrier®) in different concentrations. By increasing the concentration
of the carbonate water from 0, 20, 40, 60, 80, and 100 % the change in capacitance and resistance
are measured then compared with the measurement of the fermentation of glucose using yeast,
Figure 4.9.
Finally, to investigate the effect of particle size of the yeast pellets, some sensors were
prepared with yeast that was ground and filtered prior to the sensor fabrication. Yeast pellets were
ground using an electric burr grinder (BMH23-RB-1, Mr. Coffee) and subsequently filtered with
a 50, 100, and 200 µm mesh to create groups of particles with greater size uniformity. Each group
of pellets were stored in refrigerated condition before the fabrication of the sensors. The sensors
with different particle sizes were also tested in quintuplicate.
4.4.2 Electrical measurement setup
The electrical response of the devices (prepared in the various conditions described above)
was characterized by using the following setup described below. The two aluminum electrodes
from the sensor were connected to the probes of LCR meter (LCR-821, GW Instek) and the
electrical resistance and capacitance were measured at a frequency of 1 kHz, Figure 4.4. During
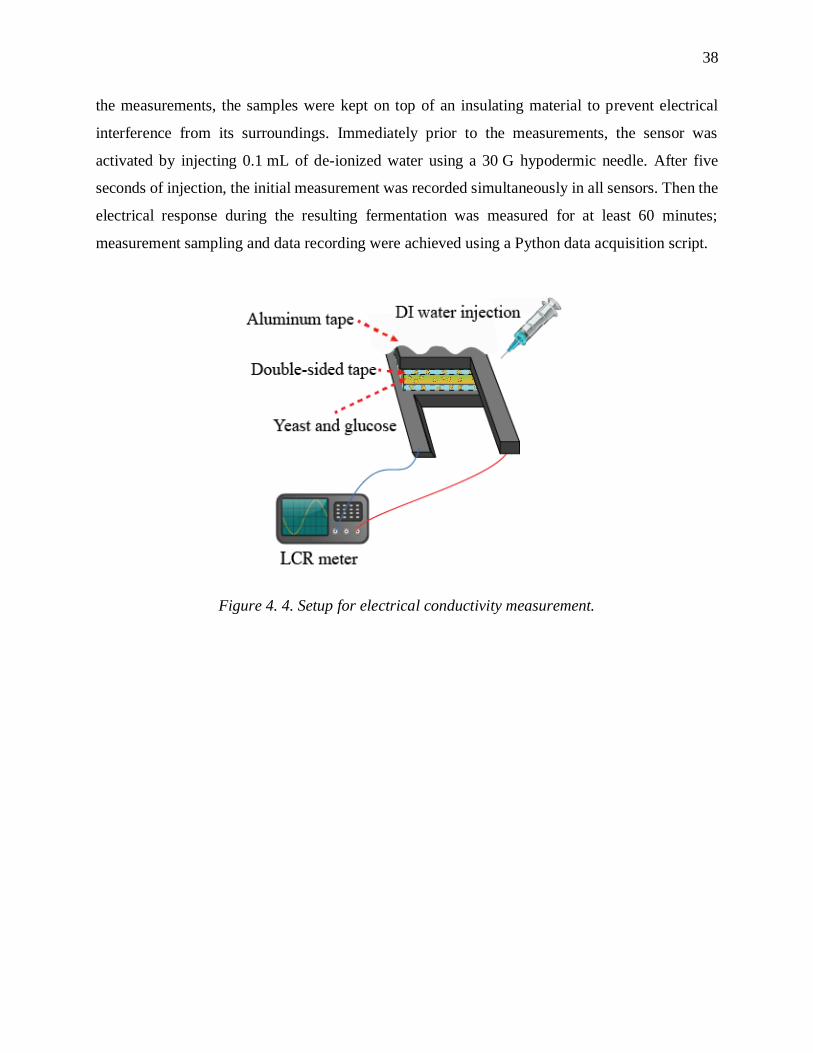
38
the measurements, the samples were kept on top of an insulating material to prevent electrical
interference from its surroundings. Immediately prior to the measurements, the sensor was
activated by injecting 0.1 mL of de-ionized water using a 30 G hypodermic needle. After five
seconds of injection, the initial measurement was recorded simultaneously in all sensors. Then the
electrical response during the resulting fermentation was measured for at least 60 minutes;
measurement sampling and data recording were achieved using a Python data acquisition script.
Figure 4. 4. Setup for electrical conductivity measurement.
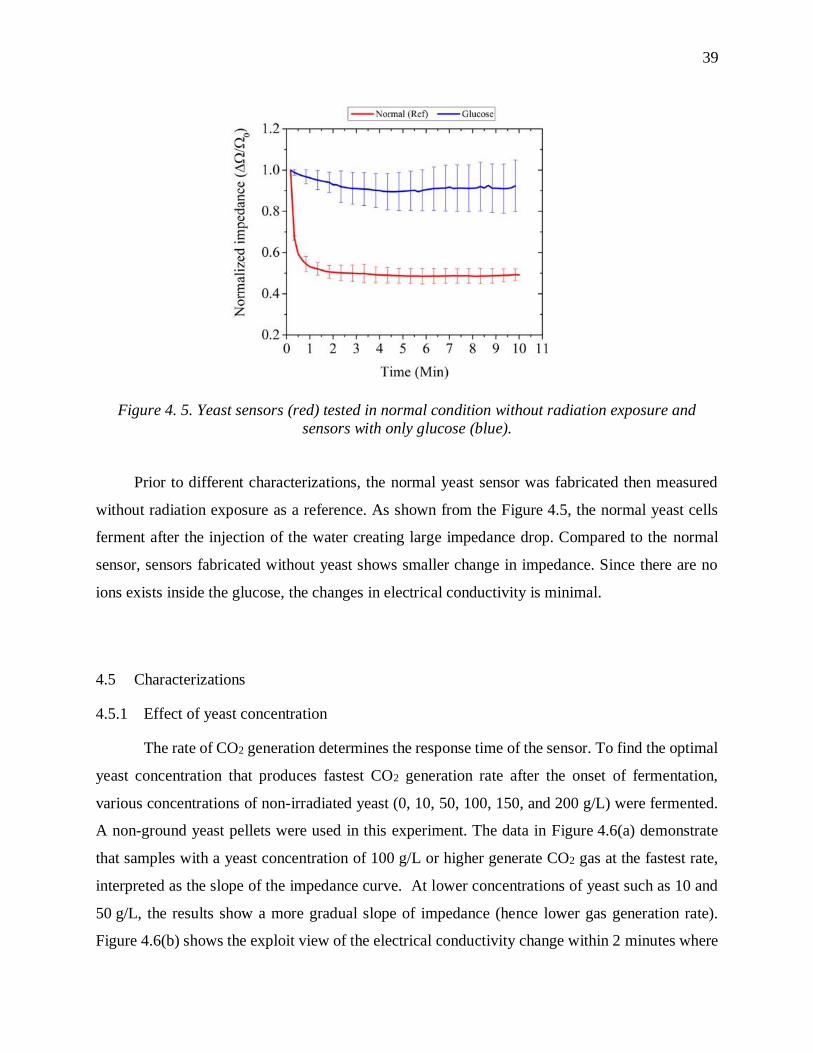
39
Figure 4. 5. Yeast sensors (red) tested in normal condition without radiation exposure and
sensors with only glucose (blue).
Prior to different characterizations, the normal yeast sensor was fabricated then measured
without radiation exposure as a reference. As shown from the Figure 4.5, the normal yeast cells
ferment after the injection of the water creating large impedance drop. Compared to the normal
sensor, sensors fabricated without yeast shows smaller change in impedance. Since there are no
ions exists inside the glucose, the changes in electrical conductivity is minimal.
4.5 Characterizations
4.5.1 Effect of yeast concentration
The rate of CO2 generation determines the response time of the sensor. To find the optimal
yeast concentration that produces fastest CO2 generation rate after the onset of fermentation,
various concentrations of non-irradiated yeast (0, 10, 50, 100, 150, and 200 g/L) were fermented.
A non-ground yeast pellets were used in this experiment. The data in Figure 4.6(a) demonstrate
that samples with a yeast concentration of 100 g/L or higher generate CO2 gas at the fastest rate,
interpreted as the slope of the impedance curve. At lower concentrations of yeast such as 10 and
50 g/L, the results show a more gradual slope of impedance (hence lower gas generation rate).
Figure 4.6(b) shows the exploit view of the electrical conductivity change within 2 minutes where
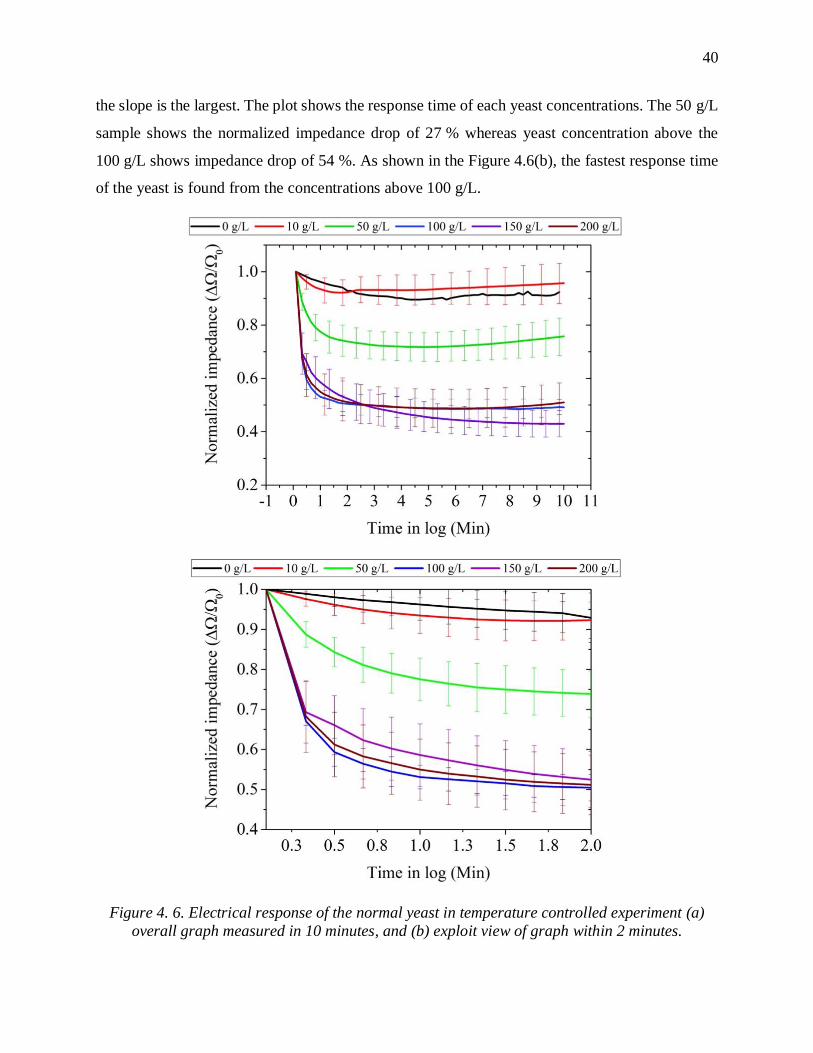
40
the slope is the largest. The plot shows the response time of each yeast concentrations. The 50 g/L
sample shows the normalized impedance drop of 27 % whereas yeast concentration above the
100 g/L shows impedance drop of 54 %. As shown in the Figure 4.6(b), the fastest response time
of the yeast is found from the concentrations above 100 g/L.
Figure 4. 6. Electrical response of the normal yeast in temperature controlled experiment (a)
overall graph measured in 10 minutes, and (b) exploit view of graph within 2 minutes.
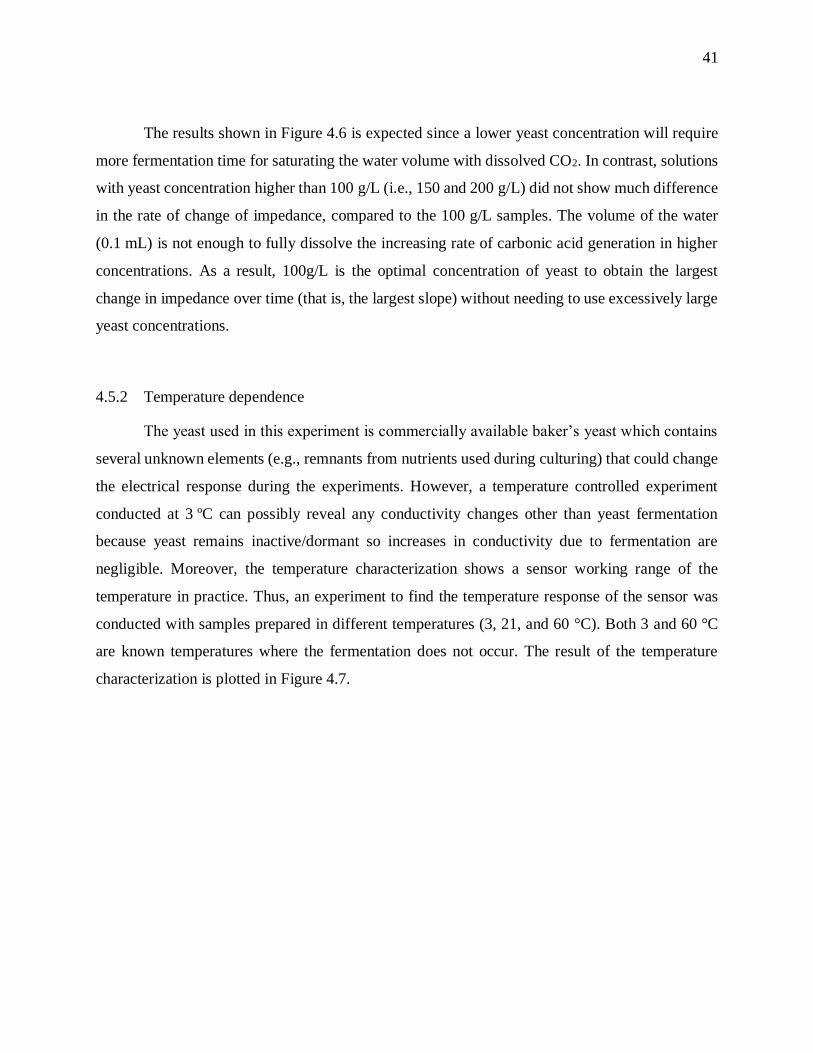
41
The results shown in Figure 4.6 is expected since a lower yeast concentration will require
more fermentation time for saturating the water volume with dissolved CO2. In contrast, solutions
with yeast concentration higher than 100 g/L (i.e., 150 and 200 g/L) did not show much difference
in the rate of change of impedance, compared to the 100 g/L samples. The volume of the water
(0.1 mL) is not enough to fully dissolve the increasing rate of carbonic acid generation in higher
concentrations. As a result, 100g/L is the optimal concentration of yeast to obtain the largest
change in impedance over time (that is, the largest slope) without needing to use excessively large
yeast concentrations.
4.5.2 Temperature dependence
The yeast used in this experiment is commercially available baker’s yeast which contains
several unknown elements (e.g., remnants from nutrients used during culturing) that could change
the electrical response during the experiments. However, a temperature controlled experiment
conducted at 3 ºC can possibly reveal any conductivity changes other than yeast fermentation
because yeast remains inactive/dormant so increases in conductivity due to fermentation are
negligible. Moreover, the temperature characterization shows a sensor working range of the
temperature in practice. Thus, an experiment to find the temperature response of the sensor was
conducted with samples prepared in different temperatures (3, 21, and 60 °C). Both 3 and 60 °C
are known temperatures where the fermentation does not occur. The result of the temperature
characterization is plotted in Figure 4.7.
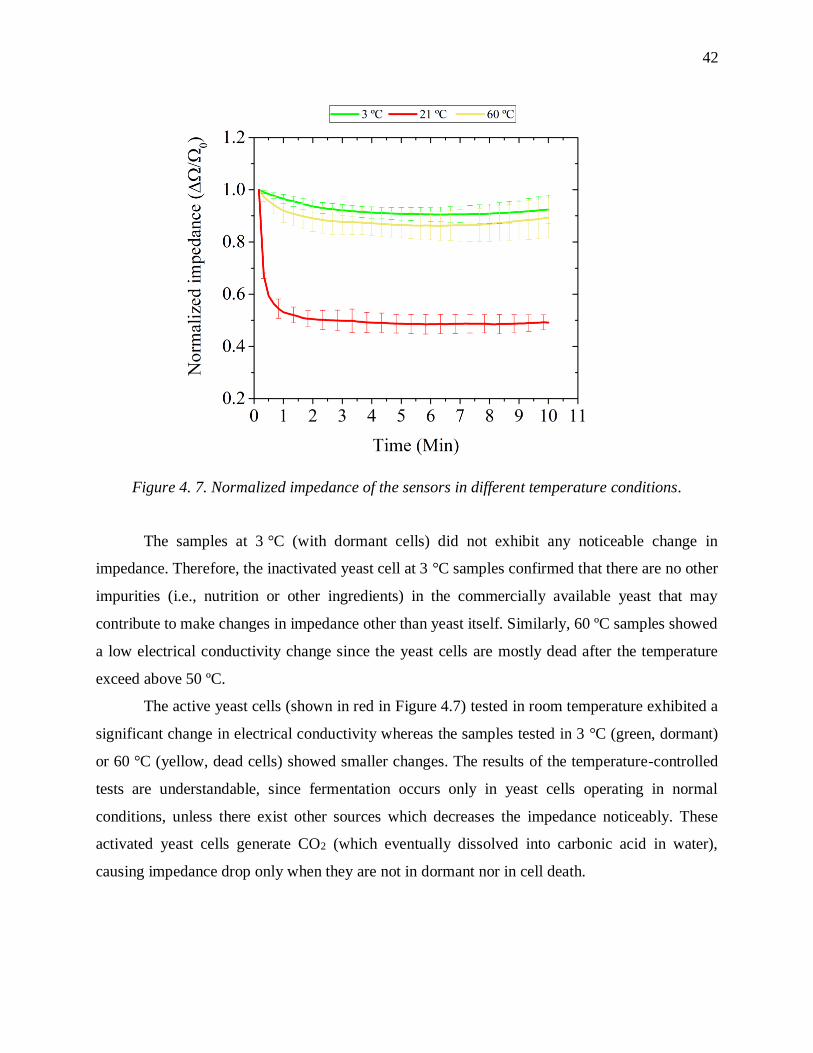
42
Figure 4. 7. Normalized impedance of the sensors in different temperature conditions.
The samples at 3 °C (with dormant cells) did not exhibit any noticeable change in
impedance. Therefore, the inactivated yeast cell at 3 °C samples confirmed that there are no other
impurities (i.e., nutrition or other ingredients) in the commercially available yeast that may
contribute to make changes in impedance other than yeast itself. Similarly, 60 ºC samples showed
a low electrical conductivity change since the yeast cells are mostly dead after the temperature
exceed above 50 ºC.
The active yeast cells (shown in red in Figure 4.7) tested in room temperature exhibited a
significant change in electrical conductivity whereas the samples tested in 3 °C (green, dormant)
or 60 °C (yellow, dead cells) showed smaller changes. The results of the temperature-controlled
tests are understandable, since fermentation occurs only in yeast cells operating in normal
conditions, unless there exist other sources which decreases the impedance noticeably. These
activated yeast cells generate CO2 (which eventually dissolved into carbonic acid in water),
causing impedance drop only when they are not in dormant nor in cell death.
43
4.5.3 Effect of glucose (Inactive fermentation)
The commercially available Baker’s yeast has a clear advantage in long-shelf life, easy
handling, and mass production. Nevertheless, it was important to identify any impurities as
mentioned from the previous experiment conducted (temperature test) and to validate the working
principle of this sensor: metabolic disorder caused by ionizing radiation. To confirm that the
electrical response of yeast is due to changes in its metabolic activity, rather than due to these
remnant elements, we investigated the electrical response in the absence of glucose. As well known,
the metabolic process of the yeast does not initiate when there is no consumable glucose. Thus, by
eliminating the glucose inside the sensor, the yeast cells will not produce the bicarbonate ions
when immersed in water. Any impurities from inside or outside the cells would be measured during
the experiment. The sensors were prepared without glucose powder but followed the device
fabrication process as described in the Method section. The fabricated sensors were exposed to
different radiation level from 1 mrad to 1 krad using Cs-137 and Co-60 with leaving non-irradiated
sensors as a control. After the exposure to five different radiation levels (1 mrad, 10 mrad, 10 rad,
500 rad, and 1 krad), the change in electrical impedance was measured and plotted in Figure 4.8.
Figure 4. 8. Normalized impedance during the fermentation without glucose.
As shown from the plot, there is no relevance of radiation effect and showed small change
in impedance when fermentation was not introduced with glucose neglected sensors. After the
onset of experiment, the sensors without glucose showed slight reduction in normalized impedance
due to these unknown impurities. In contrast, the non-irradiated samples with glucose clearly
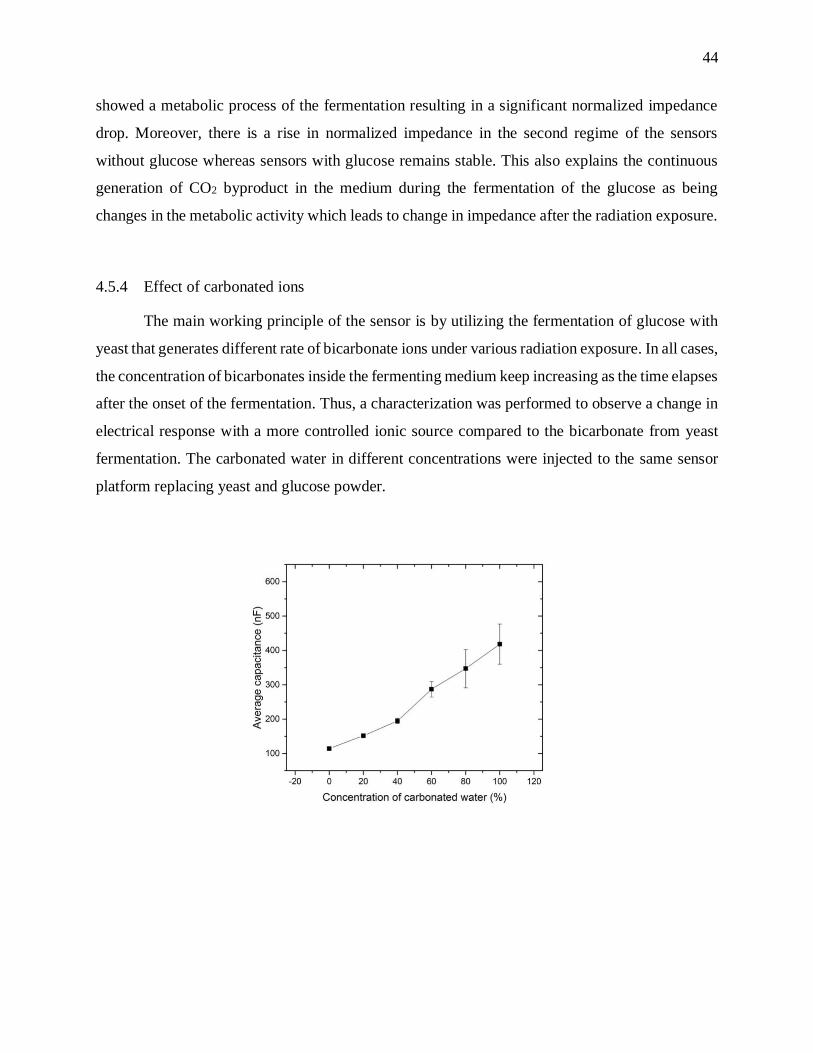
44
showed a metabolic process of the fermentation resulting in a significant normalized impedance
drop. Moreover, there is a rise in normalized impedance in the second regime of the sensors
without glucose whereas sensors with glucose remains stable. This also explains the continuous
generation of CO2 byproduct in the medium during the fermentation of the glucose as being
changes in the metabolic activity which leads to change in impedance after the radiation exposure.
4.5.4 Effect of carbonated ions
The main working principle of the sensor is by utilizing the fermentation of glucose with
yeast that generates different rate of bicarbonate ions under various radiation exposure. In all cases,
the concentration of bicarbonates inside the fermenting medium keep increasing as the time elapses
after the onset of the fermentation. Thus, a characterization was performed to observe a change in
electrical response with a more controlled ionic source compared to the bicarbonate from yeast
fermentation. The carbonated water in different concentrations were injected to the same sensor
platform replacing yeast and glucose powder.
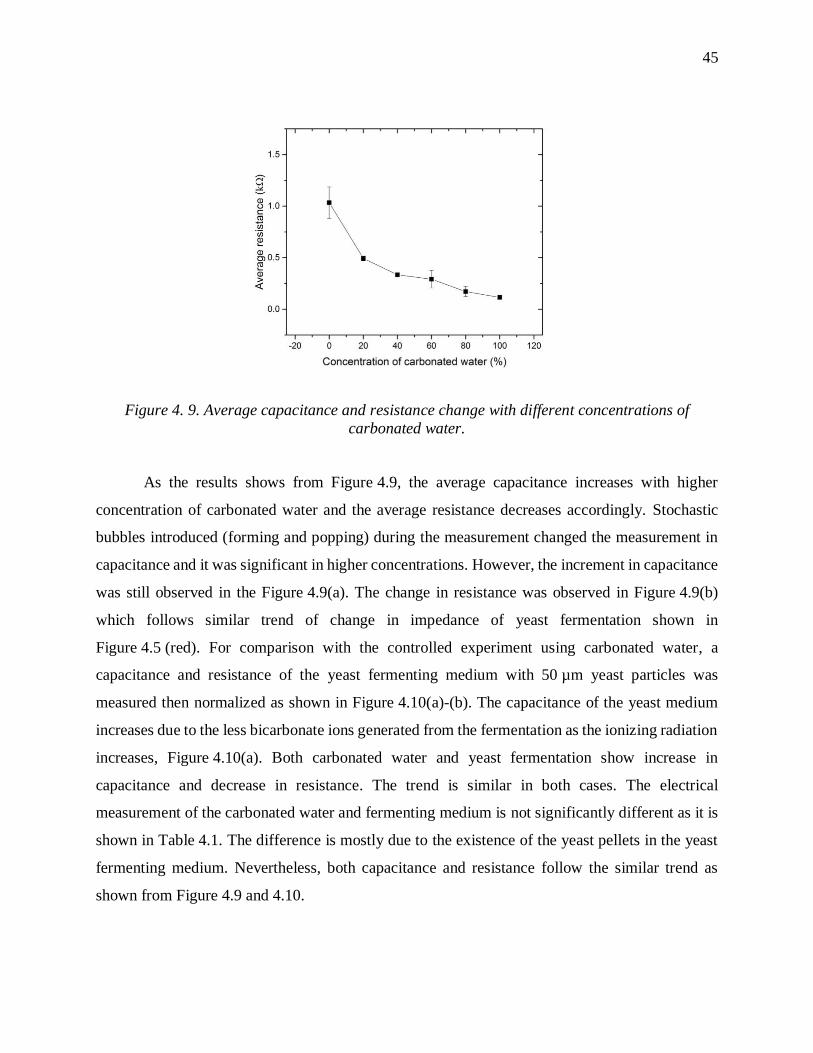
45
Figure 4. 9. Average capacitance and resistance change with different concentrations of
carbonated water.
As the results shows from Figure 4.9, the average capacitance increases with higher
concentration of carbonated water and the average resistance decreases accordingly. Stochastic
bubbles introduced (forming and popping) during the measurement changed the measurement in
capacitance and it was significant in higher concentrations. However, the increment in capacitance
was still observed in the Figure 4.9(a). The change in resistance was observed in Figure 4.9(b)
which follows similar trend of change in impedance of yeast fermentation shown in
Figure 4.5 (red). For comparison with the controlled experiment using carbonated water, a
capacitance and resistance of the yeast fermenting medium with 50 µm yeast particles was
measured then normalized as shown in Figure 4.10(a)-(b). The capacitance of the yeast medium
increases due to the less bicarbonate ions generated from the fermentation as the ionizing radiation
increases, Figure 4.10(a). Both carbonated water and yeast fermentation show increase in
capacitance and decrease in resistance. The trend is similar in both cases. The electrical
measurement of the carbonated water and fermenting medium is not significantly different as it is
shown in Table 4.1. The difference is mostly due to the existence of the yeast pellets in the yeast
fermenting medium. Nevertheless, both capacitance and resistance follow the similar trend as
shown from Figure 4.9 and 4.10.
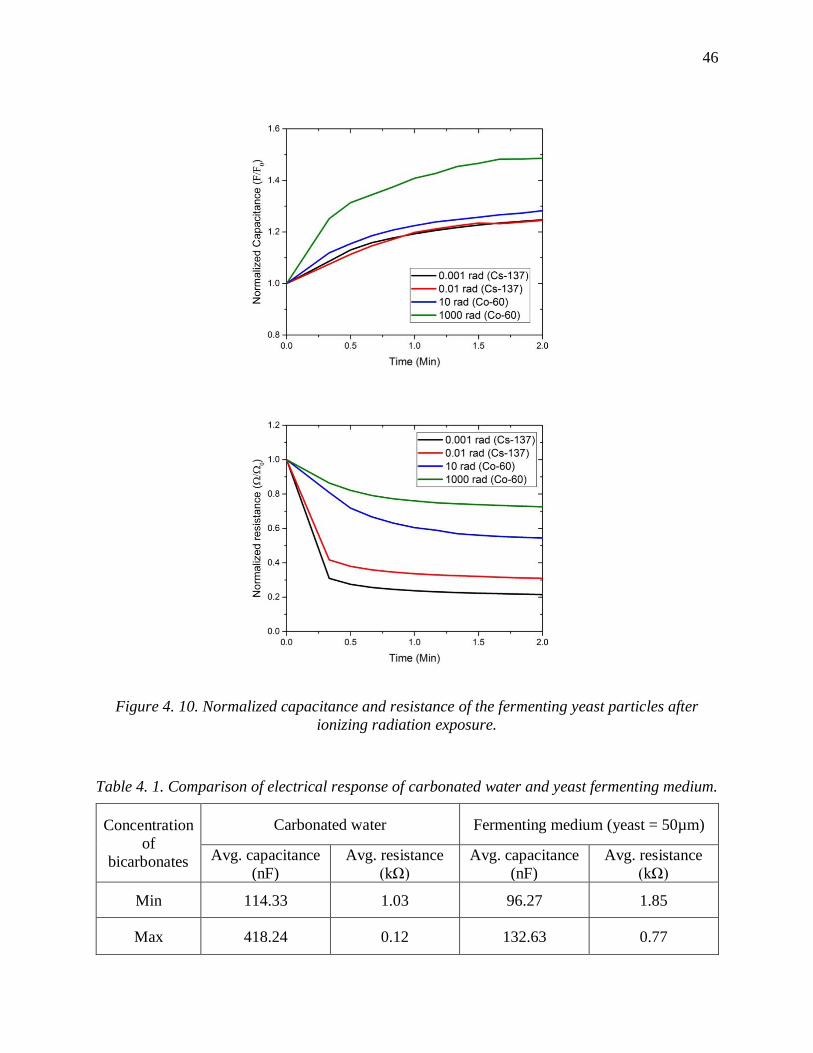
46
Figure 4. 10. Normalized capacitance and resistance of the fermenting yeast particles after
ionizing radiation exposure.
Table 4. 1. Comparison of electrical response of carbonated water and yeast fermenting medium.
Concentration
of
bicarbonates
Carbonated water Fermenting medium (yeast = 50µm)
Avg. capacitance
(nF)
Avg. resistance
(kΩ)
Avg. capacitance
(nF)
Avg. resistance
(kΩ)
Min 114.33 1.03 96.27 1.85
Max 418.24 0.12 132.63 0.77
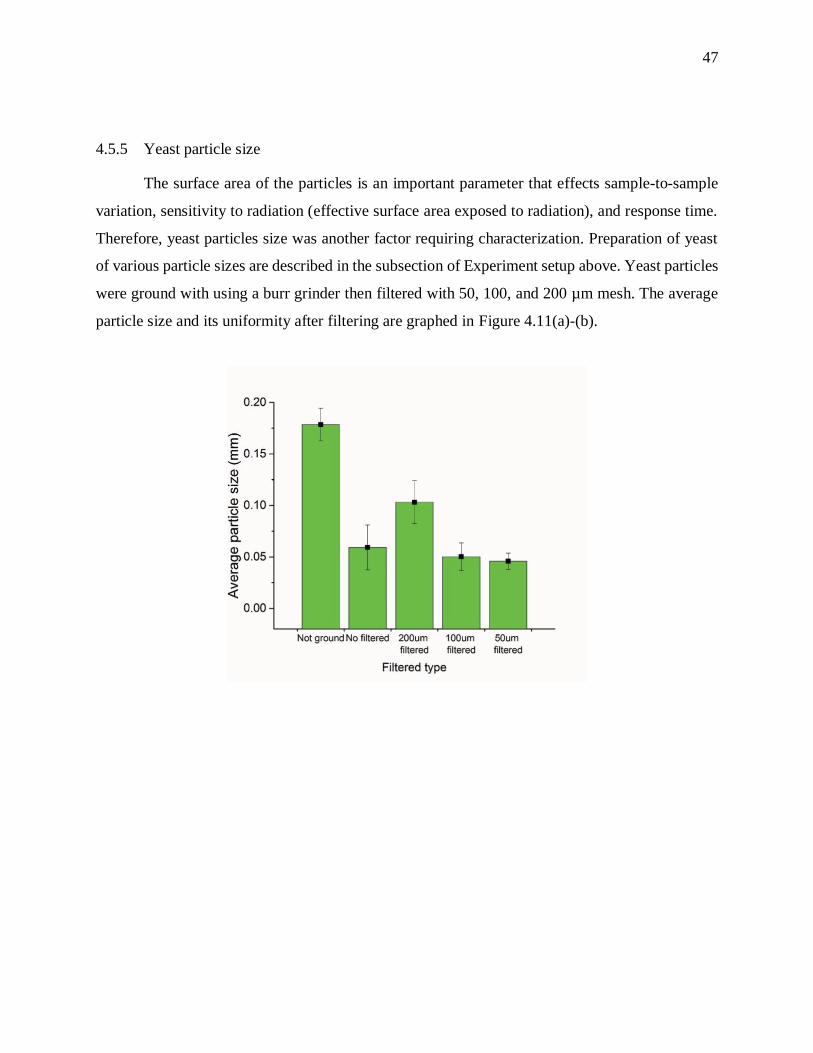
47
4.5.5 Yeast particle size
The surface area of the particles is an important parameter that effects sample-to-sample
variation, sensitivity to radiation (effective surface area exposed to radiation), and response time.
Therefore, yeast particles size was another factor requiring characterization. Preparation of yeast
of various particle sizes are described in the subsection of Experiment setup above. Yeast particles
were ground with using a burr grinder then filtered with 50, 100, and 200 µm mesh. The average
particle size and its uniformity after filtering are graphed in Figure 4.11(a)-(b).
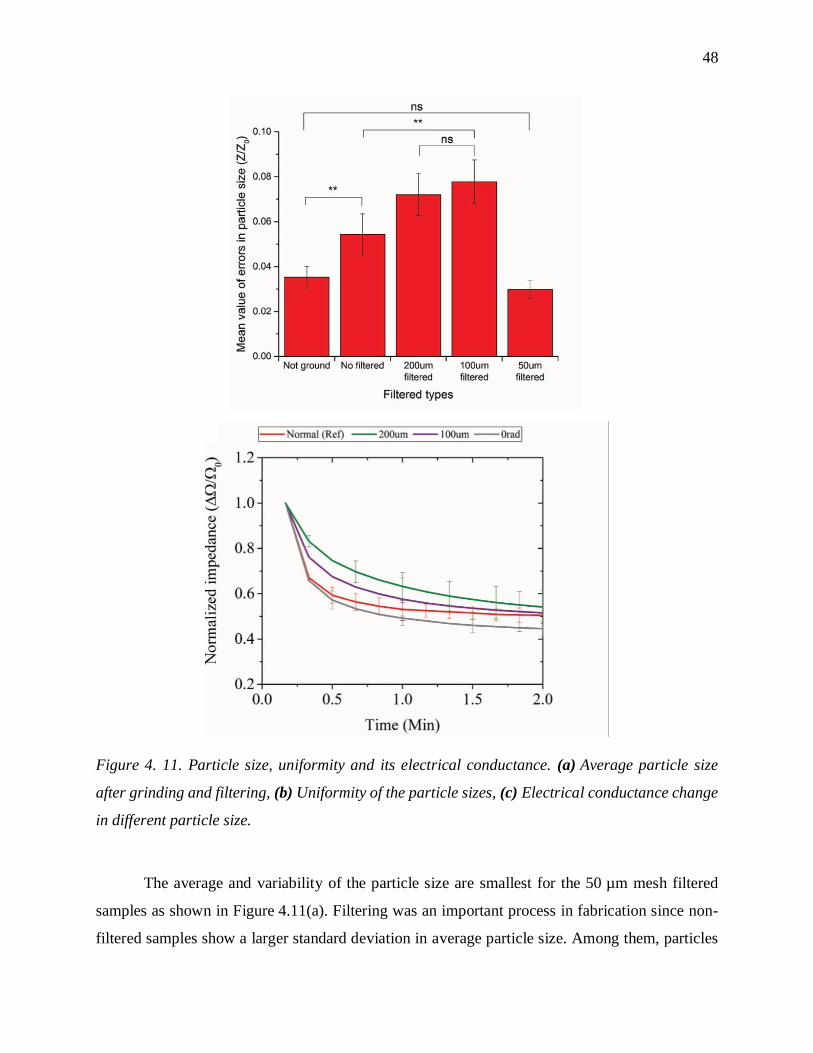
48
Figure 4. 11. Particle size, uniformity and its electrical conductance. (a) Average particle size
after grinding and filtering, (b) Uniformity of the particle sizes, (c) Electrical conductance change
in different particle size.
The average and variability of the particle size are smallest for the 50 µm mesh filtered
samples as shown in Figure 4.11(a). Filtering was an important process in fabrication since non-
filtered samples show a larger standard deviation in average particle size. Among them, particles
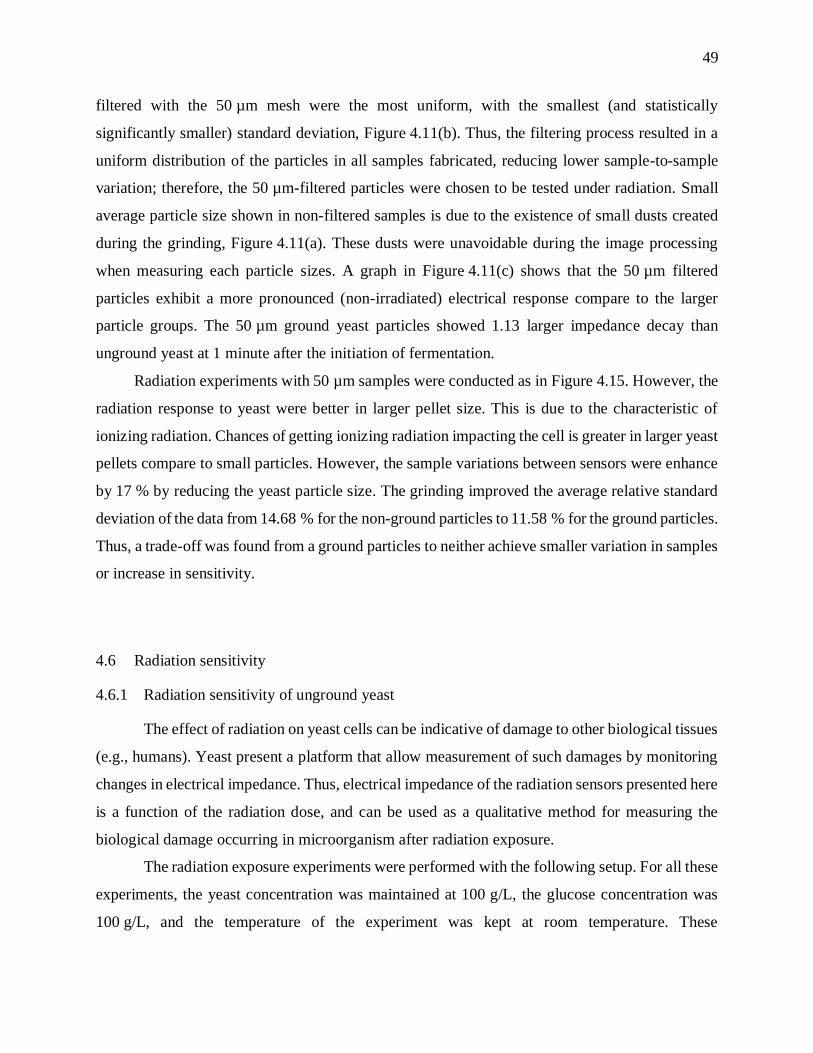
49
filtered with the 50 µm mesh were the most uniform, with the smallest (and statistically
significantly smaller) standard deviation, Figure 4.11(b). Thus, the filtering process resulted in a
uniform distribution of the particles in all samples fabricated, reducing lower sample-to-sample
variation; therefore, the 50 µm-filtered particles were chosen to be tested under radiation. Small
average particle size shown in non-filtered samples is due to the existence of small dusts created
during the grinding, Figure 4.11(a). These dusts were unavoidable during the image processing
when measuring each particle sizes. A graph in Figure 4.11(c) shows that the 50 µm filtered
particles exhibit a more pronounced (non-irradiated) electrical response compare to the larger
particle groups. The 50 µm ground yeast particles showed 1.13 larger impedance decay than
unground yeast at 1 minute after the initiation of fermentation.
Radiation experiments with 50 µm samples were conducted as in Figure 4.15. However, the
radiation response to yeast were better in larger pellet size. This is due to the characteristic of
ionizing radiation. Chances of getting ionizing radiation impacting the cell is greater in larger yeast
pellets compare to small particles. However, the sample variations between sensors were enhance
by 17 % by reducing the yeast particle size. The grinding improved the average relative standard
deviation of the data from 14.68 % for the non-ground particles to 11.58 % for the ground particles.
Thus, a trade-off was found from a ground particles to neither achieve smaller variation in samples
or increase in sensitivity.
4.6 Radiation sensitivity
4.6.1 Radiation sensitivity of unground yeast
The effect of radiation on yeast cells can be indicative of damage to other biological tissues
(e.g., humans). Yeast present a platform that allow measurement of such damages by monitoring
changes in electrical impedance. Thus, electrical impedance of the radiation sensors presented here
is a function of the radiation dose, and can be used as a qualitative method for measuring the
biological damage occurring in microorganism after radiation exposure.
The radiation exposure experiments were performed with the following setup. For all these
experiments, the yeast concentration was maintained at 100 g/L, the glucose concentration was
100 g/L, and the temperature of the experiment was kept at room temperature. These
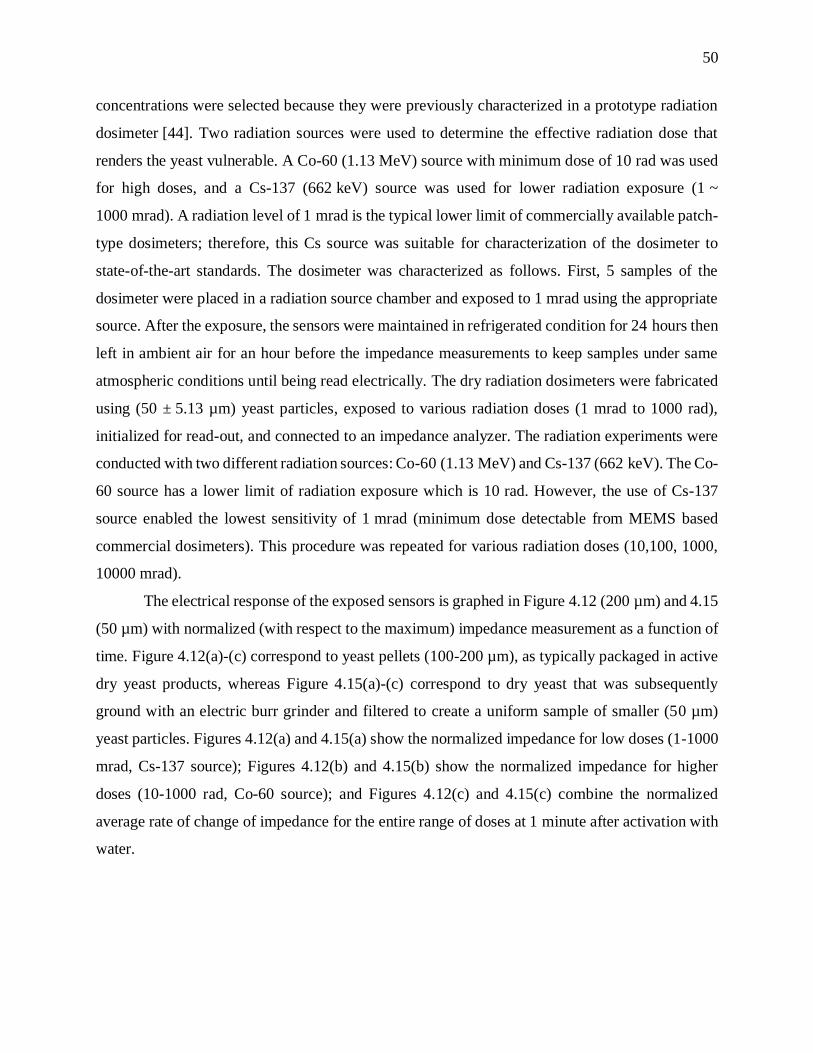
50
concentrations were selected because they were previously characterized in a prototype radiation
dosimeter [44]. Two radiation sources were used to determine the effective radiation dose that
renders the yeast vulnerable. A Co-60 (1.13 MeV) source with minimum dose of 10 rad was used
for high doses, and a Cs-137 (662 keV) source was used for lower radiation exposure (1 ~
1000 mrad). A radiation level of 1 mrad is the typical lower limit of commercially available patch-
type dosimeters; therefore, this Cs source was suitable for characterization of the dosimeter to
state-of-the-art standards. The dosimeter was characterized as follows. First, 5 samples of the
dosimeter were placed in a radiation source chamber and exposed to 1 mrad using the appropriate
source. After the exposure, the sensors were maintained in refrigerated condition for 24 hours then
left in ambient air for an hour before the impedance measurements to keep samples under same
atmospheric conditions until being read electrically. The dry radiation dosimeters were fabricated
using (50 ± 5.13 µm) yeast particles, exposed to various radiation doses (1 mrad to 1000 rad),
initialized for read-out, and connected to an impedance analyzer. The radiation experiments were
conducted with two different radiation sources: Co-60 (1.13 MeV) and Cs-137 (662 keV). The Co-
60 source has a lower limit of radiation exposure which is 10 rad. However, the use of Cs-137
source enabled the lowest sensitivity of 1 mrad (minimum dose detectable from MEMS based
commercial dosimeters). This procedure was repeated for various radiation doses (10,100, 1000,
10000 mrad).
The electrical response of the exposed sensors is graphed in Figure 4.12 (200 µm) and 4.15
(50 µm) with normalized (with respect to the maximum) impedance measurement as a function of
time. Figure 4.12(a)-(c) correspond to yeast pellets (100-200 µm), as typically packaged in active
dry yeast products, whereas Figure 4.15(a)-(c) correspond to dry yeast that was subsequently
ground with an electric burr grinder and filtered to create a uniform sample of smaller (50 µm)
yeast particles. Figures 4.12(a) and 4.15(a) show the normalized impedance for low doses (1-1000
mrad, Cs-137 source); Figures 4.12(b) and 4.15(b) show the normalized impedance for higher
doses (10-1000 rad, Co-60 source); and Figures 4.12(c) and 4.15(c) combine the normalized
average rate of change of impedance for the entire range of doses at 1 minute after activation with
water.
51
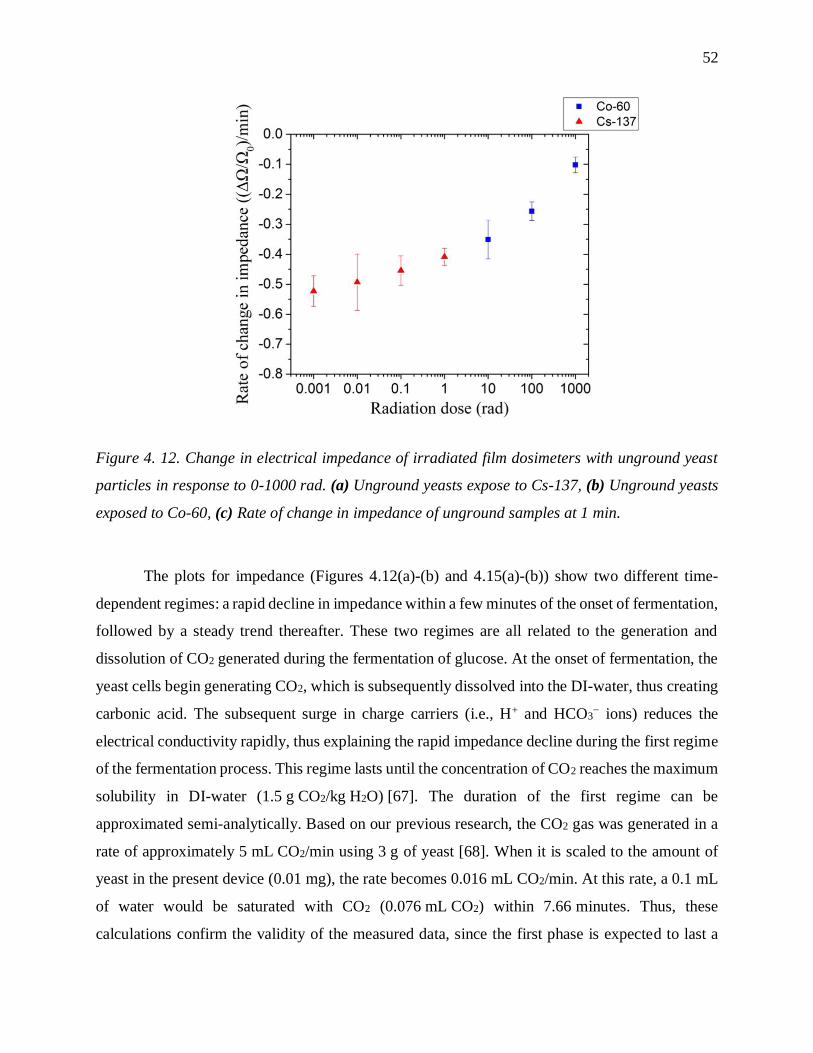
52
Figure 4. 12. Change in electrical impedance of irradiated film dosimeters with unground yeast
particles in response to 0-1000 rad. (a) Unground yeasts expose to Cs-137, (b) Unground yeasts
exposed to Co-60, (c) Rate of change in impedance of unground samples at 1 min.
The plots for impedance (Figures 4.12(a)-(b) and 4.15(a)-(b)) show two different time-
dependent regimes: a rapid decline in impedance within a few minutes of the onset of fermentation,
followed by a steady trend thereafter. These two regimes are all related to the generation and
dissolution of CO2 generated during the fermentation of glucose. At the onset of fermentation, the
yeast cells begin generating CO2, which is subsequently dissolved into the DI-water, thus creating
carbonic acid. The subsequent surge in charge carriers (i.e., H+ and HCO3− ions) reduces the
electrical conductivity rapidly, thus explaining the rapid impedance decline during the first regime
of the fermentation process. This regime lasts until the concentration of CO2 reaches the maximum
solubility in DI-water (1.5 g CO2/kg H2O) [67]. The duration of the first regime can be
approximated semi-analytically. Based on our previous research, the CO2 gas was generated in a
rate of approximately 5 mL CO2/min using 3 g of yeast [68]. When it is scaled to the amount of
yeast in the present device (0.01 mg), the rate becomes 0.016 mL CO2/min. At this rate, a 0.1 mL
of water would be saturated with CO2 (0.076 mL CO2) within 7.66 minutes. Thus, these
calculations confirm the validity of the measured data, since the first phase is expected to last a
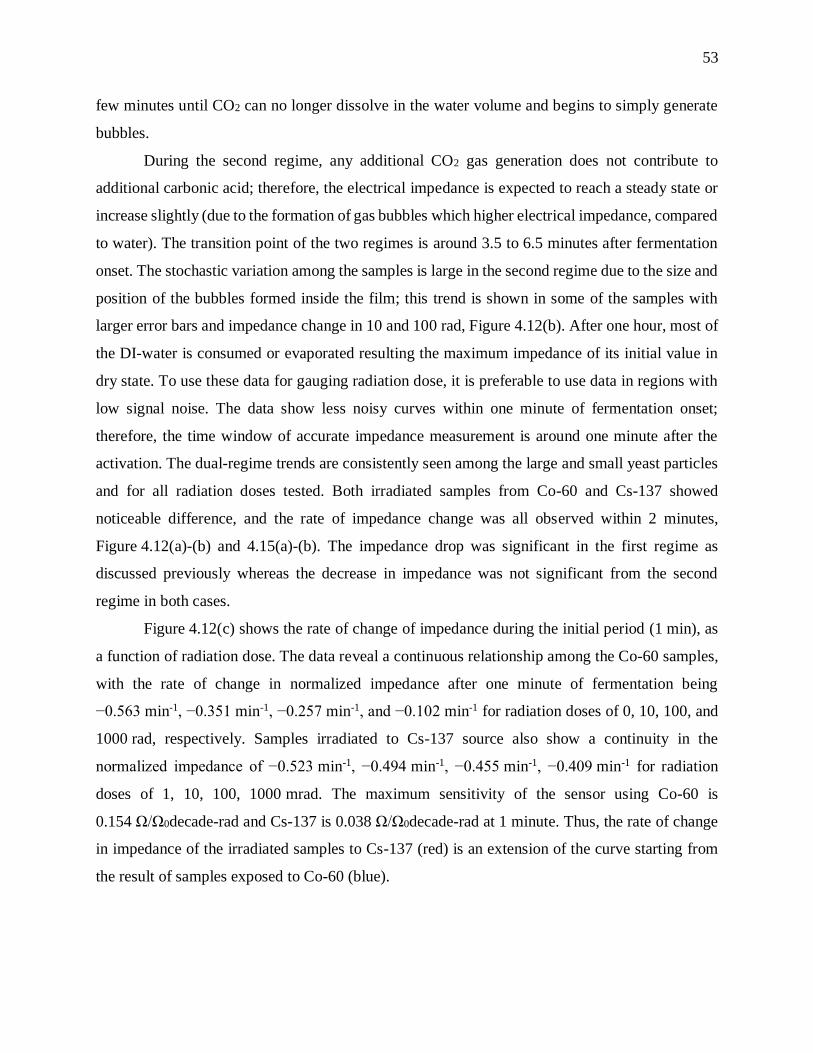
53
few minutes until CO2 can no longer dissolve in the water volume and begins to simply generate
bubbles.
During the second regime, any additional CO2 gas generation does not contribute to
additional carbonic acid; therefore, the electrical impedance is expected to reach a steady state or
increase slightly (due to the formation of gas bubbles which higher electrical impedance, compared
to water). The transition point of the two regimes is around 3.5 to 6.5 minutes after fermentation
onset. The stochastic variation among the samples is large in the second regime due to the size and
position of the bubbles formed inside the film; this trend is shown in some of the samples with
larger error bars and impedance change in 10 and 100 rad, Figure 4.12(b). After one hour, most of
the DI-water is consumed or evaporated resulting the maximum impedance of its initial value in
dry state. To use these data for gauging radiation dose, it is preferable to use data in regions with
low signal noise. The data show less noisy curves within one minute of fermentation onset;
therefore, the time window of accurate impedance measurement is around one minute after the
activation. The dual-regime trends are consistently seen among the large and small yeast particles
and for all radiation doses tested. Both irradiated samples from Co-60 and Cs-137 showed
noticeable difference, and the rate of impedance change was all observed within 2 minutes,
Figure 4.12(a)-(b) and 4.15(a)-(b). The impedance drop was significant in the first regime as
discussed previously whereas the decrease in impedance was not significant from the second
regime in both cases.
Figure 4.12(c) shows the rate of change of impedance during the initial period (1 min), as
a function of radiation dose. The data reveal a continuous relationship among the Co-60 samples,
with the rate of change in normalized impedance after one minute of fermentation being
−0.563 min-1, −0.351 min-1, −0.257 min-1, and −0.102 min-1 for radiation doses of 0, 10, 100, and
1000 rad, respectively. Samples irradiated to Cs-137 source also show a continuity in the
normalized impedance of −0.523 min-1, −0.494 min-1, −0.455 min-1, −0.409 min-1 for radiation
doses of 1, 10, 100, 1000 mrad. The maximum sensitivity of the sensor using Co-60 is
0.154 Ω/Ω0decade-rad and Cs-137 is 0.038 Ω/Ω0decade-rad at 1 minute. Thus, the rate of change
in impedance of the irradiated samples to Cs-137 (red) is an extension of the curve starting from
the result of samples exposed to Co-60 (blue).
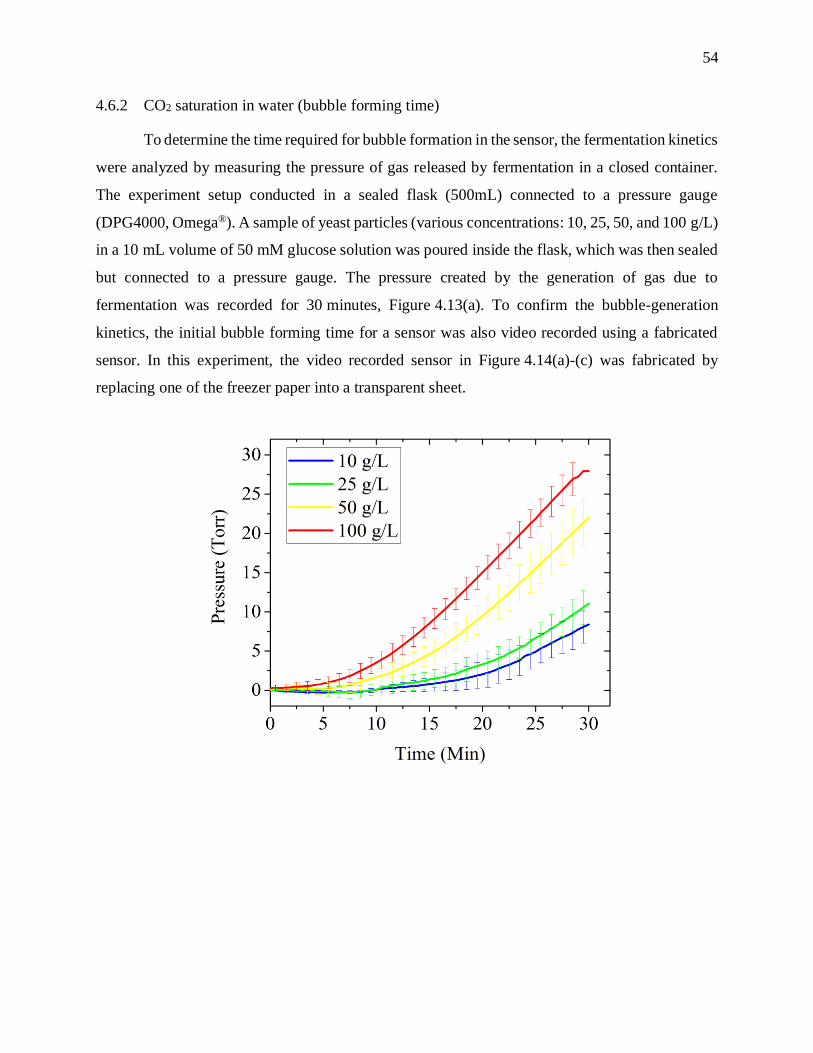
54
4.6.2 CO2 saturation in water (bubble forming time)
To determine the time required for bubble formation in the sensor, the fermentation kinetics
were analyzed by measuring the pressure of gas released by fermentation in a closed container.
The experiment setup conducted in a sealed flask (500mL) connected to a pressure gauge
(DPG4000, Omega®). A sample of yeast particles (various concentrations: 10, 25, 50, and 100 g/L)
in a 10 mL volume of 50 mM glucose solution was poured inside the flask, which was then sealed
but connected to a pressure gauge. The pressure created by the generation of gas due to
fermentation was recorded for 30 minutes, Figure 4.13(a). To confirm the bubble-generation
kinetics, the initial bubble forming time for a sensor was also video recorded using a fabricated
sensor. In this experiment, the video recorded sensor in Figure 4.14(a)-(c) was fabricated by
replacing one of the freezer paper into a transparent sheet.
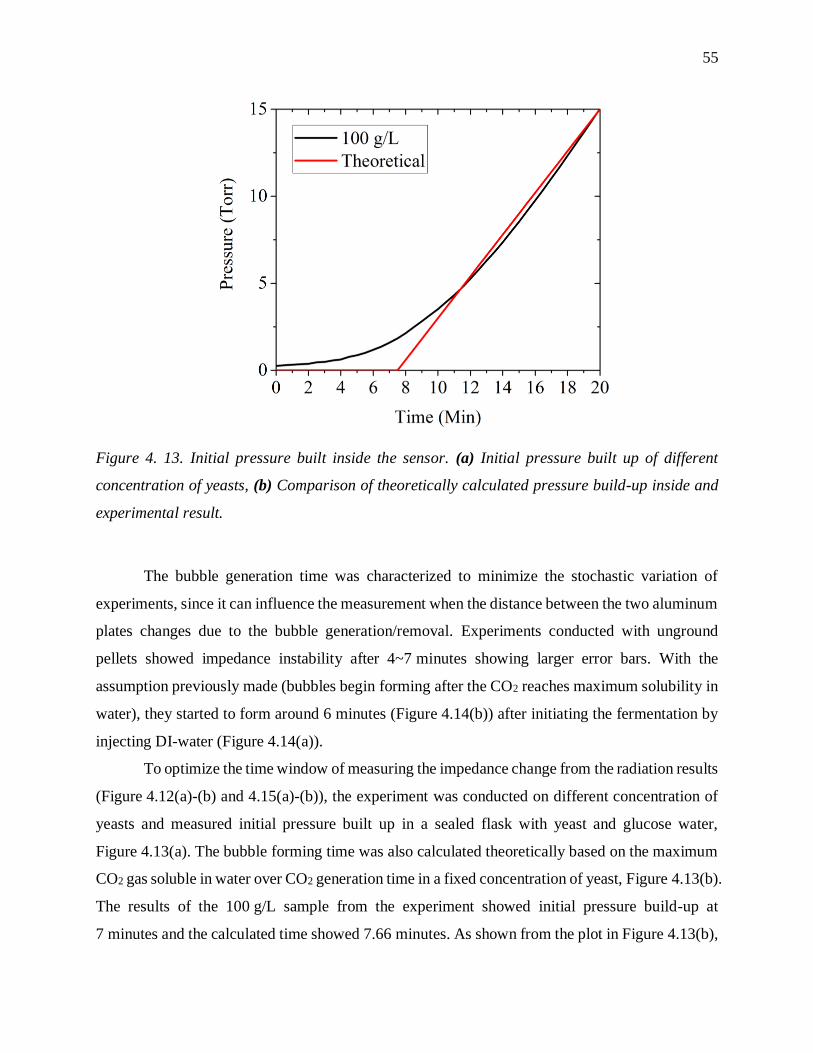
55
Figure 4. 13. Initial pressure built inside the sensor. (a) Initial pressure built up of different
concentration of yeasts, (b) Comparison of theoretically calculated pressure build-up inside and
experimental result.
The bubble generation time was characterized to minimize the stochastic variation of
experiments, since it can influence the measurement when the distance between the two aluminum
plates changes due to the bubble generation/removal. Experiments conducted with unground
pellets showed impedance instability after 4~7 minutes showing larger error bars. With the
assumption previously made (bubbles begin forming after the CO2 reaches maximum solubility in
water), they started to form around 6 minutes (Figure 4.14(b)) after initiating the fermentation by
injecting DI-water (Figure 4.14(a)).
To optimize the time window of measuring the impedance change from the radiation results
(Figure 4.12(a)-(b) and 4.15(a)-(b)), the experiment was conducted on different concentration of
yeasts and measured initial pressure built up in a sealed flask with yeast and glucose water,
Figure 4.13(a). The bubble forming time was also calculated theoretically based on the maximum
CO2 gas soluble in water over CO2 generation time in a fixed concentration of yeast, Figure 4.13(b).
The results of the 100 g/L sample from the experiment showed initial pressure build-up at
7 minutes and the calculated time showed 7.66 minutes. As shown from the plot in Figure 4.13(b),
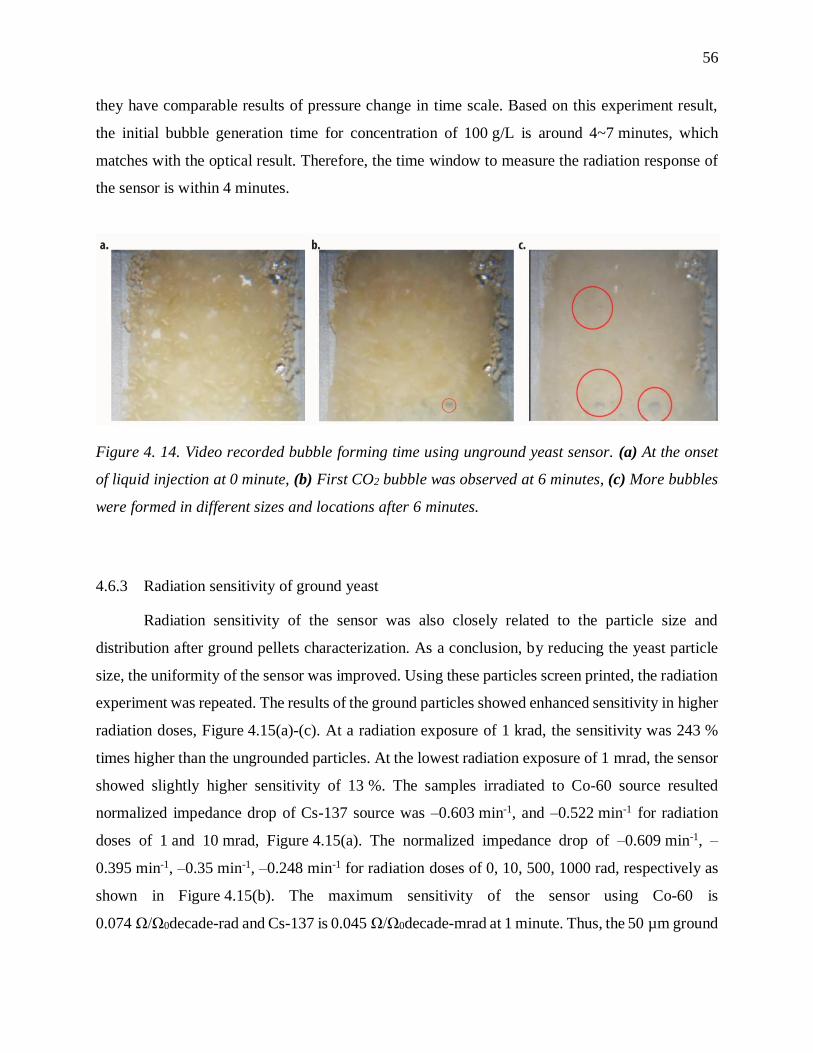
56
they have comparable results of pressure change in time scale. Based on this experiment result,
the initial bubble generation time for concentration of 100 g/L is around 4~7 minutes, which
matches with the optical result. Therefore, the time window to measure the radiation response of
the sensor is within 4 minutes.
Figure 4. 14. Video recorded bubble forming time using unground yeast sensor. (a) At the onset
of liquid injection at 0 minute, (b) First CO2 bubble was observed at 6 minutes, (c) More bubbles
were formed in different sizes and locations after 6 minutes.
4.6.3 Radiation sensitivity of ground yeast
Radiation sensitivity of the sensor was also closely related to the particle size and
distribution after ground pellets characterization. As a conclusion, by reducing the yeast particle
size, the uniformity of the sensor was improved. Using these particles screen printed, the radiation
experiment was repeated. The results of the ground particles showed enhanced sensitivity in higher
radiation doses, Figure 4.15(a)-(c). At a radiation exposure of 1 krad, the sensitivity was 243 %
times higher than the ungrounded particles. At the lowest radiation exposure of 1 mrad, the sensor
showed slightly higher sensitivity of 13 %. The samples irradiated to Co-60 source resulted
normalized impedance drop of Cs-137 source was –0.603 min-1, and –0.522 min-1 for radiation
doses of 1 and 10 mrad, Figure 4.15(a). The normalized impedance drop of –0.609 min-1, –
0.395 min-1, –0.35 min-1, –0.248 min-1 for radiation doses of 0, 10, 500, 1000 rad, respectively as
shown in Figure 4.15(b). The maximum sensitivity of the sensor using Co-60 is
0.074 Ω/Ω0decade-rad and Cs-137 is 0.045 Ω/Ω0decade-mrad at 1 minute. Thus, the 50 µm ground
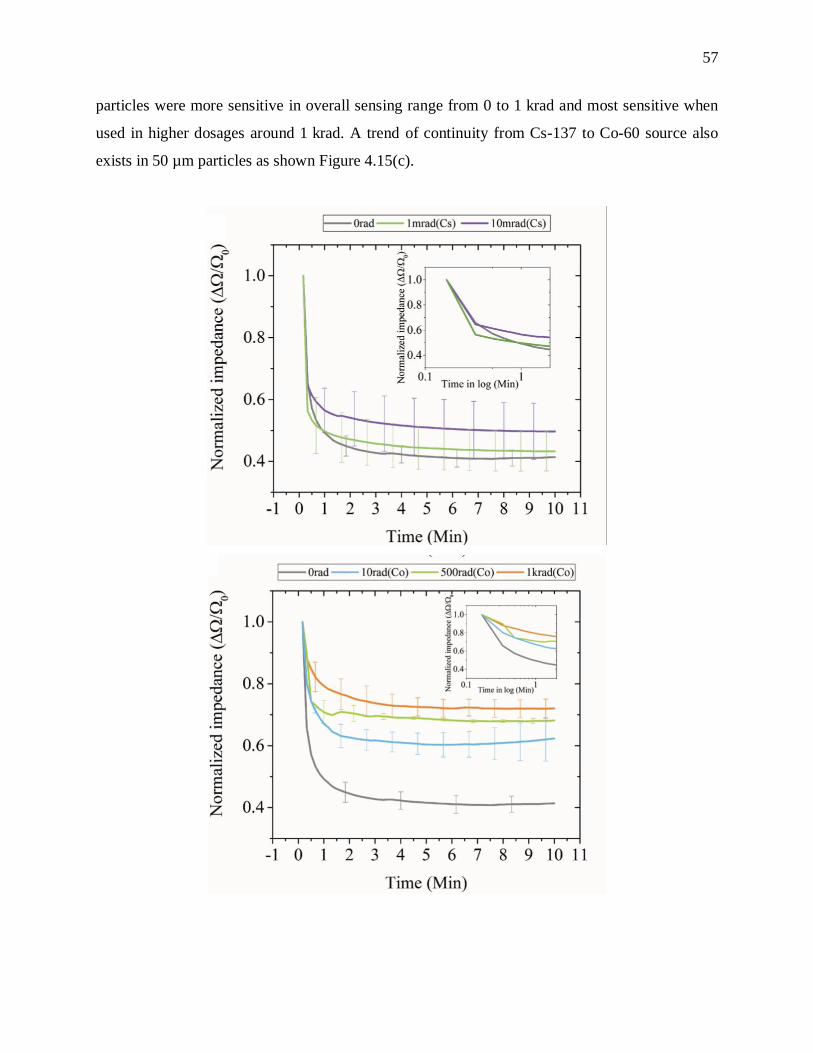
57
particles were more sensitive in overall sensing range from 0 to 1 krad and most sensitive when
used in higher dosages around 1 krad. A trend of continuity from Cs-137 to Co-60 source also
exists in 50 µm particles as shown Figure 4.15(c).
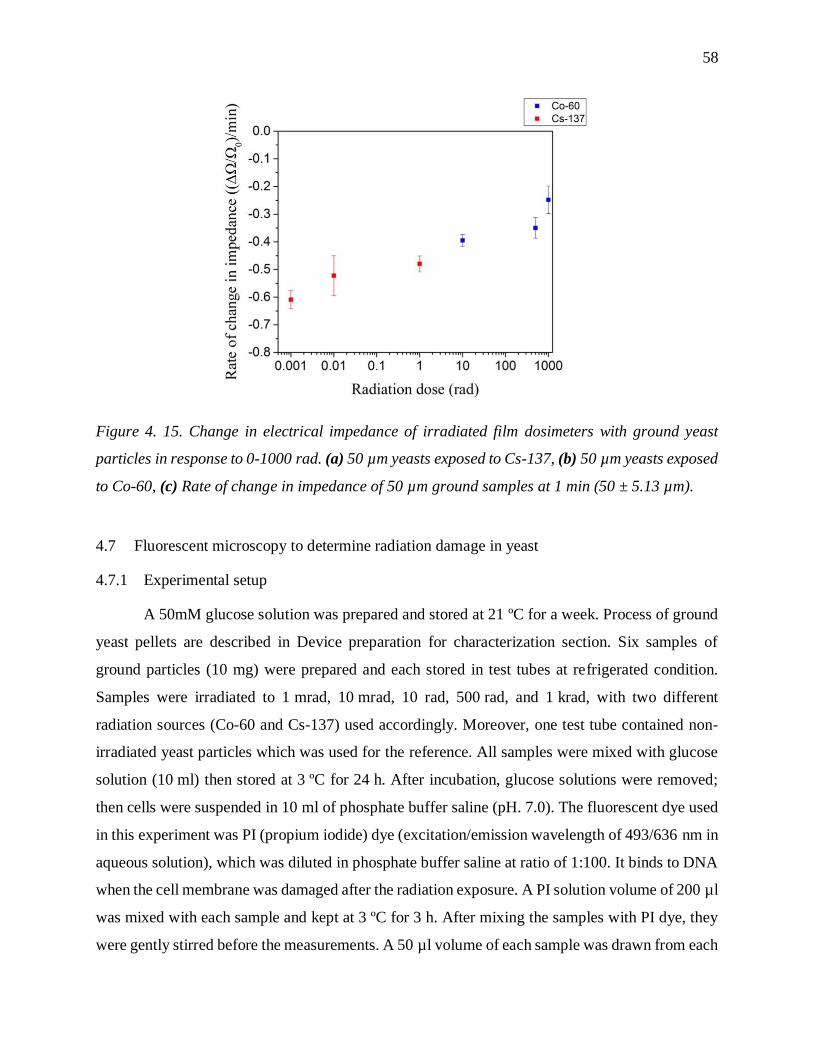
58
Figure 4. 15. Change in electrical impedance of irradiated film dosimeters with ground yeast
particles in response to 0-1000 rad. (a) 50 µm yeasts exposed to Cs-137, (b) 50 µm yeasts exposed
to Co-60, (c) Rate of change in impedance of 50 µm ground samples at 1 min (50 ± 5.13 µm).
4.7 Fluorescent microscopy to determine radiation damage in yeast
4.7.1 Experimental setup
A 50mM glucose solution was prepared and stored at 21 ºC for a week. Process of ground
yeast pellets are described in Device preparation for characterization section. Six samples of
ground particles (10 mg) were prepared and each stored in test tubes at refrigerated condition.
Samples were irradiated to 1 mrad, 10 mrad, 10 rad, 500 rad, and 1 krad, with two different
radiation sources (Co-60 and Cs-137) used accordingly. Moreover, one test tube contained non-
irradiated yeast particles which was used for the reference. All samples were mixed with glucose
solution (10 ml) then stored at 3 ºC for 24 h. After incubation, glucose solutions were removed;
then cells were suspended in 10 ml of phosphate buffer saline (pH. 7.0). The fluorescent dye used
in this experiment was PI (propium iodide) dye (excitation/emission wavelength of 493/636 nm in
aqueous solution), which was diluted in phosphate buffer saline at ratio of 1:100. It binds to DNA
when the cell membrane was damaged after the radiation exposure. A PI solution volume of 200 µl
was mixed with each sample and kept at 3 ºC for 3 h. After mixing the samples with PI dye, they
were gently stirred before the measurements. A 50 µl volume of each sample was drawn from each
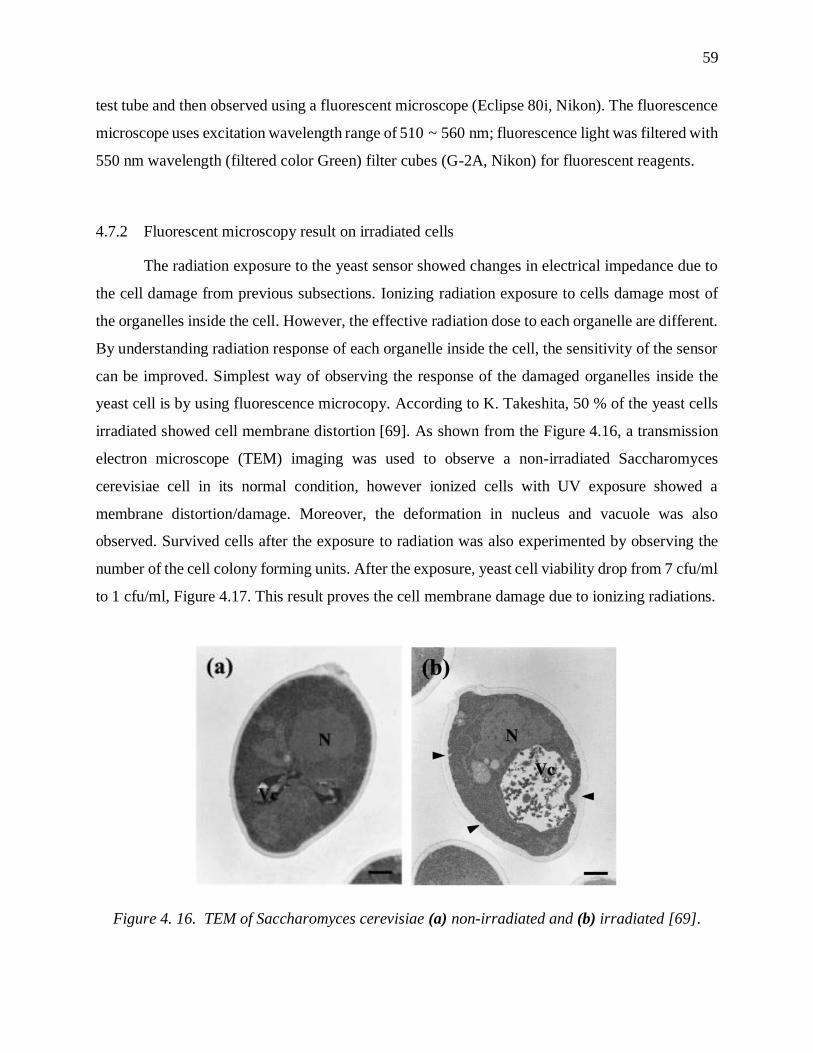
59
test tube and then observed using a fluorescent microscope (Eclipse 80i, Nikon). The fluorescence
microscope uses excitation wavelength range of 510 ~ 560 nm; fluorescence light was filtered with
550 nm wavelength (filtered color Green) filter cubes (G-2A, Nikon) for fluorescent reagents.
4.7.2 Fluorescent microscopy result on irradiated cells
The radiation exposure to the yeast sensor showed changes in electrical impedance due to
the cell damage from previous subsections. Ionizing radiation exposure to cells damage most of
the organelles inside the cell. However, the effective radiation dose to each organelle are different.
By understanding radiation response of each organelle inside the cell, the sensitivity of the sensor
can be improved. Simplest way of observing the response of the damaged organelles inside the
yeast cell is by using fluorescence microcopy. According to K. Takeshita, 50 % of the yeast cells
irradiated showed cell membrane distortion [69]. As shown from the Figure 4.16, a transmission
electron microscope (TEM) imaging was used to observe a non-irradiated Saccharomyces
cerevisiae cell in its normal condition, however ionized cells with UV exposure showed a
membrane distortion/damage. Moreover, the deformation in nucleus and vacuole was also
observed. Survived cells after the exposure to radiation was also experimented by observing the
number of the cell colony forming units. After the exposure, yeast cell viability drop from 7 cfu/ml
to 1 cfu/ml, Figure 4.17. This result proves the cell membrane damage due to ionizing radiations.
Figure 4. 16. TEM of Saccharomyces cerevisiae (a) non-irradiated and (b) irradiated [69].
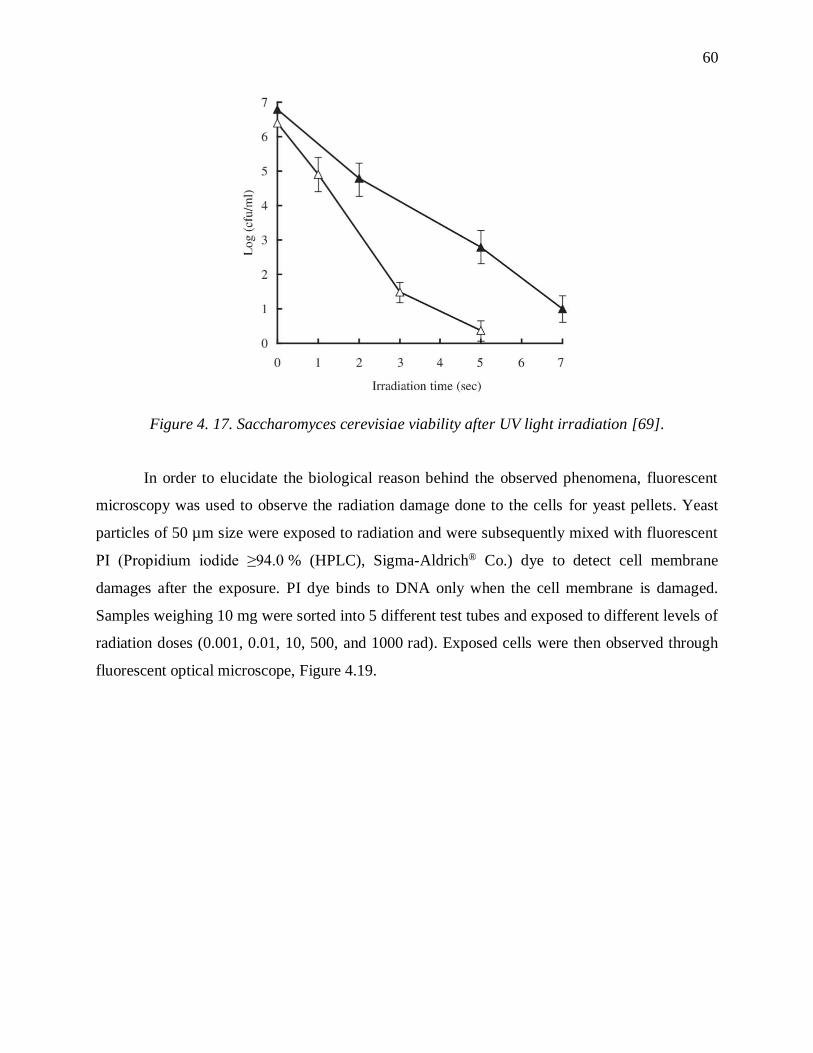
60
Figure 4. 17. Saccharomyces cerevisiae viability after UV light irradiation [69].
In order to elucidate the biological reason behind the observed phenomena, fluorescent
microscopy was used to observe the radiation damage done to the cells for yeast pellets. Yeast
particles of 50 µm size were exposed to radiation and were subsequently mixed with fluorescent
PI (Propidium iodide ≥94.0 % (HPLC), Sigma-Aldrich® Co.) dye to detect cell membrane
damages after the exposure. PI dye binds to DNA only when the cell membrane is damaged.
Samples weighing 10 mg were sorted into 5 different test tubes and exposed to different levels of
radiation doses (0.001, 0.01, 10, 500, and 1000 rad). Exposed cells were then observed through
fluorescent optical microscope, Figure 4.19.
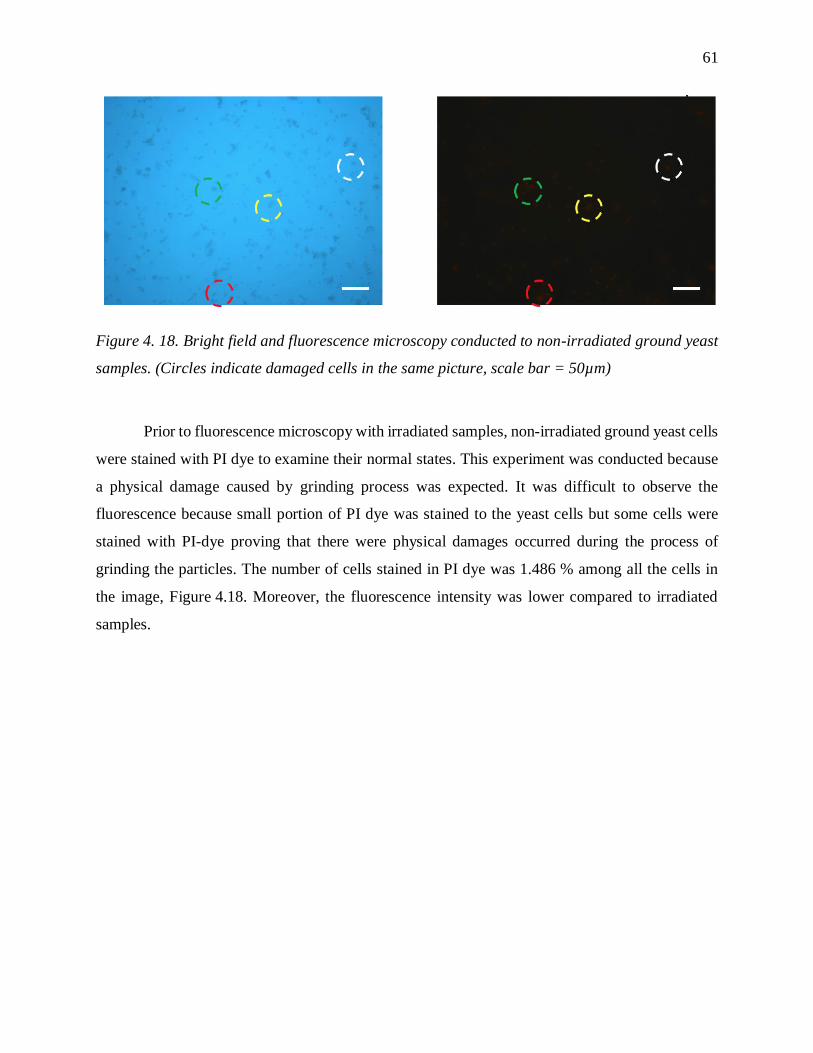
61
Figure 4. 18. Bright field and fluorescence microscopy conducted to non-irradiated ground yeast
samples. (Circles indicate damaged cells in the same picture, scale bar = 50µm)
Prior to fluorescence microscopy with irradiated samples, non-irradiated ground yeast cells
were stained with PI dye to examine their normal states. This experiment was conducted because
a physical damage caused by grinding process was expected. It was difficult to observe the
fluorescence because small portion of PI dye was stained to the yeast cells but some cells were
stained with PI-dye proving that there were physical damages occurred during the process of
grinding the particles. The number of cells stained in PI dye was 1.486 % among all the cells in
the image, Figure 4.18. Moreover, the fluorescence intensity was lower compared to irradiated
samples.
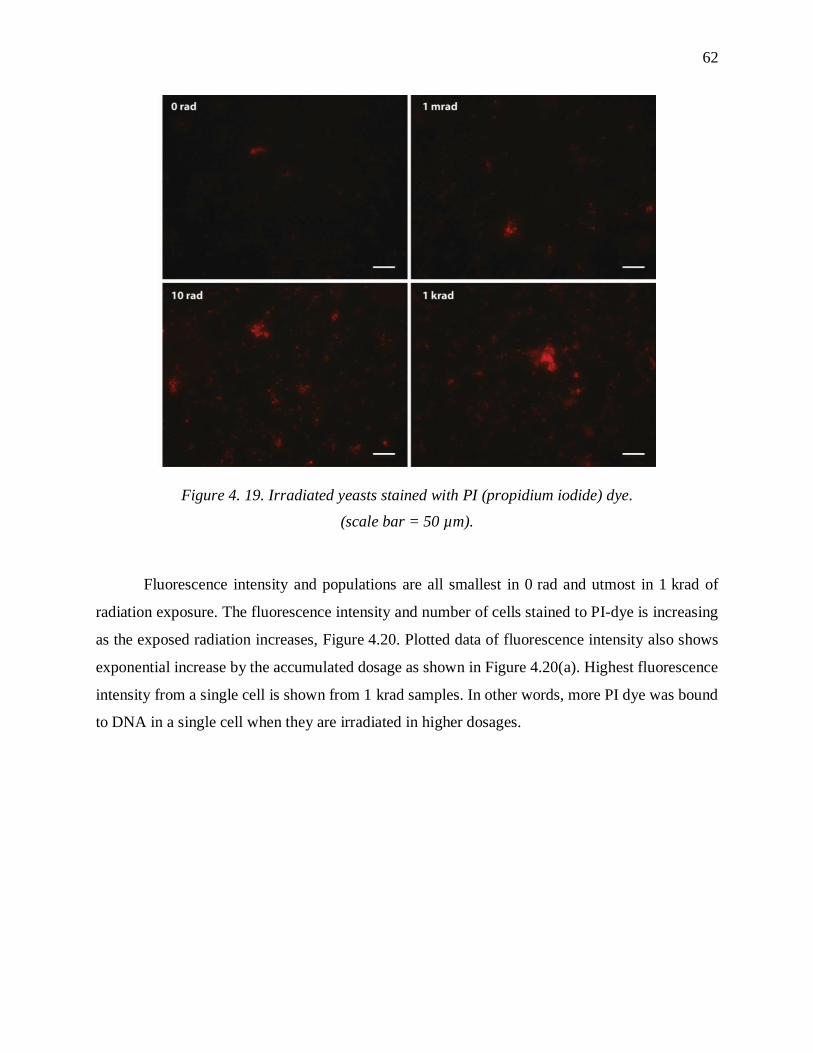
62
Figure 4. 19. Irradiated yeasts stained with PI (propidium iodide) dye.
(scale bar = 50 µm).
Fluorescence intensity and populations are all smallest in 0 rad and utmost in 1 krad of
radiation exposure. The fluorescence intensity and number of cells stained to PI-dye is increasing
as the exposed radiation increases, Figure 4.20. Plotted data of fluorescence intensity also shows
exponential increase by the accumulated dosage as shown in Figure 4.20(a). Highest fluorescence
intensity from a single cell is shown from 1 krad samples. In other words, more PI dye was bound
to DNA in a single cell when they are irradiated in higher dosages.
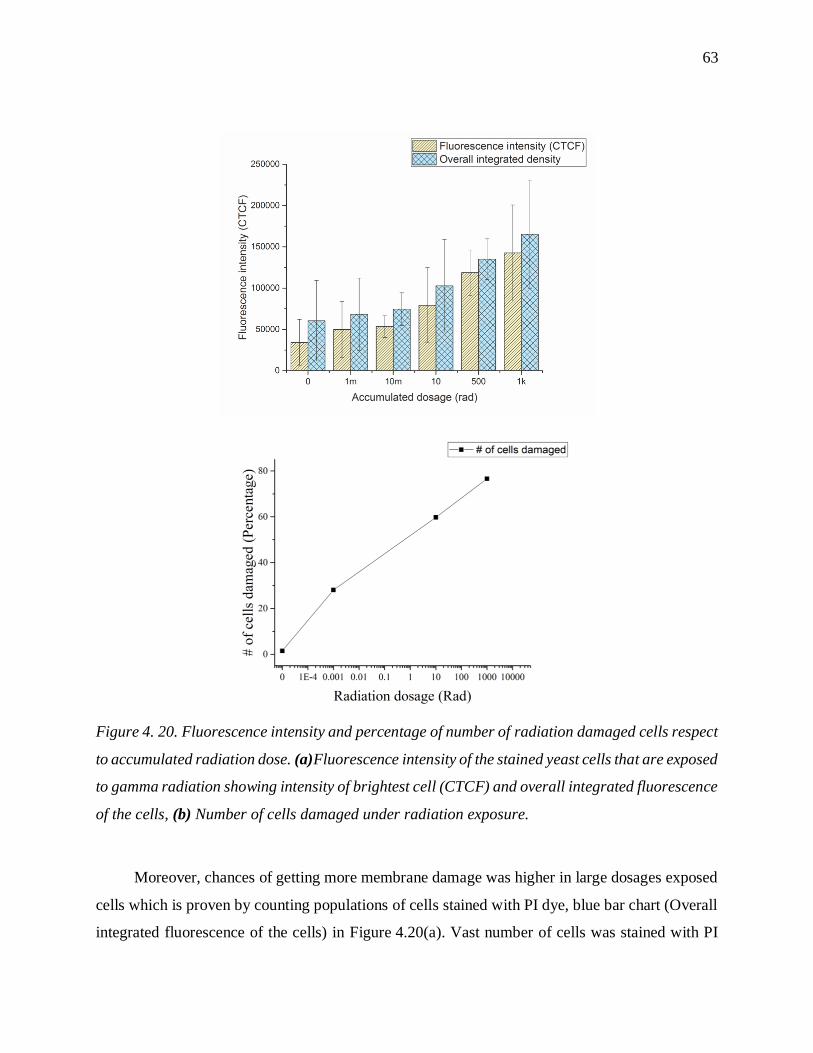
63
Figure 4. 20. Fluorescence intensity and percentage of number of radiation damaged cells respect
to accumulated radiation dose. (a)Fluorescence intensity of the stained yeast cells that are exposed
to gamma radiation showing intensity of brightest cell (CTCF) and overall integrated fluorescence
of the cells, (b) Number of cells damaged under radiation exposure.
Moreover, chances of getting more membrane damage was higher in large dosages exposed
cells which is proven by counting populations of cells stained with PI dye, blue bar chart (Overall
integrated fluorescence of the cells) in Figure 4.20(a). Vast number of cells was stained with PI
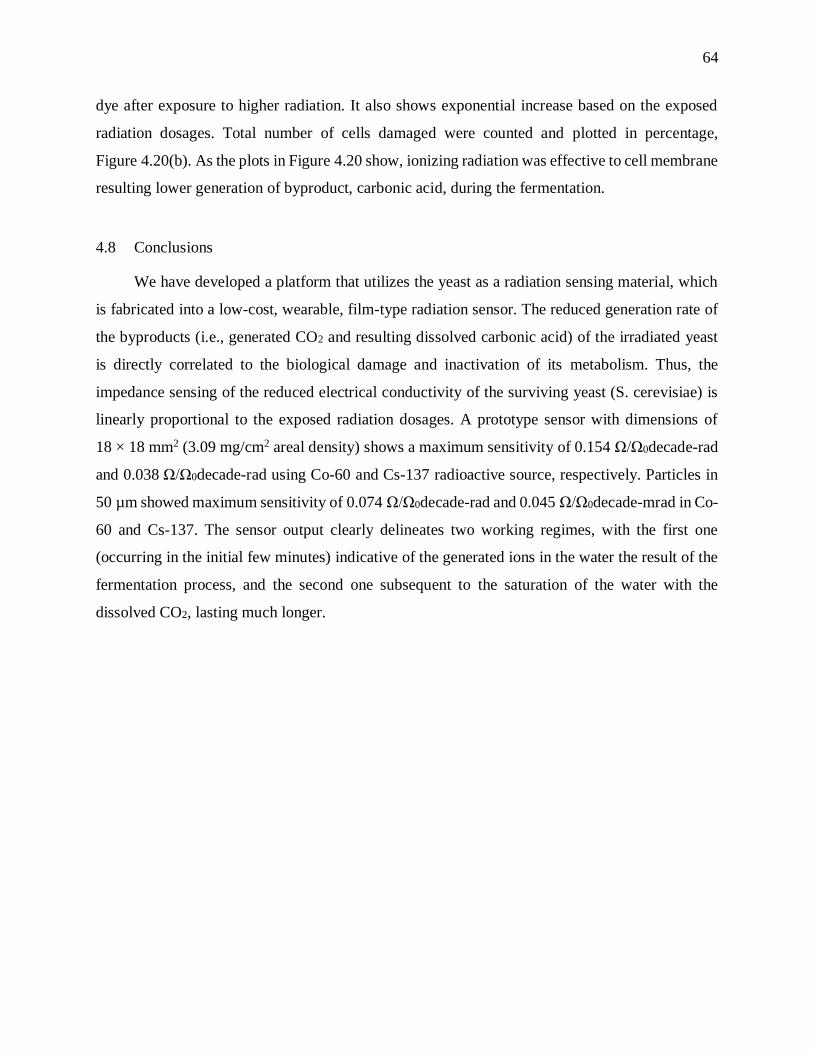
64
dye after exposure to higher radiation. It also shows exponential increase based on the exposed
radiation dosages. Total number of cells damaged were counted and plotted in percentage,
Figure 4.20(b). As the plots in Figure 4.20 show, ionizing radiation was effective to cell membrane
resulting lower generation of byproduct, carbonic acid, during the fermentation.
4.8 Conclusions
We have developed a platform that utilizes the yeast as a radiation sensing material, which
is fabricated into a low-cost, wearable, film-type radiation sensor. The reduced generation rate of
the byproducts (i.e., generated CO2 and resulting dissolved carbonic acid) of the irradiated yeast
is directly correlated to the biological damage and inactivation of its metabolism. Thus, the
impedance sensing of the reduced electrical conductivity of the surviving yeast (S. cerevisiae) is
linearly proportional to the exposed radiation dosages. A prototype sensor with dimensions of
18 × 18 mm2 (3.09 mg/cm2 areal density) shows a maximum sensitivity of 0.154 Ω/Ω0decade-rad
and 0.038 Ω/Ω0decade-rad using Co-60 and Cs-137 radioactive source, respectively. Particles in
50 µm showed maximum sensitivity of 0.074 Ω/Ω0decade-rad and 0.045 Ω/Ω0decade-mrad in Co-
60 and Cs-137. The sensor output clearly delineates two working regimes, with the first one
(occurring in the initial few minutes) indicative of the generated ions in the water the result of the
fermentation process, and the second one subsequent to the saturation of the water with the
dissolved CO2, lasting much longer.
65
CHAPTER 5. CONCLUSION AND SUGGESTIONS FOR FUTURE
RESEARCH
The main purpose of this chapter is to summarize the sensors developed and further improve
their performance based on the results achieved in previous chapters. Primarily, a summary of the
sensors will be explained in the following section 5.1. Future research will be discussed in
section 5.2 mainly explaining possible candidates of the damaged organelles of the cell that effects
the yeast metabolic process observed by fluorescence microscopy after the radiation exposure,
thus the sensor performance can be further enhanced. Moreover, a hermetic sealing of the sensor
will be discussed by encapsulating a water reservoir inside the sensor using an edible film.
5.1 Summary of previous research and their applications
The purpose of this research was to develop a platform of radiation sensitive dosimeter by
utilizing metabolic response of radiation semi-resistant microorganism (yeast) as a surrogate
marker. Yeast cells are semi-resistant to radiation; thus, the ionizing radiation impairs their average
metabolic activity rather than completely inactivating them. The two dosimeters described here
address this aim by examining the changes of the byproduct of fermentation (glucose) based on
exposed radiation dose to yeast. As a conclusion, accumulated ionizing radiation to yeast cells
impairs its metabolic response, thereafter reduced carbonic ions are generated from the fermenting
medium. In both dosimeters, decrease in CO2 byproduct was observed, then displayed response of
the yeast to exposed radiation by using LED indicator and impedance measurements. A radiation
test of yeast cells will aid in predicting biological damage of the ionizing radiation done to human
since the sensing material (Saccharomyces cerevisiae, yeast) is genetically homologous to human
cells. This is advantageous since the direct comparison in measurement between radiation exposed
to the charge based sensors and to individuals is still difficult by using the charge-based (OSLD,
TLD, diode, and RADFET) current radiation sensors [41], [42].
In Chapter 3, the use of yeast as a radiation sensing material has been demonstrated with a
discrete measurement of radiation dose from a LED indicator. The surviving fraction of yeast cells
creates CO2 gas which is a byproduct of yeast fermentation causing lower membrane deflection.
The sensor measures a radiation response from 0 to 1000 rad. Thus, the dosimeter is applicable to
higher dosage radiation sensing using Co-60 source. It is a low-cost, practical, and wearable
66
personal radiation dosimeter with −0.195 mm/decade-rad (1–1000 rad) using S. cerevisiae yeast
as the sensing material. The sensor can be tuned by controlling the membrane thickness and
diameter of the yeast chamber based on the relevant exposure from the surroundings. However,
the sensor demonstrated in Chapter 3 is difficult to further reduce its size, since the volume and
rate of CO2 generated during the fermentation are a working mechanism of the sensor. Also, the
sensor has its limitation of measuring lower dosages below 10 rads. To solve these issues, we
further developed it into a film-type radiation dosimeter that measures the changes in electrical
conductivity of the fermenting medium of the irradiated cells in Chapter 4.
Based on this initial prototype explained in Chapter 3, a platform was developed to measure
the changes in electrical conductivity of the irradiated yeast medium during the fermentation of
glucose, Chapter 4. This film-type sensor is a low-cost, wearable, light dosimeter that consists of
paper based materials with working medium in a mixture of yeast and glucose powders. It is
fabricated through a simple process: screen printing and layer-by-layer assembly. The reduced
generation rate of the byproducts (i.e., generated CO2 and resulting dissolved carbonic acid) of the
radiation exposed yeast is directly correlated to the biological damage and inactivation of its
metabolism. In conclusion, the reduced impedance from the byproduct of the surviving yeast (S.
cerevisiae) is measured which is linearly proportional to the exposed radiation dosages. The sensor
with yeast (3.09 mg/cm2 areal density) shows maximum sensitivity of 0.154 Ω/Ω0decade-rad and
0.038 Ω/Ω0decade-rad using Co-60 and Cs-137 radioactive source, respectively. Particles ground
in 50 µm showed maximum sensitivity of 0.074 Ω/Ω0decade-rad and 0.045 Ω/Ω0decade-mrad in
Co-60 and Cs-137. The sensor can detect 1 mrad of radiation exposure which is comparable
sensitivity to current commercial patch-type dosimeters. The size of the sensor is also small enough
to carry in any parts of the body without disturbance. Moreover, the sensor is fabricated with low-
cost paper based materials. A simple readout system will further reduce the costs and bring the
efficiency of using this sensor for the personal dosimetry, since it does not require transferring
exposed sensors back to the facilities for the measurement. Eventually, a collected data using this
sensor will establish a new guideline of possible radiation damage done to human body in the near
future.
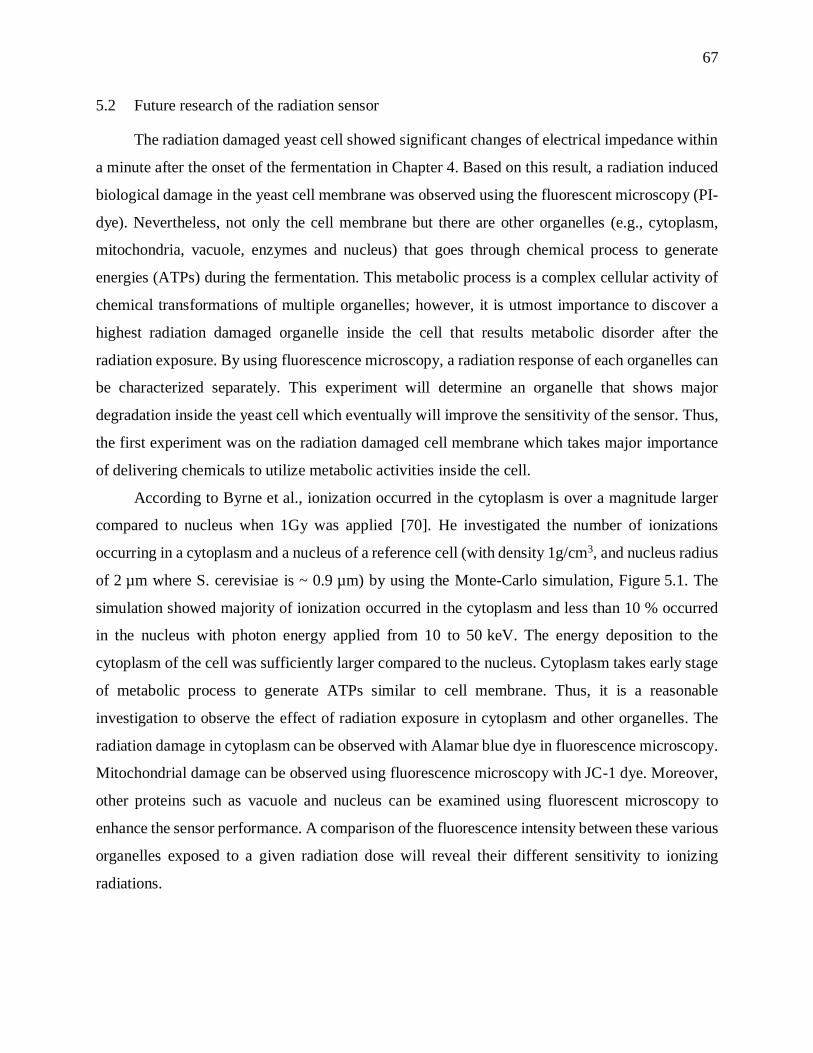
67
5.2 Future research of the radiation sensor
The radiation damaged yeast cell showed significant changes of electrical impedance within
a minute after the onset of the fermentation in Chapter 4. Based on this result, a radiation induced
biological damage in the yeast cell membrane was observed using the fluorescent microscopy (PI-
dye). Nevertheless, not only the cell membrane but there are other organelles (e.g., cytoplasm,
mitochondria, vacuole, enzymes and nucleus) that goes through chemical process to generate
energies (ATPs) during the fermentation. This metabolic process is a complex cellular activity of
chemical transformations of multiple organelles; however, it is utmost importance to discover a
highest radiation damaged organelle inside the cell that results metabolic disorder after the
radiation exposure. By using fluorescence microscopy, a radiation response of each organelles can
be characterized separately. This experiment will determine an organelle that shows major
degradation inside the yeast cell which eventually will improve the sensitivity of the sensor. Thus,
the first experiment was on the radiation damaged cell membrane which takes major importance
of delivering chemicals to utilize metabolic activities inside the cell.
According to Byrne et al., ionization occurred in the cytoplasm is over a magnitude larger
compared to nucleus when 1Gy was applied [70]. He investigated the number of ionizations
occurring in a cytoplasm and a nucleus of a reference cell (with density 1g/cm3, and nucleus radius
of 2 µm where S. cerevisiae is ~ 0.9 µm) by using the Monte-Carlo simulation, Figure 5.1. The
simulation showed majority of ionization occurred in the cytoplasm and less than 10 % occurred
in the nucleus with photon energy applied from 10 to 50 keV. The energy deposition to the
cytoplasm of the cell was sufficiently larger compared to the nucleus. Cytoplasm takes early stage
of metabolic process to generate ATPs similar to cell membrane. Thus, it is a reasonable
investigation to observe the effect of radiation exposure in cytoplasm and other organelles. The
radiation damage in cytoplasm can be observed with Alamar blue dye in fluorescence microscopy.
Mitochondrial damage can be observed using fluorescence microscopy with JC-1 dye. Moreover,
other proteins such as vacuole and nucleus can be examined using fluorescent microscopy to
enhance the sensor performance. A comparison of the fluorescence intensity between these various
organelles exposed to a given radiation dose will reveal their different sensitivity to ionizing
radiations.
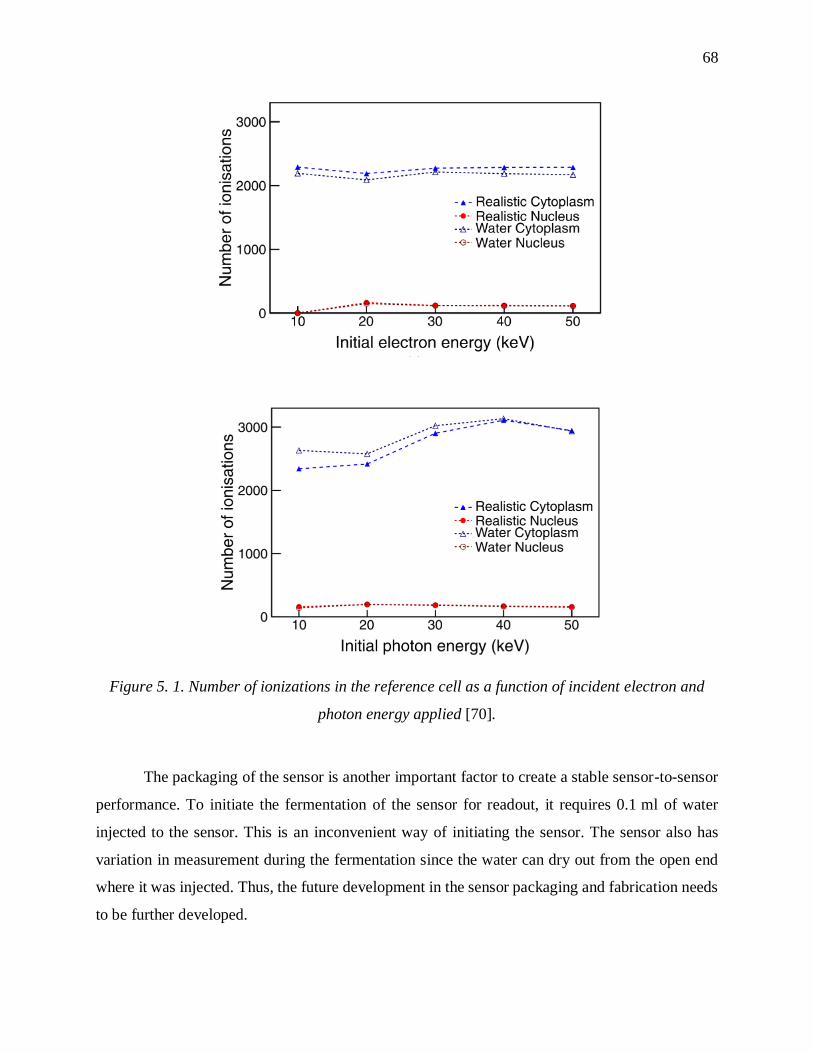
68
Figure 5. 1. Number of ionizations in the reference cell as a function of incident electron and
photon energy applied [70].
The packaging of the sensor is another important factor to create a stable sensor-to-sensor
performance. To initiate the fermentation of the sensor for readout, it requires 0.1 ml of water
injected to the sensor. This is an inconvenient way of initiating the sensor. The sensor also has
variation in measurement during the fermentation since the water can dry out from the open end
where it was injected. Thus, the future development in the sensor packaging and fabrication needs
to be further developed.
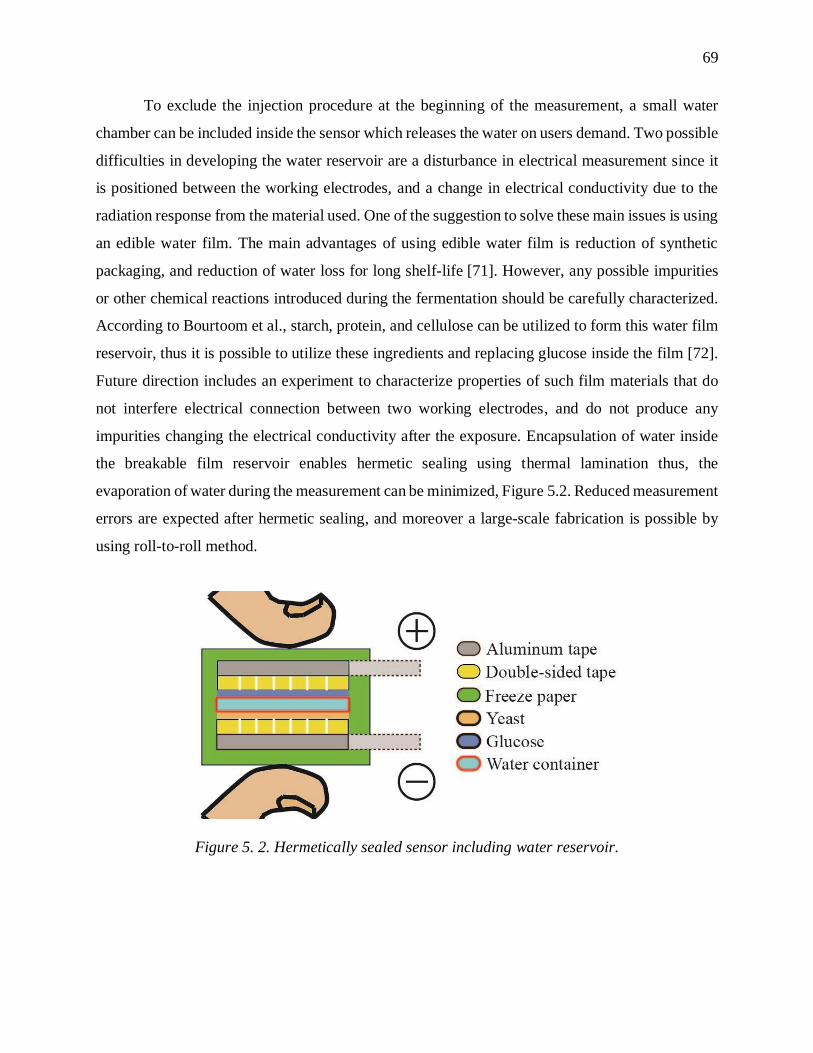
69
To exclude the injection procedure at the beginning of the measurement, a small water
chamber can be included inside the sensor which releases the water on users demand. Two possible
difficulties in developing the water reservoir are a disturbance in electrical measurement since it
is positioned between the working electrodes, and a change in electrical conductivity due to the
radiation response from the material used. One of the suggestion to solve these main issues is using
an edible water film. The main advantages of using edible water film is reduction of synthetic
packaging, and reduction of water loss for long shelf-life [71]. However, any possible impurities
or other chemical reactions introduced during the fermentation should be carefully characterized.
According to Bourtoom et al., starch, protein, and cellulose can be utilized to form this water film
reservoir, thus it is possible to utilize these ingredients and replacing glucose inside the film [72].
Future direction includes an experiment to characterize properties of such film materials that do
not interfere electrical connection between two working electrodes, and do not produce any
impurities changing the electrical conductivity after the exposure. Encapsulation of water inside
the breakable film reservoir enables hermetic sealing using thermal lamination thus, the
evaporation of water during the measurement can be minimized, Figure 5.2. Reduced measurement
errors are expected after hermetic sealing, and moreover a large-scale fabrication is possible by
using roll-to-roll method.
Figure 5. 2. Hermetically sealed sensor including water reservoir.
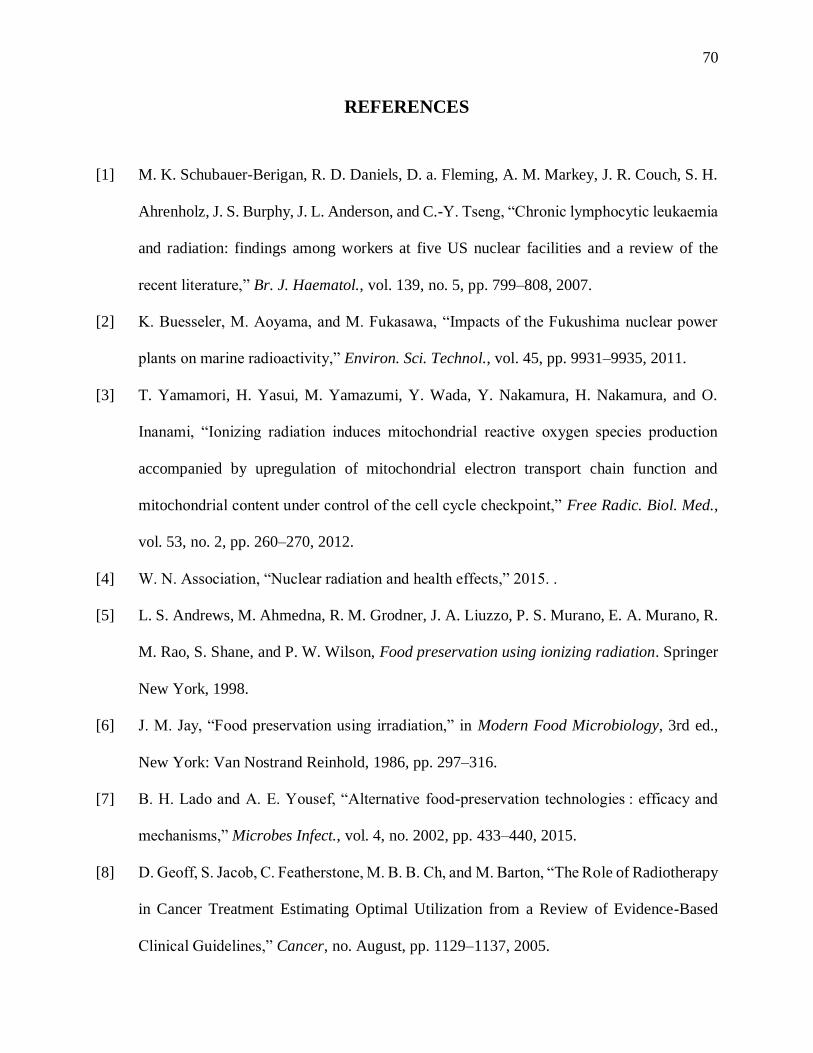
70
REFERENCES
[1] M. K. Schubauer-Berigan, R. D. Daniels, D. a. Fleming, A. M. Markey, J. R. Couch, S. H.
Ahrenholz, J. S. Burphy, J. L. Anderson, and C.-Y. Tseng, “Chronic lymphocytic leukaemia
and radiation: findings among workers at five US nuclear facilities and a review of the
recent literature,” Br. J. Haematol., vol. 139, no. 5, pp. 799–808, 2007.
[2] K. Buesseler, M. Aoyama, and M. Fukasawa, “Impacts of the Fukushima nuclear power
plants on marine radioactivity,” Environ. Sci. Technol., vol. 45, pp. 9931–9935, 2011.
[3] T. Yamamori, H. Yasui, M. Yamazumi, Y. Wada, Y. Nakamura, H. Nakamura, and O.
Inanami, “Ionizing radiation induces mitochondrial reactive oxygen species production
accompanied by upregulation of mitochondrial electron transport chain function and
mitochondrial content under control of the cell cycle checkpoint,” Free Radic. Biol. Med.,
vol. 53, no. 2, pp. 260–270, 2012.
[4] W. N. Association, “Nuclear radiation and health effects,” 2015. .
[5] L. S. Andrews, M. Ahmedna, R. M. Grodner, J. A. Liuzzo, P. S. Murano, E. A. Murano, R.
M. Rao, S. Shane, and P. W. Wilson, Food preservation using ionizing radiation. Springer
New York, 1998.
[6] J. M. Jay, “Food preservation using irradiation,” in Modern Food Microbiology, 3rd ed.,
New York: Van Nostrand Reinhold, 1986, pp. 297–316.
[7] B. H. Lado and A. E. Yousef, “Alternative food-preservation technologies : efficacy and
mechanisms,” Microbes Infect., vol. 4, no. 2002, pp. 433–440, 2015.
[8] D. Geoff, S. Jacob, C. Featherstone, M. B. B. Ch, and M. Barton, “The Role of Radiotherapy
in Cancer Treatment Estimating Optimal Utilization from a Review of Evidence-Based
Clinical Guidelines,” Cancer, no. August, pp. 1129–1137, 2005.
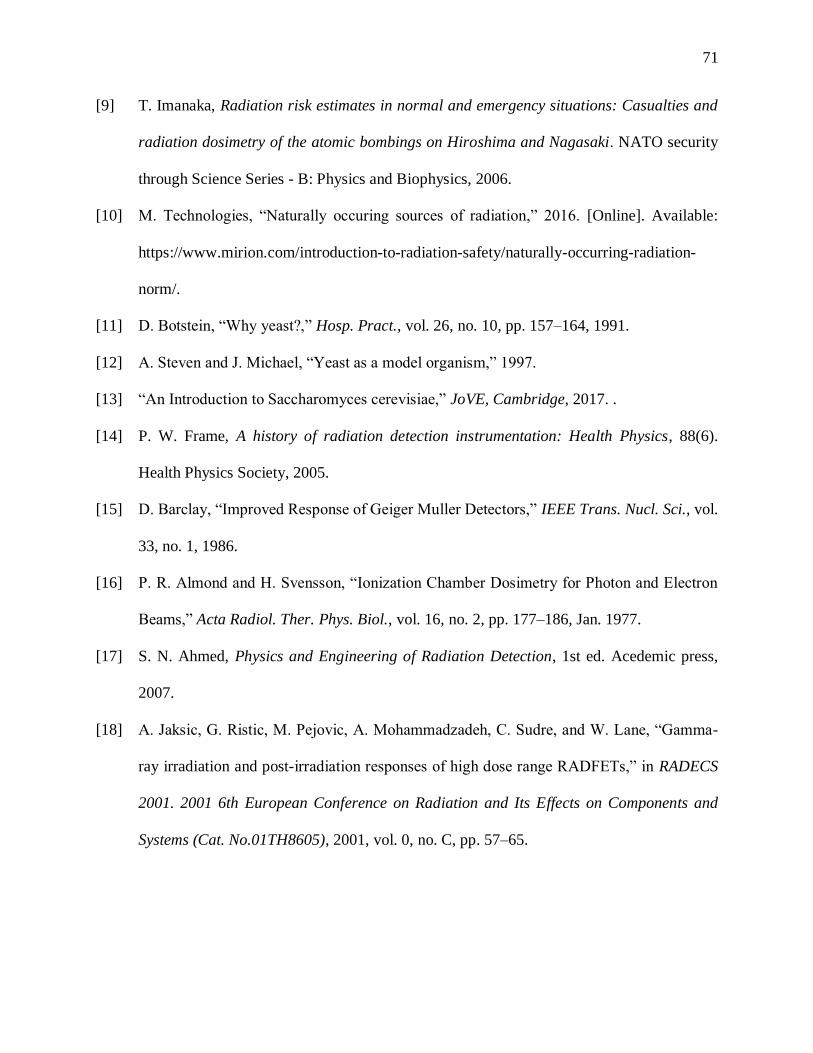
71
[9] T. Imanaka, Radiation risk estimates in normal and emergency situations: Casualties and
radiation dosimetry of the atomic bombings on Hiroshima and Nagasaki. NATO security
through Science Series - B: Physics and Biophysics, 2006.
[10] M. Technologies, “Naturally occuring sources of radiation,” 2016. [Online]. Available:
https://www.mirion.com/introduction-to-radiation-safety/naturally-occurring-radiation-
norm/.
[11] D. Botstein, “Why yeast?,” Hosp. Pract., vol. 26, no. 10, pp. 157–164, 1991.
[12] A. Steven and J. Michael, “Yeast as a model organism,” 1997.
[13] “An Introduction to Saccharomyces cerevisiae,” JoVE, Cambridge, 2017. .
[14] P. W. Frame, A history of radiation detection instrumentation: Health Physics, 88(6).
Health Physics Society, 2005.
[15] D. Barclay, “Improved Response of Geiger Muller Detectors,” IEEE Trans. Nucl. Sci., vol.
33, no. 1, 1986.
[16] P. R. Almond and H. Svensson, “Ionization Chamber Dosimetry for Photon and Electron
Beams,” Acta Radiol. Ther. Phys. Biol., vol. 16, no. 2, pp. 177–186, Jan. 1977.
[17] S. N. Ahmed, Physics and Engineering of Radiation Detection, 1st ed. Acedemic press,
2007.
[18] A. Jaksic, G. Ristic, M. Pejovic, A. Mohammadzadeh, C. Sudre, and W. Lane, “Gamma-
ray irradiation and post-irradiation responses of high dose range RADFETs,” in RADECS
2001. 2001 6th European Conference on Radiation and Its Effects on Components and
Systems (Cat. No.01TH8605), 2001, vol. 0, no. C, pp. 57–65.
72
[19] A. Holmes-Siedle and L. Adams, “RADFET: A review of the use of metal-oxide-silicon
devices as integrating dosimeters,” International Journal of Radiation Applications and
Instrumentation. Part C. Radiation Physics and Chemistry, vol. 28, no. 2. pp. 235–244,
1986.
[20] “Pocket Dosimeter,” Radiation safety equipment-NDT resource center. [Online]. Available:
https://www.nde-
ed.org/EducationResources/CommunityCollege/RadiationSafety/radiation_safety_equipm
ent/pocket_dosimeter.htm.
[21] A. G. Holmes-Siedle and K. H. Zaininger, “The Physics of Failure of MIS Devices Under
Radiation,” IEEE Trans. Reliab., vol. R-17, no. 1, pp. 34–44, Mar. 1968.
[22] J. P. Mitchell, “Radiation-induced space-charge buildup in MOS structures,” IEEE Trans.
Electron Devices, vol. 14, no. 11, pp. 764–774, Nov. 1967.
[23] J. Raymond, E. Steele, and W. Chang, “Radiation Effects in Metal-Oxide-Semiconductor
Transistors,” IEEE Trans. Nucl. Sci., vol. 12, no. 1, pp. 457–463, 1965.
[24] W. J. Poch and A. G. Holmes-Siedle, “The mosimeter-A new instrument for measuring
radiation dose,” RCA Eng., vol. 16, no. 3, pp. 56–59, 1970.
[25] A. Holmes-Siedle, “The space-charge dosimeter,” Nucl. Instruments Methods, vol. 121, no.
1, pp. 169–179, Oct. 1974.
[26] M. H. Woods and R. Williams, “Hole traps in silicon dioxide,” J. Appl. Phys., vol. 47, no.
3, pp. 1082–1089, Mar. 1976.
[27] D. M. Fleetwood, “Radiation‐induced charge neutralization and interface‐trap buildup in
metal‐oxide‐semiconductor devices,” J. Appl. Phys., vol. 67, no. 1, pp. 580–583, Jan. 1990.
73
[28] H. L. Hughes, R. D. Baxter, and B. Phillips, “Dependence of MOS Device Radiation-
Sensitivity on Oxide Impurities,” IEEE Trans. Nucl. Sci., vol. 19, no. 6, pp. 256–263, 1972.
[29] A. Haran and A. Jaksic, “The role of fixed and switching traps in long-term fading of
implanted and unimplanted gate oxide RADFETs,” IEEE Trans. Nucl. Sci., vol. 52, no. 6,
pp. 2570–2577, Dec. 2005.
[30] I. Thomson, R. E. Thomas, and L. P. Berndt, “Radiation Dosimetry with MOS Sensors,”
Radiat. Prot. Dosimetry, vol. 6, no. 1–4, pp. 121–124, Dec. 1983.
[31] L. S. August, “Design Criteria for a High-Dose MOS Dosimeter for Use in Space,” IEEE
Trans. Nucl. Sci., vol. 31, no. 1, pp. 801–803, Feb. 1984.
[32] G. Sarrabayrouse and S. Siskos, “Radiation dose measurment using MOSFETs,” IEEE
Instrum. Meas. Mag., vol. 1, no. 2, pp. 26–34, Jun. 1998.
[33] R. O. Gorson, N. Suntharalingam, and J. W. Thomas, “Results of a Film-Badge Reliability
Study 1,” Radiology, vol. 84, no. 2, pp. 333–346, Feb. 1965.
[34] M. S. Akselrod, L. Bøtter-Jensen, and S. W. S. McKeever, “Optically stimulated
luminescence and its use in medical dosimetry,” Radiat. Meas., vol. 41, pp. S78–S99, Dec.
2006.
[35] P. A. Jursinic, “Characterization of optically stimulated luminescent dosimeters, OSLDs,
for clinical dosimetric measurements,” Med. Phys., vol. 34, no. 12, p. 4594, 2007.
[36] Ž. Knežević, L. Stolarczyk, I. Bessieres, J. M. Bordy, S. Miljanić, and P. Olko, “Photon
dosimetry methods outside the target volume in radiation therapy: Optically stimulated
luminescence (OSL), thermoluminescence (TL) and radiophotoluminescence (RPL)
dosimetry,” Radiat. Meas., vol. 57, pp. 9–18, 2013.
74
[37] I. Fehér, S. Deme, B. Szabó, J. Vágvölgyi, P. P. Szabó, A. Csőke, M. Ránky, and Y. A.
Akatov, “A new thermoluminescent dosimeter system for space research,” Adv. Sp. Res.,
vol. 1, no. 14, pp. 61–66, Jan. 1981.
[38] B. W. Wessels and M. H. Griffith, “Miniature thermoluminescent dosimeter absorbed dose
measurements in tumor phantom models,” J. Nucl. Med., vol. 27, pp. 1308–1314, 1986.
[39] M. B. Moury, “Occupational radiation exposure,” 2016.
[40] S. W. S. McKeever and M. Moscovitch, “Topics under Debate - On the advantages and
disadvantages of optically stimulated luminescence dosimetry and thermoluminescence
dosimetry,” Radiat. Prot. Dosimetry, vol. 104, no. 3, pp. 263–270, 2003.
[41] S. Tugendreich, D. E. Bassett, V. A. McKusick, M. S. Boguski, and P. Hieter, “Genes
conserved in yeast and humans.,” Hum. Mol. Genet., vol. 3 Spec No, pp. 1509–1517, 1994.
[42] M. a. Resnick and B. S. Cox, “Yeast as an honorary mammal,” Mutat. Res. - Fundam. Mol.
Mech. Mutagen., vol. 451, no. 1–2, pp. 1–11, 2000.
[43] H. Kim, S. J. Yoo, and H. A. Kang, “Yeast synthetic biology for the production of
recombinant therapeutic proteins,” FEMS Yeast Res., vol. 15, no. 1, pp. 1–16, 2015.
[44] T. Saeki, I. Machida, and S. Nakai, “Genetic control of diploid recovery after γ-irradiation
in the yeast Saccharomyces cerevisiae,” Mutation Research/Fundamental and Molecular
Mechanisms of Mutagenesis, vol. 73, no. 2. pp. 251–265, 1980.
[45] C. B. Bennett, L. K. Lewis, G. Karthikeyan, K. S. Lobachev, Y. H. Jin, J. F. Sterling, J. R.
Snipe, and M. a Resnick, “Genes required for ionizing radiation resistance in yeast.,” Nat.
Genet., vol. 29, no. 4, pp. 426–434, 2001.
[46] B. Cox and J. Game, “Repair systems in Saccharomyces.,” Mutat. Res., vol. 26, no. 4, pp.
257–264, 1974.
75
[47] D. Bayrock and W. M. Ingledew, “Fluidized bed drying of baker’s yeast: Moisture levels,
drying rates, and viability changes during drying,” Food Res. Int., vol. 30, no. 6, pp. 407–
415, 1997.
[48] C. Hartmann and A. Delgado, “Numerical simulation of the mechanics of a yeast cell under
high hydrostatic pressure,” J. Biomech., vol. 37, no. 7, pp. 977–987, 2004.
[49] S. Jentsch, J. P. McGrath, and A. Varshavsky, “The yeast DNA repair gene RAD6 encodes
a ubiquitin-conjugating enzyme,” Nature, vol. 329, no. 6135, pp. 131–134, 1987.
[50] R. H. McKee and C. W. Lawrence, “Genetic analysis of gamma-ray mutagenesis in yeast.
II. Allele-specific control of mutagenesis.,” Genetics, vol. 93, no. 2, pp. 375–81, 1979.
[51] Y. Ebina, M. Ekida, and H. Hashimoto, “Origin of changes in electrical impedance during
the growth and fermentation process of yeast in batch culture,” Biotechnol. Bioeng., vol. 33,
no. 10, pp. 1290–1295, 1989.
[52] J.-A. McCarthy and A. P. Damoglou, “The effect of low-dose gamma irradiation on the
yeasts of British fresh sausage,” Food Microbiol., vol. 10, no. 5, pp. 439–446, 1993.
[53] EatByDate, “The shelf life of yeast.” [Online]. Available:
http://www.eatbydate.com/other/baking/yeast/.
[54] N. P. Neumann and J. O. Lampen, “Purification and Properties of Yeast Invertase,”
Biochemistry, vol. 6, no. 2, pp. 468–490, 1967.
[55] H. Zhang and A. Cloud, “The permeability characterisitcs of silicon rubber,” in
Proeceedings of 2006 SAMPE Fall Technical Conference, 2006.
[56] United State Nuclear Regulatory Commision, “Uses of Radiation.” [Online]. Available:
http://www.nrc.gov/about-nrc/radiation/around-us/uses-radiation.html.
76
[57] D. Krewski, J. H. Lubin, J. M. Zielinski, M. Alavanja, V. S. Catalan, R. W. Field, J. B.
Klotz, E. G. Létourneau, C. F. Lynch, J. I. Lyon, D. P. Sandler, J. B. Schoenberg, D. J.
Steck, J. a Stolwijk, C. Weinberg, and H. B. Wilcox, “Residential radon and risk of lung
cancer: a combined analysis of 7 North American case-control studies.,” Epidemiology, vol.
16, no. 2, pp. 137–145, 2005.
[58] C. E. Land, “Estimating Cancer Risks from Low Doses of Ionizing Radiation Author ( s ):
Charles E . Land Published by : American Association for the Advancement of Science
Stable URL : http://www.jstor.org/stable/1684502,” vol. 209, no. 4462, pp. 1197–1203,
2016.
[59] A. Martin, S. Harbison, K. Beach, and P. Cole, An Introduction to Radiation Protection, 6th
ed. CRC Press, 2012.
[60] F. A. Mettler and G. L. Voelz, “Major Radiation Exposure — What to Expect and How to
Respond,” N. Engl. J. Med., vol. 346, no. 20, pp. 1554–1561, May 2002.
[61] T. Use, F. Badges, and P. Monitoring, “The Use of Film Badges for Personnel Monitoring,”
no. 8, 1962.
[62] L. Struelens, E. Carinou, I. Clairand, L. Donadille, M. Ginjaume, C. Koukorava, S. Krim,
H. Mol, M. Sans-Merce, and F. Vanhavere, “Use of active personal dosemeters in
interventional radiology and cardiology: Tests in hospitals - ORAMED project,” in
Radiation Measurements, 2011, vol. 46, pp. 1258–1261.
[63] L. Struelens, E. Carinou, I. Clairand, L. Donadille, M. Ginjaume, C. Koukorava, S. Krim,
H. Mol, M. Sans-Merce, and F. Vanhavere, “Use of active personal dosemeters in
interventional radiology and cardiology: Tests in hospitals - ORAMED project,” Radiat.
Meas., vol. 46, no. 11, pp. 1258–1261, 2011.
77
[64] E. L. Alpen, Radiation Biophysics, 2nd ed. Academic press, 1997.
[65] J. C. Game, “The Saccharomyces repair genes at the end of the century,” 2000.
[66] C. Hashizume, K. Kimura, R. Hayashi, C. Hashizume, K. Kimura, and R. Hayashi, “Kinetic
Analysis of Yeast Inactivation by High Pressure Treatment at Low Temperatures Kinetic
Analysis of Yeast Inactivation by High Pressure Treatment at Low Temperatures t,” vol.
8451, no. November, 2017.
[67] C. N. Murray and J. P. Riley, “The solubility of gases in distilled water and sea water-IV.
Carbon dioxide,” Deep. Res. Oceanogr. Abstr., vol. 18, no. 5, pp. 533–541, 1971.
[68] C. K. Yoon, A. Kim, M. Ochoa, T. Paraspudi, and B. Ziaie, “A low-cost wearable radiation
sensor based on dose response viability of yeast cells,” in Proceedings MEMS 2016, 2016.
[69] K. Takeshita, J. Shibato, T. Sameshima, and S. Fukunaga, “Damage of yeast cells induced
by pulsed light irradiation,” vol. 85, pp. 151–158, 2003.
[70] H. L. Byrne, A. L. McNamara, W. Domanova, S. Guatelli, and Z. Kuncic, “Radiation
damage on sub-cellular scales: beyond DNA.,” Phys. Med. Biol., vol. 58, no. 5, pp. 1251–
1267, 2013.
[71] M. Corbo, D. Campaniello, B. Speranza, A. Bevilacqua, and M. Sinigaglia, “Non-
Conventional Tools to Preserve and Prolong the Quality of Minimally-Processed Fruits and
Vegetables,” Coatings, vol. 5, no. 4, pp. 931–961, Nov. 2015.
[72] T. Bourtoom, “Review Article Edible films and coatings : characteristics and properties,”
Int. food Res. J., vol. 15, no. 3, pp. 237–248, 2008.
78
VITA
Chang Keun Yoon was born in Seoul, Republic of Korea in 1984. He received his B.S. in Electrical
and Computer Engineering at Purdue University, West Lafayette, Indiana, in 2011. He has
continued his work toward Ph.D. as a research assistant at Birck Nanotechnology Center, Purdue
University, West Lafayette, Indiana, since 2011 under the guidance of Professor Babak Ziaie
developing radiation dosimeters utilizing microorganism, implantable micro devices, and MEMS
applications with energy harvesting circuits.
79
PUBLICATIONS
Journal
[1] C. K. Yoon, M. Ochoa, A. Kim, R. Rahimi, and B. Ziaie, “A new transduction mechanism for
detecting biological radiation damage using metabolic response of yeast as a surrogate marker.”
Submitted to Nature communications, 2017.
[2] M. Ochoa, C. K. Yoon, B. Ziaie. “Laser-fabricated, self-forming swimmers with catalytic
propulsion and magnetic navigation.” Journal of Micromechanics and Microengineering, In
press.
[3] C. K. Yoon, G. Chitnis, B. Ziaie. “Impact-triggered thermoelectric power generator using phase
change material as a heat source.” Journal of Micromechanics and Microengineering 23.11,
2013.
Conference
[1] C. K. Yoon, M. Ochoa, A. Kim, R. Rahimi, B. Ziaie, “An integrated low-cost radiation
dosimeter utilizing microorganism as radiation-sensitive material.” Hilton Head 2016, A solid-
state sensors, actuators and microsystems workshop, 2016.
[2] C. K. Yoon, A. Kim, M. Ochoa, T. Parupudi, B. Ziaie. "A low-cost wearable radiation sensor
based on dose response viability of yeast cells." 2016 IEEE 29th International Conference on
Micro Electro Mechanical Systems (MEMS). IEEE, 2016.
[3] M. Ochoa, C. K. Yoon, and B. Ziaie. "Flexible self-forming swimmers with catalytic
propulsion and magnetic navigation." 2016 IEEE 29th International Conference on Micro
Electro Mechanical Systems (MEMS). IEEE, 2016.
80
[4] S. S. Lee, C. K. Yoon, S. H. Song, B. Ziaie. “An electret-biased resonant radiation sensor.”
2014 IEEE 27th International Conference on Micro Electro Mechanical Systems (MEMS).
IEEE, 2014.
[5] C. K. Yoon, G. Chitnis, Z. Y. Zhu, B. Ziaie. “Impact triggered thermoelectric power generation
with phase change assisted temperature gradient engancement.” Power MEMS, 2013
[6] C. Mousoulis, C. K. Yoon, G. Chitnis, B. Ziaie. “Thermoelectric energy scavenging with
temperature gradient amplification.” Micro Electro Mechanical Systems (MEMS), 2012 IEEE
25th International Conference on. IEEE, 2012.
Related Documents