Purchasing Power Parity: Evidence from Developing Countries EMMANUEL ANORUO, ∗ HABTU BRAHA, ∗ AND YUSUF AHMAD ∗∗ Abstract This paper utilizes the dynamic error-correction model (DECM) to examine the is- sue of purchasing power parity (PPP) for 11 developing countries (Argentina, Bolivia, Colombia, Cote d’Ivoire, Ecuador, Guatemala, Kenya, Nigeria, Peru, South Africa, and Venezuela). For comparison purposes, evidence from the traditional unit root methods of the augmented Dickey-Fuller (ADF) and Phillips-Perron is presented. The results from the conventional unit root tests failed to find evidence of PPP in all of the cases. However, the results from the generalized error-correction model detected evidence of PPP for nine out of the 11 countries under consideration. Based on these results, it was concluded that PPP holds in the long-run for the sample countries and that the implicit restrictions associated with unit root tests prevented earlier studies from finding evidence in support of PPP theory. (JEL F31); Int’l Advances in Econ. Res., 8(2): pp. 85-96, May 02. c All Rights Reserved Introduction The existence of purchasing power parity (PPP) has been a subject of considerable debate among monetary economists. The PPP theory (frequently referred to as the law of one price) stipulates that the exchange rate adjusts over time to accommodate ination differentials between two countries. PPP is the cornerstone of the monetary models of exchange rate determination [Dornbucsh, 1976; Musa, 1982] and, as such, deserves the increased attention that it has received in the literature. Most monetarists agree that deviations from the PPP frequently occur in the short- run. For example, Dornbusch [1980] and Frenkel [1978] found evidence against PPP in the short-run. However, the existence of PPP in the long-run, although widely researched, has produced mixed results in the extant literature. For instance, Abuaf and Jorian [1990], Darby [1983], Baillie and Selover [1987], Meese and Rogoff [1988], Mark [1990], Hakkio [1984], and McCloskey and Zecher [1984] found evidence of PPP in the long-run. In contrast, Cooper [1994], Messe and Singleton [1982], and Ahking [1997] found evidence against PPP in the long-run. Meese and Singleton [1982] marked the turning point in the investigation of PPP. They found that nominal exchange rate has a unit root. This nding was interpreted as evidence that the nominal exchange rate follows a random walk, indicating that its impact is not mean- reverting. In other words, changes in nominal exchange rate are expected to be permanent. Consequently, the long-run PPP hypothesis could not be conrmed. Since then, most studies have used the classical unit root methodology to test for PPP. In most of the cases, the ∗ Coppin State College and ∗∗ the World BankU.S.A. The views expressed in this paper are those of the authors only. They do not reect the views of the World Bank. 85

Welcome message from author
This document is posted to help you gain knowledge. Please leave a comment to let me know what you think about it! Share it to your friends and learn new things together.
Transcript
Purchasing Power Parity: Evidence fromDeveloping Countries
EMMANUEL ANORUO,∗ HABTU BRAHA,∗ AND YUSUF AHMAD∗∗
Abstract
This paper utilizes the dynamic error-correction model (DECM) to examine the is-sue of purchasing power parity (PPP) for 11 developing countries (Argentina, Bolivia,Colombia, Cote d’Ivoire, Ecuador, Guatemala, Kenya, Nigeria, Peru, South Africa, andVenezuela). For comparison purposes, evidence from the traditional unit root methodsof the augmented Dickey-Fuller (ADF) and Phillips-Perron is presented. The resultsfrom the conventional unit root tests failed to find evidence of PPP in all of the cases.However, the results from the generalized error-correction model detected evidence ofPPP for nine out of the 11 countries under consideration. Based on these results, it wasconcluded that PPP holds in the long-run for the sample countries and that the implicitrestrictions associated with unit root tests prevented earlier studies from finding evidencein support of PPP theory. (JEL F31); Int’l Advances in Econ. Res., 8(2): pp. 85-96,May 02. c°All Rights Reserved
Introduction
The existence of purchasing power parity (PPP) has been a subject of considerable debateamong monetary economists. The PPP theory (frequently referred to as the law of one price)stipulates that the exchange rate adjusts over time to accommodate inßation differentialsbetween two countries. PPP is the cornerstone of the monetary models of exchange ratedetermination [Dornbucsh, 1976; Musa, 1982] and, as such, deserves the increased attentionthat it has received in the literature.Most monetarists agree that deviations from the PPP frequently occur in the short-
run. For example, Dornbusch [1980] and Frenkel [1978] found evidence against PPP in theshort-run. However, the existence of PPP in the long-run, although widely researched, hasproduced mixed results in the extant literature. For instance, Abuaf and Jorian [1990], Darby[1983], Baillie and Selover [1987], Meese and Rogoff [1988], Mark [1990], Hakkio [1984], andMcCloskey and Zecher [1984] found evidence of PPP in the long-run. In contrast, Cooper[1994], Messe and Singleton [1982], and Ahking [1997] found evidence against PPP in thelong-run.Meese and Singleton [1982] marked the turning point in the investigation of PPP. They
found that nominal exchange rate has a unit root. This Þnding was interpreted as evidencethat the nominal exchange rate follows a random walk, indicating that its impact is not mean-reverting. In other words, changes in nominal exchange rate are expected to be permanent.Consequently, the long-run PPP hypothesis could not be conÞrmed. Since then, most studieshave used the classical unit root methodology to test for PPP. In most of the cases, the
∗Coppin State College and ∗∗the World Bank�U.S.A. The views expressed in this paper arethose of the authors only. They do not reßect the views of the World Bank.
85
86 IAER: MAY 2002, VOL. 8, NO. 2
existence of unit roots in the real exchange rate could not be rejected. For example, Adlerand Lehmann [1983], using the conventional test, found that the real exchange rate follows arandom walk and concluded that there is no tendency for the PPP to hold in the long-run.Manzur [1990] and Manzur and Ariff [1995] investigated the existence of PPP for the
Group Seven (G7) countries in conjunction with the ASEAN countries. They rejected thehypothesis of unit roots based on the results from the Sim�s test. However, when theyapplied the Dickey-Fuller (DF), Augmented Dickey-Fuller (ADF), and Phillips-Perron (PP)tests, the hypothesis of unit root in the exchange rate could not be rejected. They thereforeconcluded that PPP holds in the long-run. Similarly, Abuaf and Jorian [1990] also foundevidence in support of PPP in the long-run. Whitt [1992] investigated the hypothesis thatthe exchange rate follows a random walk using monthly data and Sim�s test. He found thatthe real exchange rate does not follow a random walk, which indicates that PPP holds in thelong-run.Cooper [1994] investigated the validity of PPP by testing for stationarity and cointegration
for Australian, New Zealand, and Singaporean currencies for the period 1973-92. He foundthat both the unit root and cointegration tests failed to detect evidence in support of PPPin the long-run for the three countries under consideration.Ahking [1997] undertook a more sophisticated investigation of PPP by using the Bayesian
unit root approach. Ahking found that there is little probability that the exchange rate andprice level have a stable relationship in the long-run. Huang and Yang [1996] used both theEngle-Granger [1987] two-step approach and the Johansen [1988, 1991] maximum likelihoodprocedure to test the existence of PPP in the long-run. Interestingly, the Engle-Grangertest rejected the hypothesis that PPP holds in the long-run. However, the Johansen testprovided evidence in support of long-run PPP. When they re-estimated their data with theMonte Carlo simulations, they found that the Johansen procedure was biased in Þndingevidence of PPP because the normality assumption was violated most of the time.Dorodian, Jung, and Boyd [1999] found that in the long-run, PPP tends to hold more
often under a ßoating exchange rate regime than under a Þxed exchange rate system. Lee[1999] used sample data from 13 Asia PaciÞc economies, which included developing and a fewnewly industrial countries, to test the validity of PPP in the long-run using the generalizederror correction model. He concluded that PPP held in the long-run for the sample countries.The foregoing studies failed to provide a categorical answer to the validity of PPP in the
long-run. There are claims on both sides of the aisle. The heterogeneity of results can beattributed to the use of theoretically inconsistent testing procedures. For instance, some ofthe studies used the conventional ADF and PP unit root tests to examine the existence ofPPP in the long-run. These methods impose restrictions that make it difficult for evidence ofPPP to be detected. Furthermore, studies that used the Johansen method of cointegrationto explore the long-run validity of PPP may have produced distorted results because of theexistence of non-Gaussian residuals [Huang and Yang, 1996]. Finally, most of the studiesin the literature tested PPP for developed countries, with little or no attention devoted todeveloping countries.This paper attempts to overcome these weaknesses by using recent advances in time series
procedure to investigate the existence of long-run PPP for 11 developing countries, namely,Argentina, Bolivia, Colombia, Cote d�Ivoire, Ecuador, Guatemala, Kenya, Nigeria, Peru,South Africa, and Venezuela. SpeciÞcally, unit root tests are conducted using both the ADFand the PP procedures to determine the order of integration for nominal and real exchangerates and the price ratio. Finally, the dynamic error correction model (DECM) is utilized toexamine the existence of long-run PPP. The DECM is attractive over the other procedures
ANOROU, BRAHA, AND AHMED: PURCHASING POWER PARITY 87
because it relaxes the restrictions implicit in the traditional unit root procedures and treatsboth nominal exchange rate and the price ratio as endogenous variables.
Data and Methodology
The empirical analysis is conducted using quarterly data on nominal exchange rates andprice ratios (the ratio of each country�s CPI to the U.S. CPI) for 11 developing countries(Argentina, Bolivia, Colombia, Cote d�Ivoire, Ecuador, Guatemala, Kenya, Nigeria, Peru,South Africa, and Venezuela).The sample covers the period 1961-99 for all countries except for Nigeria, whose sample
spans from 1961-98. The data used in this study were all obtained from the InternationalFinancial Statistics (IFS) CD-ROM data disk 2000, published by International MonetaryFund. The sample countries were selected primarily due to the availability of consistent dataand also to ensure geographical diversity. Data management was also taken into considerationrelative to the number of countries included in the study.
ModelThe linear relationship between the logarithm of nominal exchange rate and the logarithm
of relative price ratio is expressed as follows:
st = α0 + α1pt + µt , (1)
where s represents the natural logarithm of the nominal exchange rate (local currency perU.S. dollar); p is the natural logarithm of the ratio of the domestic to foreign price level; andµt is the error term. In (1), PPP is indicated when α1 = 1 and rejected otherwise.
ADF Unit Root TestThe ADF [Dickey and Fuller; 1979, 1981] unit root test can also be used to explore the
existence of PPP. The ADF test is often based on the following OLS regression equation:
∆rt = α0 + β1rt−1 +nXi=i
θi∆rt−i + εt , (2)
where ∆ represents the Þrst-difference operator; r stands for the natural logarithm of realexchange rate; ε is the stationary random error; and n is the maximum lag length. In (2), ifβ < 0, then real exchange does not have a unit root. If on the other hand β = 0, then thereal exchange rate is said to have a unit root, indicating evidence against PPP.
Dynamic Error Correction ModelThe dynamic error correction is derived by modifying (2) as follows:
∆st = α0 +∆pt + δ (st−1 − pt−1) +kXi=1
¡γsi∆st−i − γpi∆pt−i
¢+ vt . (3)
Note that by deÞnition, rt = st − pt. The regression coefficient on the error correctionterm represents the deviation from the previous period�s PPP. If δ < 0, this would indicatea reduction in the exchange rate in the current period, provided that st−1 − pt−1 > 0. Anegatively statistically signiÞcant error correction coefficient indicates the tendency for theexchange rate to revert to the previous period�s equilibrium state. Nevertheless, if δ = 0, itcan be assured that there is no statistical relationship between the current period�s exchangerate and the deviation from the previous period�s PPP. In this case, there is no tendency forthe exchange rate to revert to the previous period�s equilibrium level.
88 IAER: MAY 2002, VOL. 8, NO. 2
Steigerwald [1996] points out the basic restrictions that are inherent in (3). First, the re-gression coefficient on ∆pt is equal to one by construction. Second, the regression coefficientson ∆st−i and ∆pt−i are forced to be equal and opposite in sign. It can therefore be seen thatusing (3) to test for a unit root amounts to conducting three different tests simultaneously(for example, testing the unity hypothesis of the coefficient on ∆pt, testing the error term (δ)for evidence of PPP, and testing the equality between the coefficients on ∆st−1 and ∆pt−1
and the possible opposite signs). To obtain a more generalized DECM, these restrictionsmust be relaxed.In the spirit of Steigerwald [1996], the following DECM is used to examine the validity of
PPP in the long-run:
∆st = α0 + β∆pt + δ (st−1 − pt−1) +kXi=1
θi∆pt+k +kXi=1
¡γsi∆st−i + γpi∆pt−i
¢+ vt . (4)
It can be seen from (4) that the regression coefficient (β) on ∆pt is no longer restricted to beequal to one. Instead, it can now be estimated. Given the fact that the nominal exchangerate and the price ratio are endogenous, inferences from (4) are biased unless at least onelead of the regressor is included [Phillips and Loretan, 1991].Equation (4) is checked for serial correlation in the residuals to ensure that it includes
enough leads and lags necessary to avoid biased inferences. Additional leads and lags areadded if the residuals are found to be serially correlated. This process is repeated until thehypothesis of residual serial correlation is rejected. Again, in (4), the regression coefficientson ∆st−1 and ∆pt−1 (i.e., γsi and γpi, respectively) are no longer forced to be equal withopposite signs. Finally, it is worth pointing out again that a negatively statistically signiÞcanterror correction coefficient (δ) provides evidence of PPP and the tendency for exchange rateto revert to the previous period�s equilibrium level in the long-run.
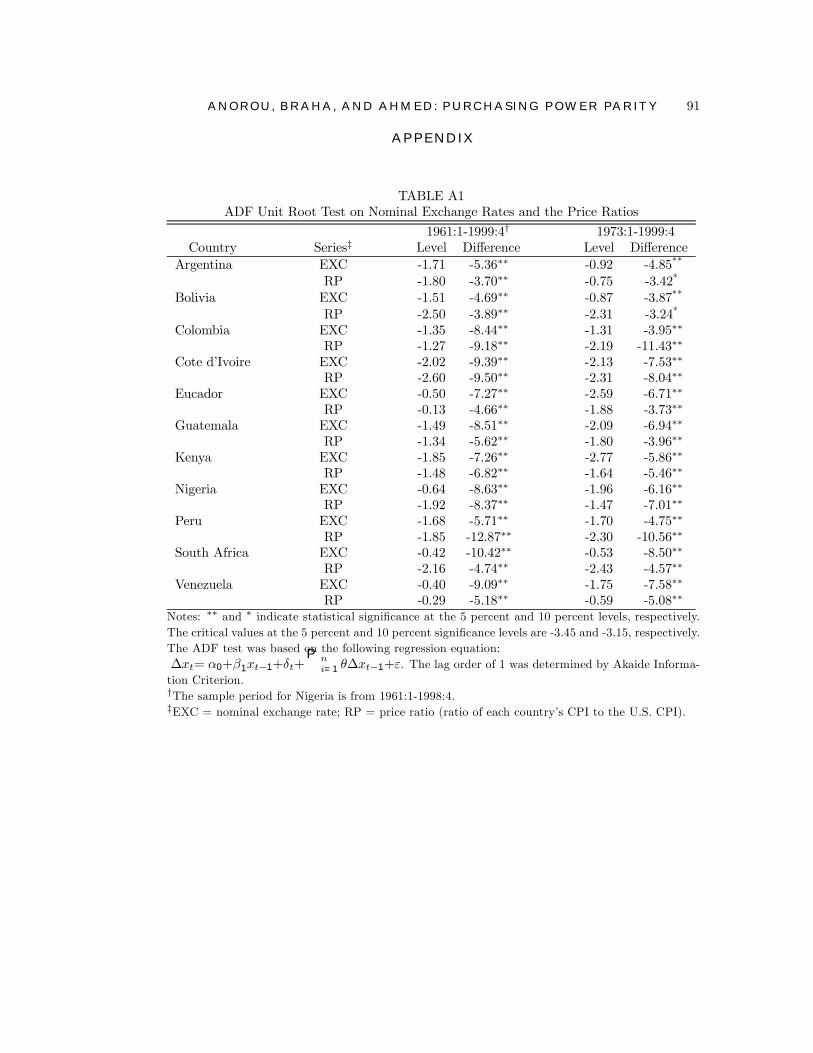
Unit Root ResultsUnit root tests are conducted to ensure that nominal exchange rate and price ratio have
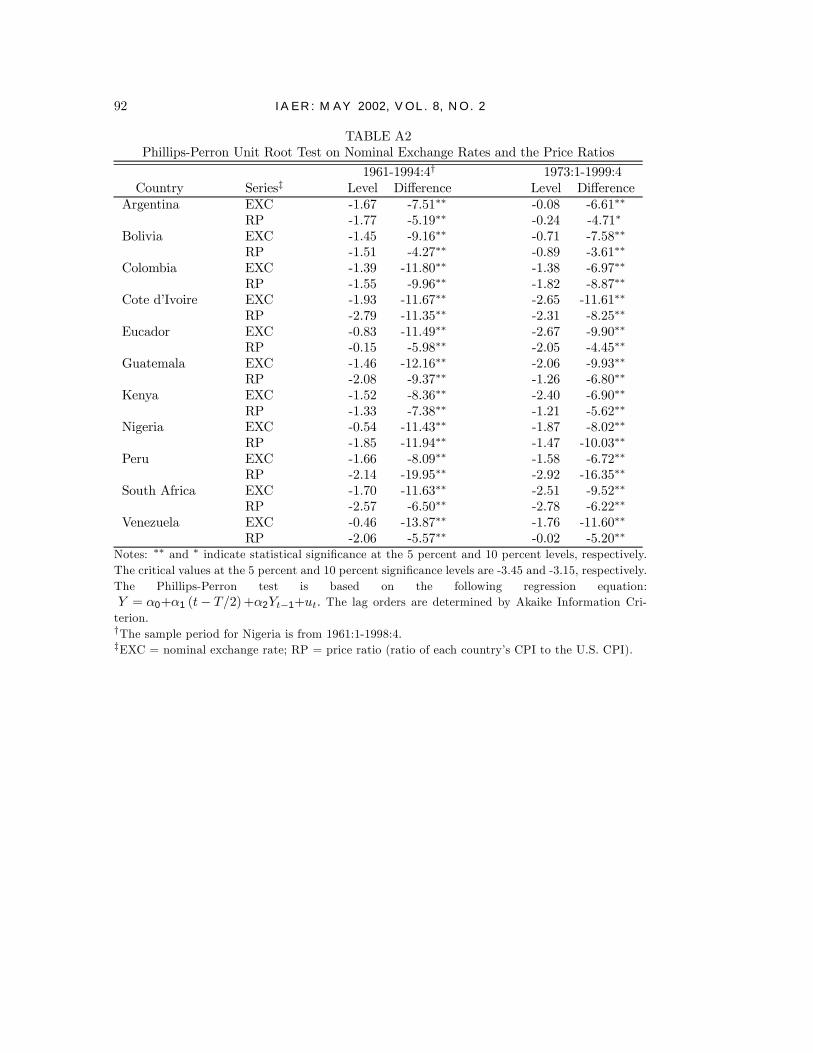
the same order of integration, since series with the same order of integration in the error-correction model must be included. The results of the ADF and PP [Phillips and Peron,1988] unit root tests are presented in Tables A1 and A2 for both periods (1961:1-1999:4 and1973:1-1999:4).The null hypothesis of nonstationarity of the nominal exchange rate and the price ratio
series is tested against the alternative hypothesis of stationarity. The results indicate thatthe two time series are not stationary in their levels. However, after Þrst differencing, thenull hypothesis of no unit root is rejected in all of the cases. In general, the results indicateone order of integration for all of the series.Similarly, Table A3 shows that in both periods, the null hypothesis of no unit root is
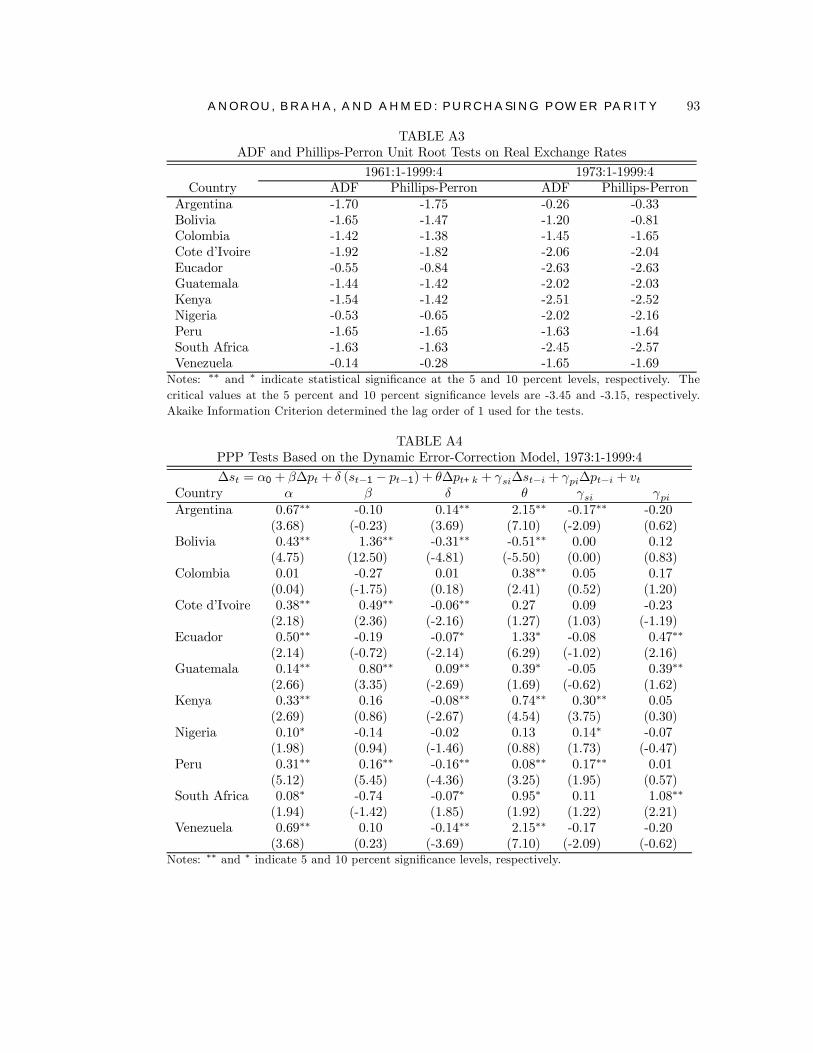
rejected in the level for the real exchange rate in all of the cases. The fact that the realexchange rate does not have a unit root provides evidence against PPP for these countries.
Results from the Dynamic Error Correction ModelHaving found evidence against PPP in the context of the classical unit root tests of
ADF and PP, a more generalized model of (4) is next estimated to determine the long-runequilibrium relationship between the natural logarithm of the nominal exchange rate andthe price ratio. The results with one lead and lag of the natural logarithm of the nominalexchange rate and the price ratio are presented in Table A4. The results indicate that theerror-correction term (δ) is negative and statistically signiÞcant in the cases of Argentina,
ANOROU, BRAHA, AND AHMED: PURCHASING POWER PARITY 89
Bolivia, Cote d�Ivoire, Ecuador, Guatemala, Kenya, Peru, South Africa, and Venezuela. Thestatistically signiÞcant error-correction coefficient indicates the presence of PPP and thetendency for the nominal exchange rate to revert to the previous period�s equilibrium levelfor these countries. However, for Colombia and Nigeria, the error-correction term is notstatistical signiÞcant, indicating a lack of PPP in the long-run.To avoid the serial correction problem associated with the inclusion of lagged variables,
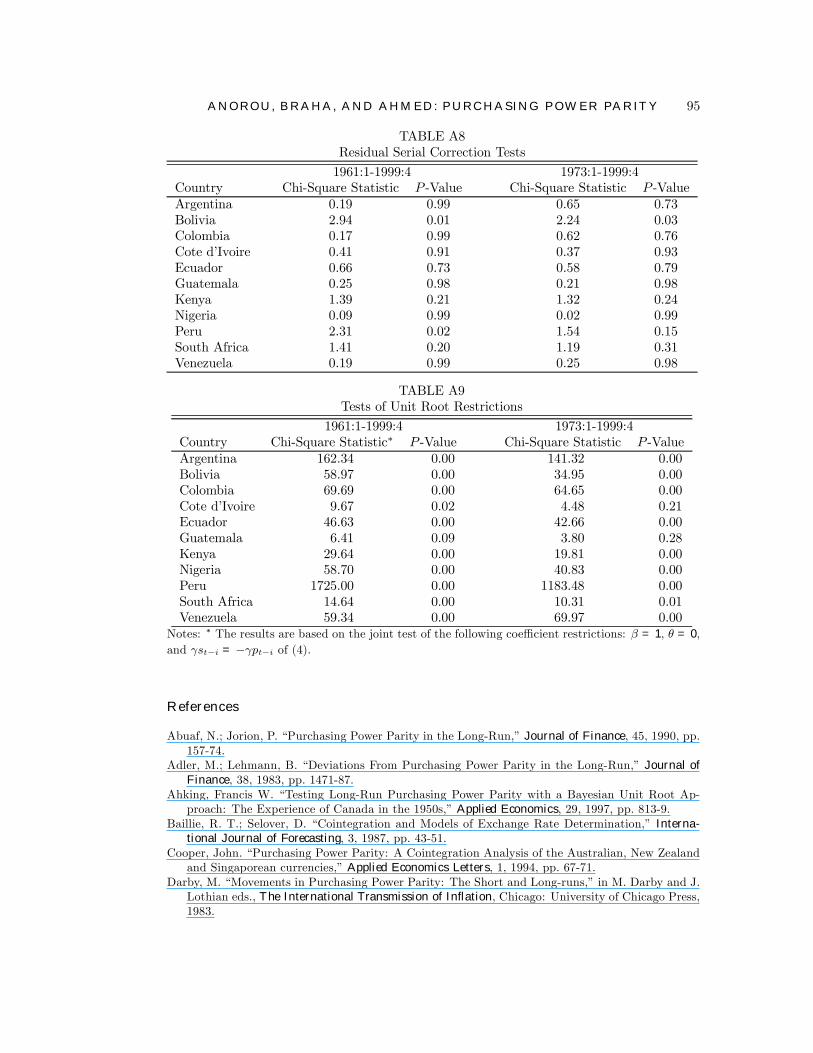
(4) is tested to ensure that it contains enough leads and lags. Steigerwald [1996] suggeststhat the best procedure is to regress the residuals on all of the regressors and lagged valuesof the residuals, and jointly test that all coefficients are equal to zero using the F -statistic.To this effect, the residuals are regressed on the nominal exchange rate, price ratio, and threelagged values of the residuals.The results of the residual serial correlation tests presented in Table A8 indicate that there
is no residual serial correlation in the cases of Argentina, Colombia, Cote d�Ivoire, Ecuador,Guatemala, Kenya, Nigeria, South Africa, and Venezuela, suggesting that (4) containedenough leads and lags. However, for Bolivia and Peru, the null hypothesis of no residualserial correlation could not be rejected.To overcome this problem, (4) was re-estimated with additional lags. For Bolivia, one
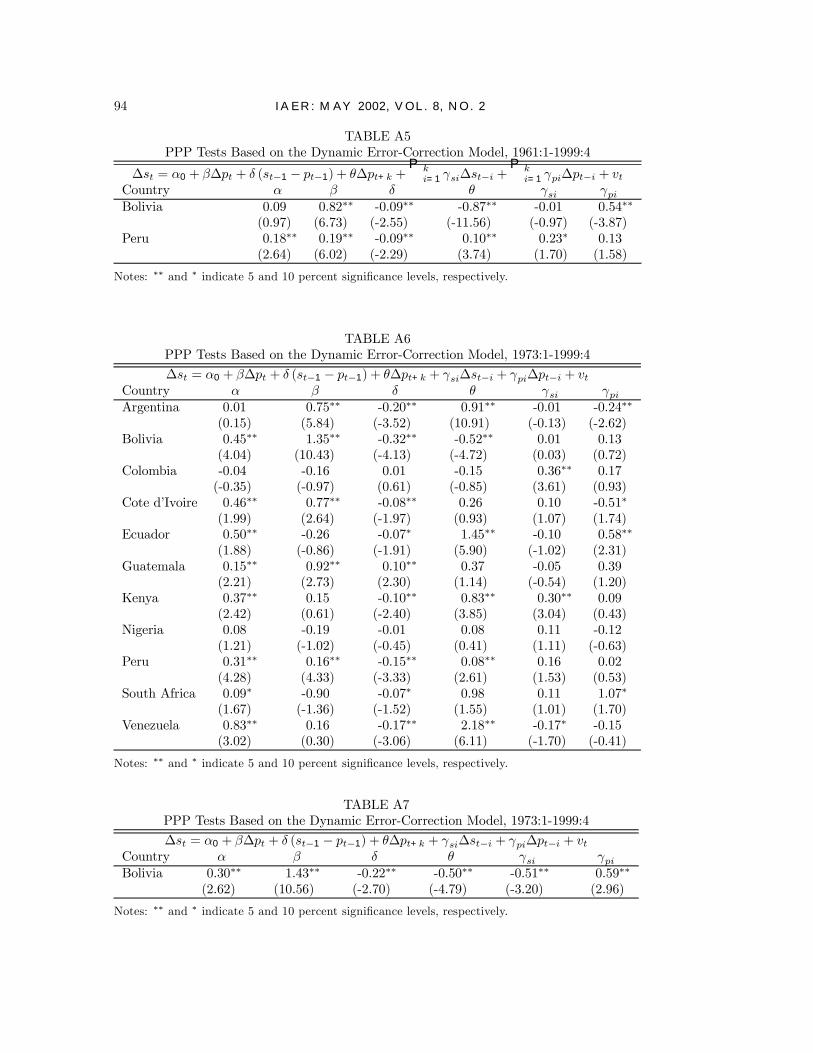
additional lag of the nominal exchange rate and the price ratio were incorporated into (4).In the case of Peru, two additional lags of the nominal exchange rate and the price ratio wereadded.Table A5 presents the results of the re-estimated coefficients for Bolivia and Peru. Again,
the results reveal that the error-correction term is less than zero and statistically signiÞcant,which provide evidence in favor of PPP. After the inclusion of the additional lags, the residualserial correlation test yielded F -statistics of 0.28 and 0.48, with p-values of 0.93 and 0.92,respectively, for Bolivia and Peru. These results suggest that the equation contains enoughleads and lags necessary to avoid fallacious inferences.Table A6 presents the results for the ßexible exchange rate regime. Similar to the results
for the entire study period (1961:1-1999:4), it was found that the regression coefficient onthe error-correction term is negative and statistically signiÞcant in the cases of Argentina,Bolivia, Cote d�Ivoire, Ecuador, Guatemala, Kenya, Peru, South Africa, and Venezuela.These results provide evidence in support of PPP for the ßexible exchange rate regime. ForColombia and Nigeria, the results provide evidence against PPP since the error-correctionterm is not statistically signiÞcant.Equation (4) was tested again for possible residual serial correlation. The results of
the residual serial correlation tests for the period 1973:1-1999 are presented in Table A8.Bolivia is the only country that shows evidence of serial correlation in the residuals duringthe ßexible exchange rate period. The serial correlation problem for Bolivia was remediedby including one additional lag of the nominal exchange rate and the price ratio. The re-estimated coefficients are presented in Table A7. Again, the results support the PPP theorysince the error-correction term is negative and statistically signiÞcant. After the inclusionof one additional lag, the residual serial correlation test provided a F -statistic of 0.60 witha p-value of 0.81, indicating that the equation contains enough leads and lags required toderive unbiased inferences.The Þnal stage of this study is to determine whether the data support the restrictions
(β = 1, θ = 0, and γst−i = γpt−i) imposed by the classical unit root procedures. Chi-Squaretests are conducted to examine the validity of these restrictions. Table A9 presents thechi-square statistics
¡χ2
¢and the associated p-values for the unit root restrictions. For
the period 1961:1-1999:4, the results reject the unity hypothesis for ∆pt in all of the cases.Further, the regression coefficients on ∆st−i and ∆pt−i are found neither to be equal nor
90 IAER: MAY 2002, VOL. 8, NO. 2
have the hypothesized opposite signs. However, for the ßexible exchange rate period (1973:1-1999:4), the restrictions could not be rejected for Cote d�Ivoire and Guatemala. For these twocountries, the unit root test provides evidence in favor of PPP. For the rest of the countriesunder consideration, the restrictions are rejected.In all, these results do not lend credence to the restrictions imposed by the standard
unit root procedures on the real exchange rate series. In other words, these results failed toprovide convincing evidence in support of PPP. Compared to the results obtained with thetraditional unit root procedures, the method of dynamic error correction model appeared tobe more robust in detecting the existence of PPP.
Conclusions
This paper has employed a theoretically consistent method of dynamic error-correctionmodel (DECM) to examine the issue of PPP for 11 developing countries (Argentina, Bo-livia, Colombia, Cote d�Ivoire, Ecuador, Guatemala, Kenya, Nigeria, Peru, South Africa, andVenezuela). The DECM was adopted because it relaxes the restrictions implicit in the tra-ditional unit root procedures and treats both the nominal exchange rate and the price ratioas endogenous variables.Consistent with earlier studies in the literature, the present study failed to Þnd evidence
of PPP in all of the cases using the conventional unit root tests of ADF and PP. However,the results from the more generalized error-correction model provided evidence in favor ofPPP in the long-run in all of the cases, with the exception of Colombia and Nigeria in bothsample periods. The restrictions imposed by the traditional unit root tests were also tested.The restrictions were rejected in all of the cases except for Cote d�Ivoire and Guatemala.This study makes two important Þndings. First, it is conÞrmed that PPP holds for the
sample developing countries. Second, it is surmised from the results that the earlier studiesthat used the conventional unit root tests failed to detect evidence of PPP because of theimposition of stringent restrictions.Although this paper has established that PPP holds for the sample countries, there is still
an avenue for further research. In the future, it would be interesting and informative to applythe method of the dynamic error-correction model to other developing countries to validate itsapplicability and robustness in detecting PPP for countries with nascent economies. However,the feasibility of such study will depend on the availability of data.
ANOROU, BRAHA, AND AHMED: PURCHASING POWER PARITY 91
APPENDIX
TABLE A1ADF Unit Root Test on Nominal Exchange Rates and the Price Ratios
1961:1-1999:4� 1973:1-1999:4Country Series� Level Difference Level Difference
Argentina EXC -1.71 -5.36∗∗ -0.92 -4.85**
RP -1.80 -3.70∗∗ -0.75 -3.42*
Bolivia EXC -1.51 -4.69∗∗ -0.87 -3.87**
RP -2.50 -3.89∗∗ -2.31 -3.24*
Colombia EXC -1.35 -8.44∗∗ -1.31 -3.95∗∗
RP -1.27 -9.18∗∗ -2.19 -11.43∗∗
Cote d�Ivoire EXC -2.02 -9.39∗∗ -2.13 -7.53∗∗
RP -2.60 -9.50∗∗ -2.31 -8.04∗∗
Eucador EXC -0.50 -7.27∗∗ -2.59 -6.71∗∗
RP -0.13 -4.66∗∗ -1.88 -3.73∗∗
Guatemala EXC -1.49 -8.51∗∗ -2.09 -6.94∗∗
RP -1.34 -5.62∗∗ -1.80 -3.96∗∗
Kenya EXC -1.85 -7.26∗∗ -2.77 -5.86∗∗
RP -1.48 -6.82∗∗ -1.64 -5.46∗∗
Nigeria EXC -0.64 -8.63∗∗ -1.96 -6.16∗∗
RP -1.92 -8.37∗∗ -1.47 -7.01∗∗
Peru EXC -1.68 -5.71∗∗ -1.70 -4.75∗∗
RP -1.85 -12.87∗∗ -2.30 -10.56∗∗
South Africa EXC -0.42 -10.42∗∗ -0.53 -8.50∗∗
RP -2.16 -4.74∗∗ -2.43 -4.57∗∗
Venezuela EXC -0.40 -9.09∗∗ -1.75 -7.58∗∗
RP -0.29 -5.18∗∗ -0.59 -5.08∗∗
Notes: ∗∗ and ∗ indicate statistical signiÞcance at the 5 percent and 10 percent levels, respectively.The critical values at the 5 percent and 10 percent signiÞcance levels are -3.45 and -3.15, respectively.The ADF test was based on the following regression equation:∆xt= α0+β1xt−1+δt+
Pni=1 θ∆xt−1+ε. The lag order of 1 was determined by Akaide Informa-
tion Criterion.�The sample period for Nigeria is from 1961:1-1998:4.�EXC = nominal exchange rate; RP = price ratio (ratio of each country�s CPI to the U.S. CPI).
92 IAER: MAY 2002, VOL. 8, NO. 2
TABLE A2Phillips-Perron Unit Root Test on Nominal Exchange Rates and the Price Ratios
1961-1994:4� 1973:1-1999:4Country Series� Level Difference Level Difference
Argentina EXC -1.67 -7.51∗∗ -0.08 -6.61∗∗
RP -1.77 -5.19∗∗ -0.24 -4.71∗
Bolivia EXC -1.45 -9.16∗∗ -0.71 -7.58∗∗
RP -1.51 -4.27∗∗ -0.89 -3.61∗∗
Colombia EXC -1.39 -11.80∗∗ -1.38 -6.97∗∗
RP -1.55 -9.96∗∗ -1.82 -8.87∗∗
Cote d�Ivoire EXC -1.93 -11.67∗∗ -2.65 -11.61∗∗
RP -2.79 -11.35∗∗ -2.31 -8.25∗∗
Eucador EXC -0.83 -11.49∗∗ -2.67 -9.90∗∗
RP -0.15 -5.98∗∗ -2.05 -4.45∗∗
Guatemala EXC -1.46 -12.16∗∗ -2.06 -9.93∗∗
RP -2.08 -9.37∗∗ -1.26 -6.80∗∗
Kenya EXC -1.52 -8.36∗∗ -2.40 -6.90∗∗
RP -1.33 -7.38∗∗ -1.21 -5.62∗∗
Nigeria EXC -0.54 -11.43∗∗ -1.87 -8.02∗∗
RP -1.85 -11.94∗∗ -1.47 -10.03∗∗
Peru EXC -1.66 -8.09∗∗ -1.58 -6.72∗∗
RP -2.14 -19.95∗∗ -2.92 -16.35∗∗
South Africa EXC -1.70 -11.63∗∗ -2.51 -9.52∗∗
RP -2.57 -6.50∗∗ -2.78 -6.22∗∗
Venezuela EXC -0.46 -13.87∗∗ -1.76 -11.60∗∗
RP -2.06 -5.57∗∗ -0.02 -5.20∗∗
Notes: ∗∗ and ∗ indicate statistical signiÞcance at the 5 percent and 10 percent levels, respectively.The critical values at the 5 percent and 10 percent signiÞcance levels are -3.45 and -3.15, respectively.The Phillips-Perron test is based on the following regression equation:Y = α0+α1 (t− T/2)+α2Yt−1+ut. The lag orders are determined by Akaike Information Cri-terion.�The sample period for Nigeria is from 1961:1-1998:4.�EXC = nominal exchange rate; RP = price ratio (ratio of each country�s CPI to the U.S. CPI).
ANOROU, BRAHA, AND AHMED: PURCHASING POWER PARITY 93
TABLE A3ADF and Phillips-Perron Unit Root Tests on Real Exchange Rates
1961:1-1999:4 1973:1-1999:4Country ADF Phillips-Perron ADF Phillips-Perron
Argentina -1.70 -1.75 -0.26 -0.33Bolivia -1.65 -1.47 -1.20 -0.81Colombia -1.42 -1.38 -1.45 -1.65Cote d�Ivoire -1.92 -1.82 -2.06 -2.04Eucador -0.55 -0.84 -2.63 -2.63Guatemala -1.44 -1.42 -2.02 -2.03Kenya -1.54 -1.42 -2.51 -2.52Nigeria -0.53 -0.65 -2.02 -2.16Peru -1.65 -1.65 -1.63 -1.64South Africa -1.63 -1.63 -2.45 -2.57Venezuela -0.14 -0.28 -1.65 -1.69Notes: ∗∗ and ∗ indicate statistical signiÞcance at the 5 and 10 percent levels, respectively. Thecritical values at the 5 percent and 10 percent signiÞcance levels are -3.45 and -3.15, respectively.Akaike Information Criterion determined the lag order of 1 used for the tests.
TABLE A4PPP Tests Based on the Dynamic Error-Correction Model, 1973:1-1999:4
∆st = α0 + β∆pt + δ (st−1 − pt−1) + θ∆pt+k + γsi∆st−i + γpi∆pt−i + vtCountry α β δ θ γsi γpiArgentina 0.67∗∗ -0.10 0.14∗∗ 2.15∗∗ -0.17∗∗ -0.20
(3.68) (-0.23) (3.69) (7.10) (-2.09) (0.62)Bolivia 0.43∗∗ 1.36∗∗ -0.31∗∗ -0.51∗∗ 0.00 0.12
(4.75) (12.50) (-4.81) (-5.50) (0.00) (0.83)Colombia 0.01 -0.27 0.01 0.38∗∗ 0.05 0.17
(0.04) (-1.75) (0.18) (2.41) (0.52) (1.20)Cote d�Ivoire 0.38∗∗ 0.49∗∗ -0.06∗∗ 0.27 0.09 -0.23
(2.18) (2.36) (-2.16) (1.27) (1.03) (-1.19)Ecuador 0.50∗∗ -0.19 -0.07∗ 1.33∗ -0.08 0.47∗∗
(2.14) (-0.72) (-2.14) (6.29) (-1.02) (2.16)Guatemala 0.14∗∗ 0.80∗∗ 0.09∗∗ 0.39∗ -0.05 0.39∗∗
(2.66) (3.35) (-2.69) (1.69) (-0.62) (1.62)Kenya 0.33∗∗ 0.16 -0.08∗∗ 0.74∗∗ 0.30∗∗ 0.05
(2.69) (0.86) (-2.67) (4.54) (3.75) (0.30)Nigeria 0.10∗ -0.14 -0.02 0.13 0.14∗ -0.07
(1.98) (0.94) (-1.46) (0.88) (1.73) (-0.47)Peru 0.31∗∗ 0.16∗∗ -0.16∗∗ 0.08∗∗ 0.17∗∗ 0.01
(5.12) (5.45) (-4.36) (3.25) (1.95) (0.57)South Africa 0.08∗ -0.74 -0.07∗ 0.95∗ 0.11 1.08∗∗
(1.94) (-1.42) (1.85) (1.92) (1.22) (2.21)Venezuela 0.69∗∗ 0.10 -0.14∗∗ 2.15∗∗ -0.17 -0.20
(3.68) (0.23) (-3.69) (7.10) (-2.09) (-0.62)Notes: ∗∗ and ∗ indicate 5 and 10 percent signiÞcance levels, respectively.
94 IAER: MAY 2002, VOL. 8, NO. 2
TABLE A5PPP Tests Based on the Dynamic Error-Correction Model, 1961:1-1999:4
∆st = α0 + β∆pt + δ (st−1 − pt−1) + θ∆pt+k +Pki=1 γsi∆st−i +
Pki=1 γpi∆pt−i + vt
Country α β δ θ γsi γpiBolivia 0.09 0.82∗∗ -0.09∗∗ -0.87∗∗ -0.01 0.54∗∗
(0.97) (6.73) (-2.55) (-11.56) (-0.97) (-3.87)Peru 0.18∗∗ 0.19∗∗ -0.09∗∗ 0.10∗∗ 0.23∗ 0.13
(2.64) (6.02) (-2.29) (3.74) (1.70) (1.58)
Notes: ∗∗ and ∗ indicate 5 and 10 percent signiÞcance levels, respectively.
TABLE A6PPP Tests Based on the Dynamic Error-Correction Model, 1973:1-1999:4
∆st = α0 + β∆pt + δ (st−1 − pt−1) + θ∆pt+k + γsi∆st−i + γpi∆pt−i + vtCountry α β δ θ γsi γpiArgentina 0.01 0.75∗∗ -0.20∗∗ 0.91∗∗ -0.01 -0.24∗∗
(0.15) (5.84) (-3.52) (10.91) (-0.13) (-2.62)Bolivia 0.45∗∗ 1.35∗∗ -0.32∗∗ -0.52∗∗ 0.01 0.13
(4.04) (10.43) (-4.13) (-4.72) (0.03) (0.72)Colombia -0.04 -0.16 0.01 -0.15 0.36∗∗ 0.17
(-0.35) (-0.97) (0.61) (-0.85) (3.61) (0.93)Cote d�Ivoire 0.46∗∗ 0.77∗∗ -0.08∗∗ 0.26 0.10 -0.51∗
(1.99) (2.64) (-1.97) (0.93) (1.07) (1.74)Ecuador 0.50∗∗ -0.26 -0.07∗ 1.45∗∗ -0.10 0.58∗∗
(1.88) (-0.86) (-1.91) (5.90) (-1.02) (2.31)Guatemala 0.15∗∗ 0.92∗∗ 0.10∗∗ 0.37 -0.05 0.39
(2.21) (2.73) (2.30) (1.14) (-0.54) (1.20)Kenya 0.37∗∗ 0.15 -0.10∗∗ 0.83∗∗ 0.30∗∗ 0.09
(2.42) (0.61) (-2.40) (3.85) (3.04) (0.43)Nigeria 0.08 -0.19 -0.01 0.08 0.11 -0.12
(1.21) (-1.02) (-0.45) (0.41) (1.11) (-0.63)Peru 0.31∗∗ 0.16∗∗ -0.15∗∗ 0.08∗∗ 0.16 0.02
(4.28) (4.33) (-3.33) (2.61) (1.53) (0.53)South Africa 0.09∗ -0.90 -0.07∗ 0.98 0.11 1.07∗
(1.67) (-1.36) (-1.52) (1.55) (1.01) (1.70)Venezuela 0.83∗∗ 0.16 -0.17∗∗ 2.18∗∗ -0.17∗ -0.15
(3.02) (0.30) (-3.06) (6.11) (-1.70) (-0.41)
Notes: ∗∗ and ∗ indicate 5 and 10 percent signiÞcance levels, respectively.
TABLE A7PPP Tests Based on the Dynamic Error-Correction Model, 1973:1-1999:4
∆st = α0 + β∆pt + δ (st−1 − pt−1) + θ∆pt+k + γsi∆st−i + γpi∆pt−i + vtCountry α β δ θ γsi γpiBolivia 0.30∗∗ 1.43∗∗ -0.22∗∗ -0.50∗∗ -0.51∗∗ 0.59∗∗
(2.62) (10.56) (-2.70) (-4.79) (-3.20) (2.96)
Notes: ∗∗ and ∗ indicate 5 and 10 percent signiÞcance levels, respectively.
ANOROU, BRAHA, AND AHMED: PURCHASING POWER PARITY 95
TABLE A8Residual Serial Correction Tests
1961:1-1999:4 1973:1-1999:4Country Chi-Square Statistic P -Value Chi-Square Statistic P -ValueArgentina 0.19 0.99 0.65 0.73Bolivia 2.94 0.01 2.24 0.03Colombia 0.17 0.99 0.62 0.76Cote d�Ivoire 0.41 0.91 0.37 0.93Ecuador 0.66 0.73 0.58 0.79Guatemala 0.25 0.98 0.21 0.98Kenya 1.39 0.21 1.32 0.24Nigeria 0.09 0.99 0.02 0.99Peru 2.31 0.02 1.54 0.15South Africa 1.41 0.20 1.19 0.31Venezuela 0.19 0.99 0.25 0.98
TABLE A9Tests of Unit Root Restrictions
1961:1-1999:4 1973:1-1999:4Country Chi-Square Statistic∗ P -Value Chi-Square Statistic P -ValueArgentina 162.34 0.00 141.32 0.00Bolivia 58.97 0.00 34.95 0.00Colombia 69.69 0.00 64.65 0.00Cote d�Ivoire 9.67 0.02 4.48 0.21Ecuador 46.63 0.00 42.66 0.00Guatemala 6.41 0.09 3.80 0.28Kenya 29.64 0.00 19.81 0.00Nigeria 58.70 0.00 40.83 0.00Peru 1725.00 0.00 1183.48 0.00South Africa 14.64 0.00 10.31 0.01Venezuela 59.34 0.00 69.97 0.00
Notes: ∗ The results are based on the joint test of the following coefficient restrictions: β = 1, θ = 0,and γst−i = −γpt−i of (4).
References
Abuaf, N.; Jorion, P. �Purchasing Power Parity in the Long-Run,� Journal of Finance, 45, 1990, pp.157-74.
Adler, M.; Lehmann, B. �Deviations From Purchasing Power Parity in the Long-Run,� Journal ofFinance, 38, 1983, pp. 1471-87.
Ahking, Francis W. �Testing Long-Run Purchasing Power Parity with a Bayesian Unit Root Ap-proach: The Experience of Canada in the 1950s,� Applied Economics, 29, 1997, pp. 813-9.
Baillie, R. T.; Selover, D. �Cointegration and Models of Exchange Rate Determination,� Interna-tional Journal of Forecasting, 3, 1987, pp. 43-51.
Cooper, John. �Purchasing Power Parity: A Cointegration Analysis of the Australian, New Zealandand Singaporean currencies,� Applied Economics Letters, 1, 1994, pp. 67-71.
Darby, M. �Movements in Purchasing Power Parity: The Short and Long-runs,� in M. Darby and J.Lothian eds., The International Transmission of Inflation, Chicago: University of Chicago Press,1983.
96 IAER: MAY 2002, VOL. 8, NO. 2
Dickey, D. A.; Fuller, W. A. �Distribution of Estimates of Autoregressive Time Series With UnitRoot,� Journal of the American Statistical Association, 1979, pp. 427-31.
Dornbusch, Rudiger. �Expectations and Exchange Rate Dynamics,� Journal of Political Economy,84, 1976, pp. 1161-76.
�. �Exchange Rate Economics: Where Do We Stand?,� Brookings Paper on Economic Activity, 1,1980, pp.143-85.
Dorodian, Khosrow; Jung, Chulho; Boyd, Roy. �Testing the Law of One Price Under the Fixed andFlexible Exchange Rate System,� Applied Economics Letters, 6, 1999, pp. 613-6.
Engle, R. F.; Granger, C. W. J. �Cointegration and Error Correction: Estimation and Testing,�Econometrica, 55, 1987, pp. 251-76.
Frenkel, J. A. �Purchasing Power Parity: Doctrinal Perspective and Evidence from the 1920s,�Journal of International Economics, 8, 1978, pp. 169-91.
Hakkio, C. S. �A Re-examination of Purchasing Power Parity: A Multi-Country and Multi-PeriodStudy,� Journal of International Economics, 17, 1984, pp. 265-77.
Haung, Bwo-Nung; Yang, Chin W. �Long-Run Purchasing Power Parity Revisited: A Monte CarloSimulation,� Applied Economics, 28, 1996, pp. 967-74.
Johansen, S. �Statistical Analysis of Cointegration Vectors,� Journal of Economic Dynamics andControl, 12, 1988, pp. 231-54.
�. �Estimation and Hypothesis Testing of Cointegration Vectors in Gaussian Vector AutoregressiveModels,� Econometrica, 59, 1991, pp. 1551-80.
Lee, Daniel. �Purchasing Power Parity and Dynamic Error Correction Evidence from Asia PaciÞcEconomies,� International Review of Economics and Finance, 8, 1999, pp. 199-212.
Manzur, Meher. �An International Comparison of Prices and Exchange Rates: A New Test ofPurchasing Power Parity,� Journal of International Money and Finance, 9, 1990, pp. 75-91.
Manzur, Meher; Ariff, Mohamad. �Purchasing Power Parity: New Methods and Extensions,� AppliedFinance Economics, 5, 1995, pp. 19-26.
Mark, N. C. �Real and Nominal Exchange Rates in the Long-Run: An Empirical Investigation,�Journal of International Economics, 28, 1990, pp. 115-36.
McCloskey, D.; Zecher, J. �The Success of Purchasing Power Parity: Historical Evidence and itsImplications for Macroeconomics,� in M. Bordo and A. Schwartz eds., A Retrospective on theClassical Gold Standard, Chicago: University of Chicago Press, 1984, pp. 1821-931.
Meese, R. A.; Singleton, K. A. �On Unit Roots and the Empirical Modeling of Exchange Rates,�Journal of Finance, 37, 1982, pp. 1029-35.
Messe. R. A.; Rogoff, K. �Was it Real? The Exchange Rate-Interest Differential Relation Over theModern Floating-Rate Period,� Journal of Finance, 43, 1988, pp. 933-48.
Mussa, Michael L. �A Model of Exchange Rate Dynamics,� Journal of Political Economy, 90, 1982,pp. 74 -104.
Phillips, P. C. B.; Loretan, M. �Estimating Long-Run Economic Equilibria,� Review of EconomicStudies, 58, 1991, pp. 407-36.
Phillips, P. C. B.; Perron, P. �Testing for a Unit Root in Time Series Regression,� Biometrika, 75,1988, pp. 335-46.
Steigerwald, D. G. �Purchasing Power Parity, Unit Roots, and Dynamic Structure,� Journal ofEmpirical Finance, 2, 1996, pp. 343-57.
Whitt, Joseph A., Jr., �The Long-Run Behavior of the Real Exchange Rate: A Reconsideration,�Journal of Money, Credit, and Banking, 24, 1, 1992, pp. 72-82.
Related Documents