Purchasing in engineer-to-order companies The use of purchasing tools in Norwegian engineer-to-order companies Mads Veilemand Holstad Børge Sjøbakk Fredrik Dehnæs Stokke Industrial Economics and Technology Management Supervisor: Luitzen de Boer, IØT Co-supervisor: Elsebeth Holmen, IØT Bjørn Ragnar Albrigtsen, SINTEF Department of Industrial Economics and Technology Management Submission date: June 2012 Norwegian University of Science and Technology

Welcome message from author
This document is posted to help you gain knowledge. Please leave a comment to let me know what you think about it! Share it to your friends and learn new things together.
Transcript
Purchasing in engineer-to-order companiesThe use of purchasing tools in Norwegian
engineer-to-order companies
Mads Veilemand HolstadBørge SjøbakkFredrik Dehnæs Stokke
Industrial Economics and Technology Management
Supervisor: Luitzen de Boer, IØTCo-supervisor: Elsebeth Holmen, IØT
Bjørn Ragnar Albrigtsen, SINTEF
Department of Industrial Economics and Technology Management
Submission date: June 2012
Norwegian University of Science and Technology


Master’s thesis – spring 2012
Purchasing in engineer-to-order companies The use of purchasing tools in Norwegian engineer-to-order companies
MADS VEILEMAND HOLSTAD
BØRGE SJØBAKK
FREDRIK STOKKE
Trondheim, June 2012

Preface
iii
Preface This master’s thesis is written within the Strategic Purchasing and Supply Management profile at
the Department of Industrial Economics and Technology Management, NTNU. The thesis is
also a contribution to the research project MARGIN, spring 2012.
The title of the master’s thesis is “Purchasing in engineer-to-order companies – The use of
purchasing tools in Norwegian engineer-to-order companies”. Following in the lines of the
MARGIN project and an identified theoretical gap with respect to the engineer-to-order (ETO)
production situation, the purpose of this master’s thesis is to study the use of purchasing tools,
especially purchasing portfolio approaches, in Norwegian ETO companies. The master’s thesis
is a continuation of a specialization project written by the authors in fall 2011.
We wish to thank our supervisors at the Department of Industrial Economics and Technology
Management, Professor Luitzen De Boer and Associate Professor Elsebeth Holmen, and Bjørn
Albrigtsen at SINTEF, for their priceless guidance during the research process. We also thank
Professor Arjan van Weele and Associate Professor Cees Gelderman for sharing questions from
a questionnaire they distributed in the Netherlands, in order to achieve replication and
comparisons with Norwegian practice.
Further, we wish to give thanks to Fugro OCEANOR for invaluable empirical data and co-
operation. We also wish to thank Lena Fröyland Larsson and Line Marlene Helberg Young at
NIMA, Ottar Bakås and Torbjørn Akersveen at NCEI, Kjell O. Johannessen at NCE NODE
and Antonia Guiogova at NCE Maritime for being of help in distributing our questionnaire.
Finally, we thank all the companies that have participated in the making of this master’s thesis
through answering our questionnaire.
Trondheim, 11th of June 2012
_____________________ _____________________ _____________________
Mads V. Holstad
Børge Sjøbakk
Fredrik D. Stokke
Summary
iv
Summary This master’s thesis is written as a contribution to the MARGIN project, which is a three-year
research project conducted by Kongsberg Maritime, Noca, Roxar and Fugro OCEANOR
(Fugro), in collaboration with SINTEF, HiST and the NCEI cluster. Further, the master’s thesis
is a continuation of a specialization project written by the authors in fall 2011. In the
specialization project, Fugro was chosen as a collaborating partner. This collaboration is
continued in this master’s thesis.
Following in the lines of the MARGIN project and an identified theoretical gap with respect to
the engineer-to-order (ETO) production situation, we set out to explore how the level of
purchasing sophistication affects the use of purchasing portfolio approaches in Norwegian ETO
companies. To answer this problem, we have conducted three literature reviews and mixed
methods research; the latter comprising qualitative action research and quantitative survey
research. Literature reviews on purchasing portfolio approaches and ETO were conducted in
fall 2011 and are further refined in this master’s thesis. The specialization project brought forth a
need for further research with respect to purchasing sophistication. As such, a literature review
on purchasing sophistication was conducted at the departure of this master’s thesis. Findings
from the literature reviews were brought together in a theoretical framework. Following the
empirical investigation, this framework was further refined with gained knowledge from both
survey- and action research. This refined framework was thereafter utilized in analyzing the
connections between the three main topics of purchasing portfolio approaches, purchasing
sophistication and ETO.
Survey research established two statistically significant connections between purchasing
portfolio approaches and purchasing sophistication. First, the use of purchasing portfolio
approaches was found to have a significant relationship with having a sourcing strategy. The
latter variable further displayed a statistically significant higher level of purchasing sophistication
for companies in possession of a sourcing strategy. Second, the use of purchasing portfolio
approaches indicated a statistically significant relationship with the skills of the purchasing
professionals; the latter identified as a dimension of purchasing sophistication. Based on these
findings, we argued that the use of purchasing portfolio approaches may lead to a higher level of
purchasing sophistication – both by establishing sourcing strategies and facilitating the
development of the skills pertaining to the purchasing professionals. Thereafter, action research
findings enabled us to develop a segmentation model, differentiating between prevalent
purchasing portfolio approaches based on relevant characteristics of purchasing sophistication.
Hence, we developed a tool for choosing an appropriate purchasing portfolio approach, given
the company’s level of purchasing sophistication.
In investigating the relationship between purchasing sophistication and the ETO production
situation, we employed both survey and action research in order to evaluate ETO companies’
level of purchasing sophistication. This evaluation was further utilized in respect to the
connection between purchasing portfolio approaches and ETO. Here, survey and action
research findings revealed several benefits for an ETO company to use a purchasing portfolio
approach. As such, we utilized the previously developed segmentation model, and
Summary
v
recommended a purchasing portfolio approach by taking into account the preceding evaluation
of purchasing sophistication of ETO companies. This led us to suggest that an ETO company,
with similar characteristics as Fugro, should adopt the purchasing portfolio approach by van
Weele (2010). In addition, the action research findings enabled us to modify the suggested
approach, in order to take into consideration the identified power and dependence
characteristics found prevalent for ETO companies with similar characteristics as Fugro. These
action research findings also enabled us to provide guidelines for the use of such an approach.
In conclusion, we have established a relationship between purchasing portfolio approaches,
purchasing sophistication and ETO. As such, we have, in an elaborate manner succeeded in
answering the purpose of this master’s thesis.
Norwegian summary
vi
Norwegian summary Denne masteroppgaven er et bidrag til MARGIN, som er et treårig forskningsprosjekt
gjennomført av Kongsberg Maritime, Noca, Roxar og Fugro OCEANOR (Fugro), i samarbeid
med SINTEF, HiST og NCEI-klyngen. Masteroppgaven er også en fortsettelse av et
fordypningsprosjekt skrevet av forfatterne høsten 2011. I fordypningsprosjektet ble Fugro valgt
som samarbeidspartner. Dette samarbeidet er videreført i denne masteroppgaven.
I tråd med MARGIN-prosjektets retningslinjer og et identifisert teoretisk gap med hensyn til
produksjonssituasjonen engineer-to-order (ETO), ønsket vi å undersøke hvordan
innkjøpsfunksjonens nivå av sofistikering (level of purchasing sophistication) påvirker bruken av
porteføljetilnærminger for innkjøp (purchasing portfolio approaches) i norske ETO-bedrifter. For å
svare på dette forskningsproblemet, har vi gjennomført tre litteraturstudier og benyttet oss av
blandede forskningsmetoder (mixed methods research). I forhold til de blandede
forskningsmetodene, har vi gjennomført kvalitativ aksjonsforskning (action research) og kvantitativ
spørreundersøkelse (survey research). Litteraturstudiene om porteføljetilnærminger for innkjøp og
ETO ble gjennomført i løpet av høsten 2011, og er videreutviklet i denne masteroppgaven.
Fordypningsprosjektet motiverte et behov for videre forskning men hensyn til
innkjøpsfunksjonens nivå av sofistikering. Et litteraturstudie om innkjøpsfunksjonens nivå av
sofistikering er derfor gjennomført i denne masteroppgaven. Funn fra litteraturstudiene ble
brukt til å lage et teoretisk rammeverk. Etter innhenting av empiriske data, ble dette
rammeverket videreutviklet med kunnskap tilegnet gjennom både spørreundersøkelse og
aksjonsforskning. Dette videreutviklede rammeverket ble deretter brukt for å analysere
sammenhengene mellom emnene porteføljetilnærminger for innkjøp, innkjøpsfunksjonens nivå
av sofistikering og ETO.
Spørreundersøkelsen avdekket to statistisk signifikante sammenhenger mellom
porteføljetilnærminger for innkjøp og innkjøpsfunksjonens nivå av sofistikering. For det første,
ble bruken av porteføljetilnærminger for innkjøp funnet å ha et signifikant forhold til det å ha en
innkjøpsstrategi (sourcing strategy). Det å ha en innkjøpsstrategi viste seg videre å være relatert til et
signifikant høyere nivå av innkjøpsfunksjonens sofistikering. For det andre, viste bruken av
porteføljetilnærminger for innkjøp å indikere et statistisk signifikant forhold til ferdighetene til
innkjøperne (skills of the purchasing professionals), hvor sistnevnte er identifisert som en dimensjon
av innkjøpsfunksjonens nivå av sofistikering. Basert på disse funnene, argumenterte vi for at
bruken av porteføljetilnærminger for innkjøp kan føre til et høyere nivå av sofistikering i
innkjøpsfunksjonen – både ved å etablere innkjøpsstrategier og fasilitere utvikling av
ferdighetene til innkjøperne. Deretter gjorde funn fra aksjonsforskningen at vi kunne utvikle en
segmenteringsmodell, som skiller mellom de mest kjente porteføljetilnærmingene for innkjøp
basert på relevante karakteristika av innkjøpsfunksjonens nivå av sofistikering. Slik utviklet vi et
verktøy for å velge en egnet porteføljetilnærming for innkjøp, gitt et selskaps nivå av
sofistikering i innkjøpsfunksjonen.
Når vi undersøkte sammenhengen mellom innkjøpsfunksjonens nivå av sofistikering og
produksjonssituasjonen ETO, brukte vi funn både fra spørreundersøkelsen og
aksjonsforskningen for å evaluere nivå av sofistikering i et ETO-selskaps innkjøpsfunksjon.
Norwegian summary
vii
Denne evalueringen ble videre benyttet da vi undersøkte sammenhengen mellom
porteføljetilnærminger for innkjøp og produksjonssituasjonen ETO. Her avdekket
spørreundersøkelsen og aksjonsforskningen flere fordeler ved å bruke porteføljetilnærminger for
innkjøp, for et ETO-selskap. Som følge av dette, så brukte vi den tidligere utviklede
segmenteringsmodellen, og anbefalte en porteføljetilnærming for innkjøp ved å inkorporere et
hensyn til innkjøpsfunksjonens nivå av sofistikering i ETO-selskaper. Dette gjorde at vi foreslo
at et ETO-selskap, men liknende karakteristikker som Fugro, bør bruke porteføljetilnærmingen
for innkjøp av van Weele (2010). I tillegg muliggjorde funn fra aksjonsforskningen at vi kunne
modifisere denne tilnærmingen, for å ta hensyn til identifisere maktforhold for ETO-selskaper
med liknende karakteristikker som Fugro. Disse funnene fra aksjonsforskningen gjorde også at
vi kunne etablere retningslinjer for bruk av denne porteføljetilnærmingen for innkjøp.
Oppsummert har vi etablert et forhold mellom porteføljetilnærminger for innkjøp,
innkjøpsfunksjonens nivå av sofistikering og ETO. På denne måten har vi på en omstendelig og
ryddig måte oppnådd hensikten ved denne masteroppgaven.
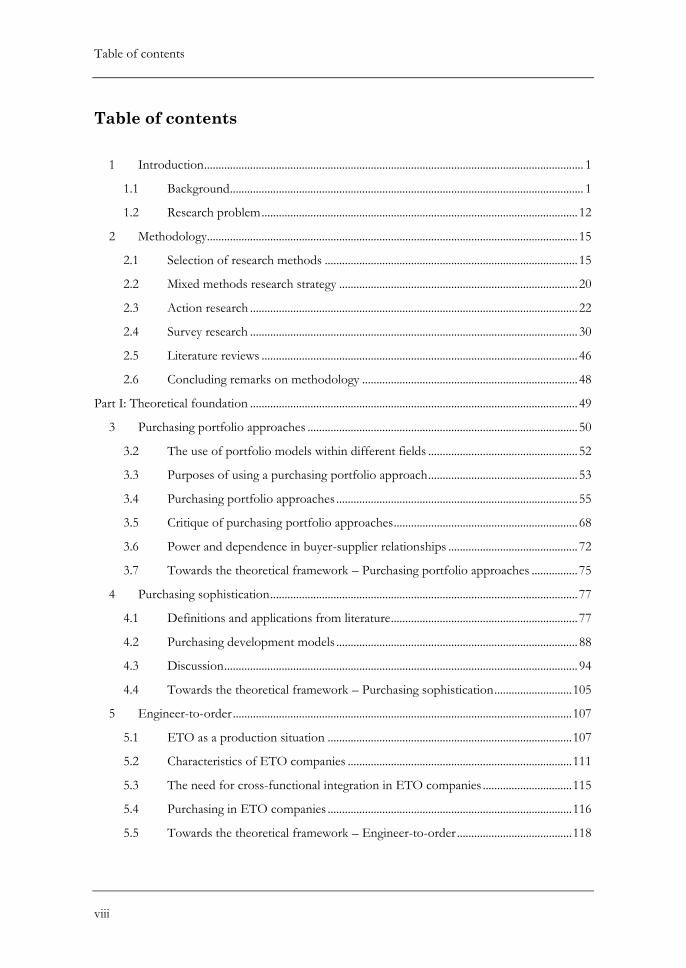
Table of contents
viii
Table of contents
1 Introduction .................................................................................................................................... 1
1.1 Background........................................................................................................................... 1
1.2 Research problem .............................................................................................................. 12
2 Methodology................................................................................................................................. 15
2.1 Selection of research methods ........................................................................................ 15
2.2 Mixed methods research strategy ................................................................................... 20
2.3 Action research .................................................................................................................. 22
2.4 Survey research .................................................................................................................. 30
2.5 Literature reviews .............................................................................................................. 46
2.6 Concluding remarks on methodology ........................................................................... 48
Part I: Theoretical foundation .................................................................................................................. 49
3 Purchasing portfolio approaches .............................................................................................. 50
3.2 The use of portfolio models within different fields .................................................... 52
3.3 Purposes of using a purchasing portfolio approach .................................................... 53
3.4 Purchasing portfolio approaches .................................................................................... 55
3.5 Critique of purchasing portfolio approaches ................................................................ 68
3.6 Power and dependence in buyer-supplier relationships ............................................. 72
3.7 Towards the theoretical framework – Purchasing portfolio approaches ................ 75
4 Purchasing sophistication ........................................................................................................... 77
4.1 Definitions and applications from literature ................................................................. 77
4.2 Purchasing development models .................................................................................... 88
4.3 Discussion ........................................................................................................................... 94
4.4 Towards the theoretical framework – Purchasing sophistication ........................... 105
5 Engineer-to-order ...................................................................................................................... 107
5.1 ETO as a production situation ..................................................................................... 107
5.2 Characteristics of ETO companies .............................................................................. 111
5.3 The need for cross-functional integration in ETO companies ............................... 115
5.4 Purchasing in ETO companies ..................................................................................... 116
5.5 Towards the theoretical framework – Engineer-to-order ........................................ 118
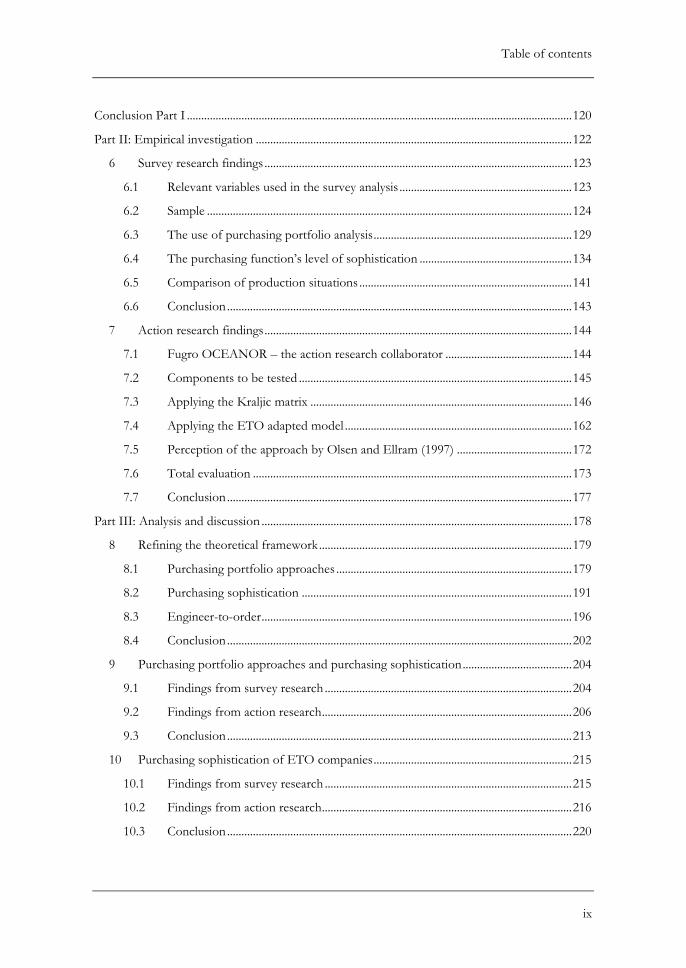
Table of contents
ix
Conclusion Part I ...................................................................................................................................... 120
Part II: Empirical investigation .............................................................................................................. 122
6 Survey research findings ........................................................................................................... 123
6.1 Relevant variables used in the survey analysis ............................................................ 123
6.2 Sample ............................................................................................................................... 124
6.3 The use of purchasing portfolio analysis ..................................................................... 129
6.4 The purchasing function’s level of sophistication ..................................................... 134
6.5 Comparison of production situations .......................................................................... 141
6.6 Conclusion ........................................................................................................................ 143
7 Action research findings ........................................................................................................... 144
7.1 Fugro OCEANOR – the action research collaborator ............................................ 144
7.2 Components to be tested ............................................................................................... 145
7.3 Applying the Kraljic matrix ........................................................................................... 146
7.4 Applying the ETO adapted model ............................................................................... 162
7.5 Perception of the approach by Olsen and Ellram (1997) ........................................ 172
7.6 Total evaluation ............................................................................................................... 173
7.7 Conclusion ........................................................................................................................ 177
Part III: Analysis and discussion ............................................................................................................ 178
8 Refining the theoretical framework ........................................................................................ 179
8.1 Purchasing portfolio approaches .................................................................................. 179
8.2 Purchasing sophistication .............................................................................................. 191
8.3 Engineer-to-order ............................................................................................................ 196
8.4 Conclusion ........................................................................................................................ 202
9 Purchasing portfolio approaches and purchasing sophistication ...................................... 204
9.1 Findings from survey research ...................................................................................... 204
9.2 Findings from action research ....................................................................................... 206
9.3 Conclusion ........................................................................................................................ 213
10 Purchasing sophistication of ETO companies ..................................................................... 215
10.1 Findings from survey research ...................................................................................... 215
10.2 Findings from action research ....................................................................................... 216
10.3 Conclusion ........................................................................................................................ 220
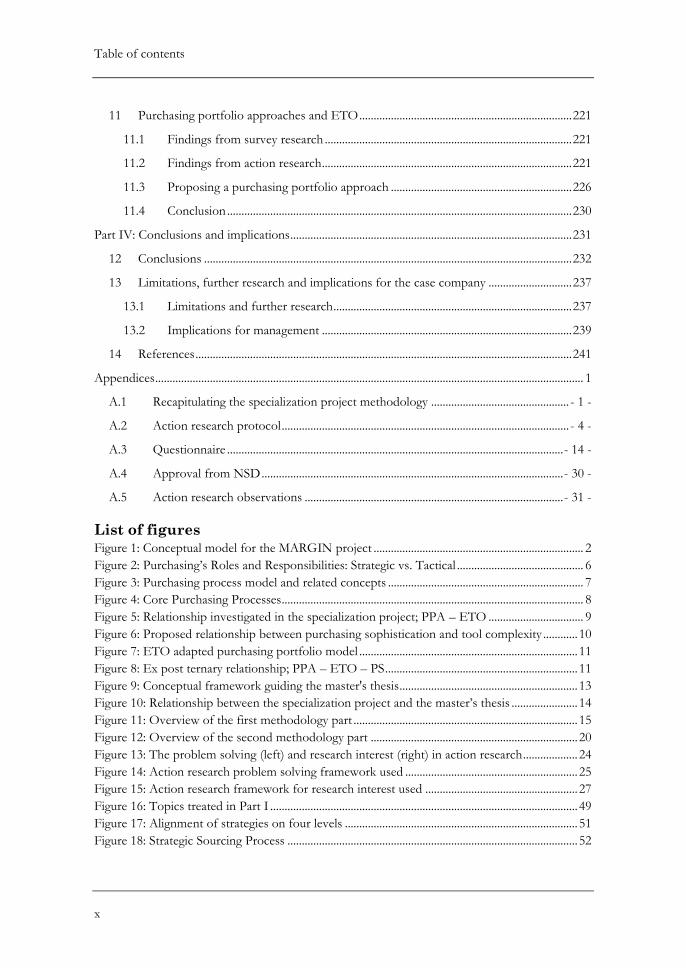
Table of contents
x
11 Purchasing portfolio approaches and ETO .......................................................................... 221
11.1 Findings from survey research ...................................................................................... 221
11.2 Findings from action research ....................................................................................... 221
11.3 Proposing a purchasing portfolio approach ............................................................... 226
11.4 Conclusion ........................................................................................................................ 230
Part IV: Conclusions and implications .................................................................................................. 231
12 Conclusions ................................................................................................................................ 232
13 Limitations, further research and implications for the case company ............................. 237
13.1 Limitations and further research ................................................................................... 237
13.2 Implications for management ....................................................................................... 239
14 References ................................................................................................................................... 241
Appendices ..................................................................................................................................................... 1
A.1 Recapitulating the specialization project methodology ................................................ - 1 -
A.2 Action research protocol .................................................................................................... - 4 -
A.3 Questionnaire ..................................................................................................................... - 14 -
A.4 Approval from NSD ......................................................................................................... - 30 -
A.5 Action research observations .......................................................................................... - 31 -
List of figures
Figure 1: Conceptual model for the MARGIN project ......................................................................... 2 Figure 2: Purchasing’s Roles and Responsibilities: Strategic vs. Tactical ............................................ 6 Figure 3: Purchasing process model and related concepts .................................................................... 7 Figure 4: Core Purchasing Processes......................................................................................................... 8 Figure 5: Relationship investigated in the specialization project; PPA – ETO ................................. 9 Figure 6: Proposed relationship between purchasing sophistication and tool complexity ............ 10 Figure 7: ETO adapted purchasing portfolio model ............................................................................ 11 Figure 8: Ex post ternary relationship; PPA – ETO – PS ................................................................... 11 Figure 9: Conceptual framework guiding the master's thesis.............................................................. 13 Figure 10: Relationship between the specialization project and the master’s thesis ....................... 14 Figure 11: Overview of the first methodology part .............................................................................. 15 Figure 12: Overview of the second methodology part ........................................................................ 20 Figure 13: The problem solving (left) and research interest (right) in action research................... 24 Figure 14: Action research problem solving framework used ............................................................ 25 Figure 15: Action research framework for research interest used ..................................................... 27 Figure 16: Topics treated in Part I ........................................................................................................... 49 Figure 17: Alignment of strategies on four levels ................................................................................. 51 Figure 18: Strategic Sourcing Process ..................................................................................................... 52
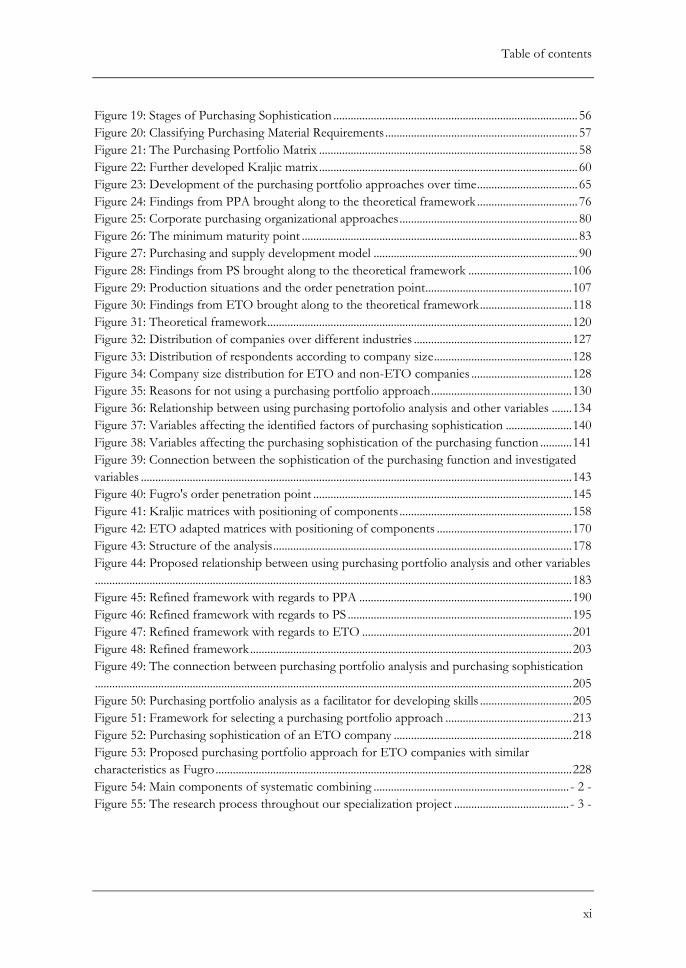
Table of contents
xi
Figure 19: Stages of Purchasing Sophistication ..................................................................................... 56 Figure 20: Classifying Purchasing Material Requirements ................................................................... 57 Figure 21: The Purchasing Portfolio Matrix .......................................................................................... 58 Figure 22: Further developed Kraljic matrix .......................................................................................... 60 Figure 23: Development of the purchasing portfolio approaches over time ................................... 65 Figure 24: Findings from PPA brought along to the theoretical framework ................................... 76 Figure 25: Corporate purchasing organizational approaches .............................................................. 80 Figure 26: The minimum maturity point ................................................................................................ 83 Figure 27: Purchasing and supply development model ....................................................................... 90 Figure 28: Findings from PS brought along to the theoretical framework .................................... 106 Figure 29: Production situations and the order penetration point................................................... 107 Figure 30: Findings from ETO brought along to the theoretical framework ................................ 118 Figure 31: Theoretical framework .......................................................................................................... 120 Figure 32: Distribution of companies over different industries ....................................................... 127 Figure 33: Distribution of respondents according to company size ................................................ 128 Figure 34: Company size distribution for ETO and non-ETO companies ................................... 128 Figure 35: Reasons for not using a purchasing portfolio approach ................................................. 130 Figure 36: Relationship between using purchasing portofolio analysis and other variables ....... 134 Figure 37: Variables affecting the identified factors of purchasing sophistication ....................... 140 Figure 38: Variables affecting the purchasing sophistication of the purchasing function ........... 141 Figure 39: Connection between the sophistication of the purchasing function and investigated
variables ...................................................................................................................................................... 143 Figure 40: Fugro's order penetration point .......................................................................................... 145 Figure 41: Kraljic matrices with positioning of components ............................................................ 158 Figure 42: ETO adapted matrices with positioning of components ............................................... 170 Figure 43: Structure of the analysis ........................................................................................................ 178 Figure 44: Proposed relationship between using purchasing portfolio analysis and other variables
...................................................................................................................................................................... 183 Figure 45: Refined framework with regards to PPA .......................................................................... 190 Figure 46: Refined framework with regards to PS .............................................................................. 195 Figure 47: Refined framework with regards to ETO ......................................................................... 201 Figure 48: Refined framework ................................................................................................................ 203 Figure 49: The connection between purchasing portfolio analysis and purchasing sophistication
...................................................................................................................................................................... 205 Figure 50: Purchasing portfolio analysis as a facilitator for developing skills ................................ 205 Figure 51: Framework for selecting a purchasing portfolio approach ............................................ 213 Figure 52: Purchasing sophistication of an ETO company .............................................................. 218 Figure 53: Proposed purchasing portfolio approach for ETO companies with similar
characteristics as Fugro ............................................................................................................................ 228 Figure 54: Main components of systematic combining .................................................................... - 2 - Figure 55: The research process throughout our specialization project ........................................ - 3 -
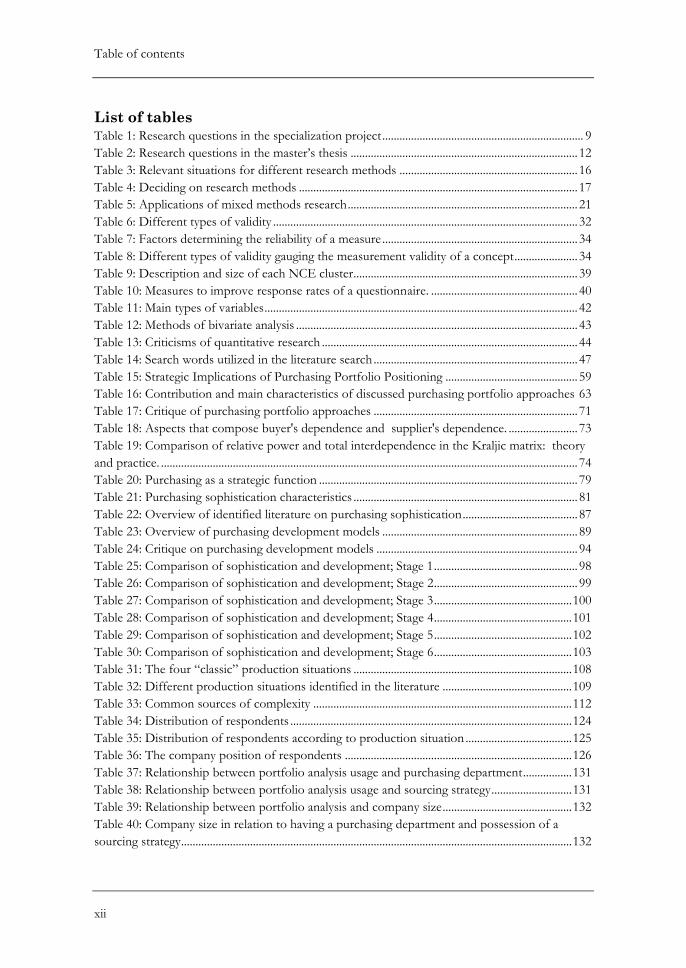
Table of contents
xii
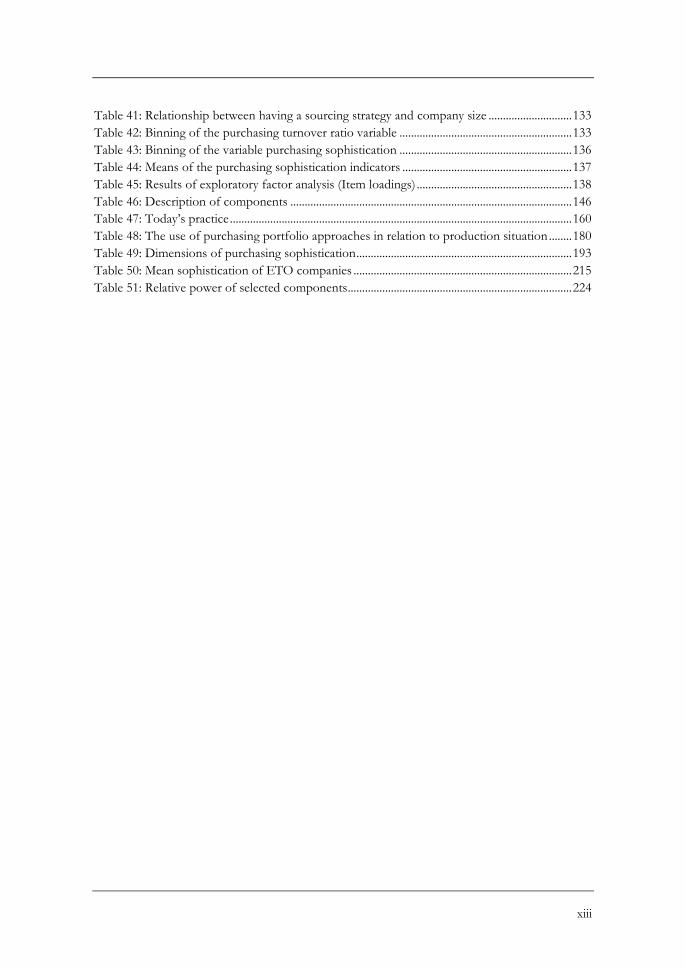
List of tables
Table 1: Research questions in the specialization project ...................................................................... 9 Table 2: Research questions in the master’s thesis ............................................................................... 12 Table 3: Relevant situations for different research methods .............................................................. 16 Table 4: Deciding on research methods ................................................................................................. 17 Table 5: Applications of mixed methods research ................................................................................ 21 Table 6: Different types of validity .......................................................................................................... 32 Table 7: Factors determining the reliability of a measure .................................................................... 34 Table 8: Different types of validity gauging the measurement validity of a concept ...................... 34 Table 9: Description and size of each NCE cluster.............................................................................. 39 Table 10: Measures to improve response rates of a questionnaire. ................................................... 40 Table 11: Main types of variables ............................................................................................................. 42 Table 12: Methods of bivariate analysis .................................................................................................. 43 Table 13: Criticisms of quantitative research ......................................................................................... 44 Table 14: Search words utilized in the literature search ....................................................................... 47 Table 15: Strategic Implications of Purchasing Portfolio Positioning .............................................. 59 Table 16: Contribution and main characteristics of discussed purchasing portfolio approaches 63 Table 17: Critique of purchasing portfolio approaches ....................................................................... 71 Table 18: Aspects that compose buyer's dependence and supplier's dependence. ........................ 73 Table 19: Comparison of relative power and total interdependence in the Kraljic matrix: theory
and practice. ................................................................................................................................................. 74 Table 20: Purchasing as a strategic function .......................................................................................... 79 Table 21: Purchasing sophistication characteristics .............................................................................. 81 Table 22: Overview of identified literature on purchasing sophistication ........................................ 87 Table 23: Overview of purchasing development models .................................................................... 89 Table 24: Critique on purchasing development models ...................................................................... 94 Table 25: Comparison of sophistication and development; Stage 1 .................................................. 98 Table 26: Comparison of sophistication and development; Stage 2 .................................................. 99 Table 27: Comparison of sophistication and development; Stage 3 ................................................ 100 Table 28: Comparison of sophistication and development; Stage 4 ................................................ 101 Table 29: Comparison of sophistication and development; Stage 5 ................................................ 102 Table 30: Comparison of sophistication and development; Stage 6 ................................................ 103 Table 31: The four “classic” production situations ............................................................................ 108 Table 32: Different production situations identified in the literature ............................................. 109 Table 33: Common sources of complexity .......................................................................................... 112 Table 34: Distribution of respondents .................................................................................................. 124 Table 35: Distribution of respondents according to production situation ..................................... 125 Table 36: The company position of respondents ............................................................................... 126 Table 37: Relationship between portfolio analysis usage and purchasing department................. 131 Table 38: Relationship between portfolio analysis usage and sourcing strategy ............................ 131 Table 39: Relationship between portfolio analysis and company size ............................................. 132 Table 40: Company size in relation to having a purchasing department and possession of a
sourcing strategy ........................................................................................................................................ 132
xiii
Table 41: Relationship between having a sourcing strategy and company size ............................. 133 Table 42: Binning of the purchasing turnover ratio variable ............................................................ 133 Table 43: Binning of the variable purchasing sophistication ............................................................ 136 Table 44: Means of the purchasing sophistication indicators ........................................................... 137 Table 45: Results of exploratory factor analysis (Item loadings) ...................................................... 138 Table 46: Description of components .................................................................................................. 146 Table 47: Today’s practice ....................................................................................................................... 160 Table 48: The use of purchasing portfolio approaches in relation to production situation ........ 180 Table 49: Dimensions of purchasing sophistication ........................................................................... 193 Table 50: Mean sophistication of ETO companies ............................................................................ 215 Table 51: Relative power of selected components.............................................................................. 224

Introduction
1
1 Introduction This introduction serves two main purposes. First, the background for this master’s thesis will
be presented, to provide the reader with necessary contextual information. Second, the problem
to be analyzed, motivated by elements elucidated in the background, is described. After a
succeeding chapter on methodology, the document comprises four main parts: Theoretical
foundation; Empirical investigation; Analysis and discussion; and, Conclusions and implications.
We refer to the table of contents for a more detailed overview of the document structure.
1.1 Background
This section provides the reader with the necessary contextual information for this master’s
thesis. First, information about the authors is provided, as we believe that our theoretical
background has shaped the scope of this master’s thesis. Thereafter a description of the
MARGIN research project is given, as a means to provide the reader with insight in how this
master’s thesis contributes to the research project. A brief discussion on the concepts of
customization, the closely related engineer-to-order production situation and the evolution of
purchasing’s importance, elucidated by literature on the subjects, will provide the reader with
insight necessary to follow the subsequent discussions. This is followed by a description of the
roles and responsibilities of the purchasing function. Finally, a summary of the specialization
project written by the authors in fall 2011 is provided, as it constituted our point of departure
for writing this master’s thesis.
1.1.1 About the authors
This master’s thesis is written by Mads Veilemand Holstad, Børge Sjøbakk and Fredrik Dehnæs
Stokke. The authors are students at the Department of Industrial Economics and Technology
Management (IØT) at the Norwegian University of Science and Technology (NTNU). The IØT
study programme consists of 40 % technological courses, 20 % methodology courses (e.g.
mathematics, statistics and physics), and approximately 40 % economical/administrative
courses, providing students with an interdisciplinary theoretical background (NTNU, 2012). All
three authors attend the Strategic Purchasing and Supply Management specialization course,
constituting the economical/administrative part of the study, whereas the authors’ technical
background is from the Department of Production and Quality Engineering (IPK).
Courses under the auspices of IPK have provided us with insight into production and supply
chain management, with a special focus on operational and tactical challenges. Further, the
Strategic Purchasing and Supply Management specialization course has given us insight in
purchasing and supply management at a strategic level. With the goal of utilizing our theoretical
background, we have chosen to write about strategic purchasing tools in production companies;
more specifically engineer-to-order (ETO) companies. As such, we draw on knowledge acquired
both in technical courses and more administrative/economical courses, which has definitely
influenced the scope of this master’s thesis. In the next subsection, the MARGIN research
project is introduced. As will be shown, our theoretical background has dictated which research
area within MARGIN this master’s thesis is a contribution to.
Introduction
2
1.1.2 The MARGIN research project
Norway, and especially Mid-Norway, has a strong and important tradition as an industrial actor
(MARGIN, 2011a). Small and medium-sized Mid-Norwegian suppliers, particularly in the
technology sector, have in the recent years increased their focus on export towards global
markets (NHO Trøndelag, 2011). Particularly, actors in the maritime industry are experiencing a
shift in their main markets to the East (Maritim21, 2010). Intensification of the global
competition puts Mid-Norwegian suppliers to the test. To secure their competitiveness,
solutions for efficient production processes in more integrated and responsive supply chains
must be developed (MARGIN, 2011b). This forms the basis for the research project MARGIN.
MARGIN is a three-year research project conducted by Kongsberg Maritime, Noca, Roxar and
Fugro OCEANOR, in collaboration with SINTEF, Sør-Trøndelag University College (HiST)
and the NCEI (Norwegian Centre of Expertise Instrumentation) cluster. The project’s aim is to
develop integrated and responsive supply chains among actors in the Mid-Norwegian maritime
supplier industry. There are four main research areas in the project: (1) Supplier collaboration
and management; (2) efficient and responsive production; (3) new business models for the after-
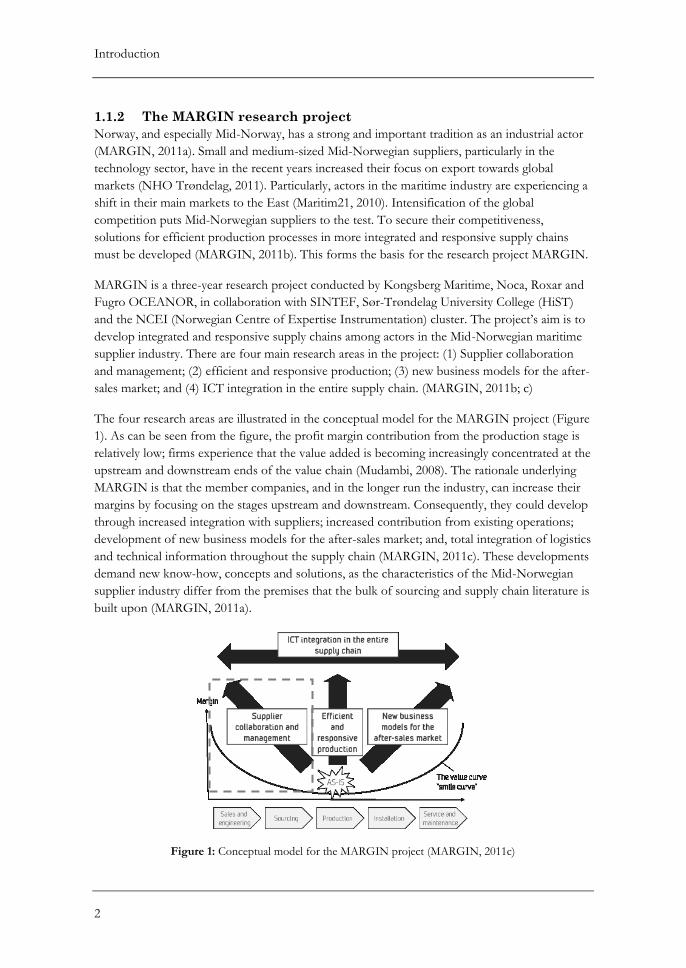
sales market; and (4) ICT integration in the entire supply chain. (MARGIN, 2011b; c)
The four research areas are illustrated in the conceptual model for the MARGIN project (Figure
1). As can be seen from the figure, the profit margin contribution from the production stage is
relatively low; firms experience that the value added is becoming increasingly concentrated at the
upstream and downstream ends of the value chain (Mudambi, 2008). The rationale underlying
MARGIN is that the member companies, and in the longer run the industry, can increase their
margins by focusing on the stages upstream and downstream. Consequently, they could develop
through increased integration with suppliers; increased contribution from existing operations;
development of new business models for the after-sales market; and, total integration of logistics
and technical information throughout the supply chain (MARGIN, 2011c). These developments
demand new know-how, concepts and solutions, as the characteristics of the Mid-Norwegian
supplier industry differ from the premises that the bulk of sourcing and supply chain literature is
built upon (MARGIN, 2011a).
Figure 1: Conceptual model for the MARGIN project (MARGIN, 2011c)
Introduction
3
Given the authors’ background (1.1.1), the scope of this master’s thesis lies at the upstream side
of Figure 1; covering the research area “supplier collaboration and management”. As such, the
master’s thesis contributes to one of four research areas in MARGIN, supplementing other
master’s theses that cover the remaining research areas. In fall 2011, the authors executed a
specialization project concerning purchasing portfolio approaches to sourcing strategies in ETO
companies, which this master’s thesis is a continuation of (this is further described in 1.1.6 and
1.2). In the specialization project Fugro OCEANOR (hereafter: Fugro) was, as a result of a
discussion between SINTEF, the course staff and the authors, chosen as a collaborator. This
was mainly due to the fact that Fugro could be classified as an ETO company. This
collaboration is continued throughout the master’s thesis, as ETO still is a topic of research. In
order to motivate this, a theory gap with respect to literature on ETO is presented in the next
subsection on customization.
1.1.3 Customization
In their 1996 article “Customizing customization”, Lampel and Mintzberg conclude, on the
basis of a comprehensive literature review, that “a flood of recent publications attest to the
widespread belief that we are in the midst of a fundamental technological change in
manufacturing, communication, distribution and retailing – a virtual renaissance of
customization” (p.28). Fredriksson and Gadde (2005) find that more recent literature reviews
show a continuance of the attention to customization. They claim that the increasing interest in
customization can partly be explained by the fact that customers demand highly customized
products and services, and partly by its marketing drive; it is claimed to improve the competitive
position of the company. This is also supported by Gunasekaran and Ngai (2005), who claim
that today’s market environment is characterized by diverse customer preferences, rapid
technological developments and globalization. They argue that these factors have resulted in a
need to offer a variety of products, constituting challenges to production managers.
There is a variety of production situations that can be used to meet demand. Some companies
anticipate customers’ orders based on forecasts and produce to stock, whereas other
manufacture in response to customers’ orders. Increasingly, firms try to achieve mass
customization, that is, the production and distribution of customized goods and services on a
mass basis (Alfnes and Strandhagen, 2000). According to Amaro et al. (1999), customized
products, whatever the degree of customization, can only be made, or at least finished, to order.
An extreme case with respect to degree of customization is the engineer-to-order (ETO) production
situation, in which highly customized products have to be designed and engineered according to
the specifications in the order placed by the customer (Pandit and Zhu, 2007).
Amaro et al. (1999) find that most of the published research in the operations management area
has treated all companies the same; as make-to-stock (MTS) companies. Hicks et al. (2000) draw
the same conclusion, and find that there is limited research into operations and supply chain
management in the ETO sector. In a more recent article, Gosling and Naim (2009) argue that
“while the term ETO is used in the literature confusion exists as to the appropriate definitions
for this type of operation and the appropriate strategies” (p.741). As these preceding findings
show, there seems to be a gap in literature with regard to theory on the ETO production
Introduction
4
situation. This is also an assumption underlying the MARGIN project (Margin, 2011a). In order
to close some of the ETO theory gap, the focus in this thesis lies on purchasing and its ability to
act as a strategic function in ETO companies. As such, a brief summary of purchasing’s
evolution, becoming a recognized strategic function, is provided in the next subsection.
1.1.4 Purchasing and its strategic relevance
Ellram and Carr (1994) delineate the history behind strategic purchasing and literature on the
subject, pointing to episodes in history that have influenced purchasing’s strategic importance
and the consequential foci in literature. During the early 1970s, purchasing was considered to be
an administrative, rather than strategic, function; even though the oil crisis in 1973-74 and
shortages in raw materials related to it put the importance of purchasing on the agenda (Ellram
and Carr, 1994). Carter and Narasimhan (1996) found that research published as late as 1978
questioned purchasing’s contribution to corporate performance. According to Farmer (1997),
practice at the time confirmed that the diminished view of purchasing’s importance was correct,
even though he and others argued that purchasing should develop strategies consistent with
corporate strategy (e.g., Farmer, 1978). Top management did, however, not see the need for this;
bureaucratic organization structures and the fact that people were recruited to undertake the
tasks that fitted the old perception from the late 1960s – that purchasing was a service to
production – perpetuated a status quo (Farmer, 1997).
During the 1980s, however, there was a shifting attitude toward purchasing’s role in corporate
strategies (Ellram and Carr, 1994). In 1983, Kraljic’s seminal paper “Purchasing Must Become
Supply Management” was published in Harvard Business Review. According to Kraljic (1983),
the purchasing function in many companies was characterized by routine; “many purchasing
managers’ skills and outlooks were formed 20 years ago in an era of relative stability, and they
haven’t changed” (p.109). He claimed that management must learn to make things happen to its
own advantage, instead of monitoring current developments, and argued that “this calls for
nothing less than a total change of perspective: from purchasing (an operating function) to
supply management (a strategic one)” (Kraljic, 1983, p.110). In line with this, firms throughout
the 1980s began to realize the impact the purchasing function can have on their competitive
position (Carter and Narasimhan, 1996). Phrases such as ‘a 1 per cent saving in purchasing is
equal to a 10 per cent increase in sales’ were used to uplift its importance (Cousins et al., 2008, p.
8), displaying an economic reason for purchasing’s importance.
Ellram and Carr (1994) point out that the focus during the early 1990s was on the means by
which the purchasing function can work to become recognized as a more notable contributor to
firms’ success. This indicates a further strengthening of purchasing as a strategic function, as the
question no longer was whether purchasing was to be a strategic function, but rather how to
achieve this. According to Trent and Monczka (1998), there was almost a total reversal of the
belief of purchasing as a mere administrative, non-strategic function during the 1990s, as
purchasing received attention and respect of executive managers.
In the later years, some researchers have still challenged purchasing’s strategic importance.
Carter and Narasimhan (1996) ask whether purchasing has an impact on corporate performance,
Introduction
5
and if it really is strategic. Through site visits by an ad hoc committee of senior executives, and a
thorough questionnaire, they conclude that purchasing indeed is strategic. However, Ramsay
(2001) uses the resource based view (RBV) to argue that purchasing is not strategically relevant.
He concludes that “it may be stated, with confidence, that purchasing activities are intrinsically
operational rather than strategic in nature” (Ramsay, 2001, p.261). Mol (2003) rejects this
conclusion in his response to Ramsay’s article, pointing out that there is a wider theoretical base
underlying strategic management and developments in the RBV that suggest that purchasing is
indeed a strategic activity. In a recent response to the article by Ramsay (2001), Barney (2012)
argues that “resource-based theory suggests that purchasing and supply chain management will
often have the attributes that can enable them to be sources of sustained competitive advantage”
(p.3). Today, in general, it is agreed that purchasing has evolved from a mere clerical buying
function into a strategic business function (e.g. Gelderman and van Weele, 2005; Cousins et al.,
2008) – it has moved “from the backroom to the boardroom” (van Weele, 2011). In addition to
strategic congruence, economics is still a prominent reason for purchasing’s importance
(Cousins et al., 2008; Monczka et al., 2011). According to Ellram (1996) purchasing
expenditures, as a percentage of an organization’s revenues, average 63 per cent in
manufacturing companies. Further, van Weele (2010) finds that the purchasing value in relation
to costs of goods sold is approximately 50 per cent. Hence, as the purchasing-to-sales ratio
increases, purchasing decisions will have a more profound impact on net results (van Weele,
2010). This is also recognized by Carr and Pearson (1999), as they find that strategic purchasing
has a positive impact on firms’ financial performance.
According to Cousins et al. (2008), a “part of the redefinition of purchasing as an important and
strategic process has been to differentiate between purchasing operations, purchasing strategy
and purchasing as a strategic function” (p.13). Clearly inspired by Ellram and Carr (1994) they
make a distinction between purchasing operations, the day-to-day buying activities of the firm;
purchasing strategy, the specific actions of the function to achieve its goals; and purchasing as a
strategic function, when the activities and strategies of the purchasing function are aligned with the
overall strategies of the firm. Ellram and Carr (1994) stress the criticality of making such a
distinction, as purchasing might pursue its own operating strategies independently, with success,
without considering the overall corporate strategy. However, “only when the activities and
strategies of the purchasing function are aligned with the overall strategies of the firm can
purchasing be a strategic function” (Cousins et al., 2008, p. 13).
Even though purchasing is regarded to be a strategic function, it still has both tactical and
operational responsibilities (Monczka et al., 2011). As a means to provide the reader with further
insight in purchasing, the next subsection provides important definitions and an overview of the
purchasing function, together with its roles and responsibilities.
1.1.5 The purchasing function
Van Weele (2010) describes purchasing as “the management of the company’s external resources
in such a way that the supply of all goods, services, capabilities and knowledge which are
necessary for running, maintaining and managing the company’s primary and support activities
is secured under the most favorable conditions”(p.3). Even though the previous subsection
Introduction
6
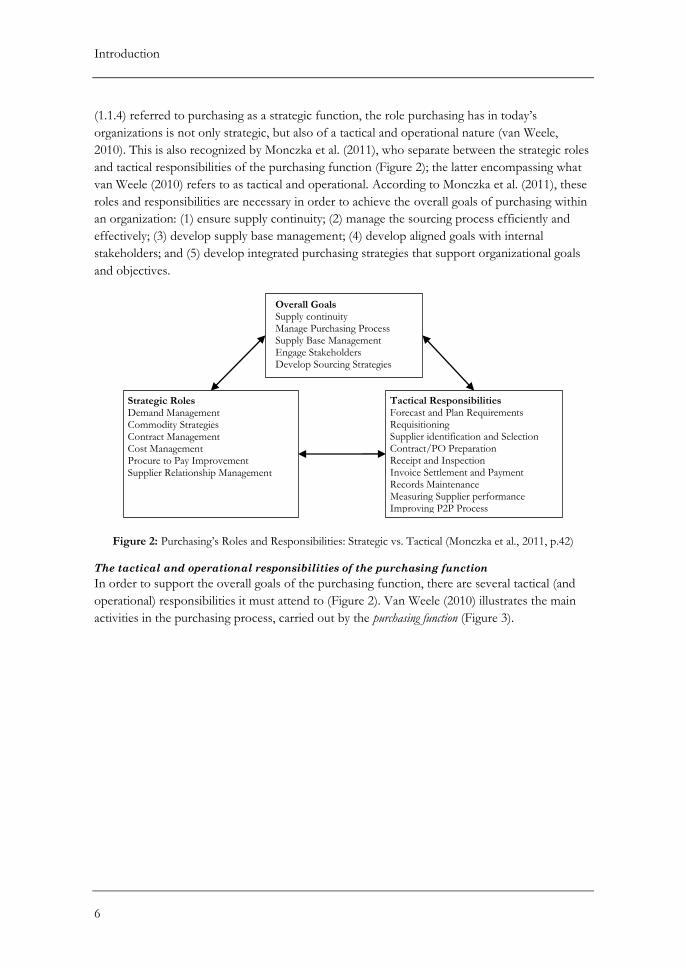
(1.1.4) referred to purchasing as a strategic function, the role purchasing has in today’s
organizations is not only strategic, but also of a tactical and operational nature (van Weele,
2010). This is also recognized by Monczka et al. (2011), who separate between the strategic roles
and tactical responsibilities of the purchasing function (Figure 2); the latter encompassing what
van Weele (2010) refers to as tactical and operational. According to Monczka et al. (2011), these
roles and responsibilities are necessary in order to achieve the overall goals of purchasing within
an organization: (1) ensure supply continuity; (2) manage the sourcing process efficiently and
effectively; (3) develop supply base management; (4) develop aligned goals with internal
stakeholders; and (5) develop integrated purchasing strategies that support organizational goals
and objectives.
Figure 2: Purchasing’s Roles and Responsibilities: Strategic vs. Tactical (Monczka et al., 2011, p.42)
The tactical and operational responsibilities of the purchasing function
In order to support the overall goals of the purchasing function, there are several tactical (and
operational) responsibilities it must attend to (Figure 2). Van Weele (2010) illustrates the main
activities in the purchasing process, carried out by the purchasing function (Figure 3).
Tactical Responsibilities Forecast and Plan Requirements Requisitioning Supplier identification and Selection Contract/PO Preparation Receipt and Inspection Invoice Settlement and Payment Records Maintenance Measuring Supplier performance Improving P2P Process
Strategic Roles Demand Management Commodity Strategies Contract Management Cost Management Procure to Pay Improvement Supplier Relationship Management
Overall Goals Supply continuity Manage Purchasing Process Supply Base Management Engage Stakeholders Develop Sourcing Strategies
Introduction
7
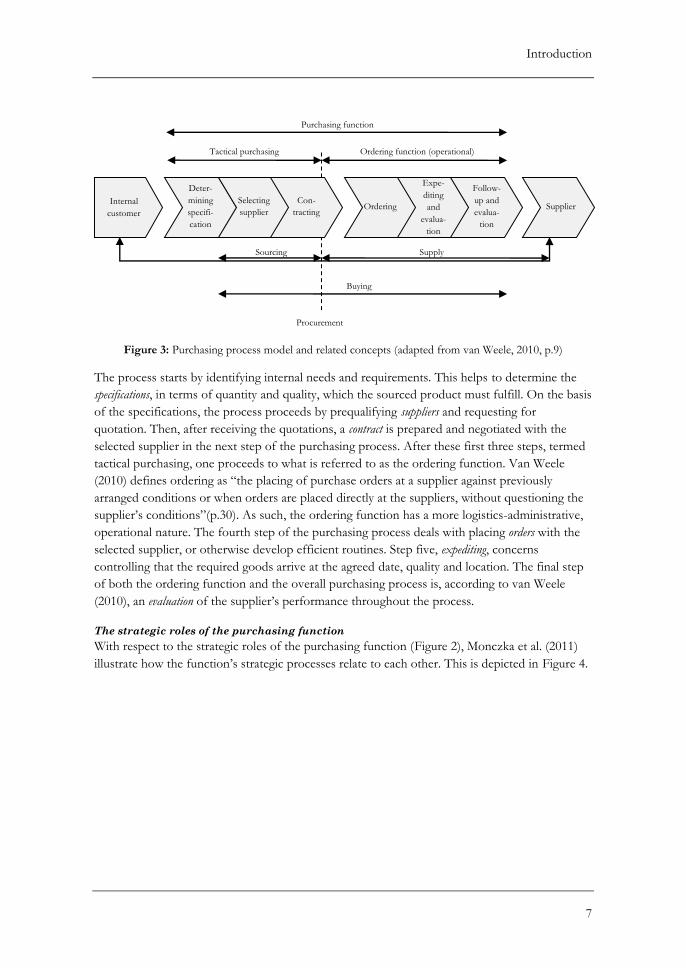
Figure 3: Purchasing process model and related concepts (adapted from van Weele, 2010, p.9)
The process starts by identifying internal needs and requirements. This helps to determine the
specifications, in terms of quantity and quality, which the sourced product must fulfill. On the basis
of the specifications, the process proceeds by prequalifying suppliers and requesting for
quotation. Then, after receiving the quotations, a contract is prepared and negotiated with the
selected supplier in the next step of the purchasing process. After these first three steps, termed
tactical purchasing, one proceeds to what is referred to as the ordering function. Van Weele
(2010) defines ordering as “the placing of purchase orders at a supplier against previously
arranged conditions or when orders are placed directly at the suppliers, without questioning the
supplier’s conditions”(p.30). As such, the ordering function has a more logistics-administrative,
operational nature. The fourth step of the purchasing process deals with placing orders with the
selected supplier, or otherwise develop efficient routines. Step five, expediting, concerns
controlling that the required goods arrive at the agreed date, quality and location. The final step
of both the ordering function and the overall purchasing process is, according to van Weele
(2010), an evaluation of the supplier’s performance throughout the process.
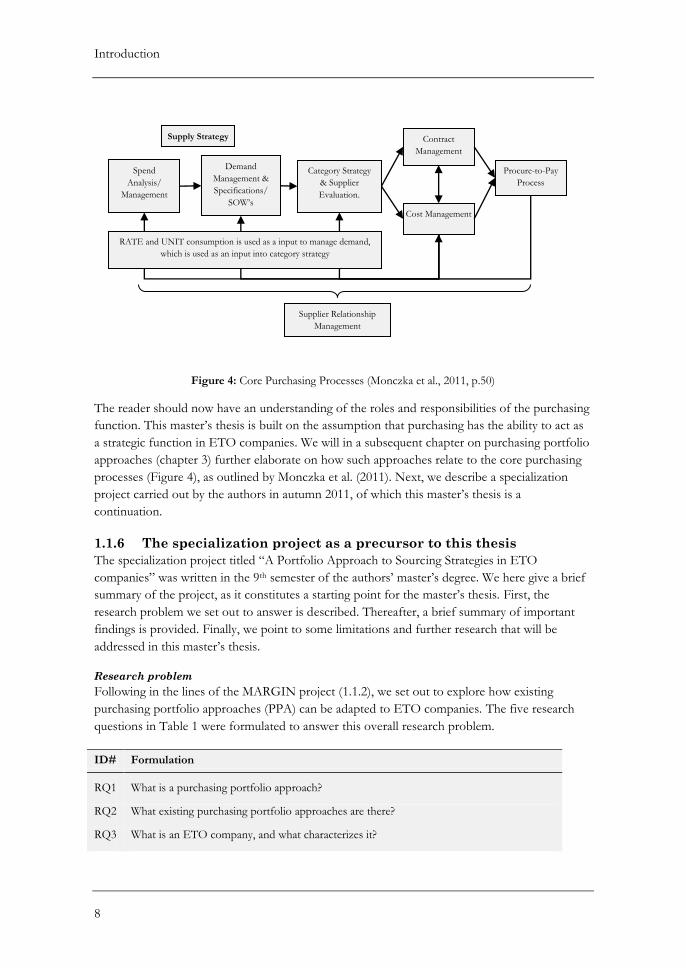
The strategic roles of the purchasing function
With respect to the strategic roles of the purchasing function (Figure 2), Monczka et al. (2011)
illustrate how the function’s strategic processes relate to each other. This is depicted in Figure 4.
Deter-
mining
specifi-
cation
Internal
customer
Selecting
supplier
Con-
tracting Ordering
Expe-
diting
and
evalua-
tion
Follow-
up and
evalua-
tion
Supplier
Purchasing function
Tactical purchasing Ordering function (operational)
Sourcing Supply
Buying
Procurement
Introduction
8
Figure 4: Core Purchasing Processes (Monczka et al., 2011, p.50)
The reader should now have an understanding of the roles and responsibilities of the purchasing
function. This master’s thesis is built on the assumption that purchasing has the ability to act as
a strategic function in ETO companies. We will in a subsequent chapter on purchasing portfolio
approaches (chapter 3) further elaborate on how such approaches relate to the core purchasing
processes (Figure 4), as outlined by Monczka et al. (2011). Next, we describe a specialization
project carried out by the authors in autumn 2011, of which this master’s thesis is a
continuation.
1.1.6 The specialization project as a precursor to this thesis
The specialization project titled “A Portfolio Approach to Sourcing Strategies in ETO
companies” was written in the 9th semester of the authors’ master’s degree. We here give a brief
summary of the project, as it constitutes a starting point for the master’s thesis. First, the
research problem we set out to answer is described. Thereafter, a brief summary of important
findings is provided. Finally, we point to some limitations and further research that will be
addressed in this master’s thesis.
Research problem
Following in the lines of the MARGIN project (1.1.2), we set out to explore how existing
purchasing portfolio approaches (PPA) can be adapted to ETO companies. The five research
questions in Table 1 were formulated to answer this overall research problem.
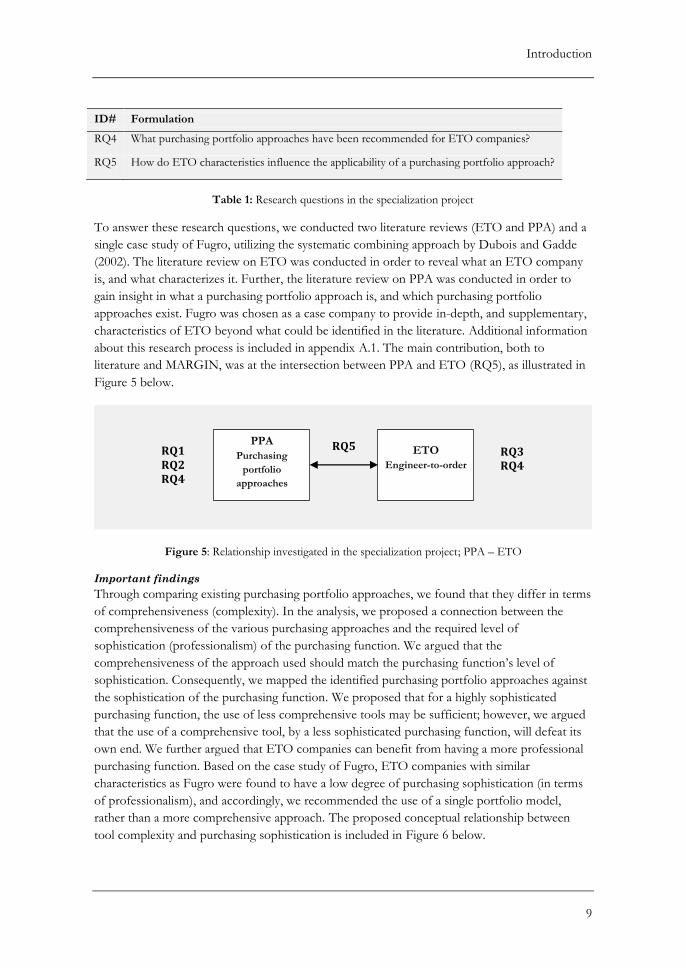
ID# Formulation
RQ1 What is a purchasing portfolio approach?
RQ2 What existing purchasing portfolio approaches are there?
RQ3 What is an ETO company, and what characterizes it?
Spend
Analysis/
Management
Demand
Management &
Specifications/
SOW’s
Category Strategy
& Supplier
Evaluation.
Contract
Management
Cost Management
Procure-to-Pay
Process
Supply Strategy
RATE and UNIT consumption is used as a input to manage demand,
which is used as an input into category strategy
Supplier Relationship
Management
Introduction
9
ID# Formulation
RQ4 What purchasing portfolio approaches have been recommended for ETO companies?
RQ5 How do ETO characteristics influence the applicability of a purchasing portfolio approach?
Table 1: Research questions in the specialization project
To answer these research questions, we conducted two literature reviews (ETO and PPA) and a
single case study of Fugro, utilizing the systematic combining approach by Dubois and Gadde
(2002). The literature review on ETO was conducted in order to reveal what an ETO company
is, and what characterizes it. Further, the literature review on PPA was conducted in order to
gain insight in what a purchasing portfolio approach is, and which purchasing portfolio
approaches exist. Fugro was chosen as a case company to provide in-depth, and supplementary,
characteristics of ETO beyond what could be identified in the literature. Additional information
about this research process is included in appendix A.1. The main contribution, both to
literature and MARGIN, was at the intersection between PPA and ETO (RQ5), as illustrated in
Figure 5 below.
Figure 5: Relationship investigated in the specialization project; PPA – ETO
Important findings
Through comparing existing purchasing portfolio approaches, we found that they differ in terms
of comprehensiveness (complexity). In the analysis, we proposed a connection between the
comprehensiveness of the various purchasing approaches and the required level of
sophistication (professionalism) of the purchasing function. We argued that the
comprehensiveness of the approach used should match the purchasing function’s level of
sophistication. Consequently, we mapped the identified purchasing portfolio approaches against
the sophistication of the purchasing function. We proposed that for a highly sophisticated
purchasing function, the use of less comprehensive tools may be sufficient; however, we argued
that the use of a comprehensive tool, by a less sophisticated purchasing function, will defeat its
own end. We further argued that ETO companies can benefit from having a more professional
purchasing function. Based on the case study of Fugro, ETO companies with similar
characteristics as Fugro were found to have a low degree of purchasing sophistication (in terms
of professionalism), and accordingly, we recommended the use of a single portfolio model,
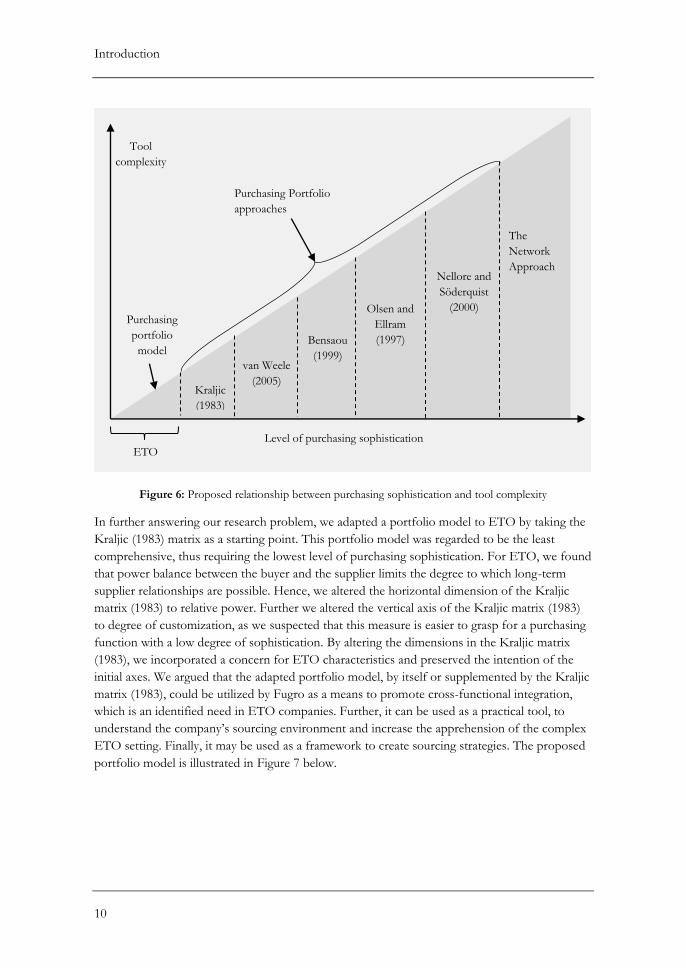
rather than a more comprehensive approach. The proposed conceptual relationship between
tool complexity and purchasing sophistication is included in Figure 6 below.
ETO
Engineer-to-order
PPA
Purchasing
portfolio
approaches
Introduction
10
Figure 6: Proposed relationship between purchasing sophistication and tool complexity
In further answering our research problem, we adapted a portfolio model to ETO by taking the
Kraljic (1983) matrix as a starting point. This portfolio model was regarded to be the least
comprehensive, thus requiring the lowest level of purchasing sophistication. For ETO, we found
that power balance between the buyer and the supplier limits the degree to which long-term
supplier relationships are possible. Hence, we altered the horizontal dimension of the Kraljic
matrix (1983) to relative power. Further we altered the vertical axis of the Kraljic matrix (1983)
to degree of customization, as we suspected that this measure is easier to grasp for a purchasing
function with a low degree of sophistication. By altering the dimensions in the Kraljic matrix
(1983), we incorporated a concern for ETO characteristics and preserved the intention of the
initial axes. We argued that the adapted portfolio model, by itself or supplemented by the Kraljic
matrix (1983), could be utilized by Fugro as a means to promote cross-functional integration,
which is an identified need in ETO companies. Further, it can be used as a practical tool, to
understand the company’s sourcing environment and increase the apprehension of the complex
ETO setting. Finally, it may be used as a framework to create sourcing strategies. The proposed
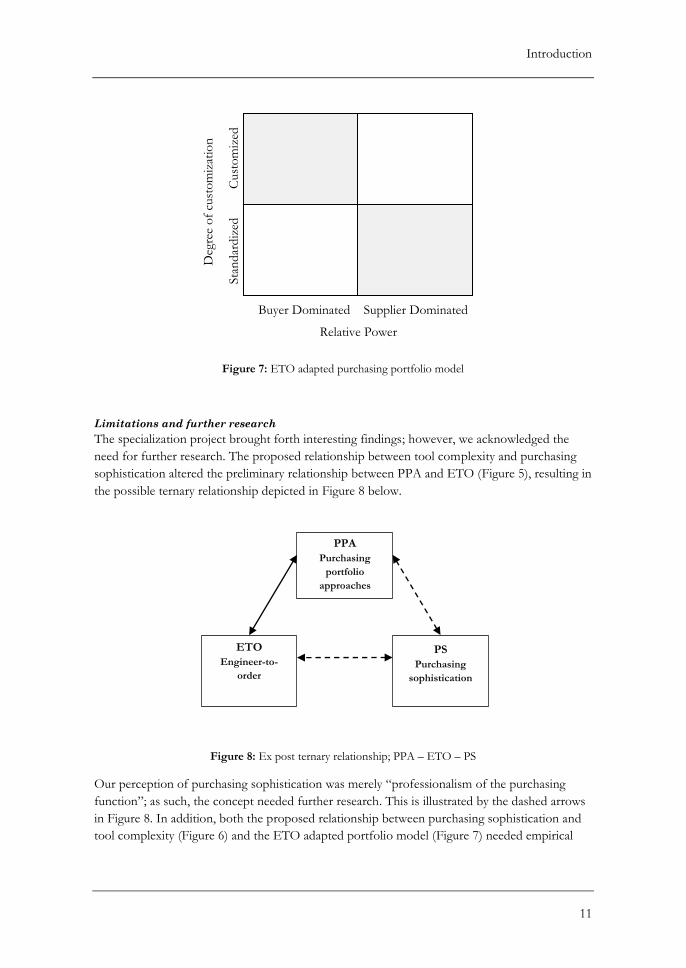
portfolio model is illustrated in Figure 7 below.
Level of purchasing sophistication
van Weele
(2005)
Bensaou
(1999)
Olsen and
Ellram
(1997)
Nellore and
Söderquist
(2000)
Kraljic
(1983)
The
Network
Approach
Purchasing Portfolio
approaches
Purchasing
portfolio
model
Tool
complexity
ETO
Introduction
11
Figure 7: ETO adapted purchasing portfolio model
Limitations and further research
The specialization project brought forth interesting findings; however, we acknowledged the
need for further research. The proposed relationship between tool complexity and purchasing
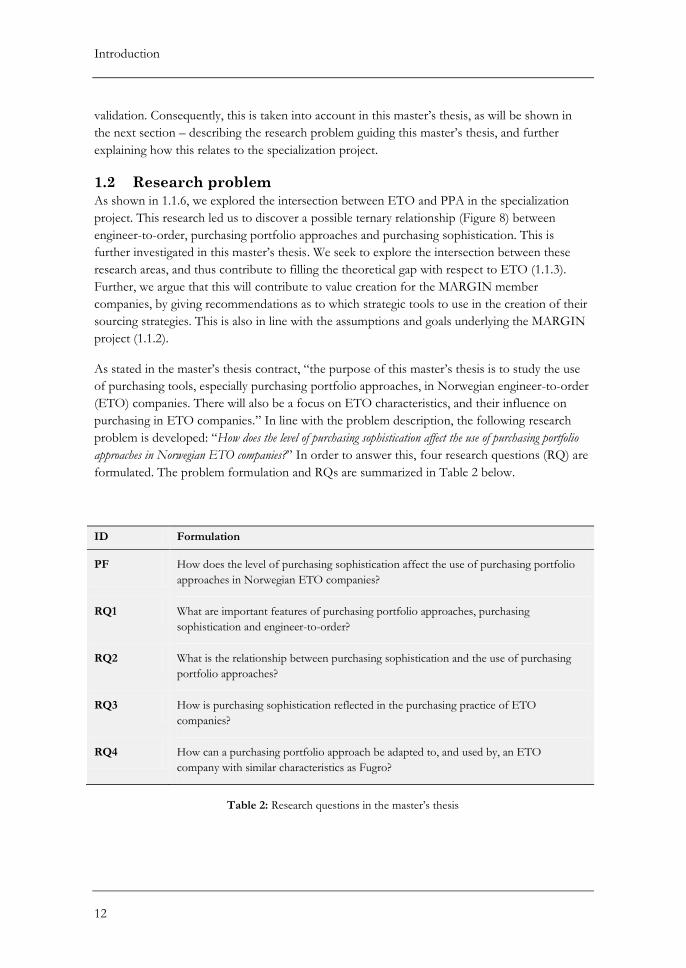
sophistication altered the preliminary relationship between PPA and ETO (Figure 5), resulting in
the possible ternary relationship depicted in Figure 8 below.
Figure 8: Ex post ternary relationship; PPA – ETO – PS
Our perception of purchasing sophistication was merely “professionalism of the purchasing
function”; as such, the concept needed further research. This is illustrated by the dashed arrows
in Figure 8. In addition, both the proposed relationship between purchasing sophistication and
tool complexity (Figure 6) and the ETO adapted portfolio model (Figure 7) needed empirical
Relative Power
ETO
Engineer-to-
order
PPA
Purchasing
portfolio
approaches
PS
Purchasing
sophistication
Buyer Dominated Supplier Dominated
Sta
nd
ard
ized
C
ust
om
ized
Deg
ree
of
cust
om
izat
ion
Introduction
12
validation. Consequently, this is taken into account in this master’s thesis, as will be shown in
the next section – describing the research problem guiding this master’s thesis, and further
explaining how this relates to the specialization project.
1.2 Research problem
As shown in 1.1.6, we explored the intersection between ETO and PPA in the specialization
project. This research led us to discover a possible ternary relationship (Figure 8) between
engineer-to-order, purchasing portfolio approaches and purchasing sophistication. This is
further investigated in this master’s thesis. We seek to explore the intersection between these
research areas, and thus contribute to filling the theoretical gap with respect to ETO (1.1.3).
Further, we argue that this will contribute to value creation for the MARGIN member
companies, by giving recommendations as to which strategic tools to use in the creation of their
sourcing strategies. This is also in line with the assumptions and goals underlying the MARGIN
project (1.1.2).
As stated in the master’s thesis contract, “the purpose of this master’s thesis is to study the use
of purchasing tools, especially purchasing portfolio approaches, in Norwegian engineer-to-order
(ETO) companies. There will also be a focus on ETO characteristics, and their influence on
purchasing in ETO companies.” In line with the problem description, the following research
problem is developed: “How does the level of purchasing sophistication affect the use of purchasing portfolio
approaches in Norwegian ETO companies?” In order to answer this, four research questions (RQ) are
formulated. The problem formulation and RQs are summarized in Table 2 below.
ID Formulation
PF How does the level of purchasing sophistication affect the use of purchasing portfolio
approaches in Norwegian ETO companies?
RQ1 What are important features of purchasing portfolio approaches, purchasing
sophistication and engineer-to-order?
RQ2 What is the relationship between purchasing sophistication and the use of purchasing
portfolio approaches?
RQ3 How is purchasing sophistication reflected in the purchasing practice of ETO
companies?
RQ4 How can a purchasing portfolio approach be adapted to, and used by, an ETO
company with similar characteristics as Fugro?
Table 2: Research questions in the master’s thesis
Introduction
13
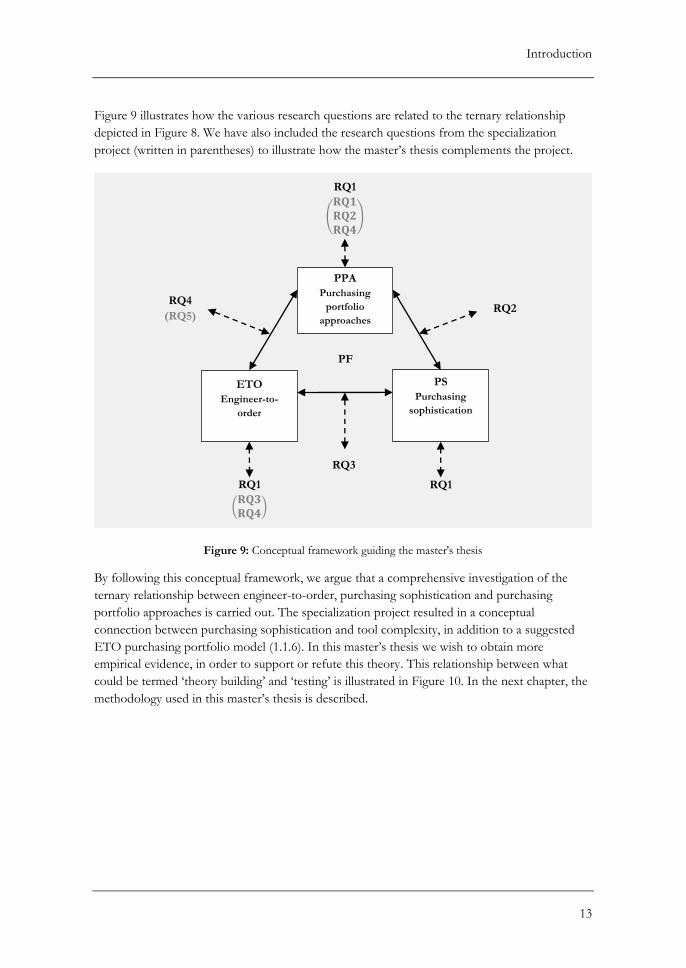
Figure 9 illustrates how the various research questions are related to the ternary relationship
depicted in Figure 8. We have also included the research questions from the specialization
project (written in parentheses) to illustrate how the master’s thesis complements the project.
Figure 9: Conceptual framework guiding the master's thesis
By following this conceptual framework, we argue that a comprehensive investigation of the
ternary relationship between engineer-to-order, purchasing sophistication and purchasing
portfolio approaches is carried out. The specialization project resulted in a conceptual
connection between purchasing sophistication and tool complexity, in addition to a suggested
ETO purchasing portfolio model (1.1.6). In this master’s thesis we wish to obtain more
empirical evidence, in order to support or refute this theory. This relationship between what
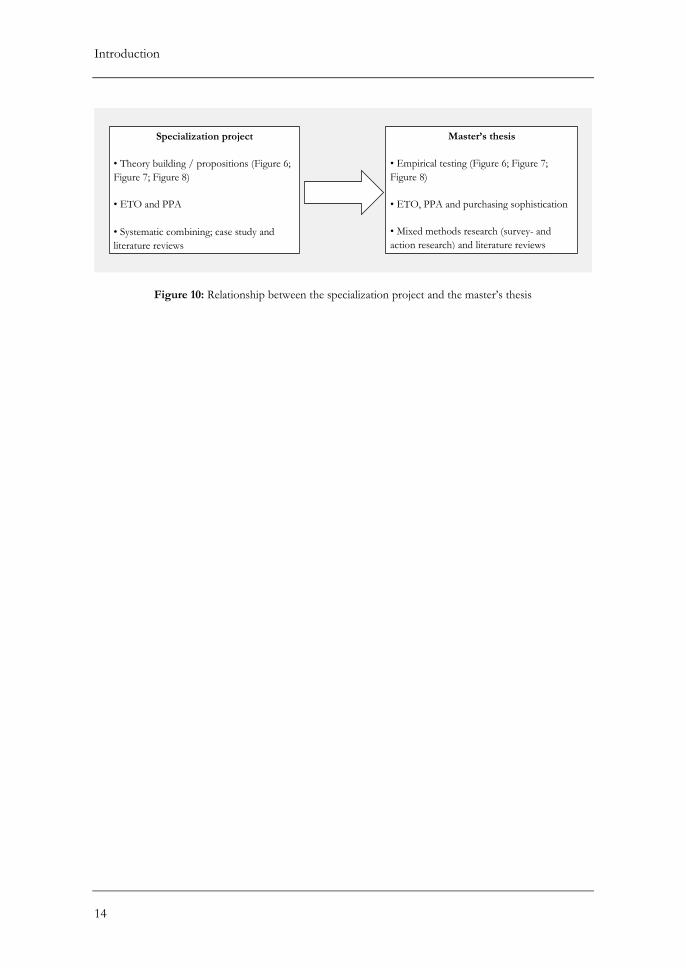
could be termed ‘theory building’ and ‘testing’ is illustrated in Figure 10. In the next chapter, the
methodology used in this master’s thesis is described.
RQ1
(
)
RQ1
ETO
Engineer-to-
order
PPA
Purchasing
portfolio
approaches
PS
Purchasing
sophistication
RQ2
RQ4
(RQ5)
(
)
RQ1
PF
RQ3
Introduction
14
Figure 10: Relationship between the specialization project and the master’s thesis
Specialization project
• Theory building / propositions (Figure 6;
Figure 7; Figure 8)
• ETO and PPA
• Systematic combining; case study and
literature reviews
Master’s thesis
• Empirical testing (Figure 6; Figure 7;
Figure 8)
• ETO, PPA and purchasing sophistication
• Mixed methods research (survey- and
action research) and literature reviews
Methodology
15
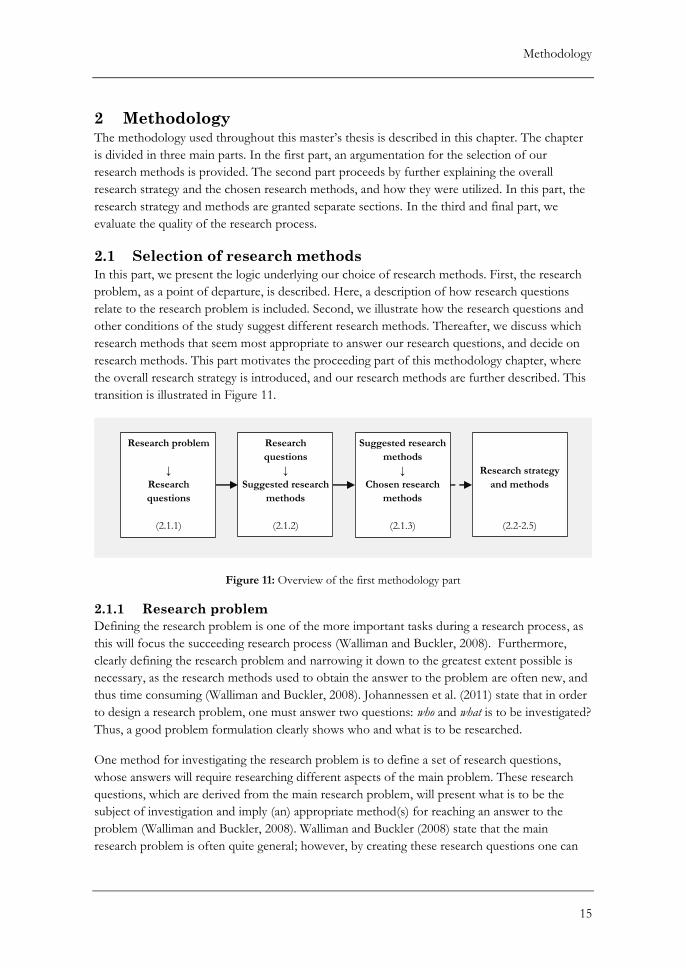
2 Methodology The methodology used throughout this master’s thesis is described in this chapter. The chapter
is divided in three main parts. In the first part, an argumentation for the selection of our
research methods is provided. The second part proceeds by further explaining the overall
research strategy and the chosen research methods, and how they were utilized. In this part, the
research strategy and methods are granted separate sections. In the third and final part, we
evaluate the quality of the research process.
2.1 Selection of research methods
In this part, we present the logic underlying our choice of research methods. First, the research
problem, as a point of departure, is described. Here, a description of how research questions
relate to the research problem is included. Second, we illustrate how the research questions and
other conditions of the study suggest different research methods. Thereafter, we discuss which
research methods that seem most appropriate to answer our research questions, and decide on
research methods. This part motivates the proceeding part of this methodology chapter, where
the overall research strategy is introduced, and our research methods are further described. This
transition is illustrated in Figure 11.
Figure 11: Overview of the first methodology part
2.1.1 Research problem
Defining the research problem is one of the more important tasks during a research process, as
this will focus the succeeding research process (Walliman and Buckler, 2008). Furthermore,
clearly defining the research problem and narrowing it down to the greatest extent possible is
necessary, as the research methods used to obtain the answer to the problem are often new, and
thus time consuming (Walliman and Buckler, 2008). Johannessen et al. (2011) state that in order
to design a research problem, one must answer two questions: who and what is to be investigated?
Thus, a good problem formulation clearly shows who and what is to be researched.
One method for investigating the research problem is to define a set of research questions,
whose answers will require researching different aspects of the main problem. These research
questions, which are derived from the main research problem, will present what is to be the
subject of investigation and imply (an) appropriate method(s) for reaching an answer to the
problem (Walliman and Buckler, 2008). Walliman and Buckler (2008) state that the main
research problem is often quite general; however, by creating these research questions one can
Research problem
↓
Research
questions
(2.1.1)
Research
questions
↓
Suggested research
methods
(2.1.2)
Suggested research
methods
↓
Chosen research
methods
(2.1.3)
Research strategy
and methods
(2.2-2.5)
Methodology
16
direct the research to those issues which are most important. As the main research problem and
the research questions provide the framework for the master’s thesis, it is recommended that
time is spent refining these questions in order to ease the remaining research process (Walliman
and Buckler, 2008).
Developing the research problem
At the outset of our master’s thesis, we had solid foundation and understanding of ETO and
purchasing portfolio approaches from a theoretical point of view. However, we wanted to
enhance our understanding of the concepts through empirical testing of our gained knowledge
and the proposed theoretical developments, including purchasing sophistication (1.2). With
respect to Johannessen et al. (2011), our research problem (1.2) clearly shows what is to be
investigated (purchasing sophistication and purchasing portfolio approaches), and who is to be
investigated (Norwegian ETO companies). Thus, the problem formulation neatly describes the
ternary relationship described in the introduction (1.1.6 and 1.2). Further, we specified four
research questions within this overall research problem, to further specify our research (1.2;
Table 2). In the next subsection, we describe suggested research methods, given the research
questions and other conditions of the study.
2.1.2 Suggested research methods
Several authors argue that the research questions should be taken as a starting point when
choosing the appropriate research method(s) (e.g. Walliman and Buckler, 2008; Teddlie and
Tashakkori, 2009; Yin, 2009). In order to avoid the usage of a less advantageous research
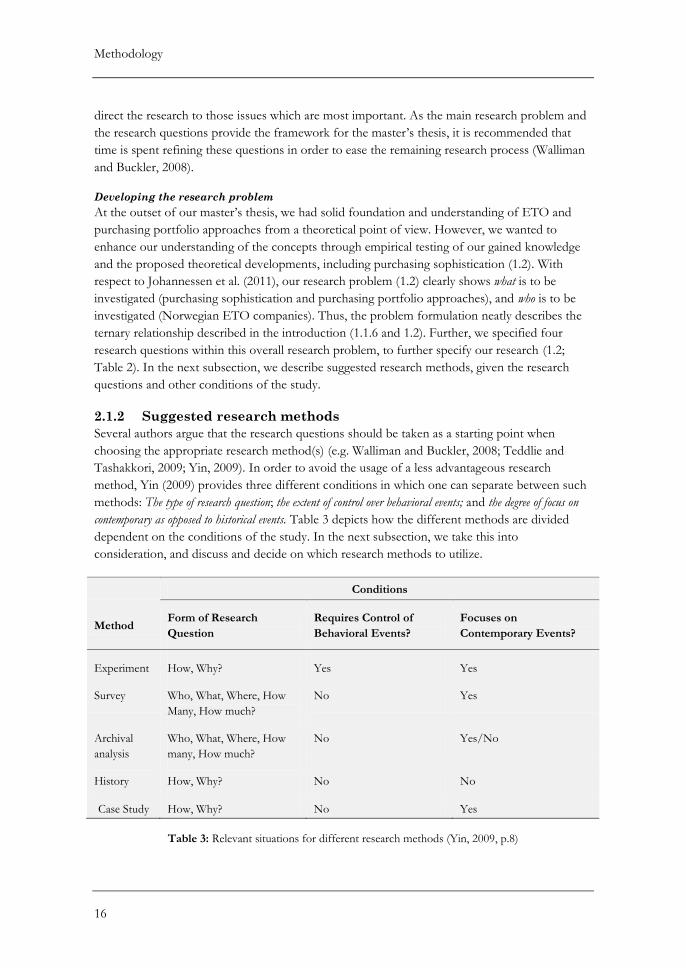
method, Yin (2009) provides three different conditions in which one can separate between such
methods: The type of research question; the extent of control over behavioral events; and the degree of focus on
contemporary as opposed to historical events. Table 3 depicts how the different methods are divided
dependent on the conditions of the study. In the next subsection, we take this into
consideration, and discuss and decide on which research methods to utilize.
Conditions
Method Form of Research
Question
Requires Control of
Behavioral Events?
Focuses on
Contemporary Events?
Experiment How, Why? Yes Yes
Survey Who, What, Where, How
Many, How much?
No Yes
Archival
analysis
Who, What, Where, How
many, How much?
No Yes/No
History How, Why? No No
Case Study How, Why? No Yes
Table 3: Relevant situations for different research methods (Yin, 2009, p.8)
Methodology
17
2.1.3 Deciding on research methods
When deciding on research methods, our research questions are evaluated in light of the
different conditions provided by Yin (2009), as described in Table 3 above. The result of this
comparison is given in Table 4 below.
Research
questions
Form of
Research
Question
Requires
Control of
Behavioral
Events?
Focuses on
Contemporary
Events?
Recommended
method by Yin
(2009)
Choice
of
method
RQ1: What are
important features
of purchasing
portfolio
approaches,
purchasing
sophistication and
engineer-to-order?
Who,
What,
Where,
How Many,
How
much?
No No Archival analysis Literature
review*
RQ2: What is the
relationship between
purchasing
sophistication and
the use of
purchasing portfolio
approaches?
Who,
What,
Where,
How many,
How
much?
No Yes Survey Survey
RQ3: How is
purchasing
sophistication
reflected in the
purchasing practice
of ETO companies?
How,
Why?
Yes Yes Experiment Action
research
RQ4: How can a
purchasing portfolio
approach be adapted
to, and used by, an
ETO company with
similar
characteristics as
Fugro?
How,
Why?
Yes Yes Experiment Action
research
Table 4: Deciding on research methods
Methodology
18
From Table 4, we see that our choice of method for several of the research questions deviates
from what is recommended by Yin (2009). Hence, we see it appropriate to present our
evaluation underlying the choice of research methods. This is done in the three following
paragraphs.
Choosing to conduct a literature review*
From Table 4 we see that the recommended research method for answering our first research
question is archival analysis, as the research question neither requires control of behavioral
events, nor focus on contemporary events. We do, however, argue that a literature review is
more suitable for answering this question, as archival analysis typically refers to the treatment of
archival records to explain an incidence (Yin, 2009); e.g. the outcomes of a new university
grading policy, based on analysis of students’ certificates before and the implementation.
Yin (2009) states that thorough literature reviews are done prior to the choice of a research
method; hence, he neglects it from Table 3. He argues that the purpose of a literature review is
not to find a definite answer on what is known on a topic; rather it is a means for developing
improved research questions (Yin, 2009). Dubois and Gadde (2002) argue that a literature
review is an important method for developing a theoretical framework. Walliman and Buckler
(2008) follow in the same lines, arguing that a literature review outlines the theoretical aspects
and previous research of an investigated phenomenon. Based on our intention of developing a
theoretical framework for subsequent gathering of empirical data and analysis, we feel that our
choice of a literature review to answer the first research question is well justified. The literature
reviews are briefly described in 2.5.
In Table 4 and this paragraph heading, we have included an asterisk. This is done to emphasize
that the first research question is not solely answered by the aforementioned literature review.
Due to our mixed methods empirical investigation (Part II), we discovered that the empirical
data enabled us to refine the framework. As such, RQ1 is intermediately answered at the end of
our theoretical foundation (Part I) through a literature review, and brought to a conclusion by
supplementing with survey- and action research findings in the first chapter of the analysis
(chapter 8). The refined framework was further used to guide the subsequent analysis of the
ternary relationship between purchasing portfolio approaches, purchasing sophistication and
engineer-to-order (chapter 9-11).
Choosing to conduct survey research
As a means to answer our second research question in a satisfying manner, we have chosen to
utilize a survey research method. This choice of research method is in accordance with the
recommendations provided by Yin (2009), as the research question starts with “what”, thus
qualifying for the use of either survey or archival analysis. Furthermore, the question is of an
exploratory nature, favoring the use of a survey method. A further argument for choosing to
conduct survey research is that we have no control of the researched phenomenon in this
incident; we are in no position to influence the relationship between the use of purchasing
portfolio approaches and purchasing sophistication. In addition, the research question has a
Methodology
19
contemporary focus. In conclusion, we see that our use of a survey research method is well
justified according to Yin (2009). The survey research is further discussed in 2.4.
Choosing to conduct action research
If we were to follow Yin (2009), experiments should be chosen as a research method for both
RQ3 and RQ4. According to Yin (2009), experiments should be conducted when the researcher
“can manipulate behavior directly, precisely, and systematically” (p.11). Further, Yin (2009)
proposes that appropriate arenas are either a laboratory where variables can be isolated, or a
field setting where different groups of research objectives are treated differently.
As stated in the introduction (1.1.2), we have chosen Fugro as a collaborative partner in this
master’s thesis. No company within MARGIN possesses the same characteristics as Fugro;
hence, an experiment with several “social groups”, as proposed by Yin (2009), is impossible to
conduct. Further, we are not in position to manipulate the work context and fully isolate
variables of interest in Fugro. This already implies that classic experiments are less appropriate
for answering our research questions.
Further, we wish to test and introduce knowledge and frameworks developed. This is done in
order to identify processual and social aspects of using purchasing portfolio approaches, and to
generate new knowledge, both for us and the partner company. In addition, we argue that an
investigation of an ETO company’s purchasing sophistication can only be fully accomplished by
challenging the employees of the company. In order to achieve this, we identify a need to
involve ourselves in the research context, in order to extract information of a processual and
social nature. We argue that simple interviews, or “outsider observation”, will not yield the type
of information needed. In search for a more suitable research method, we came to the
conclusion that action research is the most appropriate research method available to answer RQ3
and RQ4. Action research is further described in a succeeding section (2.3); however we briefly
describe it here, in order to justify our choice.
Action research is not one of the research methods proposed by Yin (2009), but bears
resemblance to what he calls quasi-experiments. The methods differ in that the researcher actively
takes part in the research context in action research, whereas the researcher has a more objective
role in experiments. Conducting action research, one seeks to generate new knowledge both for
a problem holder and an action researcher, through collaborative problem solving in real life
situations, having a dual aspect of research interest in mind (Greenwood and Levin, 2007;
McKay and Marshall, 2001; Gummesson, 1991; Klev and Levin, 2009). Here, the researcher
actively takes part in the context of the research objects, and can facilitate testing and the
introduction of both developed knowledge and frameworks, at the same time as identifying
processual and social aspects of the research phenomenon (through social interaction and
participant observation). All in all, we feel that action research meets our requirements for a
research method that corresponds to the nature of the research questions considered, and the
chosen empirical setting.
Methodology
20
In the next section, we describe how the chosen research methods are gathered under the same
banner; the mixed methods research strategy. Subsequently, we further elaborate on the
respective chosen research methods.
2.2 Mixed methods research strategy
As apparent from the above discussion on choice of research methods, the selection includes
both qualitative (action research) and quantitative (survey research) research designs, with
literature review falling outside of this classification. We see it beneficial to structure our
methodology under an overall research strategy. Based on the prevalence of both qualitative and
quantitative research methods, the overall research strategy deemed suitable is mixed methods
research. This will be further elaborated in the next subsection. Thereafter, two subsequent
sections provide thorough descriptions of the action research and survey research methods, with
both theory and descriptions of our execution. A section describing the literature review is then
included. Figure 12 illustrates the relationship between these sections.
Figure 12: Overview of the second methodology part
2.2.1 Mixed methods research strategy
Mixed methods research can be defined as a project that involves both quantitative and
qualitative methods (Leech, 2010; referred to in Teddlie and Tashakkori, 2009). The approach
cuts across these two different research designs, and the data extracted from these strategies are
to be mutually illuminating (Bryman and Bell, 2007). As seen in the previous part, the research
questions dictate the choice of research methods, which again decide the applicability of a mixed
methods research strategy. Hence, we see that the research questions are a driving force for the
choice of mixed methods research. This is recognized by several authors (e.g. Teddlie and
Tashakkori, 2009; Onwuegbuzie and Leech, 2006).
Applications of mixed methods research
Bryman and Bell (2007) provide five applications of mixed methods research. These applications
are summarized in Table 5 below.
Mixed methods
research
(2.2.1)
Action research
(2.3) Survey research
(2.4) Literature review
(2.5)
Research strategy:
Research method:
Research design: Qualitative Quantitative
Methodology
21
APPLICATIONS OF MIXED METHODS RESEARCH
Application Description
Qualitative research can facilitate
quantitative research
Qualitative research can be used as a source for hypotheses or hunches
that subsequently can be tested using quantitative methods, and the deep
knowledge gained from qualitative research can be used to aid the design
of survey questions
Quantitative research can facilitate
qualitative research
Quantitative research can guide qualitative research through pinpointing
interview objects or case companies that seem to be of interest for further
qualitative research
Mixed methods research can both
cover static and processual features
of an investigation
Quantitative research can provide a static picture of social life, while
qualitative research can discover more processual features of a study
Qualitative research may facilitate
the interpretation of the
relationship between variables
Qualitative reasoning may for instance reveal the occurrence of an
intervening variable – a variable influenced by an independent variable
that further influence the dependent variable
May be an approach of hedging
risk in terms of securing empirical
data
For instance, survey responses may be too few to use for generalization,
making use of other data sources a necessity
Table 5: Applications of mixed methods research (adapted from Bryman and Bell, 2007, pp.645-656)
Applying the mixed methods research strategy
In relation to the first application, our understanding of the ETO context, gained from the
specialization project (1.1.6), has inspired the development of several questions used in the
questionnaire (A.3). With respect to the second application, the questionnaire may reveal
interesting findings with respect to company size, industry, production situation, and turnover
and so on, providing valuable information when analyzing the qualitative part of this study. As
for the third application, the survey will contribute to give a static view of the use of purchasing
portfolio approaches, while action research will contribute to map the process around the
practical use of these same models, together providing a more holistic and comprehensive view
of the use of purchasing portfolio approaches. We also recognize that our qualitative study can
cast an additional light on results from the survey, explaining possible correlations in depth,
relating to the fourth application (Table 5). Finally, the fifth application is also relevant for this
thesis; there is less risk associated with our qualitative data collection than with our survey,
making it an attractive research method for the authors. Hence, we see that all the applications
are employed in our master’s thesis research, which again supports the choice of a mixed
methods research strategy. As such, the research questions will not solely be answered by the
corresponding research method (Table 4); multiple methods will provide stronger reasoning. In
the next section, the action research method is described.
Methodology
22
2.3 Action research
As previously mentioned, action research is conducted to address two research questions in this
thesis (2.1.3). We will in this section introduce the method of action research, address critique
and practical implications of the method, and map the design used to approach the research
questions of interest. Thereafter, the quality of the action research is assessed, taking critique of
action research into account.
2.3.1 Action research defined
Action research originates from two research environments; one surrounding Kurt Lewin at
MIT; the other at Tavistick Institute in London, comprising researchers as Eric Trist, Fred
Emery and Philp Herbst (Klev and Levin, 2009). Action research is a research method that has
been discussed and utilized for many years in scientific research. Handbooks has been written
(e.g. Reason and Bradbury, 2001; Greenwood and Levin, 2007) and scientific journal published
on the subject (e.g. International Journal of Action Research; Action Research; Systemic Practice
and Action Research) to address various issues related to the method; for instance
epistemological foundations (Greenwood and Levin, 2007) and cyclical approaches to action
research design (McKay and Marshall, 2001; Burns, 1994). Action research is maybe the one
stream that has provided the most influential contribution to overarching academic
understanding of grounds for organizational development, but still; action research is looked
upon as an outsider in the social sciences (Klev and Levin, 2009).
To encapsulate the different aspects of this research method, Hult and Lennung (1980) gives a
rather comprehensive, but elucidating, definition of the term: “Action research simultaneously
assists in practical problem-solving and expands scientific knowledge, as well as enhances the
competencies of the respective actors, being performed collaboratively in an immediate situation
using data feedback in a cyclical process aiming at an increased understanding of a given social
situation, primarily applicable for the understanding of change processes in social systems and
undertaken within a mutually acceptable ethical framework.” (p.247)
This definition captures the very essence of action research; it represents a combination of
action (practice) and research (theory) (McKay and Marshall, 2001; Gummesson, 1991). Action
research seeks to generate new knowledge both for a problem owner and an action researcher,
through collaborative problem solving in real life situations, having a dual aspect of research
interest in mind (Greenwood and Levin, 2007; McKay and Marshall, 2001; Gummesson, 1991;
Klev and Levin, 2009). Different from many other research methods, action research relies on
the researcher(s) actively taking part in the context of his/her research interest area, shaping a
mutual reliance on the problem owner’s and the researcher’s skills and competences, focusing
on “doing with”, rather than “doing for”, the counterparty (Greenwood and Levin, 2007;
McKay and Marshall, 2001; Gummesson, 1991; Klev and Levin, 2009). The approach of action
research provides opportunities for gaining authenticity and good insight to the problem and the
problem holder (Gummesson, 1991).
For conducting satisfactory action research, it is important that the arena for learning is well
configured, and the process well planned (Greenwood and Levin, 2007; Klev and Levin, 2009).
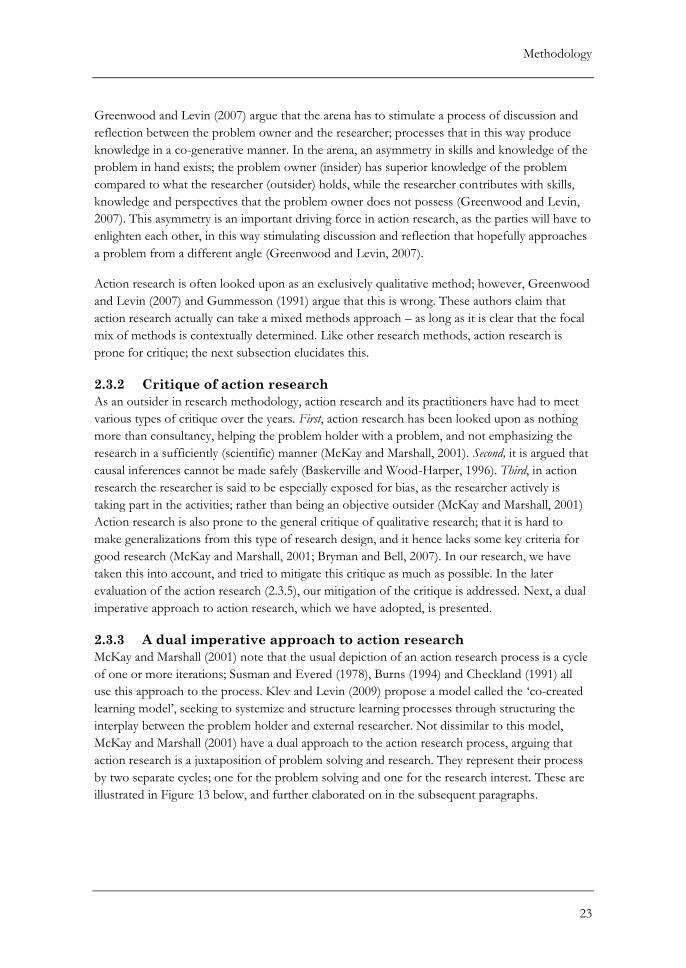
Methodology
23
Greenwood and Levin (2007) argue that the arena has to stimulate a process of discussion and
reflection between the problem owner and the researcher; processes that in this way produce
knowledge in a co-generative manner. In the arena, an asymmetry in skills and knowledge of the
problem in hand exists; the problem owner (insider) has superior knowledge of the problem
compared to what the researcher (outsider) holds, while the researcher contributes with skills,
knowledge and perspectives that the problem owner does not possess (Greenwood and Levin,
2007). This asymmetry is an important driving force in action research, as the parties will have to
enlighten each other, in this way stimulating discussion and reflection that hopefully approaches
a problem from a different angle (Greenwood and Levin, 2007).
Action research is often looked upon as an exclusively qualitative method; however, Greenwood
and Levin (2007) and Gummesson (1991) argue that this is wrong. These authors claim that
action research actually can take a mixed methods approach – as long as it is clear that the focal
mix of methods is contextually determined. Like other research methods, action research is
prone for critique; the next subsection elucidates this.
2.3.2 Critique of action research
As an outsider in research methodology, action research and its practitioners have had to meet
various types of critique over the years. First, action research has been looked upon as nothing
more than consultancy, helping the problem holder with a problem, and not emphasizing the
research in a sufficiently (scientific) manner (McKay and Marshall, 2001). Second, it is argued that
causal inferences cannot be made safely (Baskerville and Wood-Harper, 1996). Third, in action
research the researcher is said to be especially exposed for bias, as the researcher actively is
taking part in the activities; rather than being an objective outsider (McKay and Marshall, 2001)
Action research is also prone to the general critique of qualitative research; that it is hard to
make generalizations from this type of research design, and it hence lacks some key criteria for
good research (McKay and Marshall, 2001; Bryman and Bell, 2007). In our research, we have
taken this into account, and tried to mitigate this critique as much as possible. In the later
evaluation of the action research (2.3.5), our mitigation of the critique is addressed. Next, a dual
imperative approach to action research, which we have adopted, is presented.
2.3.3 A dual imperative approach to action research
McKay and Marshall (2001) note that the usual depiction of an action research process is a cycle
of one or more iterations; Susman and Evered (1978), Burns (1994) and Checkland (1991) all
use this approach to the process. Klev and Levin (2009) propose a model called the ‘co-created
learning model’, seeking to systemize and structure learning processes through structuring the
interplay between the problem holder and external researcher. Not dissimilar to this model,
McKay and Marshall (2001) have a dual approach to the action research process, arguing that
action research is a juxtaposition of problem solving and research. They represent their process
by two separate cycles; one for the problem solving and one for the research interest. These are
illustrated in Figure 13 below, and further elaborated on in the subsequent paragraphs.
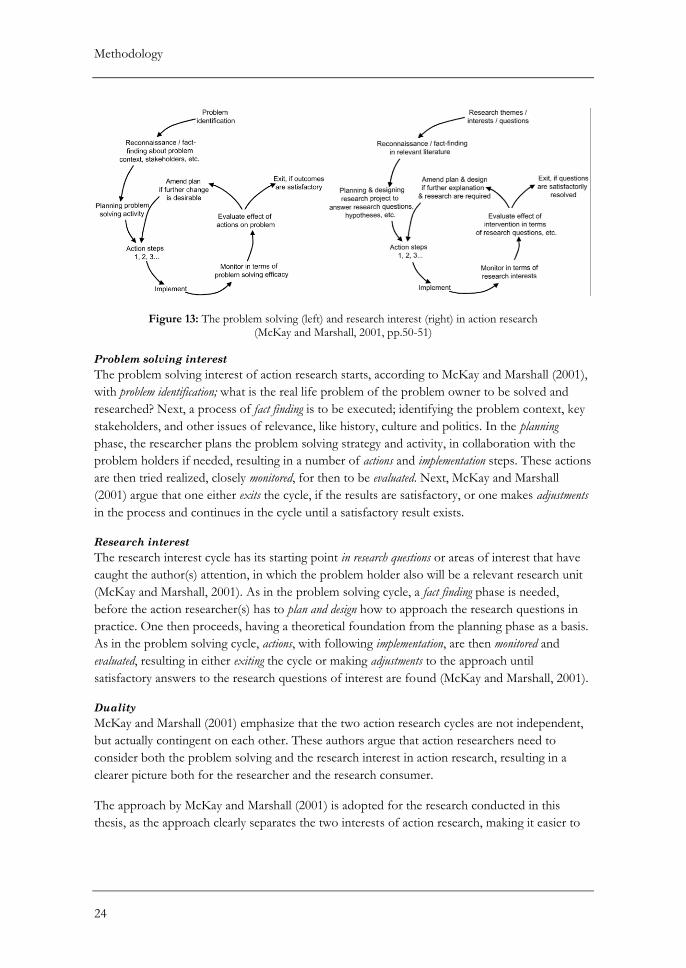
Methodology
24
Figure 13: The problem solving (left) and research interest (right) in action research (McKay and Marshall, 2001, pp.50-51)
Problem solving interest
The problem solving interest of action research starts, according to McKay and Marshall (2001),
with problem identification; what is the real life problem of the problem owner to be solved and
researched? Next, a process of fact finding is to be executed; identifying the problem context, key
stakeholders, and other issues of relevance, like history, culture and politics. In the planning
phase, the researcher plans the problem solving strategy and activity, in collaboration with the
problem holders if needed, resulting in a number of actions and implementation steps. These actions
are then tried realized, closely monitored, for then to be evaluated. Next, McKay and Marshall
(2001) argue that one either exits the cycle, if the results are satisfactory, or one makes adjustments
in the process and continues in the cycle until a satisfactory result exists.
Research interest
The research interest cycle has its starting point in research questions or areas of interest that have
caught the author(s) attention, in which the problem holder also will be a relevant research unit
(McKay and Marshall, 2001). As in the problem solving cycle, a fact finding phase is needed,
before the action researcher(s) has to plan and design how to approach the research questions in
practice. One then proceeds, having a theoretical foundation from the planning phase as a basis.
As in the problem solving cycle, actions, with following implementation, are then monitored and
evaluated, resulting in either exiting the cycle or making adjustments to the approach until
satisfactory answers to the research questions of interest are found (McKay and Marshall, 2001).
Duality
McKay and Marshall (2001) emphasize that the two action research cycles are not independent,
but actually contingent on each other. These authors argue that action researchers need to
consider both the problem solving and the research interest in action research, resulting in a
clearer picture both for the researcher and the research consumer.
The approach by McKay and Marshall (2001) is adopted for the research conducted in this
thesis, as the approach clearly separates the two interests of action research, making it easier to
Methodology
25
design the action processes with regards to both problem solving and research interest. Next, we
elaborate on how we conducted the action research.
2.3.4 Conducting action research
The methodology used in this thesis is following in the lines of action research; seeking to
generate new knowledge, through collaborative problem solving, both for the authors and the
problem holder. However, due to lack of resources and time, the research done is restricted to
only comprising the start of a preferably longer process together with the problem holder. This
master’s thesis is only a short-term operational piece in the larger and longer term puzzle; the
MARGIN project. The theoretical foundation, the research’s intention, the design of the
learning arena and process, and the first steps of collaboration with the problem holder are all
based on action research, while subsequent steps of implementation, monitoring and doing
adjustments have to be continued by the problem holder together with a third part. Even
though action research may also be used as a quantitative research method (2.3.1), we will only
utilize its potential as a qualitative research method. Next, we describe how we conducted the
problem solving and research interest cycles, respectively.
Addressing the problem solving interest
In this thesis, action research was conducted together with our partner company, Fugro
(problem holder). In line with MARGIN’s guidelines, it was important that our collaborating
partner would reap benefits from the cooperation. We argue that the problem solving interest,
with Fugro as problem holder, would provide such a benefit. We followed the guidelines
provided by McKay and Marshall (2001) (2.3.3), and the applied cyclical approach is depicted in
Figure 14 below.
Figure 14: Action research problem solving framework used (McKay and Marshall, 2001)
Fugro do not have a proactive approach
towards suppliers
Case study
Action Exit due to limited
time and resources
Methodology
26
The problem identification process (step 1) was done in two stages, prior to this master’s thesis.
First, a mapping of the problem holder and relevant problem areas was conducted by SINTEF,
HiST and the company itself. This resulted in an identification of upstream activities, as supplier
collaboration, to be one of MARGIN’s four research areas (Margin, 2011d). The second stage of
problem identification was carried out in autumn 2011, when the authors conducted a case study
of Fugro (1.1.6). The problem identification was done together with the technical manager of
Fugro and one of the purchasers. As such, we got thorough insight in both purchasing practice
and the engineering-purchasing interface. This research revealed a need for more proactive
purchasing, and a possible facilitation of this by adapting a purchasing portfolio approach to the
ETO production situation. This case study also mapped the context (step 2) of the case
company, providing invaluable information that shaped the subsequent process in the action
research.
Planning of the problem solving activity (step 3) was then conducted together with the case
company, agreeing on the arena, participants, form and practical issues of the activity. We
planned two sessions, termed “workshops”, with the company, including participants from
different functions in Fugro. In the first session, representatives from purchasing were to be
present, whereas purchasing, sales/marketing and engineering were to be present in the second.
These were chosen because we wanted to investigate whether it is beneficial to include several
functions when conducting purchasing portfolio analysis. An action research protocol (A.2) was
also made, functioning as a “game plan” for the workshops and making sure that both the
research and problem solving interest were met.
The proceeding action step constituted the actual problem solving activity (workshops). In
detail, the action step took the form of introducing purchasing portfolio approaches to the case
company – seeking to implement a more proactive and systematic process for approaching
suppliers. The authors were active in this process, introducing the portfolio approaches and
trying to facilitate a good use of them. This process was also closely monitored by the authors,
and then evaluated together with the case company. At the end of the workshops, a total
evaluation was made by the problem holder. As planned, the action research was conducted
over two sessions with two different groups of employees. The first workshop comprised of the
researchers and two purchasers; the second workshop comprised, however, only of the
researchers, marketing/sales and engineering, due to uncontrollable occurrences at the case
company. This will be further discussed in the subsequent evaluation of action research (2.3.5).
Each session lasted for about two hours.
As mentioned above, due to lack of resources and time, the action research process was cut after
the action step (step 4), leaving the subsequent steps yet to be conducted. This is also illustrated
in Figure 14 above. The authors’ contribution to the case company has therefore been to
introduce a tool for pro-active and systematic sourcing, purchasing portfolio approaches,
through problem identification and the action step.
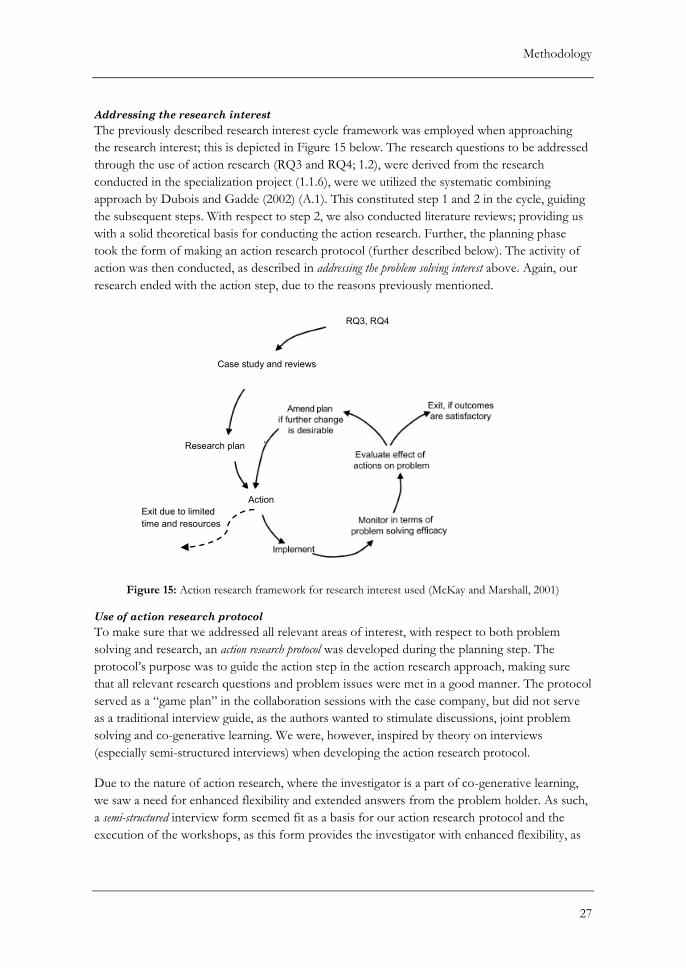
Methodology
27
Addressing the research interest
The previously described research interest cycle framework was employed when approaching
the research interest; this is depicted in Figure 15 below. The research questions to be addressed
through the use of action research (RQ3 and RQ4; 1.2), were derived from the research
conducted in the specialization project (1.1.6), were we utilized the systematic combining
approach by Dubois and Gadde (2002) (A.1). This constituted step 1 and 2 in the cycle, guiding
the subsequent steps. With respect to step 2, we also conducted literature reviews; providing us
with a solid theoretical basis for conducting the action research. Further, the planning phase
took the form of making an action research protocol (further described below). The activity of
action was then conducted, as described in addressing the problem solving interest above. Again, our
research ended with the action step, due to the reasons previously mentioned.
Figure 15: Action research framework for research interest used (McKay and Marshall, 2001)
Use of action research protocol
To make sure that we addressed all relevant areas of interest, with respect to both problem
solving and research, an action research protocol was developed during the planning step. The
protocol’s purpose was to guide the action step in the action research approach, making sure
that all relevant research questions and problem issues were met in a good manner. The protocol
served as a “game plan” in the collaboration sessions with the case company, but did not serve
as a traditional interview guide, as the authors wanted to stimulate discussions, joint problem
solving and co-generative learning. We were, however, inspired by theory on interviews
(especially semi-structured interviews) when developing the action research protocol.
Due to the nature of action research, where the investigator is a part of co-generative learning,
we saw a need for enhanced flexibility and extended answers from the problem holder. As such,
a semi-structured interview form seemed fit as a basis for our action research protocol and the
execution of the workshops, as this form provides the investigator with enhanced flexibility, as
RQ3, RQ4
Case study and reviews
Research plan
Action Exit due to limited
time and resources
Methodology
28
an answer can be supplemented with questions in order to extend the depth of information
(Walliman and Buckler, 2008; Johannessen et al., 2011). This type of interview often takes on a
conversational manner and is open-ended, but is likely to follow a certain set of questions
derived from the research questions (Walliman and Buckler, 2008). Here, the use of open questions
invites the participants to provide extended answers, and can be achieved by asking “why”
(Walliman and Buckler, 2008).
The two sessions with the case company were identically designed, but the process in the
sessions went in different directions; reflecting the flexibility of the protocol. This was expected,
as different organizational members contributed in the different sessions, shaping the process
itself. The authors found is extremely valuable, as different problems and information came to
light, at the same time as the problem holders also preferred this somewhat semi-structured
arena. The action research protocol was also organized in terms of topics, as such indirectly
determining how the session should proceed. The protocol is included in appendix A.2.
2.3.5 Evaluating the action research
As previously mentioned (2.3.4), we have chosen to utilize action research’s potential as a
qualitative research method. Hence, we evaluate the action research quality through criteria
developed for qualitative research. There is a discussion among academics concerning
appropriate research criteria for qualitative research, varying in degrees whether a simple
application of a quantitative researcher’s criteria of reliability and validity is desirable (Bryman
and Bell, 2007). For this thesis, we choose to adopt the criteria of construct -, internal and
external validity, and internal and external reliability, following in the lines of Bryman and Bell
(2007) and Yin (2009). Each of these criteria is evaluated below. We also present how we sought
to mitigate critique of action research (2.3.2), and finally point towards some potential
weaknesses of the action research.
Construct validity
Research is said to have construct validity if the correct operational measures for the concepts
being studied are identified (Yin, 2009). In order to achieve construct validity, we have used
multiple sources of evidence throughout the action research process. In the various steps in the
action research process, from problem identification to taking action, various research methods
and sources has been used. In the problem identification and fact finding activities, literature
reviews on ETO and purchasing portfolio approaches were conducted. Further, mapping of the
problem holder, both by SINTEF/HiST and the authors were conducted (2.3.4), prior to and
through a case study carried out in the specialization project (1.1.6), respectively. These multiple
sources of evidence have enabled us to triangulate the data, providing multiple measures of the
same phenomena, and hence addressing construct validity. In the action stage of the process, we
conducted two workshops with the same research design. Different people addressed the same
problems; as such, purchasing practice in Fugro was further mapped with multiple sources,
which reduced person specific biases and enhanced the construct validity.
Methodology
29
Internal validity
With respect to internal validity, one should be able to separate causal relationships between two
or more constructs, from spurious relationships (Yin, 2009; Bryman and Bell, 2007). According
to Yin (2009) internal validity is measured for explanatory or causal studies only. As our action
research is exploratory in nature, it is difficult to address the internal validity of this research.
External validity
To achieve external validity, the domain to which a study’s findings can be generalized must be
defined (Yin, 2009). Ringdal (2001) stress that when one case company constitutes the point of
departure, it is important to differentiate between the findings that are general and those that are
company specific. We argue that this is very much relevant when doing action research.
Consequently, we have compared our findings with findings in theory, in order to reveal the
domain to which our findings can be generalized. The mixed methods research strategy (2.2.1)
further strengthens the external validity.
Internal reliability
According to Bryman and Bell (2007), internal reliability is whether or not, when there is one or
more observers in a research setting, members of the research team agree about what they
observe. Throughout all interaction with the partner company, the research team has consisted
of the three authors. In addition, one researcher from SINTEF was present at the workshops.
We also recorded the workshops; enabling us to go back to occurring events in retrospect.
Through good discussions, the research team has together made conclusions on the empirical
data gathered, leading to balanced and more objective inferences. Hence, the internal reliability is
well accounted for.
External reliability
For a research to be reliable, a replication of its operations must lead to the same results (Yin,
2009; Bryman and Bell, 2007). In order to achieve this, we have thoroughly documented our
study and choices. We have used an action research protocol, which has guided our action
research (2.3.4; A.2). The design of the action research can hence be replicated, and the
researcher(s) can take the same role. We do, however, acknowledge the process itself will be
impossible to fully replicate, due to the idiosyncratic context of the researchers and the problem
holder.
Mitigating critique of action research
Critique of action research was described in 2.3.2. We have done our utmost to mitigate this
critique. First, concerning the argument of consultancy, we feel that our adoption of the dual
imperative approach to action research, explicitly addressing and acknowledging the research
interest, has mitigated the potential problem of action research being no more than problem
solving for the company. That being said, we acknowledge that the problem solving interest
actually is similar to consultancy; however, as we designed our action research sessions to
explicitly focus on both research and problem solving, we feel that the quality of our research
holds on this area.
Methodology
30
For mitigating the potential bias of impartiality, we utilized a research team comprising three
persons; two taking part in the activities with the problem holder, and one observing and
transcribing the events. We feel that a team based approach, where the researchers have
different roles, is a very good way for mitigating the potential bias. As such, we would
recommend this approach to action researchers in the future. We also wish to point out that the
aspect of the researcher(s) taking part actively in the sessions was invaluable for our research
process, yielding more and better information from the problem holder, which both contributed
to better problem solving and research findings. Paradoxically, the subjectivity issue in action
research has only strengthened our research, through taking both a subjective and an objective
role.
Mitigating the critique of generalizability and causal inferences is already evaluated in terms of
external and internal validity, respectively (see above). Next, we assess weaknesses with the
conducted action research.
Weaknesses with the research
While being satisfied with the action research in general, some elements of the research did not
go as planned. First, the workshops’ design was maybe too comprehensive, leading us to give
less priority to one of the models that were tested. This may have led to a more subjective
problem-solving practice than was wanted, in that the authors “controlled” the appliance of the
respective model. Second, uncontrollable occurrences at the case company led fewer employees
from the problem holder to attend the sessions – this was detrimental to the cross-functional
teamwork that was intended in the workshops. As such, we got less information on the pros and
cons of working in cross-functional teams when doing purchasing portfolio analysis than was
wanted. Nevertheless, it was still interesting and of value to observe how the different functions
evaluated aspects in both similar and dissimilar ways. Lastly, as mentioned, due to time and
resource limitations, we were not able to follow the problem holder longer than to the “action”
step in the action research. More time and access to the problem holder would be needed in
order to complete the action research cycles. As such, we have only been able to introduce
purchasing portfolio analysis to an ETO company, and acknowledge that valuable insight and
knowledge may be gained if one were able to complete the whole duality cycle.
In summary, we feel that we have conducted action research in a satisfactory manner, albeit we
acknowledge that the research is not without its weaknesses. By consciously taking precautions
and documenting the process thoroughly, we argue that we have conducted action research of
high quality. We feel that the action research has provided value – both for the problem holder
and the researchers. In the next section, the survey research is presented.
2.4 Survey research
This section provides a description of the survey research methodology. First, an introduction to
survey research is provided, including a definition of survey research and criteria for evaluating
quality of such a quantitative research method. Thereafter, principles for developing a
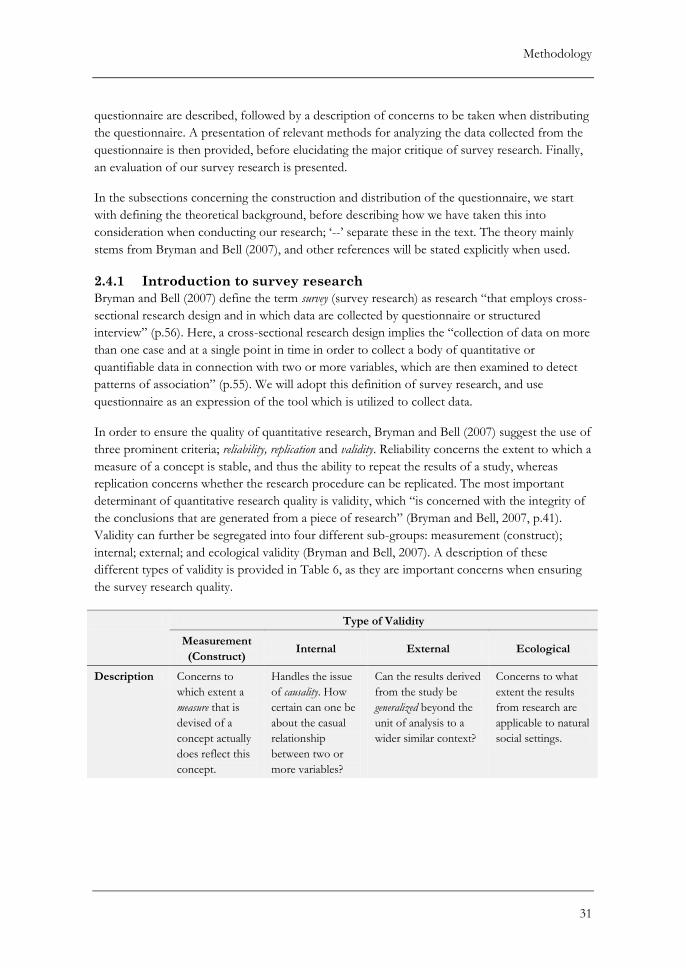
Methodology
31
questionnaire are described, followed by a description of concerns to be taken when distributing
the questionnaire. A presentation of relevant methods for analyzing the data collected from the
questionnaire is then provided, before elucidating the major critique of survey research. Finally,
an evaluation of our survey research is presented.
In the subsections concerning the construction and distribution of the questionnaire, we start
with defining the theoretical background, before describing how we have taken this into
consideration when conducting our research; ‘--’ separate these in the text. The theory mainly
stems from Bryman and Bell (2007), and other references will be stated explicitly when used.
2.4.1 Introduction to survey research
Bryman and Bell (2007) define the term survey (survey research) as research “that employs cross-
sectional research design and in which data are collected by questionnaire or structured
interview” (p.56). Here, a cross-sectional research design implies the “collection of data on more
than one case and at a single point in time in order to collect a body of quantitative or
quantifiable data in connection with two or more variables, which are then examined to detect
patterns of association” (p.55). We will adopt this definition of survey research, and use
questionnaire as an expression of the tool which is utilized to collect data.
In order to ensure the quality of quantitative research, Bryman and Bell (2007) suggest the use of
three prominent criteria; reliability, replication and validity. Reliability concerns the extent to which a
measure of a concept is stable, and thus the ability to repeat the results of a study, whereas
replication concerns whether the research procedure can be replicated. The most important
determinant of quantitative research quality is validity, which “is concerned with the integrity of
the conclusions that are generated from a piece of research” (Bryman and Bell, 2007, p.41).
Validity can further be segregated into four different sub-groups: measurement (construct);
internal; external; and ecological validity (Bryman and Bell, 2007). A description of these
different types of validity is provided in Table 6, as they are important concerns when ensuring
the survey research quality.
Type of Validity
Measurement
(Construct) Internal External Ecological
Description Concerns to
which extent a
measure that is
devised of a
concept actually
does reflect this
concept.
Handles the issue
of causality. How
certain can one be
about the casual
relationship
between two or
more variables?
Can the results derived
from the study be
generalized beyond the
unit of analysis to a
wider similar context?
Concerns to what
extent the results
from research are
applicable to natural
social settings.
Methodology
32
Example Is IQ a proper
measure of
intelligence?
Can we be certain
that x is the reason
for changes in y,
and not something
else?
Can the findings of a
research phenomenon
in a case company be
applicable for other
companies within its
industry?
Results may be
technically valid,
but are distinct
from people’s
everyday lives.
Table 6: Different types of validity (adapted from Bryman and Bell, 2007)
For survey research, one ensures replicability through describing the procedures used in the
different steps of the research method. This has been followed to the letter in this section,
resulting in a rather comprehensive description of the process. This is due to the many concerns
the researcher has to take when conducting survey research. Reliability and validity are further
taken into consideration in subsequent parts, as we have used the criteria as guidelines when
designing the questionnaire, in order to obtain the highest quality possible. In the next
subsection, the construction of a questionnaire is described.
2.4.2 Constructing the questionnaire
This subsection describes how we developed our questionnaire. Its main intent is to ensure
measurement validity and reliability of our survey research (2.4.1). We start by presenting how
indicators were employed in order to measure the important concept of purchasing
sophistication. Then, we discuss how to ensure the quality of a measure employed in the
questionnaire, before proceeding by presenting the types of questions that were developed, and
how this was done. The importance of, and how we conducted, a pilot study is then the topic of
the next paragraph. Finally, we conclude this subsection by discussing the actions taken to
ensure that we followed laws and regulations when conducting the survey research.
Concepts and indicators
The notion of a concept is important when constructing a questionnaire. Concepts are elements of
the social world which seem to have common features; they are the phenomena of which one
conducts research, and the foundation for developing theory (Bryman and Bell, 2007). As a
means for measuring a concept which is hard to quantify, indicators become essential. An
indicator represents a particular concept and is used as though it was a measure of this concept
(Bryman and Bell, 2007). Furthermore, when measuring a concept it is advantageous to use
multiple indicators, because with a single indicator the risk of incorrectly classifying respondents
is eminent. A single indicator may also measure only one aspect of the larger concept, and a last
argument for using a multiple-indicator measure is that it can provide a finer classification of the
respondents (Bryman and Bell, 2007).
A multiple-indicator measure can be constructed by using a Likert scale; either employing a five-
point scale or a seven-point scale to measure each indicator of a concept. However, this type of
measure is prone to a type of response bias called response sets, which can be defined as
“irrelevant but lawful sources of variance” (Webb et al., 1966, p.19). Bryman and Bell (2007)
explain that response sets occur when respondents answer consistently to a series of questions,
with answers not reflecting the concept being measured. A prominent type of such response sets
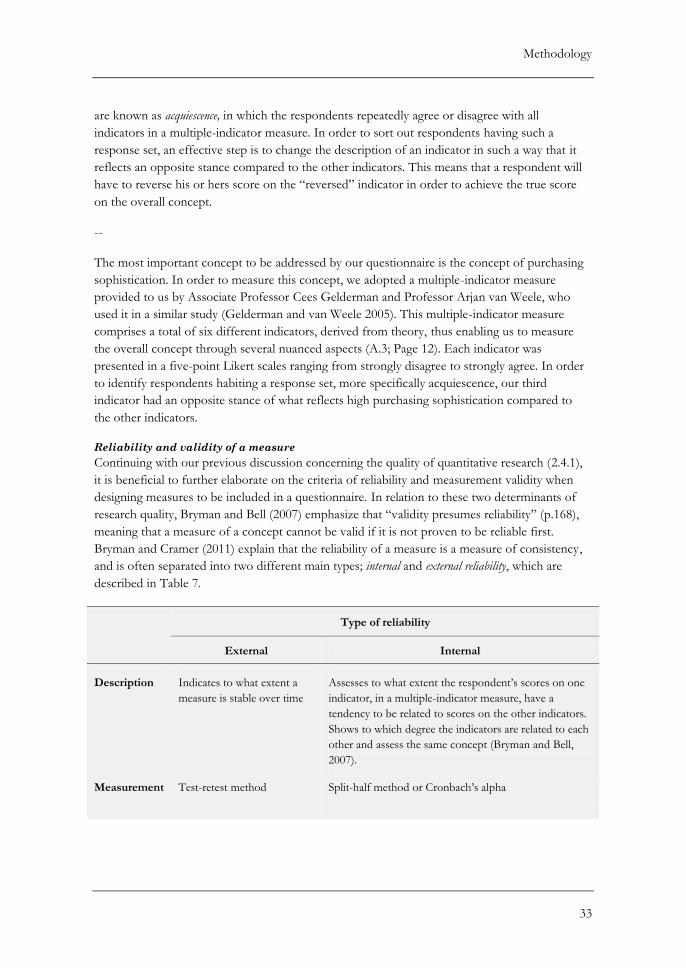
Methodology
33
are known as acquiescence, in which the respondents repeatedly agree or disagree with all
indicators in a multiple-indicator measure. In order to sort out respondents having such a
response set, an effective step is to change the description of an indicator in such a way that it
reflects an opposite stance compared to the other indicators. This means that a respondent will
have to reverse his or hers score on the “reversed” indicator in order to achieve the true score
on the overall concept.
--
The most important concept to be addressed by our questionnaire is the concept of purchasing
sophistication. In order to measure this concept, we adopted a multiple-indicator measure
provided to us by Associate Professor Cees Gelderman and Professor Arjan van Weele, who
used it in a similar study (Gelderman and van Weele 2005). This multiple-indicator measure
comprises a total of six different indicators, derived from theory, thus enabling us to measure
the overall concept through several nuanced aspects (A.3; Page 12). Each indicator was
presented in a five-point Likert scales ranging from strongly disagree to strongly agree. In order
to identify respondents habiting a response set, more specifically acquiescence, our third
indicator had an opposite stance of what reflects high purchasing sophistication compared to
the other indicators.
Reliability and validity of a measure
Continuing with our previous discussion concerning the quality of quantitative research (2.4.1),
it is beneficial to further elaborate on the criteria of reliability and measurement validity when
designing measures to be included in a questionnaire. In relation to these two determinants of
research quality, Bryman and Bell (2007) emphasize that “validity presumes reliability” (p.168),
meaning that a measure of a concept cannot be valid if it is not proven to be reliable first.
Bryman and Cramer (2011) explain that the reliability of a measure is a measure of consistency,
and is often separated into two different main types; internal and external reliability, which are
described in Table 7.
Type of reliability
External Internal
Description Indicates to what extent a
measure is stable over time
Assesses to what extent the respondent’s scores on one
indicator, in a multiple-indicator measure, have a
tendency to be related to scores on the other indicators.
Shows to which degree the indicators are related to each
other and assess the same concept (Bryman and Bell,
2007).
Measurement Test-retest method Split-half method or Cronbach’s alpha
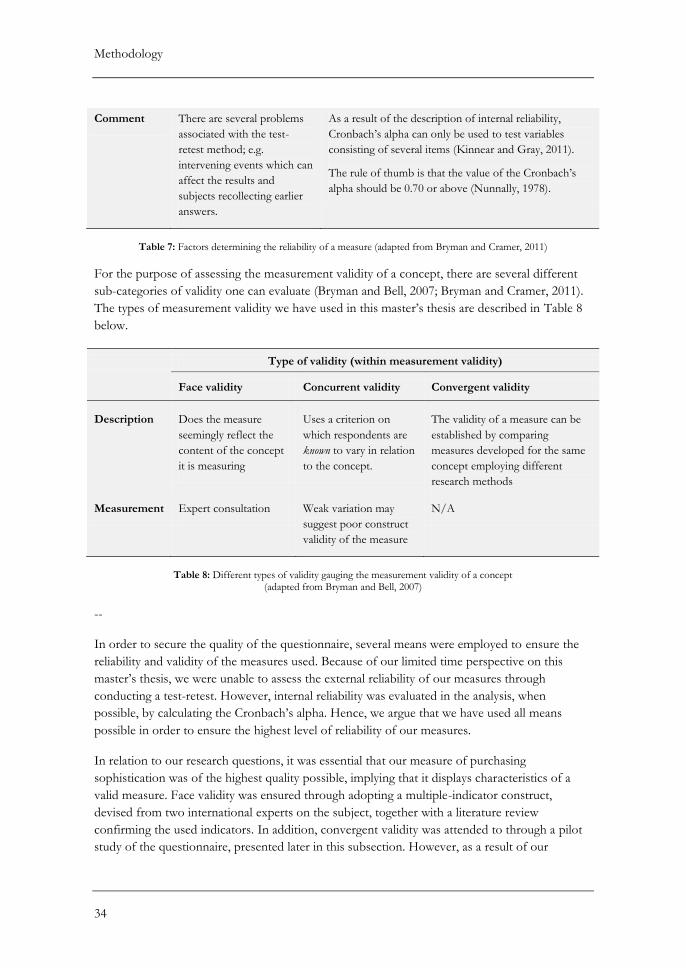
Methodology
34
Comment There are several problems
associated with the test-
retest method; e.g.
intervening events which can
affect the results and
subjects recollecting earlier
answers.
As a result of the description of internal reliability,
Cronbach’s alpha can only be used to test variables
consisting of several items (Kinnear and Gray, 2011).
The rule of thumb is that the value of the Cronbach’s
alpha should be 0.70 or above (Nunnally, 1978).
Table 7: Factors determining the reliability of a measure (adapted from Bryman and Cramer, 2011)
For the purpose of assessing the measurement validity of a concept, there are several different
sub-categories of validity one can evaluate (Bryman and Bell, 2007; Bryman and Cramer, 2011).
The types of measurement validity we have used in this master’s thesis are described in Table 8
below.
Type of validity (within measurement validity)
Face validity Concurrent validity Convergent validity
Description Does the measure
seemingly reflect the
content of the concept
it is measuring
Uses a criterion on
which respondents are
known to vary in relation
to the concept.
The validity of a measure can be
established by comparing
measures developed for the same
concept employing different
research methods
Measurement Expert consultation Weak variation may
suggest poor construct
validity of the measure
N/A
Table 8: Different types of validity gauging the measurement validity of a concept
(adapted from Bryman and Bell, 2007)
--
In order to secure the quality of the questionnaire, several means were employed to ensure the
reliability and validity of the measures used. Because of our limited time perspective on this
master’s thesis, we were unable to assess the external reliability of our measures through
conducting a test-retest. However, internal reliability was evaluated in the analysis, when
possible, by calculating the Cronbach’s alpha. Hence, we argue that we have used all means
possible in order to ensure the highest level of reliability of our measures.
In relation to our research questions, it was essential that our measure of purchasing
sophistication was of the highest quality possible, implying that it displays characteristics of a
valid measure. Face validity was ensured through adopting a multiple-indicator construct,
devised from two international experts on the subject, together with a literature review
confirming the used indicators. In addition, convergent validity was attended to through a pilot
study of the questionnaire, presented later in this subsection. However, as a result of our
Methodology
35
exploratory nature of our survey research (2.1.2), we were not able to test our measure for
concurrent validity, as we knew no criterion in which the respondents are known to vary in
relation to purchasing sophistication. Consequently, we argue that we have maintained a high
level of validity of our most important measures.
Generating questions
Questions can be separated into two main categories; open or closed. These are somewhat
complementary to each other; the advantages of a closed question correspond in many ways to
the weaknesses of an open question, and vice versa. However, because of the difficulties
associated with post-coding of open questions, closed questions are often preferable when
designing a questionnaire (Bryman and Bell, 2007). Further, a means for limiting some of the
disadvantages of closed questions is the use of an additional response category, named “other”
(Bryman and Bell, 2007). In this response category, the respondents can choose to answer in a
non-restricted manner if they find the provided answers unfit. Such a category can help capture
interesting replies unknown to the researchers. In addition, these categories can make a closed
question more comprehensive, as they allow a wide range of answers without making the list of
provided answers to exhaustive (Bryman and Bell, 2007).
When designing a question, Bryman and Bell (2007) provide three rules of thumb as an
important starting point: (1) Always bear in mind your research question; (2) what do you want
to know; and (3) how do you answer it? Furthermore, in order to prevent respondents from
answering questions which are not relevant for them, one can employ filter questions (Bryman
and Bell, 2007). A filter question will guide the respondent to other relevant questions and omit
those which the respondent is not capable of providing an answer to. However, Bryman and
Bell (2007) explicitly state that the use of such questions requires clear instructions to the
respondent. If the instructions are insufficient, there is a risk that the respondent will be given
questions which he cannot answer, which may cause irritation for the respondent.
--
When constructing the questionnaire, the second and third rules of thumb were consistently
used as guidelines in developing questions. Throughout the process, we evaluated and ensured
that the different questions were facilitating answers relevant for our overarching research
question. In accordance with the recommendations given by Bryman and Bell (2007), the
questionnaire consisted almost exclusively of closed questions. In addition, when the provided
answers to these questions were not mutually exclusive, an additional response category named
“other” was added. The main intent behind this additional response category was to capture
aspects of a question which were unknown to the researchers and not captured by the provided
answers. However, there are several other benefits of this measure, as mentioned above.
Further, we utilized filter questions in order to extract only those questions which were relevant
for the respondent, thus making the questionnaire even shorter for some respondents. As the
questionnaire was made with survey software, the use of filter questions did not require any
additional instructions to the respondents, as they were redirected to relevant questions in real
time. As such, we prevented the case in which a respondent is given a question which he cannot

Methodology
36
answer. Appendix A.3 provides a comprehensive overview of the questions used, their
specifications and how they appeared for the respondent.
Pilot study
A pilot study is especially desirable in order to ensure that the questionnaire functions well and
as intended. Bryman and Bell (2007) emphasize its importance in relation to questionnaires, as
the researcher will not have the opportunity to clarify any possible questions or confusions that
the respondent may have. A final purpose of conducting a pilot study is to identify if some
questions are not answered, indicating that they are not understood or poorly instructed – thus
implying additional adjustments (Bryman and Bell, 2007).
--
As a means for enhancing measurement validity, we conducted a pilot study. In the pilot study,
we distributed the questionnaire to our supervisors at NTNU and researchers at SINTEF, who
were familiar with the theoretical background of our questions and thus in a position to evaluate
whether our questions were suited to answer our research question. This first part of the pilot
study contributed to increasing the face validity of the measures. After adjusting the
questionnaire, given these evaluations, it was distributed to three MARGIN companies. These
companies were selected as we possessed sufficient information about each company to evaluate
if the respondents provided the “correct” answers, thus ensuring both that the questionnaire
was able to capture the right information, and the measures’ convergent validity. In addition, this
enabled us to evaluate if the research instrument communicated sufficient information and
instruction to the respondents. Only minor changes were done to the questionnaire – mostly
relating to layout and the definitions provided. We now proceed by describing actions taken in
order to comply with laws and regulations concerning survey research.
Following laws and regulations
NSD is the Data Protection Official for Research for all Norwegian universities (NSD, 2012). A
research project is subject to notification to NSD (i.e. obtaining a license from the Data
Inspectorate) if it gathers, registers, processes or otherwise store information about individuals
through questionnaires; this requirement is still valid even though the final report will not
contain any personal information (NSD, 2012).
--
As a consequence of asking our respondents for their company name and job title (to prevent
duplication), information could be linked to a person through a combination of background
information. Hence, we were required to subject a notification to NSD. By including a
paragraph concerning personal protection in our cover letter and otherwise follow the
recommended guidelines provided by NSD, we received approval to conduct our survey
research. Our approval from NSD is included in Appendix A.4. In the next subsection, the
distribution of a questionnaire is described.
Methodology
37
2.4.3 Distributing the questionnaire
This subsection presents how we approached the task of distributing our questionnaire, in order
to ensure the external validity of our survey research. First, the type of sampling form that we
have utilized is discussed, together with a presentation of our selected sample. Then, measures
to improve response rates are described, together with an overview of the measures we have
employed in order to improve the response rate to the largest extent possible. Finally, we
present a test for nonresponse bias, as a means for evaluating the external validity of the survey
findings, and present the important measure of response rate.
Sampling
Prior to the distribution of a questionnaire, it is important to select a sample, representative for a
larger population, to which you distribute the survey. A representative sample is a prerequisite in
order to ensure external validity, or, in other words, being able to generalize the findings from
the questionnaire to the population it is representing (Bryman and Bell, 2007). Obtaining a
representative sample is extremely difficult as it is dependent on removing any bias it may
contain. Bryman and Bell (2007) provide three sources of bias; using a non-probability sample,
having an inadequate sampling frame1 and occurrence of non-response.
The first source of bias can be prevented using a form of probability sampling; however, it does
not prevent the other forms of biases from occurring. Bryman and Bell (2007) state that
probability sampling is preferable, as it enables statistical significance test results to be
generalized to its population. Non-probability sampling concerns all forms of sampling, other than
probability sampling, and has a weaker external validity compared to the probability sampling.
One type of non-probability sampling is convenience sampling. Bryman and Bell (2007) describe
such a sample as “one that is simply available to the researcher by virtue of its accessibility”
(Bryman and Bell, 2007, p.197). Such samples are prevalent in the field of business and
management research; despite its inability to generalize findings, it can prove quite valuable
when conducting exploratory research (Bryman and Bell, 2007). Further, Bryman and Cramer
(2011) state that the difference in relative representativeness between random samples and
convenience samples, is not necessary as great as implied.
Another common practice in relation to distributing a questionnaire, also covered by the non-
probability sampling category, is the practice of using only one respondent to answer issues
concerning the whole organization (Bryman and Bell, 2007). This practice enables more
organizations to be included in the research, without incurring disproportionate amounts of
increase in cost and time consumption. The size of a sample is also of importance, as sampling
error decreases as the sample size increases; however, increasing the sample entails considerable
cost and time consumption. These aforementioned factors create a compromise with the need
for precision (Bryman and Bell, 2007).
--
1 A sampling frame is a list of all units in the population (Bryman and Bell, 2007) 2 Agreeing on a classification scheme is not straight forward; Statistics Norway, the Federation of Norwegian Industries and a similar study done by Gelderman and van Weele (2005) all utilize different
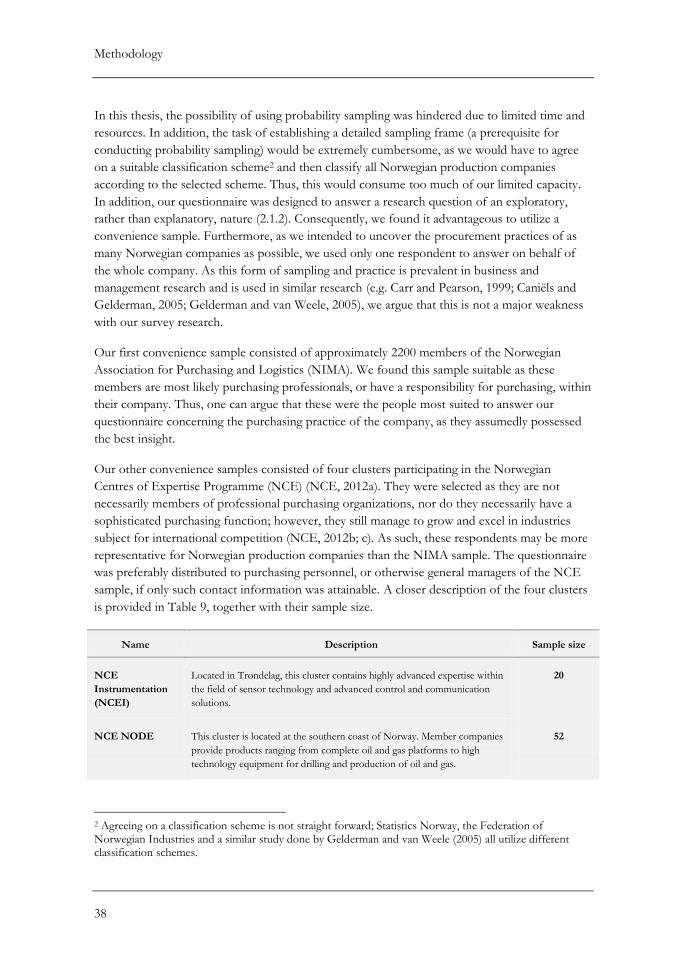
Methodology
38
In this thesis, the possibility of using probability sampling was hindered due to limited time and
resources. In addition, the task of establishing a detailed sampling frame (a prerequisite for
conducting probability sampling) would be extremely cumbersome, as we would have to agree
on a suitable classification scheme2 and then classify all Norwegian production companies
according to the selected scheme. Thus, this would consume too much of our limited capacity.
In addition, our questionnaire was designed to answer a research question of an exploratory,
rather than explanatory, nature (2.1.2). Consequently, we found it advantageous to utilize a
convenience sample. Furthermore, as we intended to uncover the procurement practices of as
many Norwegian companies as possible, we used only one respondent to answer on behalf of
the whole company. As this form of sampling and practice is prevalent in business and
management research and is used in similar research (e.g. Carr and Pearson, 1999; Caniëls and
Gelderman, 2005; Gelderman and van Weele, 2005), we argue that this is not a major weakness
with our survey research.
Our first convenience sample consisted of approximately 2200 members of the Norwegian
Association for Purchasing and Logistics (NIMA). We found this sample suitable as these
members are most likely purchasing professionals, or have a responsibility for purchasing, within
their company. Thus, one can argue that these were the people most suited to answer our
questionnaire concerning the purchasing practice of the company, as they assumedly possessed
the best insight.
Our other convenience samples consisted of four clusters participating in the Norwegian
Centres of Expertise Programme (NCE) (NCE, 2012a). They were selected as they are not
necessarily members of professional purchasing organizations, nor do they necessarily have a
sophisticated purchasing function; however, they still manage to grow and excel in industries
subject for international competition (NCE, 2012b; c). As such, these respondents may be more
representative for Norwegian production companies than the NIMA sample. The questionnaire
was preferably distributed to purchasing personnel, or otherwise general managers of the NCE
sample, if only such contact information was attainable. A closer description of the four clusters
is provided in Table 9, together with their sample size.
Name Description Sample size
NCE
Instrumentation
(NCEI)
Located in Trøndelag, this cluster contains highly advanced expertise within
the field of sensor technology and advanced control and communication
solutions.
20
NCE NODE This cluster is located at the southern coast of Norway. Member companies
provide products ranging from complete oil and gas platforms to high
technology equipment for drilling and production of oil and gas.
52
2 Agreeing on a classification scheme is not straight forward; Statistics Norway, the Federation of Norwegian Industries and a similar study done by Gelderman and van Weele (2005) all utilize different classification schemes.
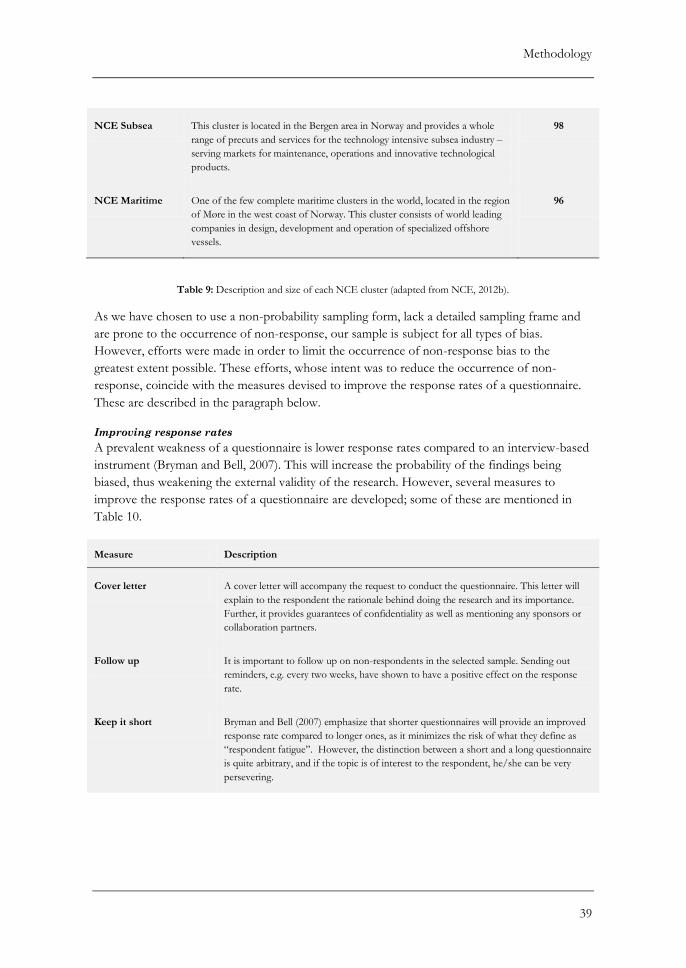
Methodology
39
NCE Subsea This cluster is located in the Bergen area in Norway and provides a whole
range of precuts and services for the technology intensive subsea industry –
serving markets for maintenance, operations and innovative technological
products.
98
NCE Maritime One of the few complete maritime clusters in the world, located in the region
of Møre in the west coast of Norway. This cluster consists of world leading
companies in design, development and operation of specialized offshore
vessels.
96
Table 9: Description and size of each NCE cluster (adapted from NCE, 2012b).
As we have chosen to use a non-probability sampling form, lack a detailed sampling frame and
are prone to the occurrence of non-response, our sample is subject for all types of bias.
However, efforts were made in order to limit the occurrence of non-response bias to the
greatest extent possible. These efforts, whose intent was to reduce the occurrence of non-
response, coincide with the measures devised to improve the response rates of a questionnaire.
These are described in the paragraph below.
Improving response rates
A prevalent weakness of a questionnaire is lower response rates compared to an interview-based
instrument (Bryman and Bell, 2007). This will increase the probability of the findings being
biased, thus weakening the external validity of the research. However, several measures to
improve the response rates of a questionnaire are developed; some of these are mentioned in
Table 10.
Measure Description
Cover letter A cover letter will accompany the request to conduct the questionnaire. This letter will
explain to the respondent the rationale behind doing the research and its importance.
Further, it provides guarantees of confidentiality as well as mentioning any sponsors or
collaboration partners.
Follow up It is important to follow up on non-respondents in the selected sample. Sending out
reminders, e.g. every two weeks, have shown to have a positive effect on the response
rate.
Keep it short Bryman and Bell (2007) emphasize that shorter questionnaires will provide an improved
response rate compared to longer ones, as it minimizes the risk of what they define as
“respondent fatigue”. However, the distinction between a short and a long questionnaire
is quite arbitrary, and if the topic is of interest to the respondent, he/she can be very
persevering.
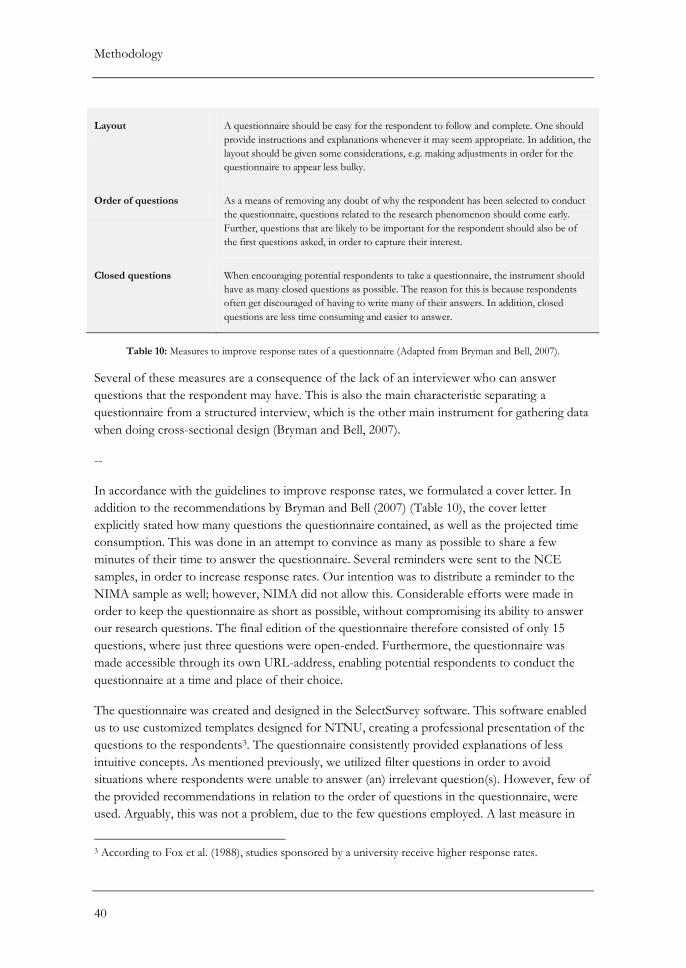
Methodology
40
Layout A questionnaire should be easy for the respondent to follow and complete. One should
provide instructions and explanations whenever it may seem appropriate. In addition, the
layout should be given some considerations, e.g. making adjustments in order for the
questionnaire to appear less bulky.
Order of questions As a means of removing any doubt of why the respondent has been selected to conduct
the questionnaire, questions related to the research phenomenon should come early.
Further, questions that are likely to be important for the respondent should also be of
the first questions asked, in order to capture their interest.
Closed questions When encouraging potential respondents to take a questionnaire, the instrument should
have as many closed questions as possible. The reason for this is because respondents
often get discouraged of having to write many of their answers. In addition, closed
questions are less time consuming and easier to answer.
Table 10: Measures to improve response rates of a questionnaire (Adapted from Bryman and Bell, 2007).
Several of these measures are a consequence of the lack of an interviewer who can answer
questions that the respondent may have. This is also the main characteristic separating a
questionnaire from a structured interview, which is the other main instrument for gathering data
when doing cross-sectional design (Bryman and Bell, 2007).
--
In accordance with the guidelines to improve response rates, we formulated a cover letter. In
addition to the recommendations by Bryman and Bell (2007) (Table 10), the cover letter
explicitly stated how many questions the questionnaire contained, as well as the projected time
consumption. This was done in an attempt to convince as many as possible to share a few
minutes of their time to answer the questionnaire. Several reminders were sent to the NCE
samples, in order to increase response rates. Our intention was to distribute a reminder to the
NIMA sample as well; however, NIMA did not allow this. Considerable efforts were made in
order to keep the questionnaire as short as possible, without compromising its ability to answer
our research questions. The final edition of the questionnaire therefore consisted of only 15
questions, where just three questions were open-ended. Furthermore, the questionnaire was
made accessible through its own URL-address, enabling potential respondents to conduct the
questionnaire at a time and place of their choice.
The questionnaire was created and designed in the SelectSurvey software. This software enabled
us to use customized templates designed for NTNU, creating a professional presentation of the
questions to the respondents3. The questionnaire consistently provided explanations of less
intuitive concepts. As mentioned previously, we utilized filter questions in order to avoid
situations where respondents were unable to answer (an) irrelevant question(s). However, few of
the provided recommendations in relation to the order of questions in the questionnaire, were
used. Arguably, this was not a problem, due to the few questions employed. A last measure in
3 According to Fox et al. (1988), studies sponsored by a university receive higher response rates.
Methodology
41
order to encourage as many respondents as possible to conduct the questionnaire, was to award
those who completed the questionnaire with a pamphlet containing the main findings from the
questionnaire. The questionnaire itself is provided in appendix A.3.
Nonresponse bias test and response rates
If respondents differ considerably from nonrespondents, one cannot say directly how the whole
sample would have responded – a considerable threat for the external validity of the survey
research (Armstrong and Overton, 1977). Armstrong and Overton (1977) provide an
extrapolation method for estimating nonresponse bias, which is based on the assumption that
late respondents are more like nonrespondents. The method classifies early and late respondents
of the questionnaire in distinct groups, which are then compared on relevant variables in order
to establish the presence of nonresponse bias (Gelderman and van Weele, 2005).
Response rate is a measure indicating how carefully a survey study is constructed (Frohlich,
2002). With a higher response rate, the sample increases; as such, the need to follow up potential
respondents and the concern for non-response bias is reduced (Fox et al., 1988). Frohlich (2002)
states that with a low response rate there is a danger that the few received respondents are the
more prosperous companies. It is difficult to agree on what is an acceptable response rate,
however, Frohlich (2002) find that the average response rate is about 32%.
The results from our test for nonresponse bias and discussion of response rates are provided in
chapter 6, which provides the results from our survey research. We now proceed by providing
an overview over the methods used in our analysis.
2.4.4 Analysis of survey data
This subsection provides a presentation of the methods most frequently used for analyzing our
survey data. First, we present the different categories a variable may be classified as. Next, we
describe the most important methods used in our bivariate analysis. Finally, we present the
concept of factor analysis, as this analysis was used to derive some important findings.
Providing a description of all the available methods for survey data analysis and their underlying
assumptions is not the intention of this chapter. Consequently, some of the methods utilized are
regarded known to the reader; else, the reader is referred to relevant literature for further
elaboration where this is regarded orderly.
Type of variable
A variable, in addition to being either dependent or independent – where the latter affects the
former – can be categorized as one of four main types (Bryman and Bell, 2007). These are
provided in Table 11 below.
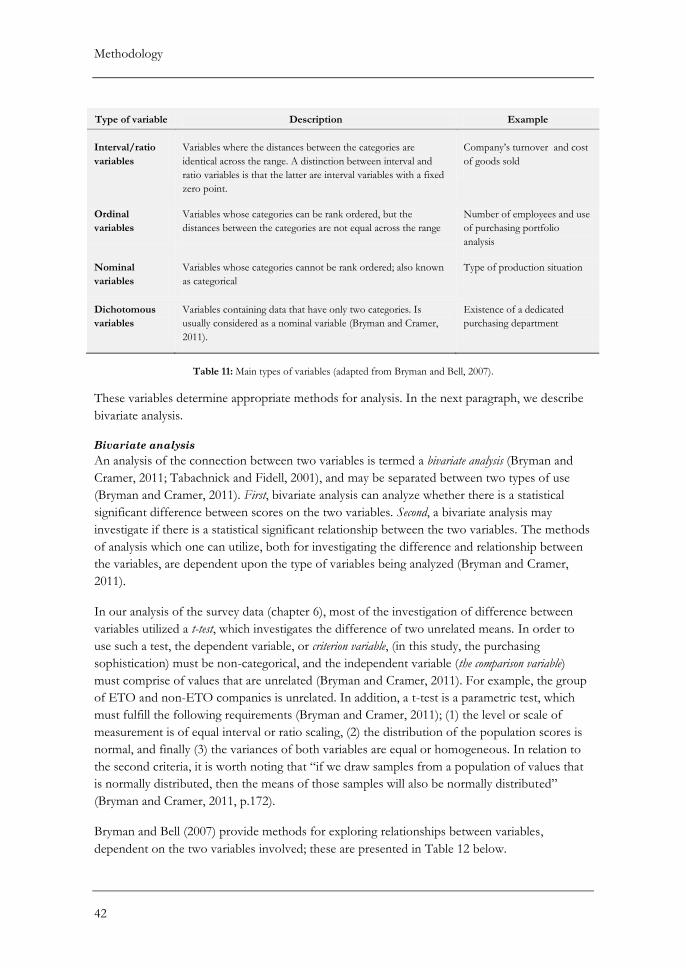
Methodology
42
Type of variable Description Example
Interval/ratio
variables
Variables where the distances between the categories are
identical across the range. A distinction between interval and
ratio variables is that the latter are interval variables with a fixed
zero point.
Company’s turnover and cost
of goods sold
Ordinal
variables
Variables whose categories can be rank ordered, but the
distances between the categories are not equal across the range
Number of employees and use
of purchasing portfolio
analysis
Nominal
variables
Variables whose categories cannot be rank ordered; also known
as categorical
Type of production situation
Dichotomous
variables
Variables containing data that have only two categories. Is
usually considered as a nominal variable (Bryman and Cramer,
2011).
Existence of a dedicated
purchasing department
Table 11: Main types of variables (adapted from Bryman and Bell, 2007).
These variables determine appropriate methods for analysis. In the next paragraph, we describe
bivariate analysis.
Bivariate analysis
An analysis of the connection between two variables is termed a bivariate analysis (Bryman and
Cramer, 2011; Tabachnick and Fidell, 2001), and may be separated between two types of use
(Bryman and Cramer, 2011). First, bivariate analysis can analyze whether there is a statistical
significant difference between scores on the two variables. Second, a bivariate analysis may
investigate if there is a statistical significant relationship between the two variables. The methods
of analysis which one can utilize, both for investigating the difference and relationship between
the variables, are dependent upon the type of variables being analyzed (Bryman and Cramer,
2011).
In our analysis of the survey data (chapter 6), most of the investigation of difference between
variables utilized a t-test, which investigates the difference of two unrelated means. In order to
use such a test, the dependent variable, or criterion variable, (in this study, the purchasing
sophistication) must be non-categorical, and the independent variable (the comparison variable)
must comprise of values that are unrelated (Bryman and Cramer, 2011). For example, the group
of ETO and non-ETO companies is unrelated. In addition, a t-test is a parametric test, which
must fulfill the following requirements (Bryman and Cramer, 2011); (1) the level or scale of
measurement is of equal interval or ratio scaling, (2) the distribution of the population scores is
normal, and finally (3) the variances of both variables are equal or homogeneous. In relation to
the second criteria, it is worth noting that “if we draw samples from a population of values that
is normally distributed, then the means of those samples will also be normally distributed”
(Bryman and Cramer, 2011, p.172).
Bryman and Bell (2007) provide methods for exploring relationships between variables,
dependent on the two variables involved; these are presented in Table 12 below.
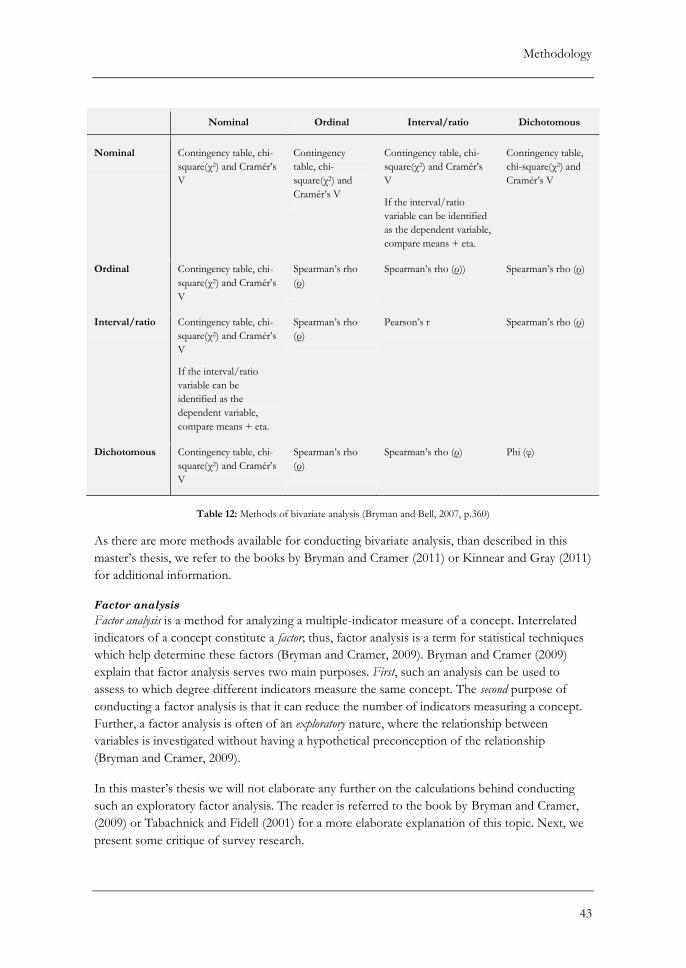
Methodology
43
Nominal Ordinal Interval/ratio Dichotomous
Nominal Contingency table, chi-
square(χ2) and Cramér’s
V
Contingency
table, chi-
square(χ2) and
Cramér’s V
Contingency table, chi-
square(χ2) and Cramér’s
V
If the interval/ratio
variable can be identified
as the dependent variable,
compare means + eta.
Contingency table,
chi-square(χ2) and
Cramér’s V
Ordinal Contingency table, chi-
square(χ2) and Cramér’s
V
Spearman’s rho
(ρ)
Spearman’s rho (ρ)) Spearman’s rho (ρ)
Interval/ratio Contingency table, chi-
square(χ2) and Cramér’s
V
If the interval/ratio
variable can be
identified as the
dependent variable,
compare means + eta.
Spearman’s rho
(ρ)
Pearson’s r Spearman’s rho (ρ)
Dichotomous Contingency table, chi-
square(χ2) and Cramér’s
V
Spearman’s rho
(ρ)
Spearman’s rho (ρ) Phi (φ)
Table 12: Methods of bivariate analysis (Bryman and Bell, 2007, p.360)
As there are more methods available for conducting bivariate analysis, than described in this
master’s thesis, we refer to the books by Bryman and Cramer (2011) or Kinnear and Gray (2011)
for additional information.
Factor analysis
Factor analysis is a method for analyzing a multiple-indicator measure of a concept. Interrelated
indicators of a concept constitute a factor; thus, factor analysis is a term for statistical techniques
which help determine these factors (Bryman and Cramer, 2009). Bryman and Cramer (2009)
explain that factor analysis serves two main purposes. First, such an analysis can be used to
assess to which degree different indicators measure the same concept. The second purpose of
conducting a factor analysis is that it can reduce the number of indicators measuring a concept.
Further, a factor analysis is often of an exploratory nature, where the relationship between
variables is investigated without having a hypothetical preconception of the relationship
(Bryman and Cramer, 2009).
In this master’s thesis we will not elaborate any further on the calculations behind conducting
such an exploratory factor analysis. The reader is referred to the book by Bryman and Cramer,
(2009) or Tabachnick and Fidell (2001) for a more elaborate explanation of this topic. Next, we
present some critique of survey research.
Methodology
44
2.4.5 Critique on survey research
Quantitative research has been a victim of some critique, especially from supporters of
qualitative research (Bryman and Bell, 2007). Bryman and Bell (2007) provide a short description
of the most prevalent critique; this is summarized in Table 13.
Critique Description
The measurement process possesses
an artificial and spurious sense of
precision and accuracy
The measures developed and the concepts they are supposed to reveal are
assumed rather than real. In addition, it is presumed that respondents
interpret the key terms in a question similarly, which is faulty according to
critics.
The reliance on instruments and
procedures hinder the connection
between research and everyday life
How can we be certain that a respondent possesses the required knowledge
to answer a question? Are all the respondents in agreement of the
importance of the investigated topic in their everyday life?
The analysis of relationships between
variables creates a static view of social
life that is independent of people’s
lives
How can we be certain that a relationship between two or more variables
has not been produced by the individuals to whom it applies?
Table 13: Criticisms of quantitative research (adapted from Bryman and Bell, 2007)
Survey research and causality
According to Bryman and Cramer (2011), establishing causality between variable is one of the
major concerns among quantitative researchers. The authors proceed by explaining that in order
for there to be a causal relationship, several criteria’s must be met. First, there must be an
established relationship between the variables. Second, the relationship must not be spurious, i.e.
there must be a “true” relationship between the two variables, not including any influence from
a common variable. Third, the cause must precede the effect, the time order of the variables in
question must be established. However, survey research has a limited capacity in establishing
causal relationships (Bryman and Cramer, 2011). The authors proceed by explaining that when
doing survey research, data is collected simultaneously; consequently, it is impossible to establish
the time order of the variables. Further, as variables are not capable of being manipulated (e.g.
company size) the researcher has a limited ability to assign cause and effect (Bryman and
Cramer, 2011). Hence, it is apparent that the last criterion for establishing a causal relationship
between variables is extremely difficult to achieve with survey research. Bryman and Cramer
(2011) state that “survey designs are often called correlation designs to denote the tendency for
such research to be able to reveal relationships between variables and to draw attention to their
limited capacity in connection with the elucidation of causal relationships” (p.15). Next, an
evaluation of the survey research is provided.
2.4.6 Evaluating the survey research
We now conclude the section concerning survey research by evaluating the survey research
process in relation to the three criteria for ensuring quality of quantitative research; replicability,
Methodology
45
reliability and validity (2.4.1). A discussion of each criterion is presented. Finally, a conclusion
with an assessment of the overall quality of this survey research is provided.
Replicability
In order to achieve a high level of replicability of our survey research, we have thoroughly
presented our research process or otherwise referred to relevant literature for a further
elaboration on the topic. An appendix containing the questionnaire is also included in this
master’s thesis (A.3), to further facilitate the replicability of this survey research. Hence, we
argue that we have achieved a high level of replicability.
Reliability
This criterion of quantitative research quality examines whether a measure of a concept is stable,
and, as such, the ability of repeating the results from the study (2.4.1). When examining the
reliability of a measure, we were unable to evaluate the external reliability because of our limited
time perspective (2.4.2). However, the internal validity was assessed by calculating the
Cronbach’s alpha. Hence, we argue that we have initiated all means possible to achieve a high as
possible reliability of this survey research.
Validity
Validity is the most important determinant of qualitative research quality. It assesses the integrity
of the generated conclusions from the research (2.4.1). As a means for enhancing the overall
validity of our survey research, we started by ensuring measurement validity through the underlying
face -, concurrent - and convergent validity. Face validity of the measures employed was
enhanced through our pilot study. In addition, we adopted a multiple-indicator construct from a
similar study by two recognized researchers within this field of research, in order to measure
purchasing sophistication. Concurrent validity was sought through a pilot study, distributing the
questionnaire to three companies in which we possessed enough information to evaluate the
answers. However, we did not receive the answers from these companies, before the agreed
distribution date with NIMA and NCEI. Nevertheless, as a consequence of the questionnaire
being thoroughly prepared, there was no need to make any adjustments to the questionnaire
once we had received the answers from our collaborating companies. Convergent validity was
enhanced for the measure of purchasing sophistication, as our literature review (chapter 4)
converged on the same indicators as those adopted by Gelderman and van Weele (2005).
A recognized weakness of survey research is that it is extremely hard to establish a causal
relationship (2.4.5); hence, survey research is prone for having a weak internal validity. As we have
established several significant relationships in our survey analysis, it is of further research
(employing other research methods) to establish that cause precedes effect in these relationships,
and, as such, be able to establish causality between the variables.
External validity is mainly attended to through a careful distribution of the questionnaire. Our
sample is prone to all three sources of bias in relation to obtaining a representative sample
(2.4.3). The first and the second types of bias (non-probability sampling and inadequate
sampling frame, respectively) are related; a sampling frame is necessary in order to conduct
probability sampling. For reasons mentioned earlier (primarily limited resources and time), we
Methodology
46
were not able to establish a sampling frame; thus, we could not conduct a probability sampling
form. However, the use of convenience sampling is prevalent in similar research, and the relative
representativeness between random samples and convenience samples, is not necessary as great
as implied (2.4.3). Consequently, we argue that this is not a major weakness with our survey
research. We do, however, have to be cautious when generalizing our survey findings, due to the
lack of a sampling frame. The last type of bias (nonresponse) received considerable attention, in
the form of increasing response rate, and guidelines were followed to the letter. However, we
were not able to issue a reminder to the NIMA sample, as the association would not allow this.
For the NCE samples, where we contacted each company individually, a reminder considerably
increased our response rates4. Hence, we argue that the NIMA sample could have been
considerably larger if a reminder was distributed. In addition, we promised a pamphlet to the
respondents as a reward for answering the questionnaire. We are convinced that this improved
our response rates and reduced the occurrence of non-response bias.
Ecological validity has received little attention when conducting our survey research, mostly
because it is a less prevalent type of validity. However, we argue that our mixed methods
approach in this master’s thesis have ensured a strong ecological validity, as our action research
has a strong foundation in the social setting, thus contributing to making the findings applicable
to a social setting. Next, we provide an overall evaluation of the quality of survey research.
Overall quality of the survey research
From our previous discussion it is evident that we have ensured a high level of replicability and
as high level of reliability as possible for our survey research. In relation to validity, several
measures were employed in order to enhance the measurement validity, which secured the
validity of our most important measures. The external validity of our survey research was
weakened by a lack of a sampling frame. This prevented us from using a form of probability
sampling. However, several precautions were taken in order to decrease the occurrence of non-
response bias, thus improving the external validity of our results. Ecological validity was
attended to by applying a mixed methods approach. In conclusion, we argue that a thorough
survey research process has ensured a high quality of our survey research, even though we have
a somewhat weaker external validity. Through using quality measures of quantitative research as
guidelines for doing survey research, we argue that we have conducted the research in a best
possible way. In the next section, we briefly describe the process of conducting literature
reviews.
2.5 Literature reviews
According to Walliman and Buckler (2008), a literature review outlines the theoretical aspects
and previous research of an investigated phenomenon. As such, it is an important method for
developing a theoretical framework (Dubois and Gadde, 2002). Hart (2001) follows in the same
line of argument, as he emphasizes the importance of doing a literature research in order to
become completely familiar with the investigated phenomenon. “A thorough critical evaluation
4 We did not send a remainder to the NCEI sample as we achieved a satisfactory response rate immediately
after distributing the survey.
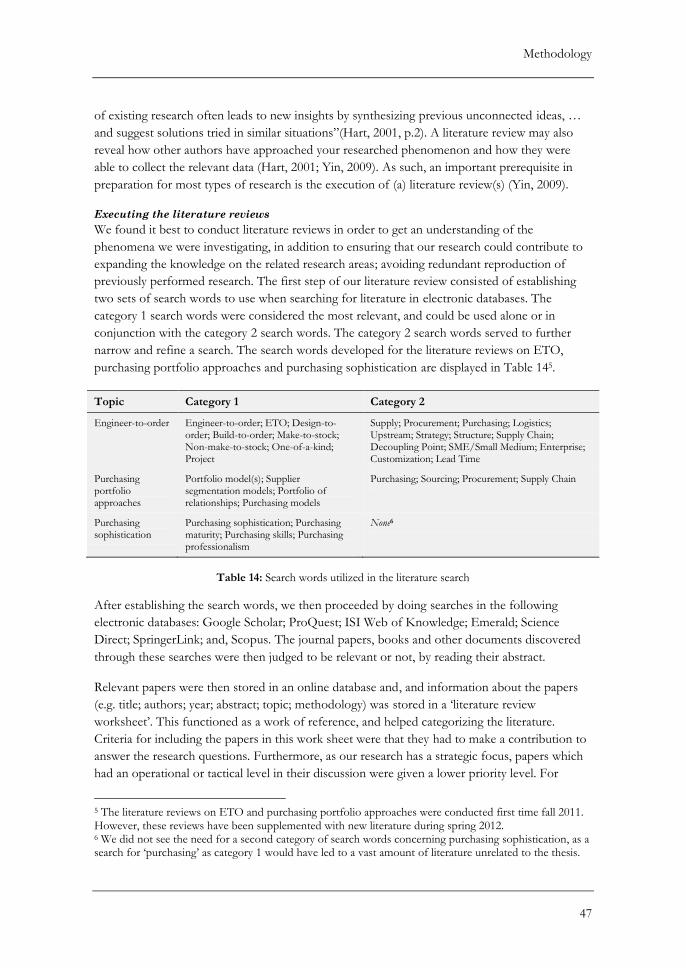
Methodology
47
of existing research often leads to new insights by synthesizing previous unconnected ideas, …
and suggest solutions tried in similar situations”(Hart, 2001, p.2). A literature review may also
reveal how other authors have approached your researched phenomenon and how they were
able to collect the relevant data (Hart, 2001; Yin, 2009). As such, an important prerequisite in
preparation for most types of research is the execution of (a) literature review(s) (Yin, 2009).
Executing the literature reviews
We found it best to conduct literature reviews in order to get an understanding of the
phenomena we were investigating, in addition to ensuring that our research could contribute to
expanding the knowledge on the related research areas; avoiding redundant reproduction of
previously performed research. The first step of our literature review consisted of establishing
two sets of search words to use when searching for literature in electronic databases. The
category 1 search words were considered the most relevant, and could be used alone or in
conjunction with the category 2 search words. The category 2 search words served to further
narrow and refine a search. The search words developed for the literature reviews on ETO,
purchasing portfolio approaches and purchasing sophistication are displayed in Table 145.
Topic Category 1 Category 2
Engineer-to-order Engineer-to-order; ETO; Design-to-order; Build-to-order; Make-to-stock; Non-make-to-stock; One-of-a-kind; Project
Supply; Procurement; Purchasing; Logistics; Upstream; Strategy; Structure; Supply Chain; Decoupling Point; SME/Small Medium; Enterprise; Customization; Lead Time
Purchasing portfolio approaches
Portfolio model(s); Supplier segmentation models; Portfolio of relationships; Purchasing models
Purchasing; Sourcing; Procurement; Supply Chain
Purchasing sophistication
Purchasing sophistication; Purchasing maturity; Purchasing skills; Purchasing professionalism
None6
Table 14: Search words utilized in the literature search
After establishing the search words, we then proceeded by doing searches in the following
electronic databases: Google Scholar; ProQuest; ISI Web of Knowledge; Emerald; Science
Direct; SpringerLink; and, Scopus. The journal papers, books and other documents discovered
through these searches were then judged to be relevant or not, by reading their abstract.
Relevant papers were then stored in an online database and, and information about the papers
(e.g. title; authors; year; abstract; topic; methodology) was stored in a ‘literature review
worksheet’. This functioned as a work of reference, and helped categorizing the literature.
Criteria for including the papers in this work sheet were that they had to make a contribution to
answer the research questions. Furthermore, as our research has a strategic focus, papers which
had an operational or tactical level in their discussion were given a lower priority level. For
5 The literature reviews on ETO and purchasing portfolio approaches were conducted first time fall 2011. However, these reviews have been supplemented with new literature during spring 2012. 6 We did not see the need for a second category of search words concerning purchasing sophistication, as a search for ‘purchasing’ as category 1 would have led to a vast amount of literature unrelated to the thesis.
Methodology
48
papers in which we were uncertain about their relative quality, we utilized the Association of
Business Schools’ (ABS) “Academic Journal Quality Guide” to help us determine its quality. In
the next section, some concluding remarks on methodology are presented.
2.6 Concluding remarks on methodology
In conclusion, we feel that a conscious attitude to methodology throughout our research process
has been very beneficial, and that the methodology used has been solid. Through investigating
how we could approach our research questions, and spend the sufficient amount of time in
planning the chosen methods, we avoided common pitfalls and increased our effectiveness
throughout the research process. As seen from the aforementioned tests on research quality,
both in relation to the action research (2.3.5) and survey research (2.4.6) we have consciously
taken actions to secure the quality of the research. The mixed method research strategy has
strengthened both research methods used in this master’s thesis, by facilitating versatile angles to
the overall research problem in taking both a micro- and macro perspective. We feel that we, to
the limit of our capacity, have conducted research of a high quality. This increases the value for
other researchers wanting to check, or build upon, our findings.
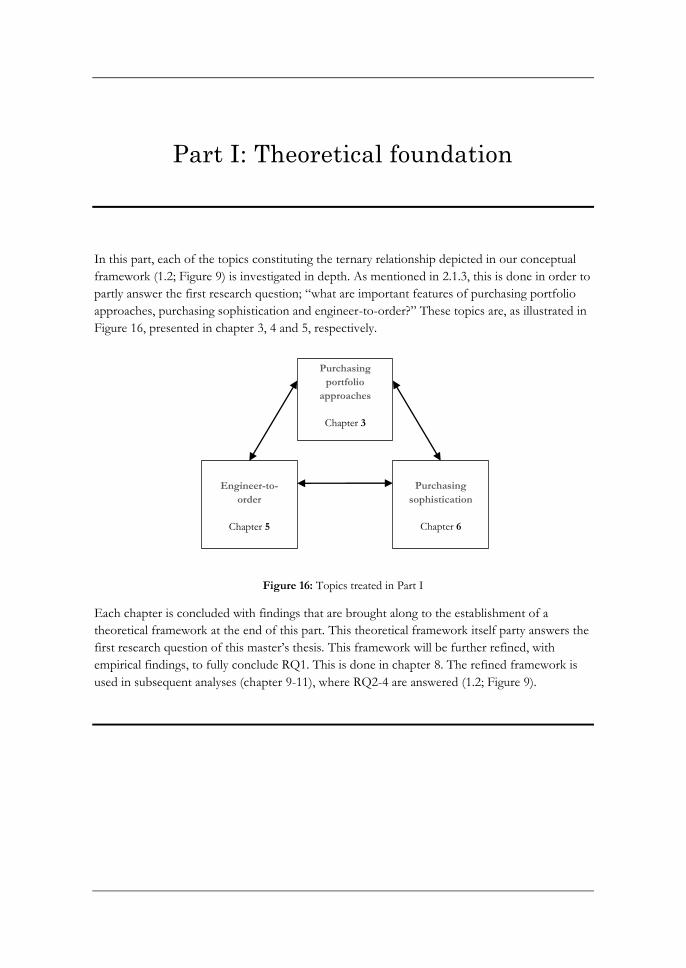
Part I: Theoretical foundation
In this part, each of the topics constituting the ternary relationship depicted in our conceptual
framework (1.2; Figure 9) is investigated in depth. As mentioned in 2.1.3, this is done in order to
partly answer the first research question; “what are important features of purchasing portfolio
approaches, purchasing sophistication and engineer-to-order?” These topics are, as illustrated in
Figure 16, presented in chapter 3, 4 and 5, respectively.
Figure 16: Topics treated in Part I
Each chapter is concluded with findings that are brought along to the establishment of a
theoretical framework at the end of this part. This theoretical framework itself party answers the
first research question of this master’s thesis. This framework will be further refined, with
empirical findings, to fully conclude RQ1. This is done in chapter 8. The refined framework is
used in subsequent analyses (chapter 9-11), where RQ2-4 are answered (1.2; Figure 9).
Engineer-to-
order
Chapter 5
Purchasing
portfolio
approaches
Chapter 3
Purchasing
sophistication
Chapter 6
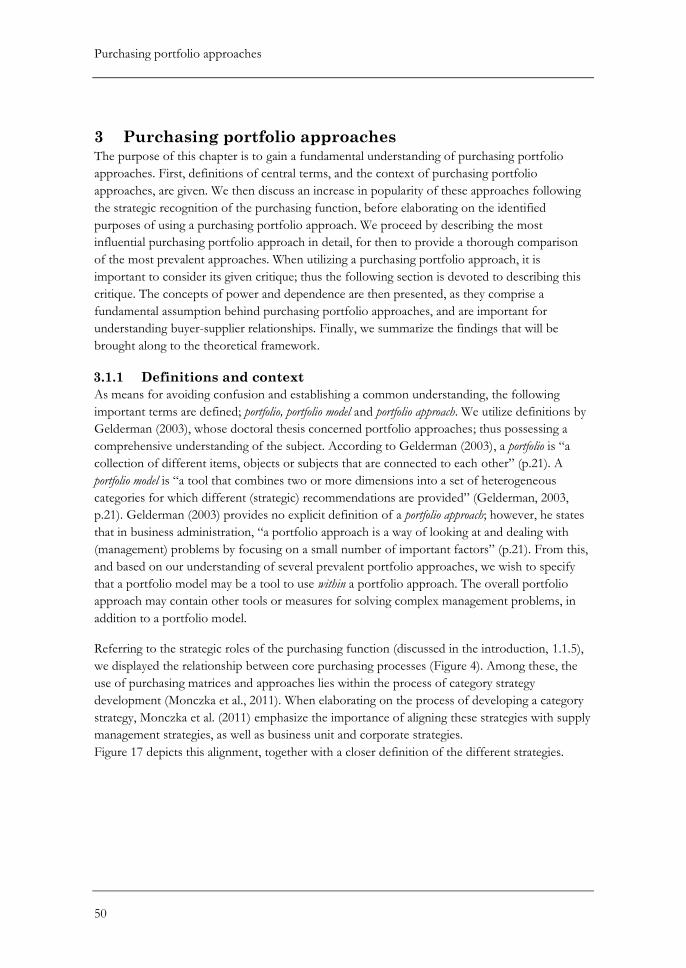
Purchasing portfolio approaches
50
3 Purchasing portfolio approaches The purpose of this chapter is to gain a fundamental understanding of purchasing portfolio
approaches. First, definitions of central terms, and the context of purchasing portfolio
approaches, are given. We then discuss an increase in popularity of these approaches following
the strategic recognition of the purchasing function, before elaborating on the identified
purposes of using a purchasing portfolio approach. We proceed by describing the most
influential purchasing portfolio approach in detail, for then to provide a thorough comparison
of the most prevalent approaches. When utilizing a purchasing portfolio approach, it is
important to consider its given critique; thus the following section is devoted to describing this
critique. The concepts of power and dependence are then presented, as they comprise a
fundamental assumption behind purchasing portfolio approaches, and are important for
understanding buyer-supplier relationships. Finally, we summarize the findings that will be
brought along to the theoretical framework.
3.1.1 Definitions and context
As means for avoiding confusion and establishing a common understanding, the following
important terms are defined; portfolio, portfolio model and portfolio approach. We utilize definitions by
Gelderman (2003), whose doctoral thesis concerned portfolio approaches; thus possessing a
comprehensive understanding of the subject. According to Gelderman (2003), a portfolio is “a
collection of different items, objects or subjects that are connected to each other” (p.21). A
portfolio model is “a tool that combines two or more dimensions into a set of heterogeneous
categories for which different (strategic) recommendations are provided” (Gelderman, 2003,
p.21). Gelderman (2003) provides no explicit definition of a portfolio approach; however, he states
that in business administration, “a portfolio approach is a way of looking at and dealing with
(management) problems by focusing on a small number of important factors” (p.21). From this,
and based on our understanding of several prevalent portfolio approaches, we wish to specify
that a portfolio model may be a tool to use within a portfolio approach. The overall portfolio
approach may contain other tools or measures for solving complex management problems, in
addition to a portfolio model.
Referring to the strategic roles of the purchasing function (discussed in the introduction, 1.1.5),
we displayed the relationship between core purchasing processes (Figure 4). Among these, the
use of purchasing matrices and approaches lies within the process of category strategy
development (Monczka et al., 2011). When elaborating on the process of developing a category
strategy, Monczka et al. (2011) emphasize the importance of aligning these strategies with supply
management strategies, as well as business unit and corporate strategies.
Figure 17 depicts this alignment, together with a closer definition of the different strategies.
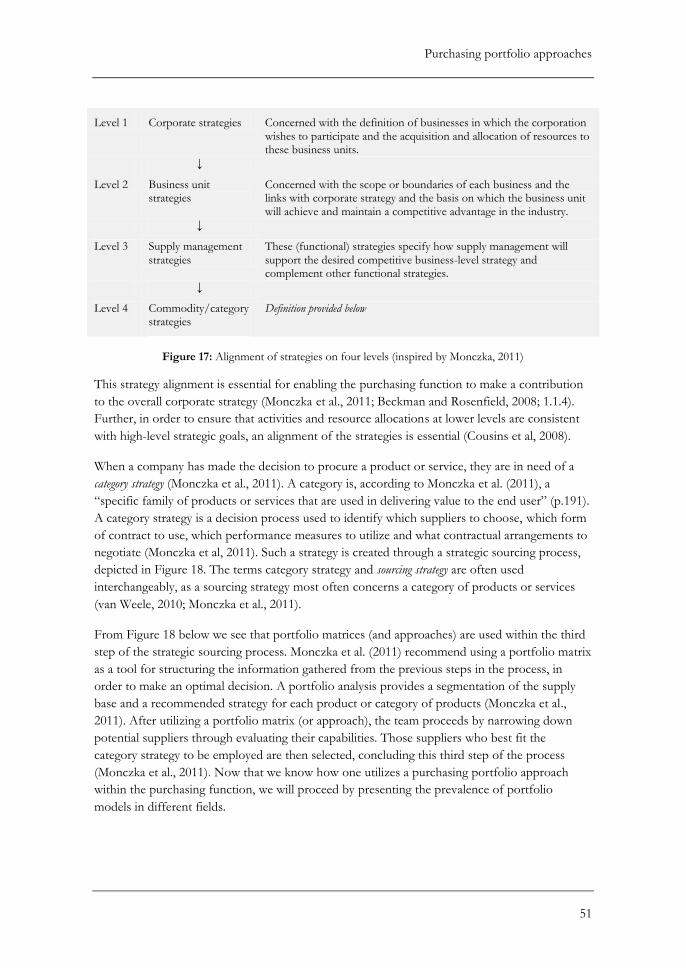
Purchasing portfolio approaches
51
Level 1 Corporate strategies Concerned with the definition of businesses in which the corporation wishes to participate and the acquisition and allocation of resources to these business units.
↓
Level 2 Business unit strategies
Concerned with the scope or boundaries of each business and the links with corporate strategy and the basis on which the business unit will achieve and maintain a competitive advantage in the industry.
↓
Level 3 Supply management strategies
These (functional) strategies specify how supply management will support the desired competitive business-level strategy and complement other functional strategies.
↓
Level 4 Commodity/category strategies
Definition provided below
Figure 17: Alignment of strategies on four levels (inspired by Monczka, 2011)
This strategy alignment is essential for enabling the purchasing function to make a contribution
to the overall corporate strategy (Monczka et al., 2011; Beckman and Rosenfield, 2008; 1.1.4).
Further, in order to ensure that activities and resource allocations at lower levels are consistent
with high-level strategic goals, an alignment of the strategies is essential (Cousins et al, 2008).
When a company has made the decision to procure a product or service, they are in need of a
category strategy (Monczka et al., 2011). A category is, according to Monczka et al. (2011), a
“specific family of products or services that are used in delivering value to the end user” (p.191).
A category strategy is a decision process used to identify which suppliers to choose, which form
of contract to use, which performance measures to utilize and what contractual arrangements to
negotiate (Monczka et al, 2011). Such a strategy is created through a strategic sourcing process,
depicted in Figure 18. The terms category strategy and sourcing strategy are often used
interchangeably, as a sourcing strategy most often concerns a category of products or services
(van Weele, 2010; Monczka et al., 2011).
From Figure 18 below we see that portfolio matrices (and approaches) are used within the third
step of the strategic sourcing process. Monczka et al. (2011) recommend using a portfolio matrix
as a tool for structuring the information gathered from the previous steps in the process, in
order to make an optimal decision. A portfolio analysis provides a segmentation of the supply
base and a recommended strategy for each product or category of products (Monczka et al.,
2011). After utilizing a portfolio matrix (or approach), the team proceeds by narrowing down
potential suppliers through evaluating their capabilities. Those suppliers who best fit the
category strategy to be employed are then selected, concluding this third step of the process
(Monczka et al., 2011). Now that we know how one utilizes a purchasing portfolio approach
within the purchasing function, we will proceed by presenting the prevalence of portfolio
models in different fields.
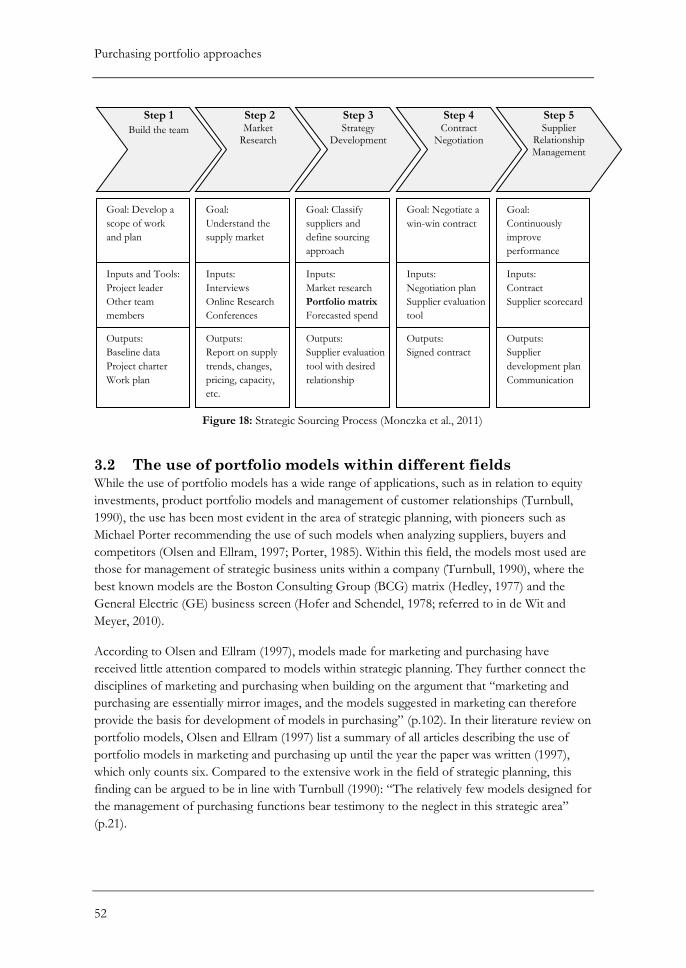
Purchasing portfolio approaches
52
3.2 The use of portfolio models within different fields
While the use of portfolio models has a wide range of applications, such as in relation to equity
investments, product portfolio models and management of customer relationships (Turnbull,
1990), the use has been most evident in the area of strategic planning, with pioneers such as
Michael Porter recommending the use of such models when analyzing suppliers, buyers and
competitors (Olsen and Ellram, 1997; Porter, 1985). Within this field, the models most used are
those for management of strategic business units within a company (Turnbull, 1990), where the
best known models are the Boston Consulting Group (BCG) matrix (Hedley, 1977) and the
General Electric (GE) business screen (Hofer and Schendel, 1978; referred to in de Wit and
Meyer, 2010).
According to Olsen and Ellram (1997), models made for marketing and purchasing have
received little attention compared to models within strategic planning. They further connect the
disciplines of marketing and purchasing when building on the argument that “marketing and
purchasing are essentially mirror images, and the models suggested in marketing can therefore
provide the basis for development of models in purchasing” (p.102). In their literature review on
portfolio models, Olsen and Ellram (1997) list a summary of all articles describing the use of
portfolio models in marketing and purchasing up until the year the paper was written (1997),
which only counts six. Compared to the extensive work in the field of strategic planning, this
finding can be argued to be in line with Turnbull (1990): “The relatively few models designed for
the management of purchasing functions bear testimony to the neglect in this strategic area”
(p.21).
Step 1
Build the team
Step 2 Market
Research
Step 3 Strategy
Development
Step 4 Contract
Negotiation
Step 5 Supplier
Relationship Management
Goal: Develop a
scope of work
and plan
Goal:
Understand the
supply market
Goal: Classify
suppliers and
define sourcing
approach
Goal: Negotiate a
win-win contract
Goal:
Continuously
improve
performance
Inputs and Tools:
Project leader
Other team
members
Outputs:
Baseline data
Project charter
Work plan
Inputs:
Interviews
Online Research
Conferences
Inputs:
Market research
Portfolio matrix
Forecasted spend
Outputs:
Report on supply
trends, changes,
pricing, capacity,
etc.
Outputs:
Supplier evaluation
tool with desired
relationship
Inputs:
Negotiation plan
Supplier evaluation
tool
Inputs:
Contract
Supplier scorecard
Outputs:
Signed contract Outputs:
Supplier
development plan
Communication
Figure 18: Strategic Sourcing Process (Monczka et al., 2011)
Purchasing portfolio approaches
53
3.2.1 The development of purchasing portfolio approaches
Turnbull made his statements on the strategic neglect of purchasing in 1990, but since then, the
field of purchasing has grown into what we today would call a strategic function (Cousins et al.,
2008) and contributor to competitive advantage (Mol, 2003) (1.1.4). Alongside this development, the
usage and development of new purchasing portfolio approaches has also been increasing (e.g.
Lilliecreutz and Ydreskog, 1999; Gelderman and van Weele, 2005; Caniëls and Gelderman, 2007;
Day et al., 2010). Portfolio approaches have been expanded to incorporate concerns for areas
such as supplier involvement in new product development (Wynstra and Pierick, 2000), e-
purchasing (Croom, 2000), the specification process (Nellore and Söderquist, 2000), and
sourcing in the global context (Trautmann et al., 2009; Gelderman and Semeijn, 2006). A recent
trend of sustainable sourcing has spawned new portfolio approaches incorporating an
environmental concern (Cousins et al, 2008; Pagell et al, 2010).
3.3 Purposes of using a purchasing portfolio approach
We have now elaborated on the context in which a purchasing portfolio approach is utilized and
its development. In this section, a presentation of the main identified purposes of using a
purchasing portfolio approach is provided. First, the most commonly cited purposes are
presented. Concluding this section, is a presentation of the importance, characteristics and a
company’s capacity of handling supplier relationships, and its relation to the purposes of using a
purchasing portfolio approach.
3.3.1 Main purposes of using a purchasing portfolio approach
Turnbull (1990) states that management decisions are interrelated, and argues that portfolio
analysis and planning considers this, as it provides an integrated approach to the management of
different aspects of business. Another application is to help optimize the use of a company’s
limited resources over its different supplier relationships (Wind and Mahajan, 1981; Turnbull,
1990; Pagell et al., 2010). Olsen and Ellram (1997) suggest that a portfolio model should be used
as an analytical tool to organize information, and develop a classification framework for the
items being analyzed. This ability of a purchasing portfolio approach, breaking down complex
problems into their most important dimensions, has made it one of the most important tools
available to purchasing (Syson, 1992; referred to in Trautmann et al, 2009).
According to Nellore and Söderquist (2000), the purpose of using portfolio models is to
“optimize the use of capabilities of different suppliers” (p.263). Gelderman and van Weele
(2002) discover, through a case study of a major Dutch chemical company, that the use of
Kraljic’s purchasing portfolio approach “seems to be an effective tool for discussing, visualizing
and illustrating the possibilities for differentiated purchasing and supplier strategies” (p.35). This
is also recognized by Smart and Dudas (2007), who explain that it is the simplicity of a portfolio
matrix and the facilitation of communication that makes it attractive for practitioners. Day et al.
(2010) state that the actual output of a segmentation model (defined in similar terms and used
interchangeably with purchasing portfolio model) is an assessment of the supply base as well as a
contribution to the decision making on relational investments – investments made for gaining
competitive advantages through collaboration. In the long term, purchasing portfolio models
can be used to study the progress of a relationship over time, and support strategic decision
Purchasing portfolio approaches
54
making on products and markets (Day et al., 2010). Several authors (e.g. Olsen and Ellram,
1997; Trautmann et al, 2009) emphasize that the process of categorizing the purchases in a
portfolio model may be even more important than the resulting classification; the reason being
that the process forces key decision makers in the company to discuss and agree on the
importance of different products, suppliers, or relationships which are categorized in the model.
Portfolio models may further be a means for cross-functional coordination. Gelderman and
Semeijn (2006) discovered, through an in-depth case study of a chemical company, that the
portfolio model adopted by the company’s purchasing functions forced cross-functional
teamwork within each business unit, and as such improved their internal coordination.
Gelderman and van Weele (2005) also emphasize that adopting portfolio models within cross-
functional teams gives non-purchasing specialists a practical framework for analyzing and
discussing purchasing issues.
Dubois and Pedersen (2002) provide a summary of the intentions of the purchasing portfolio
approach, suggesting that the popularity of the purchasing portfolio model can be accredited to
two of its characteristics: First, it provides practical guidelines for managing different purchasing
situations and supplier relationships. Second, the models are relatively easy to understand and
communicate to other members of the organization.
3.3.2 Management of supplier relationships
Several authors have commented on the importance and characteristics of supplier relationships.
According to Gadde and Snehota (2000), “the most critical element of supply strategy is a
company’s capacity to handle various types of supplier relationships” (p.306). Cousins et al.
(2008) claim that the management of relationships will vary according to both the strategy of the
organization and the product sourced; and, as such, “the type of business outcome will dictate
the level of relationship process or detail of course of action required to achieve it” (p.179).
According to Håkansson and Snehota (1995), business relationships generally have structural
characteristics in terms of continuity, complexity, symmetry and informality, and process
characteristics in terms of adaptations, cooperation and conflict, social interaction and
routinization. Following the argument by Cousins et al. (2008), the content within each
characteristic will vary depending on the business outcome. Watts et al. (1995) emphasize that
purchasing links suppliers to the company; in order to incorporate these suppliers’ capabilities in
the strategic planning process of a company, the supplier relationships must be properly
managed.
A discussion about the need and capacity for handling supplier relationships is prevalent in the
literature. Gadde and Snehota (2000) claim that companies need both high and low involvement
relationships, due to the fact that different degrees of involvement lead to different costs and
benefits, and that the resources that can be dedicated to the management of supplier
relationships are limited. The latter is also recognized by Cousins et al. (2008), who claim that
the cost of the resources will escalate depending of the complexity of the relationship output.
Lilliecreutz and Ydreskog (1999) state that an efficient purchasing strategy will not treat every
supplier relationship in the same way. The best utilization of suppliers requires that resources are
Purchasing portfolio approaches
55
allocated to relationships in proportion to expected potential outcomes of the relationships
(Gadde and Snehota, 2000). As previously mentioned, purchasing portfolio approaches can be
used as a tool for managing supplier relationships (Nellore and Söderquist, 2000; Dubois and
Pedersen, 2002). Turnbull (1990) recognizes that purchasing portfolio approaches may help to
ensure differentiated supplier relationships and optimize the use of a company’s limited
resources.
Another argument favoring the use of portfolio approaches to manage supplier relationships is
provided through the International Marketing and Purchasing (IMP) Group’s Interaction
Approach to the study of buyer-seller relationships. The IMP group moves away from the
traditional view of the buyer being a passive partner – and shows that both the buyer and
supplier are interested in partnerships to reap benefits from each other’s resources and
capabilities (Turnbull, 1990). Interdependency is formed in the relationship, making the two
parts adapt to each other. As a company regards the individual suppliers or customers of
different importance, the approach of portfolio planning thus seems fit to managing both
suppliers and customers (Turnbull, 1990).
3.4 Purchasing portfolio approaches
In this section, we will elaborate on some of the most well-known purchasing portfolio
approaches. First, the approach by Kraljic (1983) is presented, in order to provide the reader
with a fundamental understanding of the concept of purchasing portfolio approaches.
Thereafter, the most prevalent amongst the portfolio approaches exercised in practice
(Gelderman and Van Weele, 2002; 2005; Lamming and Harrison, 2001), are presented. Finally, a
summarization of important characteristics and comparisons of the most prevalent purchasing
portfolio approaches are given.
3.4.1 Kraljic’s purchasing portfolio approach
Kraljic (1983) introduced the first purchasing portfolio approach in an effort to make
purchasing adapt to current environmental and economic changes, and move from purchasing
operations to (strategic) supply management. This portfolio approach has later been recognized
as a major breakthrough in the development of professional purchasing (Gelderman and van
Weele, 2003) and initiated a stream of both empirical and conceptual research in relation to the
use of such approaches in purchasing (Kibbeling et al., 2009).
Kraljic (1983) acknowledged that the need for a supply strategy is dependent upon the unique
characteristics of the individual company, and by determining the strategic importance of the purchase
(in terms of their value added, impact on profitability and other factors) and the complexity of the
supply market (in terms of supply scarcity and pace of technology development, and other
factors), the required purchasing sophistication can be determined in terms of four management
dimensions. These dimensions are further utilized in the purchasing portfolio approach, and are
illustrated in Figure 19 below.
The purchasing portfolio approach by Kraljic (1983) consists of four phases, where the first
phase involves classifying the sourced materials or components in what is later known as the
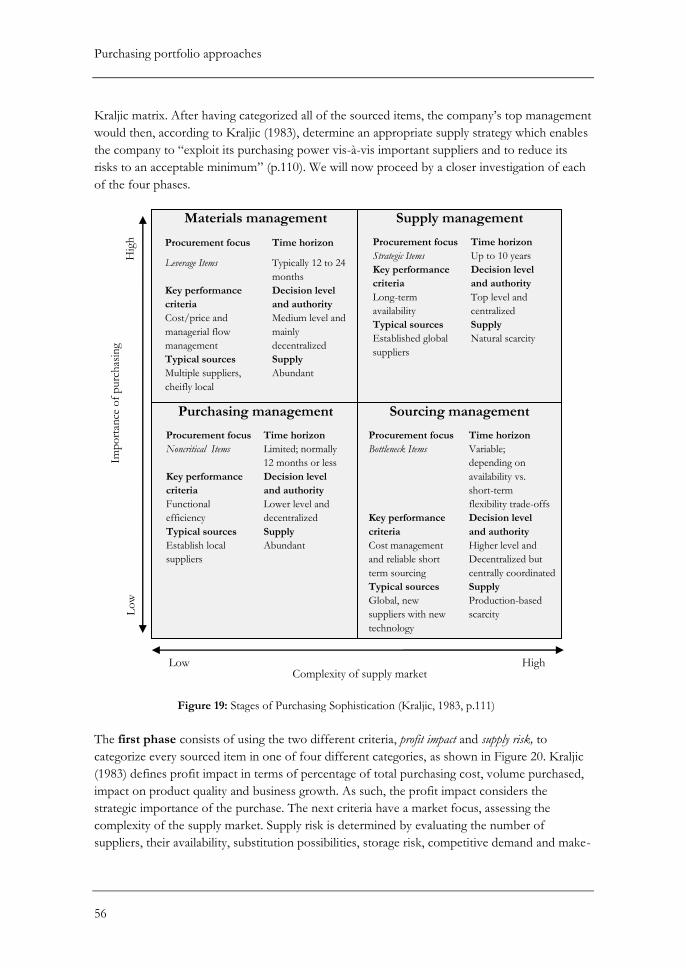
Purchasing portfolio approaches
56
Kraljic matrix. After having categorized all of the sourced items, the company’s top management
would then, according to Kraljic (1983), determine an appropriate supply strategy which enables
the company to “exploit its purchasing power vis-à-vis important suppliers and to reduce its
risks to an acceptable minimum” (p.110). We will now proceed by a closer investigation of each
of the four phases.
The first phase consists of using the two different criteria, profit impact and supply risk, to
categorize every sourced item in one of four different categories, as shown in Figure 20. Kraljic
(1983) defines profit impact in terms of percentage of total purchasing cost, volume purchased,
impact on product quality and business growth. As such, the profit impact considers the
strategic importance of the purchase. The next criteria have a market focus, assessing the
complexity of the supply market. Supply risk is determined by evaluating the number of
suppliers, their availability, substitution possibilities, storage risk, competitive demand and make-
Materials management
Procurement focus Time horizon
Leverage Items Typically 12 to 24
months
Key performance
criteria
Decision level
and authority
Cost/price and
managerial flow
management
Medium level and
mainly
decentralized
Typical sources Supply
Multiple suppliers,
cheifly local
Abundant
Low High Complexity of supply market
Lo
w
Hig
h
Imp
ort
ance
of
purc
has
ing
Supply management
Procurement focus Time horizon
Strategic Items Up to 10 years
Key performance
criteria
Decision level
and authority
Long-term
availability
Top level and
centralized
Typical sources Supply
Established global
suppliers
Natural scarcity
Purchasing management
Procurement focus Time horizon
Noncritical Items Limited; normally
12 months or less
Key performance
criteria
Decision level
and authority
Functional
efficiency
Lower level and
decentralized
Typical sources Supply
Establish local
suppliers
Abundant
Sourcing management
Procurement focus Time horizon
Bottleneck Items Variable;
depending on
availability vs.
short-term
flexibility trade-offs
Key performance
criteria
Decision level
and authority
Cost management
and reliable short
term sourcing
Higher level and
Decentralized but
centrally coordinated
Typical sources Supply
Global, new
suppliers with new
technology
Production-based
scarcity
Figure 19: Stages of Purchasing Sophistication (Kraljic, 1983, p.111)
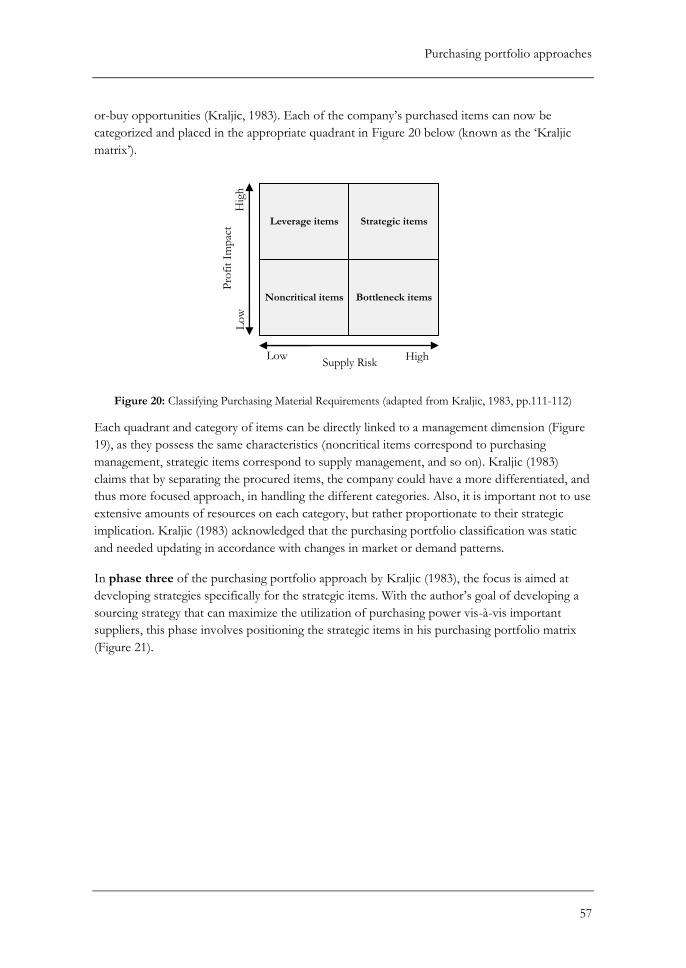
Purchasing portfolio approaches
57
or-buy opportunities (Kraljic, 1983). Each of the company’s purchased items can now be
categorized and placed in the appropriate quadrant in Figure 20 below (known as the ‘Kraljic
matrix’).
Each quadrant and category of items can be directly linked to a management dimension (Figure
19), as they possess the same characteristics (noncritical items correspond to purchasing
management, strategic items correspond to supply management, and so on). Kraljic (1983)
claims that by separating the procured items, the company could have a more differentiated, and
thus more focused approach, in handling the different categories. Also, it is important not to use
extensive amounts of resources on each category, but rather proportionate to their strategic
implication. Kraljic (1983) acknowledged that the purchasing portfolio classification was static
and needed updating in accordance with changes in market or demand patterns.
In phase three of the purchasing portfolio approach by Kraljic (1983), the focus is aimed at
developing strategies specifically for the strategic items. With the author’s goal of developing a
sourcing strategy that can maximize the utilization of purchasing power vis-à-vis important
suppliers, this phase involves positioning the strategic items in his purchasing portfolio matrix
(Figure 21).
Supply Risk Low High
Lo
w
Hig
h
Pro
fit
Imp
act
Leverage items Strategic items
Noncritical items Bottleneck items
Figure 20: Classifying Purchasing Material Requirements (adapted from Kraljic, 1983, pp.111-112)
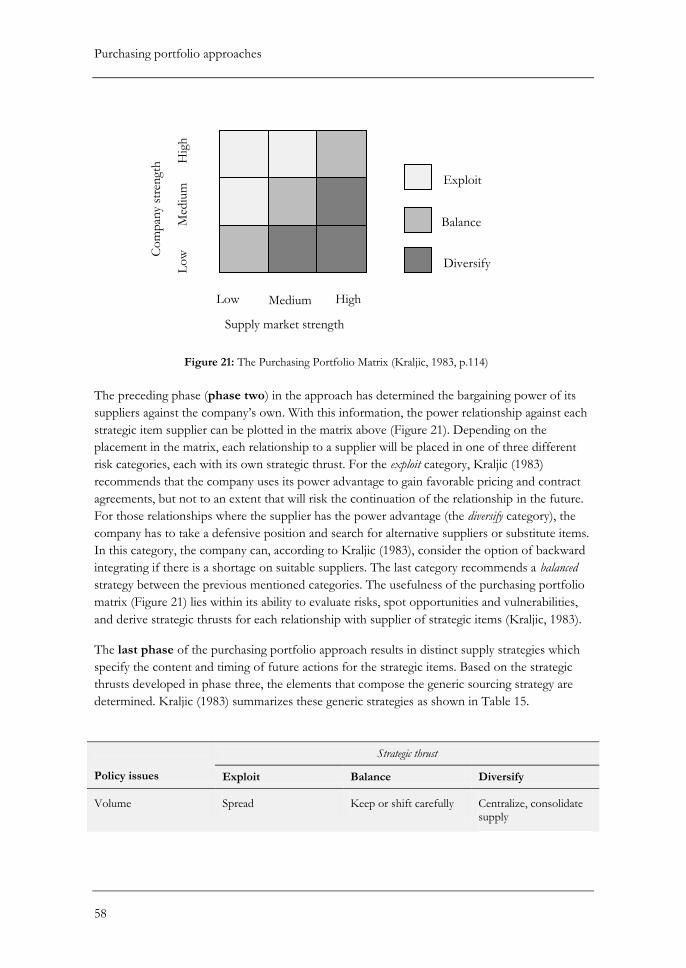
Purchasing portfolio approaches
58
The preceding phase (phase two) in the approach has determined the bargaining power of its
suppliers against the company’s own. With this information, the power relationship against each
strategic item supplier can be plotted in the matrix above (Figure 21). Depending on the
placement in the matrix, each relationship to a supplier will be placed in one of three different
risk categories, each with its own strategic thrust. For the exploit category, Kraljic (1983)
recommends that the company uses its power advantage to gain favorable pricing and contract
agreements, but not to an extent that will risk the continuation of the relationship in the future.
For those relationships where the supplier has the power advantage (the diversify category), the
company has to take a defensive position and search for alternative suppliers or substitute items.
In this category, the company can, according to Kraljic (1983), consider the option of backward
integrating if there is a shortage on suitable suppliers. The last category recommends a balanced
strategy between the previous mentioned categories. The usefulness of the purchasing portfolio
matrix (Figure 21) lies within its ability to evaluate risks, spot opportunities and vulnerabilities,
and derive strategic thrusts for each relationship with supplier of strategic items (Kraljic, 1983).
The last phase of the purchasing portfolio approach results in distinct supply strategies which
specify the content and timing of future actions for the strategic items. Based on the strategic
thrusts developed in phase three, the elements that compose the generic sourcing strategy are
determined. Kraljic (1983) summarizes these generic strategies as shown in Table 15.
Policy issues
Strategic thrust
Exploit Balance Diversify
Volume Spread Keep or shift carefully Centralize, consolidate supply
Low Medium High
Hig
h
Lo
w
Med
ium
Co
mp
any
stre
ngt
h
Supply market strength
Exploit
Balance
Diversify
Figure 21: The Purchasing Portfolio Matrix (Kraljic, 1983, p.114)
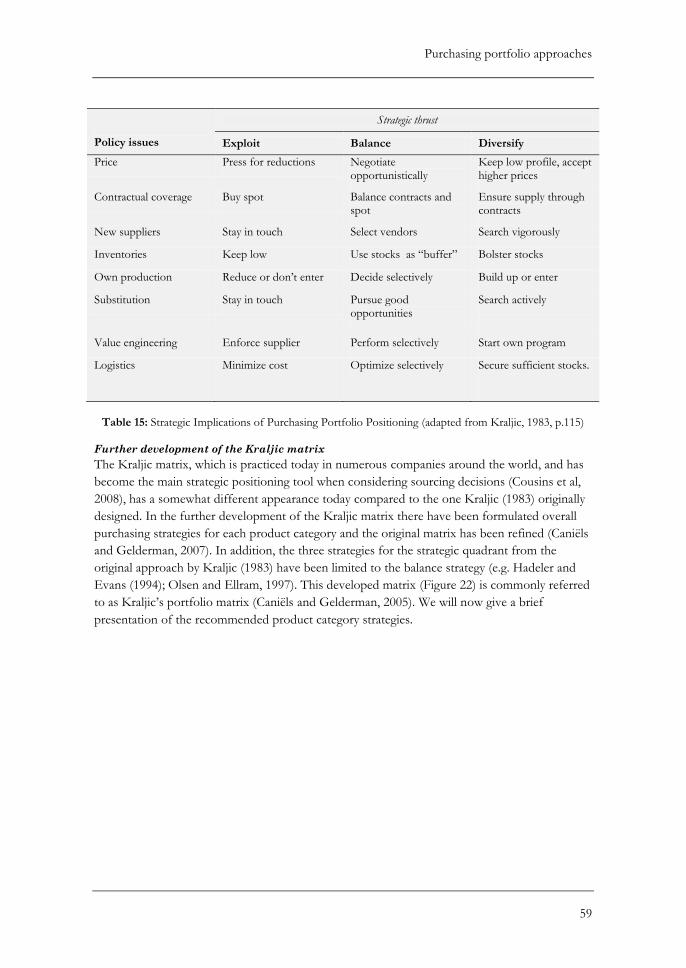
Purchasing portfolio approaches
59
Policy issues
Strategic thrust
Exploit Balance Diversify
Price Press for reductions Negotiate opportunistically
Keep low profile, accept higher prices
Contractual coverage Buy spot Balance contracts and spot
Ensure supply through contracts
New suppliers Stay in touch Select vendors Search vigorously
Inventories Keep low Use stocks as “buffer” Bolster stocks
Own production Reduce or don’t enter Decide selectively Build up or enter
Substitution Stay in touch Pursue good opportunities
Search actively
Value engineering Enforce supplier Perform selectively Start own program
Logistics Minimize cost Optimize selectively Secure sufficient stocks.
Table 15: Strategic Implications of Purchasing Portfolio Positioning (adapted from Kraljic, 1983, p.115)
Further development of the Kraljic matrix
The Kraljic matrix, which is practiced today in numerous companies around the world, and has
become the main strategic positioning tool when considering sourcing decisions (Cousins et al,
2008), has a somewhat different appearance today compared to the one Kraljic (1983) originally
designed. In the further development of the Kraljic matrix there have been formulated overall
purchasing strategies for each product category and the original matrix has been refined (Caniëls
and Gelderman, 2007). In addition, the three strategies for the strategic quadrant from the
original approach by Kraljic (1983) have been limited to the balance strategy (e.g. Hadeler and
Evans (1994); Olsen and Ellram, 1997). This developed matrix (Figure 22) is commonly referred
to as Kraljic’s portfolio matrix (Caniëls and Gelderman, 2005). We will now give a brief
presentation of the recommended product category strategies.
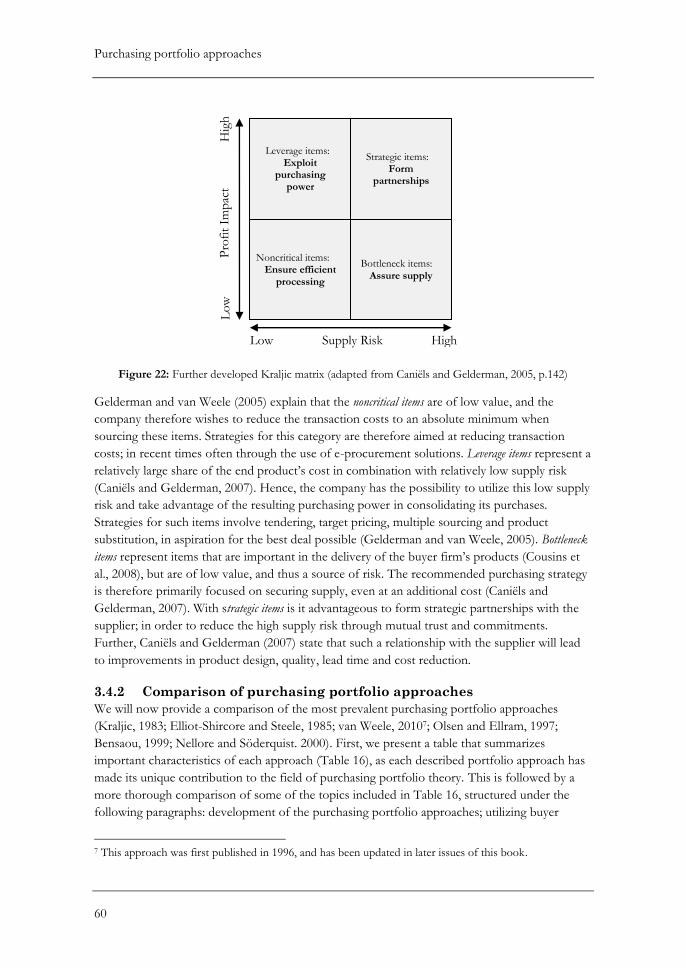
Purchasing portfolio approaches
60
Figure 22: Further developed Kraljic matrix (adapted from Caniëls and Gelderman, 2005, p.142)
Gelderman and van Weele (2005) explain that the noncritical items are of low value, and the
company therefore wishes to reduce the transaction costs to an absolute minimum when
sourcing these items. Strategies for this category are therefore aimed at reducing transaction
costs; in recent times often through the use of e-procurement solutions. Leverage items represent a
relatively large share of the end product’s cost in combination with relatively low supply risk
(Caniëls and Gelderman, 2007). Hence, the company has the possibility to utilize this low supply
risk and take advantage of the resulting purchasing power in consolidating its purchases.
Strategies for such items involve tendering, target pricing, multiple sourcing and product
substitution, in aspiration for the best deal possible (Gelderman and van Weele, 2005). Bottleneck
items represent items that are important in the delivery of the buyer firm’s products (Cousins et
al., 2008), but are of low value, and thus a source of risk. The recommended purchasing strategy
is therefore primarily focused on securing supply, even at an additional cost (Caniëls and
Gelderman, 2007). With strategic items is it advantageous to form strategic partnerships with the
supplier; in order to reduce the high supply risk through mutual trust and commitments.
Further, Caniëls and Gelderman (2007) state that such a relationship with the supplier will lead
to improvements in product design, quality, lead time and cost reduction.
3.4.2 Comparison of purchasing portfolio approaches
We will now provide a comparison of the most prevalent purchasing portfolio approaches
(Kraljic, 1983; Elliot-Shircore and Steele, 1985; van Weele, 20107; Olsen and Ellram, 1997;
Bensaou, 1999; Nellore and Söderquist. 2000). First, we present a table that summarizes
important characteristics of each approach (Table 16), as each described portfolio approach has
made its unique contribution to the field of purchasing portfolio theory. This is followed by a
more thorough comparison of some of the topics included in Table 16, structured under the
following paragraphs: development of the purchasing portfolio approaches; utilizing buyer
7 This approach was first published in 1996, and has been updated in later issues of this book.
Leverage items: Exploit
purchasing power
Strategic items: Form
partnerships
Noncritical items: Ensure efficient
processing
Bottleneck items: Assure supply
Low High Supply Risk
Lo
w
Hig
h
Pro
fit
Imp
act

Purchasing portfolio approaches
61
power; number of stages; and, empirical validation. Further, we briefly discuss the approaches
with respect to time horizon, a company’s scarce resources, and taking the buyer’s perspective in
subsequent paragraphs. Finally a conclusion is made, summarizing the most important findings.
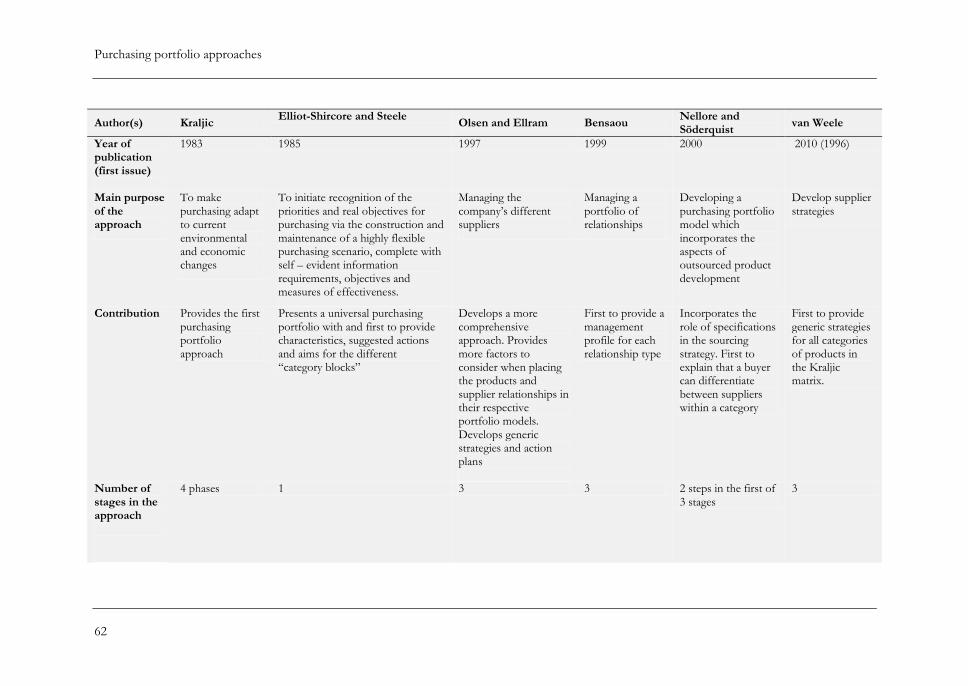
Purchasing portfolio approaches
62
Author(s) Kraljic Elliot-Shircore and Steele
Olsen and Ellram Bensaou Nellore and Söderquist
van Weele
Year of publication (first issue)
1983 1985 1997 1999 2000 2010 (1996)
Main purpose of the approach
To make purchasing adapt to current environmental and economic changes
To initiate recognition of the priorities and real objectives for purchasing via the construction and maintenance of a highly flexible purchasing scenario, complete with self – evident information requirements, objectives and measures of effectiveness.
Managing the company’s different suppliers
Managing a portfolio of relationships
Developing a purchasing portfolio model which incorporates the aspects of outsourced product development
Develop supplier strategies
Contribution Provides the first purchasing portfolio approach
Presents a universal purchasing portfolio with and first to provide characteristics, suggested actions and aims for the different “category blocks”
Develops a more comprehensive approach. Provides more factors to consider when placing the products and supplier relationships in their respective portfolio models. Develops generic strategies and action plans
First to provide a management profile for each relationship type
Incorporates the role of specifications in the sourcing strategy. First to explain that a buyer can differentiate between suppliers within a category
First to provide generic strategies for all categories of products in the Kraljic matrix.
Number of stages in the approach
4 phases 1 3 3 2 steps in the first of 3 stages
3
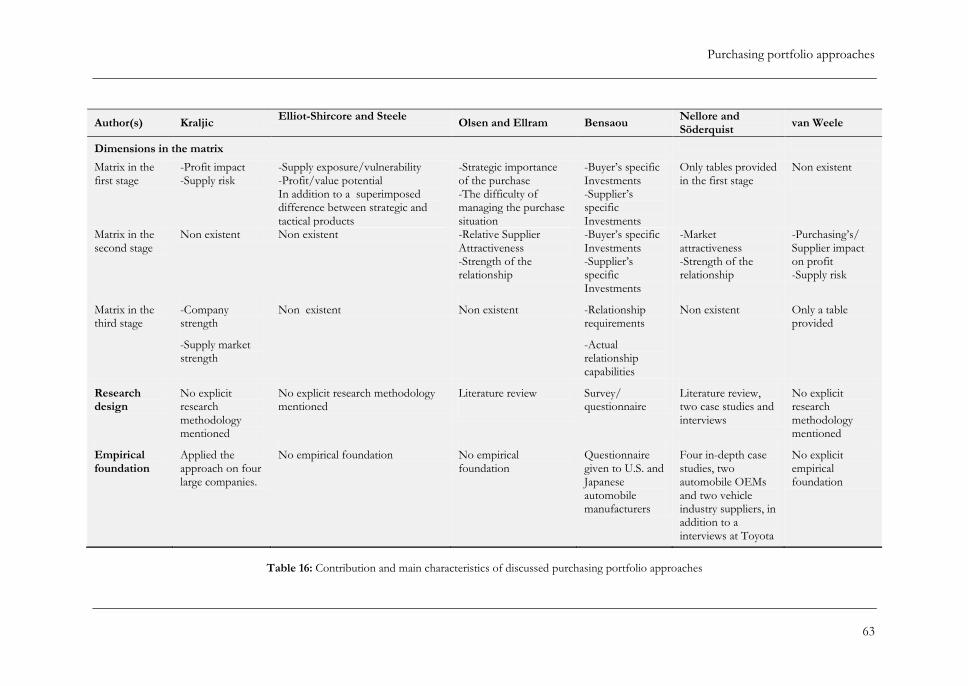
Purchasing portfolio approaches
63
Author(s) Kraljic Elliot-Shircore and Steele
Olsen and Ellram Bensaou Nellore and Söderquist
van Weele
Dimensions in the matrix
Matrix in the first stage
-Profit impact -Supply risk
-Supply exposure/vulnerability -Profit/value potential In addition to a superimposed difference between strategic and tactical products
-Strategic importance of the purchase -The difficulty of managing the purchase situation
-Buyer’s specific Investments -Supplier’s specific Investments
Only tables provided in the first stage
Non existent
Matrix in the second stage
Non existent Non existent -Relative Supplier Attractiveness -Strength of the relationship
-Buyer’s specific Investments -Supplier’s specific Investments
-Market attractiveness -Strength of the relationship
-Purchasing’s/ Supplier impact on profit -Supply risk
Matrix in the third stage
-Company strength
-Supply market strength
Non existent Non existent -Relationship requirements
-Actual relationship capabilities
Non existent Only a table provided
Research design
No explicit research methodology mentioned
No explicit research methodology mentioned
Literature review
Survey/ questionnaire
Literature review, two case studies and interviews
No explicit research methodology mentioned
Empirical foundation
Applied the approach on four large companies.
No empirical foundation No empirical foundation
Questionnaire given to U.S. and Japanese automobile manufacturers
Four in-depth case studies, two automobile OEMs and two vehicle industry suppliers, in addition to a interviews at Toyota
No explicit empirical foundation
Table 16: Contribution and main characteristics of discussed purchasing portfolio approaches
Purchasing portfolio approaches
64
Development of the purchasing portfolio approaches
In this paragraph, we show how the different purchasing portfolio approaches have developed
over time, and how the approaches relate to each other. As mentioned previously (3.4.1), Kraljic
(1983) developed the foundations for the modern purchasing portfolio approach as it is used
today. Elliot-Shircore and Steele (1985) developed their own purchasing portfolio approach
(“Positioning Overview”) in order to “lift purchasing activity out of the tactical fire fighting rut
into a strategic role within the company” (p.26); as such, the purpose of using this approach is
similar as for Kraljic (1983). Their approach provided characteristics and suggested actions for
the different blocks of products. Further, the approach by van Weele (2010) was originally
published in 1996, and has up to this day further built on Kraljic’ foundation, providing
comprehensive generic strategies for all the different categories of products - not just for the
strategic items which were the sole focus of Kraljic (1983). However, he preserves the three
strategies recommended for the strategic quadrant, though under different names (‘buyer-
dominated segment’, ‘balanced relationship’ and ‘supplier-dominated segment’).
In executing the first stage of their approach, Olsen and Ellram (1997) use a matrix which has
considerable resemblance to the Kraljic (1983) matrix; however, their dimensions have a broader
scope, incorporating additional purchase characteristics. Moreover, this approach is more
comprehensive, analyzing the company’s current relationships before developing generic
strategies and action plans. This is in contrast to the three previous purchasing portfolio
approaches, who only consider the items sourced before recommending generic strategies.
Nellore and Söderquist (2000) provide the most comprehensive approach. They expand the first
step in the approach by Olsen and Ellram (1997), in order to incorporate a consideration for
product development. They then utilize the remaining approach of Olsen and Ellram (1997) -
conducting minor changes, and recommending generic strategies based on their own empirical
data in addition to the other portfolio approaches discussed. Finally, Bensaou (1999) develops
his own portfolio approach, which uses the same main purchase characteristics as Olsen and
Ellram (1997) when assessing the contextual factors of a relationship. This approach is different
from earlier developed purchasing portfolio approaches, as it does not recommend any generic
sourcing strategies, only an appropriate management profile for each relationship.
Utilizing buyer power
In comparing the different approaches, we also discovered a change in focus with respect to the
exploitation of buyer power in the approaches’ recommended sourcing strategies. Kraljic (1983)
states explicitly that his suggested approach should result in a supply strategy which exploits the
buyer’s purchasing power against important suppliers. Van Weele (2010), who builds his
approach on the basis provided by Kraljic (1983), shares this focus on power and dependence,
and further expands the focus to apply for all the different product categories - not just for the
strategic sourced items. Van Weele (2010) further emphasizes that an important aspect of any
purchasing strategy is the issue of influencing the balance of power between the buyer and the
supplier: “In the author’s view the balance of power should preferably be in favor of the
[buyer]… Obviously, when a company is too dependent on a supplier, something should be
done to change the situation” (van Weele, 2010, p.195). As such, these portfolio approaches
represent those with the greatest focus on utilizing buying power, out of the approaches
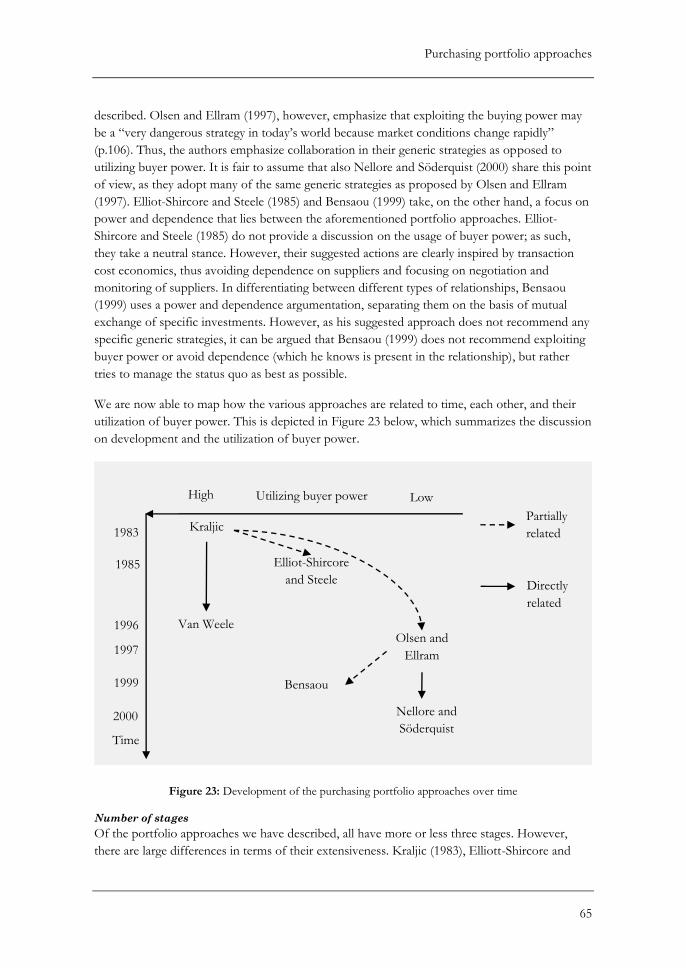
Purchasing portfolio approaches
65
described. Olsen and Ellram (1997), however, emphasize that exploiting the buying power may
be a “very dangerous strategy in today’s world because market conditions change rapidly”
(p.106). Thus, the authors emphasize collaboration in their generic strategies as opposed to
utilizing buyer power. It is fair to assume that also Nellore and Söderquist (2000) share this point
of view, as they adopt many of the same generic strategies as proposed by Olsen and Ellram
(1997). Elliot-Shircore and Steele (1985) and Bensaou (1999) take, on the other hand, a focus on
power and dependence that lies between the aforementioned portfolio approaches. Elliot-
Shircore and Steele (1985) do not provide a discussion on the usage of buyer power; as such,
they take a neutral stance. However, their suggested actions are clearly inspired by transaction
cost economics, thus avoiding dependence on suppliers and focusing on negotiation and
monitoring of suppliers. In differentiating between different types of relationships, Bensaou
(1999) uses a power and dependence argumentation, separating them on the basis of mutual
exchange of specific investments. However, as his suggested approach does not recommend any
specific generic strategies, it can be argued that Bensaou (1999) does not recommend exploiting
buyer power or avoid dependence (which he knows is present in the relationship), but rather
tries to manage the status quo as best as possible.
We are now able to map how the various approaches are related to time, each other, and their
utilization of buyer power. This is depicted in Figure 23 below, which summarizes the discussion
on development and the utilization of buyer power.
Figure 23: Development of the purchasing portfolio approaches over time
Number of stages
Of the portfolio approaches we have described, all have more or less three stages. However,
there are large differences in terms of their extensiveness. Kraljic (1983), Elliott-Shircore and
Kraljic
Van Weele Olsen and
Ellram
Bensaou
Nellore and
Söderquist Time
1997
1996
1983
1999
2000
High Low
Partially
related
Directly
related
Utilizing buyer power
Elliot-Shircore
and Steele 1985
Purchasing portfolio approaches
66
Steele (1985) and van Weele (2010) use only one portfolio model to place the sourced products
and, according to their placement, a generic strategy can be developed for the product. Kraljic
(1983) uses one additional matrix to assess power-dependence in the buyer-supplier relationship
for the strategic products, but only as a means for further specifying his generic strategy for
those products.
The remaining approaches use 2-3 portfolio models each, aiding in an analysis of the current
sourcing strategy in addition to how the strategy should be. Thus, these portfolio approaches
incorporate a more comprehensive consideration of the company’s unique characteristics and
context. Olsen and Ellram (1997) use portfolio models both in the assessment of the sourced
products (indicating how the strategy should be), and in the following step when analyzing their
current suppliers (indicating the current strategy). These two steps together form the foundation
for which the action plans are developed. Furthermore, the approach stands out, as it provides
an elaborate description of its use and of the generic strategies. The description of use includes
comprehensive lists of factors for measuring each of the dimensions, as well as a description of
each quadrant, in both of the employed portfolio models. In addition to provide generic
strategies in forms of action plans, Olsen and Ellram (1997) also provide guidelines as to how to
prioritize the implementation of the developed action plans.
The purchasing portfolio approach Nellore and Söderquist (2000) utilizes, in part, the same
portfolio models as Olsen and Ellram (1997), with only minor modifications to the model
applied when assessing the supplier relationships. However, this approach lacks the same
attention to detail, both in relation to the use of the approach and the generic strategies.
Bensaou (1999), on the other hand, starts with an analysis of the external conditions and choose
an appropriate relationship type, before finding suitable management profiles based on the
relationship types (indicating how the strategy should be). In the last stage of his approach, a
comparison, utilizing a third portfolio model, is done of the actual relationship capabilities
(indicating the current strategy) against how they ought to be, given by the preceding stage. A
noteworthy attribute of this last approach is that there is not given any generic strategies, as
opposed to the other approaches; the main objective is only to ensure that the portfolio of
relationships is effectively managed and fitted to their external context.
Empirical validation
Of the presented purchasing portfolio approaches, Kraljic (1983) is the only one who has
actually tested his approach. Through gathering experience of the usage of the approach from a
welding materials producer, an electrical equipment manufacturer, a multinational chemical
company and a heavy equipment manufacturer, the author argues that he has demonstrated the
usefulness of the approach in a variety of industrial settings. However, one similarity between
these companies is their size; they are all large. Bensaou (1999) developed his approach based on
a questionnaire that was distributed among managers in large automobile manufacturers based in
the U.S. and Japan. Nellore and Söderquist (2000) also departed from the automobile industry
when they developed their approach, utilizing four in-depth case studies of two automobile
OEMs and two medium-sized expert suppliers (a shock absorber and an air bag manufacturer)
Purchasing portfolio approaches
67
together with a benchmarking interview of Toyota. Both Bensaou (1999) and Nellore and
Söderquist (2000), however not empirical tested, have a solid foundation in empirical data. On
the other hand, both approaches have departed from the same industry, which could question
their applicability to other, rather different, industry contexts. The remaining presented
approaches have no explicitly stated empirical foundation; however, Olsen and Ellram (1997)
mention the need for further research on the usefulness of their portfolio approach. We
recognize that of the few purchasing portfolio approaches that do have an empirical foundation,
all have made this foundation on data from large companies, or from within the automobile
industry.
Time horizon
There are some differences between the portfolio approaches with respect to the time horizon
in which the proposed strategies are valid. Kraljic (1983) and Olsen and Ellram (1997) reveal
how they intend their approaches to be used over time. Kraljic (1983) points out that the
purchasing portfolio classification needs updating in accordance to changes in the market or
demand. On the other hand, Olsen and Ellram (1997) incorporate time in their approach by
separating between short-term and long-term goals. It is less obvious how the other portfolio
approaches relate to the aspect of time.
A company’s scarce resources
No company has unlimited access to resources. In his approach, Kraljic (1983) suggests that the
company should use its resources proportionate to the strategic importance of the product
category. Olsen and Ellram (1997) also emphasize the importance of freeing resources from less
attractive supplier relationships, and redistribute them to more attractive and stronger
relationships. Elliot-Shircore and Steele (1985) provide actions in order to minimize the resource
consumption of the products categorized as Tactical – Acquisition; closer monitoring and price
negotiations are not justified for such products. The authors also state that the extent of
application of their purchasing portfolio approach will depend on the amount of resources the
company has available. One important purpose of the last stage in the approach by Bensaou
(1999) is to avoid an overdesign of the relationship, indicating an awareness of the company’s
limited resources. Furthermore, as Nellore and Söderquist (2000) adopt earlier developed
generic strategies, it is fair to assume that the authors have preserved a conscious allocation of
resources. However, despite building on the foundations given by Kraljic (1983), van Weele
(2010) pays little attention to the resource consumption of the different generic strategies he
proposes, and thus leaves the allocation of the resources up to the individual firm.
Buyers perspective
Finally, the last found characteristics of the described portfolio approaches is a tendency for
viewing the buyer-supplier relationship solely from a buyer’s perspective. Only Nellore and
Söderquist (2000) take the supplier’s perspective, and evaluate the suppliers’ capabilities and
capacities before recommending a strategy. According to them, there is a need to evaluate how
the supplier is going to react, or even if he is willing to adapt, to the imposed generic strategy
coming from his customer.
Purchasing portfolio approaches
68
Conclusion
Our comparison of the different purchasing portfolio approaches shows how the approaches
relate to each other, elucidating some of their identified differences and similarities. Further,
each approach has made its unique contribution, and has different emphasis on subjects such as
utilizing buyer power and use of a company’s scarce resources. These findings may suggest that
it is more valuable to combine the different approaches in relation to a company’s unique
situation instead of utilizing just one of these approaches, neglecting important contributions of
other models. However, this is probably more demanding for a purchasing function, and the
appropriateness of such a method will again be determined by the company’s situation, and the
recognized importance of the purchasing function.
3.5 Critique of purchasing portfolio approaches
The use of portfolio approaches in strategic planning has been criticized, and an elaboration of
the received criticism is given in this section. This is done in order to enhance the understanding
of the appropriateness, and limitations of a purchasing portfolio approach. First, a presentation
of the industrial network approach is provided in order to give a different perspective on buyer-
supplier relationships than the logic underlying portfolio analysis. Thereafter, we provide a
summarization of identified critique of purchasing portfolio approaches. A conclusion then
discusses the appropriateness of purchasing portfolio approaches, given the presented critique.
3.5.1 The industrial network approach
Dubois and Pedersen (2002) compare some of the better known portfolio models against the
industrial network approach, in order to uncover how the different approaches handle relationships
between suppliers and buyers in a purchasing context. Through their investigation of portfolio
models, Dubois and Pedersen (2002) discovered that a fundamental assumption of most
portfolio models is a focus on power-dependence. Consequently, a company will try to utilize its
buyer power and avoid becoming dependent on a single supplier – to the largest extent possible
(e.g. Kraljic, 1983). Dubois and Pedersen (2002) argue that the network approach captures
important interdependencies between products which are lost in the portfolio approaches, as the
following paragraph explains.
Dubois and Pedersen (2002) explain that the network approach uses the inter-firm relationships
as a unit of analysis, rather than the individual company, and concentrates on how relationships
connect to each other and how they are embedded in a wider relationship network. This
connectedness causes relationships to be considered in relation to others and not as distinct
dyads, as seen from the portfolio approach. The network approach provides a new
understanding of how products actually are interdependent along several dimensions; Dubois
and Pedersen (2002) argue that incorporating an industrial network approach can make the
company “capture vital aspects of inter-firm interaction and interdependence within and
between relationships” (p.41). For example, in the connection between the focal buyer-supplier
relationship and the customer’s other supplier relationships, Dubois and Pedersen (2002)
acknowledge that a sourced product, with its unique technical features, needs to be adapted to
the user’s context. Often, this implies linking the product to other sourced products in order to
use it, and, as such, there exist interdependence between the relationships providing these
Purchasing portfolio approaches
69
products. This realization led Dubois and Pedersen (2002) to conclude that a product is part of a
network, and it may be more appropriate to consider products as “network entities” rather than
distinct “given” objects. However, Dubois and Pedersen (2002) also acknowledge that
redirecting the purchasing portfolio approach, from concerning only products to consider
relationships and networks, entails more complex and challenging analyses.
3.5.2 Identified critique of purchasing portfolio approaches
In this subsection, identified critique of purchasing portfolio approaches is summarized in Table
17 below. In addition, a paragraph concerning the approaches’ dimensions is included.
Following this table, concluding remarks on the appropriateness of purchasing portfolio
approaches, given the presented critique, are made.
Purchasing portfolio approaches
70
Critique Author(s) The authors’ argumentation R
elat
ions
hips
and
sup
plie
r’s
pers
pect
ive
Lack of focus on interdependencies between relationships and products
Olsen and Ellram (1997); Dubois and Pedersen (2002)
Portfolio models create a dyadic context due to a strong reliance on balancing power-dependence, and because they are based on only two distinct dimensions. By limiting the focus to a purely dyadic context and not consider the relationship’s network position, important potential for increased productivity and innovativeness is reduced (Dubois and Pedersen, 2002).
Portfolio models neglect the transaction cost incurred through breaking up established relationships and developing new ones
Dubois and Pedersen (2002) After a relationship with a supplier is established, the buyer starts to make adjustments in order to integrate this supplier into the buyer’s business operations. The more adjustments made by the buyer, the more expensive it gets to terminate the relationship.
Rendering relationships as less attractive than they may be
Zolkiewski and Turnbull (2002) Relationships may constitute an important contribution to the company, despite being less attractive according to the two dimensions measured in a two-dimensional portfolio model. Expanding the model to consider multiple dimensions will provide a more comprehensive understanding of the relationships and their importance for the firm.
Ignoring the supplier Gelderman and van Weele (2003); Cox (2004); van Weele (2010)
In order to ensure an effective implementation of the recommended sourcing strategy, a “good fit between the position of the product into the buyer’s purchasing portfolio and the position of the product in the supplier’s customer portfolio is necessary” (van Weele, 2010, p.200); e.g. a partnership with a supplier is only feasible if it is the strategic intent of both parties (Gelderman and van Weele, 2003). As such, a buyer cannot make a sourcing decision in isolation, a reason being that the supplier will have its own goals and motives (Cox, 2004).
Pos
itio
ning
of
the
prod
ucts
Viewing products as “given” objects
Dubois and Pedersen (2002) Important aspects such as developing, producing and using the product are neglected when viewing products as “given”. Purchasing portfolio models often use products as a basis for analysis, which entails that the above mentioned aspects are neglected in the analysis.
Purchasing portfolio approaches
71
Critique Author(s) The authors’ argumentation
Limited guidance in how to manage a category, after the classification is made
Olsen and Ellram (1997); Nellore and Söderquist (2000)
A portfolio model fails to provide the means for which to choose amongst the developed strategies; both between the category strategies and amongst the different strategies recommended within a category (Olsen and Ellram, 1997). Portfolio models, by developing independent strategies for each of the categories, can recommend generic strategies that are contradictory (Nellore and Söderquist, 2000)
Str
ateg
ic
reco
gnitio
n
Portfolio models impede purchasing’s strategic recognition
Dubois and Pedersen (2002) Using the portfolio models to decide how to handle purchasing may indicate one of two situations: (1) as portfolio models handle distinct “given” products, using such models may imply that the purchasing function has a mere clerical function; (2) “it may be that purchasing is side-stepped because buyers prefer to deal with purchasing as an isolated phenomenon” (p.41).
Dim
ensi
ons
The dimensions in a portfolio approach are only approximate estimations of the factors they are supposed to measure
Lilliecreutz and Ydreskog (1999); Nellore and Söderquist (2000); Dubois and Pedersen (2002); Zolkiewski and Turnbull (2002); Trautmann et al. (2009); Terpend et al. (2011)
The complex sourcing situation entails that two dimensions will never be able to capture all the possible situations and their recommended actions.
The dimensions in a portfolio approach cause an emphasis on the company’s boundary
Dubois and Pedersen (2002); Terpend et al. (2011)
The two dimensions in the portfolio models often measure an internal and an external variable, causing an emphasis on the company’s boundary – possibly overlooking important existing interdependencies between internal and external factors.
The process of classifying the items along the two dimensions can be confusing
Nellore and Söderquist, (2002); Terpend et al, 2011
Many products will not fit exactly within a discrete category, and some products do not match any category.
Measurement along the dimensions
Olsen and Ellram (1997); Zolkiewski and Turnbull (2002); Gelderman and van Weele (2003; 2005)
It is difficult to separate “high” from “low” – this will in turn make the choice of strategy difficult.
Table 17: Critique of purchasing portfolio approaches
Purchasing portfolio approaches
72
The dimensions in a portfolio model
From Table 17 above, we recognize that a lot of the critique of purchasing portfolio approaches
concerns the dimensions of the approach. In order to achieve a nuanced presentation with
respect to the dimensions, we have chosen to elaborate some more. Olsen and Ellram (1997)
emphasize that the dimensions used to categorize the items in the portfolio model should have
the “right” balance of complexity. Important factors may be neglected if the dimensions are too
simple. On the other hand, if they are to complex, a company may consume too much time and
effort in categorizing the items, causing them to “not realize the full potential of the portfolio
approach in terms if improved resource allocation and communication” (Olsen and Ellram,
1997, p 102). Too complex dimensions may, according to Nellore and Söderquist (2000), also
cause the company to be a victim of means-end confusion; it is important to remember that “the
classification is not an end in itself, but a means to aid in the development of the appropriate
action plans” (Nellore and Söderquist, 2000, p.263). Furthermore, Olsen and Ellram (1997)
argue that high complexity of the dimensions may make it hard to implement the use of the
portfolio model.
3.5.3 Concluding arguments
The aforementioned criticism of the purchasing portfolio models may suggest that these models
should be used with a consideration of their limitations, and preferably together with other tools
(Olsen and Ellram, 1997). Gelderman and van Weele (2005) discover that much of the critique
aimed at the portfolio approach is derived from conceptual studies; whereas arguments
supporting this approach have been reported from a limited set of case studies. Further,
Gelderman and van Weele (2003) discover that experienced practitioners of purchasing
portfolio approaches have devised effective solutions to several of the mentioned problems (e.g.
the disregard for the supplier and measurement along the dimensions). Terpend et al. (2011)
recognize that the existing portfolio models provide a foundation for strategic planning;
however, they are not able to predict every possible purchasing situation. According to Terpend
et al. (2011), this finding is in accordance with the incrementalist perspective on strategy formulation
(Mintzberg, 1978; referred to in Terpend et al., 2011), which states that managers adapt
strategies to changing environments, and strategy formulation is subject to the bounded
rationality of managers conceiving them. Thus, as a purchaser, one cannot rely solely on the
predetermined categories provided by the portfolio models, but one must maintain the ability to
adjust the strategy as changes occur (Terpend et al, 2011).
3.6 Power and dependence in buyer-supplier relationships
The concepts of power and dependence are considered important when developing an
understanding of buyer – supplier relationships (Caniëls and Gelderman, 2005; 2007; Kibbeling
et al, 2009). The existence of differences in power and dependence between buyers and suppliers
also seems to be a fundamental assumption underlying all purchasing portfolio models (Dubois
and Pedersen, 2002; Caniëls and Gelderman, 2005). As previously discussed, utilizing buyer
power had an extensive focus in the earlier purchasing portfolio approaches; more recent
approaches have acknowledged the danger of such an approach towards suppliers (3.4.2). In this
section we will elaborate on the related concepts of power and dependence, and discuss their
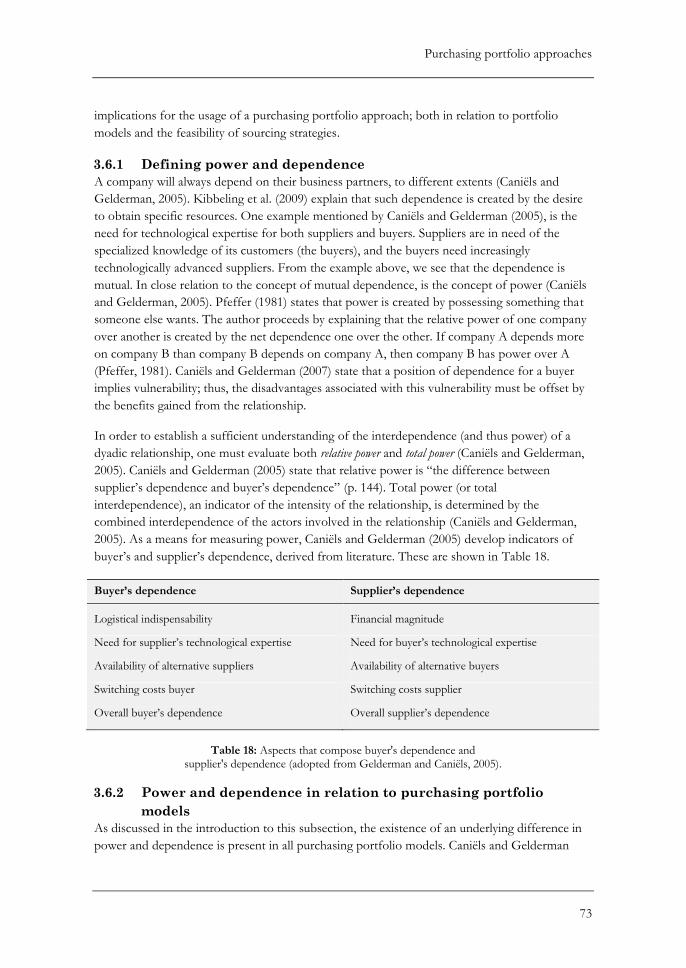
Purchasing portfolio approaches
73
implications for the usage of a purchasing portfolio approach; both in relation to portfolio
models and the feasibility of sourcing strategies.
3.6.1 Defining power and dependence
A company will always depend on their business partners, to different extents (Caniëls and
Gelderman, 2005). Kibbeling et al. (2009) explain that such dependence is created by the desire
to obtain specific resources. One example mentioned by Caniëls and Gelderman (2005), is the
need for technological expertise for both suppliers and buyers. Suppliers are in need of the
specialized knowledge of its customers (the buyers), and the buyers need increasingly
technologically advanced suppliers. From the example above, we see that the dependence is
mutual. In close relation to the concept of mutual dependence, is the concept of power (Caniëls
and Gelderman, 2005). Pfeffer (1981) states that power is created by possessing something that
someone else wants. The author proceeds by explaining that the relative power of one company
over another is created by the net dependence one over the other. If company A depends more
on company B than company B depends on company A, then company B has power over A
(Pfeffer, 1981). Caniëls and Gelderman (2007) state that a position of dependence for a buyer
implies vulnerability; thus, the disadvantages associated with this vulnerability must be offset by
the benefits gained from the relationship.
In order to establish a sufficient understanding of the interdependence (and thus power) of a
dyadic relationship, one must evaluate both relative power and total power (Caniëls and Gelderman,
2005). Caniëls and Gelderman (2005) state that relative power is “the difference between
supplier’s dependence and buyer’s dependence” (p. 144). Total power (or total
interdependence), an indicator of the intensity of the relationship, is determined by the
combined interdependence of the actors involved in the relationship (Caniëls and Gelderman,
2005). As a means for measuring power, Caniëls and Gelderman (2005) develop indicators of
buyer’s and supplier’s dependence, derived from literature. These are shown in Table 18.
Buyer’s dependence Supplier’s dependence
Logistical indispensability Financial magnitude
Need for supplier’s technological expertise Need for buyer’s technological expertise
Availability of alternative suppliers Availability of alternative buyers
Switching costs buyer Switching costs supplier
Overall buyer’s dependence Overall supplier’s dependence
Table 18: Aspects that compose buyer's dependence and
supplier's dependence (adopted from Gelderman and Caniëls, 2005).
3.6.2 Power and dependence in relation to purchasing portfolio
models
As discussed in the introduction to this subsection, the existence of an underlying difference in
power and dependence is present in all purchasing portfolio models. Caniëls and Gelderman
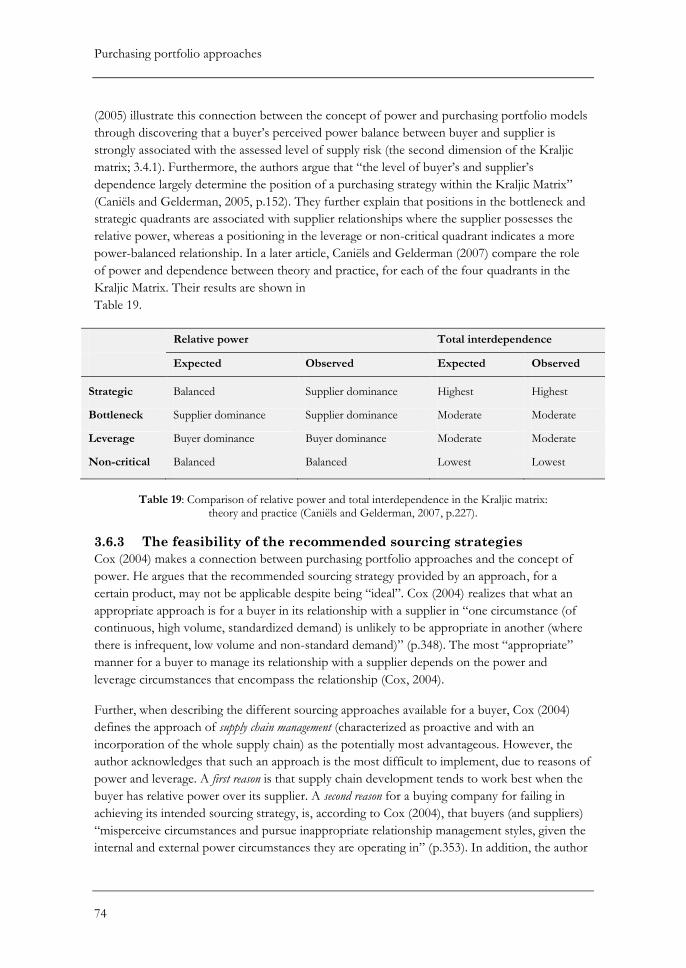
Purchasing portfolio approaches
74
(2005) illustrate this connection between the concept of power and purchasing portfolio models
through discovering that a buyer’s perceived power balance between buyer and supplier is
strongly associated with the assessed level of supply risk (the second dimension of the Kraljic
matrix; 3.4.1). Furthermore, the authors argue that “the level of buyer’s and supplier’s
dependence largely determine the position of a purchasing strategy within the Kraljic Matrix”
(Caniëls and Gelderman, 2005, p.152). They further explain that positions in the bottleneck and
strategic quadrants are associated with supplier relationships where the supplier possesses the
relative power, whereas a positioning in the leverage or non-critical quadrant indicates a more
power-balanced relationship. In a later article, Caniëls and Gelderman (2007) compare the role
of power and dependence between theory and practice, for each of the four quadrants in the
Kraljic Matrix. Their results are shown in
Table 19.
Relative power Total interdependence
Expected Observed Expected Observed
Strategic Balanced Supplier dominance Highest Highest
Bottleneck Supplier dominance Supplier dominance Moderate Moderate
Leverage Buyer dominance Buyer dominance Moderate Moderate
Non-critical Balanced Balanced Lowest Lowest
Table 19: Comparison of relative power and total interdependence in the Kraljic matrix:
theory and practice (Caniëls and Gelderman, 2007, p.227).
3.6.3 The feasibility of the recommended sourcing strategies
Cox (2004) makes a connection between purchasing portfolio approaches and the concept of
power. He argues that the recommended sourcing strategy provided by an approach, for a
certain product, may not be applicable despite being “ideal”. Cox (2004) realizes that what an
appropriate approach is for a buyer in its relationship with a supplier in “one circumstance (of
continuous, high volume, standardized demand) is unlikely to be appropriate in another (where
there is infrequent, low volume and non-standard demand)” (p.348). The most “appropriate”
manner for a buyer to manage its relationship with a supplier depends on the power and
leverage circumstances that encompass the relationship (Cox, 2004).
Further, when describing the different sourcing approaches available for a buyer, Cox (2004)
defines the approach of supply chain management (characterized as proactive and with an
incorporation of the whole supply chain) as the potentially most advantageous. However, the
author acknowledges that such an approach is the most difficult to implement, due to reasons of
power and leverage. A first reason is that supply chain development tends to work best when the
buyer has relative power over its supplier. A second reason for a buying company for failing in
achieving its intended sourcing strategy, is, according to Cox (2004), that buyers (and suppliers)
“misperceive circumstances and pursue inappropriate relationship management styles, given the
internal and external power circumstances they are operating in” (p.353). In addition, the author
Purchasing portfolio approaches
75
provides a third reason for why few companies are able to achieve the supply management
approach; a company does not have the sufficient capabilities or resources to undertake such a
resource intensive approach (Cox, 2004).
From this connection between the concepts of power and dependence, purchasing portfolio
approaches and sourcing strategy, it can be argued that these are important concepts to consider
when using a purchasing portfolio approach – even more so for those approaches where there is
a greater emphasis on utilizing power (i.e., Kraljic, 1983; van Weele, 2010; 0). In the next section,
we conclude this chapter by stating what will be brought along to the theoretical framework.
3.7 Towards the theoretical framework – Purchasing portfolio
approaches
The main purpose of this chapter has been to provide a necessary understanding of the concept
of purchasing portfolio approaches. Several central topics related to the concept have been
presented. We will now gather and classify findings that will be brought along to the
construction of a theoretical framework at the end of this part. These findings will subsequently
be used, both for answering RQ1 and structuring and guiding the analysis. In the analysis
(chapter 8), these findings will be refined using empirical data gathered through our mixed
methods research, c.f. 2.1.3.
The first relevant finding to be included in the theoretical framework is the fundamental context
of using a purchasing portfolio approach; making sourcing strategies (3.1.1). Further, referring to
other main purposes of using a purchasing portfolio approach (3.3.1), we argue that different
stated purposed can be organized within three groups: Balancing the portfolio of relationships (Wind
and Mahajan, 1981; Turnbull, 1990; Pagell et al., 2010; Nellore and Söderquist, 2000; Day et al.,
2010); organizing information (Olsen and Ellram, 1997; Syson, 1992); facilitating communication
(Gelderman and van Weele, 2002; Smart and Dudas, 2007; Olsen and Ellram, 1997; Trautmann
et al, 2009). As such, we find it advantageous to include these three groups of purposes in the
theoretical framework.
We have in this chapter described the most prevalent purchasing portfolio approaches (Kraljic,
1983; Elliot-Shircore and Steele, 1985; Olsen and Ellram, 1997; Bensaou, 1999; Nellore and
Söderquist, 2000; van Weele, 2010). Their contribution and main characteristics will be included
in the theoretical framework. Further, the comparison of these approaches (3.4.2), with respect
to utilizing buyer power; development of the approaches; number of stages and buyer’s
perspective, will be brought along to the theoretical framework.
Further, in reviewing critique of purchasing portfolio approaches, we found that the critique
could be categorized into four main categories: positioning of the products; dimensions; relationships and
the supplier’s perspective; and, strategic recognition (3.5; Table 17).These categories are included in the
theoretical framework. The final topic to be included in the theoretical framework is the concept
of power and dependence, as it is argued to be a fundamental assumption underlying all
purchasing portfolio approaches (3.6). In summary, the findings to be brought along to the
development of a theoretical framework are illustrated in Figure 24 below.
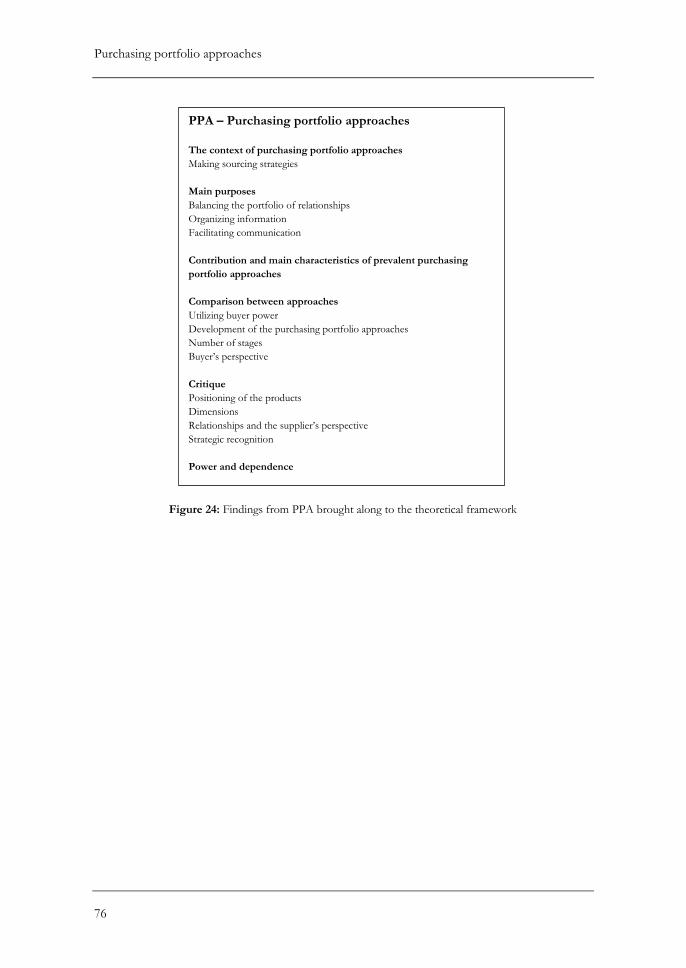
Purchasing portfolio approaches
76
Figure 24: Findings from PPA brought along to the theoretical framework
PPA – Purchasing portfolio approaches
The context of purchasing portfolio approaches
Making sourcing strategies
Main purposes
Balancing the portfolio of relationships
Organizing information
Facilitating communication
Contribution and main characteristics of prevalent purchasing
portfolio approaches
Comparison between approaches
Utilizing buyer power
Development of the purchasing portfolio approaches
Number of stages
Buyer’s perspective
Critique
Positioning of the products
Dimensions
Relationships and the supplier’s perspective
Strategic recognition
Power and dependence
Purchasing sophistication
77
4 Purchasing sophistication The purpose of this chapter is to gain a fundamental understanding of the concept of
purchasing sophistication. First, definitions of purchasing sophistication and its perceived
equivalents are provided. Second, an overview of purchasing maturity models (also referred to as
development models) is given, as purchasing sophistication is closely related to such models. As
there is some critique posted on such models, this is paid attention to in a succeeding
subsection. Thereafter, a discussion of the findings is given, before we summarize the findings
that will be brought along to the theoretical framework.
4.1 Definitions and applications from literature
A relatively sparse body of literature is identified with respect to purchasing sophistication.
There appears to be little consensus on a fixed term reflecting purchasing sophistication; both
maturity and professionalism are seemingly also used to express the concept of purchasing
sophistication. No literature reviews on purchasing sophistication are identified, and existing
literature tends to connect sophistication to other topics. The following topics are identified, and
will be further described in the subsequent sections: Purchasing sophistication… (1) from the
marketer’s perspective; (2) and purchasing’s strategic influence; (3) and corporate purchasing
synergy; (5) and the use of purchasing portfolio models; (6) and firm performance.
4.1.1 Purchasing sophistication from the marketer’s perspective
Contributing to the 1980s’ stream of literature on purchasing’s importance (see 1.1.4), the article
“Impact of Purchasing Trends on Industrial Marketers” by Guinipero and Zenz was published
in 1982. The authors examine how the (then) recent trends in the development of purchasing
have an effect on the field of marketing. As the authors put it, “it is important that industrial
marketers better understand these changes and subsequently implement marketing efforts that
complement the purchasing environment of the 1980s” (p.17), as marketers often have lagged
behind in adjusting their perspective to changes in the sales/purchasing interface (Guinipero and
Zenz, 1982).
In conducting their study, an underlying presumption is that “sales personnel in the 1980s are
making sales calls on a new class of professional buyer” (Guinipero and Zenz, 1982, p.21). The
authors build this presumption on three measures that determine the extent of professionalism
in purchasing: (1) Membership in a professional purchasing organization; (2) attainment of the
rank Certified Purchasing Manager; and (3) participation in internal or external training
programs. The authors argue that membership in a professional purchasing organization (such
as the American NAPM, The National Association of Purchasing Management8) brings benefits
in the shape of “(1) increased job knowledge, (2) personal development, (3) mental stimulation
via exposure to thoughts and ideas different from those of the member corporation, and (4)
chance to attain certification in the field” (p.22). Further, Guinipero and Zenz (1982) describe
an increase in certification at the time, which they find to be due to management recognition of
certification and willingness to pay higher salaries to, and promote, certified purchasers. They
also note that increased professionalism tends to increase emphasis on training and education.
8 The American equivalent to NIMA in Norway.
Purchasing sophistication
78
Guinipero and Zenz (1982) conclude, inter alia, that within the 1980s environment, with a highly
trained purchasing workforce, “sales personnel must become increasingly sophisticated and
productive to meet growing expectations professional purchasers will have on salespeople”
(p.23). As they take the marketer’s perspective, the authors do not provide any guidelines to
purchasers with respect to becoming (more) professional; they merely point out that the three
aforementioned measures determine the extent of professionalism in purchasing.
4.1.2 Purchasing sophistication and purchasing’s strategic influence
In 1983, Kraljic’s article “Purchasing Must Become Supply Management” was published in
Harvard Business Review. The article is one of the most influential articles in the 1980s’ stream
of purchasing literature. In the article, the author presents a two-by-two matrix (‘Exhibit I’, as
seen in Figure 19; see 3.4.1) that classifies the “Stages of Purchasing Sophistication” (p.111)
within companies. By determining the strategic importance of the purchase and the complexity of the
supply market, the required purchasing sophistication can be determined. The four stages of
purchasing sophistication are (1) purchasing management; (2) materials management; (3)
sourcing management; and (4) supply management. Kraljic (1983) never explicitly defines what
he means by purchasing sophistication; he provides step-by-step pragmatic advice on how to
identify supply weaknesses and treat them with comprehensive strategies to manage supply.
However, in Exhibit I, each stage is evaluated with respect to procurement focus; time horizon;
key performance criteria; items purchased; typical sources; supply; and, decision authority.
Further, when classifying purchasing materials requirements (‘Exhibit II’), the stages of
purchasing sophistication vary with an increasing intensity in main tasks, required information
and decision level.
According to Pearson and Gritzmacher (1990), “evidence and intuition suggest that firms that
develop their purchasing function and integrate it into the strategic management process may be
in a better position to survive and to compete successfully in the future” (p.99). The authors
argue that three factors appear to have created the need for an integration of purchasing into the
strategic decision making process: Higher level of competition; the dynamic supply environment
of the firm; and, the changing nature of the purchasing function. The justification for the
purchasing function to be included in the strategic decision-making process depends, according
to Pearson and Gritzmacher (1990), on the sophistication level of the purchasing function,
which they define as the following: “the sophistication level of purchasing within an
organization determines to a great extent its role in and integration into the strategic
management decision making process” (p.93). The authors provide seven key characteristics that
can determine the level of sophistication: (1) organizational structure; (2) organizational
perceptions; (3) information access; (4) information technology; (5) decision issues; (6) supplier
network and relationships; and, (7) strategic management. Table 20 explains the seven key
characteristics, as given by the authors. Here, the operational approach refers to a traditional,
clerical approach (low sophistication), whereas the strategic approach describes characteristics
needed in order for purchasing to influence the strategic management decision-making (high
sophistication).
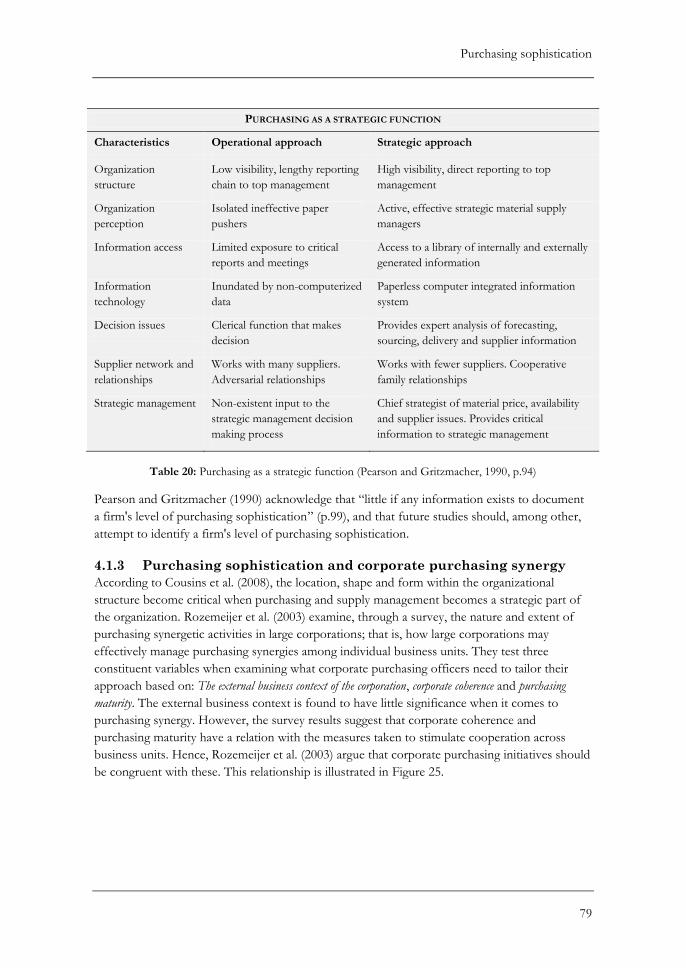
Purchasing sophistication
79
PURCHASING AS A STRATEGIC FUNCTION
Characteristics Operational approach Strategic approach
Organization
structure
Low visibility, lengthy reporting
chain to top management
High visibility, direct reporting to top
management
Organization
perception
Isolated ineffective paper
pushers
Active, effective strategic material supply
managers
Information access Limited exposure to critical
reports and meetings
Access to a library of internally and externally
generated information
Information
technology
Inundated by non-computerized
data
Paperless computer integrated information
system
Decision issues Clerical function that makes
decision
Provides expert analysis of forecasting,
sourcing, delivery and supplier information
Supplier network and
relationships
Works with many suppliers.
Adversarial relationships
Works with fewer suppliers. Cooperative
family relationships
Strategic management Non-existent input to the
strategic management decision
making process
Chief strategist of material price, availability
and supplier issues. Provides critical
information to strategic management
Table 20: Purchasing as a strategic function (Pearson and Gritzmacher, 1990, p.94)
Pearson and Gritzmacher (1990) acknowledge that “little if any information exists to document
a firm's level of purchasing sophistication” (p.99), and that future studies should, among other,
attempt to identify a firm's level of purchasing sophistication.
4.1.3 Purchasing sophistication and corporate purchasing synergy
According to Cousins et al. (2008), the location, shape and form within the organizational
structure become critical when purchasing and supply management becomes a strategic part of
the organization. Rozemeijer et al. (2003) examine, through a survey, the nature and extent of
purchasing synergetic activities in large corporations; that is, how large corporations may
effectively manage purchasing synergies among individual business units. They test three
constituent variables when examining what corporate purchasing officers need to tailor their
approach based on: The external business context of the corporation, corporate coherence and purchasing
maturity. The external business context is found to have little significance when it comes to
purchasing synergy. However, the survey results suggest that corporate coherence and
purchasing maturity have a relation with the measures taken to stimulate cooperation across
business units. Hence, Rozemeijer et al. (2003) argue that corporate purchasing initiatives should
be congruent with these. This relationship is illustrated in Figure 25.
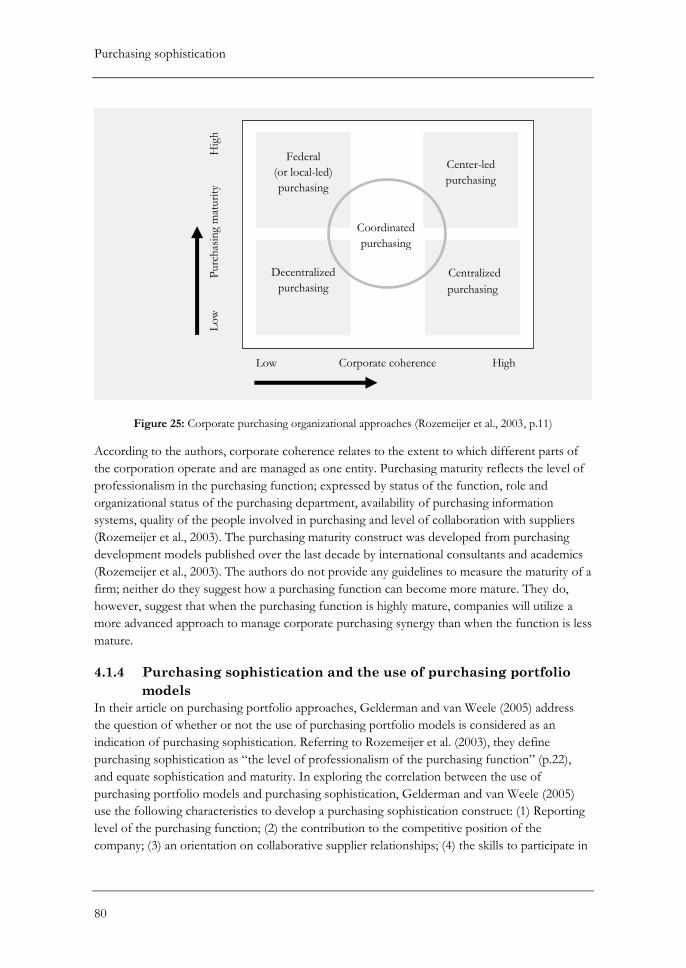
Purchasing sophistication
80
Figure 25: Corporate purchasing organizational approaches (Rozemeijer et al., 2003, p.11)
According to the authors, corporate coherence relates to the extent to which different parts of
the corporation operate and are managed as one entity. Purchasing maturity reflects the level of
professionalism in the purchasing function; expressed by status of the function, role and
organizational status of the purchasing department, availability of purchasing information
systems, quality of the people involved in purchasing and level of collaboration with suppliers
(Rozemeijer et al., 2003). The purchasing maturity construct was developed from purchasing
development models published over the last decade by international consultants and academics
(Rozemeijer et al., 2003). The authors do not provide any guidelines to measure the maturity of a
firm; neither do they suggest how a purchasing function can become more mature. They do,
however, suggest that when the purchasing function is highly mature, companies will utilize a
more advanced approach to manage corporate purchasing synergy than when the function is less
mature.
4.1.4 Purchasing sophistication and the use of purchasing portfolio
models
In their article on purchasing portfolio approaches, Gelderman and van Weele (2005) address
the question of whether or not the use of purchasing portfolio models is considered as an
indication of purchasing sophistication. Referring to Rozemeijer et al. (2003), they define
purchasing sophistication as “the level of professionalism of the purchasing function” (p.22),
and equate sophistication and maturity. In exploring the correlation between the use of
purchasing portfolio models and purchasing sophistication, Gelderman and van Weele (2005)
use the following characteristics to develop a purchasing sophistication construct: (1) Reporting
level of the purchasing function; (2) the contribution to the competitive position of the
company; (3) an orientation on collaborative supplier relationships; (4) the skills to participate in
Federal
(or local-led)
purchasing
Center-led
purchasing
Decentralized
purchasing
Centralized
purchasing
Coordinated
purchasing
Low Corporate coherence High
L
ow
P
urc
has
ing
mat
uri
ty
Hig
h
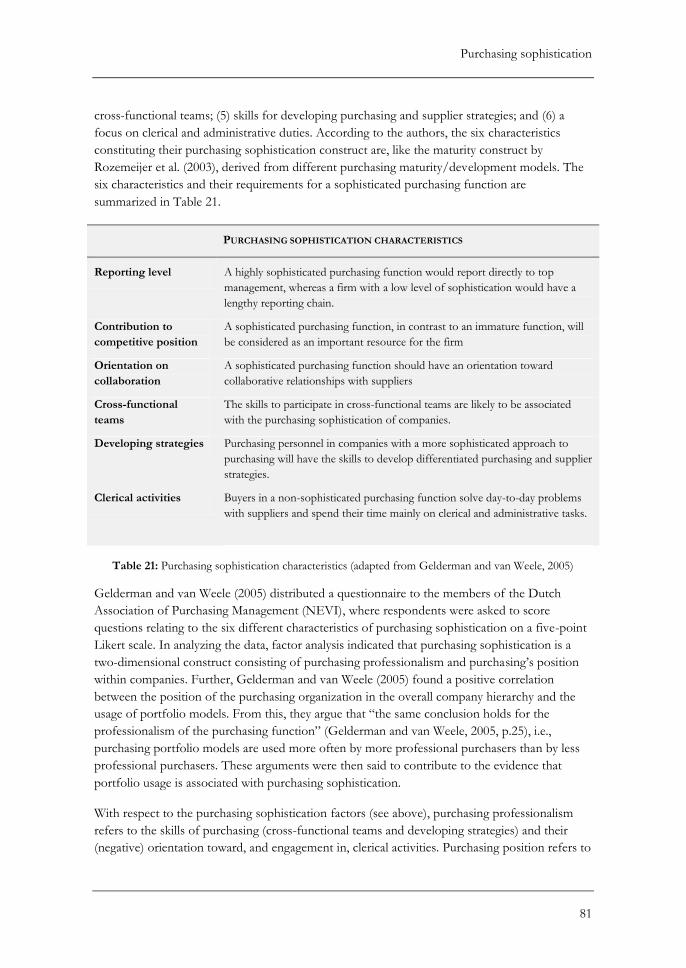
Purchasing sophistication
81
cross-functional teams; (5) skills for developing purchasing and supplier strategies; and (6) a
focus on clerical and administrative duties. According to the authors, the six characteristics
constituting their purchasing sophistication construct are, like the maturity construct by
Rozemeijer et al. (2003), derived from different purchasing maturity/development models. The
six characteristics and their requirements for a sophisticated purchasing function are
summarized in Table 21.
PURCHASING SOPHISTICATION CHARACTERISTICS
Reporting level A highly sophisticated purchasing function would report directly to top
management, whereas a firm with a low level of sophistication would have a
lengthy reporting chain.
Contribution to
competitive position
A sophisticated purchasing function, in contrast to an immature function, will
be considered as an important resource for the firm
Orientation on
collaboration
A sophisticated purchasing function should have an orientation toward
collaborative relationships with suppliers
Cross-functional
teams
The skills to participate in cross-functional teams are likely to be associated
with the purchasing sophistication of companies.
Developing strategies Purchasing personnel in companies with a more sophisticated approach to
purchasing will have the skills to develop differentiated purchasing and supplier
strategies.
Clerical activities Buyers in a non-sophisticated purchasing function solve day-to-day problems
with suppliers and spend their time mainly on clerical and administrative tasks.
Table 21: Purchasing sophistication characteristics (adapted from Gelderman and van Weele, 2005)
Gelderman and van Weele (2005) distributed a questionnaire to the members of the Dutch
Association of Purchasing Management (NEVI), where respondents were asked to score
questions relating to the six different characteristics of purchasing sophistication on a five-point
Likert scale. In analyzing the data, factor analysis indicated that purchasing sophistication is a
two-dimensional construct consisting of purchasing professionalism and purchasing’s position
within companies. Further, Gelderman and van Weele (2005) found a positive correlation
between the position of the purchasing organization in the overall company hierarchy and the
usage of portfolio models. From this, they argue that “the same conclusion holds for the
professionalism of the purchasing function” (Gelderman and van Weele, 2005, p.25), i.e.,
purchasing portfolio models are used more often by more professional purchasers than by less
professional purchasers. These arguments were then said to contribute to the evidence that
portfolio usage is associated with purchasing sophistication.
With respect to the purchasing sophistication factors (see above), purchasing professionalism
refers to the skills of purchasing (cross-functional teams and developing strategies) and their
(negative) orientation toward, and engagement in, clerical activities. Purchasing position refers to
Purchasing sophistication
82
the internal position and status of the purchasing function in companies, deduced from its
contribution to the company’s competitive position and its direct reporting to top management
(Gelderman and van Weele, 2005). The authors remove the “orientation on collaboration”
characteristic from the analysis, as it cross-loads on both the professionalism and status factors.
Gelderman and van Weele (2005) do not address causality in the aforementioned correlation;
however, they argue that it is possible that the introduction of purchasing portfolio approaches
in companies is a driver for purchasing sophistication, and that “adopting a portfolio approach
could work as a catalyst for change within the company” (p.25). Further, it could put purchasing
“higher on the company’s strategic agenda, clarifying the problems and possibilities of
purchasing and supplier management” (Gelderman and van Weele, 2005, p.25). However, they
emphasize that one has to consider the prerequisites, with regard to both the needed
professionalism and domain of the purchasing function within the company, to be able to apply
purchasing portfolio management.
4.1.5 Purchasing sophistication and firm performance
In a relatively recent article, Schiele (2007) investigates the relationship between the
development level of a purchasing organization – maturity – and its impact on the performance
of a firm. The rationale is that as the purchasing volume expressed as a percentage of a firm’s
total turnover has risen substantially in the recent years, a better performance may make a
considerable contribution to a firm’s overall performance (Schiele, 2007). The author develops a
purchasing development model, which is used to test the relationship between purchasing
maturity and firm performance; the latter measured by 14 companies’ success in a purchasing
cost-reduction programme. Referring to Rozemeijer et al. (2003), Schiele defines purchasing
maturity as “the level of professionalism of the purchasing function” (p.22).
We have chosen to look further into the model in a subsequent section on maturity models
(4.2); however, the author’s perception of purchasing maturity seems fit to include here. Schiele
(2007) takes a managerial approach to purchasing, and presents a five-dimensional profile of
purchasing maturity, consisting of: (1) procurement planning; (2) the structural organization of
the purchasing function; (3) process organization and purchasing’s embeddedness in the firm;
(4) established human resource systems and leadership models in procurement; and (5)
purchasing controlling structures. The dimensions are, as for Rozemeijer et al. (2003) and
Gelderman and van Weele (2005), deduced from literature on development models and
commonalities in these. Schiele (2007) also finds that “collaborative supplier relations” is a
common dimension of such models. However, he omits it, as it cannot be deduced from a
management model; “a classical management approach (…) does not favour any single strategy”
(p.277). Each of the five dimensions contains several items that are used to assess a firm’s
purchasing maturity, and we choose to refer to the article by Schiele (2007) for a further
elaboration of these.
Schiele (2007) confirms a positive relationship between maturity and firm performance. Initially,
he expected that firms with a low degree of maturity would have a larger savings potential;
however, he was surprised to find that the new method performed better with mature
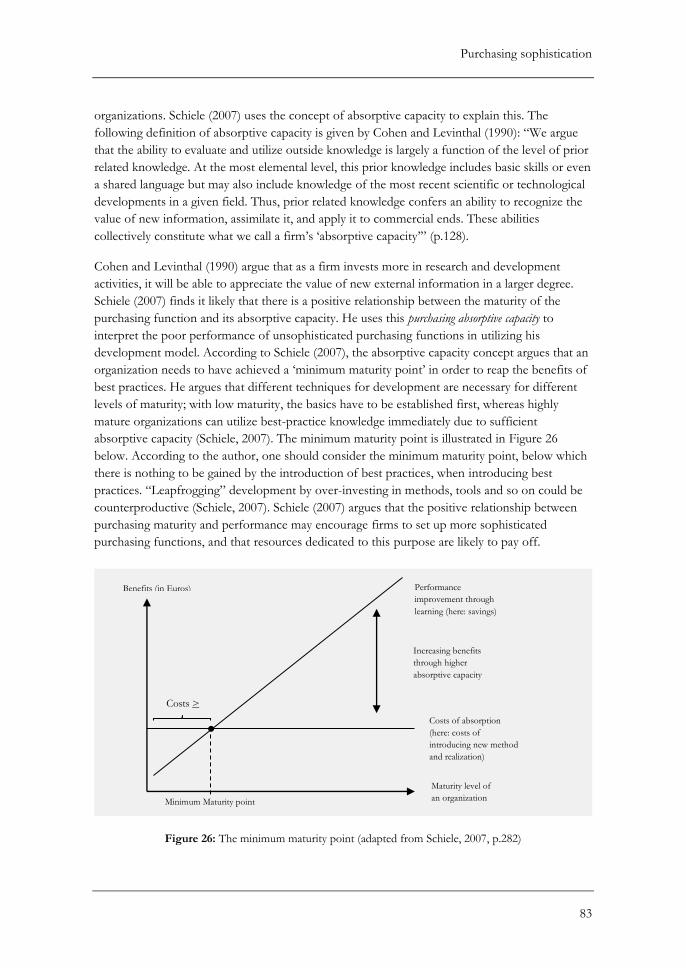
Purchasing sophistication
83
organizations. Schiele (2007) uses the concept of absorptive capacity to explain this. The
following definition of absorptive capacity is given by Cohen and Levinthal (1990): “We argue
that the ability to evaluate and utilize outside knowledge is largely a function of the level of prior
related knowledge. At the most elemental level, this prior knowledge includes basic skills or even
a shared language but may also include knowledge of the most recent scientific or technological
developments in a given field. Thus, prior related knowledge confers an ability to recognize the
value of new information, assimilate it, and apply it to commercial ends. These abilities
collectively constitute what we call a firm’s ‘absorptive capacity’” (p.128).
Cohen and Levinthal (1990) argue that as a firm invests more in research and development
activities, it will be able to appreciate the value of new external information in a larger degree.
Schiele (2007) finds it likely that there is a positive relationship between the maturity of the
purchasing function and its absorptive capacity. He uses this purchasing absorptive capacity to
interpret the poor performance of unsophisticated purchasing functions in utilizing his
development model. According to Schiele (2007), the absorptive capacity concept argues that an
organization needs to have achieved a ‘minimum maturity point’ in order to reap the benefits of
best practices. He argues that different techniques for development are necessary for different
levels of maturity; with low maturity, the basics have to be established first, whereas highly
mature organizations can utilize best-practice knowledge immediately due to sufficient
absorptive capacity (Schiele, 2007). The minimum maturity point is illustrated in Figure 26
below. According to the author, one should consider the minimum maturity point, below which
there is nothing to be gained by the introduction of best practices, when introducing best
practices. “Leapfrogging” development by over-investing in methods, tools and so on could be
counterproductive (Schiele, 2007). Schiele (2007) argues that the positive relationship between
purchasing maturity and performance may encourage firms to set up more sophisticated
purchasing functions, and that resources dedicated to this purpose are likely to pay off.
Figure 26: The minimum maturity point (adapted from Schiele, 2007, p.282)
Performance
improvement through
learning (here: savings)
Increasing benefits
through higher
absorptive capacity
Costs of absorption
(here: costs of
introducing new method
and realization)
Maturity level of
an organization Minimum Maturity point
Benefits (in Euros)
Costs >
benefits

Purchasing sophistication
84
We have now presented articles that address the concept of purchasing sophistication. Table 22
summarizes descriptions of purchasing sophistication identified in the literature. As several of
these are deduced from maturity (or development) models, the next subsection provides a brief
overview of such models.
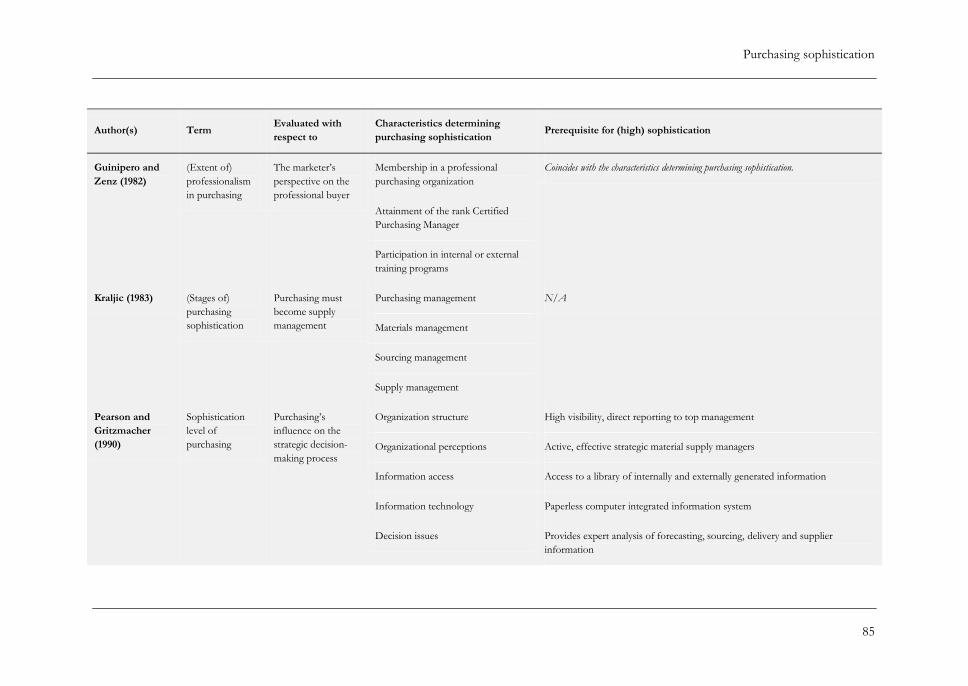
Purchasing sophistication
85
Author(s) Term Evaluated with
respect to
Characteristics determining
purchasing sophistication Prerequisite for (high) sophistication
Guinipero and
Zenz (1982)
(Extent of)
professionalism
in purchasing
The marketer’s
perspective on the
professional buyer
Membership in a professional
purchasing organization
Coincides with the characteristics determining purchasing sophistication.
Attainment of the rank Certified
Purchasing Manager
Participation in internal or external
training programs
Kraljic (1983) (Stages of)
purchasing
sophistication
Purchasing must
become supply
management
Purchasing management N/A
Materials management
Sourcing management
Supply management
Pearson and
Gritzmacher
(1990)
Sophistication
level of
purchasing
Purchasing’s
influence on the
strategic decision-
making process
Organization structure High visibility, direct reporting to top management
Organizational perceptions Active, effective strategic material supply managers
Information access Access to a library of internally and externally generated information
Information technology Paperless computer integrated information system
Decision issues Provides expert analysis of forecasting, sourcing, delivery and supplier
information
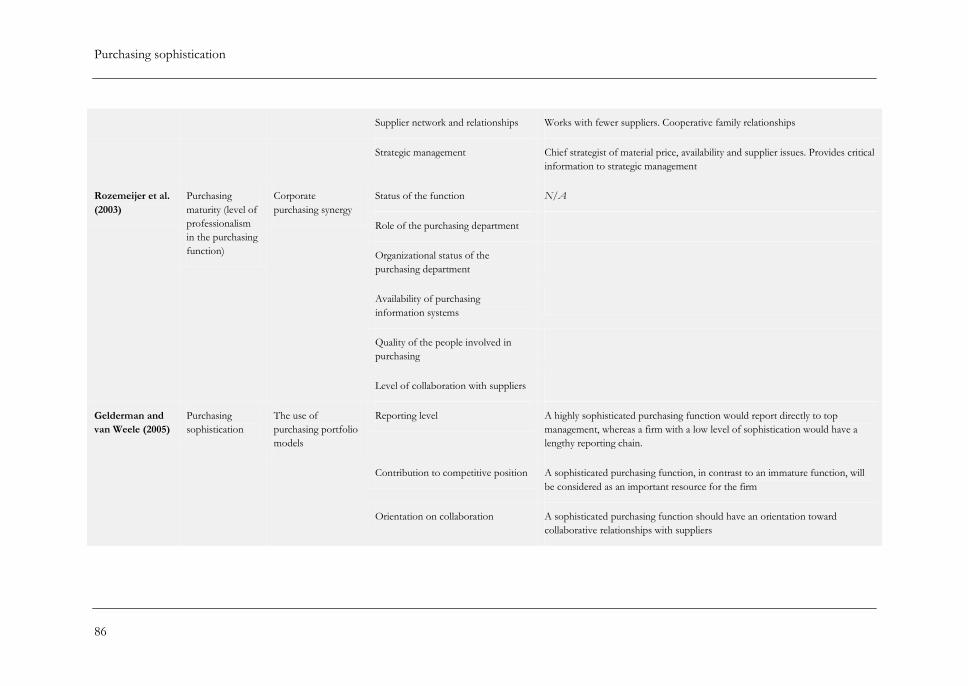
Purchasing sophistication
86
Supplier network and relationships Works with fewer suppliers. Cooperative family relationships
Strategic management Chief strategist of material price, availability and supplier issues. Provides critical
information to strategic management
Rozemeijer et al.
(2003)
Purchasing
maturity (level of
professionalism
in the purchasing
function)
Corporate
purchasing synergy
Status of the function N/A
Role of the purchasing department
Organizational status of the
purchasing department
Availability of purchasing
information systems
Quality of the people involved in
purchasing
Level of collaboration with suppliers
Gelderman and
van Weele (2005)
Purchasing
sophistication
The use of
purchasing portfolio
models
Reporting level A highly sophisticated purchasing function would report directly to top
management, whereas a firm with a low level of sophistication would have a
lengthy reporting chain.
Contribution to competitive position A sophisticated purchasing function, in contrast to an immature function, will
be considered as an important resource for the firm
Orientation on collaboration A sophisticated purchasing function should have an orientation toward
collaborative relationships with suppliers
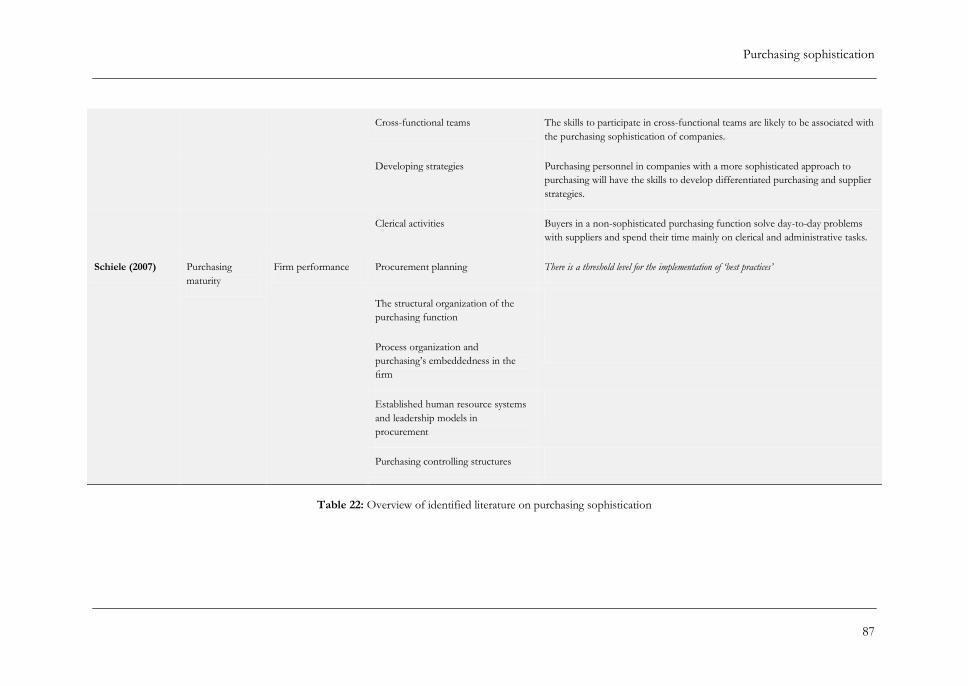
Purchasing sophistication
87
Cross-functional teams The skills to participate in cross-functional teams are likely to be associated with
the purchasing sophistication of companies.
Developing strategies Purchasing personnel in companies with a more sophisticated approach to
purchasing will have the skills to develop differentiated purchasing and supplier
strategies.
Clerical activities Buyers in a non-sophisticated purchasing function solve day-to-day problems
with suppliers and spend their time mainly on clerical and administrative tasks.
Schiele (2007) Purchasing
maturity
Firm performance Procurement planning There is a threshold level for the implementation of ‘best practices’
The structural organization of the
purchasing function
Process organization and
purchasing’s embeddedness in the
firm
Established human resource systems
and leadership models in
procurement
Purchasing controlling structures
Table 22: Overview of identified literature on purchasing sophistication
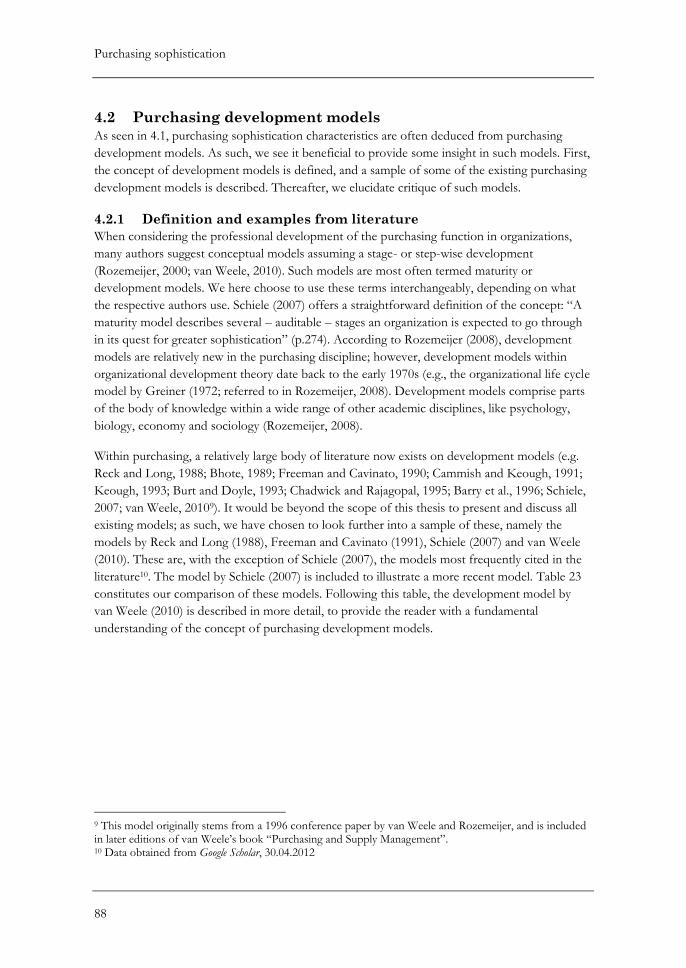
Purchasing sophistication
88
4.2 Purchasing development models
As seen in 4.1, purchasing sophistication characteristics are often deduced from purchasing
development models. As such, we see it beneficial to provide some insight in such models. First,
the concept of development models is defined, and a sample of some of the existing purchasing
development models is described. Thereafter, we elucidate critique of such models.
4.2.1 Definition and examples from literature
When considering the professional development of the purchasing function in organizations,
many authors suggest conceptual models assuming a stage- or step-wise development
(Rozemeijer, 2000; van Weele, 2010). Such models are most often termed maturity or
development models. We here choose to use these terms interchangeably, depending on what
the respective authors use. Schiele (2007) offers a straightforward definition of the concept: “A
maturity model describes several – auditable – stages an organization is expected to go through
in its quest for greater sophistication” (p.274). According to Rozemeijer (2008), development
models are relatively new in the purchasing discipline; however, development models within
organizational development theory date back to the early 1970s (e.g., the organizational life cycle
model by Greiner (1972; referred to in Rozemeijer, 2008). Development models comprise parts
of the body of knowledge within a wide range of other academic disciplines, like psychology,
biology, economy and sociology (Rozemeijer, 2008).
Within purchasing, a relatively large body of literature now exists on development models (e.g.
Reck and Long, 1988; Bhote, 1989; Freeman and Cavinato, 1990; Cammish and Keough, 1991;
Keough, 1993; Burt and Doyle, 1993; Chadwick and Rajagopal, 1995; Barry et al., 1996; Schiele,
2007; van Weele, 20109). It would be beyond the scope of this thesis to present and discuss all
existing models; as such, we have chosen to look further into a sample of these, namely the
models by Reck and Long (1988), Freeman and Cavinato (1991), Schiele (2007) and van Weele
(2010). These are, with the exception of Schiele (2007), the models most frequently cited in the
literature10. The model by Schiele (2007) is included to illustrate a more recent model. Table 23
constitutes our comparison of these models. Following this table, the development model by
van Weele (2010) is described in more detail, to provide the reader with a fundamental
understanding of the concept of purchasing development models.
9 This model originally stems from a 1996 conference paper by van Weele and Rozemeijer, and is included in later editions of van Weele’s book “Purchasing and Supply Management”. 10 Data obtained from Google Scholar, 30.04.2012
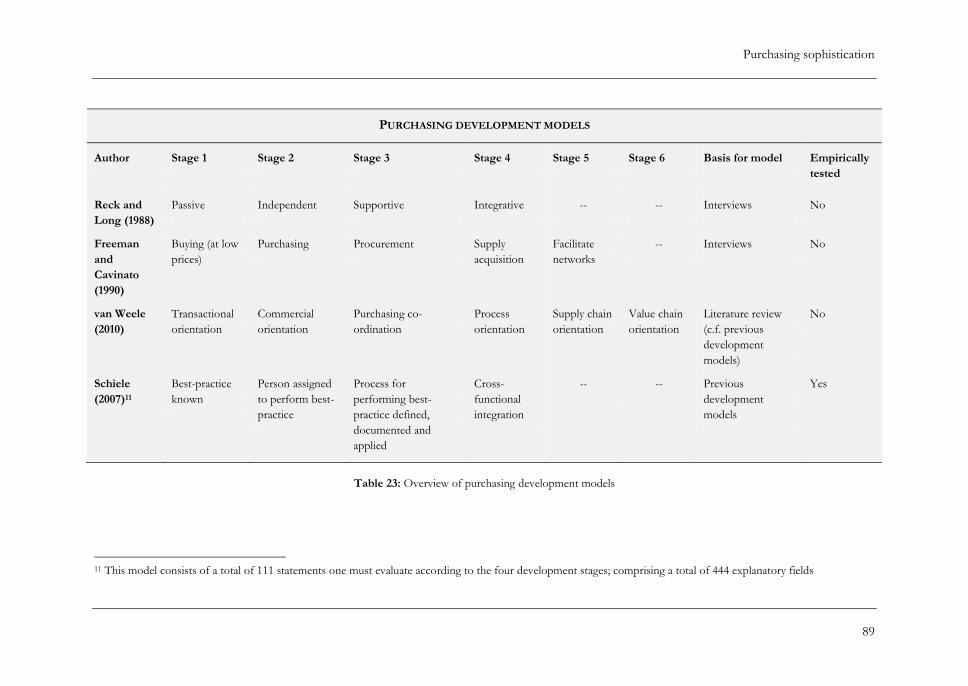
Purchasing sophistication
89
PURCHASING DEVELOPMENT MODELS
Author Stage 1 Stage 2 Stage 3 Stage 4 Stage 5 Stage 6 Basis for model Empirically
tested
Reck and
Long (1988)
Passive Independent Supportive Integrative -- -- Interviews No
Freeman
and
Cavinato
(1990)
Buying (at low
prices)
Purchasing Procurement Supply
acquisition
Facilitate
networks
-- Interviews No
van Weele
(2010)
Transactional
orientation
Commercial
orientation
Purchasing co-
ordination
Process
orientation
Supply chain
orientation
Value chain
orientation
Literature review
(c.f. previous
development
models)
No
Schiele
(2007)11
Best-practice
known
Person assigned
to perform best-
practice
Process for
performing best-
practice defined,
documented and
applied
Cross-
functional
integration
-- -- Previous
development
models
Yes
Table 23: Overview of purchasing development models
11 This model consists of a total of 111 statements one must evaluate according to the four development stages; comprising a total of 444 explanatory fields

Purchasing sophistication
90
Purchasing and supply development model
The development model by van Weele (2010) takes the model by Keough (1993) as a point of
departure. Keough (1993) identifies five stages of development in purchasing, and assumes a
causal relationship between the industry a company operates in, and the stage of development.
Van Weele (2010) combines insights from additional contributors in order to construct an
integrated purchasing development model, resulting in the six-stage model depicted in Figure 27.
Next, the stages in the development model by van Weele (2010) are described as by the author.
Focus Serve the
factory
Reduce cost Savings
through
synergy
Total cost of
ownership
Supply chain
optimization
Total customer
satisfaction
Activi-
ties
• Clerical
• Order
processing
• Commercial
• Tendering
• Negotiating
• Approved
supplier lists
• Commercial
• Contracting
• Global
sourcing
• Cross-
functional
buying teams
• Systems
integration
• Vendor
rating etc.
• Outsourcing
• EDI
/Internet
• E-
commerce
• Cost models
• Customer-
driven activities
• Contact manu-
facturing
• Supplier
development
• Global supplier
network
Di-
lemmas
• Initial
purchasing
• Control of
purchasing
• Expenditure
• Supplier
base
management
• Contract
management
• Ethics
• Communi-
cation and
information
infrastructure
• Social
resistance
• Internatio-
nalization
• HRM
Figure 27: Purchasing and supply development model (adapted from van Weele, 2010, p.69)
Pharma
Consumer
electronics
Computers/
PCs
Auto-
motive
Retailers
Telecom-
munication
Construc-
tion Public
utilities
Food and
beverages
Financial
services
Decentralized
Functional focus
Centre-led
Cross-functional focus
Transactional
orientation
Commercial
orientation Value chain
integration External
integration Internal
integration Purchasing
co-ordination
Eff
ecti
ven
ess/
cum
ula
tive
savin
gs
Purchasing sophistication
91
In the first stage, purchasing’s primary task is to locate appropriate suppliers and secure the supply
of raw materials and necessary components. This is also regarded as the value added by the
purchasing function, which lacks an explicit purchasing strategy. Purchasing is a sub-department
at business unit level, and reports mostly to a production or logistics manager. It is strongly
oriented on operational and administrative activities. There is very little insight in how much is
spent on purchasing in the company. Buying is done reactively, and purchasing is evaluated on
complaint, meaning that purchasing does a sufficient job when no complaints are filed. The
purchasing staff usually consists of operational and administrative buyers with little professional
purchasing education.
The second stage is named ‘Reduce cost’; as such, the focus lies at striving for the lowest unit cost.
The purchasing function is granted its own department at business unit level, and reports
directly to the business unit manager. A purchasing strategy is present, focusing on low prices.
Consequently, the performance of purchasing is primarily measured on cost savings, which leads
to a culture showing signs of hard negotiations with many suppliers. Purchasing is increasingly
becoming a specialist function. The purchasing staff consists of operational and initial buyers
with hands-on experience, with specialist buyers focused around different product groups;
concentrating on negotiation and contracting ‘good deals’.
In the third stage, emphasis lies on cross-unit coordination and compliance with nationally
negotiated contracts. For the first time, there is a kind of strategy formulation, which is aimed at
capturing the benefits from internal coordination and synergies. The purchasing function is a
centralized purchasing department at corporate level, which is responsible for establishing
purchasing policies. Differentiated supplier strategies are based upon portfolio-analysis
techniques. In this stage, supplier management is a focus of attention, and the firm tries to
achieve purchasing power by bundling volumes across business units. Increasingly, purchasing is
seen as having an important influence on the quality of the purchased products, and non-
production related purchasing receives greater attention from the purchasing function. The
purchasing function gets some attention from top management; however, other parts of the
organization remain skeptical to whether purchasing has any real value adding potential. The
purchasing organization is strongly product oriented, and the purchasing staff has purchasing
background and training.
In the fourth stage, cross-functional problem solving receives much attention. The objective is to
reduce total life cycle costs, rather than just the unit cost of purchased components. Key
suppliers may be included in the problem solving, implying a move from confrontational to
partnership sourcing. In the previous stages, purchasing as a function was primarily functionally
oriented, with the company organized around the purchasing function; however, in this stage
purchasing becomes more process-oriented, and is organized around internal customers. Non-
production purchasing receives serious attention, and the purchasing function is recognized as
of strategic importance; consequently, it is included in strategic issues like core/non-core and
make-or-buy decisions. The structure is ‘center-led’, meaning that cross-functional (or cross-
business) teams conduct coordination activities with active support of the business units under
strong management by a corporate purchasing staff. With respect to the framework by
Purchasing sophistication
92
Rozemeijer et al. (2003) (Figure 25), this refers to a situation with both high corporate coherence
and high purchasing maturity. Operational buying receives less attention, as e-procurement
solutions are put in place to handle this. The purchasing staff is highly educated with a broad
business perspective.
The fifth stage has a focus on outsourcing, for which a dedicated strategy is formulated; focusing
on creating maximum leverage of the company’s external resources. This is combined with an
attention to collaborate with supply chain partners, especially suppliers, in new product
development, pre-production planning activities and process improvements. Non-production
buying is executed or fully supported by the purchasing function, and ease for internal
customers is pursued through systems contracting, electronic business, catalogues or electronic
data interchange (EDI). In this stage, supplier management becomes supply chain management;
instead of having mere transactional relationships to suppliers, the firm now invests in supply
partners. Initial purchasing is no longer performed by a separate department, but rather by
cross-functional teams. The suppliers may have representatives in the buying firm to work on
design or manufacturing problems, constituting so called residential engineering teams. There is
integration across disciplines, divisions and suppliers, in order to achieve integrated supply chain
management. This is supported by information systems that are integrated internally as well as
with partner suppliers. Important skills are knowledge of principles underling total cost of
ownership (TCO), e.g. being able to build cost models, strategic supply chain management and
general management skills.
In the sixth and final stage of the development model by van Weele (2010), delivering value to the
end customer is at the center of attention in the purchasing strategy. As such, suppliers are
challenged to support the firm’s market strategies, and participate actively in product
development. The value chain orientation has the goal of designing the most effective and
efficient value chain possible. Instead of just contributing to the bottom line in terms of cost
reduction, suppliers are challenged to contribute to the top line through business development.
There is a strategic fit between the overall business strategy and the purchasing strategy. The
traditional marketing and purchasing functions are integrated, and all organizational members
carry a shared, entrepreneurial vision.
As development models are not without critics, we have chosen to look further into some of the
critique on purchasing development models in the succeeding section.
4.2.2 Critique of purchasing development models
Purchasing development models are both questioned and criticized. Dubois and Wynstra (2005)
discuss the model by van Weele (2005)12. They point out that one could question why one phase
should be considered more advanced and sophisticated than the other. The authors argue that a
purchasing function could do a good job in terms of performance, even though it does not
operate at the highest possible level of sophistication. They point out that in specific cases, like
in small firms, this may be the case; the higher skills and concomitant high salaries, together with
12 Previous edition of van Weele (2010)
Purchasing sophistication
93
expensive supporting technologies that may come with higher levels of sophistication, may be a
too high price to pay compared with the potential improvements (Dubois and Wynstra, 2005).
Ramsay and Croom (2008) follow in the lines of the critique mentioned above, and criticize the
widespread consensus that has emerged in the Purchasing and Supply Management (PSM) field
– that purchasing and supply activities may be classified as “strategic” and “nonstrategic”. In this
respect, they criticize development models, which imply that intra-organizational status can be
improved by “moving up the evolutionary ladder” (p.198), away from administrative or clerical
activities: “At the heart of the conventional wisdom lies the argument that some PSM activities
are intrinsically non-strategic and that because improvements in the function’s strategic
contribution will enable the function to improve its intra-organisational status, it should focus
on strategic activities” (p.203). According to Ramsay and Croom (2008), this will only apply after
you have established the organizational value of the function by dramatically demonstrating the
contribution of PSM activities to the firm’ bottom line. A failure to do this may be a cause of
continued low status in large companies (Ramsay and Croom, 2008). The authors point out that
they do not suggest that the purchasing function should become passive and clerical; however,
in firms where no purchasing function does not yet exist, or is small and struggling against
maverick purchasing activities, “getting control of the ‘low-level’ clerical activities is an essential
objective” (p.203). As such, the authors claim that purchasing development models are
unhelpful.
Rozemeijer (2008) responds to the article by Ramsay and Croom (2008). He agrees with Ramsay
and Croom (2008) in that purchasing development model literature typically lacks the notion
that purchasing development models are not substitutes for various degrees of strategic
thinking, influencing and problem solving that exist in unique firms. However, Rozemeijer
(2008) disagrees with respect to develop models being unhelpful. According to him,
development models are helpful in classifying organizations in terms of their current position.
Further, they are especially relevant when one in a systematic way wants to take bearing of
possible directions for strategic change (Rozemeijer, 2008). The author provides several
questions which such a model can help answer: “What should the next growth step be given the
specific industry and company context? How could a firm develop from stage 1 to 2 or from 4
to 5? What measures need to be taken? What barriers need to be overcome? What potential
improvements are to be harvested?” (p.206).
Dubois and Wynstra (2005) question whether there is a natural growth path from left to right,
and argue that organizations may revert one or several phases. This is also acknowledged by
Reck and Long (1988), who claim that “the purchasing function appears to move up and down
the development continuum” (p.8). Other similar development issues are addressed by van
Weele (2010), who poses several questions related to the development path: “Does purchasing
development really take place as a process of continuous change or is it in reality characterized
more by step-changes and discontinuity?”; “do all organizations follow the stages identified or
can some stages be skipped?”;” how much time does it take to go through the different stages of
the model?”; “is it possible to skip some stages in the model?” (p.72).
Purchasing sophistication
94
Van Weele (2010) acknowledges that his development model has never been empirically tested
through academic research, and as such he cannot provide any answers to the questions above.
Ramsay and Croom (2008) note that “no empirical evidence is offered in any of the papers
employing the biological metaphors to show that all purchasing functions are improving”
(p.199). This lack of empirical testing is recognized by Rozemeijer (2008) as the most important
drawback of purchasing development models. He notes that the papers and books from which
these models are derived are conceptual and based on literature studies; as such, they should be
regarded as conceptual, even though they have been utilized as instruments for diagnosis by
many consultants and practitioners (Rozemeijer, 2008).
Table 24 summarizes the identified critique on purchasing development models. In the next
section, a discussion on the preceding findings is given.
CRITIQUE ON PURCHASING DEVELOPMENT MODELS
Critique Author(s)
Over-emphasis on the rightmost stages of the models – neglecting the
bottom line impact of “non-strategic” items and uniqueness of firms
that may impede the development process.
Dubois and Wynstra (2005);
Ramsay and Croom (2008)
Questionable whether firms follow a linear development path from “left
to right”
Reck and Long (1988); Dubois
and Wynstra (2005); Van Weele
(2010)
Lack of empirical testing, questionable validity and reliability of such
models
Rozemeijer (2008); Van Weele
(2010)
Table 24: Critique on purchasing development models
4.3 Discussion
In this chapter, we have reviewed literature on purchasing sophistication, and the closely related
concept of purchasing development models, including critique of the latter. We see it beneficial
to discuss these findings, in order to establish which findings that will be brought along to the
establishment of a theoretical framework at the end of this part, answering our first research
question (1.2). First, we discuss definitions and characteristics of purchasing sophistication.
Thereafter, we investigate how purchasing sophistication may relate to purchasing development
models, by comparing characteristics of the first with an example of the latter. Finally, we
discuss how critique on purchasing development models may apply for purchasing
sophistication.
4.3.1 Adopting a definition and characteristics of purchasing
sophistication
As previously mentioned, there is little consensus on the definition of purchasing sophistication
(4.1). Pearson and Gritzmacher (1990) are the only authors to give an explicit definition of
purchasing sophistication; “the sophistication level of purchasing within an organization
Purchasing sophistication
95
determines to a great extent its role in and integration into the strategic management decision
making process” (p.93) (4.1.2). According to Rozemeijer et al. (2003), purchasing maturity
reflects the level of professionalism in the purchasing function (4.1.3). This definition is adopted
by Gelderman and van Weele (2005), who define purchasing sophistication as “the level of
professionalism of the purchasing function” (p.22), and equate sophistication and maturity
(4.1.4). Schiele (2007) further defines maturity as the development level of a purchasing
organization (4.1.5). As such, we note that purchasing sophistication, professionalism and
maturity are somewhat used interchangeably to display the same term. Neither Rozemeijer et al.
(2003), Gelderman and van Weele (2005) nor Schiele (2007) define what is meant by level of
professionalism or development level of the purchasing function; nor do Guinipero and Zenz
(1982) and Kraljic (1983) with respect to the extent of professionalism in the purchasing
function and stages of purchasing sophistication, respectively. As such, the definition of
purchasing sophistication by Pearson and Gritzmacher (1990) seems appropriate to adopt
throughout this master’s thesis.
When reviewing the literature, we saw that the foci in the respective articles reflect the
development in purchasing’s strategic relevance (as described in 1.1.4). The earlier articles
(Guinipero and Zenz, 1982; Kraljic, 1983) reflect that purchasing had not yet received
recognition as an important strategic function. Furthermore, the more recent articles (Pearson
and Gritzmacher, 1990; Rozemeijer et al., 2003; Gelderman and van Weele, 2005; Schiele, 2007)
have acknowledged the importance of the purchasing function, both as a contributor to strategic
planning and economic performance (1.1.4). In line with this development in literature, we see a
change in foci of analysis when considering purchasing sophistication; from the individual
(Guinipero and Zenz, 1982), via product level (Kraljic, 1983) to the purchasing function
(Pearson and Gritzmacher, 1990; Rozemeijer et al., 2003; Gelderman and van Weele, 2005;
Schiele, 2007).
We argue that a comprehensive understanding of purchasing sophistication also should include
recommendations as to how to achieve, or, in other words, prerequisites for purchasing
sophistication. As such, only two of the identified articles (Pearson and Gritzmacher, 1990;
Gelderman and van Weele, 2005) meet this criterion (Table 22). When comparing these two
contributions, we see some resemblance in the definitions. To recapitulate, Gelderman and van
Weele (2005) provide the following characteristics of purchasing sophistication: reporting level;
contribution to competitive position; orientation on collaboration; cross-functional teams;
developing strategies; and, clerical activities. When comparing these with the characteristics
provided by Pearson and Gritzmacher (1990), we see that many characteristics are defined in a
similar manner. Reporting level bears resemblance to organizational structure; as it reflects
purchasing reporting to top management. Further, orientation on collaboration is defined in a
similar manner as supplier network and relationships; oriented on collaborative relationships with
(fewer) suppliers. Contribution to competitive position is reflected in strategic management; both
refer to purchasing’s contribution to corporate competitive strategy. Clerical activities are
defined in terms of low sophistication; hence, it reflects the operational approach’s description
of organizational perceptions. It is likely that non-clerical activities would result in a higher
Purchasing sophistication
96
organization perception of the purchasing function, and as such, we argue that these
characteristics are similar.
Developing strategies and decision issues are somewhat less similar than the previously discussed
characteristics. Developing strategies has a more strategic focus than the more operational
decision issues. Further, we see that the information access and information technology characteristics
by Pearson and Gritzmacher (1990) are not incorporated in the characteristics by Gelderman
and van Weele (2005). We do, however, argue that these characteristics are somewhat self-
evident in these days; reflecting that these characteristics may be somewhat outdated. Finally,
Gelderman and van Weele (2005) incorporate cross-functional teams as a prerequisite for high
purchasing sophistication, which reflects today’s trend of teaming.
Based on this discussion, we argue that the characteristics given by Gelderman and van Weele
(2005) are the most comprehensive, and incorporate characteristics provided by other authors.
Even though not all characteristics are incorporated, we argue that the few remaining
characteristics are redundant in today’s marketplace. They further provide cross-functional
teamwork as a characteristic determining purchasing sophistication. We consider this valuable,
as it also reflects important trends in both literature and business practice. In addition, we note
that the characteristics have been operationalized in a survey conducted by the authors, in a
study with similar research objectives as in this master’s thesis. As such, by approaching a
consensus by adopting these characteristics, we see the possibility to replicate the study and do
comparisons with purchasing practice in Norwegian ETO companies.
4.3.2 Investigating the relationship between purchasing
sophistication and purchasing development models
As seen in 4.1, several authors (Rozemeijer et al., 2003; Gelderman and van Weele, 2005;
Schiele, 2007) have developed their characteristics of purchasing sophistication from purchasing
development models. As mentioned in the proceeding subsection, Pearson and Gritzmacher
(1990) and Gelderman and van Weele (2005) are the only ones to provide what we have termed
prerequisites for (high) sophistication (Table 22). They do not, however, distinguish between
various levels of sophistication beyond pointing to what is non-sophisticated (operational) and
what is sophisticated (strategic). Pearson and Gritzmacher (1990) explicitly call for future studies
on how to measure a firm’s level of purchasing sophistication (4.1.2).
In the section concerning purchasing development models (4.2), a development model was
defined as a model that “describes several – auditable – stages an organization is expected to go
through in its quest for greater sophistication” (Schiele, 2007, p.274). Rozemeijer (2008) argues
that development models are helpful in classifying organizations in terms of their current
position, and in a systematic way providing possible directions for strategic change (4.2.2). As
such, we see it beneficial to compare purchasing sophistication characteristics with a
development model, in order to distinguish whether such a model reflect various levels of
purchasing sophistication per se. The choice of a development model, to use as a framework in
this discussion, is described in the next paragraph.
Purchasing sophistication
97
The choice of purchasing development model
The development models by Reck and Long (1988), Cavinato and Freeman (1990), van Weele
(2010) and Schiele (2007) were compared in 4.2.1. These vary with, among others, number of
stages, basis for the model and empirical foundation (Table 23). The models by Reck and Long
(1988) and Freeman and Cavinato (1990) illustrate how purchasing can evolve from a clerical
function to a strategic contributor, while the models by van Weele (2010) and Schiele (2007) go
further in describing how the function can evolve after it is regarded as of strategic importance.
As such, the various models reflect the evolution of purchasing’s strategic importance, as
outlined in the introduction (1.1.4). As purchasing today generally is regarded to be of strategic
importance (1.1.4), we feel that the models by van Weele (2010) and Schiele (2007) best reflect
today’s situation.
The model by Schiele (2007) is regarded to be too comprehensive for our purpose, as it consists
of a total of 111 statements one must evaluate according to four development stages; comprising
a total of 444 explanatory fields (Table 23; 11). Therefore, we choose the development model by
van Weele (2010) as a starting point. This is also the model with the highest number of
development stages (Table 23); hence, we regard it to be the most nuanced – which intuitively
seems beneficial in comparing purchasing sophistication characteristics. The model by van
Weele (2010) also integrates and combines insight from other development models (4.2.1),
which speaks in its favor when choosing between the models. In line with the discussion in
4.3.1, the purchasing sophistication characteristics by Gelderman and van Weele (2005) are
compared with the development model by van Weele (2010) in the next paragraph.
Comparing purchasing sophistication characteristics with a purchasing development
model
The development model by van Weele (2010) does not explicitly use purchasing sophistication
at the horizontal axis; it uses time (Figure 27). As such, we will in this paragraph discuss whether
the time dimension could be replaced by level of purchasing sophistication. Consequently, in
order to relate the development model to purchasing sophistication, we compare each stage to
the purchasing sophistication characteristics provided by Gelderman and van Weele (2005):
reporting level; contribution to competitive position; orientation on collaboration; cross-
functional teams; developing strategies; and, clerical activities (4.1.4; Table 21). In our
understanding of the development model, we argue that favorable acquired skills or
characteristics do not expire in the evolution from left to right; e.g., when the purchasing
function does not receive less attention from top management when evolving. The discussion of
each stage follows below.
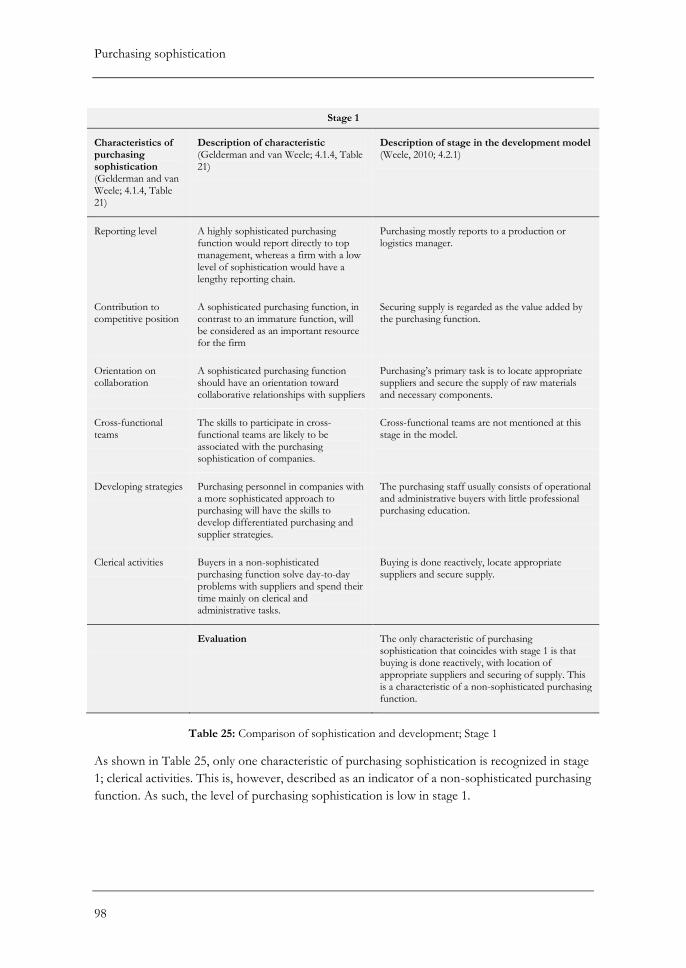
Purchasing sophistication
98
Stage 1
Characteristics of purchasing sophistication (Gelderman and van Weele; 4.1.4, Table 21)
Description of characteristic (Gelderman and van Weele; 4.1.4, Table 21)
Description of stage in the development model (Weele, 2010; 4.2.1)
Reporting level A highly sophisticated purchasing function would report directly to top management, whereas a firm with a low level of sophistication would have a lengthy reporting chain.
Purchasing mostly reports to a production or logistics manager.
Contribution to competitive position
A sophisticated purchasing function, in contrast to an immature function, will be considered as an important resource for the firm
Securing supply is regarded as the value added by the purchasing function.
Orientation on collaboration
A sophisticated purchasing function should have an orientation toward collaborative relationships with suppliers
Purchasing’s primary task is to locate appropriate suppliers and secure the supply of raw materials and necessary components.
Cross-functional teams
The skills to participate in cross-functional teams are likely to be associated with the purchasing sophistication of companies.
Cross-functional teams are not mentioned at this stage in the model.
Developing strategies Purchasing personnel in companies with a more sophisticated approach to purchasing will have the skills to develop differentiated purchasing and supplier strategies.
The purchasing staff usually consists of operational and administrative buyers with little professional purchasing education.
Clerical activities Buyers in a non-sophisticated purchasing function solve day-to-day problems with suppliers and spend their time mainly on clerical and administrative tasks.
Buying is done reactively, locate appropriate suppliers and secure supply.
Evaluation The only characteristic of purchasing sophistication that coincides with stage 1 is that buying is done reactively, with location of appropriate suppliers and securing of supply. This is a characteristic of a non-sophisticated purchasing function.
Table 25: Comparison of sophistication and development; Stage 1
As shown in Table 25, only one characteristic of purchasing sophistication is recognized in stage
1; clerical activities. This is, however, described as an indicator of a non-sophisticated purchasing
function. As such, the level of purchasing sophistication is low in stage 1.
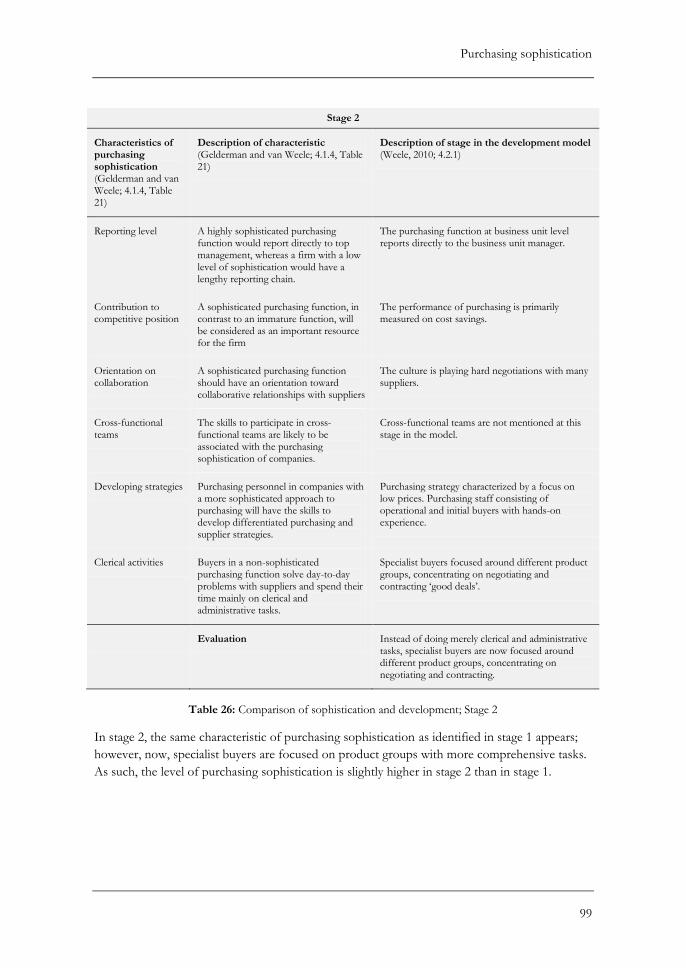
Purchasing sophistication
99
Stage 2
Characteristics of purchasing sophistication (Gelderman and van Weele; 4.1.4, Table 21)
Description of characteristic (Gelderman and van Weele; 4.1.4, Table 21)
Description of stage in the development model (Weele, 2010; 4.2.1)
Reporting level A highly sophisticated purchasing function would report directly to top management, whereas a firm with a low level of sophistication would have a lengthy reporting chain.
The purchasing function at business unit level reports directly to the business unit manager.
Contribution to competitive position
A sophisticated purchasing function, in contrast to an immature function, will be considered as an important resource for the firm
The performance of purchasing is primarily measured on cost savings.
Orientation on collaboration
A sophisticated purchasing function should have an orientation toward collaborative relationships with suppliers
The culture is playing hard negotiations with many suppliers.
Cross-functional teams
The skills to participate in cross-functional teams are likely to be associated with the purchasing sophistication of companies.
Cross-functional teams are not mentioned at this stage in the model.
Developing strategies Purchasing personnel in companies with a more sophisticated approach to purchasing will have the skills to develop differentiated purchasing and supplier strategies.
Purchasing strategy characterized by a focus on low prices. Purchasing staff consisting of operational and initial buyers with hands-on experience.
Clerical activities Buyers in a non-sophisticated purchasing function solve day-to-day problems with suppliers and spend their time mainly on clerical and administrative tasks.
Specialist buyers focused around different product groups, concentrating on negotiating and contracting ‘good deals’.
Evaluation Instead of doing merely clerical and administrative tasks, specialist buyers are now focused around different product groups, concentrating on negotiating and contracting.
Table 26: Comparison of sophistication and development; Stage 2
In stage 2, the same characteristic of purchasing sophistication as identified in stage 1 appears;
however, now, specialist buyers are focused on product groups with more comprehensive tasks.
As such, the level of purchasing sophistication is slightly higher in stage 2 than in stage 1.
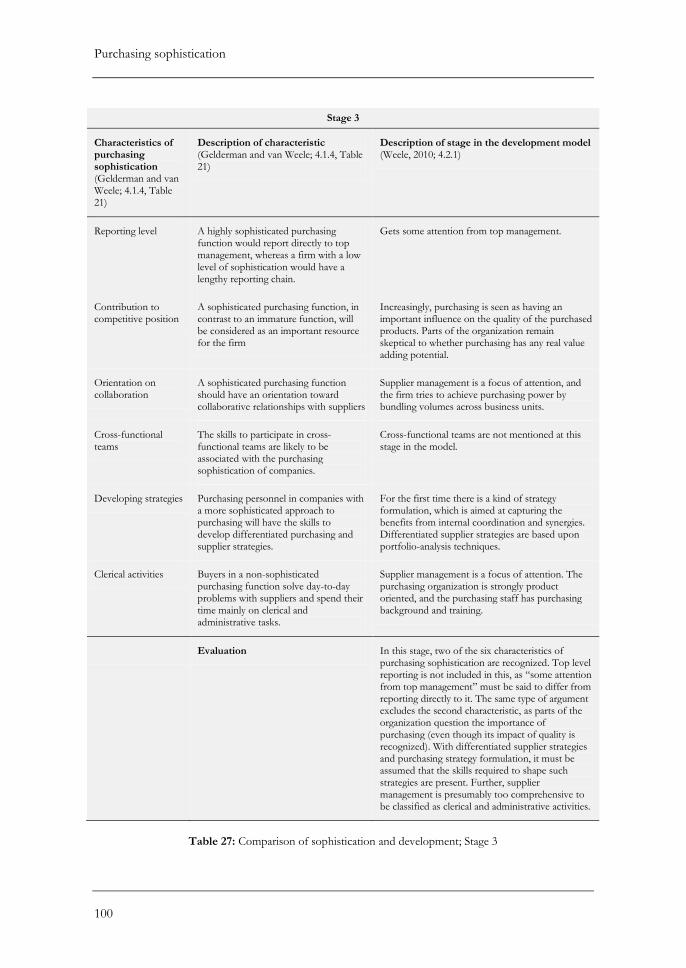
Purchasing sophistication
100
Stage 3
Characteristics of purchasing sophistication (Gelderman and van Weele; 4.1.4, Table 21)
Description of characteristic (Gelderman and van Weele; 4.1.4, Table 21)
Description of stage in the development model (Weele, 2010; 4.2.1)
Reporting level A highly sophisticated purchasing function would report directly to top management, whereas a firm with a low level of sophistication would have a lengthy reporting chain.
Gets some attention from top management.
Contribution to competitive position
A sophisticated purchasing function, in contrast to an immature function, will be considered as an important resource for the firm
Increasingly, purchasing is seen as having an important influence on the quality of the purchased products. Parts of the organization remain skeptical to whether purchasing has any real value adding potential.
Orientation on collaboration
A sophisticated purchasing function should have an orientation toward collaborative relationships with suppliers
Supplier management is a focus of attention, and the firm tries to achieve purchasing power by bundling volumes across business units.
Cross-functional teams
The skills to participate in cross-functional teams are likely to be associated with the purchasing sophistication of companies.
Cross-functional teams are not mentioned at this stage in the model.
Developing strategies Purchasing personnel in companies with a more sophisticated approach to purchasing will have the skills to develop differentiated purchasing and supplier strategies.
For the first time there is a kind of strategy formulation, which is aimed at capturing the benefits from internal coordination and synergies. Differentiated supplier strategies are based upon portfolio-analysis techniques.
Clerical activities Buyers in a non-sophisticated purchasing function solve day-to-day problems with suppliers and spend their time mainly on clerical and administrative tasks.
Supplier management is a focus of attention. The purchasing organization is strongly product oriented, and the purchasing staff has purchasing background and training.
Evaluation In this stage, two of the six characteristics of purchasing sophistication are recognized. Top level reporting is not included in this, as “some attention from top management” must be said to differ from reporting directly to it. The same type of argument excludes the second characteristic, as parts of the organization question the importance of purchasing (even though its impact of quality is recognized). With differentiated supplier strategies and purchasing strategy formulation, it must be assumed that the skills required to shape such strategies are present. Further, supplier management is presumably too comprehensive to be classified as clerical and administrative activities.
Table 27: Comparison of sophistication and development; Stage 3
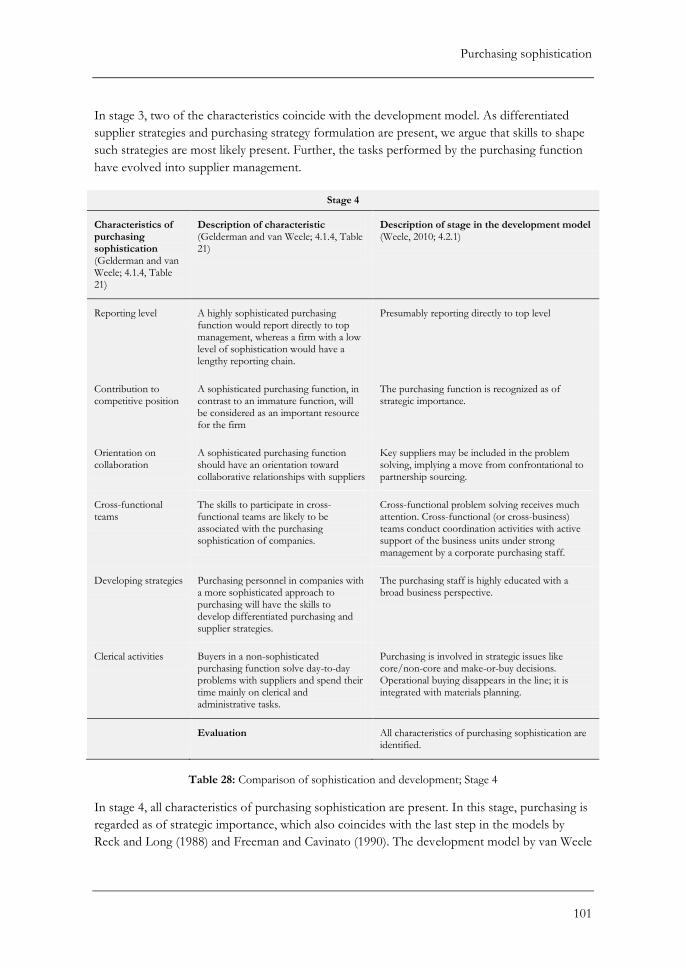
Purchasing sophistication
101
In stage 3, two of the characteristics coincide with the development model. As differentiated
supplier strategies and purchasing strategy formulation are present, we argue that skills to shape
such strategies are most likely present. Further, the tasks performed by the purchasing function
have evolved into supplier management.
Stage 4
Characteristics of purchasing sophistication (Gelderman and van Weele; 4.1.4, Table 21)
Description of characteristic (Gelderman and van Weele; 4.1.4, Table 21)
Description of stage in the development model (Weele, 2010; 4.2.1)
Reporting level A highly sophisticated purchasing function would report directly to top management, whereas a firm with a low level of sophistication would have a lengthy reporting chain.
Presumably reporting directly to top level
Contribution to competitive position
A sophisticated purchasing function, in contrast to an immature function, will be considered as an important resource for the firm
The purchasing function is recognized as of strategic importance.
Orientation on collaboration
A sophisticated purchasing function should have an orientation toward collaborative relationships with suppliers
Key suppliers may be included in the problem solving, implying a move from confrontational to partnership sourcing.
Cross-functional teams
The skills to participate in cross-functional teams are likely to be associated with the purchasing sophistication of companies.
Cross-functional problem solving receives much attention. Cross-functional (or cross-business) teams conduct coordination activities with active support of the business units under strong management by a corporate purchasing staff.
Developing strategies Purchasing personnel in companies with a more sophisticated approach to purchasing will have the skills to develop differentiated purchasing and supplier strategies.
The purchasing staff is highly educated with a broad business perspective.
Clerical activities Buyers in a non-sophisticated purchasing function solve day-to-day problems with suppliers and spend their time mainly on clerical and administrative tasks.
Purchasing is involved in strategic issues like core/non-core and make-or-buy decisions. Operational buying disappears in the line; it is integrated with materials planning.
Evaluation All characteristics of purchasing sophistication are identified.
Table 28: Comparison of sophistication and development; Stage 4
In stage 4, all characteristics of purchasing sophistication are present. In this stage, purchasing is
regarded as of strategic importance, which also coincides with the last step in the models by
Reck and Long (1988) and Freeman and Cavinato (1990). The development model by van Weele
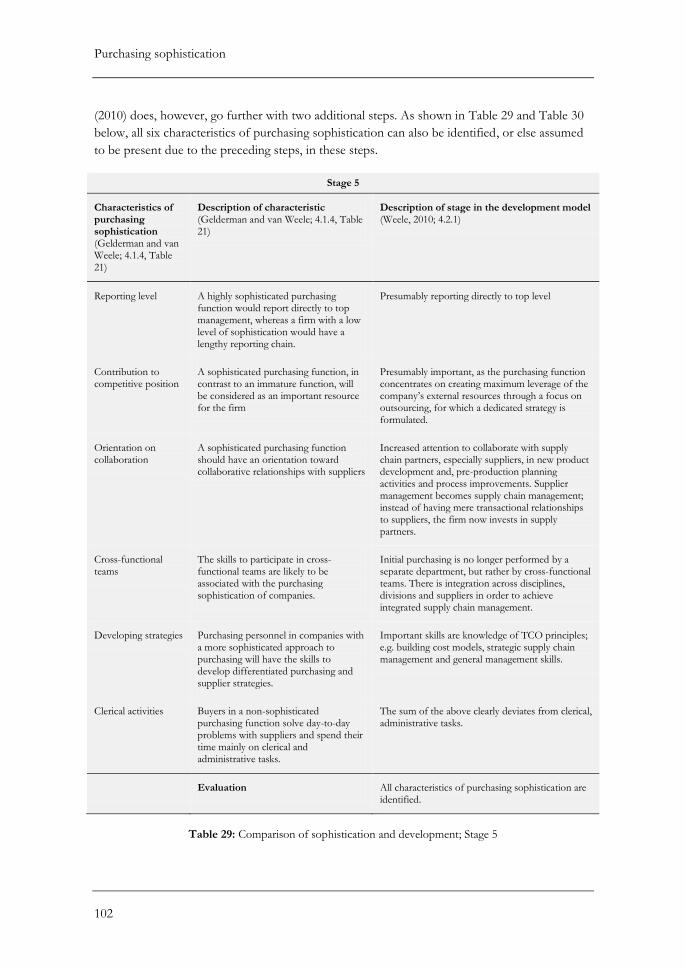
Purchasing sophistication
102
(2010) does, however, go further with two additional steps. As shown in Table 29 and Table 30
below, all six characteristics of purchasing sophistication can also be identified, or else assumed
to be present due to the preceding steps, in these steps.
Stage 5
Characteristics of purchasing sophistication (Gelderman and van Weele; 4.1.4, Table 21)
Description of characteristic (Gelderman and van Weele; 4.1.4, Table 21)
Description of stage in the development model (Weele, 2010; 4.2.1)
Reporting level A highly sophisticated purchasing function would report directly to top management, whereas a firm with a low level of sophistication would have a lengthy reporting chain.
Presumably reporting directly to top level
Contribution to competitive position
A sophisticated purchasing function, in contrast to an immature function, will be considered as an important resource for the firm
Presumably important, as the purchasing function concentrates on creating maximum leverage of the company’s external resources through a focus on outsourcing, for which a dedicated strategy is formulated.
Orientation on collaboration
A sophisticated purchasing function should have an orientation toward collaborative relationships with suppliers
Increased attention to collaborate with supply chain partners, especially suppliers, in new product development and, pre-production planning activities and process improvements. Supplier management becomes supply chain management; instead of having mere transactional relationships to suppliers, the firm now invests in supply partners.
Cross-functional teams
The skills to participate in cross-functional teams are likely to be associated with the purchasing sophistication of companies.
Initial purchasing is no longer performed by a separate department, but rather by cross-functional teams. There is integration across disciplines, divisions and suppliers in order to achieve integrated supply chain management.
Developing strategies Purchasing personnel in companies with a more sophisticated approach to purchasing will have the skills to develop differentiated purchasing and supplier strategies.
Important skills are knowledge of TCO principles; e.g. building cost models, strategic supply chain management and general management skills.
Clerical activities Buyers in a non-sophisticated purchasing function solve day-to-day problems with suppliers and spend their time mainly on clerical and administrative tasks.
The sum of the above clearly deviates from clerical, administrative tasks.
Evaluation All characteristics of purchasing sophistication are identified.
Table 29: Comparison of sophistication and development; Stage 5
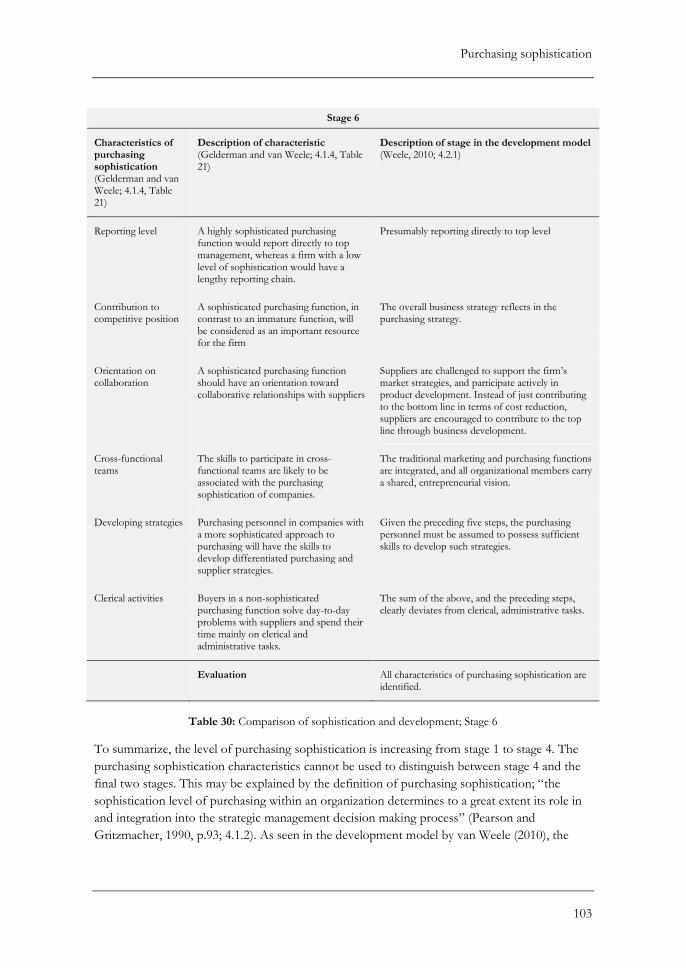
Purchasing sophistication
103
Stage 6
Characteristics of purchasing sophistication (Gelderman and van Weele; 4.1.4, Table 21)
Description of characteristic (Gelderman and van Weele; 4.1.4, Table 21)
Description of stage in the development model (Weele, 2010; 4.2.1)
Reporting level A highly sophisticated purchasing function would report directly to top management, whereas a firm with a low level of sophistication would have a lengthy reporting chain.
Presumably reporting directly to top level
Contribution to competitive position
A sophisticated purchasing function, in contrast to an immature function, will be considered as an important resource for the firm
The overall business strategy reflects in the purchasing strategy.
Orientation on collaboration
A sophisticated purchasing function should have an orientation toward collaborative relationships with suppliers
Suppliers are challenged to support the firm’s market strategies, and participate actively in product development. Instead of just contributing to the bottom line in terms of cost reduction, suppliers are encouraged to contribute to the top line through business development.
Cross-functional teams
The skills to participate in cross-functional teams are likely to be associated with the purchasing sophistication of companies.
The traditional marketing and purchasing functions are integrated, and all organizational members carry a shared, entrepreneurial vision.
Developing strategies Purchasing personnel in companies with a more sophisticated approach to purchasing will have the skills to develop differentiated purchasing and supplier strategies.
Given the preceding five steps, the purchasing personnel must be assumed to possess sufficient skills to develop such strategies.
Clerical activities Buyers in a non-sophisticated purchasing function solve day-to-day problems with suppliers and spend their time mainly on clerical and administrative tasks.
The sum of the above, and the preceding steps, clearly deviates from clerical, administrative tasks.
Evaluation All characteristics of purchasing sophistication are identified.
Table 30: Comparison of sophistication and development; Stage 6
To summarize, the level of purchasing sophistication is increasing from stage 1 to stage 4. The
purchasing sophistication characteristics cannot be used to distinguish between stage 4 and the
final two stages. This may be explained by the definition of purchasing sophistication; “the
sophistication level of purchasing within an organization determines to a great extent its role in
and integration into the strategic management decision making process” (Pearson and
Gritzmacher, 1990, p.93; 4.1.2). As seen in the development model by van Weele (2010), the
Purchasing sophistication
104
purchasing function is recognized as a strategic contributor in stage 4. This is also the final
stages of the models by Reck and Long (1988) and Freeman and Cavinato (1990). As such, we
have reached the highest level of purchasing sophistication, as characterized by Gelderman and
van Weele (2005), already in stage 4.
In conclusion, we argue that the different stages of the development model reflect different
levels of purchasing sophistication. As such, the different stages’ descriptions may arguably be
used to diagnose a company’s level of purchasing sophistication. In the next subsection, we
discuss how critique on purchasing development model relates to purchasing sophistication.
4.3.3 Applying critique of purchasing development models to
purchasing sophistication
In 4.2.2, we identified critique on purchasing development models. The critique on purchasing
development models is about over-emphasis on the rightmost stages of the models, uncertainty
concerning the evolutionary path and lack of empirical testing (4.2.2; Table 24). In this
subsection, we discuss whether this critique applies for purchasing sophistication.
With respect to the over-emphasis on the rightmost stages, Dubois and Wynstra (2005) question
why one phase should be considered more advanced and sophisticated than the other; arguing
that a purchasing function could perform well, despite operating at a lower level of
sophistication. With respect to the first part of this argument, we have in the proceeding
subsection shown an increase in sophistication when moving through the stages, using the
characteristics of sophistication by Gelderman and van Weele (2005). With respect to the latter
part of the argument, Dubois and Wynstra (2005) argue that in specific cases, costs associated
with higher levels of sophistication may be a too high price to pay, compared with the potential
improvements. This corresponds with the lower left area in the minimum maturity point
illustration by Schiele (2007) (4.1.5; Figure 26). In line with this, Ramsay and Croom (2008)
argue that in firms where a purchasing function do not exist, or where they are struggling against
maverick purchasing activities, it is essential to get control of the clerical activities. We agree that
it may not necessarily be beneficial to strive for the highest possible level of purchasing
sophistication, when the basics are still critical. However, Schiele (2007) notes that a purchasing
function is prone to having a minimum maturity point, below which the implementation of best-
practice would defeat its own end. As such, we argue that a purchasing function needs a
sufficient level of sophistication to utilize tools that may bring advantage, both with respect to
strategic congruence and economics.
Several authors (Reck and Long , 1988; Dubois and Wynstra, 2005; van Weele, 2010) question
whether there is an evolutionary growth path from left to right, if a company may reside in more
than one stage, and so on (4.2.2). One can argue that this critique also applies for purchasing
sophistication: is it necessarily the case that a company possesses all characteristics of purchasing
sophistication; is it possible to acquire a characteristic, for later to lose it? The identified theory
on purchasing sophistication does not answer such questions, and we see that empirical testing
is necessary. This lack of empirical testing is also the last identified critique on purchasing

Purchasing sophistication
105
development models (4.2.2); as such, we see that the critique applies. In the next section, we
conclude on which findings to bring along to the theoretical framework at the end of this part.
4.4 Towards the theoretical framework – Purchasing
sophistication
The main purpose of this chapter has been to provide a necessary understanding of the concept
of purchasing sophistication. Several central topics related to the concept have been presented.
We will now gather and classify findings that will be brought along to the construction of a
theoretical framework at the end of this part. These findings will, as for purchasing portfolio
approaches (chapter 3), subsequently be used; both for answering RQ1 and structuring and
guiding the analysis. In the analysis (chapter 8), these findings will be refined using empirical
data gathered through our mixed methods research, c.f. 2.1.3.
The first relevant finding to be included in the theoretical framework is the definition of the
concept of purchasing sophistication. As described in 4.3.1, we adopt the definition by Pearson
and Gritzmacher (1990, p.93); “the sophistication level of purchasing within an organization
determines to a great extent its role in and integration into the strategic management decision
making process”. Further, we adopt the characteristics of purchasing sophistication provided by
Gelderman and van Weele (2005) (4.1.4; Table 21). As such, these characteristics will be brought
along to the theoretical framework. Moreover, the discussion by Schiele (2007) concerning the
minimum maturity point (4.1.5) is intuitively regarded relevant; hence, it the concept of a
minimum maturity point is included in the theoretical framework.
Further, we have compared several purchasing development models (Reck and Long, 1988;
Freeman and Cavinato, 1990; van Weele, 2010; Schiele, 2007). Based on the discussion of these
models (4.3.2), we adopt the model by van Weele (2010), and include the concept of purchasing
development models in the theoretical framework. Finally, we have elucidated critique on
purchasing development models (4.2.2), and further discussed this in relation to purchasing
sophistication (4.3.3). As such, the topic of critique is included in the framework. In summary,
the findings to be brought along to the development of a theoretical framework are illustrated in
Figure 28 below.
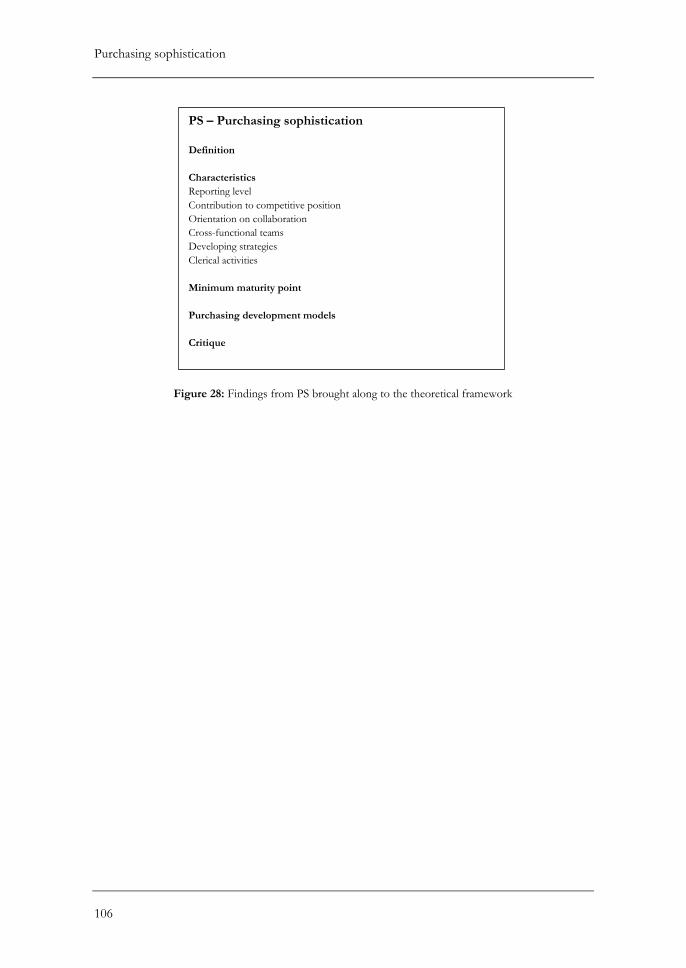
Purchasing sophistication
106
Figure 28: Findings from PS brought along to the theoretical framework
PS – Purchasing sophistication
Definition
Characteristics
Reporting level
Contribution to competitive position
Orientation on collaboration
Cross-functional teams
Developing strategies
Clerical activities
Minimum maturity point
Purchasing development models
Critique
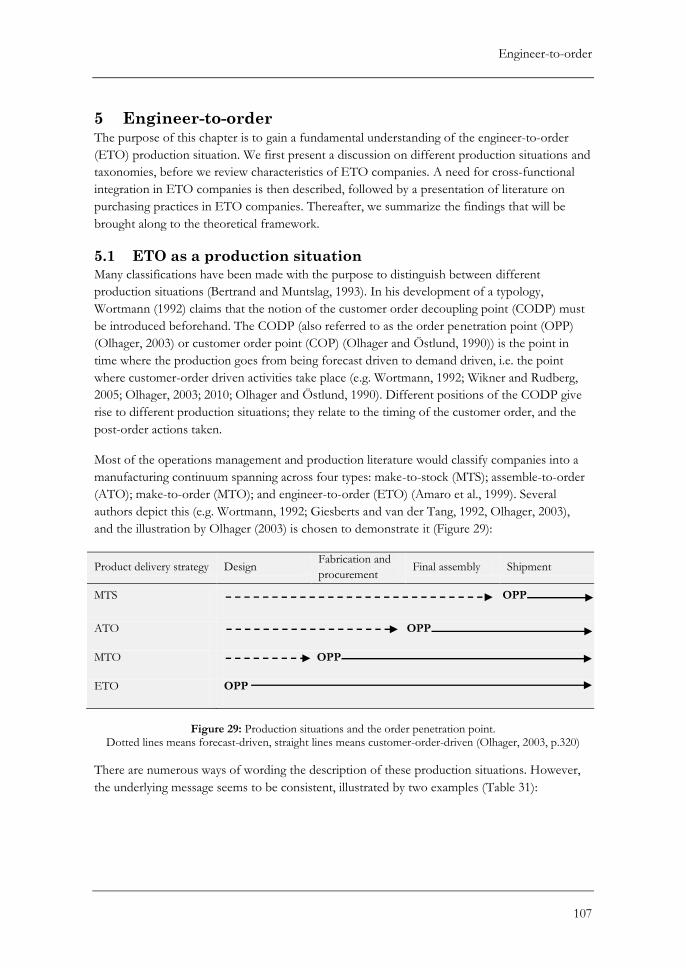
Engineer-to-order
107
5 Engineer-to-order The purpose of this chapter is to gain a fundamental understanding of the engineer-to-order
(ETO) production situation. We first present a discussion on different production situations and
taxonomies, before we review characteristics of ETO companies. A need for cross-functional
integration in ETO companies is then described, followed by a presentation of literature on
purchasing practices in ETO companies. Thereafter, we summarize the findings that will be
brought along to the theoretical framework.
5.1 ETO as a production situation
Many classifications have been made with the purpose to distinguish between different
production situations (Bertrand and Muntslag, 1993). In his development of a typology,
Wortmann (1992) claims that the notion of the customer order decoupling point (CODP) must
be introduced beforehand. The CODP (also referred to as the order penetration point (OPP)
(Olhager, 2003) or customer order point (COP) (Olhager and Östlund, 1990)) is the point in
time where the production goes from being forecast driven to demand driven, i.e. the point
where customer-order driven activities take place (e.g. Wortmann, 1992; Wikner and Rudberg,
2005; Olhager, 2003; 2010; Olhager and Östlund, 1990). Different positions of the CODP give
rise to different production situations; they relate to the timing of the customer order, and the
post-order actions taken.
Most of the operations management and production literature would classify companies into a
manufacturing continuum spanning across four types: make-to-stock (MTS); assemble-to-order
(ATO); make-to-order (MTO); and engineer-to-order (ETO) (Amaro et al., 1999). Several
authors depict this (e.g. Wortmann, 1992; Giesberts and van der Tang, 1992, Olhager, 2003),
and the illustration by Olhager (2003) is chosen to demonstrate it (Figure 29):
Product delivery strategy Design Fabrication and
procurement Final assembly Shipment
MTS OPP
ATO OPP
MTO OPP
ETO OPP
Figure 29: Production situations and the order penetration point.
Dotted lines means forecast-driven, straight lines means customer-order-driven (Olhager, 2003, p.320)
There are numerous ways of wording the description of these production situations. However,
the underlying message seems to be consistent, illustrated by two examples (Table 31):
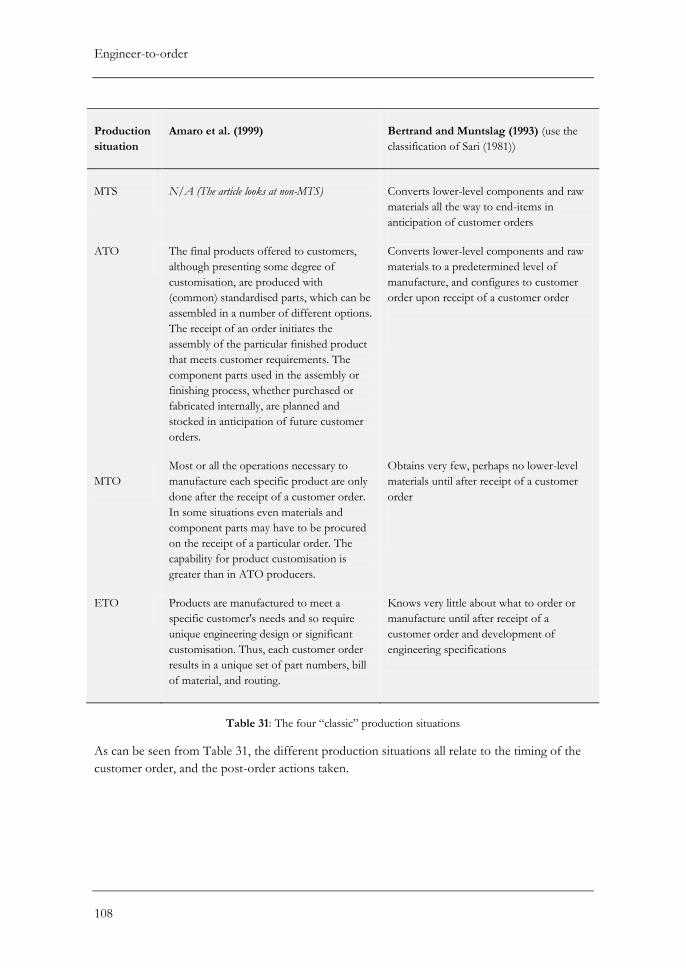
Engineer-to-order
108
Production
situation
Amaro et al. (1999)
Bertrand and Muntslag (1993) (use the
classification of Sari (1981))
MTS
N/A (The article looks at non-MTS)
Converts lower-level components and raw
materials all the way to end-items in
anticipation of customer orders
ATO The final products offered to customers,
although presenting some degree of
customisation, are produced with
(common) standardised parts, which can be
assembled in a number of different options.
The receipt of an order initiates the
assembly of the particular finished product
that meets customer requirements. The
component parts used in the assembly or
finishing process, whether purchased or
fabricated internally, are planned and
stocked in anticipation of future customer
orders.
Converts lower-level components and raw
materials to a predetermined level of
manufacture, and configures to customer
order upon receipt of a customer order
MTO
Most or all the operations necessary to
manufacture each specific product are only
done after the receipt of a customer order.
In some situations even materials and
component parts may have to be procured
on the receipt of a particular order. The
capability for product customisation is
greater than in ATO producers.
Obtains very few, perhaps no lower-level
materials until after receipt of a customer
order
ETO Products are manufactured to meet a
specific customer's needs and so require
unique engineering design or significant
customisation. Thus, each customer order
results in a unique set of part numbers, bill
of material, and routing.
Knows very little about what to order or
manufacture until after receipt of a
customer order and development of
engineering specifications
Table 31: The four “classic” production situations
As can be seen from Table 31, the different production situations all relate to the timing of the
customer order, and the post-order actions taken.
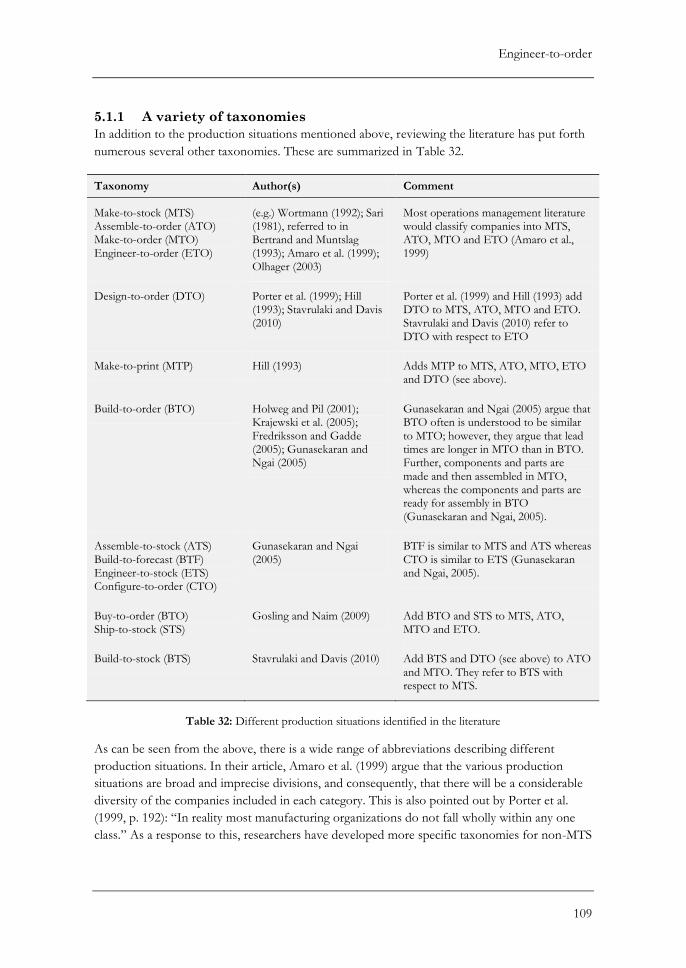
Engineer-to-order
109
5.1.1 A variety of taxonomies
In addition to the production situations mentioned above, reviewing the literature has put forth
numerous several other taxonomies. These are summarized in Table 32.
Taxonomy Author(s) Comment
Make-to-stock (MTS) Assemble-to-order (ATO) Make-to-order (MTO) Engineer-to-order (ETO)
(e.g.) Wortmann (1992); Sari (1981), referred to in Bertrand and Muntslag (1993); Amaro et al. (1999); Olhager (2003)
Most operations management literature would classify companies into MTS, ATO, MTO and ETO (Amaro et al., 1999)
Design-to-order (DTO) Porter et al. (1999); Hill (1993); Stavrulaki and Davis (2010)
Porter et al. (1999) and Hill (1993) add DTO to MTS, ATO, MTO and ETO. Stavrulaki and Davis (2010) refer to DTO with respect to ETO
Make-to-print (MTP) Hill (1993) Adds MTP to MTS, ATO, MTO, ETO and DTO (see above).
Build-to-order (BTO) Holweg and Pil (2001); Krajewski et al. (2005); Fredriksson and Gadde (2005); Gunasekaran and Ngai (2005)
Gunasekaran and Ngai (2005) argue that BTO often is understood to be similar to MTO; however, they argue that lead times are longer in MTO than in BTO. Further, components and parts are made and then assembled in MTO, whereas the components and parts are ready for assembly in BTO (Gunasekaran and Ngai, 2005).
Assemble-to-stock (ATS) Build-to-forecast (BTF) Engineer-to-stock (ETS) Configure-to-order (CTO)
Gunasekaran and Ngai (2005)
BTF is similar to MTS and ATS whereas CTO is similar to ETS (Gunasekaran and Ngai, 2005).
Buy-to-order (BTO) Ship-to-stock (STS)
Gosling and Naim (2009) Add BTO and STS to MTS, ATO, MTO and ETO.
Build-to-stock (BTS) Stavrulaki and Davis (2010) Add BTS and DTO (see above) to ATO and MTO. They refer to BTS with respect to MTS.
Table 32: Different production situations identified in the literature
As can be seen from the above, there is a wide range of abbreviations describing different
production situations. In their article, Amaro et al. (1999) argue that the various production
situations are broad and imprecise divisions, and consequently, that there will be a considerable
diversity of the companies included in each category. This is also pointed out by Porter et al.
(1999, p. 192): “In reality most manufacturing organizations do not fall wholly within any one
class.” As a response to this, researchers have developed more specific taxonomies for non-MTS
Engineer-to-order
110
(Amaro et al., 1999) and ETO (Wacker and Miller, 2000; Hicks et al., 2001; Wikner and
Rudberg, 2005). These taxonomies will be further described in the next paragraph.
Taxonomies for non-MTS companies
In their article, Amaro et al. (1999) find that the non-MTS environment can be divided into two
sectors: The versatile manufacturing company sector and the repeat business customer sector.
The first is involved in a competitive bidding situation for every order, whereas the latter may
receive a series of similar orders. They further make a new taxonomy for the non-MTS
production environment based on three dimensions: The degree of product customization,
spanning from “pure” (new design), via “tailored” (modify existing design) and “standardized”
(pick from set of design options) to “none” (use existing design as it is); the scope of the
company’s responsibility for the design and specification of products; and, the activities
performed after winning or accepting an order, i.e. assembly, processing, purchasing, routing,
specification and design. After removing combinations that do not make sense, so to speak, they
find 11 types of non-MTS companies, four of which are classified as ETO; according to the first
dimension they are offering purely customized products, but differ with respect to the two other
dimensions.
Wacker and Miller (2000) decompose ETO in two types; configure-to-order (CTO) and invent-
to-order (ITO). According to them, CTO involves making a product very similar to products
produced in the past, while ITO requires a substantial amount of engineering time spent in
inventing and designing the product.
Hicks et al. (2001) develop a typology of four ideal types of ETO companies based on the
variables of depth of product structure, which indicates product complexity, and volume of
production, which determines whether jobbing, batch or flow (see e.g. Slack et al., 2010)
processes are employed. The four ideal types (vertically integrated; design and assembly; design
and contract; and, project management) all have a deep product structure; however, they differ
with respect to core competencies, competitive advantage, vertical integration, supplier
relationships, environment and type of risk.
As seen previously, it has been argued that the continuum of production situations is closely
related to the CODP. Wikner and Rudberg (2005) claim that most scholars adopt a linear
approach to the concept of CODP, and by adopting this approach they do not differ between
production- and engineering-related activities. As such, the authors argue that the linear
continuum does not realistically illustrate the actual situation many companies face. To deal with
this, they propose a two-dimensional CODP (they refer to CODP as e.g. Wortmann (1992)
refers to production situations) consisting of an engineering dimension and a production
dimension. They argue that the engineering dimension can be separated from the production
dimension because ETO can be seen as a special case of MTO, as the entire production flow is
driven by customer orders. While the production dimension is the “traditional” MTSPD, ATOPD
and MTOPD, the engineering dimension ranges from ETOED, via adapt-to-order (ATOED) to
engineer-to-stock (ETSED); highlighting that designs to a various degree may be produced prior
to customer orders.
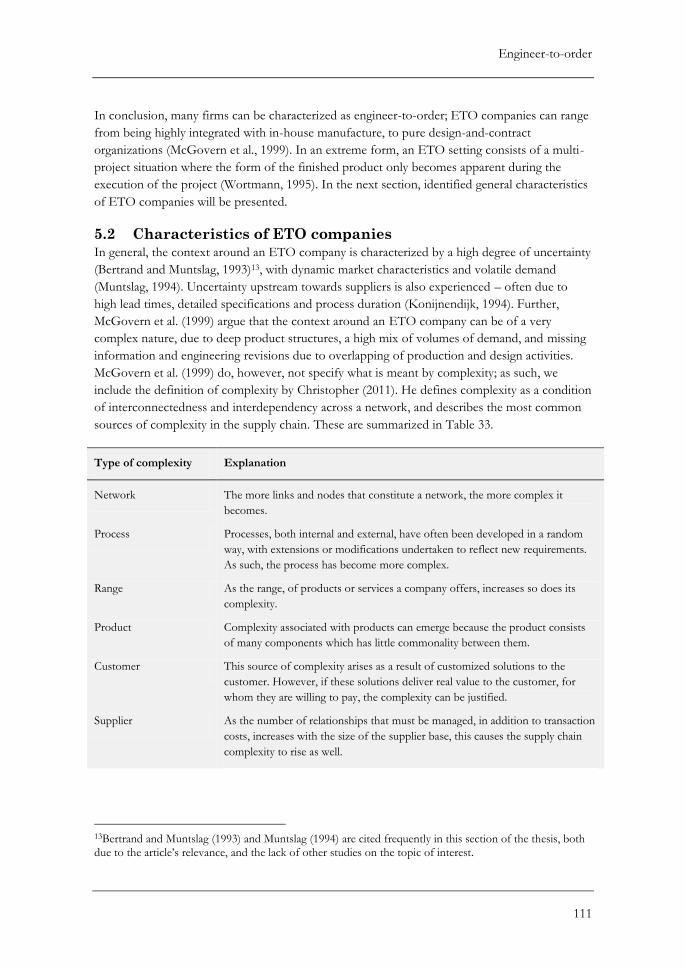
Engineer-to-order
111
In conclusion, many firms can be characterized as engineer-to-order; ETO companies can range
from being highly integrated with in-house manufacture, to pure design-and-contract
organizations (McGovern et al., 1999). In an extreme form, an ETO setting consists of a multi-
project situation where the form of the finished product only becomes apparent during the
execution of the project (Wortmann, 1995). In the next section, identified general characteristics
of ETO companies will be presented.
5.2 Characteristics of ETO companies
In general, the context around an ETO company is characterized by a high degree of uncertainty
(Bertrand and Muntslag, 1993)13, with dynamic market characteristics and volatile demand
(Muntslag, 1994). Uncertainty upstream towards suppliers is also experienced – often due to
high lead times, detailed specifications and process duration (Konijnendijk, 1994). Further,
McGovern et al. (1999) argue that the context around an ETO company can be of a very
complex nature, due to deep product structures, a high mix of volumes of demand, and missing
information and engineering revisions due to overlapping of production and design activities.
McGovern et al. (1999) do, however, not specify what is meant by complexity; as such, we
include the definition of complexity by Christopher (2011). He defines complexity as a condition
of interconnectedness and interdependency across a network, and describes the most common
sources of complexity in the supply chain. These are summarized in Table 33.
Type of complexity Explanation
Network The more links and nodes that constitute a network, the more complex it
becomes.
Process Processes, both internal and external, have often been developed in a random
way, with extensions or modifications undertaken to reflect new requirements.
As such, the process has become more complex.
Range As the range, of products or services a company offers, increases so does its
complexity.
Product Complexity associated with products can emerge because the product consists
of many components which has little commonality between them.
Customer This source of complexity arises as a result of customized solutions to the
customer. However, if these solutions deliver real value to the customer, for
whom they are willing to pay, the complexity can be justified.
Supplier As the number of relationships that must be managed, in addition to transaction
costs, increases with the size of the supplier base, this causes the supply chain
complexity to rise as well.
13Bertrand and Muntslag (1993) and Muntslag (1994) are cited frequently in this section of the thesis, both
due to the article’s relevance, and the lack of other studies on the topic of interest.
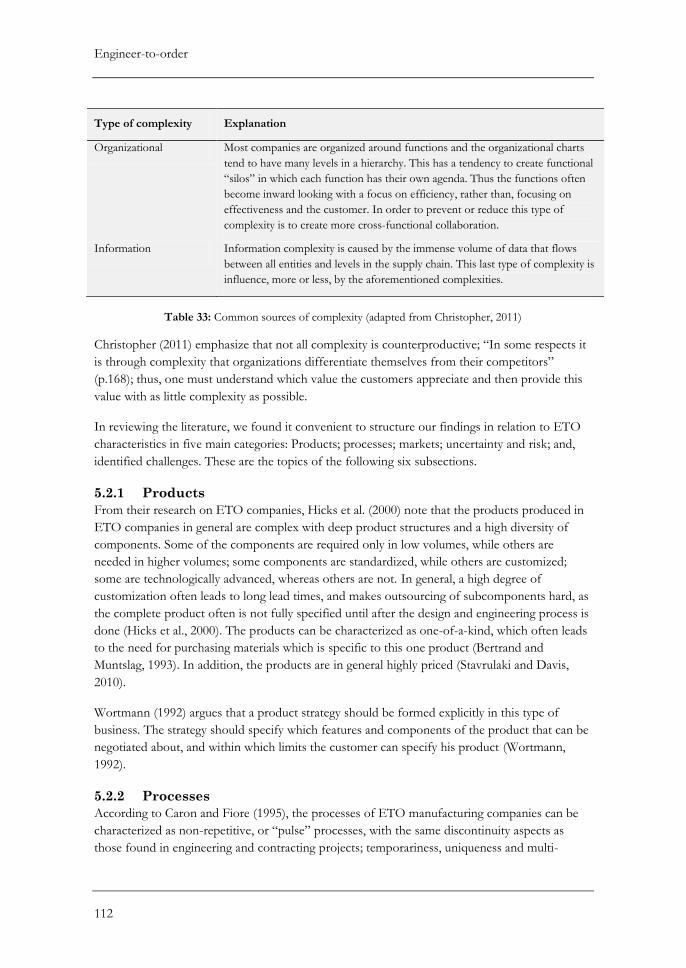
Engineer-to-order
112
Type of complexity Explanation
Organizational Most companies are organized around functions and the organizational charts
tend to have many levels in a hierarchy. This has a tendency to create functional
“silos” in which each function has their own agenda. Thus the functions often
become inward looking with a focus on efficiency, rather than, focusing on
effectiveness and the customer. In order to prevent or reduce this type of
complexity is to create more cross-functional collaboration.
Information Information complexity is caused by the immense volume of data that flows
between all entities and levels in the supply chain. This last type of complexity is
influence, more or less, by the aforementioned complexities.
Table 33: Common sources of complexity (adapted from Christopher, 2011)
Christopher (2011) emphasize that not all complexity is counterproductive; “In some respects it
is through complexity that organizations differentiate themselves from their competitors”
(p.168); thus, one must understand which value the customers appreciate and then provide this
value with as little complexity as possible.
In reviewing the literature, we found it convenient to structure our findings in relation to ETO
characteristics in five main categories: Products; processes; markets; uncertainty and risk; and,
identified challenges. These are the topics of the following six subsections.
5.2.1 Products
From their research on ETO companies, Hicks et al. (2000) note that the products produced in
ETO companies in general are complex with deep product structures and a high diversity of
components. Some of the components are required only in low volumes, while others are
needed in higher volumes; some components are standardized, while others are customized;
some are technologically advanced, whereas others are not. In general, a high degree of
customization often leads to long lead times, and makes outsourcing of subcomponents hard, as
the complete product often is not fully specified until after the design and engineering process is
done (Hicks et al., 2000). The products can be characterized as one-of-a-kind, which often leads
to the need for purchasing materials which is specific to this one product (Bertrand and
Muntslag, 1993). In addition, the products are in general highly priced (Stavrulaki and Davis,
2010).
Wortmann (1992) argues that a product strategy should be formed explicitly in this type of
business. The strategy should specify which features and components of the product that can be
negotiated about, and within which limits the customer can specify his product (Wortmann,
1992).
5.2.2 Processes
According to Caron and Fiore (1995), the processes of ETO manufacturing companies can be
characterized as non-repetitive, or “pulse” processes, with the same discontinuity aspects as
those found in engineering and contracting projects; temporariness, uniqueness and multi-
Engineer-to-order
113
functionality. However, they argue that ETO manufacturing companies are different from
engineering and contracting projects due to the fact that a considerable portion of the
manufacturing and assembly processes are carried out at the corporate premises, using a
production system managed according to suitable manufacturing policies. This is in contrast to
engineering and contracting projects, where more ‘ad hoc’ production systems are followed
(Caron and Fiore, 1995).
From a study of different ETO companies, Hicks et al. (2000) have generalized the business
processes of an ETO company, and divide them into three stages; marketing, tendering, and contract
execution. According to these authors, the first stage of an ETO company’s complex process is
marketing. Here, the decision on whether to tender or not is made, based on customer
requirements, commercial factors, the company’s ability to compete, and the likelihood of
success. Second, a decomposed stage of the process is the response to an invitation to tender for
a contract. At this stage, the company contacts potential suppliers, to get information on costs
and lead times. There is a need for an understanding of the customer’s needs in terms of
technical features, price, delivery and quality. Further, Hicks et al. (2000) describe that in the last
stage of the process, given that the company has won the contract, activities are development of
a project plan and detailed design, procurement, component manufacturing, assembly,
construction and commissioning.
The degree of vertical integration of the company decides how many of the activities the
company does itself. In general, typical participants in these activities are engineers, designers,
estimators, suppliers, fabricators, contractors, architects and owners (Pandit and Zhu, 2007).
ETO companies often reduce the degree of vertical integration, as outsourcing is increasingly
used (Hicks et al., 2000).
5.2.3 Markets
Bertrand and Muntslag (1993) claim that the market and manufacturing situation for ETO
companies is characterized by high fluctuations in, for instance, sales volume and product mix –
which ETO companies has to cope with both in the short and medium term. According to
them, this is a general characteristic for ETO, and external flexibility is needed for coping with
these fluctuations. They do, however, not explain what they mean by external flexibility; as such,
we see it as beneficial to include a description of flexibility by Beckman and Rosenfield (2008).
These authors state that one of the greatest benefits of being flexible is the ability to customize
the company’s products to their customers’ needs. They further mention that there are several
types of flexibility that a company can develop; however, the most common are volume flexibility
and product (or service) flexibility; the former relates to the capability to respond to variability in
demand quantity, while the latter is used to respond to changes in the mix of products (or
services) the company offers. The authors proceed by explaining that the benefits incurred from
increased flexibility must be traded off against the cost of achieving this flexibility. Further,
attempts to achieve flexibility can easily get out of hand, resulting in a more disorderly
environment.
Engineer-to-order
114
In their literature review on engineer-to-order supply chain management, Gosling and Naim
(2009) found that studies on ETO companies have been done in sectors such as construction,
high technology /capital goods, automotive, shipbuilding, consumer electronics and general
manufacturing. Most of the research within ETO focused on strategy for construction, and
supply chain structures and strategy for production of capital goods. Research on the
automotive, consumer electronics, general manufacturing and shipbuilding sectors, was mainly
related to discussions around lean and agility. According to Gosling and Naim (2009), the
commonality between the researched sectors is that ETO companies work within a project
environment and that each product is different from the last.
5.2.4 Uncertainty and risk
Muntslag (1994) discusses uncertainty and risk for ETO companies. He refers to risk as “a
situation in which various, mutually exclusive events may occur, each leading to a substantially
different result in terms of quality, timeliness and cost” (Muntslag, 1994, p.100). He further
makes a distinction between three types of order-dependent risk in ETO situations: Technical or
quality risk –the situation where a product cannot be technically produced, leading to more
product engineering and detailed design; Time risk – the situation where the throughput time in
engineering and manufacturing is longer than what was estimated in the quotation phase; and
Financial risk – the situation where the costs of engineering and production are higher than
estimated in the quotation phase. This risk may arise from the aforementioned types of risk.
Further, in the study by Muntslag (1994), as well as in Bertrand and Muntslag (1993), three
uncertainty factors are recognized: Product specification uncertainty, process specification uncertainty and
product mix and volume uncertainty. These uncertainties might include one or more of the discussed
risks (Muntslag, 1994). Product specification uncertainty arises as the final product specifications
are not set in the quotation phase. As a consequence, this may lead to technical risk if the
product concept turns out to be incomplete or incorrect. Additional engineering and/or design
and production might be necessary, which can lead to both time and financial risk. It can be
difficult to plan the use of resources and capacities in the quotation phase when the product
specifications are not fully set – potentially causing process specification uncertainty. As a
consequence, a company’s operational planning may become inaccurate compared to what is
needed to produce the required components in time. Hence, this process uncertainty can lead to
both time and financial risk if the resources needed to produce are not available when needed.
As the demand (volume) and specifications (product mix) in products can be highly fluctuating,
it can be hard to reserve production capacity. This uncertainty can lead to time risk if demand
exceeds what is forecasted in a certain period. As penalty clauses may be present, financial risk
might also occur.
5.2.5 Identified challenges
Problems that typically occur from highly customized production are difficulties in estimating
lead time and delivery dates, expensive rework, poor product quality, conflicts between
manufacturing and marketing schedules, and material waste (Pandit and Zhu, 2007). Of these,
lead time is often regarded as the biggest challenge (Elfving et al. 2005; Pandit and Zhu, 2007).
Long lead times in ETO companies can occur for several reasons, of which many relate to the
Engineer-to-order
115
design: Slow collection and poor reliability of design input; changes due to early commitment
and lack of knowledge; changes due to design errors; coupling ETO product design to other
systems design; outdated practice of auxiliary design and approvals; and complexity – requiring
large number of specialists (Pandit and Zhu, 2007).
Elfving et al. (2005) argue that too many design decisions are made too early due to long lead
times, and are hence based on insufficient understanding. They state that this can lead to sub-
optimal solutions, quality defects and rework. Consequently, they propose three strategies to
mitigate lead times: (1) the various tasks in the project schedule can be overlapped with each
other; (2) the various tasks can be decoupled and executed in a parallel manner; and (3) some
tasks can be entirely eliminated or their task duration is reduced. Elfving et al. (2005) further
argue that the first strategy of overlapping, for instance of concept development and
implementation, may in addition reduce uncertainty and improve flexibility towards the market.
According to them, cross-functional communication and coordination is a pre-requisite for this
to happen. Further, if tasks are to be executed in parallel (second strategy), a removal of the
coupling between tasks has to happen. This may require a rethinking of business processes,
which can be difficult. In the field of construction, this is achieved by decoupling larger
buildings into “building blocks” which are produced relatively independently in parallel (Elfving
et al., 2005). The third strategy may significantly reduce lead times; but there is a danger that the
overall lead time in fact may increase if the interdependencies between tasks not is taken into
consideration; this also applies for cost. Due to this, lead time reduction initiatives should be
viewed from a systems perspective (Elfving et al., 2005).
Little et al. (2000) note that common for ETO companies, is the feature of change orders. It is
argued from these authors that the capability to respond to these short term dynamics is a
prerequisite for success in many ETO companies. Krajewski et al. (2005) also recognize this, and
argue that companies have three ways to cope with these short term dynamics: The use of
supply contracts to get tighter control over a buyer’s demand changes; the use of suppliers’
capabilities in adaptive production scheduling; and the use of postponement. Krajewski et al.
(2005) further argues that reaction strategies should be developed, which considers a capability
of short term flexibility.
5.3 The need for cross-functional integration in ETO companies
Several researchers (Konijnendijk, 1994; Kingsman et al., 1993; Hicks et al., 2000) have uttered
their opinions on the subject of cross-functional integration in ETO companies. Here, we
present research made to promote integration of manufacturing and marketing, and purchasing with
design and marketing, respectively.
5.3.1 Manufacturing and marketing
Konijnendijk (1994) argues that reciprocal interdependencies exist between manufacturing and
marketing at the operational level, due to high uncertainty and the fact that a product is not
certain until it is fully specified. He further argues that manufacturing and marketing should
coordinate both the lead time quoted to the customer, together with any potential changes in the
product specification or planning that may influence this lead time.
Engineer-to-order
116
Further, Kingsman et al. (1993) argue that the manufacturing function often is faced with
unrealistic delivery dates for incoming orders, which can be the case if the sales and marketing
personnel set ambitious prices and delivery dates to win an order. They suggest that
manufacturing and marketing should be integrated in order to minimize production planning
problems. The reason for the lack of integration, Kingsman et al. (1993) argue, is that marketing
and manufacturing have differing objectives: Sales/marketing wish to maximize their number of
orders received, adapting quickly to shifting market demand. Cutting quotation prices and
delivery times can thus be a temptation for the sales and marketing personnel. Manufacturing,
however, prefer a stable and smooth workload over time, to cut product-, overhead- and
inventory costs (Kingsman et al., 1993).
5.3.2 Purchasing, design and marketing
One way to reduce costs for an ETO company is to involve the purchasing function in design
and tendering decisions (McGovern et al., 1999). Burt and Doyle (1993, referred to in Hicks et
al., 2000) found that 75-80% of total avoidable cost is controllable at the design stage – implying
that early involvement of the purchasing function in tendering and design is essential to reduce
cost.
Further, Hicks et al. (2000) argue for a company to do proactive purchasing; the purchasing
function has to be involved in the development of specifications, as the purchasers may
contribute with knowledge of potential suppliers’ capabilities and performance. According to
Hicks et al. (2000), information sharing between functions is necessary: “Effective sharing of
information requires use of common databases that support tendering, design, procurement, and
project management. This requires records of previous designs, standard components and
subsystems together with costing, planning, vendor performance and souring information”
(Hicks et al., 2000, p. 189). These authors claim that this knowledge is a source to competitive
advantage for ETO companies.
5.4 Purchasing in ETO companies
Research on purchasing has been dominated of studies on supply chains where a focal producer
has high buyer power (Cox, 2004). In the ETO setting, however, the characteristics are different,
and the same assumptions do not hold for buyer-supplier relationships (Hicks et al., 2000). Cox
(2004) has the same reasoning, stating that what could be appropriate for a buyer in its
relationship with its supplier in “one circumstance (of continuous, high volume, standardized
demand) is unlikely to be appropriate in another (where there is infrequent, low volume and
non-standard demand)” (p.348) (3.6.3). The latter may be recognized to reflect the ETO
production situation (5.2.3; 5.2.4)
Hicks et al. (2000) argue that relationships with suppliers in ETO vary due to numerous factors:
Differing levels of vertical integration; variations in volume for different types of components;
the degree of customization of components; the level of concurrent engineering activity; the
value of the item concerned; the proximity to the critical path; and the power balance within the
particular buyer/supplier relationships (Hicks et al., 2000, p.186). The authors claim that this
Engineer-to-order
117
diversity of factors implies that caution must be made when comparing literature on the high-
volume sector with the low-volume sectors.
Hicks et al. (2000) find that an increasing part of an ETO contract is outsourced, and argue that
the management of these suppliers is crucial; making the purchasing function of strategic
importance. McGovern et al. (1999) argue that the interface between internal processes and
capabilities of ETO companies and suppliers is crucial. However, Hicks et al. (2000) find that
ETO companies often have reactive purchasing functions, rather than proactive; the purchasing
function also tends to be departmentalized and clerical in nature – often using a lowest price
purchasing strategy. Further, they find that it is common to use adversarial trading approaches
with multiple suppliers at a time – characterized by win-lose transactions and mistrust.
According to McGovern et al. (1999), ETO companies are becoming more and more dependent
on their suppliers in handling the increased time pressure posed by demanding customers. In
addition to this, an ETO company should have the short term flexibility to quickly access and
use the knowledge of their suppliers in the quotation phase (McGovern et al., 1999). However,
these authors also argue that demand uncertainty constrains the possibilities for cooperative
long-term relationships within the ETO supply chain. It is argued that demand characteristics
and power characteristics in relationships are key variables which determine the appropriateness
of such approaches (Gosling and Naim, 2009).
McGovern et al. (1999) mapped the procurement decisions in ETO companies, and found that
they can happen in three ways: The customer specifies preferred suppliers; the sourcing of
components and subsystems are specified at the tendering stage; and design and/or engineering
can specify sourcing instructions during their work. In general, purchasing gets the final
specifications, which are either of a functional (giving the suppliers responsibility to design) or
detailed technical form (limiting the supplier’s freedom to design of components), from the
design function (Hicks et al., 2001). According to Hicks et al. (2001), this is an important
handover. They further argue that the latter form of procurement decision by McGovern et al.
(1999) may constrain innovation and create unnecessary in-house design and procurement
activity. The importance of specifications is also recognized by McGovern et al. (1999), who
state that “ETO companies derive competitive advantage through understanding customer
requirements, translating them into specifications at product and component level, and
integrating components and subsystems into products” (p.150). In the next section, we conclude
this chapter by stating what will be brought along to the theoretical framework.
Engineer-to-order
118
5.5 Towards the theoretical framework – Engineer-to-order
The main purpose of this chapter has been to provide a necessary understanding the engineer-
to-order production situation. Several central topics related to the concept have been presented.
We will now gather and classify findings that will be brought along to the construction of a
theoretical framework at the end of this part. These findings will, as for purchasing portfolio
approaches (chapter 3) and purchasing sophistication (chapter 4), subsequently be used; both for
answering RQ1 and structuring and guiding the analysis. In the analysis (chapter 8), these
findings will be refined using empirical data gathered through our mixed methods research, c.f.
2.1.3.
We found that literature on the ETO production situation allegedly is sparse compared to that
of the high-volume production situation. Many authors have tried to classify production
situations like ETO with different taxonomies and terminologies, often using the concept of
CODP as the point of departure (5.1.1). It is concluded that no consensus have been made in
the literature regarding terminology, but there is an implicit agreement in the literature that, for
an ETO company, the CODP lies at the design stage in a project. We argue that even though
some components may be standardized, at least parts of the product are engineered-to-order;
resulting in this position. This engineering component (one or several) distinguishes ETO from
other production situations. This will be brought along to the theoretical framework.
In order to understand the ETO production situation thoroughly, a review of ETO
characteristics was done. We found that these characteristics could be organized in terms of
products, processes, markets, risk and uncertainty and challenges (5.2). We feel that these topics
are essential; hence, we include them in the theoretical framework. In addition, a need for cross-
functional integration in ETO companies was identified (5.3). Thereafter, theory on purchasing
in ETO companies was presented (5.4). These are appropriate topics to include for subsequent
analysis. In summary, the findings to be brought along to the development of a theoretical
framework are illustrated in Figure 30 below.
Figure 30: Findings from ETO brought along to the theoretical framework
ETO – Engineer-to-order
Definition
Characteristics
Products
Processes
Markets
Risk and uncertainty
Identified challenges
Need for cross-functional integration
Purchasing in ETO companies

Engineer-to-order
119
Engineer-to-order
120
Conclusion Part I
We now present, in part, a conclusion to the first research question, “what are important
features of purchasing portfolio approaches, purchasing sophistication and engineer-to-order?”,
by constructing the theoretical framework. As mentioned in 2.1.3, this framework will further be
refined, using empirical findings, in the first chapter of the analysis (chapter 8). The refined
framework concludes RQ1. The body of theory presented is rather comprehensive, constituting
three chapters on the topics of purchasing portfolio approaches, purchasing sophistication and
engineer-to-order. Organizing relevant findings into a theoretical framework is tidily, and it
helps structuring subsequent parts. Our theoretical framework is presented in Figure 31 below.
Figure 31: Theoretical framework
ETO – Engineer-to-order
Definition
Characteristics
Products
Processes
Markets
Risk and uncertainty
Identified challenges
Need for cross-functional integration
Purchasing in ETO companies
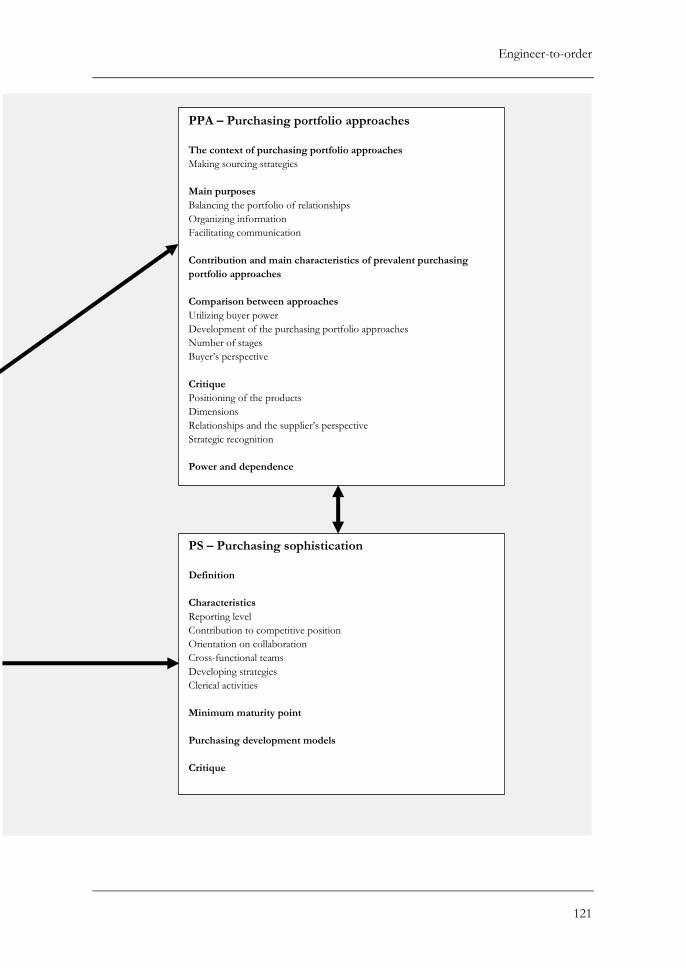
Engineer-to-order
121
PPA – Purchasing portfolio approaches
The context of purchasing portfolio approaches
Making sourcing strategies
Main purposes
Balancing the portfolio of relationships
Organizing information
Facilitating communication
Contribution and main characteristics of prevalent purchasing
portfolio approaches
Comparison between approaches
Utilizing buyer power
Development of the purchasing portfolio approaches
Number of stages
Buyer’s perspective
Critique
Positioning of the products
Dimensions
Relationships and the supplier’s perspective
Strategic recognition
Power and dependence
PS – Purchasing sophistication
Definition
Characteristics
Reporting level
Contribution to competitive position
Orientation on collaboration
Cross-functional teams
Developing strategies
Clerical activities
Minimum maturity point
Purchasing development models
Critique
Part II: Empirical investigation
In this part we present our empirical foundation, comprising survey- and action research
findings. In chapter 6, the survey findings are presented. The findings are organized according to
the main topics of the theoretical framework developed in Part I (Figure 31). In chapter 8, we
present our findings from the action research. The chapter is organized according to our action
research protocol (A.2); however, explicit observations are labeled according to the topics of the
theoretical framework. These observations are summarized in appendix A.5 for the reader’s
convenience.
This part provides the basis for the analysis, where the master’s thesis’ research questions and
the overall problem formulation (1.2) are answered.
Survey research findings
123
6 Survey research findings This chapter presents findings from our survey research. First, a motivation of the variables used
in the survey research is given, before a presentation of our sample is provided, elucidating
different characteristics of our respondents. This is followed by three succeeding sections, which
provide findings from our survey research in relation to the topics constituting the ternary
relationship between purchasing portfolio approaches, ETO companies and purchasing
sophistication (1.2). Finally a section summarizes our major findings.
6.1 Relevant variables used in the survey analysis
In our analysis of the survey data, we have utilized several variables in order to derive findings in
relation to the ternary relationship comprising ETO, purchasing portfolio approaches and
purchasing sophistication. In addition to the variables directly concerning the ternary
relationship, we have used the following variables: having a purchasing department, possessing a sourcing
strategy, company size and purchasing-to-turnover ratio. The motivation for including these variables in
the questionnaire and, hence, the analysis (Part III), is described in this subsection.
6.1.1 Having a purchasing department
In order to get an indication of the priority of purchasing within a company, we included the
dichotomous variable of whether a company has a separate purchasing department or not.
Quayle (2002) employed a similar question in his exploratory survey research of 400 small and
medium size enterprises (SMEs), discovering that few companies (about 20%) had their own
purchasing department. However, the author discovered that 81% had a designated employee,
who, among other duties, was responsible for purchasing.
6.1.2 Having a sourcing strategy
As the use of purchasing portfolio approaches is employed in the context of creating a sourcing
strategy (3.1.1), a nominal variable was included to specify whether or not a company has a
sourcing strategy. This was done in order to establish the theoretical link between using a
purchasing portfolio approach and having a sourcing strategy, with empirical data. In addition,
we suspect that this variable may be related to the level of sophistication, as it requires skills for
developing strategies by the purchasers, and as it has a negative relationship towards clerical
duties, which both are indicators of higher purchasing sophistication (4.4).
6.1.3 Company size
It is identified in theory that smaller firms have fewer resources than larger firms (Boyer et al.,
1996). In addition, a larger company is, according to Carr and Pearson (1999), believed to have
more flexibility to “devote resources to strategic purchasing activities” (p.512). Further, Quayle
(2002) discovers that small and medium-sized companies lack an awareness of effective
purchasing; positively affecting profitability. Gelderman and van Weele (2005) support this view
in stating that larger companies are more likely to handle more products, more suppliers and a
more complex souring situation; consequently, there is a need for ”more advanced analytical
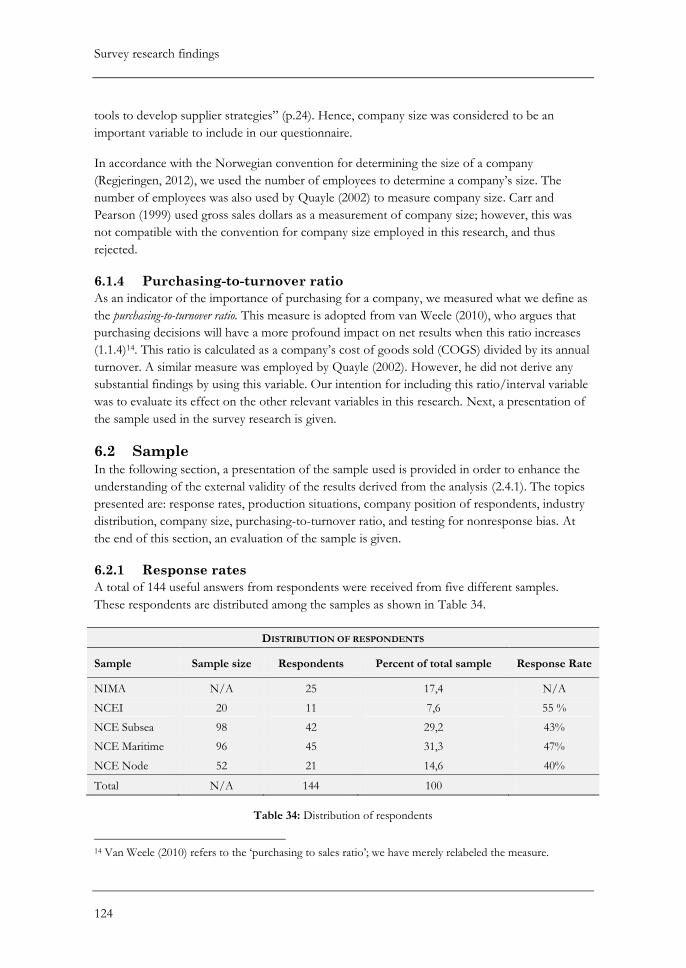
Survey research findings
124
tools to develop supplier strategies” (p.24). Hence, company size was considered to be an
important variable to include in our questionnaire.
In accordance with the Norwegian convention for determining the size of a company
(Regjeringen, 2012), we used the number of employees to determine a company’s size. The
number of employees was also used by Quayle (2002) to measure company size. Carr and
Pearson (1999) used gross sales dollars as a measurement of company size; however, this was
not compatible with the convention for company size employed in this research, and thus
rejected.
6.1.4 Purchasing-to-turnover ratio
As an indicator of the importance of purchasing for a company, we measured what we define as
the purchasing-to-turnover ratio. This measure is adopted from van Weele (2010), who argues that
purchasing decisions will have a more profound impact on net results when this ratio increases
(1.1.4)14. This ratio is calculated as a company’s cost of goods sold (COGS) divided by its annual
turnover. A similar measure was employed by Quayle (2002). However, he did not derive any
substantial findings by using this variable. Our intention for including this ratio/interval variable
was to evaluate its effect on the other relevant variables in this research. Next, a presentation of
the sample used in the survey research is given.
6.2 Sample
In the following section, a presentation of the sample used is provided in order to enhance the
understanding of the external validity of the results derived from the analysis (2.4.1). The topics
presented are: response rates, production situations, company position of respondents, industry
distribution, company size, purchasing-to-turnover ratio, and testing for nonresponse bias. At
the end of this section, an evaluation of the sample is given.
6.2.1 Response rates
A total of 144 useful answers from respondents were received from five different samples.
These respondents are distributed among the samples as shown in Table 34.
DISTRIBUTION OF RESPONDENTS
Sample Sample size Respondents Percent of total sample Response Rate
NIMA N/A 25 17,4 N/A
NCEI 20 11 7,6 55 %
NCE Subsea 98 42 29,2 43%
NCE Maritime 96 45 31,3 47%
NCE Node 52 21 14,6 40%
Total N/A 144 100
Table 34: Distribution of respondents
14 Van Weele (2010) refers to the ‘purchasing to sales ratio’; we have merely relabeled the measure.
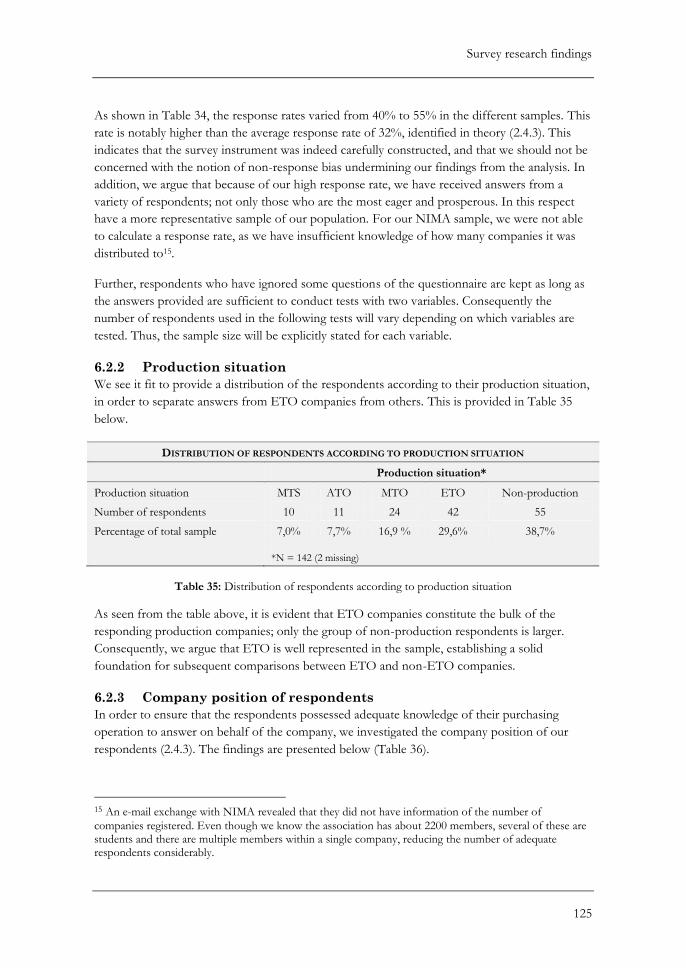
Survey research findings
125
As shown in Table 34, the response rates varied from 40% to 55% in the different samples. This
rate is notably higher than the average response rate of 32%, identified in theory (2.4.3). This
indicates that the survey instrument was indeed carefully constructed, and that we should not be
concerned with the notion of non-response bias undermining our findings from the analysis. In
addition, we argue that because of our high response rate, we have received answers from a
variety of respondents; not only those who are the most eager and prosperous. In this respect
have a more representative sample of our population. For our NIMA sample, we were not able
to calculate a response rate, as we have insufficient knowledge of how many companies it was
distributed to15.
Further, respondents who have ignored some questions of the questionnaire are kept as long as
the answers provided are sufficient to conduct tests with two variables. Consequently the
number of respondents used in the following tests will vary depending on which variables are
tested. Thus, the sample size will be explicitly stated for each variable.
6.2.2 Production situation
We see it fit to provide a distribution of the respondents according to their production situation,
in order to separate answers from ETO companies from others. This is provided in Table 35
below.
DISTRIBUTION OF RESPONDENTS ACCORDING TO PRODUCTION SITUATION
Production situation*
Production situation MTS ATO MTO ETO Non-production
Number of respondents 10 11 24 42 55
Percentage of total sample 7,0% 7,7% 16,9 % 29,6% 38,7%
*N = 142 (2 missing)
Table 35: Distribution of respondents according to production situation
As seen from the table above, it is evident that ETO companies constitute the bulk of the
responding production companies; only the group of non-production respondents is larger.
Consequently, we argue that ETO is well represented in the sample, establishing a solid
foundation for subsequent comparisons between ETO and non-ETO companies.
6.2.3 Company position of respondents
In order to ensure that the respondents possessed adequate knowledge of their purchasing
operation to answer on behalf of the company, we investigated the company position of our
respondents (2.4.3). The findings are presented below (Table 36).
15 An e-mail exchange with NIMA revealed that they did not have information of the number of
companies registered. Even though we know the association has about 2200 members, several of these are students and there are multiple members within a single company, reducing the number of adequate respondents considerably.
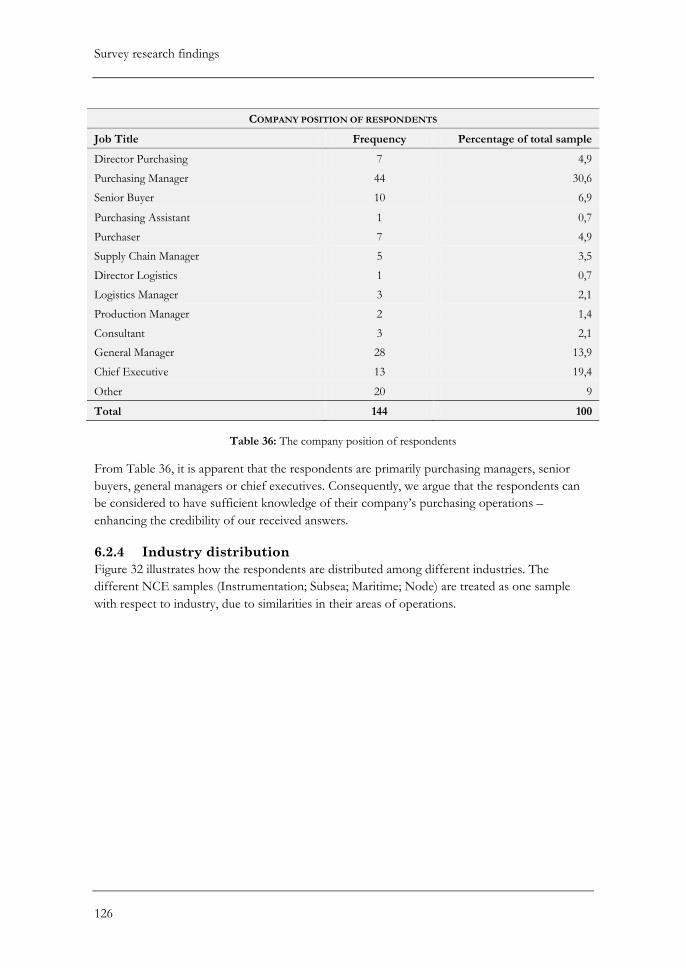
Survey research findings
126
COMPANY POSITION OF RESPONDENTS
Job Title Frequency Percentage of total sample
Director Purchasing 7 4,9
Purchasing Manager 44 30,6
Senior Buyer 10 6,9
Purchasing Assistant 1 0,7
Purchaser 7 4,9
Supply Chain Manager 5 3,5
Director Logistics 1 0,7
Logistics Manager 3 2,1
Production Manager 2 1,4
Consultant 3 2,1
General Manager 28 13,9
Chief Executive 13 19,4
Other 20 9
Total 144 100
Table 36: The company position of respondents
From Table 36, it is apparent that the respondents are primarily purchasing managers, senior
buyers, general managers or chief executives. Consequently, we argue that the respondents can
be considered to have sufficient knowledge of their company’s purchasing operations –
enhancing the credibility of our received answers.
6.2.4 Industry distribution
Figure 32 illustrates how the respondents are distributed among different industries. The
different NCE samples (Instrumentation; Subsea; Maritime; Node) are treated as one sample
with respect to industry, due to similarities in their areas of operations.
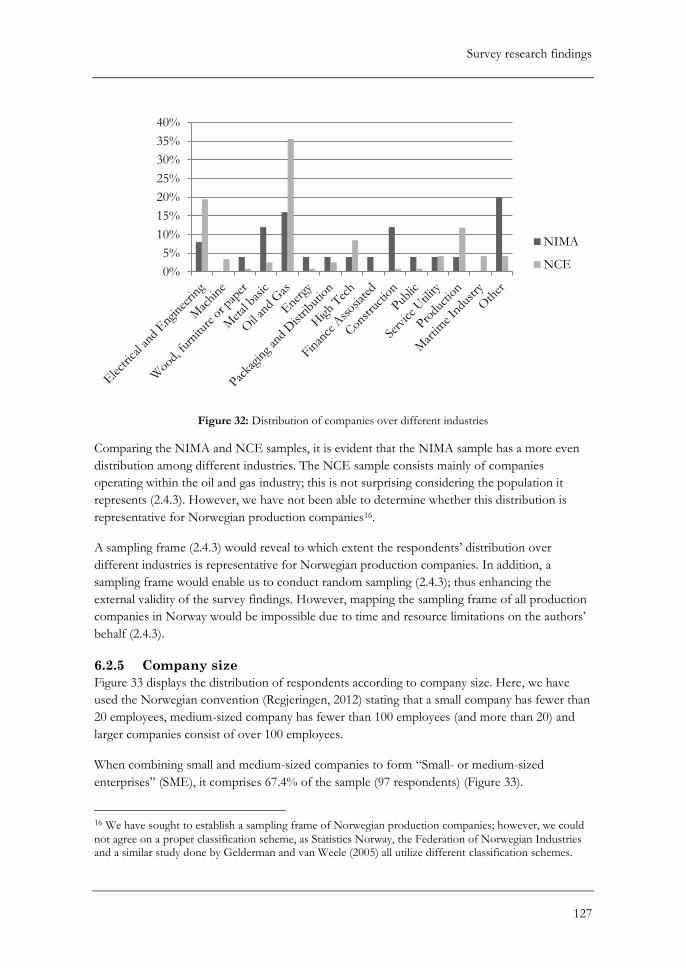
Survey research findings
127
Figure 32: Distribution of companies over different industries
Comparing the NIMA and NCE samples, it is evident that the NIMA sample has a more even
distribution among different industries. The NCE sample consists mainly of companies
operating within the oil and gas industry; this is not surprising considering the population it
represents (2.4.3). However, we have not been able to determine whether this distribution is
representative for Norwegian production companies16.
A sampling frame (2.4.3) would reveal to which extent the respondents’ distribution over
different industries is representative for Norwegian production companies. In addition, a
sampling frame would enable us to conduct random sampling (2.4.3); thus enhancing the
external validity of the survey findings. However, mapping the sampling frame of all production
companies in Norway would be impossible due to time and resource limitations on the authors’
behalf (2.4.3).
6.2.5 Company size
Figure 33 displays the distribution of respondents according to company size. Here, we have
used the Norwegian convention (Regjeringen, 2012) stating that a small company has fewer than
20 employees, medium-sized company has fewer than 100 employees (and more than 20) and
larger companies consist of over 100 employees.
When combining small and medium-sized companies to form “Small- or medium-sized
enterprises” (SME), it comprises 67.4% of the sample (97 respondents) (Figure 33).
16 We have sought to establish a sampling frame of Norwegian production companies; however, we could
not agree on a proper classification scheme, as Statistics Norway, the Federation of Norwegian Industries and a similar study done by Gelderman and van Weele (2005) all utilize different classification schemes.
0%
5%
10%
15%
20%
25%
30%
35%
40%
NIMA
NCE
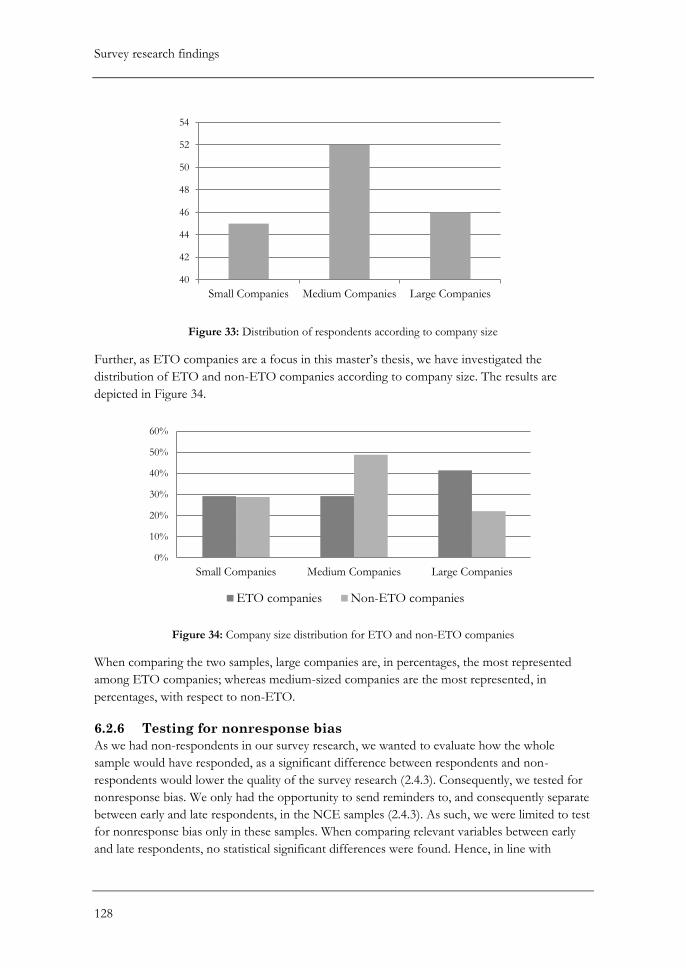
Survey research findings
128
Figure 33: Distribution of respondents according to company size
Further, as ETO companies are a focus in this master’s thesis, we have investigated the
distribution of ETO and non-ETO companies according to company size. The results are
depicted in Figure 34.
Figure 34: Company size distribution for ETO and non-ETO companies
When comparing the two samples, large companies are, in percentages, the most represented
among ETO companies; whereas medium-sized companies are the most represented, in
percentages, with respect to non-ETO.
6.2.6 Testing for nonresponse bias
As we had non-respondents in our survey research, we wanted to evaluate how the whole
sample would have responded, as a significant difference between respondents and non-
respondents would lower the quality of the survey research (2.4.3). Consequently, we tested for
nonresponse bias. We only had the opportunity to send reminders to, and consequently separate
between early and late respondents, in the NCE samples (2.4.3). As such, we were limited to test
for nonresponse bias only in these samples. When comparing relevant variables between early
and late respondents, no statistical significant differences were found. Hence, in line with
40
42
44
46
48
50
52
54
Small Companies Medium Companies Large Companies
0%
10%
20%
30%
40%
50%
60%
Small Companies Medium Companies Large Companies
ETO companies Non-ETO companies
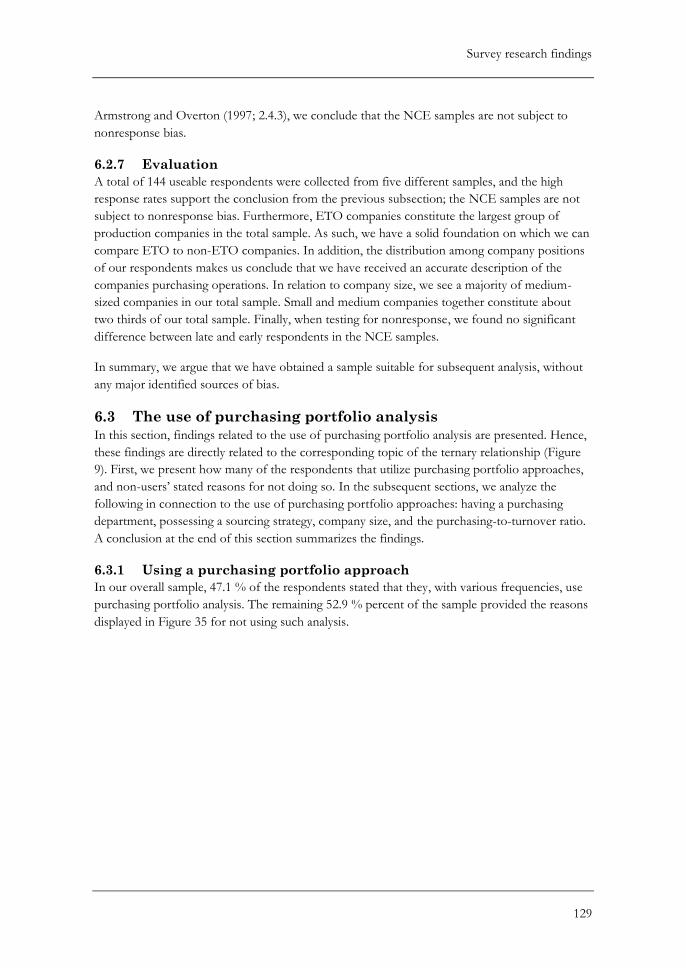
Survey research findings
129
Armstrong and Overton (1997; 2.4.3), we conclude that the NCE samples are not subject to
nonresponse bias.
6.2.7 Evaluation
A total of 144 useable respondents were collected from five different samples, and the high
response rates support the conclusion from the previous subsection; the NCE samples are not
subject to nonresponse bias. Furthermore, ETO companies constitute the largest group of
production companies in the total sample. As such, we have a solid foundation on which we can
compare ETO to non-ETO companies. In addition, the distribution among company positions
of our respondents makes us conclude that we have received an accurate description of the
companies purchasing operations. In relation to company size, we see a majority of medium-
sized companies in our total sample. Small and medium companies together constitute about
two thirds of our total sample. Finally, when testing for nonresponse, we found no significant
difference between late and early respondents in the NCE samples.
In summary, we argue that we have obtained a sample suitable for subsequent analysis, without
any major identified sources of bias.
6.3 The use of purchasing portfolio analysis
In this section, findings related to the use of purchasing portfolio analysis are presented. Hence,
these findings are directly related to the corresponding topic of the ternary relationship (Figure
9). First, we present how many of the respondents that utilize purchasing portfolio approaches,
and non-users’ stated reasons for not doing so. In the subsequent sections, we analyze the
following in connection to the use of purchasing portfolio approaches: having a purchasing
department, possessing a sourcing strategy, company size, and the purchasing-to-turnover ratio.
A conclusion at the end of this section summarizes the findings.
6.3.1 Using a purchasing portfolio approach
In our overall sample, 47.1 % of the respondents stated that they, with various frequencies, use
purchasing portfolio analysis. The remaining 52.9 % percent of the sample provided the reasons
displayed in Figure 35 for not using such analysis.
Survey research findings
130
Figure 35: Reasons for not using a purchasing portfolio approach
From Figure 35 it is apparent that the most prominent reasons for not using purchasing
portfolio analysis are that the company has its own method or do not see the need for such a
tool. The “other” reasons for not using purchasing portfolio analysis were: “we only purchase as
required in projects, though some to temporary stock using automatic re-ordering”; “we work
with standardization and series production, however much is at a prototype level. We are
(literally) a company in development, and have a way to go for standardization of the ‘heaviest’
product costs”; “the questions are irrelevant for a company that only sells services”; and “we are
small, and purchasing is very limited… it is mainly office supplies etc.” Next, we investigate to
which extent having a purchasing department affects the use of purchasing portfolio
approaches.
6.3.2 Having a purchasing department
A slight majority of the respondents (52.4 %) do not have a purchasing department. In those
companies that do have an established purchasing department; the size fluctuates between one to
fifty employees. The median17 of the purchasing department’s size is 4.
Further, an examination of the relationship between the usage of purchasing portfolio analysis
(dependent variable) and whether or not a company has a dedicated purchasing department
(independent variable) was conducted. The result of the analysis is provided in Table 37, in
addition with its associated chi-square test.
17 Bryman and Cramer (2011) state that when outlying values may distort the mean, the median should be considered; it will engender a more representative indication of the central tendency of a group of variables.
0%
5%
10%
15%
20%
25%
30%
35%
Never heard ofit
Do not havesufficientresources
Do not see theneed
Have tried, butdid not find it
useful
Use our ownmethod
Other
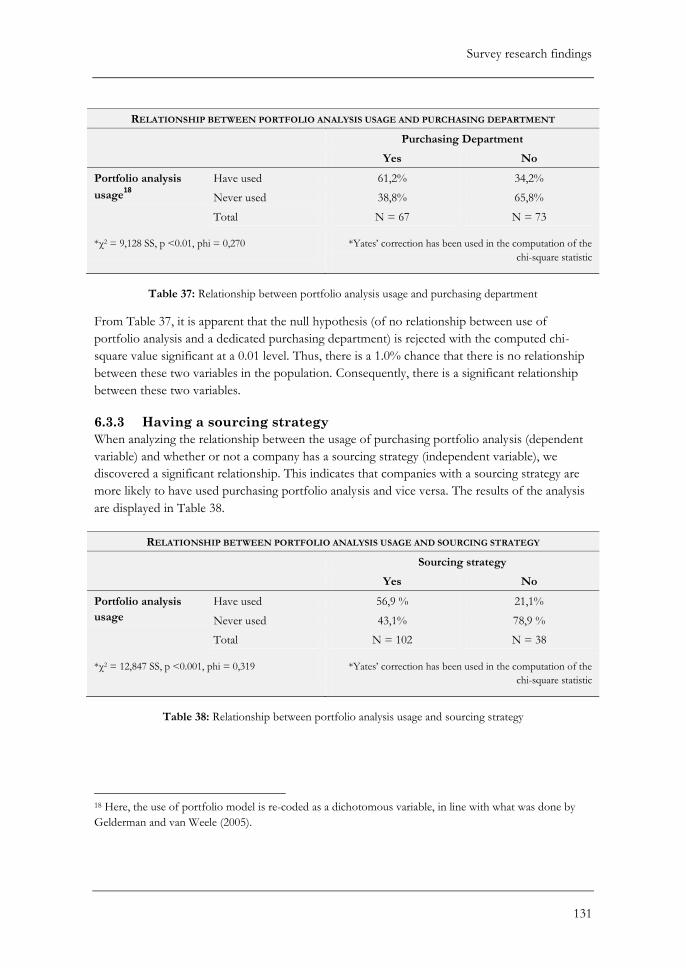
Survey research findings
131
RELATIONSHIP BETWEEN PORTFOLIO ANALYSIS USAGE AND PURCHASING DEPARTMENT
Purchasing Department
Yes No
Portfolio analysis
usage18
Have used 61,2% 34,2%
Never used 38,8% 65,8%
Total N = 67 N = 73
*χ2 = 9,128 SS, p <0.01, phi = 0,270 *Yates’ correction has been used in the computation of the
chi-square statistic
Table 37: Relationship between portfolio analysis usage and purchasing department
From Table 37, it is apparent that the null hypothesis (of no relationship between use of
portfolio analysis and a dedicated purchasing department) is rejected with the computed chi-
square value significant at a 0.01 level. Thus, there is a 1.0% chance that there is no relationship
between these two variables in the population. Consequently, there is a significant relationship
between these two variables.
6.3.3 Having a sourcing strategy
When analyzing the relationship between the usage of purchasing portfolio analysis (dependent
variable) and whether or not a company has a sourcing strategy (independent variable), we
discovered a significant relationship. This indicates that companies with a sourcing strategy are
more likely to have used purchasing portfolio analysis and vice versa. The results of the analysis
are displayed in Table 38.
RELATIONSHIP BETWEEN PORTFOLIO ANALYSIS USAGE AND SOURCING STRATEGY
Sourcing strategy
Yes No
Portfolio analysis
usage
Have used 56,9 % 21,1%
Never used 43,1% 78,9 %
Total N = 102 N = 38
*χ2 = 12,847 SS, p <0.001, phi = 0,319 *Yates’ correction has been used in the computation of the
chi-square statistic
Table 38: Relationship between portfolio analysis usage and sourcing strategy
18 Here, the use of portfolio model is re-coded as a dichotomous variable, in line with what was done by
Gelderman and van Weele (2005).
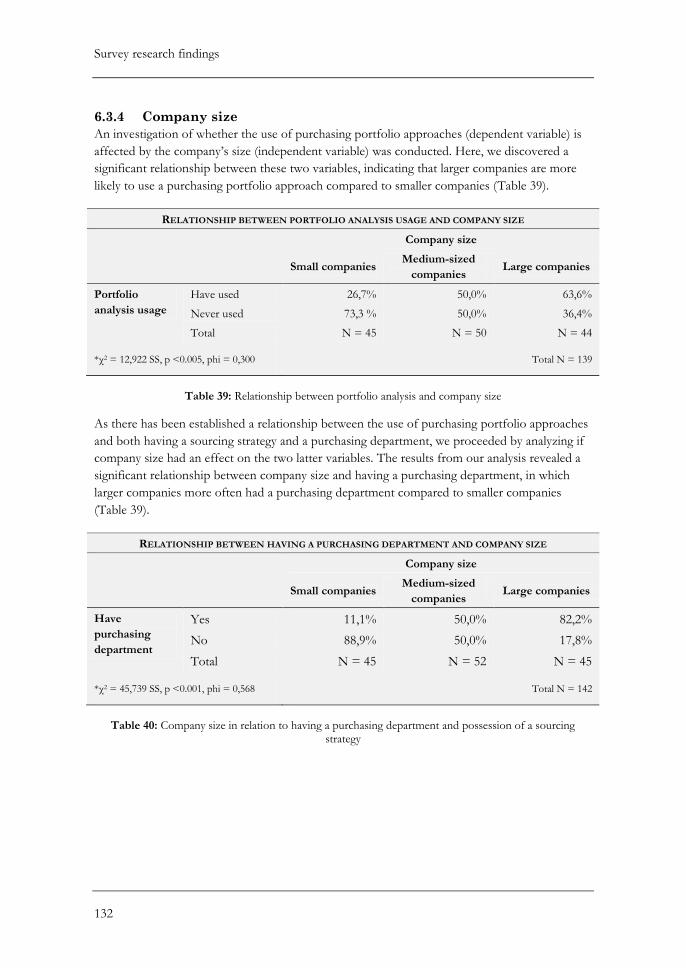
Survey research findings
132
6.3.4 Company size
An investigation of whether the use of purchasing portfolio approaches (dependent variable) is
affected by the company’s size (independent variable) was conducted. Here, we discovered a
significant relationship between these two variables, indicating that larger companies are more
likely to use a purchasing portfolio approach compared to smaller companies (Table 39).
RELATIONSHIP BETWEEN PORTFOLIO ANALYSIS USAGE AND COMPANY SIZE
Company size
Small companies
Medium-sized
companies Large companies
Portfolio
analysis usage
Have used 26,7% 50,0% 63,6%
Never used 73,3 % 50,0% 36,4%
Total N = 45 N = 50 N = 44
*χ2 = 12,922 SS, p <0.005, phi = 0,300 Total N = 139
Table 39: Relationship between portfolio analysis and company size
As there has been established a relationship between the use of purchasing portfolio approaches
and both having a sourcing strategy and a purchasing department, we proceeded by analyzing if
company size had an effect on the two latter variables. The results from our analysis revealed a
significant relationship between company size and having a purchasing department, in which
larger companies more often had a purchasing department compared to smaller companies
(Table 39).
RELATIONSHIP BETWEEN HAVING A PURCHASING DEPARTMENT AND COMPANY SIZE
Company size
Small companies
Medium-sized
companies Large companies
Have
purchasing
department
Yes 11,1% 50,0% 82,2%
No 88,9% 50,0% 17,8%
Total N = 45 N = 52 N = 45
*χ2 = 45,739 SS, p <0.001, phi = 0,568 Total N = 142
Table 40: Company size in relation to having a purchasing department and possession of a sourcing
strategy
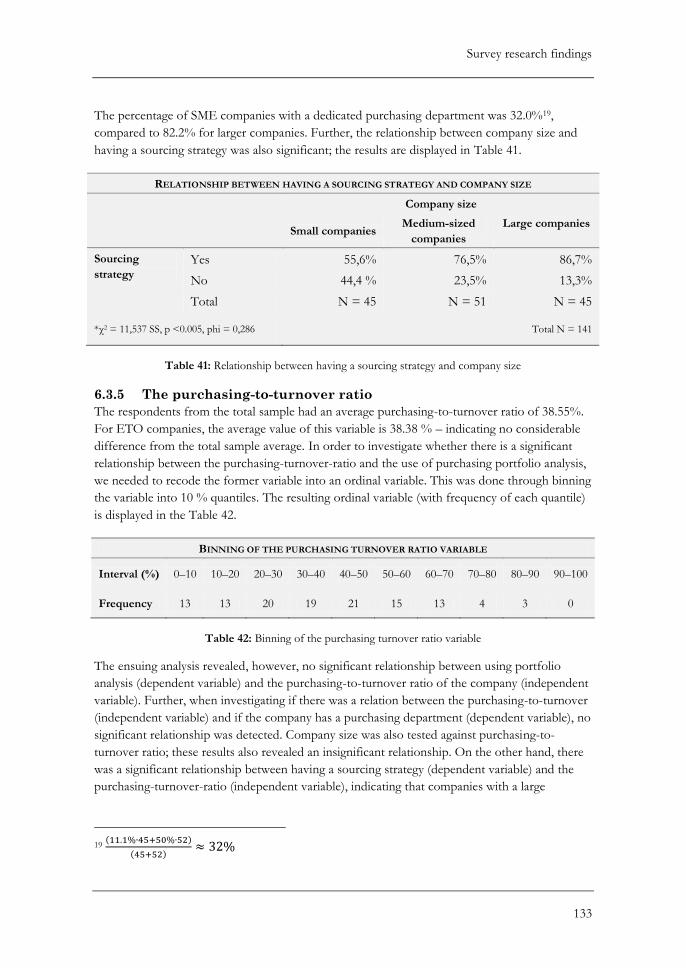
Survey research findings
133
The percentage of SME companies with a dedicated purchasing department was 32.0%19,
compared to 82.2% for larger companies. Further, the relationship between company size and
having a sourcing strategy was also significant; the results are displayed in Table 41.
RELATIONSHIP BETWEEN HAVING A SOURCING STRATEGY AND COMPANY SIZE
Company size
Small companies
Medium-sized
companies
Large companies
Sourcing
strategy Yes 55,6% 76,5% 86,7%
No 44,4 % 23,5% 13,3%
Total N = 45 N = 51 N = 45
*χ2 = 11,537 SS, p <0.005, phi = 0,286 Total N = 141
Table 41: Relationship between having a sourcing strategy and company size
6.3.5 The purchasing-to-turnover ratio
The respondents from the total sample had an average purchasing-to-turnover ratio of 38.55%.
For ETO companies, the average value of this variable is 38.38 % – indicating no considerable
difference from the total sample average. In order to investigate whether there is a significant
relationship between the purchasing-turnover-ratio and the use of purchasing portfolio analysis,
we needed to recode the former variable into an ordinal variable. This was done through binning
the variable into 10 % quantiles. The resulting ordinal variable (with frequency of each quantile)
is displayed in the Table 42.
BINNING OF THE PURCHASING TURNOVER RATIO VARIABLE
Interval (%) 0–10 10–20 20–30 30–40 40–50 50–60 60–70 70–80 80–90 90–100
Frequency 13 13 20 19 21 15 13 4 3 0
Table 42: Binning of the purchasing turnover ratio variable
The ensuing analysis revealed, however, no significant relationship between using portfolio
analysis (dependent variable) and the purchasing-to-turnover ratio of the company (independent
variable). Further, when investigating if there was a relation between the purchasing-to-turnover
(independent variable) and if the company has a purchasing department (dependent variable), no
significant relationship was detected. Company size was also tested against purchasing-to-
turnover ratio; these results also revealed an insignificant relationship. On the other hand, there
was a significant relationship between having a sourcing strategy (dependent variable) and the
purchasing-turnover-ratio (independent variable), indicating that companies with a large
19 ( )
( )
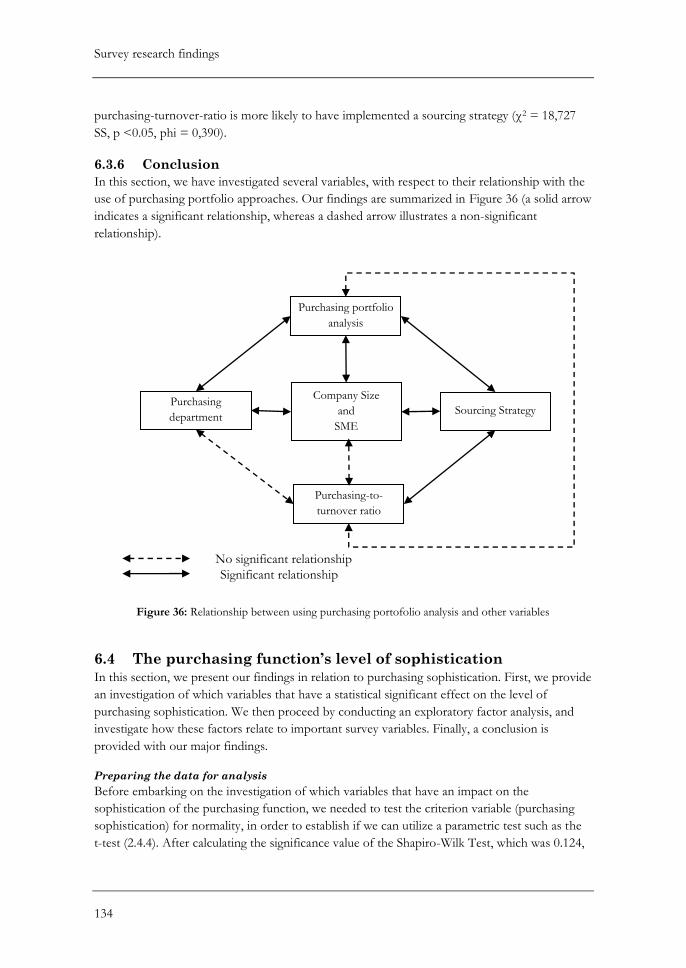
Survey research findings
134
purchasing-turnover-ratio is more likely to have implemented a sourcing strategy (χ2 = 18,727
SS, p <0.05, phi = 0,390).
6.3.6 Conclusion
In this section, we have investigated several variables, with respect to their relationship with the
use of purchasing portfolio approaches. Our findings are summarized in Figure 36 (a solid arrow
indicates a significant relationship, whereas a dashed arrow illustrates a non-significant
relationship).
6.4 The purchasing function’s level of sophistication
In this section, we present our findings in relation to purchasing sophistication. First, we provide
an investigation of which variables that have a statistical significant effect on the level of
purchasing sophistication. We then proceed by conducting an exploratory factor analysis, and
investigate how these factors relate to important survey variables. Finally, a conclusion is
provided with our major findings.
Preparing the data for analysis
Before embarking on the investigation of which variables that have an impact on the
sophistication of the purchasing function, we needed to test the criterion variable (purchasing
sophistication) for normality, in order to establish if we can utilize a parametric test such as the
t-test (2.4.4). After calculating the significance value of the Shapiro-Wilk Test, which was 0.124,
Purchasing
department Sourcing Strategy
Company Size
and
SME
Purchasing portfolio
analysis
Purchasing-to-
turnover ratio
Significant relationship
No significant relationship
Figure 36: Relationship between using purchasing portofolio analysis and other variables
Survey research findings
135
and investigated the Normal Q-Q plot for this variable, we could establish that this variable
forms a normal distribution. Further, as purchasing sophistication is measured by several
indicators, we saw it necessary to evaluate its internal reliability (2.4.2). Cronbach’s alpha for the
purchasing sophistication variable is only 0.503. This measure should, however, be 0.70 or above
(2.4.2). Nevertheless, we find that purchasing sophistication comprises several underlying factors
(further elaborated in 6.4.3). In this relation, Bryman and Cramer (2011) state that it is normal to
rather evaluate the internal reliability of each factor, than for the measure as whole.
Consequently, we will calculate the internal reliability of each factor, and as such rely on these
measures in order to evaluate the overall internal reliability of the measure of purchasing
sophistication.
Furthermore, in order to eliminate response bias in terms of response sets (2.4.2), these (a total
of 9 respondents) were removed from the sample. In addition, there were 7 respondents who
did not provide sufficient answers on the variable of purchasing sophistication. Consequently,
the sample used for the bivariate analysis with the variable of purchasing sophistication was
reduced to 128 respondents.
6.4.1 Variables affecting purchasing sophistication
This subsection provides the results of the analysis of purchasing sophistication in relation to
the previous investigated variables. In the succeeding paragraph, we investigate the impact on
purchasing sophistication of having a purchasing department, sourcing strategy and using a
purchasing portfolio analysis. We then proceed by analyzing to which extent purchasing
sophistication is influenced by company size and the purchasing-to-turnover ratio.
Through conducting a t-test with the unrelated samples of companies in possession of a
purchasing department and those without, and their mean level of sophistication, we found no
statistical significance between the groups (t = 1.123, NS, p > 0.26), despite that the former
group had a somewhat higher mean sophistication. When conducting the same test for
companies with or without a sourcing strategy, and their mean level of sophistication, we
discovered that companies with a sourcing strategy have a significantly higher sophistication (t =
2.766, SS, p < 0.01). Further, as expected, companies who used a purchasing portfolio analysis
had a more sophisticated purchasing function. However, the difference from the mean of those
companies who did not use such an analysis, was not significant (t = -1,527, NS, p> 0,129); thus
we cannot conclude that there is a difference in sophistication between users and non-users of
purchasing portfolio analysis in the sample.
As we could not establish a significant difference in sophistication between companies who used
purchasing portfolio approaches from those who did not, we proceeded by analyzing the
relationship between these two variables. In order to enable such an investigation, the level of
purchasing sophistication was re-coded into an ordinal variable consisting of five groups, whose
interval and frequency is displayed in the Table 43.
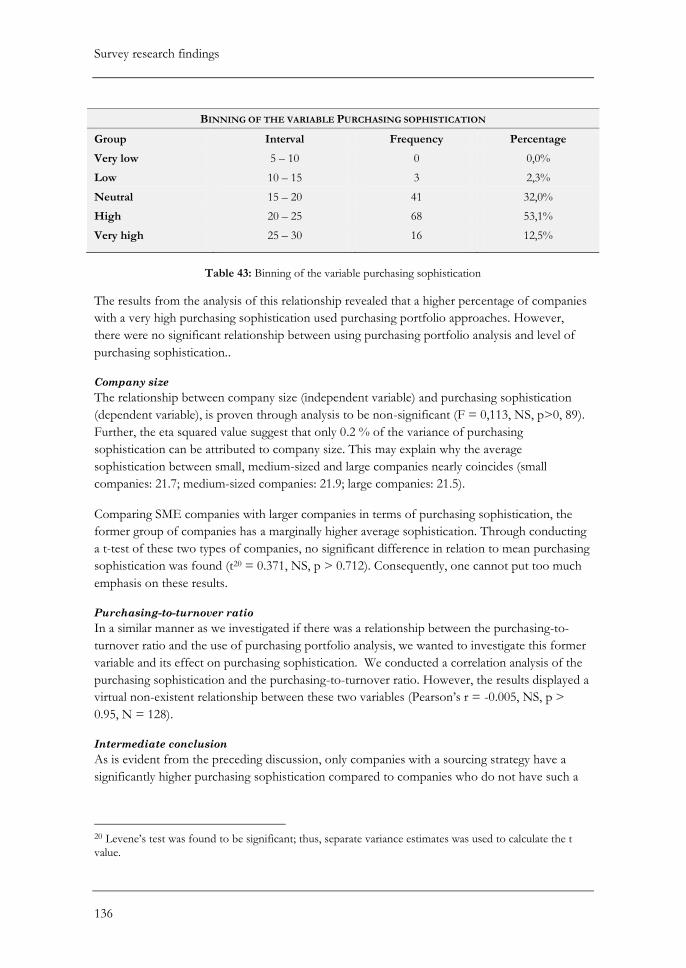
Survey research findings
136
BINNING OF THE VARIABLE PURCHASING SOPHISTICATION
Group Interval Frequency Percentage
Very low 5 – 10 0 0,0%
Low 10 – 15 3 2,3%
Neutral 15 – 20 41 32,0%
High 20 – 25 68 53,1%
Very high 25 – 30 16 12,5%
Table 43: Binning of the variable purchasing sophistication
The results from the analysis of this relationship revealed that a higher percentage of companies
with a very high purchasing sophistication used purchasing portfolio approaches. However,
there were no significant relationship between using purchasing portfolio analysis and level of
purchasing sophistication..
Company size
The relationship between company size (independent variable) and purchasing sophistication
(dependent variable), is proven through analysis to be non-significant (F = 0,113, NS, p>0, 89).
Further, the eta squared value suggest that only 0.2 % of the variance of purchasing
sophistication can be attributed to company size. This may explain why the average
sophistication between small, medium-sized and large companies nearly coincides (small
companies: 21.7; medium-sized companies: 21.9; large companies: 21.5).
Comparing SME companies with larger companies in terms of purchasing sophistication, the
former group of companies has a marginally higher average sophistication. Through conducting
a t-test of these two types of companies, no significant difference in relation to mean purchasing
sophistication was found (t20 = 0.371, NS, p > 0.712). Consequently, one cannot put too much
emphasis on these results.
Purchasing-to-turnover ratio
In a similar manner as we investigated if there was a relationship between the purchasing-to-
turnover ratio and the use of purchasing portfolio analysis, we wanted to investigate this former
variable and its effect on purchasing sophistication. We conducted a correlation analysis of the
purchasing sophistication and the purchasing-to-turnover ratio. However, the results displayed a
virtual non-existent relationship between these two variables (Pearson’s r = -0.005, NS, p >
0.95, N = 128).
Intermediate conclusion
As is evident from the preceding discussion, only companies with a sourcing strategy have a
significantly higher purchasing sophistication compared to companies who do not have such a
20 Levene’s test was found to be significant; thus, separate variance estimates was used to calculate the t
value.
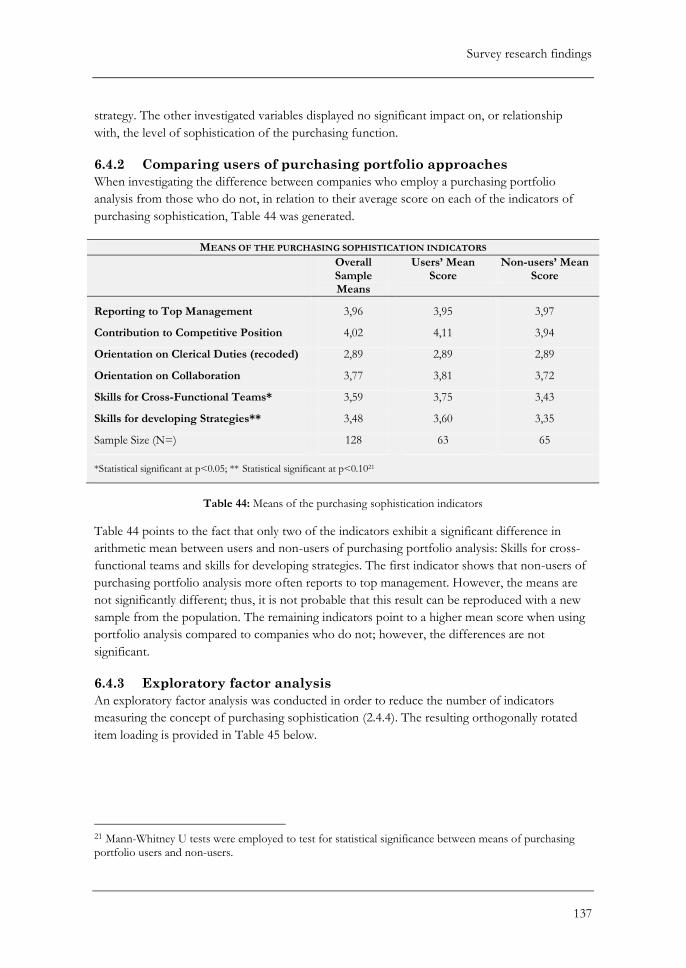
Survey research findings
137
strategy. The other investigated variables displayed no significant impact on, or relationship
with, the level of sophistication of the purchasing function.
6.4.2 Comparing users of purchasing portfolio approaches
When investigating the difference between companies who employ a purchasing portfolio
analysis from those who do not, in relation to their average score on each of the indicators of
purchasing sophistication, Table 44 was generated.
MEANS OF THE PURCHASING SOPHISTICATION INDICATORS
Overall Sample Means
Users’ Mean Score
Non-users’ Mean Score
Reporting to Top Management 3,96 3,95 3,97
Contribution to Competitive Position 4,02 4,11 3,94
Orientation on Clerical Duties (recoded) 2,89 2,89 2,89
Orientation on Collaboration 3,77 3,81 3,72
Skills for Cross-Functional Teams* 3,59 3,75 3,43
Skills for developing Strategies** 3,48 3,60 3,35
Sample Size (N=) 128 63 65
*Statistical significant at p<0.05; ** Statistical significant at p<0.1021
Table 44: Means of the purchasing sophistication indicators
Table 44 points to the fact that only two of the indicators exhibit a significant difference in
arithmetic mean between users and non-users of purchasing portfolio analysis: Skills for cross-
functional teams and skills for developing strategies. The first indicator shows that non-users of
purchasing portfolio analysis more often reports to top management. However, the means are
not significantly different; thus, it is not probable that this result can be reproduced with a new
sample from the population. The remaining indicators point to a higher mean score when using
portfolio analysis compared to companies who do not; however, the differences are not
significant.
6.4.3 Exploratory factor analysis
An exploratory factor analysis was conducted in order to reduce the number of indicators
measuring the concept of purchasing sophistication (2.4.4). The resulting orthogonally rotated
item loading is provided in Table 45 below.
21 Mann-Whitney U tests were employed to test for statistical significance between means of purchasing
portfolio users and non-users.
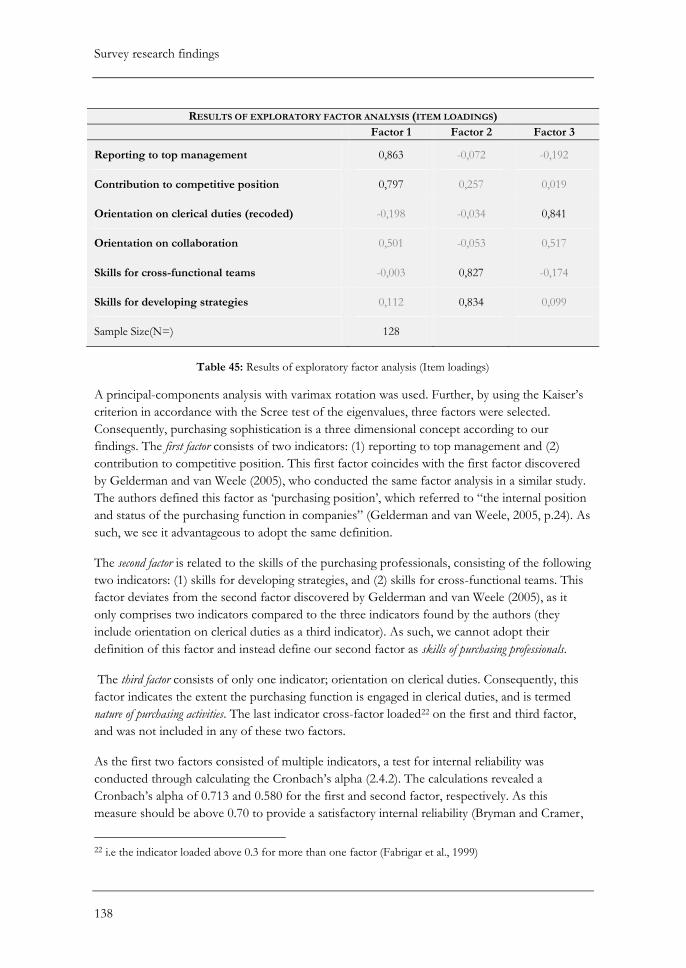
Survey research findings
138
RESULTS OF EXPLORATORY FACTOR ANALYSIS (ITEM LOADINGS)
Factor 1 Factor 2 Factor 3
Reporting to top management 0,863 -0,072 -0,192
Contribution to competitive position 0,797 0,257 0,019
Orientation on clerical duties (recoded) -0,198 -0,034 0,841
Orientation on collaboration 0,501 -0,053 0,517
Skills for cross-functional teams -0,003 0,827 -0,174
Skills for developing strategies 0,112 0,834 0,099
Sample Size(N=) 128
Table 45: Results of exploratory factor analysis (Item loadings)
A principal-components analysis with varimax rotation was used. Further, by using the Kaiser’s
criterion in accordance with the Scree test of the eigenvalues, three factors were selected.
Consequently, purchasing sophistication is a three dimensional concept according to our
findings. The first factor consists of two indicators: (1) reporting to top management and (2)
contribution to competitive position. This first factor coincides with the first factor discovered
by Gelderman and van Weele (2005), who conducted the same factor analysis in a similar study.
The authors defined this factor as ‘purchasing position’, which referred to “the internal position
and status of the purchasing function in companies” (Gelderman and van Weele, 2005, p.24). As
such, we see it advantageous to adopt the same definition.
The second factor is related to the skills of the purchasing professionals, consisting of the following
two indicators: (1) skills for developing strategies, and (2) skills for cross-functional teams. This
factor deviates from the second factor discovered by Gelderman and van Weele (2005), as it
only comprises two indicators compared to the three indicators found by the authors (they
include orientation on clerical duties as a third indicator). As such, we cannot adopt their
definition of this factor and instead define our second factor as skills of purchasing professionals.
The third factor consists of only one indicator; orientation on clerical duties. Consequently, this
factor indicates the extent the purchasing function is engaged in clerical duties, and is termed
nature of purchasing activities. The last indicator cross-factor loaded22 on the first and third factor,
and was not included in any of these two factors.
As the first two factors consisted of multiple indicators, a test for internal reliability was
conducted through calculating the Cronbach’s alpha (2.4.2). The calculations revealed a
Cronbach’s alpha of 0.713 and 0.580 for the first and second factor, respectively. As this
measure should be above 0.70 to provide a satisfactory internal reliability (Bryman and Cramer,
22 i.e the indicator loaded above 0.3 for more than one factor (Fabrigar et al., 1999)
Survey research findings
139
2011), it is evident that the second factor has a somewhat weaker reliability than what is
recommended. However, a similar low internal reliability of their first factor in the study by
Gelderman and van Weele (2005) was found to be sufficiently reliable. Hence, we argue that this
is also the case in our research.
Variables affecting the factors of purchasing sophistication
We conducted an analysis of the impact on each of the purchasing sophistication factors, by the
different variables investigated earlier in this chapter. The result from this investigation is now
presented.
First, an analysis was done in order to see if the use of purchasing portfolio analysis affected the
mean scores of the different factors of purchasing sophistication. The results demonstrated that
the use of purchasing portfolio analysis gave a significant higher mean score of the second
factor, skills of purchasing professionals (t = -2.193, SS, p<0.05). However, the two other
factors displayed no significant difference in mean score between users and non-users of
purchasing portfolio approaches. Further, we investigated if having a purchasing department
had an impact on mean scores of the three factors. The results from the analysis showed that it
was only the second factor of purchasing sophistication that had a significant higher score
between companies with a purchasing department compared with those without (t = 2,720 , SS,
p<0,01). As we have previously established that companies with a sourcing strategy have a
significantly higher purchasing sophistication, we did not see necessary to investigate this former
variable’s impact of the factors of purchasing sophistication.
Next, we wanted to investigate if company size and the purchasing-turnover-ratio had an impact
on the mean scores of the different factors of sophistication. An analysis of both the
relationship, and differences in mean score, between company size and the different factors of
sophistication indicated no significant results. As such, we conclude that company size has
negligible effect on any factors indicating a company’s purchasing sophistication. Furthermore,
through conducting a correlation analysis of the purchasing-to-turnover ratio and each of the
factors indicating purchasing sophistication, no significant correlation, and consequently no
relationship, between the two variables were evident.
Conclusion
In this subsection we have established that purchasing sophistication is a three-dimensional
concept. Further, the results from an analysis with several relevant variables impact on the
different factors of purchasing sophistication, is depicted in Figure 37.
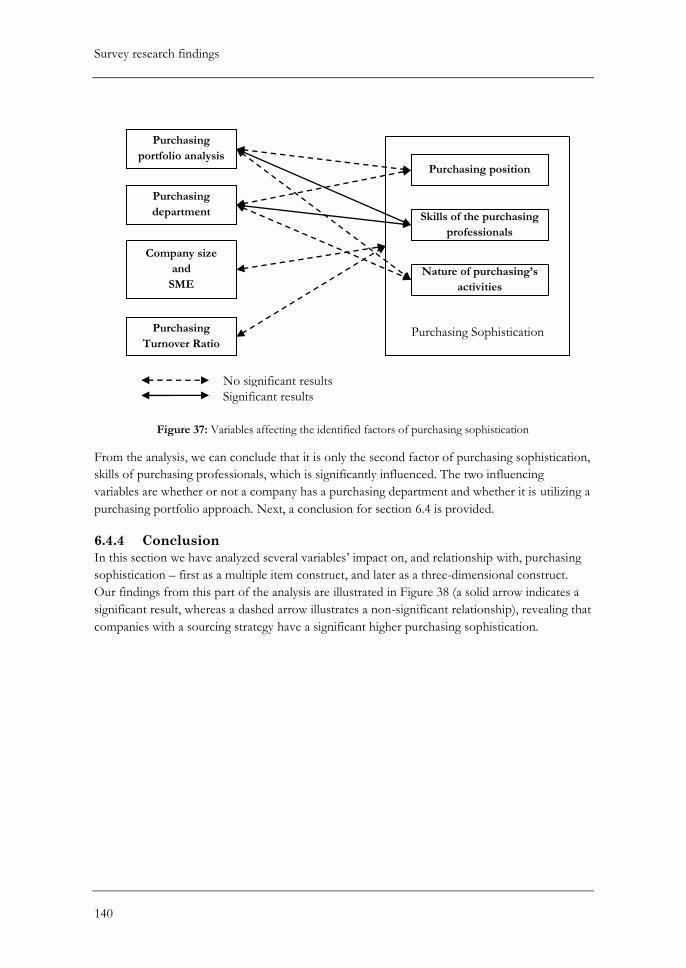
Survey research findings
140
Figure 37: Variables affecting the identified factors of purchasing sophistication
From the analysis, we can conclude that it is only the second factor of purchasing sophistication,
skills of purchasing professionals, which is significantly influenced. The two influencing
variables are whether or not a company has a purchasing department and whether it is utilizing a
purchasing portfolio approach. Next, a conclusion for section 6.4 is provided.
6.4.4 Conclusion
In this section we have analyzed several variables’ impact on, and relationship with, purchasing
sophistication – first as a multiple item construct, and later as a three-dimensional construct.
Our findings from this part of the analysis are illustrated in Figure 38 (a solid arrow indicates a
significant result, whereas a dashed arrow illustrates a non-significant relationship), revealing that
companies with a sourcing strategy have a significant higher purchasing sophistication.
Purchasing Sophistication
Purchasing position
Skills of the purchasing
professionals
Nature of purchasing’s
activities
Purchasing
portfolio analysis
Purchasing
department
Company size
and
SME
Purchasing
Turnover Ratio
Significant results
No significant results
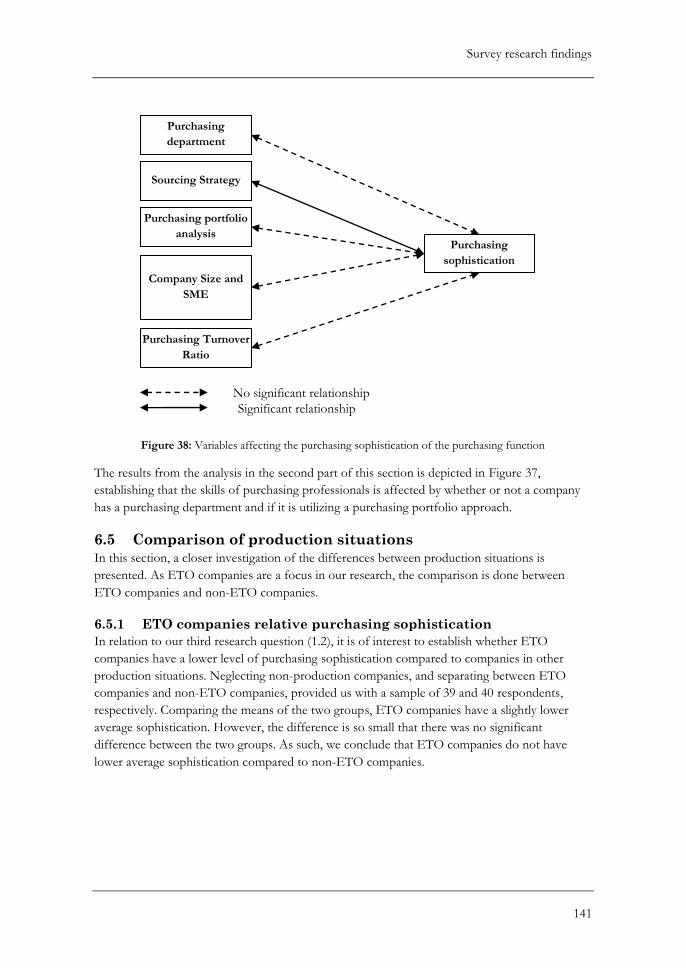
Survey research findings
141
Figure 38: Variables affecting the purchasing sophistication of the purchasing function
The results from the analysis in the second part of this section is depicted in Figure 37,
establishing that the skills of purchasing professionals is affected by whether or not a company
has a purchasing department and if it is utilizing a purchasing portfolio approach.
6.5 Comparison of production situations
In this section, a closer investigation of the differences between production situations is
presented. As ETO companies are a focus in our research, the comparison is done between
ETO companies and non-ETO companies.
6.5.1 ETO companies relative purchasing sophistication
In relation to our third research question (1.2), it is of interest to establish whether ETO
companies have a lower level of purchasing sophistication compared to companies in other
production situations. Neglecting non-production companies, and separating between ETO
companies and non-ETO companies, provided us with a sample of 39 and 40 respondents,
respectively. Comparing the means of the two groups, ETO companies have a slightly lower
average sophistication. However, the difference is so small that there was no significant
difference between the two groups. As such, we conclude that ETO companies do not have
lower average sophistication compared to non-ETO companies.
Purchasing
department
Sourcing Strategy
Company Size and
SME
Purchasing
sophistication
Purchasing Turnover
Ratio
Significant relationship
No significant relationship
Purchasing portfolio
analysis
Survey research findings
142
6.5.2 Comparison between production situations in relation to
relevant variables
As we have compared both purchasing sophistication and the use of purchasing portfolio
analysis against relevant variables, we find it beneficial to conduct the same analysis in relation to
production situation. This sub-section provides the result from this analysis.
When investigating the relationship between having a purchasing department and being an ETO
company, the analysis shows that a higher percentage of ETO companies have a purchasing
department compared to other production companies (54.5% to 45.5%, respectively). However,
this difference is not significant and there is no significant relationships between the two
variables (χ2 = 0.754, NS, p >0.38). Hence, there seems to be no difference amongst the
production situations in relation to whether they have a dedicated purchasing department.
The analysis of the relationship between having a sourcing strategy and being an ETO company
reveals that a slightly lower percentage of ETO companies have a sourcing strategy. Then again,
we discover that this difference is not significant, and that there is no significant relationship
between the variables (χ2 = 1.141, NS, p >0.28). Thus, we can conclude that there seems to be
no difference between ETO companies and non-ETO companies in relation to whether they
have a sourcing strategy.
A closer investigation reveals that more non-ETO than ETO companies stated that they use
purchasing portfolio approaches. However, this difference between production situations is not
significant 23(χ2 = 0.580, NS, p >0.44). In relation to company size, our survey data did not
indicate a significant relationship between company size and production situation; even though
most of the larger companies were ETO (χ2 = 4.620, NS, p >0.05). This result was not
surprising, considering the even distribution of ETO companies over different company sizes
(Figure 33).
The only significant result discovered indicated that ETO companies had a significantly lower
purchasing-to-turnover ratio compared to non-ETO companies (t = -2.063, SS, p<0.05). The
average purchasing-to-turnover ratio for ETO companies was 38.38%, whereas it was 47.12%
for companies within other production situations.
6.5.3 Conclusion
In this section, an analysis of ETO companies compared to non-ETO companies was
conducted. Although ETO companies have a slightly lower purchasing sophistication than non-
ETO companies, this difference is not significant. Furthermore, we compared production
situation to relevant variables (as done in the previous sections). The results displayed one
significant finding, indicating that ETO companies have a significantly lower purchasing-to-
turnover ratio.
23 Yates’ correction has been used in the computation of the chi-square statistic
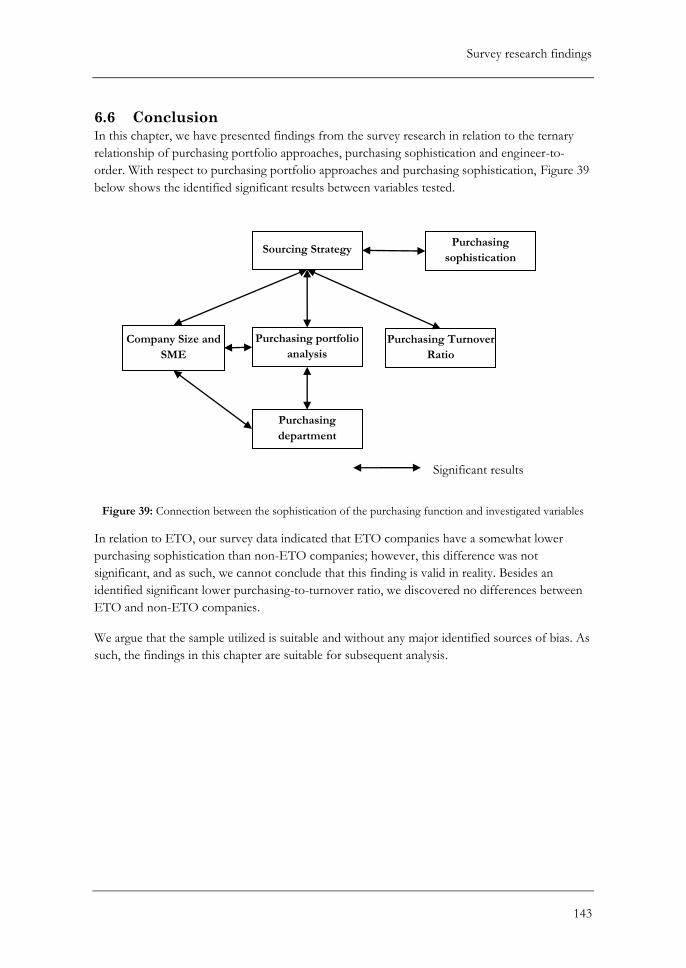
Survey research findings
143
6.6 Conclusion
In this chapter, we have presented findings from the survey research in relation to the ternary
relationship of purchasing portfolio approaches, purchasing sophistication and engineer-to-
order. With respect to purchasing portfolio approaches and purchasing sophistication, Figure 39
below shows the identified significant results between variables tested.
Figure 39: Connection between the sophistication of the purchasing function and investigated variables
In relation to ETO, our survey data indicated that ETO companies have a somewhat lower
purchasing sophistication than non-ETO companies; however, this difference was not
significant, and as such, we cannot conclude that this finding is valid in reality. Besides an
identified significant lower purchasing-to-turnover ratio, we discovered no differences between
ETO and non-ETO companies.
We argue that the sample utilized is suitable and without any major identified sources of bias. As
such, the findings in this chapter are suitable for subsequent analysis.
Sourcing Strategy Purchasing
sophistication
Purchasing Turnover
Ratio
Purchasing portfolio
analysis
Purchasing
department
Company Size and
SME
Significant results
Action research findings
144
7 Action research findings In this chapter, findings from the two action research workshops with our collaborating partner
company, Fugro, are provided. First, a short presentation of Fugro is given. This includes a
classification of Fugro as an ETO company and motivation for choosing this company as a
collaborator. The next section describes the components that were discussed in the workshops.
This is followed by a section elaborating on the two workshops’ process of applying the Kraljic
matrix on the previously described components. Here, the company’s current practice towards
suppliers is also described, together with the workshop participants’ evaluation of applying the
model. The fourth section is organized in a similar manner as the proceeding one, describing the
application of the ETO adapted model developed in the specialization project (1.1.6; Figure 7).
Thereafter, the workshop participants’ perceptions of a purchasing portfolio approach by Olsen
and Ellram (1997) are presented. This is followed by the workshop participants’ total evaluation
of the whole process. Finally, some concluding remarks are given.
7.1 Fugro OCEANOR – the action research collaborator
Fugro is a relatively small, high-tech company that specializes in design, manufacturing,
technological development, installation and support of solutions for environmental monitoring,
ocean observing and forecasting systems (Fugro, 2011a). The company is part of the Fugro
Group, and is situated with its main office in Trondheim. Even though Fugro have several areas
of specialization, we have chosen to narrow our scope to purchasing activities related to the
design and manufacturing of buoys.
In this section, we provide a brief introduction to Fugro’s production situation. Thereafter, we
motivate the collaboration with Fugro in the action research. The purpose is to provide the
reader with the underlying context of the workshops.
7.1.1 Fugro as an ETO company
As described earlier (5.1.1), many taxonomies and terminologies are developed in an attempt to
classify production situations like ETO. In general, common denominators for ETO companies
are that there is an engineering activity for each product and that the production is driven by
customer orders (5.1; Table 31): Products are manufactured to meet a customer's specific needs,
and therefore require unique engineering design or significant customization (Amaro et al.,
1999). Consequently, the company knows very little about what to order or manufacture until a
customer order is received and engineering specifications are set (Bertrand and Muntslag, 1993).
These aspects are all present at Fugro; the production of a buoy is triggered by a customer order
and each buoy is designed and engineered, to some extent, according to customer preferences
and the specified buoy location. It is therefore argued that Fugro by definition is an ETO
company. Figure 40 shows the location of Fugro’s order penetration point (or CODP; 5.1) in
the illustration by Olhager (2003).
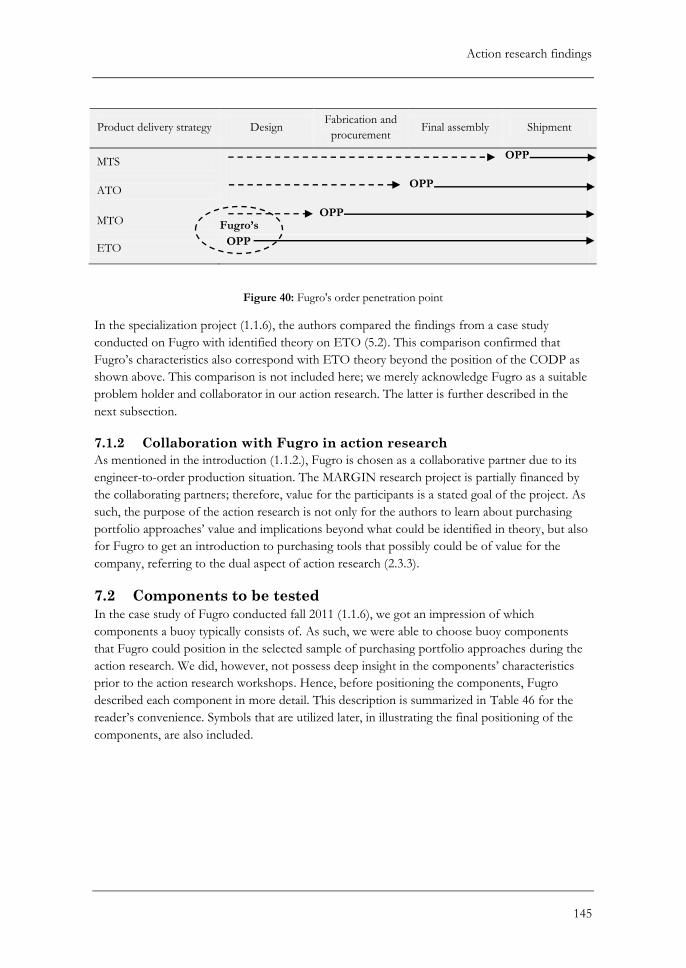
Action research findings
145
Product delivery strategy Design Fabrication and
procurement Final assembly Shipment
MTS OPP
ATO OPP
MTO OPP
ETO OPP
Figure 40: Fugro's order penetration point
In the specialization project (1.1.6), the authors compared the findings from a case study
conducted on Fugro with identified theory on ETO (5.2). This comparison confirmed that
Fugro’s characteristics also correspond with ETO theory beyond the position of the CODP as
shown above. This comparison is not included here; we merely acknowledge Fugro as a suitable
problem holder and collaborator in our action research. The latter is further described in the
next subsection.
7.1.2 Collaboration with Fugro in action research
As mentioned in the introduction (1.1.2.), Fugro is chosen as a collaborative partner due to its
engineer-to-order production situation. The MARGIN research project is partially financed by
the collaborating partners; therefore, value for the participants is a stated goal of the project. As
such, the purpose of the action research is not only for the authors to learn about purchasing
portfolio approaches’ value and implications beyond what could be identified in theory, but also
for Fugro to get an introduction to purchasing tools that possibly could be of value for the
company, referring to the dual aspect of action research (2.3.3).
7.2 Components to be tested
In the case study of Fugro conducted fall 2011 (1.1.6), we got an impression of which
components a buoy typically consists of. As such, we were able to choose buoy components
that Fugro could position in the selected sample of purchasing portfolio approaches during the
action research. We did, however, not possess deep insight in the components’ characteristics
prior to the action research workshops. Hence, before positioning the components, Fugro
described each component in more detail. This description is summarized in Table 46 for the
reader’s convenience. Symbols that are utilized later, in illustrating the final positioning of the
components, are also included.
Fugro’s
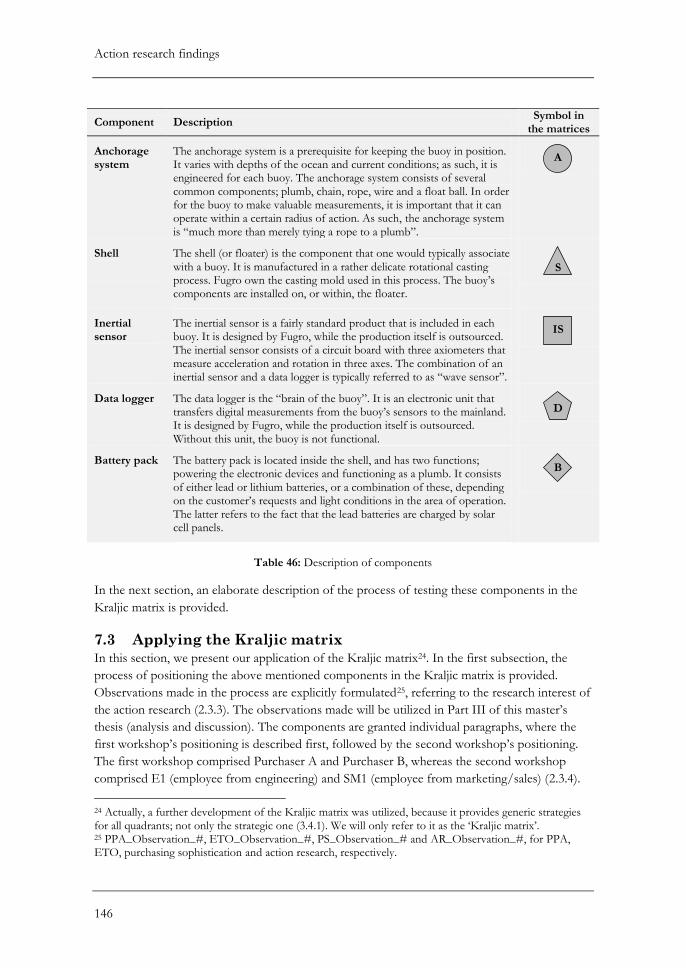
Action research findings
146
Component Description Symbol in
the matrices
Anchorage system
The anchorage system is a prerequisite for keeping the buoy in position. It varies with depths of the ocean and current conditions; as such, it is engineered for each buoy. The anchorage system consists of several common components; plumb, chain, rope, wire and a float ball. In order for the buoy to make valuable measurements, it is important that it can operate within a certain radius of action. As such, the anchorage system is “much more than merely tying a rope to a plumb”.
Shell
The shell (or floater) is the component that one would typically associate with a buoy. It is manufactured in a rather delicate rotational casting process. Fugro own the casting mold used in this process. The buoy’s components are installed on, or within, the floater.
Inertial sensor
The inertial sensor is a fairly standard product that is included in each buoy. It is designed by Fugro, while the production itself is outsourced. The inertial sensor consists of a circuit board with three axiometers that measure acceleration and rotation in three axes. The combination of an inertial sensor and a data logger is typically referred to as “wave sensor”.
Data logger The data logger is the “brain of the buoy”. It is an electronic unit that transfers digital measurements from the buoy’s sensors to the mainland. It is designed by Fugro, while the production itself is outsourced. Without this unit, the buoy is not functional.
Battery pack The battery pack is located inside the shell, and has two functions; powering the electronic devices and functioning as a plumb. It consists of either lead or lithium batteries, or a combination of these, depending on the customer’s requests and light conditions in the area of operation. The latter refers to the fact that the lead batteries are charged by solar cell panels.
Table 46: Description of components
In the next section, an elaborate description of the process of testing these components in the
Kraljic matrix is provided.
7.3 Applying the Kraljic matrix
In this section, we present our application of the Kraljic matrix24. In the first subsection, the
process of positioning the above mentioned components in the Kraljic matrix is provided.
Observations made in the process are explicitly formulated25, referring to the research interest of
the action research (2.3.3). The observations made will be utilized in Part III of this master’s
thesis (analysis and discussion). The components are granted individual paragraphs, where the
first workshop’s positioning is described first, followed by the second workshop’s positioning.
The first workshop comprised Purchaser A and Purchaser B, whereas the second workshop
comprised E1 (employee from engineering) and SM1 (employee from marketing/sales) (2.3.4).
24 Actually, a further development of the Kraljic matrix was utilized, because it provides generic strategies for all quadrants; not only the strategic one (3.4.1). We will only refer to it as the ‘Kraljic matrix’. 25 PPA_Observation_#, ETO_Observation_#, PS_Observation_# and AR_Observation_#, for PPA, ETO, purchasing sophistication and action research, respectively.
A
S
IS
D
B
Action research findings
147
A concluding paragraph illustrates each of the workshops’ positioning of the components in the
Kraljic matrix. In the proceeding subsection, a presentation of today’s purchasing practice
towards suppliers is presented. This is followed by a subsection describing the problem holders’
and researchers’ evaluation of the use of the Kraljic matrix.
7.3.1 The positioning process
As described in the methodology chapter (2.3.4), we used an action research protocol when
conducting the workshops with Fugro. This protocol functioned as a game plan, in that it was
used to structure the workshops. We were, however, conscious in allowing discussions to follow
a “natural flow”, in order to prevent the risk of missing out on valuable information. As
described in the protocol (A.2), after introducing ourselves, we presented the Kraljic matrix
together with its intention, dimensions and an example of its use with a fairly known product;
ballpoint pens. The problem holders were then challenged to discuss and place the
aforementioned components in the Kraljic matrix.
Positioning the anchorage system
The first component to be addressed was the anchorage system. In the first workshop, Purchaser
A initiated the process by, more or less systematically, addressing the underlying measures of the
model’s dimension26. He first evaluated the cost of the anchorage system, arguing that it
constitutes a relatively low share of a buoy’s total costs. With respect to product quality, he
argued that “the anchorage system is necessary in order to keep the buoy from drifting; if we sell
a buoy, an anchorage system is a prerequisite”. Purchaser A then deviated from the measures,
and started evaluating to what degree Fugro can reap profits from the component, referring to
the corresponding profit impact dimension itself: “We cannot put a high price on it (the
anchorage system), because it consists of components that are available all over the world. The
customer can check the costs of 1000 meters of rope, shackles and stuff like that; relatively
simple, verifiable components. We cannot make a profit on the anchorage system”. Based on
this unexpected turn, we make the following observation:
PPA_Observation_1 It is not clear whether one should only evaluate the underlying measures of the model’s dimension, or whether the dimension itself can be utilized as a measure.
Purchaser A then proceeded to evaluate the supply risk measures. First, he stated that there are
many available suppliers for the anchorage system. He then explained that they are currently
using one supplier; “however, we can use many suppliers of anchorage systems; we can easily
change to other suppliers”. Purchaser A did, however, not continue with the evaluation of the
supply risk measures on his own. As such, we saw it necessary to follow up by asking questions
related to the measures. We make the following observation:
26 The matrix, with its dimensions and underlying measures, was displayed at a screen during the entire process. For the measures, the reader is referred to appendix A.2 (action research protocol).
Action research findings
148
AR_Observation_1 The participants of the workshops tend to hesitate, and await guidance from the researchers.
First, we asked if the systems are purchased to stock. Purchaser A replied that “today, we
purchase close to nothing to stock, we order for each contract”. Further, we wanted to know the
supplier’s role, in order to evaluate the make-or-buy measure of supply risk. Purchaser A
explained that Fugro design the anchorage system, whereas the production itself is outsourced.
The current supplier used to supply components earlier, when Fugro used to make the
anchorage system themselves. Fugro still have capabilities to do so; however, from a cost
perspective, they have found it more lucrative to outsource the production. According to
Purchaser A, “we have assessed the situation, and found that due to space required for ropes
and such, it is better that our supplier keeps stock for us and produces anchorage systems to
order. That is what is happening today”. As such, Purchaser A also addressed the risk of keeping
stock, which is a measure underlying the supply risk dimension.
At this moment in the process, we noticed that purchaser B was quiet and did not participate
actively in the discussion. When asked if he had anything to add, he replied that “for the
anchorage system, I have nothing to add”, and was eager to proceed to the inertial sensor. We
knew, based on the case study of Fugro conducted fall 2011, that purchasing responsibility is
divided between three purchasers. Purchaser B is responsible for purchasing electrical
equipment. As such, he did seemingly not consider himself to be capable of providing valuable
input in the anchorage system discussion. We make the following observation:
PPA_Observation_2 Portfolio analysis participants may be passive (for whatever reason) when components that are not “their responsibility” are evaluated.
In order to reach a conclusion, we asked the purchasers to position the anchorage system in the
Kraljic matrix. They then became hesitant; as such, we saw the need to recapitulate their
answers, and propose that the profit impact and supply risk scores, in summary, were low and
low, respectively. Purchaser A nodded his assent, whereas purchaser B remained silent.
Consequently, the anchorage system was positioned in the noncritical quadrant of the Kraljic
matrix. Again, we see that AR_Observation_1 applies, in that the researchers had to lead the
discussion.
In the second workshop, SM1 started by explaining that the anchorage system is engineered by
Fugro based on input from the customer, and is then ordered from the supplier. Fugro use
tailored software to calculate specifications according to waves, depths and current conditions in
each buoy’s area of operation. As such, many factors determine the resulting anchorage system.
SM1 explained that the procedure is that he receives characteristics of the buoy’s area of the
operation, which is forwarded to E1, who designs the anchorage system. This design is then sent
to Purchaser A, who provides the supplier of the system with the specifications. Again, we saw
Action research findings
149
the need to guide the discussion towards the measures constituting the dimensions of the model.
This may bear resemblance to our first AR observation; however, it somewhat deviates in that
the participants are derailing instead of hesitating. We make the following observation:
AR_Observation_2 The participants of the workshops tend to deviate from the positioning process, and discuss other aspects than the positioning of the component.
To continue the process, we then asked how they evaluate suppliers in the specification process.
They confirmed what Purchaser A previously stated; they use one supplier that produces
according to the specifications provided by Fugro. We proceeded by asking if it would be easy
to change from the current supplier to a new supplier, referring to the possibility for
substitution, which is a measure of the supply risk dimension. E1 argued that “It is not just a
piece of cake, because they deliver an assembled system. Earlier, we bought only ropes and
assembled the system ourselves. Then we could approach several suppliers. Now, work practices
are important for the anchorage system. It is not that many suppliers who can do this. A lot
depends on the person that is doing the job”. We make the following observation:
ETO_Observation_1 The suppliers’ work practices limit the number of available suppliers, due to their effect on the product quality.
With respect to the evaluation of available suppliers, SM1 made an interesting statement: “I
immediately thought of this as noncritical, but it is more critical if you talk about changing
supplier”. We make the following observation:
PPA_Observation_3 Users may end up discarding initial thoughts when evaluating aspects not considered previously.
SM1 and E1 then evaluated the anchorage system’s share of total product cost. SM1 estimated
that it corresponds to about 10 % of the buoy’s total costs. According to E1, “it depends, you
know. Sometimes we deliver 300 meters, in, for example, India we deliver 5000 meters”. We
make the following observation:
ETO_Observation_2 Components that are made specifically to order may vary in price, and, as such, profit impact.
Thereafter, SM1 was quick to position the anchorage system in the bottleneck quadrant. We
explained the bottleneck quadrant to check if he was certain about this choice, whereupon he
confirmed his positioning. In line with PPA_Observation_3, we proceeded to steer the
discussion to the measures of the supply risk dimension, to see if a more thorough evaluation
Action research findings
150
would lead to yet another positioning. As such, we asked the participants if they felt that they
have a good overview of available suppliers. Both SM1 and E1 felt that Fugro are aware of
available suppliers. This did not alter the participants’ evaluation of the anchorage system, which
in the second workshop ended up in the bottleneck quadrant. This concludes the positioning of
the first component. In the next paragraph, the inertial sensor is subject for investigation.
Positioning the inertial sensor
When positioning the inertial sensor in the first workshop, one challenge immediately appeared.
There seemed to be discrepancy related to the term “inertial sensor”; Purchaser B questioned
whether the inertial sensor was “the axiometers that is placed…?” whereas Purchaser A made a
follow-up by saying “the wave sensor, for certain”. After a brief discussion, we came to the
conclusion that an inertial sensor consists of a circuit board with three axiometers, and that the
combination of an inertial sensor and a data logger is typically referred to as a “wave sensor”.
According to Purchaser B, the axiometers are off-the-shelf products that are purchased in
relatively large quanta, immediately indicating a somewhat high profit impact. With reference to
the wave sensor unit, Purchaser B evaluated the profit Fugro can reap from it, at an early stage
of the discussion: “We can reap a large profit from it, because the wave sensor is designed for
our purpose, focusing on low power consumption”. As such, we see that PPA_Observation_1,
as made in the positioning of the anchorage system, applies.
In order to further investigate the supply risk dimension, we proceeded by asking about the
suppliers of inertial sensors. According to Purchaser B, there are quite a few suppliers of the
circuit board, which is designed by Fugro. Referring to the availability measure of the supply risk
dimension, he further added that several of these are possible to use. There are fewer suppliers
of the axiometers, due to strict specifications set by Fugro; consequently, there are more
available suppliers if one were to lower the specifications. We then wanted to know about the
cost of the inertial sensor, and its effect on product quality, referring to the profit impact
dimension. Purchaser B replied that it is relatively cheap, and that it is not very critical; “if the
sensor fails, the data logger will still work, and other measurements will still be made”. Purchaser
A added that if you are to measure waves, it is important. When asked if the inertial sensor is a
competitive edge, Purchaser B replied that it is. We recognize a pattern of us driving the
discussion forward, which corresponds with AR_Observation_1.
We further asked about the ease of changing suppliers in order to further investigate the supply
risk of the component. Purchaser A stated that one would have to adapt quite a bit in order to
use axiometers from other suppliers; “it is critical if they stop producing a sensor, it takes time to
adapt a new type of sensor. It is not straightforward to change supplier, it would be like buying
coarse-grained flour to make wholemeal bread”. Purchaser B agreed, stating that they would
have to adapt with respect to both hardware and software. We make the following observation:
ETO_Observation_3 Some sourced components are considerably integrated in the final product; consequently, the transaction cost of changing components or suppliers may be high.
Action research findings
151
Next, we asked where in the matrix the inertial sensor would fit. Purchaser B again argued that
that it scores high on the profit dimension, because it is specially made for Fugro; enabling a
higher profit than what is the case for the anchorage system. Again, Purchaser B evaluated the
dimension itself, corresponding to PPA_Observation_1. He continued by repeating that there
are quite a few suppliers of the circuit board, whereas there are fewer available suppliers for the
axiometers. He did not position the inertial sensor after making these arguments; however,
based on these answers, we suspected that the inertial sensor could be placed in the leverage
quadrant. In order to challenge AR_Observation_1, we did not want to reveal our suspicion
about the positioning, but rather challenge this implicit conclusion.
Consequently, we asked about what a buoy typically costs. According to Purchaser B, it depends
on what it is equipped with, but provided a typical price range. We then asked how much the
inertial sensor costs; whereupon Purchaser B gave an answer considerably lower than the buoy
price. We then confronted the purchaser, implying that if this is doubled, the inertial sensor still
has a small impact on total product cost. Purchaser B then provided the margins reap from the
component27. We observe that PPA_Observation_1 yet again applies, in that Purchaser B
evaluated the dimension itself, rather than its measures. Purchaser B did, nonetheless, add that
“for the entire system, it is a small cost”. As such, he moderated himself with respect to the
profit impact, and lowered the profit impact of the inertial sensor. We observe that
PPA_Observation_3 applies.
We then asked explicitly about the supply risk, and recapitulated previously stated arguments.
Purchaser B made the following comment: “As I said, the inertial sensor consists of several
boards (circuit board with axiometers). For one of the boards (the circuit board), there are many
suppliers; for the other boards (axiometers), there are fewer suppliers. So…” We make the
following observation:
PPA_Observation_4 Complex product structures make the positioning of components difficult.
We proceeded to investigate the supply risk by asking whether they do have alternative choices
of suppliers, whereupon Purchaser B confirmed that “yes, we have choices”. We also asked if
they purchase to stock, and Purchaser B replied that “yes, we have some in stock; there is no
risk associated with that”. We saw that we would end up in the same quadrant as for the
anchorage system, and asked the purchasers whether or not they agreed. Purchaser B replied
“yes”. We conclude that the first workshop positioned the inertial sensor in the noncritical
quadrant, and make the following observation:
AR_Observation_3 The researchers have great influence on the problem holders; the problem holders tend to reply confirmatory to leading questions.
27 The details of this discussion are left out due to the sensitive nature of the information.
Action research findings
152
In the second workshop, there was also discrepancy with respect to the inertial sensor. Somehow,
the discussion did not solely focus on the inertial sensor, but also on the wave sensor. From
there, it derailed to a discussion about the data logger. This is further described below.
First, we initiated an evaluation of the supply risk by asking about the availability of axiometers,
i.e. if they are readily accessible. According to E1, “there are very few who match the
specifications set by Fugro. As such, it is critical”. SM1 added that they are dependent on low
power consumption, as the buoy is powered by batteries. According to E1, they purchase large
quantities to stock, and buy 3-400 units if they hear that the components are to be phased out of
production. This is done, according to SM1, because the wave sensor has to be redesigned if the
components in it change, in order to deliver according to the specifications promised to the
customer. This is in accordance with ETO_Observation_3 made in the first workshop.
There was still uncertainty about what the participants regarded as the inertial sensor; as such,
we wanted to clarify this before attempting to position the component. We therefore asked
about which components constitute a wave sensor. SM1 answered that “the wave sensor is a
combination of the data logger and a board that constitutes the wave sensor. The wave sensor is
a circuit board. If you buy a data logger, you remove the wave sensor (board). The wave sensor
runs via the data logger, it is assembled in the same chassis”. E1 clarified this, and provided the
following relationship: “Inertial sensor plus data logger equals wave sensor”. We proceeded to
ask where it fitted in the model. SM1 immediately stated that he was not comfortable with the
leverage quadrant, and that “our data logger is what the concept is built around. So, it is at least
strategic”. E1 confirmed that it is one of the “core systems”. We see that not only did SM1
position the product without considering the dimensions or the dimensions’ measures; he also
positioned another product than what was being analyzed. We make the following observations:
PPA_Observation_5 The names of the quadrants in the model may lead to predisposition with respect to positioning, omitting the dimensions and their measures.
PPA_Observation_6 Complex product structures may make the discussion derail from the actual component in analysis.
The discussion that followed concerned the data logger; hence, this is postponed to the
paragraph where we describe the positioning of this component. As such, the participants in the
second workshop never explicitly positioned the inertial sensor. Based on our observation, we
feel, nonetheless, that we have a fairly good basis for positioning the component in the model.
We assume that their assessment of profit impact would correspond to the purchasers’
assessment. However, we argue that given their supply risk assessment, the participants in the
second workshop regard the component as a bottleneck item. We feel that this assumption is
Action research findings
153
legit by virtue of the problem solving interest of action research (2.3.3). In the next paragraph,
the positioning of the shell is described.
Positioning the shell
In the first workshop, Purchaser A started the process by providing a thorough description of
today’s practice concerning the shell. This revealed that they are currently using one supplier, of
which he had extensive knowledge. This supplier keeps a certain stock for Fugro. He then
evaluated the impact on total cost, stating that the shell does not constitute a large share. In
order to measure the competitive demand of the component, we asked whether the supplier has
many customers buying these shells, or if Fugro is the supplier’s only customer of these
products. Purchaser A then confirmed the latter.
In order to assess the possibilities for substitution, we challenged Purchaser A to consider what
the alternatives were, if they were to lose their single supplier. Even though Fugro own the
unique casting molds used to make the shells, it is not easy for them to change suppliers;
Purchaser A stated that “we need to go to England for a new supplier”. However, the company
was in a process of assessing whether this supplier in England was capable of being an
alternative supplier. Purchaser B stated that this supplier needs to prove that it is able to produce
the components according to the requirements stipulated by Fugro. We see that
ETO_Observation_1 applies.
In order to reach a conclusion, we had to encourage the purchasers to place the shell
component in the matrix; corresponding to AR_Observation_1. In an attempt to evaluate
supply risk, Purchaser B stated that there were risks associated with the product; however, he
did not place the product. We then proposed that the shell component may be classified as a
bottleneck product, in which the purchasers agreed. This is in line with AR_Observation_3. In
addition, Purchaser B did not actively participate in positioning this sourced product; as such,
this reinforces PPA_Observation_2. Purchaser A added that their supplier claims to be the best
in the world on the required rotational casting process, indicating a high supply risk.
In the second workshop, E1 demonstrated that he possessed detailed knowledge of the sourcing
practice of this component. However, in contrast to the previous workshop, E1 emphasized, on
his own initiative, the cumbersome task of changing supplier; “It takes half a year to go from
prototype to series production; it is not done in the blink of an eye”. SM1 stated that this
development process goes through several iterations, each with a new prototype of the shell. E1
repeated that there is some risk associated with changing supplier. In comparing the two
workshops, it is apparent that engineering may be more conscious with respect to the
transaction cost associated with a change of supplier. We make the following observation:
PPA_Observation_7 Portfolio analysis participants from non-purchasing functions provide valuable information, not only in placing the sourced component, but also concerning the transaction cost of changing today’s practice.
Action research findings
154
The discussion somehow derailed towards lead time of the shell component. This then evolved
into a discussion on cross-functional collaboration. SM1 stated that they have a lot of contact
with the engineering department, as they need their consultation in order to derive the time of
delivery of the final product. E1 added that this collaboration depends on which type of buoy
they are to deliver; special sensors entail more interaction. In addition, E1 explained that “we
work closely because we are close”. Hence, we make the following observation:
ETO_Observation_4 Co-location of functions at the same premises enables face-to-face interaction, which may compensate for the need for cross-functional integration.
SM1 proceeded by explaining the nature of this interaction when writing a tender: Marketing
and sales use a software program when they write a tender; however, it does not function as
intended. This forces them to interact with the engineering department. SM1 proceeded by
stating that “the ideal for us is to have less to do with each other, and rather have engineering
provide updated information in the software, which we then could extract”. We make the
following observation:
ETO_Observation_5 There seems to be little appreciation for the benefits of cross-functional coordination; if employed software works as intended, this coordination would not be necessary.
We found this interesting, and asked to which extent a lack of technical insight was a problem
for sales and marketing personnel. E1 replied that “they do not have the same technical insight;
however, this has never been a problem”. SM1 proceeded by stating that they have become
better at checking with other departments before making any promises to the customer.
Nonetheless, SM1 further stated that “we sometimes discuss ‘why we have done this again? – we
knew that this was a poor solution’”. According to SM1, this has usually happened when
marketing and sales did not have sufficient time to contact the other departments. We make the
following observation:
ETO_Observation_6 Lack of cross-functional coordination may lead to poor performance when promises are made to customers.
Further, E1 argued that since they are a small company, they do not have dedicated purchase-,
engineering- or sales personnel; one often works in two departments at once. E1 added that
several workers at Fugro have worked within more than one department. As such, they possess
knowledge beyond what is their daily responsibility. We make the following observation:
Action research findings
155
ETO_Observation_7 For a small company, the facets between the different departments (such as purchasing and engineering) may be vague, and one often finds oneself working for several functions at once. As such, an employee may possess thorough knowledge of several functions.
We then urged the participants to position the component. SM1 stated that the component has
a low supply risk, as it the supplier is well known and stable. E1 added that the product had a
low profit impact, as it had a low share of total cost. Further, unlike SM1, E1 repeated that there
is supply risk associated with the possibility of losing their single supplier, and argued that it
would take a long time before Fugro could deliver buoys if they were to change supplier. This
argumentation, made SM1 change his initial assessment of the components supply risk, and
argued that it should be placed somewhere between the non-critical and bottleneck quadrant,
with an emphasis on the latter. We make the following observation:
PPA_Observation_8 An initial evaluation of the dimension alone may be substantially altered as one considers its underlying measures.
Positioning the data logger
In the first workshop, Purchaser B initiated the process by explaining that the data logger
constitutes just a fraction of the total product cost; however, it is a very important component.
It is the brain of the buoy, as it gathers data and transfers it to shore. He further elaborated that
there are several available suppliers for production of the data logger, which is designed by
Fugro. They are currently using one local supplier, and are aware of two other local suppliers
that can to the same job. As such, he evaluated the supply risk as low.
Purchaser B proceeded to explain that they order quite a few units at a time; “there is no risk in
doing this, because every buoy contains a data logger. In addition, there is demand for spare
parts”. We then asked how easy it would be to change supplier, whereupon Purchaser B
answered that “we can change supplier tomorrow if we want to”. We followed up on this
statement, and asked how long it would take for a new supplier to be put into effect, and
whether a supplier must possess a certain competence. This was done in order to challenge
PPA_Observation_8, and to achieve better comprehension of the supply risk. According to the
purchasers, the suppliers are familiar with the required type of production, and the only time
needed is the lead times for the circuit boards; approximately eight to ten weeks. We then had a
follow-up question, asking if there are any specific components in the data logger that could be
difficult for a new supplier to obtain. According to Purchaser B, this is not a problem, as the
component solely consists of standard components. The only recent problem with respect to
supply was caused by the tsunami in Japan, which destroyed electronics factories. As such, we
see that PPA_Observation_8 does not apply here.
In order to facilitate the discussion towards a conclusion, we asked where the data logger would
fit in the matrix. According to Purchaser B, “it is a small share in terms of costs, but we can reap
Action research findings
156
large profits from the unit. But in the whole, it drowns…” Again, we see that Purchaser B refers
to the profit impact itself, instead of the dimension’s measures. This corresponds to
PPA_Observation_1.
The process then, in line with AR_Observation_2, deviated slightly, in that the purchasers
described the supplier’s production process, and explained how the data logger is stacked
together with the earlier treated inertial sensor. As such, we saw the need to intervene by asking
a series of questions related to various measures of the dimensions. These revealed that the data
logger is purchased in relatively large quanta when it is purchased. It constitutes a small amount
of the buoy’s total cost; however, it has high influence on product quality. There are several
available suppliers and there is no risk in keeping stock. Hence, the purchasers positioned the
data logger in the leverage quadrant.
As mentioned previously, the second workshop’s evaluation of the data logger followed from the
discussion of the inertial sensor. According to SM1, the data logger is expensive, and they do not
want to keep large stock. We then asked how many suppliers there are. E1 responded that they
buy sensors everywhere, and integrate these themselves. As he was not answering the question,
we explicitly asked them to evaluate the dimensions’ measures, trying to avoid the tendency
observed in AR_Observation_2. SM1 then replied that there is high supply risk due to few
available suppliers and a high cost of keeping a large stock. According to E1, the profit impact is
high due to the cost of the data logger component and its high impact on quality. Consequently,
the second workshop positioned the data logger in the strategic quadrant.
Positioning the battery pack
The last component to be placed in the workshops was the buoy’s battery pack. In the first
workshop, Purchaser A initiated the process by giving a description of today’s purchasing practice
for this component. He further explained that the battery pack is identical for two of Fugro’s
products. As such, there is no risk in keeping stock; implying a low supply risk. The discussion
further revealed that the battery pack may actually consist of both lead and lithium batteries,
depending on the buoy’s area of operation. According to Purchaser A, there are several suppliers
of lead batteries; however, the lithium batteries are designed especially for Fugro by a supplier in
France.
After providing a thorough description of the company’s current purchasing practice towards
their supplier of both lithium and lead batteries, we felt that we had to facilitate the conversation
towards placing the battery pack in the purchasing portfolio matrix. This was done by asking the
purchasers about several of the measures determining profit impact and supply risk. In addition,
we had to summarize their arguments and provide suggestions to an overall placement along
each dimension. In doing this, we saw that both AR_Observation_1 and AR_Observation_3
were prevalent, in that the participants awaited guidance and replied confirmatory.
Both purchasers agreed that the lithium batteries were a strategic item. Purchaser A stated that
the battery package is not a complex unit; “the technology is known, however, safety is
important when souring batteries, as it is very risky to neglect”. He further explained that the
required level of quality determined which battery cell to use, and that the factory in France was
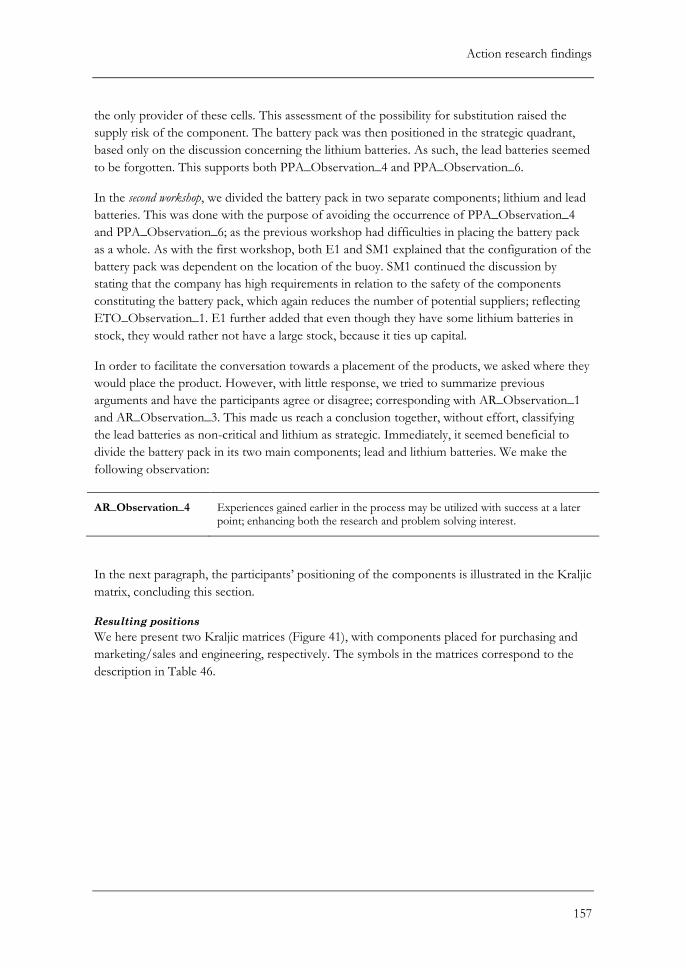
Action research findings
157
the only provider of these cells. This assessment of the possibility for substitution raised the
supply risk of the component. The battery pack was then positioned in the strategic quadrant,
based only on the discussion concerning the lithium batteries. As such, the lead batteries seemed
to be forgotten. This supports both PPA_Observation_4 and PPA_Observation_6.
In the second workshop, we divided the battery pack in two separate components; lithium and lead
batteries. This was done with the purpose of avoiding the occurrence of PPA_Observation_4
and PPA_Observation_6; as the previous workshop had difficulties in placing the battery pack
as a whole. As with the first workshop, both E1 and SM1 explained that the configuration of the
battery pack was dependent on the location of the buoy. SM1 continued the discussion by
stating that the company has high requirements in relation to the safety of the components
constituting the battery pack, which again reduces the number of potential suppliers; reflecting
ETO_Observation_1. E1 further added that even though they have some lithium batteries in
stock, they would rather not have a large stock, because it ties up capital.
In order to facilitate the conversation towards a placement of the products, we asked where they
would place the product. However, with little response, we tried to summarize previous
arguments and have the participants agree or disagree; corresponding with AR_Observation_1
and AR_Observation_3. This made us reach a conclusion together, without effort, classifying
the lead batteries as non-critical and lithium as strategic. Immediately, it seemed beneficial to
divide the battery pack in its two main components; lead and lithium batteries. We make the
following observation:
AR_Observation_4 Experiences gained earlier in the process may be utilized with success at a later point; enhancing both the research and problem solving interest.
In the next paragraph, the participants’ positioning of the components is illustrated in the Kraljic
matrix, concluding this section.
Resulting positions
We here present two Kraljic matrices (Figure 41), with components placed for purchasing and
marketing/sales and engineering, respectively. The symbols in the matrices correspond to the
description in Table 46.
Action research findings
158
Figure 41: Kraljic matrices with positioning of components
With respect to Figure 41, we see that the two workshops have positioned the products
differently. Based on the illustration, we will now make some immediate considerations. First, it
is worth mentioning that the workshops’ evaluation of the profit impact are more or less
identical, whereas sales/marketing and engineering evaluate the risk to be higher than what was
evaluated by the purchasers. As such, perceptions of supply risk cause the differences in Figure
41. Second, the shell and battery pack are the only components that ended up in the same
quadrants. For the other components, there is no consensus; this may imply that a discussion
with several functions gathered could reveal important aspects. Finally, we see that the second
workshop did not position any components in the leverage quadrant. This may be caused both
by a consequent higher risk evaluation and a predisposition concerning the leverage quadrant
(which provided a basis for PPA_Observation_5).
Next, we provide an overview of today’s practice towards suppliers.
7.3.2 Today’s practice
After placing the components in the Kraljic’s matrix, the intention was to have the workshop
participants provide a description of today’s sourcing practice. However, during the process of
positioning the investigated components, this information emerged as an obvious consequence
of the discussion. As such, we asked only about certain elements that were still unclear. This was
done with the intention of enabling a comparison of this practice with strategies recommended
from purchasing portfolio approaches. Today’s sourcing practices with respect to the
components in question are summarized in Table 47 below.
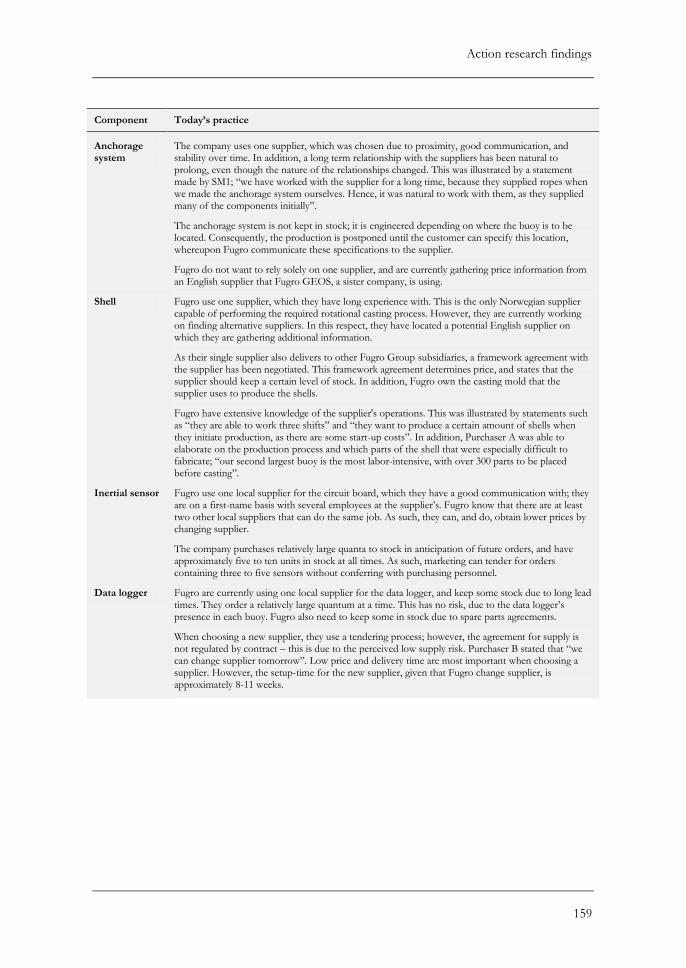
Action research findings
159
Component Today’s practice
Anchorage system
The company uses one supplier, which was chosen due to proximity, good communication, and stability over time. In addition, a long term relationship with the suppliers has been natural to prolong, even though the nature of the relationships changed. This was illustrated by a statement made by SM1; “we have worked with the supplier for a long time, because they supplied ropes when we made the anchorage system ourselves. Hence, it was natural to work with them, as they supplied many of the components initially”.
The anchorage system is not kept in stock; it is engineered depending on where the buoy is to be located. Consequently, the production is postponed until the customer can specify this location, whereupon Fugro communicate these specifications to the supplier.
Fugro do not want to rely solely on one supplier, and are currently gathering price information from an English supplier that Fugro GEOS, a sister company, is using.
Shell Fugro use one supplier, which they have long experience with. This is the only Norwegian supplier capable of performing the required rotational casting process. However, they are currently working on finding alternative suppliers. In this respect, they have located a potential English supplier on which they are gathering additional information.
As their single supplier also delivers to other Fugro Group subsidiaries, a framework agreement with the supplier has been negotiated. This framework agreement determines price, and states that the supplier should keep a certain level of stock. In addition, Fugro own the casting mold that the supplier uses to produce the shells.
Fugro have extensive knowledge of the supplier's operations. This was illustrated by statements such as “they are able to work three shifts” and “they want to produce a certain amount of shells when they initiate production, as there are some start-up costs”. In addition, Purchaser A was able to elaborate on the production process and which parts of the shell that were especially difficult to fabricate; “our second largest buoy is the most labor-intensive, with over 300 parts to be placed before casting”.
Inertial sensor Fugro use one local supplier for the circuit board, which they have a good communication with; they are on a first-name basis with several employees at the supplier’s. Fugro know that there are at least two other local suppliers that can do the same job. As such, they can, and do, obtain lower prices by changing supplier.
The company purchases relatively large quanta to stock in anticipation of future orders, and have approximately five to ten units in stock at all times. As such, marketing can tender for orders containing three to five sensors without conferring with purchasing personnel.
Data logger Fugro are currently using one local supplier for the data logger, and keep some stock due to long lead times. They order a relatively large quantum at a time. This has no risk, due to the data logger’s presence in each buoy. Fugro also need to keep some in stock due to spare parts agreements.
When choosing a new supplier, they use a tendering process; however, the agreement for supply is not regulated by contract – this is due to the perceived low supply risk. Purchaser B stated that “we can change supplier tomorrow”. Low price and delivery time are most important when choosing a supplier. However, the setup-time for the new supplier, given that Fugro change supplier, is approximately 8-11 weeks.
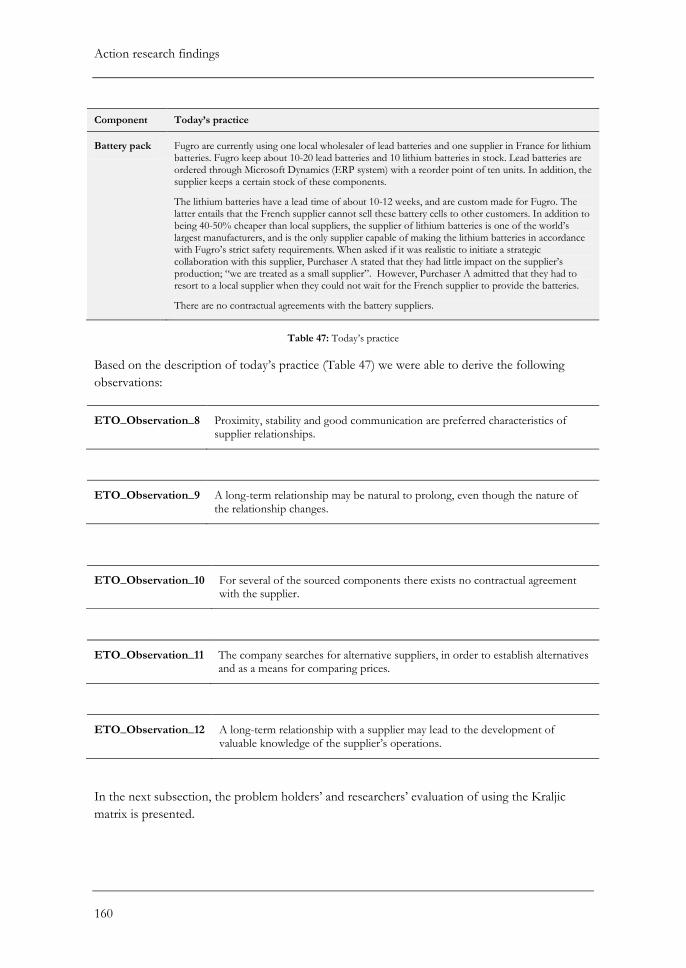
Action research findings
160
Component Today’s practice
Battery pack Fugro are currently using one local wholesaler of lead batteries and one supplier in France for lithium batteries. Fugro keep about 10-20 lead batteries and 10 lithium batteries in stock. Lead batteries are ordered through Microsoft Dynamics (ERP system) with a reorder point of ten units. In addition, the supplier keeps a certain stock of these components.
The lithium batteries have a lead time of about 10-12 weeks, and are custom made for Fugro. The latter entails that the French supplier cannot sell these battery cells to other customers. In addition to being 40-50% cheaper than local suppliers, the supplier of lithium batteries is one of the world’s largest manufacturers, and is the only supplier capable of making the lithium batteries in accordance with Fugro’s strict safety requirements. When asked if it was realistic to initiate a strategic collaboration with this supplier, Purchaser A stated that they had little impact on the supplier’s production; “we are treated as a small supplier”. However, Purchaser A admitted that they had to resort to a local supplier when they could not wait for the French supplier to provide the batteries.
There are no contractual agreements with the battery suppliers.
Table 47: Today’s practice
Based on the description of today’s practice (Table 47) we were able to derive the following
observations:
ETO_Observation_8 Proximity, stability and good communication are preferred characteristics of supplier relationships.
ETO_Observation_9 A long-term relationship may be natural to prolong, even though the nature of the relationship changes.
ETO_Observation_11 The company searches for alternative suppliers, in order to establish alternatives and as a means for comparing prices.
ETO_Observation_12 A long-term relationship with a supplier may lead to the development of valuable knowledge of the supplier’s operations.
In the next subsection, the problem holders’ and researchers’ evaluation of using the Kraljic
matrix is presented.
ETO_Observation_10 For several of the sourced components there exists no contractual agreement with the supplier.
Action research findings
161
7.3.3 Evaluation of applying the Kraljic matrix
As described in the action research protocol (A.2), we asked the workshop participants to
evaluate the application of the Kraljic matrix prior to the positioning process. We first present
the participants’ evaluation of the process, before continuing to our own evaluation of the
process.
The problem holders’ evaluation
In the first workshop, we asked the purchasers if they found it beneficial to evaluate components
using such a framework, or if it concerned matters that they are already aware of. Purchaser A
replied that they generally have a good overview; “however, we learn a lot”. He stated that it is
valuable to get input, and found it informative. He acknowledged that they are doing many
things right; “we see that what we are doing, people have thought of before”. Purchaser B added
that “when we have audit, we are reminded by the auditor that there are alternatives; to not lock
with one supplier and things like that”.
We further stated that there is a latent risk in shopping around without having contract
agreements with suppliers, referring to ETO_Observation_10. We argued that when they
choose to shop around, they lose some of the commitment the suppliers may have had if
contractual agreements were in place. As such, the suppliers may be as opportunistic as Fugro
are today, cf. ETO_Observation_11, when they get orders from other customers. We added that
their small size would not benefit them in such a situation. Purchaser B acknowledged this; “we
are very small, really”. We emphasized that these are things one have to consider; which
suppliers to commit to, length of the relationship, and so on. Purchaser B replied that “it is a lot
to think about”. We added that when you are familiar with the supplier, and are on good terms
with him, you would possibly have an advantage over other customers. As such, it may be wise
to weigh the pros and cons, and not necessarily choose the cheapest there and then, but think
ahead. According to Purchaser A, this coincides with their thinking. It should be mentioned that
this was not meant as critique of the problem holder; we were merely giving food for thought
with the best intentions – coinciding with the problem solving interest of the action research
(2.3.3).
In the second workshop, we began the evaluation in a similar manner as we did in the first
workshop. It became apparent that the feasibility of purchasing portfolio approaches was
questioned, as the problem holders had varying experience with implementing practice proposed
by academics. According to SM1, “we have seen many models through for instance lean, but it
is hard for us to adopt such a system, as many of the systems are made for companies with big
production lines with high volumes. We do not have that, and as such, the models tend to be
redundant. We have used 5S28. We have implemented some phases. We cannot implement and
use everything”. As such, the feasibility and relevance of purchasing portfolio approaches were
questioned. We make the following observation:
28 5S is a lean manufacturing technique, and refers to Shine, Sort, Straighten, Standardize and Sustain.
Action research findings
162
PS_Observation_1 Participants have predispositions regarding models proposed by academics; they do not fit their unique production situation (e.g. having low production volumes).
The researchers’ evaluation
After having both workshops use the Kraljic matrix, we discovered that some measures
underlying the two dimensions in the model were seldom used, whereas others were used more
often. Especially, impact on business growth was ignored by the workshop participants; it was
not evaluated once during both sessions. Hence we make the following observation.
PPA_Observation_9 Impact on business growth was never used to evaluate the profit impact of a product.
Further, we discovered that the measure of supply risk concerning the possibilities for make-or-
buy was not evaluated, unless we explicitly asked the participants about it (as in the first
workshop). Hence, we make the following observation.
PPA_Observation_10 Make or buy opportunities were not evaluated without being prompted.
In the next section, we apply an ETO adapted model in a similar manner as to what was
described in this section.
7.4 Applying the ETO adapted model
As described in the action research protocol (A.2), we wished to test and use the ETO adapted
purchasing portfolio model that was developed in the specialization project (1.1.6; Figure 7).
The use of this model is described in this section. First, we present the process of positioning
the selection of components (Table 46). As for the application of the Kraljic matrix,
observations made in the process are explicitly stated29. A concluding paragraph illustrates each
of the workshops’ positioning of the components in the ETO adapted model. This is followed
by a subsection describing the problem holders’ and researchers’ evaluation of the use of the
ETO adapted model.
7.4.1 The positioning process
As for the Kraljic matrix (7.3), we first presented the model and its two dimensions; relative power
and degree of customization. We explicitly stated that the goal of using this model was to elucidate
attributes of the components sourced, other than what the Kraljic matrix did, and not to provide
recommended strategies for each component. Having already mapped much of today’s
purchasing practice, the use of this model took substantially less time to test, as we already had
insight in the components’ characteristics and sourcing practice. In addition to the positioning
29 PPA_ETO_Observation_X is used for PPA findings solely related to the ETO adapted model.
Action research findings
163
of the components, we challenged the purchasers in the first workshop to think about what
would be an optimal way to approach their suppliers. They were selected for this challenge
because we suspected that they had the best overview of how to improve, if necessary, the
current situation. In addition, we believed that the purchasers would have the greatest benefit of
such a discussion, as this coincides with their responsibility in the company.
Positioning the anchorage system
In the first workshop, we started the discussion by proposing that the degree of customization is
high for the anchorage system, given that the anchorage system is individually engineered for
each buoy’s area of operation. Purchaser A responded that each buoy has its own customized
anchorage system; however, the subcomponents are standard products that you can buy
everywhere. We make the following observation:
PPA_ETO_Observation_1 Degree of customization is hard to measure; a component may be customized in the eyes of the customer, even though subcomponents are standard products.
We proceeded to ask about the suppliers, referring to the relative power dimension. According
to Purchaser A, there are many suppliers, and “it is probably the buyer who has the power”. He
then moderated his statement, and acknowledged that there are few suppliers who can deliver a
complete system. However, he argued that in a worst case scenario, they can purchase the
components and make the anchorage system themselves. We made a follow-up question by
asking how important Fugro are for the current supplier. Purchaser A replied that “When I see
how much we are buying for… They say that we are an important customer, and we have to
believe their word”. Purchaser A continued by stating how much they purchase for from the
respective supplier. Based on this, we proposed that the anchorage system may be positioned in
the top-left quadrant; being a customized component where the buyer has a higher relative
power over the supplier. The purchasers nodded in consent. We see that AR_Observation_3
applies, in that the participants replied confirmatory to this leading question.
As mentioned at the beginning of this subsection, we asked about what would be an optimal
practice for the anchorage system. Purchaser A replied that they are continuously trying to locate
several suppliers for each component, as they do not want to rely solely on one supplier; “it has
been a focus of attention since we joined the MARGIN project. We are working on it all the
time”. In the discussion of the anchorage system, we saw that PPA_Observation_2 applied;
Purchaser B remained silent, as was also observed in the positioning of this component in the
Kraljic matrix (7.3.1).
In the second workshop, SM1 immediately stated that the anchorage system is customized,
whereupon E1 agreed. As this corresponded with our impression of the component, we were
able to swiftly direct the discussion towards the relative power dimension. We asked about the
relationship to the supplier that is currently used. According to E1, they are able to achieve
lower prices on ropes, but not on the complete anchorage system. We made a follow-up
Action research findings
164
question by asking what the practice is today. E1 replied that they buy the entire system. SM1
then stated that “the anchorage system ends up in the middle of buyer and supplier dominated”.
We wanted to challenge this somehow sudden positioning, and asked whether they are a large
customer to the supplier. According to E1, they are not; the supplier is also supplying the much
larger offshore and aquaculture industries. In trying to reveal how this affects Fugro, we asked if
they are sometimes pushed back in line. SM1 answered that they probably are, based on some
delay problems they have experienced. From this, we make the following observation:
ETO_Observation_13 Being a small customer may cause lower priority from the supplier (e.g., your orders may be pushed back in line due to larger orders from more important customers).
E1 added that even though they are a small customer, they have used them for 20 years;
Purchaser A does, according to SM1, know them personally. E1 added that “if it is too bad, we
can just make a phone call and straighten them up”. SM1 and E1 thereafter positioned the
anchorage system as customized, in the middle of the relative power dimension. SM1 then made
a concluding remark, in that “we are not important for the supplier, but we have a say. We are
treated seriously when we come with small orders, because they know that we are capable of
purchasing large quanta”. Hence, we make the following observation:
ETO_Observation_14 Long-term relationships may increase the priority from the supplier.
Positioning the inertial sensor
In the first workshop, we initiated the process by asking whether the inertial sensor is customized
or standardized. Purchaser B answered that there is a low degree of customization; the inertial
sensor itself is standardized. Next, we asked if they can easily change a supplier, and if it is many
available suppliers to choose from. According to Purchaser B, there are few. He then moderated
his answer slightly, and argued that there are some, but a change of supplier generates
development work with respect to both hardware and software. This is in line with what he
stated in the appliance of the Kraljic matrix (7.3.1). We then asked how important Fugro, as a
buyer, are for the suppliers, keeping in mind ETO_Observation_13 above. Purchaser B
reckoned that they probably are small. We followed up on this, by asking if this implies that
Fugro cannot pressure the supplier to lower the prices. According to Purchaser B, this is
possible if they buy large quanta. Purchaser A added that the suppliers are large, and supply
products to the military industry, to which Fugro are small in relation. We asked if this would
complicate the establishment of closer collaboration with the supplier, whereupon SM1 replied
that it would be difficult. We make the following observation:
ETO_Observation_15 Being a small company, it is difficult to initiate close (resource intensive) relationships with large suppliers.
Action research findings
165
As for the anchorage system, we asked what would be an optimal approach towards the
supplier; “would it be closer collaboration, or are things fine the way they are?” SM1 deviated
from the question, and answered that the supplier is calling all the time, wanting to sell more.
PS_Observation_2 The purchasers tend to deviate when being challenged to consider practice other than what they are doing today.
The component was positioned in the lower-right quadrant; standardized product with supplier
dominance. However, we saw that they in fact only positioned the circuit board of the inertial
sensor, discarding the axiometers. From this, we make the following observation:
PPA_Observation_11 Complex product structures may cause sub-components to be forgotten in the positioning of the component, leading other sub-components to constitute the positioned component.
In the second workshop, SM1 initiated the process by explaining that the inertial sensor is designed
and specified by Fugro, whereas its production is outsourced. E1 argued that “it is an off-the-
shelf product for us”, and continued to explain that the components come from USA, whereas
the production takes place locally in Norway. At this point, we were confused whether E1 was
talking about the components for the inertial sensor’s circuit board or the axiometers, and we
asked if he could explain briefly how the inertial sensor is assembled. E1 replied that the circuit
board comes from the local supplier, whereas mounting of axiometers (from USA) and
calibration take place at Fugro. Again we see that PPA_Observation_4 applies; complex product
structures complicate the positioning process.
In order to position the component in the model, we asked whether the circuit board is
customized or standardized. Both E1 and SM1 replied that the circuit board is customized in
that they make a Fugro specific circuit board; however, their production process for circuit
boards is standardized once the specifications are in place. According to SM1, “they make prints
to order, that is what they do. They do not keep off-the-shelf products; when we send an order,
they make the correct prints”. We make the following observation, in resemblance to
PPA_ETO_Observation_1 made earlier:
PPA_ETO_Observation_2 Degree of customization is hard to measure; a component may be customized in terms of being specified to the customer, and still have a standardized production process.
We then made a comment about their extensive knowledge of this production, whereupon E1
replied that “we have used the supplier for 15-20 years”. Referring to relative power, we then
asked if they can change supplier when they see it fit. According to E1, the supplier was chosen
by tender. S1 added that “I think that when we have a supplier, we usually stick with him. We
Action research findings
166
usually end up with a new round of negotiations only when we have changed the product”. E1
stated that the relationship is not bound by contract, but the current supplier “is still kind of a
main supplier”. SM1 then commented that the prices are relatively stable over a long period of
time. We make the following observation:
ETO_Observation_16 The company rarely considers changing supplier; negotiations are initiated due to major changes in the product.
We saw the need to reach a conclusion about the positioning, and encouraged the participants to
give it a try. In accordance with AR_Observation_1, the participants hesitated. As such, we
utilized AR_Observation_4 (learning by the earlier stages in the process) in trying to overcome
PPA_Observation_4 (complex product structures making the position difficult), and proposed
that the axiometers are off-the-shelf products from large suppliers situated abroad, where the
suppliers have power. Both E1 and SM1 agreed. We then proposed that the circuit board is
customized, with Fugro having the larger relative power. Again, we saw that the participants
answered confirmatory to leading questions, strengthening AR_Observation_3. Hence, the
axiometers and the circuit board were positioned in the down-right and upper-left quadrants,
respectively. In the next paragraph, the positioning of the data logger is described.
Positioning the data logger
In the first workshop, Purchaser B regarded the data logger to be standardized. He further stated
that there are several available suppliers, and emphasized that “here, we can push down the
prices”. Purchaser B, however, acknowledged that if a more important customer places an order,
Fugro are pushed back in line. This is in line with ETO_Observation_13 (achieving less
attention from the supplier due to being a small customer). Having ETO_Observation_14 (long
term relationships may increase the attention from the supplier) in mind, we further asked
whether the lead times increase if bigger customers than Fugro make an enquiry to the supplier.
According to Purchaser B, that may happen; however, “they ask us how many units we must
have. If we say that we must have a certain number of units, the supplier complies. They are
flexible, even though we do not have a contractual relationship”.
Given our understanding of the data logger as a Fugro specific product, we asked if the
components in it are standardized, whereas the data logger itself is customized. SM1 confirmed
that the components in it are standardized. We followed up by asking that “if you look at what is
delivered to you, is it customized? Tailored for your purpose?” SM1 answered “if you look at it
in that way, yes. For us, it is standard, but it is made for us”. We make the following
observation:
PPA_ETO_Observation_3 Degree of customization is hard to measure; a component may be standard in the eyes of the customer but customer specific in the eyes of the supplier.
Action research findings
167
We proceeded to ask if the purchasers could describe an optimal situation towards the supplier;
“is it just to make a phone call, or is it more lucrative to establish a contractual agreement?”
Purchaser B was not sure, and found it difficult to answer. He acknowledged that he may be
continuing in the same old rut, but he appreciates keeping the options open. Purchaser B
continued by stating that “I have worked here for some years, and I am on a first-name basis, so
there have not been any problems so far. But you never know; I see the point that was made”.
We finally proposed that the component could be positioned in the bottom-left quadrant of the
matrix, whereupon both Purchaser A and Purchaser B agreed. We see that AR_Observation_3
applies, and make the following observation:
PS_Observation_3 The purchasers seem to be satisfied with the way things are, as there have not been any problems so far.
In the second workshop, it was not paid much attention to the data logger. It was merely mentioned
at the end of the process of positioning the inertial sensor, as PPA_Observation_6 applied (the
discussion derailed from the inertial sensor due to a complex product structure). However, both
SM1 and E1 regarded the data logger to be Fugro specific. Further, E1 stated that “regarding the
data logger, it is not possible to purchase it from one supplier today and another tomorrow”.
Based on this brief evaluation, the second workshop positioned the data logger in the upper-
right quadrant. In the next paragraph, the positioning of the shell is described.
Positioning the shell
In the first workshop, we first asked whether the shell is a customized product. Purchaser A
answered that the supplier produces a product that belongs to Fugro; they are not selling the
exact product to anybody else. We then wanted to investigate the relative power balance, asking
if they are a small customer, or if they have bargaining power. Purchaser A responded that they
have the power, in that several Fugro subsidiaries are using the same supplier, and a framework
agreement therefore is put in place.
ETO_Observation_17 Buyer power is achieved through framework agreements, bundling volumes across subsidiaries.
Utilizing AR_Observation_4, we were further able to ask how this would be for the English
supplier that was mentioned in the appliance of the Kraljic matrix (7.3.1). According to
Purchaser A, they would probably come to an agreement, but not as good as the agreement with
the current supplier; “the sum of the Fugro subsidiaries in Norway causes us to achieve a good
agreement”. This did not alter the initial assessment of the component; consequently, it was
positioned in the upper-left quadrant.
We thereafter wanted to know what would be optimal by asking whether they are satisfied with
the current situation, or if they would prefer to have several suppliers. Purchaser A replied that
they are currently gathering prices from the English supplier; “it will be interesting to see the
Action research findings
168
price”. Again, we see that they are not answering the question; as such, PS_Observation_2
applies.
In the second workshop, E1 initiated the positioning process by stating that “it is our product, no
one else is allowed to purchase it”, referring to the degree of customization. We proceeded to
ask if they could characterize the relationship with the current supplier. E1 replied that Fugro
have used them in 15-20 years, and are satisfied with the supplier; “we have some minor
problems with delivery time, but it has mostly been alright”. In order to further clarify the
relative power, we then asked how it would be to change supplier. According to E1, a change of
supplier would probably take from 3-4 months. In order to investigate whether
ETO_Observation_16 applied (considering a change of supplier), we asked to which extent the
current supplier’s price is competitive. E1 replied that they have never compared the price with
any other suppliers; confirming our suspicion of ETO_Observation_16’s appliance.
When asked if they are a large customer to the supplier, E1 replied that they are one of the
supplier’s largest customers. We then implied that this gives Fugro a say towards the supplier.
E1 agreed; “they accept challenges, do not say ‘no’ and are willing to adapt to our requests”.
SM1 added that “it is one of few suppliers where we are a relatively important customer. We
represent a large share of their bottom line; we have purchased steadily over many years”. We
make the following observation:
ETO_Observation_18 Large purchasing volumes over time increase the attention given by the supplier.
We then proposed that, based on the information at hand, the shell could be positioned in the
top-left quadrant, whereupon the workshop participants agreed.
Positioning the battery pack
In the first workshop, we initiated the process by asking the workshop participants if the battery
pack is standard or custom made for Fugro, referring to the component’s degree of
customization. According to Purchaser A, they have acknowledged the benefits of standardizing
the battery packs to a large extent. However, Purchaser A added that the battery pack consists of
two very different components; lead batteries, which are readily available, and lithium batteries.
Purchaser B added that the latter type is “special”. Purchaser A then concluded that the battery
pack as a whole “is a mix of standard and ‘special’ products”.
In order to assess the relative power of the component, we asked the participants to specify the
degree of influence on the supplier. Purchaser A replied that they have been able to achieve a
relatively low price on the battery pack, because they know what it costs to produce such a
battery cell. However, he added that they have chosen a cell that can only be manufactured by
the currently used supplier. We see that PPA_Observation_11 applies, in that the participant is
clearly referring to the lithium battery when evaluating the whole component, omitting the lead
batteries. Purchaser A continued the evaluation of the relative power by stating that they achieve
Action research findings
169
bargaining power when they purchase larger quanta of batteries. We make the following
observation:
ETO_Observation_19 Bargaining power is achieved by purchasing larger volumes.
Aiming for a conclusion, we proposed that the battery pack may be positioned somewhere
between standardized and customized. The participants agreed, in accordance with
AR_Observation_3. Purchaser A then added that because they have selected the specific type of
lithium battery, it is hard to change supplier; referring to the relative power dimension.
Consequently, the battery pack was also positioned in the middle of this dimension. In
retrospect we realized that only the lithium battery was positioned in the matrix, and not the
battery pack as whole, which was the intent. Hence, we again recognize the presence of
PPA_Observation_11. As mentioned, we intended to challenge the participants, by asking them
to evaluate what would be optimal towards the suppliers. This was not done for this component,
as we saw that we were running out of time.
In the second workshop, as with the Kraljic matrix, we divided the battery pack in two components,
utilizing AR_Observation_4 to mitigate the occurrence of PPA_Observation_4. E1 initiated the
process of placing the components, by stating that the lead batteries are standard and the lithium
batteries are custom made for Fugro. SM1 added that the lead batteries should be placed in the
bottom-left quadrant. E1 then stated that the lithium batteries should be placed in the top-right
quadrant. As such, the workshop participants were finished placing the components.
We wanted, however, to know more about their reasoning underlying these positions, as they
did not explicitly refer to the relative power dimension. Hence, in order to challenge the
previously made PPA_Observation_8 (an initial evaluation of the dimension alone may be
altered when considering its underlying measures), we initiated a discussion about the relative
power in the relationship with the supplier. E1 stated that they have little influence on the
supplier of lithium batteries; “they decide – they do not reduce their component lead time, even
when we propose to pay extra”. Further, he added that they have an alternative, more expensive,
supplier. However, they try to plan the use of batteries, enabling them to make quarterly orders
from their French main supplier. We agreed with this reasoning, and see that
PPA_Observation_8 did not apply.
In an effort to make the participants further elaborate on the importance of power, we asked if
the balance of power was considered when selecting a supplier. SM1 answered that this is not
something one thinks about in the first place, “power is something you experience”. E1 added
that price and lead time are important criteria for selecting suppliers,” it’s not like we want
power”. We make the following observation:
ETO_Observation_20 Power is not considered ex ante; it is experienced ex post.
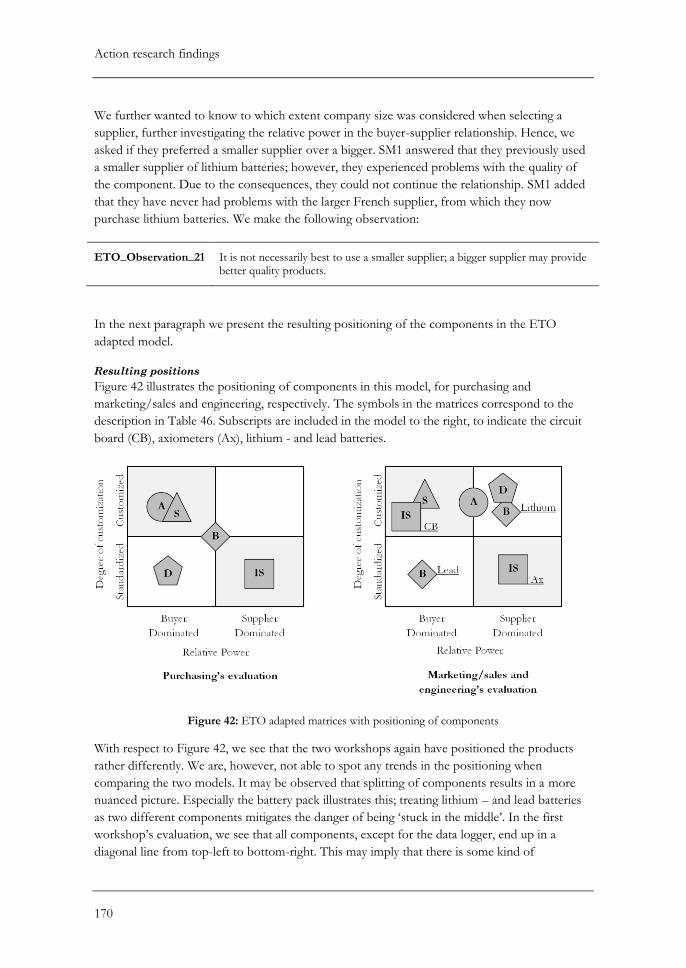
Action research findings
170
We further wanted to know to which extent company size was considered when selecting a
supplier, further investigating the relative power in the buyer-supplier relationship. Hence, we
asked if they preferred a smaller supplier over a bigger. SM1 answered that they previously used
a smaller supplier of lithium batteries; however, they experienced problems with the quality of
the component. Due to the consequences, they could not continue the relationship. SM1 added
that they have never had problems with the larger French supplier, from which they now
purchase lithium batteries. We make the following observation:
ETO_Observation_21 It is not necessarily best to use a smaller supplier; a bigger supplier may provide better quality products.
In the next paragraph we present the resulting positioning of the components in the ETO
adapted model.
Resulting positions
Figure 42 illustrates the positioning of components in this model, for purchasing and
marketing/sales and engineering, respectively. The symbols in the matrices correspond to the
description in Table 46. Subscripts are included in the model to the right, to indicate the circuit
board (CB), axiometers (Ax), lithium - and lead batteries.
Figure 42: ETO adapted matrices with positioning of components
With respect to Figure 42, we see that the two workshops again have positioned the products
rather differently. We are, however, not able to spot any trends in the positioning when
comparing the two models. It may be observed that splitting of components results in a more
nuanced picture. Especially the battery pack illustrates this; treating lithium – and lead batteries
as two different components mitigates the danger of being ‘stuck in the middle’. In the first
workshop’s evaluation, we see that all components, except for the data logger, end up in a
diagonal line from top-left to bottom-right. This may imply that there is some kind of
Action research findings
171
correlation between degree of customization and relative power. However, as this is not
reflected in the second workshop’s evaluation, it cannot be said for certain. In the next
subsection, the evaluation of applying the ETO adapter portfolio model is presented.
7.4.2 Evaluation of applying the ETO adapted portfolio model
As for Kraljic matrix, we evaluated the use of the model after the positioning was done. In this
subsection, we first present the participants’ evaluation of the process. Thereafter, our own
evaluation of the process is presented.
The problem holders’ evaluation
In the first workshop, we initiated the evaluation by asking whether there is value in considering
degree of customization and the relative power balance, or if they keep this in mind when they
purchase. Purchaser A replied that “it is at the back of our minds”. Purchaser B added that they
have been more conscious of these things after they joined the MARGIN project, and repeated
what he said in the evaluation of the Kraljic matrix; “our auditor has pointed out stuff, like that
we should have alternatives if a supplier succumbs”.
We proceeded to ask how they perceived the positioning of the various components. Purchaser
A felt that it was difficult because “you have a mix, it is not a single component but many
components. Each module consists of different types of components. It makes it difficult to
position”. We see that PPA_Observation_4 applies. To challenge this, we asked if it would be
beneficial with different strategies for e.g. the lead and lithium batteries, or if it is best
considered as one single unit. The purchasers answered that when the battery pack consists only
of lead batteries, it is fairly simple to handle. It seemed to us that they had forgotten their
previous positioning of the battery pack in the strategic quadrant of the Kraljic matrix. In our
opinion, treating a battery pack consisting exclusively of lead batteries as a strategic component
would not be necessary, given the many suppliers and low profit impact of the lead batteries.
Hence, we make the following observation:
PPA_Observation_12 The position of complex product structures may cause sub-components to achieve a disproportionate resource allocation in relation to its actual strategic importance.
In the second workshop, SM1 initiated the evaluation by regarding the ETO adapted model to be of
more value than the Kraljic matrix. He argued that “this does not emphasize volume as much;
one considers other aspects. I think this is more suitable for us”. E1 regarded the positioning
process to be easier, in that it was easier to relate to the components Fugro source. We
proceeded to propose that the two models in a way are complementary, in that they consider
different aspects of a component, whereupon the participants nodded their assents.
The researchers’ evaluation
In the evaluation of the ETO adapted model, we discovered that some new information
regarding the components and their sourcing practice emerged, as the participants were asked to
evaluate new measures of the product. Hence, we make the following observation.
Action research findings
172
PPA_Observation_13 Additional measures and dimensions can make the practitioner consider more information when evaluating a sourced component.
Further, it was also apparent that the workshop participants needed to recapitulate many of the
arguments they had used when they applied the Kraljic matrix. As such, is seemed that they had
forgotten much of the previous discussion and conclusions derived from applying the first
model. Finally, we realized that it was difficult for the participants to envision other situations
than the one they were residing. In the next section, we turn to the last approach introduced to
the participants.
7.5 Perception of the approach by Olsen and Ellram (1997)
Due to the extensiveness of the approach by Olsen and Ellram (1997), and lack of time, the
components were not positioned in this approach. We did, however, introduce the model, and
exemplify the use of it with the battery pack as an example. As such, we were able to give the
participants an impression of how to use the approach.
In the first workshop, the participants agreed with the proposed strategy of “less contact and
reduction of transaction cost” provided by the approach. Purchaser A added that he was
unaccustomed to such investigation of relationships, and felt that this was an eye-opener.
Because of limited time, we were not able to evaluate this model any further in this workshop.
In the second workshop, we had a little more time to evaluate the approach. The participants
acknowledged that they could reduce their time used on the lead battery supplier, in accordance
with the provided strategy. When asked if the workshop participants found this to be an
attractive approach, SM1 stated that “the difference is that this one tells you what to do, the
other models are more open”.
We wanted to further investigate the feasibility of the proposed strategy; hence, we asked if the
workshop participants could envision the implementation of the generic strategy proposed by
the purchasing approach. SM1 immediately stated that this would be difficult with their current
supplier, and further explained that they regarded the relationship with the supplier as a
“friendship”. As such, they do not wish to utilize their position over the supplier. Further, E1
added that they value quality higher than price; as such it would not be beneficial to use their
buying power to achieve lower prices at the expense of quality. We make the following
observation:
ETO_Observation_22 Long term relationships are difficult to terminate, as friendships evolve.
The discussion then somehow changed to concern the use of resources and time. SM1 stated
that “if the relationship works and the component does not make out too much of the total cost
of the product, we do not use time on changing suppliers. We use more time on more expensive
Action research findings
173
products”. We make the following observation, before proceeding to the total evaluation of the
workshops:
PPA_Observation_14 Expensive products are considered more strategically important; if the relationship works and the products are inexpensive, time is not spent on changing suppliers.
7.6 Total evaluation
Each of the two workshops was finalized with a total evaluation. Here, we were interested in
knowing what Fugro thought of the models; if there were any ambiguities; if they would be
interested in implementing such models; value of the process versus the output; and so on (A.2).
In addition, the first workshop was asked about the value of using the models in cross-
functional teams (limited time did not allow this in the second workshop).
In the first workshop, we initiated the evaluation by asking which one of the three presented
approaches they preferably would have used, if they were to choose one. Both Purchaser A and
Purchaser B answered that they would have used the last one (by Olsen and Ellram, 1997). We
found this rather surprising, and followed up by asking “even if it is more comprehensive?”
Purchaser B responded that it was preferred because “it has more pigeonholes”. Hence, we
make the following observation:
PPA_Observation_15 The approach by Olsen and Ellram (1997) was preferred over the Kraljic matrix and the ETO adapted model.
We proceeded by commenting that we had used the product as a basis for analysis in the Kraljic
matrix. In this respect, we wanted to know if it was useful to also evaluate the relationship with
the supplier, as was done in the approach by Olsen and Ellram (1997). Purchaser A replied that
it was useful, and added that it was “a bit unaccustomed, but I think it was an eye-opener”.
Referring to the models in general, we further asked if the workshop had been valuable; if it was
too comprehensive; or if it did not lead to a sufficient plan of action. Purchaser A stated that it
was interesting to try it out, whereupon Purchaser B agreed. Purchaser B added that “I have to
say, it fits with what we are experiencing”. When asked whether it would be relevant to adopt
similar frameworks in Fugro, Purchaser A replied that “it is relevant to try it, yes”.
Keeping in mind that the purchasers preferred the approach by Olsen and Ellram (1997), we
proceeded to ask which approach was the easiest to use, and why. Purchaser A answered that
the approaches were very theoretical, but “model 3 gathered… it provided a bit more”.
Purchaser B agreed. He further added that “we order much of the same things each time. Even
if there are several available suppliers, we send the order to the same supplier each time, and
‘that’s it’”. We see that PS_Observation_3 applies, in that the purchasers seem to be satisfied
with the way things are. In addition, we make the following observations:
Action research findings
174
PPA_Observation_16 The models were regarded as rather theoretical.
PPA_Observation_17 The approach by Olsen and Ellram (1997) was perceived as easier than the Kraljic matrix and the ETO adapted model.
With respect to PPA_Observation_16, we argued that we had used a lot of terms, like
customization and risk, which are somewhat theoretical. We therefore wanted to know whether
the use of the approaches was understood as exclusively theoretical, or if they were okay to
combine with practical matters. Purchaser B claimed that they would have to develop it in
practice; “but we have to start somewhere, and then we start with theory. We want to try it, it
would be interesting”. We followed up by asking whether the dimensions were easy to relate to.
Purchaser B thought that it was fairly easy, arguing that risk and profit are understandable terms;
“very symbolic, easily understandable”. We see that PPA_Observation_1 applies, in that
Purchaser B disregarded the underlying measures of the dimensions. We proceeded by asking
the participants what they perceived as most difficult with the approaches; “was it too much
information to consider at once? Perhaps it is not that difficult?” Purchaser B answered that he
did not think it was that difficult.
Next, we asked whether the purchasers thought that it would be valuable to include several
business functions in the process, to get different perspectives on products and component, or
if everyone has the same information. Purchaser B first replied “well, what can we say?”, and
made a follow-up by explaining that the salespeople know the products, but ask purchasing and
engineering if customers’ enquiries are too complex. Purchaser A added that the participants in
the second workshop are familiar with the products: “[SM1] has worked with engineering, but
has started to work with sales. [E1] is mostly working with engineering, but is also involved in
making tenders. Both are involved with several processes, they are not pure salesmen. They
know what they are selling”. This confirms ETO_Observation_7, in that an employee may
possess extensive knowledge of several functions.
Finally, we asked what is regarded most beneficial; the discussion or the output with respect to
strategies. Purchaser A thought that they are currently doing much of what was recommended in
the strategies, and felt that the process was valuable; “you learn something all the time, I found
that useful”.
In the second workshop, we initiated the evaluation by asking if the approaches’ ways of looking at
components were useful, and if they elucidated aspects that are not usually in focus. E1 replied
that it was interesting. SM1, however, stated that “I am often left with the impression that we
nod in recognition; however, implementation has turned out not to be straightforward. We can
go from meetings with a lot of good points, but have no action plan afterwards”. E1 added that
“knowledge is one thing, implementation is another. But it is always nice to acquire knowledge”.
Action research findings
175
SM1 argued that if they are to implement a system, someone has to be in charge of it; “resources
most be set aside for it, and we are not so good at that”. We make the following observation:
PPA_Observation_18 Personnel should be dedicated to carry the responsibility of implementing the use of a purchasing portfolio approach.
As in the first workshop, we wanted to know whether the use of the approaches was understood
as exclusively theoretical, or if it would be okay to combine it with practical matters. SM1 felt
that it was too theoretical, and that it was a combination of several things; “you cannot say that
that was the solution for us”. Based on this, we wanted to know if an approach would have to be
tailored for their purpose. SM1 agreed, and continued by arguing that “this was new models
once again; new names and new terms”. E1 added that evaluation is important, in terms of what
category components are. According to him, this has not been done because time has not been
set aside for this purpose. SM1 then built on his previous statement, by arguing that none of
them are skilled enough to see that “Wow, we can implement that one!” Hence, we make the
following observation:
PPA_Observation_19 Limited time and resources impede the implementation of a purchasing portfolio approach.
Further, we asked if terms and the dimensions are fairly okay to relate to, or if it immediately is
too theoretical. SM1 replied that “‘leverage’ does not say much, things like that are taken into
consideration”. We see that PPA_Observation_5 applies, in that SM1 gets caught up in the
names of the quadrants. E1 added that it is difficult when a component consists of various
subcomponents; “you can evaluate a screw in no time, but when you purchase complex things
like we do, it is difficult. We may depend on three of four suppliers for just one component”.
Again, we see that PPA_Observation_4 applies (complex product structures making the
positioning difficult).
SM1 then again picked up the challenge of implementation, arguing that “we do not work as the
big contractors; we do not have a group dedicated for such work. We do have routines, but we
do not set aside people for such work. It is a political decision in the company; ‘is this something
we should to? Does it provide value? Are we so small and niche that there is no point?’. If we
choose to do it, we have to set aside people that make routines based on the analysis”. Hence,
we make the following observation:
PPA_Observation_20 The implementation of a purchasing portfolio approach is a political decision, in that top management must allocate time and resources for this purpose.
Action research findings
176
Finally, we asked the participants what was most valuable; the discussion around components or
the action plans such approaches provide. Both SM1 and E1 argued that the evaluation process
was most valuable; SM1 finally stated that “I do not find the result evident”. We make the
following final observation, before proceeding to some reflections on the process as a whole:
PPA_Observation_21 The process was perceived more valuable than the output, the latter in terms of generic strategies.
Researchers’ evaluation
We here evaluate the action research in light of problem solving and research interests,
coinciding with the dual imperative approach to action research (2.3.3).
With respect to research interest, we feel that the action research has been highly valuable. Through
having an active and facilitating role in the workshops, we have gained insight in the main topics
of this master’s thesis, beyond what could have been achieved through passive observation. In
our opinion, the purchasing portfolio approaches functioned as valuable frameworks to discuss
purchasing practice and bring forth tacit knowledge by facilitating communication. We
emphasize this by making the following observation:
PPA_Observation_22 Through discussion and mutual reflection, tacit knowledge may be codified, practice formalized and communication facilitated by the use of a purchasing portfolio approach.
By challenging the workshop participants to position components in a sample of purchasing
portfolio approaches, we further experienced challenges associated with their use. As such, we
have been able to map the micro perspective of purchasing portfolio approach usage, hence
complementing the (macro perspective) survey research (chapter 6) in a neat manner.
Further, we have been able to observe and map purchasing practice in an ETO company. The
practice has its challenges with respect to robustness, as contractual agreements are rarely used.
We have seen various reasons for the lack of contractual agreements; these reasons may restrict
the feasibility of purchasing portfolio approaches’ recommended strategies. Further, we have
seen how various product types may not be straightforward to position in a purchasing portfolio
approach, due to uncertainty related to the products’ structure and varying characteristics. By
conducting two workshops, with employees from different functions, we have further been able
to observe the need for cross-functional integration in an ETO company.
We feel that the workshops were conducted in a good way; however, we acknowledge that
limited time hindered us from carrying out all of the planned aspects. Nevertheless, we were able
to make valuable observations throughout the whole process, including the aspects that were
granted limited time. In retrospect, we see we have few explicit observations concerning
purchasing sophistication. We do, however, feel that we are able to assess purchasing
Action research findings
177
sophistication by utilizing the remaining observations when investigating the linkages between
the topics in the theoretical framework; this is done in the later analysis.
With respect to problem solving, we are convinced that the process has been valuable for the
problem holder (Fugro). We acknowledge that we in no way have implemented the use of
purchasing portfolio approaches in the company; however, we argue that the process has
provided ideas, perspectives and theoretical input that will help them in achieving a more
proactive approach to purchasing. This is supported by statements made in the workshops;
Fugro stated that they have to start with theory in order to implement tools. Further, the
provided perspectives, especially with respect to a more conscious approach towards suppliers,
were said to be an eye-opener. We argue that more time is needed in order to solve Fugro’s
‘problem’ of reactive sourcing. As mentioned in the methodology (2.3.4), we were not able to
complete the action research cycle. The authors’ contribution to the case company has therefore
been to introduce a tool for pro-active and systematic sourcing, purchasing portfolio
approaches. Finally, we want to add that the findings will be presented for the company at a later
point in time, further providing value for the problem holder.
7.7 Conclusion
In this chapter we have provided the empirical findings from our action research, making
explicit observations from both workshops. These observations are classified according to the
topics in the ternary relationship of purchasing portfolio approaches, purchasing sophistication
and engineer-to-order. The observations are summarized in appendix A.5, and will be further
used in Part III for subsequent analyses. We feel that the action research has been valuable, from
both the researchers’ and the problem holder’s point of view.
This concludes Part II, Empirical investigations. As such, we proceed to Part III, where our
analysis and discussion are presented.
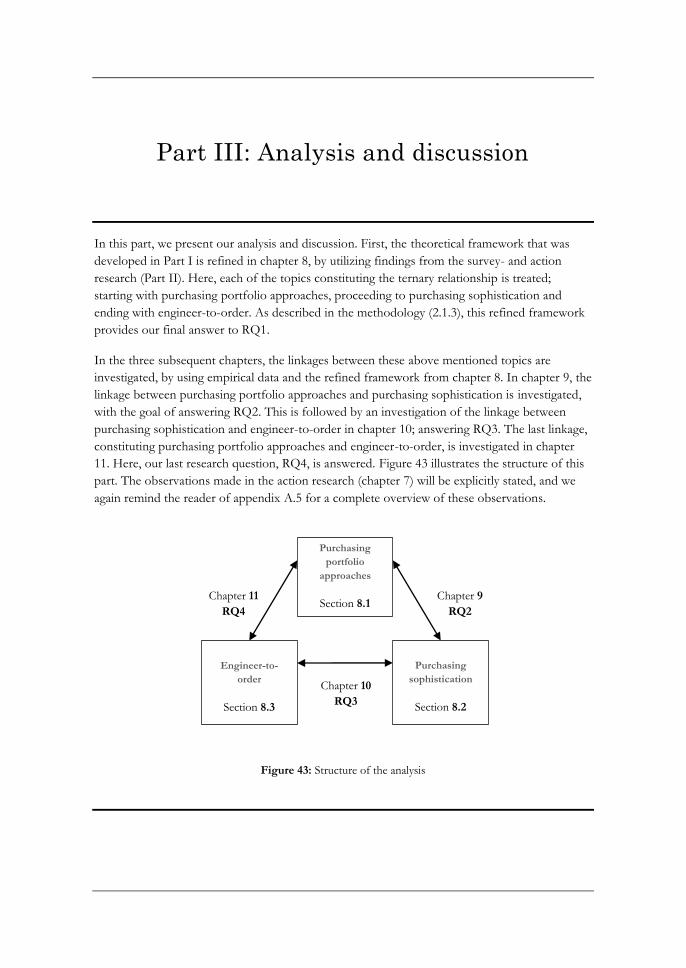
Part III: Analysis and discussion
In this part, we present our analysis and discussion. First, the theoretical framework that was
developed in Part I is refined in chapter 8, by utilizing findings from the survey- and action
research (Part II). Here, each of the topics constituting the ternary relationship is treated;
starting with purchasing portfolio approaches, proceeding to purchasing sophistication and
ending with engineer-to-order. As described in the methodology (2.1.3), this refined framework
provides our final answer to RQ1.
In the three subsequent chapters, the linkages between these above mentioned topics are
investigated, by using empirical data and the refined framework from chapter 8. In chapter 9, the
linkage between purchasing portfolio approaches and purchasing sophistication is investigated,
with the goal of answering RQ2. This is followed by an investigation of the linkage between
purchasing sophistication and engineer-to-order in chapter 10; answering RQ3. The last linkage,
constituting purchasing portfolio approaches and engineer-to-order, is investigated in chapter
11. Here, our last research question, RQ4, is answered. Figure 43 illustrates the structure of this
part. The observations made in the action research (chapter 7) will be explicitly stated, and we
again remind the reader of appendix A.5 for a complete overview of these observations.
Figure 43: Structure of the analysis
Engineer-to-
order
Section 8.3
Purchasing
portfolio
approaches
Section 8.1
Purchasing
sophistication
Section 8.2
Chapter 9
RQ2
Chapter 10
RQ3
Chapter 11
RQ4
Refining the theoretical framework
179
8 Refining the theoretical framework The purpose of this chapter is to refine the theoretical framework developed in Part I (Figure
31), with knowledge acquired through our empirical investigations (Part II). The first section
(8.1) presents a discussion of purchasing portfolio approaches. Here, survey – and action
research findings are discussed in relation to theory on subjects identified as relevant for the
topic. This is then repeated for purchasing sophistication (8.2) and ETO (8.3), respectively. We
conclude this chapter with a refined framework (8.4), answering the first research question (c.f.
2.1.3). This framework will further be utilized in the remaining chapters of this analysis, in
addressing the linkages in the ternary relationship, as described in Figure 43.
8.1 Purchasing portfolio approaches
In this section, we first present analysis of the survey research findings, including an empirical
validation of the context of purchasing portfolio approaches. Further, we wish to expand the framework
by including a macro perspective; illustrating the prevalence of purchasing portfolio analysis in
Norwegian production companies, and how the use of purchasing portfolio analysis relates to
relevant variables (6.1) of a company. This is followed by a discussion of action research
findings in relation to theory on main purposes; comparison between approaches; and, critique. Further,
we wish to expand the framework by including operational challenges that were discovered
during our action research. Finally, we present the refined framework with regards to purchasing
portfolio approaches. This will be brought along to the conclusion at the end of this chapter.
8.1.1 Survey research findings
In this subsection, we first present our empirical validation of the context of using a purchasing
portfolio approach, by investigating its relation to having a sourcing strategy (6.1.2). Thereafter,
we include a macro perspective of using a purchasing portfolio approach, presenting findings on
how many and what types of companies that are using purchasing portfolio approaches. Finally, a
comparison of the use a purchasing portfolio analysis with remaining relevant variables (6.1;
having a purchasing department; company size; and, purchasing-to-turnover ratio) is given.
Context of using a purchasing portfolio approach
According to Monczka et al. (2011), a purchasing portfolio approach provides a recommended
sourcing strategy for each of a company’s sourced products (3.1.1). In analyzing the empirical
evidence from the survey research, we discovered a significant relationship between having a
sourcing strategy and the use of purchasing portfolio approaches (6.3.3). In order to establish
the direction of the relationship, we have to ask ourselves two questions; how can having a
sourcing strategy lead to the use of purchasing portfolio approaches, and vice versa? It may be
that a company possessing a sourcing strategy would use purchasing portfolio approaches in
order to validate, refine or expand the existing sourcing strategies. However, such use would
require the company to position their products in the approach, in order to derive sourcing
strategies. As such, they have in fact used purchasing portfolio approaches to establish sourcing
strategies, which is in accordance with the described context for which to use a purchasing
portfolio approach. Consequently, we argue that the use of purchasing portfolio approaches
leads to having a sourcing strategy, and not the other way around.
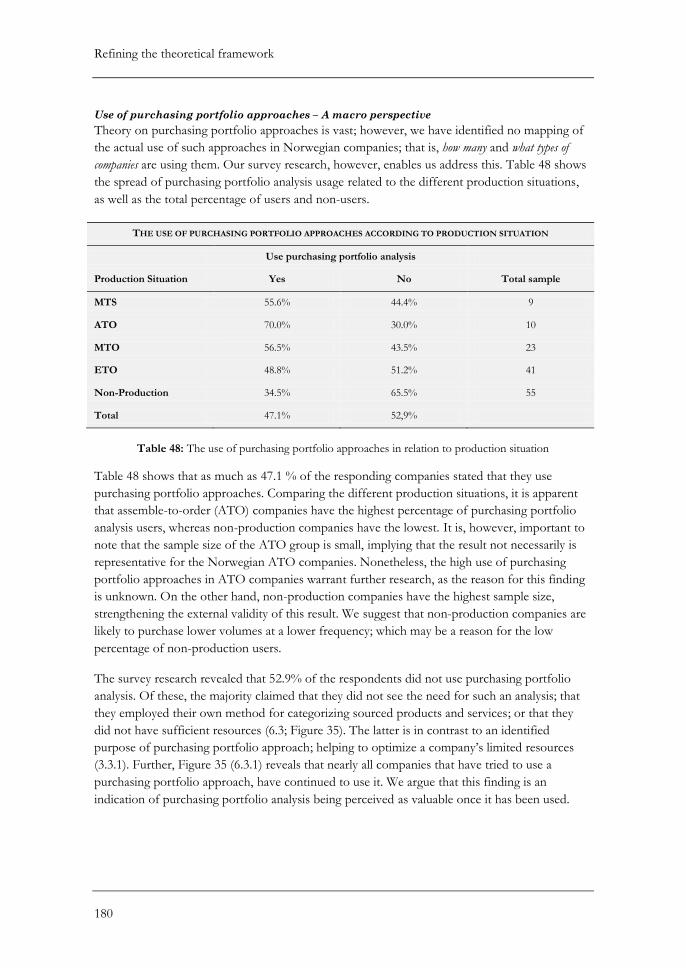
Refining the theoretical framework
180
Use of purchasing portfolio approaches – A macro perspective
Theory on purchasing portfolio approaches is vast; however, we have identified no mapping of
the actual use of such approaches in Norwegian companies; that is, how many and what types of
companies are using them. Our survey research, however, enables us address this. Table 48 shows
the spread of purchasing portfolio analysis usage related to the different production situations,
as well as the total percentage of users and non-users.
THE USE OF PURCHASING PORTFOLIO APPROACHES ACCORDING TO PRODUCTION SITUATION
Use purchasing portfolio analysis
Production Situation Yes No Total sample
MTS 55.6% 44.4% 9
ATO 70.0% 30.0% 10
MTO 56.5% 43.5% 23
ETO 48.8% 51.2% 41
Non-Production 34.5% 65.5% 55
Total 47.1% 52,9%
Table 48: The use of purchasing portfolio approaches in relation to production situation
Table 48 shows that as much as 47.1 % of the responding companies stated that they use
purchasing portfolio approaches. Comparing the different production situations, it is apparent
that assemble-to-order (ATO) companies have the highest percentage of purchasing portfolio
analysis users, whereas non-production companies have the lowest. It is, however, important to
note that the sample size of the ATO group is small, implying that the result not necessarily is
representative for the Norwegian ATO companies. Nonetheless, the high use of purchasing
portfolio approaches in ATO companies warrant further research, as the reason for this finding
is unknown. On the other hand, non-production companies have the highest sample size,
strengthening the external validity of this result. We suggest that non-production companies are
likely to purchase lower volumes at a lower frequency; which may be a reason for the low
percentage of non-production users.
The survey research revealed that 52.9% of the respondents did not use purchasing portfolio
analysis. Of these, the majority claimed that they did not see the need for such an analysis; that
they employed their own method for categorizing sourced products and services; or that they
did not have sufficient resources (6.3; Figure 35). The latter is in contrast to an identified
purpose of purchasing portfolio approach; helping to optimize a company’s limited resources
(3.3.1). Further, Figure 35 (6.3.1) reveals that nearly all companies that have tried to use a
purchasing portfolio approach, have continued to use it. We argue that this finding is an
indication of purchasing portfolio analysis being perceived as valuable once it has been used.
Refining the theoretical framework
181
Finally, we discovered that very few companies have never heard of purchasing portfolio
approaches at all (Figure 35). This indicates a high degree of recognition; the majority of the
responding companies are familiar with the concept of purchasing portfolio approaches.
Purchasing portfolio analysis in relation to other relevant variables
When analyzing the survey data with respect to the use of purchasing portfolio analysis (6.3), the
significant relationships in Figure 36 were established. In summary, we discovered that the use
of purchasing portfolio approaches is more prevalent in large companies, and in companies
having a purchasing department. Further, we found a significant relationship between
purchasing-to-turnover ratio and having a sourcing strategy. We will now discuss each of these
relationships, and imply a direction of them, as we cannot infer causality through the survey
research (2.4.5).
PPA and purchasing department
The survey data indicated that a slight minority of the companies (47.6%) had a dedicated
purchasing department (6.3.2). This is a considerably higher percentage than discovered by
Quayle (2002) in his exploratory survey research of SMEs (6.1.1). However, our total sample
includes, in addition to small and medium-sized companies, also large companies. A study by
Boyer et al. (1996) identified that smaller firms have fewer resources than larger firms (6.1.3).
Hence, we argue that some of the difference in having a purchasing department is due to larger
companies having more resources, which in turn is likely to allow a higher degree of
specialization. With a higher degree of specialization, we argue that the company is more likely
to have a dedicated purchasing department. Our percentage of SMEs with a dedicated
purchasing department is considerably smaller than the overall sample average; only 32%.
However, this is still higher than what Quayle (2002) discovered (6.1.1). We argue that this may
be a reflection of the increased strategic recognition of purchasing over the last ten years (1.1.4).
Further, the survey research revealed a significant relationship between using a purchasing
portfolio approach and having a purchasing department (6.3.2). We argue that this finding may
be explained by the fact that a purchasing department will have the necessary time and resources
available for conducting purchasing portfolio analysis. In a company where purchasing does not
have a dedicated purchasing department, it may be harder to justify the use of a purchasing
portfolio approach, as these resources could be argued to provide more value when used on
other activities. As such, we argue that having a purchasing department may lead to the use of
purchasing portfolio approaches, and not the other way around; indicating a direction of the
relationship.
PPA and company size
We discovered a significant relationship between the use of purchasing portfolio analysis and
company size; indicating that larger companies are more likely to use a purchasing portfolio
approach compared to smaller companies. As mentioned in the previous paragraph, we found
from theory that larger companies have more resources. Gelderman and van Weele (2005) argue
that large companies are more likely to be situated in a complex sourcing situation that requires
advanced analytical tools (6.1.3). Syson (1992, referred to in Trautmann et al., 2009) argues that
Refining the theoretical framework
182
the ability of a purchasing portfolio approach to break down complex problems into their most
important dimensions is an appreciated characteristic of purchasing portfolio approaches (3.3.1).
Based on this, it was not surprising that we discovered a significant relationship between large
companies and the use of purchasing portfolio approaches. In relation to the direction of the
relationship between the variables, we reckon that the use of purchasing portfolio approaches is
not likely to make a company grow in number of employees. As such, we argue that it is being a
big company that affects the use of purchasing portfolio approaches, and not the other way
around.
PPA and purchasing-to-turnover ratio
The purchasing-to-turnover ratio was employed as an indicator of the importance of purchasing
in a company (6.1.4). Several authors (Wind and Mahajan, 1981; Turnbull, 1990; Pagell et al.,
2010) argue that an application of purchasing portfolio approaches is to ensure optimal use of a
company’s limited resources in relation to different supplier relationships (3.3.1). As such, it
would also be natural that a high purchasing-to-turnover ratio would trigger the use of
purchasing portfolio approaches, to optimize the use of the high purchasing expenditure.
However, when investigating this variable in relation to the use of purchasing portfolio analysis,
we discovered that the relationship was not significant (Figure 36), indicating that this is not the
case. On the other hand, we discovered a significant relationship between the purchasing-to-
turnover variable and having a sourcing strategy. It indicated that companies with a large
purchasing-to-turnover ratio are more likely to have a sourcing strategy (6.3.5). In relation to the
direction of this relationship, we acknowledge that having a sourcing strategy may reduce the
purchasing-to-turnover ratio to some extent, through having a more careful sourcing practice.
However, we regard it more likely that it is the purchasing-to-turnover ratio that initiates the use
of a sourcing strategy, and not vice versa.
When further investigating the ratio’s relationship to the variables of purchasing department and
company size, we found no significant result (Figure 36). These findings are interesting, as we
suspected that a company with a high purchasing-to-turnover ratio at least would have a
purchasing department, due to the indicated importance of purchasing. As such, it is likely that
other factors affect the establishment of a purchasing department in a higher degree than the
purchasing-to-turnover ratio. As an example, a smaller company with a high purchasing-to-
turnover ratio may not have enough resources to allow the establishment of a purchasing
department, in line with the discussion above (PPA and company size).
Proposed directions of significant relationships
In the previous paragraph, we discussed possible directions of the identified significant
relationships with respect to the use of purchasing portfolio analysis. Figure 44 illustrates the
directions that were proposed.

Refining the theoretical framework
183
Figure 44: Proposed relationship between using purchasing portfolio analysis and other variables
Next, we present our action research findings in relation to the topic of purchasing portfolio
approaches.
8.1.2 Action research findings
In this subsection, we present and discuss action research findings related to purchasing
portfolio approaches. First, main purposes of using purchasing portfolio approaches are discussed.
Second, we refine the comparison between purchasing portfolio approaches (limited to their number of
stages) by adding empirical experiences. Third, we discuss critique of purchasing portfolio
approaches, with respect to the positioning of products and the models’ dimensions. Finally, we
discuss important observations made in the action research that were not identified in theory.
These findings further contribute to refining the theoretical framework at the end of this
section.
Purpose
In this paragraph, we first reflect on two of the identified main purposes of using PPA;
organizing information and facilitating communication. With respect to the latter, we show how
purchasing portfolio models may function as codifiers of tacit knowledge; refining a purpose
previously identified in literature.
Organizing information
In the development of the theoretical framework, we found that purposes of using purchasing
portfolio approaches could be divided in three main groups (3.7). The second group, termed
Purchasing
department Sourcing Strategy
Company Size
and
SME
Purchasing portfolio
analysis
Purchasing Turnover
Ratio
Significant relationship
No significant relationship Proposed direction
of relationship
Refining the theoretical framework
184
‘organizing information’, included arguments provided by Olsen and Ellram (1997) and Syson
(1992, referred to in Trautmann et al., 2009). These authors explain that a purchasing portfolio
approach may be used as an analytical tool to organize information, by breaking down complex
problems.
We found this purpose evident in the action research in several forms. First, when placing the
anchorage system in the Kraljic matrix, one of the participants ended up discarding his initial
thoughts and classification when evaluating measures of the dimensions that were not
considered initially (PPA_Observation_3). A similar observation was made when the shell was
positioned in the same matrix; here an evaluation of the dimension alone was substantially
altered as the underlying measures were considered (PPA_Observation_8). These observations
support the suggestion made by Olsen and Ellram (1997), in that more correct classifications
can be made when evaluating every measure of dimension systematically, in this way organizing
information. Further, we discovered that additional information on the products came to light
when the workshop participants were set to evaluate additional measures and new dimensions of
a component (PPA_Observation_13). Hence, one can argue that it is beneficial to add more
measures for each dimension, and perhaps evaluate additional dimensions to the purchasing
portfolio model. We argue that even two different approaches may be used. However, we would
like to emphasize that this has to be within the limits of the two appreciated characteristics of
purchasing portfolio approaches, provided by Dubois and Pedersen (2002) (3.3.1); the approach
still has to be easily understood and communicated, and it should still provide practical
guidelines.
Olsen and Ellram (1997) argue that the process of categorizing the sourced products in
purchasing portfolio approaches may be even more valuable than the classification itself (3.5.3).
This was also found when conducting action research: When evaluating the use of the
purchasing portfolio approaches, the process of using the approaches was regarded as more
valuable than the actual output from the approaches (PPA_Observation_21). It was actually
stated that the end results from the classifications were “not evident” (7.6). From this, we argue
that when employing any purchasing portfolio approach, the classification should be done in a
manner which maintains the procedural benefits. Consequently, we suggest that the
operationalization of an approach should facilitate discussion, with participants from several
functions within the company (in accordance with PPA_Observation_7). From this, we further
argue that classification by utilizing spreadsheets – assigning numerical values to the different
measures and hence calculating the position in the model, may be counterproductive. The
underlying measures of a dimension should help facilitate the discussion, rather than being given
a value and then be set aside.
Facilitating communication
A third identified purpose of using purchasing portfolio approaches is the facilitation of
communication (3.7). Gelderman and van Weele (2005) argue that a purchasing portfolio
approach can be “an effective tool for discussing, visualizing and illustrating the possibilities for
differentiated purchasing and supplier strategies” (p.35). In addition, Smart and Dudas (2007)
find that it may facilitate communication, and that its simplicity makes it easy to communicate to
Refining the theoretical framework
185
other members in the organization. Finally, Olsen and Ellram (1997) state that the use of a
purchasing portfolio approach forces the users to discuss inconsistencies, and agree on the
importance of different products, supplier or relationships to be classified in the approach
(3.5.3).
In our evaluation of the workshops, we made an observation which supports these identified
purposes of using a purchasing portfolio approach, stating that “through discussion and mutual
reflection, tacit knowledge may be codified, practice formalized and communication facilitated
by the use of a purchasing portfolio approach” (PPA_Observation_22). We argue that
communication is facilitated through having the users of a purchasing portfolio approach discuss
and evaluate several measures and dimensions for each purchasing portfolio model. Hence, we
have learned how purchasing portfolio approaches may facilitate communication, not just that it
can. Further, tacit knowledge may be codified and made explicit through having users of purchasing
portfolio approaches explain their reasoning when addressing the different measures and
dimensions. In relation to this, valuable insight of the product, supplier or the relationship in
question can be gained from gathering personnel from different functions to participate in this
process (PPA_Observation_7). We argue that the simplicity of a portfolio model makes it
feasible for being used by non-purchasing professionals. Finally, formalization of practice may be
attended to through having the workshop participants exchange their experience, as a means to
become aware of the actual sourcing practice, and possibly identify an internal best practice.
Comparing these findings in relation to theory, we have refined purchasing portfolio
approaches’ purpose of facilitating communication, by taking into account their potential to
codify tacit knowledge and formalize practice.
Comparison of purchasing portfolio approaches
In the specialization project conducted fall 2011 (1.1.6), we proposed that purchasing portfolio
approaches have a varying degree of comprehensiveness, and suggested that a comprehensive
tool would be more difficult to use. However, through action research, we found that
purchasing portfolio approaches’ comprehensiveness not necessarily reflects their difficulty of
use.
In the total evaluation of the applied and introduced purchasing portfolio approaches in the
workshops (7.6), it was stated that the approach by Olsen and Ellram (1997) was preferred over
the Kraljic matrix, as it had more “pigeonholes” (PPA_Observation_15). In addition, it was
perceived as easier (PPA_Observation_17). This contradicts with our preconceptions from our
specialization project (1.1.6), where the approach by Olsen and Ellram (1997) was assumed to be
the most comprehensive of the approaches tested, hence being harder to use. In trying to
explain this contradiction, we argue that this may be due to the approach by Olsen and Ellram
(1997) providing a rather elaborate description of how it is to be employed; i.e. providing
incomplete but extensive lists of measures to evaluate each dimension in both portfolio models
employed (3.4.2). Hence, it may seem that a comprehensive approach may be easier to use, as its
guidelines may be more elaborate. As such, the approach is more specified, and thus less
complex, because complexity is divided up into subcategories and underlying measures.
Refining the theoretical framework
186
However, it should be noted that the workshops only were introduced to the approach by Olsen
and Ellram (1997), due to insufficient time. As such, they were not able to apply it themselves,
but expressed their impressions on the basis of the researchers’ demonstration. Nonetheless, we
feel that the finding regarding the comprehensiveness of approaches still holds. In summary, we
recognize that the degree of comprehensiveness of a purchasing portfolio approach is not
necessarily an indicator of its difficulty of use. Further, we argue that this observation applies
both ways; a less comprehensive approach may be harder to use, as it provides less guidance for
use.
Critique
In this paragraph, we reflect on the critique related to the positioning of products in purchasing
portfolio approaches and their dimensions (3.5). First, we discuss the critique of viewing
products as ‘given’ objects, before elaborating on the perceived ambiguity of the models’
dimensions.
Viewing products as ‘given’ objects
In the identified critique of purchasing portfolio approaches (Table 17), Dubois and Pedersen
(2002) argue that objects are viewed as ‘given’ when analyzed by the use of PPA; neglecting
aspects such as developing, producing and using the products. In our action research, we found
evidence that supports this critique. In the positioning of the anchorage system that Fugro
source, we learned that the anchorage system module is engineered for every buoy, and hence
different for every product. More specifically, the types of components used are the same for
each product, but some characteristics of the components (e.g. length of ropes) are different.
This leads to price variations from module to module, and hence a different position in the
Kraljic matrix with regards to profit impact. For instance, if the buoy is to be placed in shallow
waters, shorter ropes are needed – leading to low price and low profit impact. However, when
the buoy is placed in deep waters, up to 5000 meters, more rope must be purchased – leading to
high cost and, hence high profit impact (7.3.1; ETO_Observation_2). We see that the
component is not constant; rather, it is varying in terms of specifications. This varying property
of a component makes it hard to position it in a purchasing portfolio model. As such, we
acknowledge the critique by Dubois and Pedersen (2002) in that objects are ‘given’ in a portfolio
analysis; which neglects aspects of, among others, production. We have through our action
research illustrated how viewing products as ‘given’ may be problematic in positioning
components.
Scenarios may also be imagined where a module in the product is engineered for each product,
and the engineering leads to a need for different components in the module. As such, the
module may also differ in terms of variety; not only quantity (and as such, cost), as exemplified
above. Hypothetically, these components may vary in terms of both profit impact and supply
risk, using the Kraljic matrix as an example. A module can hence vary in two dimensions –
making it even harder to utilize a purchasing portfolio approach that is to give you one strategy
for a component. As such, we argue that purchasing portfolio approaches may be inappropriate
when sourcing components that are engineered for each product.
Refining the theoretical framework
187
Ambiguity of the dimensions
A major part of the critique of purchasing portfolio approaches relates to the dimensions of
purchasing portfolio models (Table 17). However, in the action research, we made an
observation concerning the dimensions of the tested portfolio models that was not identified in
theory (PPA_Observation_1). The observation concerns the difficulty of how to interpret the
dimensions: Should one only evaluate the underlying measures of the model’s dimension, or can
the dimension itself be utilized as a measure? Findings from our action research indicate that the
dimension itself often was perceived as a measure, and the participants often evaluated the
dimension in a similar manner as the underlying measures. We argue that this ambiguity of the
dimensions may be circumvented by explicitly explaining the difference between a dimension
and its measures. Hence, we believe that this observation does not contribute to undermine the
utility of purchasing portfolio approaches.
Operational challenges
In this paragraph, we illustrate challenges that arose during the action research, concerning the
quadrants of purchasing portfolio models and the positioning of modules. We argue that these
findings fall outside of the topics included in the theoretical framework (Figure 31). As such, the
findings discussed in this paragraph will be included in the refined framework under the banner
‘operational challenges’, because they relate to the implementation of purchasing portfolio
approaches.
Predispositions caused by the quadrants’ names
Somewhat unexpected, we discovered that the names of the quadrants in a purchasing portfolio
model may cause predispositions with respect to the positioning of components
(PPA_Observation_5). This observation was made after one participant in the second workshop
stated that he was not comfortable the ‘leverage’ quadrant of the Kraljic matrix. This led,
perhaps unintentionally, to the second workshop not placing any components in the leverage
quadrant (7.3.1).
This problem is not identified in theory. We argue that a simple remedy may be to remove the
names of the quadrants when using the portfolio model. As such, we argue that this observation
does not undermine the utility of purchasing portfolio approaches. This motivates why it is not
considered as critique, but rather as an operational challenge. In addition, only one participant
had such a predisposition; as such, the external validity of this identified problem is quite weak.
Difficulty in positioning modular components
In the action research, we discovered that the modular characteristic of several of the tested
components complicated the use of the approaches (PPA_Observation_4;
PPA_Observation_6). When placing the inertial sensor in the ETO adapted model, we
discovered that a complex product structure may cause sub-components to be forgotten or not
evaluated in the positioning process at all (PPA_Observation_11). Further, when the
participants were made to evaluate the ETO adapted model, we discovered a consequence of
the previous observation; namely that some sub-components may achieve a disproportionate
amount of resources in relation to their strategic importance (PPA_Observation_12). This
Refining the theoretical framework
188
observation is in direct contrast to one of the main purposes of using a portfolio approach;
namely to help a company optimize its use of limited resources (3.3.1). As such, we argue that
components should be evaluated at a disaggregated level to the extent possible.
One exception is when the company conducts systems sourcing; i.e., that a module is sourced from
a sole supplier, as was the case for the anchorage system. In the action research, we saw that the
workshop participants knew each subcomponent comprising this sourced component very well,
because they used to make it themselves prior to outsourcing the production to a local supplier
(7.3.1). The purchasers in the first workshop considered the anchorage system’s standardized
components when positioning the anchorage system, arguing that the supply risk was low. The
second workshop took, however, the supplier’s work practices into account, and argued that this
limited the number of available suppliers. We therefore argue that a sourced system should not
be disaggregated prior to its positioning in a purchasing portfolio approach, because the
underlying components may distort the perceptions of the module, leading to a less favorable
positioning.
Using an external facilitator
There may be both pros and cons of having an external facilitator when conducting purchasing
portfolio analysis. When conducting action research, we found that the participants of the
workshops tended to hesitate, and await guidance from the researchers (AR_Observation_1).
The researchers’ presence may have resulted in that the participants became passive. Further, we
found that the researchers have great influence on the problem holders, who tended to reply
confirmatory to leading questions (AR_Observation_3). As such, the researchers’ presence may
have been responsible for some of the choices made by the participants. However, we also
found that the participants tended to deviate from the positioning process, and discuss other
aspects than the positioning of the component (AR_Observation_2). As such, we believe that
the presence of a facilitator is needed to some extent, in order to keep the discussion on track.
8.1.3 Towards a refined framework – Purchasing portfolio approaches
We have in this section presented analysis of the findings related to purchasing portfolio analysis
from both survey research and action research. First, we presented analysis of the survey
research findings, including a discussion of empirical data that validated the context of purchasing
portfolio approaches. Further, we took a macro perspective; illustrating the prevalence of purchasing
portfolio analysis in Norwegian production companies, and how the use of purchasing portfolio
analysis relates to relevant variables (6.1) of a company. This has not been done previously, and
we therefore include these findings in the refined framework.
Second, the action research analysis evaluated empirical findings in relation to theory. With
respect to main purposes, we validated the purposes of organizing information and facilitating
communication. With respect to the latter, we identified an additional intention of use; the use
of purchasing portfolio approaches to codify tacit knowledge and formalize practice. This is
included in the refined framework. Further, in a comparison between approaches, we used the
approaches’ number of stages to discuss whether a more extensive approach is more difficult to
use. This indicated that a more elaborate approach may in fact make it easier to use, as it breaks
Refining the theoretical framework
189
down the complexity into manageable pieces. We then proceeded, by addressing critique with
respect to the positioning of products and the models’ dimensions. We here supported the
critique of viewing products as ‘given’, and added some considerations of the perceived
ambiguity of a purchasing portfolio model’s dimensions. Finally, we added findings in relation to
operational challenges. These are brought along to the refined framework.
From this, we update the theoretical framework developed in Part I (Figure 31) with our
findings from the empirical investigation. We have here included both validations of identified
theory (), where this is possible, and additions (+) to the framework. In the final section of this
chapter (8.4), the refined framework is presented. The findings that are to be brought along to
the final refined framework, in addition to validations of theory, are illustrated in Figure 45
below.
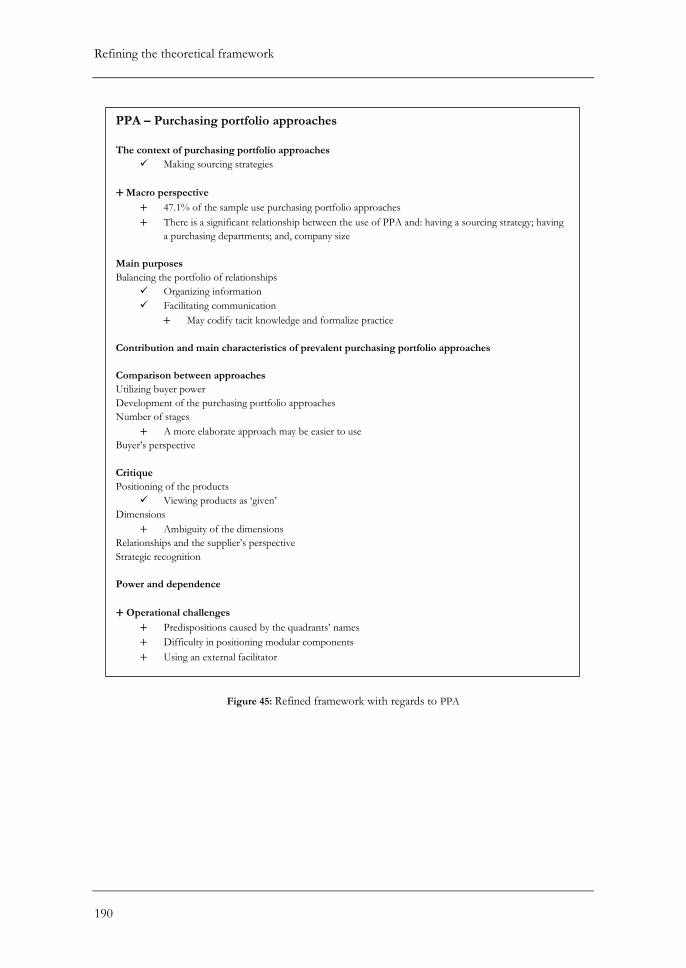
Refining the theoretical framework
190
Figure 45: Refined framework with regards to PPA
PPA – Purchasing portfolio approaches
The context of purchasing portfolio approaches
Making sourcing strategies
+ Macro perspective
+ 47.1% of the sample use purchasing portfolio approaches
+ There is a significant relationship between the use of PPA and: having a sourcing strategy; having
a purchasing departments; and, company size
Main purposes
Balancing the portfolio of relationships
Organizing information
Facilitating communication
+ May codify tacit knowledge and formalize practice
Contribution and main characteristics of prevalent purchasing portfolio approaches
Comparison between approaches
Utilizing buyer power
Development of the purchasing portfolio approaches
Number of stages
+ A more elaborate approach may be easier to use
Buyer’s perspective
Critique
Positioning of the products
Viewing products as ‘given’
Dimensions
+ Ambiguity of the dimensions
Relationships and the supplier’s perspective
Strategic recognition
Power and dependence
+ Operational challenges
+ Predispositions caused by the quadrants’ names
+ Difficulty in positioning modular components
+ Using an external facilitator
Refining the theoretical framework
191
8.2 Purchasing sophistication
In this section, we seek to refine the theoretical framework (Figure 31) with regards to the topic
of purchasing sophistication (PS). The section relies solely on an analysis of survey research
findings related to purchasing sophistication. First, we investigate how the level of purchasing
sophistication is affected by relevant variables (6.1) of a company. We then proceed by
investigating and refining the dimensions of purchasing sophistication, before discussing each
dimension in connection to the previously used variables of a company. Finally, we present the
refined framework with regards to purchasing sophistication, which will be brought along to the
conclusion at the end of this chapter.
Action research findings will not be utilized in this section. This is because we are not able to
directly address any of the subjects within the topic of purchasing sophistication with our action
research findings; these would have to be considered in relation to the main topics of purchasing
portfolio approaches and ETO. Consequently, these findings are postponed to subsequent
chapters concerning purchasing sophistication’s relation to purchasing portfolio approaches
(chapter 9) and ETO (chapter 10), respectively.
8.2.1 Survey research findings
In this subsection, we first present how the level of purchasing sophistication relates to relevant
variables of a company (6.1). No similar studies have been identified in theory on purchasing
sophistication; hence, these findings will be used to refine our theoretical framework.
Furthermore, we discuss our exploratory factor analysis of the multiple-item construct of
purchasing sophistication, referring to the characteristics of purchasing sophistication and how
these relate to each other. Following this, we analyze the factors of purchasing sophistication in
relation to relevant variables (6.1) of a company.
Purchasing sophistication in relation to relevant variables
When analyzing the survey data in relation to the level of purchasing sophistication (6.4), the
significant relationships in Figure 38 was established. In summary, we discovered that only the
possession of a sourcing strategy displayed a statistically significant higher level of purchasing
sophistication. We will first discuss and imply a direction of this connection, as we cannot infer
causality through the survey research (2.4.5). Thereafter, we discuss possible reasons for why
purchasing sophistication’s relation to the other variables is not statistically significant, in light of
identified literature.
Purchasing sophistication and having a sourcing strategy
When analyzing the survey findings, it was established that companies in possession of a
sourcing strategy indeed had a significantly higher purchasing sophistication (6.4.1). However,
our survey findings do not reveal the direction of this relationship (2.4.5). In our opinion, either
direction would seem plausible. When considering the characteristics of purchasing
sophistication (Table 21), we observe conflicting arguments as to which way the connection is
directed. It may be the case that higher monetary rewards resulting from a sourcing strategy
would increase the attention from top level management (reporting level), and as such increase
the level of purchasing sophistication. Further, a sourcing strategy which is aligned with the
Refining the theoretical framework
192
business and corporate strategies would probably increase purchasing’s strategic importance
(contribution to competitive position), thus leading to higher sophistication. A sourcing strategy may
also have an orientation towards collaborative relationship (orientation on collaboration), and/or
demand the use of cross-functional teams. Such a strategy could also increase the level of purchasing
sophistication. On the other hand, a highly sophisticated company would have the skills for
developing strategies. As such, a high level of sophistication could lead to having a sourcing strategy.
In summary, we are in no position to imply a direction of the connection between having a
sourcing strategy and level of purchasing sophistication. Nonetheless, we feel that our reasoning
is elucidating, and recommend further research at this point.
Purchasing sophistication and having a purchasing department
From the survey analysis, we found that companies with a purchasing department have a
somewhat higher purchasing sophistication than companies without a department (6.4.1), as was
expected. For instance, a dedicated purchasing function would, in comparison to a company
with a scattered responsibility of purchasing (if assigned at all), probably report to top
management, as it is recognized as a distinct department. Hence, we would suspect that a
purchasing department may lead to a higher average score on reporting level; the first of the
characteristics of purchasing sophistication adopted from Gelderman and van Weele (2005)
(Table 21; 4.3.1). Further, we argue that a dedicated purchasing department may improve the
recognition of purchasing as an important resource to the firm (the second characteristic of
purchasing sophistication: table 20), as it is assigned resources, again leading to a higher
sophistication. However, despite these prior hypotheses, we did not find the difference in
sophistication between companies with a purchasing department and those without, to be
significantly different. As such, we conclude that a dedicated purchasing department on its own
is not enough to cause a significant increase in purchasing sophistication.
Purchasing sophistication and company size
As previously mentioned (8.1.1), it is identified in theory that larger companies have more
resources than smaller firms (6.1.3), which may allow a higher degree of specialization (8.1.1)
Further, in relation to company size, it is also worth mentioning that Quayle (2002) discovered
that small and medium-sized companies lacked an awareness of the positive effect of effective
purchasing on profitability (6.1.3). This discovery may indicate that small and medium-sized
companies do not recognize purchasing as an important resource to the firm (a characteristic of
purchasing sophistication; Table 21), as they neglect its potential for positively affecting
profitability. Gelderman and van Weele (2005) provide, however, an indication of larger
companies having a somewhat higher sophistication, by claiming that such companies are more
likely to handle more products, suppliers and a more complex sourcing strategy (6.1.3). As such,
we found it interesting to see whether company size would make a significant impact on the
company’s purchasing sophistication.
Contradictory to what we expected from theory, we discovered that there was no significant
relationship between company size and a company’s level of purchasing sophistication. In fact,
both small and medium-sized companies had a higher average level of sophistication than the
larger companies. Actually, only about 0.2% of the variance in purchasing sophistication can be
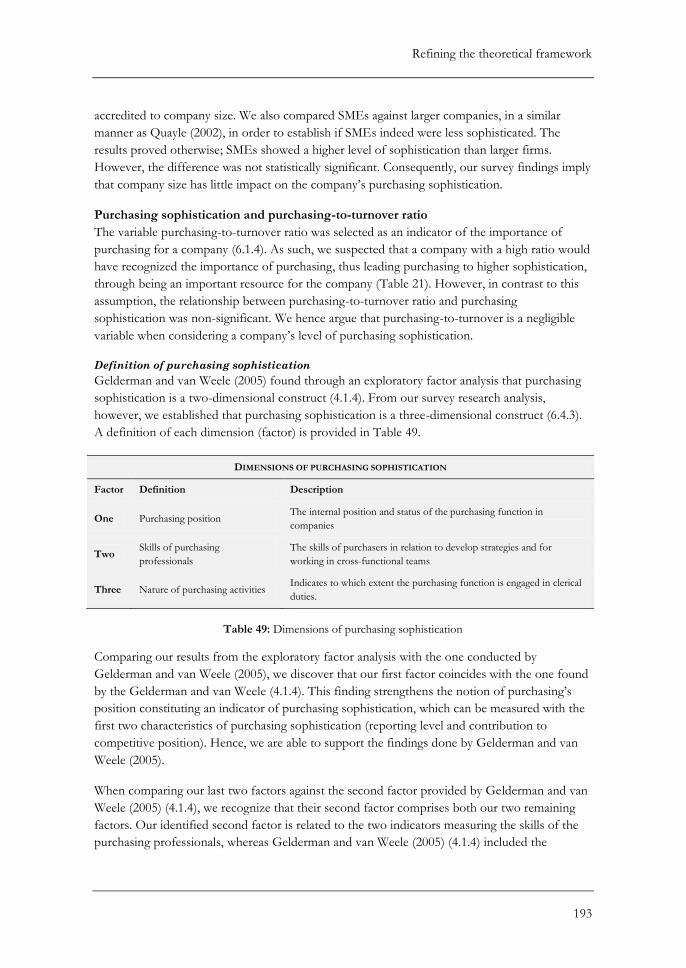
Refining the theoretical framework
193
accredited to company size. We also compared SMEs against larger companies, in a similar
manner as Quayle (2002), in order to establish if SMEs indeed were less sophisticated. The
results proved otherwise; SMEs showed a higher level of sophistication than larger firms.
However, the difference was not statistically significant. Consequently, our survey findings imply
that company size has little impact on the company’s purchasing sophistication.
Purchasing sophistication and purchasing-to-turnover ratio
The variable purchasing-to-turnover ratio was selected as an indicator of the importance of
purchasing for a company (6.1.4). As such, we suspected that a company with a high ratio would
have recognized the importance of purchasing, thus leading purchasing to higher sophistication,
through being an important resource for the company (Table 21). However, in contrast to this
assumption, the relationship between purchasing-to-turnover ratio and purchasing
sophistication was non-significant. We hence argue that purchasing-to-turnover is a negligible
variable when considering a company’s level of purchasing sophistication.
Definition of purchasing sophistication
Gelderman and van Weele (2005) found through an exploratory factor analysis that purchasing
sophistication is a two-dimensional construct (4.1.4). From our survey research analysis,
however, we established that purchasing sophistication is a three-dimensional construct (6.4.3).
A definition of each dimension (factor) is provided in Table 49.
DIMENSIONS OF PURCHASING SOPHISTICATION
Factor Definition Description
One Purchasing position The internal position and status of the purchasing function in
companies
Two Skills of purchasing
professionals
The skills of purchasers in relation to develop strategies and for
working in cross-functional teams
Three Nature of purchasing activities Indicates to which extent the purchasing function is engaged in clerical
duties.
Table 49: Dimensions of purchasing sophistication
Comparing our results from the exploratory factor analysis with the one conducted by
Gelderman and van Weele (2005), we discover that our first factor coincides with the one found
by the Gelderman and van Weele (4.1.4). This finding strengthens the notion of purchasing’s
position constituting an indicator of purchasing sophistication, which can be measured with the
first two characteristics of purchasing sophistication (reporting level and contribution to
competitive position). Hence, we are able to support the findings done by Gelderman and van
Weele (2005).
When comparing our last two factors against the second factor provided by Gelderman and van
Weele (2005) (4.1.4), we recognize that their second factor comprises both our two remaining
factors. Our identified second factor is related to the two indicators measuring the skills of the
purchasing professionals, whereas Gelderman and van Weele (2005) (4.1.4) included the
Refining the theoretical framework
194
indicator measuring orientation on clerical duties; our third factor. Hence, with respect to our
last two factors, we have developed other definitions than Gelderman and van Weele (2005).
Besides having made our survey research on another population than Gelderman and van Weele
(2005) did (4.1.4), we do not recognize any reasons for these differences in factors. Nonetheless,
we choose to adopt our three-dimensional concept of purchasing sophistication (rather than the
two dimensions provided by Gelderman and van Weele) as it is derived from the population to
which we are generalizing the results from our survey findings.
Analyzing the factors of purchasing sophistication
Having established that purchasing sophistication is a three-dimensional construct, we here seek
to identify whether the relevant variables of a company (6.1) that did not have a significant
relationship with purchasing sophistication, as a whole, have an effect on the concept at all –
utilizing the three underlying constructs of sophistication.
What is immediately apparent is that only two of the relevant variables and a single factor of
purchasing sophistication generated any significant results. In detail, the skills of the purchasing
professionals (factor two; Table 49) were significantly higher for users of purchasing portfolio
approaches compared to non-users. Similarly, having a purchasing department displayed a
statistically significant higher level of skills of the purchasing professionals than compared with
companies without such a department.
Interestingly, we discovered that company size does not have any significant impact on any of
the three factors of purchasing sophistication identified (6.4.3) - this despite the fact that we
established a significant relationship between company size and other relevant variables (with
the exception of purchase-to-turnover ratio) (8.1.1). However, company size is significantly
related to having a purchasing department, which provides a significant difference in the second
factor of purchasing sophistication. As such, one could suggest that company size has some
impact on purchasing sophistication, though not nearly as much as one could expect, knowing
that larger companies have more resources (6.1.3), and as such may have a higher degree of
specialization (8.1.1).
Further, the analysis revealed that the purchasing-to-turnover ratio does not show any significant
relationships with any of the three identified dimensions of purchasing sophistication. This
strengthens our previous supposition of purchasing-to-turnover being a negligible variable when
considering a company’s purchasing sophistication.
8.2.2 Towards a refined framework – Purchasing sophistication
In this section, we have presented analysis of the findings from the survey research, related to
purchasing sophistication. First, we investigated how the level of purchasing sophistication
relates to relevant variables of a company (6.1). Here, we found that only having a sourcing
strategy displayed a significant result in relation to the level of purchasing sophistication. We
were, however, not able to imply a direction for this connection. Nonetheless, we feel that this
statistically significant observation should be included in our refined framework under the
banner ‘level of purchasing sophistication’. Furthermore, we presented our results from an
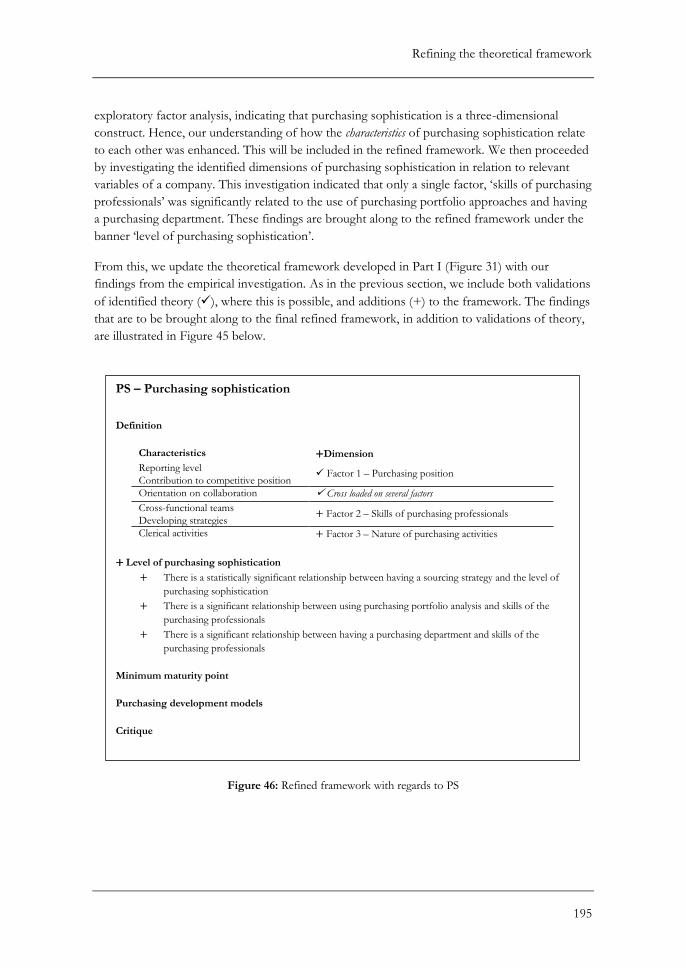
Refining the theoretical framework
195
exploratory factor analysis, indicating that purchasing sophistication is a three-dimensional
construct. Hence, our understanding of how the characteristics of purchasing sophistication relate
to each other was enhanced. This will be included in the refined framework. We then proceeded
by investigating the identified dimensions of purchasing sophistication in relation to relevant
variables of a company. This investigation indicated that only a single factor, ‘skills of purchasing
professionals’ was significantly related to the use of purchasing portfolio approaches and having
a purchasing department. These findings are brought along to the refined framework under the
banner ‘level of purchasing sophistication’.
From this, we update the theoretical framework developed in Part I (Figure 31) with our
findings from the empirical investigation. As in the previous section, we include both validations
of identified theory (), where this is possible, and additions (+) to the framework. The findings
that are to be brought along to the final refined framework, in addition to validations of theory,
are illustrated in Figure 45 below.
Figure 46: Refined framework with regards to PS
PS – Purchasing sophistication
Definition
Characteristics +Dimension
Reporting level Factor 1 – Purchasing position
Contribution to competitive position
Orientation on collaboration Cross loaded on several factors
Cross-functional teams + Factor 2 – Skills of purchasing professionals
Developing strategies
Clerical activities + Factor 3 – Nature of purchasing activities
+ Level of purchasing sophistication
+ There is a statistically significant relationship between having a sourcing strategy and the level of
purchasing sophistication
+ There is a significant relationship between using purchasing portfolio analysis and skills of the
purchasing professionals
+ There is a significant relationship between having a purchasing department and skills of the
purchasing professionals
Minimum maturity point
Purchasing development models
Critique
Refining the theoretical framework
196
8.3 Engineer-to-order
In this section, we seek to refine the theoretical framework (Figure 31) with regards to the topic
of engineer-to-order (ETO). First, we present analysis of the survey research findings,
comparing ETO companies with non-ETO companies in respect to relevant variables of a
company (6.1), refining the framework with a macro perspective. This is followed by a
discussion of action research findings in relation to theory on: characteristics; need for cross-functional
integration; and, purchasing in ETO companies. Finally, we present the refined framework with
regards to engineer-to-order, which will be brought along to the conclusion at the end of this
chapter.
8.3.1 Survey research findings
From our survey research, we were able to extract data on different production situations. Here,
we present the findings related to the relationship between ETO and non-ETO companies, to
elucidate potential differences related to the investigated variables in the survey research (6.1). In
the survey research, a total of 39 ETO companies replied, whereas 40 companies were of a non-
ETO production situation30.
When analyzing the survey findings in relation to purchasing-to-turnover ratio, between ETO
and non-ETO companies, we found that ETO-companies had a significantly lower purchasing-
to-turnover ratio compared to that of non-ETO companies (6.5.2). We argue that this difference
may be caused by a higher degree of value-adding production in ETO-companies, compared to
non-ETO companies. This is due to the engineering dimension of the production, where an
ETO company may reap high margins. As purchasing-to-turnover ratio indicates the importance
of purchasing (6.1.4), this may suggest that purchasing has a lower strategic recognition in ETO
companies compared to non-ETO companies. We do, however, acknowledge that this
relationship needs further investigation.
For the remaining variables investigated, our research findings point to a non-significant
difference between ETO and non-ETO companies (6.5). This indicates that there is no notable
difference between these production situations in terms of company size, having a purchasing
department or utilizing a sourcing strategy. Next, we discuss our action research findings with
respect to ETO.
8.3.2 Action research findings
In this subsection, we present and discuss action research findings related to ETO. First,
characteristics of the ETO production situation are discussed, in terms of products and identified
challenges (limited to handling change orders). Second, we empirically validate the need for cross-
functional integration in ETO companies. Finally, purchasing in ETO companies is elucidated by our
empirical findings.
30 The remaining respondents were not production companies, and are hence not included in this comparison.
Refining the theoretical framework
197
Characteristics
In this paragraph, we first reflect on the characteristics of ETO products, comparing theory with
findings from the action research. Thereafter, we investigate one of the identified challenges for
ETO companies, handling change orders, in a similar manner.
Product characteristics
We found in theory (5.2.1) that typical characteristics of products in ETO companies are that
they are complex, with deep product structures and a high diversity of components; varying in
terms of volume, degree of customization and technological advancement (Hicks et al., 2000).
When conducting action research (chapter 7), we got thorough insight in the problem holder’s
components, and were able to validate these product characteristics. We found that the product
(buoy) clearly is a complex product, consisting of various components (Table 46). Further, we
saw that the buoy’s components varied: Some were standardized (e.g. lead batteries); some were
customized (e.g. anchorage system); some were of high technological advancement (e.g. data
logger); some were of low technological advancement (e.g. lead batteries); and, components
varied in terms of volumes (e.g. several batteries per buoy, but only one shell).
In addition, we discovered that an ETO product may consist of modules that are sourced
assembled – so called system sourcing. These systems may consist of various sub-components with
differing characteristics with regards to e.g. degree of customization, price, availability of supply
and lead time. Hence, we are able to confirm theory regarding ETO products, in addition to
specifying that a diversity of components not only is within the overall product, but in sourced
modules as well. This last finding will be brought along to the refined framework at the end of
this chapter.
Identified challenges
From theory (5.2.5), we identified that one of the biggest challenges for ETO companies is
handling change orders, and that having capabilities to handle such dynamics are a prerequisite
for ETO companies (Little et al., 2000). Krajewski et al. (2005) suggest three ways to cope with
change orders: the use of supply contracts; the use of suppliers’ capabilities; and, the use of
postponement (5.2.5).
Through our action research, we learned that the anchorage system was the part of the buoy that
was most prone to change orders. The problem holder solved these change orders through the
use of postponement, in form of waiting to source this module until exact specifications are
provided from the customer. Hence, the problem holder has established a routine of sourcing
this component at the latest stage possible of the buoy production, to mitigate the risk of a
change order. Further, different functions at the problem holder confer with each other, to
make sure that change orders accepted by sales/marketing are feasible to do in practice (7.3.1).
This face-to-face interaction was enabled by co-location of functions at the same premises; “we
work closely because we are close” (second workshop).
In summary, we see that Fugro are utilizing postponement for handling change orders, as
described in theory. In addition, co-location of functions facilitates communication across
Refining the theoretical framework
198
functions, which in turn reduces the challenge of change orders. This last finding will be brought
along to the refined framework at the end of this part.
Cross-functional integration
As identified in ETO theory (5.3), several authors (Konijnendijk, 1994; Kingsman et al., 1993;
Hicks et al., 2000) argue that there is a need for cross-functional integration in ETO companies.
In action research, however, it was stated that there was no need for cross-functional
collaboration when doing purchasing portfolio analysis – as noted in ETO_Observation_5
(7.3.1). One reason for this attitude towards cross-functional collaboration was that, for a small
company like the problem holder, the facets between the different departments (such as
purchasing and engineering) may be vague, and one often finds oneself working for several
functions at once. As such, an employee may possess extensive knowledge of several functions
(ETO_Observation_7). In addition, co-location of functions at the same premises enables face-
to-face interaction (ETO_Observation_4), making access to information easy, as mentioned
above. This may imply that the identified need for cross-functional integration may not
necessarily apply to smaller companies with functions co-located at the same premises.
However, in line with the above mentioned challenge of change orders, the problem holders
described that previous problems with change orders were caused by a lack of cross-functional
coordination. This led us to make ETO_Observation_6 (7.3.1). As such, we argue that there is a
general need for cross-functional coordination in ETO companies, with cross-functional integration
being an extreme of coordination. Cross-functional integration may be most applicable for larger
companies, whereas coordination seems to suffice for smaller companies, where the facets
between functions are vague. Hence, we refine the need for cross-functional integration, and
bring this along to the refined framework.
Purchasing in ETO companies
In theory (5.4), we identified that the purchasing practice of ETO companies is characterized as
reactive, clerical, often using a lowest price strategy and adversarial trading approaches (Hicks et
al., 2000). In action research, however, we found that a lowest price strategy not always is
followed, even though price is important for Fugro. The company does search for alternative
suppliers, in order to establish alternatives and as a means for comparing prices
(ETO_Observation_11). However, quality, delivery time and stability, proximity and
communication were mentioned as the most important aspects when choosing suppliers
(ETO_Observation_8). We argue that this may be because the company sources some
components that are engineered for each buoy, and therefore varies (as discussed in 8.1.2). As
such, they need to know which capabilities the supplier possesses, in order to evaluate if the
supplier can provide the varying component (e.g. supply anchorage systems suitable for both the
North Sea and the Indian Ocean). Hence, the suppliers’ ability to deliver the required
components may be more important than having the lowest price.
Further, adversarial trading approaches were not identified; rather, many of the supplier
relationships mapped can be characterized by continuity and trust (ETO_Observation_22).
Through continuity and trust, the problem holder has developed long-term relationships, which
Refining the theoretical framework
199
were characterized as difficult to terminate, as the relationships often evolve into what the
problem holder termed ‘friendships’. As such, the problem holder finds that a long-term
relationship is natural to prolong, even though the nature of the relationship changes
(ETO_Observation_9). The problem holder has found that long-term relationships may
increase the priority from the supplier (ETO_Observation_14) and lead to development of
valuable knowledge of the suppliers’ operations (ETO_Observation_12). Even though long
term relationships seem to be of high value for Fugro, they use few contractual agreements
towards suppliers (ETO_Observation_10).
We believe that this finding may be due to the characteristic of the relationships as ‘friendships’;
arguing that trust, experience and continuity may mitigate the risk of opportunism and
adversarial trading. However, the friendship characteristic may also hinder Fugro from switching
between potential suppliers to achieve lower prices, as they do not want to break the
relationships. As such, we see both advantages and disadvantages of developing a ‘friendship’
with the supplier. In addition, the aversion towards using contractual agreements may also be
caused by challenges concerning the specifications of sourced components that vary (c.f. the
beginning of this paragraph).
Further, we have identified in theory (5.4) that research on purchasing has been dominated by
studies on supply chains where a focal producer has high buyer power (Cox, 2004). In the ETO
setting, however, the characteristics are different, and the same assumptions do not hold for
buyer-supplier relationships; a diversity of factors implies that caution must be made when
comparing literature on the high-volume sector with the low-volume sectors (Hicks et al., 2000).
These theoretical findings were confirmed by conducting action research. First, we found that
for a small company like the problem holder, it is difficult to initiate close (resource intensive)
relationships with large suppliers (ETO_Observation_15). The company may receive lower
priority from the supplier; e.g., your orders may be pushed back in line due to larger orders from
more important customers (ETO_Observation_13). As such, we see a power disadvantage for
companies with similar characteristics as Fugro.
While we have identified in theory that the power balances may be of a different nature for
ETO companies (see above), it does not state how ETO companies may mitigate such
challenges. However, the action research problem holder had solved this problem by purchasing
higher volumes when possible (ETO_Observation_18), and further bundling volumes across
subsidiaries for some product (ETO_Observation_17). As such, bargaining power and attention
from their suppliers was gained (ETO_Observation_18; 20). We see that it may be advantageous
with a reduced supply base; consolidating volumes toward few suppliers to gain priority and
bargaining power. Interestingly, power issues like these are not considered in Fugro prior to
choosing suppliers; rather, they are experienced ex post (ETO_Observation_21). In the next
subsection, we conclude on which findings to be included in the refined framework, under the
topic of engineer-to-order.
8.3.3 Towards a refined framework – Engineer-to-order
We have in this section presented analysis of the findings from both survey and action research.
First, we took a macro perspective, and investigated how ETO companies compare to non-
Refining the theoretical framework
200
ETO companies by using our survey research findings. Here, we discovered that the only
significant difference between ETO- and non-ETO companies was that ETO has a statistically
significant lower purchasing-to-turnover ratio. These findings will be brought along to the
refined framework, constituting a macro perspective.
Thereafter, we discussed our action research findings in relation to theory on characteristics (in
terms of products and challenges) of ETO companies. Here, we confirmed the theory
concerning product structure, and further argued that the complex product structure not only
applies for the ETO product itself, but also for sourced components (e.g. through systems
sourcing). This will be included in the refined framework. With respect to an identified challenge
concerning change orders, we confirmed that the problem holder utilized postponement as a
strategy for handling this challenge. In addition, we found that co-location of functions
facilitates communication across functions, which in turn reduces the challenge of change
orders. This last finding will be brought along to the refined framework. When investigating the
need for cross-functional integration in ETO companies, we reckoned that cross-functional coordination
may suffice for smaller companies, where the facets between functions are vague and the
functions are co-located at the same premises. This will be added in the refined framework.
Finally, we presented a discussion concerning the practice of purchasing in ETO companies. Here,
we found that all ETO companies not necessarily follow a lowest price strategy. Further, we
found that several supplier relationships are characterized as ‘friendships’, in terms of trust and
continuity. Finally, we found that bargaining power may be achieved through purchasing large
volumes, possibly through bundling volumes across subsidiaries.
From this, we update the theoretical framework developed in Part I (Figure 31) with our
findings from the empirical investigation. As in the previous sections, we include both
validations of identified theory (), where this is possible, and additions (+) to the framework.
The findings that are to be brought along to the final refined framework, in addition to
validations of theory, are illustrated in Figure 45 below.
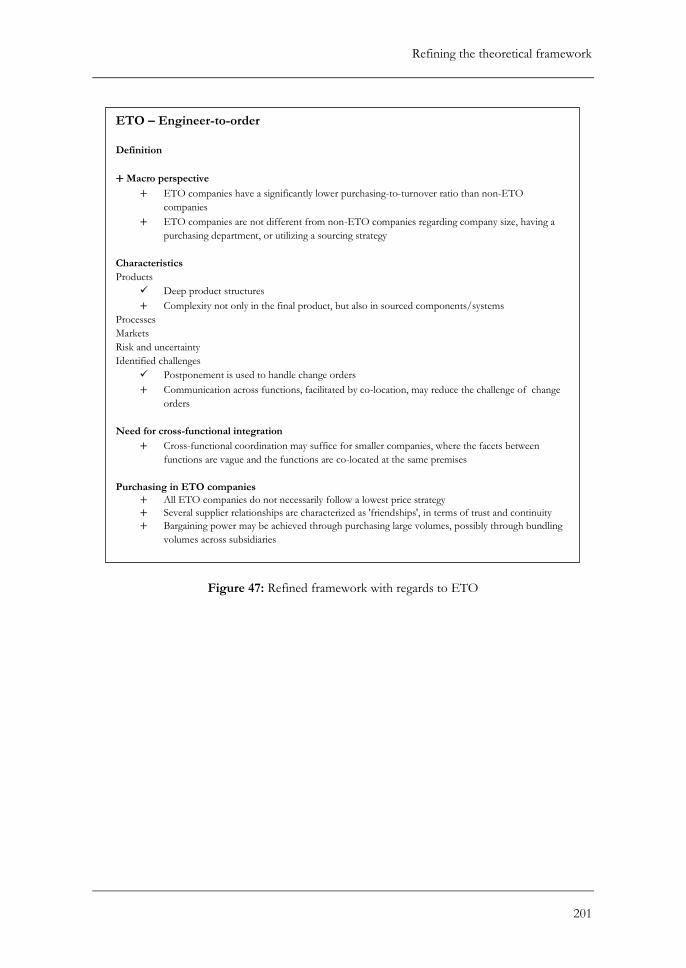
Refining the theoretical framework
201
Figure 47: Refined framework with regards to ETO
ETO – Engineer-to-order
Definition
+ Macro perspective
+ ETO companies have a significantly lower purchasing-to-turnover ratio than non-ETO
companies
+ ETO companies are not different from non-ETO companies regarding company size, having a
purchasing department, or utilizing a sourcing strategy
Characteristics
Products
Deep product structures
+ Complexity not only in the final product, but also in sourced components/systems
Processes
Markets
Risk and uncertainty
Identified challenges
Postponement is used to handle change orders
+ Communication across functions, facilitated by co-location, may reduce the challenge of change
orders
Need for cross-functional integration
+ Cross-functional coordination may suffice for smaller companies, where the facets between
functions are vague and the functions are co-located at the same premises
Purchasing in ETO companies
+ All ETO companies do not necessarily follow a lowest price strategy
+ Several supplier relationships are characterized as 'friendships', in terms of trust and continuity
+ Bargaining power may be achieved through purchasing large volumes, possibly through bundling
volumes across subsidiaries
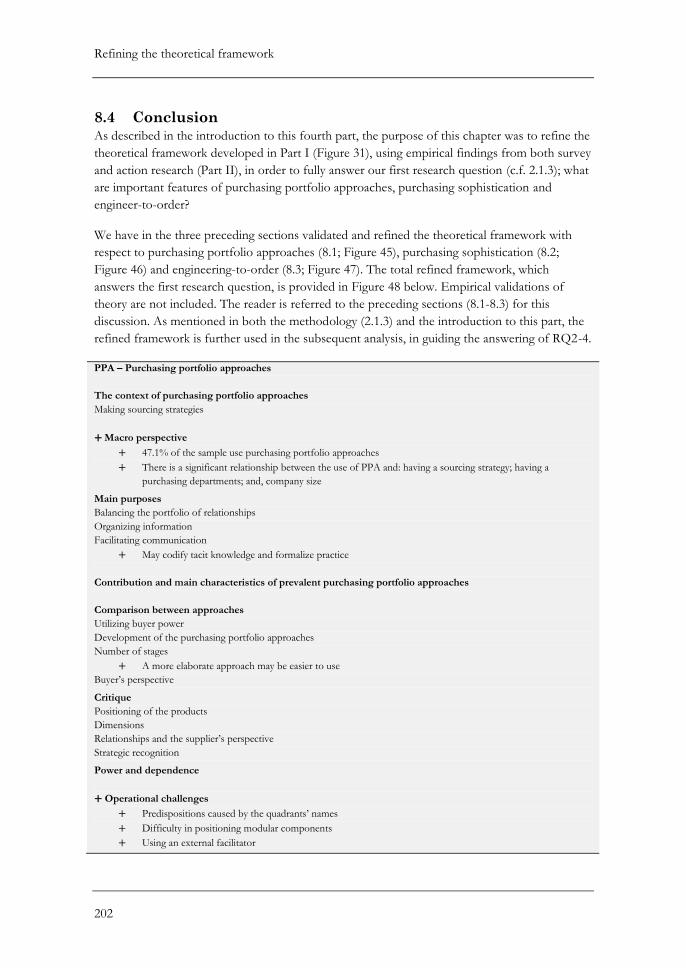
Refining the theoretical framework
202
8.4 Conclusion
As described in the introduction to this fourth part, the purpose of this chapter was to refine the
theoretical framework developed in Part I (Figure 31), using empirical findings from both survey
and action research (Part II), in order to fully answer our first research question (c.f. 2.1.3); what
are important features of purchasing portfolio approaches, purchasing sophistication and
engineer-to-order?
We have in the three preceding sections validated and refined the theoretical framework with
respect to purchasing portfolio approaches (8.1; Figure 45), purchasing sophistication (8.2;
Figure 46) and engineering-to-order (8.3; Figure 47). The total refined framework, which
answers the first research question, is provided in Figure 48 below. Empirical validations of
theory are not included. The reader is referred to the preceding sections (8.1-8.3) for this
discussion. As mentioned in both the methodology (2.1.3) and the introduction to this part, the
refined framework is further used in the subsequent analysis, in guiding the answering of RQ2-4.
PPA – Purchasing portfolio approaches
The context of purchasing portfolio approaches
Making sourcing strategies
+ Macro perspective
+ 47.1% of the sample use purchasing portfolio approaches
+ There is a significant relationship between the use of PPA and: having a sourcing strategy; having a
purchasing departments; and, company size
Main purposes
Balancing the portfolio of relationships
Organizing information
Facilitating communication
+ May codify tacit knowledge and formalize practice
Contribution and main characteristics of prevalent purchasing portfolio approaches
Comparison between approaches
Utilizing buyer power
Development of the purchasing portfolio approaches
Number of stages
+ A more elaborate approach may be easier to use
Buyer’s perspective
Critique
Positioning of the products
Dimensions
Relationships and the supplier’s perspective
Strategic recognition
Power and dependence
+ Operational challenges
+ Predispositions caused by the quadrants’ names
+ Difficulty in positioning modular components
+ Using an external facilitator
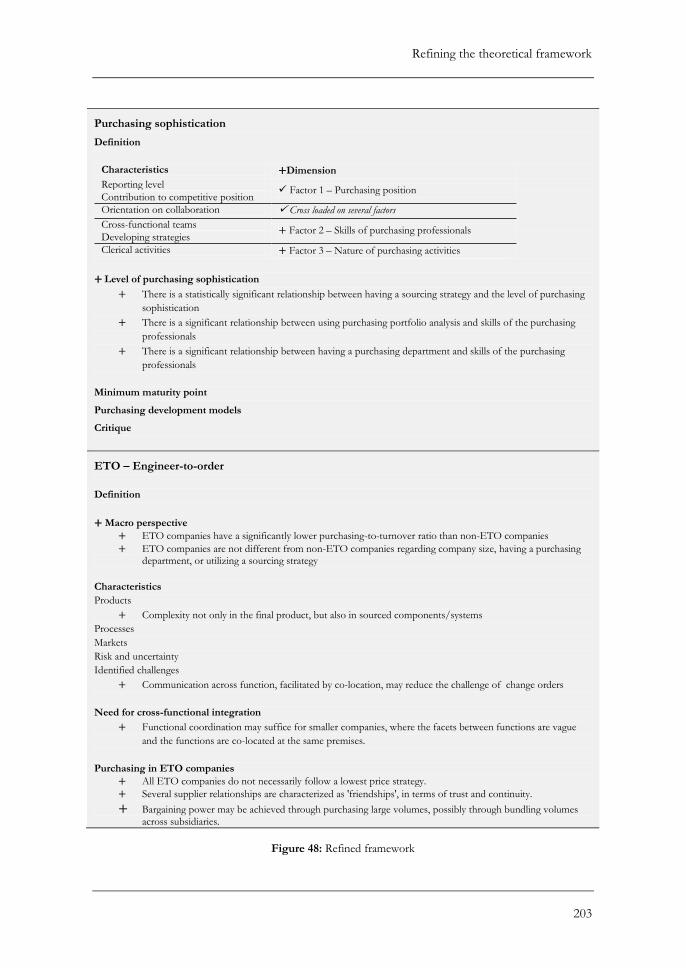
Refining the theoretical framework
203
Purchasing sophistication
Definition
Characteristics +Dimension
Reporting level Factor 1 – Purchasing position
Contribution to competitive position
Orientation on collaboration Cross loaded on several factors
Cross-functional teams + Factor 2 – Skills of purchasing professionals
Developing strategies
Clerical activities + Factor 3 – Nature of purchasing activities
+ Level of purchasing sophistication
+ There is a statistically significant relationship between having a sourcing strategy and the level of purchasing
sophistication
+ There is a significant relationship between using purchasing portfolio analysis and skills of the purchasing
professionals
+ There is a significant relationship between having a purchasing department and skills of the purchasing
professionals
Minimum maturity point
Purchasing development models
Critique
ETO – Engineer-to-order
Definition
+ Macro perspective
+ ETO companies have a significantly lower purchasing-to-turnover ratio than non-ETO companies
+ ETO companies are not different from non-ETO companies regarding company size, having a purchasing department, or utilizing a sourcing strategy
Characteristics
Products
+ Complexity not only in the final product, but also in sourced components/systems
Processes
Markets
Risk and uncertainty
Identified challenges
+ Communication across function, facilitated by co-location, may reduce the challenge of change orders
Need for cross-functional integration
+ Functional coordination may suffice for smaller companies, where the facets between functions are vague
and the functions are co-located at the same premises.
Purchasing in ETO companies
+ All ETO companies do not necessarily follow a lowest price strategy.
+ Several supplier relationships are characterized as 'friendships', in terms of trust and continuity.
+ Bargaining power may be achieved through purchasing large volumes, possibly through bundling volumes across subsidiaries.
Figure 48: Refined framework
Purchasing portfolio approaches and purchasing sophistication
204
9 Purchasing portfolio approaches and purchasing
sophistication The intention of this chapter is to evaluate the link between purchasing portfolio approaches
and purchasing sophistication, and as such, provide an answer to our second research question;
what is the relationship between purchasing sophistication and the use of purchasing portfolio approaches? This
research question is answered mainly on the basis of survey research (cf. 2.1.3); however, action
research findings will be utilized to support our inferences and conclusions. We will draw on
discussions made in chapter 8, concerning the topics of purchasing portfolio approaches (8.1)
and purchasing sophistication (8.2), and discuss how these are coupled.
In the first section, we present our survey research findings, establishing the link between the
two topics of purchasing portfolio approaches and purchasing sophistication. In the second
section, we use action research findings to support the survey findings, and for refuting our
proposed relation between purchasing sophistication and tool complexity, introduced in the
specialization project (1.1.6; Figure 6). A new, improved, framework is then presented,
segmenting between the presented prevalent purchasing portfolio approaches, with regard to
purchasing sophistication. In the final section, we conclude this chapter by answering RQ2.
9.1 Findings from survey research
This section presents the findings from our survey research in relation to the connection
between the topics of purchasing portfolio analysis and purchasing sophistication. The first
subsection establishes the link between the research topics in analysis, before the second
subsection seeks to disarm critique of purchasing portfolio approaches in relation to purchasing’s
strategic recognition (Table 17).
9.1.1 Purchasing portfolio analysis’ connection to purchasing
sophistication
As discussed in section 8.2, we established that a company possessing a sourcing strategy has a
statistically significant higher level of purchasing sophistication, compared to companies lacking
a sourcing strategy (8.2.1). In addition, when analyzing the use of purchasing portfolio
approaches, we discovered a significant relationship, indicating that users of purchasing
portfolio analysis are more likely to have a sourcing strategy than non-users (8.1.1). Further
elaborating on the latter finding, we argued that since purchasing portfolio approaches are
applied in the process of developing sourcing strategies (3.1.1), it is fair to assume that the use of
purchasing portfolio approaches leads to the development of a sourcing strategy, and not the
other way around (8.1.1). Hence, we implied a direction on this significant relationship between
using purchasing portfolio approaches and having a sourcing strategy. As such, there is a
connection between the use of a purchasing portfolio approach and the level of sophistication
of a company’s purchasing function, as illustrated in Figure 49 below. However, we
acknowledge that we are not able to determine the direction of the relationship between having
a souring strategy and the level of purchasing sophistication (8.2.1).
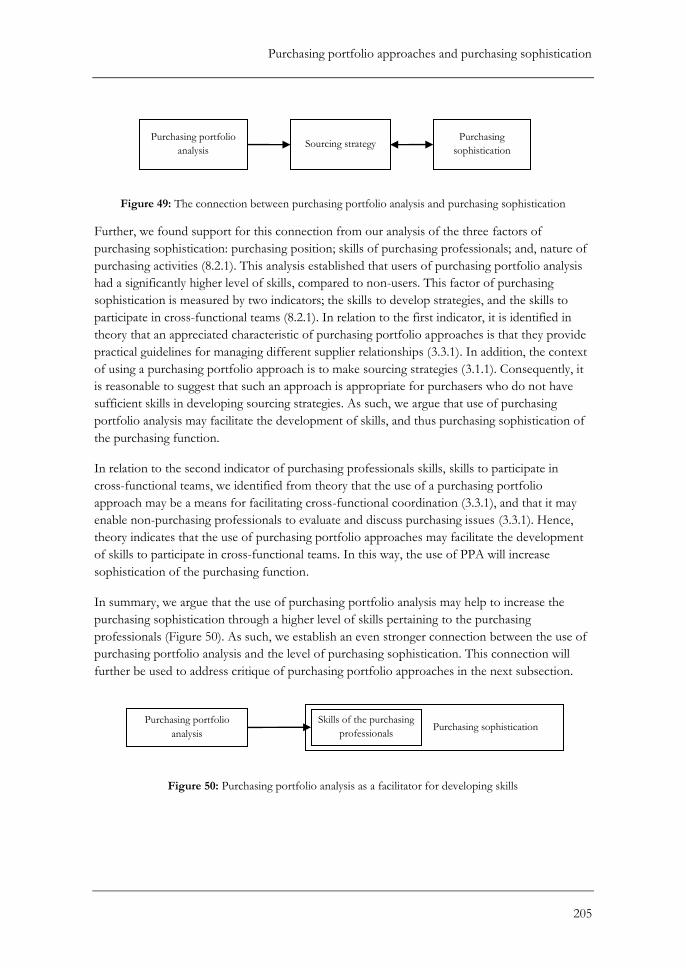
Purchasing portfolio approaches and purchasing sophistication
205
Figure 49: The connection between purchasing portfolio analysis and purchasing sophistication
Further, we found support for this connection from our analysis of the three factors of
purchasing sophistication: purchasing position; skills of purchasing professionals; and, nature of
purchasing activities (8.2.1). This analysis established that users of purchasing portfolio analysis
had a significantly higher level of skills, compared to non-users. This factor of purchasing
sophistication is measured by two indicators; the skills to develop strategies, and the skills to
participate in cross-functional teams (8.2.1). In relation to the first indicator, it is identified in
theory that an appreciated characteristic of purchasing portfolio approaches is that they provide
practical guidelines for managing different supplier relationships (3.3.1). In addition, the context
of using a purchasing portfolio approach is to make sourcing strategies (3.1.1). Consequently, it
is reasonable to suggest that such an approach is appropriate for purchasers who do not have
sufficient skills in developing sourcing strategies. As such, we argue that use of purchasing
portfolio analysis may facilitate the development of skills, and thus purchasing sophistication of
the purchasing function.
In relation to the second indicator of purchasing professionals skills, skills to participate in
cross-functional teams, we identified from theory that the use of a purchasing portfolio
approach may be a means for facilitating cross-functional coordination (3.3.1), and that it may
enable non-purchasing professionals to evaluate and discuss purchasing issues (3.3.1). Hence,
theory indicates that the use of purchasing portfolio approaches may facilitate the development
of skills to participate in cross-functional teams. In this way, the use of PPA will increase
sophistication of the purchasing function.
In summary, we argue that the use of purchasing portfolio analysis may help to increase the
purchasing sophistication through a higher level of skills pertaining to the purchasing
professionals (Figure 50). As such, we establish an even stronger connection between the use of
purchasing portfolio analysis and the level of purchasing sophistication. This connection will
further be used to address critique of purchasing portfolio approaches in the next subsection.
Figure 50: Purchasing portfolio analysis as a facilitator for developing skills
Sourcing strategy
Purchasing sophistication
Purchasing sophistication
Purchasing
sophistication
Skills of the purchasing
professionals
Purchasing portfolio
analysis
Purchasing portfolio
analysis
Purchasing
Sophistication
Purchasing portfolio approaches and purchasing sophistication
206
9.1.2 Addressing critique with our proposed connection
Dubois and Pedersen (2002) criticize the use of purchasing portfolio models, in stating that such
models impede the strategic recognition of purchasing (3.5.2; Table 17). One of their arguments
is that the use of a purchasing portfolio model implies that the purchasing function has a mere
clerical function within the company (Table 17). The sixth characteristic of purchasing
sophistication, adopted from Gelderman and van Weele (2005; 4.3.1), is ‘clerical activities’.
According to Gelderman and van Weele (2005), clerical activities are a sign of low purchasing
sophistication (Table 21). As such, we argue that the critique given by Dubois and Pedersen
(2002) actually implies that the use of purchasing portfolio models obstructs, rather than
facilitates, the development of a purchasing function’s level of sophistication.
In 4.3.1, we adopted the definition of purchasing sophistication by Pearson and Gritzmacher
(1990, p.93); “the sophistication level of purchasing within an organization determines to a great
extent its role in and integration into the strategic management decision making process”. This
definition implies that a higher level of sophistication corresponds to a higher strategic
recognition of purchasing. As mentioned in 9.1.1, users of purchasing portfolio analysis are
more likely to have a sourcing strategy than non-users. Further, we have established that
companies possessing a sourcing strategy have a significantly higher level of purchasing
sophistication than companies in lack of such a strategy (9.1.1). As such, we argue that our
proposed connection from our survey findings, between the use of purchasing portfolio
approaches and the purchasing function’s level of sophistication, to a large extent refutes this
criticism of purchasing portfolio approaches, in that the use of purchasing portfolio approaches
may increase purchasing’s strategic recognition.
We acknowledge that the arguments by Dubois and Pedersen (2002) may be valid for some
companies; however, we argue that our survey findings indicate that this may be an exception,
and that the use of purchasing portfolio approaches can be associated with a higher level of
purchasing sophistication. From this, we now turn to our action research findings; further
addressing the link between purchasing portfolio approaches and purchasing sophistication.
9.2 Findings from action research
In this section we will provide our findings from action research that relate to the connection
between the topics of purchasing portfolio approaches and purchasing sophistication. First, we
attempt to direct the significant relationship between the use of purchasing portfolio approaches
and the second factor of purchasing sophistication (skills of purchasing professionals); as such
implying causality to the extent possible. Thereafter, we discard the proposed relationship
between purchasing sophistication and tool complexity that was developed in the specialization
project (1.1.6). Finally, we develop a segmentation model for the purchasing portfolio
approaches identified in theory, by using characteristics of purchasing sophistication.
9.2.1 The skills of the purchasing professionals
From our survey research findings (9.1.1), we established two connections between the use of
purchasing portfolio analysis and the company’s level of purchasing sophistication (Figure 49
and Figure 50). In this subsection, we will further elaborate on the direction of these
Purchasing portfolio approaches and purchasing sophistication
207
relationships, based on our findings from action research. Even though we discovered two
connections, our findings from the action research only addresses the latter, which suggests that
purchasing portfolio approaches may be a facilitator for developing skills of the purchasing
professionals; as such increasing the level of sophistication of the purchasing function (Figure
50).
The second factor of purchasing sophistication is determined by two characteristics; skills in
developing strategies and participating in cross-functional teams (8.2; Figure 46). In relation to
the latter characteristic, the action research did not uncover any relevant observations or
discussions as to whether the skills to participate in cross-functional teams were enhanced
during the workshops. This was somewhat expected, as we argue that it takes time and training
to develop such skills. Further, the same line of argument applies for the second indicator of the
skills of purchasing professionals. We found that the participants were positive to the use of
such an approach, as it was stated that they found the concept interesting and considered it
valuable starting point for developing strategies (7.6). We were, however, not able to see a
development of skills during the workshops. We argue that these observations stems from the
time constraint of the action research – one cannot expect development from only a total of two
hours of application. We do, however, believe that if we had been able to fulfill the action
research cycle (2.3.4), using purchasing portfolio approaches over time, the participants would
adapt to using such approaches. As such, they would likely have enhanced their skills in
developing strategies and participating in cross-functional teams.
9.2.2 Discarding the proposed relationship between purchasing
sophistication and tool complexity
In our specialization project, we proposed a connection between the required level of
purchasing sophistication and the comprehensiveness of various purchasing portfolio
approaches (1.1.6; Figure 6). As depicted in Figure 10 (1.2), this connection was challenged
through empirical testing (action research) in this master’s thesis. According to our proposed
connection, the Kraljic approach (1983) should be easier to use than the approach by Olsen and
Ellram (1997), due to its argued lower tool complexity (Figure 6). However, when refining our
framework in relation to the topic of purchasing portfolio approaches (8.1.2), we found that the
extensiveness of the approaches not necessarily reflects their difficulty of use. Here, we argued
that a comprehensive approach may be easier to use, as its guidelines may be more elaborate. As
such, the approach may be more specified, and thus less complex, because complexity is divided
up into subcategories and underlying measures. As such, tool complexity is regarded to be an
insufficient dimension to utilize in differentiating the purchasing portfolio approaches.
Further, in the proposed model, the sophistication dimension was proposed on the basis of an
understanding of purchasing sophistication as “professionalism of the purchasing function”
(1.1.6). However, by investigating the concept of purchasing sophistication in depth in this
master’s thesis (chapter 4), we learned that sophistication may be described by six characteristics
(4.3.1; Table 21). These characteristics are not limited to the skills of the purchasing function
(c.f. professionalism, as was our prior assumption). As such, we see that a model should
preferably incorporate an understanding of purchasing sophistication beyond what was not
Purchasing portfolio approaches and purchasing sophistication
208
limited to the insufficient definition of purchasing sophistication as ‘professionalism of the
purchasing function’, but based on its underlying characteristics.
We still feel that a segmentation of the most prominent purchasing portfolio approaches is
beneficial, as we have discarded the proposed model from the specialization project. Schiele
(2007) proposes that a minimum maturity point exists, under which the implementation of best
practices defeats its own end (4.1.5). We argue that due to the differences of the purchasing
portfolio approaches (e.g. in terms of number of stages and utilizing buyer power; 3.4.2), they
have different minimum maturity points. Following this line of argument, it would be
counterproductive to implement a purchasing portfolio approach with a higher minimum
maturity point than your current level of sophistication. If this was the case, the use of the
purchasing portfolio approach would possibly consume more resources than the approach
would provide benefits. As such, the recognition of purchasing as a contributor to competitive
advantage (Table 21) could probably be compromised, due to disadvantageous usage of the
company’s resources; hence reducing the level of purchasing sophistication. In the next
subsection, we develop a new segmentation model which incorporates stronger concerns for
purchasing sophistication.
9.2.3 Segmenting purchasing portfolio approaches
In this subsection, we develop a segmentation model including the most prevalent purchasing
portfolio approaches (3.4) based on the six characteristics of purchasing sophistication by
Gelderman and van Weele (2005) (Table 21). First, we discuss the characteristics’ ability to
segment the purchasing portfolio approaches. Then, each approach is discussed and evaluated
according to relevant characteristics of sophistication. Finally, we conclude with a model
segmenting the different approaches.
Relevant characteristics of purchasing sophistication in relation to purchasing
portfolio approaches
We here discuss each of the characteristics of purchasing sophistication (Table 21), in relation to
its ability to separate between different purchasing portfolio approaches. First, we argue that
both reporting level and contribution to competitive position are organizational aspects of purchasing
sophistication. From our survey research, we established a connection between these two
characteristics, in that they constitute the first factor of purchasing sophistication (‘Purchasing’s
position’; 8.2.1). Further, in the action research, we discovered that the implementation of a
purchasing portfolio approach may be viewed as a political decision, in that top management
must allocate time and resources for this purpose (PPA_Observation_20). This observation
clearly relates to the first identified factor of purchasing sophistication (8.2.1), in that it implies
both top management attention and the perceived importance of purchasing. We argue that these
characteristics are unfit to distinguish between different approaches; they are, however,
important determinants for the implementation of a purchasing portfolio approach.
Further, we argue that orientation on collaboration may be used to segment the purchasing portfolio
approaches, as we found that the approaches differ with respect to, e.g., the utilization of buyer
power (3.4.2). As such, we will utilize this characteristic when segmenting the approaches.
Purchasing portfolio approaches and purchasing sophistication
209
Further, in relation to the second factor of purchasing sophistication (‘Skills of purchasing
professionals’; 8.2.1), comprising the skills of participating in cross-functional teams and developing
strategies, we argue that this factor as a whole cannot be used to segment the approaches. As
such, we see it beneficial to separate between the two indicators. First, we argue that the skills to
participate in cross-functional teams may be facilitated by the use of purchasing portfolio
approaches (3.3.1; 9.1.1), and that this is an advantage provided by all purchasing portfolio
approaches; not limited to a specific approach. Consequently, we will not use this characteristic
when segmenting the approaches. However, we argue that the required skills associated with
developing strategies will vary between the approaches, as they differ in terms of providing explicit
strategies and guidelines. Hence, this characteristic is brought along to the segmentation of the
approaches.
Finally, the last identified factor of purchasing sophistication (‘Nature of purchasing activities’;
8.2.1) indicates the orientation on clerical duties. We argue clerical activities typically would lie
below the minimum maturity point of using purchasing portfolio approaches; a portfolio
analysis requires a strategic mindset, beyond what recognizes clerical activities. Hence, a strategic
mindset could be argued to be a prerequisite for using any purchasing portfolio approach. As
such, we conclude that orientation on clerical duties cannot be used to separate the approaches.
In the following paragraphs, we discuss more specifically how the relevant characteristics of
purchasing sophistication (orientation on collaboration and developing strategies) may be used to
separate the different purchasing portfolio approaches, and how each of the prevalent
purchasing portfolio approaches relates to the chosen characteristics.
Orientation on collaboration
First of all, we argue that orientation on collaboration has two extremes; at one side, buyer
power is utilized towards the supplier, whereas partnership sourcing is in contrast to this at the
other side. As such, this provides a dimension for segmentation– orientation on collaboration – for
distinguishing between the prevalent purchasing approaches.
Kraljic (1983) clearly states his position in relation to the orientation on collaboration,
emphasizing that the generated sourcing strategy generally must enable the company to exploit
its buyer power against its suppliers – at a lowest possible risk (3.4.2). This is also evident in his
second portfolio matrix (3.4.1), where a determination of the relative bargaining power of the
company is made (Figure 21). As such, Kraljic (1983) represents a purchasing portfolio approach
with a low orientation on collaboration (i.e. emphasis on utilizing buyer power).
The approach by Elliot-Shircore and Steele (1985) does not discuss the usage of buyer power
explicitly (3.4.2), which may suggest that the authors have recognized the potential benefits of
collaborating with suppliers through partnership sourcing, and the danger of purely relying on
utilizing buyer power. This would be an indication of higher level of purchasing sophistication
(Table 21). However, as Elliot-Shircore and Steele (1985) never explicitly mention the benefits
of close partnerships with suppliers, we argue that this is not the case. This argument is
strengthened by the fact that the suggested actions for the different category blocks are focused
Purchasing portfolio approaches and purchasing sophistication
210
on negotiation and monitoring of suppliers (3.4.2). This is an indication of confrontational
sourcing, which may be caused by a focus on buyer power. Further, the portfolio model
employed in the approach by Elliot-Shircore and Steele (1983) evaluates each purchased product
according to its supply vulnerability and value potential (Table 16). As such, there is no need for
more information about the supplier than what is readily available, in order to categorize the
sourced products. Hence, we argue that the purchasing function can rely on a confrontational
sourcing practice. Consequently, the approach by Elliot-Shircore and Steele (1985) has a
somewhat intermediate focus on whether to utilize buyer power in relation to their suppliers.
As mentioned in the comparison of purchasing portfolio approaches (3.4.2), van Weele (2010)
builds his approach on the purchasing portfolio approach by Kraljic (1983) (3.4.1), and shares
his focus on utilizing buyer power. This is supported by the following statement: “In the
author’s view the balance of power should preferably be in favor of the [buyer]…Obviously,
when a company is too dependent on a supplier, something should be done to change the
situation” (van Weele, 2010, p.195; 3.4.2). Hence, we argue that there are few differences in
relation to orientation on collaboration between the approaches by Kraljic (1983) and van Weele
(2010). Consequently, van Weele (2010) represents a purchasing portfolio approach with a low
orientation on collaboration (i.e. emphasis on utilizing buyer power).
Olsen and Ellram (1997) provide a purchasing portfolio approach which realizes the danger
associated with utilizing buyer power in a fluctuating competitive environment (3.4.2). As such,
this approach is not concerned with utilizing buyer power, but rather to collaborate with the
suppliers. This indicates that the approach will not be fully appreciated until the purchasing
function starts to realize the potential of collaborating with the suppliers; moving away from a
focus on utilizing purchasing power. This is further supported by the fact that the authors
developed their approach with the purpose of managing a company’s different suppliers (Table
16). Consequently, we argue that the approach by Olsen and Ellram (1997) represents one of the
approaches with the highest orientation on collaboration.
When comparing the prevalent purchasing portfolio approaches (3.4.2), we discovered that
Bensaou (1999) lies somewhat between the two extremes mentioned above, similar to Elliot-
Shircore and Steele (1985). However, while Elliot-Shircore and Steele (1985) are implicitly using
utilizing buyer power in their generic strategies, the approach by Bensaou (1999) uses power and
dependence in relation to both the dimensions in his approach. Further, Bensaou (1999) does
not provide any generic strategies, and as such we cannot determine to which extent this aspect
of the approach is inspired by orientation on collaboration. Consequently, we argue that the
approach by Bensaou (1999) has an intermediate orientation on collaboration.
Finally, Nellore and Söderquist (2000) provide the only purchasing portfolio approach which
takes the supplier’s perspective, evaluating the supplier’s capabilities and capacities (3.4.2). As
the approach by Nellore and Söderquist (2000) requires such an evaluation, we argue that such
detailed information about the suppliers can only be achieved in a form of partnership; one
rarely attains this type of information from confrontational supplier relationships where buyer
power is utilized. However, we acknowledge that a large buyer, who is a vital customer for the
Purchasing portfolio approaches and purchasing sophistication
211
supplier, could demand such information without having to engage in a form of partnership.
Nevertheless, we argue that this is an exception, and thus conclude that Nellore and Söderquist
(2000) have a high orientation on collaboration.
Developing strategies
According to Gelderman and van Weele (2005), purchasing personnel in companies with a more
sophisticated approach to purchasing will have the skills to develop differentiated purchasing
and supplier strategies (4.1.4; Table 21). However, in our opinion, the purchasing portfolio
approaches vary with respect to the completeness of the provided generic strategies. Hence, we
argue that the least detailed generic strategies require higher skills of the purchasing
professionals in developing sourcing strategies, and vice versa. This was also found in action
research as the participants preferred the approach by Olsen and Ellram (1997) over the Kraljic
matrix (1983)(PPA_Observation_15).As such, this provides the second dimension – required
skills for developing strategies – for distinguishing between the prevalent purchasing approaches.
Starting with the approach by Kraljic (1983), we identify that the approach provides only generic
strategies for the products classified as strategic (3.4.1). Hence, the purchaser must use his own
skills in developing strategies for the remaining three product categories. We argue that this
implies a high level of skills required in developing strategies. However, Kraljic (1983) provides
comprehensive strategies for strategic components (3.4.1). Thus, we argue that Kraljic (1983)
has a somewhat intermediate requirement for skills in developing strategies.
The purchasing portfolio approach by Elliot-Shircore and Steele (1985) is among the least
extensive, as it has only one stage within the approach (Table 16). Further, the approach
provides characteristics, suggested actions and aims for the four different “category blocks”
(Table 16). As such, it provides complete generic strategies for all products placed in the matrix.
Hence, we argue that the approach by Elliot-Shircore and Steele (1985) requires low skills for
developing sourcing strategies.
As mentioned when comparing the different purchasing portfolio approaches (3.4.2), van Weele
(2010) builds his approach on the one developed by Kraljic (1983), however, he provides generic
strategies for all product categories in the employed portfolio model. Consequently, we argue
that the approach by van Weele (2010) has a low requirement for the practitioners’ skills in
developing strategies.
In the remaining three approaches, there is a fundamental change in relation to their
extensiveness, as they employ 2-3 portfolio models each (3.4.1). These remaining approaches
analyze both how the current sourcing strategy is implemented and how the strategy should be (3.4.1).
The purchasing portfolio approach by Olsen and Ellram (1997) is somewhat different to the two
other remaining purchasing portfolio approaches, in that it provides elaborate guidelines as to
how to use it, and the most complete generic strategies (3.4.2). These guidelines take the form of
comprehensive lists of factors to measure for each dimension, descriptions of each quadrant in
the portfolio matrices employed, and prioritization guidelines for the different suggested action
plans (generic strategies). Hence, we argue that, despite analyzing current strategy and how it
Purchasing portfolio approaches and purchasing sophistication
212
should be, the approach by Olsen and Ellram (1997) has a low required level of skills for its use.
This reasoning is supported by PPA_Observation_15.
Bensaou (1999) developed his purchasing portfolio approach with the objective of ensuring that
the portfolio of relationships is effectively managed and adapted to their external context (3.4.1).
However, the author does not provide any generic strategies, rather appropriate management
profiles (3.4.2) As such, much of the work of forming sourcing strategies for each product is left
to the practitioner. Hence, we argue that the purchasing portfolio approach by Bensaou (1999)
requires a high level of skills in developing strategies.
The last of the prevalent purchasing portfolio approaches is the one developed by Nellore and
Söderquist (2000). Out of the approaches discussed, this consists of the most steps (Table 16).
As previously mentioned, it is the only purchasing portfolio approach which explicitly forces the
practitioner to take the suppliers view of the sourcing practice (3.4.2). Hence, we argue that it is
beneficial for the user to have a certain strategic mindset before initiating this approach. Further,
the approach by Nellore and Söderquist (2000) adopts parts of the same portfolio models by
Olsen and Ellram (1997). However, Nellore and Söderquist (2000) do not provide the same
elaborate description, neither with respect to how to use the approach, nor of the generic
strategies (3.4.2). Consequently, we argue that the purchasing portfolio approach by Nellore and
Söderquist (2000) demands a high level of skills to develop sourcing strategy. In the next
paragraph, we summarize this discussion through placing each approach in a segmentation
model.
A segmentation model for purchasing portfolio approaches
We have now presented an evaluation of each prevalent purchasing portfolio approach
according to orientation on collaboration and the required skills for developing strategies. This
discussion is summarized by placing the different approaches in the model depicted in Figure 51
below. As such, we have successfully made a segmentation of the most prevalent purchasing
portfolio approaches, with regards to purchasing sophistication.
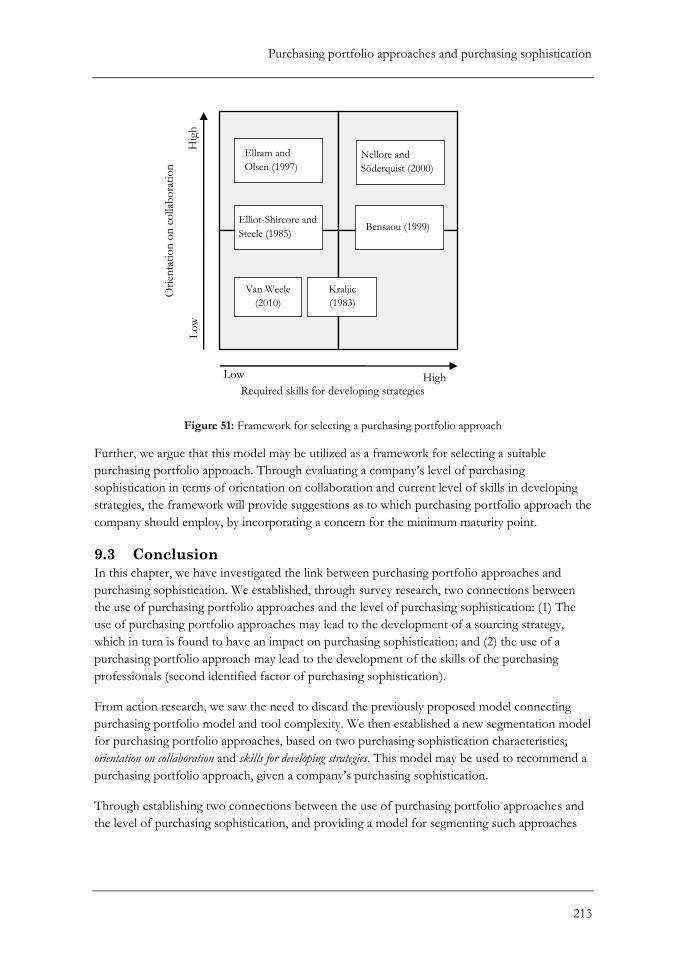
Purchasing portfolio approaches and purchasing sophistication
213
Figure 51: Framework for selecting a purchasing portfolio approach
Further, we argue that this model may be utilized as a framework for selecting a suitable
purchasing portfolio approach. Through evaluating a company’s level of purchasing
sophistication in terms of orientation on collaboration and current level of skills in developing
strategies, the framework will provide suggestions as to which purchasing portfolio approach the
company should employ, by incorporating a concern for the minimum maturity point.
9.3 Conclusion
In this chapter, we have investigated the link between purchasing portfolio approaches and
purchasing sophistication. We established, through survey research, two connections between
the use of purchasing portfolio approaches and the level of purchasing sophistication: (1) The
use of purchasing portfolio approaches may lead to the development of a sourcing strategy,
which in turn is found to have an impact on purchasing sophistication; and (2) the use of a
purchasing portfolio approach may lead to the development of the skills of the purchasing
professionals (second identified factor of purchasing sophistication).
From action research, we saw the need to discard the previously proposed model connecting
purchasing portfolio model and tool complexity. We then established a new segmentation model
for purchasing portfolio approaches, based on two purchasing sophistication characteristics;
orientation on collaboration and skills for developing strategies. This model may be used to recommend a
purchasing portfolio approach, given a company’s purchasing sophistication.
Through establishing two connections between the use of purchasing portfolio approaches and
the level of purchasing sophistication, and providing a model for segmenting such approaches
Ori
enta
tio
n o
n c
olla
bo
rati
on
Required skills for developing strategies
Van Weele
(2010)
Ellram and
Olsen (1997) Nellore and
Söderquist (2000)
Bensaou (1999) Elliot-Shircore and
Steele (1985)
Kraljic
(1983)
Low High
Lo
w
Hig
h

Purchasing portfolio approaches and purchasing sophistication
214
with regards to purchasing sophistication, we argue that we have answered our second research
question in an elaborate and satisfying manner.
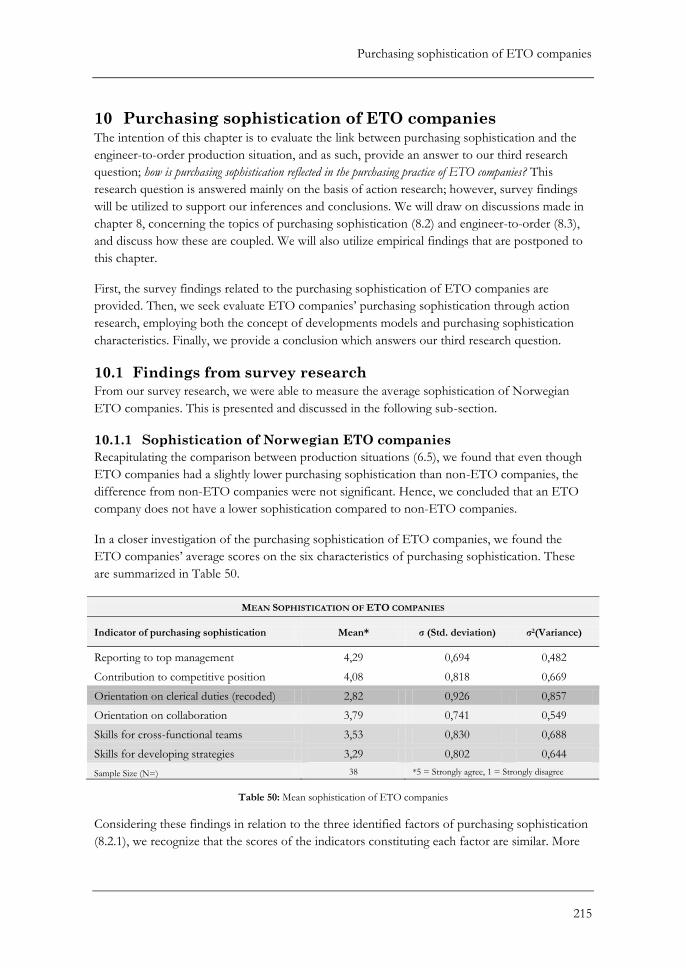
Purchasing sophistication of ETO companies
215
10 Purchasing sophistication of ETO companies The intention of this chapter is to evaluate the link between purchasing sophistication and the
engineer-to-order production situation, and as such, provide an answer to our third research
question; how is purchasing sophistication reflected in the purchasing practice of ETO companies? This
research question is answered mainly on the basis of action research; however, survey findings
will be utilized to support our inferences and conclusions. We will draw on discussions made in
chapter 8, concerning the topics of purchasing sophistication (8.2) and engineer-to-order (8.3),
and discuss how these are coupled. We will also utilize empirical findings that are postponed to
this chapter.
First, the survey findings related to the purchasing sophistication of ETO companies are
provided. Then, we seek evaluate ETO companies’ purchasing sophistication through action
research, employing both the concept of developments models and purchasing sophistication
characteristics. Finally, we provide a conclusion which answers our third research question.
10.1 Findings from survey research
From our survey research, we were able to measure the average sophistication of Norwegian
ETO companies. This is presented and discussed in the following sub-section.
10.1.1 Sophistication of Norwegian ETO companies
Recapitulating the comparison between production situations (6.5), we found that even though
ETO companies had a slightly lower purchasing sophistication than non-ETO companies, the
difference from non-ETO companies were not significant. Hence, we concluded that an ETO
company does not have a lower sophistication compared to non-ETO companies.
In a closer investigation of the purchasing sophistication of ETO companies, we found the
ETO companies’ average scores on the six characteristics of purchasing sophistication. These
are summarized in Table 50.
MEAN SOPHISTICATION OF ETO COMPANIES
Indicator of purchasing sophistication Mean* σ (Std. deviation) σ2(Variance)
Reporting to top management 4,29 0,694 0,482
Contribution to competitive position 4,08 0,818 0,669
Orientation on clerical duties (recoded) 2,82 0,926 0,857
Orientation on collaboration 3,79 0,741 0,549
Skills for cross-functional teams 3,53 0,830 0,688
Skills for developing strategies 3,29 0,802 0,644
Sample Size (N=) 38 *5 = Strongly agree, 1 = Strongly disagree
Table 50: Mean sophistication of ETO companies
Considering these findings in relation to the three identified factors of purchasing sophistication
(8.2.1), we recognize that the scores of the indicators constituting each factor are similar. More
Purchasing sophistication of ETO companies
216
specifically, we discover that the position of purchasing (reporting to top management and
contribution to competitive position) within ETO companies is high. This indicates that
purchasing is recognized in most ETO companies as being an important resource to the firm
and has a high position within the company (Table 21).
In relation to our second factor of purchasing sophistication, skills of purchasing professionals
(skills for participating in cross-functional teams and for developing strategies), we discover that
these indicators score slightly above average. Comparing the indicators of this factor, we
recognize that the skills to participate in cross-functional teams are somewhat higher than skills
for developing strategies.
The third factor of purchasing sophistication, the nature of purchasing activities (orientation of
clerical duties), has the lowest score. This may suggest that purchasing personnel in ETO
companies are mostly concerned with clerical tasks and solving problems with suppliers. These
findings are in accordance with identified theory, which states that purchasing in ETO
companies is of a reactive, rather than pro-active, nature (5.4). It is important to note, however,
that the score on the third factor has the highest standard deviation and variance; as such, it
varies considerably between ETO companies.
Not included in any of the factors, is the characteristic of orientation on collaboration (Table
21), which has one of the highest average scores, implying that ETO companies may have
several collaborative supplier relationships. This finding is not in accordance with ETO theory,
that state that ETO companies are utilizing adversarial trading approaches (Hicks, et al., 2000;
5.4).
In summary, the results from Table 50 show that ETO companies appreciate the value of
purchasing. This is somewhat contradictory, however, to the identified significant lower
purchasing-to-turnover ratio (employed as a measure of purchasing’s importance) of ETO
companies compared to non-ETO companies. From this, we argue that the measure of
purchasing-to-turnover ratio may be a poor indicator of purchasing’s importance. However, we
also acknowledge that the revealed score on position of purchasing from the survey, may be
overrated by respondents. However, potential for improvements are found in the second and
the third factor of purchasing sophistication. Hence, we argue that in order to achieve a higher
level of purchasing sophistication, Norwegian ETO companies must change their reactive
purchasing practice towards a more strategic and pro-active practice. In addition, for achieving
higher sophistication, the purchasers’ skills must be improved.
10.2 Findings from action research
In this section, we utilize our findings from action research and identified theory to assess the
purchasing sophistication of ETO companies. This is done in two steps. First, we use our
refined framework (Figure 47) as a basis for an evaluation of ETO companies with regards to
the development model by van Weele (2010). Second, the refined framework serves as the basis
for a second evaluation of the purchasing sophistication of ETO companies, now using the
identified characteristics of purchasing sophistication (Table 21). Finally, we summarize the two
Purchasing sophistication of ETO companies
217
classifications and propose which is the most appropriate for measuring the purchasing
sophistication of ETO companies.
10.2.1 ETO companies in van Weele’s (2010) development model
When comparing purchasing sophistication characteristics with a purchasing development
model (4.3.2.), we argued that the different stages in the development model by van Weele
(2010) reflect different levels of purchasing sophistication. As such, a development model may
possibly be used to assess a company’s level of purchasing sophistication.
The development model by van Weele (2010) seems to be developed on a general level – for
purchasing functions in all kinds of companies (4.2). Van Weele (2010) does, however, place
various industries in his maturity model (4.2.1;Figure 27). We here seek to assess how the ETO
production situation, rather than an industry, relates to the model.
Using the refined framework of ETO (Figure 47), we see that purchasing practice in ETO
companies comprise elements from various stages in the development by van Weele (2010).
First, we know that purchasing is rather clerical, and that purchasing is done reactively in ETO
companies (5.4). These are both elements of stage 1 in the model of van Weele (2010). Further,
from stage 2 in the model, one recognizes the low cost focus of purchasing identified in theory
(5.4). Action research findings, however, showed that the low cost focus not necessarily is
evident for all ETO companies – they may also have a focus on e.g. quality and communication
when sourcing (Figure 47). Taking other aspects than price into account when sourcing, like the
ones mentioned; is a characteristic of stage 3 in the development model (4.2.1). Also, from the
same stage, utilizing buyer power through coordination between business units towards smaller
suppliers is recognized (Figure 47). In stage 3, however, the purchasing function should have a
focus on cross-functional collaboration and a formulation of purchasing strategy (4.2.1). These
elements have not been recognized to be evident in either theory or empirical findings,
indicating that ETO companies may be below stage three in the model. Further, purchasing
portfolio analysis is said to be used in this stage; and survey findings showed that 47,1% (Table
48) of the sample’s ETO companies are actually using this.
Further, from stage 4 we recognize a move from confrontational sourcing, to partnership
sourcing, as suppliers are included in problem solving activities (4.2.1). From action research, we
found that relationships in ETO companies may be characterized as built on continuity and
trust; however the suppliers were not included in problem solving (Figure 47). Theory on ETO
companies claim that adversarial trading approaches are prevalent in purchasing practice (5.4).
As such, we argue that ETO companies may have characteristics of both stage 3 and 4 in
relation to supplier relationships. Finally, from stage 5, we recognize the use of outsourcing
(Figure 47). From this discussion, we see that ETO companies may comprise elements from five
different stages in the development model by van Weele (2010), as depicted below.
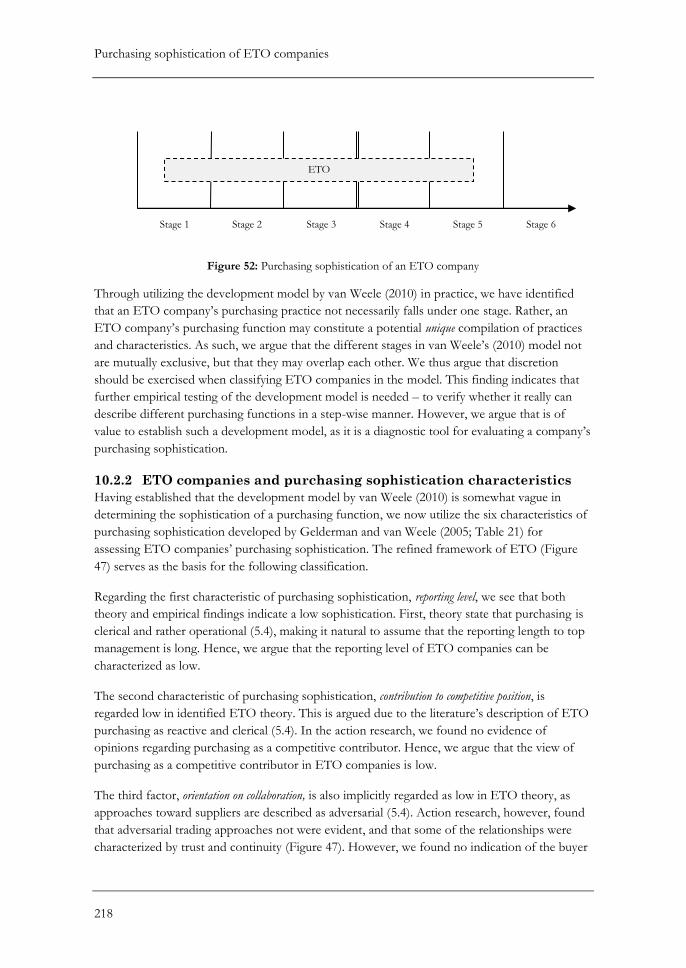
Purchasing sophistication of ETO companies
218
Figure 52: Purchasing sophistication of an ETO company
Through utilizing the development model by van Weele (2010) in practice, we have identified
that an ETO company’s purchasing practice not necessarily falls under one stage. Rather, an
ETO company’s purchasing function may constitute a potential unique compilation of practices
and characteristics. As such, we argue that the different stages in van Weele’s (2010) model not
are mutually exclusive, but that they may overlap each other. We thus argue that discretion
should be exercised when classifying ETO companies in the model. This finding indicates that
further empirical testing of the development model is needed – to verify whether it really can
describe different purchasing functions in a step-wise manner. However, we argue that is of
value to establish such a development model, as it is a diagnostic tool for evaluating a company’s
purchasing sophistication.
10.2.2 ETO companies and purchasing sophistication characteristics
Having established that the development model by van Weele (2010) is somewhat vague in
determining the sophistication of a purchasing function, we now utilize the six characteristics of
purchasing sophistication developed by Gelderman and van Weele (2005; Table 21) for
assessing ETO companies’ purchasing sophistication. The refined framework of ETO (Figure
47) serves as the basis for the following classification.
Regarding the first characteristic of purchasing sophistication, reporting level, we see that both
theory and empirical findings indicate a low sophistication. First, theory state that purchasing is
clerical and rather operational (5.4), making it natural to assume that the reporting length to top
management is long. Hence, we argue that the reporting level of ETO companies can be
characterized as low.
The second characteristic of purchasing sophistication, contribution to competitive position, is
regarded low in identified ETO theory. This is argued due to the literature’s description of ETO
purchasing as reactive and clerical (5.4). In the action research, we found no evidence of
opinions regarding purchasing as a competitive contributor. Hence, we argue that the view of
purchasing as a competitive contributor in ETO companies is low.
The third factor, orientation on collaboration, is also implicitly regarded as low in ETO theory, as
approaches toward suppliers are described as adversarial (5.4). Action research, however, found
that adversarial trading approaches not were evident, and that some of the relationships were
characterized by trust and continuity (Figure 47). However, we found no indication of the buyer
Stage 1 Stage 2 Stage 6 Stage 5 Stage 4 Stage 3
ETO
Purchasing sophistication of ETO companies
219
company having any collaborative initiative towards their suppliers, even though the supplier
relation was characterized as friendly. This low orientation on collaboration coincides with the
theory mentioned above, making us confident in classifying the orientation on collaboration as
low in ETO companies.
The characteristic of skills to participate in cross functional teams is not addressed in ETO theory,
even though it is identified as a need for ETO companies (5.3).In the action research, we found
that the problem holder was not accustomed to working in cross-functional teams, as they did
not see the need for it (7.3.1). As such, they had little training for such collaboration. A finding
that describes this well, is the observation of a participant remaining silent through a longer
period of time, when “his component” or areas of specialization was not the topic of discussion
(PPA_Observation_2). As such, we argue that, due to lack of training, the skills to participate in
cross functional-teams are low.
ETO theory does not address the fifth characteristic of purchasing sophistication, skills for
developing strategies. As for the action research, we found that the participants were not
accustomed to developing formalized strategies; rather, they divided the areas of responsibility
between three purchasers (7.3.1). It is an interesting finding that the participants in the second
workshop actually preferred a purchasing portfolio approach that gave them an explicit strategy,
in spite of a purchasing portfolio approach where they themselves had to develop strategies
(8.1.2). As such, we argue that the skills for developing strategies are low, due to a lack of
interest and experience in such an activity.
The last characteristic, orientation on clerical duties, is mentioned in ETO theory in that the
purchasing practice is said to be reactive and non-strategic (5.4). Considering today’s purchasing
practice of the problem holder (7.3.2), we discover that the ETO company has few contractual
agreements and no collaboration with any of their suppliers. As such, we argue that this
observation coincides with theory. Hence, we argue that this characteristic of purchasing
sophistication of ETO companies also is low.
From the aforementioned discussion, we can further evaluate the three dimensions of
purchasing sophistication (8.2.1) in relation to an ETO company. The first factor, position of
purchasing, may be regarded low, as both the underlying factors of reporting level and
contribution to competitive position are classified as low. The second factor, skills of purchasing
professionals, can be classified as low, as skills of participating in cross-functional teams are low;
and the third factor, position of purchasing, may be classified as low due to the characteristic of
orientation on clerical duties is considered low.
In summary, we have found that all characteristics of purchasing sophistication are regarded as
low in ETO companies. As such, it is plausible to state the purchasing sophistication of
purchasing in total is low for an ETO company.
10.2.3 Evaluating purchasing sophistication
Having employed both a development model and characteristics of purchasing sophistication
for evaluating a company’s purchasing sophistication, we found that the development model
Purchasing sophistication of ETO companies
220
may be too vague in determining a distinct level of purchasing sophistication. However, we
acknowledge the value of the model, in that it provides a more nuanced description of a
company’s level of purchasing sophistication, compared to the characteristics, which are either
classified as high, medium or low.
10.3 Conclusion
In this chapter, we have investigated the link between the ETO production situation and
purchasing sophistication. Survey findings revealed that purchasing’s position in ETO
companies is regarded as high. However, we proposed that there is potential for improvement
regarding the two remaining factors of purchasing sophistication; the nature of purchasing
activities and the skills of the purchasing professionals.
Using our refined framework (Figure 47), we evaluated the purchasing sophistication of an ETO
company, both by employing the development model by van Weele (2010) and the
characteristics of purchasing sophistication (Gelderman and van Weele, 2005). We argued that
the development model by van Weele (2010) was too vague in determining the level of
purchasing sophistication of an ETO company, as we found that a company may possess
elements from various stages in the development model. However, the six characteristics of
purchasing sophistication (Gelderman and van Weele, 2005) revealed that ETO companies can
be classified as having low purchasing sophistication. Consequently, by characterizing the
purchasing sophistication of ETO companies, explaining how and why ETO companies are
classified to have a low purchasing sophistication, we have answered our third research question.
Purchasing portfolio approaches and ETO
221
11 Purchasing portfolio approaches and ETO The intention of this chapter is to evaluate the link between purchasing portfolio approaches
and the engineer-to-order production situation, and as such, provide an answer to our fourth
research question; how can a purchasing portfolio approach be adapted to, and used by, an ETO company
with similar characteristics as Fugro? This research question is answered mainly on the basis of action
research; however, survey findings will be utilized to support our inferences and conclusions.
We will draw on discussions made in chapter 8, concerning the topics of purchasing portfolio
approaches (8.1) and engineer-to-order (8.3), and discuss how these are coupled. We will also
utilize empirical findings that are postponed to this chapter.
In the first section, we use survey research findings to motivate why an ETO company with
similar characteristics as Fugro should use a purchasing portfolio approach. In the next section,
we analyze action research findings in order to establish whether power and dependence
conditions in ETO companies differ from what is identified in literature. Thereafter, we discuss
the ETO adapted portfolio model that was developed in the specialization project. In the third
section, we recommend a purchasing portfolio approach for ETO companies with similar
characteristics as Fugro. Here, we also point to adaptations of the suggested purchasing
portfolio approach, and provide practical guidelines for its use. In the final section, we conclude
this chapter by answering RQ4.
11.1 Findings from survey research
From our investigation of the link between using a purchasing portfolio approach and a
company’s level of purchasing sophistication (9.1), we established a connection between using a
purchasing portfolio analysis and the skills of the purchasing professionals. Further, we implied
a direction on this connection, stating that the use of a purchasing portfolio approach facilitates
the development of skills (9.1.1).
When investigating the link between purchasing sophistication and engineer-to-order
companies, it was discovered from survey research findings that the skills of the purchasing
professionals had a potential for improvement (10.1.1). As such, we establish that ETO
companies would benefit from using a purchasing portfolio approach, as it may facilitate the
development of skills pertaining to the purchasing professionals and in turn increase the
companies’ level of purchasing sophistication. In the section, we discuss action research findings
with respect to the linkage between purchasing portfolio approaches and ETO.
11.2 Findings from action research
In this section, we discuss the action research findings with respect to the linkage between
purchasing portfolio approaches and ETO. We first investigate whether power and dependence
conditions in ETO companies differ from what is identified in literature. Thereafter, we discuss
and discard the ETO adapted portfolio model that was developed in the specialization project
by virtue of action research findings (cf. 1.2; Figure 10).
Purchasing portfolio approaches and ETO
222
11.2.1 Power and dependence
In this subsection, we investigate to which extent the concepts of power and dependence are
prevalent in practice, compared to what is identified in theory on purchasing portfolio
approaches (3.6). This is done through determining the relative power of the supplier
relationship, for a selection of the components investigated in our action research. First, we
present the selection of components, before discussing the distribution of power in these
supplier relationships in the succeeding paragraphs. We conclude this subsection by discussing
the impact of the discovered occurrence of power and dependence on purchasing portfolio
approaches.
Components subject to analysis
In our action research, we applied and introduced a total of three purchasing portfolio
approaches. However, in order to make comparisons with identified theory on the subject of
power and dependence in purchasing portfolio approaches (3.6) we only utilize the findings
from the testing of the Kraljic matrix, as this is the only model previously tested empirically in
relation to buyer power (Caniëls and Gelderman, 2007; 3.6.2). Furthermore, when placing the
different products in the Kraljic matrix, we discovered some discrepancies in classifications
between the two workshops (7.3.1). In order to investigate the concept of power and
dependence, we therefore see it beneficial to closer investigate those components which were
placed in the same quadrant in both workshops, as we argue that these components are
“correctly” classified. Consequently, our investigation of power and dependence is limited to the
following components; lithium batteries31, lead batteries and shell.
Lithium batteries
In our action research, the workshop participants were encouraged to place the battery pack
component within the Kraljic matrix (7.3.1). However, it became apparent during the process
that this battery pack consisted of both lead and lithium batteries (7.3.1). Hence, we see it
beneficial to separate the battery pack in two components, lead and lithium batteries, as each
type has its distinct sourcing practice and the two types are bought separately. In this paragraph,
we provide the analysis of the practice on sourcing the lithium battery, before presenting a
similar discussion on lead batteries in the next paragraph.
Referring to our mapping of today’s practice (7.3.2), the lithium batteries are supplied from a
single French supplier, which is one of the world’s largest manufacturers of this type of product.
Hence, it is obvious that Fugro is a much smaller company in relation to this supplier, and
though their purchase of lithium batteries may constitute a major cost, we argue that this
financial magnitude is small for the supplier. Using the determinants of buyer’s and supplier’s
dependence, depicted in Table 18, we suggest that this argumentation shows that the supplier
may possess a favorable power position.
Further, these batteries are made especially for Fugro, (which entails that the supplier cannot sell
these lithium battery cells to its other customers) (7.3.1); hence, the supplier will lose its market
31 In the first workshop, the battery pack was placed in the matrix, based only on the discussion of the lithium battery, as such the two workshops agree on the placement of this component.
Purchasing portfolio approaches and ETO
223
of this type of lithium battery cell if he terminates the relationship with Fugro. As such, the
supplier has a high switching cost and no alternative buyers, which according to the
determinants of buyer’s and supplier’s dependence (Table 18), generates power for the buying
firm. However, this applies equally for Fugro, as this is the only supplier who can make the
lithium batteries in accordance with Fugro’s important safety requirements (7.3.2). Hence, Fugro
are equally interested in preserving the relationship as the French supplier; as such the power is
balanced in respect to switching cost and availability of other supplier/buyers (Table 18). Then
again, the French supplier is not as dependent on Fugro’s technological expertise as Fugro are of
this supplier; hence the balance of power is shifted towards the supplier in relation to this
variable.
In summary, our knowledge of the supplier relationship towards the French supplier suggests
that the overall buyer’s dependence on the supplier is relatively larger than the supplier’s
dependence on the buyer. Consequently, according to the determinants of buyer’s and supplier’s
dependence (Table 18), we argue that the relative power in relation with the supplier of the
lithium batteries is in favor of the supplier.
Lead batteries
The lead batteries are supplied from a local wholesaler, which is committed to keep a certain
stock of these components (7.3.2). As Fugro do not have any contractual agreements with this
supplier, the commitment of keeping stock shows that the supplier is willing to incur inventory
cost to maintain a relationship with Fugro. Hence, we argue that this indicates that the overall
dependence of the supplier (Table 18) on the buyer (Fugro) is higher than vice versa.
Consequently, in relation to this indicator of dependence, Fugro have the power advantage over
the supplier. This is further supported by the fact that this supplier is a wholesaler; and as such,
we argue that Fugro is not dependent on the supplier’s technological expertise (Table 18). For
instance, Fugro can circumvent the wholesaler and approach the supplier’s suppliers directly, if
necessary. Further, it was stated that there were several suppliers which could provide the same
component, which indicates a high availability of alternative suppliers (7.3.1) and a power
advantage in the relationship toward the supplier.
When evaluating the lead battery in relation to applying the Kraljic matrix, no additional
information, in relation to the other the determinants of buyer’s and supplier’s dependence
(Table 18), was found. However, we argue that we have enough information to conclude that
the relative power in relation with the supplier of the lead batteries is in favor of Fugro. Next,
we analyze the balance of power in the relationship towards the supplier of shells.
Shell
Fugro are currently using a single supplier of the buoy’s shells, which is committed through
contractual agreements to keep a certain stock of these components (7.3.2). We learned that
Fugro are the only customer of these components, implying that the supplier does not have any
available alternative buyers (Table 18), increasing the supplier’s dependence on the buyer.
However, we argue that this argumentation also applies the other way around; Fugro do not
have any other available suppliers capable of providing this component. This reasoning is based
Purchasing portfolio approaches and ETO
224
on the fact that the employed supplier is the only Norwegian supplier capable of performing the
required rotational casting process (7.3.2). Even though they are currently in the process of
finding alternative suppliers (7.3.2), we learned that it takes about six months to go from
prototyping to series production with a new supplier. Consequently, in addition to having few
alternative suppliers, the costs of switching suppliers are significant. Further, the need for the
supplier’s technological expertise is apparent. As such, the supplier has a considerable power
advantage over Fugro. However, as this single supplier delivers to other subsidiaries of the
Fugro Group, a framework agreement have been negotiated with the supplier (7.3.2).
Nonetheless, we argue that this does not change the interdependencies noteworthy.
Consequently, the relative power with the supplier of lead batteries is in favor of the supplier.
In the next paragraph, we summarize the above discussion and further relate it to theory.
Comparisons
Caniëls and Gelderman (2007) observed different power characteristics in buyer-supplier
relationships in the different product categories of the Kraljic matrix (3.6.2). They found, for
instance, that relationships in the strategic and bottleneck quadrants are characterized by
supplier dominance, whereas relationships in the non-critical quadrant are characterized by
buyer dominance. Table 51 below seeks to compare the discovered relative power characteristics
in each supplier relationship, related to the investigated components in action research, and what
we could expect based on the observations done by Caniëls and Gelderman (2007).
RELATIVE POWER OF THE SELECTED COMPONENTS
Relative power
Component Placement in the
workshops
Observed (Caniëls and
Gelderman, 2007)
Results from workshop
analysis
Lithium batteries Strategic Supplier dominance Supplier dominance
Lead batteries Non-critical Buyer dominance Buyer dominance
Shell Bottleneck Supplier dominance Supplier dominance
Table 51: Relative power of selected components
What is evident from Table 51, is that our discovered relative power characteristics in relation to
the selected components coincide with the findings by Caniëls and Gelderman (2007) (3.6.2). As
such, we support their findings, and suggest that an ETO company, with similar characteristics
as Fugro, may have a similar distribution of relative power in their supplier relationships as
companies in other production situations. Further, we see that components with a higher supply
risk are characterized by supplier dominance, which coincides with the statement made by
Caniëls and Gelderman (2005), who relate the concept of power to purchasing portfolio models
(3.6.2). We argue that these findings support the argument by Dubois and Pedersen (2002), in
that differences in power and dependence between buyer and suppliers seem to be a
fundamental assumption behind purchasing portfolio models (3.6).
Purchasing portfolio approaches and ETO
225
In relation to the component positioned within the strategic quadrant (Table 51), we see that
both the analysis of the action research findings and theory (3.6.2) indicate that the supplier has
the relative power in these buyer-supplier relationships. Further, one could argue that the buyer
should avoid such supplier dominated, strategic relationships. However, as learned in action
research, a smaller company may be dependent of such relationships as the strategic supplier
provides the highest quality(ETO_Observation_20). Consequently, we argue that this should be
reflected in the generic strategies provided for this quadrant. Recapitulating theory (3.4.1), we
see that the strategic quadrant of the purchasing portfolio model used in the action research
(Figure 22) is limited to using the “balance strategy” provided by Kraljic (1983) for strategic
products (3.4.1). However, based on the identified prevalence of supplier dominance in these
types of relationships, we argue that it may not be feasible to apply the balance strategy, as it
recommends the establishment of strategic relationships. We argue that a more beneficial
strategy to adopt for the strategic quadrant is the “diversify” strategy (3.4.1) proposed by Kraljic
(1983) for supplier dominated relationships in the strategic quadrant. This strategy implies that
the company has to take a defensive position, and search for alternative suppliers or substitute
items. In this category, the company can, according to Kraljic (1983), consider the option of
backward integrating if there is a shortage on suitable suppliers.
For the non-critical and bottleneck items, the relative power was as expected, based on the
recommended strategies provided by the further developed Kraljic matrix (Figure 22). Hence,
we see no need to make adaptions in relation to power and dependence in these strategies. In
summary, our analysis shows that the concepts of power and dependence are as prevalent in
connection to purchasing portfolio approaches as identified in theory. In addition, we argue that
the strategies recommended by the purchasing portfolio approaches should incorporate a
concern for relative power. As an example, the Kraljic matrix’s strategic quadrant should be
limited to the diversify strategy from the approach by Kraljic (1983), as the supplier has more
power in this quadrant. We acknowledge that power and dependence may change over time;
however, we argue that longitudinal studies are needed to establish its effect on generic strategies
and the positioning of the components in the matrix. In the next subsection, we evaluate and
discard the ETO adapted portfolio model made by the authors in fall 2011.
11.2.2 Discarding the ETO adapted portfolio model
In our specialization project, we proposed an ETO adapted purchasing portfolio model (1.1.6;
Figure 7). As depicted in Figure 10 (1.2), this model was tested in this master’s thesis, through
conducting action research. In the workshops with Fugro, the participants were asked to
evaluate both the value and challenges associated with the proposed portfolio model (7.4.2). The
perceived value of the model was that it did not emphasize the volume of purchases as much as
the other approaches did; as such, it was regarded as more suitable for Fugro. The workshops
participants also regarded the model’s dimensions (degree of customization and relative power
(1.1.6)) to be easy to relate to, which eased the positioning of the components in the model
(7.4.2). While being easy to easy to relate to, the nature of the dimensions were also regarded as
a challenge: In general, does the customization dimension refer to a product that is company
standard and repeatedly manufactured by a supplier, or does it refer to a one-of-a-kind product
made to order? In more detail, three scenarios describing challenges concerning the degree of
Purchasing portfolio approaches and ETO
226
customization dimension were identified in action research: a component may be customized in
the eyes of the customer, even though sub-components are standard products; a component
may be customized in terms of being specified to the customer, and still have a standardized
production process; and, a component may be standard in the eyes of the customer, and
customer specific in the eyes of the supplier (PPA_ETO_Observation_1; 2; 3, respectively). In
addition, one of the participants was reluctant to address relative power at all, in saying that
power is not a thing you think of to start with, “it is something you experience” (7.6).
In retrospect, we also acknowledge that degree of customization may be an underlying factor of
relative power. For instance, if a customized product is a component that is specifically
manufactured repeatedly for the customer, the supplier may have a hold-up problem; i.e., if the
supplier has invested in equipment to make products according to specifications, he is
dependent upon the buyer. As such, the buyer has increased relative power over the supplier.
On the other hand, if the customized product is a one-of-a-kind product made to order, the
supplier may be the only available supplier with sufficient capabilities to make such a product;
implying an increased relative power over the buyer. This is supported by the final positioning of
the products in the ETO adapted model (Figure 42), where we see that most of the components
positioned by the first workshop are located at a diagonal in the matrix. This tendency in the
positions reflects the reasoning above. As such, we suspect that the model distinguishes
products along only one dimension, and hence is not working as intended; distinguishing
products along two dimensions.
In summary, we identified challenges related to the two dimensions of the ETO adapted
portfolio model which undermined purchasing portfolio approaches’ purpose of balancing a
portfolio of relationships (8.1.3). However, it preserved its intention of organizing information
and facilitating communication (8.1.3). We choose to discard the ETO adapted portfolio model
for further use, because we feel that we are able to recommend an existing approach that is able
to attend to all identified main purpose of using a purchasing portfolio approach (8.1.3). This is
the subject for the next section.
11.3 Proposing a purchasing portfolio approach
Earlier in this chapter (11.1), we established that using a portfolio approach is beneficial, as it
may facilitate the development of purchasing professionals’ skills, and as such, the level of
purchasing sophistication. Hence, in this section we seek to propose a suitable purchasing
portfolio approach for ETO companies with similar characteristics as Fugro. First, we elaborate
on the established benefit of using purchasing portfolio approaches with action research
findings. Thereafter, we use the segmentation model (Figure 51) developed in chapter 9, in order
to derive a recommendation for which purchasing portfolio approach to use. Finally, we provide
adaptions of the selected approach, together with guidelines for use and implementation of it.
11.3.1 Motivating the use of purchasing portfolio approaches in ETO
companies
In addition to the mention benefits of using purchasing portfolio approaches (11.1), we
discovered through action research that the use of purchasing portfolio approaches also may: (1)
Purchasing portfolio approaches and ETO
227
Enable pro-active sourcing, through making differentiated sourcing strategies, (2) facilitate
communication, (3) formalize purchasing practice, and (4) codify tacit knowledge. These
benefits of using a purchasing portfolio approach is especially relevant for ETO companies due
to the identified reactive purchasing practice and need for cross-functional integration (Figure
47). In this way, we see the need for the use of purchasing portfolio approaches in ETO
companies, as proven by both survey - and action research. Next, we propose a suitable
purchasing portfolio approach for ETO companies with similar characteristics as Fugro.
11.3.2 Proposing a purchasing portfolio approach for an ETO company
In order to propose a purchasing portfolio approach for an ETO company with similar
characteristics as Fugro, we see it beneficial to utilize our segmentation model developed in
chapter 9 (Figure 51). For being able to use this model, we have to assess the level of purchasing
sophistication in relation to the characteristics of orientation on collaboration and skills for
developing sourcing strategies. Hence, we utilize our findings from chapter 10, which assessed
the relative purchasing sophistication of ETO companies. We rely on the action research
findings, as these more descriptive due their qualitative nature.
First, when regarding the orientation on collaboration of ETO companies with similar characteristics
as Fugro, we found that adversarial trading approaches not were evident; rather, trust and
continuity characterized some of the relationships (Figure 47). However, we found no indication
of the buyer company having any collaborative initiative towards their suppliers, despite the
“friendships” between the companies. As such, we see that it is possible with relationships
towards the supplier built on trust and continuity, without having an orientation on
collaboration. Hence, we argue that ETO companies, similar to Fugro, have a low orientation
on collaboration.
In relation to skills for developing strategies, we discovered in our action research that the
participants were not accustomed to developing sourcing strategies. In addition, the participants
in the second workshop preferred a purchasing portfolio approach that gave them an explicit
strategy, in contrast to a purchasing portfolio approach where they themselves had to develop
strategies. Hence, we argue that the skills for developing strategies are low in companies similar
to Fugro.
Having classified both dimensions of the segmentation model as low, we see it natural to
propose that ETO companies with similar characteristics as Fugro should adopt the purchasing
portfolio approach suggested by van Weele (2010), as the segmentation model propose this
approach for such a level of sophistication - illustrated in Figure 53.
Purchasing portfolio approaches and ETO
228
Figure 53: Proposed purchasing portfolio approach for ETO companies with similar characteristics as Fugro
As such, by recommending the approach by van Weele (2010), we have taken the characteristics
of the ETO production situation into account. In contrast to our suggested ETO adapted
portfolio model from the specialization project, we argue that the approach by van Weele
maintains all the identified purposes approach, including the purpose of balancing the portfolio
of relationships. This is due to the fact that this approach is built upon the model of Kraljic
(1983), which we empirically tested in action research, and found to be able to separate the
components along two dimensions – to a greater extent than the proposed ETO adapted model.
11.3.3 Adaptions to the ETO production situation
Having proposed the use of the van Weele approach (2010) for ETO companies, we argue that
it is beneficial to do some minor adaptions of the approach to further tailor the approach to the
ETO production situation.
It was identified above (11.2.1) that power characteristics are prevalent in the supplier
relationships in ETO companies. In the same section we suggested an adaption of the Kraljic
(1983) in order attend to the revealed power characteristics. We argue that the approach by van
Weele (2010) has to be adapted in a similar manner, for addressing the same power
characteristics. This implies limiting the recommended generic strategies in the strategic
quadrant to the supplier dominated segment (3.4.2); hence proposing a defensive position and
search for new suppliers. Our action research findings supports this adaption, as Fugro indeed
found it hard to establish collaborations with suppliers in this quadrant (ETO_Observation_15),
Ori
enta
tio
n o
n c
olla
bo
rati
on
Required skills for developing strategies
Van Weele
(2010)
Ellram and
Olsen (1997) Nellore and
Söderquist (2000)
Bensaou (1999) Elliot-Shircore and
Steele (1985)
Kraljic
(1983)
Low High
Co
nfr
on
tati
on
Co
llab
ora
tio
n
Purchasing portfolio approaches and ETO
229
making the strategy non-feasible. Next, we present some practical guidelines for implementation
and use of the recommended purchasing portfolio approach.
11.3.4 Practical guidelines
From conducting action research, we gained valuable experience in terms of using a purchasing
portfolio approach. As such, we present some practical guidelines for the use of a purchasing
portfolio approach in an ETO company.
First, we found it valuable to address each of the measures systematically in order to reap as much
relevant information about the component as possible, and making sure that no measure was
forgotten (PPA_Observation_13). We saw evidence of components being placed differently
after new information from measures occurred (PPA_observation_3). As such, we argue that to
get a correct placement of the component, and as such avoid misallocation of resources, all
relevant measures should be taken into consideration.
Second, we argue that it must be explicitly stated that the name of each quadrant and dimension
not are measures in themselves; it should be the underlying measures of the dimensions that
should be addressed. For instance, as discussed in 8.1.2, the name of the quadrants may lead to
pre-dispositions of the component (PPA_Observation_5), downplaying the various measures of
the dimensions. Further, an initial evaluation of the dimension alone may be altered as the
underlying measures are considered (PPA_Observation_8). Hence, we argue that it should be
explicitly stated that the names of the quadrants and dimensions not are measures themselves.
Third, when conducting action research, we saw it valuable to have employees from different
organizational functions participating in the process (PPA_Observation_7). We argue that this is
important for providing more information on each component, and achieving a more balanced
view of components and hence a better subsequent classification. We argue that use of an
external facilitator of the process may be beneficial, in order to involve all participants in this
context, as we found that some practitioners remain passive when classifying a component that
was not his area of responsibility (PPA_Observation_2).
Fourth, the arena and process of using a PPA should stimulate discussion, formalization of practice, and
codification of tacit knowledge (PPA_Observation_21). We argue that one should not rush through
the process of using a purchasing portfolio approach for merely getting an output from the
model itself, but rather facilitate a good process, as there is much value in this
(PPA_Observation_21).
Fifth, for ETO companies specifically, make sure that you are talking about the same component. We
found that using PPA for components that actually are modules are challenging due to the
complex product structure (PPA_Observation_4; PPA_Observation_6; PPA_Observation_11;
PPA_Observation_12). The practitioners should themselves decide whether it is the module as a
whole, or the sub-components that is to be classified in the model.
Purchasing portfolio approaches and ETO
230
Finally, time, resources and a dedicated person should be assigned to implementing PPA, as lack of time,
resources, and designation may impede the implementation of such an approach
(PPA_Observation_18; 19; 20).
This concludes our proposed guidelines for using the proposed purchasing portfolio approach.
Next, a conclusion is provided, answering the fourth research question.
11.4 Conclusion
In this chapter, we have investigated the link between the ETO production situation and the use
of purchasing portfolio approaches, with the intention of answering our fourth research
question. A motivation for the need of using purchasing portfolio approaches in ETO
companies was given with the use of findings from both survey – and action research. We
investigated the prevalence of power and dependence in buyer-supplier relationships, which
revealed that identified power and dependence characteristics, coincides with identified theory.
Further, on the basis of action research, we discarded the proposed ETO adapted model from
the specialization project, as it was revealed that it did not possess all the identified purposes of
using a purchasing portfolio approach. Hence, we argued that there are other, more
advantageous purchasing portfolio approaches. From this, we utilized the developed
segmentation model (Figure 51), in order to propose a more suitable purchasing portfolio
approach for ETO companies with similar characteristics as Fugro. The approach by van Weele
(2010) was proposed, on the basis of the established low sophistication of ETO companies.
Minor adaptions of the approach were proposed, in order to attend to the identified power and
dependence characteristics of buyer-supplier relationships. Finally, by the virtue of our action
research, we were able to give six guidelines for implementation and use of purchasing portfolio
approaches in ETO companies with similar characteristics as Fugro. As such, we have answered
our fourth research question in an elaborate manner.
Purchasing portfolio approaches and ETO
Part IV: Conclusions and implications
In this part, we present our conclusions and implications derived from our research. First, we
present our answers to each of the thesis’ research questions, before providing an answer to the
overall problem formulation. Second, we present the major limitations of our research, and
suggest areas for further research related to these. Finally, implications for relevant stakeholders
are given.
Conclusions
232
12 Conclusions In order to conclude on our findings, we take our four research questions as a point of
departure; we repeat them and give explicit answers to them based on previous discussions.
Finally, to sum up, our problem formulation is discussed.
RQ1: What are important features of purchasing portfolio approaches, purchasing
sophistication and engineer-to-order?
The first research question was answered by constructing a theoretical framework in the first
part of this master’s thesis (theoretical foundation), and further refining it at the outset of the
analysis by including empirical findings from both survey - and action research. Here, we
summarize important features of purchasing portfolio approaches, purchasing sophistication
and engineer-to-order, respectively.
Purchasing portfolio approaches
The context of using a purchasing portfolio approach is the development of sourcing strategies,
i.e. decision processes used to identify which suppliers, form of contract and performance
measures that should be employed for a category of sourced products. As such, three main
identified purposes of using a purchasing portfolio approach are: (1) balancing the portfolio of
relationships; (2) organization of information; and, (3) facilitation of communication. Our survey
research revealed, inter alia, that 47.1% of the responding companies use purchasing portfolio
approaches, and that there is a statistically significant relationship between the use of PPA and:
having a sourcing strategy; having a purchasing department; and, company size.
Comparison between the most prevalent purchasing portfolio approaches (Kraljic, 1983; Elliot-
Shircore and Steele, 1985; Olsen and Ellram, 1997; Bensaou, 1999; Nellore and Söderquist,
2000; van Weele, 2010) revealed that they differ with respect to their contribution and main
characteristics, including their utilization of buyer power, number of stages, having a buyer’s
perspective and their development in relation to each other. Here, our action research indicated
that a more elaborate approach may be easier to use than a perceived simpler one, as it breaks
down the complexity of the sourcing situation through extensive guidance. Further, identified
critique of purchasing portfolio approaches can be divided in four groups, concerning: the
position of the products; the models’ dimensions; relationships and the supplier’s perspective;
and, purchasing’s strategic recognition. Finally, our action research revealed operational
challenges concerning predispositions caused by the quadrants in the models’ names, difficulty
of positioning modular components and the use of an external facilitator when conducting
purchasing portfolio analysis. These operational challenges were not identified in literature;
hence, they expanded our theoretical framework.
Purchasing sophistication
Our chosen definition of the concept states that purchasing sophistication determines to a great
extent purchasing’s role and integration into the strategic management decision making process
(Pearson and Gritzmacher, 1990). However, the identified literature indicates that the closely
related concept of purchasing professionalism and maturity are used interchangeably with
Conclusions
233
purchasing sophistication. In order to achieve a more elaborate understanding of the concept,
we have adopted six characteristics of purchasing sophistication, provided by Gelderman and
van Weele (2005): (1) reporting level; (2) contribution to competitive position; (3) orientation on
collaboration; (4) cross-functional teams; (5) developing strategies; and (6) (non-)clerical
activities. This enabled us to measure purchasing sophistication as a multiple item construct in
our survey research. In turn, an exploratory factor analysis of the survey research data suggested
that purchasing sophistication is in fact a three-dimensional construct. The first factor
(‘purchasing position’) was also found by Gelderman and van Weele (2005) in a similar study.
This factor includes the first and second characteristic of purchasing sophistication. Further, we
found a second factor (‘skills of purchasing professionals’) that includes the fourth and fifth
characteristic. Our third factor (‘nature of purchasing activities’) included the sixth characteristic
of purchasing sophistication; clerical activities. The third characteristic (orientation on
collaboration) cross-loaded on the first and third factor, and consequently, it was excluded from
our factors of purchasing sophistication.
Further, our survey research findings found a statistically significant relationships between:
having a sourcing strategy and the level of purchasing sophistication; using purchasing portfolio
analysis and skills of the purchasing professionals (second factor of sophistication); and having a
purchasing department and skills of the purchasing professionals. In addition, it was identified in
literature that several characteristics of purchasing sophistication have been derived from
purchasing development models. As such, we were keen on testing whether a development
model displays increasing levels of purchasing sophistication, when evolving through increasing
stages of development. We found, using the adopted characteristics of purchasing
sophistication, that the level of purchasing sophistication is, in fact, increasing with the stage
evolution. As such, we also rejected some of the critique of purchasing development model; that
such models do not necessarily reflect an increasing level of sophistication. Finally, we identified
that companies are prone to a minimum maturity point, under which the implementation of best
practice defeat its own ends.
Engineer-to-order
We found that literature on the engineer-to-order (ETO) production situation allegedly is sparse
compared to that of the high-volume production situation. Many authors have tried to classify
production situations like ETO with different taxonomies and terminologies, often using the
concept of customer order decoupling point (CODP) as the point of departure. It is concluded
that no consensus have been made in the literature regarding terminology, but there is an
implicit agreement in the literature that, for an ETO company, the CODP lies at the design
stage of a project. We argue that even though some components may be standardized, at least
parts of the product are engineered-to-order; resulting in this position. This engineering
component (one or several) distinguishes ETO from other production situations.
Theoretically identified characteristics of the ETO production situation are related to: products;
processes; markets; risk and uncertainty; and, identified challenges. Here, action research
findings supported the ETO products’ deep product structure. Further, we found that the
product complexity is not limited to the product itself, but also in sourced components/systems.
Conclusions
234
Further, we verified that postponement may be used to deal with the identified challenge of
change orders. Here, we refined the framework, by adding that communication across functions,
facilitated by co-location, may also contribute to meet this challenge. A need for cross-functional
integration was identified in theory, and subsequently refined through our action research. Here,
we argued that cross-functional coordination may suffice for smaller companies, due to vague
facets between functions and being co-located at the same premises. Finally, we discovered from
our action research that the purchasing practice in a company with similar characteristics as
Fugro somewhat deviates from the clerical, reactive, cost focused adversarial practice stipulated
in theory. We found that some supplier relationships are characterized as “friendships”,
displaying trust and continuity, and that bargaining power may be achieved by bundling
volumes, possibly across subsidiaries.
RQ2: What is the relationship between purchasing sophistication and the use of
purchasing portfolio approaches?
The second research question was answered by investigating how the use of purchasing
portfolio approaches affect purchasing sophistication, and how purchasing sophistication
characteristics relate to the purchasing portfolio approaches presented in this master’s thesis.
First, the use of survey research established that the use of purchasing portfolio approaches may
enhance the skills of purchasing professionals, which is one of three identified factors of
purchasing sophistication. In detail, the use purchasing portfolio approaches enhances the skills
of the purchasing professionals in terms of skills to participate in cross-functional teams, and in
developing strategies, respectively.
Second, it is found that the use of purchasing portfolio approaches is significantly related to the
variable of having a sourcing strategy. As having a sourcing strategy again is found to be
significantly related to purchasing sophistication, this provides a connection between the use of
purchasing portfolio approaches and the concept of purchasing sophistication as a whole.
Finally, the purchasing sophistication characteristics of orientation on collaboration and skills to
develop strategies were found to enable segmentation between various purchasing portfolio
approaches. From this, a segmentation model for purchasing portfolio approaches was
proposed. Based on the logic of minimum maturity points, the segmentation model may
contribute to help companies in choosing an appropriate purchasing portfolio approach, given
their current level of purchasing sophistication. As such, the model depicts how the
characteristics of purchasing sophistication relate to the prevalent purchasing portfolio
approaches.
RQ3: How is purchasing sophistication reflected in the purchasing practice of ETO
companies?
Our third research question was answered through evaluating ETO companies’ purchasing
sophistication through both survey – and action research. ETO companies were evaluated with
respect to the three identified factors of purchasing sophistication: purchasing’s position; skills of
purchasing professionals; and the nature of the purchasing activities. Survey findings indicated that
Norwegian ETO companies regard purchasing’s position in the organization as high, while
viewing the skills of the purchasing professionals as average. The survey research further
Conclusions
235
showed that the orientation on clerical duties in Norwegian ETO companies’ purchasing
practice is high. As such, Norwegian ETO companies classify the underlying factors of
purchasing sophistication with high variety – making it hard to establish one sole classification
of the purchasing sophistication from this research method.
Through the combination of action research findings and identified theory, however, the
purchasing sophistication of Norwegian ETO companies is found to be low. In detail;
purchasing’s position; the skills of the purchasing professionals; and the nature of purchasing’s
activities are all considered low utilizing this research method. Hence, we see diverging evidence
within two factors of purchasing sophistication, in that the two research methods applied
provided different evaluations. However, triangulation of theory, survey – and action research,
establish that Norwegian ETO companies’ orientation towards clerical duties is high.
As such, we argue that purchasing sophistication is reflected in the purchasing practice of ETO
companies, in that the identified purchasing practice, both from theory and empirical findings,
indicates that the factor of orientation on clerical duties is high. The factors of purchasing
position within the company, and skills of purchasing professionals, are ambiguous.
RQ4: How can a purchasing portfolio approach be adapted to, and used by, an ETO
company with similar characteristics as Fugro?
In order to answer the fourth research question, we analyzed the link between purchasing
portfolio approaches and the ETO production situation. As a previously proposed purchasing
portfolio approach for the ETO production situation was discarded with action research, a new
purchasing portfolio approach was proposed on the background of the segmentation model
developed when answering the second research question. Positioning Fugro in the developed
segmentation model led us to suggest that the approach by van Weele (2010) is a suitable
approach for ETO companies with the same characteristics as Fugro.
This approach was further adapted to the ETO context by limiting the strategies provided for
the strategic quadrant to the supplier dominated segment, hence, proposing a defensive position
when searching for new suppliers of components classified in this quadrant. This was done due
to the power characteristics that are prevalent in the buyer-supplier relationships for ETO
companies. Action research findings further supported this adaption, in that recommended
strategies from purchasing portfolio approaches may not be feasible.
Finally, an ETO company with the same characteristics as Fugro may use the proposed
purchasing portfolio approach in accordance with the provided guidelines for use. These
guidelines are developed from action research, and seek to take both processual and ETO
specific factors into account when operationalizing the purchasing portfolio approach. Namely,
these guidelines are: (1) address each of the measures systematically; (2) it should be explicitly
stated that the names of the quadrants and dimensions not are measures themselves; (3) have
employees from different organizational functions participating in the process; (4) the arena and
process of using a purchasing portfolio approach should stimulate discussion, formalization of
practice, and codification of tacit knowledge; (5) make sure that you are talking about the same
Conclusions
236
component; and (6) time, resources and a dedicated person should be assigned to see that the
implementing is successfully carried out.
How does the level of purchasing sophistication affect the use of purchasing portfolio
approaches in Norwegian ETO companies?
Through answering our first research question, we developed the foundation for answering the
three subsequent research questions. The second research question established the link between
purchasing portfolio approaches and the purchasing sophistication, developing a segmentation
model connecting purchasing sophistication characteristics to prevalent purchasing portfolio
approaches. The third research question answered how purchasing sophistication is reflected in
the purchasing practice of ETO companies. As such, the question provided a connection
between ETO and the level of purchasing sophistication, through an assessment of the level of
purchasing sophistication of such companies. Our last research question built on the
aforementioned connections, when utilizing the segmentation model developed to recommend a
suitable purchasing portfolio approach for ETO companies with similar characteristics as Fugro.
This was based on the assessment done in answering the second research question. Through our
mixed methods approach, we have been able to emphasize the benefits to be reaped by, and add
guidelines for easing the implementation of, a purchasing portfolio approach. As such, we argue
that through employing our refined framework, we established a connection between each main
topic in the ternary relationship between purchasing portfolio approaches, purchasing
sophistication and engineer-to-order. This led to a proposed purchasing portfolio approach for
ETO companies with similar characteristics as Fugro. Consequently, we argue that we in a tidy
and extensive manner have provided an answer to our overall problem formulation.
Limitations, further research and implications for the case company
237
13 Limitations, further research and implications for the
case company In this section, we present the major limitations of our research, and suggest topics for further
research in relation to these limitations. Finally, implications for important stakeholders are
given.
13.1 Limitations and further research
Empirical testing
One limitation of this thesis is the lack of empirical testing of some of the concepts introduced.
First, as the discussion on the adapted purchasing portfolio model (11.3.2) is of an analytic,
conceptual nature, the model may not be as applicable in practice for ETO companies as
proposed. Therefore, studying the use of this model in practice, together with the proposed
guidelines, should be an issue in further research. A lack of empirical testing of purchasing
portfolio approaches, in general (3.4.2), also favors further empirical testing such a model. We
argue that action research, as conducted in this thesis, is an appropriate research method for
such empirical testing, as we feel that this research method yielded information beyond what
other, more passive, research methods would have done.
Further, we have argued that the concept of purchasing development models is of highly
conceptual nature, and that it is not empirically tested (4.2.2). As this concept constitutes a part
of the body of knowledge in purchasing literature, we argue that empirical testing is essential in
determining how this concept relates to reality. We propose that thorough case studies may be
an appropriate approach for investigating this concept empirically. The studies should be
conducted both within different industries, like the ones van Weele (2010) place in his model
(4.2.1), and within different production situations, as we have done in this thesis - in order to
increase it applicability for companies in different industries and production situations.
Sources of evidence
A second limitation of this report is the use of only one case company. We argue that the case
company is representative for ETO companies, but acknowledge that the external validity of
only using one case company is low. By conducting multiple case studies, using a replication
logic (Yin, 2009), more valid generalizations can be made, similarities and differences identified,
and theories established.
Action research
The main limitation in our action research is that we preferably should have participated in a
longer action research process with the problem holder. Due to time and resource constraints,
we only got to the “action stage” in the action research cycle (2.3.4). As we found many
interesting findings up to this stage in the cycle, we argue that further research should comprise
of finishing such an action research process, to further enhance the understanding of the use of
purchasing portfolio approaches in ETO companies, and how purchasing sophistication relate
to these research topics. As we have given extensive descriptions of how action research was
conducted in this thesis, we argue that the research design is easily replicated, and that an
Limitations, further research and implications for the case company
238
external researcher as such could either re-do the research, or merely continue the research
process.
Survey research
The main limitation of our survey research is related to its external validity, as we were not able
to establish a sampling frame - which is a premise for using a form of probability sampling
(2.4.6). However, because of our high response rate from the NCE samples (6.2.1.), which were
proven not be subject for nonresponse bias (6.2.6), we argue that our survey findings is
representative for the total NCE sample. From this we argue that our survey research findings
may be generalized to Norwegian maritime companies organized in NCE. However, further
research should be conducted in terms of establishing a sampling frame of Norwegian
production companies, enabling probability sampling with a subsequent investigation of
Norwegian production companies as a whole.
Establishing causalities
In our survey research, we found several significant relations between various variables tested:
Purchasing-to-turnover ratio and having a sourcing strategy; having a sourcing strategy and
company size; having a sourcing strategy and the purchasing portfolio analysis; having a
purchasing department and company size; the use of purchasing portfolio analysis and having a
purchasing department; company size and purchasing portfolio analysis (Figure 39). However,
survey research cannot address causalities between these variables (2.4.5). We have throughout
the analysis indicated the direction of these relationships, but acknowledge that further research
should be conducted for establishing causality. To prove causalities, we propose that
experiments or longitudinal studies should be conducted.
Cross-functional integration
Throughout the thesis, the concept of cross-functional integration and collaboration has been
evident in various discussions. First, the use of cross-functional teams are a characteristic of a
purchasing function of high development (4.2.1), and the skills to participate in such a team is an
indicator of purchasing sophistication (Table 21). Second, it is identified in theory that the use of
purchasing portfolio approaches may facilitate cross-functional coordination and
communication (3.3.1). Third, cross-functional integration is identified as a need in ETO
companies (5.3). As such, we see that all three topics in the ternary relationship (purchasing
portfolio approaches, purchasing sophistication and engineer-to-order), in various degrees,
address cross-functional integration. From this, we argue that further research could be done for
investigating how cross-functional integration relates to these topics in practice. A plausible
hypothesis is that the use of PPA may enhance cross-functional integration, which again
increases purchasing sophistication. We argue that both of these implications favor the use of
purchasing portfolio approaches for ETO companies. Action research, case studies, experiments
and longitudinal studies may be interesting research methods to utilize in such an investigation.
Appropriateness of purchasing portfolio approaches
The extent to which it is equally desirable for all companies in all industries to adapt a
purchasing portfolio approach, should also be a topic for further research. Pagell et al. (2010)
highlighted the importance of this topic, in discovering that several market leading companies
Limitations, further research and implications for the case company
239
performed well despite that they neither used a purchasing portfolio approach nor alternative
purchasing tools. Thus, it should be important to prove the value of incorporating purchasing
tools, before committing resources in an attempt to improve such tools.
The need for purchasing sophistication
In theory, it is assumed that all companies are better off with a highly sophisticated purchasing
function. This is reflected in both in purchasing development models - e.g. van Weele (2010),
and the discussion of purchasing sophistication - e.g. Schiele (2007). However, Dubois and
Wynstra (2005) argue that a purchasing function could do a good job in terms of performance,
even though it does not operate at the highest possible level of sophistication. They point out
that in specific cases, like in small firms, this may be the case; the higher skills and concomitant
high salaries, together with expensive supporting technologies that may come with higher levels
of sophistication, may be a too high price to pay compared with the potential improvements
(Dubois and Wynstra, 2005). We agree in this line of argument, and propose that further
research should be conducted in order to investigate whether a high level of purchasing
sophistication is a goal in itself for all companies. While being outside of the scope of this
master’s thesis, we argue that identified literature from Stabell and Fjeldstad (1998) could be of
interest in such an investigation, addressing three distinct generic value configuration models
required to understand and analyze firm-level value creation. Further, we propose case studies to
be a suitable research method for such an investigation. Case studies should be conducted on a
variety of companies; of different size, in different industries and within different production
situations.
13.2 Implications for management
This thesis has implications for two different stakeholders; the MARGIN research project and
Fugro. First, our research has made a contribution to the MARGIN project, within the research
area of supplier collaboration and management. First, we proposed a segmentation model that
separates various purchasing portfolio approaches in terms of their purchasing sophistication.
This model may be applicable for both Fugro and the other MARGIN collaborators, in finding
a suitable purchasing portfolio approach, given a company’s purchasing sophistication. Second,
we have proposed a purchasing tool applicable for ETO companies having much of the same
characteristics as Fugro – which can be utilized in the MARGIN project. We argue that this tool
may facilitate cross-functional integration, codification of tacit knowledge, formalization of
strategies and communication. Further, the use of such a purchasing tool will provide a
differentiated sourcing strategy, and we argue that the use of such a tool may contribute to
enhancing the strategic recognition of purchasing and enable pro-active sourcing. A purchasing
portfolio model may also enhance the understanding of the complex sourcing context prevalent
for ETO companies.
The model recommended for Fugro, and other ETO companies with similar characteristics, is
the purchasing portfolio approach by van Weele (2010) with minor adaptions (11.3.2). The
following guidelines are proposed for use of such a model:
Limitations, further research and implications for the case company
240
Address each of the measures systematically
It should be explicitly stated that the names of the quadrants and dimensions not are
measures themselves
Have employees from different organizational functions participating in the process
The arena and process of using a PPA should stimulate discussion, formalization of
practice, and codification of tacit knowledge
Make sure that you are talking about the same component
Time, resources and a dedicated person should be assigned to implementing
For Fugro, we further argue that this thesis contributes to managers in terms of a thorough
mapping of the company’s purchasing practice, where we argue that several findings should
have implications. Through employing a purchasing portfolio approach, Fugro will gain
differentiated sourcing strategies, which may enable a more pro-active and conscious sourcing
practice. Further, we argue that the company is better served with an increased degree of cross-
functional coordination and communication when sourcing, and propose the use of a
purchasing portfolio approach to facilitate this. We further argue that a purchasing portfolio
approach may help Fugro in codifying tacit knowledge and in formalizing sourcing practice. We
argue that these implications also will be applicable for other ETO companies with similar
characteristics as Fugro.
Finally, we argue that our research has proven that the use of a purchasing portfolio approach
may enhance the skills of purchasers, and that the usage of sourcing strategies leads to a higher
level of purchasing sophistication. We argue that an increased sophistication will contribute to
the strategic recognition of purchasing and potential economic benefits.
References
241
14 References Alfnes, E. and Strandhagen, J.O., 2000. Enterprise Design for Mass Customisation: The Control Model
Methodology. International Journal of Logistics Research and Applications, 3(2), pp.111-125.
Amaro, G. Hendry, L. and Kingsman, B., 1999. Competitive advantage, customisation and a new
taxonomy for non make-to-stock companies. International Journal of Operations & Production Management,
19(4), pp.349-371.
Armstrong, J.S. and Overton, T.S., 1977. Estimating Nonresponse Bias in Mail Surveys. Journal of Marketing
Research, 14(3), pp.396-402.
Barney, J.B., 2012. Purchasing, supply chain management and sustained competitive advantage: The
relevance of resource-based theory. Journal of Supply Chain Management, 48(2), pp.3-6.
Barry, J., Cavinato, J., Green, A. and Young, R.R., 1996. A development model for effective MRO
procurement. International Journal of Purchasing and Materials Management, 32(3), pp.35–44.
Baskerville, R.L. and Wood-Harper, A.T. 1996. A critical perspective on action research as a method for
information systems research. Journal of Information Technology, 11(3).
Beckman, S.L. and Rosenfield, D.B., 2008. Operations strategy: competing in the 21st century. Boston, USA:
McGraw-Hill/Irwin.
Bensaou, M., 1999. Portfolios of Buyer-Supplier Relationships. MIT Sloan Management Review, 40(4), pp.35-
44.
Bertrand, J.W.M. and Muntslag, D.R., 1993. Production control in engineer-to-order firms. International
Journal of Production Economics, 30-31, pp.3-22.
Bhote, K.R., 1989. Strategic Supply Management. A Blueprint for Revitalizing the Manufacturer–Supplier Relationship.
New York, USA: Amacom.
Boyer, K.K., Ward, P.T. and Leong, G.K. 1996. Approaches to the factory of the future an empirical
taxonomy. Journal of Operations Management, 14 (4) pp. 297–313.
Bryman, A. and Bell, E., 2007. Business research methods, 2nd ed. Oxford University Press.
Bryman, A. and Cramer, D., 2009. Quantitative Data Analysis with SPSS 14, 15 and 16: A Guide for Social
Scientists. 1st ed. Routledge.
Bryman, A., 2006. Paradigm peace and the implications for quality. International Journal of Social Research
Methodology, 9(2), pp.111-126.
Burns, R. (1994), Introduction to Research Methods in Education, 2nd ed., Longman Cheshire,
Melbourne.
Burt, D. N and Doyle, M. F., 1993. The American Keiretsu. Illinois, USA: Business One- Irwin.
Cammish, R. and Keough, M., 1991. A strategic role for purchasing. The McKinsey Quarterly, 3, pp.22–39.
References
242
Caniëls, M.C.J. and Gelderman, C.J., 2005. Purchasing strategies in the Kraljic matrix – A power and
dependence perspective. Journal of Purchasing & Supply Management, 11, pp.141-155.
Caniëls, M.C.J. and Gelderman, C.J., 2007. Power and interdependence in buyer supplier relationships: A
purchasing portfolio approach. Industrial Marketing Management, 36, pp.219-229.
Caron, F. and Fiore, A., 1995. ‘Engineer to order’ companies: how to integrate manufacturing and
innovative processes. International Journal of Project Management, 13(5), pp.313-319.
Carr, A. S. and Pearson, J. N., 1999. Strategically managed buyer–supplier relationships and performance
outcomes. Journal of Operations Management, 17, pp.497–519.
Carter, J. R., and Narasimhan, R., 1996. Is Purchasing Really Strategic? Journal of Supply Chain Management,
32(1), pp.20-28.
Chadwick, T., Rajagopal, S., 1995. Strategic Supply Management: An Implementation Toolkit. Oxford, England:
Butterworth-Heinemann.
Checkland, P., 1991. ``From framework through experience to learning: the essential nature of action
research'', in Nissen, H.E. et al. (Eds), Information Systems Research: Contemporary Approaches and
Emergent Traditions, Elsevier, Amsterdam
Christopher, M., 2011. Logistics and Supply Chain Management, 4th ed. London, England: Financial Times
Prentice Hall.
Cohen, W.M. and Levinthal, D.A., 1990. Absorptive Capacity: A New Perspective on Learning and
Innovation. Administrative Science Quarterly, 35(1), pp.128-152.
Cousins, P., Lamming, R., Lawson, B. and Squire, B., 2008. Strategic Supply Management: Principles, Theories and
Practice. Harlow, England: Pearson Education.
Cox, A., 2004. The art of the possible: relationship management in power regimes and supply chains. Supply
Chain Management, 9(5), pp.346-356.
Croom, S. R., 2000. The Impact of Web-Based Procurement on the Management of Operating Resources
Supply. Journal of Supply Chain Management, 36(1), pp.4-13.
Day, M., Magnan G.M. and Moeller, M.M., 2010. Evaluating the bases of supplier segmentation: A review
and taxonomy. Industrial Marketing Management, 39, pp.625-639.
De Wit, B. and Meyer, R., 2010. Strategy Process, Content, Context. 4th ed. Hampshire, UK: Cengage Learning
EMEA.
Dubois, A. and Gadde, L.-E., 2002. Systematic combining: an abductive approach to case research. Journal
of Business Research, 55(7), pp.553-560.
Dubois, A. and Pedersen, A.-C., 2002. Why relationships do not fit into purchasing portfolio models – a
comparison between the portfolio and industrial network approaches. European Journal of Purchasing &
Supply Management, 8(1), pp.35-42.
References
243
Dubois, A. and Wynstra, F., 2005. Organising the Purchasing Function as an Interface between Internal
and External Networks. In Proceedings of the 21st Annual IMP Conference. Rotterdam, Netherlands.
Elfving, J.A., Tommelein, I.D. and Ballard, G., 2005. Consequences of competitive bidding in project-
based production. Journal of Purchasing and Supply Management, 11, pp.173-181.
Ellinger, A.E., 2000. Improving Marketing/Logistics Cross-Functional Collaboration in the Supply Chain.
Industrial Marketing Management 29, pp. 85–96.
Elliot-Shircore, T.I. and Steele, P.T. (1985): Procurement Positioning overview. Purchasing and Supply
Management, December, pp. 23-26.
Ellram, L. M. and Carr, A, 1994. Strategic purchasing: A history and review of the literature. Journal of Supply
Chain Management, 30(2), pp.10-18.
Ellram, L. M., 1996. A Structured Method for Applying Purchasing Cost Management Tools. Journal of
Supply Chain Management, 32(1), pp.11-19.
Esper, T, Ellinger, A, Stank, T, Flint, D and Moon, M., 2010. Demand and supply integration: A
conceptual framework of value creation through knowledge management. Journal of Academic Marketing
Science, vol. 38, no 5, pp. 5–18.
Eugene J. Webb, Donald T. Campbell, Richard D. Schwartz and Lee Sechrest. Unobtrusive Measures:
Nonreactive Research in the Social Sciences. Chicago. Rand McNally & Company, 1966.
Fabrigar, L.R., Wegener, D.T., MacCallum, R.C. and Strahan, E.J. 1999. Evaluating the Use of Exploratory
Factor Analysis in Psychological Research. Psychological Methods, 4(3), pp. 272-299.
Farmer, D., 1978. Developing Purchasing Strategies. Journal of Purchasing and Materials Management, 14, pp.6-
11.
Farmer, D., 1997. Purchasing myopia – revisited. European Journal of Purchasing & Supply Management, 3(1),
pp.1-8.
Fawcett, S.E. and Magnan, G.M., 2002. The rhetoric and reality of supply chain integration. International
Journal of Physical Distribution & Logistics Management, 32, 5, pp. 339-361.
Regjeringen, 2012. Finansdepartementet. SMB – definisjoner og betydning. [Online]
http://www.regjeringen.no/nb/dep/fin/dok/nouer/1995/nou-1995-16/5/2/1.html?id=336716, accessed
February 2012.
Fox, R.J., Crask, M.R. and Kim, J. 1988. Mail Survey Response Rate: A Meta-Analysis of Selected
Techniques for Inducing Response. The Public Opinion Quarterly, 52 (3), pp.467-491.
Fredriksson, P. and Gadde, L.-E. 2005. Flexibility and rigidity in customization and build-to-order
production. Industrial Marketing Management, 34, pp.695-705.
Freeman, V.T. and Cavinato, J.L. 1990. Fitting purchasing to the Strategic Firm: Frameworks, Processes,
and Values. Journal of Purchasing and Materials Management 26 (1), pp.6-10.
References
244
Frolich, M.T. 2002.Techniques for improving response rates in OM survey research. Journal of Operations
Management, 20, pp.53-62.
Fugro, 2011a. About Fugro OCEANOR [Online] http://www.oceanor.no/about-fugro-oceanor/ ,
accessed November 2011.
Gadde, L.-E. and Snehota, I., 2000. Making the Most of Supplier Relationships. Industrial Marketing
Management, 29, pp.305-316.
Gelderman, C. J. and Semeijn, J., 2006. Managing the global supply base through purchasing portfolio
management. Journal of Purchasing &Supply Management, 12, pp.209-217.
Gelderman, C. J. and Van Weele, A. J, 2002. Strategic Direction through Purchasing Portfolio
Management: A Case Study. Journal of Supply Chain Management, 38(2), pp.30-37.
Gelderman, C. J. and Van Weele, A. J, 2005. Purchasing Portfolio Models: A Critique and Update. Journal of
Supply Chain Management, 41(3), pp.19-28.
Gelderman, C.J., 2003. A Portfolio Approach to the Development of Differentiated Purchasing Strategies. Ph. D.
Eindhoven University of Technology.
Gelderman, C.J., and van Weele, A. (2003): Handling measurement issues and strategic directions in
Kraljic's purchasing portfolio model. Journal of Purchasing & Supply Management, 9, pp. 207-216.
Giesberts, P.M. and van der Tang, L., 1992. Dynamics of the customer order decoupling point: impact on
information systems for production control. Production Planning & Control, 3(3), pp. 300-313.
Giunipero, L. and Zenz, G., 1982. Impact of Purchasing Trends on Industrial Marketers. Industrial
Marketing Management, 11, pp.17-23.
Gosling, J. and Naim, M. M., 2009. Engineer-to-order supply chain management: A literature review and
research agenda. International Journal of Production Economics, 122, pp.741-754.
Gray, C.D and Kinnear, P.R 2012. IBM SPSS Statistics 19 made simple. Hove : Psychology Press.
Greenwood, D.J. and Levin, M., 2007. Introduction to Action Research. Thousand Oaks (CA), USA: Sage
Publications.
Griffin, A. and Hauser, J.R., 1996. Integrating R&D and Marketing: A Review and Analysis of the
Literature. Journal of Product Innovation Management, 13, pp. 191-215.
Gummesson E., 1991. Qualitative Methods in Management Research, 2nd edition. Newbury Park (CA), USA:
Sage Publications.
Gunasekaran, A. and Ngai, E. W. T, 2005. Build-to-order supply chain management: a literature review and
framework for development. Journal of Operations Management, 23, pp.423–451.
Hadeler, B.J., & Evans, J.R. (1994). Supply Strategy: Capturing the value. Industrial management, 36 (4), 3-
4.
References
245
Håkansson, H. and Snehota, I. (1995) Relationships in Business, chapter 1, pp. 1-23 in Håkansson and
Snehota (eds.) Managing Relationships in Business Networks. London: Routledge.
Hardt, C. W., Reinecke, N., & Spiller, P., 2007. Inventing the 21st-century purchasing organization. The
McKinsey Quarterly, 4, pp. 115–124
Hicks, C., McGovern, T. and Earl, C.F., 2000. Supply chain management: A strategic issue in engineer to
order manufacturing. International Journal of Production Economics, 65, pp.179-190.
Hicks, C., McGovern, T. and Earl, C.F., 2001. A Typology of UK Engineer-to-Order Companies.
International Journal of Logistics Research and Applications, 4(1), pp.43-56.
Hirschman, E.C., 1986. Humanistic inquiry in marketing research: Philosophy, method and criteria. Journal
of Marketing Research, 23 (Aug.), 237–249.
Holweg, M. and Pil, F.K., 2001. Successful Build-To-Order Strategies Start With the Customer. MIT Sloan
Management Review, 43(1), pp.74-83.
NSD, 2012. Personvernombudet for forskning[Online] http://www.nsd.uib.no/personvern/index.html,
accessed February 2012.
Hult, M. and Lennung, S. 1980. Towards a definition of action research: a note and a bibliography'. Journal
of Management Studies, 17, pp.241-50.
Ivens, B.S, Pardo, C. and Tunisini, A., 2009. Organizing and integrating marketing and purchasing in
business markets: An introduction to the special issue, issues and implications. Industrial Marketing
Management, 38, pp. 851–856.
Johannessen, A., Christoffersen, L. and Tufte, P.A., 2011. Forskningsmetode for økonomisk-administrative fag.
Oslo, Norway: Abstrakt forlag.
Jüttner, U., Christopher, M., and Baker, S., 2007. Demand-chain management –Integrating marketing and
supply chain management. Industrial Marketing Management, 36, pp. 377–392.
Kahn, K. B., & Mentzer, J. T., 1998. Marketing's integration with other departments. Journal of Business
Research, 42, pp. 53–62.
Keough, M., 1993. Buying your way to the top. The McKinsey Quarterly, 3, pp.41-62.
Kibbeling, M.I, Gelderman, C.J., Ulijn, J. and van Weele, A. 2009. A Dutch-French comparison of
dependence, trust and commitment in buyer-supplier relationships: a purchasing portfolio approach.
International Journal of Business and Globalisation, 3(4), pp. 353-373.
Kingsman, B., Worden, L., Mercer, A. and Wilson, E., 1993. Integrating marketing and production
planning in Make-To-Order companies. International Journal of Production Economics, 30-31, pp.53-66.
Klev, R. and Levin, M., 2009. Forandring som praksis: endringsledelse gjennom læring og utvikling. Bergen:
Fagbokforlaget
References
246
Konijnendijk, P.A., 1994. Coordinating marketing and manufacturing in ETO companies. International
Journal of Production Economics, 37, pp.19-26.
Krajewski, L., Wei, J.C. and Tang, L.-L., 2005. Responding to schedule changes in build-to-order supply
chains. Journal of Operations Management, 23, pp.452-469.
Kraljic, P., 1983. Purchasing Must Become Supply Management. Harward Business Review, 61(5), pp.109-117.
Lamming, R.C. and D. Harrison 2001. Referred to in Gelderman, C.J. and van Weele, A. 2005. Purchasing
Portfolio Models: A Critique and Update. The Journal of Supply Chain Management, 41(3), pp.19-28.
Lampel, J. and Mintzberg, H., 1995. Customizing Customization. MIT Sloan Management Review, 38(1),
pp.21-30.
Leech, N., 2010. Referred in Teddlie C. and Tashakkori, A. 2009. Foundations of mixed methods research. One
thousand Oaks, CA: Sage
Lilliecreutz, J. and Ydreskog, L., 1999. Supplier classification as an enabler for a differentiated purchasing
strategy. Referred to in A. Erridge, R. Fee and J. McIlroy, eds. 2001. Best practice procurement. Hampshire,
England: Gower Publishing Limited. ch.8.
Little, D., Rolling, R., Peck, M. and Porter, K., 2000. Integrated planning and scheduling in the engineer-to-
order sector. International Journal of Computer Integrated Manufacturing, 13(6), pp.545-554.
Lynch, J. and Whicker, L., 2008. Do logistics and marketing understand each other? An empirical
investigation of the interface activities between logistics and marketing. International Journal of Logistics:
Research and Applications, 11(3), pp. 167–178.
MARGIN, 2011a. Prosjektbeskrivelse BIP RFFMIDT.
MARGIN, 2011b. Om prosjektet [Online]. Available from:
http://www.sintef.no/Projectweb/MARGIN/Om-prosjektet/ Accessed October, 2011.
MARGIN, 2011c. English summary [Online]. Available from:
http://www.sintef.no/Projectweb/MARGIN/English-summary1/ Accessed October, 2011.
MARGIN, 2011d. Notat: Kartlegging av Fugro OCEANOR sin verdikjede.
Maritim21, 2010. Kunnskapsnav og infrastruktur [online] http://www.maritim21.no/wp-
content/uploads/2009/12/M21-Rapport-Kunnskapsnav-og-infrastruktur-v1.pdf, Accessed October, 2011.
McGovern, T., Hicks, C. and Earl, C.F., 1999. Modelling Supply Chain Management Processes in
Engineer-to-Order Companies. International Journal of Logistics Research and Application, 2(2), pp.147-159.
McKay, J. and Marshall, P., 2001. Dual imperatives of action research. Information Technology & People, 14(1),
pp.46-59.
Mintzberg, H., 1978. Patterns in Strategy Formulation. Management Science, 24(9), pp.934-948.
Mol, M. J., 2003. Purchasing’s strategic relevance. Journal of Purchasing & Supply Management, 9(1), pp.43-50.
References
247
Monczka, R.M, Handfield, R.B, Giuinipero, L.C., and Patterson, J.L. (2011): Purchasing and Supply Chain
Management. 5th ed. Mason, USA; South-Western, Cengage Learning.
Moses, A. and Åhlström, P., 2008. Problems in cross-functional sourcing decision processes. Journal of
Purchasing & Supply Management, 14, pp. 87–99.
Mudambi, J., 2008. Location, control and innovation in knowledge-intensive industries, Journal of
Economic Geography, 8(5), pp.699-725.
Muntslag, D.R., 1994. Profit and risk evaluation in customer driven engineering and manufacturing.
International Journal of Production Economics, 36, p.97-107.
Murphy, D.J. and Heberling, M.E., 1996. A Framework for Purchasing and Integrated Product Teams.
Journal of Supply Chain Management, Summer, 32, 3, pp. 11-19
Narasimhan, R. and Das, A., 2001. The impact of purchasing integration and practices on manufacturing
performance. Journal of Operations Management, 19, pp. 593–609.
NCE, 2012a, Norske virksomheter i verdenstoppen [Online]:
http://ekstranett.innovasjonnorge.no/templates/Page_Meta____56195.aspx/. Accessed April, 2012.
NCE, 2012b, World Class Clusters – Brochures [Online]:
http://ekstranett.innovasjonnorge.no/templates/Page_Meta____56522.aspx/. Accessed April, 2012.
NCE, 2012c, NCE: Et lærende næringsliv [Online]:
http://ekstranett.innovasjonnorge.no/templates/Page_Meta____60068.aspx/. Accessed April, 2012.
Nellore, R. and Söderquist, K., 2000. Portfolio approaches to procurement: Analyzing the Missing Link to
Specifications. Long Range Planning, 33, pp.245-267.
NHO Trøndelag, 2011. Næringslivet i Trøndelag [Online]:
http://helenorge.nho.no/trondelag/category.php?categoryID=163 Accessed October 2011.
NSD, 2012, Data protection Official for Research [Online]:
http://www.nsd.uib.no/personvern/om/english.html. Accessed April, 2012
NTNU, 2012. Industriell økonomi og teknologiledelse - Studiets oppbygging [Online]
http://www.ntnu.no/studier/mtiot/indok/studieretning. Accessed April, 2012
Nunnally, J.C. 1978. Psychometric theory. 2nd ed. New York : McGraw-Hill
Olhager, J. and Östlund, B., 1990. An integrated push-pull manufacturing strategy. European Journal of
Operational Research, 45(2-3), pp.135-142.
Olhager, J., 2003. Strategic positioning of the order penetration point. International Journal of Production
Economics, 85, pp.319-329.
Olhager, J., 2010. The role of the customer order decoupling point in production and supply chain
management. Computers in Industry, 61, pp.863-868.
References
248
Olsen, R. F. and Ellram, L. M., 1997. A Portfolio Approach to Supplier Relationships. Industrial Marketing
Management, 26(2), pp.101-113.
Onwuegbuzie, A. J. and Leech, N.L. (2006): Linking research questions to mixed methods data analysis
procedures. The qualitative report, 11(3), 474-498
Pagell, M. and Krause, D.R., 2002. Strategic consensus in the internal supply chain: Exploring the
manufacturing- purchasing link. International Journal of Production Reserach, vol. 40, no. 13, pp. 3075-3092.
Pagell, M., 2004. Understanding the factors that enable and inhibit the integration of operations,
purchasing and logistics. Journal of Operations Management, 22, pp. 459–487.
Pagell, M., Wu, Z., Wasserman, M. E., 2010. Thinking differently about purchasing portfolios: An
assessment of sustainable sourcing. Journal of Supply Chain Management, 46(1), pp.57-73.
Pandit, A. and Zhu, Y., 2007. An ontology-based approach to support decision-making for the design of
ETO (Engineer-To-Order) products. Automation in Construction, 16, pp.759-770.
Pearson, J.N. and Gritzmacher, K.J., 1990. Integrating Purchasing into Strategic Management. Long Range
Planning, 23(3), pp.91-99.
Pfeffer, J., 1981. Power in Organizations. Massachusetts, USA: Pitman Publishing Inc.
Piercy, N.F., 2009. Strategic relationships between boundary-spanning functions: Aligning customer
relationship management with supplier relationship management. Industrial Marketing Management, 38, pp.
857–864.
Porter, K., Little, D. and Peck, M., 1999. Manufacturing classifications: relationships with production
control systems. Integrated Manufacturing Systems, 10(4), pp.189-198.
Porter, M.E., 1985. Competitive Strategy. In: M. E. Porter, ed. 1985. Competitive Strategy: Creating and
Sustaining Superior Performance. New York: Free Press.
Quayle, M. 2002. Purchasing in small firms. European Journal of Purchasing & Supply Management, 8, pp. 151-
159.
Ramsay, J. and Croom, S. The impact of evolutionary and developmental metaphors on Purchasing and
Supply Management: A critique. Journal of Purchasing & Supply Management, 14, pp.192– 204.
Ramsay, J., 2001. Purchasing’s strategic irrelevance. European Journal of Purchasing & Supply Management, 7,
pp.257-263.
Reason and Bradbury, 2001.Handbook of Action Research. Sage Publications, London
Reck, R.F. and Long, B.G., 1988. Purchasing: A Competitive Weapon. Journal of Supply Chain Management,
24(3), pp.2-8.
Ringdal, K. 2001. Enhet og mangfold: Samfunnsvitenskapelig forskning og kvantitativ metode. Bergen:
Fagbokforlaget.
References
249
Rozemeijer, F. R., van Weele, A. R. and Weggeman, M., 2003. Creating Corporate Advantage through
Purchasing: Toward a Contingency Model. The Journal of Supply Chain Management, 39(1), pp.4-13.
Rozemeijer, F., 2000. How to manage corporate purchasing synergi in a decentralised company? Towards
design rules for managing and organising purchasing synergy in decentralised companies. European Journal of
Purchasing & Supply Management, 6, pp.5-12.
Rozemeijer, F., 2008. Purchasing myopia revisited again? Journal of Purchasing & Supply Management, 14,
pp.205-207.
Rozemeijer, F., and Wynstra F., 2005. “Organizing for strategic sourcing”. Referred in Axelsson B.,
Rozemeijer F., Wynstra F., 2005. Developing sourcing capabilities. Creating strategic change in purchasing and
supply management, J.Wiley & Sons: Chichester
Schiele, H., 2007. Supply-management maturity, cost savings and purchasing absorptive capacity: Testing
the procurement-performance link. Journal of Purchasing & Supply Management, 13, pp.274-293.
Sheth, J.N., Sharma, A., Iyer, G.R., 2009. Why integrating purchasing with marketing is both inevitable and
beneficial. Industrial Marketing Management, 38, pp. 865–871.
Smart, A. and Dudas, A. 2007. Developing a decision-making framework for implementing purchasing
synergy: a case study. International Journal of Physical Distribution & Logistics Management, 35(1), pp.64-89.
Smirnova, M., Henneberg, S.C., Ashnai, B., Naudé, P. and Mouzas, S., 2011. Understanding the role of
marketing–purchasing collaboration in industrial markets: The case of Russia. Industrial Marketing
Management, 40, pp. 54–64.
Stabell, C.B., Fjeldstad, Ø.D. 1998. Configuring value for competitive advantage: on chains, shops, and
networks. Strategic Management Journal, 19, pp. 413-437
Stavrulaki, E. and Davis, M., 2010. Aligning products with supply chain processes and strategy. The
International Journal of Logistics Management, 21(1), pp.127-151.
Susman, G.I. and Evered, R.D. ,1978. ``An assessment of the scientific merits of action research'',
Administrative Science Quarterly, 23, pp. 582-603.
Tabachnick, B.G., and Fidell, L.S. 2001. Using Multivariate Statistics. 4th ed. Boston: Allyn and Bacon.
Teddlie C. and Tashakkori, A. 2009. Foundations of mixed methods research. Thousand Oaks (CA), USA: Sage.
Terpend, R., Krause, D. R., and Dooley, K. J., 2011. Managing Buyer-Supplier Relationships: Empirical
Patterns of Strategy Formulation in Industrial Purchasing. Journal of Supply Chain Management, 47(1), pp.73-
94.
Trautmann, G., Bals, L. and Hartmann, E., 2009. Global sourcing in integrated network structures: The
case of hybrid purchasing organizations. Journal of International Management, 15, pp.194–208.
Trent, R. J. and Monczka, R. M., 1998. Purchasing and Supply Management: Trends and Changes
Throughout the 1990s. International Journal of Purchasing and Materials Management, 34(4), pp.2-11.
References
250
Turnbull, P.W., 1990. A review of Portfolio Planning Models for Industrial Marketing and Purchasing
Management. European Journal of Marketing, 24(3), pp.7-22.
Van Weele, A. 1996. Revolution in Purchasing. European Journal of Purchasing & Supply Management, 2(4), pp.
153-160.
Van Weele, A. J., 2005. Purchasing &Supply Chain Management: Analysis, Strategy, Planning and Practice, 4th ed.
London, England: Thomson Learning.
Van Weele, A. J., 2010. Purchasing &Supply Chain Management: Analysis, Strategy, Planning and Practice, 4th ed.
Singapore: Seng Lee Press.
Van Weele, A., 2011. Value creation through building responsible Supply Chains. Speech presented at
Norsk Logistikkforum 2011, Oslo, Norway.
Wacker, J.G. and Miller, M., 2000. Configure-to-order planning bills of material: Simplifying a complex
product structure for manufacturing planning and control. Production and Inventory Management Journal, 41(2),
pp.21-26.
Walliman, N. and Buckler, S., 2008. Your dissertation in Education. Wiltshire, Great Britain: SAGE
Publications.
Watts, C.A., Kim, K.Y. and Hahn, C.K. (1995): Linking purchasing to corporate competitive strategy.
Journal of Supply Chain Management. Spring, 31,2, pp.3-8
Webb, E.J., Campbell, D.T., Schwartz, R.D. and Lee Sechrest, L. 1966.Unobtrusive Measures: Nonreactive
Research in the Social Sciences. Chicago : Rand McNally.
Wikner, J. and Rudberg, M., 2005. Integrating production and engineering perspectives on the customer
order decoupling point. International Journal of Operations & Production Management, 25(7/8), pp.623-641.
Williams, A., Giunipero, L. C., & Henthorne, T. L., 1994. The cross-functional imperative: The case of
marketing and purchasing. International Journal of Purchasing and Materials Management, 30(3), pp. 29–33.
Wind, Y. and Mahajan, V. 1981. Designing product and business portfolios. Harvard Business Review,
January-February, pp.155-165
Wortmann, H., 1995. Comparison of information systems for engineer-to-order and make-to-stock
situations. Computers in Industry, 26, pp.261-271.
Wortmann, J.C., 1992. Production management systems for one-of-a-kind products. Computers in Industry,
19, pp.79-88.
NIMA, Nima: Hovedside[Online]: www.nima.no, Accessed April, 2012.
Wynstra, F. and ten Pierick, E., 2000. Managing supplier involvement in new product development: a
portfolio approach. European Journal of Purchasing & Supply Management, 6(1), pp.49-57.
Yin, R. K., 2009. Case Study Research: design and methods, 4th ed. Sage Publications.

References
251
Zaltman, G. 1997. Rethinking market research putting people back, Journal of marketing Research., 34 (Nov.)
(1997), pp.424–437.
Zolkiewski, J. and Turnbull, P., 2002. Do relationship portfolios and networks provide the key to
successful relationship management? The Journal of Business & Industrial Marketing, 17(7), pg.575-59.

Appendices
In this part we provide relevant appendices to this master’s thesis. This is done partly to ensure
the quality of this research and partly as means for the reader’s convenience by providing
summarization of findings. The appendices included in this part are:
A.1: Recapitulating the specialization project methodology
A.2: Action research protocol
A.3: Questionnaire
A.4: Approval from NSD
A.5: Action research observations

- 1 -
A.1 Recapitulating the specialization project methodology As the findings in the specialization project (1.1.6) constitute a point of departure for this
master’s thesis, we feel it necessary to provide an overview of how we executed the research
leading to our conclusions. This is done to ensure reliability, i.e., if a later investigator conducts
the same research, he or she should arrive at the same conclusions (Yin, 2009). We first present
systematic combining, which is the research approach that we utilized. This is followed by a
brief description of our research process, illustrated with the systematic combining framework.
Research methodology in the specialization project
To answer the research questions in the specialization project, two literature reviews and a single
case study of Fugro were conducted, utilizing the systematic combining approach by Dubois and
Gadde (2002). According to Dubois and Gadde (2002), case study research, due to the
intertwined nature of the activities in the research process, is non-linear. For this reason, the
authors claim that a standardized conceptualization of case study research, as a number of
planned subsequent stages, defeats its own end. Dubois and Gadde (2002) argue that, instead, by
constantly changing between different research activities and combining these activities with
empirical and theoretical studies, the researcher will have a more comprehensive understanding
of the studied phenomenon. In systematic combining one continuously moves between an
empirical and theoretical dimension, enabling the theoretical framework, empirical fieldwork and
case analysis to evolve simultaneously and continuously (Dubois and Gadde, 2002). The main
components of systematic combining are illustrated in Figure 54, and are further elaborated
below.
Dubois and Gadde (2002) separate between two activities which are embedded in the systematic
combining process, namely matching and direction and redirection. The first activity relates to
matching theory and reality. This may, for example, be the change to another theoretical
framework than initially chosen, in order to better understand the empirical data that the
researcher has collected. The second activity, direction and redirection, is important to enable
matching; data collection is directed in line with the researcher’s theoretical framework towards
a narrow set of data, and Dubois and Gadde (2002) emphasize that it is important to
complement this process with activities intended to discover aspects of the research that is
unknown to the researcher. By making new discoveries and adding to the dimensions of the
research problem, the study is redirected and a new view on the researched phenomenon is
developed (Dubois and Gadde, 2002).
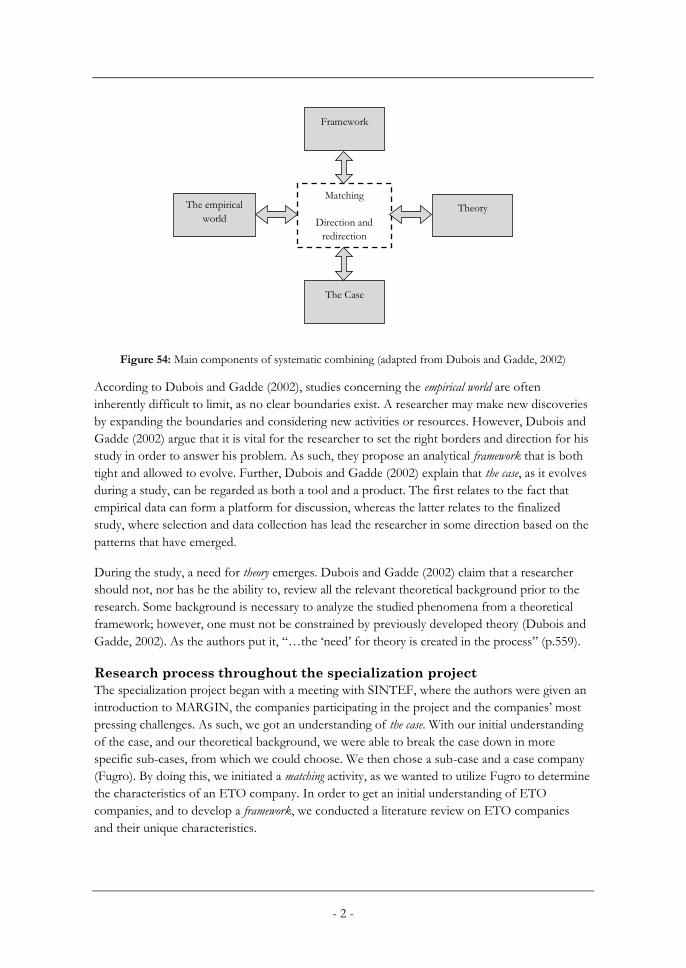
- 2 -
Figure 54: Main components of systematic combining (adapted from Dubois and Gadde, 2002)
According to Dubois and Gadde (2002), studies concerning the empirical world are often
inherently difficult to limit, as no clear boundaries exist. A researcher may make new discoveries
by expanding the boundaries and considering new activities or resources. However, Dubois and
Gadde (2002) argue that it is vital for the researcher to set the right borders and direction for his
study in order to answer his problem. As such, they propose an analytical framework that is both
tight and allowed to evolve. Further, Dubois and Gadde (2002) explain that the case, as it evolves
during a study, can be regarded as both a tool and a product. The first relates to the fact that
empirical data can form a platform for discussion, whereas the latter relates to the finalized
study, where selection and data collection has lead the researcher in some direction based on the
patterns that have emerged.
During the study, a need for theory emerges. Dubois and Gadde (2002) claim that a researcher
should not, nor has he the ability to, review all the relevant theoretical background prior to the
research. Some background is necessary to analyze the studied phenomena from a theoretical
framework; however, one must not be constrained by previously developed theory (Dubois and
Gadde, 2002). As the authors put it, “…the ‘need’ for theory is created in the process” (p.559).
Research process throughout the specialization project
The specialization project began with a meeting with SINTEF, where the authors were given an
introduction to MARGIN, the companies participating in the project and the companies’ most
pressing challenges. As such, we got an understanding of the case. With our initial understanding
of the case, and our theoretical background, we were able to break the case down in more
specific sub-cases, from which we could choose. We then chose a sub-case and a case company
(Fugro). By doing this, we initiated a matching activity, as we wanted to utilize Fugro to determine
the characteristics of an ETO company. In order to get an initial understanding of ETO
companies, and to develop a framework, we conducted a literature review on ETO companies
and their unique characteristics.
Framework
Theory The empirical
world
The Case
Matching
Direction and
redirection
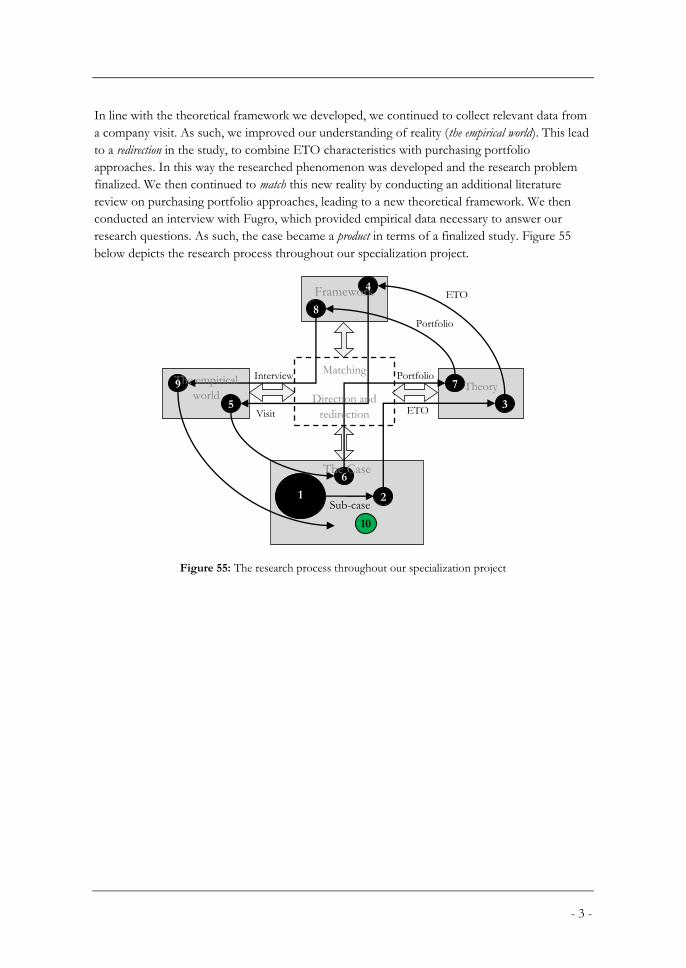
- 3 -
In line with the theoretical framework we developed, we continued to collect relevant data from
a company visit. As such, we improved our understanding of reality (the empirical world). This lead
to a redirection in the study, to combine ETO characteristics with purchasing portfolio
approaches. In this way the researched phenomenon was developed and the research problem
finalized. We then continued to match this new reality by conducting an additional literature
review on purchasing portfolio approaches, leading to a new theoretical framework. We then
conducted an interview with Fugro, which provided empirical data necessary to answer our
research questions. As such, the case became a product in terms of a finalized study. Figure 55
below depicts the research process throughout our specialization project.
Figure 55: The research process throughout our specialization project
Framework
Theory The empirical
world
The Case
Matching
Direction and
redirection
1 2 Sub-case
3
4
5
6
7
8
9
ETO
ETO
Visit
Interview Portfolio
Portfolio
10
- 4 -
A.2 Action research protocol We here present the action research protocol used when preparing and conducting the action
research. The text is in Norwegian, as the action research was conducted in Norwegian. Further,
it is written in an informal form as parts of it are meant to be presented orally.
Introduksjon/ved Fredrik
Presentasjon av oss selv og prosjektet
- Hei. Vi er tre studenter ved Industriell økonomi og teknologiledelse ved NTNU. Vi
skriver prosjekt- og masteroppgave for MARGIN-prosjektet, som dere er deltakere i.
Vårt fokus ligger oppstrøms i verdikjeden, og vi ser spesifikt på bruk av «sourcing
strategier»; mer spesifikt på bruk av porteføljemodeller for innkjøp til dannelse av slike
strategier. Vi har lest og skrevet mye om porteføljemodeller, og har et teoretisk
perspektiv – vi føler nå at det er på tide å prøve dette ut i praksis. Vi håper også at dere
kan lære noe av dette - det er en del av poenget
Forespørsel om diktafon
- For å sikre riktig gjengivelse av samtalen
- Intervjuet vil i etterkant transkriberes på bakgrunn av notater tatt av Børge, samt
diktafon. Opptaket vil slettes rett etter vi har tatt en lokal kopi, for å hindre at
uvedkommende får tilgang til det.
Introduksjon av de som er til stede
- Hvorfor akkurat de
- Vi ønsker også å prøve å ett kryssfunksjonelt samarbeid for å få flere vinklinger på
problemstillingene vi ser på
Hva vi skal gjøre
- Vi skal i dag prøve bruken av porteføljetilnærminger for innkjøp. Det innebærer at man
analyserer sine innkjøp og deretter plasserer disse i ulike kategorier, basert på
forskjellige faktorer (og dimensjoner). Avhengig av plasseringen av produktet, vil man
få anbefalinger om en egnet strategi for hvordan håndtere disse transaksjonene.
- Vi skal prøve å bruke et par forskjellige modeller for å belyse ulike aspekter ved en
komponent man kjøper inn.
- Vi kommer til å introdusere modellen først, før vi ønsker at dere skal plassere et utvalg
produkter (komponenter) som dere kjøper inn til bedriften.
- Så ser vi om det lar seg gjøre, eller om det ikke passer. Kanskje modellene klarer å
belyse elementer ved innkjøp man ikke har tenkt på? Kanskje prosessen viser svakheter
med modellene?
- Vår hypotese er at modellene er teoretiske å bruke. Vi er uansett fornøyd med alle
utfall – alt er resultater. Vi håper også at disse modellene kan hjelpe dere med å belyse
aspekter ved dagens innkjøpssituasjon som man ikke har tenkt på.
- 5 -
Vår rolle
- Vår rolle vil være å introdusere modellene som skal prøve å belyse ulike elementer ved
innkjøpssituasjonen. Vi skal prøve å «dra dere gjennom» et utvalg modeller og styre
diskusjonen rundt bruken, men det er dere som står for «arbeidet»/diskusjonen.
- En av oss vil også transkribere og observerer det vi gjør Dette vil bli behandlet
konfidensielt.
Deres rolle
- Som eksperter på ulike områder i driften håper vi at dere kan være med på å belyse
ulike aspekter ved en komponent/produkt.
- Vi håper at dere bidrar med deres syn på komponenter, produkter, leverandører og
innkjøpssituasjonen generelt.
- Vi ønsker at dere tenker og diskuterer høyt
Spørsmål?
Praktiske hensyn
- Figurer vil bli vist i en power point-presentasjon
- Plassering av komponenter vil skje på ark med Post-it eller ved å tegne inn på ark.
- Samme fremgang vil bli brukt for begge workshop’ene. Designet av disse er altså likt,
men vi regner med at prosessen vil gå ulike veier.
- Hver workshop varer cirka 2 timer med innlagt pause
Test av Kraljic-matrisen/ved Mads
Vi starter med å prøve den porteføljetilnærmingen som er mest brukt i dag: Kraljic-matrisen.
Grunntanken her er at innkjøpsstrategi er spesifikk for hver enkel bedrift, og ved å vurdere den
strategiske viktigheten av innkjøpet (i form av «value added», påvirkning på profitt med mer) og
kompleksiteten til innkjøpsmarkedet (leverandørmangel, teknologiutvikling, med mer), så kan man
bestemme den nødvendige innkjøpstilnærmingen. Vi bruker her en modifisert utgave av den
originale porteføljetilnærmingen fra 1983. Denne tilnærmingen består av å bruke en enkelt
porteføljemodell til å gi anbefalinger for hvordan håndtere ulike innkjøp. Ved å analysere hvert
kjøpte produkt etter kriteriene profit impact and supply risk, kan man plassere produktet i en av fire
forskjellige kategorier (vist i figuren). Figuren vises ppt-presentasjon.
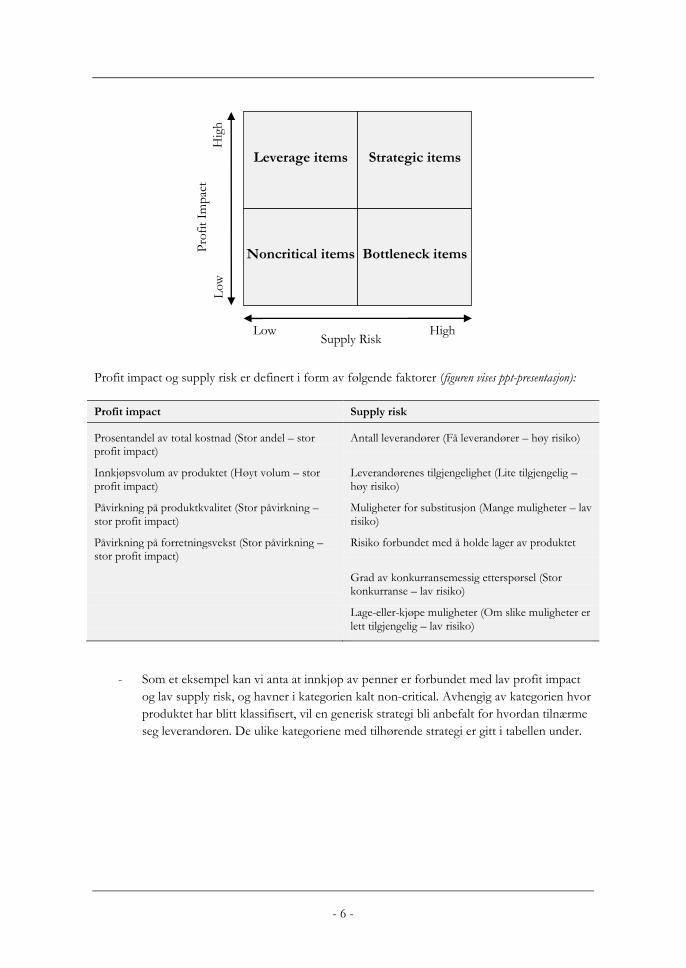
- 6 -
Profit impact og supply risk er definert i form av følgende faktorer (figuren vises ppt-presentasjon):
Profit impact Supply risk
Prosentandel av total kostnad (Stor andel – stor profit impact)
Antall leverandører (Få leverandører – høy risiko)
Innkjøpsvolum av produktet (Høyt volum – stor profit impact)
Leverandørenes tilgjengelighet (Lite tilgjengelig – høy risiko)
Påvirkning på produktkvalitet (Stor påvirkning – stor profit impact)
Muligheter for substitusjon (Mange muligheter – lav risiko)
Påvirkning på forretningsvekst (Stor påvirkning –stor profit impact)
Risiko forbundet med å holde lager av produktet
Grad av konkurransemessig etterspørsel (Stor konkurranse – lav risiko)
Lage-eller-kjøpe muligheter (Om slike muligheter er lett tilgjengelig – lav risiko)
- Som et eksempel kan vi anta at innkjøp av penner er forbundet med lav profit impact
og lav supply risk, og havner i kategorien kalt non-critical. Avhengig av kategorien hvor
produktet har blitt klassifisert, vil en generisk strategi bli anbefalt for hvordan tilnærme
seg leverandøren. De ulike kategoriene med tilhørende strategi er gitt i tabellen under.
Low High Supply Risk
Lo
w
Hig
h
Pro
fit
Imp
act
Leverage items
Strategic items
Noncritical items
Bottleneck items
- 7 -
Kategori Strategi
Non-critical products
Effektiv prosessering
Ikke-kritiske produkter har en lav verdi og bedriften ønsker derfor å redusere transaksjonskostnaden til det absolutte minimum for disse produktene. Strategiene for denne kategorien sikter derfor mot å redusere transaksjonskostnader gjennom effektiv prosessering, produkt standardisering, ordrevolum og lageroptimering. E-procurement har for eksempel blitt brukt mye her i nyere tid.
Leverage products
Utnyttelse av innkjøpsmakt
For «leverage-produkter» har bedriften muligheten til å utnytte en lav «supply risk» og bruke innkjøpsmakten, gitt ved å konsolidere innkjøpet. Strategier for denne kategorien involverer anbud, målprising, bruk av flere leverandører og utbytting av produkter, med den hensikt å oppnå en best mulig avtale. Leverandøravtalene skal også helst være kortsiktige.
Bottleneck products
Volum sikring, søk etter alternativer
Flaskehalsprodukter representerer produkter som er viktig for leveransen av sluttproduktet, men er av lav verdi. Vanlige elementer i strategier innenfor denne kategorien er volumsikring, leverandørkontroll og sikkerhetslager, og backup-planer.
Strategic products
Partnerskap med leverandør
For strategiske produkter er det fordelaktig å danne et partnerskapsforhold med leverandøren for å redusere risiko gjennom felles tillit og forpliktelser. Et nært og langsiktig samarbeid med leverandøren vil lede til forbedringer i produkt design og utvikling, kvalitet, ledetid og kostnadsreduksjon.
Vi ønsker at dere skal prøve å plassere produkter som dere kjøper inn. Bruk konsensusmetoden.
Plassering av komponenter
Vi ønsker at dere plasserer følgende komponenter:
- Fortøyning
- Treghetssensor
- Skall
- Datalogger
- Batteripakke
Evaluering for hver kategori
- Hva er dagens praksis for denne type produkt?
- Hvorfor er dagens praksis slik?
- Hvorfor et produkt er plassert i den spesifikke kvadranten?
- Er posisjoneringen i henhold til forventningene?
- Hva er tolkningen av resultatene?
Presenterer deretter hvilken generell strategi som gjelder for denne kategorien av produkter
Diskusjon
- Sammenlikne med dagens praksis.
- Hva er hovedforskjellene mellom anbefalt og implementert praksis?
- Er anbefalt praksis realistisk? Hvorfor, hvorfor ikke?
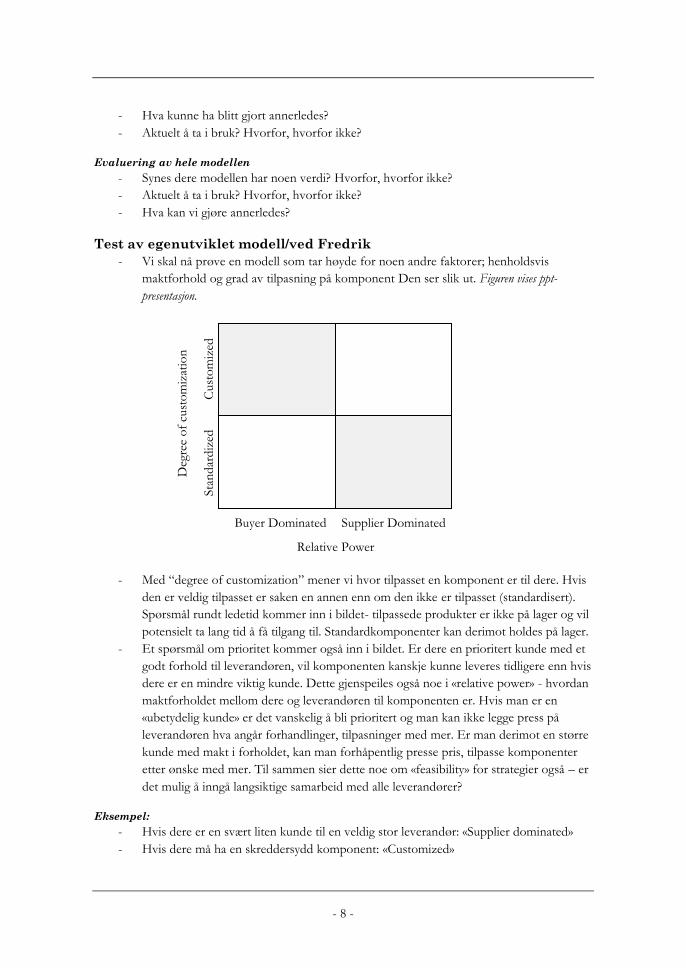
- 8 -
- Hva kunne ha blitt gjort annerledes?
- Aktuelt å ta i bruk? Hvorfor, hvorfor ikke?
Evaluering av hele modellen
- Synes dere modellen har noen verdi? Hvorfor, hvorfor ikke?
- Aktuelt å ta i bruk? Hvorfor, hvorfor ikke?
- Hva kan vi gjøre annerledes?
Test av egenutviklet modell/ved Fredrik
- Vi skal nå prøve en modell som tar høyde for noen andre faktorer; henholdsvis
maktforhold og grad av tilpasning på komponent Den ser slik ut. Figuren vises ppt-
presentasjon.
- Med “degree of customization” mener vi hvor tilpasset en komponent er til dere. Hvis
den er veldig tilpasset er saken en annen enn om den ikke er tilpasset (standardisert).
Spørsmål rundt ledetid kommer inn i bildet- tilpassede produkter er ikke på lager og vil
potensielt ta lang tid å få tilgang til. Standardkomponenter kan derimot holdes på lager.
- Et spørsmål om prioritet kommer også inn i bildet. Er dere en prioritert kunde med et
godt forhold til leverandøren, vil komponenten kanskje kunne leveres tidligere enn hvis
dere er en mindre viktig kunde. Dette gjenspeiles også noe i «relative power» - hvordan
maktforholdet mellom dere og leverandøren til komponenten er. Hvis man er en
«ubetydelig kunde» er det vanskelig å bli prioritert og man kan ikke legge press på
leverandøren hva angår forhandlinger, tilpasninger med mer. Er man derimot en større
kunde med makt i forholdet, kan man forhåpentlig presse pris, tilpasse komponenter
etter ønske med mer. Til sammen sier dette noe om «feasibility» for strategier også – er
det mulig å inngå langsiktige samarbeid med alle leverandører?
Eksempel:
- Hvis dere er en svært liten kunde til en veldig stor leverandør: «Supplier dominated»
- Hvis dere må ha en skreddersydd komponent: «Customized»
Relative Power
Buyer Dominated Supplier Dominated
Sta
nd
ard
ized
C
ust
om
ized
Deg
ree
of
cust
om
izat
ion
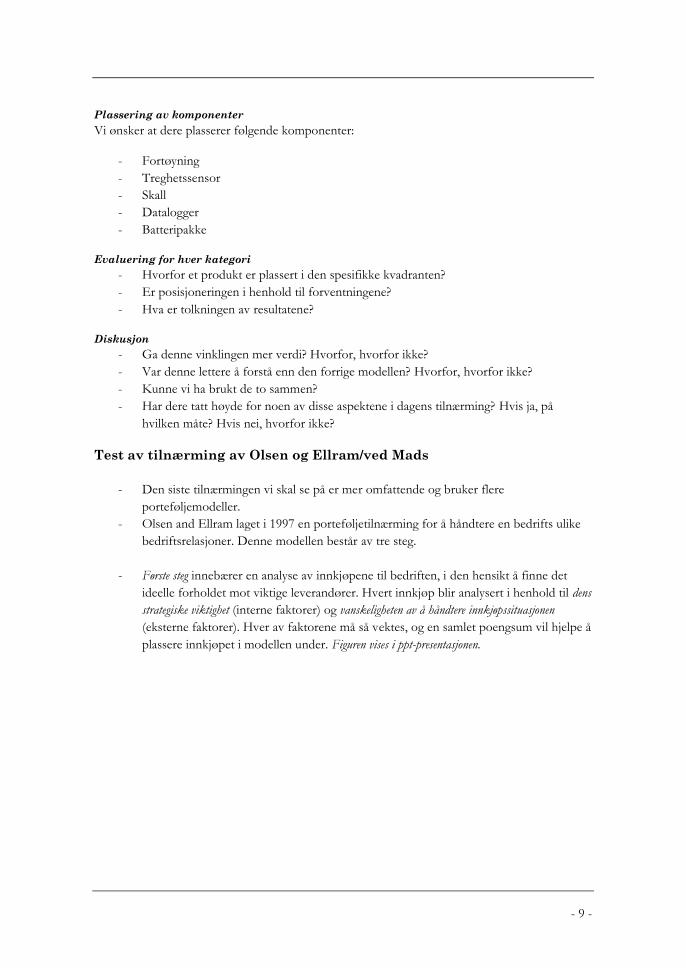
- 9 -
Plassering av komponenter
Vi ønsker at dere plasserer følgende komponenter:
- Fortøyning
- Treghetssensor
- Skall
- Datalogger
- Batteripakke
Evaluering for hver kategori
- Hvorfor et produkt er plassert i den spesifikke kvadranten?
- Er posisjoneringen i henhold til forventningene?
- Hva er tolkningen av resultatene?
Diskusjon
- Ga denne vinklingen mer verdi? Hvorfor, hvorfor ikke?
- Var denne lettere å forstå enn den forrige modellen? Hvorfor, hvorfor ikke?
- Kunne vi ha brukt de to sammen?
- Har dere tatt høyde for noen av disse aspektene i dagens tilnærming? Hvis ja, på
hvilken måte? Hvis nei, hvorfor ikke?
Test av tilnærming av Olsen og Ellram/ved Mads
- Den siste tilnærmingen vi skal se på er mer omfattende og bruker flere
porteføljemodeller.
- Olsen and Ellram laget i 1997 en porteføljetilnærming for å håndtere en bedrifts ulike
bedriftsrelasjoner. Denne modellen består av tre steg.
- Første steg innebærer en analyse av innkjøpene til bedriften, i den hensikt å finne det
ideelle forholdet mot viktige leverandører. Hvert innkjøp blir analysert i henhold til dens
strategiske viktighet (interne faktorer) og vanskeligheten av å håndtere innkjøpssituasjonen
(eksterne faktorer). Hver av faktorene må så vektes, og en samlet poengsum vil hjelpe å
plassere innkjøpet i modellen under. Figuren vises i ppt-presentasjonen.
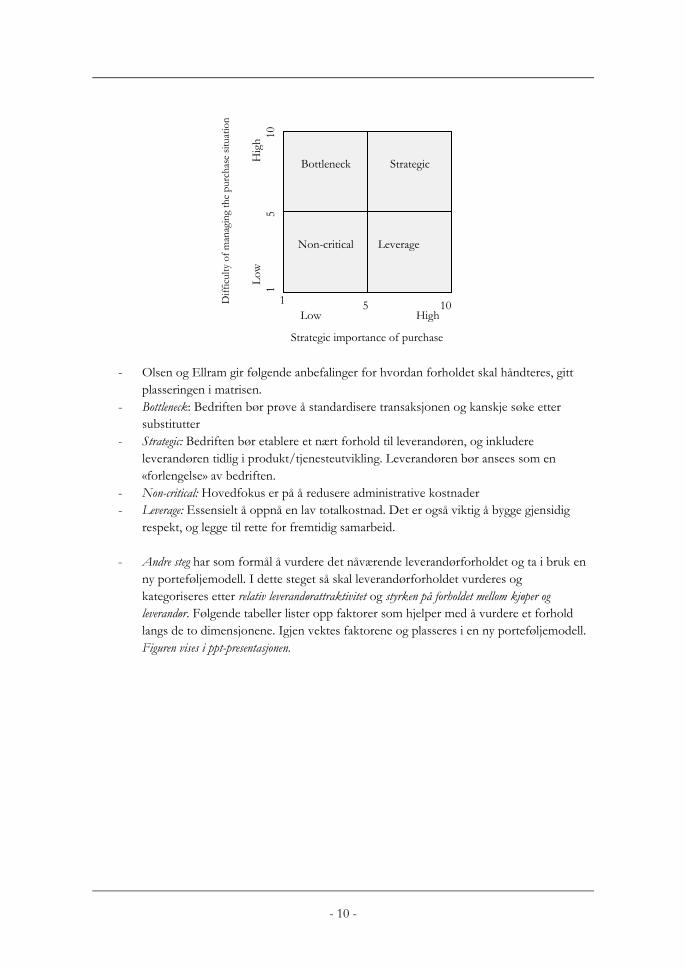
- 10 -
- Olsen og Ellram gir følgende anbefalinger for hvordan forholdet skal håndteres, gitt
plasseringen i matrisen.
- Bottleneck: Bedriften bør prøve å standardisere transaksjonen og kanskje søke etter
substitutter
- Strategic: Bedriften bør etablere et nært forhold til leverandøren, og inkludere
leverandøren tidlig i produkt/tjenesteutvikling. Leverandøren bør ansees som en
«forlengelse» av bedriften.
- Non-critical: Hovedfokus er på å redusere administrative kostnader
- Leverage: Essensielt å oppnå en lav totalkostnad. Det er også viktig å bygge gjensidig
respekt, og legge til rette for fremtidig samarbeid.
- Andre steg har som formål å vurdere det nåværende leverandørforholdet og ta i bruk en
ny porteføljemodell. I dette steget så skal leverandørforholdet vurderes og
kategoriseres etter relativ leverandørattraktivitet og styrken på forholdet mellom kjøper og
leverandør. Følgende tabeller lister opp faktorer som hjelper med å vurdere et forhold
langs de to dimensjonene. Igjen vektes faktorene og plasseres i en ny porteføljemodell.
Figuren vises i ppt-presentasjonen.
Bottleneck
Non-critical Leverage
Strategic
Low High
5
5 10
Strategic importance of purchase
Lo
w
Hig
h
1
1
10
Dif
ficu
lty
of
man
agin
g th
e p
urc
has
e si
tuat
ion
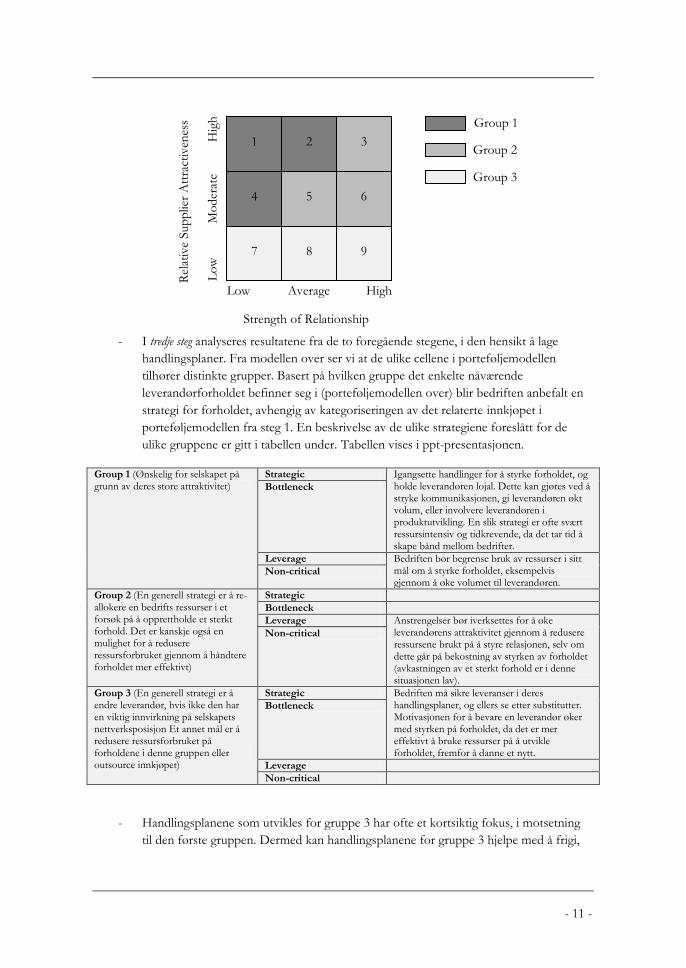
- 11 -
- I tredje steg analyseres resultatene fra de to foregående stegene, i den hensikt å lage
handlingsplaner. Fra modellen over ser vi at de ulike cellene i porteføljemodellen
tilhører distinkte grupper. Basert på hvilken gruppe det enkelte nåværende
leverandørforholdet befinner seg i (porteføljemodellen over) blir bedriften anbefalt en
strategi for forholdet, avhengig av kategoriseringen av det relaterte innkjøpet i
porteføljemodellen fra steg 1. En beskrivelse av de ulike strategiene foreslått for de
ulike gruppene er gitt i tabellen under. Tabellen vises i ppt-presentasjonen.
Group 1 (Ønskelig for selskapet på grunn av deres store attraktivitet)
Strategic Igangsette handlinger for å styrke forholdet, og holde leverandøren lojal. Dette kan gjøres ved å stryke kommunikasjonen, gi leverandøren økt volum, eller involvere leverandøren i produktutvikling. En slik strategi er ofte svært ressursintensiv og tidkrevende, da det tar tid å skape bånd mellom bedrifter.
Bottleneck
Leverage Bedriften bør begrense bruk av ressurser i sitt mål om å styrke forholdet, eksempelvis gjennom å øke volumet til leverandøren.
Non-critical
Group 2 (En generell strategi er å re-allokere en bedrifts ressurser i et forsøk på å opprettholde et sterkt forhold. Det er kanskje også en mulighet for å redusere ressursforbruket gjennom å håndtere forholdet mer effektivt)
Strategic
Bottleneck
Leverage Anstrengelser bør iverksettes for å øke leverandørens attraktivitet gjennom å redusere ressursene brukt på å styre relasjonen, selv om dette går på bekostning av styrken av forholdet (avkastningen av et sterkt forhold er i denne situasjonen lav).
Non-critical
Group 3 (En generell strategi er å endre leverandør, hvis ikke den har en viktig innvirkning på selskapets nettverksposisjon Et annet mål er å redusere ressursforbruket på forholdene i denne gruppen eller outsource innkjøpet)
Strategic Bedriften må sikre leveranser i deres handlingsplaner, og ellers se etter substitutter. Motivasjonen for å bevare en leverandør øker med styrken på forholdet, da det er mer effektivt å bruke ressurser på å utvikle forholdet, fremfor å danne et nytt.
Bottleneck
Leverage
Non-critical
- Handlingsplanene som utvikles for gruppe 3 har ofte et kortsiktig fokus, i motsetning
til den første gruppen. Dermed kan handlingsplanene for gruppe 3 hjelpe med å frigi,
Mo
der
ate
Lo
w
Hig
h
Rel
ativ
e Sup
plie
r A
ttra
ctiv
enes
s
Average Low High
Strength of Relationship
5 6
2 1
4
3
7 8 9
Group 1
Group 2
Group 3
- 12 -
eller tilegne seg, ressurser som kan nyttes i handlingsplanene for to andre gruppene.
For hver gruppe er det viktig å håndtere en eventuell feiltilpasning mellom
ressursforbruk og den relative styrken og attraktiviteten til forholdet.
- Da bedriften vil komme til å utlede flere handlingsplaner, med ulike mål og krav til
ressurser, bør bedriften velge en balansert portefølje av handlingsplaner fra de ulike
gruppene.
Plassering av komponenter
Vi ønsker at dere plasserer følgende komponenter:
- Fortøyning
- Treghetssensor
- Skall
- Batteripakke
- Batteripakke
Evaluering for hver kategori
- Hvorfor et produkt er plassert i de spesifikke kvadrantene?
- Er posisjoneringen i henhold til forventningene?
- Hva er tolkningen av resultatene?
Diskusjon
- Ga denne vinklingen mer verdi? Hvorfor, hvorfor ikke?
- Var denne lettere å forstå enn de forrige modellene? Hvorfor, hvorfor ikke?
- Kunne vi ha brukt de sammen?
- Har dere tatt høyde for noen av disse aspektene i dagens tilnærming? Hvis ja, på
hvilken måte? Hvis nei, hvorfor ikke?
Evaluering
- Hvordan var denne modellen å bruke?
- Hva var vanskelig med den? Hvorfor?
- Belyste den aspekter som de andre ikke gjorde? Hvis ja, hvorfor?
- Ble denne for teoretisk? På hvilken måte?
Avslutning og total evaluering/ved Mads og Fredrik
Generelt
- Hvordan synes dere workshop’en var?
- Nyttig, eller ga dette lite verdi? Hvorfor?
Modellene
- Hvilken modell var enklest å bruke? Hvorfor?
- Synes dere at dere fikk noe ut av de ulike vinklingene på komponentene og
leverandører? Hvorfor, hvorfor ikke?

- 13 -
- Hva var vanskeligst med bruk av modellene? Hvorfor?
- Ble dette for teoretisk? På hvilken måte? Vanskelig å forholde seg til begrep? Ikke
virkelighetsnært i det hele tatt?
- Hva var det mest verdi i? Prosessen eller resultatet? Hvorfor?
- Synes dere det er hensiktsmessig å samarbeide på tvers? Hvorfor, hvorfor ikke?
- Hva lærte de ulike avdelingene?
Se på forskjeller mellom dagens praksis og foreslått
- Hvis vi ser på de tilnærmingene dere har til leverandører i dag kontra de som ble
foreslått her i dag – hva virker mest hensiktsmessig? Hvorfor?
- Er foreslåtte strategier realistiske? Hvorfor, hvorfor ikke?
Eventuelt fra oss eller fra Fugro
Takke for tiden og samarbeidet
- 14 -
A.3 Questionnaire This appendix contains the questionnaire that was distributed to the sample. First the
introduction will be presented, which was the first page of the questionnaire and the first thing
the respondents encountered. Each question will then be presented in a chronological order. For
each question a description is provided, stating what type of question it is and which type of
variable it creates. The appendix ends with presenting a flowchart, showing how respondents
were directed past irrelevant questions.
Introduction – Page 1
When making this introduction a number of concerns were important to attend to. First and
foremost, we needed to ensure that we followed the guidelines provided by our faculty and NSD
(the Data Protection Official for Research). These guidelines stipulated that the information
given to the respondents should at least contain the following:
A short explanation of the purpose behind the research project and how the
data obtained from the questionnaire is to be used.
A paragraph concerning research and personal security. Here it would be
beneficial to include a statement of how the data is going to be anonymized
when the collection of data is completed. Another important point to make is
that since there is a possibility to track a respondent based on his IP-address, is
it only in exceptional cases one can write that the respondents will be
anonymous. One should rather state that the information will be handled
confidential.
Often it is useful to provide contact information in the introduction, so the
respondents know who to address if they have any questions.
Who is responsible for the questionnaire. For students, their supervisor’s name
and title must be included.
In addition, as we wanted to achieve the best possible response rate from our sample, we
wanted to provide a good covering letter (2.3.4). Thus, when forming this introduction it was
also important to follow the guidelines provided by Bryman and Bell (2007) for topics to include
in an introductory statement. These guidelines are provided in the following list:
Clearly state the identity of the person who is contacting the respondent.
State the auspices under which the research is being conducted (e.g. university)
If a student is doing research for a thesis – make this clear.
Specify what the research is about and why it is important, in addition to what
kind of information to be collected by the questionnaire
Indicate why the respondent has been selected.
Provide reassurance about the confidentiality of any information provided.
Clearly state that it is voluntary to participate in the study.
Explicitly explain to the respondent that he or she will not be identified or be
identifiable in any way, when the results are presented.
Provide the respondent with the opportunity to ask any questions – provide
contact information of the one responsible of the questionnaire.
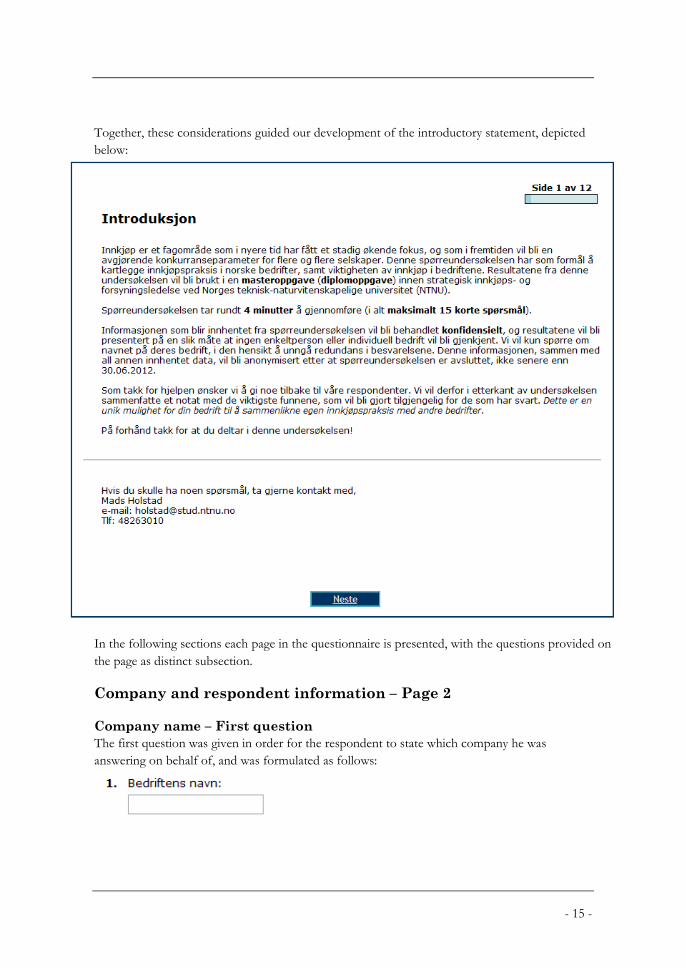
- 15 -
Together, these considerations guided our development of the introductory statement, depicted
below:
In the following sections each page in the questionnaire is presented, with the questions provided on
the page as distinct subsection.
Company and respondent information – Page 2
Company name – First question
The first question was given in order for the respondent to state which company he was
answering on behalf of, and was formulated as follows:
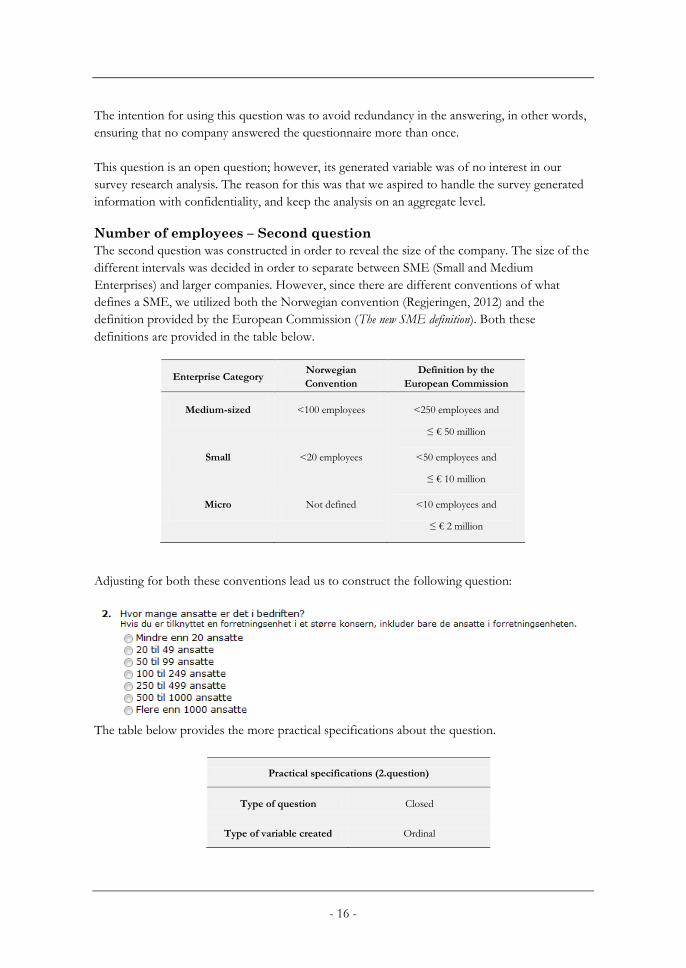
- 16 -
The intention for using this question was to avoid redundancy in the answering, in other words,
ensuring that no company answered the questionnaire more than once.
This question is an open question; however, its generated variable was of no interest in our
survey research analysis. The reason for this was that we aspired to handle the survey generated
information with confidentiality, and keep the analysis on an aggregate level.
Number of employees – Second question
The second question was constructed in order to reveal the size of the company. The size of the
different intervals was decided in order to separate between SME (Small and Medium
Enterprises) and larger companies. However, since there are different conventions of what
defines a SME, we utilized both the Norwegian convention (Regjeringen, 2012) and the
definition provided by the European Commission (The new SME definition). Both these
definitions are provided in the table below.
Enterprise Category Norwegian
Convention
Definition by the
European Commission
Medium-sized <100 employees <250 employees and
≤ € 50 million
Small <20 employees <50 employees and
≤ € 10 million
Micro Not defined <10 employees and
≤ € 2 million
Adjusting for both these conventions lead us to construct the following question:
The table below provides the more practical specifications about the question.
Practical specifications (2.question)
Type of question Closed
Type of variable created Ordinal
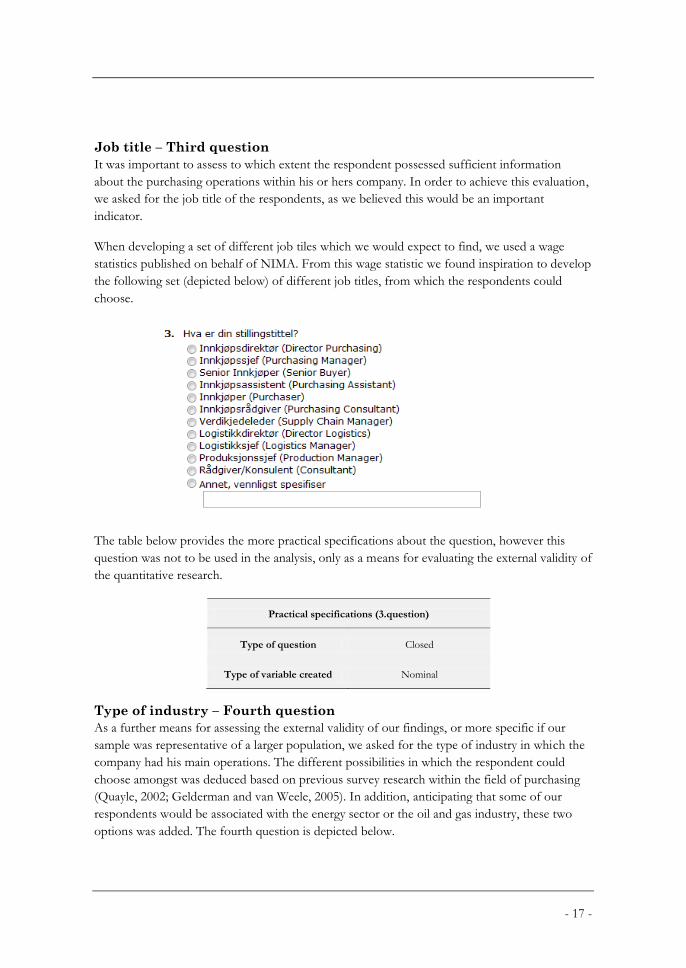
- 17 -
Job title – Third question
It was important to assess to which extent the respondent possessed sufficient information
about the purchasing operations within his or hers company. In order to achieve this evaluation,
we asked for the job title of the respondents, as we believed this would be an important
indicator.
When developing a set of different job tiles which we would expect to find, we used a wage
statistics published on behalf of NIMA. From this wage statistic we found inspiration to develop
the following set (depicted below) of different job titles, from which the respondents could
choose.
The table below provides the more practical specifications about the question, however this
question was not to be used in the analysis, only as a means for evaluating the external validity of
the quantitative research.
Practical specifications (3.question)
Type of question Closed
Type of variable created Nominal
Type of industry – Fourth question
As a further means for assessing the external validity of our findings, or more specific if our
sample was representative of a larger population, we asked for the type of industry in which the
company had his main operations. The different possibilities in which the respondent could
choose amongst was deduced based on previous survey research within the field of purchasing
(Quayle, 2002; Gelderman and van Weele, 2005). In addition, anticipating that some of our
respondents would be associated with the energy sector or the oil and gas industry, these two
options was added. The fourth question is depicted below.

- 18 -
The more practical information about the question is given in the table below. Again, this
question’s main purpose was to evaluate the quality if the quantitative and not to be used in the
analysis.
Practical specifications (4.question)
Type of question Closed
Type of variable created Nominal
Production situation – Page 3
Important to our research and the purpose of this questionnaire was the collecting of data
concerning the production situation to the respondent’s company. Thus our fifth question asked
the respondents as to which production situation was most descriptive for his or hers company
and it had the following format.
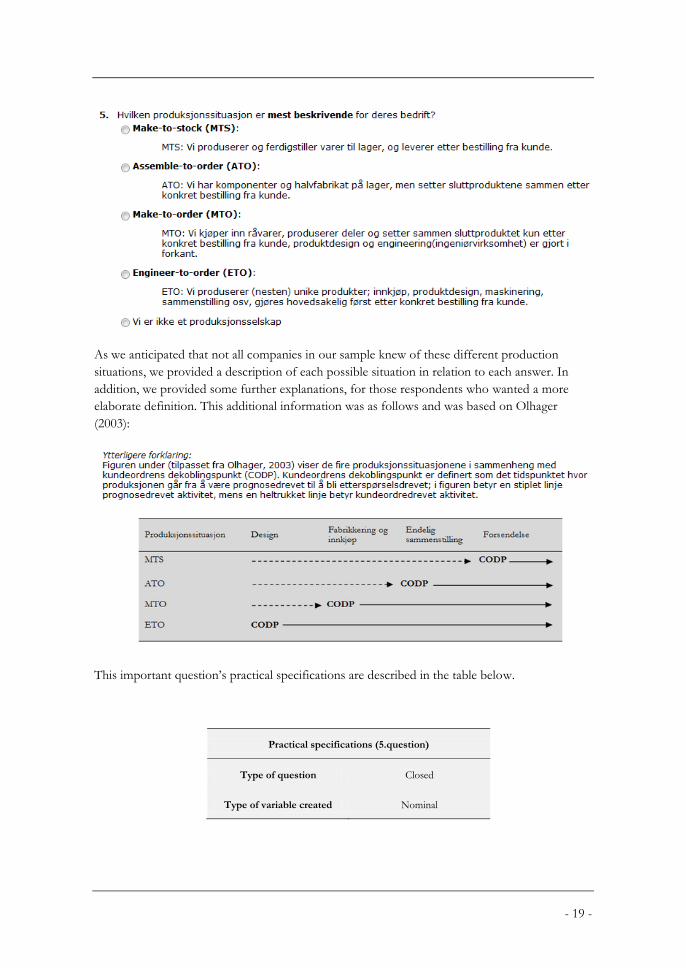
- 19 -
As we anticipated that not all companies in our sample knew of these different production
situations, we provided a description of each possible situation in relation to each answer. In
addition, we provided some further explanations, for those respondents who wanted a more
elaborate definition. This additional information was as follows and was based on Olhager
(2003):
This important question’s practical specifications are described in the table below.
Practical specifications (5.question)
Type of question Closed
Type of variable created Nominal
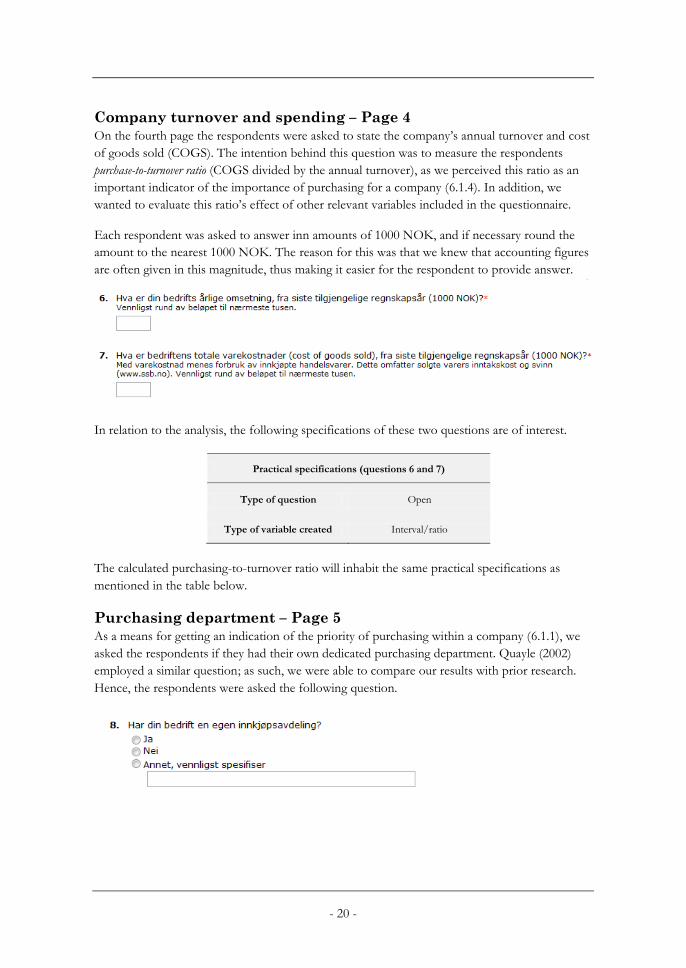
- 20 -
Company turnover and spending – Page 4
On the fourth page the respondents were asked to state the company’s annual turnover and cost
of goods sold (COGS). The intention behind this question was to measure the respondents
purchase-to-turnover ratio (COGS divided by the annual turnover), as we perceived this ratio as an
important indicator of the importance of purchasing for a company (6.1.4). In addition, we
wanted to evaluate this ratio’s effect of other relevant variables included in the questionnaire.
Each respondent was asked to answer inn amounts of 1000 NOK, and if necessary round the
amount to the nearest 1000 NOK. The reason for this was that we knew that accounting figures
are often given in this magnitude, thus making it easier for the respondent to provide answer.
In relation to the analysis, the following specifications of these two questions are of interest.
Practical specifications (questions 6 and 7)
Type of question Open
Type of variable created Interval/ratio
The calculated purchasing-to-turnover ratio will inhabit the same practical specifications as
mentioned in the table below.
Purchasing department – Page 5
As a means for getting an indication of the priority of purchasing within a company (6.1.1), we
asked the respondents if they had their own dedicated purchasing department. Quayle (2002)
employed a similar question; as such, we were able to compare our results with prior research.
Hence, the respondents were asked the following question.
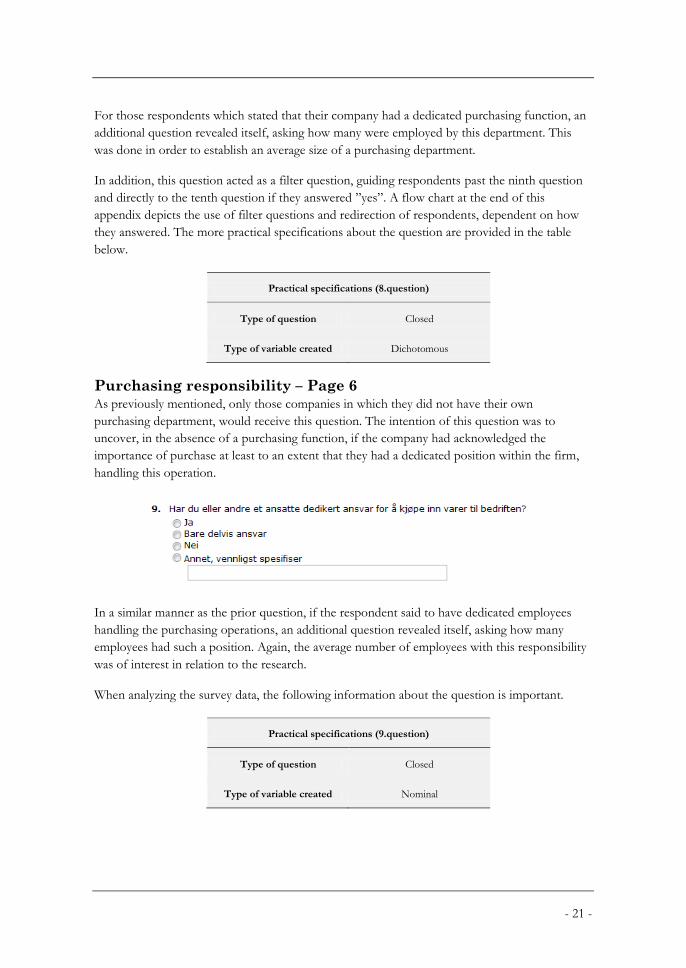
- 21 -
For those respondents which stated that their company had a dedicated purchasing function, an
additional question revealed itself, asking how many were employed by this department. This
was done in order to establish an average size of a purchasing department.
In addition, this question acted as a filter question, guiding respondents past the ninth question
and directly to the tenth question if they answered ”yes”. A flow chart at the end of this
appendix depicts the use of filter questions and redirection of respondents, dependent on how
they answered. The more practical specifications about the question are provided in the table
below.
Practical specifications (8.question)
Type of question Closed
Type of variable created Dichotomous
Purchasing responsibility – Page 6
As previously mentioned, only those companies in which they did not have their own
purchasing department, would receive this question. The intention of this question was to
uncover, in the absence of a purchasing function, if the company had acknowledged the
importance of purchase at least to an extent that they had a dedicated position within the firm,
handling this operation.
In a similar manner as the prior question, if the respondent said to have dedicated employees
handling the purchasing operations, an additional question revealed itself, asking how many
employees had such a position. Again, the average number of employees with this responsibility
was of interest in relation to the research.
When analyzing the survey data, the following information about the question is important.
Practical specifications (9.question)
Type of question Closed
Type of variable created Nominal
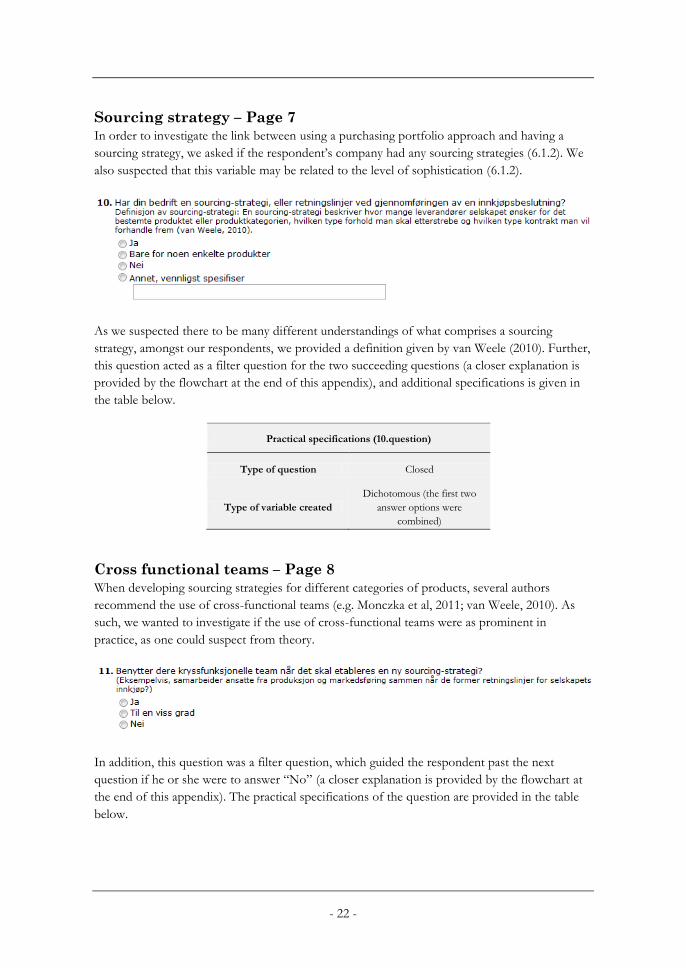
- 22 -
Sourcing strategy – Page 7
In order to investigate the link between using a purchasing portfolio approach and having a
sourcing strategy, we asked if the respondent’s company had any sourcing strategies (6.1.2). We
also suspected that this variable may be related to the level of sophistication (6.1.2).
As we suspected there to be many different understandings of what comprises a sourcing
strategy, amongst our respondents, we provided a definition given by van Weele (2010). Further,
this question acted as a filter question for the two succeeding questions (a closer explanation is
provided by the flowchart at the end of this appendix), and additional specifications is given in
the table below.
Practical specifications (10.question)
Type of question Closed
Type of variable created
Dichotomous (the first two
answer options were
combined)
Cross functional teams – Page 8
When developing sourcing strategies for different categories of products, several authors
recommend the use of cross-functional teams (e.g. Monczka et al, 2011; van Weele, 2010). As
such, we wanted to investigate if the use of cross-functional teams were as prominent in
practice, as one could suspect from theory.
In addition, this question was a filter question, which guided the respondent past the next
question if he or she were to answer “No” (a closer explanation is provided by the flowchart at
the end of this appendix). The practical specifications of the question are provided in the table
below.
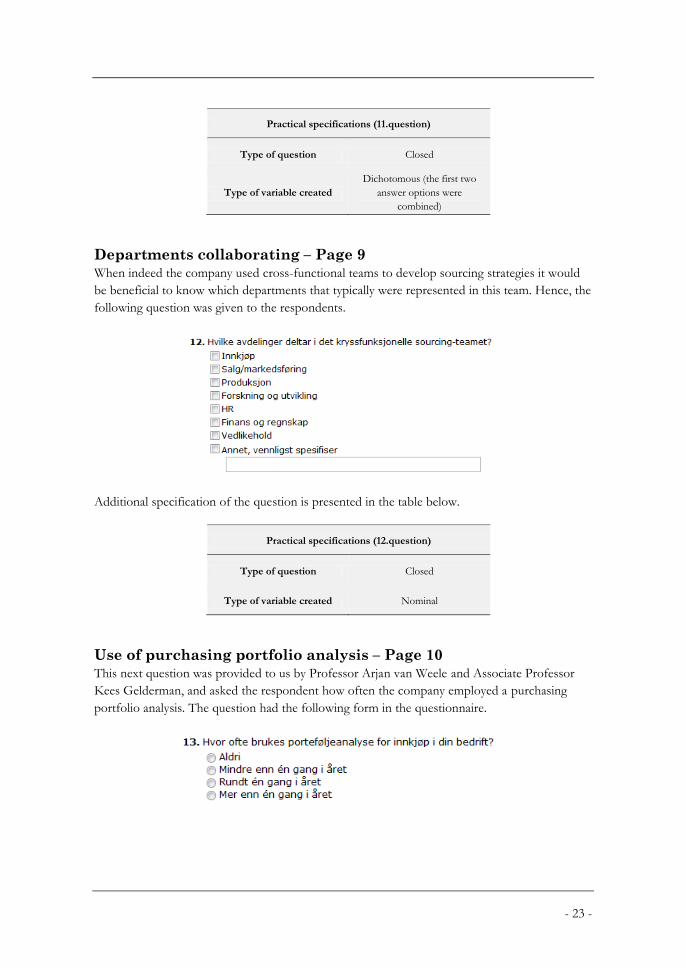
- 23 -
Practical specifications (11.question)
Type of question Closed
Type of variable created
Dichotomous (the first two
answer options were
combined)
Departments collaborating – Page 9
When indeed the company used cross-functional teams to develop sourcing strategies it would
be beneficial to know which departments that typically were represented in this team. Hence, the
following question was given to the respondents.
Additional specification of the question is presented in the table below.
Practical specifications (12.question)
Type of question Closed
Type of variable created Nominal
Use of purchasing portfolio analysis – Page 10
This next question was provided to us by Professor Arjan van Weele and Associate Professor
Kees Gelderman, and asked the respondent how often the company employed a purchasing
portfolio analysis. The question had the following form in the questionnaire.
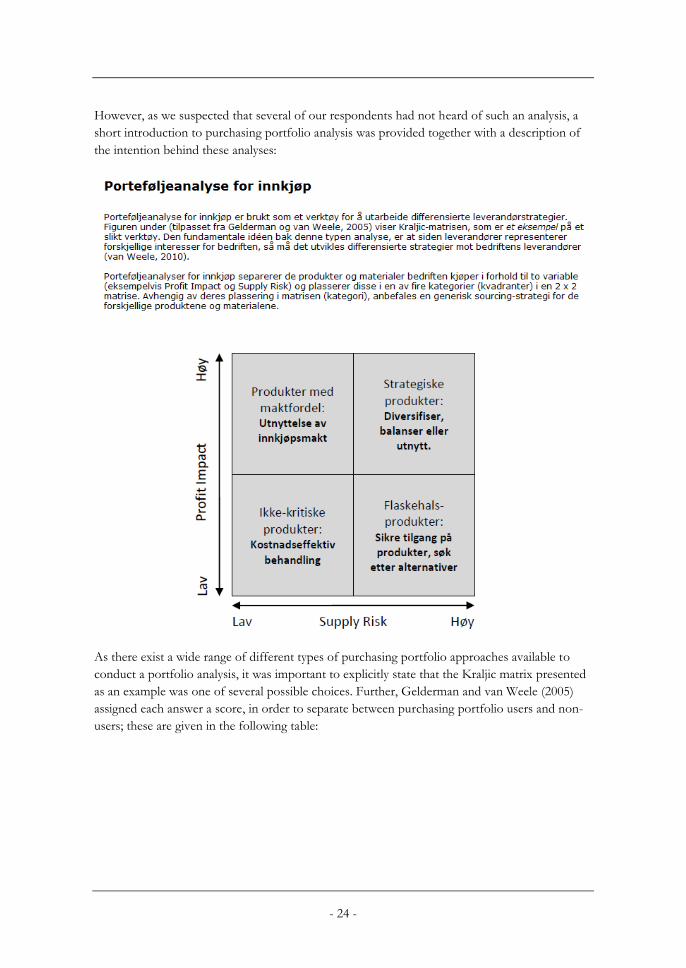
- 24 -
However, as we suspected that several of our respondents had not heard of such an analysis, a
short introduction to purchasing portfolio analysis was provided together with a description of
the intention behind these analyses:
As there exist a wide range of different types of purchasing portfolio approaches available to
conduct a portfolio analysis, it was important to explicitly state that the Kraljic matrix presented
as an example was one of several possible choices. Further, Gelderman and van Weele (2005)
assigned each answer a score, in order to separate between purchasing portfolio users and non-
users; these are given in the following table:
- 25 -
Answer Score
Never 0
Less than once a year 1
About once a year 1
More than once a year 1
Consequently, despite there being four different fixed answers, in reality there were only two
different categories (those answers with score 1 and those with score 0). Thus the variable
created by the question was dichotomous.
Practical specifications (13.question)
Type of question Closed
Type of variable created Dichotomous
Reasons for not utilizing such a model –Page 11
Pending that several of our respondents would not be accustomed with the use of a purchasing
portfolio analysis, we included this fourteenth question in order to find the reason why. The
different answers were deduced through a discussion with our supervisor, and by adding an
“other” response category we could capture additional reasons.
The more practical specifications of the question are provided in the following table.
Practical specifications (14.question)
Type of question Closed
Type of variable created Nominal
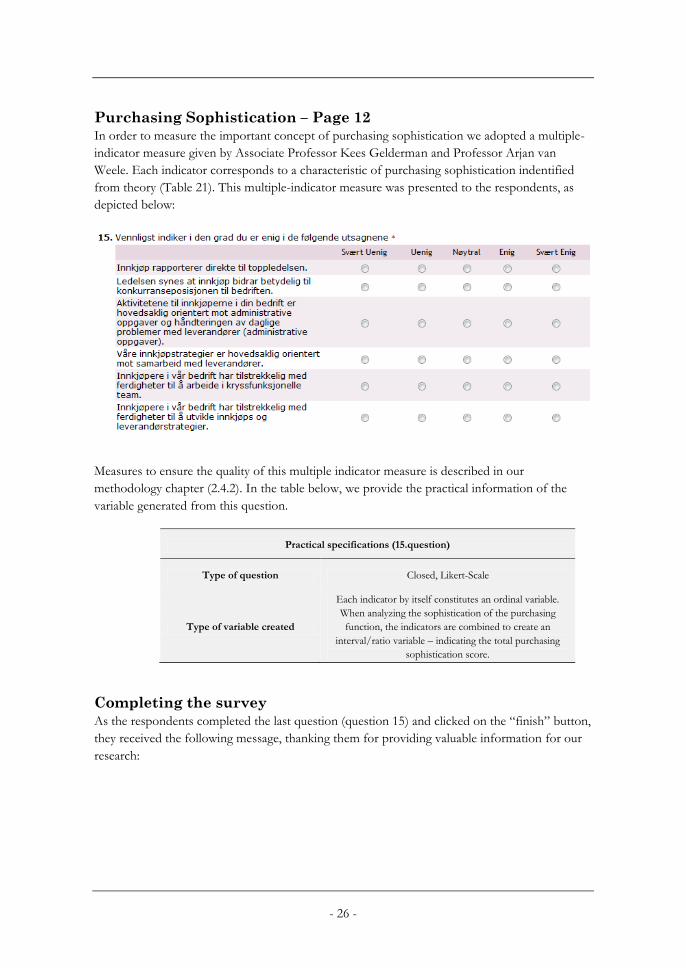
- 26 -
Purchasing Sophistication – Page 12
In order to measure the important concept of purchasing sophistication we adopted a multiple-
indicator measure given by Associate Professor Kees Gelderman and Professor Arjan van
Weele. Each indicator corresponds to a characteristic of purchasing sophistication indentified
from theory (Table 21). This multiple-indicator measure was presented to the respondents, as
depicted below:
Measures to ensure the quality of this multiple indicator measure is described in our
methodology chapter (2.4.2). In the table below, we provide the practical information of the
variable generated from this question.
Practical specifications (15.question)
Type of question Closed, Likert-Scale
Type of variable created
Each indicator by itself constitutes an ordinal variable.
When analyzing the sophistication of the purchasing
function, the indicators are combined to create an
interval/ratio variable – indicating the total purchasing
sophistication score.
Completing the survey
As the respondents completed the last question (question 15) and clicked on the “finish” button,
they received the following message, thanking them for providing valuable information for our
research:
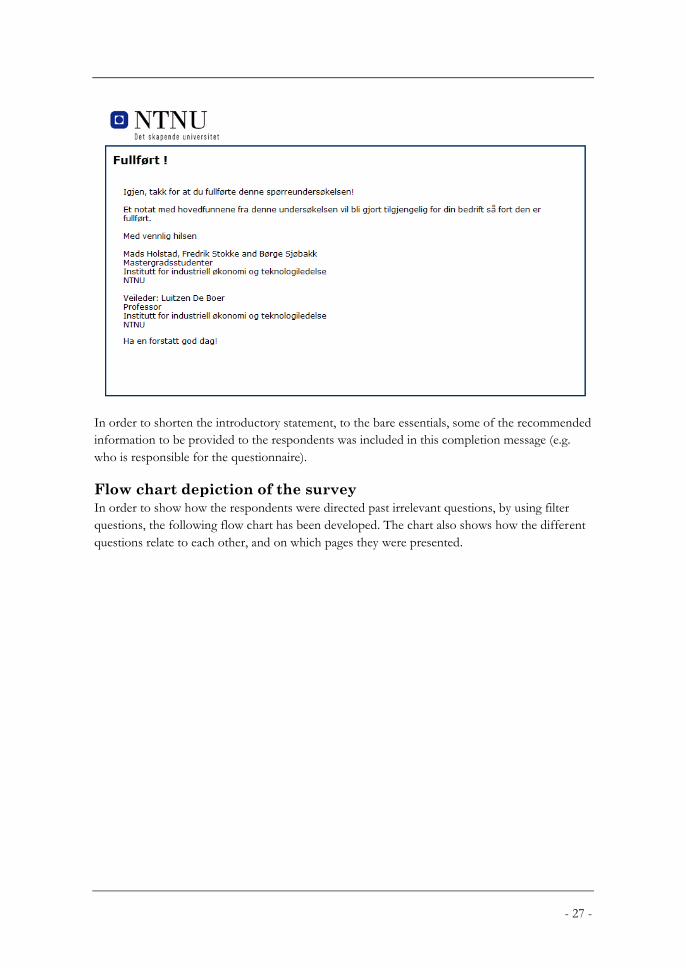
- 27 -
In order to shorten the introductory statement, to the bare essentials, some of the recommended
information to be provided to the respondents was included in this completion message (e.g.
who is responsible for the questionnaire).
Flow chart depiction of the survey
In order to show how the respondents were directed past irrelevant questions, by using filter
questions, the following flow chart has been developed. The chart also shows how the different
questions relate to each other, and on which pages they were presented.
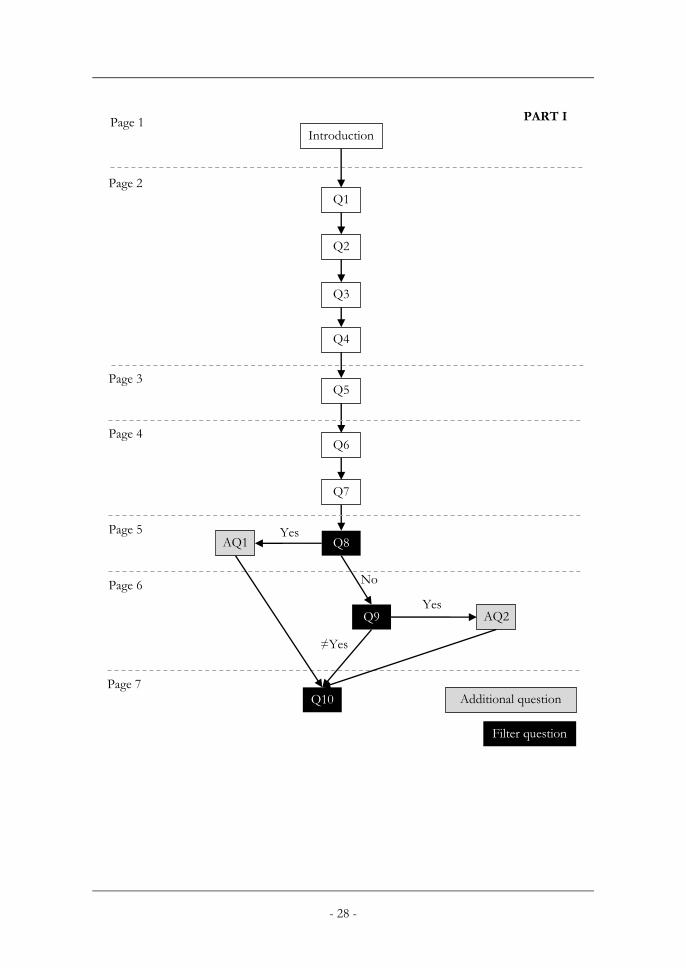
- 28 -
Q1
Q2
Q3
Page 2
Page 3
Page 1 Introduction
Q4
Q5
Page 4 Q6
Page 5 Q8
Q7
Page 6
Q9
No
Page 7
Q10
PART I
AQ1 Yes
Yes AQ2
≠Yes
Filter question
Additional question
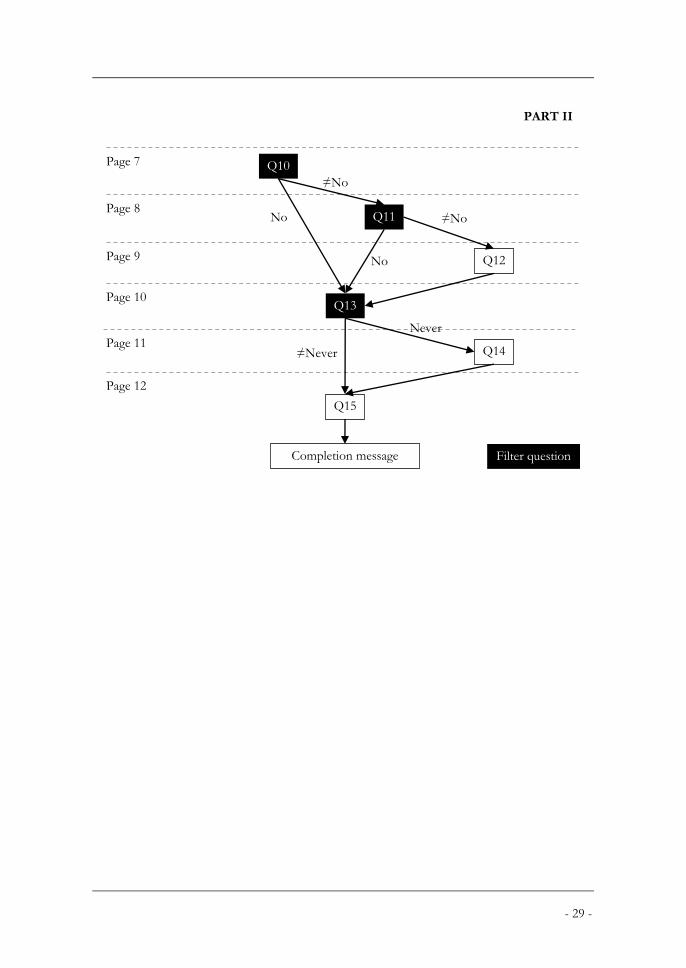
- 29 -
Page 7 Q10
PART II
Page 8 Q11
Page 9 Q12
Page 10 Q13
Page 11 Q14
Page 12
Q15
Completion message
≠No
No
No
≠No
Never
≠Never
Filter question

- 30 -
A.4 Approval from NSD
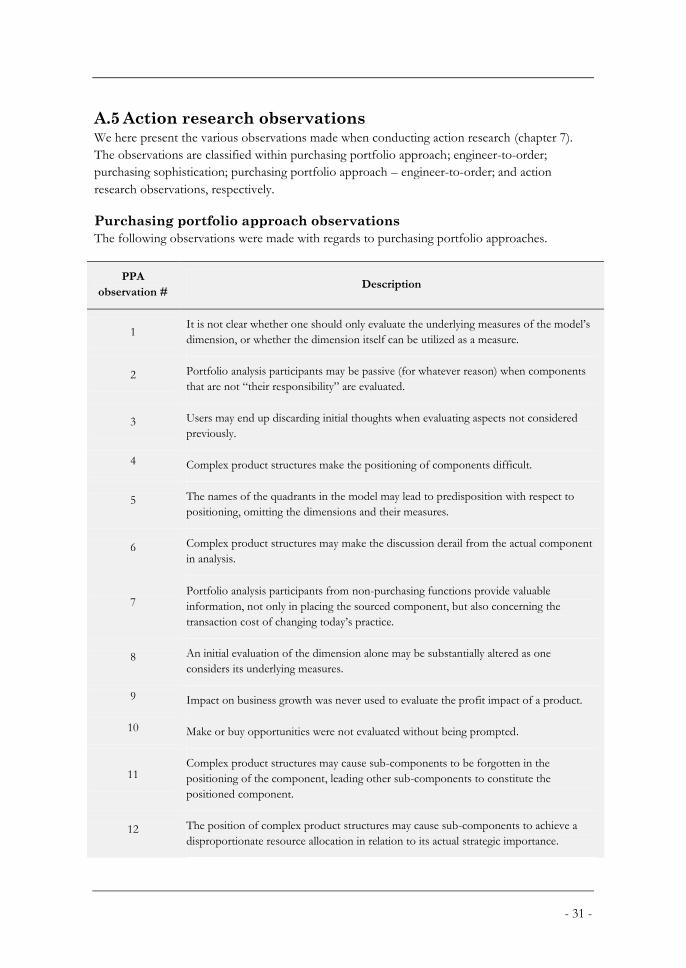
- 31 -
A.5 Action research observations We here present the various observations made when conducting action research (chapter 7).
The observations are classified within purchasing portfolio approach; engineer-to-order;
purchasing sophistication; purchasing portfolio approach – engineer-to-order; and action
research observations, respectively.
Purchasing portfolio approach observations
The following observations were made with regards to purchasing portfolio approaches.
PPA
observation # Description
1 It is not clear whether one should only evaluate the underlying measures of the model’s
dimension, or whether the dimension itself can be utilized as a measure.
2 Portfolio analysis participants may be passive (for whatever reason) when components
that are not “their responsibility” are evaluated.
3 Users may end up discarding initial thoughts when evaluating aspects not considered
previously.
4 Complex product structures make the positioning of components difficult.
5 The names of the quadrants in the model may lead to predisposition with respect to
positioning, omitting the dimensions and their measures.
6 Complex product structures may make the discussion derail from the actual component
in analysis.
7 Portfolio analysis participants from non-purchasing functions provide valuable
information, not only in placing the sourced component, but also concerning the
transaction cost of changing today’s practice.
8 An initial evaluation of the dimension alone may be substantially altered as one
considers its underlying measures.
9 Impact on business growth was never used to evaluate the profit impact of a product.
10 Make or buy opportunities were not evaluated without being prompted.
11 Complex product structures may cause sub-components to be forgotten in the
positioning of the component, leading other sub-components to constitute the
positioned component.
12 The position of complex product structures may cause sub-components to achieve a
disproportionate resource allocation in relation to its actual strategic importance.
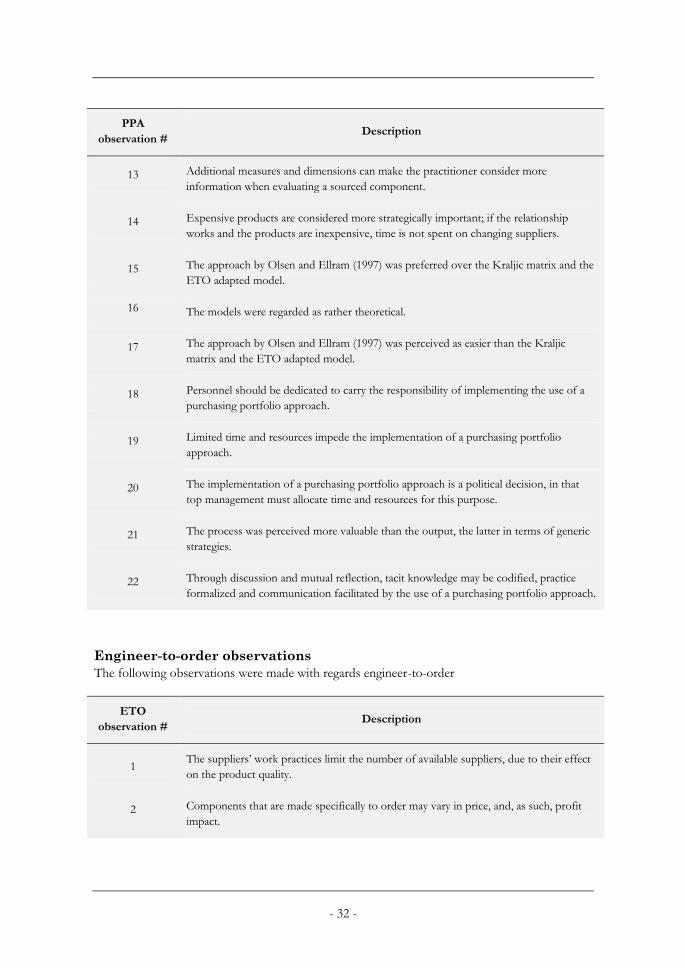
- 32 -
PPA
observation # Description
13 Additional measures and dimensions can make the practitioner consider more
information when evaluating a sourced component.
14 Expensive products are considered more strategically important; if the relationship
works and the products are inexpensive, time is not spent on changing suppliers.
15 The approach by Olsen and Ellram (1997) was preferred over the Kraljic matrix and the
ETO adapted model.
16 The models were regarded as rather theoretical.
17 The approach by Olsen and Ellram (1997) was perceived as easier than the Kraljic
matrix and the ETO adapted model.
18 Personnel should be dedicated to carry the responsibility of implementing the use of a
purchasing portfolio approach.
19 Limited time and resources impede the implementation of a purchasing portfolio
approach.
20 The implementation of a purchasing portfolio approach is a political decision, in that
top management must allocate time and resources for this purpose.
21 The process was perceived more valuable than the output, the latter in terms of generic
strategies.
22 Through discussion and mutual reflection, tacit knowledge may be codified, practice
formalized and communication facilitated by the use of a purchasing portfolio approach.
Engineer-to-order observations
The following observations were made with regards engineer-to-order
ETO
observation # Description
1 The suppliers’ work practices limit the number of available suppliers, due to their effect
on the product quality.
2 Components that are made specifically to order may vary in price, and, as such, profit
impact.
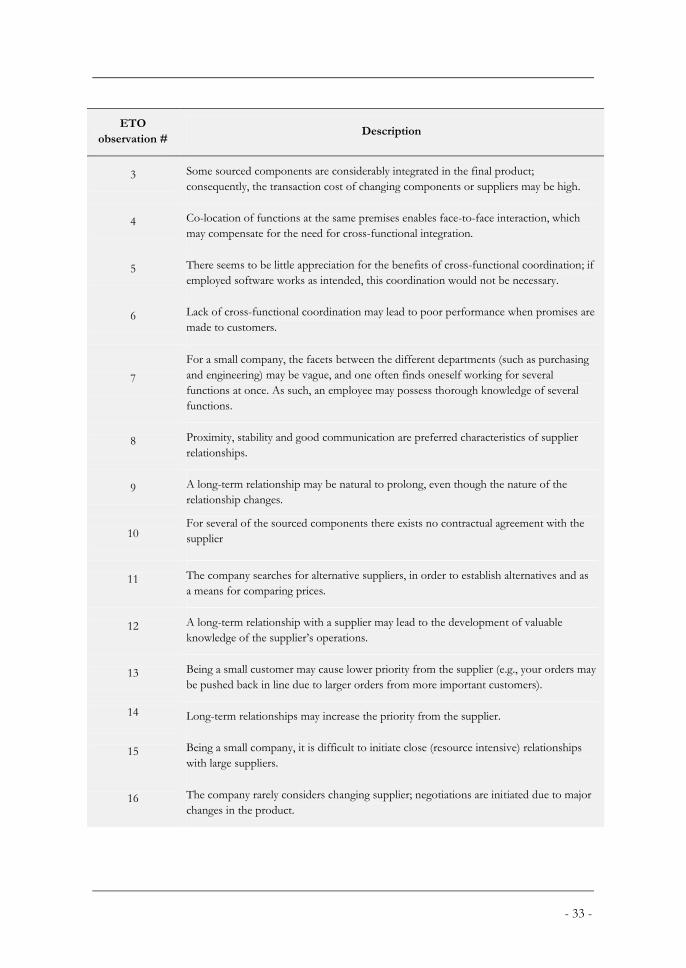
- 33 -
ETO
observation # Description
3 Some sourced components are considerably integrated in the final product;
consequently, the transaction cost of changing components or suppliers may be high.
4 Co-location of functions at the same premises enables face-to-face interaction, which
may compensate for the need for cross-functional integration.
5 There seems to be little appreciation for the benefits of cross-functional coordination; if
employed software works as intended, this coordination would not be necessary.
6 Lack of cross-functional coordination may lead to poor performance when promises are
made to customers.
7
For a small company, the facets between the different departments (such as purchasing
and engineering) may be vague, and one often finds oneself working for several
functions at once. As such, an employee may possess thorough knowledge of several
functions.
8 Proximity, stability and good communication are preferred characteristics of supplier
relationships.
9 A long-term relationship may be natural to prolong, even though the nature of the
relationship changes.
10 For several of the sourced components there exists no contractual agreement with the
supplier
11 The company searches for alternative suppliers, in order to establish alternatives and as
a means for comparing prices.
12 A long-term relationship with a supplier may lead to the development of valuable
knowledge of the supplier’s operations.
13 Being a small customer may cause lower priority from the supplier (e.g., your orders may
be pushed back in line due to larger orders from more important customers).
14 Long-term relationships may increase the priority from the supplier.
15 Being a small company, it is difficult to initiate close (resource intensive) relationships
with large suppliers.
16 The company rarely considers changing supplier; negotiations are initiated due to major
changes in the product.
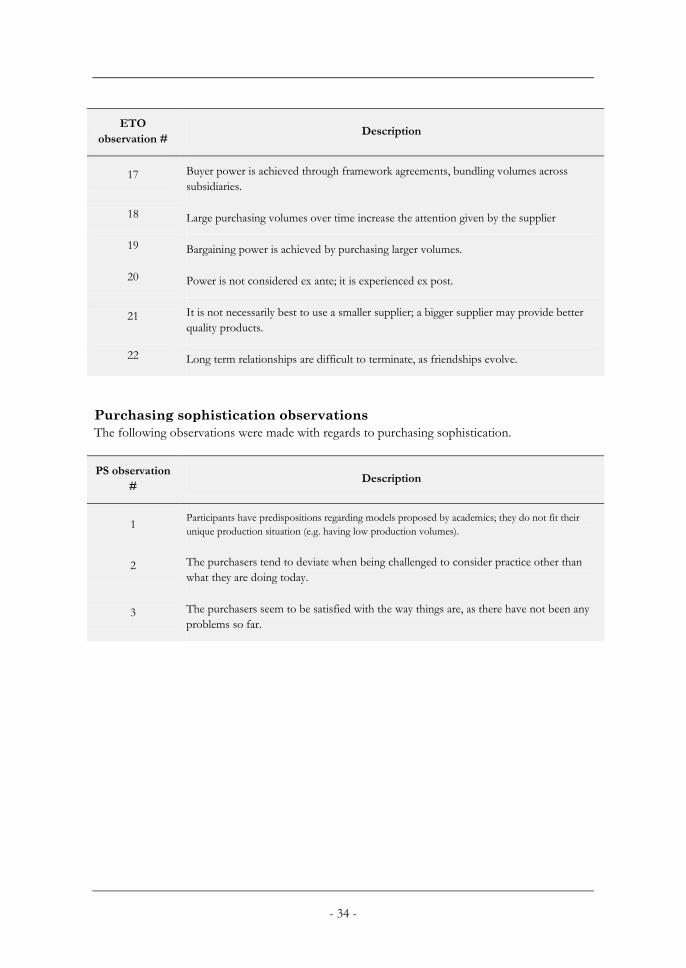
- 34 -
ETO
observation # Description
17 Buyer power is achieved through framework agreements, bundling volumes across
subsidiaries.
18 Large purchasing volumes over time increase the attention given by the supplier
19 Bargaining power is achieved by purchasing larger volumes.
20 Power is not considered ex ante; it is experienced ex post.
21 It is not necessarily best to use a smaller supplier; a bigger supplier may provide better
quality products.
22 Long term relationships are difficult to terminate, as friendships evolve.
Purchasing sophistication observations
The following observations were made with regards to purchasing sophistication.
PS observation
# Description
1 Participants have predispositions regarding models proposed by academics; they do not fit their
unique production situation (e.g. having low production volumes).
2 The purchasers tend to deviate when being challenged to consider practice other than
what they are doing today.
3 The purchasers seem to be satisfied with the way things are, as there have not been any
problems so far.
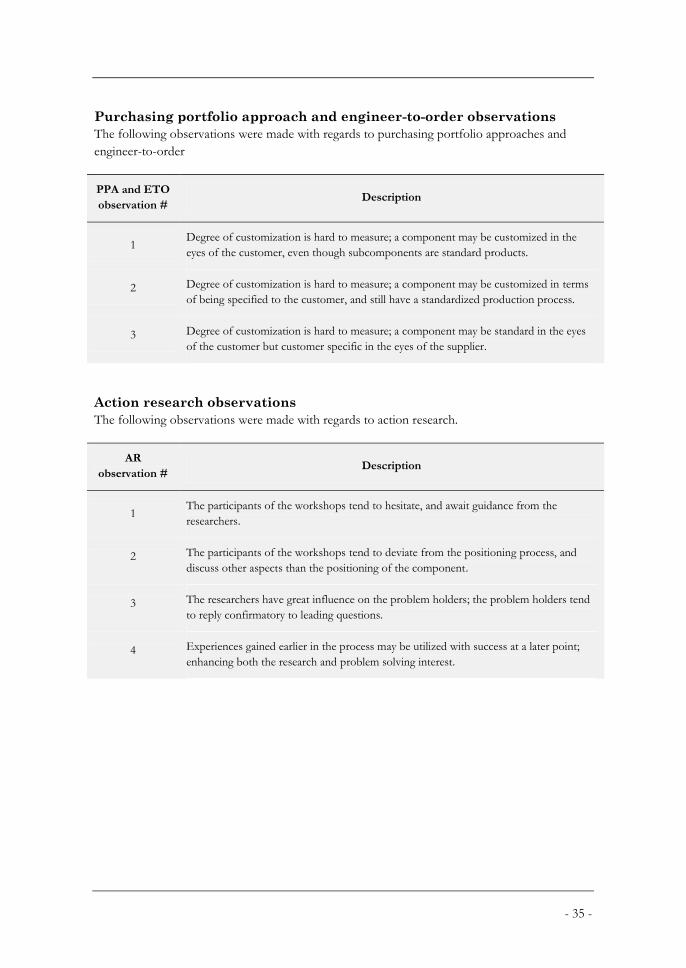
- 35 -
Purchasing portfolio approach and engineer-to-order observations
The following observations were made with regards to purchasing portfolio approaches and
engineer-to-order
PPA and ETO
observation # Description
1 Degree of customization is hard to measure; a component may be customized in the
eyes of the customer, even though subcomponents are standard products.
2 Degree of customization is hard to measure; a component may be customized in terms
of being specified to the customer, and still have a standardized production process.
3 Degree of customization is hard to measure; a component may be standard in the eyes
of the customer but customer specific in the eyes of the supplier.
Action research observations
The following observations were made with regards to action research.
AR
observation # Description
1 The participants of the workshops tend to hesitate, and await guidance from the
researchers.
2 The participants of the workshops tend to deviate from the positioning process, and
discuss other aspects than the positioning of the component.
3 The researchers have great influence on the problem holders; the problem holders tend
to reply confirmatory to leading questions.
4 Experiences gained earlier in the process may be utilized with success at a later point;
enhancing both the research and problem solving interest.
Related Documents