Transportation Technologies & Infrastructure Department PURADYN OIL BYPASS FILTRATION SYSTEM EVALUATION TEST PLAN October 2002 Reviewed: INEEL Fleet Maintenance Supervisor (Thomas) Date Reviewed: INEEL Bus & Heavy Equipment Foreman (Murdock) Date Reviewed: INEEL Fleet Maintenance Department Manager (Bullock) Date Approved: INEEL Central/Idaho Falls Facilities Director (Winn) Date Reviewed: INEEL Test Engineer (Zirker) Date Reviewed: INEEL Project Manager (Francfort) Date Approved: INEEL TT&I Department Manager (Murphy) Date i

Welcome message from author
This document is posted to help you gain knowledge. Please leave a comment to let me know what you think about it! Share it to your friends and learn new things together.
Transcript
Transportation Technologies & Infrastructure Department
PURADYN OIL BYPASS FILTRATION SYSTEM EVALUATION TEST PLAN
October 2002
Reviewed: INEEL Fleet Maintenance Supervisor (Thomas) Date
Reviewed: INEEL Bus & Heavy Equipment Foreman (Murdock) Date
Reviewed: INEEL Fleet Maintenance Department Manager (Bullock) Date
Approved: INEEL Central/Idaho Falls Facilities Director (Winn) Date
Reviewed: INEEL Test Engineer (Zirker) Date
Reviewed: INEEL Project Manager (Francfort) Date
Approved: INEEL TT&I Department Manager (Murphy) Date
i
CONTENTS
1 Purpose and Applicability ...................................................................................................... 1
1.1 Activities to be Performed Under this Test Plan......................................................... 2
1.2 Features of the PuraDYN Filtration System ............................................................... 2
2 References ............................................................................................................................. 3
3 Equipment and Hardware Requirements ............................................................................... 3
4 Prerequisites and Pre-Test Preparation.................................................................................. 3
5 Baseline of the Engines and Oil Analysis ............................................................................. 4
5.1 Oil Analysis and Records............................................................................................ 4
6 Bypass Filtration System - Testing Program......................................................................... 5
6.1 Prepare for Test ........................................................................................................... 6
6.1.1 Generate Test Plant. ............................................................................... 6 6.1.2 Complete Test Prerequisites................................................................... 6
6.2 Install PuraDYN Filter System and Initial Service of the Engines ............................. 6
6.2.1 Purchase Test Supplies........................................................................... 6 6.2.2 Install the Filters and Attachments (Hoses and Connections)................ 6 6.2.3 Baseline Engines and Oil ....................................................................... 6
6.3 Run Test ...................................................................................................................... 7
6.3.1 Document the Daily Oil Usage Consumption........................................ 7 6.3.2 Change the Filters .................................................................................. 7 6.3.3 Analyze Oil Analysis Reports ................................................................ 7 6.3.4 Gather the Test Data............................................................................... 8
6.4 Issue Program Documents........................................................................................... 8
6.4.1 Quarterly and yearly Milestone Reports ................................................ 8 6.4.2 Final Report............................................................................................ 8 6.4.3 Publish Results ....................................................................................... 8
7 Safety Concerns and Precautions .......................................................................................... 9
8 Test Data Reporting Requirements........................................................................................ 9
9 Anticipated Results.............................................................................................................. 11
10 Contact Persons ................................................................................................................... 11
ii
Appendix A: Oil Analysis Shipping Containers and Labels........................................................A-1
Appendix B: Value Limits for Oil Analysis Reports t ................................................................. B-1
Appendix C: Typical Oil Analysis Report ................................................................................... C-1
Appendix D: TechTraks...............................................................................................................D-1
Spectro-Metals...................................................................................................................D-1
Spectro-Metals Sources .....................................................................................................D-2
Viscosity ............................................................................................................................D-5
Fuel Soot............................................................................................................................D-6
Infrared Analysis (IR)........................................................................................................D-7
Total Base Number (TBN) ................................................................................................D-8
Total Acid Number (TAN) ................................................................................................D-9
Particle Count (PC)..........................................................................................................D-10
Direct Reading Ferrography (DR)...................................................................................D-11
Analytical Ferrography (AF) ...........................................................................................D-12
Appendix E: Daily Oil Usage Log............................................................................................... E-1
Appendix F: Changing the Filters.................................................................................................F-1
Appendix G: Extended Oil Drain Schedule .................................................................................G-1
Appendix H: Decision Analysis and Disposition Chart...............................................................H-1
iii
PURADYN OIL BYPASS FILTRATION SYSTEM EVALUATION TEST PLAN
1 PURPOSE AND APPLICABILITY
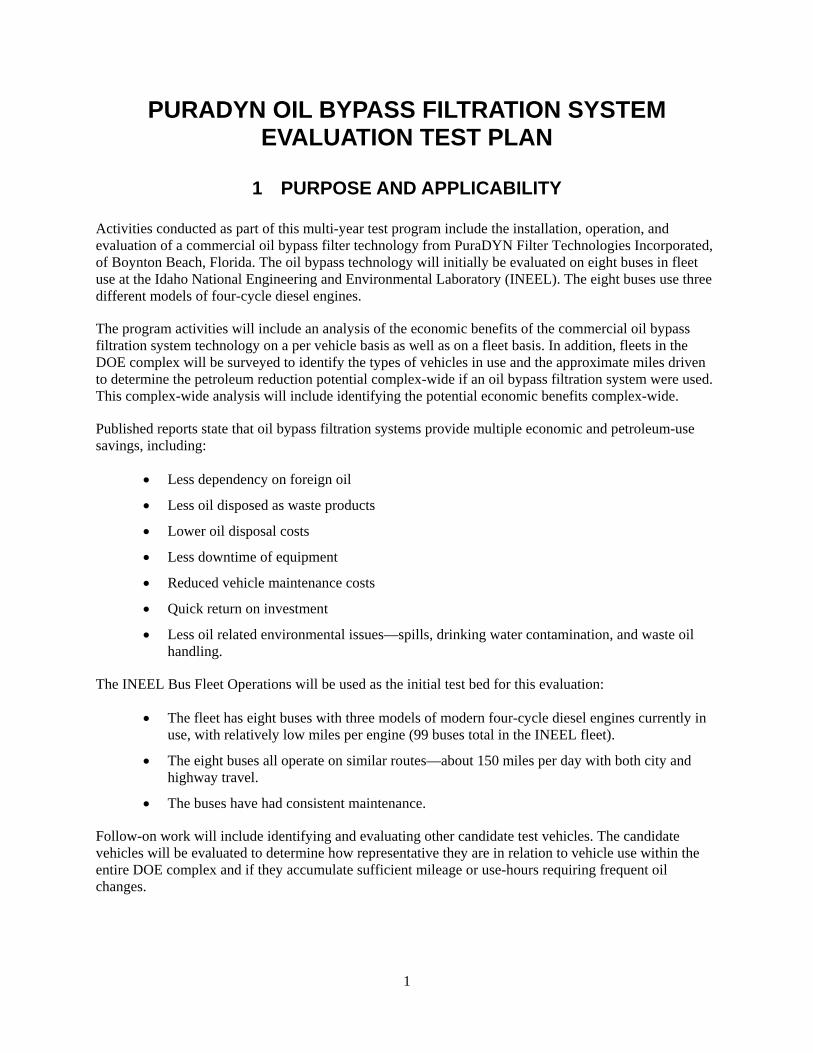
Activities conducted as part of this multi-year test program include the installation, operation, and evaluation of a commercial oil bypass filter technology from PuraDYN Filter Technologies Incorporated, of Boynton Beach, Florida. The oil bypass technology will initially be evaluated on eight buses in fleet use at the Idaho National Engineering and Environmental Laboratory (INEEL). The eight buses use three different models of four-cycle diesel engines.
The program activities will include an analysis of the economic benefits of the commercial oil bypass filtration system technology on a per vehicle basis as well as on a fleet basis. In addition, fleets in the DOE complex will be surveyed to identify the types of vehicles in use and the approximate miles driven to determine the petroleum reduction potential complex-wide if an oil bypass filtration system were used. This complex-wide analysis will include identifying the potential economic benefits complex-wide.
Published reports state that oil bypass filtration systems provide multiple economic and petroleum-use savings, including:
• Less dependency on foreign oil
• Less oil disposed as waste products
• Lower oil disposal costs
• Less downtime of equipment
• Reduced vehicle maintenance costs
• Quick return on investment
• Less oil related environmental issues—spills, drinking water contamination, and waste oil handling.
The INEEL Bus Fleet Operations will be used as the initial test bed for this evaluation:
• The fleet has eight buses with three models of modern four-cycle diesel engines currently in use, with relatively low miles per engine (99 buses total in the INEEL fleet).
• The eight buses all operate on similar routes—about 150 miles per day with both city and highway travel.
• The buses have had consistent maintenance.
Follow-on work will include identifying and evaluating other candidate test vehicles. The candidate vehicles will be evaluated to determine how representative they are in relation to vehicle use within the entire DOE complex and if they accumulate sufficient mileage or use-hours requiring frequent oil changes.
1
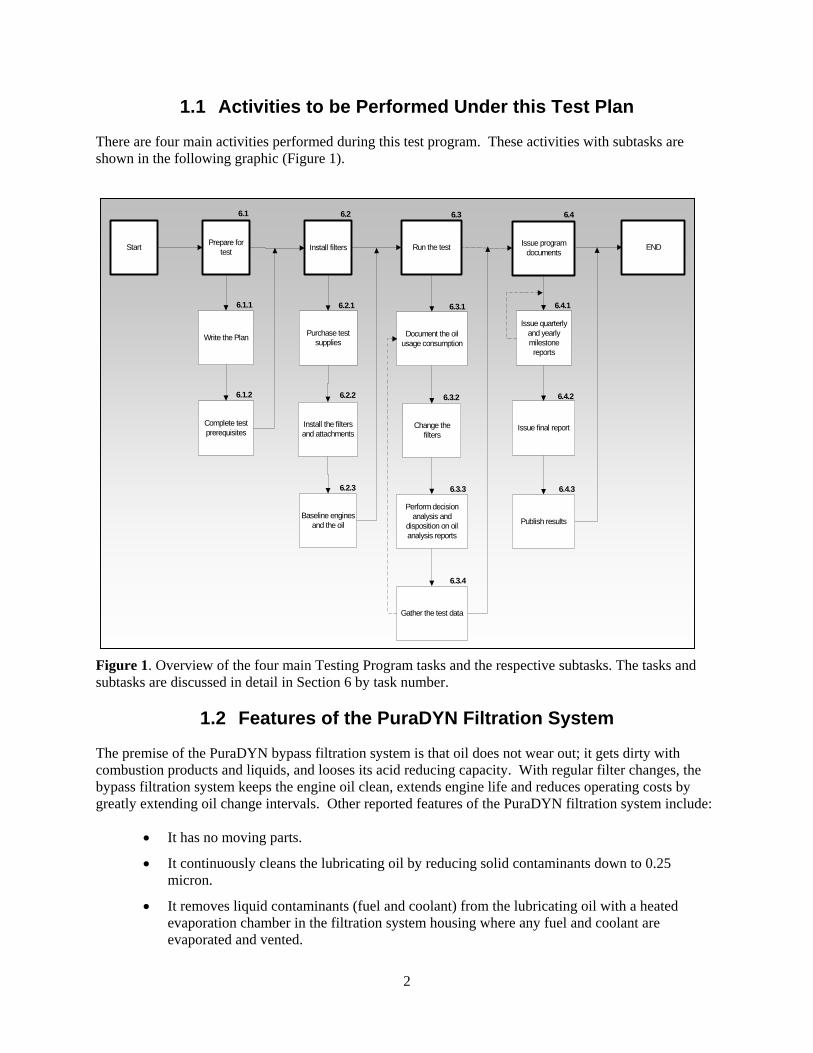
1.1 Activities to be Performed Under this Test Plan
There are four main activities performed during this test program. These activities with subtasks are shown in the following graphic (Figure 1).
Start Run the test Issue programdocuments
END
Change thefilters
Issue final report
Install filters
Purchase testsupplies
Prepare fortest
Write the Plan
Complete testprerequisites
Publish results
Install the filtersand attachments
Baseline enginesand the oil
Perform decisionanalysis and
disposition on oilanalysis reports
Issue quarterlyand yearlymilestonereports
Gather the test data
Document the oilusage consumption
6.1
6.1.1
6.1.2
6.2
6.2.1
6.2.2
6.2.3
6.3
6.3.1
6.3.2
6.3.3
6.3.4
6.4
6.4.1
6.4.2
6.4.3
Figure 1. Overview of the four main Testing Program tasks and the respective subtasks. The tasks and subtasks are discussed in detail in Section 6 by task number.
1.2 Features of the PuraDYN Filtration System
The premise of the PuraDYN bypass filtration system is that oil does not wear out; it gets dirty with combustion products and liquids, and looses its acid reducing capacity. With regular filter changes, the bypass filtration system keeps the engine oil clean, extends engine life and reduces operating costs by greatly extending oil change intervals. Other reported features of the PuraDYN filtration system include:
• It has no moving parts.
• It continuously cleans the lubricating oil by reducing solid contaminants down to 0.25 micron.
• It removes liquid contaminants (fuel and coolant) from the lubricating oil with a heated evaporation chamber in the filtration system housing where any fuel and coolant are evaporated and vented.
2
• Through a time-release feature in the bypass replacement filter, additives are released to the lubricant to maintain a high total base number (TBN) to neutralize any acid build up.
• It cleans the lubricant at six to eight gallons per hour.
• The bypass filter system can be installed in two hours.
• The subsequent bypass filter changing takes minutes.
• Each bypass filter system costs $325, each installation kit costs $90.00 and each replacement bypass filter cartridge costs $21.00.
2 REFERENCES
• PuraDYN Installation Manual • Instructional Installation Video
3 EQUIPMENT AND HARDWARE REQUIREMENTS
• The necessary personnel, tools, equipment, and facilities will be supplied by the INEEL Fleet Maintenance Heavy Vehicle Transportation Center for installation, maintenance, and servicing functions.
• Ten model PFT-40 PuraDYN filters systems (two backup systems) with installation kits, spare parts, and 112 replacement filter cartridges for the three-year test.
• Eight low mileage four-cycle diesel engines operating in INEEL buses.
• Three 55-gallon drums and 100 one-gallon jugs of Shell, Rotello, 15w-40 oil.
• Forty-eight full-flow filters—five for the Caterpillar engine and 35 for the Detroit Diesel engines.
4 PREREQUISITES AND PRE-TEST PREPARATION
• Conduct all required safety evaluations by Fleet Maintenance safety personnel to ensure all hazards have been identified and mitigated.
• Establish and maintain safety control procedures, job safety analyses, and work control documents.
• Establish the installation locations of the bypass filter housings within the bus engine compartments.
• Identify and define all tasks, performers, and deliverables of the test.
• Order and stage all filter systems, filter cartridges, installation supplies, engine oil, and spare parts in the Fleet Maintenance Facility.
• Pre-mark (or flag) the maintenance record database of the selected test buses with the test details and the testing instructions.
• Review and approve (signed off) the test plan prior to installing the filters.
• Detail the basic scope of the test and emphasize that it is a DOE-HQ sponsored test in a meeting with the appropriate bus fleet personnel,.
3
• Ensure the INEEL mechanics and foreman review the installation manual and view the instructional installation video.
• Install warning signs within the engine compartment alerting all fuelers, drivers and mechanics to any bypass filter system burn hazards, the non oil-change status of the bus, and oil-use logging requirements.
• Instruct the fuelers and drivers to use only the specified test oil when adding oil during their inspections and that they are to log the approximate volume of oil added.
• Instruct the mechanics to use only the unique test oil when adding oil during the filter changes and that they are to log to approximate volume of oil added.
• Provide oil use logs sheets for each of the buses and the oil storage area.
• Instruct the mechanics and shop foremen on the chain-of-custody requirements when capturing, submitting and archiving the oil analysis samples and containers.
• Install a lockable chemical cabinet for holding in-process and archived oil specimens.
• Convene and complete a readiness self-assessment prior to installation of the bypass filter systems to ensure manpower, safety, management, and equipment/supply issues have been addressed and are adequate for the test.
5 BASELINE OF THE ENGINES AND OIL ANALYSIS
Table 1 details the buses, bus engines, and oil.
Table 1. Test engine types and descriptions. Bus No. 1
Engine2 Cyl Cubic inches
Horse Power
Oil Cap (quarts)
Oil Engine Install Date
Engine Mileage3
Est. Annual Mileage
73425 Series 50 4 518 250 28 15-40 10/1/96 302,000 29,000
73432 Series 50 4 518 250 28 15-40 10/1/96 416,000 54,000
73433 Series 50 4 518 250 28 15-40 10/1/96 193,000 17,000
73446 Series 60 6 777 400 40 15-40 12/1/98 110,000 46,000
73447 Series 60 6 777 400 40 15-40 12/1/98 91,000 21,000
73448 Series 60 6 777 400 40 15-40 12/1/98 141,000 32,000
73449 Series 60 6 777 400 40 15-40 12/1/98 101,000 28,000
73450 Model 310 6 628 350 38 15-40 1/8/01 85,000 69,000
1. All of the buses are MCI coaches and the engines are tracked and maintained by the bus number. 2. The series 50 and series 60 are Detroit Diesel engines, and bus 73450 has a Caterpillar engine. 3. The three series 50 engines were installed as part of a research program with Detroit Diesel. The remaining 5
engines were installed as original equipment with each new bus coach.
5.1 Oil Analysis and Records
Oil analysis specimens are taken during each oil change in the following manner:
4
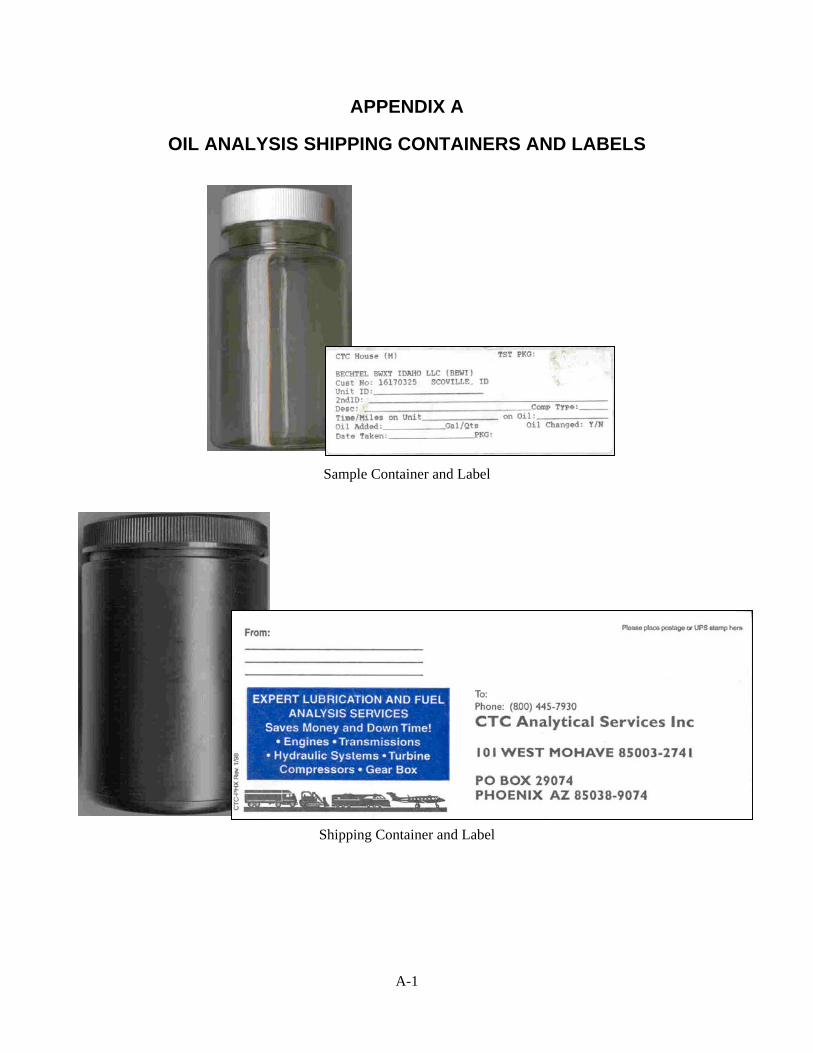
1. A sample of dirty or used oil is captured in a 120 cc sample container via the oil-sampling valve.
2. This container is tagged with a label containing information germane to the oil, bus engine, and customer.
3. The sample container is inserted into a shipping container and shipped to the oil analysis laboratory.
Photographs of the containers and copies of the labels are shown in Appendix A. The chain of custody of the oil, containers, labels and the analysis results is paramount in this test.
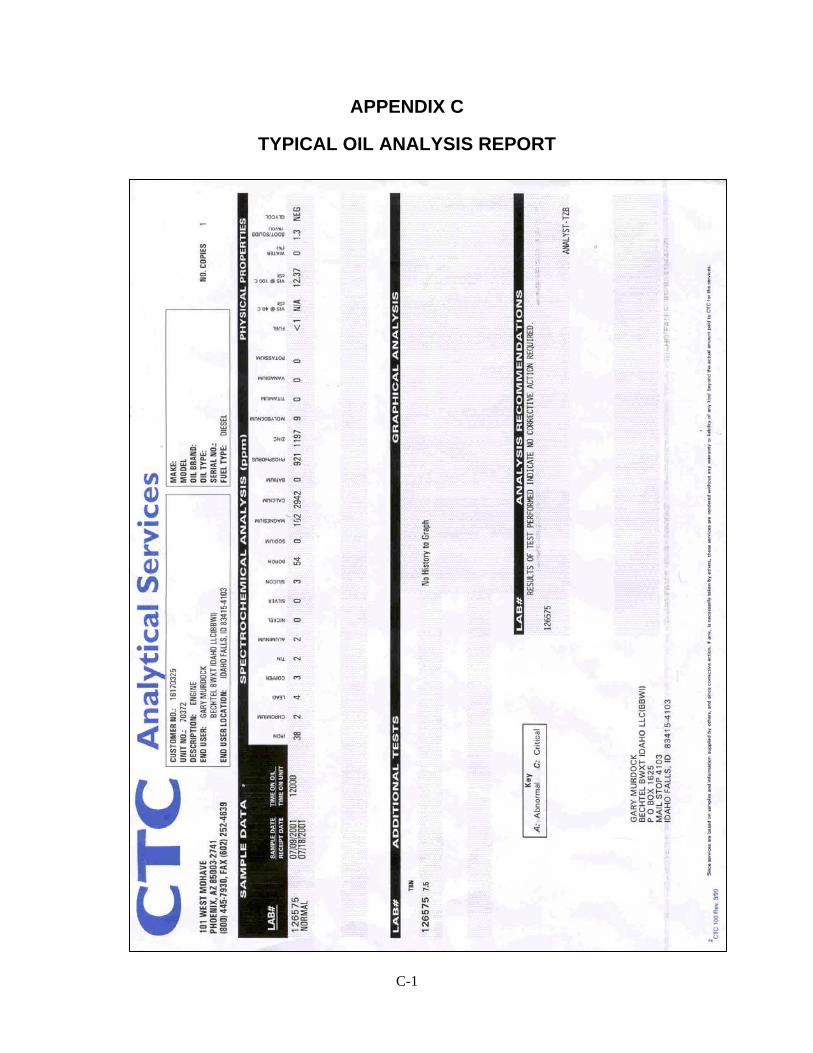
The product of an oil analysis is the oil analysis report. The report details:
• Engine metals • Viscosity • Fuel and coolant contaminants • TBN • Additive constituents • Recommendations
General values or limits of an oil analysis report for a new engine are shown in Appendix B. It should be noted that the wear pattern of each engine varies, but the most important flag to engine or lubrication problems is a significant deviation to an established profile. An independent oil analysis laboratory currently provides this service to the INEEL. For this program, the engine oil profiles will also be tracked at the INEEL.
A typical oil analysis report is shown in Appendix C. A detailed explanation of all aspects of oil analysis is located in Appendix D.
The oil analysis laboratory recommended by PuraDYN and, coincidently, currently used by the INEEL Fleet Operations is CTC Analytical Services of Phoenix, Arizona. CTC will continue to be used for oil analysis and a second oil analysis laboratory (Ana Laboratories of Bellmawr, NJ) will provide a second reference of the oil analysis test results at least until it is confirmed that the CTC results are accurate and consistent.
6 BYPASS FILTRATION SYSTEM - TESTING PROGRAM
• The high level tasks and subtasks of the testing program are shown in Figure 1 and discussed in detail in this section. The high level tasks include:
• Prepare for Test (Section 6.1)
• Install Filters and Initial Service of the Engines (Section 6.2)
• Run Test (Section 6.3)
• Issue Program Documents (Section 6.4)
5
6.1 Prepare for Test
6.1.1 Generate Test Plant.
Generating the test plan includes interacting with selected stakeholders to identify the test requirements, articulating the requirements, defining the interfaces between the stakeholders, and obtaining final agreement or sign-off on the test plan.
6.1.2 Complete Test Prerequisites
The prerequisites are listed in section 4 (Prerequisites and Pre-Test Preparation) and shall be completed prior to installation of the filter systems.
6.2 Install PuraDYN Filter System and Initial Service of the Engines
6.2.1 Purchase Test Supplies.
The supplies are listed in (Section 3 Equipment and Hardware Requirements) and shall be procured prior to the installation of the filter system.
6.2.2 Install the Filters and Attachments (Hoses and Connections)
Refer to the PuraDYN Installation Manual for detailed graphics and written instructions on the installation of the filter housing, connecting hoses, inserting the filter cartridge, and servicing the components. The installation of the bypass filter system shall be performed after the engine has been serviced with the test oil (see Section 6.2.3).
Once the installation is complete, the operation of the PuraDYN Filter System shall be verified. Once the filter cartridge is placed into the filter housing, there are two steps to ensure the filter is operational. These are:
1. Verify metering jet is not plugged. Open oil sample valve, which is down stream from the metering jet fitting. If oil flows this confirms the metering jet is not plugged.
2. Verify heated evaporation chamber in the filter housing is operational. If the heated evaporation chamber is functioning, the heating element will draw 12.5 amperes (12 volt system). The heating element causes the filter housing to have a near constant 200 degree F temperature.
6.2.3 Baseline Engines and Oil
Oil samples will be taken to document the initial oil-in-the-engine profile and the oil-in-the-can profile. This oil profiling includes the following tasks:
• Take three used oil analysis samples during oil changing service and label the containers • Submit one used oil sample to each of the two oil analysis laboratories. • Secure one used oil analysis specimens into the archive cabinet • Change the full flow filter—use the filters selected for the test that are in the storage area • Obtain engine oil from the oil storage area and log the quantity used on the log sheet. • Replace the engine oil with Shell Rotello, 15w-40 oil • Obtain three analysis samples of the new oil and label the containers
6
• Submit one new oil sample to each of the two oil analysis laboratories • Secure one new oil analysis specimens into the archive cabinet • Install the bypass filter system • Complete the Work Order.
6.3 Run Test
The testing activities are divided into four parts:
• Document the daily oil usage consumption (Section 6.3.1) • Change the filters (Section 6.3.2) • Analyze oil analysis reports (Section 6.3.3) • Gather the Test Data (Section 6.3.4)
6.3.1 Document the Daily Oil Usage Consumption
The driver and the fueler check the bus oil level daily when the bus is fueled. A one-gallon container of oil and an Oil Usage Log are located in the storage compartment of each bus. When oil is needed, only the test oil, Shell, Rotello, 15w-40 is to be used and the amount added is entered on the Oil Usage Log sheet (Appendix E).
6.3.2 Change the Filters
The Changing the Filters flow diagram (Appendix F) details the sequential and repetitive steps and decision boxes in changing the filters, capturing the oil analysis samples, and analyzing the oil analysis results during the test. The PuraDYN literature defines the filter replacement schedule recommendations. These recommendations are included in the Extended Oil Drain Schedule (Appendix G) and reflected in the Changing the Filters flow chart (Appendix F).
6.3.3 Analyze Oil Analysis Reports
The shop foreman reviews the oil analysis reports and completes the decision analysis process by documenting the unit number, oil analysis sample date, miles on oil and disposition (yes – continue oil use or no - change the oil). When a negative disposition occurs, the test engineer and the maintenance supervisor are notified.
A decision analysis is performed when the shop foreman reviews each oil analysis report by following the Decision Analysis and Disposition Chart (Appendix H) to determine the fitness of the oil for continued use. The chart diagram defines the decision steps related to each data aspect of the oil analysis report. The decision steps are based on:
• The elevated levels of metal wear of engine components in parts per million (ppm) • The elevated percent levels of fuel and coolant contaminants • The reduction of the TBN • The reduced levels of oil additive constituents • The reduced viscosity levels • The significant changes in any analysis trend.
7
6.3.4 Gather the Test Data
The test engineer gathers the following test data from the various performers:
• Oil Usage Logs • Work Orders • Oil Analysis Reports • Decision Analysis and Disposition Charts
6.4 Issue Program Documents
Issuing program reports is divided into three parts:
• Quarterly and yearly milestone reports (Section 6.4.1) • Final Report (Section 6.4.2) • Publish Results (Section 6.4.3)
6.4.1 Quarterly and yearly Milestone Reports
Quarterly status reports will be issued, including:
• Total miles traveled per bus
• Number of filter changes per bus
• Total gallons of oil usage per bus
• Trends reported in the oil analysis reports.
• Initial analysis of economic tradeoffs such as oil use and disposal reductions versus system installation costs.
• The yearly milestone reports shall rollup the quarterly report data and provide a year-to-date cost savings/cost avoidance analysis.
6.4.2 Final Report
At a minimum, the final report to DOE shall include:
• Compilation of the quarterly status and yearly milestone reports
• Documentation of the PuraDYN filter system performance
• Compilation of the comprehensive life-cycle costs benefits
• Evaluation of the cost effectiveness and return of investment for installing PuraDYN filter system within the complete INEEL bus fleet.
6.4.3 Publish Results
The test program activities will be presented in DOE publications, selected professional or trade journals, and at industry conferences.
8

7 SAFETY CONCERNS AND PRECAUTIONS
• There are no unique safety concerns or precautions with the installation of the PuraDYN filter system beyond the normal hazards related to heavy mechanic work.
• There is one potential hazard with the servicing of the bypass filter. The evaporation chamber (inside of the filter where fuel and water are evaporated) is heated causing the outside surface of the filter housing to be approximately 200 degree F. The housing is pre-labeled, at the factory, “HOT”. Also, there is a sign posted where the filter is attached that states the filter housing is hot. With training and warning signs, the mechanics shall avoid this hazard as they do other hotter engine parts such as exhaust manifolds
• The Fleet Operations safety personnel have reviewed this test plan (maintenance and servicing activities) and the installation manual, and found no unique safety concerns
• The mechanic shall have tailgate training on the hazards of maintenance and servicing the filter systems.
8 TEST DATA REPORTING REQUIREMENTS
The buses and the engines all have regular maintenance and servicing. A matrix of the general tasks, performers and test data deliverables relating to maintaining and servicing are shown in Table 2.
Table 2. General Tasks, Performers and Deliverables Task Performer Deliverable Notes
Add oil as needed during daily pre-trip check
Driver Record volume on Oil Usage Log
The drivers are required to perform a pre-trip inspection. Part of their pre-trip inspection is to check the oil and add oil as needed.
Add oil as needed during bus fueling
Fueler Record volume on Oil Usage Log
The bus fuelers are required to perform an engine oil check during fueling.
Receive alert for service notice
Shop Foreman
Work Order The alert for service request relating to lubrication occurs at 12,000-mile intervals. The only exception is at the beginning of the test when the first service is at 6,000 miles; afterward it is at 12,000-mile intervals. A Work Order is generated at each alert.
Turn in service documents
Mechanic Work Order Completed Work Order is returned to shop foreman when the work is finished.
Receive oil analysis report
Shop Foreman
Oil analysis report
The oil analysis report is issued by the oil analysis laboratory with each 12,000-mile service. The oil analysis laboratory sends the report directly to the Shop Foreman.
Perform decision analysis on oil analysis report
Shop Foreman
Decision Analysis and Disposition Chart
The Shop Foreman uses the Decision and Analysis and Disposition Chart as a checklist when reviewing the oil analysis reports and to document the continued use or change oil disposition.
9
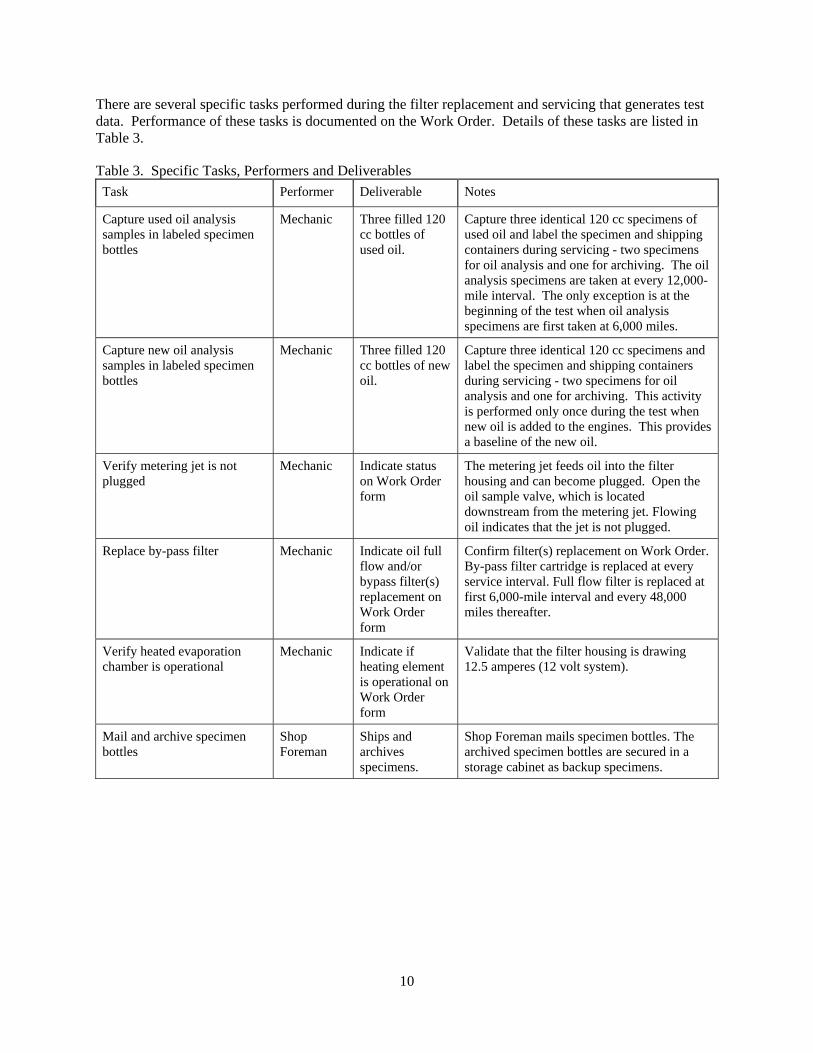
There are several specific tasks performed during the filter replacement and servicing that generates test data. Performance of these tasks is documented on the Work Order. Details of these tasks are listed in Table 3.
Table 3. Specific Tasks, Performers and Deliverables Task Performer Deliverable Notes
Capture used oil analysis samples in labeled specimen bottles
Mechanic Three filled 120 cc bottles of used oil.
Capture three identical 120 cc specimens of used oil and label the specimen and shipping containers during servicing - two specimens for oil analysis and one for archiving. The oil analysis specimens are taken at every 12,000-mile interval. The only exception is at the beginning of the test when oil analysis specimens are first taken at 6,000 miles.
Capture new oil analysis samples in labeled specimen bottles
Mechanic Three filled 120 cc bottles of new oil.
Capture three identical 120 cc specimens and label the specimen and shipping containers during servicing - two specimens for oil analysis and one for archiving. This activity is performed only once during the test when new oil is added to the engines. This provides a baseline of the new oil.
Verify metering jet is not plugged
Mechanic Indicate status on Work Order form
The metering jet feeds oil into the filter housing and can become plugged. Open the oil sample valve, which is located downstream from the metering jet. Flowing oil indicates that the jet is not plugged.
Replace by-pass filter Mechanic Indicate oil full flow and/or bypass filter(s) replacement on Work Order form
Confirm filter(s) replacement on Work Order. By-pass filter cartridge is replaced at every service interval. Full flow filter is replaced at first 6,000-mile interval and every 48,000 miles thereafter.
Verify heated evaporation chamber is operational
Mechanic Indicate if heating element is operational on Work Order form
Validate that the filter housing is drawing 12.5 amperes (12 volt system).
Mail and archive specimen bottles
Shop Foreman
Ships and archives specimens.
Shop Foreman mails specimen bottles. The archived specimen bottles are secured in a storage cabinet as backup specimens.
10

9 ANTICIPATED RESULTS
• Published data suggests PuraDYN customers have seen cost savings up to 90% on oil purchases and oil disposal due to greatly extended oil change frequencies. Cost savings captured by extending the oil change frequency includes those identified in Section 1, plus other economic benefits of less dependency on foreign oil and less oil-related environmental issues—spills, drinking water contamination, and waste oil handling/disposal.
• The INEEL would immediately avoid using 30 to 40 gallons of oil with every servicing on every bus engine with this new filter system.
• With the oil use reduction, there is concurrently 30 to 40 gallons of oil that does not have to be disposed of at each oil change.
• Vehicle maintenance requirements should decrease and utilization should increase.
• The life cycle cost savings of oil changes should be greater than any additional costs associated with the bypass filter system.
10 CONTACT PERSONS
The test program point of contact list is show in Table 4.
Table 4. Test Plan contact list. Order NAME Email ORG. PHONE
1 Larry Zirker [email protected] *BBWI / INEEL test engineer 208-526-0152
2 Ted Thomas [email protected] BBWI / INEEL Fleet Maintenance Supervisor
208-526-7247
3 Gary Murdock [email protected] BBWI / INEEL Bus & Heavy Equipment Foreman
208-526-2248
4 Jim Francfort [email protected] BBWI / INEEL Field Operations Program Manager
208-526-6787
5 Kirt Bullock [email protected] BBWI / INEEL Fleet Maintenance Department Manager
208-526-2252
6 Tim Murphy [email protected] BBWI / INEEL TT&I Department Manager
208-526-0480
7 Mike Anderson [email protected] DOE-ID
Project Manager
208 526-7418
Kevin Kroger [email protected] **PuraDYN Chief Operations Officer
248-931-2644
Frank Lotz [email protected] PuraDYN Product Engineering 561-547-9499
*BBWI – Bechtel BWXT Idaho, LLC is the prime contractor at the INEEL. **PuraDYN – PuraDYN Filter Technologies Company is the manufacturer of filter system to be tested.
11
APPENDIX A
OIL ANALYSIS SHIPPING CONTAINERS AND LABELS
Sample Container and Label
Shipping Container and Label
A-1
APPENDIX B
VALUE LIMITS FOR OIL ANALYSIS REPORTS T
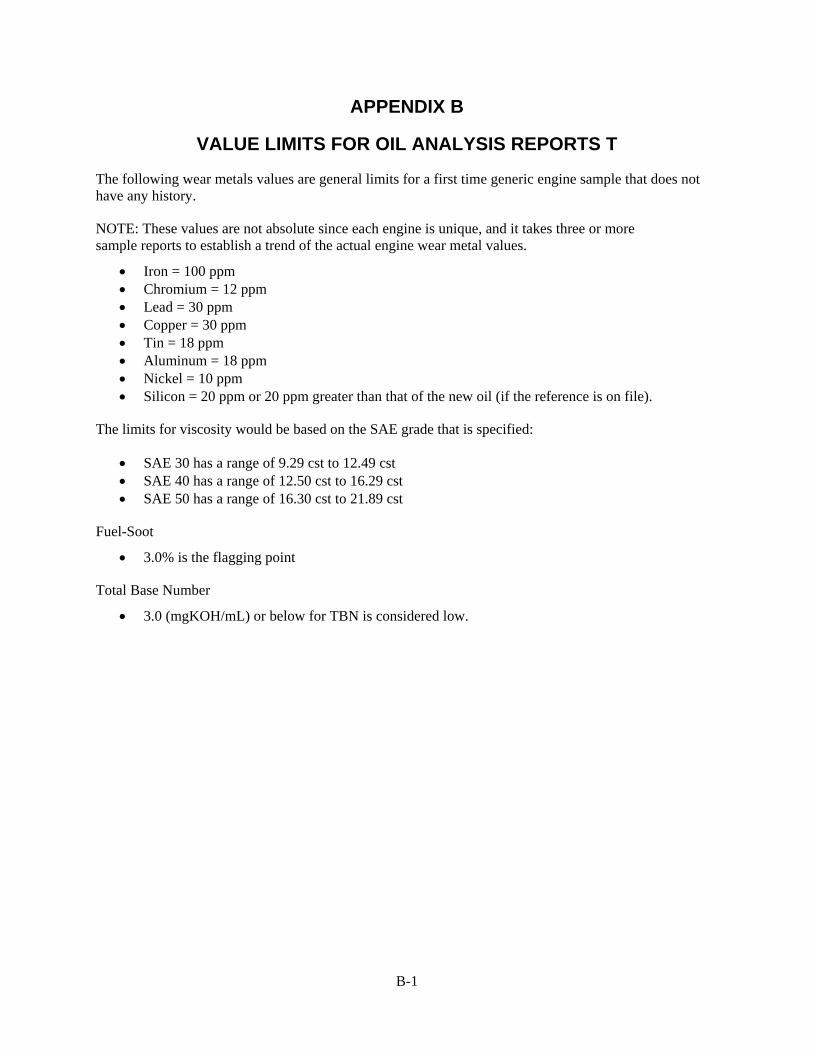
The following wear metals values are general limits for a first time generic engine sample that does not have any history.
NOTE: These values are not absolute since each engine is unique, and it takes three or more sample reports to establish a trend of the actual engine wear metal values.
• Iron = 100 ppm • Chromium = 12 ppm • Lead = 30 ppm • Copper = 30 ppm • Tin = 18 ppm • Aluminum = 18 ppm • Nickel = 10 ppm • Silicon = 20 ppm or 20 ppm greater than that of the new oil (if the reference is on file).
The limits for viscosity would be based on the SAE grade that is specified:
• SAE 30 has a range of 9.29 cst to 12.49 cst • SAE 40 has a range of 12.50 cst to 16.29 cst • SAE 50 has a range of 16.30 cst to 21.89 cst
Fuel-Soot
• 3.0% is the flagging point
Total Base Number
• 3.0 (mgKOH/mL) or below for TBN is considered low.
B-1
APPENDIX C
TYPICAL OIL ANALYSIS REPORT
C-1
APPENDIX D
TECHTRAKS
Spectro-Metals
Glossary Description: Any of several techniques for detecting and quantifying trace metallic elements, in which the sample is energized to make the element(s) emit or absorb a quantifiable amount of light energy.
How is the test performed? Two methods prevail today: EMISSION – The sample is energized via electric arc. The elements emit discrete wavelengths of energy. Photomultiplier tubes (at least one for each element of interest) measure the amount of energy for each element. Energy measured is proportional to the concentration of each respective element. ABSORPTION – The element of interest absorbs light energy emitted from a tube whose cathode is made of that element. Absorption technique is confined to one element at a time.
Reporting Units: Parts-per-million (ppm) by weight. 1 ppm – 0.0001%
Repeatability: (approx.): 1-20 ppm (+/- 1ppm); 20-500 (+/- 5%); 500+ (+/- 8-10%)
Technical Overview: SP (Spectro-metals) is confined to the measurement of metallic particles <10 microns in size and is thus limited on detecting catastrophic failures. In some applications, it is a weaker alternative. There is insufficient energy available (in the standard process) to enable ionization of particles well below 10 microns (varying according to the type of spectrometer and the element one is attempting to detect, as well as the form the elements is in), which must occur if spectral energy is to be developed.
− Because SP is particularly effective for detecting extremely small particles (the smaller the better) it is one of the tests LEAST affected by the sampling technique. Sampling location however, should always be constant.
Interpretation: Spectrometals (SP) testing provides information on three distinct areas of interest: WEAR, CONTAMINATION, and ADDITIVES.
Wear Metals: Iron, Chrome, Molybdenum, Aluminum, Lead, Copper, Tin, Nickel, Silver, Antimony, Titanium.
Contaminant Metals: Silicon, Sodium, Potassium, Boron.
Additive Metals: Magnesium, Calcium, Barium, Phosphorus, Zinc.
Special Note: The listing above provides only the primary situation in which one may detect the metals. In reality, nearly every element can fit into all three categories and many fit into two routinely.
D-1
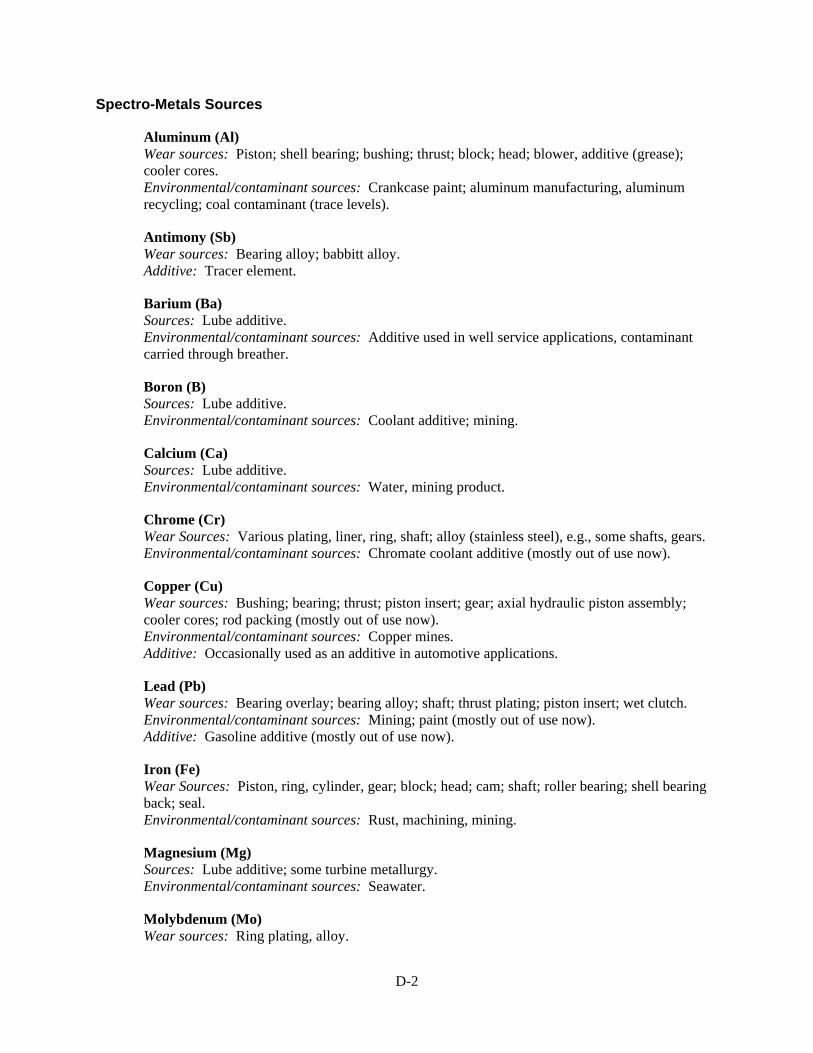
Spectro-Metals Sources
Aluminum (Al) Wear sources: Piston; shell bearing; bushing; thrust; block; head; blower, additive (grease); cooler cores. Environmental/contaminant sources: Crankcase paint; aluminum manufacturing, aluminum recycling; coal contaminant (trace levels).
Antimony (Sb) Wear sources: Bearing alloy; babbitt alloy. Additive: Tracer element.
Barium (Ba) Sources: Lube additive. Environmental/contaminant sources: Additive used in well service applications, contaminant carried through breather.
Boron (B) Sources: Lube additive. Environmental/contaminant sources: Coolant additive; mining.
Calcium (Ca) Sources: Lube additive. Environmental/contaminant sources: Water, mining product.
Chrome (Cr) Wear Sources: Various plating, liner, ring, shaft; alloy (stainless steel), e.g., some shafts, gears. Environmental/contaminant sources: Chromate coolant additive (mostly out of use now).
Copper (Cu) Wear sources: Bushing; bearing; thrust; piston insert; gear; axial hydraulic piston assembly; cooler cores; rod packing (mostly out of use now). Environmental/contaminant sources: Copper mines. Additive: Occasionally used as an additive in automotive applications.
Lead (Pb) Wear sources: Bearing overlay; bearing alloy; shaft; thrust plating; piston insert; wet clutch. Environmental/contaminant sources: Mining; paint (mostly out of use now). Additive: Gasoline additive (mostly out of use now).
Iron (Fe) Wear Sources: Piston, ring, cylinder, gear; block; head; cam; shaft; roller bearing; shell bearing back; seal. Environmental/contaminant sources: Rust, machining, mining.
Magnesium (Mg) Sources: Lube additive; some turbine metallurgy. Environmental/contaminant sources: Seawater.
Molybdenum (Mo) Wear sources: Ring plating, alloy.
D-2
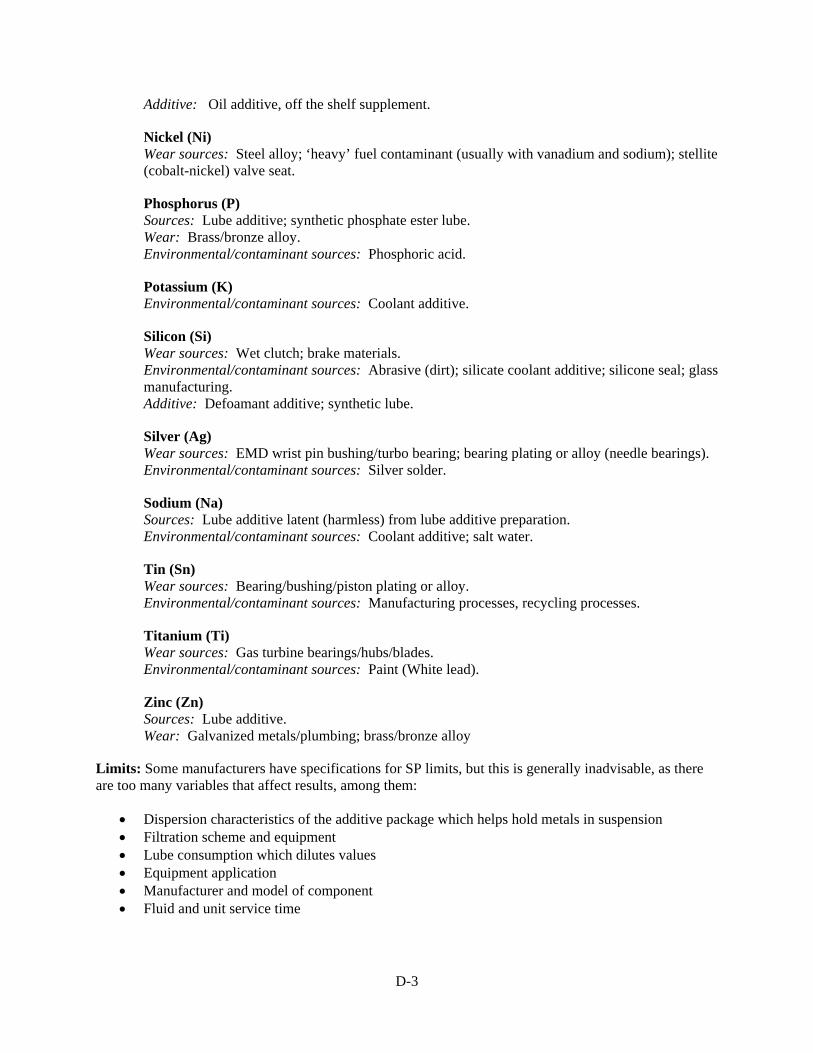
Additive: Oil additive, off the shelf supplement.
Nickel (Ni) Wear sources: Steel alloy; ‘heavy’ fuel contaminant (usually with vanadium and sodium); stellite (cobalt-nickel) valve seat.
Phosphorus (P) Sources: Lube additive; synthetic phosphate ester lube. Wear: Brass/bronze alloy. Environmental/contaminant sources: Phosphoric acid.
Potassium (K) Environmental/contaminant sources: Coolant additive.
Silicon (Si) Wear sources: Wet clutch; brake materials. Environmental/contaminant sources: Abrasive (dirt); silicate coolant additive; silicone seal; glass manufacturing. Additive: Defoamant additive; synthetic lube.
Silver (Ag) Wear sources: EMD wrist pin bushing/turbo bearing; bearing plating or alloy (needle bearings). Environmental/contaminant sources: Silver solder.
Sodium (Na) Sources: Lube additive latent (harmless) from lube additive preparation. Environmental/contaminant sources: Coolant additive; salt water.
Tin (Sn) Wear sources: Bearing/bushing/piston plating or alloy. Environmental/contaminant sources: Manufacturing processes, recycling processes.
Titanium (Ti) Wear sources: Gas turbine bearings/hubs/blades. Environmental/contaminant sources: Paint (White lead).
Zinc (Zn) Sources: Lube additive. Wear: Galvanized metals/plumbing; brass/bronze alloy
Limits: Some manufacturers have specifications for SP limits, but this is generally inadvisable, as there are too many variables that affect results, among them:
• Dispersion characteristics of the additive package which helps hold metals in suspension • Filtration scheme and equipment • Lube consumption which dilutes values • Equipment application • Manufacturer and model of component • Fluid and unit service time
D-3
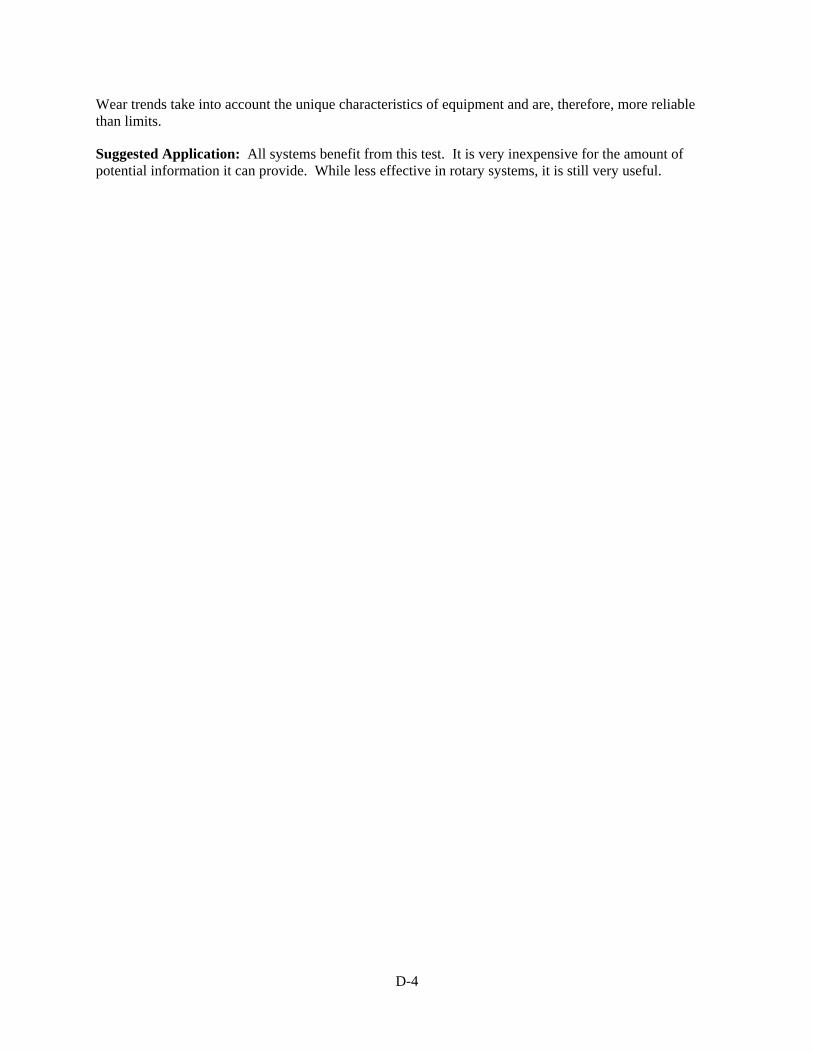
Wear trends take into account the unique characteristics of equipment and are, therefore, more reliable than limits.
Suggested Application: All systems benefit from this test. It is very inexpensive for the amount of potential information it can provide. While less effective in rotary systems, it is still very useful.
D-4
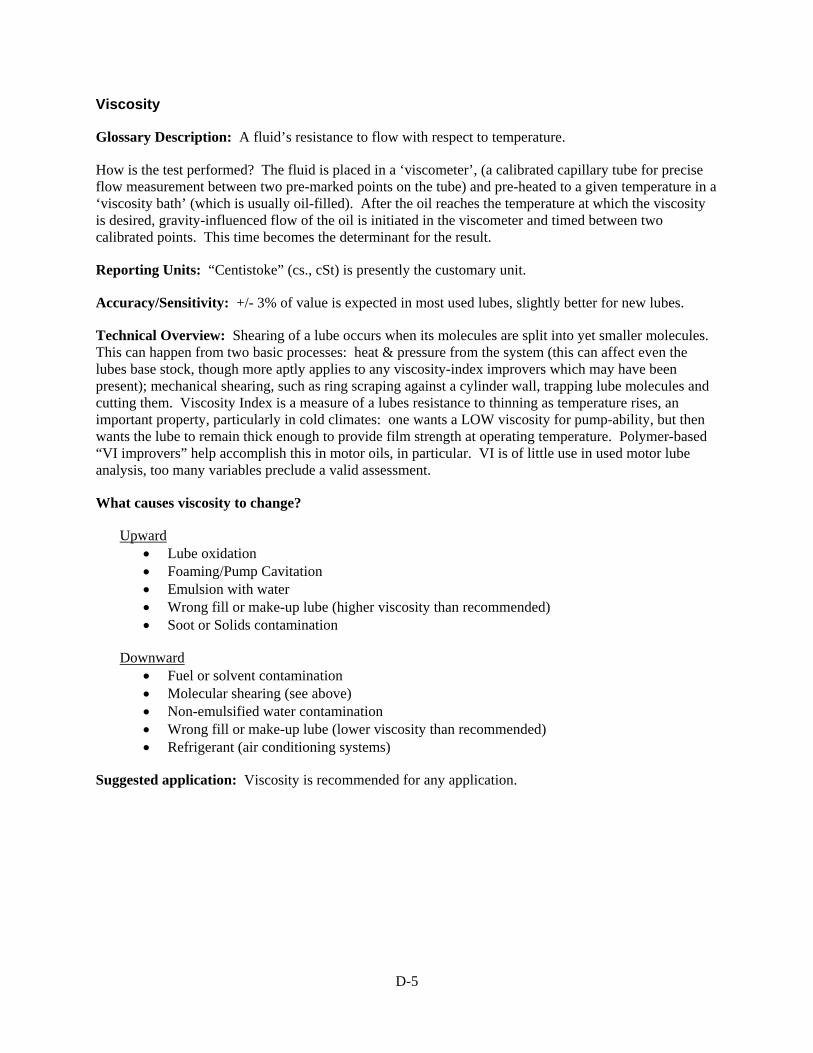
Viscosity
Glossary Description: A fluid’s resistance to flow with respect to temperature.
How is the test performed? The fluid is placed in a ‘viscometer’, (a calibrated capillary tube for precise flow measurement between two pre-marked points on the tube) and pre-heated to a given temperature in a ‘viscosity bath’ (which is usually oil-filled). After the oil reaches the temperature at which the viscosity is desired, gravity-influenced flow of the oil is initiated in the viscometer and timed between two calibrated points. This time becomes the determinant for the result.
Reporting Units: “Centistoke” (cs., cSt) is presently the customary unit.
Accuracy/Sensitivity: +/- 3% of value is expected in most used lubes, slightly better for new lubes.
Technical Overview: Shearing of a lube occurs when its molecules are split into yet smaller molecules. This can happen from two basic processes: heat & pressure from the system (this can affect even the lubes base stock, though more aptly applies to any viscosity-index improvers which may have been present); mechanical shearing, such as ring scraping against a cylinder wall, trapping lube molecules and cutting them. Viscosity Index is a measure of a lubes resistance to thinning as temperature rises, an important property, particularly in cold climates: one wants a LOW viscosity for pump-ability, but then wants the lube to remain thick enough to provide film strength at operating temperature. Polymer-based “VI improvers” help accomplish this in motor oils, in particular. VI is of little use in used motor lube analysis, too many variables preclude a valid assessment.
What causes viscosity to change?
Upward • Lube oxidation • Foaming/Pump Cavitation • Emulsion with water • Wrong fill or make-up lube (higher viscosity than recommended) • Soot or Solids contamination
Downward • Fuel or solvent contamination • Molecular shearing (see above) • Non-emulsified water contamination • Wrong fill or make-up lube (lower viscosity than recommended) • Refrigerant (air conditioning systems)
Suggested application: Viscosity is recommended for any application.
D-5
Fuel Soot
Glossary Description: Combustion solids from reciprocating engines, however, the primary application is diesel engines.
How is the test performed? With IR one draws inferences from sample opacity (light dispersion) and certain absorbencies. A standard reference curve is then developed and stored in the infrared spectrometer’s on-board computer. This particular approach has been correlated against a more rigorous technique, thermo-gravimetric analysis, with near-linearity to 3%, useful to 5%.
Reporting Units: Percent of SOOT contamination by volume.
Accuracy/Range: 0.2% or +/- 10% of value, whichever is greater. Practical range: 0.1 to 5.0%.
Technical Overview: This test was developed primarily with Diesel engines in mind, as their combustion nature produces the most obvious soot. More recently it has been disclosed that “fuel soot”, although it causes no known direct-wear problems in moderate amounts, DOES evidently “tie up” the anti-wear additive (any of several possible forms of zinc di-thiophosphate) to some extent, rendering the additive less effective. Excessive solids may possibly impair anti-wear benefits and, indirectly, perhaps lead to additional wear above “normal” for given unit. Do not confuse SOOT discussed here with (see) Particle Count or DR Ferrography. The latter are entirely different investigative aspects.
Interpretation: Significance of soot/solids will vary according to unit type, model and application. Diesel Engines (0.1 to 5.0%): Combustion solids or “fuel soot” (mostly carbon from incomplete fuel burn but can also contain oxidized fuel and/or lube, the latter more lacquer-like in nature).
If excessive, possible causes are:
Wear – oriented Turbocharger or blower seal leakage Blow-by (excessive crankcase pressure) As applicable; Worn pistons, rings, cylinders worn accessory drive air compressor Worn valves/guides or other area of valve train
Operations – oriented Lube change interval too long Over fueling or excessive idling Incorrect rack setting Restricted air intake Excessive exhaust backpressure Leaking/worn injector nozzle
Gasoline Engines (0.1 to 1.15): Combustion blow-by, if excessive, possible causes: Overextended drain, timing/tune-up needed, excessive temperatures.
4-Cycle Gas Engines (0.1 to 2.0): Combustion blow-by, oxidized/nitrated fuel/lube, if excessive, possible causes: Fueling/timing problems, overextended drain, low operating temperatures.
Suggested Application: All diesel engines, some gasoline engines and gas-fired engines.
D-6
Infrared Analysis (IR)
Glossary Description: A form of absorption spectroscopy (IR) confined to the infrared spectral wavelength region, which primarily addresses identification and quantification of organic functional groups.
How is the test performed? A thin layer (approx. 0.1 mm) of lube is spread on a zinc selenide crystal. Infrared radiation is directed at the sample (though the crystal’s bottom side) and a detector measures the amount of energy absorbed on a per-wavelength basis. Specific classes of compounds absorb specific infrared wavelengths, allowing detection and quantification. A computer subtracts the reference from the sample, providing results as a difference, with the exception of the hydrocarbon value, which is reported without a reference subtraction.
Reporting Units: Absorption units (AU) per centimeter (cm) in the form, x.xxxx (or some variation of multiple thereof; we use xxxx).
Expected Repeatability: +/- 3 AU or 5%, whichever is greater.
Technical Overview: IR deals mainly with the chemistry of a lubricant’s base stock and additive packages (if any). For lube analysis purposes it might be considered the chemistry of Carbon, Hydrogen, Oxygen, Nitrogen, Phosphorus and Sulfur, even more specifically, the configurations and combinations in which these elements are linked (referred to as “functional groups”), but IR is certainly not limited to these elements. “FTIR” (Fourier Transforms IR, after the French mathematician), is the current technical standard for IR. Fourier Transforms allow the generation of complex curves from digitally represented data. An on-board computer allows data acquisition/storage, as well as provides the number crunching power to achieve the transforms rapidly, thus, Fast FTIR (FFTIR), a very powerful technique.
Interpretation: There are two basic types of results available: Individual absorption readings at specific wavelengths (most common) to investigate specific characteristics; Complete wavelength scanning (or curving) for product matching and investigation of unknowns.
Used lube analysis often utilizes specific wavelengths for repetitive logging of data on an individual sump. By so doing one may be able to identify and develop trends as with other test procedures.
Wavelength Functional Group Range2.9 microns Water 0 – 5 3.5 microns Hydrocarbon (identifies if mineral oil or synthetic) 500 – 1000 5.8 microns Oxidation 0 – 24 6.1 microns Nitration 0 – 24 9.6 microns Glycol 0 – 50
The above ranges are for orientation purposes only. As with most used lube testing it is often trends, not absolute number, which determine when to conclude, for instance, that the lube has “oxidized” to a significant extent. Baseline data from new lube references are very important if correct inferences are to be made. The client’s onsite supply should be the baseline source, since batches of lube may significantly vary in IR absorption properties, thus semi-annual lube storage sampling is advised in order to remain current.
Suggested Application: IR is amenable to any lube system, offering its fullest possibilities with reciprocating engines and compressors. Hydraulic systems and gearboxes are also applicable.
D-7
Total Base Number (TBN)
Glossary Description: A neutralization number intended for measuring all basic (alkaline) materials in the lube, e.g. acid-neutralizing components in the lubes additive package.
How the test is performed? The sample is diluted with solvent and acid (hydrochloric {HCL} or perchloric {H3PO4}) is added in controlled increments from a buret (a calibrated tube with a stopcock valve at the bottom to allow gravity feed) until the sample is neutralized. This process is called a titration. The acid is the titrant. Neutralization is determined with a volt or pH meter, and the neutralization point usually occurs around pH 4. The amount of acid consumed is recorded and the TBN calculated from that value.
Reporting Units: Milligrams (mg) of potassium hydroxide (KOH)*/milliliter (ml) of lube. Repeatability: +/- 10%. Range: 0.01 – 80 (encompassing virtually all systems).
Technical Overview: *It appears incongruous to express TBN in terms of KOH, in as much as HCL is the titrant, but this convention renders TBN and TAN (total acid number) ‘compatible’ in term of relative magnitude (neutralization numbers utilize the atomic formula weight of the titrant in the calculation – KOH’s formula weight is more than 1.5 time HCL’s). The only oddity of this notion is that TBN and TAN don’t necessarily relate to one another, nor is one the opposite of the other (it is possible and usual for a motor lube to have a TBN and TAN simultaneously), so there is no real need to develop a common denominator. Note: ASTM D664 TBN method has given way (and will not be retained by ASTM as a method) to D2896 (“perchloric acid method”) as the recommended method for new lubes, as well as general practice. D664 however, still has practical use in traditional used lube analysis and will probably remain to some degree for at least awhile. Note: TAN, in conjunction with TBN, is recommended for extended drain interval evaluations.
− Recently ASTM D4739 has been developed as a probable alternative to D664.
Interpretation: TBN is a measure of the lube’s alkaline reserve and mostly applies to motor lubes. If a lube contains no alkaline additives, there is little use to determining a TBN, as there will likely be none. TBN is attacked by combustion acids, e.g., Sulfuric Acid, decreasing as it consumes. There are varying schools of thoughts as to when a TBN is sufficiently low enough to suggest a drain.
Crude “Rule of Thumb”: If TBN decreases to 2.0 or decreases more than 50% from starting point, a drain should be contemplated. One needs to be careful here – although a used lubricant may exhibit a TBN of, say, 2.0, there may be a need for a higher TBN level at the point of combustion blow-by attack (the ring belt area). Although the entire crankcase has TBN 2.0 in it, only a small portion of it can be at the “battle point”, particularly when engine shutdown occurs and the cylinder areas reach dew point for water condensation. A safety margin should be considered whenever sulfur is a potential problem.
Some manufacturers may impose a ratio of TBN to sulfur %; levels of 10-20 might be specified. Gasoline does not directly pose a sulfur problem to an engine. Instead, gasoline engines, owing to their fuel type and combustion mechanism, tend to form complex peroxy acids, which ultimately attack the TBN. Marine cylinder lube types may have TBN’s as high as the 70’s, as these lubes must combat sulfur levels as lofty as several percent, dependent on the fuel type and point of origin. The rule of 20 time sulfur levels for TBN seems to hold true for this application.
Suggested Application: Reciprocating engines, natural gas engines and compressors using alkaline lube, alkaline environment situations where the lube does not contain alkaline additives, but can be contaminated with alkaline materials.
D-8
Total Acid Number (TAN)
Glossary Description: A neutralization number intended for measuring all acidic and acid-acting materials in the lube, including strong and weak acids.
How is the test performed? The sample is diluted with solvent and base (alkaline), in the form of potassium hydroxide (KOH), which is added in controlled increments from a buret (a calibrated tube with a stopcock valve at the bottom to allow gravity feed) until the sample is neutralized. This process is called a titration. The KOH is the titrant. Neutralization is determined with a volt or pH meter, and the neutralization point usually occurs around pH 11. The AN is calculated from the amount of KOH consumed.
Reporting Units: Milligrams (mg) of potassium hydroxide/milliliter (ml) of lube.
Repeatability: +/- 10% Range: 0.01 – 20 (practical)
Technical Overview: Many standard lube additives yield a non-harmful TAN even as new, thus it is important to establish baseline values. Phosphorus/Zinc compounds may contribute as much as 2.0 TAN dependent upon concentrations. Magnesium, Calcium, and Barium (even though they are alkaline contributors), can still yield an TAN value of as much as 2-3, again dependent upon concentration, so a ‘fully compounded’ lube might easily have a starting acid number of 2-5. This is a difficult concept to find comfort with, but it stems from the tendency to regard all acids as corrosive, rather than acids in the sense of their electrochemical behavior, i.e., there are degrees of acid behavior. Such degrees are expressed as pH, which represents acid strength (lower = greater strength), but not necessarily the quality. PH, therefore, does not relate to AN in any sense.
Interpretation: AN is comprised of both strong and weak acids. Strong acids tend to be corrosive, and are accordingly much more necessary to control. Examples of strong acids are:
• Hydrochloric Acid (HCL) breakdown of freon in refrigeration compressors; certain work environments.
• Hydrofluoric Acid (HF) breakdown of freon. • Sulfuric Acid (H2SO4) Diesel combustion by-product from sulfur in fuel; certain work
environments. • Nitric Acid (HNO3) certain work environments (e.g., a phosphate mine).
All of the above will etch or corrode various metals in varying degrees. A low pH (<4.5) probably indicates the presence of one or more of the above acid types in at least the beginning stages of concern, particularly if water is present, since the acid can then achieve its fullest chemical potential.
Weak acids do not usually cause corrosion problems, but certain leaded bearings and coatings can be attacked by weak acids. Often times the development of weak acids may indicate lube oxidation and, as such, represents an effect, not a cause. Once this occurs to excess, however, it can be self-sustaining, thus a lube might need to be drained (or “sweetened” {a partial drain}, if the sump capacity is too large to drain economically).
Crude “Rule of Thumb”: Increases of 2.0 or 50% (whichever is greater) against baseline (new lube reference) = drain or sweeten (drain partially and top with fresh oil).
Suggested Application: Plant equipment; engines using high sulfur fuel, most non-engines, extended drain studies for engines.
D-9
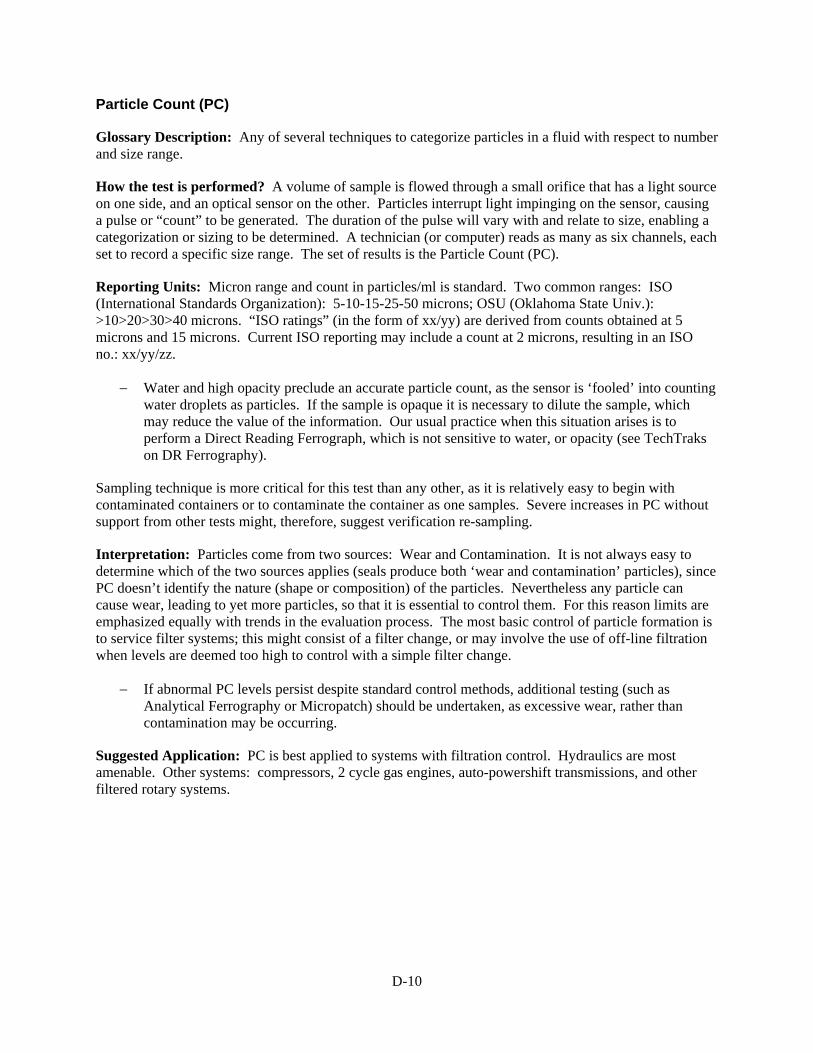
Particle Count (PC)
Glossary Description: Any of several techniques to categorize particles in a fluid with respect to number and size range.
How the test is performed? A volume of sample is flowed through a small orifice that has a light source on one side, and an optical sensor on the other. Particles interrupt light impinging on the sensor, causing a pulse or “count” to be generated. The duration of the pulse will vary with and relate to size, enabling a categorization or sizing to be determined. A technician (or computer) reads as many as six channels, each set to record a specific size range. The set of results is the Particle Count (PC).
Reporting Units: Micron range and count in particles/ml is standard. Two common ranges: ISO (International Standards Organization): 5-10-15-25-50 microns; OSU (Oklahoma State Univ.): >10>20>30>40 microns. “ISO ratings” (in the form of xx/yy) are derived from counts obtained at 5 microns and 15 microns. Current ISO reporting may include a count at 2 microns, resulting in an ISO no.: xx/yy/zz.
− Water and high opacity preclude an accurate particle count, as the sensor is ‘fooled’ into counting water droplets as particles. If the sample is opaque it is necessary to dilute the sample, which may reduce the value of the information. Our usual practice when this situation arises is to perform a Direct Reading Ferrograph, which is not sensitive to water, or opacity (see TechTraks on DR Ferrography).
Sampling technique is more critical for this test than any other, as it is relatively easy to begin with contaminated containers or to contaminate the container as one samples. Severe increases in PC without support from other tests might, therefore, suggest verification re-sampling.
Interpretation: Particles come from two sources: Wear and Contamination. It is not always easy to determine which of the two sources applies (seals produce both ‘wear and contamination’ particles), since PC doesn’t identify the nature (shape or composition) of the particles. Nevertheless any particle can cause wear, leading to yet more particles, so that it is essential to control them. For this reason limits are emphasized equally with trends in the evaluation process. The most basic control of particle formation is to service filter systems; this might consist of a filter change, or may involve the use of off-line filtration when levels are deemed too high to control with a simple filter change.
− If abnormal PC levels persist despite standard control methods, additional testing (such as Analytical Ferrography or Micropatch) should be undertaken, as excessive wear, rather than contamination may be occurring.
Suggested Application: PC is best applied to systems with filtration control. Hydraulics are most amenable. Other systems: compressors, 2 cycle gas engines, auto-powershift transmissions, and other filtered rotary systems.
D-10
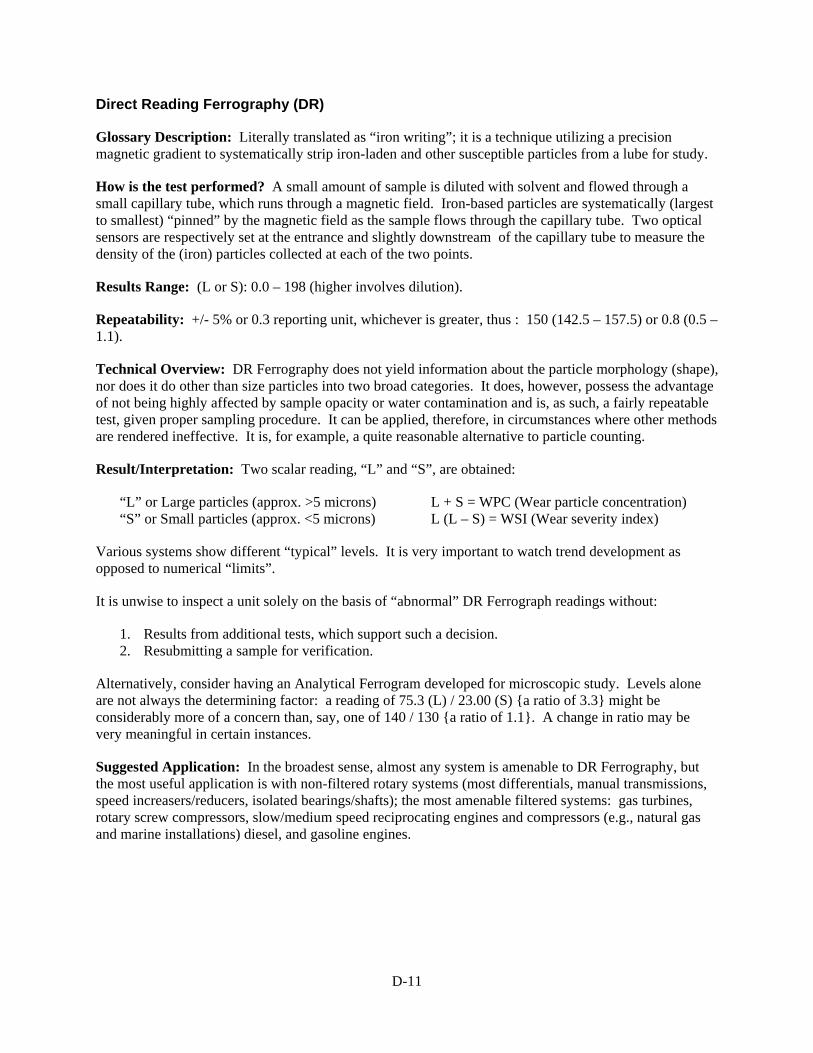
Direct Reading Ferrography (DR)
Glossary Description: Literally translated as “iron writing”; it is a technique utilizing a precision magnetic gradient to systematically strip iron-laden and other susceptible particles from a lube for study.
How is the test performed? A small amount of sample is diluted with solvent and flowed through a small capillary tube, which runs through a magnetic field. Iron-based particles are systematically (largest to smallest) “pinned” by the magnetic field as the sample flows through the capillary tube. Two optical sensors are respectively set at the entrance and slightly downstream of the capillary tube to measure the density of the (iron) particles collected at each of the two points.
Results Range: (L or S): 0.0 – 198 (higher involves dilution).
Repeatability: +/- 5% or 0.3 reporting unit, whichever is greater, thus : 150 (142.5 – 157.5) or 0.8 (0.5 – 1.1).
Technical Overview: DR Ferrography does not yield information about the particle morphology (shape), nor does it do other than size particles into two broad categories. It does, however, possess the advantage of not being highly affected by sample opacity or water contamination and is, as such, a fairly repeatable test, given proper sampling procedure. It can be applied, therefore, in circumstances where other methods are rendered ineffective. It is, for example, a quite reasonable alternative to particle counting.
Result/Interpretation: Two scalar reading, “L” and “S”, are obtained:
“L” or Large particles (approx. >5 microns) L + S = WPC (Wear particle concentration) “S” or Small particles (approx. <5 microns) L (L – S) = WSI (Wear severity index)
Various systems show different “typical” levels. It is very important to watch trend development as opposed to numerical “limits”.
It is unwise to inspect a unit solely on the basis of “abnormal” DR Ferrograph readings without:
1. Results from additional tests, which support such a decision. 2. Resubmitting a sample for verification.
Alternatively, consider having an Analytical Ferrogram developed for microscopic study. Levels alone are not always the determining factor: a reading of 75.3 (L) / 23.00 (S) {a ratio of 3.3} might be considerably more of a concern than, say, one of 140 / 130 {a ratio of 1.1}. A change in ratio may be very meaningful in certain instances.
Suggested Application: In the broadest sense, almost any system is amenable to DR Ferrography, but the most useful application is with non-filtered rotary systems (most differentials, manual transmissions, speed increasers/reducers, isolated bearings/shafts); the most amenable filtered systems: gas turbines, rotary screw compressors, slow/medium speed reciprocating engines and compressors (e.g., natural gas and marine installations) diesel, and gasoline engines.
D-11

Analytical Ferrography (AF)
Glossary Description: Literally translated as “iron writing”; it is a technique utilizing a precision magnetic gradient to systematically strip iron-laden and other susceptible particles from a lube for study.
How is the test performed? A small amount of sample is diluted with solvent and flowed across the length of an inclined microscope slide, the slide is flanked by specially designed permanent magnets, causing magnetic particles to be systematically stripped and deposited.
Technical Overview: Analytical ferrography addresses particles, which are larger than those detectable by rapid-process atomic emission or absorption spectrometers (which are limited to particles <10 microns). Further, the process yields morphology (shape) of particles, which in turn frequently reveals the cause of a problem. It is one of the most powerful and revealing tools used in lube analysis consulting. It is not, however, an end-all. At the time of this writing there is no single test to supplant all others.
Result/Interpretation: A ferrogram is an ordered precipitation (from large to small) of magnetic particles on a slide, and a semi-random precipitation of non-magnetic particles, as influenced by gravity. The slide is viewed under a ferroscope (a special microscope for illuminating with two differently colored light sources). An experienced technician “grades” various types of particles (see below). A pertinent photograph is usually taken as well, and a brief narrative may also accompany the photograph. The unit history report will usually have a coded interpretation of the information.
Ratings:
0 = None detected 1 = Few 2 = Moderate 3 = Significant 4 = Very dense
In addition to numerical ratings there will be a letter classification to identify particle type:
(A) Abrasives: Sand, “dirt”, usually silicon-based particles that appear translucent. (C) Cutting wear: Curved or spiral metals signifying, e.g., a lathe or lapping-type effect from an
abrasive lodged in a relatively soft bearing while cutting into the shaft. (D) Dark metallo-oxide: Indicative of severe heat from metal-to-metal contact, e.g., lube film break
down. (E) Fatigue-oriented metal: Metals with diameter >15 microns in size, indicating component
distress and potential catastrophic failure. (F) Fiber: Individual strands, often from filter media, occasionally from shop rags and other debris. (L) Laminar: Metals having a “peeled” look (thin, long), often from roller bearings. (N) Non-Ferrous metal: Any metal that is not primarily iron, e.g., brass bronze, aluminum, babbitt. (O) Corrosive: Extremely small (<1 micron) particles found in the “tail” (last flow point) of the
ferrogram, indicative of hostile environment or over-extension of lube drain. (P) Friction Polymer: Appears as a nearly clear lacquer-like particle, often with embedded metals.
Tends to indicate lube distress from “hot Spots” in the system or misapplication of lubricant, e.g., too low a viscosity, resulting in insufficient film strength.
(R) Rubbing wear: Small particles (<15 microns technically, but usually much smaller) which are expected or normal in many systems.
(S) Sphere: Nearly perfectly round and mostly small particles (<3 microns) often from fissures in roller bearing elements. A significant increase may foretell spalling of the bearing. May also be weld/grind material.
(X) Red oxide: Usually oxides of iron (e.g., rust); indication of latent water contamination.
Suggested Application: To support inspection decision. AF is a requirement for most predictive and proactive maintenance programs.
D-12
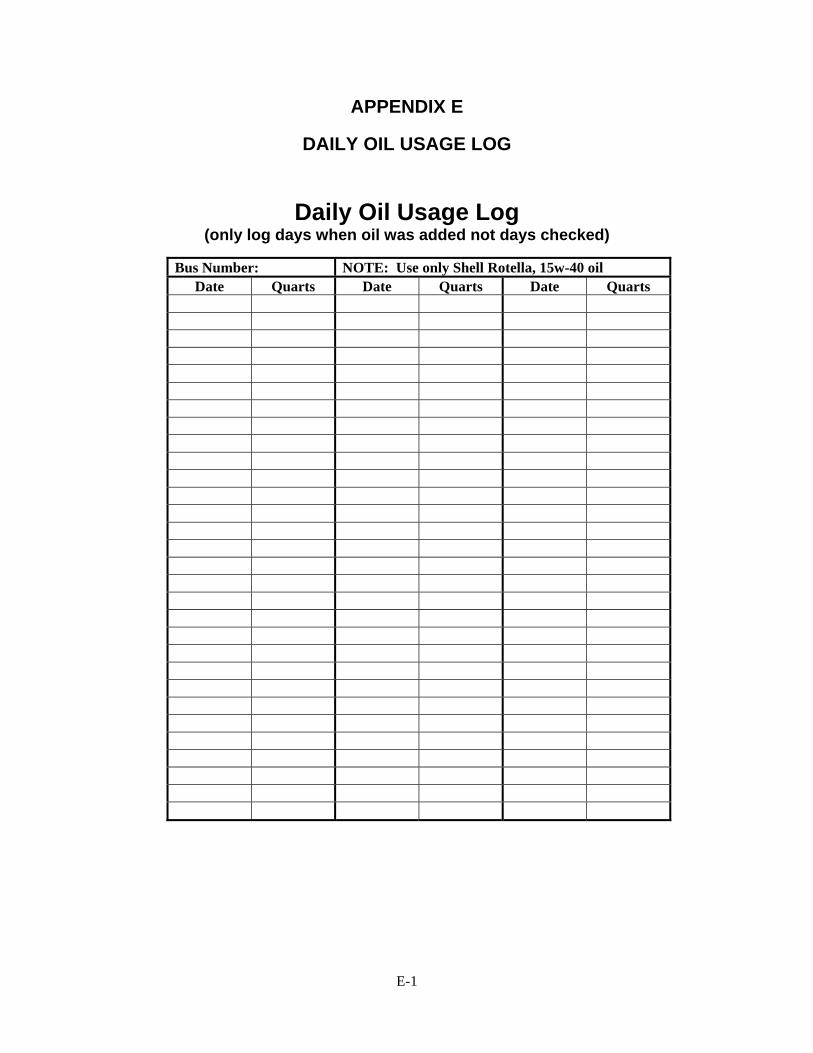
APPENDIX E
DAILY OIL USAGE LOG
Daily Oil Usage Log
(only log days when oil was added not days checked)
Bus Number: NOTE: Use only Shell Rotella, 15w-40 oil Date Quarts Date Quarts Date Quarts
E-1
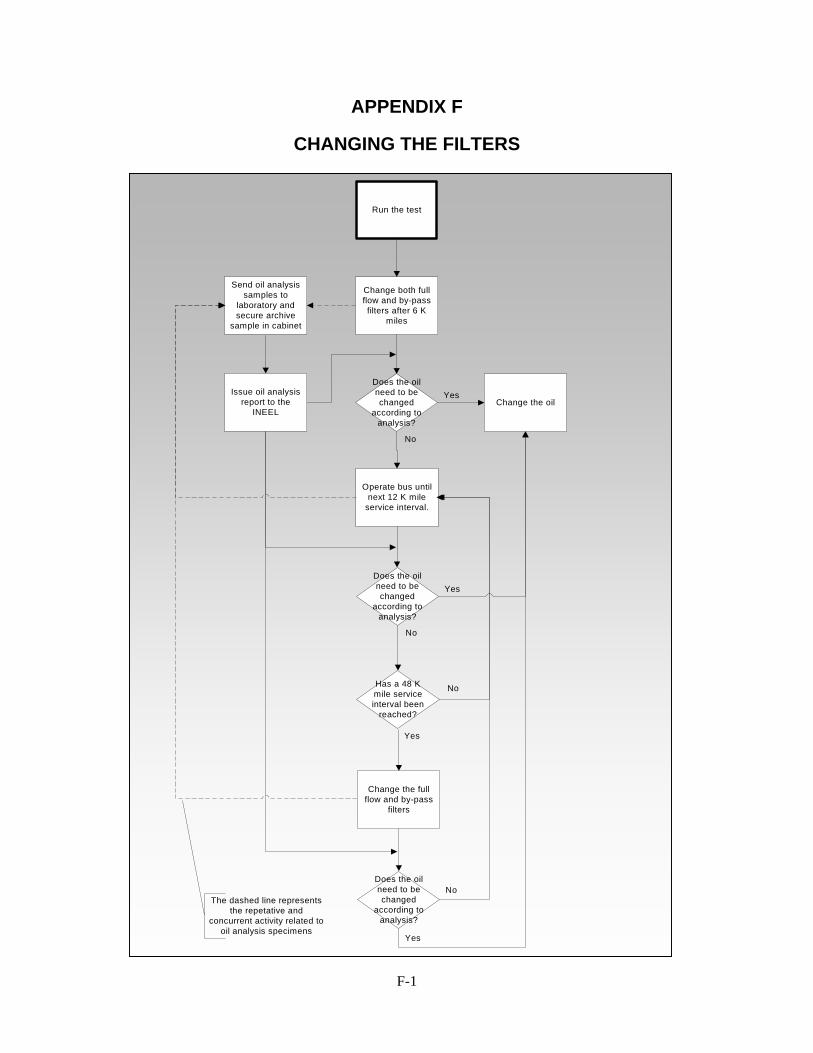
APPENDIX F
CHANGING THE FILTERS
Run the test
Change both fullflow and by-passfilters after 6 K
miles
No
Yes
Has a 48 Kmile serviceinterval been
reached?
Send oil analysissamples to
laboratory andsecure archive
sample in cabinet
Does the oilneed to bechanged
according toanalysis?
No
Change the oil
Operate bus untilnext 12 K mile
service interval.
Does the oilneed to bechanged
according toanalysis?
No
Yes
Yes
Does the oilneed to bechanged
according toanalysis?
Issue oil analysisreport to the
INEEL
Change the fullflow and by-pass
filters
Yes
NoThe dashed line represents
the repetative andconcurrent activity related to
oil analysis specimens
F-1
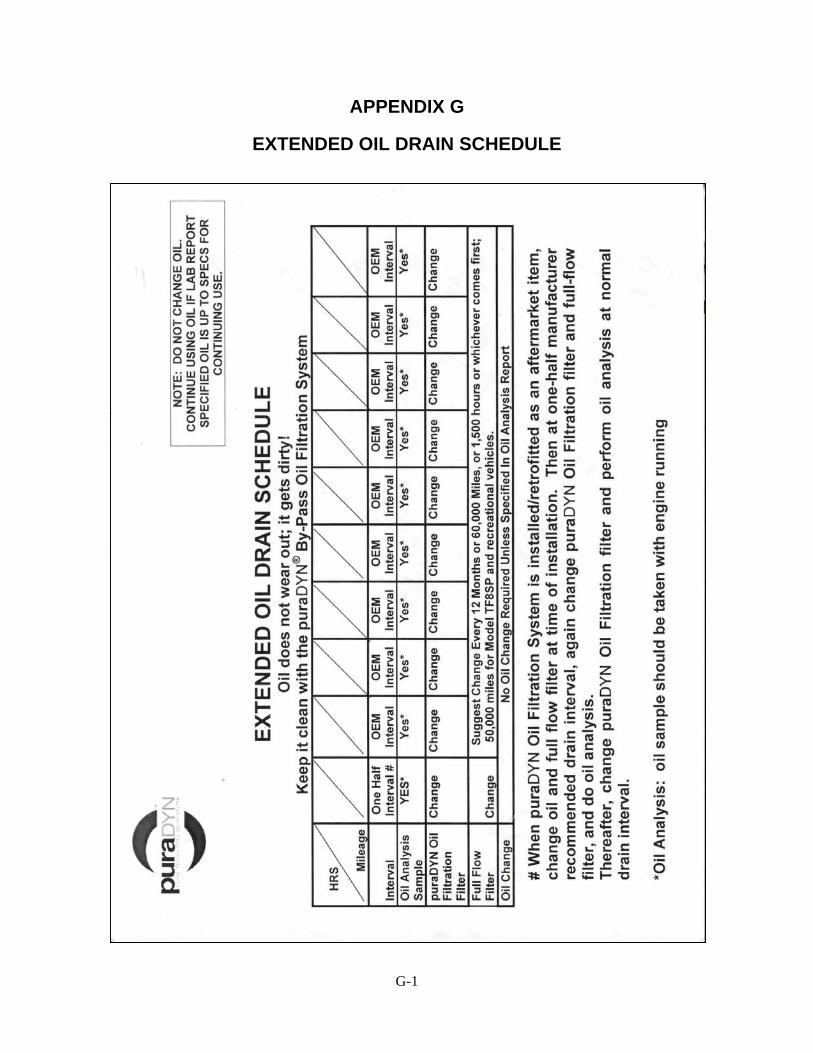
APPENDIX G
EXTENDED OIL DRAIN SCHEDULE
G-1
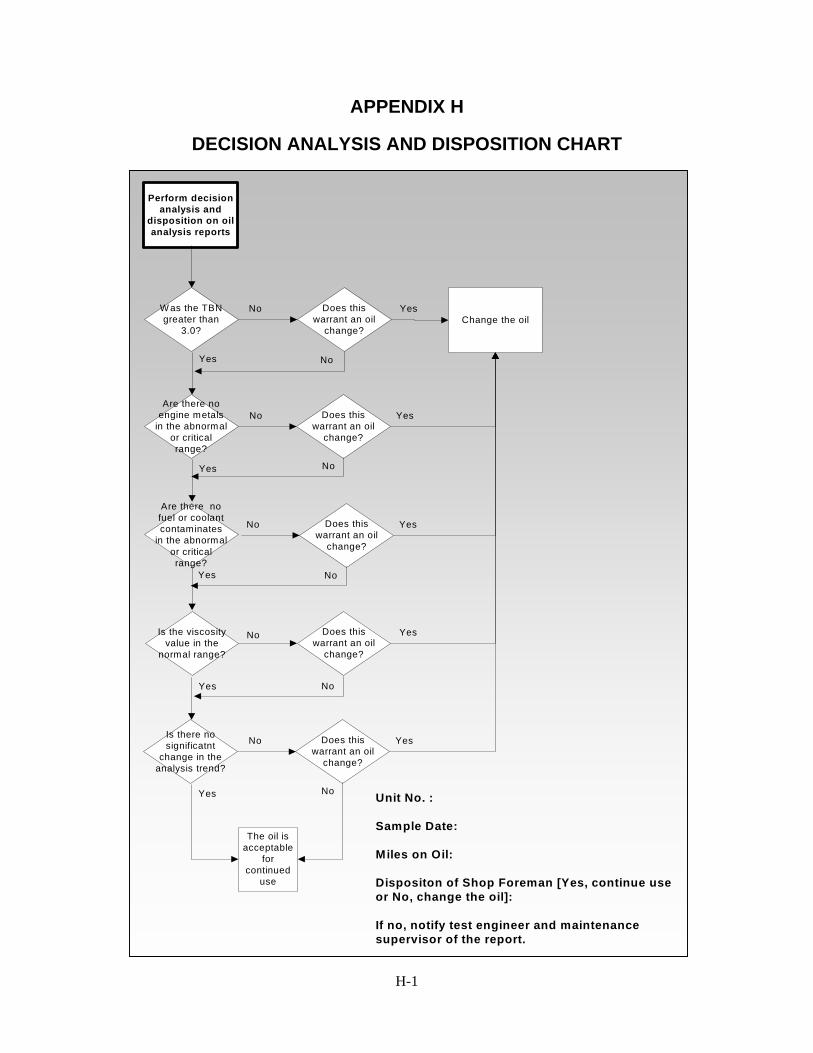
APPENDIX H
DECISION ANALYSIS AND DISPOSITION CHART
Perform decisionanalysis and
disposition on oilanalysis reports
Change the oilW as the TBNgreater than
3.0?
Yes
No
Are there noengine metals
in the abnormalor criticalrange?
Yes
No
Are there nofuel or coolantcontaminates
in the abnormalor criticalrange?
Yes
Is the viscosityvalue in the
normal range?
Does thiswarrant an oil
change?
Yes
Does thiswarrant an oil
change?
Yes
No Does thiswarrant an oil
change?
Yes
No Does thiswarrant an oil
change?
Yes
No
No
No
No
Yes
The oil isacceptable
forcontinued
use
Is there nosignificatnt
change in theanalysis trend?
Yes
No Does thiswarrant an oil
change?
Yes
No Unit No. :
Sample Date:
Miles on Oil:
Dispositon of Shop Foreman [Yes, continue useor No, change the oil]:
If no, notify test engineer and maintenancesupervisor of the report.
H-1
Related Documents