Pulsed electric fields - Influence on physiology, structure and extraction processes of the oleaginous yeast Waltomyces lipofer vorgelegt von Diplom-Biologe Dennis Raschke von der Fakult¨ at III - Prozesswissenschaften der Technischen Universit¨ at Berlin zur Erlangung des akademischen Grades Doktor der Naturwissenschaften - Dr.rer.nat - genehmigte Dissertation Promotionsausschuss: Vorsitzender: Prof. Dipl.-Ing. Dr. Ulf Stahl 1. Gutachter: Prof. Dr. Dipl.-Ing. Dietrich Knorr 2. Gutachter: Prof. Dr. rer. nat. Sascha Rohn Tag der wissenschaftlichen Aussprache: 29.09.2010 Berlin 2010 D 83

Welcome message from author
This document is posted to help you gain knowledge. Please leave a comment to let me know what you think about it! Share it to your friends and learn new things together.
Transcript

Pulsed electric fields - Influence on physiology, structure and
extraction processes of the oleaginous yeast
Waltomyces lipofer
vorgelegt von
Diplom-Biologe
Dennis Raschke
von der Fakultat III - Prozesswissenschaften
der Technischen Universitat Berlin
zur Erlangung des akademischen Grades
Doktor der Naturwissenschaften
- Dr.rer.nat -
genehmigte Dissertation
Promotionsausschuss:
Vorsitzender: Prof. Dipl.-Ing. Dr. Ulf Stahl
1. Gutachter: Prof. Dr. Dipl.-Ing. Dietrich Knorr
2. Gutachter: Prof. Dr. rer. nat. Sascha Rohn
Tag der wissenschaftlichen Aussprache: 29.09.2010
Berlin 2010
D 83

Contents
1 Introduction and objective of the work 1
2 Literature Review 32.1 Oleaginous yeasts . . . . . . . . . . . . . . . . . . . . . . . . . . . . . . 3
2.1.1 Waltomyces lipofer - physiology, morphology and taxonomy . . 42.1.2 Lipid metabolism in yeast . . . . . . . . . . . . . . . . . . . . . 52.1.3 Fermentation and industrial application of oleaginous yeasts . . 72.1.4 Nutritional effects of polyunsaturated fatty acids . . . . . . . . 9
2.2 Extraction and analysis of yeast lipids . . . . . . . . . . . . . . . . . . 102.2.1 Methods for yeast lipid extraction . . . . . . . . . . . . . . . . . 102.2.2 Methods for yeast lipid analysis . . . . . . . . . . . . . . . . . . 14
2.3 Single cell proteins (SCP) . . . . . . . . . . . . . . . . . . . . . . . . . 162.4 Pulsed electric field treatment (PEF) . . . . . . . . . . . . . . . . . . . 18
2.4.1 Mechanisms of Electroporation . . . . . . . . . . . . . . . . . . 182.4.2 PEF Equipment design . . . . . . . . . . . . . . . . . . . . . . . 192.4.3 PEF Process Parameters . . . . . . . . . . . . . . . . . . . . . . 212.4.4 Application of PEF . . . . . . . . . . . . . . . . . . . . . . . . . 23
3 Material and Methods 253.1 Organisms . . . . . . . . . . . . . . . . . . . . . . . . . . . . . . . . . . 253.2 Media . . . . . . . . . . . . . . . . . . . . . . . . . . . . . . . . . . . . 25
3.2.1 YED Medium . . . . . . . . . . . . . . . . . . . . . . . . . . . . 253.2.2 YEG Medium . . . . . . . . . . . . . . . . . . . . . . . . . . . . 263.2.3 Whey permeate (WP) . . . . . . . . . . . . . . . . . . . . . . . 26
3.3 Buffers and solutions . . . . . . . . . . . . . . . . . . . . . . . . . . . . 273.3.1 Buffers and solutions for analytical methods . . . . . . . . . . . 273.3.2 Buffers and solutions for lipid extraction . . . . . . . . . . . . . 27
3.4 Cultivation methods . . . . . . . . . . . . . . . . . . . . . . . . . . . . 283.4.1 Maintenance and Storage . . . . . . . . . . . . . . . . . . . . . . 283.4.2 Growth in suspension culture . . . . . . . . . . . . . . . . . . . 283.4.3 Fermentations . . . . . . . . . . . . . . . . . . . . . . . . . . . . 28
3.5 Growth measurement using optical density . . . . . . . . . . . . . . . . 303.5.1 Stand alone photometer . . . . . . . . . . . . . . . . . . . . . . 303.5.2 OD - online monitoring during fermentation . . . . . . . . . . . 31
3.6 Mechanical cell disintegration and extraction . . . . . . . . . . . . . . . 323.6.1 Mechanical cell disintegration . . . . . . . . . . . . . . . . . . . 32
I
3.6.2 Extraction . . . . . . . . . . . . . . . . . . . . . . . . . . . . . . 323.6.3 Rotary evaporation . . . . . . . . . . . . . . . . . . . . . . . . . 35
3.7 Lipid extraction and analysis - methodology design and procedure . . . 363.7.1 Methodology design . . . . . . . . . . . . . . . . . . . . . . . . . 363.7.2 Gentle Extraction and Analysis Procedure . . . . . . . . . . . . 38
3.8 Analytical Methods . . . . . . . . . . . . . . . . . . . . . . . . . . . . . 403.8.1 Water content . . . . . . . . . . . . . . . . . . . . . . . . . . . . 403.8.2 Flow Particle Image Analysis . . . . . . . . . . . . . . . . . . . 403.8.3 Flow Cytometry . . . . . . . . . . . . . . . . . . . . . . . . . . . 403.8.4 Fluorescence microscopy . . . . . . . . . . . . . . . . . . . . . . 443.8.5 Gas chromatography (GC - FID) . . . . . . . . . . . . . . . . . 453.8.6 Protein extraction and analysis . . . . . . . . . . . . . . . . . . 453.8.7 Determination of the DNA content . . . . . . . . . . . . . . . . 483.8.8 Determination of cell permeabilization by electric current increase 48
3.9 Pulsed electric field treatment . . . . . . . . . . . . . . . . . . . . . . . 493.9.1 Generation of pulsed electric fields . . . . . . . . . . . . . . . . 493.9.2 Application of pulsed electric field treatment . . . . . . . . . . . 51
3.10 Ultrasound treatment . . . . . . . . . . . . . . . . . . . . . . . . . . . . 543.10.1 Equipment . . . . . . . . . . . . . . . . . . . . . . . . . . . . . . 543.10.2 Calculation . . . . . . . . . . . . . . . . . . . . . . . . . . . . . 553.10.3 Procedure . . . . . . . . . . . . . . . . . . . . . . . . . . . . . . 55
3.11 Chemicals . . . . . . . . . . . . . . . . . . . . . . . . . . . . . . . . . . 56
4 Results and discussion 584.1 Method development for growth monitoring . . . . . . . . . . . . . . . 58
4.1.1 Vitality . . . . . . . . . . . . . . . . . . . . . . . . . . . . . . . 584.1.2 Lipid droplet development . . . . . . . . . . . . . . . . . . . . . 624.1.3 Combination of FPIA and flow cytometry . . . . . . . . . . . . 644.1.4 Optimization of lipid extraction methods . . . . . . . . . . . . . 66
4.2 Media optimization . . . . . . . . . . . . . . . . . . . . . . . . . . . . . 694.3 Growth Monitoring . . . . . . . . . . . . . . . . . . . . . . . . . . . . . 71
4.3.1 Development of OD, cell size, vitality and lipid accumulation . . 714.3.2 Influence of pH and growth rate on the cell size . . . . . . . . . 74
4.4 Influence of PEF on physiology . . . . . . . . . . . . . . . . . . . . . . 784.4.1 Influence of PEF on the structural integrity . . . . . . . . . . . 784.4.2 Influence of PEF on cell size and vitality . . . . . . . . . . . . . 804.4.3 Influence of PEF on the fatty acid pattern . . . . . . . . . . . . 86
4.5 Influence of PEF on extraction processes . . . . . . . . . . . . . . . . . 884.5.1 Extraction of hydrophilic substances . . . . . . . . . . . . . . . 884.5.2 Extraction of lipophilic substances . . . . . . . . . . . . . . . . 99
4.6 Fermentation strategies for PEF and extraction processes . . . . . . . . 1094.6.1 Batch fermentation with integrated PEF treatment . . . . . . . 110
II
4.6.2 Semi continuous fed-batch fermentation with separate PEF treat-ment . . . . . . . . . . . . . . . . . . . . . . . . . . . . . . . . . 114
5 Summary 1175.1 Method development for growth monitoring and media optimization . . 1175.2 Growth Monitoring . . . . . . . . . . . . . . . . . . . . . . . . . . . . . 1185.3 Influence of PEF on physiology . . . . . . . . . . . . . . . . . . . . . . 1185.4 Influence of PEF on extraction processes . . . . . . . . . . . . . . . . . 119
6 Conclusions & Perspectives 1216.1 Growth Monitoring and media optimization . . . . . . . . . . . . . . . 1216.2 Influence of PEF on physiology . . . . . . . . . . . . . . . . . . . . . . 1216.3 Influence of PEF on extraction processes . . . . . . . . . . . . . . . . . 122
III
List of Figures
2.1 Structure and nomenclature of some omega fatty acids . . . . . . . . . 52.2 Proposed model for the formation of lipid droplets . . . . . . . . . . . . 62.3 Generalized phase diagram . . . . . . . . . . . . . . . . . . . . . . . . . 102.4 Mechanism of electropermeabilization . . . . . . . . . . . . . . . . . . . 192.5 PEF treatment equipment for the generation of different pulse shapes . 20
3.1 Schematic setup of the EloFerm fermentation unit. . . . . . . . . . . . 293.2 Fermentation setup for large scale sampling. . . . . . . . . . . . . . . . 303.3 Lipid extraction and analysis - methodology design . . . . . . . . . . . 373.4 BSA standard curves for the Bradford protein assay . . . . . . . . . . . 473.5 Co-linear treatment chamber for continuous PEF applications . . . . . 503.6 Setup for the integration of PEF treatment into the fermentation process. 523.7 Setup for lab-scale ultrasound treatment of yeast cells . . . . . . . . . . 54
4.1 Determination of vitality using flow cytometry. . . . . . . . . . . . . . . 594.2 Separation of different vitality subpopulations using flow cytometry . . 614.3 Cell size and cell shape distribution of W.lipofer . . . . . . . . . . . . . 634.4 Detection of lipid droplets using flow cytometry . . . . . . . . . . . . . 644.5 Oil extraction yields from W.lipofer using different extraction methods
and mechanical pretreatments . . . . . . . . . . . . . . . . . . . . . . . 664.6 Test of different growth media concerning maximum optical density
(ODmax), minimal doubling time (td), lipid accumulation as well as cellshape and cell structure . . . . . . . . . . . . . . . . . . . . . . . . . . 69
4.7 Development of optical density and cell diameter during the growth ofW. lipofer . . . . . . . . . . . . . . . . . . . . . . . . . . . . . . . . . . 71
4.8 Development of vitality during the growth of W. lipofer. . . . . . . . . 724.9 Monitoring of lipid droplet development. . . . . . . . . . . . . . . . . . 734.10 Influence of pH on cell size of W.lipofer . . . . . . . . . . . . . . . . . . 754.11 Correlation between growth rate (µ) and cell size of W.lipofer. . . . . . 764.12 Proposed scheme for the correlation between dry weight, pH, cell size
and lipid droplet development . . . . . . . . . . . . . . . . . . . . . . . 774.13 Influence of PEF treatment on the structural integrity of W.lipofer . . 784.14 Fluorescence microscopy images of untreated and PEF-treated Nile Red
stained W.lipofer cells . . . . . . . . . . . . . . . . . . . . . . . . . . . 794.15 Influence of different PEF treatment conditions (2, 3.75 and 25 kV/cm)
on the cell size and the vitality of 6 day old W.lipofer cells . . . . . . . 81
IV
4.16 Influence of PEF treatment on the vitality of W.lipofer cells dependingon culture age . . . . . . . . . . . . . . . . . . . . . . . . . . . . . . . . 84
4.17 Influence of PEF treatment on the fatty acid pattern of W.lipofer . . . 864.18 Increase of the electric current during PEF treatment of W.lipofer at
different conditions . . . . . . . . . . . . . . . . . . . . . . . . . . . . . 894.19 Development of electric current and vitality during PEF treatment of
(A) W.lipofer and (B) S.cerevisiae . . . . . . . . . . . . . . . . . . . . 904.20 Development of the dry weight of W.lipofer due to PEF treatment . . . 934.21 Influence of PEF treatment on the extraction of proteins from W.lipofer 954.22 Influence of PEF treatment on the extraction of DNA from W.lipofer . 984.23 Comparison of fatty acid composition of Miglyol®812 and 5 day old
W.lipofer cells . . . . . . . . . . . . . . . . . . . . . . . . . . . . . . . . 994.24 Fatty acid pattern of untreated W.lipofer cells and cells after PEF
treatment at 25 kV/cm and an energy input of 20 kJ/kg with andwithout extraction with Miglyol®812 for 2 hours. . . . . . . . . . . . . 100
4.25 Extraction of yeast lipids using Miglyol®812 and subsequent continuousPEF treatment. . . . . . . . . . . . . . . . . . . . . . . . . . . . . . . . 102
4.26 Extraction of yeast lipids using Miglyol®812 after ultrasound treatment.1044.27 Drying curves at 60 of untreated and PEF treated W.lipofer cells. . . 1064.28 Influence of hot air drying and PEF on the fatty acid distribution of
W.lipofer . . . . . . . . . . . . . . . . . . . . . . . . . . . . . . . . . . 1074.29 Fermentation, PEF treatment and extraction strategies . . . . . . . . . 1094.30 Vitality of W.lipofer during growth in suspension culture and integrated
batch PEF treatment after 96 h, 120 h and 144 h . . . . . . . . . . . . 1104.31 Vitality development in dependence of culture age and PEF treatment
during the cultivation of textitW.lipofer . . . . . . . . . . . . . . . . . 1124.32 Comparison of batch and semi-continuous fed-batch fermentation strate-
gies for W.lipofer . . . . . . . . . . . . . . . . . . . . . . . . . . . . . . 115
V
List of Tables
3.1 List of Yeasts . . . . . . . . . . . . . . . . . . . . . . . . . . . . . . . . 253.2 Gentle extraction and analysis procedure . . . . . . . . . . . . . . . . . 393.3 Fluorescence channels and according dyes . . . . . . . . . . . . . . . . . 423.4 Flow cytometry detector settings . . . . . . . . . . . . . . . . . . . . . 433.5 Flow cytometry compensation settings . . . . . . . . . . . . . . . . . . 43
4.1 Refractive indeces of different materials or cell types . . . . . . . . . . . 654.2 Comparison of batch and continuous PEF treatment conditions . . . . 103
VI

Zusammenfassung
Im Rahmen der Arbeit wurde der Einfluss der Hochspanungsimpulsbehandlung (HSI)auf die fettbildende Hefe Waltomyces lipofer untersucht. Der Schwerpunkt wurdeauf die Extraktion von Proteinen und Fettsauren sowie auf die Entwicklung dafurgeeigneter Prozessstrategien gelegt. Als Grundlage wurden Methoden zur schnellenUberwachung von Vitalitat und Fetttropfenbildung etabliert, das Medium optimiert,das Wachstumsverhalten dokumentiert und der Einfluss von HSI auf die Struktur unddie Physologie von W.lipofer untersucht. Daruber hinaus wurde an Stelle der Anwen-dung von HSI auch eine Ultraschallbehandlung durchgefuhrt. Es wurde getestet,ob mit der Verwendung von Mikroorganismen, energiesparenden Behandlungstech-nologien und dem Verzicht auf organische Losungsmittel nachhaltige und umweltfre-undliche Extraktionsprozesse entwickelt werden konnen. Durch die Verwendung vonMikroorganismen kann das gewunschte Produkt in großen Mengen produziert werdenohne auf naturliche Ressourcen, wie z.B. Fisch oder einige Olsaaten, zuruckgreifen zumussen.
Methoden zur schnellen Uberwachung von Vitalitat, Zellgroße und der Fettropfen-bidung mittels Durchflusszytomerie und -partikelbildanalyse (Flow particle imageanalysis - FPIA) wurden erfolgreich etabliert oder angepasst. Durch die durchgefuhrteWachstumsuberwachung konnte eine maximale optische Dichte von 21.8, eine Ver-dopplungszeit von 7.1 h, eine uber den Wachstumszeitraum leicht abnehmende aberkonstant uber 96.5 % liegende Vitalitat und eine konstante Akkumulation von Fett-tropfen, beginnend mit der spaten exponentiellen Phase, festgestellt werden. Daruberhinaus konnte ein Zusammenhang zwischen Zellgroße, Fetttropfenbildung, pH-Wertund der Wachstumsrate von W.lipofer gezeigt werden. Der Einfluss der HSI Behand-lung auf die Physiologie und auf Extraktionsprozesse wurde untersucht. Die kritischeFeldstarke wurde auf 2-3.75 kV/cm ermittelt. In Abhangigkeit von den Behandlungs-bedingungen wurde ein starker Einfluss auf die Vitalitat, die Zellgroße und die struk-turelle Integritat gezeigt. Bei einer elektrischen Feldstarke von 3.75 kV/cm wurde einekonstante Abnahme der Vitaltitat und der Zellgroße mit steigendem Energieeintragfestgestellt (1-15 kJ/kg). Bei geringerer elektrischer Feldstarke (2 kV/cm) wurde keinEinfluss auf Vitalitat und Zellgroße beobachtet. Hingegen wurde bei 25 kV/cm bereitsbeim geringsten angewendeten Energieeintrag (d.h. 1 kJ/kg) eine maximale Abnahmeder beiden Parameter festgestellt. Die Zusammensetzung der Fettsauren verandertesich durch die HSI Behandlung nicht. In unbehandelten und HSI-behandelten Probenwaren die vorherrschenden Fettsauren C16, C18 und C18:1 sowie kleinere Mengenan C16:1, C18:2, C18:3, C22 und C24. Im Bezug auf Extraktionsprozesse, konnte
VII
eine erleichterte Extraktion von hydrophilen Substanzen z.B. Proteinen (22.1 % desGesamtproteins bei 10 kV/cm, 10 kJ/kg) und DNA (70.9 % der Gesamt DNA bei5 kV/cm, 10 kJ/kg) gezeigt werden. Daruber hinaus wurde demonstriert, dass dieHSI Behandlung fur die erleichterte mechanische Entwasserung von Zellen eingesetztwerden kann. Die Trockenmasse konnte von 21.7 % in unbehandelten Proben auf26.6 % bei 5 kV/cm und 15 kJ/kg gesteigert werden. Bei der Extraktion von Lipidenmit dem Neutrallipid Miglyol®812 konnten keine signifikanten Extraktionsausbeutennach HSI Vorbehandlung gezeigt werden. Es wurden sowohl batch als auch kontinuier-liche Behandlungsmethoden eingesetzt und die elektrische Feldstarke (0-25 kV/cm)und der Energieeintrag variiert (0-30 kJ/kg). Durch den Einsatz von Ultraschallbe-handlung an Stelle von HSI konnten 29.2 % der gesamten Lipide bei einem Energieein-trag von 25 kJ/kg extrahiert werden. Durch die Anwendung von HSI Behandlung undanschließender schonender Trocknung bei 60 wurde eine erleichterte mechanischeEntwasserung und ein beschleunigter Trocknungsprozess beobachtet, wahrend keinenegativen Einflusse der Trocknung auf die Fettsaurezusammensetzung gezeigt werdenkonnten. Im Rahmen der Arbeit wurden zwei Systeme getestet, die eine Integra-tion der HSI Behandlung in bestehende Fermenationskonzepte erlauben. Solange diegewunschten Behandlungsbedingungen bei gleichzeitigem Erhalt einer hohen Restvi-talitat moglich sind, bietet sich ein kontinuierliches Behandlungskonzept an. Es konntegezeigt werden, dass die Zellen nicht an wiederholte HSI Behandlung adaptieren. Indiesem Fall sank die Vitalitat nie unter 63 % nach HSI Behandlung bei 1.5 kV/cmund 2.8 kJ/kg. Uber einen Zeitraum von 4 Tagen, wurden in 24 h Abstanden Be-handlungen durchgefuhrt. Sobald die gewahlten HSI Behandlungsparameter keineausreichende Restvitalitat fur weiteres Wachstum im Fermenter erlauben, kann einsemi-kontinuierliches fed-batch System eingesetzt werden. Durch die Entnahme vonZellmaterial und das direkte Nachfullen mit frischem Medium wurde die Vitalitat vonW.lipofer nicht stark beeinflusst und lag in allen Proben uber 88 %.
VIII
Abstract
The main aim of this thesis was the investigation of pulsed electric field (PEF) treat-ment effects on the oleaginous yeast Waltomyces lipofer. The focus was laid on theapplication of PEF treatment on the extraction of proteins and fatty acids as well ason the development of suitable processing strategies. The basis for these investigationswas provided by experiments aiming on the development of methods for rapid vital-ity and lipid droplet measurement, media optimization, growth monitoring as well asinvestigations on the influence of PEF on the structure and physiology of W.lipofer.Moreover, alternative processing strategies including the use of ultra sound in steadof PEF treatment were applied. Extraction processes were tested, which are sustain-able and environmental friendly by using microorganisms, energy saving treatmenttechnologies and an extraction without organic solvents. By using microorganisms,the desired product can be produced in large amounts independent from natural re-sources, such as fish oils or oil seeds.
Rapid methods for flow cytometry and flow particle image analysis (FPIA) for themonitoring of vitality, cell size and lipid droplet development were successfully devel-oped or adapted. Growth monitoring revealed a maximum optical density of 21.8,a doubling time of 7.1 h, a slightly decreasing vitality, which was always above 96.5%, and a constant accumulation of lipid droplets starting with late exponential phasewas determined. Moreover, a correlation between the cell size of W.lipofer, the lipiddroplet development, the pH and the growth rate was demonstrated. The influenceof PEF on the physiology as well as on extraction processes was analyzed. A criticalfield strength of 2-3.75 kV/cm was determined. Depending on the treatment condi-tions a strong impact on vitality, cell size and structural integrity of the yeast cellswas observed. At 3.75 kV/cm a constant decrease of vitality and cell size was seenwith increasing energy input (1-15 kJ/kg). At a low electric field strength no influ-ence on cell size and vitality was observed, while at a high electric field strength, i.e.25 kV/cm, even the lowest energy input used, i.e. 1 kJ/kg, led to a maximum decreaseof these parameters. The composition of fatty acids remained unchanged after PEFtreatment. In both PEF treated and untreated samples, the predominant fatty acidswere C16, C18 and C18:1 as well as small amounts of C16:1, C18:2, C18:3, C22 andC24. As far as extraction processes are concerned it was shown, that PEF treatmentcan be used for the extraction of hydrophilic substances e.g proteins (22.1 % of totalprotein at 10 kV/cm, 10 kJ/kg) and DNA (70.9 % of total DNA at 5 kV/cm, 10kJ/kg). Moreover, it was demonstrated that PEF treatment can be used for the me-chanical de-watering of cells. The dry weight was increased from 21.7 % in untreated
IX
samples to 26.6 % at 5 kV/cm and 15 kJ/kg. The extraction of lipophilic substanceusing the gentle extraction solvent Miglyol®812 after PEF treatment did not allowsignificant lipid extraction yields. In these experiments both batch and continuoustreatment strategies, varying electric field strength (0-25 kV/cm) and different energyinputs (0-30 kJ/kg) were applied. However, the application of ultra sound treatmentinstead of PEF led to extraction yields of 29.2 % of total lipids at 25 kJ/kg. Byapplying PEF treatment and subsequent gentle heat drying at 60 it was possibleto enhance mechanical de-watering and the drying process. No negative influence ofthe increased temperature on the fatty acid pattern was seen. Two different optionsfor the integration of PEF treatment into fermentation concepts were tested. As soonas the desired treatment conditions allow high vitalities of the microorganisms aftertreatment a continuous concept is applicable. It was shown that the cells do not adaptto repeated PEF treatment. In this case the amount of viable cells did not decreasebelow 63 % after treatment at 1.5 kV/cm and 2.8 kJ/kg every 24 h over a period of4 days. As soon as the treatment conditions do not allow high vitalities after treat-ment a semi-contiuous fed-batch approach was tested. The removal of cell suspensionfrom the fermenter and subsequent refilling with fresh media still allowed high cellvitalities above 88 %.
X

Abbreviations
∆I Increase of the electric current [A] during PEF treatmentAbs595 Absorption at 595 nmBSA Bovine serum albumineC Capacity [F]C/N Carbon/nitrogen ratio in growth mediacF CarboxyfluoresceincFDA Carboxyfluorescein-diacetated electrode gap distance [cm]delect. Electrode gap distancedf Film density (for GC columns)E Electric field strength [kV/cm]Emax Maximum electric field strength [kV/cm]EDTA EthylendiaminotetraacetateFconv Conversion factor (U) to (E) (continous PEF treatment)Fmax Maximum frequency [s-1]FCM Flow CytometryFPIA Flow Particle Image AnalysisFSC Forward scatterGC Gas chromatographyGC-FID Gas chromatography - flame ionization detectorH2Odemin. Demineralized waterHPLC High performance liquid chromatographyI Electric current [A]In Electric current [A] at each point of the PEF treatmentIstart Electric current [A] at the beginning of PEF treatmentMTBE Methyl tert-butyl etherNR Nile RedOD Optical densitypF Feed pressure (Ultra filtration)Pmean Average power [J · s-1]pTM Transmembrane pressure (Ultrafiltration)PBS Phosphate buffered salinePEF Pulsed electric fieldsPI Propidium-iodideRi Refractive indexRT Room temperature
XI
SCP Single cell proteinsSSC Side scatterTdetector GC detector temperatureTinjector GC injector temperatureTLC Thin layer chromatographyTMSH Trimethylsulphonium hydroxideU Voltage [V]Umax Maximum voltage [V]
XII
1 Introduction and objective of the work
Pulsed electric field treatment is a technology that allows reversible and irreversiblecell permeabilization of various cell types and tissues (Doevenspeck (1960); Hamiltonand Sale (1967); Sale and Hamilton (1967); Flaumenbaum (1968); Zimmermann et al.(1974); Angersbach et al. (2000)). Due to this property it can be used for variousapplications, including microbial inactivation (Jacob et al. (1981); Grahl and Markl(1996); Vega-Mercado et al. (1996); Heinz et al. (1999); Alvarez et al. (2000); Ulmeret al. (2002)), stress induction (Galindo et al. (2009)), changing of structural proper-ties including a decrease of the cutting resistance (Kraus (2003); Lebovka et al. (2004);Janositz (2005)), and to enhance mass transfer processes like drying and extractionprocesses (Flaumenbaum (1968); Knorr et al. (1994); Fincan et al. (2004)). More-over, PEF treatment allows environmental friendly and energy saving processing asdescribed by Toepfl et al. (2006).
Oleaginous yeasts are of interest for the food industry, since they can accumulate largeamounts, i.e. up to 70 % of their dry weight, of storage lipids within the cell (Starkey(1946); Ratledge (1985)). These storage lipids can contain polyunsaturated fatty acidsincluding small amounts of omega fatty acids (Ratledge and Wynn (2002)), which areof interest for the use as food supplements. The production of large amounts of eicos-apentaenoic acid (EPA) in the genetically modified oleaginuous yeast Yarrowia lipoly-tica was recently patented by DuPont (WO/2009/046231). The natural resourcesfor omega-3 and omega-6 fatty acids, which are industrially used, are limited (e.g.fish oils and few oil seeds). Even though the amount of those interesting fatty acidswas found to be small in W.lipofer (McElroy and Stewart (1967); Lomascolo et al.(1994)), it was chosen as a model organism, due to its clearly visible lipid droplets,which make this organism particulary suitable to establish extraction processes. Thecombination of the technological potential of oleaginous yeasts and of PEF treatmentcould allow an environmental friendly and sustainable production of single cell lipids.
The objective of the work is the investigation of the influence of PEF treatmenton the physiology, structure and extraction processes on the oleaginous yeast Walto-myces lipofer. The first aim is the development of rapid growth monitoring methods,which are suitable for oleaginous yeast and their special characteristics. Thus bothmethods for rapid monitoring of vitality and lipid droplet development have to beestablished. Moreover, a reliable and fast method for chemical extraction of lipiddroplets from oleaginous yeast has to be found. Additionally, various growth medianeed to be tested in terms of growth rate, maximum optical density and lipid droplet
1
1 Introduction and objective of the work
production. As soon as these goals are accomplished the growth characteristics ofW.lipofer can be monitored. A thorough knowledge of these growth characteristicscan provide the basis for optimal growth and lipid production, which is needed for theextraction experiments. The next step are investigations on the influence of PEF onthe physiology, e.g. vitality and fatty acid distribution and on the structural integrityof W.lipofer. As far as the extraction is concerned the influence of PEF treatmenton both the mass transfer of hydrophilic substances into the treatment media andlipophilic substances into the gentle extraction solvent Miglyol®812 will be tested.Independent on the results, different strategies for the integration of PEF treatmentinto fermentation concepts will be presented and the use of alternative productionconcepts, which could support or replace PEF treatment will be discussed.
2

2 Literature Review
This literature review provides essential background information on the main topicsof this thesis. Besides an overview over the distribution of oleaginicity, the abilityto build and accumulate large amounts of storage lipids, in microorganisms, also thephysiology, morphology and taxonomy of the oleaginous yeast W.lipofer is addressed.Moreover the lipid metabolism and the potential industrial applications for oleagi-nous microorganisms will be discussed (chap. 2.1). Besides that a focus is laid onlipid extraction and analysis methods (chap. 2.2). Additionally, information on theapplication of single cell proteins will be given (chap. 2.3). The focus of the last sectionis laid on pulsed electric field (PEF) treatment including its influence on membranepermeabilization, different treatment designs and its applications (chap. 2.4).
2.1 Oleaginous yeasts
According to Ratledge (1985) microorganisms can be considered as oleaginous (i.e.oil producing), when the amount of accumulated lipids exceeds 25 % of their dryweight. Beside several yeast strains, e.g. Candida curvata, Cryptococcus terricolus,Hansenula saturnus, Lipomyces starkeyi, Rhodotorula glutinis, Waltomyces lipofer,Yarrowia lipolytica, also some bacteria, e.g. Rhodococcus opacus, Thraustochytriumsp. ONC-T18, several fungi, e.g. Aspergillus terreus, Fusarium bulbigenum, Mucorcircincelloides, Penecillium soppi and some microalgae, e.g. Thalassiosira pseudo-nana, Parietochloris incisa, Amphidinium cateri, Scenedesmus rubescens are capableof producing large amounts of lipid (Ratledge (1985); Lomascolo et al. (1994); Alvarezet al. (1996); Cohen and Khozin-Goldberg (2005); Burja et al. (2006); Matsunagaet al. (2009)). The strains named above only represent several examples for oleagi-nous species and are shown to demonstrate the wide distribution of lipid accumulationamong different genera up to different domains. Therefore the list does not claim tobe exhaustive.
As soon as the nitrogen source depletes in the growth media the balanced growthstops, lipid accumulation starts and continues as long as a carbon source is available inthe medium. The basic principle, which is the same for all oleaginous microorganisms,was described by Ratledge (1985).
The first descriptions of fat as a part of yeast cells goes back to Nageli and Loew(1878). In the early 20th century first attempts were made to use oleaginous micro-organisms as source for lipids (Lindner (1922)). Endomyces vernalis (Synonym: Tri-chosporon pullulans), which was used by Lindner (1922), was one of the first oleaginousyeasts described. Until today many yeast strains have been identified to be oleaginous
3
2 Literature Review
according to the definition of Ratledge (1985).
2.1.1 Waltomyces lipofer - physiology, morphology and taxonomy
Since W.lipofer is the model organism used in this work its physiology, morphologyand taxonomy will be discussed in more detail. The first naming in the literature ofthis strain goes back to Den Dooren De Jong (1926). The strain was then called Torulalipofera. The strain was renamed several times to Torulopsis lipofera, Cryptococcuslipoferus, Lipomyces lipofer and Waltomyces lipofer as described by Smith (1998).The genus Lipomyces has been subjected to several rearrangements based on physio-logical, morphological and genetical differences (i.e. spore formation and morphology,Co-enzyme Q10 formation, metabolic pathway for arachidonic acid, carbohydrate pro-files, 5S rRNA), which were described by Kurtzman and Liu (1990); Kurtzman et al.(2007); Nieuwdorp et al. (1974); Slodki and Wickerham (1966); Slooff et al. (1969);Walker (1985); Van der Walt (1992); Weijman and van der Walt (1989) and Yamadaand Nakase (1985). Even though recent works show that no genetical basis is givenfor the genus Waltomyces (Kurtzman et al. (2007)), a main difference between Wal-tomyces lipofer and species of the genus Lipomyces remains, since W.lipofer is ableto form ascospores (Roberts (1957); Yamada and Nakase (1985)). In this work theorganism is referred to as W.lipofer. The organism was placed in the family of theSaccharomycetaceae by Yamada and Nakase (1985) and in the family of the Lipomyc-etaceae by Weijman and van der Walt (1989).
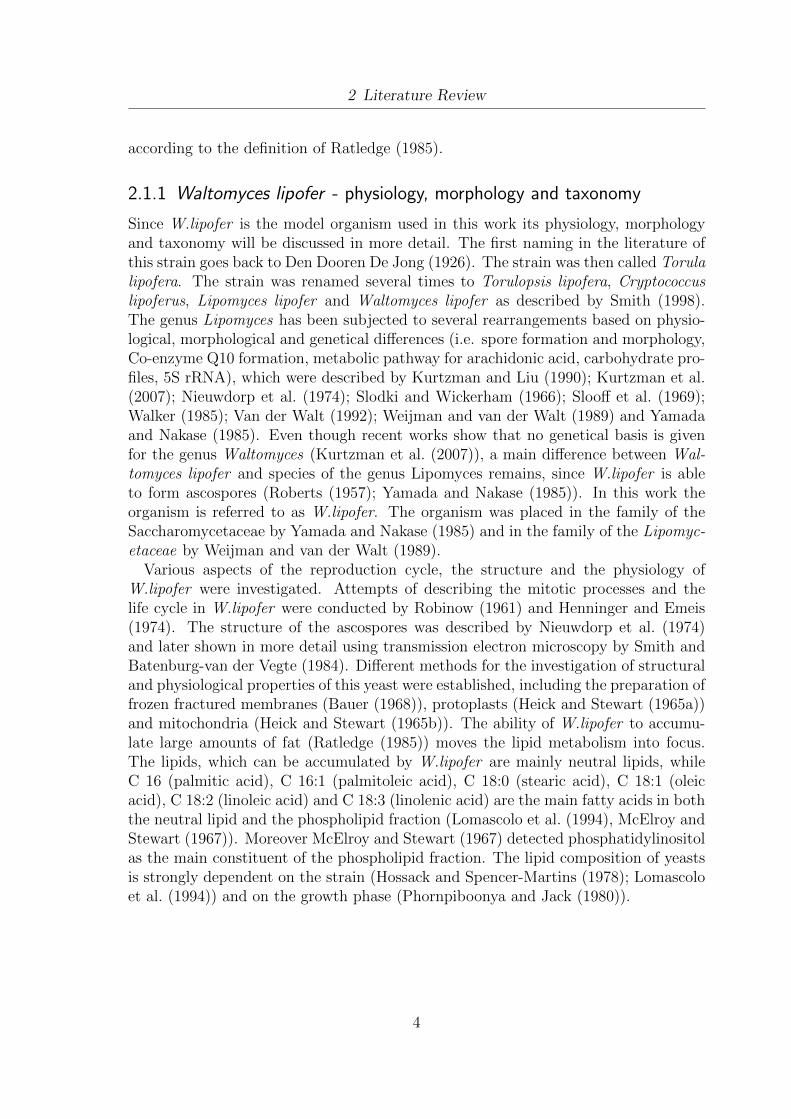
Various aspects of the reproduction cycle, the structure and the physiology ofW.lipofer were investigated. Attempts of describing the mitotic processes and thelife cycle in W.lipofer were conducted by Robinow (1961) and Henninger and Emeis(1974). The structure of the ascospores was described by Nieuwdorp et al. (1974)and later shown in more detail using transmission electron microscopy by Smith andBatenburg-van der Vegte (1984). Different methods for the investigation of structuraland physiological properties of this yeast were established, including the preparation offrozen fractured membranes (Bauer (1968)), protoplasts (Heick and Stewart (1965a))and mitochondria (Heick and Stewart (1965b)). The ability of W.lipofer to accumu-late large amounts of fat (Ratledge (1985)) moves the lipid metabolism into focus.The lipids, which can be accumulated by W.lipofer are mainly neutral lipids, whileC 16 (palmitic acid), C 16:1 (palmitoleic acid), C 18:0 (stearic acid), C 18:1 (oleicacid), C 18:2 (linoleic acid) and C 18:3 (linolenic acid) are the main fatty acids in boththe neutral lipid and the phospholipid fraction (Lomascolo et al. (1994), McElroy andStewart (1967)). Moreover McElroy and Stewart (1967) detected phosphatidylinositolas the main constituent of the phospholipid fraction. The lipid composition of yeastsis strongly dependent on the strain (Hossack and Spencer-Martins (1978); Lomascoloet al. (1994)) and on the growth phase (Phornpiboonya and Jack (1980)).
4

2 Literature Review
2.1.2 Lipid metabolism in yeast
The malonyl-CoA pathway was proposed as the main route for lipid synthesis inW.lipofer based on radioactive labeling in cell free extracts (McElroy and Stewart(1968)). This pathway is widely distributed in different organisms. Starting point isthe formation of acetoacetyl-ACP from acetyl-ACP and malonyl-ACP and a subse-quent reduction to butyryl-ACP (Torkko (2003)). The chain elongation is conductedby subsequent addition of malonyl-CoA (Schweizer et al. (1978)). Thus only fattyacids of even chain length can be produced. The fatty acid synthesis is conductedby a enzyme complex called fatty acid synthase (FAS), which is basically comparablein yeast and animal cells (Singh et al. (1985); Smith (1994)). Recently the crystalstructure of the FAS complex was revealed by Lomakin et al. (2007).
Figure 2.1: Structure and nomenclature of some omega fatty acids. The position of thedouble bond is counted starting with the carbon atom of the carboxy function (i.e. C1).The nomenclature of omega fatty acids is based on the distance of the last double bond fromthe methyl end of the acyl chain.
Fatty acids of odd chain length are formed by elongation of special fatty acid pre-cursors (Rattray et al. (1975)). The synthesis of branched chain fatty acids has notbeen reported for yeast cells, however, it is abundant in different bacteria (Oku andKaneda (1988); Zhu et al. (2005); Kaneda (1991); Annous et al. (1997)). Branchedchain fatty acids can be synthesized from amino acid precursors (i.e. valine, leucineand isoleucine), which all have methyl-branches in their side chain. These precur-sors are de-aminated to the according α-keto acids followed by an activation of thecarboxy function with CoA (Oku and Kaneda (1988); Zhu et al. (2005)). The de-saturation and elongation of fatty acids derived from the above mentioned fatty acidsynthesis pathway is catalyzed by so called desaturases and elongases as summarizedby Ratledge and Wynn (2002). The formation of fatty acids of different length anddegree of desaturation in fungi, micro algae and thraustochytrids was summarized by
5
2 Literature Review
Ratledge and Wynn (2002). Starting with stearic acid the different desaturases (i.e.DS 9, DS 12 and DS 15) lead to the formation of omega fatty acids (n-fatty acids),of the families n-9, n-6 and n-3. By subsequent desaturation and elongation steps,the widely known n-3 fatty acids eicosa pentaenoic acid (EPA) and docosahexaeneoicacid (DPA), which are of high nutritional value, can be synthesized. The desaturasesare named according to the position of the introduced double-bond counted from thecarbon atom of the carboxy-function. The omega fatty acids are named after theposition of the double-bond counted from the methyl-end of the acyl chain (Ratledgeand Wynn (2002)). An overview of the structure and nomenclature of n-fatty acids isprovided in Fig. 2.1.
A:
C: D:
B:
Cytoplasm
ER lumen
Cytoplasm
ER lumen
Cytoplasm
ER lumen
Cytoplasm
ER lumen
Lipid droplet
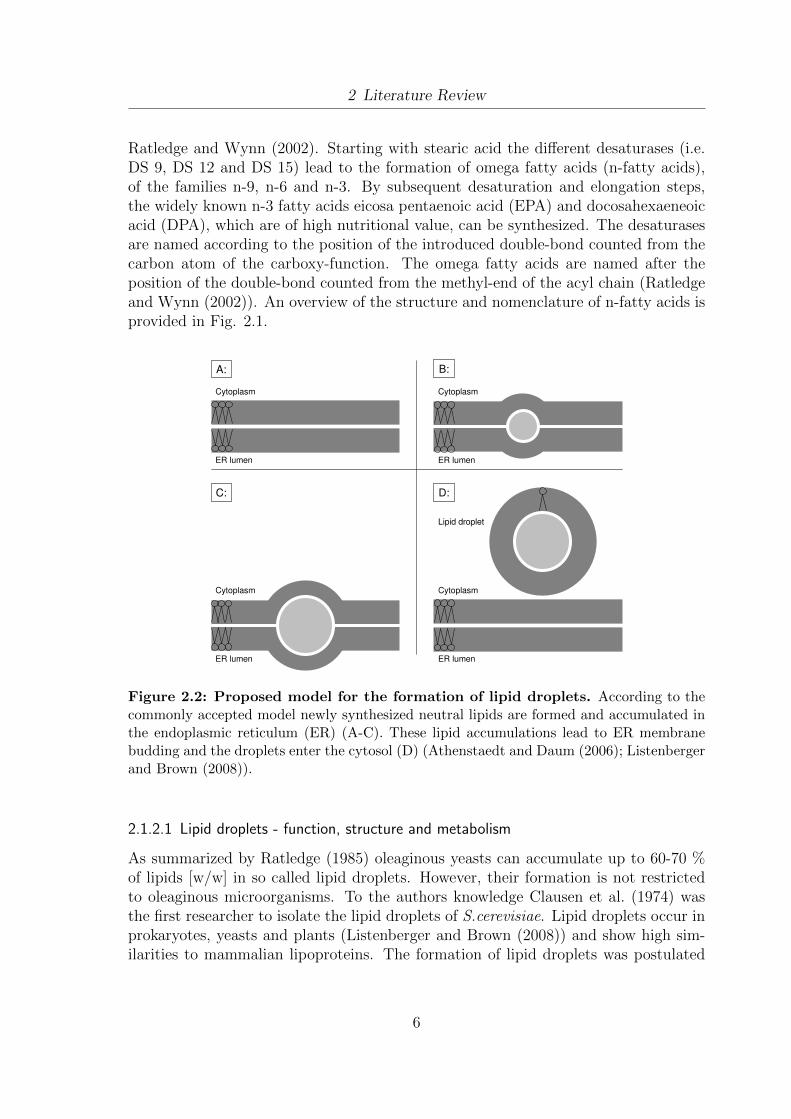
Figure 2.2: Proposed model for the formation of lipid droplets. According to thecommonly accepted model newly synthesized neutral lipids are formed and accumulated inthe endoplasmic reticulum (ER) (A-C). These lipid accumulations lead to ER membranebudding and the droplets enter the cytosol (D) (Athenstaedt and Daum (2006); Listenbergerand Brown (2008)).
2.1.2.1 Lipid droplets - function, structure and metabolism
As summarized by Ratledge (1985) oleaginous yeasts can accumulate up to 60-70 %of lipids [w/w] in so called lipid droplets. However, their formation is not restrictedto oleaginous microorganisms. To the authors knowledge Clausen et al. (1974) wasthe first researcher to isolate the lipid droplets of S.cerevisiae. Lipid droplets occur inprokaryotes, yeasts and plants (Listenberger and Brown (2008)) and show high sim-ilarities to mammalian lipoproteins. The formation of lipid droplets was postulated
6

2 Literature Review
for both yeast (Athenstaedt and Daum (2006)) and prokaryotic cells (Waltermannet al. (2005)). The model, which is the most accepted today, describes the formationof lipid droplets as the result of neutral lipid formation in the ER and subsequentbudding of ER membrane vesicles into the cytosol (Fig. 2.2; Athenstaedt and Daum(2006); Listenberger and Brown (2008)). In yeast cells the composition of the lipiddroplet core varies between different yeast strains. While triacylglycerols are themain constiuent of lipid droplets in Yarrowia lipolytica (Athenstaedt et al. (2006))and W.lipofer (McElroy and Stewart (1967)), the ratio of triacylglycerols to steryl es-ters in S.cerevisiae is nearly equal (Leber et al. (1994)). The localization of the lipiddroplets in the cytoplasm has been shown for S.cerevisiae using X-ray tomography(Larabell and Gros (2004)). The lipid droplets can be clearly distinguished from thecytoplasm and the vacuole.
Besides triacylglycerols and steryl esters, which resemble the main constituent of thelipid droplet core and the surrounding phospholipids as thoroughly reviewed by Athen-staedt and Daum (2006); Czabany et al. (2007); Listenberger and Brown (2008) alsoproteins are found in the lipid droplet membrane of yeast cells (Athenstaedt et al.(1999)). Moreover different proteins were detected in the lipid droplets of eukaryoticadipocytes membranes (Brasaemle (2007)) and in plant cells (Huang (1992)).
Concerning lipid metabolism and storage, the regulatory pathways of S.cerevisiaehave been thoroughly reviewed (Athenstaedt and Daum (2006); Czabany et al. (2007,2008)). The lipid droplets can be considered as a storage compartment for fatty acidsand sterols, stored as triacylglycerides and steryl esters, which can not be integrated inplasma membranes due to their chemical properties. Those substances can be releasedfrom the lipid droplets as soon as they are required in the metabolism (Czabany et al.(2007)).
2.1.3 Fermentation and industrial application of oleaginous yeasts
The first attempts of using oleaginous yeasts as a source for lipids were made in Ger-many in the early 20th century. In the last century many oleaginous yeast strainswere discovered and various attempts were made to use their technological potential.This chapter outlines the advantages in terms of growth optimization, fermentationstrategies and industrial applications for oleaginous yeasts.
For the fermentation of oleaginous yeast various media can be used. Besides tradi-tional laboratory media with glucose, glycerol or fructose as carbon source (Turcotteand Kosaric (1989); Papanikolaou and Aggelis (2002)) also other media, which accu-mulate in industrial processes, can be applied. Those media include whey permeate,molasses or peat moss hydrolysate. The latter can be derived from a chemical hy-drolyzation process (Burden and Eveleigh (1990); Ykema et al. (1988); Akhtar et al.(1998)). Recently attempts were made to optimize the lipid production of Lipomyces
7
2 Literature Review
starkeyi using media containing glucose and xylose (Zhao et al. (2008)). Due to thetypical growth and lipid production curve for oleaginous microorganisms (Ratledge(1985, 2005)), which postulates the beginning of lipid accumulation as soon as nitro-gen is depleted in the growth medium, it is obvious that the carbon to nitrogen ratio(C/N ratio) plays a major role in the optimization of lipid production. This influencewas investigated by several authors. The optimal C/N ratio varied depending on theused medium and the chosen production strain. Ratledge (1985) summarized that thetypical C/N ratio for lipid production is 50-60:1. For Apiotrichum curvatum grownin whey permeate an optimal ratio of 30-35:1 was determined (Ykema et al. (1988)),while Turcotte and Kosaric (1989) showed an optimal ratio of 77:1 for Rhodospiridiumtoruloides grown on glucose or fructose and varying nitrogen sources. According toAbd-Aziz et al. (2001), 7,9:1 is the best C/N ratio for lipid production of a recombi-nant S.cerevisiae strain (YKU 131) cultivated in a sago starch medium.
Various fermentation strategies were applied for oleaginous yeast strains. Holdsworthand Ratledge (1988) conducted batch fermentations with Lipomyces starkeyi, Rho-dosporidium toruloides, Trichosporon cutaneum and Candida curvata, moreover ap-plying a two-phase chemostat approach for C.curvata. Ykema et al. (1988) comparedthe different fermentation strategies batch, fed batch, continuous and partial recyclingfor Apiotrichum curvatum (synonym: Candida curvata and Cryptococcus curvatus).In the latter mentioned strategy, the cell suspension was removed from the fermenter,the medium was separated and the cells were transferred back to the fermenter ac-cording to Chesbro et al. (1979). Meesters et al. (1996) describes the use of a specialfermenter (Surer) which can overcome problems due to impaired mass transfer, whichcan occur during fermentation scale-up. Recently Li et al. (2007) investigated the highcell density fed-batch fermentation with Rhodosporidium toruloides, showing lipid pro-duction rates of 0.54 g l-1 h-1, which are somewhat higher than the values (0.42 g l-1
h-1) shown for C.curvatus (Meesters et al. (1996)) and lower than shown for L.starkeyi(0.59 g l-1 h-1) (Yamauchi et al. (1983)).
As far as industrial applications for oleaginous yeasts are concerned some examplescan be found in the literature. Several authors report the use of yeast and othermicrobial lipids for biodiesel production (Meng et al. (2009); Vicente et al. (2009)).Angerbauer et al. (2008) showed the accumulation of lipids by Lipomyces starkeyigrown on pretreated (i.e. thermal, ultrasound, acid and alkaline hydrolysis) sewagesludge and its use for biodiesel production. The amount of accumulated fat (1 gl-1)was significantly lower than the values reported for fed batch cultivation by Yamauchiet al. (1983) (83 g l-1).
8
2 Literature Review
2.1.4 Nutritional effects of polyunsaturated fatty acids
Focusing on the nutritional applications for lipids mainly polyunsaturated fatty acids,including omega fatty acids (n-3 and n-6), are of interest for the food industry. Thisis due to their beneficial effects in preventing various diseases, which will be addressedin this section. These fatty acids can not be synthesized by humans and must there-fore be taken up with the diet. The use of yeast lipids for nutritional purposes is ofinterest, since the natural resources for n-3 and n-6 fatty acids, like fish oil or some oilseeds are limited. Recently the production of eicosapentaenoic acid (EPA) using theoleaginous yeast Yarrowia lipolytica was protected by a patent (WO/2009/046231).
The protective effect of n-fatty acids against cardiovascular diseases, which was firstpostulated by Sinclair (1956), is widely known and has been thoroughly discussed inthe literature (Albert et al. (2002); Hu et al. (2002, 2003); Lee and Lip (2003); Skerrettand Hennekens (2003); Lemaitre et al. (2009)). The beneficial effects in preventingstrokes by using an α-linolenic acid enriched rapeseed oil was recently published byNguemeni et al. (2010). Besides the prevention of cardiovascular diseases, the in-fluence of n-3 fatty acids in type 2 diabetes was also demonstrated as reviewed byNettleton and Katz (2005). Moreover beneficial effects of n-3 fatty acids were alsoshown for the prevention of cancer, the cure of mental illnesses and infant developmentas thoroughly reviewed by Riediger et al. (2009). As far as the ratio of n-3/n-6 fattyacids is concerned the literature suggests ratios between 1:1 - 4:1 to prevent variousdiseases including cardiovascular diseases and cancer, while the typical western dietshows ratios around 1:16 (Simopoulos (2002, 2008)). Due to these findings n-3 andn-6 fatty acids are of particular interest for the use in functional foods and as dietarysupplements, which leads to an increasing market.
9
2 Literature Review
2.2 Extraction and analysis of yeast lipids
The extraction of microbial lipids including yeast lipids has been widely discussed inthe literature. This section describes both different extraction methods (chap. 2.2.1)and methods for the analysis of yeast lipids (chap. 2.2.2).
2.2.1 Methods for yeast lipid extraction
Various methods can be applied for the extraction of microbial lipids. Besides super-critical CO2 extraction, also acid hydrolysis and subsequent petrol ether extraction,different other organic solvent extractions as well as the potential for using an alter-native extraction solvent (i.e. Miglyol®812) will be described.
2.2.1.1 Supercritical CO2 extraction
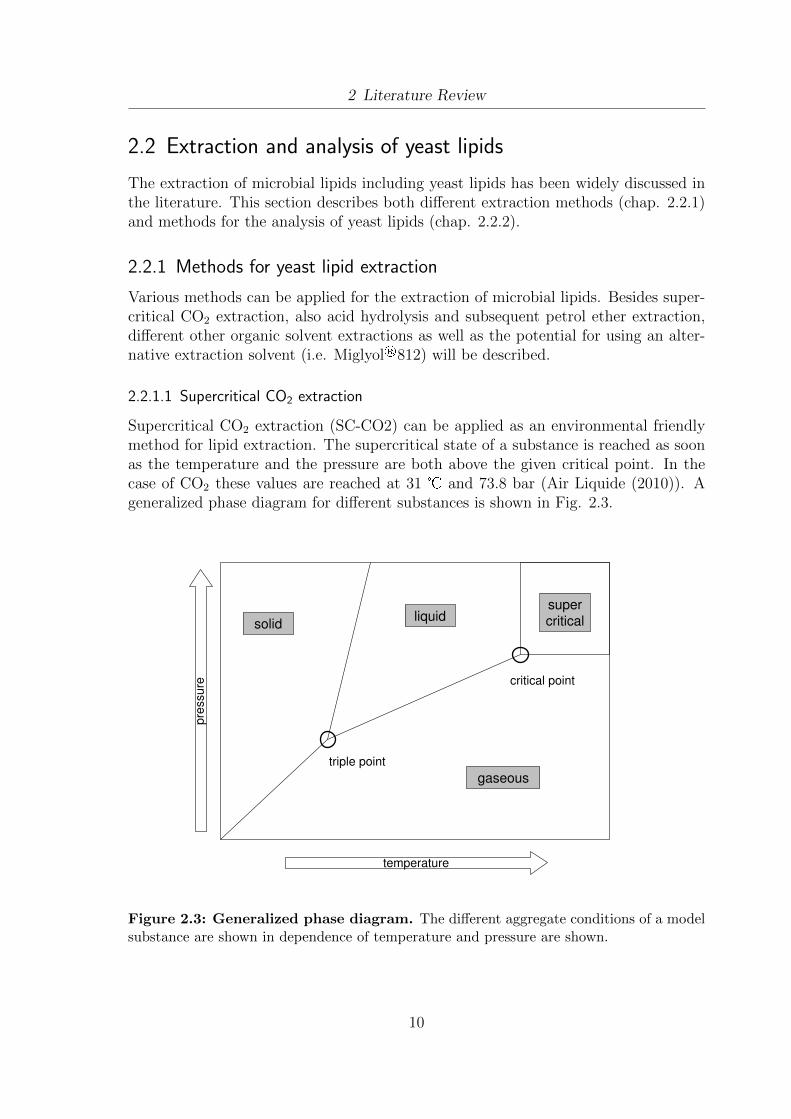
Supercritical CO2 extraction (SC-CO2) can be applied as an environmental friendlymethod for lipid extraction. The supercritical state of a substance is reached as soonas the temperature and the pressure are both above the given critical point. In thecase of CO2 these values are reached at 31 and 73.8 bar (Air Liquide (2010)). Ageneralized phase diagram for different substances is shown in Fig. 2.3.
triple point
critical point
temperature
pres
sure
solid
gaseous
liquidsuper critical
Figure 2.3: Generalized phase diagram. The different aggregate conditions of a modelsubstance are shown in dependence of temperature and pressure are shown.
10
2 Literature Review
The SC-CO2 extraction is particularly suitable for temperature sensitive food com-pounds, since it can be conducted at relatively low temperatures. Due to the fact thatpolyunsaturated fatty acids (PUFAs) are temperature sensitive (Belitz et al. (2001))SC-CO2 extraction provides a promising method, when large amounts of cells areavailable. Moreover the liquid-like density, the low viscosity and the high diffusivityof CO2 in the supercritical state (Brunner (2005)) resemble additional advantages ofSC-CO2 extraction.
As far as the production concept is concerned different applications of SC-CO2 arepossible. Both batch as well as continuous processes are described in the literature(King et al. (1992); Guvenc et al. (1999); Kondo et al. (2000); Brunner (2005); Elleret al. (2009)). A typical supercritical fluid extraction flow scheme can be found inBrunner (2005). Besides CO2, various potential solvents can be used for supercriticalfluid extraction including N2O, NH3, Xe, H2O, CCl2F2 and CH3OH (Capriel et al.(1986); Berkowitz and Calderon (1987); Phelps et al. (1996); Demirbas (2007)). Super-critical fluid extraction can be used for the production of hop extract, decaffeination oftea and coffee, de-alcoholization of beer, oil extraction, pesticide removal, decontami-nation and recovery of aroma substances (Brunner (2005)). As far as the extractionof microbial lipids is concerned SC-CO2 extraction was already shown to be effectivefor the lower fungus Pythium irregulare (Walker et al. (1999)), for the extraction ofpotential lipophilic antimicrobials (i.e. triacylglycerols and docosapentaenoic acid)from the micro algae Chaetoceros muelleri (gracilis) (Mendiola et al. (2007)) and forthe extraction of squalene from the yeast Torulaspora delbrueckii (Bhattacharjee andSinghal (2003)). In the latter case it was demonstrated that the squalene yield afterlyophilization and subsequent SC-CO2 extraction, 430.52 µg/g dry weight, was signif-icantly higher than in the reference sample without lyophilization, being 11.12 µg/gdry weight (Bhattacharjee and Singhal (2003)), and in organic solvent extractions,41.16 µg/g dry weight, with a mixture of chloroform : methanol of 2 : 1 (Bhattachar-jee et al. (2001)).
2.2.1.2 Organic solvent extraction
Throughout the literature various methods for organic solvent extraction of microbiallipids are presented. Due to the rigidity of the yeast cell wall, in most cases a mechani-cal pre-treatment for cell disintegration has to be applied as outlined by Jacob (1992).Both the different cell disintegration methods as well as the used organic solvents andsolvent compositions will be described in this section.
11
2 Literature Review
Cell disintegration
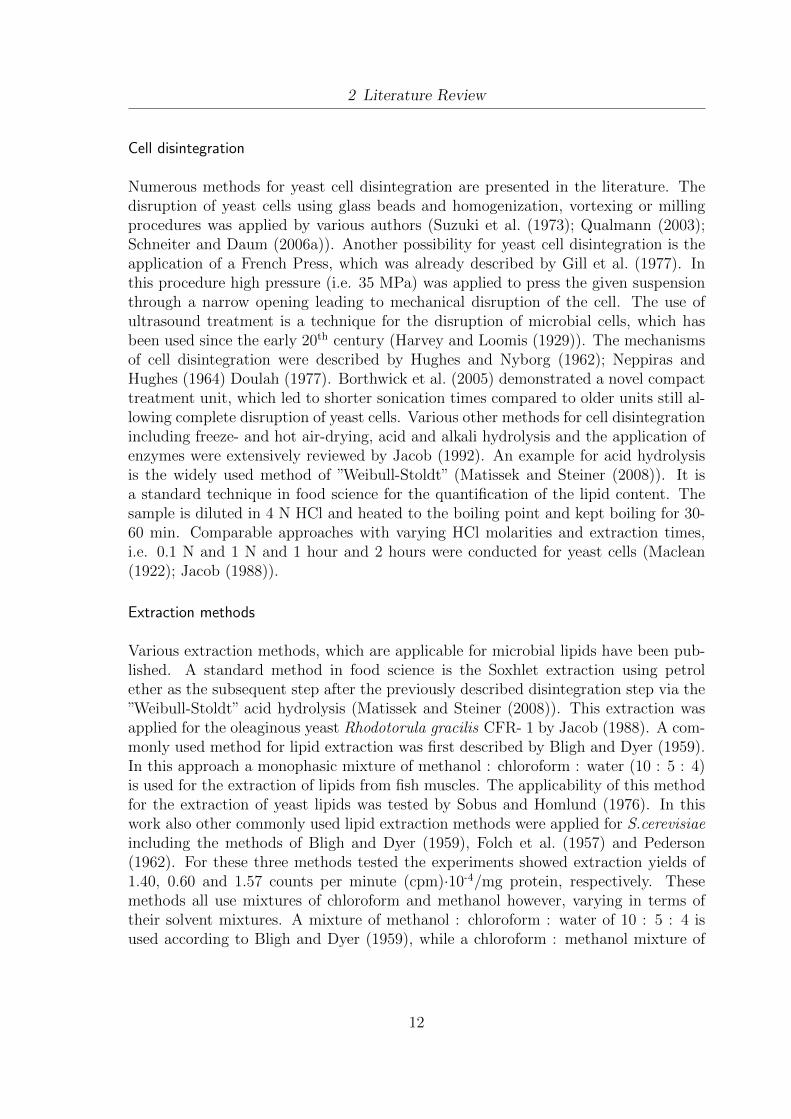
Numerous methods for yeast cell disintegration are presented in the literature. Thedisruption of yeast cells using glass beads and homogenization, vortexing or millingprocedures was applied by various authors (Suzuki et al. (1973); Qualmann (2003);Schneiter and Daum (2006a)). Another possibility for yeast cell disintegration is theapplication of a French Press, which was already described by Gill et al. (1977). Inthis procedure high pressure (i.e. 35 MPa) was applied to press the given suspensionthrough a narrow opening leading to mechanical disruption of the cell. The use ofultrasound treatment is a technique for the disruption of microbial cells, which hasbeen used since the early 20th century (Harvey and Loomis (1929)). The mechanismsof cell disintegration were described by Hughes and Nyborg (1962); Neppiras andHughes (1964) Doulah (1977). Borthwick et al. (2005) demonstrated a novel compacttreatment unit, which led to shorter sonication times compared to older units still al-lowing complete disruption of yeast cells. Various other methods for cell disintegrationincluding freeze- and hot air-drying, acid and alkali hydrolysis and the application ofenzymes were extensively reviewed by Jacob (1992). An example for acid hydrolysisis the widely used method of ”Weibull-Stoldt” (Matissek and Steiner (2008)). It isa standard technique in food science for the quantification of the lipid content. Thesample is diluted in 4 N HCl and heated to the boiling point and kept boiling for 30-60 min. Comparable approaches with varying HCl molarities and extraction times,i.e. 0.1 N and 1 N and 1 hour and 2 hours were conducted for yeast cells (Maclean(1922); Jacob (1988)).
Extraction methods
Various extraction methods, which are applicable for microbial lipids have been pub-lished. A standard method in food science is the Soxhlet extraction using petrolether as the subsequent step after the previously described disintegration step via the”Weibull-Stoldt” acid hydrolysis (Matissek and Steiner (2008)). This extraction wasapplied for the oleaginous yeast Rhodotorula gracilis CFR- 1 by Jacob (1988). A com-monly used method for lipid extraction was first described by Bligh and Dyer (1959).In this approach a monophasic mixture of methanol : chloroform : water (10 : 5 : 4)is used for the extraction of lipids from fish muscles. The applicability of this methodfor the extraction of yeast lipids was tested by Sobus and Homlund (1976). In thiswork also other commonly used lipid extraction methods were applied for S.cerevisiaeincluding the methods of Bligh and Dyer (1959), Folch et al. (1957) and Pederson(1962). For these three methods tested the experiments showed extraction yields of1.40, 0.60 and 1.57 counts per minute (cpm)·10-4/mg protein, respectively. Thesemethods all use mixtures of chloroform and methanol however, varying in terms oftheir solvent mixtures. A mixture of methanol : chloroform : water of 10 : 5 : 4 isused according to Bligh and Dyer (1959), while a chloroform : methanol mixture of
12
2 Literature Review
2 : 1 is used by Folch et al. (1957) and of 1 : 1 by Pederson (1962). The chloroform: methanol ratio of 2 : 1 is also applied in the extraction method of Schneiter andDaum (2006a), while a ratio of 1 : 1 was used for the extraction of lipids from humanred blood cells (Ways and Hanahan (1964)). Based on the different organisms usedin these approaches a clear statement concerning the most effective method can notbe made.
2.2.1.3 Miglyol®812 extraction
An alternative method for extraction of lipophilic substances from cell suspensions isthe application of triacylglycerol mixtures like Miglyol®812. As far as the fatty acidpattern of the triacylglycerols is concerned, Miglyol®812 mainly contains caprylic acid(C8) and capric acid (C10) (AAPS Pharmaceutica (2010)). The main advantage ofMiglyol®812 is, that it can allow a gentle extraction of lipophilic substances withoutharming the used organism. Miglyol®812 was already applied in two-phase systemsfor the extractive bioconversion of geraniol from Vitis vinifera cultures (Cormier andAmbid (1987)), the extraction of oil from cell suspensions of Achillea millefolium(Figueiredo et al. (1995)) and also for the extraction of natural aroma compoundsfrom the yeast Kluyveromyces marxianus (Etschmann and Schrader (2006)). Besidesthese cell culture based approaches Miglyol®812 can also be used for aroma com-pound recovery from food industry waste waters (Souchon et al. (2002)). Moreoverits application in micro capsules for herbicide and pesticide removal from water (Wysset al. (2004)) as well as its use for the encapsulation of the anti-viral substance ben-zalkonium chlorid (Pense et al. (1992)) have been demonstrated.
13
2 Literature Review
2.2.2 Methods for yeast lipid analysis
Generally it can be stated that the analytical methods for various lipid classes, whichhave been documented by different scientific societies (e.g. American oil chemists’society, German society for fat science), can as well be applied for the analysis of yeastlipids. Since various methods exist for the analysis of lipids, only those, which are ofinterest for oleaginous yeasts and the analysis of their lipid droplets, will be outlinedin this section. Yeast lipid droplets mainly consist of a phospholipid monolayer anda core of triacylglycerols and steryl esters (McElroy and Stewart (1967); Leber et al.(1994); Athenstaedt et al. (2006)). Therefore these substance classes will be outlinedseparately. Since fatty acids play a major role in all those substance classes the possibleanalytical methods will be addressed as well. For being able to conduct the analyticalprocedure for the different lipid fractions many authors report the separation of neutrallipids and polar lipids using thin layer chromatography (McElroy and Stewart (1967);Lomascolo et al. (1994)). A collection of various non-specific and specific stainingagents including iodine vapor staining, sulfuric acid charring and the application ofmolybdenum blue reagent among others was summarized by Schneiter and Daum(2006b).
Fatty acids
The analysis of the fatty acid composition can be conducted via gas chromatographicmeasurement of fatty acid methyl esters (FAME). These can be produced by saponifi-cation of fatty acids bound to e.g. triacylglycerols, steryl esters or phospholipids andsubsequent esterification of the free fatty acids with methanol. In the last decadesdifferent approaches for the production of FAMEs were demonstrated (Schlenk andGellerman (1960); Morrison and Smith (1964)). A rapid method using trimethylsul-phonium hydroxide (TMSH) was published by Butte (1983). As far as oleaginousyeasts and S.cerevisiae, a model organism for lipid droplet formation, are concernedvarious authors have applied gas chromatographic approaches for fatty acid analysis(McElroy and Stewart (1967, 1968); Clausen et al. (1974); Lamackaa et al. (1998);Athenstaedt and Daum (1999); Athenstaedt et al. (2006)).
Phospholipids
The phospholipid composition in yeast was investigated by numerous authors. Onemethod is the separation using 1-dimensional thin layer chromatography (McElroyand Stewart (1967); Hossack and Rose (1976)). Other approaches were conductedusing 2-dimensional TLC applying different solvent system in each step (Hunter andRose (1972); Leber et al. (1994); Athenstaedt and Daum (1999); Schneiter and Daum(2006b)). The visualization of the phospholipids can be conducted using either thequantification of total phosphorus (Chen et al. (1956); McElroy and Stewart (1967);Hunter and Rose (1972); Leber et al. (1994)) or by using iodine vapor (Hunter and
14

2 Literature Review
Rose (1972); Leber et al. (1994); Athenstaedt and Daum (1999); Schneiter and Daum(2006b)). A review of different agents for spray detection of phospholipids was pub-lished by Goswami and Frey (1971). In the same work an alternative approach usinga mixture of ammonium molybdate, copper and sulphuric acid is described.
Triglycerides
Triglycerides can be derived from 1-dimensional separation of total lipid extracts asdescribed above. A post-chromatographic staining with a mixture of MnCl2, water,methanol, sulfuric acid and subsequent heating can be conducted for the visualizationof triacylglycerols (Leber et al. (1994); Athenstaedt and Daum (1999)) as shown forfor the analysis of S.cerevisiae lipid extracts. In these approaches the quantification ofacylglycerols was conducted via densitometric scanning of the developed TLC-platesat 400 nm. Hunter and Rose (1972) investigated the lipid composition of S.cerevisiaeas well. In this work the tri- and diacylglycerols were determined using chromotropicacid as described by van Handel and Zilversmit (1957).
Steryl esters and sterols
Various authors have investigated the amount and composition of sterols and sterylesters in yeast, since they are a major component of yeast lipid droplets. Based on amodified Liebermann-Burchard reaction (Moore and Baumann (1952)) and the sub-sequent quantification using an ergosterol standard curve, the sterol composition ofS.cerevisiae was investigated (Hunter and Rose (1972)). McElroy and Stewart (1967)described the spectrophotometric measurement of sterols from Lipomyces lipofer (syn-onym: Waltomyces lipofer) lipid extracts. Another approach for ergosterol and er-gosteryl ester measurement using TLC and subsequent densitometric scanning at275 nm was described by Leber et al. (1994); Athenstaedt and Daum (1999). Freeergosterols, which can be obtained from alkaline hydrolysis, can be measured via gaschromatography (GC) or high performance liquid chromatography (HPLC) (Lewiset al. (1987); Zinser et al. (1993); Athenstaedt and Daum (1999)).
15

2 Literature Review
2.3 Single cell proteins (SCP)
This chapter comprises the historical background and the potential applications formicrobial derived proteins. These proteins are commonly known as single cell proteins(SCPs). This term was introduced in the middle of the 20th century to avoid the neg-ative costumer perception concerning the term ”microbial” (Mateles and Tannenbaum(1968)). This chapter will mainly focus on the application of yeasts, however, othermicroorganisms will be taken into account as well.
Historical background
The extraction of microbial derived proteins is of interest for technological appli-cations, since these proteins could be used for nutritional purposes. The attempts ofusing yeast as a protein source go back to the early 20th century and were of partic-ular interest in the 1960s due to the world-wide shortage in protein. The historicalbackground has been extensively reviewed by Ugalde and Castrillo (2002). The com-position of essential amino acids of SCPs is quite balanced, besides its lack/pooroccurrence of cysteine in S.cerevisiae, Candida lipolytica and Penicillium notatumand of threonine in case of Penicillium notatum (Ugalde and Castrillo (2002)). Amajor drawback for SCP is the high concentration of nucleic acids. In the humanbody nucleic acids are subsequently metabolized to nucleotides, nucleosides, purineand pyrimidine bases and finally uric acid in case of purines or orotic acid in caseof pyrimidines. Uric acid excess is associated with different kidney diseases (Fahlenand Agraharkar (2009)), while excess of orotic acid was shown to cause liver damageas demonstrated for rats (Carrella et al. (1976)). This problem can be overcome byeither mixing SCP products with conventional products as summarized by Ugalde andCastrillo (2002) or by introducing extra process steps to reduce the amount of nucleicacids in the SCP product (Schlingmann and Prave (1978); Solomons and Litchfield(1983)).
Potential microorganisms, growth media and current applications
Various microorganisms were shown to be relevant for single cell protein produc-tion, including the yeast strains S.cerevisiae, Candida tropicalis, Candida utilis anddifferent rumen bacteria as well as Rhodopseudomonas capsulata, the microalgae Spir-ulina maxima, the fungi Penicillium notatum and Fusarium venenatum (Vrati (1984);Ugalde and Castrillo (2002); Rajoka et al. (2006)). The latter one is used for the pro-duction of Quorn. This myco protein product is sold in various countries by MarlowFoods Ltd. (2010), where large airlift bioreactors with a volume of 155 m3 are beingused (Ugalde and Castrillo (2002)).
Throughout the years various cheap substrates were tested for SCP production includ-
16
2 Literature Review
ing molasses, starch, whey, methanol, ethanol, hydrocarbons (alkanes and alkenes) aswell as spent sulfite liquor, which accumulates during paper production (Ugalde andCastrillo (2002)). Moreover the use of cellulosic waste for the growth of thermophilicactinomycetes (Bellamy (1974)) and the application of biogas plant effluent for thecultivation of Rhodopseudomonas capsulata have been described (Vrati (1984)) forthe production of SCPs. Another method proposed is the growth of Candida utilis onde-fatted rice polishings (Rajoka et al. (2006)), while Moraine et al. (1979) describedthe production of SCPs by algae during waste water treatment. It can be seen thatvarious sources for SCPs are being explored, which underlines the importance and theinterest of this process for the industry.
Protein extraction using PEF treatment
As far as PEF treatment for protein extraction is concerned some attempts havebeen described in the literature. Tryfona and Bustard (2008) demonstrated the ex-traction of amino acids from Corynebacterium glutamicum. In the 1970s the appli-cation of PEF treatment for the extraction of hemoglobin from bovine red bloodcells was shown (Zimmermann et al. (1974)). Also applications involving yeast cellshave been described. For S.cerevisiae the extraction of proteins was demonstrated byZakhartsev et al. (2007). Moreover a process for the production of alternative yeastextracts, involving the extraction of proteins, was invented and patented (Monch andStute (2002)).
17
2 Literature Review
2.4 Pulsed electric field treatment (PEF)
Pulsed electric field (PEF) treatment is a non-thermal technology which can allowenergy saving, environmental friendly and gentle food processing (Toepfl et al. (2006)).The first attempts for using PEF treatment were conducted by Doevenspeck (1960),Hamilton and Sale (1967), Sale and Hamilton (1967) and Flaumenbaum (1968). Thischapter will outline the principles of electroporation, equipment design, processingparameters and different applications of PEF treatment.
2.4.1 Mechanisms of Electroporation
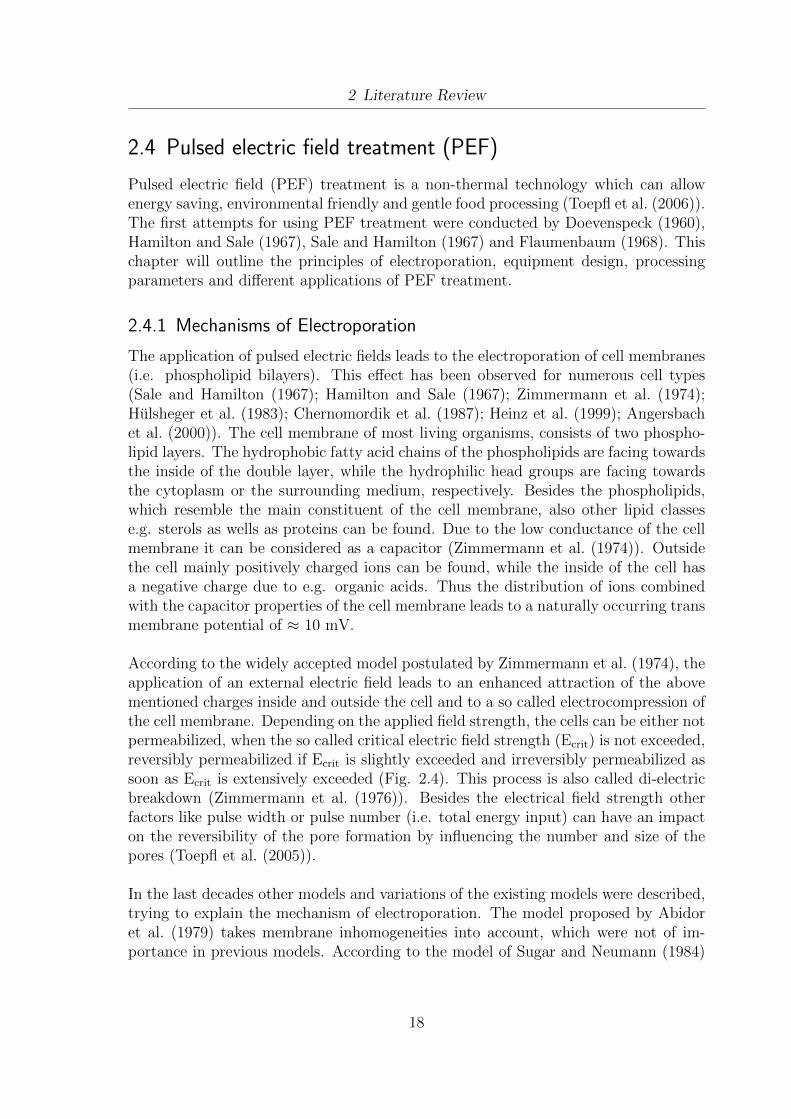
The application of pulsed electric fields leads to the electroporation of cell membranes(i.e. phospholipid bilayers). This effect has been observed for numerous cell types(Sale and Hamilton (1967); Hamilton and Sale (1967); Zimmermann et al. (1974);Hulsheger et al. (1983); Chernomordik et al. (1987); Heinz et al. (1999); Angersbachet al. (2000)). The cell membrane of most living organisms, consists of two phospho-lipid layers. The hydrophobic fatty acid chains of the phospholipids are facing towardsthe inside of the double layer, while the hydrophilic head groups are facing towardsthe cytoplasm or the surrounding medium, respectively. Besides the phospholipids,which resemble the main constituent of the cell membrane, also other lipid classese.g. sterols as wells as proteins can be found. Due to the low conductance of the cellmembrane it can be considered as a capacitor (Zimmermann et al. (1974)). Outsidethe cell mainly positively charged ions can be found, while the inside of the cell hasa negative charge due to e.g. organic acids. Thus the distribution of ions combinedwith the capacitor properties of the cell membrane leads to a naturally occurring transmembrane potential of ≈ 10 mV.
According to the widely accepted model postulated by Zimmermann et al. (1974), theapplication of an external electric field leads to an enhanced attraction of the abovementioned charges inside and outside the cell and to a so called electrocompression ofthe cell membrane. Depending on the applied field strength, the cells can be either notpermeabilized, when the so called critical electric field strength (Ecrit) is not exceeded,reversibly permeabilized if Ecrit is slightly exceeded and irreversibly permeabilized assoon as Ecrit is extensively exceeded (Fig. 2.4). This process is also called di-electricbreakdown (Zimmermann et al. (1976)). Besides the electrical field strength otherfactors like pulse width or pulse number (i.e. total energy input) can have an impacton the reversibility of the pore formation by influencing the number and size of thepores (Toepfl et al. (2005)).
In the last decades other models and variations of the existing models were described,trying to explain the mechanism of electroporation. The model proposed by Abidoret al. (1979) takes membrane inhomogeneities into account, which were not of im-portance in previous models. According to the model of Sugar and Neumann (1984)
18
2 Literature Review
- - - - -
+ + ++ +
- --
- -
+ + +++
elec
tric
fiel
d
-
+
reversibel permeabilization
E > Ecrit
irreversibel permeabilization
E >> Ecrit
no permeabilization
E < Ecrit
Degree of permeabilization
medium
cytosol
medium
cytosol
Figure 2.4: Mechanism of electropermeabilization. As soon as an electric field isapplied, the positive charges outside the cell and the negative charges inside the cell areattracted to the electrodes leading to electrocompression and subsequent electropermeabi-lization of the plasma membrane.
the application of an external electric field leads to the formation of irreversible hy-drophobic pores, as soon as a critical pore size is reached. The model postulatesreversible membrane breakdown, if the pore size stays under the given limit untilthe external electric field is turned off. Another model takes the membrane tensionand the viscoelastic properties of the membrane into account (Dimitrov and Jain(1984)). Moreover, additional authors have postulated models trying to explain themechanisms of electroporation (Neumann and Rosenheck (1972); Kinosita and Tsong(1977); Weaver (2000)).
2.4.2 PEF Equipment design
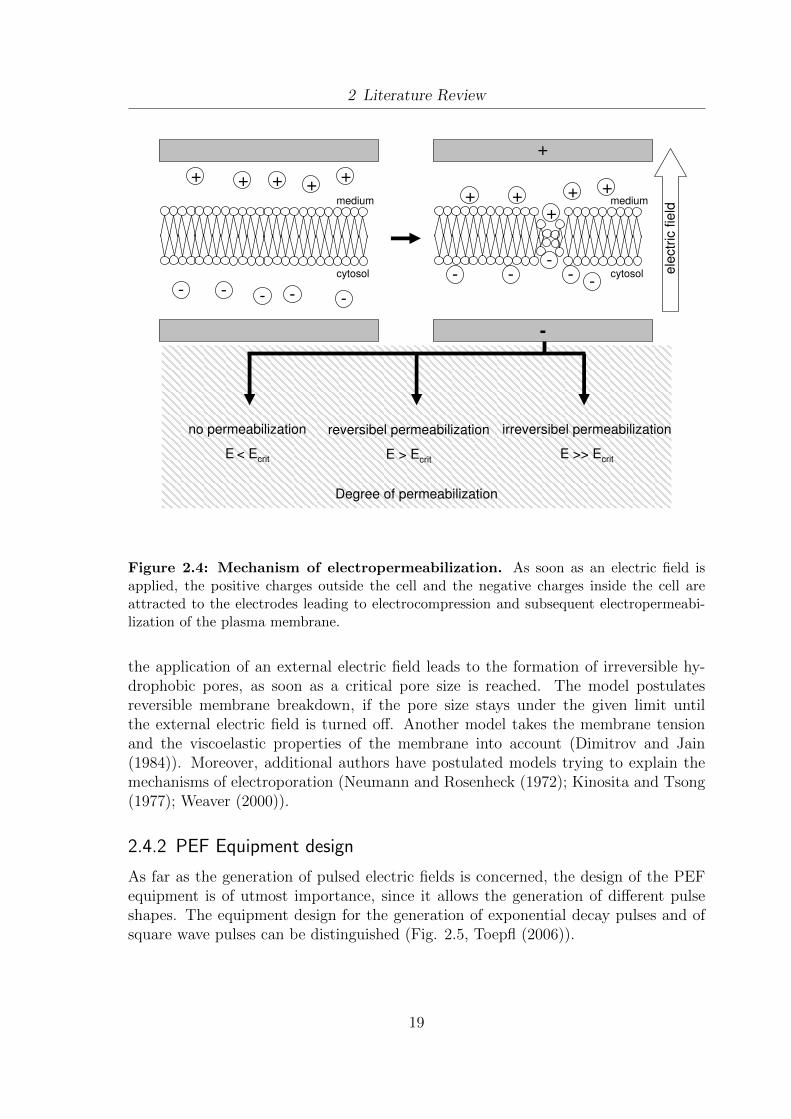
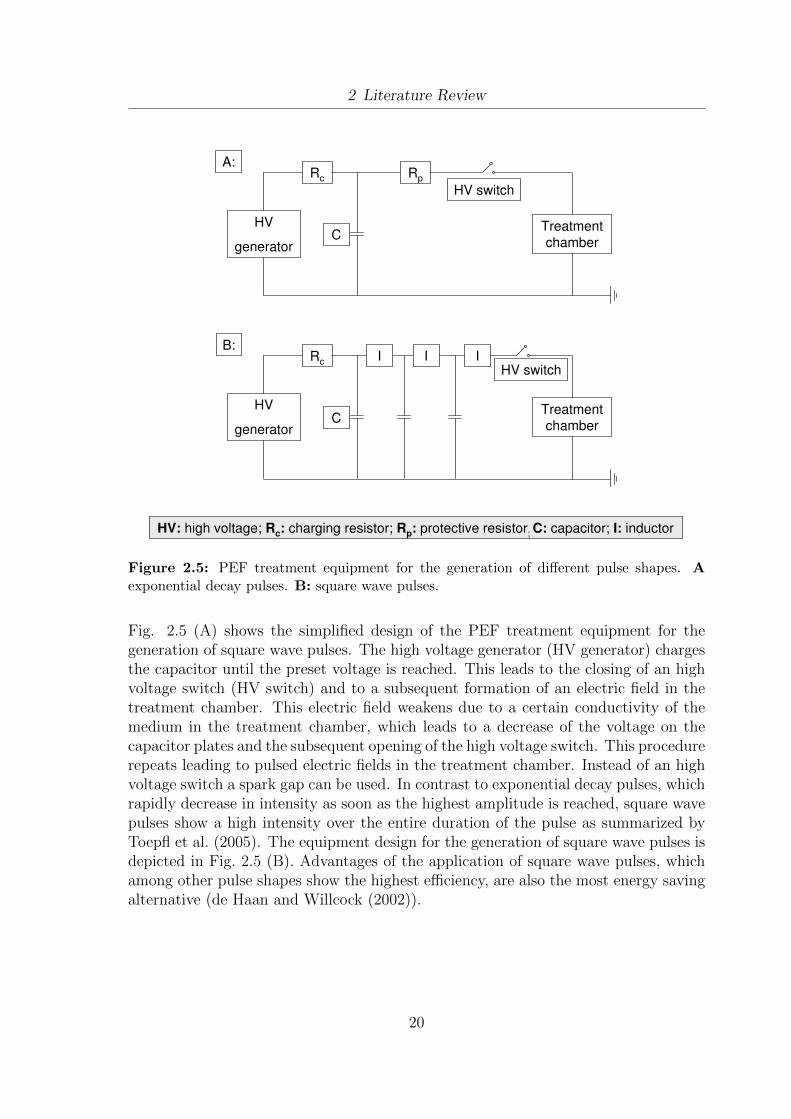
As far as the generation of pulsed electric fields is concerned, the design of the PEFequipment is of utmost importance, since it allows the generation of different pulseshapes. The equipment design for the generation of exponential decay pulses and ofsquare wave pulses can be distinguished (Fig. 2.5, Toepfl (2006)).
19
2 Literature Review
HV
generator
Rc
C
Rp
HV switch
Treatment chamber
Rc
CTreatment chamber
I I IHV switch
A:
B:
HV
generator
HV: high voltage; Rc: charging resistor; Rp: protective resistor; C: capacitor; I: inductor
Figure 2.5: PEF treatment equipment for the generation of different pulse shapes. Aexponential decay pulses. B: square wave pulses.
Fig. 2.5 (A) shows the simplified design of the PEF treatment equipment for thegeneration of square wave pulses. The high voltage generator (HV generator) chargesthe capacitor until the preset voltage is reached. This leads to the closing of an highvoltage switch (HV switch) and to a subsequent formation of an electric field in thetreatment chamber. This electric field weakens due to a certain conductivity of themedium in the treatment chamber, which leads to a decrease of the voltage on thecapacitor plates and the subsequent opening of the high voltage switch. This procedurerepeats leading to pulsed electric fields in the treatment chamber. Instead of an highvoltage switch a spark gap can be used. In contrast to exponential decay pulses, whichrapidly decrease in intensity as soon as the highest amplitude is reached, square wavepulses show a high intensity over the entire duration of the pulse as summarized byToepfl et al. (2005). The equipment design for the generation of square wave pulses isdepicted in Fig. 2.5 (B). Advantages of the application of square wave pulses, whichamong other pulse shapes show the highest efficiency, are also the most energy savingalternative (de Haan and Willcock (2002)).
20
2 Literature Review
2.4.3 PEF Process Parameters
Various process parameters can influence the efficiency of the PEF treatment. Besidesthe aforementioned pulse shape (chap. 2.4.2) also the treatment media (chap. 2.4.3.1),as well as the electric field strength (chap. 2.4.3.2) and the total energy input (chap.2.4.3.3) have to be considered.
2.4.3.1 Treatment media conditions
The properties of the treatment media are of utmost importance for the efficiency ofthe PEF treatment. The conductivity of the media has to be in certain limits, however,these limits can not be clearly defined, since they are dependent on other factors, e.g.the treatment chamber design and electrode material. It has to be considered thatthe media conductivity increases with increasing temperature, and therefore has to betaken into account as well. A medium without, or with a very low conductivity is notsuitable, since it impairs the generation of pulsed electric fields. This is the case forH2Odemin., with a conductivity below 0.01 µS·cm-1. As soon as the conductivity is toohigh no electric field can be generated. As already mentioned no clear limit can bedrawn, since other factors can influence the treatment efficiency. The decision for anoptimal treatment media has to be made for every approach taking all influence factorsinto account (temperature, chamber design, electrode material and treated material orcell type). The influence of the conductivity on the PEF treatment efficiency has beeninvestigated by several authors, however, leading to different results (Hulsheger et al.(1981); Vega-Mercado et al. (1996); Alvarez et al. (2000)). Another treatment mediafactor is the occurrence of small insulating particles like air bubbles, cell agglomeratesor lipid droplets (Gongora-Nieto et al. (2003); Toepfl et al. (2007)). These structureslead to inhomogeneities in the electric field, thereby reducing the efficiency of the PEFtreatment.
2.4.3.2 Electric field strength
The electric field strength (E) is one of the main impact factors of PEF efficiency.The critical electric field strength (Ecrit) describes the field strength, which is neededfor the breakdown of the plasma membrane (Zimmermann et al. (1976); Zimmermann(1996)). This value strongly depends on the given cell size and cell geometry (Heinzet al. (2001); Toepfl et al. (2005)) and therefore on the cell type. The electrical fieldstrengths needed for 99 % non-thermal inactivation of various plant cells, yeast andbacteria was investigated by several authors and ranges from < 1 kV/cm for potatotissue, over ≈ 5 kV/cm for S.cerevisiae and goes up to > 20 kV/cm for E.coli assummarized by Heinz et al. (2001). The electric field strength can be calculated basedon the applied voltage (U) and the distance between the electrodes (d):
E =U
d(2.4.3.1)
21
2 Literature Review
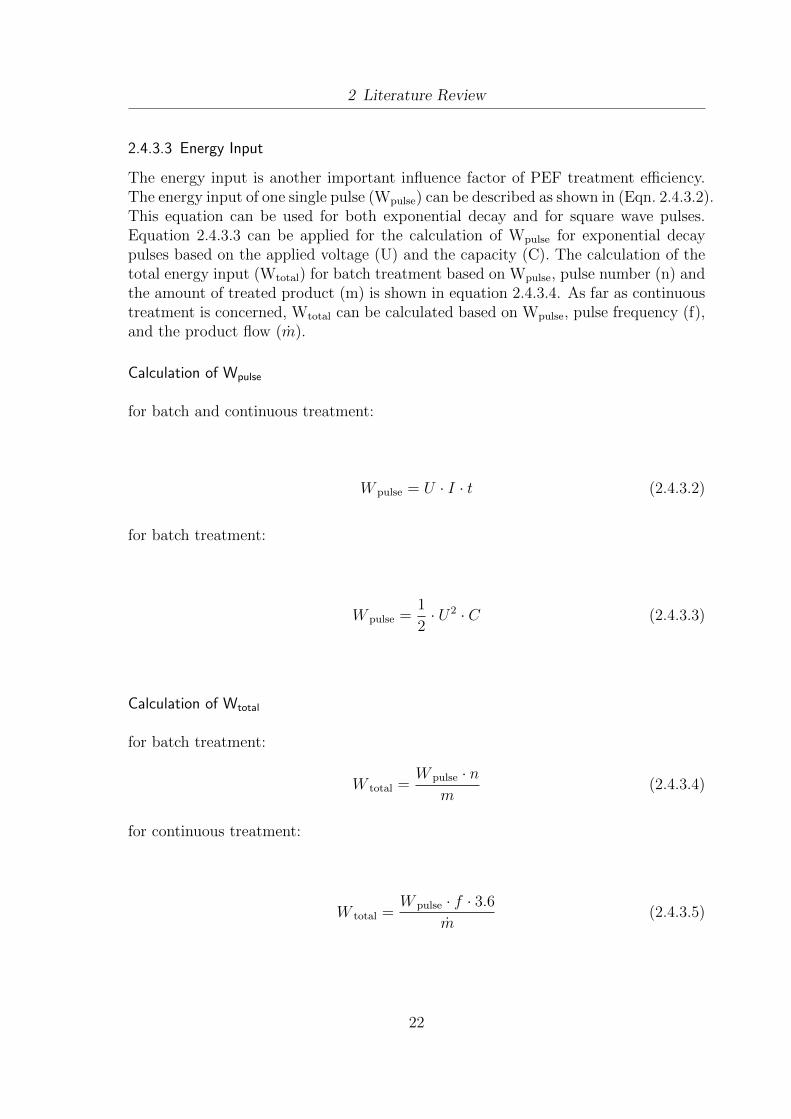
2.4.3.3 Energy Input
The energy input is another important influence factor of PEF treatment efficiency.The energy input of one single pulse (Wpulse) can be described as shown in (Eqn. 2.4.3.2).This equation can be used for both exponential decay and for square wave pulses.Equation 2.4.3.3 can be applied for the calculation of Wpulse for exponential decaypulses based on the applied voltage (U) and the capacity (C). The calculation of thetotal energy input (Wtotal) for batch treatment based on Wpulse, pulse number (n) andthe amount of treated product (m) is shown in equation 2.4.3.4. As far as continuoustreatment is concerned, Wtotal can be calculated based on Wpulse, pulse frequency (f),and the product flow (m).
Calculation of Wpulse
for batch and continuous treatment:
W pulse = U · I · t (2.4.3.2)
for batch treatment:
W pulse =1
2· U2 · C (2.4.3.3)
Calculation of Wtotal
for batch treatment:
W total =W pulse · n
m(2.4.3.4)
for continuous treatment:
W total =W pulse · f · 3.6
m(2.4.3.5)
22
2 Literature Review
2.4.4 Application of PEF
As far as the use of PEF treatment for technological purposes is concerned, variouspotential applications have been described in the literature.
Molecular biology - Gene transfer
Pulsed electric field treatment is widely used in molecular biology, among other alter-native methods, for the generation of so called ”competent” cells. These cells, whichare viable and have a permeabilized plasma membrane, can be used for the processof transformation. Transformation describes the uptake of DNA fragments by a hostorganism, with the aim of modifying its genetic information. The use of electroper-meabilization for transformation was first published by Neumann et al. (1982).
Microbial inactivation
Microbial inactivation can be conducted using PEF treatment. As soon as the criticalelectric field strength is strongly exceeded an irreversible breakdown of the plasmamembrane occurs (Zimmermann et al. (1976), Fig. 2.4). The inactivation is depen-dent on the size and the geometry of the cells (Heinz et al. (2001); Toepfl et al. (2005)).Various authors have described and reviewed the inactivation of microorganisms us-ing pulsed electric fields (Jacob et al. (1981); Grahl and Markl (1996); Vega-Mercadoet al. (1996); Heinz et al. (1999); Alvarez et al. (2000); Ulmer et al. (2002)). The po-tential applications for the decontamination of foods have been thoroughly reviewed(Barbosa-Canovas et al. (1999); Barsotti et al. (1999); Jeyamkondan et al. (1999);Heinz et al. (2001); Knorr et al. (2001)). Due to the large number of articles pub-lished in this field, the aforementioned reference lists do not claim to be exhaustive.Besides its use for food applications, the inactivation of microorganisms and/or thedisintegration of biological material was also shown to be applicable for the treatmentof both sludge (Kopplow et al. (2004); Toepfl (2006)) and medical waste water (Riederet al. (2008)).
Induction of stress response
Another potential field of application for pulsed electric field treatment is the induc-tion of stress response. For this purpose the use of elicitors as reviewed by Dornenburgand Knorr (1995), as well as the use of high pressure (Dornenburg and Knorr (1998))were shown to be effective. For PEF treatment this approach seems possible sincea reversible permeabilization and a fast recovery of the cells in terms of vitality andmetabolism was already demonstrated (Angersbach et al. (2000)). The potential ap-plications for the induction of stress response were reviewed by Jager et al. (2008).Based on metabolite profiling stress induced changes in potato tissue have been found
23
2 Literature Review
after PEF treatment at low intensities (i.e. single pulses at 0.2-0.4 kV/cm) by Galindoet al. (2009).
Enhancement of mass transfer processes
One of the major applications of pulsed electric field treatment is the enhancement ofmass transfer processes. Flaumenbaum (1968) was able to demonstrate an increase ofthe pressing yield of apple mash by 10-12 %. For carrot juice an increase of the yieldfrom 51.3 % to 76.1 % (for fine particles <1.5 mm) and from 30.0 % to 70.3 % (forcoarse particles <3 mm) was shown (Knorr et al. (1994)). Fincan et al. (2004) ob-served a 90 % release of red pigments from beetroot after PEF treatment at 1 kV/cmand 7 kJ/kg. Increasing cell liquid release of potatoe tissue after increasing PEFtreatment intensity, e.g. 0.5 kV/cm up to 3.0 kV/cm at varying energy inputs, andsubsequent centrifugation was demonstrated by Knorr and Angersbach (1998). As faras the pressing of oil seeds is concerned an increasing oil yield was shown for olivesand maize germs. Moreover, the oil quality after PEF treatment could be improved,since an increased amount of phytosterols in case of maize germ oil was detected(Guderjan et al. (2005); Guderjan (2006)). Besides the enhancement of juice yield, oilyield and enhanced extraction of pigments various authors reported improved dryingcharacteristics, for e.g. red peppers (Ade-Omowaye et al. (2001b, 2003)) and carrots(Rastogi et al. (1999)). The latter one observed an increase of the cell disintegrationindex from 0.09 to 0.84 at low/moderate treatment conditions of 1.6 kV/cm and 2.25kJ/kg. The potential application of PEF treatment for drying of plant cells were thor-oughly reviewed by Knorr and Angersbach (1998) and Ade-Omowaye et al. (2001a).Additional to the enhanced extraction of substances, PEF treatment was also shownto be applicable for e.g. the uptake of brine and salt into meat and fish products asreviewed by Jager et al. (2008).
Induction of structural changes
As far as structural changes due to PEF treatment are concerned, tissue softeningis one effect that was demonstrated by several authors. Kraus (2003) reported a re-duction of the needed cutting force for sugar beets. The softening of different planttissues, i.e. carrot, apple and potato, was also observed (Lebovka et al. (2004)). More-over, a reduction of the cutting resistance and alternated cutting properties of potatotissue was described by Janositz (2005).
24
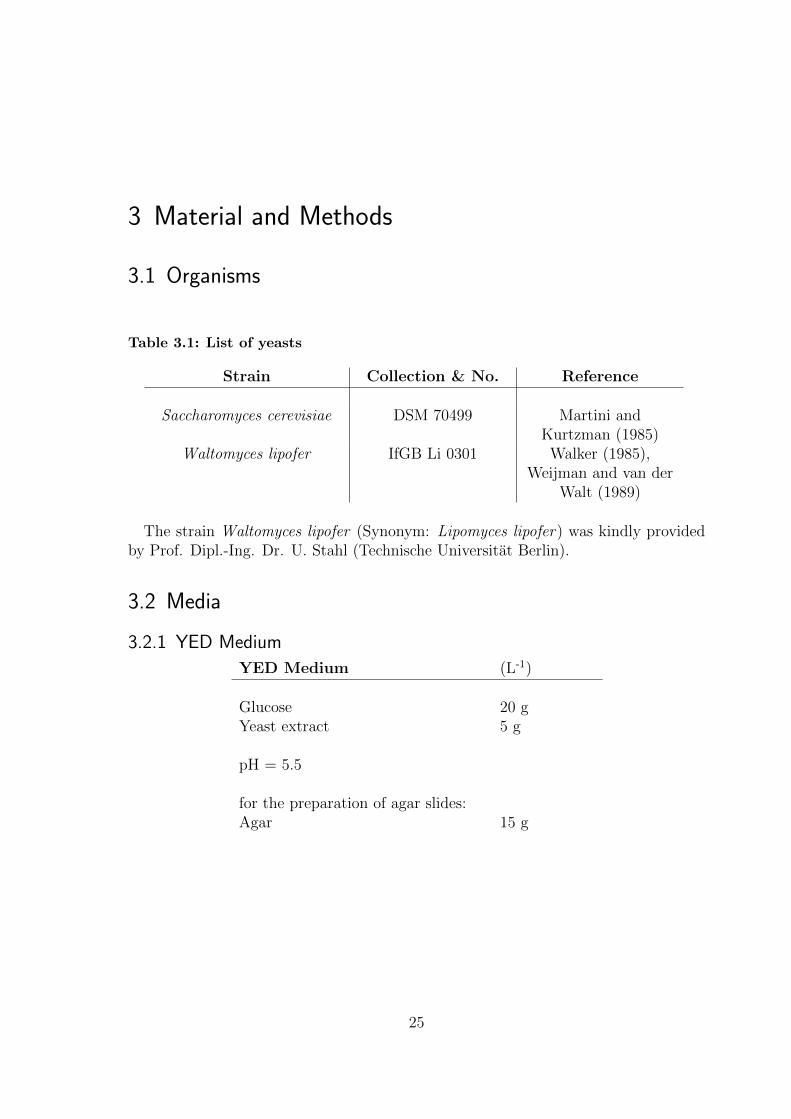
3 Material and Methods
3.1 Organisms
Table 3.1: List of yeasts
Strain Collection & No. Reference
Saccharomyces cerevisiae DSM 70499 Martini andKurtzman (1985)
Waltomyces lipofer IfGB Li 0301 Walker (1985),Weijman and van der
Walt (1989)
The strain Waltomyces lipofer (Synonym: Lipomyces lipofer) was kindly providedby Prof. Dipl.-Ing. Dr. U. Stahl (Technische Universitat Berlin).
3.2 Media
3.2.1 YED Medium
YED Medium (L-1)
Glucose 20 gYeast extract 5 g
pH = 5.5
for the preparation of agar slides:Agar 15 g
25
3 Material and Methods
3.2.2 YEG Medium
YEG Medium (L-1)
Glycerol 20 gYeast extract 5 g
pH = 5.5
for the preparation of agar slides:Agar 15 g
3.2.3 Whey permeate (WP)
Cells were grown in whey permeate, which was kindly provided by Dipl.-Ing. K.Schossler (TU Berlin) and obtained using the following procedure:
Addition of 27 mL rennin (1:50) to 3 l of raw milk
Casein coagulation at 32
Storage over night at 4
Separation of the whey by ultra filtration- ProScale Millipore; Molsheim, France- pTM = 3-4 bar; pF ≤ 6 bar; Pump level: 4
26
3 Material and Methods
3.3 Buffers and solutions
3.3.1 Buffers and solutions for analytical methods
3.3.1.1 Gaschromatography (GC-FID)
Solvent MTBEHybridization reagent TMSH in 0.2 M methanolCarrier gas N2
3.3.1.2 Flow Particle Image Analysis (FPIA)
Sheath fluid Sysmex particle sheath(NaCl 7.1 g/l, Surfactant 0.8 g/lTris buffer 2.0 g/l, EDTA-2K 0.2 g/l)
3.3.1.3 Flow Cytometry
Buffer PBS 0.05 M, pH 7.0PBS 0.05 M, +25 mM citric acid, pH 4.8
Vital stain cFDA, 100 µM stock solutionLethal stain PILipid stain Nile Red, 10 mg/ml in acetoneSheath fluid Beckman Coulter - IsoFlow
Cleaning fluid Beckman Coulter - Cleanz®
3.3.1.4 Protein extraction and analysis
Lysis buffer sorbit 0.6 M ; Tris-HCl 10 mM, pH 7.4;(Qualmann (2003)) EDTA 1 mM , pH 7.4
3.3.2 Buffers and solutions for lipid extraction
3.3.2.1 Schneiter & Daum
chloroform : methanol 2 : 1MgCl2 0,034 % [w/v]2 N KCl : Methanol 4 : 1Artificial upper phase chloroform : methanol : water (3 : 48 : 47)
27
3 Material and Methods
3.4 Cultivation methods
3.4.1 Maintenance and Storage
Yeast cells were obtained from a -80 culture (Roti-Store yeast cryo tubes). Cellswere kept on YED agar slides at 4 . Cells were transfered to new slides every 2-3month.
3.4.2 Growth in suspension culture
Depending on the experiment, the yeast cells were grown in YED, YEG or WPmedium. The main cultures were inoculated 4 % from 2-3 day old starter cultures.The cultivation was conducted at 25 in either 50 mL suspension in 250 mL Erlen-meyer flasks or in 200 mL in 1000 mL Erlenmeyer flasks. The cells were agitated ona flat bed stirrer at 100 rpm.
3.4.3 Fermentations
Fermentations were conducted as an up-scale of suspension culture experiments, al-lowing the monitoring and control of further growth parameters, i.e. pH, temperature,OD and aeration. Additionally, the fermentations were necessary to establish a con-tinuous production process (chap. 3.9.2.5).
EquipmentA schematic overview of the fermentation setup is given in Fig. 3.1.
EloFerm Dual Fermenter
– OD online measurement
– Combined pH and temperature electrode
– pH control
– Temperature control
– Monitoring and control software on external computer
External equipment
– Cryostat with cooling coil
– Variomag® Mono magnetic stirrer
28
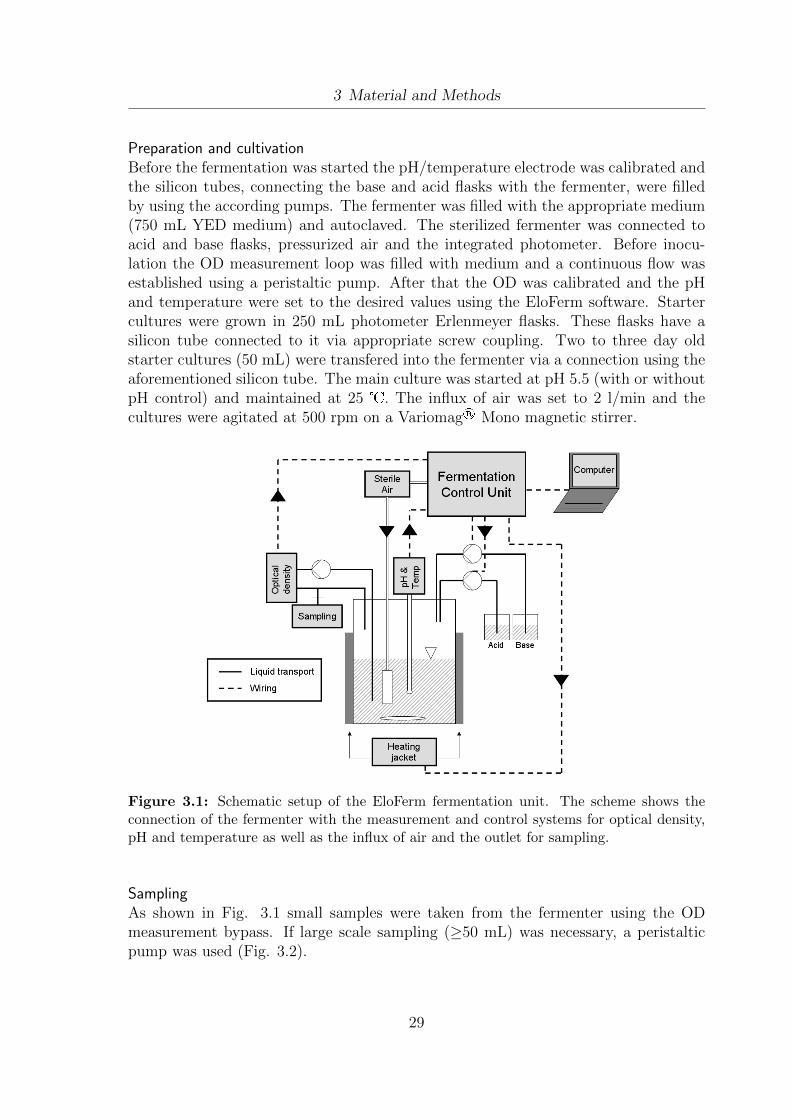
3 Material and Methods
Preparation and cultivationBefore the fermentation was started the pH/temperature electrode was calibrated andthe silicon tubes, connecting the base and acid flasks with the fermenter, were filledby using the according pumps. The fermenter was filled with the appropriate medium(750 mL YED medium) and autoclaved. The sterilized fermenter was connected toacid and base flasks, pressurized air and the integrated photometer. Before inocu-lation the OD measurement loop was filled with medium and a continuous flow wasestablished using a peristaltic pump. After that the OD was calibrated and the pHand temperature were set to the desired values using the EloFerm software. Startercultures were grown in 250 mL photometer Erlenmeyer flasks. These flasks have asilicon tube connected to it via appropriate screw coupling. Two to three day oldstarter cultures (50 mL) were transfered into the fermenter via a connection using theaforementioned silicon tube. The main culture was started at pH 5.5 (with or withoutpH control) and maintained at 25 . The influx of air was set to 2 l/min and thecultures were agitated at 500 rpm on a Variomag® Mono magnetic stirrer.
Figure 3.1: Schematic setup of the EloFerm fermentation unit. The scheme shows theconnection of the fermenter with the measurement and control systems for optical density,pH and temperature as well as the influx of air and the outlet for sampling.
SamplingAs shown in Fig. 3.1 small samples were taken from the fermenter using the ODmeasurement bypass. If large scale sampling (≥50 mL) was necessary, a peristalticpump was used (Fig. 3.2).
29
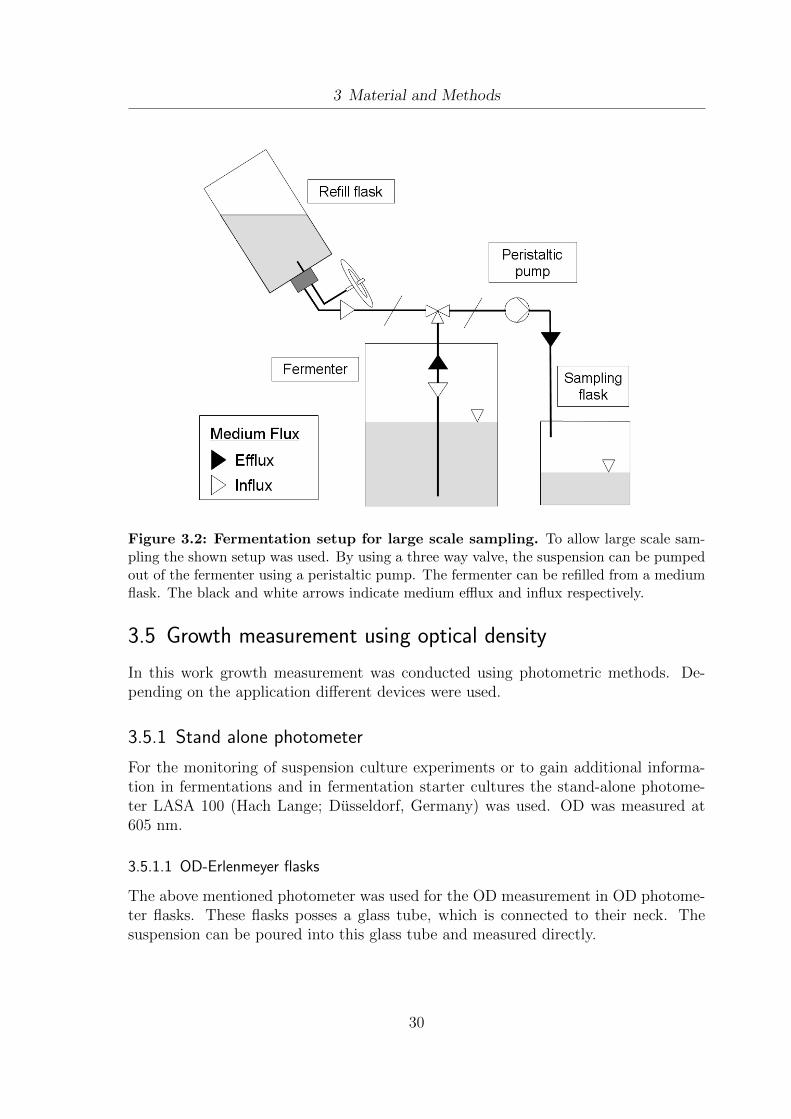
3 Material and Methods
Figure 3.2: Fermentation setup for large scale sampling. To allow large scale sam-pling the shown setup was used. By using a three way valve, the suspension can be pumpedout of the fermenter using a peristaltic pump. The fermenter can be refilled from a mediumflask. The black and white arrows indicate medium efflux and influx respectively.
3.5 Growth measurement using optical density
In this work growth measurement was conducted using photometric methods. De-pending on the application different devices were used.
3.5.1 Stand alone photometer
For the monitoring of suspension culture experiments or to gain additional informa-tion in fermentations and in fermentation starter cultures the stand-alone photome-ter LASA 100 (Hach Lange; Dusseldorf, Germany) was used. OD was measured at605 nm.
3.5.1.1 OD-Erlenmeyer flasks
The above mentioned photometer was used for the OD measurement in OD photome-ter flasks. These flasks posses a glass tube, which is connected to their neck. Thesuspension can be poured into this glass tube and measured directly.
30

3 Material and Methods
3.5.1.2 Measurement in Cuvettes
For the measurement of the OD in cuvettes appropriate dilutions were prepared lead-ing to OD values of 0.3-0.4. The final OD was calculated by multiplying the measuredvalues with the dilution factors.
3.5.2 OD - online monitoring during fermentation
During the fermentation process, OD was measured online using the included ODmeasurement system of the EloFerm Dual fermenter. A peristaltic pump was used totransport medium through a bypass of the fermenter with an included measurementcell, permanently. OD was measured at 611 nm. The width of the measurement cellwas 0.21 cm.
31

3 Material and Methods
3.6 Mechanical cell disintegration and extraction
3.6.1 Mechanical cell disintegration
To determine the total amount of lipids cells had to be disintegrated before chemicalextraction (chap. 3.6.2). Two mechanical methods, involving the disruption usingglass beads, were applied for cell disintegration. The amount of cells, solvent andglass beads varied depending on the type of chemical extraction that was applied.
Vortex Cells were mixed with appropriate amounts of solvent and glass beads, de-pending on the type of chemical extraction that was applied, in a 50 mL plastic tubewith a lid and vortexed for 5 min (Jahnke & Kunkel; Staufen i.Br., Germany) atmaximum speed.
Homogenizer Cells, solvent and glass beads were transferred to 70 mL homogeniza-tion flasks (Sartorius, Gottingen, Germany). The flasks were transferred to a cellhomogenizer (MSK 853030; B.Braun, Melsungen, Germany) and treated 6 x 30 s with30 s pause after each interval with continuous CO2 cooling.
3.6.2 Extraction
3.6.2.1 Weibull-Stoldt and subsequent Soxhlet extraction
For chemical extraction using the method of Weibull-Stoldt (Matissek and Steiner(2008)) five gram of fresh yeast were diluted in 100 mL of H2Odest. and 100 mL of HCl[25%] were added. The suspension was heated to the boiling point and kept boilingfor 45 min. The sample was then filtered through a wet folded filter. The foldedfilter was washed with hot water till the filtrate was Cl--free, which was tested usingAgNO3. The filter was dried over night at 105. The dried filter was subjected to asubsequent Soxhlet extraction using 150 mL of petrolether. The petrolether extractwas used for rotary evaporation (chap. 3.6.3).
32
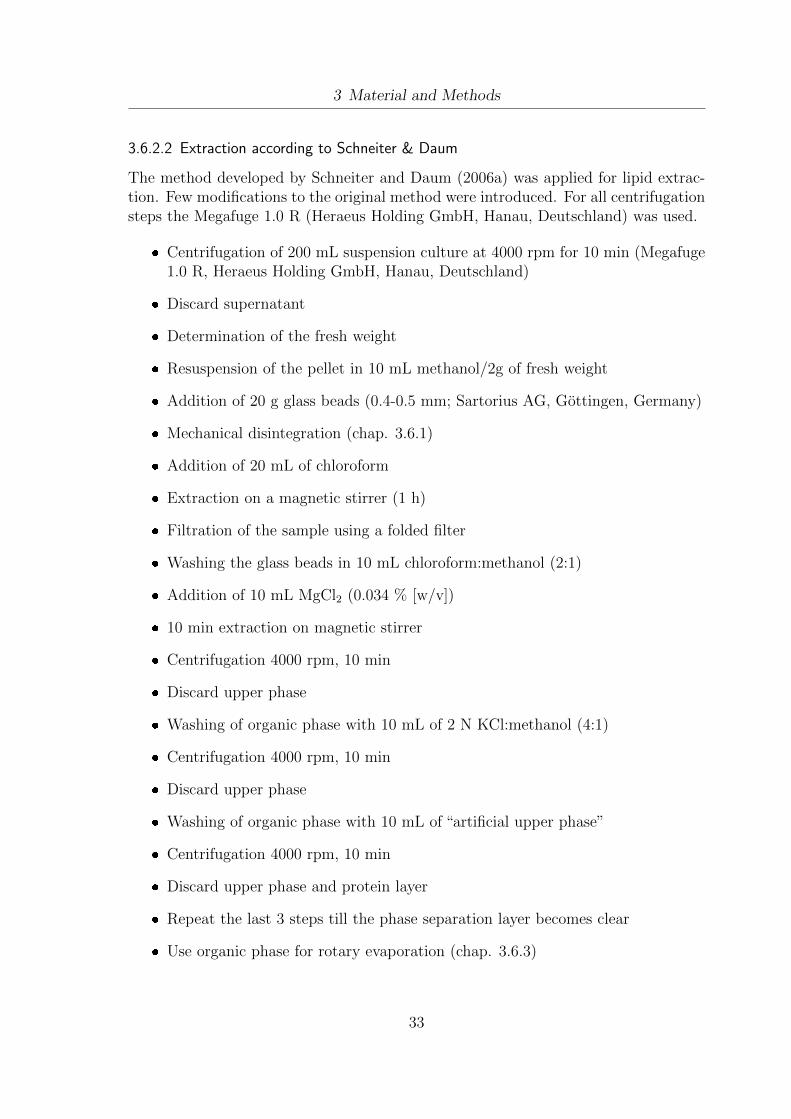
3 Material and Methods
3.6.2.2 Extraction according to Schneiter & Daum
The method developed by Schneiter and Daum (2006a) was applied for lipid extrac-tion. Few modifications to the original method were introduced. For all centrifugationsteps the Megafuge 1.0 R (Heraeus Holding GmbH, Hanau, Deutschland) was used.
Centrifugation of 200 mL suspension culture at 4000 rpm for 10 min (Megafuge1.0 R, Heraeus Holding GmbH, Hanau, Deutschland)
Discard supernatant
Determination of the fresh weight
Resuspension of the pellet in 10 mL methanol/2g of fresh weight
Addition of 20 g glass beads (0.4-0.5 mm; Sartorius AG, Gottingen, Germany)
Mechanical disintegration (chap. 3.6.1)
Addition of 20 mL of chloroform
Extraction on a magnetic stirrer (1 h)
Filtration of the sample using a folded filter
Washing the glass beads in 10 mL chloroform:methanol (2:1)
Addition of 10 mL MgCl2 (0.034 % [w/v])
10 min extraction on magnetic stirrer
Centrifugation 4000 rpm, 10 min
Discard upper phase
Washing of organic phase with 10 mL of 2 N KCl:methanol (4:1)
Centrifugation 4000 rpm, 10 min
Discard upper phase
Washing of organic phase with 10 mL of “artificial upper phase”
Centrifugation 4000 rpm, 10 min
Discard upper phase and protein layer
Repeat the last 3 steps till the phase separation layer becomes clear
Use organic phase for rotary evaporation (chap. 3.6.3)
33
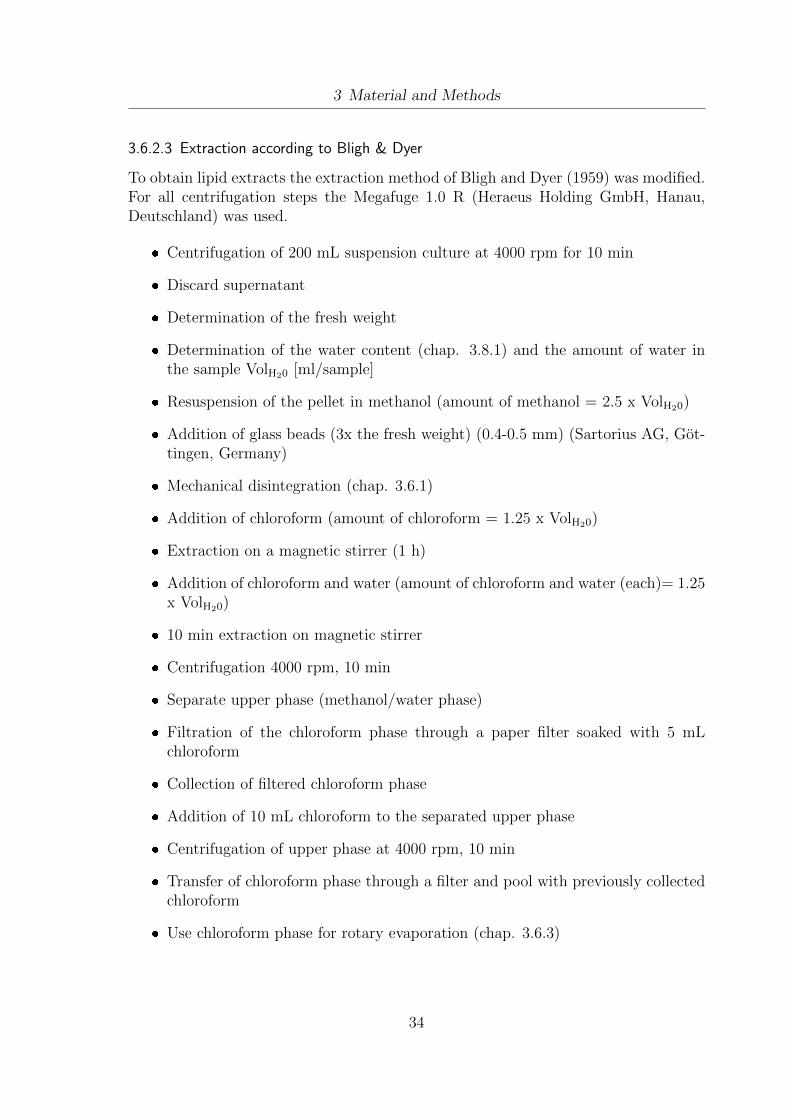
3 Material and Methods
3.6.2.3 Extraction according to Bligh & Dyer
To obtain lipid extracts the extraction method of Bligh and Dyer (1959) was modified.For all centrifugation steps the Megafuge 1.0 R (Heraeus Holding GmbH, Hanau,Deutschland) was used.
Centrifugation of 200 mL suspension culture at 4000 rpm for 10 min
Discard supernatant
Determination of the fresh weight
Determination of the water content (chap. 3.8.1) and the amount of water inthe sample VolH20 [ml/sample]
Resuspension of the pellet in methanol (amount of methanol = 2.5 x VolH20)
Addition of glass beads (3x the fresh weight) (0.4-0.5 mm) (Sartorius AG, Got-tingen, Germany)
Mechanical disintegration (chap. 3.6.1)
Addition of chloroform (amount of chloroform = 1.25 x VolH20)
Extraction on a magnetic stirrer (1 h)
Addition of chloroform and water (amount of chloroform and water (each)= 1.25x VolH20)
10 min extraction on magnetic stirrer
Centrifugation 4000 rpm, 10 min
Separate upper phase (methanol/water phase)
Filtration of the chloroform phase through a paper filter soaked with 5 mLchloroform
Collection of filtered chloroform phase
Addition of 10 mL chloroform to the separated upper phase
Centrifugation of upper phase at 4000 rpm, 10 min
Transfer of chloroform phase through a filter and pool with previously collectedchloroform
Use chloroform phase for rotary evaporation (chap. 3.6.3)
34
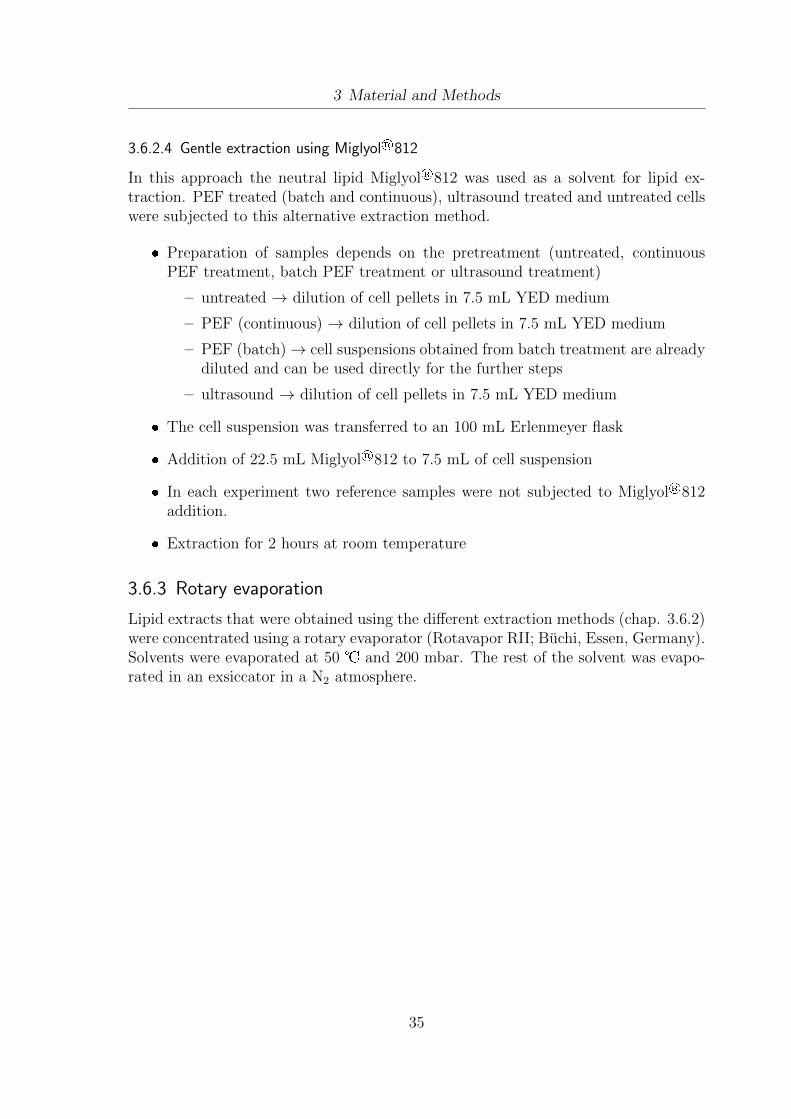
3 Material and Methods
3.6.2.4 Gentle extraction using Miglyol®812
In this approach the neutral lipid Miglyol®812 was used as a solvent for lipid ex-traction. PEF treated (batch and continuous), ultrasound treated and untreated cellswere subjected to this alternative extraction method.
Preparation of samples depends on the pretreatment (untreated, continuousPEF treatment, batch PEF treatment or ultrasound treatment)
– untreated → dilution of cell pellets in 7.5 mL YED medium
– PEF (continuous) → dilution of cell pellets in 7.5 mL YED medium
– PEF (batch)→ cell suspensions obtained from batch treatment are alreadydiluted and can be used directly for the further steps
– ultrasound → dilution of cell pellets in 7.5 mL YED medium
The cell suspension was transferred to an 100 mL Erlenmeyer flask
Addition of 22.5 mL Miglyol®812 to 7.5 mL of cell suspension
In each experiment two reference samples were not subjected to Miglyol®812addition.
Extraction for 2 hours at room temperature
3.6.3 Rotary evaporation
Lipid extracts that were obtained using the different extraction methods (chap. 3.6.2)were concentrated using a rotary evaporator (Rotavapor RII; Buchi, Essen, Germany).Solvents were evaporated at 50 and 200 mbar. The rest of the solvent was evapo-rated in an exsiccator in a N2 atmosphere.
35
3 Material and Methods
3.7 Lipid extraction and analysis - methodology design and
procedure
3.7.1 Methodology design
This section provides an overview of the methodical design of the conducted extractionexperiments, which is presented in Fig. 3.3. The experiments can be split into twomajor parts, the development of a novel lipid extraction method and the determinationof the extraction yield. The novel extraction method was applied using batch PEFtreatment (chap. 3.9.2.1), continuous PEF treatment (chap. 3.9.2.4) or ultrasoundtreatment (chap. 3.10) as well as a subsequent gentle extraction using the neutrallipid Miglyol®812. The mechano-chemical extraction for analytical purposes wasoptimized by applying various mechanical pretreatments (chap. 3.6.1) (untreated,vortex or homogenization) as well as different chemical extraction methods (chap.3.6.2) (Weibull-Stoldt + Soxhlet extraction, Bligh & Dyer extraction or extractionaccording to Schneiter & Daum).
3.7.1.1 Determination of the extraction yield
The extraction yield (Y) was calculated based on the lipid content of the cells after asubsequent chemical extraction with a mechanical pretreatment.
Calculation of the cell lipid content after gentle extraction The lipids which were ob-tained from the extracts (chap. 3.6.2) using rotary evaporation (chap. 3.6.3) wereweighed. The total lipid content of the cell pellets (Xt) was then calculated accordingto the following formula:
Xt =extracted lipids
cell dry weight(3.7.1.1)
The total lipid content of the cell pellets (Xt) comprises both yeast lipids (Xy) andalso lipids which are originated from the Miglyol®812 (Xm).
Xt = Xy +Xm (3.7.1.2)
For being able to distinguish between Xy and Xm in the obtained total lipid extractGC-FID measurement (chap. 3.8.5) was conducted. Miglyol®812 mainly consists ofC8 and C10 fatty acids (≥ 95 %), which occur in W.lipofer only to a very low extend(≤ 1%). Therefore the percentage (content) of these Miglyol®812 derived fatty acids(cm) of the total lipid content can be determined based on the total peak area (At) andthe sum of the C8 and C10 peak areas (Am) as provided in GC-FID chromatograms.
36

3 Material and Methods
Cells
PEF
(continuous)
Miglyol extraction
Weibull-Stoldt + Soxhlet extraction
Bligh & Dyer
Schneiter & Daum
Rotary evaporation
Lipids
GC Weight
Analysis of extraction efficiency
PEF
(batch)
-/+ mechanical disintegration (untreated, vortex or homogenization)
Lipid source
Treatment
PEF or Ultrasound
Gentle extraction
Conventional extraction
Product recovery
Analysis
Nov
el li
pid
extr
actio
nA
naly
sis
of e
xtra
ctio
n yi
eld
Lipids in Miglyol
Ultrasound
(batch)
Figure 3.3: Lipid extraction and analysis - methodology design. The application ofbatch and continuous PEF treatment as well as ultrasound treatment resemble alternativeapproaches. These options were never combined in one single experiment.
37

3 Material and Methods
cm =Am · 100
At
(3.7.1.3)
cm can be used for the determination of Xm:
Xm =Xt · Cm
100(3.7.1.4)
The amount of yeast lipids of the total lipid content of the cell pellets (Xy) can becalculated as follows:
Xy = Xt −Xm (3.7.1.5)
The extraction yield (Y) of the conducted PEF treatment with subsequent Miglyolextraction was calculated as the reduction of the total lipid content from an untreatedreference sample (Xy,ref) to a treated sample (Xy,treated).
Y = 100− (100 ·Xy,treated
Xy,ref
) (3.7.1.6)
3.7.2 Gentle Extraction and Analysis Procedure
Each experiment consisted of the following samples:
no. of samples treatment Miglyol®812 extraction
2x - -2x - +
n·2x + +
The procedure is described to fit all different treatment options (untreated, PEF(batch & continuous) & ultrasound) (Tab.3.2). Prior to every experiment the freshweight and the water content (chap. 3.8.1) have to be determined. Based on thosevalues the amount of water in the sample VolH20 [ml/sample] was calculated. Thisvalue is needed for the further extraction steps.
38
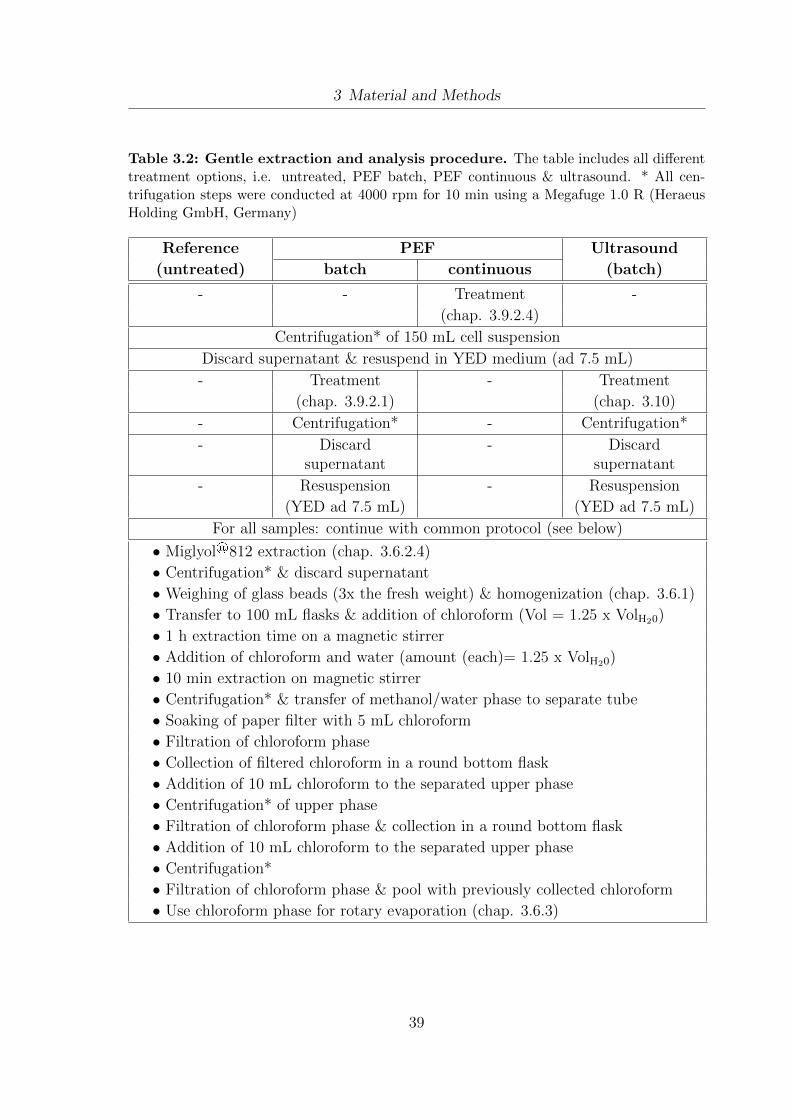
3 Material and Methods
Table 3.2: Gentle extraction and analysis procedure. The table includes all differenttreatment options, i.e. untreated, PEF batch, PEF continuous & ultrasound. * All cen-trifugation steps were conducted at 4000 rpm for 10 min using a Megafuge 1.0 R (HeraeusHolding GmbH, Germany)
Reference PEF Ultrasound
(untreated) batch continuous (batch)
- - Treatment -
(chap. 3.9.2.4)
Centrifugation* of 150 mL cell suspension
Discard supernatant & resuspend in YED medium (ad 7.5 mL)
- Treatment - Treatment
(chap. 3.9.2.1) (chap. 3.10)
- Centrifugation* - Centrifugation*
- Discardsupernatant
- Discardsupernatant
- Resuspension - Resuspension
(YED ad 7.5 mL) (YED ad 7.5 mL)
For all samples: continue with common protocol (see below)
• Miglyol®812 extraction (chap. 3.6.2.4)
• Centrifugation* & discard supernatant
• Weighing of glass beads (3x the fresh weight) & homogenization (chap. 3.6.1)
• Transfer to 100 mL flasks & addition of chloroform (Vol = 1.25 x VolH20)
• 1 h extraction time on a magnetic stirrer
• Addition of chloroform and water (amount (each)= 1.25 x VolH20)
• 10 min extraction on magnetic stirrer
• Centrifugation* & transfer of methanol/water phase to separate tube
• Soaking of paper filter with 5 mL chloroform
• Filtration of chloroform phase
• Collection of filtered chloroform in a round bottom flask
• Addition of 10 mL chloroform to the separated upper phase
• Centrifugation* of upper phase
• Filtration of chloroform phase & collection in a round bottom flask
• Addition of 10 mL chloroform to the separated upper phase
• Centrifugation*
• Filtration of chloroform phase & pool with previously collected chloroform
• Use chloroform phase for rotary evaporation (chap. 3.6.3)
39
3 Material and Methods
3.8 Analytical Methods
3.8.1 Water content
The water content was measured using the moisture meter MA 35 (Sartorius, Got-tingen, Germany). 50 mL of cell suspension was centrifuged at 4000 rpm for 10 min(Megafuge 1.0 R, Heraeus Holding GmbH, Hanau, Germany).
Determination of the dry weight
The supernatant was discarded and the pellet was transferred quantitatively to themoisture meter aluminum tray. The device was used in the ”automatic” mode. Thesample was dried at 130 until a constant mass was determined. The standard timefor measurement was 5-15 min.
Measurement of drying curves
The supernatant was discarded and the pellet was transferred quantitatively to themoisture meter aluminum tray. The yeast cells were spread out on an area of 11 mmdiameter and 2 mm height using a metal washer. The drying was conducted at 60 .The weight of the sample was measured every 30-60 seconds. Based on this data thedrying curves were calculated.
3.8.2 Flow Particle Image Analysis
The established method for Flow Particle Image Analysis (FPIA) was conducted asdescribed in Raschke and Knorr (2009). 100 µL - 1 mL of cell suspension were mea-sured using the FPIA 3000 (Malvern Instruments Ltd., Worcestershire, UK). Forstatistical analysis particles below 2 µm, above 12 µm as well as particles with a cir-cularity below 95 % were excluded. This was done to avoid mistakes based on cellagglomerates and/or poor cell boundary integration. All experiments were conductedin duplicate and the standard deviations provided were calculated based on the meanof each test. They do not represent the standard deviation of all cells of one sample.These standard deviations would be much higher (i.e. ≈+/-1µm), which is due to cellpopulation heterogeneity.
3.8.3 Flow Cytometry
Flow cytometry was conducted both for determination of vitality and lipid dropletdevelopment. Therefore different staining methods were established (chap. 3.8.3.2;Raschke and Knorr (2009)).
40

3 Material and Methods
3.8.3.1 Equipment
The Coulter® EPICS® XL-MCL Flow Cytometer (Beckman- Coulter Inc., Miami,Florida, USA) equipped with an air-cooled 15 mW 488 nm Argon-Laser was used forall experiments.
3.8.3.2 Staining
Depending on the growth phase and the OD, 40 µL - 100 µL of cell suspension wereused. If necessary the flow rate of the cytometer was adjusted (low, medium, high)using the according software to obtain 600-1000 events/s.
Vitality staining (cFDA/PI)The double staining using both Carboxyfluorescein-diacetate (cFDA) and PropidiumIodide (PI) can be applied to distinguish between vital, sublethal and dead cells. ThecFDA is not fluorescent itself but membrane permeable and therefore enters bothliving and dead cells. However, it only shows fluorescence as soon as an active es-terase within the cell cleaves off the acetate residues which leads to the formationof Carboxyfluorescein (cF). PI is not membrane permeable and can only enter per-meabilized cells. As soon as it enters it intercalates with the DNA and stays withinthe cell. Based on these staining methods three subpopulations can be distinguished.Cells which only show cF fluorescence and therefore have an active esterase can beconsidered as ”vital”, while cells which only show PI fluorescence can be considered as”dead”. The third subpopulation, which is formed by cells showing both fluorescencesignals have a permeabilized membrane and an active esterase within the cell. Thesecells can be considered as ”sublethal”. The staining method was modified based on anapproach for vitality staining of Lactobacillus rhamnosus (Ananta et al. (2005)). Themethod for the oleaginous yeast W.lipofer as applied in this work was published byRaschke and Knorr (2009).
Determination of the appropriate amount of cells (chap. 3.8.3.2)
Dilution of cells in 780 µL PBS buffer (0.05 M, +25 mM Citric acid, pH 4.8)
Addition of 220 µL cFDA (Molecular Probes Inc. Leiden, Netherlands) from100 µM stock solution
30 min incubation; RT, dark
Addition of PI (Invitrogen Ltd. Karlsruhe, Germany) to obtain a final concen-tration of 15 µM
10 min incubation; RT, dark
Flow cytometry measurement
41
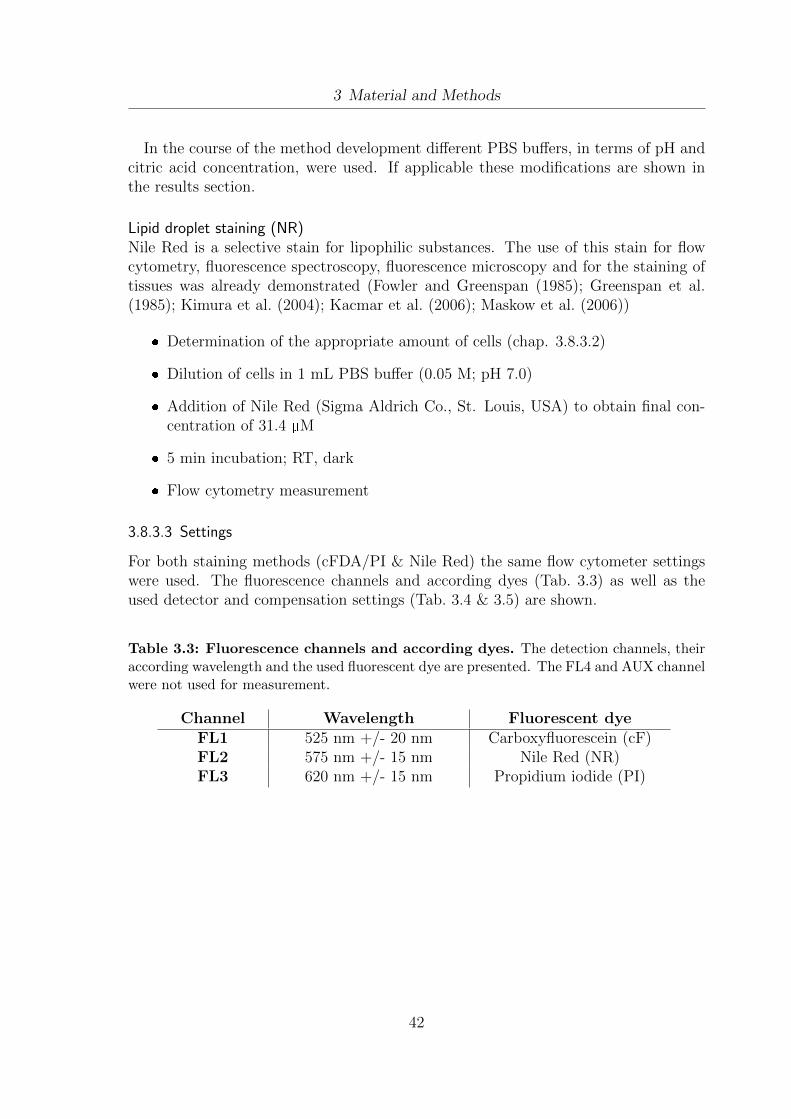
3 Material and Methods
In the course of the method development different PBS buffers, in terms of pH andcitric acid concentration, were used. If applicable these modifications are shown inthe results section.
Lipid droplet staining (NR)Nile Red is a selective stain for lipophilic substances. The use of this stain for flowcytometry, fluorescence spectroscopy, fluorescence microscopy and for the staining oftissues was already demonstrated (Fowler and Greenspan (1985); Greenspan et al.(1985); Kimura et al. (2004); Kacmar et al. (2006); Maskow et al. (2006))
Determination of the appropriate amount of cells (chap. 3.8.3.2)
Dilution of cells in 1 mL PBS buffer (0.05 M; pH 7.0)
Addition of Nile Red (Sigma Aldrich Co., St. Louis, USA) to obtain final con-centration of 31.4 µM
5 min incubation; RT, dark
Flow cytometry measurement
3.8.3.3 Settings
For both staining methods (cFDA/PI & Nile Red) the same flow cytometer settingswere used. The fluorescence channels and according dyes (Tab. 3.3) as well as theused detector and compensation settings (Tab. 3.4 & 3.5) are shown.
Table 3.3: Fluorescence channels and according dyes. The detection channels, theiraccording wavelength and the used fluorescent dye are presented. The FL4 and AUX channelwere not used for measurement.
Channel Wavelength Fluorescent dyeFL1 525 nm +/- 20 nm Carboxyfluorescein (cF)FL2 575 nm +/- 15 nm Nile Red (NR)FL3 620 nm +/- 15 nm Propidium iodide (PI)
42
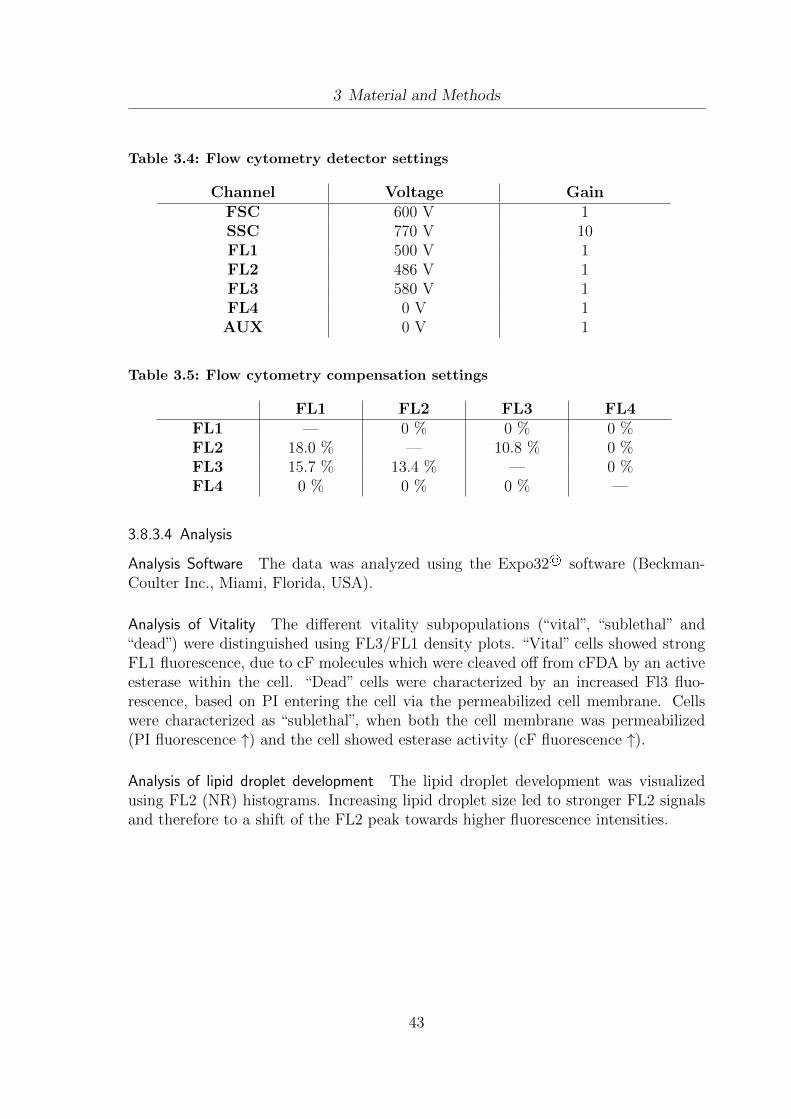
3 Material and Methods
Table 3.4: Flow cytometry detector settings
Channel Voltage GainFSC 600 V 1SSC 770 V 10FL1 500 V 1FL2 486 V 1FL3 580 V 1FL4 0 V 1AUX 0 V 1
Table 3.5: Flow cytometry compensation settings
FL1 FL2 FL3 FL4FL1 — 0 % 0 % 0 %FL2 18.0 % — 10.8 % 0 %FL3 15.7 % 13.4 % — 0 %FL4 0 % 0 % 0 % —
3.8.3.4 Analysis
Analysis Software The data was analyzed using the Expo32© software (Beckman-Coulter Inc., Miami, Florida, USA).
Analysis of Vitality The different vitality subpopulations (“vital”, “sublethal” and“dead”) were distinguished using FL3/FL1 density plots. “Vital” cells showed strongFL1 fluorescence, due to cF molecules which were cleaved off from cFDA by an activeesterase within the cell. “Dead” cells were characterized by an increased Fl3 fluo-rescence, based on PI entering the cell via the permeabilized cell membrane. Cellswere characterized as “sublethal”, when both the cell membrane was permeabilized(PI fluorescence ↑) and the cell showed esterase activity (cF fluorescence ↑).
Analysis of lipid droplet development The lipid droplet development was visualizedusing FL2 (NR) histograms. Increasing lipid droplet size led to stronger FL2 signalsand therefore to a shift of the FL2 peak towards higher fluorescence intensities.
43

3 Material and Methods
3.8.4 Fluorescence microscopy
Fluorescence microscopy was conducted in Prof. Romeis laboratory at the ”Freie Uni-versitat Berlin” in the Dept. of Biology, Chemistry and Pharmacy.
Sample preparation:
Samples were stained with Nile Red as described in chap. 3.8.3.2.
Equipment:
Microscope Eclipse 90i; Nikon, Dusseldorf, Germany
Filter HQ-Filterset for Ds Red F41-035AHF Analysentechnik, Tubingen, Germany
Camera ORCA C4742; HamamatsuHerrsching am Ammersee, Germany
Software Volocity; PerkinElmer, Waltham, MA, USA
44
3 Material and Methods
3.8.5 Gas chromatography (GC - FID)
Gas chromatography with flame ionization detector (GC-FID) was used to determinethe fatty acid distribution in the used microorganisms.
GC Equipment Chrompack CP 9001 (Chrompack, Delft, Netherlands)
Autosampler A200S (CTC Analytics, Zwingen, Switzerland)
Column SP 2380 (30m x 0.25 mm, 0,2 µm)poly(90% biscyanopropyl/10% cyanopropylphenyl siloxane)
Temperature Tinjector = 250 settings Tdetector = 270
Carrier gas N2
Temperature · 60 for 8 mincurve · 60 to 170 (3 /min)
· 170 for 50 min
Standard 37 Standard Mix Supelco (Sigma Aldrich, St. Louis, MO, USA)
Software Maitre 2.5; Chromatography Data System(Varian, Inc., Palo Alto, CA, USA)
Sample preparation:
Dilution of 10 mg of fat in 500 µL MTBE
Addition of 50 µL TMSH (0.2 M in methanol) (Macherey & Nagel, Duren,Germany) to 100 µL of MTBE-fat solution
GC measurement (Injection volume: 1 µL)
3.8.6 Protein extraction and analysis
To determine the extraction yield of proteins after PEF treatment a protein extractionas well as a subsequent protein analysis were conducted.
3.8.6.1 Protein extraction
For protein extraction both untreated as well as PEF-treated (batch) (chap. 3.9.2.3)cells were used.
45

3 Material and Methods
Centrifugation (10000 rpm, 5 min; Biofuge®Pico, Heraeus Holding GmbH,Hanau, Germany)
Transfer supernatant to separate tube and keep for quantification of proteins inthe medium (chap. 3.8.6.2)
Determination of the fresh weight of untreated samples
Addition of 3 g glass beads/g fresh weight into new 2 mL reaction tube
Resuspension of cell pellets in lysis buffer (2 mL lysis buffer/g fresh weight)
Transfer of the suspension into the reaction tube with glass beads
Vortex 9x 30 s
Centrifugation at 10000 rpm, 5 min (Biofuge®Pico, Heraeus Holding GmbH,Hanau, Germany)
Transfer supernatant to new reaction tube and use for quantification of intra-cellular proteins (chap. 3.8.6.2)
3.8.6.2 Protein quantification
Protein quantification was conducted using the Bio-Rad protein assay. This assay isbased on the method of Bradford. Due to binding of the Coomassie® brilliant blueG-250 dye a subsequent shift of the absorption maximum to 595 nm occurs and theprotein concentration can be measured. Both protein extracts (chap. 3.8.6.1) andsupernatant of untreated and PEF treated cells were used.
Sample preparation:
Appropriate sample dilutions or concentrations were prepared to allow measurementwithin distinct absorbance levels (Abs595≤ 1) The samples were prepared as follows:
Transfer 900 µL H2Odemin. into 1,5 mL reaction tube
Addition 100 µL of sample. For the preparation of the blank 100 µL of thesolution in which the proteins are dissolved in is used
Addition of 250 µL of bradford dye (BioRad, Hercules, CA, USA)
Vortexing of samples
Incubation for 15 min at RT
Measurement of Abs595
46
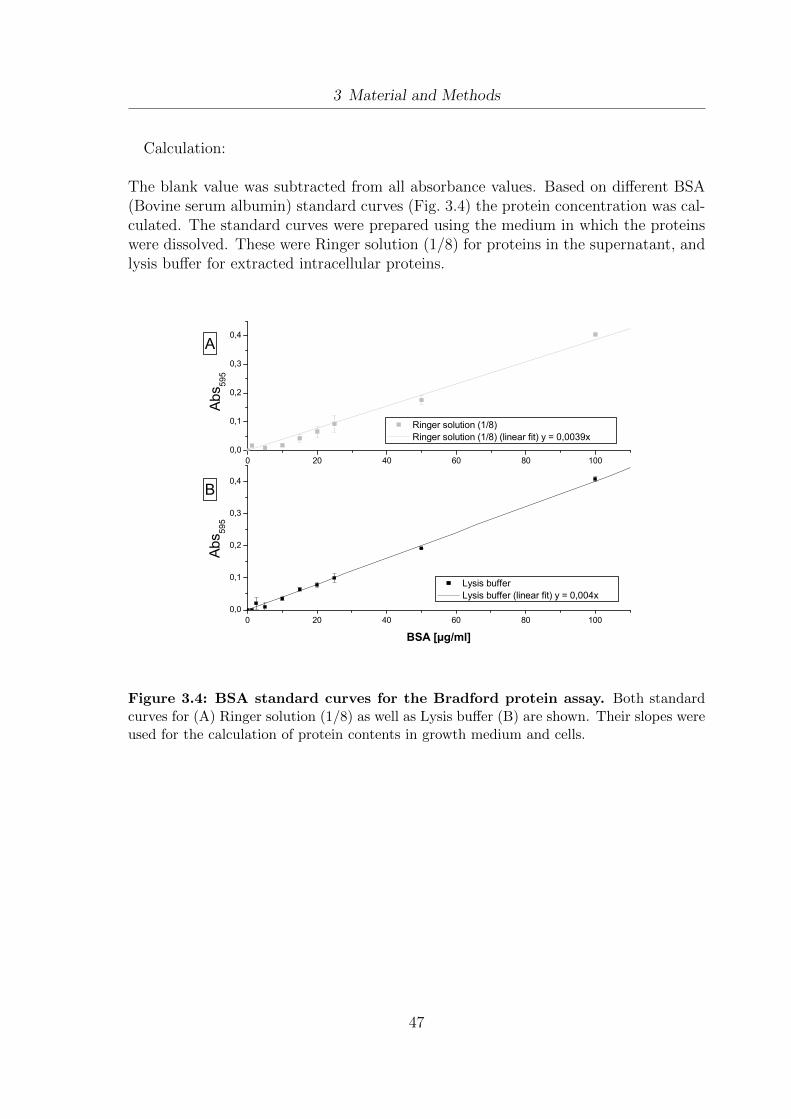
3 Material and Methods
Calculation:
The blank value was subtracted from all absorbance values. Based on different BSA(Bovine serum albumin) standard curves (Fig. 3.4) the protein concentration was cal-culated. The standard curves were prepared using the medium in which the proteinswere dissolved. These were Ringer solution (1/8) for proteins in the supernatant, andlysis buffer for extracted intracellular proteins.
0 2 0 4 0 6 0 8 0 1 0 00 , 0
0 , 1
0 , 2
0 , 3
0 , 40 2 0 4 0 6 0 8 0 1 0 0
0 , 0
0 , 1
0 , 2
0 , 3
0 , 4A
Ab
s 595
Abs 59
5
L y s i s b u f f e r L y s i s b u f f e r ( l i n e a r f i t ) y = 0 , 0 0 4 x
B
R i n g e r s o l u t i o n ( 1 / 8 ) R i n g e r s o l u t i o n ( 1 / 8 ) ( l i n e a r f i t ) y = 0 , 0 0 3 9 x
Figure 3.4: BSA standard curves for the Bradford protein assay. Both standardcurves for (A) Ringer solution (1/8) as well as Lysis buffer (B) are shown. Their slopes wereused for the calculation of protein contents in growth medium and cells.
47
3 Material and Methods
3.8.7 Determination of the DNA content
The concentration of DNA in the yeast samples was determined photometrically. AfterPEF treatment (chap. 3.9.2.3) or mechanical disintegration as conducted during pro-tein extraction (chap. 3.8.6.1) the cell suspension was centrifuged and the supernatantwas used for the measurement. The supernatant was measured at 260 nm and 310 nmfor DNA quantification and at 280 nm to detect protein impurities in a Quartz cuvette(d= 1 cm). The range of values tolerable for the measurement lay between 0.1 and 1.0.If necessary, appropriate dilutions of the samples were prepared. The absorption ofthe used solution was set to zero. The concentration of DNA was calculated accordingto the following equation:
Abs260 nm − Abs310 nm
Abs260 nmH2O − Abs310 nmH2O·DF ·MF (3.8.7.1)
with ”DF” being the dilution factor and ”MF” being the multiplication factor, whichis 50µg/ml for DNA. The following equation provides information about potentialprotein impurities in the sample:
Abs260 nm − Abs310 nm
Abs280 nm − Abs310 nm
(3.8.7.2)
As soon as values between 1.8 and 2.0 are calculated the solution can be consideredto be free of proteins.
3.8.8 Determination of cell permeabilization by electric current increase
To determine the level of cell permeabilization the electric current increase duringmeasurement was calculated. This effect is due to an increase in media conductivitybased on cytoplasmic ions released into the medium after permeabilization. This effectwas previously described by Zakhem et al. (2006a). Based on the electric current atthe beginning (Istart) and at each measuring point (In), ∆I was calculated.
∆I = In − Istart (3.8.8.1)
The starting value of each treatment (Istart) was set to zero, while the maximumincrease of ∆I for each treatment was set to 100 %. This allows a comparison ofsamples treated at different electric field strengths. A comparison of total values isnot possible, since the electric current is directly proportional to the applied voltage.Therefore this method is only suitable for the determination of the time, which isneeded for the maximum possible cell disintegration at a given electric field strength.
48
3 Material and Methods
3.9 Pulsed electric field treatment
3.9.1 Generation of pulsed electric fields
In the course of this work different applications of pulsed electric fields were used.Besides the treatment in a batch system (chap. 3.9.1.1), various approaches in acontinuous system (chap. 3.9.1.2) were conducted.
3.9.1.1 Batch treatment
Batch treatment was conducted using exponential decay pulses generated by a labscale micro-pulse modulator.
Power supply FUG HCK 800M-20000, 20 kV, 80 mA(FUG, Rosenheim, Germany)
Capacitors Ceramite Y5U 6800Z, Ctotal = 19,1 nF(Behlke, Kronberg, Germany)
High voltage switch HTS 160-500 SCR, 16 kV, 5 kA, 2 kHz(Behlke, Kronberg, Germany)
Protective resistor 2.5 Ohm (Stervice, France)
Free wheeling diode FDA 150-200, 20 kV, 1.5 kA(Behlke, Kronberg, Germany)
Frequency generator AFG 320 (Sony Tektronix, Beaverton, USA)
Switch power supply A400, 5 V, 2 A (EMS Power, Basingstoke, U.K.)
Oscilloscope TDS220 (Sony Tektronix, Beaverton, USA)
High Voltage Sensor P6015A, 1000x 3.0 pF, 100 MΩ (Sony Tektronix,Beaverton, USA)
Electric current sensor Current transformator 2-1.0, (Output V/A=1.0)(Stangenes Industries Inc., Palo Alto, CA, USA)
Treatment chamber Electroporation cuvettes:d = 0,2 cm, 400 µL(Eppendorf, Hamburg, Germany)d = 0,4 cm, 800 µL(VWR International GmbH, Darmstadt, Germany)
49
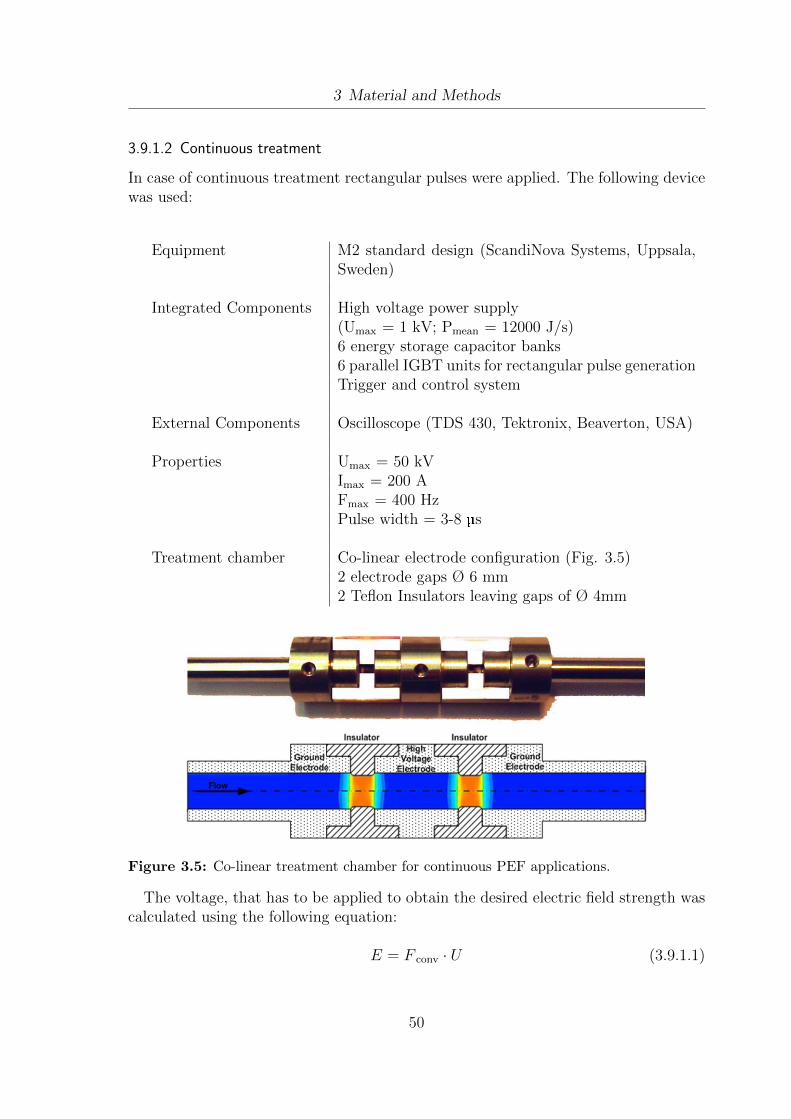
3 Material and Methods
3.9.1.2 Continuous treatment
In case of continuous treatment rectangular pulses were applied. The following devicewas used:
Equipment M2 standard design (ScandiNova Systems, Uppsala,Sweden)
Integrated Components High voltage power supply(Umax = 1 kV; Pmean = 12000 J/s)6 energy storage capacitor banks6 parallel IGBT units for rectangular pulse generationTrigger and control system
External Components Oscilloscope (TDS 430, Tektronix, Beaverton, USA)
Properties Umax = 50 kVImax = 200 AFmax = 400 HzPulse width = 3-8 µs
Treatment chamber Co-linear electrode configuration (Fig. 3.5)2 electrode gaps Ø 6 mm2 Teflon Insulators leaving gaps of Ø 4mm
Figure 3.5: Co-linear treatment chamber for continuous PEF applications.
The voltage, that has to be applied to obtain the desired electric field strength wascalculated using the following equation:
E = F conv · U (3.9.1.1)
50

3 Material and Methods
The conversion factor (Fconv) of 1.7, which takes the special electrode design intoaccount, was obtained by numerical simulation according to Meneses et al..
The total energy input for continuous treatment, taking Wpulse, the frequency andthe mass flow into account, was calculated as follows:
W total =W pulse · f · 3.6
m(3.9.1.2)
3.9.2 Application of pulsed electric field treatment
In the course of the experiments, various PEF treatment conditions were used. Bothbatch treatment using exponential decay pulses (chap. 3.9.2.1-3.9.2.3), as well ascontinuous treatment using square wave pulses (chap. 3.9.2.4) were conducted. Thesettings were calculated using the equations shown in chapter 2.4.3.2 and chapter2.4.3.3. A special setup which allows the integration of continuous PEF treatmentinto a fermentation process was designed (chap. 3.9.2.5).
3.9.2.1 Batch treatment for the extraction of lipophilic substances
The batch treatment is an integral part of the general protocol for the ”Gentle extrac-tion and analysis procedure” (chap. 3.7.2). The treatment was conducted as follows:
Transfer of appropriate amount of cells to electroporation cuvettes(d = 0,4 cm, 800 µL; VWR International GmbH, Darmstadt, Germany)
Treatment at desired conditions (chap. 2.4.3)
Pooling of cells of identical treatment
3.9.2.2 Batch treatment for vitality and cell size experiments
Batch treatment for vitality and cell size experiments was conducted as follows:
Transfer of cells into electroporation cuvettes(d = 0,4 cm, 800 µL; VWR International GmbH, Darmstadt, Germany)
Treatment at desired conditions (chap. 2.4.3)
Transfer cells to 1.5 mL reaction tubes and use for:
– Vitality measurement (Flow cytometry) (chap. 3.8.3)
– Cell size measurement (FPIA) (chap. 3.8.2)
51

3 Material and Methods
Figure 3.6: Setup for the integration of PEF treatment into the fermentationprocess. The triangles indicate the medium/water flux during PEF treatment/efflux fromthe fermenter (black), reflux of treated cells into the fermenter (black/white) and duringcleaning (grey).
3.9.2.3 Batch treatment for the extraction of hydrophilic substances
To determine the effect of batch treatment on the extraction of hydrophilic substancesthe following procedure was conducted. The method is described for one sample andtherefore has to be adapted depending on sample number and duplicate testing.
Sample preparation/concentration
– Transfer of 20 mL suspension culture into a weighed 50 mL reaction tube
– Centrifugation at 4000 rpm for 10 min (Megafuge 1.0 R; Heraeus HoldingGmbH, Germany)
– Discard supernatant
– Determination of the fresh weight
– Resuspension of cell pellets ≈ 200 µL Ringer solution (1/8 strength)
– Transfer of suspension into a 1.5 mL reaction tube
Treatment
– Transfer of 800 µL suspension into electroporation cuvette(d = 0,4 cm, 800 µL; VWR International GmbH, Darmstadt, Germany)
– Treatment at desired conditions (chap. 2.4.3)
52
3 Material and Methods
– Transfer of suspension into 1.5 mL reaction tube
– Cells can be used for protein extraction and subsequent analysis (chap.3.8.6)
3.9.2.4 Continuous treatment
The continuous treatment is an integral part of the general protocol for the ”Gentleextraction and analysis procedure” (chap. 3.7.2) and was also used for the determina-tion of cell size and vitality. The cells were pumped from the culture flask through asilicone tube into the co-linear treatment chamber (chap. 3.9.1.2) using a peristalticpump (323 DU; Watson Marlow, Falmouth, UK). The treatment conditions were cal-culated as described in chapter 2.4.3. The treated suspension was collected and usedfor the following steps in the aforementioned ”Gentle extraction and analysis proce-dure” (chap. 3.7.2) and/or used for the determination of cell size (chap. 3.8.2) andvitality (chap. 3.8.3).
3.9.2.5 Combination of fermentation and PEF treatment
In the course of the experiments a fermentation setup was designed which allows con-tinuous treatment of the cells (Fig. 3.6). It allows the PEF treatment, the collectionand the transfer of the cells back into the fermenter. It is also possible to clean thetreatment chamber between treatments.
53
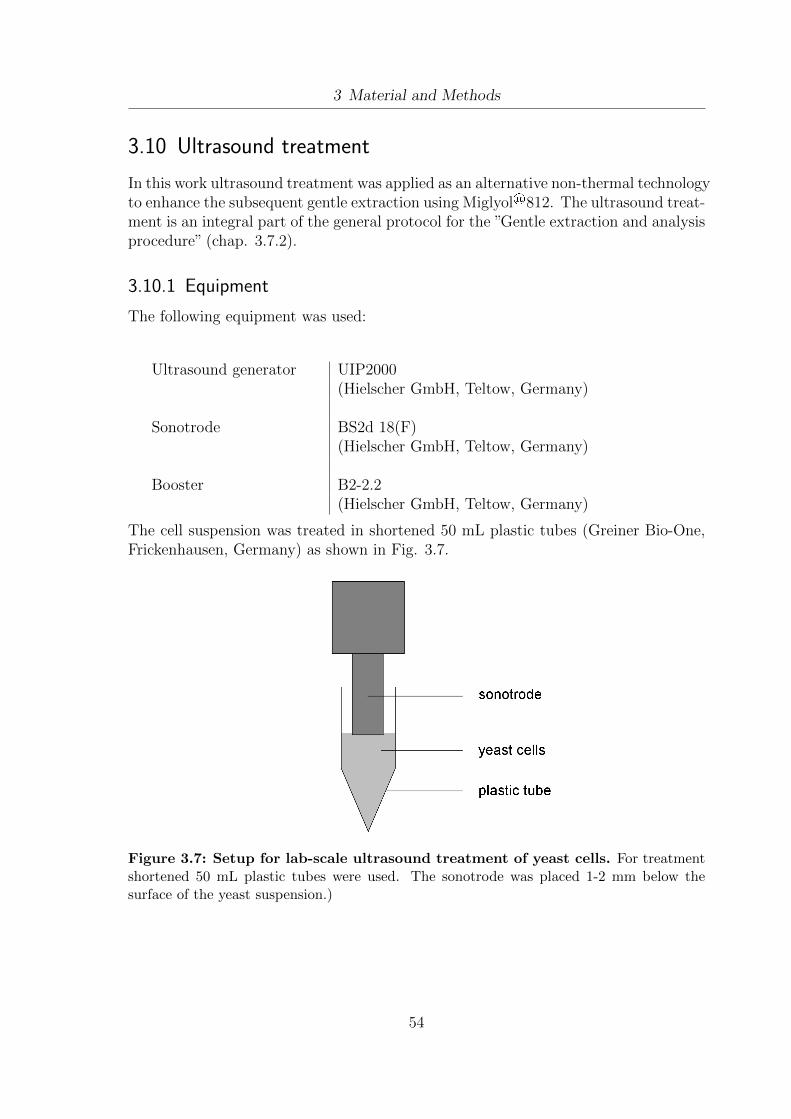
3 Material and Methods
3.10 Ultrasound treatment
In this work ultrasound treatment was applied as an alternative non-thermal technologyto enhance the subsequent gentle extraction using Miglyol®812. The ultrasound treat-ment is an integral part of the general protocol for the ”Gentle extraction and analysisprocedure” (chap. 3.7.2).
3.10.1 Equipment
The following equipment was used:
Ultrasound generator UIP2000(Hielscher GmbH, Teltow, Germany)
Sonotrode BS2d 18(F)(Hielscher GmbH, Teltow, Germany)
Booster B2-2.2(Hielscher GmbH, Teltow, Germany)
The cell suspension was treated in shortened 50 mL plastic tubes (Greiner Bio-One,Frickenhausen, Germany) as shown in Fig. 3.7.
Figure 3.7: Setup for lab-scale ultrasound treatment of yeast cells. For treatmentshortened 50 mL plastic tubes were used. The sonotrode was placed 1-2 mm below thesurface of the yeast suspension.)
54
3 Material and Methods
3.10.2 Calculation
The power Pbasic, which is consumed by the ultrasound device without any sampleand the power (Ptotal) which is consumed during treatment at a given amplitude weremeasured. The real power consumption Preal was calculated as follows:
P real = P total − P basic (3.10.2.1)
Based on Preal, desired treatment time (s), treated mass (m) or desired energy input(Wtotal) the treatment conditions can be calculated.
W total =P real · sm
(3.10.2.2)
3.10.3 Procedure
Transfer cell suspension to plastic tube (Fig. 3.7)
Insertion of the sonotrode into the medium
Application of desired treatment conditions
Centrifugation at 4000 rpm for 10 min (Megafuge 1.0 R, Heraeus Holding GmbH,Hanau, Deutschland)
Discard supernatant
55
3 Material and Methods
3.11 Chemicals
Growth media & media supplements
Agar Sigma-Aldrich, Deisenhofen, GermanyD-Glucose Merck, Darmstadt, GermanyDifco Yeast Nitrogen Base BD, Sparks, MD, USAGlycerol Merck, Darmstadt, GermanyWhey permeate TU BerlinYeast extract Merck, Darmstadt, Germany
Salts
KCl Merck, Darmstadt, GermanyKH2PO4 Merck, Darmstadt, GermanyMgCl2 Merck, Darmstadt, GermanyNa2HPO4 Merck, Darmstadt, GermanyNaCl Merck, Darmstadt, Germany(NH4)2SO4 Merck, Darmstadt, GermanyRinger solution Merck, Darmstadt, Germany
Gentle extraction
Miglyol®812 Caelo, Hilden, GermanyGlass beads (0,4-0,6 mm) Sartorius, Gottingen, Germany
Buffer supplements
EDTA Merck, Darmstadt, GermanySorbit Merck, Darmstadt, GermanyTris-HCl Sigma-Aldrich, Deisenhofen, Germany
Solvents, acids & bases
Chloroform Merck, Darmstadt, GermanyHydrochloric acid Merck, Darmstadt, GermanyMethanol Merck, Darmstadt, GermanyNaOH Merck, Darmstadt, Germany
56
3 Material and Methods
Gas chromatography
MTBE Merck, Darmstadt, GermanyTMSH in 0.2 M methanol Macherey-Nagel, Duren, Germany
Flow cytometry
cFDA Molecular Probes Inc. Leiden, NetherlandsCleaning fluid - Cleanz® Beckman Coulter, Fullerton, CA, USANile Red Sigma Aldrich Co., St. Louis, USAPI Invitrogen Ltd. Karlsruhe, GermanySheath fluid - IsoFlow Beckman Coulter, Fullerton, CA, USA
Flow Particle Image Analysis
Sysmex particle sheath Malvern Instruments, Worcestershire, Eng-land
57
4 Results and discussion
This chapter, which provides results and discussion of the conducted experiments, isdivided into the following sections. Starting with the method development for growthmonitoring (chap. 4.1), media optimization (chap. 4.2) and growth monitoring (chap.4.3) the influence of PEF treatment on physiology (chap. 4.4) and on extractionprocesses (chap. 4.5) is determined. Different fermentation strategies suitable forPEF treatment and extraction processes were employed (chap. 4.6).
4.1 Method development for growth monitoring
Since a thorough understanding of the physiological state of the given microorganism isof great importance for employing a successful fermentation strategy, several methodsfor growth monitoring had to be established. These methods are suitable for themonitoring of vitality (chap. 4.1.1) and lipid droplet development (chap. 4.1.2) (seealso: Raschke and Knorr (2009)).
4.1.1 Vitality
Vitality determination is an important tool for fermentation optimization. In thecourse of the experiments a flow cytometry method was established, which allowsthe distinction between ”vital”, ”sublethal” and ”dead” cells. The distinction betweenthese subpopulations is based on the esterase activity of ”vital” cells and the followingenzymatic degradation of the non-fluorescent prefluorochrome cFDA to the fluorescentcF as well as the PI fluorescence, which is only shown by cells with permeabilizedcell membranes, which can be regarded as ”dead”. The combination of these twofluorescence signals in one cell defines a cell as ”sublethal”. The staining conditionsplay a major role when it comes to method optimization for flow cytometry. Cells werestained with cFDA an PI according to the protocol described previously (3.8.3.2), butthe staining buffer was varied in terms of pH and citric acid concentration. As shownin Fig. 4.1 (left) cells stained with PBS buffer (0.05 M; pH 7.0), without addition ofcitric acid, the PI stained subpopulation (i.e. ”dead”cells) can be clearly distinguished,while the cFDA staining leads to poor results. Based on the method of Abe (1998)a modified PBS buffer was used containing 50 mM of citric acid and pH 3 (Fig. 4.1,right). The modification had a positive impact on the cFDA staining, but the PIstaining was impaired. A mixture of the two buffers (PBS, pH 4.8, 25 mM cFDA)led to satisfying result for both cFDA and PI staining (Fig. 4.1, center). In furtherexperiments it was shown that the main impact on the staining method is based on the
58
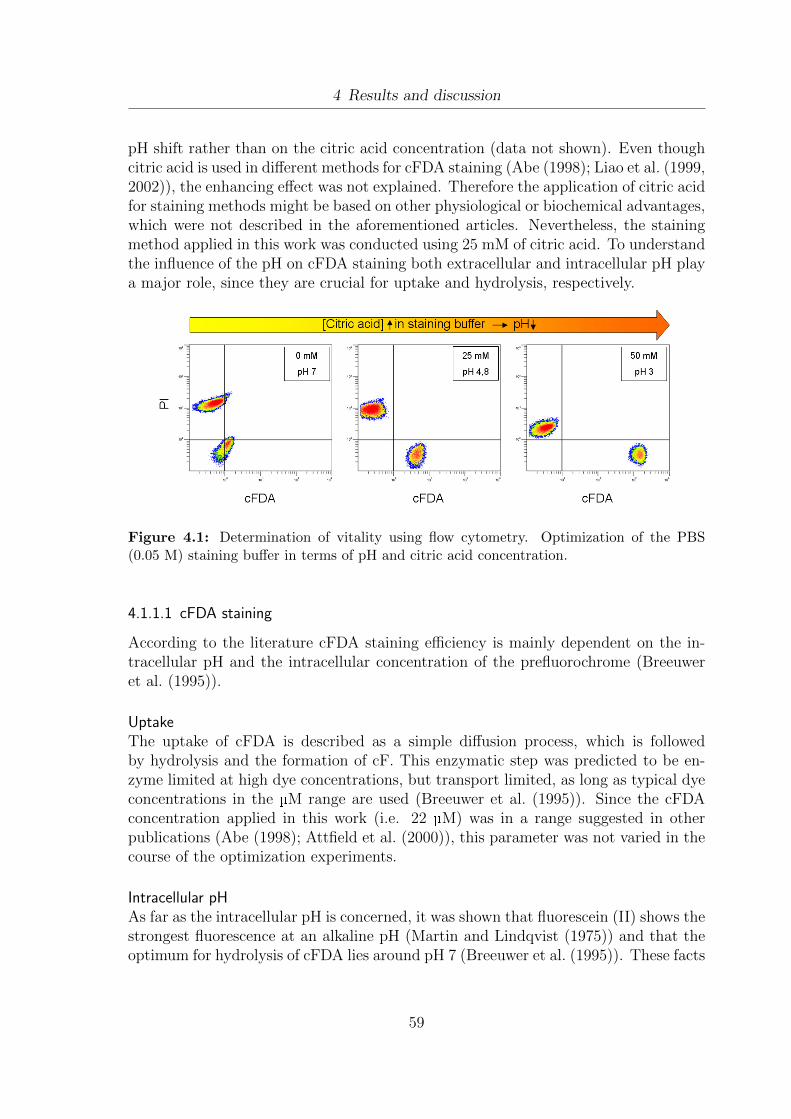
4 Results and discussion
pH shift rather than on the citric acid concentration (data not shown). Even thoughcitric acid is used in different methods for cFDA staining (Abe (1998); Liao et al. (1999,2002)), the enhancing effect was not explained. Therefore the application of citric acidfor staining methods might be based on other physiological or biochemical advantages,which were not described in the aforementioned articles. Nevertheless, the stainingmethod applied in this work was conducted using 25 mM of citric acid. To understandthe influence of the pH on cFDA staining both extracellular and intracellular pH playa major role, since they are crucial for uptake and hydrolysis, respectively.
Figure 4.1: Determination of vitality using flow cytometry. Optimization of the PBS(0.05 M) staining buffer in terms of pH and citric acid concentration.
4.1.1.1 cFDA staining
According to the literature cFDA staining efficiency is mainly dependent on the in-tracellular pH and the intracellular concentration of the prefluorochrome (Breeuweret al. (1995)).
UptakeThe uptake of cFDA is described as a simple diffusion process, which is followedby hydrolysis and the formation of cF. This enzymatic step was predicted to be en-zyme limited at high dye concentrations, but transport limited, as long as typical dyeconcentrations in the µM range are used (Breeuwer et al. (1995)). Since the cFDAconcentration applied in this work (i.e. 22 µM) was in a range suggested in otherpublications (Abe (1998); Attfield et al. (2000)), this parameter was not varied in thecourse of the optimization experiments.
Intracellular pHAs far as the intracellular pH is concerned, it was shown that fluorescein (II) shows thestrongest fluorescence at an alkaline pH (Martin and Lindqvist (1975)) and that theoptimum for hydrolysis of cFDA lies around pH 7 (Breeuwer et al. (1995)). These facts
59

4 Results and discussion
suggest an optimal intracellular pH around 7-8 for cFDA staining. According to theliterature these conditions can be found in yeast cells. Depending on the growth phaseand the media used, for S.cerevisiae an intracellular pH range of 5.5 to 7.6 (Kotyk(1963); Slavık and Kotyk (1984); Imai and Ohno (1995)) and for Lipomyces starkeyian intracellular pH of 7-8 were described. For L. starkeyi, which is closely relatedto W.lipofer, the pH was estimated by testing enzyme activities in vitro (Lomascoloet al. (1996)). Based on this information it can be expected that optimal intracellularconditions for cFDA hydrolysis are given in W.lipofer and that the main focus foroptimization can be put on the extracellular pH.
Extracellular pHAs already mentioned the uptake of cFDA is described as a diffusion process (Breeuweret al. (1995)). Diffusion processes are influenced by the plasma membrane fluidity,as shown for non-ionic substances in artificial large unilamellar vesicles (Lande et al.(1995)) and erythrocyte membranes (Dumas et al. (1997)). The membrane fluidityitself is influenced by the extracellular pH as shown for different organisms. Tourdot-Marechal et al. (2000) observed an increased membrane fluidity with decreasing pHfor the gram-positive lactic acid bacterium Oenococcus oeni, while Turk et al. (2007)demonstrated an opposite effect for the marine yeast Debaryomyces hansenii. It can beexpected that the membrane fluidity is optimal when cells are maintained at optimalgrowth parameters including the pH. Thus also diffusion processes will be optimal.Therefore the extracellular pH should be close to the optimal growth pH of the cells toallow optimal membrane fluidity. In case of W.lipofer this optimum lies in the slightlyacidic range. These considerations are strengthened by the results obtained in thiswork. It can be seen that the fluorescence increases with decreasing pH (Fig. 4.1),which can be due to improved uptake of cFDA, since the intracellular pH should notbe strongly affected. If a decrease of the extracellular pH led to a decrease in theintracellular pH, this would lead to poorer fluorescence results, since the optimum forhydrolysis and fluorescence lies, as already mentioned, in the slightly alkaline range.The argument of using a low pH for staining is strengthened by the literature, wheresimilar pH ranges for the cFDA staining of yeast cells are used (Breeuwer et al. (1995);Abe (1998)). In the experiments it can be seen that cFDA staining is further improvedwhen the pH is decreased to pH 3. Since W.lipofer is capable of growing at low pHan optimal membrane fluidity at pH 3 can be expected.
4.1.1.2 PI staining
PI uptake takes place via membrane pores. It is regarded to be cell membrane imper-meant and therefore used to detect permeabilized cells (Invitrogen (2010)). Thereforeconsiderations concerning the extracellular pH and its influence on membrane fluid-ity, as they were made for cFDA (chap. 4.1.1.1), are not necessary. Since the barrierbetween the inside of the cell and surrounding medium is destroyed due to cell perme-abilization, it can be assumed that the intracellular pH will adapt to the extracellular
60

4 Results and discussion
pH over time. The more the extracellular pH differs from the pH optimum of PI,the more will the PI staining efficiency/ fluorescence be impaired. The pH used intypical vitality stainings lies around pH 7 (Ananta et al. (2005); Invitrogen (2010)).The results of the staining optimization (4.1) reflects this considerations, since it canbe seen, that PI fluorescence was optimal at pH 7, decreasing slightly at pH 4.8 andleading to poor results at pH 3.
Figure 4.2: Separation of different vitality subpopulations using flow cytometry.4 day old cells, which were subjected to a mild PEF treatment (5 kV/cm, 0.5 kJ/kg) weredouble-stained using cFDA and PI and separated using flow cytometry. Cells which showcFDA fluorescence were considered as ”vital”, cells with PI fluorescence as ”dead” and cellswhich show both signals as ”sublethal”. (from: Raschke and Knorr (2009))
4.1.1.3 cFDA/ PI double staining
When all the results of the cFDA and PI staining (Fig. 4.1) are taken into account,it can be summarized that both pH 7 and pH 3 lead to unsatisfying staining results,since a potentially occurring ”sublethal” subpopulation, which would be located atthe intersection of cFDA and PI subpopulations, could not be distinguished from the”dead” cells at pH 7 or from the ”vital” cells at pH 3, respectively. Since pH 4.8 ledto satisfying results for the cFDA/PI double staining, these conditions were used forfurther experiments. As already mentioned no significant influence of citric acid was
61
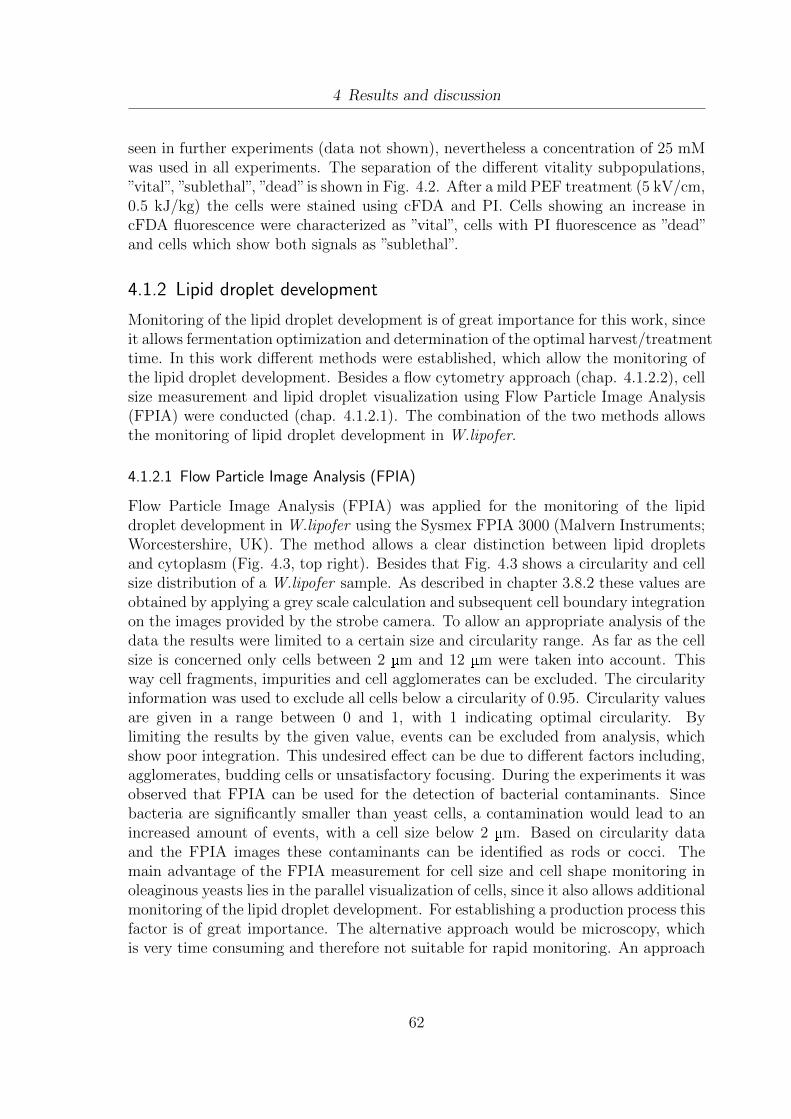
4 Results and discussion
seen in further experiments (data not shown), nevertheless a concentration of 25 mMwas used in all experiments. The separation of the different vitality subpopulations,”vital”, ”sublethal”, ”dead”is shown in Fig. 4.2. After a mild PEF treatment (5 kV/cm,0.5 kJ/kg) the cells were stained using cFDA and PI. Cells showing an increase incFDA fluorescence were characterized as ”vital”, cells with PI fluorescence as ”dead”and cells which show both signals as ”sublethal”.
4.1.2 Lipid droplet development
Monitoring of the lipid droplet development is of great importance for this work, sinceit allows fermentation optimization and determination of the optimal harvest/treatmenttime. In this work different methods were established, which allow the monitoring ofthe lipid droplet development. Besides a flow cytometry approach (chap. 4.1.2.2), cellsize measurement and lipid droplet visualization using Flow Particle Image Analysis(FPIA) were conducted (chap. 4.1.2.1). The combination of the two methods allowsthe monitoring of lipid droplet development in W.lipofer.
4.1.2.1 Flow Particle Image Analysis (FPIA)
Flow Particle Image Analysis (FPIA) was applied for the monitoring of the lipiddroplet development in W.lipofer using the Sysmex FPIA 3000 (Malvern Instruments;Worcestershire, UK). The method allows a clear distinction between lipid dropletsand cytoplasm (Fig. 4.3, top right). Besides that Fig. 4.3 shows a circularity and cellsize distribution of a W.lipofer sample. As described in chapter 3.8.2 these values areobtained by applying a grey scale calculation and subsequent cell boundary integrationon the images provided by the strobe camera. To allow an appropriate analysis of thedata the results were limited to a certain size and circularity range. As far as the cellsize is concerned only cells between 2 µm and 12 µm were taken into account. Thisway cell fragments, impurities and cell agglomerates can be excluded. The circularityinformation was used to exclude all cells below a circularity of 0.95. Circularity valuesare given in a range between 0 and 1, with 1 indicating optimal circularity. Bylimiting the results by the given value, events can be excluded from analysis, whichshow poor integration. This undesired effect can be due to different factors including,agglomerates, budding cells or unsatisfactory focusing. During the experiments it wasobserved that FPIA can be used for the detection of bacterial contaminants. Sincebacteria are significantly smaller than yeast cells, a contamination would lead to anincreased amount of events, with a cell size below 2 µm. Based on circularity dataand the FPIA images these contaminants can be identified as rods or cocci. Themain advantage of the FPIA measurement for cell size and cell shape monitoring inoleaginous yeasts lies in the parallel visualization of cells, since it also allows additionalmonitoring of the lipid droplet development. For establishing a production process thisfactor is of great importance. The alternative approach would be microscopy, whichis very time consuming and therefore not suitable for rapid monitoring. An approach
62
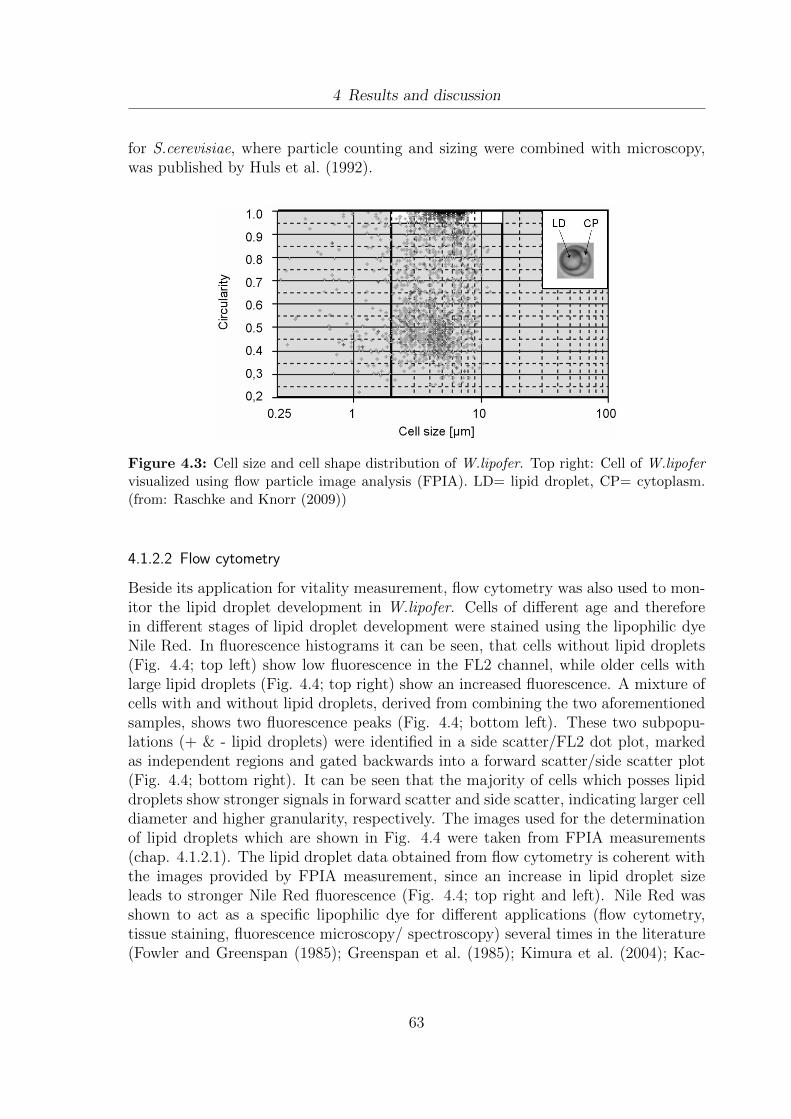
4 Results and discussion
for S.cerevisiae, where particle counting and sizing were combined with microscopy,was published by Huls et al. (1992).
Figure 4.3: Cell size and cell shape distribution of W.lipofer. Top right: Cell of W.lipofervisualized using flow particle image analysis (FPIA). LD= lipid droplet, CP= cytoplasm.(from: Raschke and Knorr (2009))
4.1.2.2 Flow cytometry
Beside its application for vitality measurement, flow cytometry was also used to mon-itor the lipid droplet development in W.lipofer. Cells of different age and thereforein different stages of lipid droplet development were stained using the lipophilic dyeNile Red. In fluorescence histograms it can be seen, that cells without lipid droplets(Fig. 4.4; top left) show low fluorescence in the FL2 channel, while older cells withlarge lipid droplets (Fig. 4.4; top right) show an increased fluorescence. A mixture ofcells with and without lipid droplets, derived from combining the two aforementionedsamples, shows two fluorescence peaks (Fig. 4.4; bottom left). These two subpopu-lations (+ & - lipid droplets) were identified in a side scatter/FL2 dot plot, markedas independent regions and gated backwards into a forward scatter/side scatter plot(Fig. 4.4; bottom right). It can be seen that the majority of cells which posses lipiddroplets show stronger signals in forward scatter and side scatter, indicating larger celldiameter and higher granularity, respectively. The images used for the determinationof lipid droplets which are shown in Fig. 4.4 were taken from FPIA measurements(chap. 4.1.2.1). The lipid droplet data obtained from flow cytometry is coherent withthe images provided by FPIA measurement, since an increase in lipid droplet sizeleads to stronger Nile Red fluorescence (Fig. 4.4; top right and left). Nile Red wasshown to act as a specific lipophilic dye for different applications (flow cytometry,tissue staining, fluorescence microscopy/ spectroscopy) several times in the literature(Fowler and Greenspan (1985); Greenspan et al. (1985); Kimura et al. (2004); Kac-
63
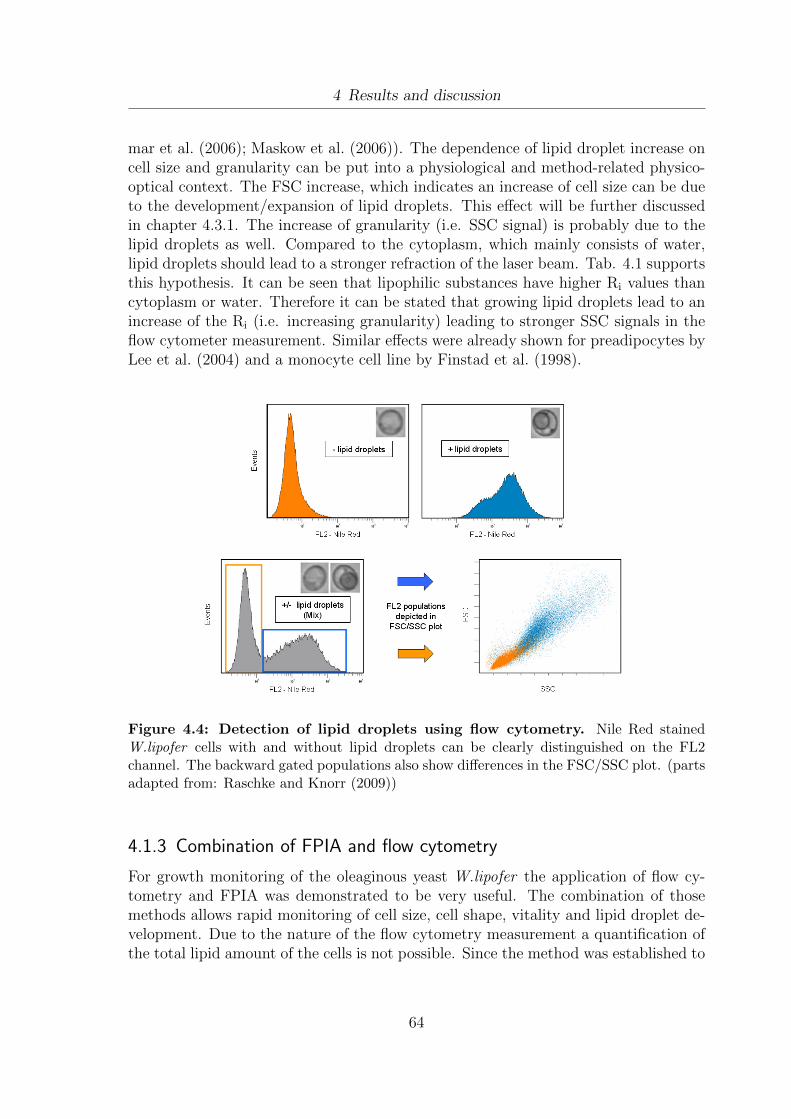
4 Results and discussion
mar et al. (2006); Maskow et al. (2006)). The dependence of lipid droplet increase oncell size and granularity can be put into a physiological and method-related physico-optical context. The FSC increase, which indicates an increase of cell size can be dueto the development/expansion of lipid droplets. This effect will be further discussedin chapter 4.3.1. The increase of granularity (i.e. SSC signal) is probably due to thelipid droplets as well. Compared to the cytoplasm, which mainly consists of water,lipid droplets should lead to a stronger refraction of the laser beam. Tab. 4.1 supportsthis hypothesis. It can be seen that lipophilic substances have higher Ri values thancytoplasm or water. Therefore it can be stated that growing lipid droplets lead to anincrease of the Ri (i.e. increasing granularity) leading to stronger SSC signals in theflow cytometer measurement. Similar effects were already shown for preadipocytes byLee et al. (2004) and a monocyte cell line by Finstad et al. (1998).
Figure 4.4: Detection of lipid droplets using flow cytometry. Nile Red stainedW.lipofer cells with and without lipid droplets can be clearly distinguished on the FL2channel. The backward gated populations also show differences in the FSC/SSC plot. (partsadapted from: Raschke and Knorr (2009))
4.1.3 Combination of FPIA and flow cytometry
For growth monitoring of the oleaginous yeast W.lipofer the application of flow cy-tometry and FPIA was demonstrated to be very useful. The combination of thosemethods allows rapid monitoring of cell size, cell shape, vitality and lipid droplet de-velopment. Due to the nature of the flow cytometry measurement a quantification ofthe total lipid amount of the cells is not possible. Since the method was established to
64

4 Results and discussion
allow rapid monitoring a time consuming chemical quantification was not conducted.By correlating the Nile Red fluorescence values at given growth stages with the corre-lating lipid content determined by chemical extraction, the preparation of a standardcurve seems possible. The optimization of a suitable chemical extraction method forthis approach is described in chapter 4.1.4.
Table 4.1: Refractive indeces (Ri) of different materials or cell types.
Material Wavelength Temperature Ri Reference
Water 488 nm 24 1.34 Ri database (2010)
Erythrocytes 514 nm 37 1.39 Park et al. (2008)
Lecithin 532 nm 25 1.49 Jin et al. (2006)
Olive oil 491 nm 25 1.48 Yunus et al. (2009)
Coconut oil 491 nm 25 1.46 Yunus et al. (2009)
65
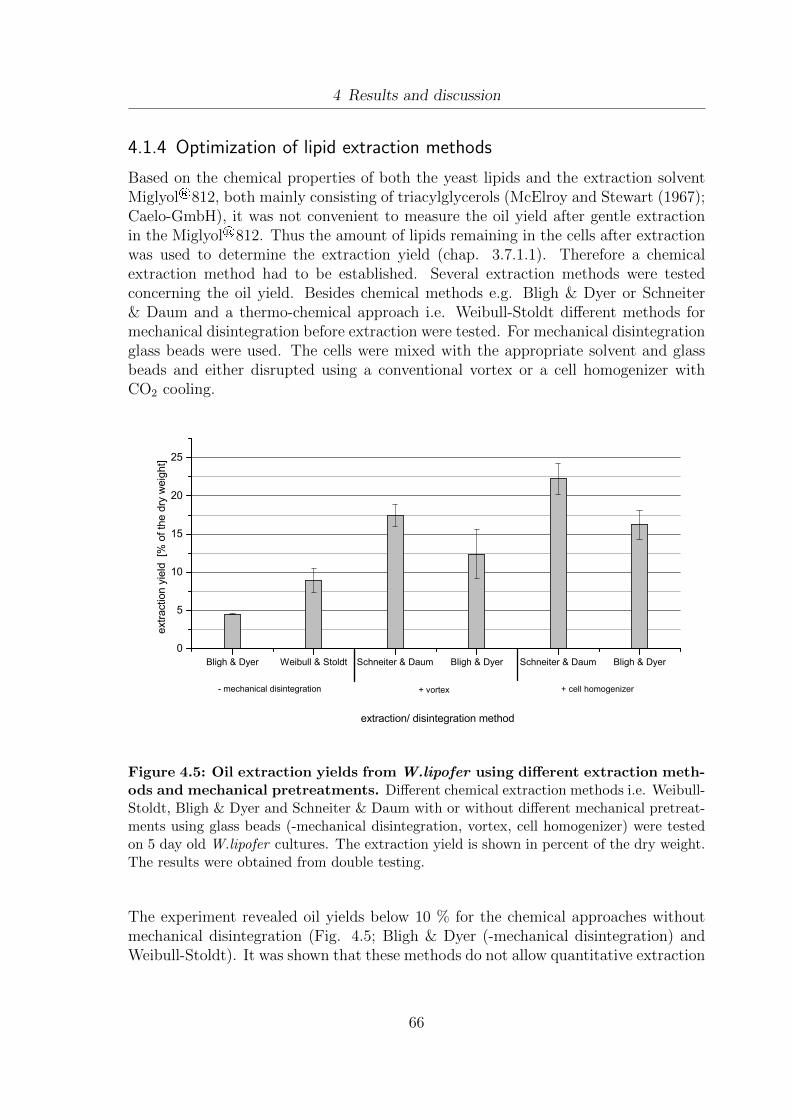
4 Results and discussion
4.1.4 Optimization of lipid extraction methods
Based on the chemical properties of both the yeast lipids and the extraction solventMiglyol®812, both mainly consisting of triacylglycerols (McElroy and Stewart (1967);Caelo-GmbH), it was not convenient to measure the oil yield after gentle extractionin the Miglyol®812. Thus the amount of lipids remaining in the cells after extractionwas used to determine the extraction yield (chap. 3.7.1.1). Therefore a chemicalextraction method had to be established. Several extraction methods were testedconcerning the oil yield. Besides chemical methods e.g. Bligh & Dyer or Schneiter& Daum and a thermo-chemical approach i.e. Weibull-Stoldt different methods formechanical disintegration before extraction were tested. For mechanical disintegrationglass beads were used. The cells were mixed with the appropriate solvent and glassbeads and either disrupted using a conventional vortex or a cell homogenizer withCO2 cooling.
B l i g h & D y e r W e i b u l l & S t o l d t S c h n e i t e r & D a u m B l i g h & D y e r S c h n e i t e r & D a u m B l i g h & D y e r0
5
1 0
1 5
2 0
2 5
e x t r a c t i o n / d i s i n t e g r a t i o n m e t h o d
+ c e l l h o m o g e n i z e r + v o r t e x
extra
ction y
ield [%
of th
e dry
weigh
t]
- m e c h a n i c a l d i s i n t e g r a t i o n
Figure 4.5: Oil extraction yields from W.lipofer using different extraction meth-ods and mechanical pretreatments. Different chemical extraction methods i.e. Weibull-Stoldt, Bligh & Dyer and Schneiter & Daum with or without different mechanical pretreat-ments using glass beads (-mechanical disintegration, vortex, cell homogenizer) were testedon 5 day old W.lipofer cultures. The extraction yield is shown in percent of the dry weight.The results were obtained from double testing.
The experiment revealed oil yields below 10 % for the chemical approaches withoutmechanical disintegration (Fig. 4.5; Bligh & Dyer (-mechanical disintegration) andWeibull-Stoldt). It was shown that these methods do not allow quantitative extraction
66
4 Results and discussion
of lipids from yeast. Even though the method according to Weibull-Stoldt as describedby Matissek and Steiner (2008), is a standard method in food chemistry, it appearsnot to be suitable for yeast cells. The chemical disintegration step using 12.5 % HCland a temperature of 100 , could have been insufficient for an entire disintegration ofthe yeast cell wall. The rigidity of this structure will be further discussed in the nextsection. For the mechanical disrupted samples it was shown that higher oil yields weregained when the cells were treated using the cell homogenizer (Fig. 4.5). Generally theextraction method after Schneiter & Daum showed with 17.4 % (vortex) and 22.2 %(cell homogenizer) the highest extraction yields. The yields obtained with the modifiedmethod after Bligh & Dyer where somewhat lower. From vortexed samples 12.4 % ofoil were extracted, while 16.2 % were obtained from the samples which were treatedusing the cell homogenizer. In general the obtained extraction yields are lower thanthe maximum values described in the literature. According to Ratledge (1985) andStarkey (1946) some oleaginous yeasts, including W.lipofer (named Lipomyces lipoferin Ratledge (1985)) can store up to 60-70 % of lipids of their dry weight. This differencemight be due to either incomplete extraction or to a lower lipid content compared tothat described in the literature. Most likely both factors play a role. Anyhow thiseffect is not significant for this approach. As long as the samples are comparableamongst each other this approach is suitable for the determination of the extractionyield (chap. 3.7.1.1), since the reference samples, which are used for the determinationof the total lipid content, undergo the same extraction. Therefore the extraction yieldcan be presented in percent of total extractable lipids. The differences in the yieldthat were shown are based on the varying mechanical disintegration methods as wellas on the chosen extraction method. Both factors will be addressed.
Influence of the mechanical disintegration
As far as the mechanical disintegration is concerned it is evident that the applica-tion of the cell homogenizer led to the best results. This can be seen, when thesamples obtained from Bligh & Dyer extraction for untreated, vortexed and homog-enized samples (4.5 %, 12.4 % and 16.2 %) are compared. The need for mechanicaldisintegration can be explained, when the yeast physiology is taken into account. ForS.cerevisiae the structure and composition of the cell wall has been thoroughly re-viewed (Lipke and Ovalle (1998)). The main constituents of the cell wall were shownto be β(1,3) and β(1,6) glucan, mannoproteins and sometimes chitin. Chitin occursin many yeasts, even though mostly in small amounts (Roelofsen and Hoette (1951)).Analysis of cell wall carbohydrate profiles of various members of the Lipomycetaceaefamily, including W.lipofer, revealed glucose, mannose, galactose, and glucoronic acidas the main components (Weijman and van der Walt (1989)). These components arestrongly crosslinked within the membrane (Lipke and Ovalle (1998)). The crosslink-ing of β(1,6)- glucan, mannoproteins, β(1,3) and chitin in S.cerevisiae were describedby Kollar et al. (1997). This leads to a compact structure, which contributes 15 to
67
4 Results and discussion
30 % of the cell dry weight (Orlean (1997)). The need for mechanical disintegration issupported by the literature. Many methods concerning the extraction of organelles ormetabolites from yeast describe those pretreatments (Kaneko et al. (1976); Qualmann(2003); Schneiter and Daum (2006a); Clausen et al. (1974)).
Influence of the extraction method
The influence of the extraction method can be demonstrated when samples are com-pared, which underwent the same mechanical pretreatment. It can be seen that themethod of Schneiter and Daum (2006a) led to better results than the method modifiedafter Bligh and Dyer (1959). Lamackaa et al. (1998) describes the method of Blighand Dyer (1959) and Folch et al. (1957), which was not tested in this work, as notsuitable for the quantitative lipid extraction from S.cerevisiae, since it does not allowextraction of lipids that are bound to the cell envelope. Opposed to that are differentworks using the method of Bligh & Dyer for the extraction of phospholipids, whichmainly occur in parts of the cell envelope, from yeast and bacteria (Serrano et al.(1988); Jenkins et al. (1997); Raschke (2006)). Anyhow, supposing a poor extractionof envelope-bound lipids the difference in the extraction yields observed for Bligh &Dyer compared to Schneiter & Daum (Fig. 4.5) of 5.1 % for vortexed and 6.0 %for homogenized samples, can not be fully explained. Since Blagovic et al. (2001)reported a total lipid content for S.cerevisiae, which contains only very small lipiddroplets, of 4.4 % of the dry weight (incl. 58 % neutral lipids), it can be assumedthat the contribution of envelope-bound lipids to the total dry weight will be ≈ 2-3 %.An additional fact that might explain the better yield using the Schneiter & Daumapproach, might be based on the methodology. While Bligh & Dyer uses a ratio ofchloroform:methanol of 1:2, Schneiter & Daum use 2:1. The increased amount of chlo-roform might enhance the extraction of lipophilic substances.
As far as the applicability for extraction analysis is concerned, the method of Bligh& Dyer was chosen for further experiments, since it was less time consuming. For thecalculation of the extraction yield (chap. 3.7.1.1) it is sufficient, that the results arecomparable amongst each other, since all treated samples were compared with the oilyield of an untreated sample of the same experiment.
68

4 Results and discussion
4.2 Media optimization
For being able to establish the lipid extraction process for the oleaginous yeast W.lipofer,it is important to find a suitable growth medium. The main characteristics of a desiredmedium are fast growth, i.e. low doubling times (td) and high maximum optical den-sity (ODmax), as well as sufficient lipid accumulation to test the extraction methods.The different media YED (yeast extract, dextrose (i.e. glucose)), YEG (Yeast ex-tract, glycerol), and WP (whey permeate) were tested. YED resembles a standardmedium for the cultivation of yeast cells. The application of glycerol and whey per-meate was conducted since both substances accrue in industrial processes and aretherefore cheaper than glucose and therefor of interest as far as industrial applicationsare concerned. Moreover, both glycerol and whey permeate were already successfullyapplied for oleaginous yeasts. Ykema et al. (1988) demonstrated the advantages ofwhey permeate for the cultivation of Apiotrichium curvatum, while Papanikolaou andAggelis (2002) reported good growth characteristics for Yarrowia lipolytica in glycerol.
Figure 4.6: Test of different growth media concerning maximum optical density(ODmax), minimal doubling time (td), lipid accumulation as well as cell shapeand cell structure. Cells were grown in different media over a period of 7 days. ODmax
and td were determined based on the growth curve. The images were provided by FPIAmeasurement. The results shown are derived from double testing.
69

4 Results and discussion
As far as the growth speed is concerned, YED and WP showed comparable growthcharacteristics, with td values of 9.0 and 10.1, respectively. For YEG medium W.lipofershowed the slowest growth, with a minimal td of 15.5. Additionally YEG led to a poorODmax of 2.1. This value was significantly higher in YED (ODmax=18.6) and WP(ODmax=30). The amount of carbon in the YED and YEG media was comparable.The high ODmax for WP is likely due to a high lactose concentration, which was notmeasured. By comparing the FPIA images (Fig. 4.6) it can be seen that only YEDmedium and the whey permeate (WP) allow good lipid droplet development. Thedamaged inner structure, which can be seen for YEG medium might be due to thelow ODmax value. Since all the cells were measured after 7 days of growth it is verylikely, that cells which are growth limited due to e.g. insufficient media composition,are already dead. The poor growth in YEG medium is probably due to the chosen car-bon source (i.e. glycerol). The ability of utilizing glycerol is not present in all speciesof the genus Lipomyces (Smith et al. (1995); NCYC), which includes W.lipofer. Thedata about glycerol is not published for the specific strain used (i.e. Li301), anyhowthe results suggest its incapability of glycerol utilization.These results suggest YED and WP as appropriate media for W.lipofer. For furtherexperiments YED was chosen based on considerations concerning the PEF treatment.With increasing electrical conductivity of the medium the effectivity of the PEF treat-ment diminishes. The higher the conductivity gets, the stronger is the electrical cur-rent between the two electrodes of the treatment chamber. This leads to a fasterbreakdown of the electric field and thereby weakens the PEF effect. YED was there-fore chosen as treatment media since its conductivity of 0,96 mS/cm lies somewhatlower than the conductivity measured for whey permeate (i.e. milk ultra filtrate) of 5- 5.1 mS/cm by Jenness and Koops (1962).
70
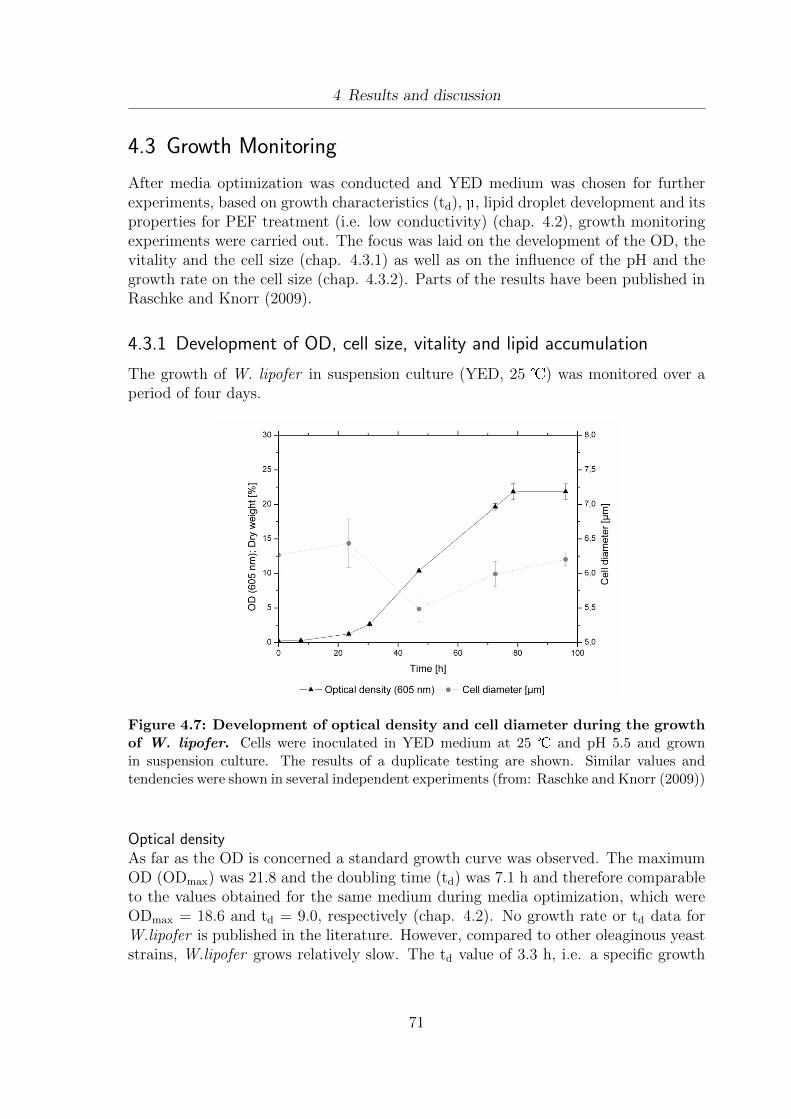
4 Results and discussion
4.3 Growth Monitoring
After media optimization was conducted and YED medium was chosen for furtherexperiments, based on growth characteristics (td), µ, lipid droplet development and itsproperties for PEF treatment (i.e. low conductivity) (chap. 4.2), growth monitoringexperiments were carried out. The focus was laid on the development of the OD, thevitality and the cell size (chap. 4.3.1) as well as on the influence of the pH and thegrowth rate on the cell size (chap. 4.3.2). Parts of the results have been published inRaschke and Knorr (2009).
4.3.1 Development of OD, cell size, vitality and lipid accumulation
The growth of W. lipofer in suspension culture (YED, 25 ) was monitored over aperiod of four days.
Figure 4.7: Development of optical density and cell diameter during the growthof W. lipofer. Cells were inoculated in YED medium at 25 and pH 5.5 and grownin suspension culture. The results of a duplicate testing are shown. Similar values andtendencies were shown in several independent experiments (from: Raschke and Knorr (2009))
Optical densityAs far as the OD is concerned a standard growth curve was observed. The maximumOD (ODmax) was 21.8 and the doubling time (td) was 7.1 h and therefore comparableto the values obtained for the same medium during media optimization, which wereODmax = 18.6 and td = 9.0, respectively (chap. 4.2). No growth rate or td data forW.lipofer is published in the literature. However, compared to other oleaginous yeaststrains, W.lipofer grows relatively slow. The td value of 3.3 h, i.e. a specific growth
71

4 Results and discussion
rate of 0.21 h-1, demonstrated for the oleaginous yeast Y.lipolytica was significantlylower (Papanikolaou and Aggelis (2002)) for growth in glycerol. Li et al. (2007) showedtd values between 5.1 h and 5.8 h for the oleaginous yeast Rhodosporidium toruloidesfor different glucose concentrations.
VitalityThe results of the vitality measurement during the growth experiment in suspensionculture are shown in Fig 4.8. Throughout the entire growth curve the vitality wasconstantly high just showing a slight decrease from 97.8 % (0 h) to 96.5 % (96 h).This decrease might be due to several factors including stress based on increasingcell density, accumulation of metabolites in the medium, pH changes or starvationconditions due to depletion of the carbon source or other nutrients. In comparableexperiments the same trend was seen, however, with varying vitalities.
Figure 4.8: Development of vitality during the growth of W. lipofer. The fractionsof ”vital” cells, ”dead” cells, and ”sublethal” cells are given in percent. It can be seen that thevitality was constantly high, but slowly decreasing during the course of the experiment. The”dead” and ”sublethal” fractions were always below 2 % (from: Raschke and Knorr (2009)).The results of a duplicate testing are shown. Similar tendencies were shown in independentexperiments.
Cell sizeThe development of the cell size was measured throughout the entire growth experi-ment (Fig. 4.7). The error bars indicate the standard deviation between parallel testsand not between the different cells of one sample. In the latter case the standarddeviations would be much bigger (around 1 - 1.2 µm (data not shown)) due to cellpopulation heterogeneity. This variation can be seen in the aforementioned cell size
72
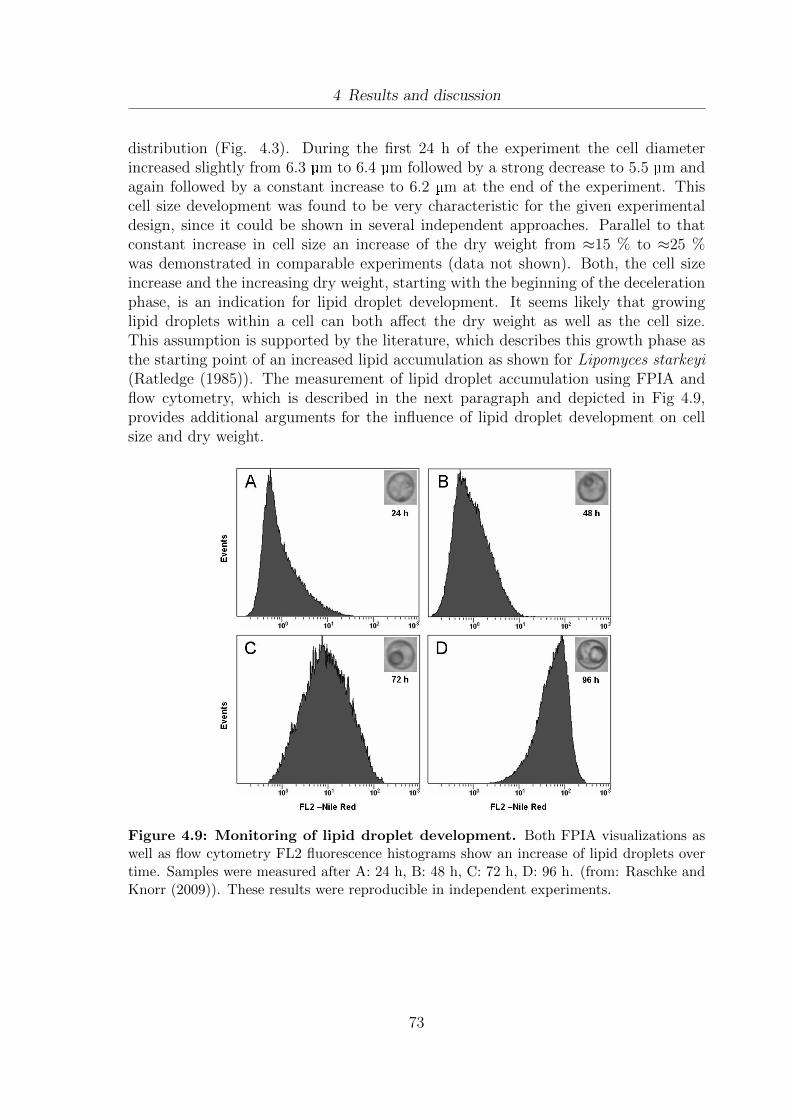
4 Results and discussion
distribution (Fig. 4.3). During the first 24 h of the experiment the cell diameterincreased slightly from 6.3 µm to 6.4 µm followed by a strong decrease to 5.5 µm andagain followed by a constant increase to 6.2 µm at the end of the experiment. Thiscell size development was found to be very characteristic for the given experimentaldesign, since it could be shown in several independent approaches. Parallel to thatconstant increase in cell size an increase of the dry weight from ≈15 % to ≈25 %was demonstrated in comparable experiments (data not shown). Both, the cell sizeincrease and the increasing dry weight, starting with the beginning of the decelerationphase, is an indication for lipid droplet development. It seems likely that growinglipid droplets within a cell can both affect the dry weight as well as the cell size.This assumption is supported by the literature, which describes this growth phase asthe starting point of an increased lipid accumulation as shown for Lipomyces starkeyi(Ratledge (1985)). The measurement of lipid droplet accumulation using FPIA andflow cytometry, which is described in the next paragraph and depicted in Fig 4.9,provides additional arguments for the influence of lipid droplet development on cellsize and dry weight.
Figure 4.9: Monitoring of lipid droplet development. Both FPIA visualizations aswell as flow cytometry FL2 fluorescence histograms show an increase of lipid droplets overtime. Samples were measured after A: 24 h, B: 48 h, C: 72 h, D: 96 h. (from: Raschke andKnorr (2009)). These results were reproducible in independent experiments.
73

4 Results and discussion
Lipid accumulationBoth FPIA and flow cytometry were used to visualize and measure the developmentof lipid droplets during growth of W.lipofer (Fig. 4.9). Typical FPIA images foreach growth phase had to be chosen, since cell size and shape variations occur, whichare due to a certain natural cell population heterogeneity. Throughout the entire ex-periment a lipid droplet increase over time can be seen. On the one hand it can bevisualized using the images provided by FPIA measurement. On the other hand thislipid droplet increase is reflected in the shift of the Nile Red peak from low fluores-cence 100 after 24 h and 48 h to higher fluorescence 101 and 102 for 72 h and 96 h,respectively. The use of Nile Red as a fluorescent dye, which is specific for lipophilicsubstances, was reported in the literature several times (Fowler and Greenspan (1985);Greenspan et al. (1985); Kimura et al. (2004); Kacmar et al. (2006); Maskow et al.(2006)).
Based on the conducted growth experiment in suspension culture it can be statedthat the cell size might be a good indicator for the detection of lipid droplet devel-opment. Nevertheless the cell size itself is influenced by other parameters as well.Tyson et al. (1979) demonstrated the influence of the growth phase on the cell size inS.cerevisiae, while results obtained in this work show a connection between cell sizeand pH as well as an influence of the specific growth rate (µ), which will be presentedin the following chapter (chap. 4.3.2)
4.3.2 Influence of pH and growth rate on the cell size
Based on the finding that the cell size can be a suitable indicator for lipid dropletdevelopment, other potential factors influencing the cell size had to be determined.Based on literature and observations from pre-experiments, the focus was laid on themedia pH (chap. 4.3.2.1) and the specific growth rate (chap. 4.3.2.2).
4.3.2.1 pH influence
The influence of the media pH on cell size was chosen for further investigation, basedon observations made in fermentation experiments, which were subjected to pH con-trol. The typical cell size development which was observed in suspension culture(Fig. 4.7) could not be seen in those fermentations. Therefore two parallel fermen-tation experiments were set up. Both fermentations were started with an initial pHof 5.5. One fermentation was conducted with pH control, the other one without.Throughout the whole experiment the OD, the media pH and the cell size were mea-sured (Fig. 4.10). The OD values shown are lower than those shown for suspensionculture experiments (Fig. 4.7), since they were derived directly from the on line mea-surement of the fermenter and are therefore not diluted. The real OD of suspensionculture and fermentation experiments is comparable. The pH curve of the fermenterwith pH control was constant, while the pH in the fermenter without pH control de-
74
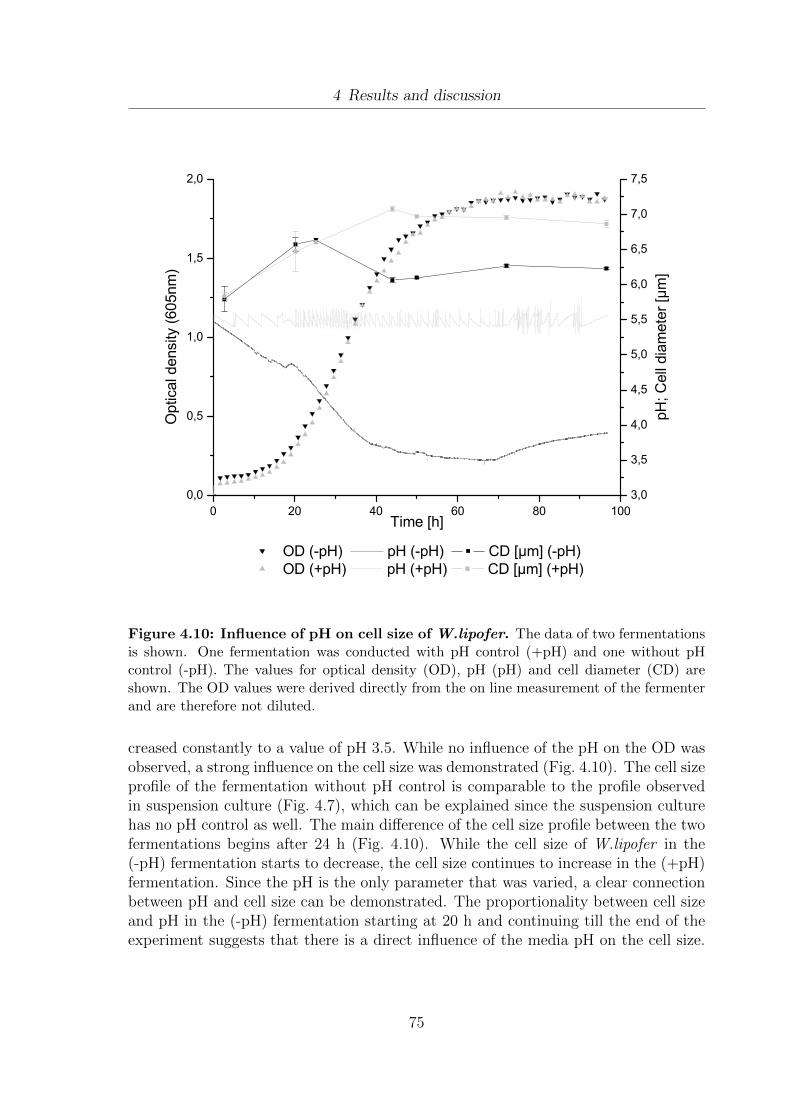
4 Results and discussion
0 2 0 4 0 6 0 8 0 1 0 00 , 0
0 , 5
1 , 0
1 , 5
2 , 0
3 , 0
3 , 5
4 , 0
4 , 5
5 , 0
5 , 5
6 , 0
6 , 5
7 , 0
7 , 5
Figure 4.10: Influence of pH on cell size of W.lipofer. The data of two fermentationsis shown. One fermentation was conducted with pH control (+pH) and one without pHcontrol (-pH). The values for optical density (OD), pH (pH) and cell diameter (CD) areshown. The OD values were derived directly from the on line measurement of the fermenterand are therefore not diluted.
creased constantly to a value of pH 3.5. While no influence of the pH on the OD wasobserved, a strong influence on the cell size was demonstrated (Fig. 4.10). The cell sizeprofile of the fermentation without pH control is comparable to the profile observedin suspension culture (Fig. 4.7), which can be explained since the suspension culturehas no pH control as well. The main difference of the cell size profile between the twofermentations begins after 24 h (Fig. 4.10). While the cell size of W.lipofer in the(-pH) fermentation starts to decrease, the cell size continues to increase in the (+pH)fermentation. Since the pH is the only parameter that was varied, a clear connectionbetween pH and cell size can be demonstrated. The proportionality between cell sizeand pH in the (-pH) fermentation starting at 20 h and continuing till the end of theexperiment suggests that there is a direct influence of the media pH on the cell size.
75
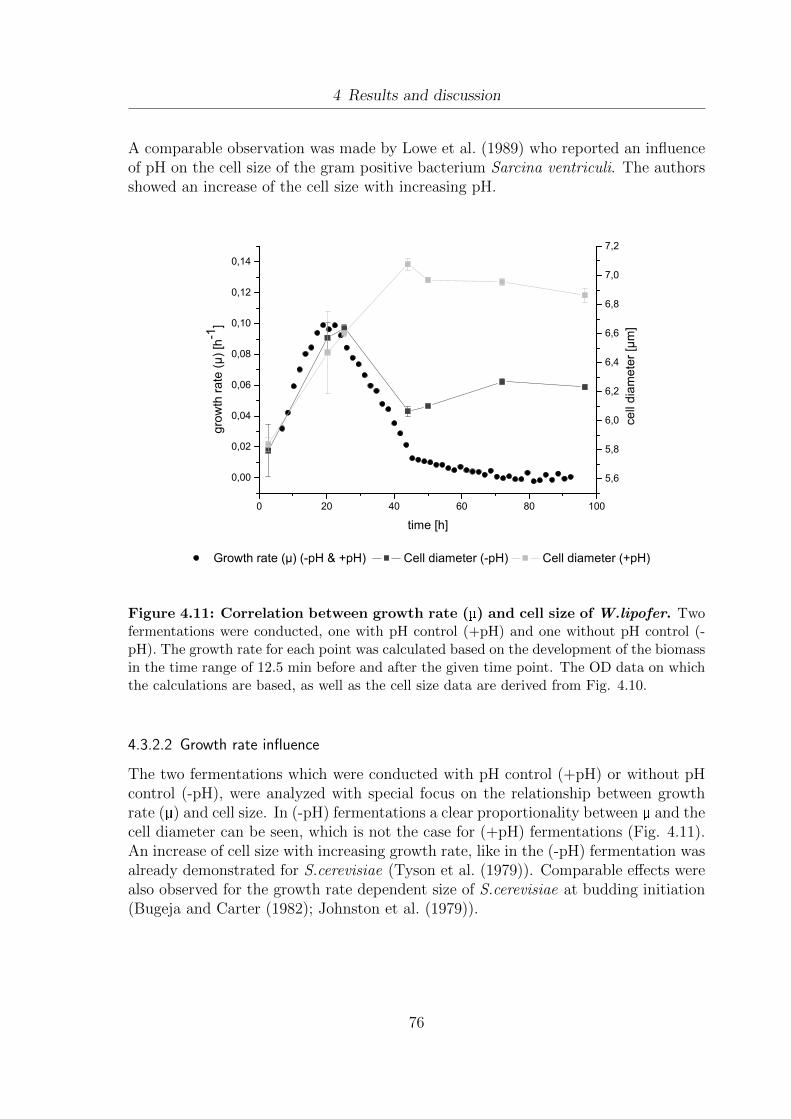
4 Results and discussion
A comparable observation was made by Lowe et al. (1989) who reported an influenceof pH on the cell size of the gram positive bacterium Sarcina ventriculi. The authorsshowed an increase of the cell size with increasing pH.
0 2 0 4 0 6 0 8 0 1 0 0
0 , 0 0
0 , 0 2
0 , 0 4
0 , 0 6
0 , 0 8
0 , 1 0
0 , 1 2
0 , 1 4
5 , 6
5 , 8
6 , 0
6 , 2
6 , 4
6 , 6
6 , 8
7 , 0
7 , 2
Figure 4.11: Correlation between growth rate (µ) and cell size of W.lipofer. Twofermentations were conducted, one with pH control (+pH) and one without pH control (-pH). The growth rate for each point was calculated based on the development of the biomassin the time range of 12.5 min before and after the given time point. The OD data on whichthe calculations are based, as well as the cell size data are derived from Fig. 4.10.
4.3.2.2 Growth rate influence
The two fermentations which were conducted with pH control (+pH) or without pHcontrol (-pH), were analyzed with special focus on the relationship between growthrate (µ) and cell size. In (-pH) fermentations a clear proportionality between µ and thecell diameter can be seen, which is not the case for (+pH) fermentations (Fig. 4.11).An increase of cell size with increasing growth rate, like in the (-pH) fermentation wasalready demonstrated for S.cerevisiae (Tyson et al. (1979)). Comparable effects werealso observed for the growth rate dependent size of S.cerevisiae at budding initiation(Bugeja and Carter (1982); Johnston et al. (1979)).
76

4 Results and discussion
4.3.2.3 Influence of lipid droplet development on growth characteristics
Based on the obtained results a scheme can be proposed which shows different factorsbeing influenced by the lipid droplet development in W.lipofer (Fig. 4.12). It can bestated that the lipid droplet development has an influence on the dry weight, as wellas on the cell size, while the cell size itself is influenced by other factors includingmedia pH and growth rate. These findings are important for the optimization of afermentation process, which focuses on lipid droplet development and provides a basisfor further investigations. The combination of these results demonstrates that the cellsize and dry weight data can be a suitable indicator for lipid droplet development inW.lipofer under these growth conditions. However, additional measurements usingFPIA and flow cytometry are suggested.
Figure 4.12: Proposed scheme for the correlation between dry weight, pH, cell size andlipid droplet development. The lipid droplet development influences the cell size and thedry weight, while the cell size is influenced by the growth rate and the medium pH.
77

4 Results and discussion
4.4 Influence of PEF on physiology
This section deals with the influence of PEF treatment on various physiological pa-rameters, which are of interest for the desired extraction process in terms of lipidextractability, process design and/or product quality. The chosen parameters werestructural integrity, cell size, vitality and the fatty acid pattern. Their impact onthe applicability of the entire extraction process will be discussed in the followingsubsections.
4.4.1 Influence of PEF on the structural integrity
The structural integrity is of great importance for the design of an extraction process,since it is a first clearly visible indicator for the effectivity of the PEF treatment. Dueto its size and its clearly visible lipid droplets W.lipofer is an appropriate model for thevisualization of this influence. Fig. 4.13 shows both untreated (top) and PEF treated(bottom) W.lipofer cells. The conditions chosen for the PEF treatment in batch modewere an electric field strength of 25kV/cm and a total energy input of 10 kJ/kg. As faras the untreated cells are concerned the lipid droplets can be clearly distinguished fromthe cell cytoplasm. After PEF treatment the cells loose their structural integrity. Theinfluence of PEF on the structural integrity of biological material and its visualizationhas been described in the literature several times. Lebovka et al. (2001) demonstratedthe impact of PEF on the structural integrity of apple tissue. Janositz (2005) showeda reduction of the cutting resistance of potato tissue after PEF treatment, which canbe seen as an indirect indicator for the loss of the structural integrity. As far as theimpact of PEF on oleaginous yeasts is concerned no comparable approach was foundin the literature.
Figure 4.13: Influence of PEF treatment on the structural integrity of W.lipofer.The cells were measured using Flow Particle Image Analysis (FPIA). Both untreated (top)and PEF-treated cells (bottom) are shown. The conditions used for the batch treatmentwere 25kV/cm and 10 kJ/kg.
78

4 Results and discussion
By using fluorescence microscopy it could be demonstrated that PEF treatment leadsto a distribution of lipophilic substances over the entire cell (Fig. 4.14). The lipophilicfluorescent dye Nile Red was used to stain both PEF-treated and untreated cells. Thedye leads to a selective staining of lipid droplets , which can be seen in untreatedcells. In treated cells the entire cell is stained. The light-red ring, which can be seenin the PEF treated cells (Fig. 4.14 B) is an artifact from bright field microscopy andis therefore due to the methodology.
Figure 4.14: Fluorescence microscopy images of untreated and PEF-treated NileRed stained W.lipofer cells. Using fluorescence microscopy cells of W.lipofer were visu-alize after Nile Red staining. The cells were (A) untreated or (B) PEF-treated at 25 kV/cmand 10 kJ/kg.
The fluorescence of the entire cell that was demonstrated for PEF treatment (Fig.4.14) can be due to either a mixture of water and oil within the cell or to a loss ofwater from the cell. Both options would lead to an entirely stained cell. The firstoption seems unlikely, since PEF treatment needs a lipid bilayer and a membrane po-tential to work. Czabany et al. (2007) compared the structure of lipid droplets in theyeast S.cerevisiae to mammalian lipoproteins as described in Kostner and Laggner(1989). Lipid droplets are surrounded by a phospholipid monolayer and thereforeno trans membrane potential exists and therefore a direct effect of PEF on the lipiddroplets can not be expected. Toepfl et al. (2007) demonstrated a negative effect ofinsulating particles on the effectivity of the PEF treatment. Since lipid droplets re-semble insulating particles an effect of PEF treatment is not likely. The most probableexplanation seems to be that the permeabilization of the cell leads to a loss of theturgor pressure and a release of hydrophilic molecules and water into the surroundingmedium. This can be possible since the turgor pressure in yeast cells, as demonstrated
79
4 Results and discussion
for S.cerevisiae, was shown to lie between 0.5 and 1.5 mP (i.e. 5-15 bar) as summa-rized by Gervais et al. (1996). This loss of pressure combined with a certain flexibilityof the yeast cell wall (Morris et al. (1986); de Maranon et al. (1996); Klis et al. (2002))would lead to a reduction of cell size. The determination of the relationship betweencell size and PEF treatment will be discussed in the next section (chap. 4.4.2).
4.4.2 Influence of PEF on cell size and vitality
The influence of PEF treatment on the cell size was tested, since the results obtainedin the last section suggest a decrease of the cell size due to a permeabilization-inducedloss of turgor pressure. By applying various treatment conditions it was tested if, andto what extend, this proposed cell size reduction takes place. Additionally the vitalitywas tested for each condition to determine, whether there is a possible correlationbetween cell size reduction and vitality.
To determine the influence of PEF on the cell size and the vitality of W.lipofer, 6day old cultures were subjected to various treatment conditions. The electric fieldstrength was varied using 2, 3.75 and 25 kV/cm applying energy inputs of 0-6, 0-15and 0-100 kJ/kg, respectively. Since the energy per pulse (Wpulse, [J/pulse]) is de-pendent on the applied voltage (chap. 2.4.3.3) the maximum energy inputs used at2 kV/cm and 3.75 kV/cm were limited to avoid long treatment times. The resultsare depicted in Fig. 4.15. The vital fractions were determined using flow cytometryafter double staining with the two fluorescent stains cFDA and PI. The vital fractionis shown in percent of total cells. The cell size was determined using FPIA. The cellsize of the treated samples were compared to the untreated samples (i.e. 0 kJ/kg)which were set to 100 %.
As far as the treatment with 2 kV/cm is concerned (Fig. 4.15 (left)) it can be seenthat the cell diameter as well as the vitality do not change with increasing energyinput. The vitality was always between 84.4 % and 87.3 %, while the cell size wasalways between 99.4 % and 100.3 % of the size of the untreated sample (i.e. 0 kJ/kg).The treatment at an electric field strength of 3.75 kV/cm (Fig. 4.15 (middle)) showsboth a decreasing vitality (88.9 % to 42.7 %) and a decreasing cell size, down to91.5 % of the untreated sample, as soon as the energy input is increased from 0 to15 kJ/kg. The cells treated at 25 kV/cm (Fig. 4.15 (right)) show a strong decreaseof both cell size (100 % to 91.3 %) and vitality (71.2 % to 0.25 %) when untreatedcells (0 kJ/kg) and cells treated at the lowest energy input (1 kJ/kg) are compared.As soon as higher energy inputs (2-100 kJ/kg) are applied, no significant change ortendency in terms of vitality and cell size can be seen compared to the 1 kJ/kg sample.In those samples the measured values only vary slightly from 90.3 % to 91.3 % for cellsize and 0.1 % to 1.1 % for vitaliy. In general it can be stated that above a certainelectric field strength an influence of PEF treatment on the vitality and the cell size
80

4 Results and discussion
Figure 4.15: Influence of different PEF treatment conditions (2, 3.75 and 25 kV/cm) onthe cell size and the vitality of 6 day old W.lipofer cells. The figure shows the influence ofdifferent energy inputs at a given field strength on the cell size and vitality of W.lipofer. Cellswere treated in batch mode using electroporation cuvettes (d= 0.4 cm). Different energyinputs were generated by varying the pulse number. The vital fractions were determinedusing flow cytometry after cFDA/PI double staining. The values are given in percent of totalcells. The cell sizes were determined using FPIA. The cell size of the treated samples werecompared to the according untreated samples (i.e. 0 kJ/kg) which were set to 100 %. Thedata is derived from duplicate testing. Similar tendencies were also shown in comparableexperiments.
can be seen. The loss of vitality due to PEF induced cell permeabilization is wellknown, and was already shown for several microorganisms (Hulsheger et al. (1983);Heinz et al. (1999); Jeyamkondan et al. (1999); Ulmer et al. (2002); Lado and Yousef(2003); Toepfl (2006); Zakhem et al. (2006a)). A strong decrease of the cell size dueto PEF treatment was already demonstrated for protoplasts derived from Nicotianatabacum plant cell cultures (Janositz, TU Berlin, data not published).
The results show a strong correlation between PEF treatment intensity, vitality andcell size, which can be seen best when the treatment is conducted at moderate con-ditions like 3.75 kV/cm (Fig. 4.15 (middle)). In this range the reduction of vitalityand cell size is proportional to the applied energy input. As soon as higher conditionsare used (i.e. 25 kV/cm; Fig. 4.15 (right)) even the lowest energy input leads tomaximum reduction of vitality and cell size. At lower conditions (i.e. 2 kV/cm; Fig.4.15 (left)) an increase in the energy input does not show a noticeable effect.
81
4 Results and discussion
Based on these findings depicted in Fig. 4.15 it can be stated that the critical elec-tric field strength for W.lipofer lies between 2 kV/cm and 3.75 kV/cm. This is inagreement with the values described in the literature for other yeast strains. Toepfl(2006) calculated the critical field strength for S.cerevisiae to lie between 2-4 kV/cmdepending on cell orientation, while for Candida albicans a critical field strength of5 kV/cm was shown (Hulsheger et al. (1983)). It was also demonstrated, that theelectrical field strength resembles the main factor for inactivation and cell size reduc-tion. Above and below a certain electric field strength range an increase of the totalenergy input does not increase inactivation. However, in this certain range a strongproportionality between total energy input and inactivation/ cell size reduction canbe seen.
4.4.2.1 Indications, potential reasons and limitations for cell size reduction
Based on the findings demonstrated in the section above, the potential reasons andlimitations for the observed cell size reduction will be discussed. It is likely that thecell size reduction is due to a loss of turgor pressure.
Due to cell size development, which can be seen in (Fig. 4.15 (right)) it can be ex-pected that a PEF-induced cell size reduction to ≈ 91 % compared to the untreatedsample resembles the maximal decrease possible for W.lipofer cells. This hypothesisis supported when cell size and vitality data are compared. Even the lowest energyinput applied (1 kJ/kg) at the highest electric field strength (25 kV/cm) already leadsto nearly complete inactivation of the cells (Fig. 4.15 (right)). This can be comparedto the data, summarized and published by Heinz et al. (2001), showing a 2 log-cycleinactivation of S.cerevisiae at 10 kJ/kg and 25 kV/cm. This low vitality is an in-dicator for an entire permeabilization, which leads to a loss of turgor pressure. Dueto a certain flexibility of the yeast cell wall, as shown for S.cerevisiae (Morris et al.(1986); de Maranon et al. (1996); Klis et al. (2002)), this loss of pressure can lead toa reduction of the cell size. Thus it can be assumed that no further cell size reductionwill occur as soon as the cells are entirely permeabilized. The limitation of the cell sizereduction to a certain value (i.e. ≈ 91 %) can be explained by the limited flexibilityof the cell wall and other stabilizing structures like the cytoskeleton. The severe effectof the PEF treatment on the cell, which is reflected in the vitality measurement, canalso be seen when the total loss of cell content is calculated. Assuming the yeast cellsto be exactly spherical this 9% reduction of the cell diameter means a reduction ofthe cell volume by 24.6 %.
4.4.2.2 Influence of the culture age on PEF treatment efficiency
Since the literature indicates an influence of the culture age on the efficiency of thePEF treatment (Hulsheger et al. (1983); Lado and Yousef (2003)), further experi-ments were conducted. It was tested whether older cells show an increased resistance
82
4 Results and discussion
to PEF treatment. Based on the results depicted in Fig. 4.15 (middle) (i.e. 6 dayold cultures), 3.75 kV/cm was chosen as an ideal electric field strength for furthertests, since a continuously decreasing vitality with increasing energy input could bedemonstrated. Therefore the experimental design was extended and these conditionswere also tested for W.lipofer cells of different age (i.e. 3, 4, 5 and 6 days).
Fig. 4.16 shows the vital fraction [%] of 3, 4, 5 and 6 day old W.lipofer culturesafter various energy inputs at a constant electric field strength of 3.75 kV/cm. With-out respect to the culture age it can be seen that an increasing energy input leads tolower vitalities. While the vitality values of the untreated samples (i.e. 0 kJ/kg) laybetween 88.1 % and 93.15 % a decrease to values between 35.05 % and 43.65 % of thehighest energy input used (i.e. 15 kJ/kg) was demonstrated. With increasing cultureage an increase of the remaining vitality after PEF treatment was shown for nearlyall energy inputs (i.e. 1-15 kJ/kg). Even though there are few exceptions a generaltrend can be seen which reveals older cells as more resistant to PEF treatment.
Influence of the cell size There are many factors changing with increasing age, whichcan have an influence on the efficiency of the PEF treatment. Interestingly, takingthe already demonstrated increasing cell size over time (chap. 4.3.1) into account, anopposite effect can be expected. In several publications the trans membrane potential,which is needed for irreversible dielectric breakdown, was found to be around 1 V forvarious cell types, as summarized by Zimmermann (1996). Even though this value re-mains constant independent on the cell size it was demonstrated that the electric fieldsstrength, which is needed to obtain this aforementioned trans membrane potential, ishighly dependent on the cell size. An increasing susceptibility of microorganisms toPEF treatment with increasing cell size was demonstrated several times in the litera-ture (Zimmermann et al. (1974); Hulsheger et al. (1983); Heinz et al. (2001)).
Even though these considerations suggest an increasing susceptibility of W.lipofer toPEF treatment with increasing age, the opposite effect was observed (Fig. 4.16). Theseobservations are supported by data for S.cerevisiae (Jacob et al. (1981); Gaskova et al.(1996)). This is also in agreement with data published for E.coli, where an increasingPEF resistance with increasing age, which did not entirely correlate with the changein cell size, was observed (Hulsheger et al. (1983)). Experiments conducted by Ladoand Yousef (2003) partly support these observations, since similar effects were seen forthe gram-positive bacterial strain Listeria monocytogenes Scott A, while no influenceof the culture age on PEF efficiency was demonstrated for L.monocytogenes OSY-8578.
Before the basic mechanisms of membrane permeabilization were published by Zim-mermann et al. (1974), Jacob et al. (1981) postulated that the higher susceptibilityof S.cerevisiae cells to PEF treatment in the exponential phase is due to the buddingprocess, which leads to weak spots in the cell wall allowing easier cell membrane per-
83
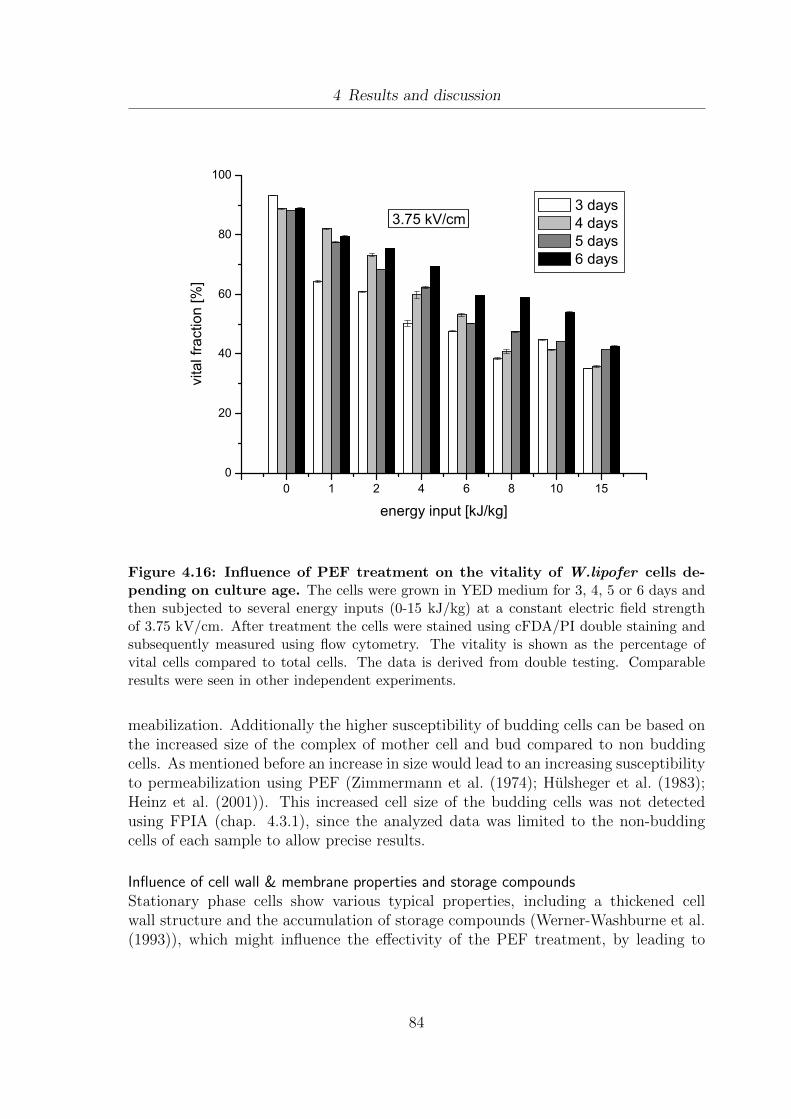
4 Results and discussion
0 1 2 4 6 8 1 0 1 50
2 0
4 0
6 0
8 0
1 0 0vita
l frac
tion [
%]
e n e r g y i n p u t [ k J / k g ]
3 d a y s 4 d a y s 5 d a y s 6 d a y s
3 . 7 5 k V / c m
Figure 4.16: Influence of PEF treatment on the vitality of W.lipofer cells de-pending on culture age. The cells were grown in YED medium for 3, 4, 5 or 6 days andthen subjected to several energy inputs (0-15 kJ/kg) at a constant electric field strengthof 3.75 kV/cm. After treatment the cells were stained using cFDA/PI double staining andsubsequently measured using flow cytometry. The vitality is shown as the percentage ofvital cells compared to total cells. The data is derived from double testing. Comparableresults were seen in other independent experiments.
meabilization. Additionally the higher susceptibility of budding cells can be based onthe increased size of the complex of mother cell and bud compared to non buddingcells. As mentioned before an increase in size would lead to an increasing susceptibilityto permeabilization using PEF (Zimmermann et al. (1974); Hulsheger et al. (1983);Heinz et al. (2001)). This increased cell size of the budding cells was not detectedusing FPIA (chap. 4.3.1), since the analyzed data was limited to the non-buddingcells of each sample to allow precise results.
Influence of cell wall & membrane properties and storage compoundsStationary phase cells show various typical properties, including a thickened cellwall structure and the accumulation of storage compounds (Werner-Washburne et al.(1993)), which might influence the effectivity of the PEF treatment, by leading to
84
4 Results and discussion
inhomogeneities of the electric field. Since PEF treatment only effects the plasmamembrane and not the cell wall, changes in the membrane composition or its struc-ture are most likely the reason for the increasing resistance to PEF treatment. Anincreased resistance of the plasma membrane to filipin, which causes membrane dam-age due to sterol binding, was already demonstrated for stationary phase cells ofCandida albicans (Takeo (1985)). Another reason for an increased resistance to PEFtreatment could be a shift of the fatty acid pattern towards long and saturated fattyacids, which would lead to a less fluid membrane. The effect of a less fluid mem-brane structure, which also occurs when the treatment temperature is lowered, on thesusceptibility to PEF treatment was summarized by Toepfl (2006). Changes in theplasma membrane fatty acid composition of yeast cells from exponential to stationaryphase were already demonstrated for Lipomyces lipofer (i.e. Waltomyces lipofer), De-baryomyces vanrijiae, Saccharomycodes ludwigii, Endomyces fibuliger, Metchnikowiareukaufii (McElroy and Stewart (1967); Viljoen et al. (1986)). By comparing theseresults no tendency for a clear preference for saturated or unsaturated fatty acidsin stationary phase can be made, which applies for all strains. Therefore an argu-mentation focusing on an increase of membrane rigidity in stationary phase based ona preference for saturated fatty acids can not be generally made. Other differencesbetween the plasma membrane structures of yeast cells were observed, which allowan assumption on the increasing resistance to PEF treatment in stationary phase.Takeo et al. (1976) observed particles in hexagonal arrangements in the plasma mem-brane of S.cerevisiae cells in stationary phase, which were not present in exponentialphase. Walther et al. (1984) observed plasma membrane invaginations for Schizosac-charomyce pombe, which increased in abundance and size in stationary phase. Yeastplasma membrane invaginations have been reported several times and appear to beassociated with glycogen structures (Coulary et al. (2001)) as well as actin filamentsand actin binding proteins (Mulholland et al. (1994)). It is likely that invaginationsin the cell membrane influence its permeabilization. This can be due to two reasons.On the one hand membrane inclusions can prevent membrane permeabilization due tosterical hindrance, since the postulated membrane compression (Zimmermann et al.(1976)), which leads to the dielectric breakdown, is impaired. On the other hand it ispossible that membrane inclusions lead to a inhomogeneous electric field distributionand therefore influence the permeabilization. Similar effects were already described forair bubbles and particles like fat globules (Toepfl (2006)). Moreover, it was shown thatbesides the membrane inclusions, cytoplasmic inclusions like carbohydrates and lipiddroplets are also found primarily in stationary phase yeast cells (Werner-Washburneet al. (1993)), which additionally can impair the permeabilization effect. The fact thatlipid droplets in the oleaginous yeast W. lipofer are much bigger than in non-oleaginousyeast strains supports this theory. However, the results (Fig. 4.16) demonstrate, thateven large lipid droplets, as they occur in the stationary phase of W.lipofer growth(Fig. 4.9), do not prevent the cell from electro permeabilization.
85

4 Results and discussion
4.4.3 Influence of PEF on the fatty acid pattern
In this work the application of pulsed electric field treatment for the extraction offatty acids from W.lipofer was conducted (chap. 4.5.2). It is of importance thatthe fatty acids, mainly the unsaturated and polyunsaturated fatty acids, which areof great interest for food applications, are not altered by PEF treatment. Thereforefurther experiments were conducted in which a possible influence of PEF on the fattyacid pattern was investigated. It is possible that electrochemical reactions at theelectrodes might lead to fatty acid alterations, especially as far as double bonds areconcerned. Possible reactions like the formation of hydrogen peroxide (H2O2) or freeradical formation due to an electric discharge in water were already demonstrated bySato et al. (1994); Joshi et al. (1995) and Sahni and Locke (2006). The possible effects,which can occur during PEF treatment, like electrochemical reactions and electrodecorrosion were addressed and summarized by Morren et al. (2003). The influence oftemperature, which is known to have an influence on fatty acid stability (Belitz et al.(2001)), can be ruled out due to the energy inputs applied, which only led to an in-crease of maximal 5 .
C 8 C 1 0 C 1 4 C 1 6 C 1 6 : 1 C 1 8 C 1 8 : 1 C 1 8 : 2 C 1 8 : 3 C 2 0 C 2 0 : 1 C 2 2 C 2 405
2 02 53 03 54 04 55 05 5A :
P E F t r e a t m e n t : c o n t i n u o u s m o d e u n t r e a t e d 8 k V / c m ; 7 k J / k g 2 5 k V / c m ; 7 k J / k g 2 5 k V / c m ; 3 0 k J / k g
P E F t r e a t m e n t : b a t c h m o d e u n t r e a t e d 2 5 k V / c m ; 1 k J / k g 2 5 k V / c m ; 1 0 k J / k g
% of
total
fatty
acids
C 8 C 1 0 C 1 4 C 1 6 C 1 6 : 1 C 1 8 C 1 8 : 1 C 1 8 : 2 C 1 8 : 3 C 2 0 C 2 0 : 1 C 2 2 C 2 405
2 02 53 03 54 04 55 05 5B :
% of
total
fatty
acids
f a t t y a c i d s
Figure 4.17: Influence of PEF treatment on the fatty acid pattern of W.lipofer .Cells were grown in YED medium at 25 for 5 days. The fatty acid patterns of untreatedand PEF treated cells were measured using gas chromatography (GC-FID). A: Fatty acidpatterns after batch PEF treatment. B: Fatty acid patterns after continuous PEF treatment.
86
4 Results and discussion
W.lipofer cells were treated using both batch (4.17 A) and continuous PEF treatment(4.17 B) with varying electric field strengths and varying total energy inputs. Thefatty acids were extracted applying the method of Bligh & Dyer, and the compositionwas measured using gas chromatography (GC-FID). The data was compared withuntreated reference samples. In Fig. 4.17 (A) it can be seen, that the main fatty acidspresent in untreated W.lipofer cells are oleic acid (C 18:1) with 42 %, stearic acid(C 18:0) with 27.5 % and palmitic acid (C 16:0) with 24.3 %. All other fatty acidsdetected show values below 1.5 %. The untreated cells of an independent experiment(4.17 B) show the same pattern with oleic acid, stearic acid and palmitic acid as themain constituents. However, slightly different total amounts of the different fattyacids were detected (i.e. C 18:1= 49.1 %;C 18:0= 19.4 %;C 16:0= 23.8 %). In thiscase the total percentage of each of the other fatty acids never exceeded 2 %. Thesefindings are basically in agreement with data published for Lipomyces and Waltomycesyeast strains (McElroy and Stewart (1967); Lomascolo et al. (1994)), however, thetotal values vary and the abundance of linoleic acid (C 18:2) is lower than in theliterature. The mentioned variations are possible, since the fatty acid pattern in yeastis strongly influenced by the growth phase and the growth conditions (McElroy andStewart (1967); Phornpiboonya and Jack (1980); Viljoen et al. (1986); Suutari et al.(1990); Finotti et al. (1993)). No change in the fatty acid pattern between treatedand untreated samples was observed. This is in agreement with data published for theprocessing of an omega-3 enriched orange juice-milk beverage (Zulueta et al. (2007)).As far as other non-thermal technologies, like ultrasound treatment, are concernedthe formation of free radicals was demonstrated (Riesz et al. (1985); Henglein (1987)),which can cause alterations in the fatty acid patterns (Porter et al. (1980); Thomas(2000)). These results provide a first indication that PEF does not influence the fattyacid pattern. However, to determine the PEF influence in more depth, further analysisfocusing on typical fatty acid autoxidation products would be needed.
87
4 Results and discussion
4.5 Influence of PEF on extraction processes
The influence of PEF on extraction processes was tested. The focus was laid on bothhydrophilic substances (chap. 4.5.1) and on lipophilic substances (e.g. triacylglyc-erols). It was tested whether the membrane permeabilization due to PEF treatmentallows mass transfer processes from high concentrations of the given substance insidethe cell towards low concentrations in the external medium. In case of the lipophilicsubstances the defined triglycerol mixture Miglyol®812 was used to enhance the pro-cess, while the approaches for the extraction of hydrophilic substances only involvedthe water-based external media, e.g. growth media or buffer solutions.
4.5.1 Extraction of hydrophilic substances
The application of PEF for the extraction of hydrophilic compounds from yeast cellswas tested. This chapter comprises both detection methods for cell permeabiliza-tion (chap. 4.5.1.1) and potential applications for the extraction of cell componentsincluding proteins (chap. 4.5.1.2).
4.5.1.1 Measurement of cell permeabilization
In this work different approaches for the detection of mass transfer processes of hy-drophilic substances in yeast were applied. The measurement of the electric currentas an indicator for increasing conductivity due to mass transfer processes and thewater-loss of yeast cells will be presented.
Measurement of permeabilization using the electric current (I)The measurement of the electric current (I) was tested as an indicator for cell per-meabilization. Cell permeabilization can lead to a release of hydrophilic substancesinto the external medium, thus leading to an increasing conductivity. The conduc-tivity is reciprocal to the resistivity, therefore an increasing conductivity leads to anincreasing electric current. Thus a direct proportionality between the degree of per-meabilization, the release of cytoplasmic compounds, the conductivity and thereforethe electric current during the PEF treatment is given. A comparable approach wasalready published for S.cerevisiae by Zakhem et al. (2006a,b). In a related methodthe so called cell disintegration index (CDI) was introduced as a possibility to quan-tify the degree of cell permeabilization. The CDI calculation is based on impedancemeasurement (Angersbach et al. (2002)).
In this work the influence of PEF treatment on the electric current during the treat-ment was determined. Different electric field strength 0, 5, 10, 15 and 20 kV/cm wereapplied and and the development of the electric current was followed over a period of65 s (Fig. 4.18). Since the applied pulse frequency was 1 Hz, the number of pulsesis equivalent to the treatment time in seconds. The increase of the electric current
88

4 Results and discussion
Figure 4.18: Increase of the electric current during PEF treatment of W.lipoferat different conditions. The increase of the electric current during treatment of W.lipofercells was compared with untreated samples. The electric current was measured during thetreatment. The maximum increase of the electric current at each electric field strength wasset to 100%. Since the applied pulse frequency was 1 Hz, the number of pulses is equivalentto the treatment time in seconds.
(∆I) from the beginning Istart to every given point of measurement In was calculated.The maximum increase of ∆I for each electric field strength was set to 100 % to allowcomparison between the different electrical field strengths, since it has to be takeninto account that the total electric current increases with increasing voltage,
U [V ] = R[Ω] · I[A]
and therfore with increasing electric field strength
E[kVcm
] = U [kV ]d[cm]
.
In can be stated that all samples show maximum disintegration after 35 s of treat-ment. No significant difference can be seen between the application of 10, 15 and 20kV/cm. In all these cases the maximum cell disintegration was reached after 25 sof treatment. Taking the increasing energy input Wpulse with increasing electric fieldstrength into account,
89
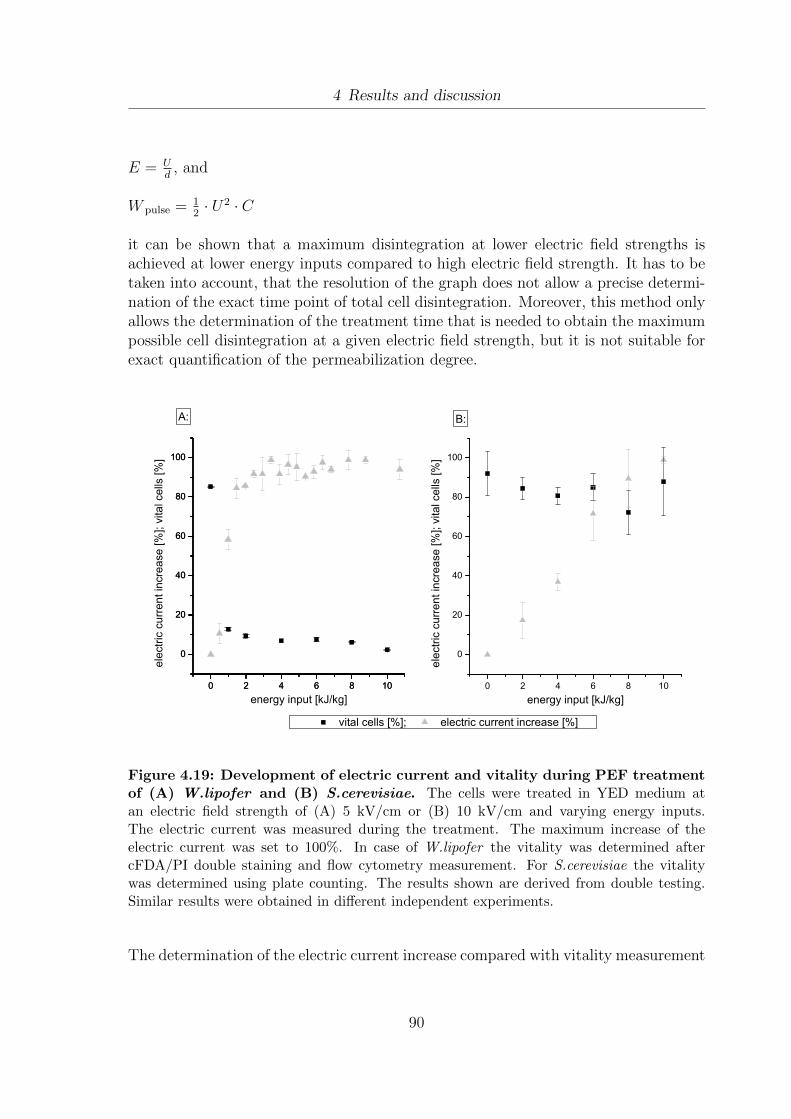
4 Results and discussion
E = Ud
, and
W pulse = 12· U2 · C
it can be shown that a maximum disintegration at lower electric field strengths isachieved at lower energy inputs compared to high electric field strength. It has to betaken into account, that the resolution of the graph does not allow a precise determi-nation of the exact time point of total cell disintegration. Moreover, this method onlyallows the determination of the treatment time that is needed to obtain the maximumpossible cell disintegration at a given electric field strength, but it is not suitable forexact quantification of the permeabilization degree.
0 2 4 6 8 1 0
0
2 0
4 0
6 0
8 0
1 0 0
0 2 4 6 8 1 0
0
2 0
4 0
6 0
8 0
1 0 0
0 2 4 6 8 1 0
0
2 0
4 0
6 0
8 0
1 0 0
electr
ic curr
ent in
creas
e [%]
; vita
l cells
[%]
e n e r g y i n p u t [ k J / k g ] v i t a l c e l l s [ % ] ; e l e c t r i c c u r r e n t i n c r e a s e [ % ]
A : B :ele
ctric c
urren
t incre
ase [
%]; v
ital ce
lls [%
]
e n e r g y i n p u t [ k J / k g ]
Figure 4.19: Development of electric current and vitality during PEF treatmentof (A) W.lipofer and (B) S.cerevisiae. The cells were treated in YED medium atan electric field strength of (A) 5 kV/cm or (B) 10 kV/cm and varying energy inputs.The electric current was measured during the treatment. The maximum increase of theelectric current was set to 100%. In case of W.lipofer the vitality was determined aftercFDA/PI double staining and flow cytometry measurement. For S.cerevisiae the vitalitywas determined using plate counting. The results shown are derived from double testing.Similar results were obtained in different independent experiments.
The determination of the electric current increase compared with vitality measurement
90
4 Results and discussion
can be used to test, whether a reversible permeabilization of the cells is possible. Thiswould be the case as soon as an increase of the electric current can be seen, while atthe same time the vitality remains unchanged. This was tested for both W.lipofer andS.cerevisiae. In case of W.lipofer the lowest electric field strength, which still allowsmeasurement of the electric current during treatment, was applied (i.e. 5 kV/cm). Thevitality was measured using cFDA/PI double staining and subsequent flow cytometricassessment. For S.cerevisiae 10 kV/cm were applied and the vitality was determinedusing plate counting. In case of W.lipofer it can be seen that an increasing energyinput leads to a rapidly decreasing vitality and to an increasing electric current duringthe treatment (Fig. 4.19 A). The percentage of vital cells in the untreated sample is85.15 %. This value decreases to 2.2 % at 10 kJ/kg. The main inactivation is alreadyobtained at the lowest energy input used (i.e. 1 kJ/kg), since the vital fraction of thecells is already decreased to 12.8 %. A nearly reciprocal effect can be seen as far as theelectric current increase is concerned. At an energy input of 1 kJ/kg already 58,3 % ofthe maximal electric current increase and therefore of the maximal cell disintegrationare obtained. This value increases to 85,7 % at 2 kJ/kg. No significant change inthe electric current can be seen above an energy input of 3 kJ/kg, which leads to anelectric current increase of 91,66 % of the maximal increase. Taking both the devel-opment of the electric current and the vitality into account it can be stated that anextraction of metabolites after reversible permeabilization is not possible for W.lipoferat these conditions. However, it might be possible to obtain satisfying results for re-versible treatment as soon as lower electric field strengths are used. Due to technicalreasons the measurement of the electric current at lower intensities was not possible.In this case different methods for the detection of cell disintegration have to be ap-plied, including the measurement of the dry weight, which is addressed in the nextparagraph or the determination of the amount of extracted substances e.g. proteinsusing biochemical methods. The area of possible electric field strengths is limited dueto the critical electric field strength (Ecrit) of the organism. Below this value no cellpermeabilization can occur (Fig. 2.4). In chapter 4.4.2 Ecrit for W.lipofer was deter-mined to lie between 2 kV/cm and 3.75 kV/cm. This observation is in agreement withliterature values determined mathematically for S.cerevisiae (i.e. 2-4 kV/cm; Toepfl(2006)) or experimentally for Candida albicans (5 kV/cm; Hulsheger et al. (1983)).
As far as S.cerevisiae is concerned an increasing electric current with increasing energyinput can be observed (Fig. 4.19 B). However, the percentage of vital cells decreasesfrom 91.98 % in untreated cells to 84.5 % at 2 kJ/kg. At higher energy inputs thevital fraction varies around 80 % with increasing standard deviations at increasingenergy inputs. Since a vitality of approximately 80 % can be observed at maximumelectric current increase it can be stated that a reversible treatment is possible. Thiscan be due to the tendency of S.cerevisiae to form agglomerates. This can both havean influence on the effectivity of the PEF treatment as well as on the chosen vitalitymeasurement using plate counting. Large agglomerates could be less susceptible toPEF treatment since the electric field will become very inhomogeneous and cells in
91
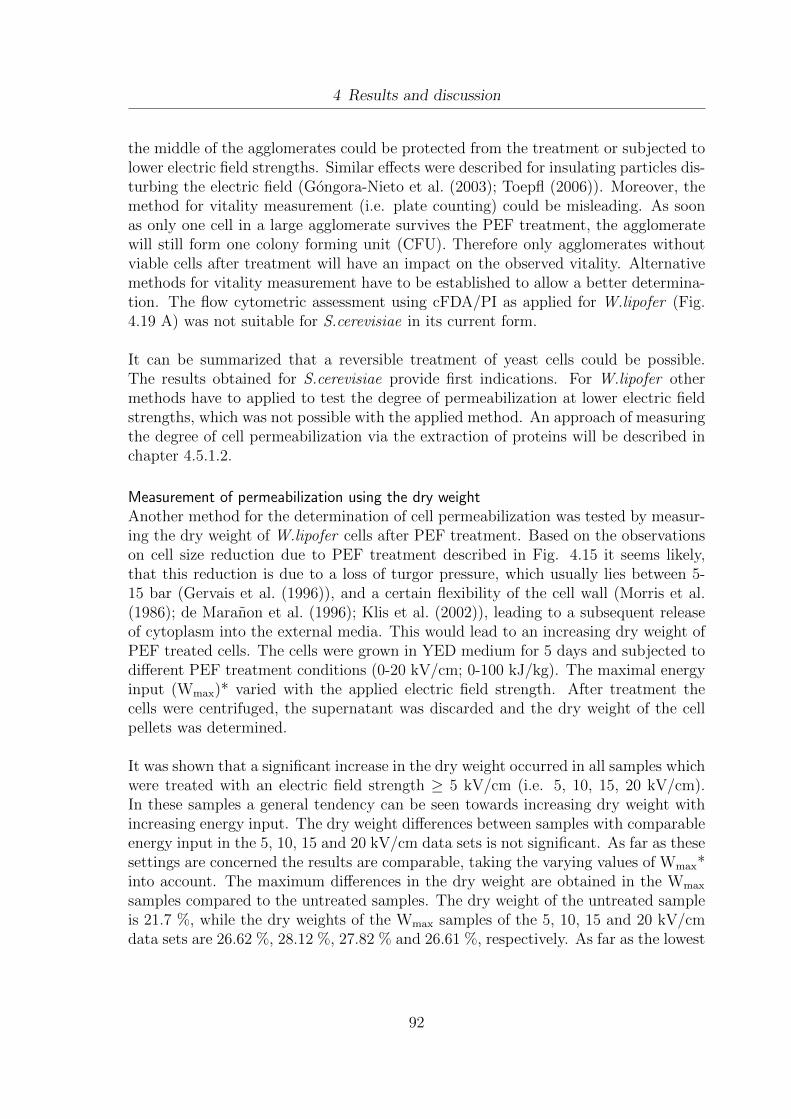
4 Results and discussion
the middle of the agglomerates could be protected from the treatment or subjected tolower electric field strengths. Similar effects were described for insulating particles dis-turbing the electric field (Gongora-Nieto et al. (2003); Toepfl (2006)). Moreover, themethod for vitality measurement (i.e. plate counting) could be misleading. As soonas only one cell in a large agglomerate survives the PEF treatment, the agglomeratewill still form one colony forming unit (CFU). Therefore only agglomerates withoutviable cells after treatment will have an impact on the observed vitality. Alternativemethods for vitality measurement have to be established to allow a better determina-tion. The flow cytometric assessment using cFDA/PI as applied for W.lipofer (Fig.4.19 A) was not suitable for S.cerevisiae in its current form.
It can be summarized that a reversible treatment of yeast cells could be possible.The results obtained for S.cerevisiae provide first indications. For W.lipofer othermethods have to applied to test the degree of permeabilization at lower electric fieldstrengths, which was not possible with the applied method. An approach of measuringthe degree of cell permeabilization via the extraction of proteins will be described inchapter 4.5.1.2.
Measurement of permeabilization using the dry weightAnother method for the determination of cell permeabilization was tested by measur-ing the dry weight of W.lipofer cells after PEF treatment. Based on the observationson cell size reduction due to PEF treatment described in Fig. 4.15 it seems likely,that this reduction is due to a loss of turgor pressure, which usually lies between 5-15 bar (Gervais et al. (1996)), and a certain flexibility of the cell wall (Morris et al.(1986); de Maranon et al. (1996); Klis et al. (2002)), leading to a subsequent releaseof cytoplasm into the external media. This would lead to an increasing dry weight ofPEF treated cells. The cells were grown in YED medium for 5 days and subjected todifferent PEF treatment conditions (0-20 kV/cm; 0-100 kJ/kg). The maximal energyinput (Wmax)* varied with the applied electric field strength. After treatment thecells were centrifuged, the supernatant was discarded and the dry weight of the cellpellets was determined.
It was shown that a significant increase in the dry weight occurred in all samples whichwere treated with an electric field strength ≥ 5 kV/cm (i.e. 5, 10, 15, 20 kV/cm).In these samples a general tendency can be seen towards increasing dry weight withincreasing energy input. The dry weight differences between samples with comparableenergy input in the 5, 10, 15 and 20 kV/cm data sets is not significant. As far as thesesettings are concerned the results are comparable, taking the varying values of Wmax*into account. The maximum differences in the dry weight are obtained in the Wmax
samples compared to the untreated samples. The dry weight of the untreated sampleis 21.7 %, while the dry weights of the Wmax samples of the 5, 10, 15 and 20 kV/cmdata sets are 26.62 %, 28.12 %, 27.82 % and 26.61 %, respectively. As far as the lowest
92
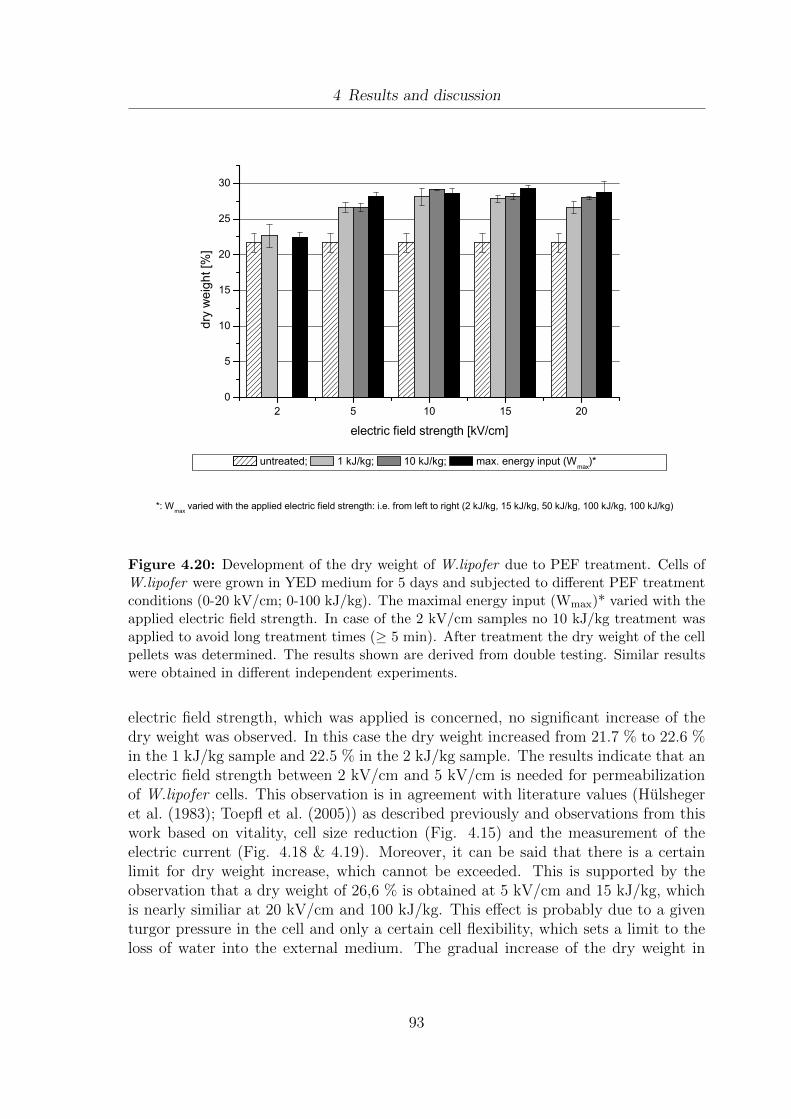
4 Results and discussion
2 5 1 0 1 5 2 00
5
1 0
1 5
2 0
2 5
3 0
* : W m a x v a r i e d w i t h t h e a p p l i e d e l e c t r i c f i e l d s t r e n g t h : i . e . f r o m l e f t t o r i g h t ( 2 k J / k g , 1 5 k J / k g , 5 0 k J / k g , 1 0 0 k J / k g , 1 0 0 k J / k g )
dry we
ight [%
]
e l e c t r i c f i e l d s t r e n g t h [ k V / c m ] u n t r e a t e d ; 1 k J / k g ; 1 0 k J / k g ; m a x . e n e r g y i n p u t ( W m a x ) *
Figure 4.20: Development of the dry weight of W.lipofer due to PEF treatment. Cells ofW.lipofer were grown in YED medium for 5 days and subjected to different PEF treatmentconditions (0-20 kV/cm; 0-100 kJ/kg). The maximal energy input (Wmax)* varied with theapplied electric field strength. In case of the 2 kV/cm samples no 10 kJ/kg treatment wasapplied to avoid long treatment times (≥ 5 min). After treatment the dry weight of the cellpellets was determined. The results shown are derived from double testing. Similar resultswere obtained in different independent experiments.
electric field strength, which was applied is concerned, no significant increase of thedry weight was observed. In this case the dry weight increased from 21.7 % to 22.6 %in the 1 kJ/kg sample and 22.5 % in the 2 kJ/kg sample. The results indicate that anelectric field strength between 2 kV/cm and 5 kV/cm is needed for permeabilizationof W.lipofer cells. This observation is in agreement with literature values (Hulshegeret al. (1983); Toepfl et al. (2005)) as described previously and observations from thiswork based on vitality, cell size reduction (Fig. 4.15) and the measurement of theelectric current (Fig. 4.18 & 4.19). Moreover, it can be said that there is a certainlimit for dry weight increase, which cannot be exceeded. This is supported by theobservation that a dry weight of 26,6 % is obtained at 5 kV/cm and 15 kJ/kg, whichis nearly similiar at 20 kV/cm and 100 kJ/kg. This effect is probably due to a giventurgor pressure in the cell and only a certain cell flexibility, which sets a limit to theloss of water into the external medium. The gradual increase of the dry weight in
93
4 Results and discussion
a certain range of energy inputs is in agreement with the data on PEF treatmentinfluence on cell size and vitality as described previously (4.15).
It can be stated that the measurement of the dry weight provides both a methodfor the determination of the cell permeabilization and a promising technique for themechanical de-watering of cells. Other applications for PEF treatment as far as theextraction of hydrophilic compounds is concerned will be addressed in the next section(chap. 4.5.1.2).
4.5.1.2 Applications for the extraction of hydrophilic substances
This section deals with possible applications for the extraction of hydrophilic sub-stances. The main focus will be laid on the extraction of proteins and DNA. Theinterest in proteins for nutritional applications and the problems associated with highconcentrations of nucleic acids were emphasized in the literature review (chap. 2.3).In this section it was tested whether a selective protein extraction using PEF treat-ment can be conducted, without extracting DNA. This approach seems possible dueto the localization of DNA in the cell core and the localization of proteins mainly inthe cytoplasm. The cell core could be to large to exit the cell and to small to be sub-jected to PEF treatment, since the susceptibility to PEF treatment is size dependent(Zimmermann et al. (1974)). The susceptibility of the nuclear membrane of yeast cellsto PEF treatment was demonstrated by Wall et al. (2004).
Extraction of Proteins
Some authors have described the extraction of amino acids, proteins or compoundscontaining substantial amounts of protein using PEF treatment. The extraction ofamino acids from Corynebacterium glutamicum was shown by Tryfona and Bustard(2008), while Zimmermann et al. (1974) reported the release of hemoglobin frombovine red blood cells into the external medium due to PEF treatment. As far asyeast cells are concerned the application of PEF for the extraction of proteins fromS.cerevisiae has already been described (Zakhartsev et al. (2007)). A process applica-ble for producing alternative yeast extracts, which can also contain amino acids andproteins, using PEF was patented by Monch and Stute (2002).
In this part of work, the oleaginous yeast W.lipofer was tested concerning the ex-tractability of its proteins due to PEF treatment. Combined with the extraction oflipids, which was also tested in this work (chap. 4.5.2) a combined process could bedeveloped including both the extraction of hydrophilic and lipophilic substances.
For this study the cells of W.lipofer were grown in YED medium for 5 days, con-centrated 20 times in 1/8 Ringer solution and subjected to different PEF treatmentconditions (0-20 kV/cm; 0-100 kJ/kg). The maximal energy input (Wmax)* varied
94
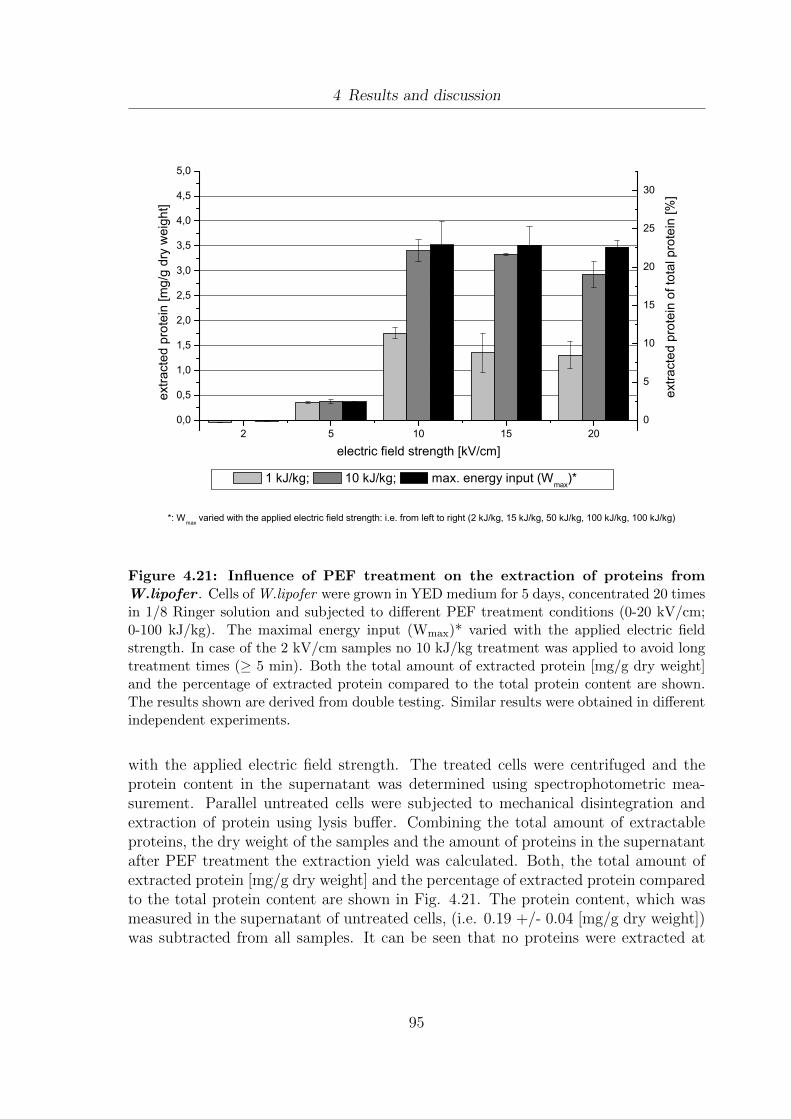
4 Results and discussion
0
5
1 0
1 5
2 0
2 5
3 0
2 5 1 0 1 5 2 00 , 00 , 51 , 01 , 52 , 02 , 53 , 03 , 54 , 04 , 55 , 0
* : W m a x v a r i e d w i t h t h e a p p l i e d e l e c t r i c f i e l d s t r e n g t h : i . e . f r o m l e f t t o r i g h t ( 2 k J / k g , 1 5 k J / k g , 5 0 k J / k g , 1 0 0 k J / k g , 1 0 0 k J / k g )
extra
cted p
rotein
[mg/g
dry w
eight]
e l e c t r i c f i e l d s t r e n g t h [ k V / c m ] 1 k J / k g ; 1 0 k J / k g ; m a x . e n e r g y i n p u t ( W m a x ) *
extra
cted p
rotein
of to
tal pr
otein
[%]
Figure 4.21: Influence of PEF treatment on the extraction of proteins fromW.lipofer . Cells of W.lipofer were grown in YED medium for 5 days, concentrated 20 timesin 1/8 Ringer solution and subjected to different PEF treatment conditions (0-20 kV/cm;0-100 kJ/kg). The maximal energy input (Wmax)* varied with the applied electric fieldstrength. In case of the 2 kV/cm samples no 10 kJ/kg treatment was applied to avoid longtreatment times (≥ 5 min). Both the total amount of extracted protein [mg/g dry weight]and the percentage of extracted protein compared to the total protein content are shown.The results shown are derived from double testing. Similar results were obtained in differentindependent experiments.
with the applied electric field strength. The treated cells were centrifuged and theprotein content in the supernatant was determined using spectrophotometric mea-surement. Parallel untreated cells were subjected to mechanical disintegration andextraction of protein using lysis buffer. Combining the total amount of extractableproteins, the dry weight of the samples and the amount of proteins in the supernatantafter PEF treatment the extraction yield was calculated. Both, the total amount ofextracted protein [mg/g dry weight] and the percentage of extracted protein comparedto the total protein content are shown in Fig. 4.21. The protein content, which wasmeasured in the supernatant of untreated cells, (i.e. 0.19 +/- 0.04 [mg/g dry weight])was subtracted from all samples. It can be seen that no proteins were extracted at
95

4 Results and discussion
2 kV/cm and only small amounts at 5 kV/cm, i.e. 0.36, 0.38 and 0.37 mg/g dryweight at 1, 10 and 15 kJ/kg, respectively (Fig. 4.21). In this case no influence ofthe energy input can be seen. At 10 kV/cm, 1.75, 3.40, 3.52 mg protein/g dry weighthave been extracted at 1, 10 and 50 kJ/kg, respectively. The same tendency that canbe seen in the 10 kV/cm samples, was observed at higher electric field strength (i.e.15 and 20 kV/cm), however, with slightly varying values. Taking the total amountof extractable proteins, measured after mechanical disintegration, into account themaximum amount of proteins extracted was 22.9 %.
Based on the observations from Fig. 4.21 it can be stated that the lowest settingsfor protein extraction lie between 2 and 5 kV/cm, which is again in agreement withthe values determined for the critical electric field strength (Ecrit) using measurementof the electric current (Fig. 4.18 & 4.19), vitality, cell size reduction (Fig. 4.15) anddetermination of the dry weight (chap. 4.5.1.1) as well as with literature values (Hul-sheger et al. (1983); Toepfl et al. (2005)). However, the optimal electric field strengthtested was 10 kV/cm, since it shows a significant increase in protein extraction andno further increase can be observed for higher conditions (i.e. 15 and 20 kV/cm).This effect was not observed for the determination of the dry weight (Fig. 4.20). Inthis case 5 kV/cm proofed to be the optimal condition. This can be due to the size,molecular weight and the structure of proteins, which can not as easily leave the cellas the aqueous cytoplasm. This theory is supported by the observation that the treat-ment conditions can have an influence on pore size and number (Toepfl et al. (2005)).If Ecrit is slightly exceed only few and small pores were formed, which would still leadto leakage of the cytoplasm and explain the effects observed for the dry weight devel-opment (Fig. 4.20), however, it seems likely, that proteins need a greater number ofpores and larger pores to increase the space for mass transfer processes and preventsize exclusion, which is supported by the observation shown in Fig. 4.21. Even thoughthe results show possible conditions for protein extraction using PEF treatment, it hasto be taken into account that only 22.9 % of the total proteins were extracted. Thiscan be due to proteins bound to intracellular structures, which cannot be extracted.Comparing this data with the vitalities shown in Fig. 4.19 (A) it can be demonstratedthat an extraction of proteins from W.lipofer cannot be conducted reversibly. This isdue to the fact that even the lowest energy input tested (i.e. 1 kJ/kg) at 5 kV/cm(Fig. 4.19 A) led to a decrease of the vital fraction from 85.2 % to 12.8 %, while thesame settings did not lead to sufficient protein extraction (i.e. 2.3 % of total protein)as shown in Fig. 4.21.
In another independent experiment the elongation of the extraction time by 0-24 h ledto an increase of extracted proteins from 2.98 mg/g dry weight after 0 h to 21 mg/gdry weight after 24 h at 20 kV/cm and 10 kJ/kg. However, the protein content inthe supernatant of untreated cells was rising as well from 0.49 mg/g dry weight to16.8 mg/g dry weight. Therefore it can be stated that this increase by 18 mg/g dryweight and 16.4 mg/g dry in PEF treated and untreated cells, respectively, is due to
96

4 Results and discussion
other reasons than PEF treatment (data not shown). One reason could be the proteinrelease from dead cells due to autolyzation processes. This seems likely, since thecells were kept on a magnetic stirrer for 24 hours and thus at unfavorable conditionsfor growth. Alternatively, evaporation processes could have occurred in the sample,leading to a concentration of protein in the supernatant. Focusing on the elongationof the extraction time by 1, 2, 4 and 6 hours no significant influence on the extrac-tion yield of proteins could be shown compared to untreated samples (data not shown).
It can be summarized that an extraction of proteins from W.lipofer using irreversiblePEF treatment is possible. However, the elongation of the extraction time does notseem to improve the extraction yield. Possible modifications of the method, e.g. theuse of different buffers or the application of PEF in different growth phases, couldreveal better conditions for extraction.
Extraction of DNA
The application of PEF treatment was tested for the extraction of DNA. To be ofinterest for food applications the ratio of protein/DNA in extracts after PEF treat-ment has to be significantly lower than in total extracts, which were obtained aftermechanical disintegration to overcome the problems associated with excessive nucleicacid intake as described previously (Chap. 2.3). The cells of W.lipofer were grownin YED medium at 25 for 5 days. The cells were treated using PEF and theconcentration of DNA in the supernatant was determined photometrically. Theseconcentrations are shown in percent compared to the amount of DNA extracted usingmechanical disintegration (Fig. 4.22). The concentration of DNA in the supernatantof untreated cells was set to 0 %.
For all electric field strengths ≥ 5 kV/cm it can be seen that the amount of extractedDNA increases with increasing energy input. However, varying total amounts weremeasured, no significant difference between the different electric field strength can beseen. Since no extraction of DNA was demonstrated for 2 kV/cm it can be statedthat the critical electric field strength (Ecrit) lies between 2 kV/cm and 5 kV/cm,which is in agreement with the literature values for yeasts (Hulsheger et al. (1983);Toepfl et al. (2005)), as well as with results obtained in this work (Fig. 4.18, Fig.4.15 & sections: 4.5.1.1, 4.5.1.2). As far as the extractability of DNA compared toprotein is concerned it can be seen, that DNA can be extracted more easily usingPEF treatment. This is reflected in the percentage of the extracted substances due toPEF treatment compared to the total amount of extractable substance. Using PEFtreatment ≈ 70 % of the DNA can be extracted, while only ≈ 22 % of protein weremeasured in the supernatant. Moreover, both DNA extraction (Fig. 4.22) and theincrease of the dry weight due to loss of cytoplasm (Fig. 4.20), show their maximum
97
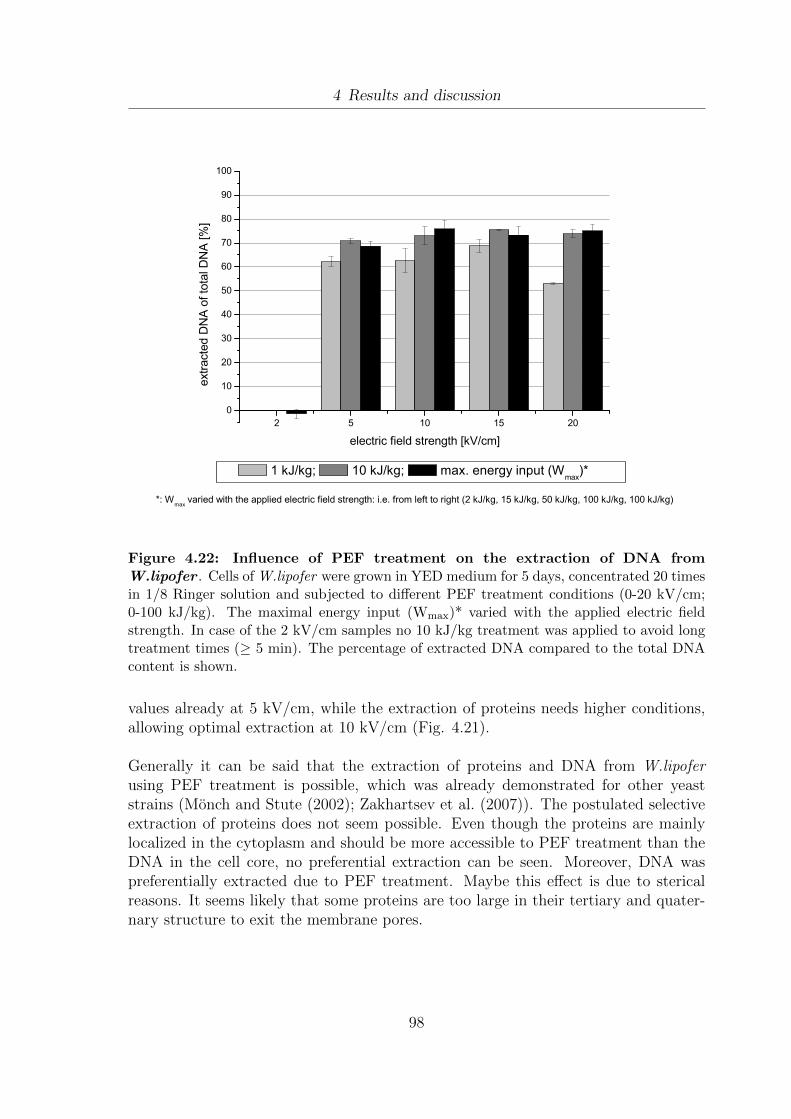
4 Results and discussion
2 5 1 0 1 5 2 00
1 02 03 04 05 06 07 08 09 0
1 0 0
1 k J / k g ; 1 0 k J / k g ; m a x . e n e r g y i n p u t ( W m a x ) ** : W m a x v a r i e d w i t h t h e a p p l i e d e l e c t r i c f i e l d s t r e n g t h : i . e . f r o m l e f t t o r i g h t ( 2 k J / k g , 1 5 k J / k g , 5 0 k J / k g , 1 0 0 k J / k g , 1 0 0 k J / k g )
extra
cted D
NA of
total
DNA [
%]
e l e c t r i c f i e l d s t r e n g t h [ k V / c m ]
Figure 4.22: Influence of PEF treatment on the extraction of DNA fromW.lipofer . Cells of W.lipofer were grown in YED medium for 5 days, concentrated 20 timesin 1/8 Ringer solution and subjected to different PEF treatment conditions (0-20 kV/cm;0-100 kJ/kg). The maximal energy input (Wmax)* varied with the applied electric fieldstrength. In case of the 2 kV/cm samples no 10 kJ/kg treatment was applied to avoid longtreatment times (≥ 5 min). The percentage of extracted DNA compared to the total DNAcontent is shown.
values already at 5 kV/cm, while the extraction of proteins needs higher conditions,allowing optimal extraction at 10 kV/cm (Fig. 4.21).
Generally it can be said that the extraction of proteins and DNA from W.lipoferusing PEF treatment is possible, which was already demonstrated for other yeaststrains (Monch and Stute (2002); Zakhartsev et al. (2007)). The postulated selectiveextraction of proteins does not seem possible. Even though the proteins are mainlylocalized in the cytoplasm and should be more accessible to PEF treatment than theDNA in the cell core, no preferential extraction can be seen. Moreover, DNA waspreferentially extracted due to PEF treatment. Maybe this effect is due to stericalreasons. It seems likely that some proteins are too large in their tertiary and quater-nary structure to exit the membrane pores.
98
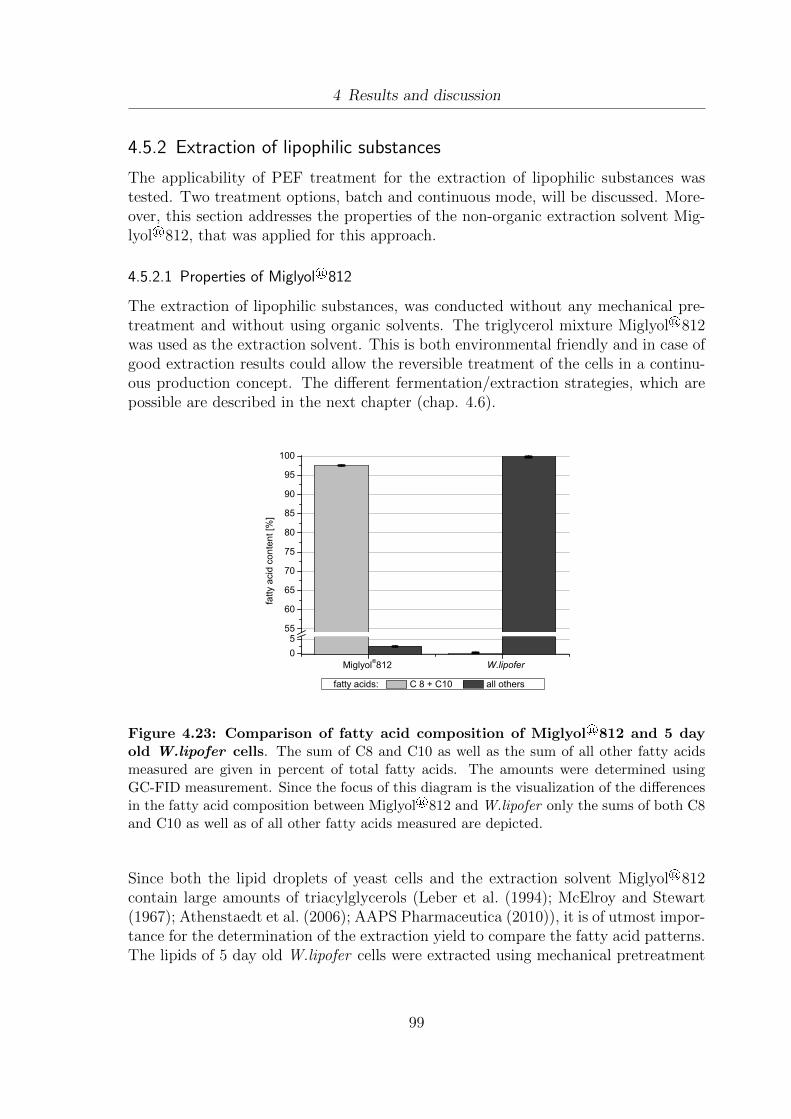
4 Results and discussion
4.5.2 Extraction of lipophilic substances
The applicability of PEF treatment for the extraction of lipophilic substances wastested. Two treatment options, batch and continuous mode, will be discussed. More-over, this section addresses the properties of the non-organic extraction solvent Mig-lyol®812, that was applied for this approach.
4.5.2.1 Properties of Miglyol®812
The extraction of lipophilic substances, was conducted without any mechanical pre-treatment and without using organic solvents. The triglycerol mixture Miglyol®812was used as the extraction solvent. This is both environmental friendly and in case ofgood extraction results could allow the reversible treatment of the cells in a continu-ous production concept. The different fermentation/extraction strategies, which arepossible are described in the next chapter (chap. 4.6).
05
5 56 06 57 07 58 08 59 09 5
1 0 0
W . l i p o f e r
Figure 4.23: Comparison of fatty acid composition of Miglyol®812 and 5 dayold W.lipofer cells. The sum of C8 and C10 as well as the sum of all other fatty acidsmeasured are given in percent of total fatty acids. The amounts were determined usingGC-FID measurement. Since the focus of this diagram is the visualization of the differencesin the fatty acid composition between Miglyol®812 and W.lipofer only the sums of both C8and C10 as well as of all other fatty acids measured are depicted.
Since both the lipid droplets of yeast cells and the extraction solvent Miglyol®812contain large amounts of triacylglycerols (Leber et al. (1994); McElroy and Stewart(1967); Athenstaedt et al. (2006); AAPS Pharmaceutica (2010)), it is of utmost impor-tance for the determination of the extraction yield to compare the fatty acid patterns.The lipids of 5 day old W.lipofer cells were extracted using mechanical pretreatment
99
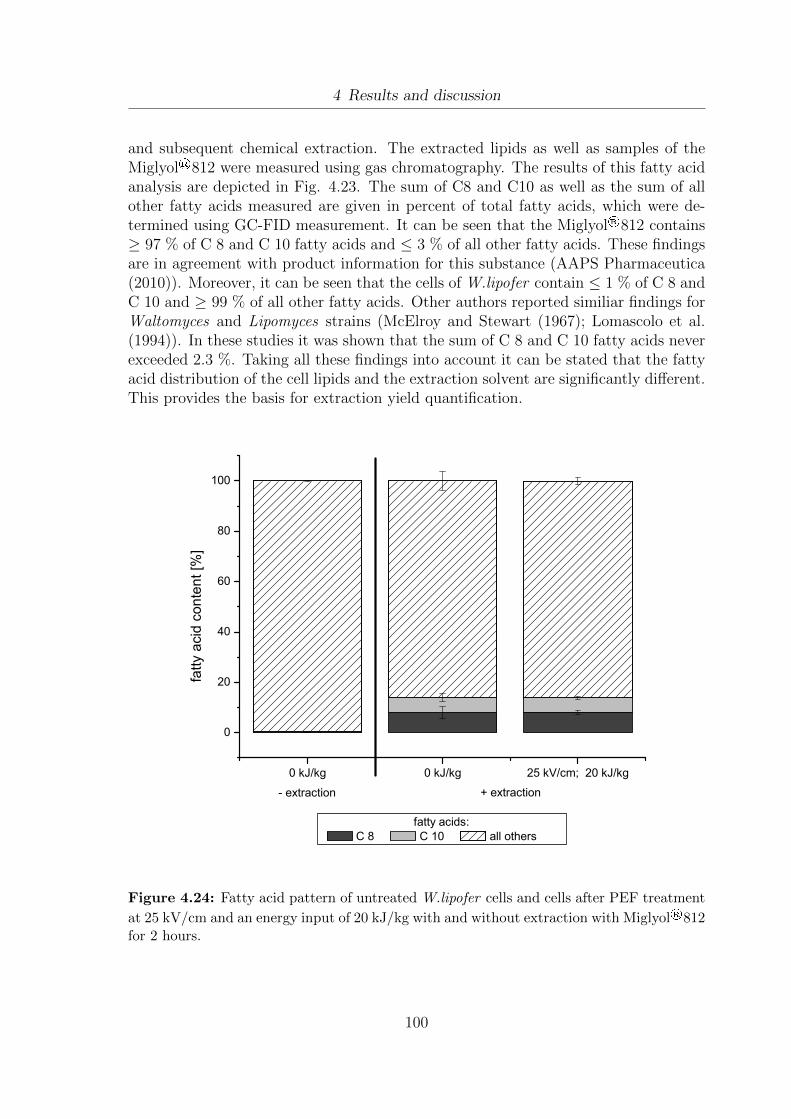
4 Results and discussion
and subsequent chemical extraction. The extracted lipids as well as samples of theMiglyol®812 were measured using gas chromatography. The results of this fatty acidanalysis are depicted in Fig. 4.23. The sum of C8 and C10 as well as the sum of allother fatty acids measured are given in percent of total fatty acids, which were de-termined using GC-FID measurement. It can be seen that the Miglyol®812 contains≥ 97 % of C 8 and C 10 fatty acids and ≤ 3 % of all other fatty acids. These findingsare in agreement with product information for this substance (AAPS Pharmaceutica(2010)). Moreover, it can be seen that the cells of W.lipofer contain ≤ 1 % of C 8 andC 10 and ≥ 99 % of all other fatty acids. Other authors reported similiar findings forWaltomyces and Lipomyces strains (McElroy and Stewart (1967); Lomascolo et al.(1994)). In these studies it was shown that the sum of C 8 and C 10 fatty acids neverexceeded 2.3 %. Taking all these findings into account it can be stated that the fattyacid distribution of the cell lipids and the extraction solvent are significantly different.This provides the basis for extraction yield quantification.
0 k J / k g 0 k J / k g 2 5 k V / c m ; 2 0 k J / k g
0
2 0
4 0
6 0
8 0
1 0 0
+ e x t r a c t i o n- e x t r a c t i o n f a t t y a c i d s :
C 8 C 1 0 a l l o t h e r s
fatty
acid
conte
nt [%
]
Figure 4.24: Fatty acid pattern of untreated W.lipofer cells and cells after PEF treatment
at 25 kV/cm and an energy input of 20 kJ/kg with and without extraction with Miglyol®812for 2 hours.
100
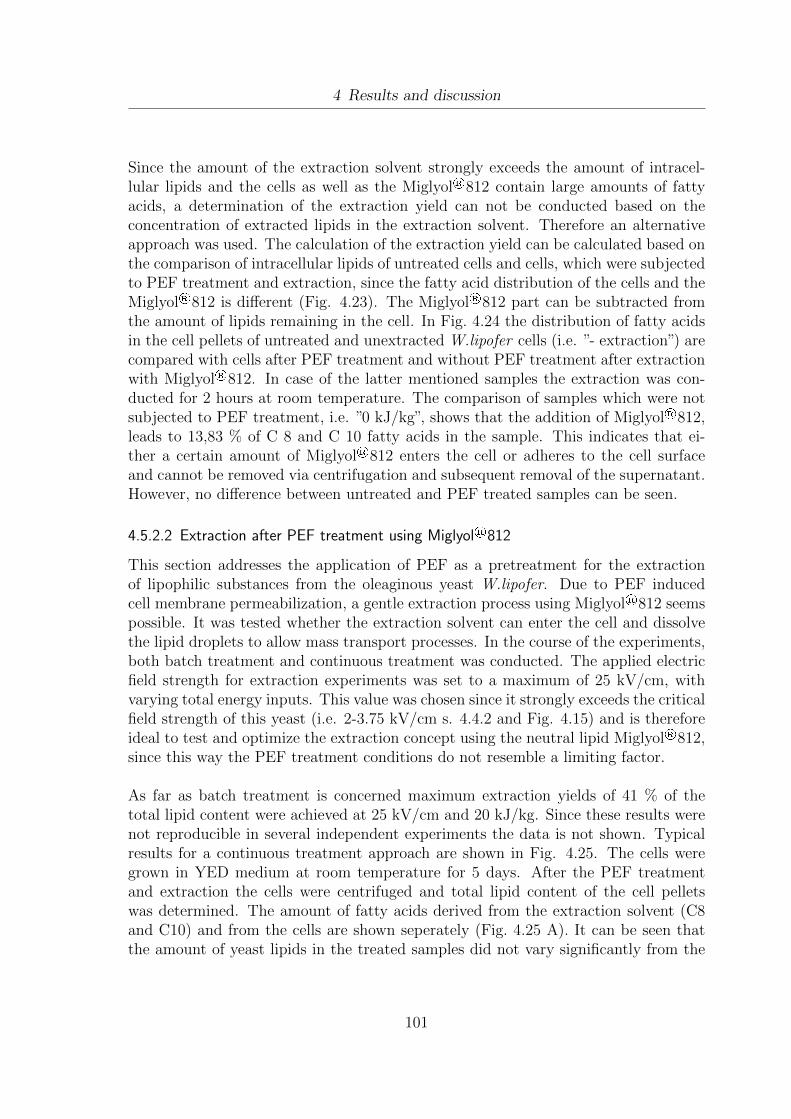
4 Results and discussion
Since the amount of the extraction solvent strongly exceeds the amount of intracel-lular lipids and the cells as well as the Miglyol®812 contain large amounts of fattyacids, a determination of the extraction yield can not be conducted based on theconcentration of extracted lipids in the extraction solvent. Therefore an alternativeapproach was used. The calculation of the extraction yield can be calculated based onthe comparison of intracellular lipids of untreated cells and cells, which were subjectedto PEF treatment and extraction, since the fatty acid distribution of the cells and theMiglyol®812 is different (Fig. 4.23). The Miglyol®812 part can be subtracted fromthe amount of lipids remaining in the cell. In Fig. 4.24 the distribution of fatty acidsin the cell pellets of untreated and unextracted W.lipofer cells (i.e. ”- extraction”) arecompared with cells after PEF treatment and without PEF treatment after extractionwith Miglyol®812. In case of the latter mentioned samples the extraction was con-ducted for 2 hours at room temperature. The comparison of samples which were notsubjected to PEF treatment, i.e. ”0 kJ/kg”, shows that the addition of Miglyol®812,leads to 13,83 % of C 8 and C 10 fatty acids in the sample. This indicates that ei-ther a certain amount of Miglyol®812 enters the cell or adheres to the cell surfaceand cannot be removed via centrifugation and subsequent removal of the supernatant.However, no difference between untreated and PEF treated samples can be seen.
4.5.2.2 Extraction after PEF treatment using Miglyol®812
This section addresses the application of PEF as a pretreatment for the extractionof lipophilic substances from the oleaginous yeast W.lipofer. Due to PEF inducedcell membrane permeabilization, a gentle extraction process using Miglyol®812 seemspossible. It was tested whether the extraction solvent can enter the cell and dissolvethe lipid droplets to allow mass transport processes. In the course of the experiments,both batch treatment and continuous treatment was conducted. The applied electricfield strength for extraction experiments was set to a maximum of 25 kV/cm, withvarying total energy inputs. This value was chosen since it strongly exceeds the criticalfield strength of this yeast (i.e. 2-3.75 kV/cm s. 4.4.2 and Fig. 4.15) and is thereforeideal to test and optimize the extraction concept using the neutral lipid Miglyol®812,since this way the PEF treatment conditions do not resemble a limiting factor.
As far as batch treatment is concerned maximum extraction yields of 41 % of thetotal lipid content were achieved at 25 kV/cm and 20 kJ/kg. Since these results werenot reproducible in several independent experiments the data is not shown. Typicalresults for a continuous treatment approach are shown in Fig. 4.25. The cells weregrown in YED medium at room temperature for 5 days. After the PEF treatmentand extraction the cells were centrifuged and total lipid content of the cell pelletswas determined. The amount of fatty acids derived from the extraction solvent (C8and C10) and from the cells are shown seperately (Fig. 4.25 A). It can be seen thatthe amount of yeast lipids in the treated samples did not vary significantly from the
101
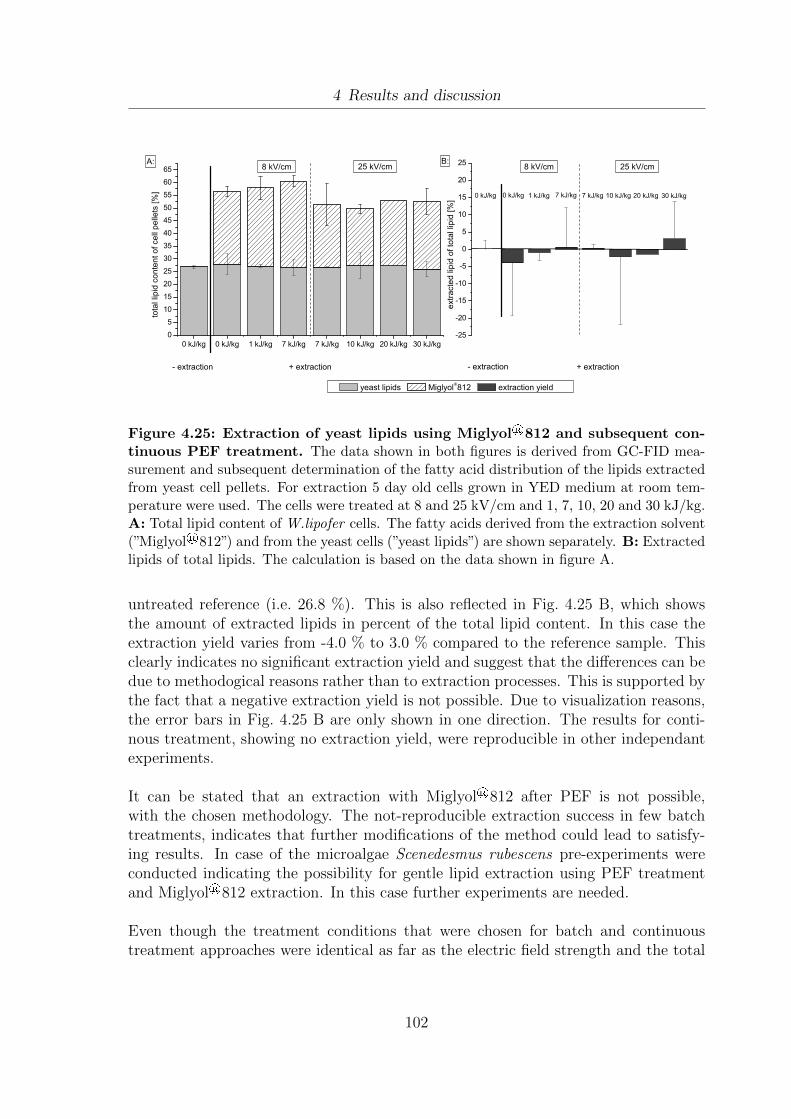
4 Results and discussion
0 k J / k g 0 k J / k g 1 k J / k g 7 k J / k g 7 k J / k g 1 0 k J / k g 2 0 k J / k g 3 0 k J / k g05
1 01 52 02 53 03 54 04 55 05 56 06 5 2 5 k V / c m
+ e x t r a c t i o n- e x t r a c t i o n
total
lipid c
onten
t of c
ell pe
llets [
%]8 k V / c m
- 2 5- 2 0- 1 5- 1 0- 505
1 01 52 02 5B :
3 0 k J / k g2 0 k J / k g1 0 k J / k g7 k J / k g7 k J / k g1 k J / k g0 k J / k g0 k J / k g
y e a s t l i p i d s M i g l y o l 8 1 2 e x t r a c t i o n y i e l d
2 5 k V / c m8 k V / c m
+ e x t r a c t i o n- e x t r a c t i o n
extra
cted l
ipid of
total
lipid
[%]
A :
Figure 4.25: Extraction of yeast lipids using Miglyol®812 and subsequent con-tinuous PEF treatment. The data shown in both figures is derived from GC-FID mea-surement and subsequent determination of the fatty acid distribution of the lipids extractedfrom yeast cell pellets. For extraction 5 day old cells grown in YED medium at room tem-perature were used. The cells were treated at 8 and 25 kV/cm and 1, 7, 10, 20 and 30 kJ/kg.A: Total lipid content of W.lipofer cells. The fatty acids derived from the extraction solvent(”Miglyol®812”) and from the yeast cells (”yeast lipids”) are shown separately. B: Extractedlipids of total lipids. The calculation is based on the data shown in figure A.
untreated reference (i.e. 26.8 %). This is also reflected in Fig. 4.25 B, which showsthe amount of extracted lipids in percent of the total lipid content. In this case theextraction yield varies from -4.0 % to 3.0 % compared to the reference sample. Thisclearly indicates no significant extraction yield and suggest that the differences can bedue to methodogical reasons rather than to extraction processes. This is supported bythe fact that a negative extraction yield is not possible. Due to visualization reasons,the error bars in Fig. 4.25 B are only shown in one direction. The results for conti-nous treatment, showing no extraction yield, were reproducible in other independantexperiments.
It can be stated that an extraction with Miglyol®812 after PEF is not possible,with the chosen methodology. The not-reproducible extraction success in few batchtreatments, indicates that further modifications of the method could lead to satisfy-ing results. In case of the microalgae Scenedesmus rubescens pre-experiments wereconducted indicating the possibility for gentle lipid extraction using PEF treatmentand Miglyol®812 extraction. In this case further experiments are needed.
Even though the treatment conditions that were chosen for batch and continuoustreatment approaches were identical as far as the electric field strength and the total
102

4 Results and discussion
Table 4.2: Comparison of batch and continuous PEF treatment conditions. Thetable shows the number of pulses for batch and continuous treatment at different energyinputs (i.e. 10 kJ/kg, 20 kJ/kg, 30 kJ/kg) at 25 kV/cm.
treatment conditions average pulse numberE [kV/cm] W [kJ/kg] batch continuous25 kV/cm 10 kJ/kg 8 pulses 3,8 pulses25 kV/cm 20 kJ/kg 16 pulses 7,5 pulses25 kV/cm 30 kJ/kg 25 pulses 11,3 pulses
energy input are concerned, a main difference between these two strategies remains.Due to the geometry of the used continuous treatment chamber the total amount ofpulses that are applied are significantly lower than in batch treatment mode. Thesedifferences are shown in Tab. 4.2. It can be seen that at 25 kV/cm and different totalenergy inputs, the number of pulses is always≈ 2 times higher in batch mode comparedto continuous treatment. This could explain, the occasional positive extraction results,which could be shown for batch treatment. However, other results obtained in thiswork suggest that the influence of the energy input/ the pulse number is minimal asoon as very high electric field strengths are used (Fig. 4.15). Potential modificationsfor the extraction method could be an increased extraction temperature, which wouldlead to a higher fluidity of the Miglyol®812. Moreover, the mixing could be supportedby using mild ultrasound treatment during the extraction process. This could lead toa larger surface for mass transfer processes in the yeast/Miglyol®812 mixture. Theuse of ultrasound as a pretreatment technology in stead of PEF treatment, will bediscussed in section 4.5.2.3.
4.5.2.3 Alternative processing concepts
Based on the information on yeast lipid extraction using PEF treatment and subse-quent gentle extraction using Miglyol®812 (chap. 4.5.2.2), other processing optionshave to be considered. This section addresses both the use of ultrasound treatment instead of PEF treatment and the applicability of a gentle heat drying process of PEFpretreated and de-watered yeast cells.
Application of ultrasound treatment
Since the application of PEF treatment prior to Miglyol®812 extraction did not leadto reproducible lipid extraction (chap. 4.5.2.2), the application of ultrasound treat-ment was tested. This approach is promising, because ultrasound is known for beingable to disrupt microbial cells. The first attempts go back to the early 20th cen-tury (Harvey and Loomis (1929)). The underlying mechanisms have been thoroughlystudied by Doulah (1977); Hughes and Nyborg (1962); Neppiras and Hughes (1964).
103
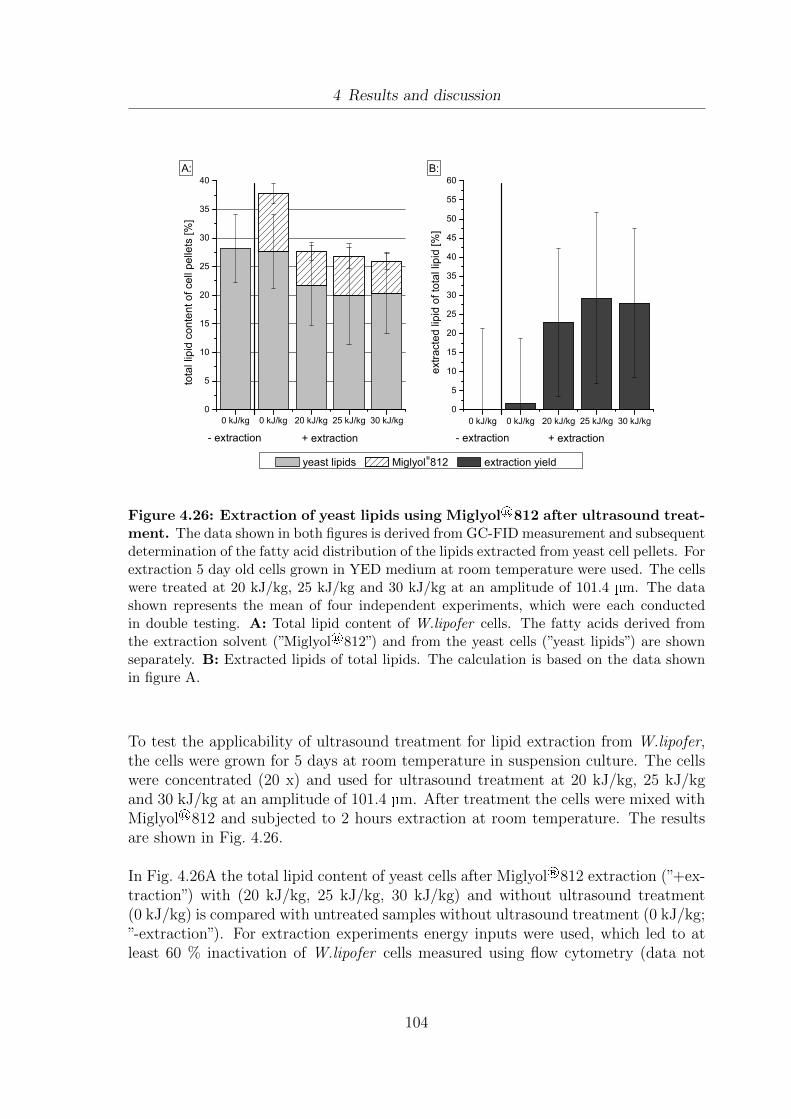
4 Results and discussion
0 k J / k g 0 k J / k g 2 0 k J / k g 2 5 k J / k g 3 0 k J / k g05
1 01 52 02 53 03 54 04 55 05 56 0
+ e x t r a c t i o n- e x t r a c t i o n+ e x t r a c t i o n- e x t r a c t i o n
B :A :
extra
cted l
ipid of
total
lipid
[%]
0 k J / k g 0 k J / k g 2 0 k J / k g 2 5 k J / k g 3 0 k J / k g0
5
1 0
1 5
2 0
2 5
3 0
3 5
4 0
y e a s t l i p i d s M i g l y o l 8 1 2 e x t r a c t i o n y i e l d
total
lipid c
onten
t of c
ell pe
llets [
%]
Figure 4.26: Extraction of yeast lipids using Miglyol®812 after ultrasound treat-ment. The data shown in both figures is derived from GC-FID measurement and subsequentdetermination of the fatty acid distribution of the lipids extracted from yeast cell pellets. Forextraction 5 day old cells grown in YED medium at room temperature were used. The cellswere treated at 20 kJ/kg, 25 kJ/kg and 30 kJ/kg at an amplitude of 101.4 µm. The datashown represents the mean of four independent experiments, which were each conductedin double testing. A: Total lipid content of W.lipofer cells. The fatty acids derived fromthe extraction solvent (”Miglyol®812”) and from the yeast cells (”yeast lipids”) are shownseparately. B: Extracted lipids of total lipids. The calculation is based on the data shownin figure A.
To test the applicability of ultrasound treatment for lipid extraction from W.lipofer,the cells were grown for 5 days at room temperature in suspension culture. The cellswere concentrated (20 x) and used for ultrasound treatment at 20 kJ/kg, 25 kJ/kgand 30 kJ/kg at an amplitude of 101.4 µm. After treatment the cells were mixed withMiglyol®812 and subjected to 2 hours extraction at room temperature. The resultsare shown in Fig. 4.26.
In Fig. 4.26A the total lipid content of yeast cells after Miglyol®812 extraction (”+ex-traction”) with (20 kJ/kg, 25 kJ/kg, 30 kJ/kg) and without ultrasound treatment(0 kJ/kg) is compared with untreated samples without ultrasound treatment (0 kJ/kg;”-extraction”). For extraction experiments energy inputs were used, which led to atleast 60 % inactivation of W.lipofer cells measured using flow cytometry (data not
104

4 Results and discussion
shown). The total lipid content is separated in lipids derived from yeast cells as wellas in lipids which originate from the gentle extraction solvent Miglyol®812 (mainlyC8 and C10). This separation was made based on GC-FID measurements. It canbe seen that the total yeast lipid content of untreated W.lipofer cells (i.e. 0 kJ/kg,”-extraction”) is 28.2 %. Comparable values for untreated cells were also shown inother independent experiments (Fig. 4.25). After Miglyol®812 extraction 27.7 %yeast lipids can be found in the cell. This value does not vary significantly from the”- extraction” sample. This indicates, that no lipid extraction can occur without ul-trasound treatment. This is in agreement with the findings shown for PEF treatment(Fig. 4.25). As soon as ultrasound treatment is applied, a reduction of the total yeastlipid content to 21.7 %, 19.9 % and 20.3 % can be observed at 20 kJ/kg, 25 kJ/kg and30 kJ/kg. It can be stated that the combination of ultrasound treatment and subse-quent Miglyol®812 extraction can be used for the extraction of yeast lipids. However,no additional influence can be seen between the different energy inputs. This is alsoshown in Fig. 4.26 B. Based on the data from figure A the amount of extracted lipidsin percent of the total lipid content was calculated. The ”-extraction” sample was usedas a reference sample and was set to 0 %. Compared to that value the addition ofMiglyol led to an extraction of 1.7 %, 23.0 %, 29.2 % and 28.0 % at 0 kJ/kg, 20 kJ/kg,25 kJ/kg and 30 kJ/kg, respectively.
When higher energy inputs were used, i.e. 40 kJ/kg and 50 kJ/kg, no additionalextraction was observed (data not shown). These energy inputs led to an increase ofthe sample temperature to 60 and 70 . In additional experiments a reduction ofthe vitality from 77.25 % to 4.05 % was observed when the tempertaure was increasedfrom 50 to 60 . At 20, 30 and 40 the vitality was 82.60 %, 88.60 % and83.85 %, respectively. In the literature synergistic effects of temperature and ultra-sound treatment were observed (Zenker et al. (2003); Garcia et al. (1989); Ordonezet al. (1987)). Since these synergistic effects were not observed as far as extractionyields obtained in this work are concerned, a further investigation on the synergisticeffect on the vitality was not conducted.
105

4 Results and discussion
Gentle heat drying after PEF treatment
Since PEF pretreatment does not allow significant extraction of fatty acids with theneutral lipid extraction solvent Miglyol®812 an alternative process will be tested. Inthis section the applicability of a gentle heat drying process after PEF pretreatmentwill be discussed. It was already shown in this work, that PEF treatment enhances themechanical de-watering of W.lipofer and allows protein and DNA extraction from thethe cells (chap. 4.5.1). By applying heat drying the rest of the water evaporates andleaves the lipid droplets, the cell organelles and the remaining cytoplasm componentssurrounded by the cell membrane and the cell wall. Since the cell wall of W.lipoferand other yeasts is composed of different carbohydrates (Weijman and van der Walt(1989), Roelofsen and Hoette (1951)) it is likely that this barrier can be used as”natural” encapsulation. The effect of PEF treatment on the enhancement of dryingprocesses and the influence of the gentle heat drying on the fatty acid compositionwill be tested.
0 5 1 0 1 5 2 0 2 5 3 0 3 5 4 00
1 0
2 0
3 0
4 0
5 0
6 0
7 0
8 0
moistu
re co
ntent
[%]
t i m e [ m i n ]
- P E F + P E F ( 2 5 k V / c m , 3 0 k J / k g )
5 % m o i s t u r e
Figure 4.27: Drying curves at 60 of untreated and PEF treated W.lipofer cells.(- PEF) = untreated; (+ PEF) = PEF treatment at 25 kV/cm, 30 kJ/kg. The dashed line(- - -) indicates a moisture content of 5 %.
The cells were grown in suspension culture in YED medium at 25 for 5 days. Cells
106

4 Results and discussion
subjected to continuous PEF treatment at 25 kV/cm and 30 kJ/kg as well as referencesamples were centrifuged and a precise volume (i.e. =11 mm, height= 2mm) of thecell pellets were used for analysis of the moisture content at 60. Cells subjected toPEF treatment and/or heat drying and untreated reference samples were subjectedto chemical lipid extraction and the lipids were analyzed using GC-FID measurementfor the determination of the fatty acid composition.
C 8 C 1 0 C 1 4 C 1 6 C 1 6 : 1 C 1 7 C 1 7 : 1 C 1 8 C 1 8 : 1 C 1 8 : 2 C 1 8 : 3 C 2 0 C 2 0 : 1 C 2 2 C 2 40
5
2 0
2 5
3 0
3 5
4 0
4 5
5 0
5 5
% of
total
fatty
acids
f a t t y a c i d s
- P E F ; - d r y i n g + P E F ; - d r y i n g - P E F ; + d r y i n g + P E F ; + d r y i n g
Figure 4.28: Influence of hot air drying and PEF on the fatty acid distributionof W.lipofer. Cells were grown in YED medium at 25 for 5 days. The fatty acid patternsof untreated (- PEF) and PEF treated cells (+ PEF) with (+ drying) and without gentleheat drying (- drying) at 60 were measured using gas chromatography (GC-FID).
In Fig. 4.27 it can be seen that the initial moisture content of the PEF-treated anduntreated samples are 68.15 % and 77.27 %, respectively. This is in agreement withthe data shown in Fig. 4.20. As far as a comparison of the drying curves is concerneda moisture content of 5 % was considered as desirable for further storage. Similiar val-ues were also reported in the literature. Zayed and Roos (2004) suggested a moisturecontent of 2.8 % to 5.6 % for freeze dried Lactobacillus salivarius cells to allow highestvitalities during storage. Fig. 4.27 shows that this value is reached after 28-29 min forPEF treated cells and after 36-37 min for untreated cells resulting in an accelarationof the drying time by 21.6-22.2 %. As far as the drying curves are concerned no sig-nificant difference can be seen. It is possible that the shorter drying time is only dueto the lower initial water content. Further experiments would be needed to determinethe exact difference in the drying behaviour. However, since the lower initial watercontent is a result of the PEF treatment it can be stated, that this technology allows
107

4 Results and discussion
faster drying of W.lipofer cells.
The influence of PEF treatment and drying on the fatty acid composition of W.lipofercells is depicted in Fig. 4.28. No difference between the different samples, i.e. - PEFand - drying, + PEF treatment and - drying, - PEF and + drying, + PEF treatmentand + drying, can be seen. This demonstrates, that the gentle heat drying does nothave an effect on the fatty acid pattern. As observed previously in this work (Fig.4.17), the main fatty acids found were C16:0, C18:0 and C18:1 as well as smalleramounts of C16:1, C18:2, C18:3, C22:0 and C24:0. These results are comparable tofindings described by other authors (Lomascolo et al. (1994); McElroy and Stewart(1967)).
Generally it can be stated that PEF treatment allows faster drying of W.lipofer cells,without an influence on the fatty acid pattern. Therefore the application of PEFprovides a promising pretreatment for drying procedures. The storage stability of theobtained dry yeast biomass needs to be investigated.
108
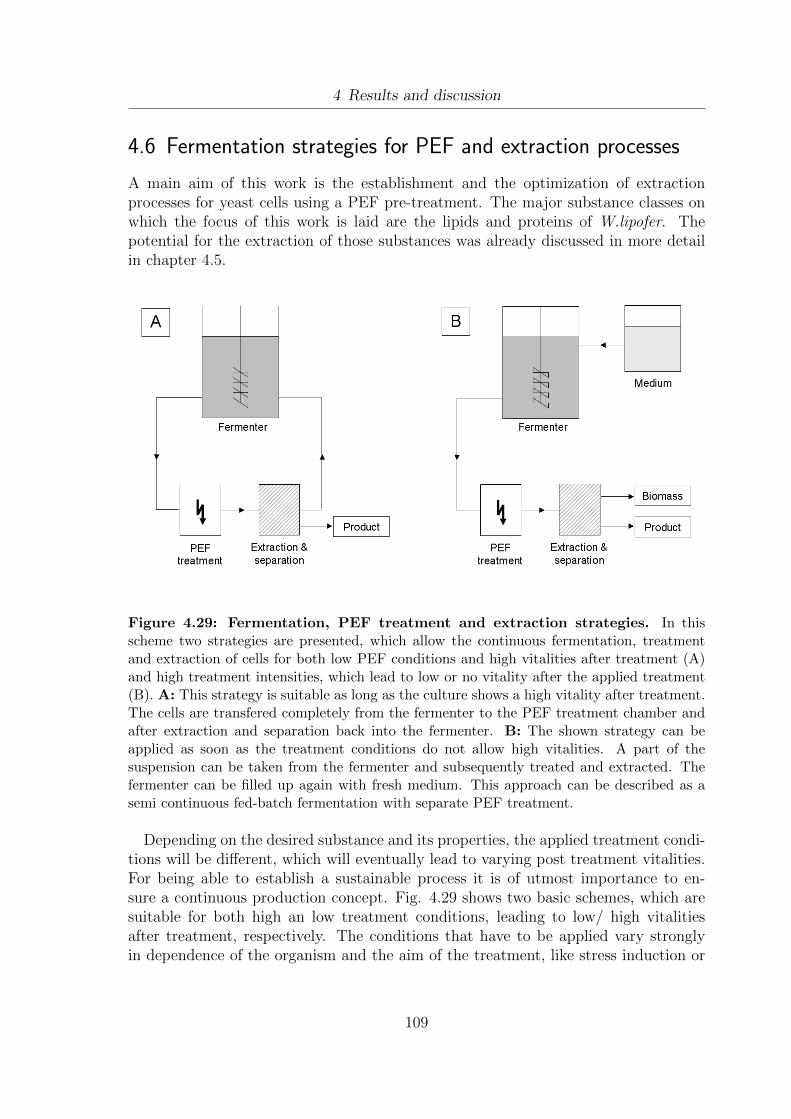
4 Results and discussion
4.6 Fermentation strategies for PEF and extraction processes
A main aim of this work is the establishment and the optimization of extractionprocesses for yeast cells using a PEF pre-treatment. The major substance classes onwhich the focus of this work is laid are the lipids and proteins of W.lipofer. Thepotential for the extraction of those substances was already discussed in more detailin chapter 4.5.
Figure 4.29: Fermentation, PEF treatment and extraction strategies. In thisscheme two strategies are presented, which allow the continuous fermentation, treatmentand extraction of cells for both low PEF conditions and high vitalities after treatment (A)and high treatment intensities, which lead to low or no vitality after the applied treatment(B). A: This strategy is suitable as long as the culture shows a high vitality after treatment.The cells are transfered completely from the fermenter to the PEF treatment chamber andafter extraction and separation back into the fermenter. B: The shown strategy can beapplied as soon as the treatment conditions do not allow high vitalities. A part of thesuspension can be taken from the fermenter and subsequently treated and extracted. Thefermenter can be filled up again with fresh medium. This approach can be described as asemi continuous fed-batch fermentation with separate PEF treatment.
Depending on the desired substance and its properties, the applied treatment condi-tions will be different, which will eventually lead to varying post treatment vitalities.For being able to establish a sustainable process it is of utmost importance to en-sure a continuous production concept. Fig. 4.29 shows two basic schemes, which aresuitable for both high an low treatment conditions, leading to low/ high vitalitiesafter treatment, respectively. The conditions that have to be applied vary stronglyin dependence of the organism and the aim of the treatment, like stress induction or
109
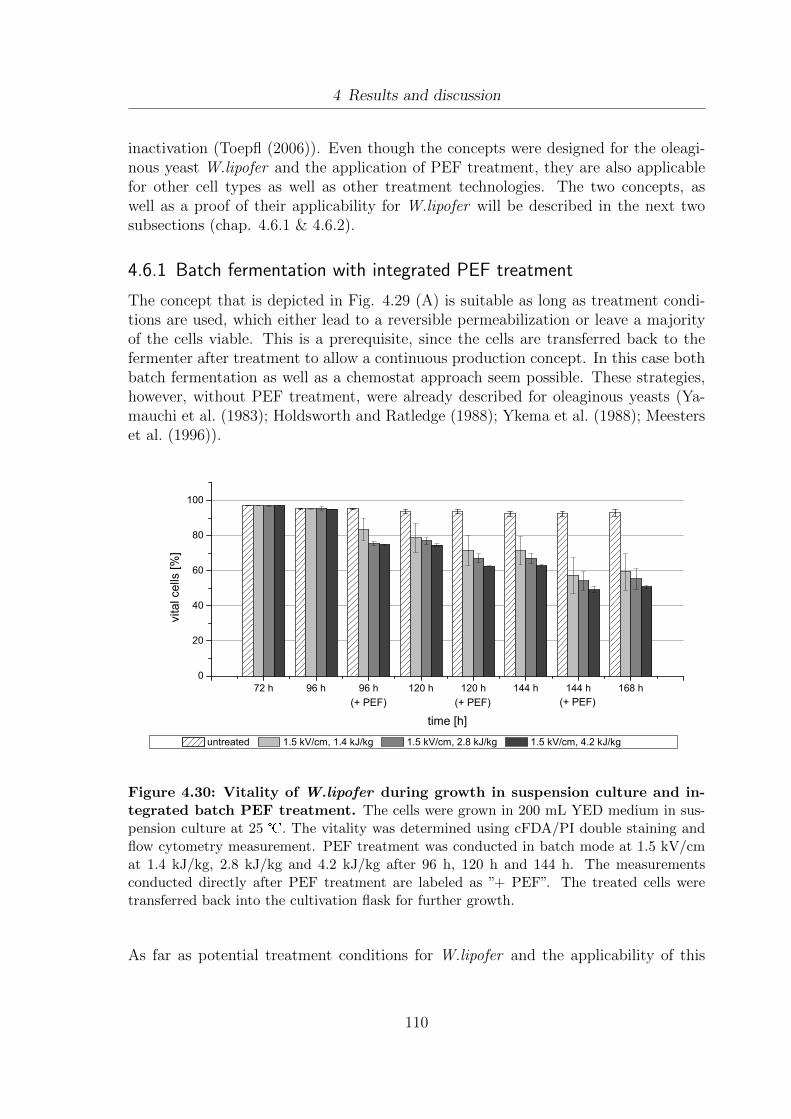
4 Results and discussion
inactivation (Toepfl (2006)). Even though the concepts were designed for the oleagi-nous yeast W.lipofer and the application of PEF treatment, they are also applicablefor other cell types as well as other treatment technologies. The two concepts, aswell as a proof of their applicability for W.lipofer will be described in the next twosubsections (chap. 4.6.1 & 4.6.2).
4.6.1 Batch fermentation with integrated PEF treatment
The concept that is depicted in Fig. 4.29 (A) is suitable as long as treatment condi-tions are used, which either lead to a reversible permeabilization or leave a majorityof the cells viable. This is a prerequisite, since the cells are transferred back to thefermenter after treatment to allow a continuous production concept. In this case bothbatch fermentation as well as a chemostat approach seem possible. These strategies,however, without PEF treatment, were already described for oleaginous yeasts (Ya-mauchi et al. (1983); Holdsworth and Ratledge (1988); Ykema et al. (1988); Meesterset al. (1996)).
7 2 h 9 6 h 9 6 h 1 2 0 h 1 2 0 h 1 4 4 h 1 4 4 h 1 6 8 h0
2 0
4 0
6 0
8 0
1 0 0
( + P E F ) ( + P E F )( + P E F )
u n t r e a t e d 1 . 5 k V / c m , 1 . 4 k J / k g 1 . 5 k V / c m , 2 . 8 k J / k g 1 . 5 k V / c m , 4 . 2 k J / k g
vital ce
lls [%
]
t i m e [ h ]
Figure 4.30: Vitality of W.lipofer during growth in suspension culture and in-tegrated batch PEF treatment. The cells were grown in 200 mL YED medium in sus-pension culture at 25 . The vitality was determined using cFDA/PI double staining andflow cytometry measurement. PEF treatment was conducted in batch mode at 1.5 kV/cmat 1.4 kJ/kg, 2.8 kJ/kg and 4.2 kJ/kg after 96 h, 120 h and 144 h. The measurementsconducted directly after PEF treatment are labeled as ”+ PEF”. The treated cells weretransferred back into the cultivation flask for further growth.
As far as potential treatment conditions for W.lipofer and the applicability of this
110
4 Results and discussion
continuous concept are concerned, the electric field strength is the main limiting fac-tor. Combining information from chapter 4.4.2 & 4.5.1 and literature for other yeaststrains (Hulsheger et al. (1983); Toepfl (2006)) electric field strengths below 5 kV/cmappear to be suitable. This way the concept can be applicable for stress inductionand/or the extraction of hydrophilic compounds. In the latter case the desired com-pounds can diffuse out of the reversibly damaged cells easier than lipophilic substances.
Due to technical reasons the data shown in Fig. 4.30 and Fig. 4.31 were derivedfrom cultivation in suspension culture and PEF treatment in batch mode. However,the basic principle is comparable to fermentation and continuous PEF-treatment. Theresults depicted in Fig. 4.30 show the vitality of W.lipofer during growth in suspensionculture with integrated PEF treatment. The cells were cultivated in 200 mL YEDmedium in 1000 mL Erlenmeyer flasks at 25 . The vitality was measured after 72h, 96 h, 120 h, 144 h and 168 h and additionally after each PEF treatment (+ PEF).The treatments were conducted after 96 h, 120 h and 144 h.
Throughout the entire growth it can be seen that the vitality of the untreated cellsof W.lipofer is always above 92 %, showing a slight decrease from 97.1 % after 72 hto 93.1 % after 168 h. As far as the influence of the PEF treatment is concerneda decrease of the vitality can be observed. After 96 h, before the first treatment,the vitality of all samples is comparable (95.3 %, 95.2 %, 95.5 % and 95.1 %). Theapplication of PEF treatment at 1.5 kV/cm and different energy inputs of 1.4 kJ/kg,2.8 kJ/kg and 4.2 kJ/kg leads to a reduction of the vitality to 83.5 %, 75.5 % and74.9 %, rspectively. No significant change to the vitalies measured directly beforethe next treatment after 120 h can be noticed. As soon as the cells are treated withPEF for the second time after 120 h, a further reduction of the vitality to 71.4 % at1.4 kJ/kg, 67.1 % at 2.8 kJ/kg and 62.41 % at 4.2 kJ/kg can be seen. These values arecomparable to the data measured after 144 h before the third and last PEF treatment.This last treatment led to a vitality decrease to 57.6 %, 54.2 % and 49.1 % at theaforementioned energy inputs of 1.4 kJ/kg, 2.8 kJ/kg and 4.2 kJ/kg. These valuesremained constant until the end of the fermentation at 168 h.
As already shown in previous experiments (Fig. 4.8; Raschke and Knorr (2009))the vitality of W.lipofer remains constantly high throughout growth experiments insuspension culture. The results do not indicate an adaptation of the cells to the treat-ment, since the application of PEF leads to a comparable decrease of the vitality after96 h, 120 h and 144 h for all energy inputs applied. If an adaptation of the cells toPEF occurred, this would probably lead to poor inactivation results in the second andthird treatment. This adaptation to PEF could have been possible due to a naturalcell population heterogeneity leading to rather sensitive and rather robust cells. As faras cell structure and regulation processes are concerned cell population heterogeneityhas been observed both for yeasts (Vanoni et al. (1983)) and bacteria (Kearns andLosick (2005)). The application of PEF treatment could have led to the inactivation
111
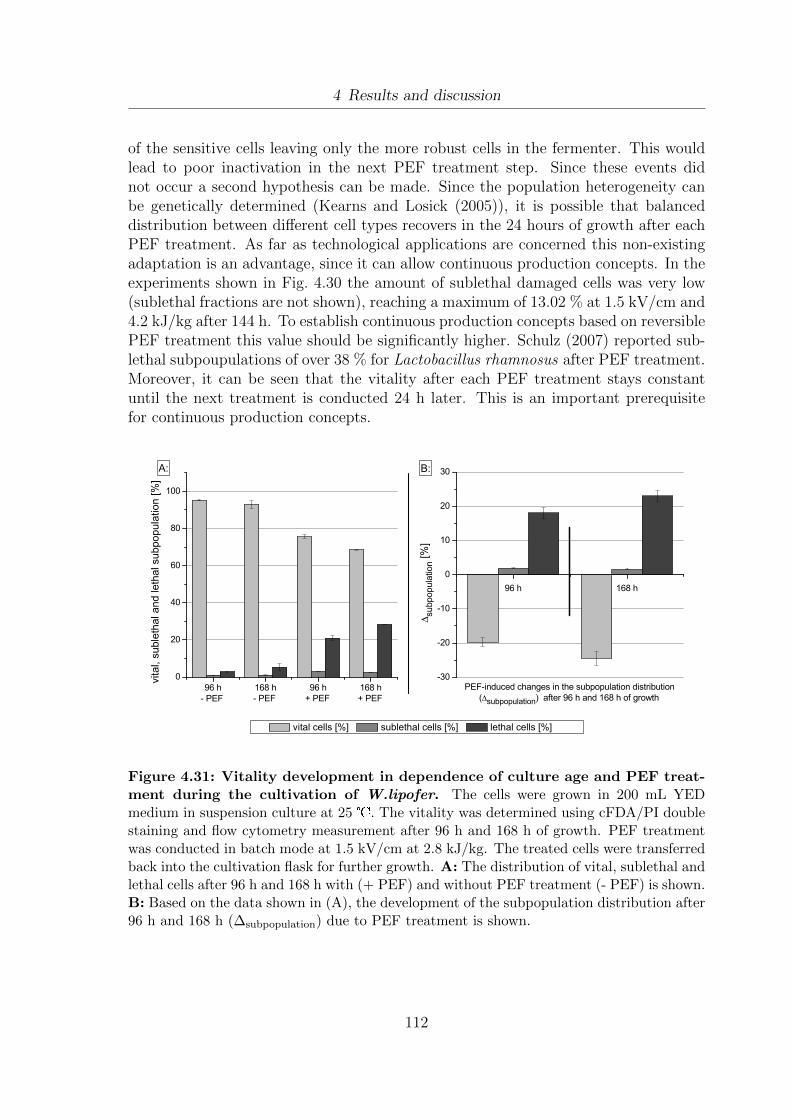
4 Results and discussion
of the sensitive cells leaving only the more robust cells in the fermenter. This wouldlead to poor inactivation in the next PEF treatment step. Since these events didnot occur a second hypothesis can be made. Since the population heterogeneity canbe genetically determined (Kearns and Losick (2005)), it is possible that balanceddistribution between different cell types recovers in the 24 hours of growth after eachPEF treatment. As far as technological applications are concerned this non-existingadaptation is an advantage, since it can allow continuous production concepts. In theexperiments shown in Fig. 4.30 the amount of sublethal damaged cells was very low(sublethal fractions are not shown), reaching a maximum of 13.02 % at 1.5 kV/cm and4.2 kJ/kg after 144 h. To establish continuous production concepts based on reversiblePEF treatment this value should be significantly higher. Schulz (2007) reported sub-lethal subpoupulations of over 38 % for Lactobacillus rhamnosus after PEF treatment.Moreover, it can be seen that the vitality after each PEF treatment stays constantuntil the next treatment is conducted 24 h later. This is an important prerequisitefor continuous production concepts.
9 6 h 1 6 8 h 9 6 h 1 6 8 h0
2 0
4 0
6 0
8 0
1 0 0
- P E F + P E F+ P E F
vital, s
ublet
hal a
nd le
thal su
bpop
ulatio
n [%]
v i t a l c e l l s [ % ] s u b l e t h a l c e l l s [ % ] l e t h a l c e l l s [ % ]
- P E F
9 6 h 1 6 8 h
- 3 0
- 2 0
- 1 0
0
1 0
2 0
3 0B :
P E F - i n d u c e d c h a n g e s i n t h e s u b p o p u l a t i o n d i s t r i b u t i o n ( ∆s u b p o p u l a t i o n ) a f t e r 9 6 h a n d 1 6 8 h o f g r o w t h
∆ subp
opula
tion [
%]
A :
Figure 4.31: Vitality development in dependence of culture age and PEF treat-ment during the cultivation of W.lipofer. The cells were grown in 200 mL YEDmedium in suspension culture at 25 . The vitality was determined using cFDA/PI doublestaining and flow cytometry measurement after 96 h and 168 h of growth. PEF treatmentwas conducted in batch mode at 1.5 kV/cm at 2.8 kJ/kg. The treated cells were transferredback into the cultivation flask for further growth. A: The distribution of vital, sublethal andlethal cells after 96 h and 168 h with (+ PEF) and without PEF treatment (- PEF) is shown.B: Based on the data shown in (A), the development of the subpopulation distribution after96 h and 168 h (∆subpopulation) due to PEF treatment is shown.
112
4 Results and discussion
To obtain information about the influence of the growth age on resistivity towards PEFtreatment, the untreated cells derived from the aforementioned experiment (Fig. 4.30),after 168 h, were subjected to PEF treatment at 1.5 kV/cm and 2.8 kJ/kg. The distri-bution of vital, sublethal and dead subpopulations of cells after 96 h and 168 h with(+ PEF) and without PEF treatment (- PEF) is depicted in Fig. 4.31 (A). Whencomparing the subpopulation distribution of untreated cells after 96 h and 168 h, onlya slight decrease of the percentage of vital cells and a slight increase of the percent-age of lethal cells (both ≤ 2.5 %) with increasing culture age can be observed. Asimilar shift, however, with somewhat higher values (i.e. ≤ 7.5 %), can be seen whenthe PEF treated cells (+ PEF) after 96 h and 168 h are compared. In general atendency towards lower vitalities in older cultures can be stated. As far as the PEF-induced changes in the subpopulation distribution (∆subpopulation) after 96 h and 168 hof growth are concerned the results are depicted in Fig. 4.31 (B). The changes werecalculated by subtracting the percentage of a given subpopulation (vital, sublethalor lethal) before PEF treatment from the percentage after PEF treatment from thesame treatment time. It can be seen that PEF treatment induces a decrease in thepercentage of vital cells leading a slight increase in sublethal and a stronger increasein dead cells. However, the results indicate that the cells after 96 hours are slightlyless susceptible to PEF treatment, since the vital subpopulation decreases by 19.8 %compared to 24.5 % after 168 hours. In a previous chapter a reverse effect was shown,indicating a decreasing susceptibility to PEF treatment with increasing age, when 3-6day old cells were compared (Fig. 4.16). This observation can be explained, sincethe cells in these two experiments were treated at different PEF conditions and thedata shown in Fig. 4.31 was obtained after 168 hours of growth, while the experimentdepicted in Fig. 4.16 was stopped after 144 hours. It is obvious that cells, even ifthey get more rigid and less susceptible to PEF treatment during stationary phase asdicussed in chapter 4.4.2.2, eventually will become more susceptible to unfavourableconditions (e.g. PEF treatment) as soon as they enter ”death phase”. These weakendoverall fitness can be due to a lack of carbon source or other nutrients as well as of anaccumulation of secondary metabolites in the media.
It can be summarized that repeated low intensity PEF treatment in fermentationprocesses of W.lipofer provides a promising strategy for the extraction of metabolites.A prerequisite for the application of this process design is the existence of treatmentconditions, which allow both satisfying extraction results and high vitalities aftertreatment. Based on the findings described in chapter 4.5 this is more likely for theextraction of hydrophilic substances. As soon as the aforementioned prerequisite is notfulfilled, and the extraction conditions do not allow high vitalities after treatment, analternative strategy can be applied, which will be described in the next section (4.6.2).
113
4 Results and discussion
4.6.2 Semi continuous fed-batch fermentation with separate PEFtreatment
The second concept that can be applied (Fig. 4.29 B) is suitable as soon as the optimalPEF conditions for the desired extraction process do not allow high vitalities aftertreatment. This is possible, since a fed-batch approach is chosen as the fermentationstrategy. The cells that are needed for PEF treatment and subsequent extraction aretaken from the cultivation vessel and are not transfered back to the fermenter aftertreatment. This is the main difference compared to the approach described before (Fig.4.29 A). The fermenter can be refilled with fresh medium allowing further growth ofthe yeast cells. After treatment both the extracted product and yeast biomass isobtained. The sustainability of this process is based on the semi-continuous growthin the fermenter and the further use of the yeast biomass that accumulates during theprocess. The past, present and potential future uses of yeast biomass, like animal feed,auto-/hydrolysates, β- glucan or enzyme extraction, have recently been summarizedfor S. cerevisiae by Ferreira et al. (2010).
The applicability of the fermentation concept was tested. Therefore the ability of theyeast cells to remain viable and continue their growth after suspension removal andthe addition of fresh media was determined, by comparing the desired semi- contin-uous fed-batch approach with a standard batch fermentation. The yeast cells werecultivated in a dual fermenter in YED medium at 25 , pH 5.5 and constant aerationof 3 l/min (Fig. 4.32). Both fermentations were conducted at identical conditionsuntil the stationary phase was reached. Starting at 90 h one fermentation was contin-ued in batch mode without further changes (”control”), while the other fermentationwas subjected to the described semi- continuous fed-batch approach (”semi continuousfed-batch”). In the latter case every 48 hours the suspension volume was reduced to400 mL. The fermenter was subsequently refilled to a volume of 750 mL with freshYED medium. The vitality values shown resemble the vital fraction determined usingflow cytometry after cFDA/PI double staining. By comparing the two fermentationsit can be seen that the optical density of the ”control” fermenter shows normal growthcharacteristics in terms of optical density (OD), which are comparable to the valuesdemonstrated for suspension culture experiments (Fig. 4.7) as well as for fermenta-tions (Fig. 4.10). It has to be taken into account, when comparing suspension cultureand fermentation ODs, that the OD values determined during fermentation, were de-rived directly from the on line measurement of the fermenter and are therefore notdiluted. It can be seen that there is a slight but constant increase of the OD of the”control” fermentation after the stationary phase is reached (Fig. 4.32). This is due tothe long fermentation time and the continuous evaporation of water, leading to highercell densities and therefore higher OD values. This effect can not be seen in the ”semicontinuous fed-batch” approach, since the fermenter was refilled with fresh mediumto a certain limit (i.e. 750 mL) after each suspension removal (s. above). As far asthe OD development in the semi continuous fed-batch approach is concerned it can
114
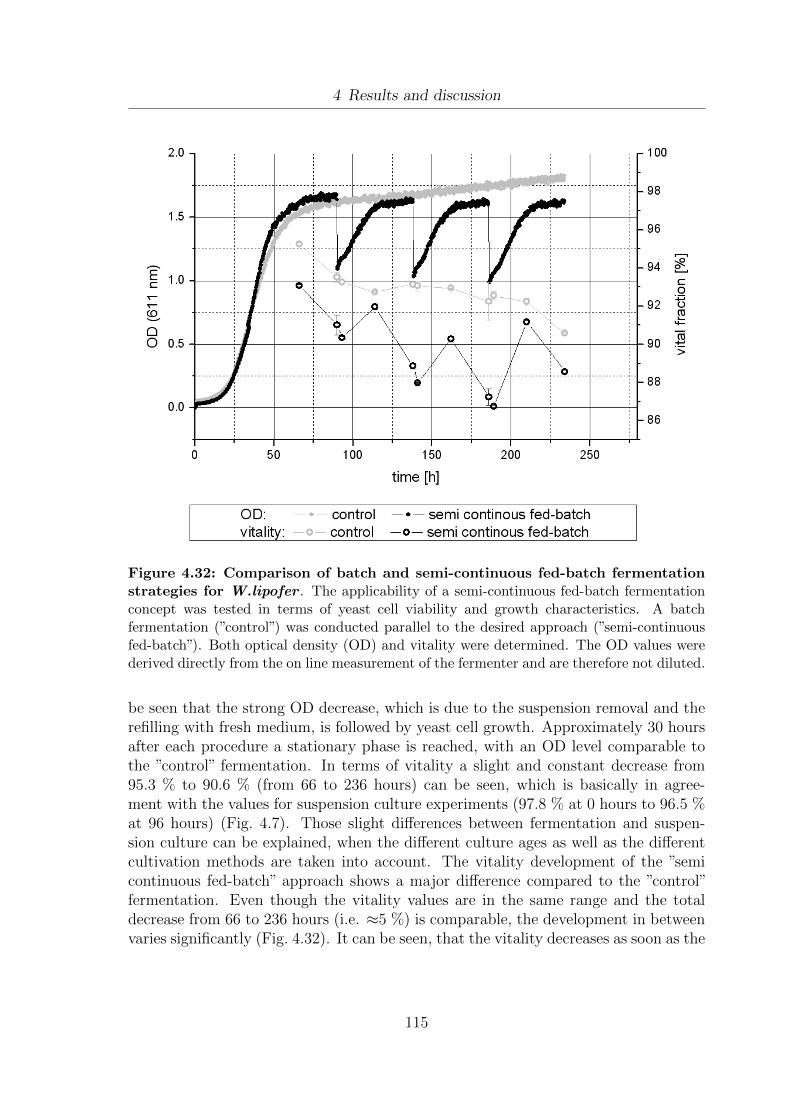
4 Results and discussion
Figure 4.32: Comparison of batch and semi-continuous fed-batch fermentationstrategies for W.lipofer . The applicability of a semi-continuous fed-batch fermentationconcept was tested in terms of yeast cell viability and growth characteristics. A batchfermentation (”control”) was conducted parallel to the desired approach (”semi-continuousfed-batch”). Both optical density (OD) and vitality were determined. The OD values werederived directly from the on line measurement of the fermenter and are therefore not diluted.
be seen that the strong OD decrease, which is due to the suspension removal and therefilling with fresh medium, is followed by yeast cell growth. Approximately 30 hoursafter each procedure a stationary phase is reached, with an OD level comparable tothe ”control” fermentation. In terms of vitality a slight and constant decrease from95.3 % to 90.6 % (from 66 to 236 hours) can be seen, which is basically in agree-ment with the values for suspension culture experiments (97.8 % at 0 hours to 96.5 %at 96 hours) (Fig. 4.7). Those slight differences between fermentation and suspen-sion culture can be explained, when the different culture ages as well as the differentcultivation methods are taken into account. The vitality development of the ”semicontinuous fed-batch” approach shows a major difference compared to the ”control”fermentation. Even though the vitality values are in the same range and the totaldecrease from 66 to 236 hours (i.e. ≈5 %) is comparable, the development in betweenvaries significantly (Fig. 4.32). It can be seen, that the vitality decreases as soon as the
115
4 Results and discussion
yeast cells reach stationary phase (i.e. 90, 138, 186 hours) directly before each suspen-sion removal and refilling. Three hours after these events (i.e. 93, 141, 189 hours) thevitality decreases by 0.69 % (+/- 0.19) on average. Twenty-one hours later (i.e. 114,162, 210 hours) the vitality increased again, to 92.0, 90.3 and 91.2 %, respectively. Atthe end of the fermentation from 210 to 234 hours the vitality decreased from 91.2to 88.6 %. The vitality curve clearly demonstrates, that both high cell densities aswell as the process of suspension removal lead to a decrease in vitality. However, inthe phases of exponential growth in between an increase in vitality can be observed,which is due to the increasing amount of cell divisions and therefore of young andvital cells. The vitality decrease in stationary phase can be due to several reasonsincluding depletion of nutrients or accumulation of by-products. It is widely knownthat after being in stationary phase cells enter a death phase. It is possible that thisslight decrease of vitality resembles the first indicator for the starting death phase.The decrease of vitality, which was observed three hours after each suspension removaland refilling can be due to this process itself. During the removal using a peristalticpump the aeration of the fermenter is stopped for a period of several minutes. This canlead to stress reactions and decreasing vitality, since facultative anaerobic organismsare subjected to many modifications in their metabolism as shown for Escherichia coli(Spiro and Guest (1991)) and S.cerevisiae (Zitomer and Lowry (1992)).
The applicability of this process was demonstrated. Even though there are changesin the vitality the concept is still promising, if the desired PEF conditions do notallow high vitalities after treatment. Further tests revealed, that it is also possible toreduce the removed suspension volume, thus shortening the intervals. This indicatesthe possibility for further modifications and optimizations of the proposed concept toobtain e.g. higher extraction yields. This modification can therefore be conductedadditionally to the optimization of the treatment and extraction conditions itself.
116
5 Summary
5.1 Method development for growth monitoring and media
optimization
A rapid method for vitality monitoring of the oleaginous yeast W.lipofer usingflow cytometry was established. This was achieved by combining Carboxyfluorescein-diacetate (cFDA), which stains esterase active cells and Propidium Iodide (PI),which can only enter permeabilized cells. By applying these two fluorescent dyesin a double staining method, ”vital”, ”dead” and ”sublethal” cells can be distin-guished. This method was developed based on an approach for Lactobacillusrhamnosus, which was published by Ananta et al. (2005).
In this work two methods were established for the rapid monitoring of lipiddroplet development in W.lipofer. On the one hand the lipophilic fluorescentdye Nile Red can be used for selective staining of lipid droplets. The lipiddroplet accumulation over time can be determined based on the increase of thefluorescence intensity. Thus, a shift of the FL2 fluorescence (emission wavelength: 575 nm +/- 15 nm) can be measured using flow cytometry. On theother hand flow particle image analysis (FPIA) provides a useful tool for thevisualization of the lipid droplets within the cell. These structures can be clearlydistinguished from the surrounding cytoplasm. Moreover FPIA was applied forthe measurement of cell size and cell shape. It was shown that the combinationof Nile Red staining and subsequent flow cytometric assessment combined withdata obtained from FPIA measurement can be used for rapid monitoring of lipiddroplet development.
This work demonstrates that the combination of FPIA and flow cytometry is ofgreat use for growth monitoring of the oleaginous yeast W.lipofer. Besides vital-ity, and lipid droplet development also cell size and cell shape can be measured.This information can be obtained in less than 45 min after sampling.
For being able to determine the lipid content of W.lipofer cells, various chemicalextraction methods and mechanical disintegration techniques were compared.It was shown, that a chemical extraction, using the methods of Bligh & Dyerand Schneiter & Daum, after a mechanical pretreatment, using glass beads in acell homogenizer, were effective methods for lipid extraction, revealing extrac-tion yields of 16.2 % and 22.2 %, respectively. These values were signifcantly
117
5 Summary
higher compared to the alternative of using glass beads and vortexing as me-chanical pretreatment (12.4 % and 17.4 %). If Bligh & Dyer extraction withoutmechanical pretreatment or the extraction method of Weibull-Stoldt was used,the extraction yield was always below 10 %. The method of Bligh & Dyer wasapplied in all further experiments, since it was less time consuming still allowinga comparison between different samples.
As far as media optimization is concerned YED (yeast extract, glucose) mediumwas chosen for the cultivation of W.lipofer. This was due to a combination ofhigh maximal optical density (ODmax= 18.6), fast doubling times (td= 9.0) anda suitable electric conductivity (i.e. 0,96 mS/cm) for PEF treatment.
5.2 Growth Monitoring
The rapid monitoring methods, that were developed, were applied in growthexperiments with W.lipofer in suspension culture over 4 days at 25 in YEDmedium. The measurement revealed a normal growth curve (ODmax= 21.8;td= 7.1 h) and slightly decreasing, but constantly high vitality, which was alwaysabove 96.5 %.
Both flow cytometry and FPIA measurement revealed an increasing lipid accu-mulation starting in the late exponential phase, which is in agreement with theliterature (Ratledge (1985)). As far as the cell size is concerned, a characteristicdevelopment was to be seen in various suspension culture experiments, showinga large cell diameter in the lag-phase, a rapid decrease towards early exponen-tial phase followed by an increase during late exponential and stationary phase.In fermentations, which were conducted with and without pH control, it wasrevealed, that this characteristic cell size development only occurs without pHcontrol. A correlation between a pH drop starting in the early exponential phaseand the cell size was found. Moreover, it was found that the growth rate corre-lates with the cell size development in cultures without pH control. Combiningthese observations it was postulated that the cell size of W.lipofer is influencedby the lipid droplet development, the pH and the growth rate.
5.3 Influence of PEF on physiology
In this work it was shown that PEF treatment has an influence on the structuralintegrity of W.lipofer. Using FPIA it was visualized that the cells loose theirclear distinction between cytoplasm and lipid droplet after PEF treatment at25 kV/cm and 10 kJ/kg. By staining with the lipophilic dye Nile Red andsubsequent fluorescence microscopy it was demonstrated that the lipid dropletsof untreated cells are restricted to a limited area of the cell, while the lipids of
118
5 Summary
PEF treated cells are distributed equally over the entire cell. This can be due toa destruction of these structures, or to a reduction of the cell size due to PEF.
The influence of PEF on cell size and vitality was also investigated. A clear cor-relation between these parameters was found. While a low electric field strengthof 2 kV/cm had no influence on both parameters, it was shown that even thelowest energy inputs applied lead to a maximal decrease in cell size and vitality,when the cells were treated at an electric field strength of 25 kV/cm. At a moder-ate electric field strength of 3.75 kV/cm an increasing energy input from 1 kJ/kgto 15 kJ/kg led to a constant decrease in cell size and vitality by ≈ 9 % and≈ 50 %, respectively. Based on these findings the critical electric field strengthwas determined between 2 kV/cm and 3.75 kV/cm. This is in agreement withvalues described in the literature for other yeasts (Toepfl (2006); Hulsheger et al.(1983)).
Based on GC-FID measurements no influence of PEF treatment on the fattyacid pattern of W.lipofer was detected. The cells were treated using batch(25 kV/cm; 1 kJ/kg and 10 kJ/kg) and continuous treatment (8 kV/cm, 7 kJ/kgand 25 kV/cm, 7 kJ/kg and 30 kJ/kg). The main fatty acids of W.lipofer areC16:0, C18:0 and C18:1 and small amounts of C16:1, C18:2, C18:3, C22:0 andC24:0. These results suggest the application of PEF treatment for the extractionof fatty acids, since no structural modifications have to be expected.
5.4 Influence of PEF on extraction processes
The influence of PEF on the extraction of hydrophilic substances from W.lipoferwas investigated. It was shown that PEF treatment at 2 kV/cm led to no sig-nificant increase in the dry weight of the cells. This indicates that no cyto-plasm components can be extracted at these low electric field strengths. Above5 kV/cm the dry weight increases with increasing energy input. The dry weightof untreated samples was 21.7 % and 26.6 % after treatment at 15 kJ/kg. Forthe electric field strengths 10 kV/cm, 15 kV/cm and 20 kV/cm comparable ten-dencies were shown. As far as proteins are concerned, it was shown, that noextraction occurred at 2 kV/cm, poor extraction was shown at 5 kV/cm andvarying energy inputs. At higher electric field strengths of 10 kV/cm, 15 kV/cmand 20 kV/cm an increasing extraction with increasing energy input was shown.The extraction yield of these three electric field strengths were comparable. Incase of 10 kV/cm, 11.4 %, 22.1 % and 22.9 % proteins of the total protein contentwere extracted at 1 kJ/kg, 10 kJ/kg and 50 kJ/kg, respectively. It was demon-strated that PEF can be used for the extraction of DNA from W.lipofer. Com-parable extraction yields were demonstrated for 5 kV/cm, 10 kV/cm, 15 kV/cmand 20 kV/cm, while no significant extraction occurred at 2 kV/cm. In caseof 5 kV/cm, 62.2 %, 70.9 % and 68.7 % DNA of the total DNA content were
119

5 Summary
extracted at 1 kJ/kg, 10 kJ/kg and 15 kJ/kg, respectively. Generally it can bestated that PEF treatment is applicable for the extraction of hydrophilic sub-stances from yeast cells. Depending on the approach a minimum electric fieldstrength of 5-10 kV/cm is needed.
In this work, the influence of PEF treatment on the extraction of lipophilicsubstances was investigated. As a gentle extraction solvent Miglyol®812 wasused. No significant extraction yield was shown for both batch and continuoustreatment strategies. In few experiments satisfactory extraction yields weredemonstrated for batch treatment, however, these results were not reproducible.Treatment conditions between 0-25 kV/cm and 0-30 kJ/kg were used.
Since no satisfactory yield was shown for the extraction of lipophilic substancesfrom W.lipofer, alternative strategies were tested. By using ultrasound treat-ment, in stead of PEF treatment, up to 29.2 % of total lipids were extracted atan energy input of 25 kJ/kg.
Due to the poor extraction yield for lipophilic substances it was tested whetherit is possible to apply PEF treatment and a subsequent gentle heat drying. Thisway the cell wall could be used as a ”natural”encapsulation. It was demonstratedthat PEF pretreatment allows mechanical de-watering, protein extraction andenhanced gentle heat drying. Moreover no negative influence of the dryingprocess on the fatty acid pattern was seen.
To allow continuous extraction concepts the PEF treatment has to be integratedinto the fermentation setup. Therefore different fermentation strategies weretested. As long as the cells remain viable, a continuous strategy can be applied.In laboratory scale tests no adaptation of the cells to PEF treatment was shown.As soon as the desired extraction conditions do not allow sufficient cell vitalityafter treatment an alternative approach was demonstrated. In this case a semi-continuous fed-batch fermentation can be applied. Cell suspension was removedfrom the fermenter in early stationary phase and the fermentation flask wasrefilled with fresh medium. The experiments revealed that after cell suspensionremoval the cells continued growing up to the previous optical density level.A slight decrease of the vitality from ≈ 94 % to ≈ 90 % was shown for bothreference and semi-continuous fed-batch sample. However, the influence of theremoval and refilling process can be seen in stronger variations of the cell vitalityduring the entire growth curve. A decrease of the vitality was demonstrateddirectly after suspension removal. The vitality recovers during the followinggrowth period. It can be stated, that processing strategies were succesfullytested, which allow the integration of PEF treatment into fermentation concepts.
120
6 Conclusions & Perspectives
6.1 Growth Monitoring and media optimization
A future aim could be the adaptation of the flow cytometry methodology forother yeast strains including S.cerevisiae as well as other oleaginous yeasts,since rapid monitoring methods are of great interest, as soon as fermentationconcepts have to be established. The needed modifications of the method couldbe achieved by optimizing both the staining conditions, e.g. dye concentra-tion, staining time and staining temperature and also by adaptation of the flowcytometer parameters, e.g. fluorescence channel settings and the compensation.
As far as media optimization is concerned other growth media should be tested.Of great interest are media, which accrue in industrial processes. Besides wheypermeate and glycerol, which were already tested in this approach, peat mosshydrolysate or molasses could be used.
Further research could be done concerning the optimization of the lipid ex-traction methods using organic solvents. Even though sufficient results wereobtained by using the methods of Bligh & Dyer and of Schneiter & Daum bothapproaches are very time- consuming and therefore not useful for rapid moni-toring.
A correlation between fluorescence intensity after Nile Red staining and theextraction yield of the chemical extraction should be made. This way a rapidquantification of the lipid content during fermentation could be possible.
6.2 Influence of PEF on physiology
Based on the PEF induced structural changes that were detected using flowcytometry and FPIA, further investigations are needed. It has to be shownwhether the demonstrated water loss can explain the distribution of lipids overthe entire cell. It is not clear whether PEF leads to a disruption of the lipiddroplets.
Another topic that has to be addressed in further investigations is the influ-ence of PEF treatment on stress induction in yeast. As far as plant cells areconcerned the stress induction has already been investigated (Galindo et al.
121
6 Conclusions & Perspectives
(2009)). Plasma membrane damage due to e.g. detergents or antifungal sub-stances was show to trigger the stress response element (STRE) in S.cerevisiae(Moskvina et al. (1999)). This could potentially lead to the production of aspecial heat shock protein (HSP12), which itself is regulated via STRE (Varelaet al. (1995)). This way a potential connection between PEF treatment andyeast stress response could be drawn. A mutant strain of S.cerevisiae, whichproduces a fusion protein of HSP12 and the green fluorescent protein (GFP)(Karreman and Lindsey (2005)) could be used to test, whether PEF inducedstress response is regulated via STRE and HSP12.
6.3 Influence of PEF on extraction processes
PEF treatment was shown to be effective for the mechanical de-watering ofW.lipofer and for the extraction of its DNA and proteins. The effectivity of theprotein extraction could be improved by optimization of the extraction condi-tions e.g. the extraction time and/ or temperature. The mechanical de-watering,that was shown on a laboratory scale using centrifugation, should be tested ona technical scale using a decanter centrifuge.
The extraction of lipophilic substances using Miglyol®812 could be optimized bymodification of the extraction conditions. Besides extraction time and/or tem-perature the method could also be optimized by using mild ultrasound treatmentduring extraction. This could improve the mixing and therefore lead to a largersurface for mass transfer processes in the yeast/Miglyol®812 mixture.
A further optimization of the drying experiments is needed. Different dryingmethods, e.g. freeze drying or spray drying have to be tested. Additionally thestorage stability of the fatty acids in the dried yeast cells has to be determined.
122
Bibliography
AAPS Pharmaceutica. Miglyol® product information. http://abstracts.
aapspharmaceutica.com/ExpoAAPS07/Data/EC/Event/Exhibitors/263/
cb63fb76-28f4-4948-a6d0-ae249dae9c30.pdf, May 2010.
S. Abd-Aziz, D. Ang, H. M. Yusof, M. I. A. Karim, A. B. Ariff, K. Uchiyama, andS. Shioya. Effect of C/N ratio and starch concentration on ethanol production fromsago starch using recombinant yeast. World journal of microbiology & biotechnology,17(7):713–719, 2001.
F. Abe. Hydrostatic pressure enhances vital staining with carboxyfluorescein or car-boxydichlorofluorescein in Saccharomyces cerevisiae: efficient detection of labeledyeasts by flow cytometry. Applied Environmental Microbiology, 64(3):1139–1142,Mar 1998.
I. G. Abidor, V. B. Arakelyan, L. V. Chernomordik, Y. A. Chizmadzhev, V. F. Pas-tushenko, and M. R. Tarasevich. Electric breakdown of bilayer lipid membranes i.the main experimental facts and their qualitative discussion. Bioelectrochemistryand Bioenergetics, 6(1):37–52, 1979.
B. Ade-Omowaye, A. Angersbach, K. Taiwoy, and D. Knorr. Use of pulsed electric fieldpretreatment to improve dehydration characteristics of plant based foods. Trendsin Food Science & Technology, 12:285–295, 2001a.
B. Ade-Omowaye, N. Rastogi, A. Angersbach, and D. Knorr. Effects of high hydro-static pressure or high intensity electrical field pulse pre-treatment on dehydrationcharacteristics of red paprika. Innovative Food Science and Emerging Technologies,2:1–7, 2001b.
B. Ade-Omowaye, N. Rastogi, A. Angersbach, and D. Knorr. Combined effects ofpulsed electric field pre-treatment and partial osmotic dehydration on air dryingbehaviour of red bell pepper. Journal of Food Engineering, 60:89–98, 2003.
Air Liquide. Gas encyclopedia. http://encyclopedia.airliquide.com/
Encyclopedia.asp?GasID=26, April 2010.
P. Akhtar, J. I. Gray, and A. Asghar. Synthesis of lipids by certain yeast strains grownon whey permeate. Journal of Food Lipids, 5(4):283–297, 1998.
123
Bibliography
C. M. Albert, H. Campos, M. J. Stampfer, P. M. Ridker, J. E. Manson, W. C. Willett,and J. Ma. Blood levels of long-chain n-3 fatty acids and the risk of sudden death.New England Journal of Medicine, 346(15):1113–1118, Apr 2002. doi: 10.1056/NEJMoa012918. URL http://dx.doi.org/10.1056/NEJMoa012918.
H. M. Alvarez, F. Mayer, D. Fabritius, and A. Steinbuchel. Formation of intracytoplas-mic lipid inclusions by Rhodococcus opacus strain PD630. Archives of Microbiology,165(6):377–386, Jun 1996.
I. Alvarez, J. Raso, A. Palop, and F. J. Sala. Influence of different factors on the in-activation of Salmonella senftenberg by pulsed electric fields. International Journalof Food Microbiology, 55(1-3):143–146, Apr 2000.
E. Ananta, D. Voigt, M. Zenker, V. Heinz, and D. Knorr. Cellular injuries upon expo-sure of Escherichia coli and Lactobacillus rhamnosus to high-intensity ultrasound.Journal of Applied Microbiology, 99(2):271–278, 2005. doi: 10.1111/j.1365-2672.2005.02619.x. URL http://dx.doi.org/10.1111/j.1365-2672.2005.02619.x.
C. Angerbauer, M. Siebenhofer, M. Mittelbach, and G. M. Guebitz. Conversion ofsewage sludge into lipids by Lipomyces starkeyi for biodiesel production. BioresourceTechnology, 99(8):3051–3056, May 2008. doi: 10.1016/j.biortech.2007.06.045. URLhttp://dx.doi.org/10.1016/j.biortech.2007.06.045.
A. Angersbach, V. Heinz, and D. Knorr. Effects of pulsed electric fields on cell mem-branes in real food systems. Innovative Food Science and Emerging Technologies,1(2):135–149(15), 2000.
A. Angersbach, V. Heinz, and D. Knorr. Evaluation of process-induced dimensionalchanges in the membrane structure of biological cells using impedance measurement.Biotechnology Progress, 18(3):597–603, 2002. doi: 10.1021/bp020047j. URL http:
//dx.doi.org/10.1021/bp020047j.
B. Annous, L. Becker, D. Bayles, D. Labeda, and B. Wilkinson. Critical role of anteiso-C15:0 fatty acid in the growth of Listeria monocytogenes at low temperatures.Applied Environmental Microbiology, 63(10):3887–3894, 1997. URL http://aem.
asm.org/cgi/content/abstract/63/10/3887.
K. Athenstaedt and G. Daum. Phosphatidic acid, a key intermediate in lipidmetabolism. European Journal of Biochemistry, 266(1):1–16, Nov 1999.
K. Athenstaedt and G. Daum. The life cycle of neutral lipids: synthesis, stor-age and degradation. Cellular and Molecular Life Sciences, 63(12):1355–1369,Jun 2006. doi: 10.1007/s00018-006-6016-8. URL http://dx.doi.org/10.1007/
s00018-006-6016-8.
124

Bibliography
K. Athenstaedt, D. Zweytick, A. Jandrositz, S. D. Kohlwein, and G. Daum. Identifica-tion and characterization of major lipid particle proteins of the yeast Saccharomycescerevisiae. Journal of Bacteriology, 181(20):6441–6448, Oct 1999.
K. Athenstaedt, P. Jolivet, C. Boulard, M. Zivy, L. Negroni, J.-M. Nicaud, andT. Chardot. Lipid particle composition of the yeast Yarrowia lipolytica dependson the carbon source. Proteomics, 6(5):1450–1459, Mar 2006. doi: 10.1002/pmic.200500339. URL http://dx.doi.org/10.1002/pmic.200500339.
P. V. Attfield, S. Kletsas, D. A. Veal, R. van Rooijen, and P. J. Bell. Use of flowcytometry to monitor cell damage and predict fermentation activity of dried yeasts.Journal of Applied Microbiology, 89(2):207–214, Aug 2000.
G. V. Barbosa-Canovas, M. M. Gongora-Nieto, U. R. Pothakamury, and B. G. Swan-son. Preservation of foods with pulsed electric fields. San Diego: Academic Press,1999.
L. Barsotti, P. Merle, and J. C. Cheftel. Food processing by pulsed electric fields. ii.biological aspects. Food Reviews International, 15:181–213, 1999.
H. Bauer. Interpretation of frozen-fractured membranes of Lipomyces lipofer. Journalof Bacteriology, 96(3):853–854, Sep 1968.
H. D. Belitz, W. Grosch, and P. Schieberle. Lehrbuch der Lebensmittelchemie.Springer-Verlag GmbH, 2001.
W. D. Bellamy. Biotechnology report: Single Cell Proteins from cellulosic wastes.Biotechnology and Bioengineering, 16(7):869–880, Jul 1974. doi: 10.1002/bit.260160702. URL http://dx.doi.org/10.1002/bit.260160702.
N. Berkowitz and J. Calderon. On ”partial” coal conversion by extraction with super-critical H2O. Fuel Processing Technology, 16(3):245–256, 1987.
P. Bhattacharjee and R. S. Singhal. Extraction of squalene from yeast by supercriticalcarbon dioxide. World Journal of Microbiology and Biotechnology, 19(6):605–608,2003.
P. Bhattacharjee, V. Shukla, R. Singhal, and P. Kulkarni. Studies on fermentativeproduction of squalene. World Journal of Microbiology & Biotechnology, 17:811–816, 2001.
B. Blagovic, J. Rupcic, M. Mesaric, K. Georgiu, and V. Maric. Lipid composition ofbrewer’s yeast. Food Technology and Biotechnology, 39(3):175–181, 2001.
E. G. Bligh and W. J. Dyer. A rapid method of total lipid extraction and purification.Canadian journal of biochemistry and physiology, 37(8):911–917, Aug 1959.
125
Bibliography
K. A. J. Borthwick, W. T. Coakley, M. B. McDonnell, H. Nowotny, E. Benes, andM. Groschl. Development of a novel compact sonicator for cell disruption. Journalof Microbiological Methods, 60(2):207–216, Feb 2005. doi: 10.1016/j.mimet.2004.09.012. URL http://dx.doi.org/10.1016/j.mimet.2004.09.012.
D. L. Brasaemle. Thematic review series: adipocyte biology. The perilipin familyof structural lipid droplet proteins: stabilization of lipid droplets and control oflipolysis. Journal of Lipid Research, 48(12):2547–2559, Dec 2007. doi: 10.1194/jlr.R700014-JLR200. URL http://dx.doi.org/10.1194/jlr.R700014-JLR200.
P. Breeuwer, J. L. Drocourt, N. Bunschoten, M. H. Zwietering, F. M. Rombouts,and T. Abee. Characterization of uptake and hydrolysis of fluorescein diacetateand carboxyfluorescein diacetate by intracellular esterases in Saccharomyces cere-visiae, which result in accumulation of fluorescent product. Applied EnvironmentalMicrobiology, 61(4):1614–1619, Apr 1995.
G. Brunner. Supercritical fluids: technology and application to food processing. Jour-nal of Food Engineering, 67:21–33, 2005.
V. C. Bugeja and B. L. Carter. Size at bud initiation for wild-type and petite yeastcells. Jounal of Bacteriology, 151(2):1051–1052, Aug 1982.
D. W. Burden and D. E. Eveleigh. Yeast Technology, chapter Yeast - diverse substratesand products, pages 198–227. Springer, Berlin, 1990.
A. M. Burja, H. Radianingtyas, A. Windust, and C. J. Barrow. Isolation and char-acterization of polyunsaturated fatty acid producing Thraustochytrium species:screening of strains and optimization of omega-3 production. Applied Microbiologyand Biotechnology, 72(6):1161–1169, Oct 2006. doi: 10.1007/s00253-006-0419-1.URL http://dx.doi.org/10.1007/s00253-006-0419-1.
W. Butte. Rapid method for the determination of fatty acid profiles from fats andoils using trimethylsulphonium hydroxide for transesterification. Journal of Chro-matography, 261:142–145, 1983.
Caelo-GmbH. Miglyol® 812 - safety data sheet. http://www.caelo.de/testLFS/
sdb/3274.pdf.
P. Capriel, A. Haisch, and S. U. Khan. Supercritical methanol: an efficacious techniquefor the extraction of bound pesticide residues from soil and plant samples. Journalof Agricultural and Food Chemistry, 34(1):70–73, 1986.
M. Carrella, I. Bjorkhem, J. A. Gustafsson, K. Einarsson, and K. Hellstrom. Themetabolism of steroids in the fatty liver induced by orotic acid feeding. BiochemicalJournal, 158(1):89–95, Jul 1976.
126
Bibliography
P. S. Chen, T. Y. Toribara, and H. Warner. Microdetermination of phosphorus.Analytical Chemistry, 28 (11):1756–1758, 1956.
L. V. Chernomordik, S. I. Sukharev, S. V. Popov, V. F. Pastushenko, A. V. Sokirko,I. G. Abidor, and Y. A. Chizmadzhev. The electrical breakdown of cell and lipidmembranes: the similarity of phenomenologies. BBA - Biomembranes, 902(3):360–373, 1987.
W. Chesbro, T. Evans, and R. Eifert. Very slow growth of Escherichia coli. Journalof Bacteriology, 139(2):625–638, Aug 1979.
M. K. Clausen, K. Christiansen, P. K. Jensen, and O. Behnke. Isolation of lipidparticles from baker’s yeast. FEBS Letters, 43(2):176–179, 1974.
Z. Cohen and I. Khozin-Goldberg. Single Cell Oils, chapter Search for PUFA-richmicro algae, pages 1–20. AOCS Publishing, 2005.
F. Cormier and C. Ambid. Extractive bioconversion of geraniol by a Vitis viniferacell suspension employing a two-phase system. Plant Cell Reports, 6:427–430, 1987.
B. Coulary, M. Aigle, and J. Schaeffer. Evidence for glycogen structures associ-ated with plasma membrane invaginations as visualized by freeze-substitution andthe Thiery reaction in Saccharomyces cerevisiae. Journal of Electron Microscopy(Tokyo), 50(2):133–137, 2001.
T. Czabany, K. Athenstaedt, and G. Daum. Synthesis, storage and degradation ofneutral lipids in yeast. Biochimica et Biophysica Acta, 1771(3):299–309, Mar 2007.doi: 10.1016/j.bbalip.2006.07.001. URL http://dx.doi.org/10.1016/j.bbalip.
2006.07.001.
T. Czabany, A. Wagner, D. Zweytick, K. Lohner, E. Leitner, E. Ingolic, and G. Daum.Structural and biochemical properties of lipid particles from the yeast Saccha-romyces cerevisiae. Journal of Biological Chemistry, 283(25):17065–17074, Jun2008. doi: 10.1074/jbc.M800401200. URL http://dx.doi.org/10.1074/jbc.
M800401200.
S. W. H. de Haan and P. Willcock. Comparison of the energy performance of pulsegeneration circuits for PEF. Innovative Food Science and Emerging Technologies,3:349–356, 2002.
I. M. de Maranon, P. A. Marechal, and P. Gervais. Passive response of Saccharomycescerevisiae to osmotic shifts: cell volume variations depending on the physiologicalstate. Biochemical and Biophysical Research Communications, 227(2):519–523, Oct1996.
127
Bibliography
A. Demirbas. Phenolics from hazelnut kernels by supercritical methanol extraction.Energy Sources, Part A: Recovery, Utilization, and Environmental Effects, 29(9):791–797, 2007.
L. E. Den Dooren De Jong. Een nieuwe, vetformende Gist - A new fat-producingyeast. Tijdschrift v. Hygiene, Microbiologie en Serologie, 1:136–147, 1926.
D. S. Dimitrov and R. K. Jain. Membrane stability. Biochimica Biophysica Acta, 779(4):437–468, Dec 1984.
H. Doevenspeck. Verfahren und Vorrichtung zur Gewinnung der einzelnen Phasen ausdispersen Systemen. German Patent, DE 1237541, 1960.
M. S. Doulah. Mechanism of disintegration of biological cells in ultrasonic cavita-tion. Biotechnology and Bioengineering, 19(5):649–660, May 1977. doi: 10.1002/bit.260190504. URL http://dx.doi.org/10.1002/bit.260190504.
H. Dornenburg and D. Knorr. Review: Strategies for the improvement of secondarymetabolite production in plant cell cultures. Enzyme and Microbial Technology,17(8):674–684, 1995.
H. Dornenburg and D. Knorr. Monitoring the impact of high pressure processingon the biosynthesis of plant metabolites using plant cell cultures. Trends in FoodScience & Technology, 9:355–361, 1998.
D. Dumas, S. Muller, F. Gouin, F. Baros, M. L. Viriot, and J. F. Stoltz. Mem-brane fluidity and oxygen diffusion in cholesterol-enriched erythrocyte membrane.Archives of Biochemistry and Biophysics, 341(1):34–39, May 1997. doi: 10.1006/abbi.1997.9936. URL http://dx.doi.org/10.1006/abbi.1997.9936.
F. J. Eller, S. L. Taylor, J. A. Laszlo, D. L. Compton, and J. A. Teel. Counter-currentcarbon dioxide purification of partially deacylated sunflower oil. Journal of theAmerican Oil Chemists’ Society, 86 (3 ):277–282, 2009.
M. M. W. Etschmann and J. Schrader. An aqueous-organic two-phase bioprocessfor efficient production of the natural aroma chemicals 2-phenylethanol and 2-phenylethylacetate with yeast. Applied Microbiology and Biotechnology, 71:440–443,Jan 2006.
M. T. Fahlen and M. Agraharkar. Uric acid nephropathy. eMedicine - http://
emedicine.medscape.com/article/244255-overview, Feb 2009.
I. Ferreira, O. Pinho, E. Vieira, and J. Tavarela. Brewer’s Saccharomyces yeastbiomass: characteristics and potential applications. Trends in Food Science &Technology, 21:77–84, 2010.
128

Bibliography
A. Figueiredo, M. Salome, S. Pais, and J. J. C. Scheffer. Composition of the essentialoil from cell suspension cultures of Achillea millefolium ssp. millefolium. Plant Cell,Tissue and Organ Culture, 40:113–118, 1995.
M. Fincan, F. DeVito, and P. Dejmek. Pulsed electric field treatment for solid-liquidextraction of red beetroot pigment. Journal of Food Engineering, 64:381–388, 2004.
E. Finotti, D. Moretto, R. Marsella, and R. Mercantini. Temperature effects and fattyacid patterns in Geomyces species isolated from antarctic soil. Polar Biology, 13(2):127–130, 1993.
H. S. Finstad, C. A. Drevon, M. A. Kulseth, A. V. Synstad, E. Knudsen, and S. O.Kolset. Cell proliferation, apoptosis and accumulation of lipid droplets in U937-1cells incubated with eicosapentaenoic acid. Biochemical Journal, 336 (Pt 2):451–459, Dec 1998.
B. L. Flaumenbaum. Anwendung der Elektroplasmolyse bei der Herstellung vonFruchtsaften. Flussiges Obst, 35:19–20, 1968.
J. Folch, M. Lees, and G. H. S. Stanley. A simple method for the isolation andpurification of total lipides from animal tissues. Journal of Biological Chemistry,226(1):497–509, May 1957.
S. D. Fowler and P. Greenspan. Application of Nile red, a fluorescent hydrophobicprobe, for the detection of neutral lipid deposits in tissue sections: comparison withoil red O. Journal of Histochemistry and Cytochemistry, 33(8):833–836, Aug 1985.
F. G. Galindo, P. Dejmek, K. Lundgren, A. G. Rasmusson, A. Vicente, and T. Moritz.Metabolomic evaluation of pulsed electric field-induced stress on potato tissue.Planta, 230:469–479, 2009.
M. L. Garcia, J. Burgos, B. Sanz, and J. A. Ordonez. Effect of heat and ultrasonicwaves on the survival of two strains of Bacillus subtilis. Journal of Applied Bacte-riology, 67(6):619–628, Dec 1989.
P. Gervais, P. Molin, P. A. Marechal, and C. Herail-Foussereau. Thermodynamicsof yeast cell osmoregulation: Passive mechanisms. Journal of Biological Physics,22(2):73–86, 1996.
C. O. Gill, M. J. Hall, and C. Ratledge. Lipid accumulation in an oleaginous yeast(Candida 107) growing on glucose in single-stage continuous culture. Applied En-vironmental Microbiology, 33(2):231–239, Feb 1977.
M. M. Gongora-Nieto, P. D. Pedrow, B. G. Swanson, and G. V. Barbosa-Canovas.Impact of air bubbles in a dielectric liquid when subjected to high electric fieldstrengths. Innovative Food Science and Emerging Technologies, 4:57–67, 2003.
129

Bibliography
S. K. Goswami and C. F. Frey. Spray detection of phospholipids on thin-layer chro-matograms. Journal of Lipid Research, 12(4):509–510, Jul 1971.
T. Grahl and H. Markl. Killing of microorganisms by pulsed electric fields. AppliedMicrobiology and Biotechnology, 45:148–157, 1996.
P. Greenspan, E. P. Mayer, and S. D. Fowler. Nile red: a selective fluorescent stainfor intracellular lipid droplets. Journal of Cell Biology, 100(3):965–973, Mar 1985.
D. Gaskova, K. Sigler, B. Janderova, and J. Plasek. Effect of high-voltage elec-tric pulses on yeast cells: factors influencing the killing efficiency. Bioelectro-chemistry and Bioenergetics, 39(2):195–202, 1996. ISSN 0302-4598. doi: DOI:10.1016/0302-4598(95)01892-1. URL http://www.sciencedirect.com/science/
article/B6TF7-3TKNHGF-7/2/f07dbf376da8a37caa29e4d731586b04.
M. Guderjan. Untersuchungen zum Einfluss elektrischer Hochspannungsimpulse beider Gewinnung pflanzlicher Ole. Dissertation TU Berlin, 2006.
M. Guderjan, S. Toepfl, A. Angersbach, and D. Knorr. Impact of pulsed electric fieldtreatment on the recovery and quality of plant oils. Journal of Food Engineering,67 (3):281–287, 2005.
A. Guvenc, U. Mehmetoglu, and A. Calimli. Supercritical CO2 Extraction of Ethanol.Turkish Journal of Chemistry, 23:285–291, 1999.
W. A. Hamilton and A. J. H. Sale. Effects of high electric fields on microorganisms:II. Mechanism of action of the lethal effect. Biochimica et Biophysica Acta, 148(3):789–800, 1967.
E. N. Harvey and A. L. Loomis. The destruction of luminous bacteria by high fre-quency sound waves. Journal of Bacteriology, 17(5):373–376, May 1929.
H. M. Heick and H. B. Stewart. Preparation and properties of protoplasts fromLipomyces lipofer . Canadian journal of biochemistry and physiology, 43:549–560,May 1965a.
H. M. Heick and H. B. Stewart. Mitochondria from Lipomyces lipofer . Canadianjournal of biochemistry and physiology, 43:561–571, May 1965b.
V. Heinz, S. T. Phillips, M. Zenker, and D. Knorr. Inactivation of Bacillus subtilisby high intensity pulsed electric fields under close to isothermal conditions. FoodBiotechnology, 13:155–168, 1999.
V. Heinz, I. Alvarez, A. Angersbach, and D. Knorr. Preservation of liquid foods byhigh intensity pulsed electric fields-basic concepts for process design. Trends in FoodScience & Technology, 12(3-4):103–111, 2001.
130
Bibliography
A. Henglein. Sonochemistry: historical developments and modern aspects. Ultrason-ics, 25:6–16, 1987.
W. Henninger and C. C. Emeis. The apomictic life-cycle of the multispored strainsof the yeast Lipomyces (author’s transl). Archives of Microbiology, 101(4):365–377,1974.
H. Hulsheger, J. Potel, and E. G. Niemann. Killing of bacteria with electric pulses ofhigh field strength. Radiation and Environmental Biophysics, 20(1):53–65, 1981.
H. Hulsheger, J. Potel, and E. G. Niemann. Electric field effects on bacteria and yeastcells. Radiation and Environmental Biophysics, 22(2):149–162, 1983.
J. E. Holdsworth and C. Ratledge. Lipid turnover in oleaginous yeasts. Journal ofGeneral Microbiology, 134:339–346, 1988.
J. A. Hossack and A. H. Rose. Fragility of plasma membranes in Saccharomycescerevisiae enriched with different sterols. Journal of Bacteriology, 127(1):67–75, Jul1976.
J. A. Hossack and I. Spencer-Martins. Lipid composition of the yeast. Applied Mi-crobiology and Biotechnology, 5(4):273–278, 1978.
F. B. Hu, L. Bronner, W. C. Willett, M. J. Stampfer, K. M. Rexrode, C. M. Albert,D. Hunter, and J. E. Manson. Fish and omega-3 fatty acid intake and risk ofcoronary heart disease in women. Journal Of the American Medical Association,287(14):1815–1821, Apr 2002.
F. B. Hu, E. Cho, K. M. Rexrode, C. M. Albert, and J. E. Manson. Fish and long-chainomega-3 fatty acid intake and risk of coronary heart disease and total mortality indiabetic women. Circulation, 107(14):1852–1857, Apr 2003. doi: 10.1161/01.CIR.0000062644.42133.5F. URL http://dx.doi.org/10.1161/01.CIR.0000062644.
42133.5F.
H. C. Huang. Oil bodies and oleosins in seeds. Annual Review of Plant Physiologyand Plant Molecular Biology, 43:177–200, 1992.
D. E. Hughes and W. L. Nyborg. Cell disruption by ultrasound: Streaming andother activity around sonically induced bubbles is a cause of damage to living cells.Science, 138(3537):108–114, 1962.
P. G. Huls, N. Nanninga, E. A. van Spronsen, J. A. Valkenburg, N. O. Vishcer, andC. L. Woldringh. A computer-aided measuring system for the characterization ofyeast populations combining 2D-image analysis, electronic particle counter, andflow cytometry. Biotechnology and Bioengineering, 39(3):343–350, Feb 1992. doi:10.1002/bit.260390313. URL http://dx.doi.org/10.1002/bit.260390313.
131

Bibliography
K. Hunter and A. H. Rose. Lipid composition of Saccharomyces cerevisiae as influ-enced by growth temperature. Biochimica Biophysica Acta, 260(4):639–653, Apr1972.
T. Imai and T. Ohno. Measurement of yeast intracellular pH by image processingand the change it undergoes during growth phase. Journal of Biotechnology, 38(2):165–172, Jan 1995.
Invitrogen. Propidium iodide nucleic acid stain. http://probes.invitrogen.com/
media/pis/mp01304.pdf, 2010.
H. E. Jacob, W. Forster, and H. Berg. Microbiological implications of electric fieldeffects. II. Inactivation of yeast cells and repair of their cell envelope. Zeitschriftfur Allgemeine Mikrobiologie, 21(3):225–233, 1981.
Z. Jacob. Selective medium for the production of lipids by Rhodotorula gracilis CFR-1. Journal of Food Science & Technology, 25:373, 1988.
Z. Jacob. Yeast Lipids: Extraction, Quality Analysis, and Acceptability. CriticalReviews in Biotechnology, 12(5):463–491, 1992.
A. Janositz. Auswirkung von Hochspannungsimpulsen auf das Schnittverhalten vonKartoffeln (Solanum tuberosum). Diplomarbeit TU Berlin, 2005.
G. M. Jenkins, A. Richards, T. Wahl, C. Mao, L. Obeid, and Y. Hannun. Involve-ment of yeast sphingolipids in the heat stress response of Saccharomyces cerevisiae.Journal of Biological Chemistry, 272(51):32566–32572, Dec 1997.
R. Jenness and J. Koops. Preparation and properties of a salt solution which simulatesmilk ultrafiltrate. Netherlands Milk and Dairy Journal, 16(3):153–64, 1962.
S. Jeyamkondan, D. S. Jayas, and R. A. Holley. Pulsed electric field processing offoods: a review. Journal of Food Protection, 62(9):1088–1096, Sep 1999.
H. Jager, A. Balasa, and D. Knorr. Electrotechnologies for Extraction from FoodPlants and Biomaterials, chapter Food Industry Applications for Pulsed ElectricFields, page 240. Springer, Heidelberg, 2008.
Y. L. Jin, J. Y. Chen, L. Xu, and P. N. Wang. Refractive index measurement forbiomaterial samples by total internal reflection. Physics in Medicine and Biology,51(20):N371–N379, Oct 2006. doi: 10.1088/0031-9155/51/20/N02. URL http:
//dx.doi.org/10.1088/0031-9155/51/20/N02.
G. C. Johnston, C. W. Ehrhardt, A. Lorincz, and B. L. Carter. Regulation of cellsize in the yeast Saccharomyces cerevisiae. Journal of Bacteriology, 137(1):1–5, Jan1979.
132
Bibliography
A. A. Joshi, B. Locke, P. Arce, and W. C. Finney. Formation of hydroxyl radicals,hydrogen peroxide and aqueous electrons by pulsed streamer corona discharge inaqueous solution. Journal of Hazardous Materials, 41:3–30, 1995.
J. Kacmar, R. Carlson, S. J. Balogh, and F. Srienc. Staining and quantification ofpoly-3-hydroxybutyrate in Saccharomyces cerevisiae and Cupriavidus necator cellpopulations using automated flow cytometry. Journal of the International Societyfor Analytical Cytology: Cytometry Part A, 69(1):27–35, Jan 2006. doi: 10.1002/cyto.a.20197. URL http://dx.doi.org/10.1002/cyto.a.20197.
T. Kaneda. Iso- and anteiso-fatty acids in bacteria: biosynthesis, function, and tax-onomic significance. Microbiology and Molecular Biology Reviews, 55(2):288–302,Jun. 1991.
H. Kaneko, M. Hosohara, M. Tanaka, and T. Itoh. Lipid composition of 30 species ofyeast. Lipids, 11(12):837–844, Dec 1976.
R. J. Karreman and G. G. Lindsey. A Rapid Method to Determine the Stress Statusof Saccharomyces cerevisiae by Monitoring the Expression of a Hsp12:Green Fluo-rescent Protein(GFP) Construct under the Control of the Hsp12 Promoter. Journalof Biomolecular Screening, 10(3):253–259, 2005. doi: 10.1177/1087057104273485.URL http://jbx.sagepub.com/cgi/content/abstract/10/3/253.
D. B. Kearns and R. Losick. Cell population heterogeneity during growth of Bacillussubtilis. Genes & Development, 19(24):3083–3094, Dec 2005. doi: 10.1101/gad.1373905. URL http://dx.doi.org/10.1101/gad.1373905.
K. Kimura, M. Yamaoka, and Y. Kamisaka. Rapid estimation of lipids in oleaginousfungi and yeasts using Nile red fluorescence. Journal of Microbiological Methods, 56(3):331–338, Mar 2004. doi: 10.1016/j.mimet.2003.10.018. URL http://dx.doi.
org/10.1016/j.mimet.2003.10.018.
J. W. King, G. R. List, and J. H. Johnson. Supercritical carbon dioxide extraction ofspent bleaching clays. The Journal of Supercritical Fluids, 5:38–41, 1992.
K. Kinosita and T. Y. Tsong. Voltage-induced pore formation and hemolysis of humanerythrocytes. Biochimica Biophysica Acta, 471(2):227–242, Dec 1977.
F. M. Klis, P. Mol, K. Hellingwerf, and S. Brul. Dynamics of cell wall structure inSaccharomyces cerevisiae. FEMS Microbiology Reviews, 26(3):239–256, Aug 2002.
D. Knorr and A. Angersbach. Impact of high-intensity electric field pulses on plantmembrane permeabilization. Trends in Food Science & Technology, 9:185–191, 1998.
D. Knorr, M. Geulen, T. Grahl, and W. Sitzmann. Food application of high electricfield pulses. Trends in Food Science and Technology, 5:71–75, 1994.
133
Bibliography
D. Knorr, A. Angersbach, M. N. Eshtiaghi, V. Heinz, and D. U. Lee. Processingconcepts based on high intensity electric field pulses. Trends in Food Science andTechnology, 12(3):129–135(7), 2001.
R. Kollar, B. B. Reinhold, E. Petrakova, H. J. Yeh, G. Ashwell, J. Drgonova, J. C.Kapteyn, F. M. Klis, and E. Cabib. Architecture of the yeast cell wall. Beta(1–>6)-glucan interconnects mannoprotein, beta(1–>)3-glucan, and chitin. Journal ofBiological Chemistry, 272(28):17762–17775, Jul 1997.
M. Kondo, M. Goto, A. Kodama, and T. Hirose. Fractional extraction by supercriticalcarbon dioxide for the deterpenation of bergamot oil. Industrial & EngineeringChemistry Research, 39:4745–4748, 2000.
O. Kopplow, M. Barjenbruch, and V. Heinz. Sludge pre-treatment with pulsed electricfields. Water Science and Technology, 49(10):123–129, 2004.
G. Kostner and P. Laggner. Clinical Biochemistry- Human Plasma Lipoproteins,chapter Chemical and physical properties of lipoproteins, pages 23–54. Walter deGruyter, Berlin, 1989.
A. Kotyk. Intracellular pH of baker’s yeast. Folia Microbiologica (Praha), 8:27–31,Jan 1963.
W. Kraus. The 2002 beet campaign - VDZ Zweigverein Sud. Zuckerindustrie, 128(5):344–354, 2003.
C. P. Kurtzman and Z. Liu. Evolutionary affinities of species assigned to Lipomycesand Myxozyma estimated from ribosomal RNA sequence divergence. Current Mi-crobiology, 21(6):387–393, 1990.
C. P. Kurtzman, J. Albertyn, and E. Basehoar-Powers. Multigene phylogeneticanalysis of the Lipomycetaceae and the proposed transfer of Zygozyma speciesto Lipomyces and Babjevia anomala to Dipodascopsis. FEMS Yeast Research,7(6):1027–1034, Sep 2007. doi: 10.1111/j.1567-1364.2007.00246.x. URL http:
//dx.doi.org/10.1111/j.1567-1364.2007.00246.x.
B. H. Lado and A. E. Yousef. Selection and identification of a Listeria monocytogenestarget strain for pulsed electric field process optimization. Applied EnvironmentalMicrobiology, 69(4):2223–2229, Apr 2003.
M. Lamackaa, J. Sajbidor, and P. Bohov. Lipid isolation and fatty acid analysis in Sac-charomyces cerevisiae. Comparison of different methods. Biotechnology Techniques,12(8):621–625, Aug 1998.
M. B. Lande, J. M. Donovan, and M. L. Zeidel. The relationship between membranefluidity and permeabilities to water, solutes, ammonia, and protons. Journal ofGeneral Physiology, 106(1):67–84, Jul 1995.
134
Bibliography
C. A. Larabell and M. A. L. Gros. X-ray tomography generates 3-D reconstructionsof the yeast, Saccharomyces cerevisiae, at 60-nm resolution. Molecular Biology ofthe Cell, 15(3):957–962, Mar 2004. doi: 10.1091/mbc.E03-07-0522. URL http:
//dx.doi.org/10.1091/mbc.E03-07-0522.
R. Leber, E. Zinser, G. Zellnig, F. Paltauf, and G. Daum. Characterization of lipidparticles of the yeast, Saccharomyces cerevisiae. Yeast, 10(11):1421–1428, Nov 1994.doi: 10.1002/yea.320101105. URL http://dx.doi.org/10.1002/yea.320101105.
N. Lebovka, M. Bazhala, and E. Vorobiev. Pulsed electric field breakage of cellulartissues: visualisation of percolative properties. Innovative Food Science & EmergingTechnologies, 2:113–125, 2001.
N. I. Lebovka, I. Praporscic, and E. Vorobiev. Effect of moderate thermal and pulsedelectric field treatments on textural properties of carrots, potatoes and apples. In-novative Food Science and Emerging Technologies, 5 (1):9–16, 2004.
K. W. Lee and G. Y. H. Lip. The role of omega-3 fatty acids in the secondaryprevention of cardiovascular disease. Quarterly Journal of Medicine, 96(7):465–480,Jul 2003.
Y. H. Lee, S. Y. Chen, R. J. Wiesner, and Y. F. Huang. Simple flow cytometricmethod used to assess lipid accumulation in fat cells. Journal of Lipid Research,45(6):1162–1167, Jun 2004. doi: 10.1194/jlr.D300028-JLR200. URL http://dx.
doi.org/10.1194/jlr.D300028-JLR200.
R. N. Lemaitre, I. B. King, N. Sotoodehnia, T. D. Rea, T. E. Raghunathan, K. M.Rice, T. S. Lumley, R. H. Knopp, L. A. Cobb, M. K. Copass, and D. S. Siscovick.Red blood cell membrane alpha-linolenic acid and the risk of sudden cardiac arrest.Metabolism, 58(4):534–540, Apr 2009. doi: 10.1016/j.metabol.2008.11.013. URLhttp://dx.doi.org/10.1016/j.metabol.2008.11.013.
T. A. Lewis, R. J. Rodriguez, and L. W. Parks. Relationship between intracellularsterol content and sterol esterification and hydrolysis in Saccharomyces cerevisiae.Biochimica Biophysica Acta, 921(2):205–212, Sep 1987.
Y. Li, Z. K. Zhao, and F. Bai. High-density cultivation of oleaginous yeast Rho-dosporidium toruloides Y4 in fed-batch culture. Enzyme and Microbial Technology,41(3):312 – 317, 2007.
R. S. Liao, R. P. Rennie, and J. A. Talbot. Assessment of the effect of amphotericinB on the vitality of Candida albicans. Antimicrobial Agents and Chemotherapy, 43(5):1034–1041, May 1999.
135

Bibliography
R. S. Liao, R. P. Rennie, and J. A. Talbot. Comparative evaluation of a new fluorescentcarboxyfluorescein diacetate-modified microdilution method for antifungal suscepti-bility testing of Candida albicans isolates. Antimicrobial Agents and Chemotherapy,46(10):3236–3242, Oct 2002.
P. Lindner. Das Problem der biologischen Fettbildung und Fettgewinnung. Ange-wandte Chemie, 35(19):110–114, 1922.
P. N. Lipke and R. Ovalle. Cell wall architecture in yeast: new structure and newchallenges. Journal of Bacteriology, 180(15):3735–3740, Aug 1998.
L. L. Listenberger and D. A. Brown. Lipid droplets. Current Biology, 18(6):R237–R238, Mar 2008. doi: 10.1016/j.cub.2008.01.010. URL http://dx.doi.org/10.
1016/j.cub.2008.01.010.
I. B. Lomakin, Y. Xiong, and T. A. Steitz. The crystal structure of yeast fatty acidsynthase, a cellular machine with eight active sites working together. Cell, 129(2):319–332, Apr 2007. doi: 10.1016/j.cell.2007.03.013. URL http://dx.doi.org/10.
1016/j.cell.2007.03.013.
A. Lomascolo, E. Dubreucq, V. Perrier, and P. Galzy. Study of Lipids in Lipomycesand Waltomyces. Canadian Journal of Microbiology, 40(6):724–729, 1994.
A. Lomascolo, E. Dubreucq, and P. Galzy. Study of the delta 12-desaturase systemof Lipomyces starkeyi. Lipids, 31(3):253–259, Mar 1996.
S. E. Lowe, H. S. Pankratz, and J. G. Zeikus. Influence of pH extremes on sporulationand ultrastructure of Sarcina ventriculi. Journal of Bacteriology, 171(7):3775–3781,Jul 1989.
I. S. Maclean. The conditions influencing the formation of fat by the yeast cell.Biochemical Journal, 16(3):370–379, 1922.
Marlow Foods Ltd. Company website. http://www.quorn.com, May 2010.
M. Martin and L. Lindqvist. The pH dependence of fluorescein fluorescence. Journalof Luminescence, 10(6):381–390, 1975.
A. V. Martini and C. P. Kurtzman. Deoxyribonucleic acid relatedness among speciesof the genus Saccharomyces sensu stricto. International Journal of Systematic Bac-teriology, 35(4):508–511, 1985.
T. Maskow, S. Muller, A. Losche, H. Harms, and R. Kemp. Control of continuouspolyhydroxybutyrate synthesis using calorimetry and flow cytometry. Biotechnologyand Bioengineering, 93(3):541–552, Feb 2006. doi: 10.1002/bit.20743. URL http:
//dx.doi.org/10.1002/bit.20743.
136

Bibliography
R. I. Mateles and S. E. Tannenbaum. Single-cell protein. Economic Botany, 22(1):42–50, 1968.
R. Matissek and G. Steiner. Lebensmittelanalytik. Grundzuge, Methoden, Anwendun-gen. Springer, Berlin, 2008.
T. Matsunaga, M. Matsumoto, Y. Maeda, H. Sugiyama, R. Sato, and T. Tanaka.Characterization of marine microalga, Scenedesmus sp. strain JPCC GA0024 towardbiofuel production. Biotechnology Letters, 31(9):1367–1372, Sep 2009. doi: 10.1007/s10529-009-0029-y. URL http://dx.doi.org/10.1007/s10529-009-0029-y.
F. A. McElroy and H. B. Stewart. The lipids of Lipomyces lipofer. Canadian journalof biochemistry, 45(2):171–178, Feb 1967.
F. A. McElroy and H. B. Stewart. Lipid synthesis in Lipomyces lipofer. Canadianjournal of biochemistry, 46(4):303–313, Apr 1968.
P. Meesters, H. van der Waal, H. Weusthuis, and G. Eggink. Cultivation of theoleaginous yeast Cryptococcus curvatus in a new reactor with improved mixing andmass transfer characteristics (Surer). Biotechnology techniques, 10(4):277–282, Apr1996.
J. A. Mendiola, C. F. Torres, A. Tore, P. J. Martın-Alvarez, S. Santoyo, B. O.Arredondo, F. J. Senorans, A. Cifuentes, and E. Ibanez. Use of supercritical CO2
to obtain extracts with antimicrobial activity from Chaetoceros muelleri microalga.A correlation with their lipidic content. European Food Research and Technology,224(4):505–510, 2007.
N. Meneses, H. Jaeger, J. Moritz, and D. Knorr. Impact of insulator shape and flowcharacteristics on inactivation of E. coli using a continuous co-linear PEF system.Journal of Food Engineering (submitted for publication).
X. Meng, J. Yang, X. Xu, L. Zhang, Q. Nie, and M. Xian. Biodiesel production fromoleaginous microorganisms. Renewable Energy, 34(1):1–5, 2009. ISSN 0960-1481.doi: DOI:10.1016/j.renene.2008.04.014. URL http://www.sciencedirect.com/
science/article/B6V4S-4SYD9N6-4/2/2eb8d1c616d0b27a635a1b182b5b154c.
S. Monch and R. Stute. Process for producing yeast extracts - Bestfoods. UnitedStates Patent Application 20020081357, 2002.
P. R. Moore and C. A. Baumann. Skin sterols. I. Colorimetric determination ofcholesterol and other sterols in skin. Journal of Biological Chemistry, 195(2):615–621, Apr 1952.
R. Moraine, G. Shelef, A. Meydan, and A. Levi. Algal single cell protein from waste-water treatment and renovation process. Biotechnology and Bioengineering, 21:1191–1207, 1979.
137
Bibliography
J. Morren, B. Roodenburg, and S. W. H. de Haan. Electrochemical reactions andelectrode corrosion in pulsed electric field (PEF) treatment chambers. InnovativeFood Science and Emerging Technologies, 4:285–295, 2003.
G. J. Morris, L. Winters, G. E. Coulson, and K. J. Clarke. Effect of osmotic stress onthe ultrastructure and viability of the yeast Saccharomyces cerevisiae. Journal ofGeneral Microbiology, 132(7):2023–2034, Jul 1986.
W. R. Morrison and L. M. Smith. Preparation of fatty acid methyl esters and dimethyl-acetals from lipids with boron fluoride-methanol. Journal of Lipid Research, 5:600–608, 1964.
E. Moskvina, E. M. Imre, and H. Ruis. Stress factors acting at the level of the plasmamembrane induce transcription via the stress response element (STRE) of the yeastSaccharomyces cerevisiae. Molecular Microbiology, 32(6):1263–1272(10), Jun. 1999.
J. Mulholland, D. Preuss, A. Moon, A. Wong, D. Drubin, and D. Botstein. Ultrastruc-ture of the yeast actin cytoskeleton and its association with the plasma membrane.Journal of Cell Biology, 125(2):381–391, Apr 1994.
NCYC. National collection of yeast cultures. www.ncyc.co.uk.
E. A. Neppiras and D. E. Hughes. Some experiments on the disintegration of yeastby high intensity ultrasound. Biotechnology and Bioengineering, 6:247–270, 1964.
J. A. Nettleton and R. Katz. n-3 long-chain polyunsaturated fatty acids in type 2diabetes: a review. Journal of the American Dietetic Association, 105(3):428–440,Mar 2005. doi: 10.1016/j.jada.2004.11.029. URL http://dx.doi.org/10.1016/j.
jada.2004.11.029.
E. Neumann and K. Rosenheck. Permeability changes induced by electric impulses invesicular membranes. Journal of Membrane Biology, 10(3):279–290, Dec 1972.
E. Neumann, M. Schaefer-Ridder, Y. Wang, and P. H. Hofschneider. Gene transferinto mouse lyoma cells by electroporation in high electric fields. The EMBO Journal,1(7):841–845, 1982.
C. Nageli and O. Loew. Uber die chemische Zusammensetzung der Hefe. JustusLiebigs Annalen der Chemie, 193(2):322–348, 1878.
C. Nguemeni, B. Delplanque, C. Rovere, N. Simon-Rousseau, C. Gandin, G. Agnani,J. L. Nahon, C. Heurteaux, and N. Blondeau. Dietary supplementation of alpha-linolenic acid in an enriched rapeseed oil diet protects from stroke. PharmacologicalResearch, 61(3):226–233, Mar 2010. doi: 10.1016/j.phrs.2009.12.007. URL http:
//dx.doi.org/10.1016/j.phrs.2009.12.007.
138
Bibliography
P. J. Nieuwdorp, P. Bos, and W. C. Slooff. Classification of Lipomyces. Antonie VanLeeuwenhoek, 40(2):241–254, 1974.
H. Oku and T. Kaneda. Biosynthesis of branched-chain fatty acids in Bacillus subtilis.A decarboxylase is essential for branched-chain fatty acid synthetase. Journal ofBiological Chemistry, 263(34):18386–18396, 1988. URL http://www.jbc.org/cgi/
content/abstract/263/34/18386.
J. A. Ordonez, M. A. Aguilera, M. L. Garcia, and B. Sanz. Effect of combinedultrasonic and heat treatment (thermoultrasonication) on the survival of a strain ofStaphylococcus aureus. Journal of Dairy Research, 54(1):61–67, Feb 1987.
P. Orlean. Molecular and cellular biology of the yeast Saccharomyces, Vol. 3. Cell cycleand cell biology, chapter Biogenesis of yeast wall and surface components, pages 229–362. Cold Spring Harbor Laboratory Press, Cold Spring Harbor, N.Y., 1997.
S. Papanikolaou and G. Aggelis. Lipid production by Yarrowia lipolytica growing onindustrial glycerol in a single-stage continuous culture. Bioresource Technology, 82(1):43–49, Mar 2002.
Y. K. Park, M. Diez-Silva, G. Popescu, G. Lykotrafitis, W. Choi, M. S. Feld, andS. Suresh. Refractive index maps and membrane dynamics of human red bloodcells parasitized by Plasmodium falciparum. Proceedings of the National Academyof Sciences USA, 105(37):13730–13735, Sep 2008. doi: 10.1073/pnas.0806100105.URL http://dx.doi.org/10.1073/pnas.0806100105.
T. Pederson. Lipid formation in Cryptococcus terricolus . Acta Chemica Scandinavica,16:374–382, 1962.
A. Pense, C. Vauthier, F. Puisieux, and J. Benoit. Microencapsulation of benzalko-nium chloride. International Journal of Pharmaceutics, 81:111–117, 1992.
C. L. Phelps, N. G. Smart, and C. M. Wai. Past, present, and possible future appli-cations of supercritical fluid extraction technology. Journal of Chemical Education,73(12):1163–1168, 1996.
Y. Phornpiboonya and R. C. Jack. Changes in stereospecific distribution of yeastfatty acids with age. Chemistry and Physics of Lipids, 26 (1):57–66, 1980.
N. A. Porter, B. A. Weber, H. Weenen, and J. A. Khan. Autoxidation of polyun-saturated lipids. Factors controlling the stereochemistry of product hydroperoxides.Journal of the American Chemical Society, 102:5597–5601, 1980.
S. Qualmann. Cytochrom c-Oxidase-Untereinheit 2: mitochondrialer Import und pro-teolytische Reifung eines pflanzlichen Proteins in der Backerhefe (Saccharomycescerevisiae Meyen ex Hansen). PhD thesis, Universitat Hamburg, 2003.
139
Bibliography
M. I. Rajoka, S. H. Khan, M. A. Jabbar, M. S. Awan, and A. S. Hashmi. Kineticsof batch single cell protein production from rice polishings with Candida utilis incontinuously aerated tank reactors. Bioresource Technology, 97(15):1934–1941, Oct2006. doi: 10.1016/j.biortech.2005.08.019. URL http://dx.doi.org/10.1016/j.
biortech.2005.08.019.
D. Raschke. Untersuchungen zur Kalteanpassung mittels kompatibler Solute bei psy-chrotoleranten und mesophilen Bakterien (Psychrobacter - und Halomonas-Arten).Diplomarbeit Rheinische Friedrich-Wilhelms-Universitat Bonn, 2006.
D. Raschke and D. Knorr. Rapid monitoring of cell size, vitality and lipid dropletdevelopment in the oleaginous yeast Waltomyces lipofer. Journal of MicrobiologicalMethods, 79(2):178–183, Nov 2009. doi: 10.1016/j.mimet.2009.08.011. URL http:
//dx.doi.org/10.1016/j.mimet.2009.08.011.
N. Rastogi, M. Eshtiaghi, and D. Knorr. Accelerated mass transfer during osmoticdehydration of high intensity electrical field pulse pretreated carrots. Journal offood science, 64 (6):1020–1023, 1999.
C. Ratledge. Microbial Oils and Fats - An Overview, volume 1 of Biotechnology forthe Oils and Fats Industry. American Oil Chemists’ Society, 1985.
C. Ratledge. Single Cell Oils, chapter Single cell oils for the 21st century, pages 1–20.AOCS Publishing, 2005.
C. Ratledge and J. P. Wynn. The biochemistry and molecular biology of lipid accu-mulation in oleaginous microorganisms. Advances in Applied Microbiology, 51:1–51,2002.
J. B. Rattray, A. Schibeci, and D. K. Kidby. Lipids of yeasts. Bacteriological Reviews,39(3):197–231, Sep 1975.
A. Rieder, T. Schwartz, K. Schon-Holz, S. M. Marten, J. Suss, C. Gusbeth,W. Kohnen, W. Swoboda, U. Obst, and W. Frey. Molecular monitoring of in-activation efficiencies of bacteria during pulsed electric field treatment of clini-cal wastewater. Journal of Applied Microbiology, 105(6):2035–2045, Dec 2008.doi: 10.1111/j.1365-2672.2008.03972.x. URL http://dx.doi.org/10.1111/j.
1365-2672.2008.03972.x.
N. D. Riediger, R. A. Othman, M. Suh, and M. H. Moghadasian. A systemic reviewof the roles of n-3 fatty acids in health and disease. Journal of the AmericanDietetic Association, 109(4):668–679, Apr 2009. doi: 10.1016/j.jada.2008.12.022.URL http://dx.doi.org/10.1016/j.jada.2008.12.022.
P. Riesz, D. Berdahl, and C. L. Christman. Free radical generation by ultrasound inaqueous and nonaqueous solutions. Environmental Health Perspectives, 64:233–252,Dec 1985.
140
Bibliography
C. Roberts. Observations on the yeast Lipomyces. Nature, 179(4571):1198–1199, Jun1957.
C. F. Robinow. Mitosis in the yeast Lipomyces lipofer. Journal of Biophysical andBiochemical Cytology, 9:879–892, Apr 1961.
P. A. Roelofsen and I. Hoette. Chitin in the cell wall of yeasts. Antonie Van Leeuwen-hoek, 17(5):297–313, 1951.
Ri database. http://refractiveindex.info, 2010.
M. Sahni and B. R. Locke. Quantification of hydroxyl radicals produced in aque-ous phase pulsed electrical discharge reactors. Industrial & Engineering ChemistryResearch, 45:5819–5825, 2006.
A. J. Sale and W. A. Hamilton. Effect of high electric fields on micro-organisms. I.Killing of bacteria and yeast. Biochimica Biophysica Acta, 148:781–800, 1967.
M. Sato, T. Ohgiyama, and J. S. Clements. Formation of chemical species and theireffects on microorganisms using a pulsed high voltage discharge in water. In Con-ference Record - IAS Annual Meeting (IEEE Industry Applications Society) 2, pp.1455-1461, 1994.
H. Schlenk and J. L. Gellerman. Esterification of fatty acids with diazomethane on asmall scale. Analytical Chemistry, 32:1412–1414, 1960.
M. Schlingmann and P. Prave. Single Cell Proteine mit reduziertem Nukleinsaure-und Fettgehalt. Fette, Seifen, Anstrichmittel, 80(7):283–286, 1978.
R. Schneiter and G. Daum. Extraction of yeast lipids. Methods In Molecular Biology,313:41–45, 2006a.
R. Schneiter and G. Daum. Analysis of yeast lipids. Methods In Molecular Biology,313:75–84, 2006b.
A. Schulz. Subletale Schadigung von Mikroorganismen durch Anwendung gepulsterelektrischer Felder - Nachweis, Methodenvergleich und Modellierung. DiplomarbeitTU Berlin, Aug 2007.
E. Schweizer, K. Werkmeister, and M. K. Jain. Fatty acid biosynthesis in yeast.Molecular and Cellular Biochemistry, 21(2):95–107, Nov 1978.
R. Serrano, C. Montesinos, and J. Sanchez. Lipid requirements of the plasma mem-brane ATPases from oat roots and yeast. Plant Science, 56:117–122, 1988.
A. P. Simopoulos. The importance of the ratio of omega-6/omega-3 essential fattyacids. Biomedicine & Pharmacotherapy, 56(8):365–379, Oct 2002.
141
Bibliography
A. P. Simopoulos. The importance of the omega-6/omega-3 fatty acid ratio in car-diovascular disease and other chronic diseases. Experimental biology and medicine(Maywood), 233(6):674–688, Jun 2008. doi: 10.3181/0711-MR-311. URL http:
//dx.doi.org/10.3181/0711-MR-311.
H. M. Sinclair. Deficiency of essential fatty acids and atherosclerosis, etcetera. Lancet,270(6919):381–383, Apr 1956.
N. Singh, S. J. Wakil, and J. K. Stoops. Yeast fatty acid synthase: structure tofunction relationship. Biochemistry, 24(23):6598–6602, Nov 1985.
P. J. Skerrett and C. H. Hennekens. Consumption of fish and fish oils and decreasedrisk of stroke. Preventive cardiology, 6(1):38–41, 2003.
J. Slavık and A. Kotyk. Intracellular pH distribution and transmembrane pH profileof yeast cells. Biochimica Biophysica Acta, 766(3):679–684, Sep 1984.
M. E. Slodki and L. J. Wickerham. Extracellular polysaccharides and classification ofthe genus Lipomyces. Journal of General Microbiology, 42(3):381–385, Mar 1966.
W. C. Slooff, P. J. Nieuwdorp, and P. Bos. Polysaccharides, ascospore walls andclassification of Lipomyces. Antonie Van Leeuwenhoek, 35:Suppl:A23–Suppl:A24,Jun 1969.
M. T. Smith. The yeasts, a taxonomic study, chapter Lipomyces Lodder & Kregervan Rij, pages 248–253. Elsevier Science Ltd, 1998.
M. T. Smith and W. H. Batenburg-van der Vegte. Ascospore morphology and ul-trastructure of species assigned to the genus Lipomyces Lodder et Kreger-van Rij.International Journal of Systematic Bacteriology, 34:80–86, 1984.
M. T. Smith, G. A. Poot, W. H. Batenburg-van der Vegte, and J. P. van der Walt.Species delimitation in the genus Lipomyces by nuclear genome comparison. AntonieVan Leeuwenhoek, 68(1):75–87, Jul 1995.
S. Smith. The animal fatty acid synthase: one gene, one polypeptide, seven enzymes.Journal of the Federation of American Societies for Experimental Biology (FASEB),8(15):1248–1259, Dec 1994.
M. T. Sobus and C. E. Homlund. Extraction of lipids from yeast. Lipids, 11(4):341–348, Apr 1976.
G. L. Solomons and J. H. Litchfield. Single cell protein. Critical Reviews in Biotech-nology, 1(1):21–58, 1983.
I. Souchon, F. Pierre, S. Samblat, M. Bes, and M. Marin. Recovery of aroma com-pounds from tomato industry effluent using membrane-based solvent extraction.Desalination, 148:87–92, 2002.
142
Bibliography
S. Spiro and J. R. Guest. Adaptive responses to oxygen limitation in Escherichia coli.Trends in Biochemical Sciences, 16(8):310–314, Aug 1991.
R. L. Starkey. Lipid production by a soil yeast. Journal of Bacteriology, 51(1):33–50,Jan 1946.
I. P. Sugar and E. Neumann. Stochastic model for electric field-induced membranepores. Electroporation. Biophysical Chemistry, 19(3):211–225, May 1984.
M. Suutari, K. Liukkonen, and S. Laakso. Temperature adaptation in yeasts: the roleof fatty acids. Journal of General Microbiology, 136(8):1469–1474, Aug 1990.
T. Suzuki, A. Takigawa, and K. Hasegawa. Lipid extraction methods for Lipomycesstarkeyi . Agricultural and Biological Chemistry, 37:2653–2656, 1973.
K. Takeo. Resistance of the stationary-phase plasma membrane of Candida albicansto filipin-induced deformation. FEMS Microbiology Letters, 27(1):73–77, 1985.
K. Takeo, M. Shigeta, and Y. Takagi. Plasma membrane ultrastructural differencesbetween the exponential and stationary phases of Saccharomyces cerevisiae as re-vealed by freeze-etching. Journal of General Microbiology, 97(2):323–329, Dec 1976.
M. J. Thomas. The role of free radicals and antioxidants. Nutrition, 16(7-8):716–718,2000.
S. Toepfl. Pulsed Electric Fields (PEF) for Permeabilization of Cell Membranes inFood- and Bioprocessing - Applications, Process and Equipment Design and CostAnalysis. PhD thesis TU Berlin, 2006.
S. Toepfl, V. Heinz, and D. Knorr. Emerging Technologies for Food Processing, chap-ter Overview of Pulsed Electric Field Processing of Foods, pages 67–97. Elsevier,Oxford, UK., 2005.
S. Toepfl, A. Mathys, V. Heinz, and D. Knorr. Review: Potential of high hydrostaticpressure and pulsed electric fields for energy efficient and environmentally friendlyfood processing. Food Reviews International, 22(4):405–423, 2006.
S. Toepfl, V. Heinz, and D. Knorr. High intensity pulsed electric fields applied forfood preservation. Chemical Engineering and Processing, 46(6):537–546, 2007.
J. Torkko. Characterization of mitochondrial 2-enoyl thioester reductase involved inrespiratory competence. PhD thesis, 2003.
R. Tourdot-Marechal, D. Gaboriau, L. Beney, and C. Divies. Membrane fluidity ofstressed cells of Oenococcus oeni. International Journal of Food Microbiology, 55(1-3):269–273, Apr 2000.
143
Bibliography
T. Tryfona and M. T. Bustard. Impact of pulsed electric fields on Corynebac-terium glutamicum cell membrane permeabilization. Journal of Bioscience andBioengineering, 105(4):375–382, Apr 2008. doi: 10.1263/jbb.105.375. URL http:
//dx.doi.org/10.1263/jbb.105.375.
G. Turcotte and N. Kosaric. The effect of C/N ratio on lipid production by Rho-dosporidium toruloides ATCC 10788. Biotechnology letters, 11(9):637–642, 1989.
M. Turk, V. Montiel, D. Zigon, A. Plemenitas, and J. Ramos. Plasma membrane com-position of Debaryomyces hansenii adapts to changes in pH and external salinity.Microbiology, 153(Pt 10):3586–3592, Oct 2007. doi: 10.1099/mic.0.2007/009563-0.URL http://dx.doi.org/10.1099/mic.0.2007/009563-0.
C. B. Tyson, P. G. Lord, and A. E. Wheals. Dependency of size of Saccharomycescerevisiae cells on growth rate. Journal of Bacteriology, 138(1):92–98, Apr 1979.
U. O. Ugalde and J. I. Castrillo. Applied Mycology and Biotechnology 2, chapter SingleCell Proteins from Fungi and Yeasts, pages 123–150. Elsevier Science Ltd, 2002.
H. M. Ulmer, V. Heinz, M. G. Ganzle, D. Knorr, and R. F. Vogel. Effects of pulsedelectric fields on inactivation and metabolic activity of Lactobacillus plantarum inmodel beer. Journal of Applied Microbiology, 93(2):326–335, 2002.
J. P. Van der Walt. The Lipomycetaceae, a model family for phylogenetic studies.Antonie Van Leeuwenhoek, 62(4):247–250, Nov 1992.
E. van Handel and D. B. Zilversmit. Micromethod for the direct determination ofserum triglycerides. Journal of Laboratory and Clinical Medicine, 50(1):152–157,Jul 1957.
M. Vanoni, M. Vai, L. Popolo, and L. Alberghina. Structural heterogeneity in popu-lations of the budding yeast Saccharomyces cerevisiae. Journal of Bacteriology, 156(3):1282–1291, Dec 1983.
J. C. Varela, U. M. Praekelt, P. A. Meacock, R. J. Planta, and W. H. Mager. TheSaccharomyces cerevisiae HSP12 gene is activated by the high-osmolarity glycerolpathway and negatively regulated by protein kinaseA. Molecular and Cellular Biol-ogy, 15(11):6232–6245, 1995. URL http://mcb.asm.org/cgi/content/abstract/
15/11/6232.
H. Vega-Mercado, U. R. Pothakamury, F. J. Chang, G. V. Barbosa-Canovas, andB. G. Swanson. Inactivation of Escherichia coli by combining pH, ionic strengthand pulsed electric field hurdles. Food Research International, 29 (2):117–121, 1996.
G. Vicente, L. F. Bautista, R. Rodrıguez, F. J. Gutierrez, I. Sadaba, R. M.Ruiz-Vazquez, S. Torres-Martınez, and V. Garre. Biodiesel production from
144

Bibliography
biomass of an oleaginous fungus. Biochemical Engineering Journal, 48(1):22 – 27, 2009. ISSN 1369-703X. doi: DOI:10.1016/j.bej.2009.07.014.URL http://www.sciencedirect.com/science/article/B6V5N-4WW9KXK-2/2/
f6ffe5a987cb63df0cf190d78c7de86f.
B. C. Viljoen, J. L. F. Kock, and P. M. Lategan. The influence of culture age on thecellular fatty acid composition of four selected yeasts. Journal of General Microbi-ology, 132:1895–1898, 1986.
S. Vrati. Single cell protein production by photosynthetic bacteria grown on theclarified effluents of biogas plant. Applied Microbiology and Biotechnology, 19:199–202, 1984.
T. H. Walker, H. D. Cochran, and G. J. Hulbert. Supercritical carbon dioxide ex-traction of lipids from Pythium irregulare. Journal of the American Oil Chemists’Society, 76 (5):595–602, 1999.
W. F. Walker. 5S ribosomal RNA sequences from Ascomycetes and evolutionaryimplications. Systematic & Applied Microbiology, 6:48–53, 1985.
K. Wall, S. J. MacGregor, J. G. Anderson, and J. W. Mackersie. Evidence of nuclearmembrane damage in yeast cells treated with pulsed electric fields. Proceedings ofthe IEEE International Power Modulator Conference, San Francisco, California,pages 623–626, 2004.
P. Walther, M. Muller, and M. E. Schweingruber. The ultrastructure of the cell surfaceand plasma membrane of exponential and stationary phase cells of Schizosaccha-romyces pombe, grown in different media. Archives of Microbiology, 137:128–134,1984.
P. Ways and D. J. Hanahan. Characterization and quantification of red cell lipids innormal man. Journal of Lipid Research, 5(3):318–328, Jul 1964.
J. C. Weaver. Electroporation of cells and tissues. IEEE Transactions on PlasmaScience, 28(1):24–33, 2000.
A. C. M. Weijman and J. P. van der Walt. Carbohydrate profiles and the taxonomicconcept of the Lipomycetaceae. Studies in Mycology, 31(31):193–199, 1989.
M. Werner-Washburne, E. Braun, G. C. Johnston, and R. A. Singer. Stationary phasein the yeast Saccharomyces cerevisiae. Microbiological Reviews, 57(2):383–401, Jun1993.
M. Waltermann, A. Hinz, H. Robenek, D. Troyer, R. Reichelt, U. Malkus, H. J. Galla,R. Kalscheuer, T. Stoveken, P. von Landenberg, and A. Steinbuchel. Mechanism
145
Bibliography
of lipid-body formation in prokaryotes: how bacteria fatten up. Molecular Mi-crobiology, 55(3):750–763, Feb 2005. doi: 10.1111/j.1365-2958.2004.04441.x. URLhttp://dx.doi.org/10.1111/j.1365-2958.2004.04441.x.
A. Wyss, N. Cordente, U. von Stockar, and I. W. Marison. A novel approach for theextraction of herbicides and pesticides from water using liquid-core microcapsules.Biotechnology and Bioengineering, 87(6):734–742, Sep 2004. doi: 10.1002/bit.20181.URL http://dx.doi.org/10.1002/bit.20181.
Y. Yamada and T. Nakase. Waltomyces, a new ascosporogenous yeast genus for theQ10-equipped, slime-producing organisms whose asexual reproduction is by mul-tilateral budding and whose ascospores have smooth surfaces. Journal of Generaland Applied Microbiology, 31:491–492, 1985.
H. Yamauchi, H. Mori, T. Kobayashi, and S. Shimizu. Mass production of lipids byLipomyces starkeyi in microcomputer-aided fed-batch culture. Journal of fermen-tation technology, 61(3):275–280, 1983.
A. Ykema, E. C. Verbree, M. M. Kater, and H. Smit. Optimization of lipid pro-duction in the oleaginous yeast Apiotrichum curvatum in whey permeate. AppliedMicrobiology and Biotechnology, 29:211–218, 1988.
W. M. M. Yunus, Y. W. Fen, and L. M. Yee. Refractive index and fourier transforminfrared spectra of virgin coconut oil and virgin olive oil. American Journal ofApplied Sciences, 6(2):328–331, 2009.
M. Zakhartsev, C. Momeu, and V. Ganeva. High-Throughput Liberation of Water-Soluble Yeast Content by Irreversible Electropermeation (HT-irEP). Journal ofBiomolecular Screening, 12(2):267–275, 2007.
H. E. Zakhem, J. L. Lanoiselle, N. I. Lebovka, M. Nonus, and E. Vorobiev. Theearly stages of Saccharomyces cerevisiae yeast suspensions damage in moderatepulsed electric fields. Colloids and Surfaces B: Biointerfaces, 47(2):189–197, Feb2006a. doi: 10.1016/j.colsurfb.2005.12.010. URL http://dx.doi.org/10.1016/j.
colsurfb.2005.12.010.
H. E. Zakhem, J. L. Lanoiselle, N. I. Lebovka, M. Nonus, and E. Vorobiev. Behavior ofyeast cells in aqueous suspension affected by pulsed electric field. Journal of Colloidand Interface Science, 300(2):553–563, Aug 2006b. doi: 10.1016/j.jcis.2006.04.055.URL http://dx.doi.org/10.1016/j.jcis.2006.04.055.
G. Zayed and Y. H. Roos. Influence of trehalose and moisture content on survival ofLactobacillus salivarius subjected to freeze-drying and storage. Process Biochem-istry, 39:1081–1086, 2004.
146

Bibliography
M. Zenker, V. Heinz, and D. Knorr. Application of ultrasound-assisted thermal pro-cessing for preservation and quality retention of liquid foods. Journal of Food Pro-tection, 66(9):1642–1649, Sep 2003.
X. Zhao, X. Kong, Y. Hua, B. Feng, and Z. Zhao. Medium optimization for lipidproduction through co-fermentation of glucose and xylose by the oleaginous yeastLipomyces starkeyi. European Journal of Lipid Science and Technology, 110(5):405–412, 2008.
K. Zhu, D. O. Bayles, A. Xiong, R. K. Jayaswal, and B. J. Wilkinson. Precursor andtemperature modulation of fatty acid composition and growth of Listeria monocy-togenes cold-sensitive mutants with transposon-interrupted branched-chain alpha-keto acid dehydrogenase. Microbiology, 151(2):615–623, 2005. doi: 10.1099/mic.0.27634-0. URL http://mic.sgmjournals.org/cgi/content/abstract/151/2/
615.
U. Zimmermann. Electromanipulation of Cells, chapter The effect of high intensityelectric field pulses on eukaryotic cell membranes: Fundamentals and applications.Boca Raton, Florida, US, Crc Press, 1996.
U. Zimmermann, G. Pilwat, and F. Riemann. Dielectric breakdown of cell membranes.Biophysical Journal, 14(11):881–899, Nov 1974. doi: 10.1016/S0006-3495(74)85956-4. URL http://dx.doi.org/10.1016/S0006-3495(74)85956-4.
U. Zimmermann, G. Pilwat, F. Beckers, and F. Riemann. Effects of external electricalfields on cell membranes. Bioelectrochemistry and Bioenergetics, 3(1):58–83, 1976.
E. Zinser, F. Paltauf, and G. Daum. Sterol composition of yeast organelle membranesand subcellular distribution of enzymes involved in sterol metabolism. Journal ofBacteriology, 175(10):2853–2858, May 1993.
R. S. Zitomer and C. V. Lowry. Regulation of gene expression by oxygen in Saccha-romyces cerevisiae. Microbiological Reviews, 56(1):1–11, Mar 1992.
A. Zulueta, M. J. Esteve, I. Frasquet, and A. Frıgola. Fatty acid profile changesduring orange juice-milk beverage processing by high-pulsed electric field. EuropeanJournal of Lipid Science and Technology, 109(1):25 – 31, 2007.
147

Danksagung
Herrn Prof. Dr. Dietrich Knorr danke ich fur die Uberlassung des Themas, dieFinanzierung meines Forschungsvorhabens, die standige Disskussionsbereitschaft,sowie das rege Interesse am Fortgang meiner Arbeit.
Ich danke Herrn Prof. Dr. Sascha Rohn fur seine Bereitschaft als zweiterGutachter tatig zu sein und fur seine große Unterstutzung bei der Durchfuhrungder Gaschromatographie Messungen.
Herrn Prof. Dr. Ulf Stahl danke ich fur die Ubernahme des Prufungsvorsitzessowie fur die Bereitstellung der Hefe.
Mein Dank gilt auch Herrn Prof. Dr. Lothar Kroh und den Mitarbeitern desFachgebietes Lebensmittelchemie und Analytik, die mir die Gaschromatogra-phie Messungen ermoglicht haben und Frau Prof. Dr. Tina Romeis sowieHerrn Dr. Ulrich Dubiella fur die Moglichkeit zur Durchfuhrung der FluoreszenzMikroskopie.
Besonderer Dank gilt auch Frau Irene Hemmerich fur Ihre stets große Unter-stutzung, insbesondere bei der Durchflusszytometrie. Frau Dipl.-Ing. AntjeLitzmann danke ich sehr fur die Durchsicht meiner Arbeit und die gemeinsamenProblemlosungen bei der Fermentation. Großer Dank gilt naturlich auch allenanderen Mitarbeitern des Fachgebietes, fur die Unterstutzung, Hilfe und gutenDiskussionen, die sehr zum Gelingen meiner Arbeit beigetragen haben.
Ich danke auch den Studenten, Erik, Franzi, Frederik, Gunnar, Maud und Ker-stin fur Ihren Einsatz.
Großer Dank gilt naturlich meinen Eltern, meiner Schwester und meinen Freun-den fur die Unterstutzung bei meinem Studium und meiner Promotion. Beson-ders danken mochte ich auch Silvia, die mir in allen Phasen der Promotionszeiteine riesige Hilfe war.
148

Eidesstattliche Erklarung
Ich erklare an Eides statt, dass die vorliegende Dissertation in allen Teilen von mirselbstandig angefertigt wurde und die benutzten Hilfsmittel vollstandig angegebenworden sind.
Berlin, 16.8.2010
149
Related Documents