RESEARCH AND ANALYSIS Pulp Nonfiction Regionalized Dynamic Model of the U.S. Pulp and Paper Industry Brynhildur Davidsdottir and Matthias Ruth Summary This article presents a modeling framework that enhances our ability to analyze the implications of policy for future sus- tainability of industrial systems. The framework quantifies the relationship between physical input and waste flows, capital vintage, and investment behavior in the U.S. pulp and paper industry. A regional vintage model is developed that simulta- neously incorporates investment decisions, vintage structure of the capital stock, and physical material and energy flows, in addition to paper demand. Each capital vintage is specified by size, output structure, and age-specific retirement rates, as well as fiber use and energy intensities. Both embodied and disembodied technological change are incorporated, as well as greenhouse gas emissions from fuel use, and decom- position and incineration of waste. Estimated equations are used to simulate industrial futures until 2020, from a system of nonlinear differential equations. Our results demonstrate the economic and physical inter- dependence between material and energy flows and the cen- tral role energy prices have in decision-making. For instance, an increase in average energy prices, ceteris paribus, will on average discourage paper recycling, which has implications for greenhouse gas emissions as well as for changes in energy intensity. The analysis of the data reveals diminishing rates of energy self-generation, and the immense longevity of capital, which hampers rapid change in input and carbon intensity. This stresses the importance of investment-led strategies in facil- itating faster capital turnover to enhance future sustainability of the system. Keywords capital vintage dynamic modeling energy flows greenhouse gas (GHG) emissions material flows technological change Address correspondence to: Brynhildur Davidsdottir Abt Associates Inc. 55 Wheeler Street Cambridge, MA 02138, USA <[email protected]> © 2005 by the Massachusetts Institute of Technology and Yale University Volume 9, Number 3 http://mitpress.mit.edu/jie Journal of Industrial Ecology 191

Welcome message from author
This document is posted to help you gain knowledge. Please leave a comment to let me know what you think about it! Share it to your friends and learn new things together.
Transcript
RESEARCH AND ANALYSIS
Pulp NonfictionRegionalized Dynamic Model of the U.S.Pulp and Paper Industry
Brynhildur Davidsdottir and Matthias Ruth
Summary
This article presents a modeling framework that enhancesour ability to analyze the implications of policy for future sus-tainability of industrial systems. The framework quantifies therelationship between physical input and waste flows, capitalvintage, and investment behavior in the U.S. pulp and paperindustry. A regional vintage model is developed that simulta-neously incorporates investment decisions, vintage structureof the capital stock, and physical material and energy flows,in addition to paper demand. Each capital vintage is specifiedby size, output structure, and age-specific retirement rates,as well as fiber use and energy intensities. Both embodiedand disembodied technological change are incorporated, aswell as greenhouse gas emissions from fuel use, and decom-position and incineration of waste. Estimated equations areused to simulate industrial futures until 2020, from a systemof nonlinear differential equations.
Our results demonstrate the economic and physical inter-dependence between material and energy flows and the cen-tral role energy prices have in decision-making. For instance,an increase in average energy prices, ceteris paribus, will onaverage discourage paper recycling, which has implications forgreenhouse gas emissions as well as for changes in energyintensity. The analysis of the data reveals diminishing rates ofenergy self-generation, and the immense longevity of capital,which hampers rapid change in input and carbon intensity. Thisstresses the importance of investment-led strategies in facil-itating faster capital turnover to enhance future sustainabilityof the system.
Keywords
capital vintagedynamic modelingenergy flowsgreenhouse gas (GHG) emissionsmaterial flowstechnological change
Address correspondence to:Brynhildur DavidsdottirAbt Associates Inc.55 Wheeler StreetCambridge, MA 02138, USA<[email protected]>
© 2005 by the Massachusetts Institute ofTechnology and Yale University
Volume 9, Number 3
http://mitpress.mit.edu/jie Journal of Industrial Ecology 191
R E S E A R C H A N D A N A LYS I S
Introduction
The analysis of physical material and en-ergy flows conventionally is performed with en-ergy/materials flow analysis (MFA) using physi-cal/engineering parameters combined with massbalance equations (Kleijn 1999). ConventionalMFA, though, tends to be static or compara-tive static and does not ask or answer ques-tions regarding the forces that influence physicalflows, such as capital inertia, path dependency,or learning—and thus does not link the physicalanalysis to economic drivers of change (Graedeland Allenby 1995; Ayres 1978; Sundin et al.2002; Brunner and Rechberger 2003). A notableexception is a study by Nystrom (2001) on theSwedish paper industry. Yet physical flows do notexist in isolation from economic variables. Anychange in physical flows, be it to improve energyor material efficiency, or to change the materialor energy mix used in a production process, is in-fluenced by economic decision-making and theeconomic and physical realities of the already in-stalled capital stock. Expanding the boundaries ofphysical flow analysis to include the economicsof change facilitates a descriptive analysis of al-ternative physical energy and material futures asa function of economic drivers. Making that con-nection explicit will enhance our ability to an-alyze the impact of policy on the future sustain-ability of industrial systems.
The scientific community already has calledfor increased use of dynamic systems-basedengineering-economic approaches. In 1998 morethan 100 leading international industry ex-perts called for less aggregated analytical eco-nomic modeling and the increased presence ofengineering-economic analysis in the context ofclimate change policies (Dowd and Newmann1999). Kleijn (1999), in the Journal of IndustrialEcology, suggested increased research into howdynamic modeling could be applied to materialflow systems. Andrews (2000) proposed going be-yond “what” questions by asking “how”—for ex-ample, how do individuals (or firms, industries)make decisions, and how do those decisions in-fluence material and energy flows? More recently,at the 2003 American Council for an Energy-Efficient Economy (ACEEE) Summer Study, nu-merous industry and modeling experts signed a
statement expressing the need for more trans-parent modeling tools that enable holistic analy-sis of industrial systems where input choices arelinked to output decisions and waste flows. Suchtools could assist in analyses of unexpected costsand benefits (co-benefits) of a management deci-sion/policy (see ACEEE 2003).
The modeling framework presented in this ar-ticle aims to answer those calls by facilitatinga dynamic analysis of physical material and en-ergy flows, linked to the economics of industrialchange. Flows of energy and materials are mod-eled using nonlinear differential equations, in-corporating time lags, and linking those flows toinvestment and output decisions as well as to cap-ital vintage and waste flows. The model providesa descriptive analysis of industrial behavior andgenerates insights into the ability of an industryto react to changes in its external environment,given the vintage structure dynamics of its capitalstock, alternative investment choices, and policyvariables.
The remainder of this article describes the de-velopment and base simulation results of a dy-namic capital vintage model, which combinesinformation on physical input and output flowswith the economics of change. The following sec-tion reviews the economic drivers of industrialchange in the context of capital vintage dynam-ics. The third section describes the implementa-tion of the modeling framework for an analysis ofthe U.S. pulp and paper industry, beginning witha description of the system and system bound-aries, followed by a relatively detailed descriptionof the model itself. The fourth section presentshighlights from model parameterization and basicsimulation results, focusing on implications forenergy, material, and climate change policy. Thearticle concludes with a discussion of the rele-vance of the approach and findings to industrialsystems analysis as well as energy, material, andclimate change policy.
Drivers of Industrial Change
Technological Change, StructuralChange, and Substitution
Changes in the average input intensityof energy and material flows by process are
192 Journal of Industrial Ecology
R E S E A R C H A N D A N A LYS I S
commonly decomposed into those caused bytechnological change,1 structural change, and in-put substitution (Farla et al. 1997). The scale ofmaterial and energy flows is considered a functionof input intensity, output structure—the mix ofproducts generated within the system—and out-put volume (Levine 2003). Economic and engi-neering factors then are considered to influenceeach of these components.
Technological change can either be embodiedor disembodied, where embodied change only in-fluences new capital vintages and disembodiedchange influences the efficiency of already in-stalled capital (Solow 1957; Meijer 1994; Berndtet al. 1993; Davidsdottir 2004). Embodied tech-nological change implicitly captures invention,innovation, and diffusion (Schumpeter 1938),through which the innovated invention becomespart of the capital stock via either replacementor expansion investment.
Embodied technological change requires sig-nificant direct and indirect capital investments.Direct investments are undertaken by the indus-try using the capital and indirect investmentsare carried out by those participating in the ear-lier stages (invention and innovation) through,for example, research and development expen-ditures. Research and development expenditureshave much impact on the character (e.g., effi-ciency) of available new capital and usually oc-cur outside of the industrial system in question(Scherer 1982). Because embodied change occursthrough new capital investment, it only influ-ences the input efficiency of the youngest capitalvintages.
Capital vintage is defined based on the yearin which investment occurred. The size of eachvintage is a function of both expansion and re-placement investment—which both add to thenewest vintages (the “front end”) of the pro-ductive capital stock and together establish thenew vintage. The size of “existing” vintages de-clines as a function of replacement investment.Replacement investment or retrofits thus alterthe structure of the capital stock, and reducethe size of an existing vintage, but add to thesize of new vintages. If replacement investmentfor a particular vintage expands the produc-tive capacity of the capital stock, the expan-sion is defined as expansion investment. Thus
expansion investment is not limited to greenfield(completely new) mills.
The extent to which embodied technologi-cal change occurs depends on input prices andlearning and is highly path-dependent (Arthur1994; Unruh 2000; Kuper and Soest 2003). Pathdependency is the result of mature industries con-tinuing to invest in similar technologies throughtime (Arthur 1994; Unruh 2000), fostering in-cremental rather than radical changes. Choicesmade early on in the development of an industrygradually rigidify (technology lock-in), definingthe future technology trajectory as a function ofthe structure of the existing capital stock. Capitalinertia further reduces the rate of technologicalchange and efficiency improvements. If an indus-try is mature, capital-intensive, and dominated byearly-vintage capital stock, capital vintage struc-ture can act as a significant deterrent to changein response to altered external economic or en-vironmental conditions.
Learning, which here is defined as a changein input intensity per unit of output or in theoperational or capital costs per unit of outputas a function of cumulative experience, also in-fluences the speed of diffusion and thus em-bodied technological change. As learning orexperience is gained, capital, operational cost,and input intensity tend to decline (Woerlen2003).
Disembodied technological change only influ-ences “older” vintages and is a change in inputefficiency of the already installed capital stock. Itoccurs not as a result of retrofits or replacementinvestment, but as a function of low- or no-costoperational changes (Ross 1991). Such changescan be in the form of improved housekeepingpractices and they typically do not require a sub-stantial investment in fixed capital structures.Examples are improved insulation and the useof more energy-efficient light bulbs. Learning-by-doing plays a central role in disembodiedchange as enterprises gain experience in oper-ating equipment, and thus efficiency improvesafter capital is installed (Meijer 1994; Davidsdot-tir 2002; Ruth et al. 2004; Davidsdottir and Ruth2004).
Structural change in industrial system anal-ysis is defined as a change in the output mixand is driven by demand and other factors in
Davidsdottir and Ruth, Regionalized Dynamic Model of the US Pulp and Paper Industry 193
R E S E A R C H A N D A N A LYS I S
an industry’s economic environment, but is lim-ited by the vintage structure of the capital stock.2
Structural change in the paper industry could en-compass a shift away from producing newsprinttoward producing more printing and writingpapers. Because fiber and energy requirements dif-fer substantially for those two products—they areproduced using different pulping processes—sucha shift would influence both energy and materialintensity as well as the character of those flows(Ruth and Harrington 1998; Davidsdottir 2004;AF&PA various years).
Material and energy flows also change in re-sponse to direct input substitution. Substitutionis defined as an increase in the use of one in-put and a decline in another one, holding outputconstant. Substitution between energy and ma-terials in industrial systems is in most cases noteasily possible for capital either of new or of oldvintages, but substitution within energy and ma-terial bundles is in most cases possible for newvintages but less so for old vintages (Ayres 1978;Davidsdottir 2002).
As can be inferred from the above description,changes in input intensity are always in some waylinked to behavioral or economic parameters suchas consumer preferences and input prices, but ulti-mately are defined by the structure and size of thecapital stock. Consequently, to enable adequatedynamic descriptions of material and energy flowsrequires that capital vintage-specific features suchas input efficiency, size of each vintage, and capi-tal utilization rates be captured. This can be doneusing capital vintage modeling.
Capital Vintage Modeling
Capital vintage models were first developed inthe 1950s and 1960s (e.g., Johansen 1959; Kaldorand Mirrlees 1962). Such models have recentlybeen used to analyze energy flows in industrial sys-tems (Ruth et al. 2004; Ruth and Amato 2002;Davidsdottir and Ruth 2004; Davidsdottir 2002,2003, 2004). Capital vintage models capture theage structure of the capital stock and its asso-ciated age-specific attributes such as size, rate ofreplacement, input efficiency, and input substitu-tion possibilities. For example, an older vintageis likely to require a larger amount of input mate-
rials and energy to produce the same amount ofphysical output as a new vintage.
An industrial system “evolves” as the capi-tal stock changes via investment, either throughexpansion of the capital stock (expansion in-vestment) or through the gradual replacementof old, obsolete, or worn-out structures (replace-ment investment). The expansion of a capitalstock will, ceteris paribus, increase the use of inputmaterials and slightly improve material and en-ergy efficiency—given that the industry investsin more efficient capital. Assuming the indus-try invests in more efficient capital, replacementinvestment will more extensively increase en-ergy and material efficiency and help keep con-stant (or reduce) the total use of material andenergy inputs. Thus, the “evolution” of a ma-ture industrial system changes the efficiency ofmaterial and energy use, which, combined withoutput levels and structure of the output, de-termines the size of total material and energyflows.
The capital vintage approach used in thisstudy expands the vintage models developedby Meijer (1994), Ruth and colleagues (2004)and Davidsdottir and Ruth (2004). This ap-proach differs from others in four importantways. First, we link regional output structure andregion-specific parameters to investment behav-ior. Earlier models did not contain such region-specific detail. Second, we simultaneously cap-ture material, energy, and waste flows. Earliermodels only analyzed either energy or materi-als, and, in most cases, did not capture wasteflows. Third, we incorporate both embodied anddisembodied technological change, which wasnot explicitly done in earlier models. Fourth,replacement investment and thus depreciation isendogenous, and we acknowledge differences invintage-specific capital depreciation and replace-ment rates. Earlier models applied a fixed, ex-ogenous, and non-vintage-specific depreciationrate.
The structure, size, and capital utilization ofnew and existing vintages determine—togetherwith the vintage-specific input efficiency of eachindividual process and its vintage-specific rate ofdisembodied change—the total flow of a spe-cific input (e.g., energy) through the system.The input efficiency changes as a function of
194 Journal of Industrial Ecology
R E S E A R C H A N D A N A LYS I S
substitution, structural change, and technologi-cal change, which is modeled as endogenous andembodied as well as disembodied change and isinfluenced, for example, by capital inertia, learn-ing, and path dependency.
Efficiency by vintage and output levels bytype and by vintage determine total inputrequirements. Total requirements are disaggre-gated into different energy and material typesbased on econometrically estimated input sub-stitution equations. The total size of energy andmaterial flows by type, combined with engineer-ing parameters, provide estimates of total wasteflows from the system. The overall methodolog-ical approach is thus based on a combination ofmaterial flow/energy flow analysis, which is linkedby capital vintage accounting and dynamic mod-eling (Hannon and Ruth 2001) to simulate totalmaterial and energy flows using nonlinear dif-ferential equations (see, e.g., Van Beukering andJanssen 2000). The following section describes indetail the structure of the model, including themethodology by which technological change andinput substitution are captured.
The industrial system chosen for this studyis the U.S. pulp and paper industry (NAICSCode 322), which is briefly described in thesection below. More detailed descriptions ofthis industry can be found in earlier editions ofthis journal, (e.g., Ruth and Harrington 1998)and elsewhere (e.g., Smith 1996; Davidsdottir2002).
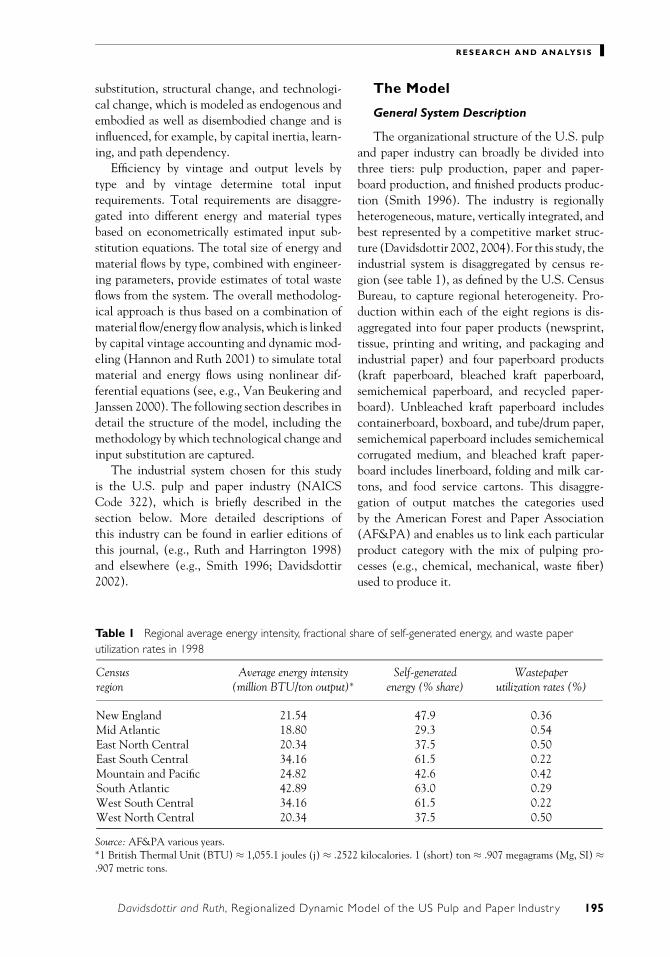
Table 1 Regional average energy intensity, fractional share of self-generated energy, and waste paperutilization rates in 1998
Census Average energy intensity Self-generated Wastepaperregion (million BTU/ton output)∗ energy (% share) utilization rates (%)
New England 21.54 47.9 0.36Mid Atlantic 18.80 29.3 0.54East North Central 20.34 37.5 0.50East South Central 34.16 61.5 0.22Mountain and Pacific 24.82 42.6 0.42South Atlantic 42.89 63.0 0.29West South Central 34.16 61.5 0.22West North Central 20.34 37.5 0.50
Source: AF&PA various years.∗1 British Thermal Unit (BTU) ≈ 1,055.1 joules (j) ≈ .2522 kilocalories. 1 (short) ton ≈ .907 megagrams (Mg, SI) ≈.907 metric tons.
The Model
General System Description
The organizational structure of the U.S. pulpand paper industry can broadly be divided intothree tiers: pulp production, paper and paper-board production, and finished products produc-tion (Smith 1996). The industry is regionallyheterogeneous, mature, vertically integrated, andbest represented by a competitive market struc-ture (Davidsdottir 2002, 2004). For this study, theindustrial system is disaggregated by census re-gion (see table 1), as defined by the U.S. CensusBureau, to capture regional heterogeneity. Pro-duction within each of the eight regions is dis-aggregated into four paper products (newsprint,tissue, printing and writing, and packaging andindustrial paper) and four paperboard products(kraft paperboard, bleached kraft paperboard,semichemical paperboard, and recycled paper-board). Unbleached kraft paperboard includescontainerboard, boxboard, and tube/drum paper,semichemical paperboard includes semichemicalcorrugated medium, and bleached kraft paper-board includes linerboard, folding and milk car-tons, and food service cartons. This disaggre-gation of output matches the categories usedby the American Forest and Paper Association(AF&PA) and enables us to link each particularproduct category with the mix of pulping pro-cesses (e.g., chemical, mechanical, waste fiber)used to produce it.
Davidsdottir and Ruth, Regionalized Dynamic Model of the US Pulp and Paper Industry 195
R E S E A R C H A N D A N A LYS I S
The industry is one of the most capital-intensive industries in the United States, with ca-pacity utilization rates averaging over 90%. Lowprofit margins and high capital intensity com-pel the industry to operate at almost full capac-ity, and any halt to production, for example, toupdate antiquated equipment and thus improveenergy efficiency, may result in bankruptcy.Hence, any updates in energy efficiency are oftenrealized as side results of changes in productioncapabilities. As may be expected, technologicalchange has been incremental (rather than radi-cal), partially as a result of such low profit mar-gins and immense capital intensity coupled withlow rates of capital turnover (equipment as oldas 100 years or more is still in use within theindustry), all resulting in significant capital iner-tia. Thus, capital inertia, together with observ-able path dependency—which indeed is to beexpected of a mature industry—overall are themain culprits for the incremental rate of techno-logical change (Davidsdottir 2004). Additionalevidence of the industry’s incremental changecan be found in research by Smith (1996), Herzogand Tester (1991), and Norberg-Bohm and Rossi(1998).
Material inputs primarily consist of waste orvirgin fibers with a waste fiber utilization rate(WUR) averaging 35%, yet regionally varyingfrom 20 to 54% (see table 1).
The model captures the regional flow of ma-terials by type and process. Virgin materials flowfrom forestry operations to the pulp and papermaking process and flow out of the system as wastepaper. The model captures the flow of domesti-cally produced waste paper and traces its fate—either into the industrial system again or into thesolid waste stream. After waste paper ends up inthe solid waste stream, it is assumed to be eitherincinerated or put into landfills. Consequently,the model excludes the possibility of waste paperexports, which in recent years have become sig-nificant. As a result it is likely that the modeloverestimates methane emissions from land-fills.
Total regional energy use is disaggregatedinto self-generated energy (mostly derived fromblack liquor, the liquid residual from the pulp-ing process) and six different purchased fuels.Purchased fuels are natural gas, residual fuel oil,
coal, electricity, and distillate fuel oil, in addi-tion to “others” that include steam and liquefiedpetroleum gas. Self-generated energy is modeledas an aggregate of spent liquor, hogged fuels,3
bark, and waste paper. Combined heat and poweris not explicitly modeled, but is incorporated intofuture efficiency descriptions for chemical pulp-ing as self-generated energy.
Fuel intensity and fuel mix are regionally het-erogenous, with self-generation ranging from 30to 63% (table 1). Table 1 illustrates that produc-tion in regions that rely on virgin fibers is, onaverage, more intensive in virgin fiber and en-ergy use, whereas self-generated energy supplies alarger proportion of total energy needs.
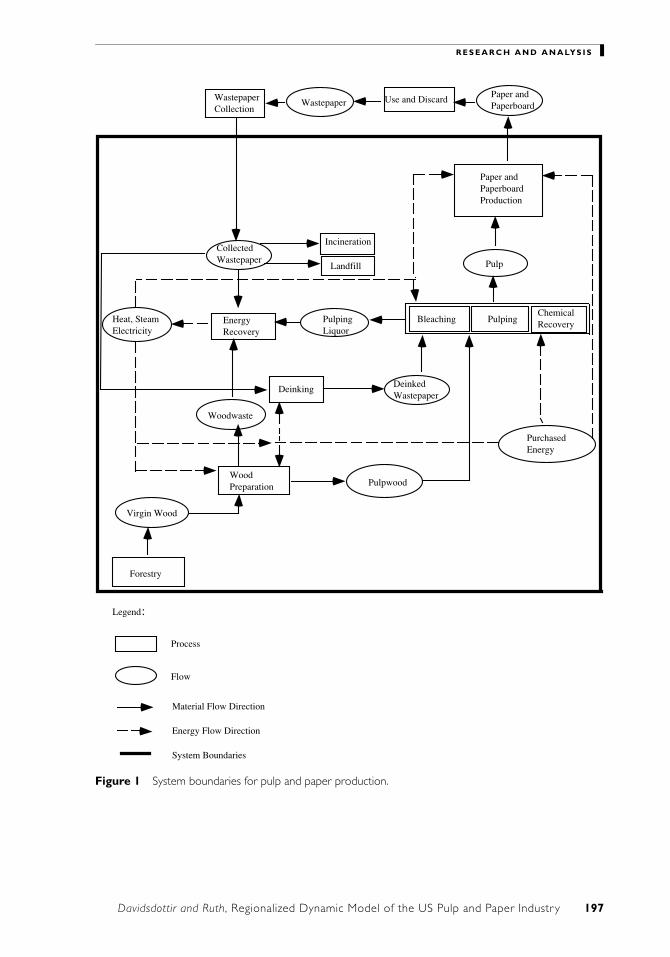
In summary, the model simultaneously tracesfor each region the physical flow of energy andmaterials by type as well as changes in the struc-ture of the regional capital stocks and the mixand quantity of products (figure 1).
Carbon dioxide emissions from the burning offossil fuels, as well as methane and carbon dioxideemissions from paper decay in landfills, in addi-tion to emissions from waste-paper incinerationare also captured.
Several parameters are considered as outsideof system boundaries for this version of the model.Energy and materials used for the transport of pa-per products to the market, for collection of wastepaper, and in forestry are considered to be outsideof system boundaries, as are their corollary carbonemissions. International trade is also excluded,and thus, given recent developments in the in-dustry, the model is likely to overestimate totaldomestic paper and paperboard production andthus total carbon emissions from the U.S. pulpand paper industry. Nevertheless, trends in en-ergy, material, and carbon intensity are likely tobe relatively unaffected, as technology spilloversinto the U.S. market are relatively small.
Model Structure
The model contains the following five inter-acting modules:
� Production module—simulates regional pro-duction levels/growth by product type.
� Physical vintage module—describes the size ofeach capital vintage and simulates changesin the size of existing vintages and the
196 Journal of Industrial Ecology
R E S E A R C H A N D A N A LYS I S
CollectedWastepaper
Landfill
Heat, SteamElectricity
EnergyRecovery
PulpingLiquor
Forestry
Virgin Wood
WoodPreparation Pulpwood
Woodwaste
Deinking DeinkedWastepaper
Bleaching PulpingChemicalRecovery
Paper andPaperboardProduction
Pulp
Paper andPaperboard
Use and DiscardWastepaperWastepaperCollection
PurchasedEnergy
Legend:
Process
Flow
Energy Flow Direction
Material Flow Direction
System Boundaries
Incineration
Figure 1 System boundaries for pulp and paper production.
Davidsdottir and Ruth, Regionalized Dynamic Model of the US Pulp and Paper Industry 197
R E S E A R C H A N D A N A LYS I S
addition of new vintages as a function ofreplacement and expansion investment.
� Input intensity module—relates the input in-tensity of each input type by vintage to thesize of each vintage, giving the total in-tensity of the capital stock, and, combinedwith the production module, gives total useof each input type.
� Input mix module—simulates changes in theinput mix, that is, the switch between pro-cess fuels and from virgin to waste fibers.
� Greenhouse gas emissions module—describesemissions of methane and carbon dioxidefrom landfilled paper using the EMCONMethane Generation Model (EMCON As-sociates 1982), emissions from waste paperincineration, and emissions from the use ofprocess fuels by type.
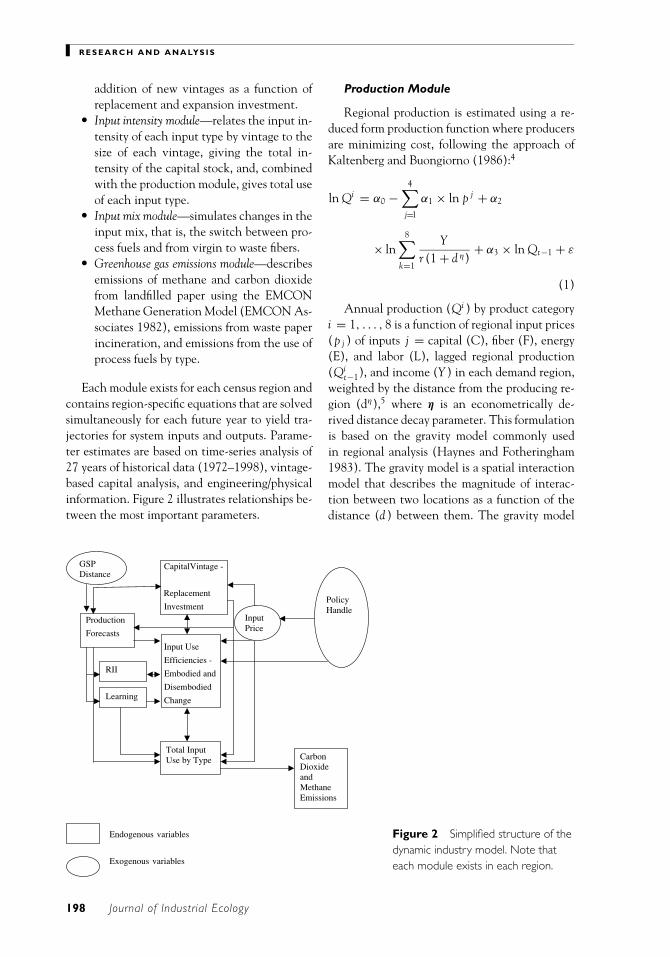
Each module exists for each census region andcontains region-specific equations that are solvedsimultaneously for each future year to yield tra-jectories for system inputs and outputs. Parame-ter estimates are based on time-series analysis of27 years of historical data (1972–1998), vintage-based capital analysis, and engineering/physicalinformation. Figure 2 illustrates relationships be-tween the most important parameters.
CapitalVintage -
Replacement
Investment
Production
Forecasts
Input Use
Efficiencies -
Embodied and
Disembodied
Change
Endogenous variables
Exogenous variables
Total Input Use by Type
Learning
RII
Input Price
Policy Handle
Carbon Dioxide and Methane Emissions
GSP Distance
Figure 2 Simplified structure of thedynamic industry model. Note thateach module exists in each region.
Production Module
Regional production is estimated using a re-duced form production function where producersare minimizing cost, following the approach ofKaltenberg and Buongiorno (1986):4
ln Qi = α0 −4∑
j=1
α1 × ln p j + α2
× ln8∑
k=1
Yr (1 + d η)
+ α3 × ln Qt−1 + ε
(1)
Annual production (Qi ) by product categoryi = 1, . . . , 8 is a function of regional input prices(p j ) of inputs j = capital (C), fiber (F), energy(E), and labor (L), lagged regional production(Qi
t−1), and income (Y ) in each demand region,weighted by the distance from the producing re-gion (dη),5 where η is an econometrically de-rived distance decay parameter. This formulationis based on the gravity model commonly usedin regional analysis (Haynes and Fotheringham1983). The gravity model is a spatial interactionmodel that describes the magnitude of interac-tion between two locations as a function of thedistance (d ) between them. The gravity model
198 Journal of Industrial Ecology
R E S E A R C H A N D A N A LYS I S
captures the distance impacts on interregionaltrade, for example, by taking into account thatthe farther places are apart, the less they interact.The α’s are regression coefficients and ε is the re-gression residual. Data on input prices are avail-able from Miller Freeman (various years), En-ergy Information Administration (EIA variousyears), American Forest and Paper Association(AF&PA, various years), and Moody’s InvestorsServices (various years). Data on regional growthare available from the U.S. Bureau of EconomicAnalysis (BEA various years) and past productionrates are available from AF&PA (various years).
Physical Vintage Module
The physical vintage module captures thestructure and changes in the capital stock. Thecapital stock initially is broken into “surviving”annual vintages that consist of still potentiallyproductive investments that were installed eachyear between 1950 and 1998. Future changes inthe capital stock are captured using a physicalperpetual inventory, see equation (2), where thesize of the total capital stock (K ) is described as afunction of current regional gross new capital in-vestments (I), the size of last year’s capital stock(that is, the sum of surviving past investments),and a vintage-specific physical depreciation rate(µτ ) (Jorgenson 1997):
K = It +T−1∑τ=1
(1 − Totalµτ,t ) × Iτ (2)
I = (EXPI + REPLI) (3)
where
EXPI = (K − Kt−1)
REPL =T∑
τ=1
(µτ,t × Iτ,t ) (4)
Totalµτ = MaxTotalµτ
expα0×expα1×age+α2×p j(5)
where
µr = (Totalµτ − Totalµτ−1)
Gross new capital investment is a function ofexpansion investment (EXPI) and replacement
investment (REPLI), see equation (3), where ex-pansion investment is econometrically estimatedas a function of input prices6 (p) and capacity uti-lization parameters, effectively linking desired ca-pacity levels to investment decisions (Jorgenson1997; Davidsdottir 2002). Replacement invest-ment by definition equals the proportion of grossinvestment that directly replaces retired anddepreciated capital (equation (4)) (Jorgenson1997). Vintage-specific replacement rates (µτ )are econometrically estimated using a Gumpertzcurve and are influenced by input prices (p byinput j) and the age of capital, see equation (5).7
Historical data on replacement and expansioninvestment is available from AF&PA (variousyears) and input prices are available from MillerFreeman (various years), EIA (various years),AF&PA (various years) and Moody’s InvestorsServices, found at <www.moodys.com>.
Input Intensity and Technological Change
Each vintage, as it enters the capital stock, isassigned a set of region- and vintage-specific in-put intensity parameters, and thus captures em-bodied technological change. The input inten-sity of each new vintage (EIE j
τ ) depends on theregional relative input intensity (RII j ) of newto old capital (EIA 2002) and the weighted av-erage embodied intensity of the existing capitalstock (WAIE j
t−1) (equation (7)). The vintage-specific RII j is a function of region- and process-specific output mix and process-specific relativeinput intensities (RIISi ), weighted by the con-tributing share of process i to total output (Q)(equation (6)). WAIE j
t−1 is a function of av-erage intensity of all vintages weighted by thevintage-specific fractional share in total produc-tion (equation (8)). That fractional share is afunction of the size of each vintage, multipliedby capital utilization rates, and divided by totalproduction volume from the entire capital stock:
RII j =8∑
i =1
(RIISi ×
(Qi∑8
i =1 Qi
))(6)
EIE jτ = RII j ∗WAIE j
t−1 (7)
WAIE j =T−1∑τ=1
(EIE j
τ ×(
Qτ∑Tτ=1 Qτ
))(8)
Davidsdottir and Ruth, Regionalized Dynamic Model of the US Pulp and Paper Industry 199
R E S E A R C H A N D A N A LYS I S
Input intensity of “existing” capital varies inresponse to disembodied technological change.Disembodied change, by definition, is assumednot to be capital-intensive. It is econometri-cally estimated as a function of input prices andlearning-by-doing, where the latter is a functionof cumulative production.
Combining the two types of technologi-cal change gives the dynamic vintage-specificintensity (IEj
τ ) of the productive capital stock,see equation (9). Total input use by type (TIj) ismeasured as a function of the dynamic vintage-specific input intensity, total vintage size (Iτ ) ateach time period, and capital utilization rates(Q/K ), where Q is total production and K equalstotal size of the capital stock, see equation (10):
IE jτ = EIE j
τ ×(
1 +∑T
τ �AEold
AEoldt=1
)(9)
TI jt =
T∑τ=1
(IE j
τ ×(
Iτ ×(
QK
)))(10)
Thus total input use by input type is a functionof the remaining size of each age class (vintage) ofcapital, the extent to which each vintage is usedin the production of paper and paperboard, andthe input efficiency of each vintage. The latterchanges with embodied and disembodied tech-nological change and with output mix. Historicaldata on input use by input type is available fromAF&PA (various years). Data on process-specificefficiencies and fiber types is derived from work byMartin and colleagues (2000), Energetics (1990),Skog and colleagues (1998), and AF&PA (vari-ous years).
Input Substitution—Energy and Materials
The aggregate energy and material flows areunbundled into vectors of different material andenergy types through input substitution analysis,which annually updates the mix of energy andmaterials within each bundle.
Substitution among the various energy typesis econometrically estimated with seemingly un-related regressions. The change in non-quality-adjusted fractional shares of each fuel[�E(%) j =e ], where e = coal, natural gas,residual fuel oil, electricity, distillate fuel oil,
self-generated fuels), is specified as a function ofthe change in actual and relative energy prices(�p j =e) and the share of kraft pulping, correctedby waste paper utilization rates (equation (11)):
�E(%) j =e = α0 + α1
�
(Qi =kraft × (1 − WUR)∑8
i =1 Qi
)
+α2 × �p j =e (11)
Total fuel use by type is therefore a functionof each fuel-specific fractional share multipliedby total energy use from equation (10).
Substitution among fiber sources is economet-rically estimated with a Fisher and Pry technol-ogy substitution model (Fisher and Pry 1971).Changes in waste paper utilization rates (WUR)are specified as functions of dynamic maximumWURs (from Ruth and Harrington, 1998), inputprices (p j ), and cumulative waste paper produc-tion (cumulativeQ (equation (11)):
WUR = WURmax/
(1 + exp−(α0+α1×cumulativeQ+α2×p j )) (12)
Maximum waste paper utilization rates de-scribe the maximum amount of WURs to beused for each paper category and are mostlybased on quality requirements such as maintain-ing strength and brightness. The region-specificmaxima are a function of product-specific max-ima and the current mix of products being pro-duced in each region. Total use of waste fibers is afunction of total pulp needs based on the currentprocess mix and the WUR (corrected for shrink-age), with virgin fibers accounting for the remain-der of fiber use—again corrected for shrinkage.To achieve mass balance in the industrial systemas a whole, waste fibers are assumed to originatein 1-year-old domestically produced paper only.Fifteen percent of nonrecycled waste paper is as-sumed to be incinerated and 85% is assumed tobe landfilled. We assume that those percentagesremain constant in all our simulations.
Greenhouse Gas Emissions
The paper industry contributes both directlyand indirectly to greenhouse gas emissions,mostly in the form of carbon dioxide (CO2) and
200 Journal of Industrial Ecology
R E S E A R C H A N D A N A LYS I S
methane (CH4). The model captures three dif-ferent carbon emissions metrics. These are
� Net Carbon Emissions: carbon emitted in theform of carbon dioxide from fossil fuel com-bustion, assuming that self-generated fuelsare carbon-neutral.
� Total Carbon Emissions: sum of carbon diox-ide emitted from fossil fuel combustionsand self-generated fuels, implying that self-generated energy is not carbon-neutral.
� Gross Carbon Emissions: CO2-equivalentemissions of carbon from fossil fuel com-bustion, self-generated energy, waste-paperincineration, and decomposition of paperproducts in landfills.
Carbon emitted as carbon dioxide from theburning of fossil fuels is a function of total fueluse by type- and fuel-specific carbon coefficients.Self-generated fuels either are assumed to becarbon-neutral (giving net carbon emissions) orare assigned fuel-specific carbon coefficients (giv-ing total carbon emissions). According to Bar-laz and colleagues (1989), carbon emitted ascarbon dioxide from landfills amounts to two-thirds of carbon emitted as methane, which isestimated using the EMCON methane genera-tion model (EMCON Associates 1982; NCASI1999). Based on their analysis of the predictedpowers of methane generation models, Coops andcolleagues (1995) conclude that multiphase mod-els are the most accurate. The EMCON modelis such a multiphase model. It combines severalfirst-order models to express methane generationfrom different fractions of the decomposing ma-terial. The EMCON model packs the solid wastestream into vintages, where each vintage is char-acterized by the year in which it was landfilledand its composition. Methane released each yearfrom a particular vintage in the landfill is a func-tion of the methane generation capacity of thematerial being added to the landfill (estimatedfrom research by Doorn and Barlaz 1995 and Au-genstein 1992), the amount of material by typethat is added to the landfill with a 2-yr time lag8
(from work by Michales and Skog 1997), which isa function of how much waste is recycled, a refusedecay rate coefficient (from work by Peer et al.1993), and time that has passed since the mate-rial was landfilled. Methane emitted is then con-
verted to carbon units using relative molecularweights. The sum of carbon emitted as methane,measured using CO2-equivalent emissions of car-bon as methane, and carbon emitted as carbondioxide is called gross carbon emissions. Becausemethane is 21 times more potent as a green-house gas than carbon dioxide, it is critical tocorrect for global warming potential (GWP) byusing CO2-equivalent emissions of carbon whenadding together carbon emissions from methaneand carbon dioxide. We assume that all landfill-generated methane is released into the atmo-sphere.9 But methane capture from landfills cer-tainly is feasible and the implications of changingthis assumption will be analyzed in a future arti-cle on waste-management options in the pulp andpaper industry.
Parameter Estimation andSimulation Results
After all necessary parameters are estimated,using either econometrics or engineering esti-mates, each equation is entered into the dy-namic simulation software STELLA Researchand the equations are run simultaneously to ex-amine overall industrial behavior. In the caseof econometrically estimated parameters, the-ory and econometric principles guide parame-ter choice. Only statistically significant param-eters enter the simulation model. As always,when model parameters are based on economet-rically estimated values, the parameters may notbe stable over time or may be biased or spu-rious, and thus do not reflect the behavior ofthe system. To guard against such issues, eachequation incorporated into the model had topass extensive regression diagnostics such as theLagrange multiplier tests for heteroscedasticity(Breusch and Pagan 1979) and serial correla-tion (Godfrey 1978, Breusch 1978), as well asaugmented Dickey-Fuller tests for unit roots andcointegration (Dickey and Fuller 1979). Further-more, the descriptive powers of each equationwere estimated using the Theil inequality coeffi-cient and the Hendry Forecast test (Pindyck andRubinfeld 1991; Cuthbertson et al. 1992). Thoseconfirmation measures indicate that the modelhas significant descriptive powers and the regres-sion coefficients are stable, not biased, and not
Davidsdottir and Ruth, Regionalized Dynamic Model of the US Pulp and Paper Industry 201
R E S E A R C H A N D A N A LYS I S
spurious, and thus can be used to describe param-eter relationships in the industry.
Parameter Estimation
Production ModuleThe production module is estimated by region,
using seemingly related regression systems (SUR)to explicitly take into account the potential forsubstitution between output types (Zellner 1962).The SUR model in essence is a recursive modelthat consists of several regression equations thatcontain similar dependent variables—in this caseoutput types—whose variation may be correlated.
Estimation of the parameters entering the re-gional production function highlights the follow-ing:
1. Production levels rarely are a function ofcapital or labor costs except in the North-east. Waste-fiber price is rarely significant,with regional price elasticities10 rangingfrom −0.09 to −0.15. Demand for virginfiber never has a significant price elasticity.Extensive ownership of forest resources bythe pulp and paper industry may explainthis result, because the pulp and paper in-dustry holds over 40% of all privately heldtimberland in the United States.
2. Regional energy price elasticities were inmost cases significant and range from closeto zero to −0.728. This result is consistentwith the findings of Kaltenberg and Buon-giorno (1986).
3. Recycled paperboard exhibits significantregion-specific energy price elasticities,ranging from −0.057 up to −0.728.
4. In regions where virgin fibers are the preva-lent fiber type, the energy price elasticity ofaggregate production of paper and paper-board usually is low or insignificant, withenergy price elasticities of recycled paper-board significantly higher than in regionswith high WUR. In regions that have highWUR, energy price elasticity of total paperand paperboard and recycled products wassimilar. This indicates that in the case of anincrease in energy prices in those regions,the industry will not shift from virgin towaste fibers, but rather reduce overall pro-duction levels.
As detailed in the preceding section, each re-gression coefficient and each regression equationwas subject to extensive diagnostic tests that im-ply that the coefficients are stable, efficient, andnot spurious. The wide range of product-specificenergy price elasticities results from regional het-erogeneity in the industry. For example, in theMid-Atlantic region, where WURs are high, en-ergy price elasticity of recycled paperboard islower than in regions such as the South Atlantic,where WURs are low. Yet at the same time, it issimilar to the energy price elasticity of total pa-per and paperboard production, which is in turnhigher than in regions with low WURs. This isbecause if energy prices increase in the South theindustry simply shifts to using more virgin fiber,an option that is not easily available to firms inthe Mid-Atlantic region. Overall, the results in-dicate that an increase in energy price is likelyto result in a reduction of WURs in regions withlow WURs, rather than in an overall decline inproduction levels, because substitution flexibilityexists in those regions. In regions predominantlydependent on waste fibers, an increase in energyprices is likely to reduce overall production lev-els, which may or may not result in a reductionin the WUR because the production of paper orpaperboard from recycled fibers may decline atthe same rate as total production.
Physical Vintage and Investment ModuleEstimation of capital turnover and investment
behavior highlights the following:
1. An increase in input prices, in particularenergy prices, reduces the rate of increasein expansion investment.
2. Capital depreciation, and thus replace-ment investment, is significantly influ-enced by the age of capital and energyprices. As energy prices increase, the de-preciation curve shifts, effectively reduc-ing depreciation rates for “young” capitalbut increasing the depreciation rates for“older” capital.
An increase in energy prices will reduce thescale of expansion investment and will increaseor decrease replacement investment, dependingon the structure of the capital stock. The price
202 Journal of Industrial Ecology
R E S E A R C H A N D A N A LYS I S
of other inputs scarcely has a significant im-pact. Given results from the production module,the investment that occurs as energy prices in-crease shifts toward processes that enable self-generation of energy, which both increases thetotal use of fibers (because chemical processinghas a lower yield) and potentially increases totalenergy intensity of the industry (e.g., if the shiftis from mechanical to chemical processing, ex-cluding thermal losses in the electric utilities sec-tor), but reduces the intensity of purchased fuels.Ceteris paribus, both expansion and replacementinvestment reduce energy intensity within a tech-nology as a result of higher energy efficiency ofnew capital that is added to the capital stock, butmay increase total energy intensity in the indus-try. Because expansion investment increases thesize of the productive capital stock, total energyand material use increases, but because replace-ment investment does not expand the size of thecapital stock and increases efficiency it reducestotal energy and material use.
Input Mix ModuleThe econometric estimation of input substi-
tution highlights the following:
1. As expected, the fractional share of paperproduced from kraft pulp has a statisticallysignificant impact on a change in the shareof self-generated energy, indicating that anincrease in the fractional share of kraftpulping, combined with an increase in en-ergy prices, facilitates a nonlinear shift toself-generated energy, effectively reducingthe share of purchased fuels at a diminish-ing rate.
2. The parameter estimates reveal that theprice of fiber and capital do not signifi-cantly impact fuel mix, but changes in ab-solute and relative fuel prices trigger suchchange.
3. Energy prices significantly influence thefiber mix, where an increase in energyprices slows down the expansion to in-creased waste paper use. Interestingly, nei-ther labor, capital, nor fiber price has a sig-nificant impact on changes in the WUR,but the enactment of region-specific waste-paper use policies does. Overall, an in-
crease in regional energy prices is seen toreduce WURs, stimulating an increase inthe share of virgin fibers and an increasein the share of self-generated energy. Thisseemingly counterintuitive result is mostlikely caused by the fact that firms that userecycled fibers as their main fiber sourcemust purchase most of their energy and arenot able to sell (on net) energy into thegrid. Thus, as energy prices increase, pro-cesses that use waste-fiber pulping and me-chanical pulping are harder hit than thosethat pulp virgin fibers using chemical pulp-ing. As a consequence, they are able tomeet most of their energy needs throughself-generation and may be able to feedsome energy into the grid. Even if waste-fiber pulping in total is less energy-intensivethan the chemical pulping of virgin fibers,it is more energy intensive when only pur-chased energy needs are accounted for.
SummaryIn summary, the price of energy plays a cen-
tral role in decision making in the pulp and paperindustry, revealing the impact of using energyprices as drivers for industrial change. In lightof the close relationship between decisions aboutoutput mix, energy, and fibers, it is difficult tomake changes with respect to one input withoutaffecting the use of others or the overall outputmix. An increase in energy prices is likely to havethe negative side-effects of reducing WURs andreducing the percentage share of recycled paperin total production, as realized by the parame-ter estimations described above, but have thepositive impact of increasing replacement ratesand stimulating a shift to increased energy self-generation. This will incrementally increase theaverage efficiency of purchased energy use butmay reduce the efficiency of total energy use. Dueto immense capital inertia, though, the systemwill respond only slowly to changes in inputprices.
Simulation Results
One of the expected benefits of this particu-lar modeling approach is to enable the analysis
Davidsdottir and Ruth, Regionalized Dynamic Model of the US Pulp and Paper Industry 203
R E S E A R C H A N D A N A LYS I S
of waste flows linked both to material and en-ergy use, here focusing on carbon emissions. Themodel is run from 2000 until the year 2020creating a base case, a high GSP (Gross StateProduct—which captures economic activity atthe U.S. state level) growth case (5% over basegrowth rate), and a low GSP growth case (5%under base growth rate), using exogenously fore-casted data on regional input prices (EIA variousyears, AF&PA various years) and regional in-come or GSP (BEA various years). The base caseresults indicate the following for energy and ma-terial use, energy and material intensity, carbonemissions, and carbon intensity:
1. Total energy intensity (or total carbon in-tensity) is declining in all regions, with theintensity of purchased fuels (or net carbonintensity) declining faster than the inten-sity of self-generated fuels due to the con-tinued shift toward self-generated energy.This implies reduced reliance on purchasedenergy at the national level.
2. Despite the decline in energy intensity, to-tal energy and material use and use of self-generated fuels and purchased fuels are allexpected to increase at national and re-gional levels if production levels continueto increase.
3. Output levels and output mix signifi-cantly influence total carbon emissions andcarbon intensity because of the interde-pendence between production of specificoutputs and their fuel and material require-ments.
4. Change in carbon intensity is much in-fluenced by embodied (70%) and disem-bodied technological change (30%), wherelearning by doing is seen as a statisticallysignificant driver of disembodied change.This indicates that in this particular in-dustrial system, investment (either replace-ment or expansion) in new capital is themain driver of technological change. Shiftsin process fuels, however, are seen to havea much smaller impact on carbon emis-sions/intensity when compared to the im-pact of technological change, as the shifttoward self-generation is nonlinear and itsrate diminishes over time.
Simulation results indicate substantial re-gional differences in regional paths of carbonemissions and carbon intensity. Different re-gional developments and character of output andinput mix, and thus WURs and the extensionpossibilities of self-generated energy, can mostlyexplain this difference. Other contributing fac-tors are regional differences in the rate of techno-logical change, which is mostly driven by differingregional growth rates in terms both of economicgrowth and of the growth of the pulp and paperindustry. A region whose industry has higher in-vestment rates will experience faster embodiedtechnological change, and thus exhibit a morerapid decline in carbon intensity, when comparedto a region that has a lower level of investment.In addition, a region that has lower productionrates experiences lower rates of learning-by-doingand thus has lower rates of disembodied change.
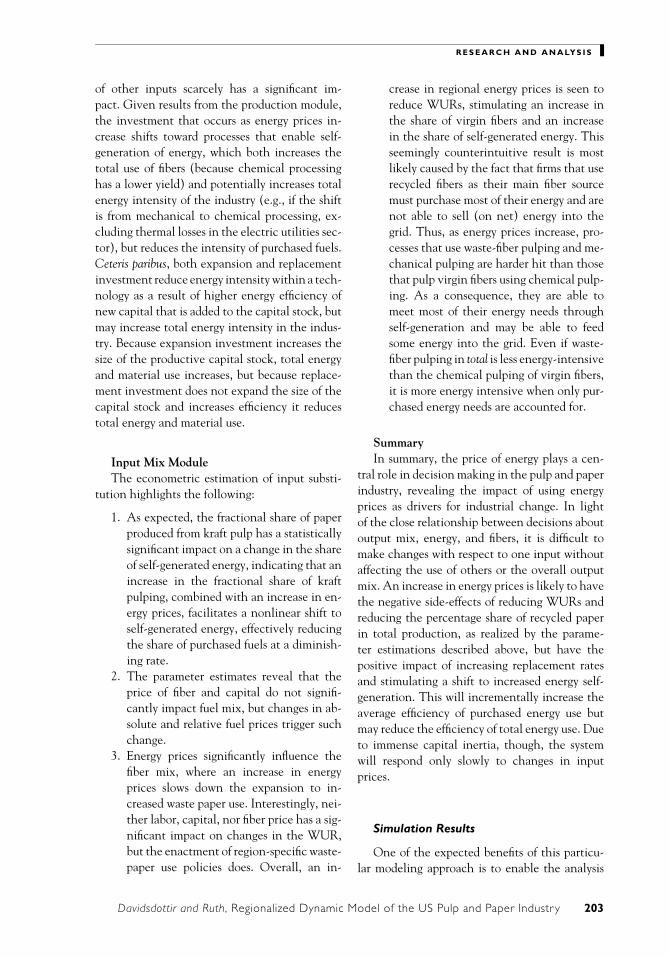
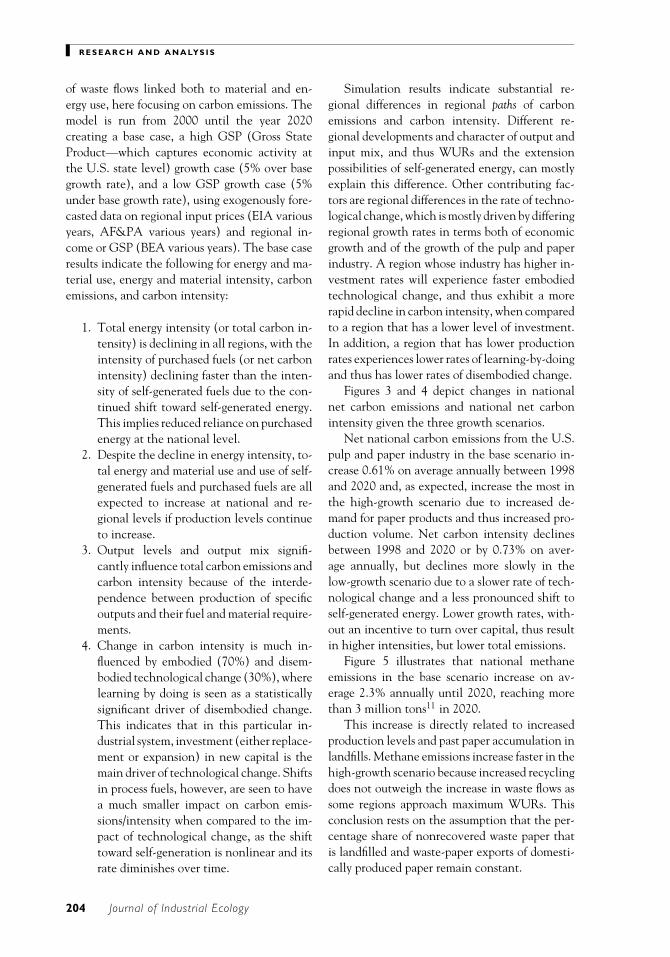
Figures 3 and 4 depict changes in nationalnet carbon emissions and national net carbonintensity given the three growth scenarios.
Net national carbon emissions from the U.S.pulp and paper industry in the base scenario in-crease 0.61% on average annually between 1998and 2020 and, as expected, increase the most inthe high-growth scenario due to increased de-mand for paper products and thus increased pro-duction volume. Net carbon intensity declinesbetween 1998 and 2020 or by 0.73% on aver-age annually, but declines more slowly in thelow-growth scenario due to a slower rate of tech-nological change and a less pronounced shift toself-generated energy. Lower growth rates, with-out an incentive to turn over capital, thus resultin higher intensities, but lower total emissions.
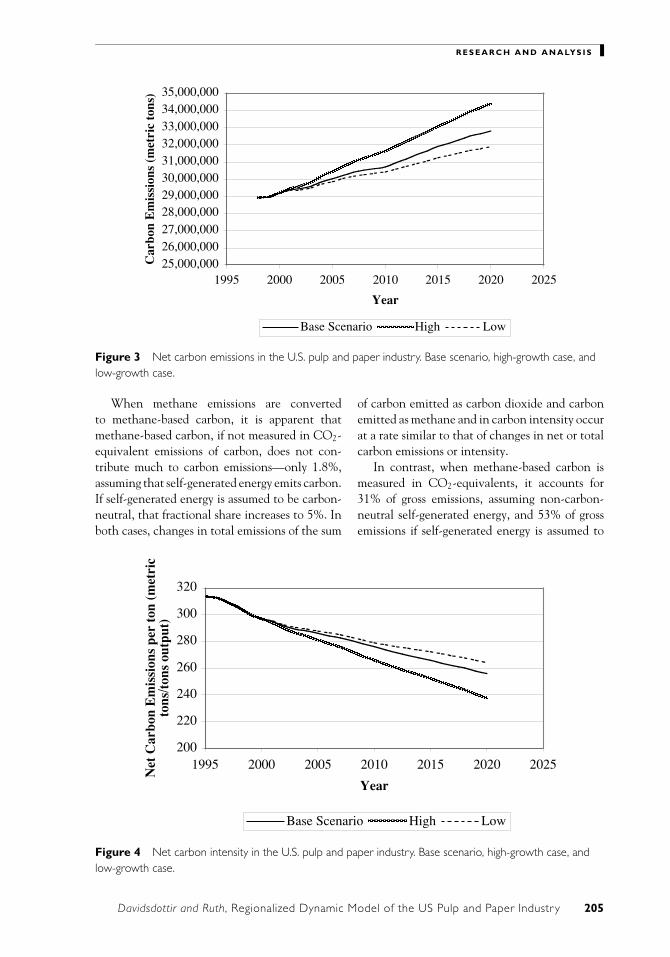
Figure 5 illustrates that national methaneemissions in the base scenario increase on av-erage 2.3% annually until 2020, reaching morethan 3 million tons11 in 2020.
This increase is directly related to increasedproduction levels and past paper accumulation inlandfills. Methane emissions increase faster in thehigh-growth scenario because increased recyclingdoes not outweigh the increase in waste flows assome regions approach maximum WURs. Thisconclusion rests on the assumption that the per-centage share of nonrecovered waste paper thatis landfilled and waste-paper exports of domesti-cally produced paper remain constant.
204 Journal of Industrial Ecology
R E S E A R C H A N D A N A LYS I S
25,000,00026,000,00027,000,00028,000,00029,000,00030,000,00031,000,00032,000,00033,000,00034,000,00035,000,000
1995 2000 2005 2010 2015 2020 2025
Year
Car
bon
Em
issi
ons
(met
ric
tons
)
Base Scenario High Low
Figure 3 Net carbon emissions in the U.S. pulp and paper industry. Base scenario, high-growth case, andlow-growth case.
When methane emissions are convertedto methane-based carbon, it is apparent thatmethane-based carbon, if not measured in CO2-equivalent emissions of carbon, does not con-tribute much to carbon emissions—only 1.8%,assuming that self-generated energy emits carbon.If self-generated energy is assumed to be carbon-neutral, that fractional share increases to 5%. Inboth cases, changes in total emissions of the sum
200
220
240
260
280
300
320
1995 2000 2005 2010 2015 2020 2025
Year
Net
Car
bon
Em
issi
ons
per
ton
(met
ric
tons
/ton
s ou
tput
)
Base Scenario High Low
Figure 4 Net carbon intensity in the U.S. pulp and paper industry. Base scenario, high-growth case, andlow-growth case.
of carbon emitted as carbon dioxide and carbonemitted as methane and in carbon intensity occurat a rate similar to that of changes in net or totalcarbon emissions or intensity.
In contrast, when methane-based carbon ismeasured in CO2-equivalents, it accounts for31% of gross emissions, assuming non-carbon-neutral self-generated energy, and 53% of grossemissions if self-generated energy is assumed to
Davidsdottir and Ruth, Regionalized Dynamic Model of the US Pulp and Paper Industry 205
R E S E A R C H A N D A N A LYS I S
1,500,000
2,000,000
2,500,000
3,000,000
3,500,000
4,000,000
1990 1995 2000 2005 2010 2015 2020 2025
Year
Met
hane
Em
issi
ons
(met
ric
tons
)
Base Scenario High Low
Figure 5 National methane emissions in the U.S. pulp and paper industry.
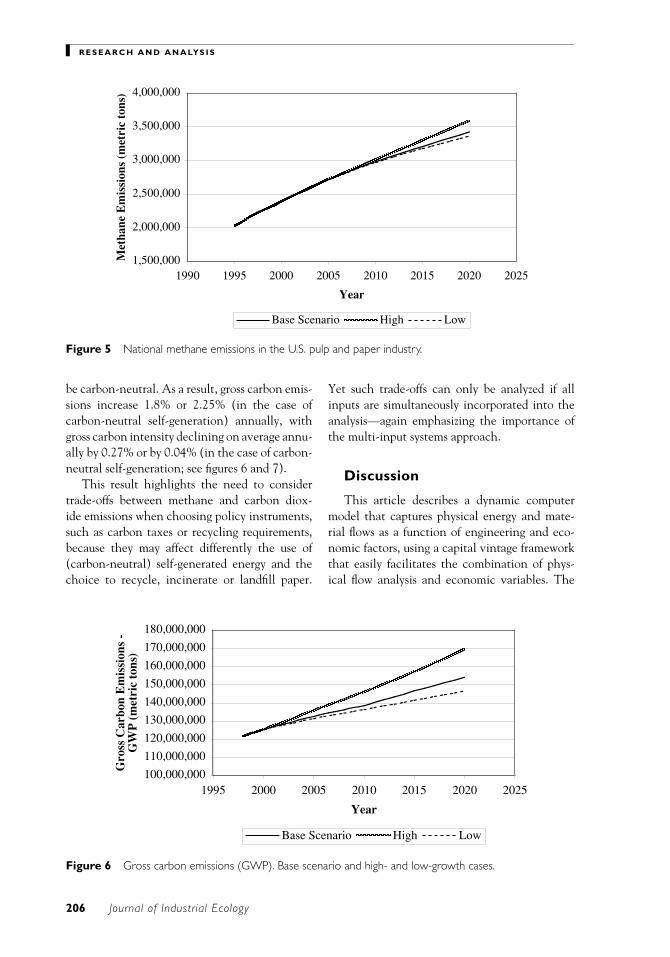
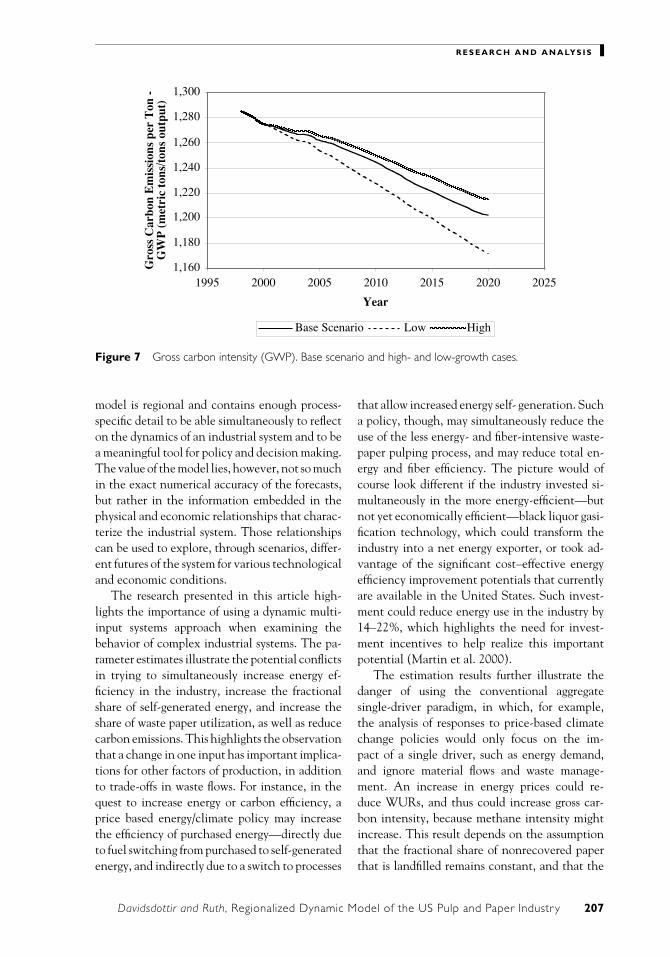
be carbon-neutral. As a result, gross carbon emis-sions increase 1.8% or 2.25% (in the case ofcarbon-neutral self-generation) annually, withgross carbon intensity declining on average annu-ally by 0.27% or by 0.04% (in the case of carbon-neutral self-generation; see figures 6 and 7).
This result highlights the need to considertrade-offs between methane and carbon diox-ide emissions when choosing policy instruments,such as carbon taxes or recycling requirements,because they may affect differently the use of(carbon-neutral) self-generated energy and thechoice to recycle, incinerate or landfill paper.
100,000,000
110,000,000
120,000,000
130,000,000
140,000,000
150,000,000
160,000,000
170,000,000
180,000,000
1995 2000 2005 2010 2015 2020 2025
Year
Gro
ss C
arbo
n E
mis
sion
s -
GW
P (
met
ric
tons
)
Base Scenario High Low
Figure 6 Gross carbon emissions (GWP). Base scenario and high- and low-growth cases.
Yet such trade-offs can only be analyzed if allinputs are simultaneously incorporated into theanalysis—again emphasizing the importance ofthe multi-input systems approach.
Discussion
This article describes a dynamic computermodel that captures physical energy and mate-rial flows as a function of engineering and eco-nomic factors, using a capital vintage frameworkthat easily facilitates the combination of phys-ical flow analysis and economic variables. The
206 Journal of Industrial Ecology
R E S E A R C H A N D A N A LYS I S
1,160
1,180
1,200
1,220
1,240
1,260
1,280
1,300
1995 2000 2005 2010 2015 2020 2025
Year
Gro
ss C
arbo
n E
mis
sion
s pe
r T
on -
G
WP
(m
etri
c to
ns/t
ons
outp
ut)
Base Scenario Low High
Figure 7 Gross carbon intensity (GWP). Base scenario and high- and low-growth cases.
model is regional and contains enough process-specific detail to be able simultaneously to reflecton the dynamics of an industrial system and to bea meaningful tool for policy and decision making.The value of the model lies, however, not so muchin the exact numerical accuracy of the forecasts,but rather in the information embedded in thephysical and economic relationships that charac-terize the industrial system. Those relationshipscan be used to explore, through scenarios, differ-ent futures of the system for various technologicaland economic conditions.
The research presented in this article high-lights the importance of using a dynamic multi-input systems approach when examining thebehavior of complex industrial systems. The pa-rameter estimates illustrate the potential conflictsin trying to simultaneously increase energy ef-ficiency in the industry, increase the fractionalshare of self-generated energy, and increase theshare of waste paper utilization, as well as reducecarbon emissions. This highlights the observationthat a change in one input has important implica-tions for other factors of production, in additionto trade-offs in waste flows. For instance, in thequest to increase energy or carbon efficiency, aprice based energy/climate policy may increasethe efficiency of purchased energy—directly dueto fuel switching from purchased to self-generatedenergy, and indirectly due to a switch to processes
that allow increased energy self- generation. Sucha policy, though, may simultaneously reduce theuse of the less energy- and fiber-intensive waste-paper pulping process, and may reduce total en-ergy and fiber efficiency. The picture would ofcourse look different if the industry invested si-multaneously in the more energy-efficient—butnot yet economically efficient—black liquor gasi-fication technology, which could transform theindustry into a net energy exporter, or took ad-vantage of the significant cost–effective energyefficiency improvement potentials that currentlyare available in the United States. Such invest-ment could reduce energy use in the industry by14–22%, which highlights the need for invest-ment incentives to help realize this importantpotential (Martin et al. 2000).
The estimation results further illustrate thedanger of using the conventional aggregatesingle-driver paradigm, in which, for example,the analysis of responses to price-based climatechange policies would only focus on the im-pact of a single driver, such as energy demand,and ignore material flows and waste manage-ment. An increase in energy prices could re-duce WURs, and thus could increase gross car-bon intensity, because methane intensity mightincrease. This result depends on the assumptionthat the fractional share of nonrecovered paperthat is landfilled remains constant, and that the
Davidsdottir and Ruth, Regionalized Dynamic Model of the US Pulp and Paper Industry 207
R E S E A R C H A N D A N A LYS I S
capture of methane gas from landfills does notincrease.
Parameter estimates also reveal that changesin output mix and demand are both importantdrivers of change in carbon intensity and car-bon emissions. The trends observed indicate thatpolicies that only focus on improving efficiency,and do not simultaneously incorporate the im-pact of output demand/mix, will prove inefficientin influencing the system. Such policies certainlywill be inefficient in reducing waste emissions, asincreases in production will outweigh changes inefficiency (Luukkanen 2003; Sundin et al. 2002).
Regardless of the region, resource endow-ments, or production structure, an increase inthe rate of capital turnover is the most importantfactor in permanently changing carbon emissionsprofiles in the pulp and paper industry (see sim-ilar conclusion in, e.g., Nystrom and Cornland2003). This is due to the long lifetime of capitalin the sector, low rates of capital turnover, andhigh capital intensity. The immense capital in-tensity and capital inertia ensure that the capitalstock will change slowly and thereby only gradu-ally improve energy, carbon, and fiber efficiency.In addition, the long lifetime of capital and pathdependency ensure that each managerial deci-sion will have a significant impact on the indus-try and the environment for decades to come.An increase in energy prices is not sufficient toovercome such capital vintage effects because thesystem adapts very slowly to change—but such anincrease will facilitate fuel switching and disem-bodied changes in efficiency.
Consequently, to enhance the long-term sus-tainability of this particular industrial system,policies need to provide investment incentivesto facilitate faster turnover of old capital, whichwould result in permanent changes in materialand energy flows. In addition, higher rates ofturnover imply higher levels of replacement in-vestment, which indicate acceleration of diffu-sion of more efficient capital and an accelerationof learning without increasing total emissions.Because, in the U.S. pulp and paper industry,investment in more energy-efficient equipmentusually is a side bonus to enhanced productioncapacity, policies should include investment in-centives for investing in more efficient capitaland thereby make such investment in itself fea-
sible in addition to preventing a reduction inWURs if a simultaneous goal is to secure the eco-nomic viability of recycling (Davidsdottir andRuth 2004). Such policies include investmenttax rebates, demonstration projects to reduce un-certainty, and incentive-driven voluntary sectoragreements (Worrell et al. 2001). Given contin-ued growth in the industry without incentivesto replace existing capital, technological changewill remain incremental and material and en-ergy use and carbon emissions from the pulp andpaper industry will continue to increase into theforeseeable future. But such policies are likely togo unnoticed if the modeling tools used for policyanalysis do not enable integrated analysis of inputand waste flows in addition to the capital struc-ture and investment behavior in industry. Here iswhere industrial ecology could be a driving forcebehind change, by combining economics and therich descriptions of energy and material flows ofmost industrial systems. This article describes onesuch attempt. We hope there will be more.
Acknowledgments
We thank Skip Laitner and four anonymousreviewers for their comments and guidance. Theusual disclaimers apply.
Notes
1. Technological change is defined here as a reduc-tion in the use of an input, holding other inputsand output constant. Structural change can ofcourse change input use, but at the same time willchange the output mix.
2. As pointed out by one of our reviewers, struc-tural change is sometimes conceptually inter-twined with technological change.
3. Hogged fuels consist of forest residues such aswoodchips (from forest products industries) thatare used to produce energy.
4. Please note that all variables are region-specific,but to maximize simplicity the regional affixes arein most cases not included. Also, each variableexists at time t (the current year of simulation),unless otherwise noted, and α’s are regression co-efficients. All other variables are explained in thetext.
5. Distance is measured in hundreds of miles.6. That is, the price of energy, labor, materials,
and capital. We assume constant returns to scale
208 Journal of Industrial Ecology
R E S E A R C H A N D A N A LYS I S
(shown in the production module) and competi-tive price formation in the industry, which allowsus to replace output price with input prices. Thus,expansion investment is linked to output price,albeit indirectly. The assumption of competitiveprice formation is supported by several empiricalstudies by others and us as well.
7. For more in-depth discussion, see the publicationby Davidsdottir (2002).
8. Methane generation does not begin until 2 yr afterlandfilling.
9. Values for landfill gas capture were set to zero inthis model because LFG capture seems to vary con-siderably and thus any value used in the modelpotentially could have had large errors associatedwith it. Thus we deemed it more transparent sim-ply to put this parameter to zero. Our results donot change significantly if we alter this assump-tion; there is only a uniform percentage decline ingross emissions. Furthermore, our conclusions donot change.
10. Input price elasticities describe the change in de-mand of one input as a result of a change in price.For example, an elasticity of −1 indicates that ifprice increases by 1%, demand will decline by 1%.
11. One (short) ton ≈ 0.907 megagrams (Mg, SI) ≈0.907 metric tons. All tons in this article, unlessotherwise noted, are short tons.
References
ACEEE (American Council for an Energy EfficientEconomy). 2003. Statement on energy informa-tion for the 21st Century. <http://www.aceee.org/energy/manifesto2.pdf>. Accessed April 2004.
AF&PA (American Forest and Paper Association).Various years. Statistics of paper paperboard andwoodpulp. Washington, DC: The American Forestand Paper Association.
Andrews, C. 2000. Building a micro foundation for in-dustrial ecology. Journal of Industrial Ecology 4(3):35–51.
Arthur, B., 1994. Increasing returns and path dependencein the economy. Ann Arbor, MI: The Universityof Michigan Press.
Augenstein, D. 1992. The greenhouse effect and USlandfill methane. Global Environmental Change2(4): 311–328.
Ayres, R. U. 1978. Application of physical princi-ples to economics. In Development of ecologicaleconomics, edited by R. Costanza et al., 1997.Cheltenham, UK: Edward Elgar.
Barlaz, M. A., D. M. Schaefer, and R. K. Ham.1989. Bacterial population development andchemical characteristics of refuse decompo-sition in a simulated sanitary landfill. Ap-plied and Environmental Microbiology 55(1): 55–65.
BEA (Bureau of Economic Analysis). Various years.Regional economic data. <http://www.bea.gov/bea/regional/data.htm>. Accessed January 2001.
Berndt, E., C. Kolstad, and J. L. Lee. 1993. Measur-ing energy efficiency and productivity impacts ofembodied technical change. Energy Journal 14(1):33–55.
Breusch, T. S. 1978. Testing for autocorrelation in dy-namic linear models. Australian Economic Papers17(31): 334–55.
Breusch, T. and A. Pagan. 1979. A simple test for het-eroscedasticity and random coefficient variation.Econometrica 47(5): 1287–1294.
Brunner, P. and H. Rechberger. 2003. Practical hand-book of material flow analysis. Boca Raton, FL:Lewis Publishers.
Coops, O., L. Luning, H. Oonk, and A. Weenk. 1995.Validation of landfill gas formation models. InProceedings of Sardinia 95, International LandfillSymposium. Cagliari, Italy: CISA, EnvironmentalSanitary Engineering Centre.
Cutherbertson, K., S. G. Hall, and M. P. Taylor.1992. Applied econometric techniques. New York:Harvester Wheatsheaf.
Davidsdottir, B. 2002. A vintage analysis of re-gional energy and fiber use, technology changeand greenhouse gas emissions. Ph.D. dissertation,Boston University.
Davidsdottir, B. 2003. Modeling industrial behav-ior and feedback between energy and materialflows and capital vintage: Implications for ma-terial, energy and climate change policy de-sign. In Proceedings of ACEEE Summer Study onEnergy Efficiency in Industry. Washington, DC:ACEEE.
Davidsdottir, B. 2004. Forest products and energy.In Encyclopedia of Energy, Volume 2, edited byC. Cleveland. Oxford, U.K.: Elsevier.
Davidsdottir, B. and M. Ruth. 2004. Capital vintageand climate change policies: The case of US pulpand paper. Environmental Science and Policy 7(3):221–233.
Dickey, D. and W. Fuller. 1979. Distribution of the es-timators for autoregressive time series with a unitroot. Journal of the American Statistical Association74(366): 427–431.
Doorn, M. and M. A. Barlaz. 1995. Estimate of globalmethane emissions from landfills and open dumps.
Davidsdottir and Ruth, Regionalized Dynamic Model of the US Pulp and Paper Industry 209
R E S E A R C H A N D A N A LYS I S
EPA-600/R-95-019. Prepared for US EPA Officeof Research and Development.
Dowd, J. and J. Newman. 1999. Challenges and oppor-tunities for advancing engineering-economic policyanalysis. Washington, DC: IEA InternationalWorkshop.
EIA (Energy Information Administration). Variousyears. State energy price and expenditure report.Washington, DC: Department of Energy/EIA.
EIA. 2002. Industrial sector demand module of the na-tional modeling system. Washington, DC: Office ofIntegrated Analysis and Forecasting, US-DOE.
EMCON Associates. 1982. Methane generation and re-covery from landfills. Ann Arbor, MI: Ann ArborScience Publishers Inc.
Energetics. 1990. Industrial technologies: Industry profiles.Columbia, MD: Energetics Inc.
Farla, J., K. Blok, and L. Schipper. 1997. Energy effi-ciency developments in the pulp and paper indus-try. Energy Policy 25(7–9): 745–758.
Fisher, J. C., and R. Pry. 1971. A simple substitu-tion model of technological change. TechnologicalForecasting and Social Change 3(1): 75–88.
Godfrey, L. G. 1978. Testing against general auto re-gressive and moving average error models whenthe regressors include lagged dependent variables.Econometrica 46(6): 1293–1302.
Graedel, T. E. and B. R. Allenby. 1995. Industrial ecol-ogy. Englewood Cliffs, NJ: Prentice Hall.
Hannon, B. and M. Ruth. 2001. Dynamic modeling. NewYork: Springer-Verlag.
Haynes, K. E. and A. S. Fotheringham. 1983. Grav-ity and spatial interaction models. London: SAGEPublications.
Herzog, H. and J. W. Tester. 1991. Energy managementand conservation in the pulp and paper industry.In Energy and the environment in the 21st century,edited by J. Tester, D. O. Wood, and N. Ferrari.Cambridge, MA: MIT Press.
Johansen, L. 1959. Substitution versus fixed productioncoefficients in the theory of economic growth: Asynthesis. Econometrica 27(2): 157–176.
Jorgenson, D. W. 1997. Investment. Cambridge, MA:MIT Press.
Kaldor, N. and J. A. Mirrlees. 1962. A new modelof economic growth. Review of Economic Studies29(3): 174–192.
Kaltenberg, M. C. and J. Buongiorno. 1986. Growthand decline of the paper industry: An econometricanalysis of US regions. Applied Economics 18(4):379–397.
Kleijn, R. 1999. In=out. The trivial central paradigmof MFA. Journal of Industrial Ecology 3(2–3):8–10.
Kuper, G. H. and D. P. Soest. 2003. Path dependencyand input substitution: Implications for energypolicy modeling. Energy Economics 25(4): 397–407.
Levine, S. H. 2003. Comparing products and produc-tion in ecological and industrial systems. Journalof Industrial Ecology 7(2): 33–42.
Luukkanen, J. 2003. Green paper with green elec-tricity? Greening strategies of Nordic pulpand paper industry. Energy Policy 31(7): 641–655.
Martin, N., N. Angliani, D. Einstein, M. Khrushch,E. Worrell, and L. K. Price. 2000. Opportunitiesto improve energy efficiency and reduce green-house gas emissions in the U.S. pulp and paperindustry. Report Number LBNL-46141. Berkeley,CA: Lawrence Berkeley National Laboratory. En-vironmental Energy Technology Division.
Meijer, H. 1994. On the diffusion of technologies in a vin-tage framework. Unpublished Ph.D. dissertation,University of Maastricht.
Michales, A. J. and K. E. Skog. 1997. The decompo-sition of forest products in landfills. InternationalBiodeterioration and Biodegradation 39(2–3): 145–158.
Miller Freeman. 2000. The North American pulp and pa-per factbook. San Francisco, CA: Miller Freeman.
Moody’s Investor Services. Various years.<http://www.moodys.com>. Accessed January2001.
Norberg-Bohm, V. and M. Rossi. 1998. The powerof incrementalism: Environmental regulation andtechnological change. Technology Analysis andStrategic Management 10(2): 225–245.
NCASI (National Council for Air and Stream Im-provement). 1999. Estimated costs for the US forestproducts industry to meet the greenhouse gas reduc-tion target in the Kyoto Protocol. Special Report99-02. Research Triangle Park, NC: NCASI Pub-lications.
Nystrom, I. 2001. Exploring treatment of energy demandin energy systems engineering models. Chalmers,Sweden: Department of Energy Conversion,Chalmers University.
Nystrom, I. and D. Cornland. 2003. Strategic choices:Swedish climate intervention policies and the for-est industry’s role in reducing CO2 emissions. En-ergy Policy 31(10): 937–950.
Peer, R. L., S. L. Thorneloe, and D. L. Epperson. 1993.A comparison of methods for estimating globalmethane emissions from landfills. Chemosphere26(1–4): 387–400.
Pindyck, R. and D. L. Rubinfeld. 1991. Economic modelsand forecasts. New York: McGraw Hill.
210 Journal of Industrial Ecology
R E S E A R C H A N D A N A LYS I S
Ross, M. 1991. Efficient energy use in manufactur-ing. Proceedings of the National Academy of Science89(3): 827–831.
Ruth, M. and A. Amato. 2002. Vintage structure dy-namics and climate change policies: The caseof US iron and steel. Energy Policy 30(7): 541–552.
Ruth, M., B. Davidsdottir, and A. Amato. 2004. Cli-mate change policies and capital vintage effects:The cases of US pulp and paper, iron and steeland ethylene. Journal of Environmental Manage-ment 70: 235–252.
Ruth, M. and T. Harrington. 1998. Dynamics of mate-rial and energy use in US pulp and paper manufac-turing. Journal of Industrial Ecology 1(3): 147–168.
Scherer, F. M. 1982. Inter-industry technology flows inthe United States. Research Policy 11(4): 227–245.
Schumpeter, J. A. 1939. Business cycles. A theoreticalhistorical and statistical analysis of the capitalist pro-cess. New York: McGraw-Hill.
Skog, K. E., P. Ince, and W. R. Haynes. 1998. Woodfiber supply and demand in the United States.In Proceedings of the Forest Products Study GroupWorkshop of the North American Forestry Commis-sion. Madison, WI: Forest Products Society.
Smith, M. 1996. The US paper industry and sustainableproduction: An argument for restructuring. Cam-bridge, MA: MIT Press.
Solow, R. W. 1957. Technical change and the aggre-gate production function. Review of Economics andStatistics 39(3): 312–320.
Sundin, E., N. Svensson, J. McLaren, and J. Jackson.2002. Materials and energy flow analysis of paperconsumption in the United Kingdom 1987–2010.Journal of Industrial Ecology 5(3): 89–102.
Unruh, G. C. 2000. Understanding carbon lock-in.Energy Policy 28(12): 817–830.
Van Beukering, P. J. H. and M. A. Janssen. 2000. Adynamic integrated analysis of truck tires in West-ern Europe. Journal of Industrial Ecology 4(2): 93–115.
Woerlen, C. 2003. Experience curves for energy tech-nologies. In Encyclopedia of Energy, Volume 2,edited by C. Cleveland. Oxford, U.K.: Elsevier.
Worrell, E., L. Price, and M. Ruth. 2001. Policy mod-eling for energy efficiency improvements in USindustry. Annual Review of Energy and Environ-ment 26: 117–143.
Zellner, A. 1962. An efficient method of estimatingseemingly unrelated regressions and tests for ag-gregation bias. Journal of the American StatisticalAssociation 57(298): 348–368.
About the Authors
Brynhildur Davidsdottir is an associate at AbtAssociates Inc. in Cambridge, Massachusetts, and anadjunct professor at the Center for Energy and En-vironmental Studies, Boston University. Her researchinterests include ecological economics and industrialecology, environmental policy analysis, and resourcemanagement. Matthias Ruth is Roy F. Weston Chairin Natural Economics and Director of the Environmen-tal Policy Program at the School of Public Policy, aswell as Co-Director of the Engineering and Public Pol-icy Program, University of Maryland, College Park. Hisareas of expertise include industrial ecology, dynamicmodeling, and the environment and economics.
Davidsdottir and Ruth, Regionalized Dynamic Model of the US Pulp and Paper Industry 211
Related Documents