Vol. 59: 119-131, 1990 l MARINE ECOLOGY PROGRESS SERIES Mar. Ecol. Prog. Ser. Published January 11 Effects of filter-feeding by the ribbed mussel Geukensia demissa on the water-column microbiota of a Spartina alterniflora saltmarsh Oceanographic Sciences Division. Brookhaven National Laboratory, Upton. New York 11973. USA University of Georgia Marine Institute Sapelo Island, Georgia 31327, USA Max Planck Institute for Limnology. D-2320 P16n. Federal Republic of Germany ABSTRACT: We measured the effects of filtration by the Atlantic ribbed mussel Geukensia demissa (Dillwyn, 1817) on microbial abundance in water exposed to the salt-marsh surface. Various groups of living and non-living particles (large and small autotrophs, large and small heterotrophs, cyanobacteria, bacteria, non-living clay-organic floc) were removed with greatly differing effectiveness, ranging from 25 to 95 O/o of initial abundance per hour Phytoplankton would contribute an estimated 72 "10 of livlng microbial carbon removed by field populations of mussels (47 O/O of living microbial carbon contnbuted by small autotrophs). Although an equal biomass of sn~all mussels was more effective at removing particles than large mussels, medium to large mussels would account for over 90 % of mussel grazing in the field because of their greater abundance. Particle removal was not solely dependent on particle size, as large heterotrophs and bacteria were removed with low (25 to 56% h-') efficiency, whereas ~ntermediate-sized living particles and non-living clay-organic particles (ranging widely in size) were removed with high efficiency (up to 9S0/0 h-'). D~fferential removal of small heterotrophs (high efficiency) versus bacteria (low efficiency) may perturb the balance between bacterial production and microbial bacterivory in salt-marsh systems. The presence of G. den~issa enhanced bacterial production rates slightly; this could not be solely attributed to nitrogen excretion by the mussels. Mussel filtration was sufficient to balance bacterial production during high tide excursions of water onto the marsh, and may account for the net importation of bacteria from tidal creeks to the intertidal marsh reported in other studies. Present data indicate that ingestion of microbial carbon is not sufficient to meet the carbon requirements of G. demissa on an annual basis. INTRODUCTION The feeding activity of suspension-feeding bivalve molluscs can have a profound influence on the abun- dance of water-colun~n microbiota in shallow water (Wright et al. 1982), and may be an important mechanism for coupling pelagic and benthic processes (Dame et al. 1980). Cloern (1982) suggested that the abundance of phytoplankton within the southern por- tion of San Francisco Bay is controlled by the effects of grazing by benthic bivalves, which could filter a water volume equivalent to the entire water column each day. Officer et al. (1982) considered the criteria which could lead to such control in south San Francisco Bay (shallow water, limited hydrodynamic exchange, dense benthic filter-feeding community) and iden- tified 2 other estuarine systems which were also likely to exhibit benthic control of water-column microbial abundance. Peterson & Black (1987) concluded that benthic bivalves could potentially filter a large fraction of incoming tidal volume on sandflats of a subtropical embayment (Shark Bay, Australia). Sherr et al. (1986) found that in the Duplin hver estuary (Sapelo Island, Georgia, USA) much of bacterioplankton production was not grazed within the water column, and sug- gested that benthic filter-feeders may account for the removal of a substantial portion of the remaining bac- terial production. The bivalve Geukensia demissa is abundant in Spartina alterniflora Loisel. (smooth cordgrass) salt marshes such as those adjacent to the Duplin River, and has been shown to influence nitrogen flux (Jordan & Valiela 1982), S. alterniflora production (Bertness 1984), and sedimentation (Smith & Hopkinson 1983). Jordan & Valiela (1982) estimated that G. demissa populations in a New England S. alterniflora salt ,'Q Inter-Research/Pnnted in F. R. Germany 0171-8630/90/0059/0119/$ 03.00

Welcome message from author
This document is posted to help you gain knowledge. Please leave a comment to let me know what you think about it! Share it to your friends and learn new things together.
Transcript
Vol. 59: 119-131, 1990 l
MARINE ECOLOGY PROGRESS SERIES Mar. Ecol. Prog. Ser.
Published January 11
Effects of filter-feeding by the ribbed mussel Geukensia demissa on the water-column
microbiota of a Spartina alterniflora saltmarsh
Oceanographic Sciences Division. Brookhaven National Laboratory, Upton. New York 11973. USA University of Georgia Marine Institute Sapelo Island, Georgia 31327, USA
Max Planck Institute fo r Limnology. D-2320 P16n. Federal Republic of Germany
ABSTRACT: We measured the effects of filtration by the Atlantic ribbed mussel Geukensia demissa (Dillwyn, 1817) on microbial abundance in water exposed to the salt-marsh surface. Various groups of living and non-living particles (large and small autotrophs, large and small heterotrophs, cyanobacteria, bacteria, non-living clay-organic floc) were removed with greatly differing effectiveness, ranging from 25 to 95 O/o of initial abundance per hour Phytoplankton would contribute an estimated 72 "10 of livlng microbial carbon removed by field populations of mussels (47 O/O of living microbial carbon contnbuted by small autotrophs). Although an equal biomass of sn~al l mussels was more effective at removing particles than large mussels, medium to large mussels would account for over 90 % of mussel grazing in the field because of their greater abundance. Particle removal was not solely dependent on particle size, as large heterotrophs and bacteria were removed with low (25 to 56% h- ' ) efficiency, whereas ~ntermediate-sized living particles and non-living clay-organic particles (ranging widely in size) were removed with high efficiency (up to 9S0/0 h-'). D~fferential removal of small heterotrophs (high efficiency) versus bacteria (low efficiency) may perturb the balance between bacterial production and microbial bacterivory in salt-marsh systems. The presence of G. den~issa enhanced bacterial production rates slightly; this could not be solely attributed to nitrogen excretion by the mussels. Mussel filtration was sufficient to balance bacterial production during high tide excursions of water onto the marsh, and may account for the net importation of bacteria from tidal creeks to the intertidal marsh reported in other studies. Present data indicate that ingestion of microbial carbon is not sufficient to meet the carbon requirements of G. demissa on an annual basis.
INTRODUCTION
The feeding activity of suspension-feeding bivalve molluscs can have a profound influence on the abun- dance of water-colun~n microbiota in shallow water (Wright et al. 1982), and may be an important mechanism for coupling pelagic and benthic processes (Dame et al. 1980). Cloern (1982) suggested that the abundance of phytoplankton within the southern por- tion of San Francisco Bay is controlled by the effects of grazing by benthic bivalves, which could filter a water volume equivalent to the entire water column each day. Officer et al. (1982) considered the criteria which could lead to such control in south San Francisco Bay (shallow water, limited hydrodynamic exchange, dense benthic filter-feeding community) and iden- tified 2 other estuarine systems which were also likely to exhibit benthic control of water-column microbial
abundance. Peterson & Black (1987) concluded that benthic bivalves could potentially filter a large fraction of incoming tidal volume on sandflats of a subtropical embayment (Shark Bay, Australia). Sherr et al. (1986) found that in the Duplin h v e r estuary (Sapelo Island, Georgia, USA) much of bacterioplankton production was not grazed within the water column, and sug- gested that benthic filter-feeders may account for the removal of a substantial portion of the remaining bac- terial production.
The bivalve Geukensia demissa is abundant in Spartina alterniflora Loisel. (smooth cordgrass) salt marshes such as those adjacent to the Duplin River, and has been shown to influence nitrogen flux (Jordan & Valiela 1982), S. alterniflora production (Bertness 1984), and sedimentation (Smith & Hopkinson 1983). Jordan & Valiela (1982) estimated that G. demissa populations in a New England S. alterniflora salt
,'Q Inter-Research/Pnnted in F. R. Germany 0171-8630/90/0059/0119/$ 03.00
Mar. Ecol. Prog. Ser. 59: 119-131, 1990
marsh could potentially filter all or nearly all of the water in the marsh in every tidal cycle. G, demissa filtration therefore may control the abundance and composition of living and non-living particles in the water column, and profoundly influence pathways of energy and organic matter utilization in this highly productive system.
The evldent importance of bivalves in nutrient and energy flux has led to numerous studies of both their food resources and of the potential effects of filtration by field populations; however, the actual rather than potential impact of bivalve grazing is still not well understood in most environments. Studies have fre- quently emphasized the use of laboratory cultures of potential food items, and subsequent extrapolation to field situations (e.g. Birbeck & McHenery 1982, Stuart et al. 1982, Seiderer et al. 1984, McHenery & Birbeck 1985, Shumway et al. 1985, Amouroux 1986a. b, Muir et al. 1986, Newel1 & Langdon 1986, Rlisg5rd 1988). However, the use of monospecific cultures rather than natural assemblages may substantially bias estimates of the effects of filtration in the field (Doering & Oviatt 1986). The use of flumes and other enclosures, or other means of repeatedly sampling specific water parcels containing natural particles (e.g. Jordan & Valiela 1982, Wright et al. 1982, Dame et al. 1985, Chrzanow- ski et al. 1986, Lucas et al. 1987, Peterson & Black 1987, Frechette et al. 1989) may be more appropriate when the goal is to evaluate the impact of filtration by field populations.
We have conducted a series of flume and enclosure experiments to examine the effect on bacterioplankton and other microbiota of tidal excursions onto a Spartina alterniflora salt marsh. The present report considers the influence of filtration by Genkensia demissa of varying size on abundances of suspended microbes (bacteria, cyanobacteria, other large and small autotrophs, other large and small heterotrophs), and on the relative abundance of clay-organic floc particles. Our experi- mental design was to enclose the water column above equal-biomass groups of mussels of 3 size categories, and, following enclosure, to monitor changes in bac- terial production and abundance, changes in the abundance and size spectra of other microbes, and changes in the abundance of non-living clay-organic particles. Specific questions to be addressed were: (1) Is filtration by field populations of G. demissa selective for different water-column microbiota? (2) Is G. demissa filtration sufficient to account for the removal of a substantial fraction of bacterloplankton produc- tion? (3) Does G. demissa filtration alter bacterial pro- ductivity either directly (e.g. nutrient release) or indi- rectly (e.g, removal of bacterivores)? (4) Can one pre- dict from these data the relative importance of filtration by various size classes of mussels in the field?
METHODS
Mussels Geukensia demissa were collected in August 1986 from a Spartina alterniflora salt marsh (short plant height) adjacent to Sapelo Island, Georgia, USA. One group each of 1 large (shell height = 40 mm), 3 medium (26 mm) or 10 small mussels (16mm) were re-embedded in field-collected sediment in 10 cm diameter fired-clay flotverpots, with approximately one-third of the shell length protruding. Numbers per group were selected to result in approximately equal total biomass (ca 0.8 to 1.0g shell-free dry weight) of each group, based on a weight-height regression for Sapelo Island populations (Kuenzler 1961). Mussels were allowed to re-attach by bpssal threads to the flowerpot walls for 2wk in a running seawater aquarium, then placed in the field. The pots were embedded in the salt-marsh sediment near a creek bank (South End Creek, 1 km from Doboy Sound) in an area with plants of intermediate height, wlth the pot rims and interior sediment surface level with the marsh surface. Mussels were allowed to acclimate for 7 d in the field before the experiment. In addition to pots containing large, medium and small mussels, 3 pots with sediment but without mussels were prepared in an otherwise identical manner and were embedded in the marsh to serve as controls, as described below.
The experiment was initiated in daylight near slack high water (ca l h after immersion of the mussels) by enclosing each pot within a 20 cm diameter PVC cylin- der which was pressed into a pre-cut channel in the sediment surface, and which projected 5 cm above the water surface at peak high tide. Cordgrass shoots within 10 cm of the pots had been removed to facilitate placement of the PVC cylinders. Salinity was 32 %O and water temperature was 28°C at the site. Samples of water within the cylinders (30 ml) were removed at ca 15min intervals from a depth of lOcm (total water depth was 25 to 30 cm) for direct counts and size meas- urements of microbiota. Separate water samples were collected at 15 min intervals for bacterial production measurements. Sampling was terminated after l h. During the course of the experiment, a brief but vigor- ous (ca l cm total precipitation) rain shower occurred between 10 and 30min after initiation.
The experimental, conditions were designed to simu- late filtration of water by field populations of Geuken- sia demissa in Sapelo Island marshes at high tide. The tidal eleva.tion at the experimental site resulted in a mean water depth of 28 cm during the experiment, near to the mean high-tide water depths at the center of abundance of G. demissa populations (20 cm; Kuenz- ler 1961). Biomass densities of mussels within the cylin- der enclosures, which were effectively mandated by the biomass of a single large mussel, were higher than
Kemp et al.. Effect of mussel feeding on saltmarsh microbiota 121
average densities in Sapelo Island marshes. Kuenzler (1961) reported that the mean biomass of G. demissa in marshes near Sapelo Island was 4.1 g shell-free dry wt m-2, compared to the experimental density of 0.8 to 1.0 g shell-free dry wt per cylinder or ca 30 g shell-free dry wt m-'. The intensity of grazing within the cylin- ders therefore probably exceeds typical grazing inten- sity of average field populations during a l h slack tide. However, filtration also occurs but was not measured during rising and falling tides (ca 3 h total duration of immersion), when it was not possible to completely isolate the water within the cylinders from surrounding water (water height differentials of more than ca 5cm resulted in leakage). This both increases the duration of exposure of water to filtering mussels and potentially increases the intensity of filtration, since a shallower water column implies more rapid depletion of sus- pended particles at a given filtration rate. As a caveat, the enclosures reduced any potential hydrodynamic effects of wind and water motion which could influence (e.g. via particle resuspension) particle concentration, and consequently filtration rates.
Two of the 3 cylinders without mussels were used to control for the potential effects of amn~onium-nitrogen excretion by mussels on bacterial production. Amnlonium chloride was added to one cylinder at a rate designed to simulate the excretion of ammonium- N by one large mussel (31 pg N h-'), based on a regression of ammonia excretion on body weight for a New England Geukensia demissa population (Jordan & Valiela 1982). The second cylinder received ammonium chloride to simulate excretion by 10 small mussels (106 pg N h-'). Ammonium was added as 5ml of stock solution every 10 min beginning at 2 min after enclosure; to facilitate mixing, each cylinder was stirred gently with a glass pipette for 10s after the addition, taking care not to visibly resuspend sediment. The final control cylinder (no mussels, no additions) and each of the mussel cylinders were also stirred every 10 min. However, the vigorous pumping action of mussels visibly disturbed the water surface within mussel cylinders and, w e believe, considerably exceeded the intensity of mixing by pipette.
Water samples of lOml were stained with diamidinophenylindole (DAPI) and filtered onto 0.2 pm black Nuclepore filters. Filters were examined with a Zeiss epifluorescence microscope at 200X for large auto- and heterotrophic cells and at 1250X for small cells. All cells were measured at 1250x using a cali- brated ocular micrometer. Autotrophic cells were iden- tified by red autofluorescence under blue excitation light. Heterotrophic protozoa lacked chlorophyll auto- fluorescence but were located by the blue fluorescence of DAPI-stained DNA under ultraviolet excitation. Cyanobacteria were identified by red-orange auto-
fluorescence under green excitation. Samples for bac- terial abundance measurements were stained with acridine orange and examined under blue excitation at 2 0 0 0 ~ . Bacterial sizes were measured for 50 cells per treatment by photographing fields (Kodak Ekta- chrome) and measuring well-focused cells in projec- tions of slides at 10 000x, calibrating with a photograph of a stage micrometer (see Lee & Fuhrman 1987). Abundances are the means of 10 field counts for cyanobacteria and bacteria (in each of 3 replicate sub- samples), 25 fields for small and large autotrophs, and 50 fields for small and large heterotrophic protozoa. The relative abundance of non-living organic particles, which fluoresced red when stained with acridine orange (i.e. clay-organic floc: Newel1 et al. 1988) was expressed as a 'floc index'. The original abundance, dimensions and organic mass of floc in the water col- umn is unknown and the floc index is presented solely as a relative measure of abundance, defined as the number of grid squares in a 6 X 6 grid reticle at 2 0 0 0 ~ which contained floc particles > 5 pm in one dimension.
Biovolumes of all microbiota except heterotrophic bacteria were estimated from cell dimens~ons using a computer digitizing program which calculates volumes using formulae for up to 21 comparable geometric solid shapes (program MICROBIO, developed for P.F.K. by R. Hopcroft, Univ. Guelph, Ontario, Canada). The total carbon cleared froin the water column was estimated for each mussel group and living particle type assum- ing that bacteria contain 220fg C (Bratbak & Dundas 1984), cyanobacteria contain 294fg C cell-' (Cuhel & Waterbury 1984), heterotrophic cells contain 80fg C (Sherr & Sherr 1984), and using Strath- mann's (1967) regression equations for the carbon con- tents of diatoms and other autotrophic cells.
The incorporation of tritiated thymidine into DNA was measured to evaluate bacterial reproductive activ- ity, using a combination of the methods of Riemann (1984) and Moriarty & Pollard (1981). At each sampling time, 4 replicate lOml water samples per treatment were added to scintillation vials containing tritiated thymidine (20 Ci mmole-l; final concentration 20nM thymidine; New England Nuclear, NEN). One vial also contained formaldehyde (final concentration 2 %) to serve a s a time-zero killed control. Incubations were for l5min in sealed vials while vials were suspended under water a t the study site, and were terminated by the addition of formalin and placement on ice. Killed samples were filtered onto 0.45 pm Gelman GN6 mem- brane filters and washed on the filter column 5x with 3 m1 ice-cold 5 O/O trichloroacetic acid (TCA) to remove small acid-soluble molecules. Filters were then placed in centrifuge tubes, heated to 100°C for 30 min in 4 m1 of 5 Ol0 TCA to hydrolyze DNA, cooled, and centrifuged at 5000 X g to precipitate protein. Samples of the super-

122 Mar Ecol. Prog. Ser.
natant containing hydrolyzed labeled DNA were counted in Aquasol-2 (NEN) scintillation fluid. Activity was expressed as femtomoles (10-l5 moles) of thy- midine incorporated per 10' cells.
Least-squares linear regressions of abundance on time were compared for each particle type among the 6 treatments by analysis of variance (ANOVA), using the T' method and Gabriel's (1978) approximate compan- son intervals for multiple unplanned comparisons (Sokal & Rohlf 1981). If regression slopes were not significantly different among treatments, analysis of covariance (ANCOVA) was used to compare the Y- intercepts, again by the use of Gabriel's approximate comparison intervals. Although an exponential decrease in abundance through time might be more realistic given complete mixing of water within the cylinders (thorough mixing was likely in the mussel cylinders, but possibly not in control cylinders mixed
only by gentle stirring) and a constant filtration rate (Coughlan 1969), the temporal resolution of our data does not warrant using other than a simple linear relationship.
Statistical analysis of thymidine incorporation data (fmole thymidine per 106 cells per min) consisted of a 2- way Model I analysis of variance for treatment effects and for time (both fixed effects). Since treatments were not replicated, interactions cannot be tested and must be assumed negligible; we have in any case no a priori basis for expecting significant interaction.
RESULTS
The dominant taxa within each of the operationally- defined particle types were as follows: large auto- trophic cells were primarily diatoms; large hetero-
LARGE MUSSELS
W MEDIUM MUSSELS
A SMALL M U S S E L S
0 CONTROL. NH: per LG MUSSELS
A CONTROL. NH; per SM MUSSELS
0 CONTROL. NO ADDED Y P ~ +
- F
1 20m p. 7
J l -. SU HETEROTROPHS 1 I 8" ' 6 1 t
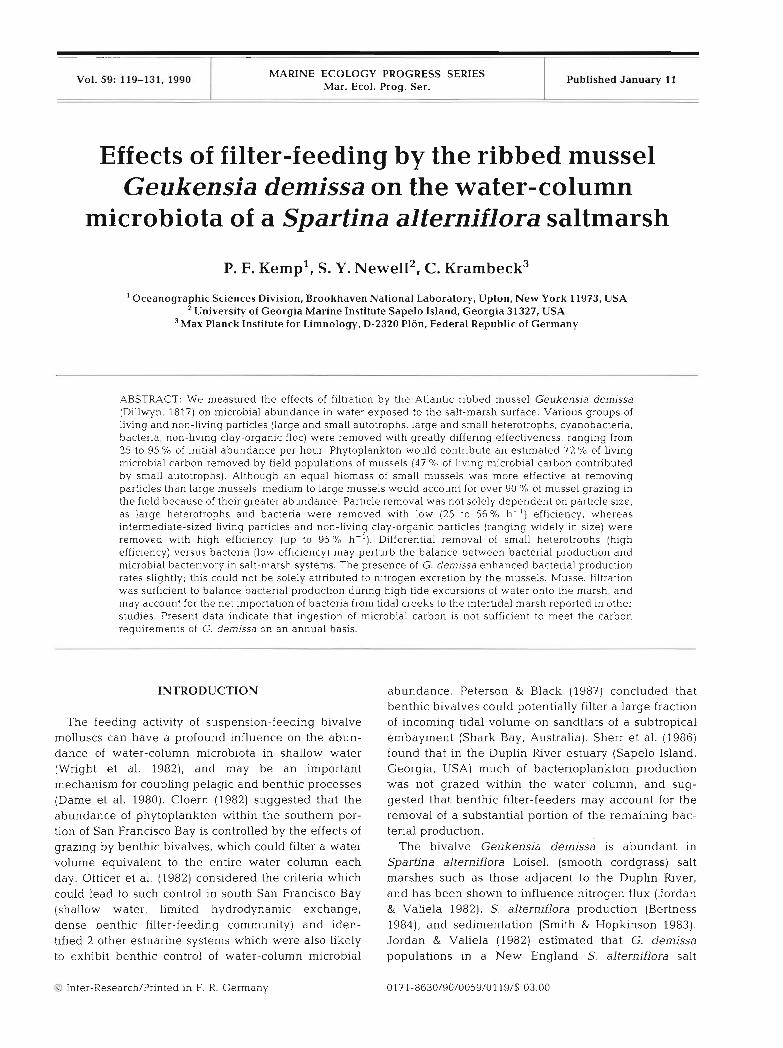
Fig. 1 Abundances of (A) non-living clay-organic floc, (B) large autotrophs, (C) large heterotrophs, (D] small auto- trophs, (E) small heterotrophs, (F) cy- anobacteria and (G) bacteria through time in control cvlinders (controls with ammonium added to correspond with ex- cretion by large mussels, by small mus- sels, or with no ammonium added), and in cyl~nders containing 1 large, 3 m e d ~ u m or 10 small mussels. Mussel biomass was approximately equal In each cyl~nder FIoc index is a reldtive measure of abundance. Each abundance value rep- resents the mean of 10, 25 or 50 micro- scope fields (sec text) converted to equi- valent abundance ptr water volume (ex- cept floc index, unconlrertcd data shown)

Kemp et al.: Effect of mussel fcedlng on saltmarsh microbiota 123
trophic cells were primarily ciliates, but included some dinoflagellates; small autotrophic cells included some diatoms but were primarily chlorophyll-containing microflagellates; and small heterotrophs were primar- ily microflagellates lacking chlorophyll autofluores- cence. Cyanobacteria were almost exclusively coccoi- dal in form.
Changes in the abundance of particles through time for each treatment are shown in Fig. 1A to G. Although the lack of replication precludes a rigorous statistical comparison of initial abundances between treatments,
it is apparent that in most instances, particle abun- dance in the first samples taken was already lower in mussel treatments than in control treatments. However, continued decreases in abundance through the experi- ment are not generally apparent.
Slopes and Y-intercepts for regressions of abundance data on time are given in Table 1, together with the results of mult~ple comparisons among slopes (Ga- briel's approximate comparison intervals) by ANOVA. Only 6 regression slopes were significant (p < 0.05); all were negative and 5 of the 6 were in treatments with
Table 1. Coefficients for regressions of particle abundances (cells ml-l, except floc) on time. ANOVA F-statistics (1, 2 df, ' p < 0.05, ' ' p < 0.01) given for significance of regression slopes. Horizontal lines indicate slopes or adjusted means which were not significantly different at p = 0.05 by ANOVA (slopes) or ANCOVA (means adjusted for common slope), using Gabriel's approximate comparison intervals based on the T' method (Sokal & Rohlf 1981). Dashed lines connect non-adjacent values which
are not significantly different
Mussels NH; controls Untreated Small Medium Large Per Ig. Per sm. control
Large Slope -0.532 0.227 0.666 -0.222 01.151 0.369 -- autotrophs F 0.51 0.11 1.00 0.05 5.40 0.09
Y-intercept 47.4 54.6 36.2 131.6 87.5 145.7 Adjusted mean 27.2 62.3 56.1 124.5 128.9 160.5
Large Slope -0.057 -0.012 0.009 0.381 0.253 0.034
heterotrophs F 1.64 10.14 0.01 1.60 0.63 0.15 Y-intercept 19.7 29.1 27.8 34.8 35.6 40.3 Adjusted mean 17.5 25.0 28.1 46.9 44.7 41.7
Small Slope -113.2 -112.3 13.5 -41.8 -35.7 -70.6
autotrophs F 263.2 4.61 0.08 0.41 2.69 0.65 '
Y-intercept 8206 11486 8640 14422 15860 17033 Adjusted mean 3905 7674 9044 13086 14594 14206
Small Slope -7.77 - 10.2 -9.64 -1.13 -13.0 1.13
heterotrophs F 7.14 143.6" 3.98 0.04 3.67 0.10 Y-intercept 637.7 84 1.6 819.3 755.4 1409 1136 Adjusted mean 342.6 496.8 531.0 719.4 942.1 1181 - -
Cyanobacteria Slope -2801 -2151 -5185 -1329 -168.6 - - - - - - - - 1327
F 43.4 ' 9.01 79.1' 19.6' 0.02 0.83 Y-intercept 187827 242665 383784 336328 301671 312712 Adjusted mean 81397 169648 228768 293885 295599 259613
Bacteria Slope -34923 5557 14673 5274 -9770 19165
F 8.13 1.24 5.17 7.55 1.27 9.30 Y-intercept 5054846 3352364 3199562 4622377 4719242 3842966 Adjusted mean 3725500 3541000 3638250 4790750 4367500 4610000
Floc index Slope -0.029 -0.029 -0.015 -0.003 0.002 -0.009
F 4.21 54.31' 1.98 0.08 0.51 11.41 Y-intercept 2.43 2.60 2.04 2.69 2.01 2.56 Adjusted mean 1.32 1.63 1.61 2.58 2.10 2.21

124 Mar. Ecol. Prog. Ser.
mussels. Regression slopes were not significantly different among all treatments for most particle types: the exceptions were for cyanobacteria, where small- and large-mussel treatments differed from the un- treated control; and for bacteria, where the small-mus- sel treatment differed from all other treatments except one control cylinder. Analysis of covariance was con- ducted for all particle types to test the hypothesis that the mean abundance through time differed among mussel size groups (i.e. the means adjusted for a single, common regression slope were compared); however, since regression slopes were not entirely homogeneous among treatments for cyanobacteria and bacteria, the ANCOVA results may be somewhat suspect for these 2 particle types. ANCOVA indicated that the adjusted mean abundances (or equivalently, the Y-intercepts given a common regression slope) were significantly different (p < 0.05) between treatments with mussels
PARTICLE F P E S
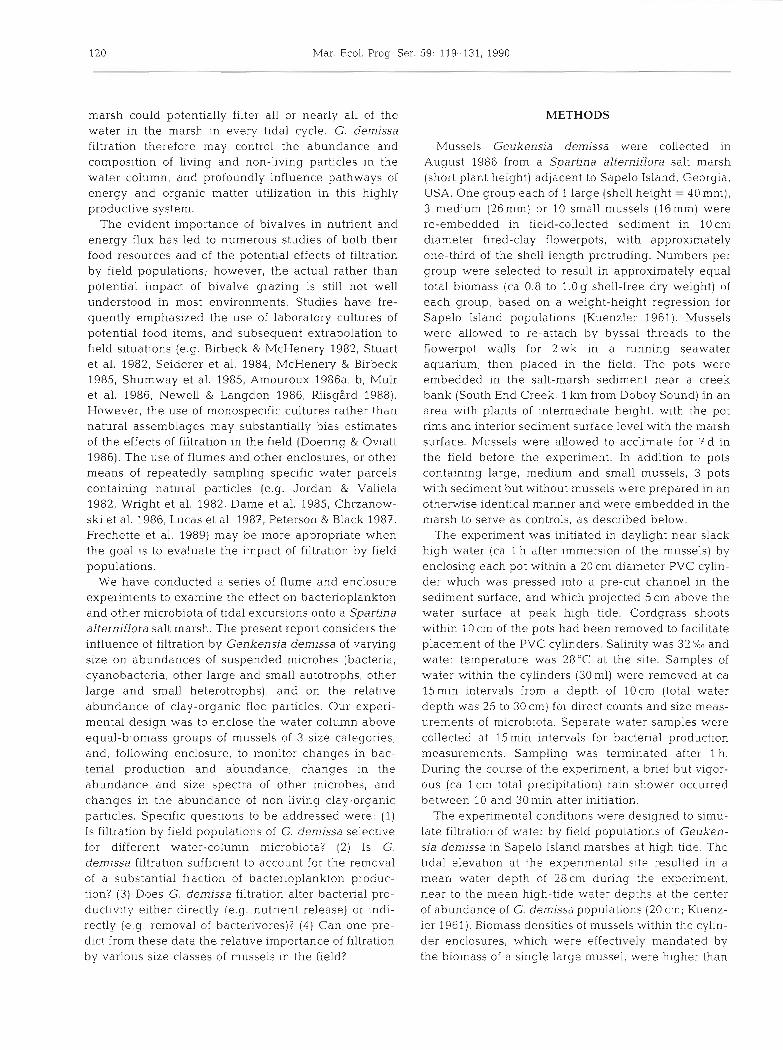
Fig. 2. Percent change in abundance of particles in control cylinders and in cylinders containing groups of 1 large, 3 medium or 10 small mussels. (1:)) Control cylinders, mean + l. S E , n = 3. Other symbols as for Fig. 1. LA, LH, FL, SA, SH, CY and BA: large autotrophs, large heterotrophs, floc particles, small autotrophs, small heterotrophs, cyanobacteria and bac- teria, respectively. Percent change calculated from mean pre- dicted initial abundance In control cylinders minus predicted
abundances after 60 min
Fig. 3. Geukensla dernissa. Clearance rate per individual mussel as a function of mussel size. Abbrev~ations as In Fig. 2. Filled symbols denote particles tor which regression of clear- ance on mussel size was significant (p < 0.05, ANOVA F-
statistic for slope)
and those without mussels for all particle types (Table 1). For all particles except bacteria and floc, the means were significantly lower for small mussels than for all other treatments. Means for medium-mussel and large-mussel treatments were not significantly differ- ent for all particle types except cyanobacteria. For most particle types, means were not significantly different among the 3 control treatments, with the notable exception of small heterotrophs for which all 3 control treatments were significantly different from each other and were larger than all mussel treatments, and floc particles for which the low-ammonium treatment (ammonium per large mussels) mean was larger than in all other cylinders.
At the end of the experiment when reduced particle abundance in mussel treatments allowed us to easily see the sediment surface, we observed that one of the 3 medium-sized mussels was completely closed and evi- dently not filtering. In the preceeding analysis, it is possible that ANCOVA comparisons of adjusted mean abundances would be somewhat affected, since pre- sumably the final abundances of at least some particles would be lower in the presence of 3 actively filtering mussels.
The linear regressions of particle abundance against time were used to estimate the initial abundance of particles in controls at time zero, representing our best estimate of the initial particle abundances in all cylin- ders. Percent change in abundance over l h was then calculated from these extrapolated inltial abundances and the predicted abundance (from regressions) in mussel or control cylinders after l h for each particle type (Fig. 2). This calculation implicitly assumes that initial abundances varied randomly among all cylin- ders, such that variation in the initial abundance among cylinders will yield only random errors in our estimates of percent change. This is especially impor- tant i.n the case of consistently lower abundance in mussel cylinders than in control cylinders, which if merely a random event would be falsely interpreted as removal due to mussel feeding prior to the collection of the first sample. The assumption is supported by the low probability (!,h) that random variations in the abundance of a given particle in the water column resulted in all 3 mussel cylinders having lower initial abundances than all 3 control cylinders. While the cumulative probability of any one of the 7 particle types showing this misleading pattern is i,,i;~, the probability of at least 4 particle types showing this pattern (e.g. large autotrophs, large heterotrophs, small autotrophs and small heterotrophs: Flg 1) is exceedingly low By extensi.on, we assume that variations in i.nitia1 abun- dances of all other particles were also random.
The mean percent change in abundance in control cylinders was either positive (large heterotrophs and
Kemp et al . . Effect of mussel feedlng on saltmarsh microbiota 125
large autotrophs; positive but near zero for bacteria) or substantially less negative (all other particles) than in inussel cylinders (Fig. 2) . Very similar patterns of parti- cle removal for different particle types occurred for all 3 mussel size groups, with maximum removal of inter- mediate-sized living particles and non-living clay- organic particles, and lowest removal of large living particles and bacteria. Percent removal generally increased with decreasing inussel size; for some parti- cle types, an equal biomass of small mussels removed more than twice as many particles than large mussels (Fig. 2; also weight-specific clearance rates in Table2).
These predicted initial and final abundances of par- ticles were also used to estimate the volume of water cleared of each particle type per hour by individual mussels of each size group (Fig. 3). Calculated clear- ance rates were based on the assumption that abun- dance decreased exponentially through time in a con- stant enclosed water volume with constant clearance rate, in order to yield rates comparable to published values (e.g. Jordan & Valiela 1982, Wright et al. 1982);
however, the temporal resolution of our own data is not sufficient to provide a reasonable test of this assump- tion. These rates should be regarded as the constant clearance rate required to yield decreases in abun- dance equivalent to those observed in the present study. Clearance rates have not been adjusted to com- pensate for changes in particle abundance in control cylinders, and therefore may somewhat underestimate (large autotrophs, heterotrophs and bacteria) or overes- timate (other particles) true clearance rates. The esti- mated clearance rates (1 h-' mussel-') were analyzed by linear regression of the mean shell-free dry weight of mussels within a given group. Data were trans- formed (log X, log Y) to fit an allometric relationship (Y = bXa), which yielded much higher F-statistics than simple linear regression of untransformed data. Regression slopes were compared among particle types as for abundance data. Regression slopes were signifi- cant for floc particles (p < 0.01), small heterotrophs (p < 0.05) and bacteria (p < 0.05), but not for small auto- trophs (p <0.10), cyanobacteria (p >0.10) or large
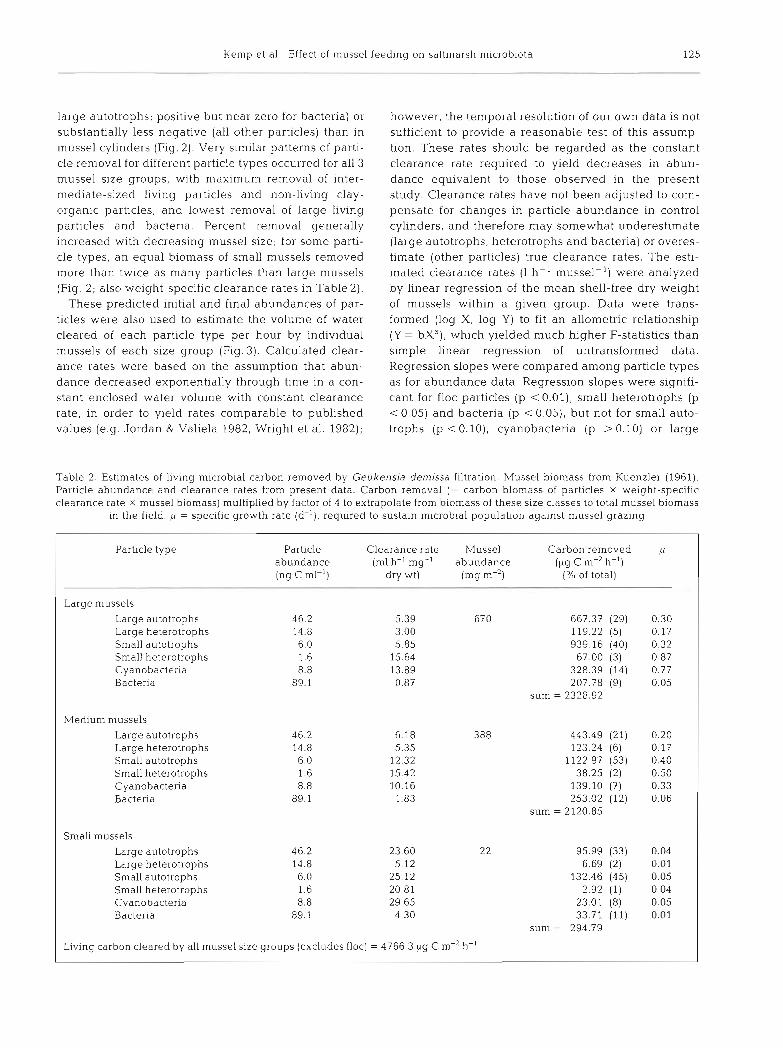
Table 2 Estimates of living microbial carbon removed by Geukensla den~issa filtration. Mussel biomass from Kuenzler (1961). Particle abundance and clearance rates from present data. Carbon removal (= carbon blomass of particles X weight-specific clearance rate X mussel biomass) multiplied by factor of 4 to extrapolate from biomass of these size classes to total mussel biomass
in the field. /L = specific growth rate (d-l), required to sustain microbial populabon agalnst mussel grazing
Particle type Particle Clearance rate Mussel Carbon removed p abundance (m1 h-' mg-l abundance (pg C m-2 h-') (ng C ml-l) dry wt) (mg m-') ('10 of total)
Large mussels
Large autotrophs 46.2 5.39 670 667.37 (29) 0.30 Large heterotrophs 14.8 3.00 119.22 (5) 0.17 Small autotrophs 6.0 5.85 939.16 (40) 0.32 Small heterotrophs 1.6 15.64 67.00 (3) 0.87 Cyanobacteria 8.8 13.89 328.39 (14) 0.77 Bacteria 89.1 0.87 207.78 (9) 0.05
sum = 2328.92
Medium mussels Large autotrophs 46.2 6.18 388 443.49 (21) 0.20 Large heterotrophs 14.8 5.35 123.24 (6) 0.17 Small autotrophs 6.0 12.32 1122.97 (53) 0.40 Small heterotrophs 1.6 15.42 38.25 (2) 0.50 Cyanobacteria 8.8 10.16 139.10 (7) 0.33 Bacteria 89.1 1.83 253.02 (12) 0.06
sum = 2120.85
Small mussels Large autotrophs 46.2 23.60 22 95.99 (33) 0.04 Large heterotrophs 14.8 5.12 6.69 (2) 0.01 Small autotrophs 6.0 25.12 132.46 (45) 0.05 Small heterotrophs 1.6 20.81 2.92 (1) 0.04 Cyanobacteria 8.8 29.65 23.01 (8) 0.05 Bacteria 89.1 4 30 33.71 (11) 0.01
sum = 294.79
Living carbon cleared by all mussel size groups (exc1,udes floc) = 4766.3 pg C m-' h-'
126 Mar. Ecol. Prog Ser. 59: 119-131, 1990
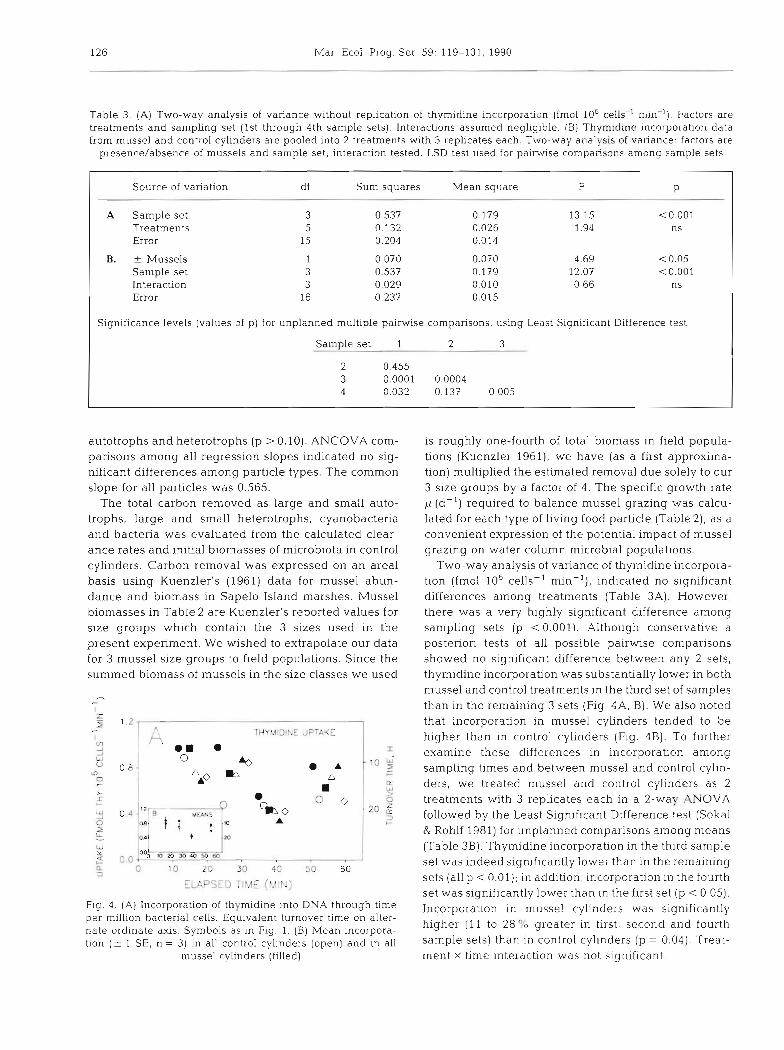
Table 3. (A) Two-way analysis of variance without replication of thymidine incorporation (fmol 106 cells-' min-l). Factors are treatments and sampling set (1st through 4th sample sets). Interactions assumed negligible. (B) Thymidine incorporation data from mussel and control cylinders are pooled into 2 treatments with 3 replicates each. Two-way analysis of variance: factors are
presence/absence of mussels and sample set; interaction tested. LSD test used for pairwise comparisons among sample sets
Source of variation df Sum squares Mean square F P
A Sample set Treatments Error
B. + Mussels Sample set Interaction Error
Significance levels (values of p) for unplanned multiple pairwise comparisons, using Least Significant Difference test
Sample set 1 2 3
autotrophs and heterotrophs (p > 0.10). ANCOVA com- parisons among all regression slopes indicated no sig- nificant differences among particle types. The common slope for all particles was 0.565.
The total carbon removed as large and small auto- trophs, large and small heterotrophs, cyanobacteria and bacteria was evaluated from the calculated clear- ance rates and initial biomasses of microblota in control cylinders. Carbon removal was expressed on an area1 basis using Kuenzler's (1961) data for mussel abun- dance and biomass in Sapelo Island marshes. Mussel biomasses in Table 2 are Kuenzler's reported values for size groups which contain the 3 sizes used in the present experiment. We wished to extrapolate our data for 3 mussel size groups to field populations. Since the summed biomass of mussels in the size classes we used
'L I O O L o 4 m m m = = - ~ --
t -7
T C 20 30 4C 50 60
EL 'ZPSE~ T M,?E it,! F, )
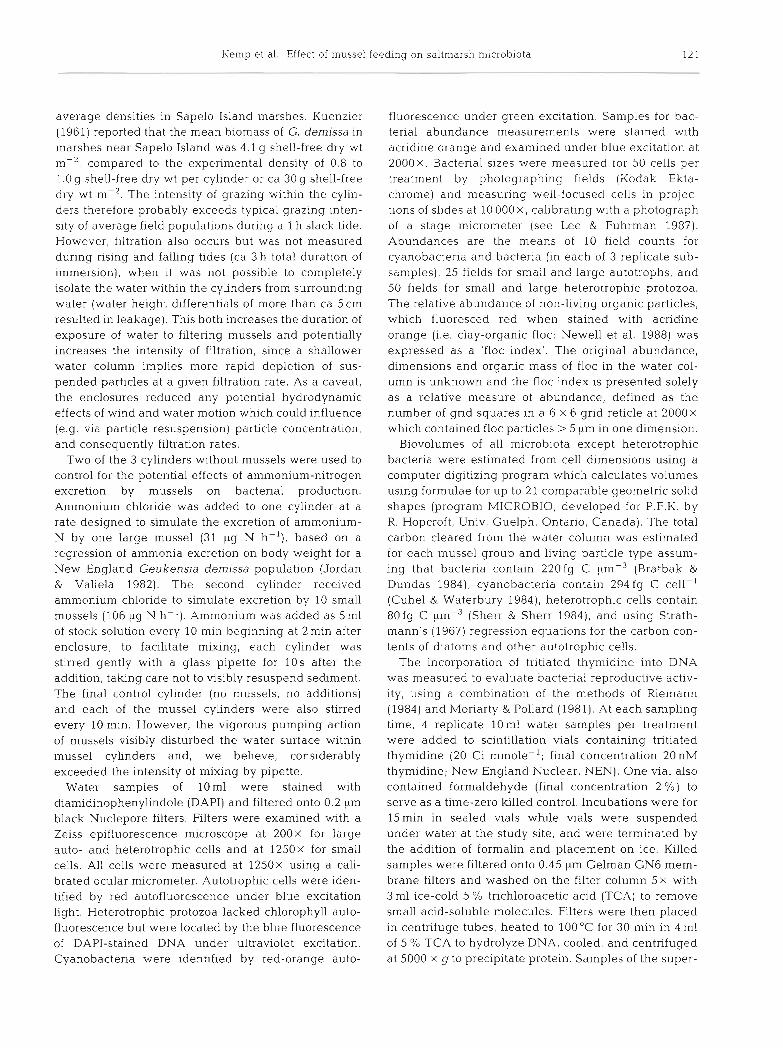
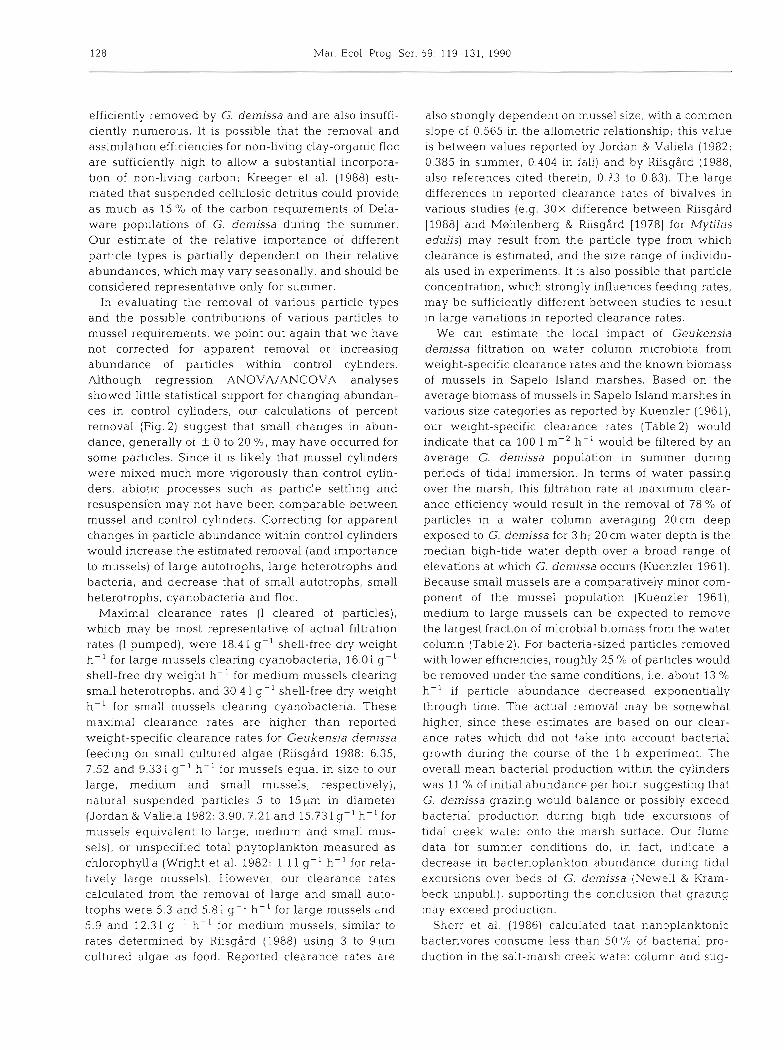
Fig. 4. (A) Incorporation of thymidine into DNA through time per million bacterial cells. Equivalent turnover time on alter- nate ordinate axis Symbols as in Flg 1. ( B ) Mean incorpora- tion (I l SE, n = 3) in all control cylinders (open) and in all
mussel cylinders (filled)
is roughly one-fourth of total biomass in field popula- tions (Kuenzler 1961), we have (as a first approxima- tion) multiplied the estimated removal due solely to our 3 size groups by a factor of 4 . The specific growth rate p (d-l) required to balance mussel grazing was calcu- lated for each type of living food particle (Table 2), as a convenient expression of the potential impact of mussel grazing on water column microbial populations.
Two-way analysis of variance of thymidine incorpora- tion (fmol 10%ells-' min-l), indicated no significant differences among treatments (Table 3A). However, there was a very highly significant difference among sampling sets (p < 0.001). Although conservative a posterion tests of all possible pairwise comparisons showed no significant difference between any 2 sets, thymidine incorporation was substantially lower in both mussel and control treatments in the third set of samples than in the remaining 3 sets (Fig. 4A. B). We also noted that incorporation in mussel cylinders tended to be higher than in control cylinders (Fig. 4B) . To further examine these differences in incorporalon among sampling times and between mussel and control cylin- ders, we treated mussel and control cylinders as 2 treatments with 3 replicates each in a 2-way ANOVA followed by the Least Significant Difference test (Sokal & Rohlf 1981) for unplanned comparisons among means (Table 3B) . Thymidine incorporation in the third sample set was indeed significantly lower than in the remaining sets (all p < 0.01); in addition, incorporati.on In the fourth set was significantly lower than in the first set (p < 0.05). Incorporation in mussel cylinders was significantly higher (1 1 to 28 "b greater in first, second and fourth sample sets) than in control cylinders (p = 0.04). Treat- ment x time interaction was not significant.

Kemp et al.: Effect of mussel feeding on saltmarsh microbiota 127
Bacterial turnover times fell generally in the range of 10 to 20 h (Fig. 4A, B), estimated from thymidine incor- poration on the assumption that thymidine concen- trations were sufficiently high to inhibit d e novo syn- thesis (see Riemann et al. 1987) and avoid significant isotope dilution (Moriarty 1986), and using a conver- sion factor of 2 X 10¹⁸ cells produced mole-' thymidine incorporated into DNA (Moriarty 1986).
DISCUSSION
Adjusted means were significantly lower for all mus- sel cylinders than in control cylinders for all particles. In a minority of cases, a significant continuing decrease in particle abundance was observed during the course of the experiment (significant negative regression slopes); in the majority of instances either most particle removal occurred early in the experiment (perhaps before the first sample was taken), or our data set simply lacks the resolution necessary to measure such continuing decreases in particle abundance. Given that consistent differences in particle abundance between mussel and control cylinders are unlikely to have hap- pened by random chance, we assume that the lower particle abundances in mussel cylinders are due to feeding activity. The apparent removal of particles prior to collection of the first samples, coupled with no evidence for continued removal of some particle types, was both unexpected and puzzling, particularly since it appears that other particle types continued to be removed. These results may reflect a substantial capa- city of Geukensia demissa to select among particles and possibly to alter selective preference over a short time span.
Because mussel abundance in treatment cylinders was higher than normal field densities, the degree to which particles were removed is probably greater than the expected removal of microbial particles in the field over a l h period at slack tide. However, similar removal of particles may occur over an entire tidal immersion in the field, including the rising and falling tides. In flume studies in the field (see Chalmers et al. 1985 concerning flume characteristics) we have found decreases in abundance during a 3 h tidal excursion which were similar in magnitude to decreases observed in this l h experiment (e.g. 74 % reduction of floc, 33 % reduction of bacteria in the flume: Newel1 & Krambeck unpubl.; ca 90 % reduction of floc, 30 % reduction of bacteria in cylinders: present study). These results are in agreement with other studies showing seston deple- tion (and consequently food limitation) in the benthic boundary layer resulting from bivalve filtration (Wild- ish & Kristmanson 1984, Frechette & Bourget 1985a, b, Peterson & Black 1987, Frechette et al. 1989). In the
shallow water column overlying Geukensia popula- tions in southeastern marshes, these suspension-feed- ing bivalves may also be food-limited.
Particles of various types were removed from the natural assemblage of suspended living and dead organic matter with greatly varying effectiveness. Riis- g5rd (1988) found that from 70 to 100% of particles from 2 to 4 ,um diameter were removed by Geukensia demissa during incubations of l h or less; removal was effectively constant at 100 % for particles above 4 pm in diameter. In the present study, this range (2 to 9pm) would be represented primarily by larger cyanobac- teria, small autotrophic and small heterotrophic cells (5 to 10 pm diameter), and probably by a substantial frac- tion of floc particles. For particles within this size range and for typically smaller cyanobacterial cells (mean diameter 1.2pm), we found removal efficiencies (frac- tion of particles retained in l h ; Fig. 3) of 70 to 90 %, comparable to the results of Riisgard who used primar- ily cultured algae rather than a natural assemblage. Riisgard (1988) and Wright et al. (1982) suggested that its characteristically closely-spaced gill structure enabled G. demissa to remove small particles more efficiently than other bivalve species. However, in the present study removal efficiency decreased for still larger particles, suggesting that factors such as particle motility (especially in the case of large heterotrophs) or other factors which determine particle 'quality' (e.g. surface chemistry; Shumway et al. 1985) sometimes may be of greater importance than particle size.
Although particle removal is not equivalent to utili- zation by mussels (particles may be rejected in pseudofeces; various particles may be assimilated with differing efficiencies), it does set limits on the accessi- bility of various potential food items to Geukensia demissa. Phytoplankton (small and large autotrophs) would contribute 72 % (small autotrophs 47 %) and bacteria could contribute 10 % of total carbon filtered as living particles by mussels, based on extrapolations of our data to field populations (Table 2 ) ; the estimated contributions of other microbes would be 6 % for large heterotrophs, 2 % for small heterotrophs, and 10.5 % for cyanobacteria. These data indicate a somewhat less important role for bacteria than suggested by Wright et al. (1982), who estimated that bacteria provided about one-fourth as much carbon to G, demissa as phyto- plankton. As a first approximation, by assuming equal assimilation efficiency for all living particles we can predict that phytoplankton, especially smaller auto- trophs, are likely to b e the primary microbial food resource of G. demissa, with a substantial but lesser contribution from cyanobacteria and bacteria. Small heterotrophs are removed with efficiencies similar to small autotrophs but are insufficiently numerous to be an important carbon source. Large heterotrophs are not
128 Mar. Ecol. Prog S er. 59: 119-131, 1990
efficiently removed by G. demissa and are also insuffi- ciently numerous. It is possible that the removal and assimilation efficiencies for non-living clay-organic floc are sufficiently high to allow a substantial incorpora- tion of non-living carbon; Kreeger et al. (1988) esti- mated that suspended cellulosic detritus could provide as much as 15 '10 of the carbon requirements of Dela- ware populations of G. demissa during the summer. Our estimate of the relative importance of different particle types is partially dependent on their relative abundances, which may vary seasonally, and should be considered representative only for summer.
In evaluating the removal of various particle types and the possible contributions of various particles to mussel requirements, we point out again that we have not corrected for apparent removal or increasing abundance of particles within control cylinders. Although regression ANOVA/ANCOVA analyses showed little statistical support for changing abundan- ces in control cylinders, our calculations of percent removal (Fig. 2) suggest that small changes in abun- dance, generally of + 0 to 20 %, may have occurred for some particles. Since it is likely that mussel cylinders were mixed much more vigorously than control cylin- ders, abiotic processes such as particle settling and resuspensibn may not have been comparable between mussel and control cylinders. Correcting for apparent changes in particle abundance within control cylinders would increase the estimated removal (and importance to mussels) of large autotrophs, large heterotrophs and bacteria, and decrease that of small autotrophs, small heterotrophs, cyanobacteria and floc.
Maximal clearance rates (1 cleared of particles), which may be most representative of actual filtration rates (1 pumped), were 18.4 1 gP1 shell-free dry weight h-' for large mussels clearing cyanobacteria, 16.01 g-' shell-free dry weight h-' for medium mussels clearing small heterotrophs, and 30.4 1 g - ' shell-free dry weight h-' for small mussels clearing cyanobacteria. These maximal clearance rates are higher than reported weight-specific clearance rates for Geukensia demissa feeding on small cultured algae (Riisgbrd 1988: 6.35, 7.52 and 9.33 1 h-' for mussels equal in size to our large, medium and small mussels, respectively), natural suspended particles 5 to 15 pm in diameter (Jordan & Valiela 1982: 3.90, 7.21 and 15.73 1 g-' h-' for mussels equivalent to large, medium and small mus- sels), or unspecified total phytoplankton measured as chlorophyll a (Wright et al. 1982: 1.1 1 g-l h-' for rela- tively large mussels). However, our clearance rates calculated from the removal of large and small auto- trophs were 5.3 and 5.8 1 g - ' h-' for large mussels and 5.9 and 12.31 g ' h-' for medium mussels, similar to rates determined by Riisgdrd (1988) using 3 to 9!~m cultured algae a s food. Reported clearance rates are
also strongly dependent on n~ussel size, with a common slope of 0.565 in the allometric relationship; this value is between values reported by Jordan & Valiela (1982; 0.385 in summer, 0.404 in fall) and by Riisgbrd (1988, also references cited therein; 0.73 to 0.83). The large differences in reported clearance rates of bivalves in various studies (e.g. 30x difference between Riisgsrd [l9881 and M~hlenberg & kisgdrd 119781 for Mytilus edulis) may result from the particle type from which clearance is estimated, and the size range of individu- als used in experiments. It is also possible that particle concentration, which strongly influences feeding rates, may be sufficiently different between studies to result in large variations in reported clearance rates.
We can estimate the local impact of Geukensia demissa filtration on water column microbiota from weight-specific clearance rates and the known biomass of mussels in Sapelo Island marshes. Based on the average biomass of mussels in Sapelo Island marshes in various size categories as reported by Kuenzler (1961), our weight-specific clearance rates (Table 2) would indicate that ca l00 1 m-2 h-' would be filtered by an average G. demissa population in summer during periods of tidal immersion. In terms of water passing over the marsh, this filtration rate at maximum clear- ance efficiency would result in the removal of 78 % of particles in a water column averaging 20cm deep exposed to G. demissa for 3 h; 20 cm water depth is the median high-tide water depth over a broad range of elevations at which G. demissa occurs (Kuenzler 1961). Because small mussels are a comparatively minor com- ponent of the mussel population (Kuenzler 1961), medium to large mussels can be expected to remove the largest fraction of microbial biomass from the water column (Table 2). For bacteria-sized particles removed with lower efficiencies, roughly 25 % of particles would be removed under the same conditions, i.e. about 13 % h- ' if particle abundance decreased exponentially through time. The actual removal may be somewhat higher, since these estimates are based on our clear- ance rates which did not take into account bacterial growth during the course of the 1 h experiment. The overall mean bacterial production within the cylinders was 11 % of initial abundance per hour, suggesting that G. demissa grazing would balance or possibly exceed bacterial production during high tide excursions of tidal creek water onto the marsh surface. Our flume data for summer conditions do, in fact, indicate a decrease in bacterioplankton abundance during tidal excursions over beds of G. denlissa (Newel1 & Kram- beck unpubl.), supporting the conclusion that grazing may exceed production.
Sherr et al. (1986) calculated that nanoplanktonic bacterivores consume less than 50 '16 of bacterial pro- duction in the salt-marsh creek water column and sug-
Kemp et al. Effect of mussel feeding on saltmarsh microbiota 129
gested that benthic filter-feeders such as Geukensia demissa may account for a significant part of the net importation of bacteria to the marsh observed by others (Erkenbrecher & Stevenson 1975, Rublee et al. 1983). Our data are consistent with this hypothesis, although a more elaborate estimation of the total impact of grazing on water colunln microbes in salt-marsh creeks would be inappropriate for the present, limited data set.
Mussel grazing on particles other than bacteria would be balanced by specific growth rates in the range of 0.35 to 1.41 d-'. These rates are sufficiently similar to reported growth rates of phytoplankton and heterotrophic protozoans to suggest that mussel graz- ing has a significant impact on microbial abundance in water exposed to the marsh surface. The overall effect on microbial populations in salt marsh creeks would presumably be dependent on the proportion of creek water which is exposed to the marsh surface and sub- ject to filtration.
Mussels may also have an indirect influence on mi- crobial processes in the water column, for example by nutrient enhancement of microbial production, by per- turbing the relative abundances of planktonic consum- ers and their prey, or by altering the abundance of clay particles which may adsorb organic matter. With regard to potential effects of nutrient release on bac- teria, mean cell-specific thymidine incorporation was slightly enhanced (1 1 to 28 %) in the presence of mus- sels. There was no evident pattern to suggest that nitrogen additions resulted in similarly enhanced cell- specific thymidine incorporation in control cylinders. Consequently, the enhancement of thymidine incorpo- ration in the presence of mussels cannot be attributed to excretion of ammonium-N by mussels. Other excre- tory products, or nutrients released during feeding, may have stimulated bacterial activity in the presence of mussels. Alternatively, grazing on bacteria may stimulate cell-specific activity, as has been suggested for various benthic and planktonic grazers (e.g. Alongi 1985, Moriarty et al. 1985, Simon 1987).
It is interesting that the enhancement of cell-specific activity in the presence of mussels was quite small in comparison to the drop in activity which occurred in the third set of samples (Fig. 4A, B) . We hypothesize that this decrease may have been a response to the sudden, though small (i.e. 3.3 %) dilution of tidal water by a brief, heavy rain shower between 10 and 30 min after the start of the experiment. Whatever the cause of the decrease in activity, cell-specific thymidine uptake had returned nearly to previous levels by the fourth sample set col- lected only 15 min later. This illustrates the potential rapidity of substantial changes in bacterial activity, on temporal scales much shorter than reported die1 (e.g. Moriarty & Pollard 1982, Turley & Lochte 1986, Kemp 1988) or longer (e.g. Newel1 et al. 1988) cycles.
Small heterotrophic cells, principally nanoflagellates, which are now considered important consumers of bac- terioplankton, were removed with much greater effi- ciency (ca 89 % per h) than bacteria (< 30 % per h) by all mussel size groups. This differential removal would tend to perturb the balance between bacterial produc- tion and grazing by bacterivores by releasing bacteria from grazing pressure, and could significantly influ- ence microbial trophodynamics in the upper portions of salt-marsh creeks. Among large heterotrophs, ciliated protozoa are frequently considered omnivorous or algivorous but can be potentially important bac- terivores in coastal water such as the Duplin River (Sherr & Sherr 1987). Large heterotrophs, however, were generally removed a t efficiencies similar to the removal of bacteria. As a result, mussel grazing would not be expected to significantly alter the balance between ciliate grazing and bacterial production.
We can estimate the flux of carbon onto the salt marsh due to mussel filtration. These rough estimates should be considered to substantially overestimate the annual removal of microbial carbon and non-microbial particulate organic carbon (POC), since filtration rates are based on summer, warm-water conditions; our winter data for an intertidal flume indicate substan- tially lower filtration rates. Geukensia demissa would remove at most 7.52g C m-2 yr-' in living microbial carbon from the water column (from Table 2, given immersion for an average of 18 % of the time [Kuenzler 19611). Given a POC concentration of 3 pg nilp' in the water column (Chalmers et al. 1985), a maximum of ca 417 g POC m-2 yr-' would be removed by field popula- tions of G. demissa if POC is removed with equal efficiency to the floc in the present experiment. This is on the order of the estimated retention of POC in intertidal flumes: Chalmers e t al. (1985), for example, estimated a mean POC retention within a flume of 360mg C m-2 per tide, equivalent to 260 g C mP2 yr-l for semi-diurnal tides.
Kuenzler (1961) estimated the annual assimilation of field populations near Sapelo Island at 56 kg-cal m-2 yr-l, equivalent to ca 7 g C m-2 yr-'. (using conversion factors in Kuenzler 1961). If the carbon assinlilation efficiency for Geukensia demissa is ca 50 '10 (Jordan & Valiela 1982), these populations would be expected to ingest ca 14 g C m-' yr-' from the water column. Our maximal estimate of 7.52g C m-2 yr-' ingested sug- gests that microbial carbon supplies a substantial por- tion, but not all of the requirements of G. demissa. Assimilation of non-living POC may provide the re- mainder.
Filtration of living carbon by Geukensia demissa represents only a very small fraction of the total carbon produced in the salt-marsh system or exported from salt marshes to the nearshore region (Chrzanowski et al.

130 Mar. Ecol. Prog. Ser. 59: 119-131, 1990
1982), in strong contrast with the impact of filtration by salt marsh oyster reef communities where net importa- tion of living carbon can greatly exceed the estimated export of total POC from the salt-marsh system (import = 1750g C m-' yr-l: Chrzanowski et al. 1986). Thus, while grazing on microbes probably provides a sub- stantial fraction of the carbon requirements of G. demissa, strongly influences the abundance of mi- crobes in water exposed to the marsh surface, and may be important to microbial trophodynamics within the salt-marsh creek water column, our data suggest it is relatively unimportant in terms of total flux of living carbon in the salt marsh system.
Acknowledgements. The authors thank L. Kemp and B. Newel1 for their able assistance in the field. Support for this research was provided to P. F. K. by a University of Georgia Marine Institute Postdoctoral Associateship and to C. K. by the University of Georgia Marine Institute Visiting Scientist Pro- gram. This report was prepared during a n appointment (P.F.K.) to the Alexander Hollaender Distinguished Postdoc- toral Fellowship Program supported by the U.S. Department of Energy, Office of Health and Environmental Research, and administered by Oak Ridge Associated Universities. This IS
contribution No. 642 of the University of Georgia Marine Institute.
LITERATURE CITED
Alongi, D. M. (1985). Effect of physical disturbance on popula- tion dynamics and trophic interactions among microbes and rneiofauna. J. mar. Res. 43: 351-364
Amouroux, J. M. (1986a). Comparative study of the carbon cycle in Venus verrucosa fed on bacteria and phytoplank- ton I . Consumphon of bactena (Lactobacillus sp. ) . Mar Biol. 90: 237-241
Amouroux, J. M. (198615). Comparative study of the carbon cycle in Venus verrucosa fed on bacteria and phytoplank- ton 11. Consumption of phytoplankton (Pavlova lutheri). Mar Biol. 92: 349-354
Bertness, M. D. (1984). Ribbed mussels and Spartina alterni- flora production in a New England salt marsh. Ecology 65: 1794-1807
Birbeck, T H., McHenery, J . G (1982). Degradation of bac- teria by Mytilus edulis. Mar Biol. 72: 7-15
Bratbak, G., Dundas, I. (1984). Bacterial dry matter content and biomass estimations. Appl. environ. Microbiol. 48: 755-757
Chalmers, A. G . , Wiegert, R. G., Wolf, P. L. (1985). Carbon balance in a salt marsh: interaction of diffusive export, tidal deposition and rainfall-caused erosion. Estuar. cstl Shelf Sci. 2 1 : 757-77 1
Chrzanowski, T H., Spurrier, J. D., Dame, R. F., Zingrnark, R. G. (1986). Processing of microbial biomass by an intert~dal reef community. Mar Ecol. Prog. Ser 30. 181-189
Chrzanowsh, T H., Stevenson, L. H., Spurrier, J. D. (1982). Transport of microbial biomass through the North Inlet ecosystem. Microb. Ecol. 8: 139-156
Cloern, J E. (1982) Does the benthos control phytoplankton biornass in south San Francisco Bay? Mar. Ecol. Prog. Ser. 9: 191-202
Coughlan, J. (1969). The estimation of filtering rate from the clearance of suspensions. Mar Biol. 2: 356-358
Cuhel, R. L., Waterbury, J B. (1984). Biochemical composition and short-term nutrient incorporation patterns in a unicel- lular marine cyanobacterium, Synechococcus (WH7803). Limnol. Oceanogr. 29: 370-373
Dame, R., Zingmark, R., Stevenson, L. H., Nelson, D. (1980). Filter feeder coupling between the estuarine water column and benthic subsystems. In: Kennedy. V. S. (ed.) Estuarine perspectives Academic Press, New York, p. 521-527
Dame, R. F., Wolaver, T. G., Libes, S. M. (1985). The summer uptake and release of nitrogen by an intertidal oyster reef. Neth. J. Sea Res. 19: 265-268
Doering, P. H., Oviatt, C. A. (1986). Application of filtration rate models to field populations of blvalves: an assessment usmg experimental mesocosrns. Mar. Ecol. Prog. Ser. 31: 265-275
Erkenbrecher, C. W., Stevenson, L. H. (1975). The influence of tidal flux on microbial biomass in salt marsh creeks. Lim- nol. Oceanogr. 20: 618-625
Frechette, M., Bourget, E. (1985a). Energy flow between the pelagic and benthic zones: factors controlling particulate organic matter available to an intertidal mussel bed. Can. J Fish. Aquat. Sci. 42. 1158-1165
Frechette, M., Bourget, E. (1985b). Food-limited growth of Mytilus edulis L. in relation to the benthic boundary layer. Can. J. Fish. Aquat. Sci. 42: 1166-1170
Frechette, M., Butman, C. A., Geyer, W. R. (1989). The impor- tance of boundary-layer flows in supplying phytoplankton to the benthic suspension feeder, 1Mytilus edulis L. Limnol. Oceanogr 34: 19-36
Gabriel, K. R. (1978). A simple method of multiple comparison of means. J Am. statist. Ass. 73: 724-729
Jordan, T E., Valiela, I. (1982). A nitrogen budget of the ribbed mussel, Geukensia demissa, and its significance in nitrogen flow in a New England salt marsh. Limnol. Oceanogr 27: 75-90
Kemp, P. F. (1988). Bacterivory by benthic ciliates: signifi- cance as a carbon source and impact on sediment bacteria. Mar. Ecol. Prog. Ser. 49: 163-169
Kreeger, D. A., Langdon, C. J., Newell, R. I. E. (1988). Utiliza- tion of refractory cellulosic carbon derived from Spartina alterninora by the ribbed mussel Geukensia demissa. Mar Ecol. Prog. Ser. 42: 171-179
Kuenzler, E. J. (1961). Structure and energy flow in a mussel population in a Georgia salt marsh Lirnnol. Oceanogr 6: 191-204
Lee, S., Fuhrman, J. A. (1987). Relationships between biovolumes and biornass of naturally derived marine bac- terioplankton. Appl. environ. Microbiol. 53: 1298-1303
Lucas, M. I. , Newell, R . C , Shumway, S. E., Seiderer, L. J , Bally, R . (1987). Particle clearance and yield in relation to bacterioplankton and suspended particulate availability in estuarine and open coast populations of the mussel Mytilus edulis. Mar Ecol. Prog. Ser. 36: 215-224
McHenery, J G., Birbeck, T. H. (1985). Uptake and processing of cultured microorgan~srns by b~valves. J. exp. mar. Biol. Eco~. 90: 145-163
M~hlenberg, F., Riisgbrd, H. U. (1978). Effjciency of particle retention in 13 species of suspension feeding bivalves. Ophelia 17 239-246
~Moriarty, D. J. W. (1986). Measurement of microbial growth rates in aquatic systems using rates of nucleic acid syn- thesis. Adv. microb. Ecol. 9: 245-292
Moriarty, D J W., Pollard, P. C. (1981). DNA synthesis a s a measure of bacterial productivity In seagrass sediments. Mar. Ecol. Prog. Ser. 5: 151-156
Moriarty, D. J. W., Pollard, P. C. (1982). Die1 variation of bacterial productivity in seagrass (Zostera capricorni) beds

Kemp et al.: Effect of mussel feeding on saltmarsh microbiota 131
measured by rate of thymid~ne incorporation into DNA. Mar. Biol. 72: 165-173
Moriarty, D. J. Mr., Pollard, P. C.. Hunt, W. G., Moriarty, C. J.. Wassenberg. T J. (1985). Productivity of bacteria and microalgae and the effect of grazing by holothurians in sedirnents on a coral reef flat. Mar Biol. 85: 293-300
Muir, D., G . , Selderer, L. J . , Davis, C L , Painting, S. J , Robb, F. T. (1986) Filtration, lysis and absorption of bacteria by mussels Chloronlytilus mendional~s collected under upwelling and downwelling condit~ons. S. Afr. J. mar Sci. 4: 169-179
Newell, R. I. E., Langdon, C. J. (1986). Digestion and absorp- tion of refractory carbon from the plant Spartina alterni- flora by the oyster Crassostrea virginica. Mar. Ecol Prog. Ser. 34: 105-115
Newell, S. Y., Fallon, R. D., Sherr, B. F . Sherr, E. B (1988). Mesoscale temporal variation in bacterial standing crop, percent active cells, productivity and output in a salt- marsh tidal river. Verh. int. Verein. Limnol. 23: 1839-1845
Officer, C. B., Smayda, T J., Mann, R. (1982). Benthic filter feeding: a natural eutrophication control. Mar. Ecol. Prog. Ser. 9: 203-210
Peterson, C. H., Black, R. (1987). Resource depletion by active suspension feeders on tidal flats: influence of local density and tidal elevation. Limnol. Oceanogr. 32: 143-166
Riemann, B. (1984). Determining growth rates of natural assemblages of freshwater bacteria by means of 3H-thy- midine incorporation into DNA: comments on methodol- ogy. Arch. Hydrobiol. Beih. Ergeb. L~mnol. 19: 67-80
Riemann, B., Bjornsen, P. K., Newell, S. Y., Fallon, R D. (1987). Calculation of cell production of coastal marine bacteria based on measured incorporation of [ 3 ~ ] - t h y - midine. hmnol . Oceanogr. 32: 4 7 1 4 7 6
RiisgArd. H. U. (1988). Efficiency of particle retention and filtration rate in 6 species of Northeast American bivalves. Mar Ecol. Prog Ser. 45: 217-223
Rublee, P. A., Merkel, S. M,, Faust, M. A. (1983). Nutrient flux in the Rhode River: tidal transport of microorganisms in brackish marshes. Estuar. cstl Shelf Sci. 17: 669-680
Seiderer, L. J., Davis, C. L., Robb, F. T., Newell, R. C. (1984). Utilisation of bacteria as a nitrogen resource by kelp-bed mussels, Chloromytilus meridionalis. Mar. Ecol. Prog Ser. 15. 109-1 16
This article was presented by Professor C. H. Peterson, Morehead City, N. Carolina, USA
Sherr, B. F., Sherr, E. B. (1984). The role of heterotrophic protozoa in carbon and energy flow in aquatic ecosystems In: Klug. M. J., Ready, C. A. (eds.) Current perspectives in microbial ecology. Am. Soc. Microb., Washington, D.C., p. 4 1 2 4 2 3
Sherr. B. F., Sherr, E. B., Andrew, T. L., Fallon, R. D., Newell. S. Y. (1986). Trophic interactions between heterotrophic protozoa and bacterioplankton in es tuar~ne water analysed with selective metabolic inhibitors. Mar Ecol. Prog. Ser. 32: 169-179
Sherr, E. B., Sherr, B. F. (1987). High rates of consumption of bacteria by pelagic ciliates. Nature, Lond. 325: 1388-1393
Shumway, S. E., Cucci, T L.. Newell, R. C., Yentsch, C. M. (1985). Particle selection, ingestion, and absorption in fil- ter-feeding bivalves. J. exp. mar. Biol Ecol 91: 77-92
Simon, M. (1987). Biomass and production of small and large free-living and attached bacteria in Lake Constance. Lim- nol. Oceanogr. 32: 591-607
Smith, J. M.. Hophnson. C. S. (1983). Biodeposition by and paleoecology of the ribbed mussel Geukensia demissa in a salt marsh, Sapelo Island, Georgia. In: Research reports presented to the University of Georgia manne Institute by summer-research participants, 1980-1982. Georgia J . Sci. 41: 93-96
Sokal, R. R., Rohlf, F. J. (1981). Biometry. W. H. Freeman and Co.. New York
Strathmann. R. R. (1967). Estimating the organic carbon con- tent of phytoplankton from cell volume or plasma volume. hmnol . Oceanogr. 12: 4 1 1 4 1 8
Stuart, V., Field, J. G., Newell, R. C. (1982) Evidence for absorption of kelp detritus by the ribbed mussel Aulacomya ater using a new 51Cr-labelled microsphere technique. Mar. Ecol. Prog. Ser. 9: 263-271
Turley, C., Lochte, K. (1986). Die1 changes in the specific growth rate and mean cell volume of natural bacterial communities in two different water masses in the Irish Sea. Microb. Ecol. 12: 231-282
Wildish, D. J., Kristmanson, D. D. (1984). Importance to mus- sels of the benthic boundary layer. Can. J. Fish. Aquat. Sci. 41: 1618-1625
Wright, R. T., Coffin, R. B., Ersing, C. P., Pearson, D. (1982). Field and laboratory measurements of bivalve filtration of natural marine bacterioplankton. Lirnnol. Oceanogr 27: 91-98
Manuscript first received: January 13, 1989 Revised version accepted. August 30, 1989
Related Documents