Can A Workplace Have An Attitude Problem? Workplace Effects on Employee Attitudes and Organizational Performance Published in Labour Economics, August 2011 Ann Bartel, Columbia University and NBER Richard B. Freeman, Harvard University and NBER Casey Ichniowski, Columbia University and NBER Morris M. Kleiner, University of Minnesota and NBER We thank participants at NBER’s Personnel Economics Conference and the University of Minnesota’s Industrial Relations Center Workshop for comments, and Wei Chi, Ricardo Correa, Alexandre Lefter, Raymond Lim, Kyoung Won Park, and Ying Ying Wang, for their research assistance on this paper. We also thank Howard Weiss for providing the attitude data from the bank for our analysis. Because the data used in this study are proprietary, the authors are unable to release them.

Welcome message from author
This document is posted to help you gain knowledge. Please leave a comment to let me know what you think about it! Share it to your friends and learn new things together.
Transcript

Can A Workplace Have An Attitude Problem?
Workplace Effects on Employee Attitudes and Organizational Performance
Published in Labour Economics, August 2011
Ann Bartel, Columbia University and NBER
Richard B. Freeman, Harvard University and NBER
Casey Ichniowski, Columbia University and NBER
Morris M. Kleiner, University of Minnesota and NBER
We thank participants at NBER’s Personnel Economics Conference and the University of
Minnesota’s Industrial Relations Center Workshop for comments, and Wei Chi, Ricardo Correa,
Alexandre Lefter, Raymond Lim, Kyoung Won Park, and Ying Ying Wang, for their research
assistance on this paper. We also thank Howard Weiss for providing the attitude data from the
bank for our analysis. Because the data used in this study are proprietary, the authors are unable
to release them.
GLW2113
Typewritten Text
This is a preprint version of the article. The final version may be found at < http://dx.doi.org/10.1016/j.labeco.2011.01.008 >

Abstract
Using the employee opinion survey responses from several thousand employees working
in 193 branches of a major U.S. bank, we consider whether there is a distinctive workplace
component to employee attitudes despite the common set of corporate human resource
management practices that cover all the branches. Several different empirical tests consistently
point to the existence of a systematic branch-specific component to employee attitudes. “Branch
effects” can also explain why a significant positive cross-sectional correlation between branch-
level employee attitudes and branch sales performance is not observed in longitudinal fixed-
effects sales models. The results of our empirical tests concerning the determinants of employee
attitudes and the determinants of branch sales are consistent with an interpretation that
workplace-specific factors lead to better outcomes for both employees and the bank, and that
these factors are more likely to be some aspect of the branches’ internal operations rather than
some characteristic of the external market of the branch.

1
I. Introduction
Research that examines the productivity of very similar plants and establishments finds
that some enterprises persistently operate much more efficiently than others.1 The role of human
resource management practices in explaining persistent productivity differences in seemingly
similar enterprises has now received considerable attention in both intra-industry studies and
cross-industry studies.2 Do productivity outcomes still vary across worksites within a given
industry even when they operate under a common set of management practices? If so, what
might account for these differences?
In this study, we address these questions by investigating employee responses to attitude
surveys and productivity outcomes across worksites in a large multi-establishment commercial
bank. Bank branches are well suited to an investigation of how workplaces affect employee
attitudes because they are small establishments and the workers do their jobs in sufficiently close
proximity to constitute a genuine workplace. A first set of empirical tests investigates whether
there is a distinctive workplace component to employee attitudes despite the common set of
corporate human resource management practices that cover all the branches.3 Three types of
evidence are presented: (1) a comparison of the distribution of branch-level differences in
attitudes to a simulated distribution of branch-level attitudes that would occur if workers with
1 See Gibbons and Henderson (forthcoming) for a summary of evidence and Haltiwanger (2008).
2 Intra-industry studies that document large productivity differences include Bandiera, Barankay, and
Rasul (2007) in fruit orchards, Bartel, Ichniowski and Shaw (2007) in valve-making, Bloom, Eifert,
McKenzie, Maharaji and Roberts (2009) in Indian textile plants, Griffith and Neely (2009) in a large
distribution firm, Hamilton, Nickerson, and Owan (2003) in textile production, Ichniowski, Shaw and
Prennushi (1997) in steel making, and MacDuffie (1995) in auto assembly. In each study, differences in
human resource management practices help explain the productivity differences. For studies of the impact
of management practices in firms in many industries, see Black and Lynch (2004, 2001), Bloom and Van
Reenen (2007), Bloom, Sadun and Van Reenen (forthcoming), Bresnahan, Brynolfsson and Hitt (2002),
and Cappelli and Neumark (2001). 3 While our focus is on the impact of a workplace on an individual’s attitude towards his job, previous
research on the determinants of individual employees’ reported levels of job satisfaction have considered
the role of individual characteristics such as wages, education, hours worked, gender and race
(Hamermesh, 2001) and business cycles (Clark and Oswald, 1996).

2
different attitudes were hired randomly into branches; (2) tests of the statistical significance of
branch dummy variables for explaining individual attitudes; and (3) an examination of the effects
of tenure on attitudes to see whether the attitudes of newly hired workers converge with pre-
existing attitudes of longer-tenured workers.
A second set of empirical tests then examines the relationship between employee
attitudes and performance outcomes in the branches. These tests address two related questions.
Are differences in sales performance of branches related to the differences in attitudes across
branches? And if they are related, is the relationship between attitudes and performance
independent of other characteristics of the branches that could cause both employee attitudes and
sales performance to vary in a branch? This set of empirical tests includes three kinds of
evidence: (1) cross-section models of the effects of branch-level employee attitude variables on
branch performance; (2) longitudinal models of the effects of changes in employee attitudes on
changes in sales performance that control for omitted branch fixed effects; and (3) estimates of
the effects of attitudes on branch closings.
The two sets of empirical tests that we conduct – the tests of workplace effects on
employee attitudes and the tests of the effects of attitudes on branch productivity – are related.
In particular, the first set of empirical models tests for “workplace effects” in the determination
of employee attitudes by taking advantage of the worker-level observations in employee attitudes
within branches. The second set of models again tests for the importance of “workplace effects”
– specifically, whether any cross-section correlation between employee attitudes can be
explained by fixed branch characteristics that are correlated with both attitudes in the branches
and branch performance.
While we consider a number of different interpretations for the results from each of the
empirical models, the results from all of the models in both sets of tests are consistent with the
3
existence of workplace effects. Results from the first set of tests consistently indicate that there
are significant branch-specific components to employee attitudes. Then, in the second set of
tests, cross-sectional models reveal that branches with positive (negative) employee attitudes are
significantly more likely to have higher (lower) sales performance. This positive relationship
between employee attitudes and branch performance in the cross-section models becomes
insignificant in the longitudinal fixed effects models, consistent with an interpretation that the
observed cross-section relationship between attitudes and performance is due to fixed branch-
specific factors that are omitted from the cross-section models but which determine not just
employee attitudes but sales performance as well.
If unmeasured branch characteristics are in fact responsible for some branches having
both positive (negative) employee attitudes and higher (lower) levels of sales performance, what
might such factors be? Two types of branch-specific factors could be at work – one relating to
the unobservable characteristics of the neighborhood in which the branch operates and the
second relating to the unobserved behaviors of workers and managers inside the branches. We
argue that the second hypothesis is more consistent with the full set of patterns in the data but our
data are not sufficiently rich to identify the specific behaviors of workers and managers that vary
from worksite to worksite that are related to more positive attitudes and higher sales
performance.
In the next section, we explain how this study builds on prior research that has examined
employee attitudes and workplace productivity. Section III describes our data. Section IV
presents empirical tests of the existence of a workplace effect on employee attitudes and Section
V presents results of models analyzing the relationship between attitudes and branch productivity
and branch closings. Section VI concludes.

4
II. Distinctive Attitudes of Workplaces and Their Effects on Performance Outcomes
This study’s empirical investigation of the relationships among workplaces, employee
attitudes, and performance outcomes bridges two different streams of empirical research. First, a
large literature has emerged that analyzes the impact of human resource and other management
practices on productivity outcomes.4 A number of studies from this stream of research find that
innovative HRM practices, and particularly sets of complementary practices, lead to large
increases in plant- and establishment-level productivity outcomes, even within a single industry.5
In the large commercial bank that we study, a common set of human resource policies is
employed for all of its branches. Thus, we are investigating whether there are other workplace-
specific differences related to the attitudes of employees that can help explain performance
outcomes – even among workplaces that share a common set of work practices.
A second stream of research analyzes responses that employees give to attitude or
opinion surveys. For example, a large literature studies employees’ responses to survey
questions aimed at measuring “perceived organizational support” (POS) – an employee’s
perceptions about the employer’s concern for him or her6 – and relates an employee’s POS score
to responses to other survey questions about job satisfaction, commitment to the firm,
perceptions about work practices, or to outcomes like turnover.7 In many cases, these studies are
4 For references, see note 2 supra.
5 Bloom, Eifert, McKenzie, Mahajari and Roberts (2009) provide particularly compelling evidence that
these effects of new management practices are causal. They compare the productivity of textile plants
after a set of new management practices are randomly assigned to only some of the plants and show large
productivity increases only for the plants that instituted the new practices. For recent reviews of the
literature on HRM practices and productivity, see Lazear and Shaw (2007) and Oyer and Schaefer (2011). 6 POS is measured by the Survey of Perceived Organizational Support (see Eisenberger et.al.,1986) or by
subsets of this survey’s questions. 7 For reviews of this literature, see Rhoades and Eisenberger (2002) and Cropanzano and Mitchell (2005).
In some of this literature, the effect of POS on a supervisor’s rating of the employee’s performance is
studied but this is different than studying the effects of attitudes on branch-level performance. Supervisor
evaluations of individual-level performance will not necessarily measure whether one supervisor’s
subordinates are more productive than another’s. More, generally, there are many reasons why unit (or in
our case, branch) performance is not simply the sum of the performance evaluations of employees.

5
at the level of the employee and analyze the relationships among responses of employees to
different kinds of questions in a given survey. In our study, because we have survey responses
from employees in 193 different worksites, we will test whether employees in the same company
who work in different worksites respond differently to the same attitude surveys, and then
whether any such differences can help account for observed differences in performance
outcomes in these worksites.
The prior research generally does not have sufficient data to address the set of research
questions that we consider in this study. Studies of the impacts of management practices on
productivity typically do not measure employee attitudes. Studies of employee responses to
attitude and opinion surveys like studies of employees’ perceptions of organizational support
typically do not identify the specific worksites of employee respondents, or sometimes only
collect data from a single worksite. Still, results from specific studies from these two different
streams of research provide some important evidence about the two basic questions we address
in this study.
One of the earliest studies of the impact of quality of work life (QWL) and employee
involvement practices on productivity incorporated data on the average responses to an employee
job satisfaction question and found that plants in the U.S auto industry that had QWL initiatives
had higher reports of employee job satisfaction and higher productivity (Katz, Kochan, and
Gobeille, 1983). From the POS research, Allen, Shore and Griffeth (2003) find that employees
from a given organization do report very different perceptions about the exact same set of work
practices. Thus, the same work practices can be perceived differently by different employees.
Furthermore, employees with less favorable perceptions of the organization’s work practices also

6
report lower levels of POS and were more likely to quit their jobs within one year of the survey.8
In perhaps the closest comparison from the POS literature to our study, Graafland and Rutten
(2004) examine employee responses to POS survey questions in a sample of 46 Dutch
construction companies. They find a positive and significant correlation between a company’s
average POS score and a measure of the company’s return on capital.9
III. Data
Our study uses the responses to an employee attitude survey for workers employed in the
New York metropolitan area branch offices of a large U.S. bank. The survey was administered
in 1994 and 1996 and is representative of employee opinion surveys that large firms in the
United States use to measure employee sentiment. It asks employees to respond to statements
about their attitudes towards their work environment according to a five-point scale, ranging
from 1 (the least favorable response) to 5 (the most favorable response). Each survey has over
110 questions, with 106 questions in common in the two years. Appendix A gives examples of
several survey questions from each of the six main sections of the survey concerning pride in the
bank, values, work environment, quality, personal responsibility, and satisfaction. Because the
bank closed many branches during this period, the number of branch locations differs in the two
years – 193 branches in 1994 and 143 branches in 1996.
The employee opinion data across the two years contain 3,684 worker-specific surveys.
In 1994, 59 percent of all branch employees, or 2,245 workers, completed the survey; and in
1996, 52 percent of employees, or 1,439 workers, filled out the survey. To maintain
8 This finding also suggests that organizations will develop more and more homogeneous and distinctive
attitudes among their employees. If employees with less favorable attitudes tend to leave the organization,
then the attitudes among remaining employees become more homogeneous (and positive) over time. 9 Although Graafland and Rutten (2004) do not report results from profitability models that control for
company-specific fixed effects, their empirical results consider questions of causality between POS and a
profitability measure by examining how lagged values of one variable affect the other.

7
confidentiality of employees’ responses, the surveys do not report the workers’ identities. Thus,
while any employee with more than two years of tenure could have completed both the 1994 and
1996 surveys, we cannot match workers across the two years and cannot track worker-specific
changes in responses over the two years. However, the survey does report the branch location of
each respondent, so we are able to create branch-level aggregates for the survey responses for
each branch in both years, and therefore can measure changes in branch-level attitude measures
between 1994 and 1996. Finally, the survey asks two questions about characteristics of the
respondents: tenure and occupation. Tenure is reported in a series of categorical responses: one
year or less; more than one but less than two years; between 2 and 5 years; between 5 and 10
years; and more than 10 years. The occupation variables distinguish three grade levels among
officers and four grade levels among staff employees.
IV. Is There A Workplace Effect in Employee Attitudes?
This section analyzes the employee attitude survey data to examine whether different
branches have distinctive employee attitudes. To address this question, we first examine whether
a given employee’s responses to 106 different survey items can be summarized meaningfully in a
more parsimonious index. Second, we examine whether the distribution of branches’ average
responses is more varied than what could be attributable to sampling variability alone by
comparing the actual distribution of average branch responses to a simulated distribution of
average branch responses had employees with different attitudes been assigned to branches
randomly. Third, we test whether branch locations are significant determinants of employees’
responses to the attitude surveys and compare the extent to which branch identifiers and worker
identifiers account for variation in the employee attitudes. Finally, we analyze how attitudes
8
vary with employees’ tenure, and in particular examine whether the attitudes of newly hired
workers converge with the pre-existing attitudes of longer-tenured employees.
A. Summarizing the Employees’ Responses: The Employee Attitude Index
We first examine whether the survey responses from the individual employees can be
fruitfully grouped into a summary indicator of a given employee’s overall view of the workplace.
Does knowing how an employee answers one question help predict how he or she will answer
others, so that a summary index number for the 106 items in a survey provides a good indicator
of most responses? Or is there considerable variation across questions in how an employee
responds?
Several statistical tests reveal a high level of consistency in survey responses across
questions for a given employee. First, the correlation between the responses to any pair of
questions is positive and significant. With 106 survey items, there are 5,565 bivariate
correlations. In 1994, 97.5 percent of these correlations are positive and significant at the .0001-
level and 99.6 percent are positive and significant at the .10-level. In the 1996 survey, 94.3
percent and 99.2 percent of the correlations are positive and significant at the .0001-level and
.10-level, respectively. Second, a factor analysis of the responses to the two surveys reveals that,
in both years, the first factor accounts for 50 percent of the proportion of the overall variation in
employee responses and the ratio of the first to second eigenvalues is over seven times the ratio
of the second to third eigenvalues—sufficient for a conclusion of unidimensionality in responses
(Lord, 1980).10
Finally, we computed Cronbach’s alpha to measure the consistency of responses
10
As one illustration of the unidimensionality in survey responses across survey items, and consistent
with the high degree of correlation among any pair of items, 98 of the 106 questions have their largest
factor loading on the first factor.

9
to the different survey items. Cronbach’s alpha equals 0.98 in both 1994 and 1996, which also
indicates that individuals reported consistently across the 106 items.11
Given these patterns, we use the average value of the 106 items as a simple summary
index of an employee’s attitudes and refer to this statistic as his overall “employee attitude
index” (EAI). The worker-level EAI variable has a mean value of 3.71 with a standard deviation
of 0.28 in 1994, and a mean value of 3.74 with a standard deviation of 0.29 in 1996.
While the preceding tests reveal strong correlations among the responses from any given
employee, we now turn to the central question of this section. If one employee in a branch has a
relatively high (low) EAI, are other employees in the same branch also more likely to have
relatively favorable (unfavorable) attitudes? This question is central to this study because it
ultimately asks if there is a distinct “workplace effect” to employee attitudes.
B. Is the “Branch Effect” in Employee Attitudes Due to Sampling Variability?
Figure 1 shows the distribution of the branches’ mean values of the EAI index as a
shaded distribution. The distribution has a strong central tendency. The mean of this
distribution of branch-specific averages of the EAI variable is 3.72 with a standard deviation of
0.285. While Figure 1 does show that different branches have different average values of EAI,
one would not expect the average value of the EAI variable across employees in a branch to be
identical across all branches even if there were no causal mechanisms inside the branches that
produced more and less favorable attitude responses for their employees. As long as some job
applicants are innately more positive than others, some branches would hire more positive
individuals just by chance and would end up with higher average EAI values. Branches would
still have distinctive employee attitudes.
11
We also calculated the average responses within the six subsections of the surveys, as well as the mean
response of employee responses to questions that referred to specific human resource management
practices, such as the mean response to questions that mention compensation or teamwork or
communication and so on. As the results in the text would suggest, the means for different subsets of
questions are all very highly correlated with each other.

10
The effect of sampling variability on the average value of EAI across different branches
would not be an especially convincing explanation for any cross-branch differences if branches
all had large numbers of workers. However, the potential impact of sampling variability is of
particular concern in this setting because of the relatively small number of employees in many of
the bank’s branches. Because the branches are small and only about one-half of a branch’s
employees responded to the survey, the average number of respondents is just 12 employees per
branch. Thus, the distribution of the branch-level EAI measure could be substantially affected by
sampling variability. If the observed distribution of branch averages in Figure 1 can be attributed
to branches randomly hiring workers with different attitudes, it would be erroneous to view
differences among branches as reflecting any causal effect of workplace conditions or policies on
employee attitudes.
To test how important sampling variability is in generating the differences in the
branches’ average EAI values, we calculated a “null distribution” of branch-level workplace
attitudes under the assumption that branches draw workers randomly with replacement from the
distribution of attitudes across all respondents in all branches of the bank.12
Specifically, we
randomly assigned workers to a branch and then calculated a new branch average for the null
distribution. Consider, for example, a branch with 10 worker respondents. Using a random
number procedure, we drew 10 observations from the firm-wide distribution of employee-
specific values of EAI. This simulated ten-respondent branch thus has employee attitudes that
would occur had the branch randomly selected its employees from a pool of workers that had the
same distribution of attitudes as the distribution of attitudes among all of the respondents to the
survey. We then assigned this simulated branch the average EAI score from those 10 randomly
drawn observations. Similarly, for a branch that had 8 respondents, we drew 8 observations
12
Assuming the branches draw samples with replacement implicitly assumes that the bank faces a larger
population of potential employees with the same distribution of attitudes as its current employees.

11
randomly from the underlying firm-level distribution and then calculated its average EAI. Doing
this calculation for all of the branches in the sample gives us a “simulated distribution” of mean
branch attitudes.
The crosshatched histogram in Figure 1 shows this simulated distribution of average
branch EAI scores.13
Differences between the actual distribution of average EAI scores in the
branches and the simulated distribution are indicative of workplace effects on attitudes. The
figure shows that the actual distribution of branch average EAI scores is more dispersed than the
null distribution for simulated branches. The actual distribution’s standard deviation of 0.285 is
markedly larger than the simulated distribution’s standard deviation of 0.184. A Kolmogorov-
Smirnov test shows that the two distributions are significantly different from each other with p-
value=0.001. That there are more branches with either high or low values of the employee
attitude index in the actual distribution than in the simulated distribution shows that there are
branch effects to attitude survey responses that cannot be attributed to random sorting of workers
with different innate attitudes. This suggests that the different levels of employee attitudes across
branches cannot be attributed just to chance.14
13
Consistent with how we created the histogram for the actual distribution of branch averages for the EAI
statistic, we pooled the numbers reporting in each year for the 143 branches for which we had
observations in 1994 and in 1996. Thus, we treat the branch as having more reports on its average
attitude over the two years than for a single year (i.e., if a branch had 7 people reporting in one year and 8
in the second year, we treated it as having 15 reports on attitudes). This assumption should minimize the
difference between the actual and simulated branch average EAIs. For the remaining 50 branches, we
used data from 1994. 14
Another possible explanation for differences in the average values of EAI across branches is that
different branches are comprised of workers with different characteristics, and certain worker
characteristics might be associated with more or less favorable attitudes. While we have only limited
information on employee characteristics, we did estimate a branch-level regression of average age of
employees, tenure distribution and the grade-level distribution on the branch’s EAI, and used the residuals
from that equation to plot the distribution of average values of EAI for the branches. (The estimates of the
regression are shown in Appendix Table B.) The distribution of branch averages for the EAI index is
virtually identical to the actual distribution of the average EAI scores for the branches. The standard
deviation for the distribution based on the regression residuals is .24 which is only slightly lower than the
standard deviation of the actual distribution (.28), which suggests that EAI is only modestly impacted by
the observable personal characteristics of the individuals in the branch. Still, it could be the case that
unmeasured differences in employee characteristics beyond the age, tenure, and grade variables that we
12
C. ANOVA Tests of Branch Effects on Employee Attitudes
Figure 1 shows substantial cross-branch variation in the employees’ attitudes that is
greater than what would occur simply because of sampling variability in hiring. A related
question is whether branches are significant determinants of the variation in attitudes. To
address this question, we conduct an analysis of variance (ANOVA). In particular, with attitude
surveys from two time periods in which multiple respondents answer multiple questions on each
survey, we estimate the following ANOVA model:
(1) OBSijqt = INDIVIDUALi + QUESTIONq + BRANCHj + YEARt + eijqt
where OBSijqt is the response from the opinion survey for the ith individual in the jth branch to
the qth question in year t. This equation compares how much of the variation in employee
responses to the various items in the survey can be attributed to each of the following main
effects: an individual effect, a question effect, a branch effect, and a year effect. The error term
eijqt captures all omitted interactions among these main effects. We also expand equation (1) in
two ways. First, we add characteristics of individual workers available on the survey—their
grade in the company occupational hierarchy and their years of tenure at the branch. Second, we
examine interaction effects between the main factors—for instance, branch x question effects.
A limitation of the ANOVA is that the survey data do not identify workers to preserve
confidentiality of responses, and thus we cannot identify which survey responses in 1994 and
1996 come from the same employee. Because of this inability to identify workers across years,
we treat each worker survey in 1994 and 1996 as coming from completely separate sets of
individuals. This method of measuring “person effects” introduces a larger number of worker
variables than actually exists, which in turn will magnify the relative importance of these person
can include in the original regression could be responsible for differences in survey responses across
branches.

13
effects.15
Given this definition of the worker dummy variables, ANOVA estimates the
proportion of the variation in the dependent variable in equation (1) that is accounted for by the
vector of worker dummy variables relative to the proportions of variation accounted for by other
factors in the model such as the branch dummy variables.
Panel A of Table 1 reports the results of the ANOVA analysis using the 106 common
questions on the employee attitude survey from the two years. Most important for this study,
these results show that the main branch effect is highly significant. While the total sum of
squares accounted for by the branch variables is less than the total sum of squares accounted for
by the person variables, the mean squares and F-statistic for the branch effects are larger than
they are for the person effects due to the much smaller number of branches relative to workers.
The results in Panel A of Table 1 also show that the second largest contributor to the sum of
squares is variation in responses among questions. Grade contributes to the variation because
workers in officer positions in the bank have more positive attitudes than other employees, while
tenure contributes because workers with greater tenure at the branch have slightly less favorable
attitudes than those with less experience. 16
Finally, the interaction of branch with question is
modest, while the interaction of branch and year is more significant. Despite the importance of
the effects of these other factors, the results confirm that different workplaces have distinctive
employee attitudes and thus provide further evidence that workplaces are important in the
determination of measures of employees’ attitudes.17
15
It is very likely that many workers responded to the survey in both years. By treating those persons as
separate people, the number of “worker variables” included in the ANOVA model is much larger than the
actual number of employees. 16
A regression of the EAI of an individual on a dummy for whether they were a bank officer or not and
the variables measuring employee tenure in a pooled data set for 1994 and 1996 reveals a positive
significant effect of the officer variable and significant negative effects of greater tenure. 17
For comparison with these ANOVA results, we also estimated two regressions – one in which
responses to the survey questions are a function of employee tenure, grade, question dummies, year
dummies, and person dummies, and a second regression in which branch dummies replace the person
dummies. Consistent with the ANOVA results in panel A of Table 1, the F-statistic for the significance

14
HLM Tests of Branch Effects in Attitudes. The ANOVA model is a fixed effects model,
appropriate for assessing variation in employee attitudes among actual branches in the bank. The
question therefore arises as to whether we can generalize from the observed branches to a wider
population of branches. To examine this, we augment the fixed effects ANOVA with a random
effects model, using a hierarchical linear model (HLM) (Bryk and Raudenbush, 1992). Focusing
on our summary measure of worker attitudes (EAIi), we estimated the following HLM model:
(2) EAIij = BRANCH0j + eij as the individual or level-one equation for person i in branch j
(3) BRANCH0j = intercept + u0j as the branch-level equation, with u0j as the random
effects for the branch.
Substituting equation (3) into equation (2), we obtain
(4) EAIij = BRANCH0j + eij + intercept + u0j as the HLM equation.
This is a random effects ANOVA that differs from the fixed effects ANOVA in Panel A
because it assumes that the branch effects are drawn randomly from some broader population.18
The virtue of this model is that it allows us to make inferences to the broader population, where
there is greater variation in possible branch effects, rather than limiting inferences to the
observed sample. The results of the HLM/random effects model are shown in Panel B of Table 1.
Most important for this study, as in Panel A, the branch effects are again highly significant.
Expanding on the HLM /random effects ANOVA model in Table 1, we also estimated HLM
models with covariates such as grade and tenure, and obtained similar results.19
We conclude
that, regardless of the statistical model, the data show that there are substantial branch-specific
differences in employees’ responses to the attitude survey questions.
of the branch dummies in the second model is substantially larger than the F-statistic for the significance
of the person dummies in the first model (111.42 vs. 50.02). 18
In the ANOVA in Table 1, we included covariates other than branches as factors, so the statement
about equation (4) is true for an ANOVA with just branches as factors, but it generalizes to other cases. 19
The Z statistic for the branch-level random effect in our model with grade and tenure covariates was
8.81, which is highly significant.
15
D. Branch Attitudes over Time
A further test of the existence of causal mechanisms within the branch that produce more
and less favorable attitudes is whether branch attitudes persist over time. If branches’ work
practices and organizational routines are reasonably stable over time, then one would expect
there to be a positive serial correlation in the attitude measure across years, especially in closely
contiguous years. As long as the workplace practices, routines and personnel that one presumes
are the factors that might cause differences in attitudes are relatively stable over the 1994-1996
period, then the workplace attitude should persist over this time period as well.20
The correlation between the average value of the EAI index for a branch in 1994 and the
average value of EAI in 1996 for the 143 branches that exist in both 1994 and 1996 is positive
(0.34) and highly significant. Part of this positive significant correlation is certainly due to the
branch having the same (happy or unhappy) employees in the two years. However, the response
rates to the opinion survey in 1994 and 1996 of 59 percent and 52 percent, respectively, imply
that a large number of respondents in the two years are different workers. To get an estimate of a
lower bound on the number of employees who completed surveys in only one year, we combine
the data on the numbers of respondents per branch in the two years with information on the
number of respondents whose branch tenure was less than two years in 1996. First, if the number
of respondents in a branch in 1994 exceeds the number of respondents in 1996, then the
additional respondents in 1994 can only be one-time responders. Second, employees who report
less than two years of tenure in the 1996 survey can also only be one-time respondents. And
third, we identify branches where the number of 1996 respondents with more than two years of
20
We recognize that branches could have distinct workplace attitudes that change substantially over time
(for example, if a branch manager who established good relations with workers was replaced by one who
established bad relations, attitudes would be inversely correlated over time). But if these kinds of changes
that could affect employee attitudes within branches are relatively rare over the 1994 to 1996 period, and
if branch effects on attitudes do in fact exist, one would expect a positive significant correlation in the
branch-level EAI variable over the two years.

16
tenure is greater than the number of respondents in the same branch in 1994. The additional
number of 1996 respondents in this calculation comprises another group of one-time
respondents. Based on these calculations, we estimate a lower bound for the percent of
respondents who respond to only one of the two surveys to be 41%. Since this is a lower bound
estimate, it is safe to conclude that a sizable portion of the correlation between the average value
of EAI in a branch in 1994 and 1996 is due to more than just having the same employees fill out
the survey in both years.21
A more direct way to make this point would be to eliminate workers from the sample
who filled out the surveys in both years, calculate the branch-level EAI variable for 1994 and
1996 just using surveys from employees who completed a survey in only one year, and then
calculate the correlation among these branch-level attitude measures. While the absence of
employee identifiers precludes such a test, research on test-retest reliability measures of the
satisfaction and attitudes of a worker on the same job in two years offers some suggestive
evidence on this question. Test-retest reliability measures of job satisfaction on the same job are
on the order of 0.80 (Van Sanne, Sluiter, Verbeek, Frings-Dresen, 2003, Table 3). Studies of the
attitudes of workers at two periods of time suggest that correlations of attitudes for the same
worker over time are on the order of 0.50 to 0.70.22
Assuming that the responses of the workers
at the bank branches that may have been included in both surveys had correlations in their EAI
scores of these magnitudes, we estimate that the within-branch over-time correlation in EAI just
21
While these calculations ignore the cases where a given worker who moved between branches
completed a survey in both years, the calculations here are designed to be a simple illustration that at least
part of the pattern in which a branch with a favorable (unfavorable) attitude in 1994 is also more likely to
have a favorable (unfavorable) attitude in 1996 is due to something more than just having the same
workers filling out the survey in the two years. 22
Rode (2004) estimates a correlation of 0.49 for job satisfaction for persons in the first and second
waves of the Americans’ Changing Lives survey, where the waves were three years apart. Bowling, Beehr
and Lepisto (2006) report a correlation of 0.53 on job satisfaction for respondents in the Adult
Longitudinal Panel report and correlations ranging from 0.58 to 0.68 for measures of organizational
commitment, job involvement, career commitment and career satisfaction. Cote and Morgan (2002)
report a correlation of 0.48 for a sample of 111 workers at two points in time separated by four weeks.

17
among the employees who answered the survey in one year ranges from 0.19 to 0.28 (see
Appendix C). These correlations are significant in our data. Therefore, this analysis that
attempts to eliminate any persistent person effect on the average EAI in a branch again supports
a conclusion that there are branch effects on employee attitudes that are persistent over time.
E. The Effect of Pre-Existing Branch Attitudes on the Attitudes of New Employees
While the data do not report the identities of the employees who filled out the surveys in
the different years, we can use the tenure variable in the attitude survey to identify those workers
in 1996 whose reported tenure precludes them from completing the 1994 survey, and use data on
these “new workers” to conduct a particularly strong and direct test of the effects of pre-existing
“branch attitudes” on the attitudes of individual employees. In particular, we now ask: when a
new employee joins the branch, does his or her attitude conform to the attitudes of the existing
workers? We examine the effect of the 1994 branch-level EAI variable on the attitudes of both
new and continuing employees in the branch in 1996. Assuming that new workers have no
particular bias in their attitudes prior to joining a branch, any correlation between their attitudes
in 1996 and the attitudes of existing workers at their branch in 1994 can be viewed as a reflection
of the impact of the existing workplace-level attitude on the new employees.
To test whether attitudes of new employees resemble the pre-existing employee attitudes
of the longer tenured employees in their new branch, we regress the EAI of individual employees
in 1996 on the mean level of the EAI in their branch in 1994, with dummy variables for whether
the respondent had less than two years of tenure (and thus joined the bank after the 1994 survey
was completed), and an interaction term between that dummy and the mean level of EAI in the
branch in which the individual worked. Column 1 of Table 2 reports results from this model.
The regression coefficient on the 1994 branch-level EAI in column 1 shows that it has a
substantial impact on the 1996 attitudes of workers, due presumably to the persistence of
18
workplace conditions and the persistence of worker attitudes among employees. The coefficient
on the dummy variable for new entrants is not statistically significant, and neither is the
coefficient on the interaction term that picks up any differential effect of the 1994 branch EAI on
the 1996 attitudes of the new employees. The implication is that workers who joined the branch
after the 1994 survey was completed tend to have attitudes in 1996 that are similar to the average
1994 value of EAI in the branch. The attitude of a new employee is similar to the preexisting
positive or negative attitudes in his or her branch.
Columns 2(a)-(b) and 3(a)-(c) probe this result further with separate regressions for
subsamples of workers with different amounts of tenure in 1996. First, the results in column 2(a)
and column 2(b) compare the effects of the branch EAI variable in separate regressions for the
samples of workers who have more than two years of tenure (in column 2a) and less than two
years of tenure (in column 2b). In these regressions, the coefficients on the 1994 branch-level
EAI variable for the newly hired workers and for the more tenured workers are very similar in
magnitude and a t-test shows that the hypothesis of the equality of the coefficients on 1994
branch-level EAI in columns (2a) and (2b) cannot be rejected (Prob>F = 0.966).
Because the subsample of workers in the column (2a) model were members of the branch
in the 1994 period while the workers included in the column (2b) model were not, the meaning
of the effect of the 1994 branch-level EAI variable on 1996 individual-level attitudes is
somewhat different across these two models. For the more senior workers in the column 2(a)
model, the effect of 1994 branch-level EAI indicates some regression-to-the-mean in attitudes
over the two year period. Workers in branches that had relatively high (low) attitude scores in
1994 again tend to have high (low) scores in 1996 (since the coefficient on the 1994 branch-level
EAI variable is positive and significant), but the attitudinal differences of the more senior
employees across branches diminishes somewhat over the two years (since the coefficient on the

19
1994 branch-level EAI variable is less than unity). For the more recently hired workers in the
column 2(b) model, the effect of the 1994 branch-level EAI variable indicates that within two
years of being hired, new employees’ attitudes resemble the attitudes of the longer tenured
employees in the branch. If branch employees with less than two years of tenure actually had
“average attitudes” similar to the mean value of EAI across all branches, there would have been
no effect of the 1994 branch-level EAI variable on the individual-level EAI scores of new
employees in the column 2(b) model. Instead, the effect of the 1994 branch-level EAI variable is
positive, indicating that the group of low-tenure employees that take jobs in a branch with
relatively favorable (unfavorable) attitudes also tend to have favorable (unfavorable) attitudes.
Two types of explanations could account for the effect of the 1994 branch-level EAI
variable on attitudes of new employees. First, new workers do not enter their branches with
attitudes matching those already working in a branch. Instead, attitudes of new workers in any
branch are initially no different from the average attitudes one observes across all of the bank’s
employees. Then, over the first two years of work in the branch, the attitudes of the group of
new hires come to resemble the positive or negative attitudes that already existed in their
branches. Conversely, the labor markets that supply new workers to different branches may
differ. Local markets in branches with more negative (positive) attitudes are populated with job
candidates whose attitudes match those already in the branch as soon as they start their jobs.
The models in columns 3(a)-(c) of Table 2 offer evidence on these competing
explanations. Each column presents the coefficient on the 1994 branch-level EAI variable from
a separate regression. Column 3(a) replicates the results in the column 2(a) model for workers
with more than two years of tenure, while columns 3(b) and (c) separate the group of workers
with less than two years of tenure into two further subsamples: workers with less than 1 year of

20
tenure (in column 3b) and workers with 1 to 2 years of tenure (in column 3c).23
The pre-existing
1994 attitudes in the branch have no effect on the attitudes of the brand new hires (column 3b).
Rather, the impact of the 1994 branch-level EAI is concentrated solely among the group of
workers in their second year of service (column 3c). These results are consistent with an
interpretation that new hires do not enter the branch right away with the same positive or
negative attitudes already observed among the longer tenured employees in their branches, but
instead have attitudes that, after they are hired, come to resemble the pre-existing attitudes.24
Two different mechanisms can explain why, as their tenure increases, the attitudes of
newly hired employees come to resemble the attitudes of employees already in the branch. First,
relationships among co-workers or between branch managers and other employees may be more
or less cooperative, which in turn changes the attitudes of the new employees over their first two
years. Conversely, employees whose initial attitudes did not match the pre-existing attitudes of
employees in the branch might quit. In this case, the attitudes of any new employee would not
change, but the selectivity of who stays and leaves the branch after the first year of service is the
mechanism that explains how the attitudes of new employees come to resemble the attitudes of
the longer tenured employees. While we suspect that both kinds of mechanisms may be at
work,25
either mechanism would still be consistent with the effects of a branch-specific factor
that determines the attitudes of employees who remain in the branch.
23
As noted in Section III, the tenure variable is not reported as a continuous variable but as a set of five
categorical variables which includes a category for 0-1 years and a category for 1-2 years. 24
If we estimate three separate regressions for subgroups of employees with 2-5 years of tenure, 5-10
years, and > 10 years instead of the single regression shown in column 3(a), the coefficients on the 1994
EAI variable in all three models are positive and significant and one cannot reject the hypothesis that all
three coefficients are equal. Also, we note of course that the results in Table 2 pertain to the effects of a
tenure variable among a cross-section sample of workers in 1996. A different test not possible with the
available data would be to follow a given cohort of workers, and track the longitudinal changes of this
cohort’s attitudes over their first few years of service. 25
Allen, Shore and Griffeth (2003) find that employees who report less favorable perceptions of the
organization’s work practices and lower perceived levels of organizational support in employee opinion
surveys are more likely to quit their jobs within one year of the survey. If this type of turnover behavior

21
These results also lend support to the importance of peer effects in the workplace.
Recent studies find that high productivity workers increase the productivity of co-workers (Mas
and Moretti, 2009; Azoulay, Zivin and Wang, 2010) and also have beneficial effects on the
absenteeism of co-workers (Ichino and Maggi, 2000). Here we find peer effects in how attitudes
about the workplace are formed, with new employees either taking on the favorable or
unfavorable attitudes of their longer-tenured co-workers or leaving the branch when their
attitudes do not match those of their peers.
V. Workplace Attitudes and Performance Outcomes of Branches
A. Performance Measures in Retail Banking
The previous section presents evidence of a genuine branch effect on employee attitudes.
Differences in the branch-level measures of employee attitudes are too large to be explained by
chance alone. Differences in EAI scores across branches are highly significant. Moreover, the
attitudes of new employees come to resemble the favorable or unfavorable attitudes of their
longer-tenured co-workers. In this section we consider whether differences in employee attitudes
can also help explain differences in the performance of the branches. To answer this question we
relate our branch-level EAI variable to three performance outcomes of the branches: net sales,
growth of net sales, and branch closings. Importantly, we estimate fixed effects performance
models that explicitly test for whether attitude variables affect performance outcomes after
controlling for any branch-level fixed-effects that may cause systematic differences in attitudes
and performance. Because the empirical results of the previous section consistently find evidence
of branch-specific effects on employee attitudes, these fixed effects performance models will be
occurred in all branches in our study’s sample, it would help account for increasing homogeneity of
attitudes of employees who join branches with positive attitudes, but would run counter to the pattern we
observe between tenure and attitudes in branches that have more negative attitudes in the initial period.
22
important for seeing whether any observed cross-sectional correlation between attitudes in the
branch and performance outcomes are independent of the impacts of any branch fixed effects.
According to branch managers, net sales is an especially important measure of a branch’s
financial performance.26
The largest component of a branch’s income is its “spread” income.
Each financial product that a branch offers has a certain spread factor that equals the profit
margin on the product. Spread income is the product of this spread factor and the total value of
the sales of the product. While the spread factors will vary across different deposit or loan
products, total spread income will be higher when total deposits and loans are higher. The sum
of the branch’s deposits and loans—referred to as a branch’s “footings”—is reported on the
branch’s balance sheet. Because growth in footings on a branch’s balance sheet translates into
more spread income,27
the bank evaluates branches on growth in balance sheet footings. We
therefore use the annual growth in this measure—the change in deposit and loans on a branch’s
balance sheet from the beginning to the end of the year—as the chief indicator of branch
financial performance in that year. This annual net sales variable varies considerably in the
sample. In 1994, deposits and loans in a branch grew at an average rate of 5.8 percent across all
branches. It ranged from −.33 to .53 with a standard deviation of .08 in 1994. The data show
similar variation in 1996.28
26
Studies of bank productivity indicate that a “production approach” is preferable for studying the relative
efficiency of branches within a given bank. Berger and Humphrey (1992) compare the production
approach for measuring bank efficiency with methods such as the asset or user cost approaches. 27
Branches also derive income from liability fees such as fees from stop payments, bounced checks, low
balances, wire transfers, etc.; asset fees from loan applications, loan processing, late payments;
transaction fees for travelers’ checks, safe deposit boxes, ATM transactions; and brokerage commissions. 28
The net sales measure does not deduct branch expenses from sales. Managers reported that many
branch expenses are tied to customer activity at the branches regardless of where the account was opened
and housed. If we subtracted expenses from sales, we would penalize branches that were busy service
centers that process large numbers of transactions on previously opened accounts. The branch closings
created an additional problem in 1996 because accounts of closed branches were assigned to a nearby
branch that remained open. Over time, some of these transferred accounts, called “rollups,” migrated to
other branches. We dealt with this issue in two ways: by excluding accounts from the rollups and by
including rollups as part of the dependent variable but with an independent variable for the level of

23
Because the branches in the sample operate in different parts of the New York
metropolitan area, the characteristics of the local population and business activity are also likely
to affect branch performance. Accordingly, we obtained data on the following characteristics of
the zip code in which a branch is located: population, number of households, per capita income,
average household wealth, number of owner-occupied households, median value of housing,
median years of schooling, the unemployment rate, number of employees in all establishments,
and total sales of all establishments.29
The variables measuring the 1994 and 1996 sales in each
branch come from the bank’s own financial reporting system, while the bank’s personnel files
provide data on the average age of branch employees and total number of employees for each
branch.30
In addition, we used information on employees’ tenure and their “grade” level (which
corresponds roughly to occupations) from the employee attitude survey, which we also use as
controls in the performance equations. Appendix D reports means and standard deviations for the
demographic characteristics of the branches’ zip code areas and for the characteristics of the
branches’ workforces in 1994.
B. Cross-Section Estimates
To examine the relationship between branches’ employee attitudes and the net sales
measure of performance, we first estimate the following cross-section branch-level net sales
equation:
(5) Ln (Net Sales)bt = a + b1Lbt + b2EAIbt + b3Xbt + ubt,
rollups on the right-hand side of the net sales equations. The coefficient on the originally rolled-up
footings would be less than one if these accounts drift to other branches over time. The two analyses gave
similar results; we report those obtained by excluding rollups. 29
These zip-code specific variables are from the Claritas data service for the bank and are derived from
the 1995 census establishment survey and have no time variation. 30
These two variables are calculated from bank personnel records and are available for both 1994 and
1996. Since the survey does not include employee identification numbers, data from personnel records on
the age of employees still cannot be linked directly to attitude survey responses of individual employees.
This explains why employee age was not included in the ANOVA model in Part IV.

24
where Lbt is the number of employees in the branch in time period t, EAIbt is the branch-level
employee attitude index in time period t, and the vector Xbt includes covariates measuring
characteristics of each branch, its workforce, and its market.
Column (1) of Table 3 records the coefficient on the branch-specific EAI index in a least
squares estimate of equation (5) for the 193 branches in 1994. The estimate shows that
workplaces with more positive employee attitudes are associated with higher sales during the year
on the order of 5 percent. A one standard deviation increase in the EAI variable (0.28 units) is
associated with an increase in net sales of about 1.4 percentage points (or roughly 24 percent of
the mean level of net sales in 1994 and 17 percent of the standard deviation of net sales). Column
(2) of the table records the coefficient on the branch-specific EAI index for the 143 branches in
existence in 1996. The estimated coefficient on the 1996 branch-level EAI is modestly higher
than that in 1994 (0.061) but not statistically different from the EAI coefficient in the 1994 model.
The results of these cross-sectional net sales equations reveal that branches with
favorable employee attitudes have higher net sales. There are two broad classes of explanations
that can account for these cross-sectional patterns. First, the partial correlation between the
branch-level EAI measure and net sales may reflect a causal mechanism between better employee
attitudes and sales performance. Whenever attitudes become more positive, employees will more
likely be selling more financial products and earning more income for the bank. This relationship
will exist for any improvements in employee attitudes, regardless of the cause.
Conversely, this partial correlation may reflect an omitted branch-specific effect that
causes both attitudes and net sales to be high. This explanation may be especially compelling in
light of the empirical results of the previous section that documented a significant and persistent
branch-specific effect in employee attitudes. If the same workplace-specific factors and dynamics
that lead to more positive attitudes in some branches also promote good sales behaviors in those

25
branches, then the positive partial correlation between the branch-level EAI measure and net sales
in the cross-section equations of columns (1) and (2) of Table 3 would reflect the effect of these
branch-level factors. Under this explanation where the same “workplace effects” that produce
distinctive attitudes in the branches also affect the sales in the branch, one would predict that the
coefficient on the EAI measure that was significant in the columns (1) and (2) cross-section sales
models would become insignificant in models that control for such branch-specific effects as long
as those omitted branch-specific factors tend to be unchanged over the 1994-1996 period.
C. Longitudinal Fixed Effects Estimates
Since data are available on employee attitudes and sales performance in two periods of
time, we can estimate a fixed effects net sales model that eliminates the effects of time-invariant
branch-level factors. In particular, if ubt = θb + εbt in the equation (5) cross-section model, where
θb is the unmeasured branch fixed effect and εbt is the random error term, and θb is also
correlated with EAIbt in equation (5), then the estimated effect of the EAI attitude variable in
cross-section sales regressions will be biased. Because the evidence in section IV already
documents strong branch effects on employee attitudes that persist over the two time periods,
this interpretation is of particular interest. Differencing the 1996 cross-section net sales equation
from the 1994 cross-section net sales equation eliminates the influence of any branch-specific
fixed effects that might determine the levels of both EAI and net sales, and yields:
(6) Ln (Net Sales)bt1 - Ln (Net Sales)bt0 = a +b1(Lbt1 – Lbt0) + b2(EAIbt1 – EAIbt0) +
b3(Xbt1 – Xbt0) + εbt1 – εbt0

26
θb, the branch fixed effect, is differenced out. In the fixed effects model, the dependent variable
is the change between the 1994 and 1996 net sales figures and the key independent variable is
the change in the branch-level EAI variable between 1994 and 1996.31
The results obtained from estimating the equation (6) model are reported in column (3) of
Table 3. The coefficient on the variable measuring the change in EAI in this model is
insignificant.32
The column (4) model includes a control for the 1994 level of net sales under the
hypothesis that there could be regression to the mean level of sales. The coefficient on the
change in EAI variable is again insignificant. The results of this two-period fixed effects model
of the effect of changes in EAI on changes in net sales cannot entirely rule out the idea of a
causal effect of attitudes on sales performance. For example, the positive significant relationship
between EAI and net sales in the columns (1) and (2) cross-section models could reflect a real
causal effect of attitudes on sales, while the effect of the EAI variable in the column (3) fixed
effect model could be biased toward zero due to an increased importance of errors in measuring
the variables in the first-difference models.33
Still, the drop in the significance of the coefficient on EAI between the cross-section
models in columns (1) and (2) and the fixed effects models in columns (3) and (4) is also
31
The change in net sales over the two periods exhibits substantial variation. The mean growth in net
sales for the 143 branches is .095, with a standard deviation of .116. The range is from -.475 to .493. The
change in EAI also exhibits considerable variation. It ranges from -.918 to .895 with a standard deviation
of 0.325. 32
We also estimated all the models in Table 3 using the first factor from the factor analysis in place of
EAI. The results are the same, with the first factor significant in both cross sections but insignificant in
the fixed effect models. 33
Increased importance of measurement error in first-difference models relative to cross-section models
tends to bias coefficient estimates in first-difference models toward zero. Longer time series of data,
especially for periods without branch closings, would offer richer longitudinal tests of causality in the
EAI–net sales relationship, but we lack such data. As reported in note 31 supra, we do observe
considerable variation in the change in EAI measure over this period, though the mean change in EAI
between 1994 and 1996 is only 0.02. This pattern could be consistent with a high noise to signal ratio.
Also, it is important to remember that the bank closed 50 branches between 1994 and 1996, and so we
cannot track the changes in EAI and performance for all 193 branches in the sample. If the bank closed
branches whose performance and attitudes were both likely to deteriorate, the loss of the 50 branches
would bias the estimated coefficient on the change in EAI variable toward zero.

27
consistent with an interpretation that the cross-section relation between workplace attitudes and
performance reflects the effect of some omitted workplace factor that affects both employee
attitudes and performance. Under this interpretation, only certain kinds of changes in branch-
level attitudes would impact sales performance. In particular, if we were able to observe these
branches over a longer period of time in which the omitted branch factors actually changed, then
these changes in the omitted factors would generate changes in both employee attitudes and net
sales. However, because these factors are fixed over the two-year period in our sample, we do
not observe these particular kinds of changes in attitudes that do affect sales. What the evidence
does show is that those changes in employee attitudes that are independent of the effects of
omitted branch-specific fixed factors do not produce changes in performance.
This conclusion is especially interesting when coupled with the findings in Section IV of
a significant branch-specific component to employee attitudes which is not explained by
sampling variability and which persists over time even after new employees are hired into the
branches. Together the results in Section IV and those in Table 3 are all consistent with an
interpretation that branch-specific factors are important in the determination of both employee
attitudes and economic performance. Moreover, not only are the effects of these branch-specific
factors beneficial for both employees (more favorable attitudes about the workplace) and the
company (higher sales performance), but these effects exist even within a single company that
uses a consistent set of HRM policies for all of its branches.
What might this omitted branch-specific factor be? One hypothesis is that the omitted
factor reflects unmeasured attributes of the branch’s local market. Under this explanation, the
innate attitudes of the employees hired by branches in poor or declining neighborhoods where
branch performance is also declining are simply less favorable than the innate attitudes of
employees hired by branches in richer neighborhoods that have better performing branches.

28
Conversely, the omitted factor could reflect unmeasured attributes of activities and dynamics of
the branches’ internal operations.
While we do not have direct information on additional branch-specific factors, two
aspects of the preceding analyses seem to favor the latter explanation. First, recall that we define
a branch’s local market based on the zip code in which the branch is located. Since the bank
operates in a very densely populated metropolitan area, zip codes correspond to neighborhoods
that typically span only twenty or thirty city blocks. Hence, the zip-code level variables that we
include in the cross-section models are fairly precise controls for the commercial activity in the
neighborhood as well as the economic and personal attributes of the local residents and workers.
Second, also recall that the analysis of the determinants of individual employee attitudes reported
in columns 3(a)-3(c) of Table 2 above showed that newly hired employees with less than one
year of tenure in their branches do not have attitudes that mimic the attitudes of employees
already working in their branch.34
Thus, the omitted branch-specific factor does not impact the
innate attitudes of the employees at the time they enter their branches. Rather, the effect of pre-
existing branch-level values of EAI on individual worker EAI is first observed for employees
with more than one year of tenure in their branch. While we must remain guarded about the
conclusion because the data do not include direct information on additional branch-specific
factors, these patterns in the data are at least suggestive that it is more likely that the omitted
branch-specific factor that leads to both more (less) favorable employee attitudes and higher
(lower) sales outcomes is related to the internal operations of the branches.
Finally, we examine one additional issue in the longitudinal net sales models of Table 3.
Column (5) of Table 3 extends the longitudinal net sales analysis by incorporating the 1994
34
To illustrate this point further, we divided the branches into those that had above average and below
average employee attitudes in 1994. The mean 1996 attitudes for the just-hired employees (those who
have less than one year of tenure) is 3.97 and 3.81 in the above average EAI and below average EAI
branches, respectively, a difference that is not significantly different from zero.
29
value of the branch-level EAI measure as another possible determinant of the change in net sales
between 1994 and 1996. This model examines whether the prevailing attitudes in a branch are
related to future growth in sales. These estimates in column (5) of Table 3 show that the 1994
level of the EAI variable has a significant positive relationship with the growth rate in net sales
between 1994 and 1996. Thus, the prevailing employee attitudes in a branch are positively
related both with the current levels of net sales (Table 3, column 1) and with the future growth in
net sales (Table 3, column 5). A branch with unfavorable (favorable) employee attitudes can
expect to have poor (good) sales growth as well as poor (good) contemporaneous net sales
performance.
D. Branch Closings
As noted, the bank closed fifty branches between 1994 and 1996. On the one hand, this
makes it more difficult to draw strong conclusions from longitudinal fixed effects models of the
relationship between EAI and sales performance because the bank may have closed those
branches whose performance and attitudes were likely to deteriorate. At the same time, this also
provides an opportunity to examine the effects of employee attitudes on performance in a way
that goes beyond earlier studies—by assessing their impact on branch closures. If management
viewed branches where workers had negative attitudes as likely to have low sales in future
periods and relatively low sales growth (consistent with the empirical results in column 5 of
Table 3), we would expect the bank to disproportionately close branches with low values of EAI.
To investigate the possibility of this kind of selectivity in branch closings, we estimate
linear probability models in which the dependent variable equals one if the branch closed
between 1994 and 1996 and the key independent variables are 1994 net sales and the branch’s
1994 EAI variable. The sample size for these models is the 193 branches that were open in 1994.

30
Fifty of these branches were closed by 1996.35
All of the branch closings occurred in the first
months of 1996 prior to the date of the 1996 employee surveys. We therefore include the 1994
values of the net sales and EAI variables as independent variables in the branch closing models
since these variables predate the closings. Column 1 of Table 4 shows that the bank closed
branches with low levels of net sales in 1994 (the only explanatory variable in this model). When
we add zip-code area characteristics to the regression (column 2 of Table 4), however, the
coefficient on 1994 net sales becomes insignificant. Coefficients from the column 2 model show
that the variable for average household wealth has a large negative significant effect on branch
closings. The results of the columns 1 and 2 models taken together reveal that the poor
performing branches were more likely to be closed and that these poor performing branches were
located in less affluent neighborhoods.
Columns 3 and 4 examine the effect of the branch-level EAI variable on the closure
decision. In column 3, the coefficient on EAI is significant and negative even after controlling
for zip-code characteristics, indicating that the bank was less likely to close branches with more
positive employee attitudes as reflected by higher values of EAI. In column 4 we add a control
for the branch’s 1994 performance level. Even with controls for 1994 performance levels and
zip-code characteristics, the column (4) results show that lower values of the branch-level EAI
variable in 1994 significantly increase the probability of a branch closing by 1996. The bank
closed branches with more negative employee attitudes.
One possible interpretation of this empirical pattern is that the effect of the more negative
attitudes is causal. For example, the bank’s managers could believe that negative attitudes
themselves drive away customers and future business, and so they close branches in response to
35
During the 1990s, the U.S. banking industry faced increased competition and technological change. Autor et.al. (2001) and Hunter et.al. (2002) discuss how these changes affected job content and earnings
at U.S. retail banks.

31
the negative attitudes. In fact, the prior results in column (5) of Table 3 do show that, among the
sample of 143 branches that remained open through 1996, branches with more negative
employee attitudes did experience lower sales growth than other branches. Alternatively, the
effect of 1994 EAI on subsequent branch closings shown in Table 4 need not be causal. The
previous results in Section IV show that there are significant branch-specific components to EAI,
and the results in Table 3 show that controls for time-invariant branch-specific factors eliminate
the positive cross-section correlations between the EAI and performance measures. Likewise, the
results in the branch closing models in columns (3) and (4) of Table 4 could also reflect the
effects of this kind of omitted branch-specific factor that negatively affects attitudes and
increases the chances that bank management will close the branch.36
Under either interpretation,
the results in the Table 4 column (4) model indicate that the bank did close branches with more
negative employee attitudes, and moreover, a branch’s EAI index is a more important factor in
the decision to close branches than the recent level of net sales in the branch. This particular
pattern is consistent with an interpretation that management views employee attitudes as a better
predictor of the long-run branch performance than the prior year’s net sales performance, and
thus with the finding in Table 3 that workplace attitudes are a good predictor of future sales
growth.
36
One version of this class of explanations implies reverse causality from (expectations of) future branch
closings to more negative employee attitudes. For example, this kind of reverse causality could occur if
some exogenous factor in 1994 increased the likelihood of the branch being closed in 1996 and also
negatively affected the 1994 levels of employee attitudes (because employees in these branches were
suspicions about an increased risk of branch closings). Given the timing of branch closings and the dates
of the surveys, this particular variant of this type of omitted variable explanation does not seem especially
persuasive. The bank first disclosed to its employees in early 1996 that branches would be closed during
that year and these closings were completed within a few months. The first reports in the business press of
branch closings in this bank were also in early 1996. The 1994 attitude surveys were completed by
employees before the end of the first quarter of 1994, well before any branch closings seem to even have
been contemplated. The time gap between when the 1994 surveys were completed by the employees and
when the branch closings were being considered is substantial and suggests that this particular version of
a reverse causality explanation – i.e., prior to completing the attitude survey in the spring of 1994,
employees suspected that their branches would be closed in 1996 and therefore reported poor attitudes in
1994 – does not appear to account for the Table 4 results.

32
The results in Table 4 also caution against drawing strong conclusions from the results of
the fixed effects net sales models reported in Table 3. As we suggest above, the results in Table
3 are consistent with the effect of an omitted branch factor that causes both more favorable
attitudes and higher sales. However, the results in columns (3) and (4) of Table 4 document
selectivity in branch closings between 1994 and 1996, with the low-EAI branches the ones that
were more likely to be closed. This kind of selectivity in branch closings could also bias
downward the coefficient on the change-in-EAI variable in the Table 3 growth-in-net-sales
models. The bank closed branches that, on average, had low net sales in less affluent
neighborhoods and that had poor employee attitudes. These branches may have been the best
candidates for improving net sales through a management initiative to improve attitudes. For
example, the bank could have removed managers from low-performing branches and replaced
them with managers from high-performing branches. Had the bank maintained these branches
and managed to improve the employee attitudes, we may have seen an improvement in
performance as well, producing a significant first difference result in Table 3. But even this
scenario relies on the role of the omitted factor, i.e. the managerial behaviors that could lead to
an improvement in attitudes.
VI. Conclusion
Bank branches are small establishments where co-workers do their jobs in sufficiently
close proximity to constitute a genuine workplace. Branches are therefore well suited for a study
of the importance of workplace effects. This study examines the relationships among
workplaces, employee attitudes and performance outcomes in a sample of 193 branches of a
major U.S. bank. Our analyses of employee opinion survey responses from several thousand
workers in these bank branches consistently show evidence of a distinctive workplace
component to employee attitudes despite the common set of corporate human resource

33
management practices that cover all the branches. Differences in the branch-level measures of
employee attitudes across branches are highly significant and are too large to be explained by
chance alone. Moreover, the attitudes of new employees converge with the pre-existing attitudes
of their longer-tenured co-workers, either through changes in employee attitudes over time or
through turnover. We also find that cross-branch differences in attitudes are highly correlated
with sales performance of the branches – branches in which employees have more favorable
attitudes have superior sales performance. “Branch effects” again appear to be important in
understanding this pattern as well. In particular, the existence of a branch-specific factor that
affects both attitudes and sales provides an explanation for our findings that the significant cross-
sectional relationship between branch attitudes and branch performance is not observed in
longitudinal fixed-effects net sales models.
While we consider several possible interpretations for each individual empirical result,
the full set of results is consistent with an interpretation that branch-specific factors lead to better
outcomes for both employees (more favorable employee attitudes) and the bank (better sales
performance), and that this factor is more likely to be some aspect of the branches’ internal
operations rather than some characteristic of the external market of the branch. Previous
research has also found that the adoption of innovative human resource management practices
produces good outcomes for employees and businesses in terms of higher levels of employee
involvement and greater productivity. While the formal human resource management practices
are the same across all branches in the company we study, the results here may indicate that
other management decisions and approaches that vary from workplace to workplace within a
single company and industry can promote superior outcomes for both the employee and the
company. Future research that goes even deeper inside firms and their establishments to identify
these distinctive, and beneficial, workplace factors would be especially valuable.

34
Bibliography
Allen, David G., Lynn M. Shore and Rodger W. Griffeth (2003), “The Role of Perceived
Organizational Support and Supportive Human Resource Practices in the Turnover
Process,” Journal of Management 29 (1): 99-118.
Autor, David, Frank Levy and Richard Murnane (2001), “Upstairs, Downstairs: Computers and
Skills on Two Floors of a Large Bank,” Industrial and Labor Relations Review, 53(3),
432-47.
Azoulay, Pierre, Joshua Zivin and Jialan Wang (2010), “Superstar Extinction”, Quarterly
Journal of Economics 125(2): 549-589.
Bandiera, Oriana, Iwan Barankay, and Imran Rasul (2007), “Incentives for Managers and
Inequality among Workers: Evidence from a Firm Level Experiment” Quarterly Journal
of Economics 122(2): 729-773.
Bartel, Ann P., Casey Ichniowski and Kathryn Shaw (2007), “How Does Information
Technology Affect Productivity? Plant-Level Comparisons of Product Innovation,
Process Improvement and Worker Skills,” Quarterly Journal of Economics, 122(4):
1721-1758.
Berger, Allen N. and David B. Humphrey (1992), “Measurement and Efficiency Issues in
Commercial Banking.” In Zvi Griliches, ed., Output Measurement in the Service Sector,
NBER Studies in Income and Wealth, Vol. 56. Chicago: University of Chicago Press.
Black, Sandra and Lisa Lynch (2004). “What’s Driving the New Economy? The Benefits of
Workplace Innovation,” Economic Journal, 114(493): 97-116.
Black, Sandra and Lisa Lynch (2001). “How to Compete: The Impact of Workplace Practices
and Information Technology on Productivity,” Review of Economics and Statistics, 83(3):
434-445.
Bloom, Nick and John Van Reenen (2007). “Measuring and Explaining Management Practices
Across Firms and Countries,” Quarterly Journal of Economics, 122(4): 1351-1408.
Bloom, Nick, Benn Eifert, David McKenzie, Aprajit Mahajari and John Roberts (2009), “Does
Management Matter? Evidence from India,” unpublished manuscript.
Bloom, Nick, Raffaella Sadun and John Van Reenen (forthcoming). “Americans do IT Better:
American Multinationals and the Productivity Miracle,” American Economic Review,
(revision of NBER Working Paper 13085).
Bresnahan, Timothy, Erik Brynjolfsson and Lorin Hitt (2002). “Information Technology,
Workplace Organization and the Demand for Skilled Labor: Firm-Level Evidence,”
Quarterly Journal of Economics 117(1): 339-376.

35
Bryk, A. S. and Raudenbush, S. W. (1992), Hierarchical Linear Models: Applications and Data
Analysis Methods. Newbury Park, CA: Sage Publications.
Bowling, Nathan A. Terry A. Beehr, and Lawrence R. Lepisto (2006), “Beyond Job Satisfaction:
A five- year prospective analysis of the dispositional approach to work attitudes” Journal
of Vocational Behavior 69: 315-330.
Cappelli, Peter and David Neumark (2001). “Do ‘High-Performance’ Work Practices Improve
Establishment-Level Outcomes?” Industrial and Labor Relations Review 54(4): 737-775.
Clark, Andrew and Andrew Oswald (1996), “Satisfaction and Comparison Income,” Journal of
Public Economics, 61(2): 359-81.
Cote, Stephanie and Laura M. Morgan (2002) “A longitudinal analysis of the association
between emotion regulation, job satisfaction, and intentions to quit” Journal of
Organizational Behavior 23: 947-962.
Cropanzano, Russell and Marie S. Mitchell (2005). “Social Exchange Theory: An
Interdisciplinary Review,” Journal of Management, 31: 874-900.
Eisenberger, R., Huntington, R. Hutchiso, S. and Sowa, D. (1986). “Perceived Organizational
Support,” Journal of Applied Psychology, 71:500-507.
Gibbons, Robert and Rebecca Henderson (forthcoming). “Relational Contracts and the Origins
of Organizational Capabilities” in Handbook of Organizational Economics (R. Gibbons
and J. Roberts, eds.), Princeton University Press.
Graafland, Johan J. and B.A. Rutten (2004). “Perceived Organizational Support and
Profitability:, Tilburg University CentER Discussion Paper 2004-45, .
Griffith, Rachel and Andrew Neely (2009). “Performance Pay and Managerial Experience in
Multi-task Teams: Evidence from Within a Firm,” Journal of Labor Economics 27(1):
49-82.
Hamermesh, Daniel (2001) “The Changing Distribution of Job Satisfaction,” Journal of Human
Resources, 36(1): 1-30.
Haltiwanger, John (2008), "Top Ten Questions for Understanding Firm Dynamics and
Productivity Growth" Keynote address at CAED.
Hamilton, Barton, Jack Nickerson, and Hideo Owan (2003), “Team Incentives and Worker
Heterogeneity: An Empirical Analysis of the Impact of Teams on Productivity and
Participation,” Journal of Political Economy, 111(3): 465-497.
Hunter, Larry, Annette Bernhardt, Katherine L. Hughes and Eva Skuratowicz (2002), “It’s Not
Just the ATMs: Technology, Firm Strategies, Jobs and Earnings in Retail Banking,”
Industrial and Labor Relations Review, 53: 402-24.

36
Ichino, Andrea and Giovanni Maggi (2000), “Work Environment and Individual Background:
Explaining Regional Shirking Differentials in a Large Italian Firm.” Quarterly Journal of
Economics 115 (3): 1057-1090.
Ichniowski, Casey, Kathryn Shaw and Giovanna Prennushi (1997), “The Effects of Human
Resource Management Practices on Productivity: A Study of Steel Finishing Lines,”
American Economic Review, 86: 291-313.
Katz, Harry C., Thomas A. Kochan and Kenneth R. Gobeille (1983) “Industrial Relations
Performance Economic Performance, and QWL Programs: An Interplant Analysis.”
Industrial and Labor Relations Review 37: 3–17.
Lazear, Edward and Kathryn Shaw (2007) “Personnel Economics: The Economist’s View of
Human Resources,” Journal of Economic Perspectives, 21 (4), (Fall): 91-114.
Lord, F. M. (1980), Applications of Item Response Theory to Practical Testing Problems.
Hillsdale, NJ: Erlbaum.
MacDuffie, John Paul (1995), “Human Resource Bundles and Manufacturing Performance:
Organizational Logic and Flexible Production Systems in the World Auto Industry,”
Industrial and Labor Relations Review, 48: 197-221.
Mas, Alexandre and Enrico Moretti (2009), “Peers at Work,” American Economic Review, 99(1):
112-145.
Oyer, Paul and Scott Schaefer (2011) “Personnel Economics: Hiring and Incentives,” In Orley
Ashenfelter and David Card, editors: Handbook of Labor Economics, vol. 4b (Great
Britain, North Holland), pp. 1769-182
Rhoades, Linda and Robert Eisenberger (2002). “Perceived Organizational Support: A Review”,
Journal of Applied Psychology, 87:698-714.
Rode, Joseph C. (2004), “Job Satisfaction and life satisfaction revisited: A Longitudinal Test of
an Integrated model” Human Relations 57: 1205-1230
Van Sanne, N, J.K. Sluiter, J.H.A.M. Verbeek, and M.H.W Frings-Dresen, (2003), “Reliability and
Validity of Instruments Measuring Job Satisfaction—A Systematic Review,” Occupational
Medicine 53:191-200.

37
Figure 1: Distribution of Actual Branch-Level Averages of the EAI Index
Compared to Distribution of Simulated Branch-Level Averages of the EAI Indexa
Mean for Distribution of Actual Branch Average Values of EAI = 3.72; Std. Dev. = 0.285
Mean for Distribution of Simulated Branch Average Values of EAI = 3.70; Std.Dev. = 0.184
Kolmogorov-Smirnov: D=0.1488, p-value=0.001.
a See text for discussion of simulated distribution.

38
Table 1
Estimates of Branch Effects on Employee Attitudes
Panel A: ANOVA
Degrees of
Freedom
Total Sum of
Squares
Mean Squares
F Value
p-value
Person Effects 3482 117287.7 33.7 53.8
.00
Branch Effects 192 19525.0 101.7 162.5
.00
Question Effects 105 53976.8 514.1 821.4
.00
Year Effects 1 123.8 123.8 197.8
.00
Branch * Question 20157 23995.6 1.2 1.9
.00
Question * Year 105 410.1 3.9 6.2
.00
Branch * Year 142 6581.3 46.3 74.1
.00
Grade 6 928.9 154.8 247.4
.00
Tenure with Bank 4 1406.4 351.6 561.8
.00
Model 24194 224235.6 9.3 14.8 .00
Error 338033 211566.5 0.6
Total 362227 435802.1
Panel B: Hierarchical Linear Modela
Fixed Effect Coefficient SE t-value p value
Intercept 00
3.6976 0.0178 207.51 0
Random Effect Variance Component SE Z p value
Branch level, j0 0.06054 0.0063 9.68 0
Level-1 effect ijr 1.1814 0.0026 456.55 0
- 2 Log likelihood
1254005
aResults of estimating the following model:
ijjij rY 0 ------Individual-level equation (i denotes individual and j denotes branches).
jj 0000 ------- Branch-level equation.

39
Table 2
The Effects of 1994 Branch-Level Attitudes on
Attitudes of New and Longer Tenured Employees in 1996a
Dependent Variable: Individual EAI in 1996
(1) (2a) (2b) (3a) (3b) (3c)
All Tenure>2 Tenure< 2 Tenure>2 Tenure<1 1<Tenure<2
Independent Variables
1994 Branch EAI 0.397*** 0.397*** 0.427** 0.397*** 0.181 0.812***
(0.090) (0.091) (0.166) (0.091) (0.226) (0.268)
Tenure < 2 years 0.111
(0.583)
1994 Branch EAI *
Tenure < 2 years
0.017
(0.158)
N 1517 1275 242 1275 138 104
* - Significant at 0.10 level; ** - Significant at 0.05 level; *** - Significant at 0.01 level. a
Robust standard errors clustered by branch are in parentheses. All regressions include the average age of branch employees,
the number of employees in the branch, and the following 1995 zip code-specific variables: total population, number of
households, number of owner-occupied households, per capita income, average household wealth, median education,
unemployment rate, median housing value, total employees in area and total sales in area.

40
Table 3
Regressions of Sales and Growth of Sales on Branch Level Attitudes, 1994–1996a,b
(1)
(2) (3) (4) (5)
1994
Ln Net Sales
1996
Ln Net Sales
1966 Ln Net
Sales Minus
1994 Ln Net
Sales
1996 Ln Net
Sales Minus
1994 Ln Net
Sales
1996 Ln Net
Sales Minus
1994 Ln Net
Sales
Branch EAI
1994
0.0493**
(.020)
0.057**
(.027)
Branch EAI
1996
0.0607*
(.031)
1994-1996
Change in EAI
- 0.0090
(0.030)
0.0007
(0.027)
1994
Ln Net Sales
- 0.818***
(0.142)
- 0.833***
(-.150)
Branch Controlsb Yes Yes Yes Yes Yes
N 193 143 143 143 143
* - Significant at 0.10 level; ** - Significant at 0.05 level; *** - Significant 0.01 level. a Robust standard errors are in parentheses.
b Regressions in columns (1) and (2) include the average age of branch employees and the number of
employees in the branch as well as the following 1995 zip-code specific variables: Total population,
number of households, number of owner-occupied households, per capita income, average household
wealth, median education, unemployment rate, median housing value, total employees in area, and total
sales in area. Regressions in columns (3), (4), and (5) include the change in the age of branch employees
and the change in the number of employees in the branch.

41
Table 4: The Effects of Employee Attitudes on Branch Closing by 1996
Dependent Variable =1 if Branch Closed between 1994 and 1996
(N=193)a
(1) (2) (3) (4)
1994 Net Sales -0.729* -0.178 ----- -0.022
(0.422) (0.402) (0.405)
1994 EAI ------ ------ -0.268** -0.269**
(0.126)
(0.129)
Branch Controls b No Yes Yes Yes
* - Significant at 0.10 level.
** - Significant at 0.05 level.
*** - Significant at 0.01 level
a- Linear probability model with robust standard errors. Sample includes all branches that
were in operation in 1994.
b- Regressions in columns (2), (3) and (4) include the average age of branch employees and
the number of employees in the branch in 1994 as well as the following 1995 zip code
specific variables: Total population, number of households, number of owner-occupied
households, per capita income, household wealth, median education, the unemployment
rate, median housing value, total employees in area and total sales in area.

42
Appendix A
Selected Questions from Employee Survey
I. Pride in the Bank
1. I am proud to work for the bank.
2. I feel a strong commitment to the goals and values of this organization.
3. I would recommend working at the bank to my friends.
II. Values
1. I am given the authority I need to do the right thing for the customer.
2. Service to the customer is an important part of the way my performance is measured.
3. I am recognized for the service I provide to customers.
4. My manager/supervisor respects his/her employees.
5. I am dealt with in an open and honest manner.
6. The bank supports my efforts to achieve balance between my work and personal life.
III. Work Environment
1. I have enough information to do my job well.
2. I know the basis on which my performance will be judged.
3. In my work unit, people have a clear understanding of their roles and responsibilities.
4. I feel encouraged to come up with new and better ways of doing things.
5. My manager/supervisor listens to my ideas and concerns.
6. My job makes good use of my skills and abilities.
7. My work gives me a feeling of personal accomplishment.
8. My job is too monotonous.
9. I regularly get feedback from my manager/supervisor about my performance.
10. If I do a good job, I know I’ll be considered when the right job opportunities become
available.
11. Adequate training is provided when new products and technologies are introduced.
12. My manager/supervisor provides coaching and/or guidance to help me improve my
performance.
13. The people I work with cooperate to get the job done.
14. My manager/supervisor encourages teamwork among group members.
IV. Quality
1. My manager/supervisor encourages continuous improvement.
2. I am recognized for my efforts to gain quality improvements.
3. I have the authority to make decisions that improve the quality of my work.
V. Personal Responsibility
I am personally responsible for:
1. Delivering quality service to the customer
2. Obtaining adequate feedback about my performance
3 .Developing job-relevant skills

43
VI. Overall Satisfaction
1. Considering everything, how satisfied are you with your job?
2. How satisfied are you with your involvement in decisions that affect your work?
3. How satisfied are you with the recognition you receive for doing a good job?
4. How satisfied are you with the training you received for your present job?
5. Overall, how good a job do you feel is being done by your immediate manager/supervisor?
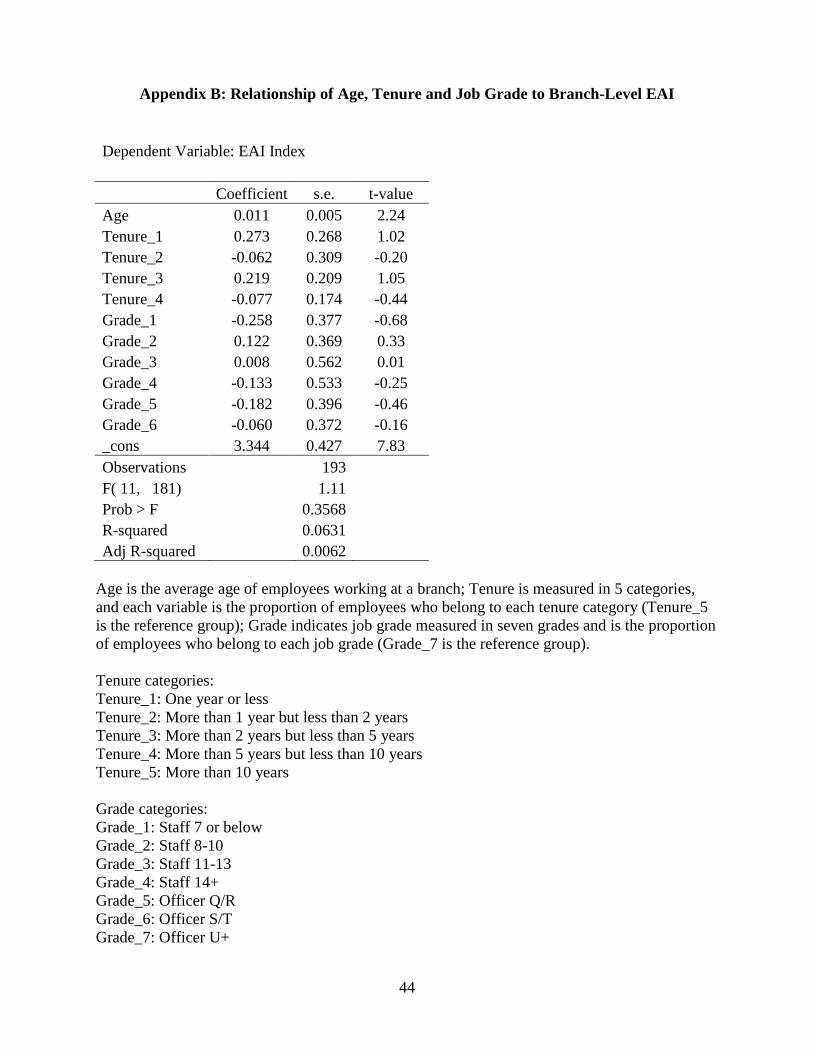
44
Appendix B: Relationship of Age, Tenure and Job Grade to Branch-Level EAI
Dependent Variable: EAI Index
Coefficient s.e. t-value
Age 0.011 0.005 2.24
Tenure_1 0.273 0.268 1.02
Tenure_2 -0.062 0.309 -0.20
Tenure_3 0.219 0.209 1.05
Tenure_4 -0.077 0.174 -0.44
Grade_1 -0.258 0.377 -0.68
Grade_2 0.122 0.369 0.33
Grade_3 0.008 0.562 0.01
Grade_4 -0.133 0.533 -0.25
Grade_5 -0.182 0.396 -0.46
Grade_6 -0.060 0.372 -0.16
_cons 3.344 0.427 7.83
Observations 193
F( 11, 181) 1.11
Prob > F 0.3568
R-squared 0.0631
Adj R-squared 0.0062
Age is the average age of employees working at a branch; Tenure is measured in 5 categories,
and each variable is the proportion of employees who belong to each tenure category (Tenure_5
is the reference group); Grade indicates job grade measured in seven grades and is the proportion
of employees who belong to each job grade (Grade_7 is the reference group).
Tenure categories:
Tenure_1: One year or less
Tenure_2: More than 1 year but less than 2 years
Tenure_3: More than 2 years but less than 5 years
Tenure_4: More than 5 years but less than 10 years
Tenure_5: More than 10 years
Grade categories:
Grade_1: Staff 7 or below
Grade_2: Staff 8-10
Grade_3: Staff 11-13
Grade_4: Staff 14+
Grade_5: Officer Q/R
Grade_6: Officer S/T
Grade_7: Officer U+

45
Appendix C: Estimating the Correlation Between 1994 and 1996 Branch-Level Employee
Attitudes For Employees Who Answer the Survey Only Once
The covariance formula that links the EAI measures over time can be decomposed into
the part of the covariance due to employees who answer the survey once and those who answer
the survey in both years. Let Xi1 be the EAI measure for branch i in the first survey and Xi2 be the
EAI for the branch in the second survey and let Cov(Xi1, Xi2) be the variance. Assume that λ
percent of workers in the branch answered the survey both times, so that the correlation between
their responses might reflect an unmeasured personal attitude rather than persistent workplace
attitudes at the branch. Then the covariance can be divided into the part contributede by these
workers and the part contributed by other workers:
(1) Cov(Xi1, Xi2) = λ cov (Xi1, Xi2; S) + (1- λ) cov (Xi1, Xi2; N), where S relates to workers who
responded on both surveys and N relates to workers who responded only once. In our data, the
observed covariance for the 143 branches that were in existence in 1994 and 1996 was 0.34.
(2) Since the correlation coefficient is the covariance divided by the standard deviation of Xi1,
times the standard deviation of Xi2, we estimate the covariance for the workers who responded in
both surveys as equal to the correlation coefficient from the studies cited in the text (0.5 or 0.7)
times the multiplicand of the estimated variances for all workers in our data in 1996 (0.29) and in
1994 (0.27). This is 0.078.
(3) Rearranging the terms in (1) gives the formula for the covariance of branch average attitudes
for workers who responded to the survey only once: cov (Xi1, Xi2; N) = [Cov(Xi1, Xi2) - λ cov
(Xi1, Xi2; S)]/ (1- λ )
(4) We estimate the correlation coefficient that we would get between branch average attitudes
for workers who responded to the survey only once by dividing the estimated cov (Xi1, Xi2; N) in
(3) by 0.078.
When λ = 0.25 and the correlation for the workers who responded in both surveys was 0.50,
these calculations give our upper bound estimate of 0.28. When λ = 0.31 and the correlation for
workers who responded in both surveys was 0.70 gives our lower bound estimate of 0.19.

46
Appendix D: Summary Statisticsa
Variable Mean Std. Dev.
Growth Rate of Footings .058 .081
Total Population 40894 24853
Number of Households 17152 12375
Per Capita Income 32188 21420
Household Wealth 146268 74805
Owner-Occupied Households 6314 4420
Median Education 13.77 1.50
Unemployment Rate .065 .032
Median Housing Value 292357 130188
Total Employees in Area 26762 38399
Total Sales in Area 3997 6570
Age of Branch Employees 36.36 4.98
Branch Employment 11.57 7.17
a Growth rate of footings, age of branch employees and branch employment are reported for
1994. All other variables are measured at the level of the zip-code in 1995.
Related Documents