E LEMENTS FOR L IFE

Welcome message from author
This document is posted to help you gain knowledge. Please leave a comment to let me know what you think about it! Share it to your friends and learn new things together.
Transcript

ELEMENTS FOR LIFE

ELEMENTS FOR LIFE
0.Intro sections:Paginated book 16/2/07 09:29 Page 1

DISCLAIMEROpinions expressed in this publication are those of the authors and do not engage the World
Meteorological Organization (WMO). The designations employed and presentation of material in thispublication, including maps, do not imply the expression of any opinion whatsoever on the part of
WMO concerning the legal status of any country, territory, city or area, or concerning the delimitations of its frontiers or boundaries.
The mention of specific companies or of certain products does not imply that they are endorsed orrecommended by WMO in preference to others of a similar nature that are not mentioned.
World Meteorological Organization (WMO)7 bis, avenue de la Paix,Case postale No. 2300
CH-1211 Geneva 2Switzerland
E-mail: [email protected]: www.wmo.int
This publication may be freely quoted or reprinted, except for resale.Acknowledgement of the source is requested. Requests for the reproduction or translation of this
publication should be directed to the publisher.
ISBN 92-63-11021-2Copyright © WMO 2007
All rights reserved.Geneva, Switzerland.
Published by Tudor Rose on behalf of the WMO.www.tudor-rose.co.uk
Additional copies of this publication are available for purchase from the WMO or Tudor Rose.
Tudor Rose
0.Intro sections:Paginated book 16/2/07 09:29 Page 2
[ ]3
ActionAid Internationalwww.actionaid.org
Bahrain Meteorological Servicewww.bahrainweather.com
Biodiversity Conservation (India) Ltdwww.bioconserveindia.com/bcil.htm
Caribbean Institute for Meteorology and Hydrologywww.cimh.edu.bb
Department of Science and Technology, India http://dst.gov.in
Environment Canadahttp://weatheroffice.ec.gc.ca/canada
European Organisation for the Exploitation of Meteorological Satelliteswww.eumetsat.int
Federal Service for Hydrometeorology and Environmental Monitoring www.meteorf.ru
Icelandic Meteorological Officewww.vedur.is/english
Institute of Earth Sciences, Academia Sinicawww.earth.sinica.edu.tw/index_e.html
Instituto de Meteorologia, Portugalwww.meteo.pt
Instituto Nacional de Meteorologia, Brazilwww.inmet.gov.br
Instituto Nacional de Saúdewww.insarj.pt
Intergovernmental Oceanographic Commissionhttp://ioc.unesco.org
International Union of Railwayswww.uic.asso.fr
Japan Meteorological Agencywww.jma.go.jp/jma/indexe.html
JCOMMwww.wmo.ch/web/aom/marprog/marprog.html
KNIMIwww.knmi.nl/indexeng.html
Korean Meteorological Institutionhttp://web.kma.go.kr/eng
Météo Francewww.meteo.fr
Meteorological and Hydrological Service, Croatiahttp://meteo.hr/index_en.php
NASAwww.nasa.gov
National Center for Atmospheric Research, USAwww.ncar.ucar.edu
National Drought Mitigation Center, University of Nebraska-Lincolnhttp://drought.unl.edu
National Emergency Management Agency, Koreawww.nema.go.kr
National Energy Authority, Icelandwww.os.is/page/english
National Environment Agency, Singaporehttp://app.nea.gov.sg
NOAAwww.noaa.gov
Observatório Nacional de Saúdewww.onsa.pt
Office for the Coordination of Humanitarian Affairshttp://ochaonline.un.org
Presidency of Meteorology and Environment, Saudi Arabiawww.pme.gov.sa
Prince Sultan Bin Abdulaziz International Prize for Waterwww.psipw.org/index.html
Singapore Public Utilities Boardwww.pub.gov.sg
Spanish National Meteorological Institutewww.inm.es
Taiwan Forestry Research Institutewww.cof.orst.edu/coops/ntc/taiwan/tfri.htm
Teisberg Associates
UK Met Officewww.metoffice.gov.uk
United Nations International Strategy for Disaster Reductionwww.unisdr.org
Vaisalawww.vaisala.com
Woods Hole Groupwww.whgrp.com
World Bankwww.worldbank.org
World Meteorological Organizationwww.wmo.int
Acknowledgements
Edited by Soobasschandra Chacowry, formerly of the World Meteorological Organization.Compiled by Sean Nicklin, Ben Cornwell and Jacqui Griffiths of Tudor Rose. Production team: Rebecca Davies, James Dodd, Stuart Fairbrother, Lindsay James and Paul Robinson of Tudor Rose.
With thanks to all the authors listed in the contents section for their support in making Elements for Life possible.
0.Intro sections:Paginated book 16/2/07 09:29 Page 3

4[ ]
Over the last two to three decades, meteorology and hydrology have undergone a major evolution. This has beenfacilitated by outstanding advances in science and technology, resulting in unprecedented volume, quality, typesand coverage of observational data, especially those made by satellites. Such advances have also led to the develop-ment of supercomputers and numerical weather prediction systems; expanded capabilities for telecommunicationsincluding the Internet, and the sustained coordinating and catalytic role of the World Meteorological Organization(WMO). At the same time, the rising sophistication and strength of the world economy and international trade, theincreasing toll of natural disasters and the escalating concern for the environment, have led to an ever-increasingdemand for timely and accurate information on the present and future states of weather, climate and water resources.
Indeed, the transformation of this expanded knowledge base into concrete practical applications in the areas ofpoverty reduction and increased human well-being has made considerable headway. Areas where socio-economicbenefits have been assessed include disaster prevention and mitigation, food production, water resource manage-ment, climate change science and adaptation, pollution control, energy production, insurance and support to health,among others. However, the exchange of this information and its successful application to sustainable socio-economicdevelopment, environmental protection and decision-making must be further intensified if all nations are to benefitequally from this progress. This is where the National Meteorological and Hydrological Services (NMHS), as well asthe research and academic communities, have an additional and very crucial role to play.
Elements for Life is being published with the intention to provide a fresh perspective on the subject by a wide rangeof users of hydrometeorological information. The variety of issues included demonstrates that investments in mete-orological and hydrological activities are very cost effective in supporting national and international efforts to enhancehuman welfare and promote sustainable development.
At the same time, this publication is an expression of the coordinating efforts of the WMO and the crucial role ofthe NMHS in developing and delivering essential services to the public, decision makers, the private sector and thewider user community. Elements for Life documents many of these important services in qualitative and quantitativeterms and will no doubt serve as a record of the growing benefits that humanity gains from meteorology and hydrol-ogy and the potential that these sciences hold for human welfare in the years to come.
On behalf of the WMO, I would like to express my appreciation to Tudor Rose for the initiative to publish thisvolume, and for selecting and organizing the relevant articles. I am equally grateful to all the authors and institutionsthat have amiably contributed to this historic publication.
Michel JarraudSecretary-General of the World Meteorological Organization
Foreword
0.Intro sections:Paginated book 16/2/07 09:29 Page 4

[ ]5
Since its establishment, the World Meteorological Organization (WMO) has excelled in monitoring the environ-ment, and in predicting its future state with increasing accuracy on all timescales from nowcasting to climateprojections. For this achievement, the organization has coordinated and promoted on a worldwide scale the devel-opment of advances in science and technology and their application to meteorology, and fostered an unprecedentedlevel of self-help and international cooperation.
This global capacity has brought to the fore of the world’s agenda issues such as increasing greenhouse gases and theresulting global warming; potential climate change and its impact; improved early warning and a multi-hazard systemagainst natural and environmental disasters; dwindling water resources; the depletion of stratospheric ozone and increas-ing levels of pollution. Such knowledge, provided by WMO’s unique system and maintained and operated by its 188members, has enabled humanity to address these issues with a sense of urgency and concern for future generations.
In addition, there is a considerable number of other areas where hydrometeorological knowledge is being success-fully applied to socio-economic development and environmental security. Some of the domains include agriculture,disaster mitigation, human health, water resources management, environment, desertification control, tourism, energy,insurance, trade, transport, construction – indeed, most human activities. The range of services is expanding rapidly.
Each nation invests in hydrometeorological science, but in most cases the advantages derived are limited to a fewmajor areas. In order to benefit from the full potential that hydrometeorological knowledge can bring to humanaffairs, a multidisciplinary and inter-institutional approach as well as further investment and cooperative arrange-ments are required. The National Meteorological and Hydrological Services (NMHS) need to work with economists,social scientists, decision makers and other users to broaden the range of services provided and demonstrate the valueof hydrometeorological information in the successful implementation of national development plans as well asregional and international strategies.
In this regard, WMO has the crucial responsibility to ensure the exchange of knowledge and experience and toincrease the visibility and public awareness of the NMHS both at national and international levels. WMO’s Statementon the Role and Operation of NMHS for Decision Makers contributes to this effort especially in the context of changesin the world and in the United Nations system. The NMHS and WMO have unique competence and comparativeadvantage in contributing to socio-economic development and environmental security as well as towards the attain-ment of internationally agreed development goals such as poverty alleviation as contained in the MillenniumDevelopment Goals and other global and regional strategies. This is the challenge faced by WMO in this early partof the 21st century.
We would therefore like to thank Tudor Rose for providing another opportunity to the meteorological and hydro-logical communities and various users to show the valuable contributions of WMO and the NMHS to human welfareand environment sustainability, and the further support they require in taking their work ahead for the benefit ofthis and future generations.
Alexander BedritskyPresident of the World Meteorological Organization
Preface
0.Intro sections:Paginated book 16/2/07 09:29 Page 5

[ ]6
Acknowledgements . . . . . . . . . . . . . . . . . . . . . . . . . . . . . . . . . . . . . . . . . . . . .3
Foreword by Michel Jarraud, Secretary-General of the World Meteorological Organization . . . . . . . . . . . . . . . . . . . . . . . . . . . . . . . . .4
Preface by Dr Alexander Bedritsky, President of the World Meteorological Organization . . . . . . . . . . . . . . . . . . . . . . . . . . . . . . . . .5
Statement from Cristina Narbona, Environment Minister of Spain . . . . . . . . .9
Statement from Sálvano Briceño, Director, Secretariat of the InternationalStrategy for Disaster Reduction . . . . . . . . . . . . . . . . . . . . . . . . . . . . . . . . . . .10
Statement from Margareta Wahlstrom, Officer-in-Charge, Office for the Coordination of Humanitarian Affairs and Acting EmergencyRelief Coordinator . . . . . . . . . . . . . . . . . . . . . . . . . . . . . . . . . . . . . . . . . . . . .11
I POLICY PLANNING & GOVERNANCE
Development challenges – working with the elements . . . . . . . . . . . . .14Michel Jarraud, Secretary-General, World Meteorological Organization
From National Meteorological Institute to Spanish Meteorological Agency:towards the future . . . . . . . . . . . . . . . . . . . . . . . . . . . . . . . . . . . . . . . . .16Francisco Cadarso, Director General, Spanish National Meteorology Institute
Weather, climate, water and air quality, and the risk to development . . .18Dr David P Rogers, Switzerland
The consequences of climate change to rail infrastructure . . . . . . . . . . .20Margrethe Sagevik, International Union of Railways
Monitoring weather, climate and the environment – EUMETSAT’soperational satellite service . . . . . . . . . . . . . . . . . . . . . . . . . . . . . . . . . .24European Organisation for the Exploitation of Meteorological Satellites
Ocean data, information, products and predictions in the service of society . . . . . . . . . . . . . . . . . . . . . . . . . . . . . . . . . . . . . . .27Dr Peter Dexter, Co-President, JCOMM, MelbourneJohannes Guddal, past Co-President, JCOMM, BergenCandyce Clark, Intergovernmental Oceanographic Commission Secretariat, Paris
The climatic and meteorological vulnerability of the population andeconomy of Russia as a factor in safe and sustainable development . . . .30A.I. Bedritsky, Head of the Federal Service for Hydrometeorology andEnvironmental Monitoring, Roshydromet; President, WMO
Technical cooperation for weather, water and climate services in developing countries . . . . . . . . . . . . . . . . . . . . . . . . . . . . . . . . . . . . . . .35Steve Palmer, UK Met Office
Planning and governance: Bahrain Meteorological Service . . . . . . . . . . .39Abdulmajeed Husain Isa, Assistant Undersecretary for Meteorology, President of Regional Association II (Asia)
Reducing disaster risk in Canada: new legislation and policies that enablecitizens to adapt to weather and climate extremes . . . . . . . . . . . . . . . . .43Magda Little, Environment Canada; David Grimes, A/Assistant DeputyMinister, Meteorological Service of Canada, Environment Canada and AlvinLau, A/Coordinator, Business Policy Directorate, Meteorological Service ofCanada, Environment Canada
Weather and climate information services for socio-economic benefit:challenges in Japan . . . . . . . . . . . . . . . . . . . . . . . . . . . . . . . . . . . . . . . .46Koichi Kurihara, Japan Meteorologial Agency
New challenges to meteorological services for human settlement andsustainable development in megacities . . . . . . . . . . . . . . . . . . . . . . . . . .48Xu Tang, PhD, Director-General, Shanghai Regional Meteorological Center,China Meteorological Administration
NMHS Strategy in south-eastern Europe . . . . . . . . . . . . . . . . . . . . . . . .50Ivan a i, Meteorological and Hydrological Service, Croatia
II ECONOMIC & SOCIAL ISSUES & PERSPECTIVES
AgricultureWeather, climate, and water information for agricultural applications . . .54Dr Pai-Yei Whung, Agricultural Research Service, US Department of AgricultureDr Donald A. Wilhite, National Drought Mitigation Center, University ofNebraska-Lincoln
Global warming, climatic trends and climatic threats in Latin America and the Caribbean . . . . . . . . . . . . . . . . . . . . . . . . . . . . . .56Fernando Santibañez and Paula Santibañez, Centre on Agriculture andEnvironment (AGRIMED), University of Chile
Weather and climate in Caribbean agriculture…59Adrian R. Trotman, Agrometeorologist, Caribbean Institute for Meteorology andHydrology
Water Resources ManagementThe hydrologic cycle and the sustainability of water resources . . . . . . . .62Shahid Habib, Chief of the Office of Utilization; Stephen Ambrose, ProgrammeManager, Disaster Management, Applied Sciences Programme; Fritz Policelli,Technical Manager, Office of Science Utilization; and Ted Engman, ScienceApplications International, NASA
Operational weather and climate forecasting, and its impact on watermanagement in Australia . . . . . . . . . . . . . . . . . . . . . . . . . . . . . . . . . . . .66Geoff Love, Director of Meteorology, Bureau of Meteorology, Australia
Seasonal forecasting in West Africa: a strategic partnership for thesustainable development of a cross boundary river catchment . . . . . . . .70Axel Julie, OMVS & JP Céron, Director of Climatology, Météo France
Weather patterns and water resource management in Taiwan, Province of China . . . . . . . . . . . . . . . . . . . . . . . . . . . . . . . . . . .72Chung-ho Wang and Bor-ming Jahn, Institute of Earth Sciences, Academia Sinica; Hen-biau King, Taiwan Forestry Research Institute
Singapore integrated water management . . . . . . . . . . . . . . . . . . . . . . . .74Singapore Public Utilities Board
Fostering sustainable water resources: the Prince Sultan Bin AbdulazizInternational Prize for Water . . . . . . . . . . . . . . . . . . . . . . . . . . . . . . . . .78Dr Abdulmalek A. Al Al-Shaikh, General Secretary of the Prince Sultan BinAbdulaziz International Prize for Water, Riyadh, Saudi Arabia, www.psipw.org
HealthManaging climate-related health risks . . . . . . . . . . . . . . . . . . . . . . . . . .80Dr Stephen J. Connor, Director, PAHO/WHO Collaborating Centre on EarlyWarning Systems for Malaria and other Climate Sensitive Diseases; Director,Environmental Monitoring Research, International Research Institute forClimate & Society
Air quality: meteorological services for safeguarding public health . . . . .82Dr Liisa Jalkanen, WMO Secretariat
Improved air quality in Singapore . . . . . . . . . . . . . . . . . . . . . . . . . . . . .84Foong Chee Leong, Director-General, Meteorological Services Division; JosephHui, Director General, Environmental Protection Division, The NationalEnvironment Agency, Singapore
The watch warning system on heat waves with effect on mortality . . . . .87Eleonora Paixão, Paulo Nogueira and José Marinho Falcão, Instituto Nacional deSaúde; Dr. Ricardo Jorge, Observatório Nacional de Saúde, Portugal; Fátima EspíritoSanto, João Ferreira and Teresa Abrantes, Instituto de Meteorologia, Portugal
Contents
0.Intro sections:Paginated book 16/2/07 09:29 Page 6

[ ]7
Improved weather-related services in cities in the face of climate, weather and population changes . . . . . . . . . . . . . . . . . . . . . . . . . . . . . .90Dr Walter F. Dabberdt, Vaisala, USA
EnergyWeather, climate and water information and the energy sector . . . . . . . .94Dr Laurent Dubus, Electricité de France R&D
Meteorological services and the social and economic benefits of energysaving in the Beijing heat supply . . . . . . . . . . . . . . . . . . . . . . . . . . . . . .96Xie Pu and Duan Yuxiao, Beijing Meteorological Bureau, Beijing, China
The effect of climate change on glaciers and hydropower in Iceland . . . .99Tómas Jóhannesson, Icelandic Meteorological Office Árni Snorrason, Hydrological Service Division, National Energy Authority
TransportationAviation meteorological services: pioneers in supporting decision making for safe, efficient and economic air transport . . . . . . . . . . . . . .101Dr Herbert Puempel, World Meteorological Organization Secretariat
WMO and ICAO: working together for international air navigation . . .103OM Turpeinen, International Civil Aviation Organization Secretariat
Airlines and weather . . . . . . . . . . . . . . . . . . . . . . . . . . . . . . . . . . . . . .106Adriaan Meijer, International Air Transport Association
Applications of weather and climate information in road transportation:examples from Canada . . . . . . . . . . . . . . . . . . . . . . . . . . . . . . . . . . . . .108Brian Mills, Adaptation and Impacts Research Division, Atmospheric Scienceand Technology Directorate, Environment Canada; Jean Andrey, Department ofGeography, University of Waterloo
The economic value of snowstorm forecasts in winter road-maintenancedecisions . . . . . . . . . . . . . . . . . . . . . . . . . . . . . . . . . . . . . . . . . . . . . . .110Erik Liljas, Swedish Meteorological and Hydrological Institute
ConstructionSustainable, energy-efficient building: the BCIL approach . . . . . . . . . .114Chandrashekar Hariharan, Biodiversity Conservation (India) Ltd
III
NATURAL & HUMAN-INDUCED DISASTERS
Using what we know about disasters– for safer lives and livelihoods . .120 Sálvano Briceño, Director, International Strategy for Disaster Reduction
Learning new methodologies to deal with large disasters: near spacemonitoring of thermal signals associated with large earthquakes . . . . .124Dimitar Ouzounov, Shahid Habib, Fritz Policelli and Patrick Taylor, NASAGoddard Space Flight Center
Disaster mitigation and preparedness: flood forecasting and warning . .127Dr Bruce Stewart, President, WMO Technical Commission for Hydrology
Satellite remote sensing for early warning of food security crises . . . . .129Molly E. Brown, NASA Goddard Space Flight Center
Climate change, flooding and the protection of poor urban communities in Africa . . . . . . . . . . . . . . . . . . . . . . . . . . . . . . . . . . . . .132Ian Douglas, Emeritus Professor, School of Environment and Development,University of Manchester; Jack Campbell and Yasmin McDonnell, Emergenciesand Conflict Team, ActionAid International
Climate change and its impact on natural risk reduction practices,preparedness and mitigation programmes in the Caribbean . . . . . . . . .136David A. Farrell, Kathy-Ann Caesar, and Kim Whitehall, Caribbean Institutefor Meteorology and Hydrology, Barbados
A virtual centre for disaster reduction in South America: monitoring,prediction and early warning of severe weather events . . . . . . . . . . . . .140Antonio Divino Moura, Instituto Nacional de Meteorologia, Brazil
The rising incidence of natural disaster events on the Korean Peninsula due to climate change . . . . . . . . . . . . . . . . . . . . . . .142Dugkeun Park, PhD, Senior Analyst, National Emergency Management Agency(NEMA), Seoul, Korea
Adapting to climate change through resilience to natural disasters . . . .145Sanjiv Nair, G Srinivasan and KJ Ramesh, Department of Science &Technology, New Delhi, India
Phot
o: V
aisa
la
0.Intro sections:Paginated book 16/2/07 09:29 Page 7

[ ]8
Climate, man and forest fires . . . . . . . . . . . . . . . . . . . . . . . . . . . . . . . .148Domingos Xavier Viegas, Department of Mechanical Engineering, University of Coimbra, Portugal
The Portuguese Institute of Meteorology and forest fires . . . . . . . . . . .150Luis Pessanha, Julia Silva and Teresa Abrantes, Instituto de Meteorologia, Portugal
Battling extreme weather under a temperate climate – Hungary . . . . .152Gyuró, Gy., Á. Horváth, M. Lakatos, S. Szalai and J. Mika, HungarianMeteorological Service
IV
ENVIRONMENT
Knowledge for sustainable development: assessing a decade of African climate forecasting . . . . . . . . . . . . . . . . . . . . . . . . . . . . . . . . . .156Jordan R. Winkler, Boston UniversityAnthony Patt, International Institute for Applied Systems AnalysisKabineh Konneh, NOAA Climate Programs Office
Environment, efficiency and solidarity: a challenge . . . . . . . . . . . . . . .158Cristina Narbona, Environment Minister of Spain
The African Monitoring of the Environment for Sustainable DevelopmentInitiative: a timely initiative to save an endangered continent . . . . . . . .160Paul Counet, The European Organisation for the Exploitation of Meteorological Satellites
Climate information applications for sustainable development in Africa . .163Dr Leonard N. Njau, Mr. Mohamed Kadi, Marie Christine Dufresne, Jocelyn Perrin, Dr Anthony Patt, and Dr Andre Kamga
Satellite observations of the increasing nitrogen dioxide emissions in China . . . . . . . . . . . . . . . . . . . . . . . . . . . . . . . . . . . . . . .166Ronald van der A, Bas Mijling, Jeroen Kuenen, Ernst Meijer, Hennie Kelder, KNMI
The Kingdom of Saudi Arabia: weather, climate and environment in aprecarious balance . . . . . . . . . . . . . . . . . . . . . . . . . . . . . . . . . . . . . . . .168David G. Aubrey, PhD, Woods Hole Group Middle East, representing thePresidency of Meteorology and Environment, Kingdom of Saudi Arabia;Dr Sameer A. Bukhari, Presidency of Meteorology and Environment, Kingdom of Saudi Arabia
Saving the public from the Asian Dust Storm . . . . . . . . . . . . . . . . . . . .171 Nam Jae-Cheol, Korean Meteorological Administration
V
ASSESSMENT METHODOLOGIES
Methodologies for assessing the economic benefits of NationalMeteorological and Hydrological Services . . . . . . . . . . . . . . . . . . . . . . .174Jeffrey K. Lazo, National Center for Atmospheric ResearchThomas J. Teisberg, Teisberg AssociatesRodney F. Weiher, Chief Economist, National Oceanic and Atmospheric Administration
Evaluating the value of seasonal climate forecasts for subsistence farmers:lessons from NOAA applications research in Zimbabwe…179 Anthony Patt, International Institute for Applied Systems Analysis, Austria
Economics of weather impacts and weather forecasts . . . . . . . . . . . . . .182Jeffrey K. Lazo, National Center for Atmospheric Research, US
Moving from hindsight to foresight: a challenge in the application ofvaluation research . . . . . . . . . . . . . . . . . . . . . . . . . . . . . . . . . . . . . . . .184Brian Mills, Adaptation and Impacts Research Division, Atmospheric Science and Technology Directorate, Environment Canada
Customizing methods for assessing economic benefits ofhydrometeorological services and modernization programmes:benchmarking and sector-specific assessment . . . . . . . . . . . . . . . . . . .186V. Tsirkunov, S. Ulatov, M. Smetanina, A. Korshunov, World Bank
The value of weather forecasts: quality, decision-making and outcome . . . . . . . . . . . . . . . . . . . . . . . . . . . . . . . . . . . . . . . . . . . .189Erik Liljas, Swedish Meteorological and Hydrological Institute
ANNEXES
Resolution 40 (Cg-XII)WMO policy and practice for the exchange of meteorological and related data and products including guidelines on relationships incommercial meteorological activities . . . . . . . . . . . . . . . . . . . . . . . . . .191
Resolution 25 (Cg-XIII)Exchange of hydrological data and products . . . . . . . . . . . . . . . . . . . .196
Executive council statement on the role and operation of nationalmeteorological and hydrological services for decision-makers . . . . . . . .198
Geneva declaration of the Thirteenth World Meteorological Congress . . . . . . . . . . . . . . . . . . . . . . . . . . . . . .200
WMO statement on the status of weather modification . . . . . . . . . . . .201
Draft recommendationRec. 16/2 (CAgM-XIV) – Drought and desertification . . . . . . . . . . . . .207
WMO statement on the scientific basis for, and limitations of weather and climate forecasting . . . . . . . . . . . . . . . . . . . . . . . . . . . . . .208
Notes & References . . . . . . . . . . . . . . . . . . . . . . . . . . . . . . . . . . . . . . .213Phot
o: M
r. Jo
rge
Jenk
ins,
PA
HO
0.Intro sections:Paginated book 16/2/07 09:29 Page 8

[ ]9[ ]9
Human activities have always been closely linked to the evolution and behaviour of our planet, especially ofits atmosphere. From ancient times, man has observed the clouds, winds, or the colour of the sky to try topredict the future so that due preparations can be made. Today, man continues to observe the atmospherebut now is able to consult meteorologists and climatologists who can indicate what to expect over thecoming hours, days, weeks or even seasons. Humanity has developed spectacularly, but is still vulnerable.Science, together with a more consolidated, supportive social structure, allows us to mitigate the effects ofadverse atmospheric changes, especially in the less developed parts of the planet which are often those thatsuffer their consequences most. All this is becoming even more important now that climate change and itseffects are having a global impact, indicating more clearly than ever how the fate of humanity is tied to theplanet on which it lives and that man’s relationship with his environment must be nurtured.
Joint efforts are needed to hold back this process or at least mitigate its effects and, in general, to improvethe usefulness of environmental information and forecasting so that we can improve people’s health andliving conditions. But, above all, it is essential that we extend and improve systems to warn populations ofpossible adverse natural phenomena. To achieve this, a constant dialogue must take place between scientists,politicians and representatives of the sectors and populations that are most at risk.
I would like to express my thanks to all those who participate in these valuable tasks, and I would like toencourage them to persevere. I am sure that their efforts to promote research and dialogue will contribute tobetter understanding between man and his environment and, therefore, to improved living conditions forhumanity as a whole.
Cristina Narbona, Environment Minister of Spain
STATEMENT FROM CRISTINA NARBONA, ENVIRONMENT MINISTER OF SPAIN
0.Intro sections:Paginated book 16/2/07 09:29 Page 9

[ ]10[ ]10
A series of high-profile disasters – the 2004 Indian Ocean tsunami, the Atlantic hurricane season, the SouthAsian earthquake and East African drought in 2005 – underscored the importance of how better cooperationbetween government authorities and international and scientific organizations would have played a criticalrole in helping people make life changing decisions about where and how they live before the disaster strikes,especially in high-risk urban areas. Without taking into consideration the urgent need to reduce risk andvulnerability, the world simply cannot hope to move forward in its quest for reducing poverty and ensuringsustainable development.
The Hyogo Framework for Action 2005-2015: Building the Resilience of Nations and Communities to Disasters,adopted at the World Conference on Disaster Reduction (Kobe, Japan, 18-22 January 2005), represents themost comprehensive policy guidance in universal understanding of disasters induced by vulnerability tonatural hazards, and reflects a solid commitment to the implementation of an effective disaster reductionagenda. By working together in building a strong ISDR system as envisaged in the Hyogo Framework, we caneffectively reduce risk and vulnerabilities, and build our resilience to disasters that affect us all.
The role of National Meteorological and Hydrological Services (NMHS) in national platforms for disastersrisk reduction – a main element of the Hyogo Framework – is essential. The ultimate objective of a naturalhazard warning is not only to issue it on time, but also to make sure it reaches people, allowing for lives andassets to be saved and for minimal disruption to their livelihoods. In this sense, the contribution of NMHS tothe understanding of natural hazards, their impact and human and social vulnerability is a key component ofrisk management. The study and utilization of the Hyogo Framework must become a basic task for NMHSand the regular dialogue with relevant national and local stakeholders a common practice in carrying outtheir functions.
I welcome the partnership between WMO and Tudor Rose and the timely initiative in commissioning thispublication, Elements for Life. The publication can certainly become an important tool to increaseunderstanding and knowledge of individuals and organizations involved in meteorological and hydrologicalservices and disaster risk management to develop team efforts to reduce risk and vulnerability.
Sálvano BriceñoDirector, Secretariat of the International Strategy for Disaster Reduction (UN/ISDR)
STATEMENT FROM SÁLVANO BRICEÑO, DIRECTORSECRETARIAT OF THE INTERNATIONAL STRATEGY FOR DISASTER REDUCTION
´
0.Intro sections:Paginated book 16/2/07 09:29 Page 10

[ ]11[ ]11
I welcome this publication of the World Meteorological Organization, which examines some of the keyinstruments needed to tackle today’s development challenges.
Vulnerability to floods, droughts, wildfires, storms, tsunamis, earthquakes and other natural hazards isaffecting more people around the world. In the decade 1976-1985, close to a billion people were affected bydisasters. By the recent decade, 1996-2005, the decade total had more than doubled to nearly two-and-a-halfbillion people.
A series of extremely high-profile disasters – the Indian Ocean tsunami in 2004, Caribbean hurricane season,the Pakistan earthquake and the East African drought in 2005 – all underscored the importance of bettercooperation between information service providers, government authorities and the international communityfor mitigating risks and saving lives.
Overall, disaster deaths have markedly reduced over the past 50 years, despite the rapid growth in globalpopulation and significant growth in the number of people affected by disasters. Today, we are better prepared,with meteorological services, early warning and response systems, to prevent massive mortality. The challengewe now face is how to use our formidable knowledge and technology to reduce our vulnerability to naturalhazards, beginning with actions taken at the household level and extending up through the highest reaches ofgovernment.
In January 2005, a ten-year plan of action, the Hyogo Framework for Action 2005-2015; Building the Resilience ofthe Nations and Communities to Disasters, was adopted by some 160 governments at the World Conference onDisaster Reduction in Kobe, Japan. In tandem with the World Meteorological Organization and our otherpartners in the International Strategy for Disaster Reduction (ISDR), we are working to support governments inimplementing the Hyogo Framework. Together, we can reduce the risks posed by natural hazards, and in sodoing, help save countless lives.
Margareta Wahlstrom Officer-in-ChargeOffice for the Coordination of Humanitarian Affairsand Acting Emergency Relief Coordinator
STATEMENT FROM MARGARETA WAHLSTROM, OFFICER-IN-CHARGEOFFICE FOR THE COORDINATION OF HUMANITARIAN AFFAIRS
0.Intro sections:Paginated book 16/2/07 09:29 Page 11

[ ]12
1.Policy planning & Governance:Master spread 16/2/07 09:32 Page 12

IPOLICY PLANNING
& GOVERNANCE
1.Policy planning & Governance:Master spread 16/2/07 09:33 Page 13

[ ]14
RECENT DEVELOPMENTS INCLUDING those aimed at thereduction and the mitigation of natural disasters and adap-tation to climate change have resulted in growing interest
in the cost and benefits of meteorological services. NationalMeteorological and Hydrological Services (NMHS) are requiredto reduce costs, improve service levels, contribute towards nationalpriorities, increase accountability and sometimes supplementpublic funding through cost-recovery and commercial activities.
As a result, economic valuation is becoming an integral partof the management of weather services. The valuation serves todemonstrate, often in monetary terms, the socio-economic valueof meteorological information. Also, valuation enables assess-ment of overall performance of service delivery, changes indecision making and behaviour, client satisfaction, awareness ofmeteorological issues and of effectiveness in delivery of publicgood and economic benefits.
Global challenges – poverty eradication and environmental sustainabilityThe eight Millennium Development Goals (MDGs) are key indetermining the cornerstone of international policy, channellingof development funds and prioritization of international agendaup to the year 2015. The cost of implementing these and the asso-ciated socio-economic benefits has not been quantified, but islargely perceived as essential for human welfare. Those of mostdirect relevance to WMO are eradication of extreme poverty andhunger, developing a global partnership for development,combating malaria and other diseases, and ensuring environ-mental sustainability.
The challenges are interdependent and transnational, and theirsolution requires interdisciplinary and collaborative action amonggovernments, international organizations, scientists, the media,the private sector, academic institutions and NGOs. The resourcesrequired are considerable, and priorities often vary significantly.Nevertheless, the challenges serve as a framework for action andfor assessing implementation costs and benefits.
An enviable track recordThe socio-economic value of WMO’s contributions to humanityhas been considerable since its establishment in 1950. The atmos-phere is continuously monitored, with data and productsexchanged freely and in an unrestricted manner. Improvedweather forecasts and early warnings with longer lead time areavailable to all nations. Today a five-day weather forecast is asreliable as a two-day forecast was 20 years ago. Seasonal forecastsbased on El Niño and climate projections are regularly available.The first WMO statements on ozone (1975) and on climatechange (1976) led to the formulation of related conventions onthese subjects.
Economic benefitsIn the USA it is estimated that 15 per cent of gross domesticproduct (GDP) is affected by weather. Experts’ assessments indi-cate that the average annual value of economic losses fromhydrometeorological causes in Russia is 60 billion roubles(approximately USD2.2 billion). In Kenya, up to 60 per cent ofall economic activities are weather and climate sensitive andinvestment in meteorological and hydrological services is knownto save lives and yield returns of 7:1. Overall, the benefits toinvestment ratios in meteorology approximate between 5:1 and10:1, and can even be much higher.
AgricultureSpecialized agrometeorological services, including seasonal fore-casts, contribute to combating droughts and desertification, andensuring effective irrigation and natural disaster preparedness.
Developing countries, where agriculture accounts for over 50per cent of GDP, often pool resources to establish regional centressuch as the AGRHYMET Centre in the Sahel region of West Africaand drought monitoring centres in Eastern and Southern Africa.
Water resources managementWMO’s efforts on water are vital for a wider range of sustainableactivities including agriculture, hydropower, health, preventingand mitigating water-related disasters, and ensuring effective envi-ronmental management.
For cost-effectiveness, a number of nations collaborate withininternationally shared basin organisations. WMO supports theseorganisations by providing expertise in various areas includinghydrological forecasting and integrated flood management.
It is estimated that by 2020, 20 per cent of the world’s energywill originate from hydropower. In the USA, hydrological fore-casting is estimated to yield benefits to costs of 12:1. Hydrologicalforecasting results in reduced flood losses of USD240 million andeconomic benefits of USD525 per annum.
HealthThe MDGs call for halting, and beginning to reverse, incidencesof major diseases by 2015. Occurrences of malaria, dengue fever,the common cold, respiratory problems from atmospheric pollu-
Development challenges –working with the elements
Michel Jarraud, Secretary-General, World Meteorological Organization
Benefits to agriculture• Use of agrometeorological information led to an increase of up to
30 per cent in crop yields in Mali• Meteorological information is used in forecasting the hatching of locusts
and their subsequent movement in Northern Africa• Benefits of El Niño forecasts (altering variety of crops) amount to
USD10 million annually in Mexico• In Canada, weather forecasts result in benefits of CAD6-36 per
acre per year of alfalfa dry hay production.
1.Policy planning & Governance:Master spread 16/2/07 09:33 Page 14

tants, heat wave and cold spells, and diseases like SARS requireincreased vigilance on weather conditions.
EnergyEnergy sources such as solar, wind and biomass offer a renew-able, clean, decentralized and environment-friendly option. Thesealternative energy systems, however, represent a challenging tech-nological and social process, but socio-economic benefits can beestimated for a wide range of applications.
Climate data are used in mapping the potential for such ener-gies and in computer simulation programmes in the design,operation and distribution of both traditional, and new andrenewable energy. This includes the design of biomass energyplants and cooling towers, the operation of landfills and model-ling for environmental impact studies.
Weather forecasts are useful in assessing power requirements,especially in times of extreme weather conditions, and in deci-sion-making relating to the daily performance of energy systems.
Transportation, tourism and constructionAir, sea, rail and road transport systems that are essential to trade,leisure, socio-economic well-being and development, requiretimely and accurate weather information for safety and efficiency.
Marine activities benefit from forecasts of weather, wave andweather-related hazards in areas such as ocean routing, offshoremarine resource development, coastal engineering, towing oper-ations and pollution clean-up.
Meteorological support to road transportation extends toproviding current and forecast information. For example, theforecast of snowfall enables authorities to plan road clearing andsalting with considerable benefits to society.
Tourism is of growing importance for the economy of manycountries, especially those of small island states. Climate changeand sea-level rise, severe weather, damage to infrastructure anderosion of beaches would make the islands and coastal zones lessattractive to tourists.
The construction industry is very sensitive to weather andclimate conditions for the design of buildings, their constructionand maintenance. In the United Kingdom, the average annualloss associated with weather-related damage is estimated atUSD1.6 billion. Damage to residential and commercial structuresis usually the largest portion of this figure.
Natural and human-induced disastersOver the last 25 years, nearly two million people have lost theirlives, with economic losses of over USD1 trillion caused by over7,000 natural disasters related to weather, climate and water. Thenumber of disasters increased fourfold, with economic lossesincreasing fivefold, but with loss of life decreasing threefold. Thisachievement is due to several factors, including the implemen-tation of effective end-to-end early warning systems. WMO isinvolved in all aspects of disaster mitigation from preparednessto relief, and ensures collaboration among nations within cyclonebasins, and with relief agencies.
The insurance industry regularly assesses the cost benefit ofdisaster mitigation. It reckoned that for every dollar spent onprevention and preparedness, approximately USD100-1,000 isneeded for an equivalent effort after a disaster has taken place.
EnvironmentWMO extensively supports environmental activities. It coordi-nates the measurement of many physical parameters related to the
environment. Assessment of socio-economic value of such activ-ities should take into account the short- and long-term benefitsthat all nations derive from such activities. Climate change andozone related activities exemplify some of the issues involved.
Climate changeClimate change is a major environmental issue. Facts includingthe continued increase of greenhouse gases, the rise in globalaverage surface temperature during the last 100 years by 0.74degrees Celsius, the global average sea-level rise between 0.1 and0.2 metres, changes observed in weather phenomena and ecosys-tems, and the melting of glaciers are a source of serious concern.
Based on model projections, the 2007 WMO/UNEPIntergovernmental Panel on Climate Change (IPCC) scientificassessment report states “Most of the observed increase in glob-ally averaged temperatures since the mid-20th century is verylikely due to the observed increase in anthropogenic greenhousegas concentrations” For the next two decades a warming of about0.2°C per decade is projected for a range of emission scenarios.The best estimate for the low scenario is 1.8°C (likely range is1.1°C to 2.9°C), and the best estimate for the high scenario is4.0°C (likely range is 2.4°C to 6.4°C). The upper ranges of sealevel rise for various scenarios would increase by 0.1 m to 0.2 m.
The associated impacts include increased occurrences ofdroughts and flood, beach erosion, infrastructure, fresh watersalinization, siltation of waterways and reductions in crop yields,decreased water availability, melting glaciers, greater exposure tovector- and water-borne diseases and more intense warm periodsand cold spells. The 2007 IPCC report states that the probabil-ity of human activities being responsible for global warming isover 90 per cent.
OzoneThe 1985 Vienna Convention and its 1987 Montreal Protocolcatalysed global action to reduce the use of chemicals damagingto the ozone layer, which shields the earth from ultraviolet radi-ation. Since then, developed countries have virtually eliminatedozone-depleting substances, with the developing world not farbehind. Without these reductions, ozone depletion would haveincreased tenfold by 2050 compared to current levels, resultingin millions more cases of melanoma, other cancers and eyecataracts. The benefits to humanity cannot be overestimated.
Evaluating international governance and policy planning WMO has been exemplary in global efforts to provide data onand assessment of scientific aspects of atmospheric, environmentand water issues, culminating in the adoption of conventions ofsignificance to international environmental governance.
Indeed, the various Conventions, namely those on ozone,climate change, biological diversity and desertification are thefruits of meteorological and hydrological sciences. Some otherinternational policies, strategies and plans of action that havebenefited from meteorological and hydrological input includefood security, water, oceans, natural disasters, habitat and trans-boundary pollutants.
In conclusion, the requirement to assess the economic bene-fits of meteorological and hydrological services presentssignificant challenges to the world community. Social scientists,economists and academia should be involved. In view of thepervasive nature of the sciences and their global reach and rele-vance, the results of indepth socio-economic studies may serveas a model for other mulitidisciplinary sciences.
[ ]15
1.Policy planning & Governance:Master spread 16/2/07 09:33 Page 15

[ ]16
LOCATED AT A geographical crossroads between thesubtropical and medium latitudes, and between theAtlantic and the Mediterranean, Spain has a varied and
complex climate. In many ways this is beneficial for thecountry, but there are also many negative aspects ranging fromperiodic droughts to other adverse phenomena such as torren-tial rainfall, heat waves, strong winds, snowfalls or seriousstorms at sea. Moreover, Spain’s location to the south of Europemakes it very vulnerable in the present global scenario ofclimate change. All of this results in a framework in whichmeteorological, climatic and hydrological research and fore-casting are of great importance.
Spanish meteorologists, through the National MeteorologicalInstitute (INM), the national weather service of Spain, havealways aimed to offer Spanish society the best possible infor-mation with the resources available. In addition to the traditionaltasks of supporting aviation, shipping and farming, they tookon hydrological and then industrial activities as well as services
for the tourism sector and the mass media. Although warningsof adverse weather conditions have always been a priority, it wasonly from 1982, as a result of a combination of meteorologicalevents, technological developments and political timing, thatscientific, technological and operational capabilities for moni-toring and forecasting were really promoted.
The INM has worked together with the Civil Protection author-ities on increasingly advanced operational plans, leading up tothe current Meteoalerta plan which is based on the new criteriafor warnings as laid down by the European MeteorologicalServices. With its different forecasting products for the very short,short and medium terms, the Institute is able to cover all thegeographical scales including more than 8,000 municipal districtsin Spain, with increasing quality and accessibility. This is demon-strated by the spectacular increase in visits to its website, whichoffers thorough and up-to-date information.
As is to be expected, the INM also acts as the ‘notary’ of theSpanish climate. Its archives, containing data from all the
From National Meteorological Institute to Spanish Meteorological Agency:
towards the future
Francisco Cadarso, Director General, Spanish National Meteorology Institute
Tropical storm Delta in the vicinity of the Canary Islands
Imag
e: T
he E
urop
ean
Org
aniz
atio
n of
Met
eoro
logi
cal S
atel
lites
(E
UM
ET
SAT
)
1.Policy planning & Governance:Master spread 16/2/07 09:33 Page 16

[ ]17
and that enhanced services should be offered to its users. It istherefore trying to improve its channels for communicationwith society and to increase its visibility. This is being achievedthrough better product adaptation, constant presence in themedia, a variety of publications and open days.
Despite its myriad achievements, the INM still faces manychallenges. Some result from environmental trends and othersfrom changes in Spanish society. On one hand, the process ofclimate change and the appearance in recent years of manyadverse phenomena relating to temperature, rainfall, wind, etc.require a new strategy for observation and monitoring of vari-ables. There is also a need for new studies to document theoccurrence of such changes and help design policies for adap-tation to change. In addition, Spain’s marked economic growthand fast-changing society is constantly demanding better andmore extensive meteorological coverage. This is leading to thedevelopment of improved products and forms of communica-tion, and to effective collaboration between the INM and thevarious Spanish autonomous communities.
In order to meet these challenges, the Institute must adaptand function in a more flexible way to tie in better with the needsof society. Over the next few months, it is to adopt a new orga-nizational and administrative structure as a State MeteorologyAgency. It is hoped that, under the new structure, the nationalweather service will continue to act as a meteorological land-mark for all Spanish citizens and will serve as a venue forcollaborative international activities in the field of meteorology.
Finally, it is vital that meteorological services are promotedand consolidated as far as possible. This is the only way inwhich we can effectively guarantee the basic infrastructure andessential meteorological and climatological products thatsociety needs with increasing urgency. We must ensure thatsociety views the meteorological services as accessible, usefuland reliable organizations. This will only be possible if we arefully aware of users’ specific needs and are able to offer quality,accessibility and reliability.
Spanish meteorological stations, serve a large number of insti-tutions and private users and form the basis of many studies,especially in the context of climate change in which the moni-toring of trends is a top priority.
None of these activities would be possible without the neces-sary infrastructure. The INM has an extensive observationnetwork both in real time and of a climatic nature, with almost300 automatic stations providing real-time and meteorologicalinformation. There is a network with 15 radars and another forlightning detection, as well as several stations for receiving datafrom various meteorological satellites and a large network formeasuring radiation. From the data processing point of view, theinstitute has Spain’s second most powerful computer, enabling itto use the most advanced forecasting and climate trend models.
The INM also has a broad territorial scope, with 15 regionalmeteorological centres, most of which have regional forecast-ing and monitoring groups as well as research, application anduser service units. All of this enables the specific and increas-ing needs of users in the various autonomous communities ofSpain to be met.
Notwithstanding the above resources, there are few activi-ties in the world requiring such extensive collaboration asmeteorology. For this purpose, INM collaborates activelywithin the World Meteorological Organization (WMO) andwith other European meteorological bodies, such as theEuropean Centre for Medium Range Weather Forecasts, theEuropean Meteorological Satellite Agency and The EconomicInterest Grouping of the National Meteorological Services ofthe European Economic Area. In fact, INM’s internationalresponsibility goes beyond this by focusing on collaborationwith Latin America. This has led to bilateral collaboration withthe meteorological services in the different countries and tocommon programmes drawn up in coordination meetings heldamong their directors. Moreover, many Latin American mete-orologists have received training within the institute, or thanksto grants offered annually in collaboration with WMO. Also,Spanish professionals pay frequent visits to Latin America forseminars, congresses, or for the purpose of offering technicalassistance.
Another field of international activity in which the SpanishInstitute plays a leading role is in the coordination of researchinto the upper atmosphere. This is conducted through theIzaña Observatory on the island of Tenerife, a centre of inter-national renown. This observatory carries out measurementsand studies on radiation and environmental pollution in theframework of national and international scientific projects.
Within Spain, there is ongoing collaboration with the mete-orological services in the autonomous communities and withmany public and private organizations. Activities are also carriedout with universities in the fields of research and education.
The fact that the institute forms part of the Ministry of theEnvironment has led to effective synergies in matters relatingto climate change and adaptation to it with other units andwith the administration in general. This has resulted in a multi-disciplinary approach, promoting collaboration not only inSpain but also within the Latin American community amongmeteorologists, climatologists and those responsible for envi-ronmental policies and civil protection.
All these activities have made the INM a paradigm of qualityand generated a close relationship with Spanish society, as wellas providing important support for global meteorology. Theinstitute is aware, however, that this role must be strengthened INM headquarters in Madrid
1.Policy planning & Governance:Master spread 16/2/07 09:33 Page 17

[ ]18
THE POTENTIAL FOR natural environmental hazards toundermine the internationally agreed MillenniumDevelopment Goals (MDGs) is significant. This is recog-
nized in Section IV of the Millennium Declaration, which statesthe objective “to intensify our collective efforts to reduce thenumber and effects of natural and man-made disasters.”1
Between 1980 and 2000, more than 1.2 million people losttheir lives due to floods, droughts and storms2 with a totalfinancial cost exceeding USD900 billion.3
In recent years, thanks largely to advances in forecasting andassessments, people are better prepared and the number ofpeople killed by extreme events is decreasing. However, thedisruption to livelihoods and human well-being is increasingbecause population growth is forcing more and more peopleto live in coastal zones, flood plains, arid areas and other placeswhich are more vulnerable to natural hazards. In addition,climate-sensitive diseases claim more than one million liveseach year, mostly children under five years of age in develop-ing countries and, without properly considering andresponding to the impact of climate change on human devel-opment, more people will be at risk. Economic losses are alsogrowing, especially in high human development countries.Elsewhere, while the losses may be less in absolute terms, thefinancial impact on countries with low gross domestic productis sufficient to halt or slow human development.
The financial consequences of natural hazards on human well-being are difficult to estimate from current data; however, it isclear that they are large and, unless we understand and reducethe vulnerability of people to natural hazards, human develop-ment itself is at risk. Climate change and weather extremes putat risk investments in infrastructure, agriculture, human health,water resources, disaster management and the environment. Forexample, the transportation infrastructure in Africa is crucial tobringing the continent out of poverty. However, every year largeparts of this network are affected by flooding. The Mozambiquefloods of 2000 damaged roads and railways with costs exceed-ing USD32 million and USD7 million respectively.4
While these financial losses are undeniably significant, it isimportant to recognize environmental hazards as complex,multifaceted problems. For example, ecosystem changes,arising from alterations in rainfall patterns and temperature,are changing the behaviour of crop pests and human exposureto climate-sensitive diseases, as well as changing the length ofthe growing season and irrigation requirements. Meteorologicaland hydrological hazards clearly influence, and potentiallyhinder all aspects of human life, and thus the human devel-opment process itself. Every problem that results from suchhazards has far-reaching and critical effects.
For every person killed in a flood or storm, it is estimatedthat an additional 3,000 lives and livelihoods are disrupted
Weather, climate, water and air quality, and the risk to development
Dr David P. Rogers, Switzerland
For every person killed in a flood or storm, it is estimated that an additional 3,000 lives and livelihoods are disrupted
1.Policy planning & Governance:Master spread 16/2/07 09:33 Page 18

[ ]19
create tools that properly assess risk and can take intoaccount its dynamic nature – climate change and variabil-ity, urbanization, the spread of disease and economicchanges. The present weakness in the availability of relevantclimate information in many developing countries must beaddressed if climate-change risks are to be factored into riskreduction strategies. Central to climate risk managementservices is real-time environmental monitoring, withoutwhich it is difficult to create meaningful regional and localclimate change assessments. Advances have already beenmade in the development of indicators and indices on disas-ter risk. In all cases, their value lies in the availability ofsocial, economic and environmental vulnerability data. Thegoal must be to develop robust national and local risk indi-cators that will influence national development policy andplanning.
At the national level, the meteorological and hydrologicalcommunity must ensure that they are engaged in the country’sdevelopment agenda; that relevant data is readily available forthe development of risk indicators; and that they support theapplication of these tools to inform national policy and plan-ning. On the development community’s side, there is need forgreater openness to the potential contribution of NationalMeteorological and Hydrological Services and their partners.10
A good example of this integration of risk management aware-ness into development policy is presented by the World Bank.It has identified climate change as a risk management issue fordevelopment and has begun to factor this risk into its develop-ment project cycle with the dual purpose of protecting itsinvestments, and improving the impact of development efforts.11
A critical step is the mainstreaming of climate risk managementinto countries’ economic planning, and capacity building inministries of finance and economic planning to use climate infor-mation to manage risks to public sector investment.12 In along-term programme to help Kiribati adapt to climate change,for example, a Global Environment Facility project was startedin the Ministry of Finance and Economic Planning and thenmoved to the Office of the President as part of a NationalStrategic Risk Management Unit, highlighting the importanceof the effort for Kiribati’s development strategy.13
At the international level, the meteorological and hydrolog-ical community must work to increase the value of long-rangepredictions so that the impact of climate variability and changecan be included in assessments of the likely occurrence ofextreme events – floods, droughts, storms – which are criti-cal factors in determining environmental vulnerability.
In conclusion, achieving the MDGs requires a partnershipbetween development planners, policy makers, and the riskmanagement community – a partnership between environ-mental and social scientists, between understanding naturalphenomena and human behaviour. In general, the fragmenta-tion between ministries and agencies in most countries is animpediment to tracking the relationship between disaster risklevels and development planning and policy. The environ-mental vulnerability component of risk is addressed byunderstanding hazards of the past, monitoring of the present,and prediction of the future. Combined with social, politicaland economic factors, risk indices can be built that help thedevelopment community make informed decisions that mayaccelerate human development by ensuring, for example, thatschools, water, sanitation, roads, energy, telecommunication,and other infrastructure are built to be disaster resistant.
through the death or incapacitation of a primary income earner,the consequences of migration or resettlement, or the numberof people experiencing secondary health and educationalimpacts.5
United Nations Development Program (UNDP), InternationalStrategy for Disaster Reduction The World MeteorologicalOrganization, other UN agencies, international organizations,6
and many national governments have recognized that sustain-able development depends on understanding and responding tothe issues that can prevent a natural hazard from triggering ahuman disaster.7 The goal of the development and environ-mental communities is to minimize the human risk of naturalhazards by reducing the vulnerability of the population in orderto protect and sustain social and economic development. In thisway natural disaster preparedness and management not onlysaves lives, but can also promote early and cost-effective adap-tation to climate risks. Many studies have estimated that theinternal rate of return from disaster reduction initiatives isbetween 20 per cent and 50 per cent and often provides addi-tional, sometimes unanticipated, social benefits.8
Flood-alleviation projects, for example, increase the availabil-ity of water for irrigation, and can offset the impacts of drought.
Vulnerability is the susceptibility and resilience of societyand the environment to natural hazards. Different populationsegments and sectors can be exposed to greater relative risksbecause of their socio-economic conditions of vulnerability.The impact of a natural hazard on a population already suffer-ing from extreme poverty, epidemic disease, or armed conflictis likely to be catastrophic since that population will proba-bly lack the organizational capacity to protect itself againstthat hazard. Reducing disaster vulnerability requires knowl-edge of the social, cultural, political and economic conditionsof the population, and the likelihood, consequences, immi-nence and presence of natural hazards. Thus risk assessmentrequires the complementary input of physical and socialscientists to determine the vulnerability of the population tonatural hazards.
Each of the MDGs must interact with disaster risk. Onewould expect that the goals would contribute to reducinghuman vulnerability; however, unless these risks are properlyfactored into the development process, well-meaning socialand economic development efforts may inadvertently increasethe vulnerability of a population and slow down or undermineefforts to achieve the MDGs. UNDP has explored the relation-ship between development and disaster risk in great detail.9
In its view, achieving more sustainable development that meetsthe MDGs is not possible unless risk management is includedwithin the programme. The challenge lies in devising tools forpolicy makers that justify the closer cooperation of disasterand development policy. UNDP defines three steps:1. The collection of basic data on disaster risk and the devel-
opment of planning tools to track the changing relationshipbetween development policy and disaster risk levels
2. The collation and dissemination of ‘best practice’ informa-tion on development planning and policy that reducesdisaster risk
3. The galvanising of political will to reorient both the devel-opment and disaster management sectors.
Step one must engage the meteorological and hydrologicalcommunity at all levels, from the local to the global, to workwithin the risk management sector. More effort is needed to
1.Policy planning & Governance:Master spread 16/2/07 09:33 Page 19

[ ]20
THE TRANSPORT SECTOR accounts for approximately 25per cent of global carbon dioxide (CO2) emissions. It isthe sector with the highest growth in emissions, and the
second largest contributor overall, after the electricity and heat-supply sector. The additional effects of transport includeaccidents, noise, congestion, land-use and air pollution; withrelated damage to health, and to urban and rural environments.
Efforts to mitigate the level of emissions from transport arein evidence. Fuel is cleaner than ever and the manufacture andperformance of vehicles is more environmentally friendly andproduces fewer, and reduced quantities of pollutants andharmful emissions. However, these efforts are vastlyoutweighed by the enormous increase in demand for bothpassenger and freight services, along with the drastic growthin road transport and aviation.
If developing countries adopt western travel patterns, thenumber of cars and commercial vehicles, currently 800 million,
will rise to 1.6 billion by 2030. Based on present populationgrowth estimates, this is approximately one vehicle for everyfive people on the planet. According to the European TransportForum 2003, this growth will be predominantly observable incountries such as Brazil, China, India, Korea, Mexico, Russiaand Thailand where people are enjoying increased prosperityand seeking greater mobility.
Climate changes have been estimated to represent 30% ofthe total external costs caused by transport in Europe(IWW/INFRAS 2004). This corresponds to 195 billion Euroof which 57% is generated by road transport, 41% caused byair transport and 1% by railways.
In spring 2006 the European Environment Agency (EEA)launched its 2005 term report, challenging politicians toresolve the conflict between transport and environmental poli-cies. The EEA report identified a gap between the ambitiousaim of achieving sustainable development in the European
The consequences of climate change to rail infrastructure
Margrethe Sagevik, International Union of Railways
Freight train in Swedish landscape
Phot
o: J
an S
kogl
und
1.Policy planning & Governance:Master spread 16/2/07 09:33 Page 20
[ ]21
gas emissions. Moving from road to rail is the key to achiev-ing the Kyoto Protocol targets and attaining a sustainableglobal transport policy for the future. Since 1990, railway isthe only transport mode to have decreased its share of CO2
emissions. A concrete example of the benefits of rail can be seen in the
recent efforts of the German rail system. In 1990 GermanRailways set themselves the goal of reducing their energyconsumption by 25 per cent. By 2002, three years ahead ofschedule, they achieved this target. They have already set ambi-tious targets for reducing energy consumption by a further15-25 per cent by 2020. These achievements are primarily theresult of the network’s ongoing EnergieSparen (Save Energy)project. The strategy aims to reduce energy consumption by10 per cent, through encouraging drivers to act in a moreenergy-efficient way. Several European railways have adoptedsimilar projects.
A modal shift, from road and air transport to rail, is the keyto achieving a sustainable global transport policy for the future.Therefore the mission of the International Union of Railways
transport sector, and what was actually happening. The sectoris the fastest growing consumer of energy, and simultaneouslythe fastest growing producer of greenhouse gases in theEuropean Union. Transport is essential, but also highly envi-ronmentally damaging. Thus the aim should be to shed, as faras possible, its terrific costs, whilst retaining viability andsustainability.
Transport policies increasingly recognize the need to restrainthe sector’s growth, and to improve the market shares of itsvarious transport modes. Fair and efficient pricing, better-targeted investments and spatial planning are some of thepolicy tools that can help to achieve this.
The environmental advantages and sustainability of railwaysRailways are the potential backbone of smart, sustainable trans-port systems. They have a low environmental impact,high-energy efficiency, and superb accessibility and safety.Nevertheless, the railway is continuously striving to improve,in order to meet the growing expectations of society andbecome an ever better, quieter and cleaner service.
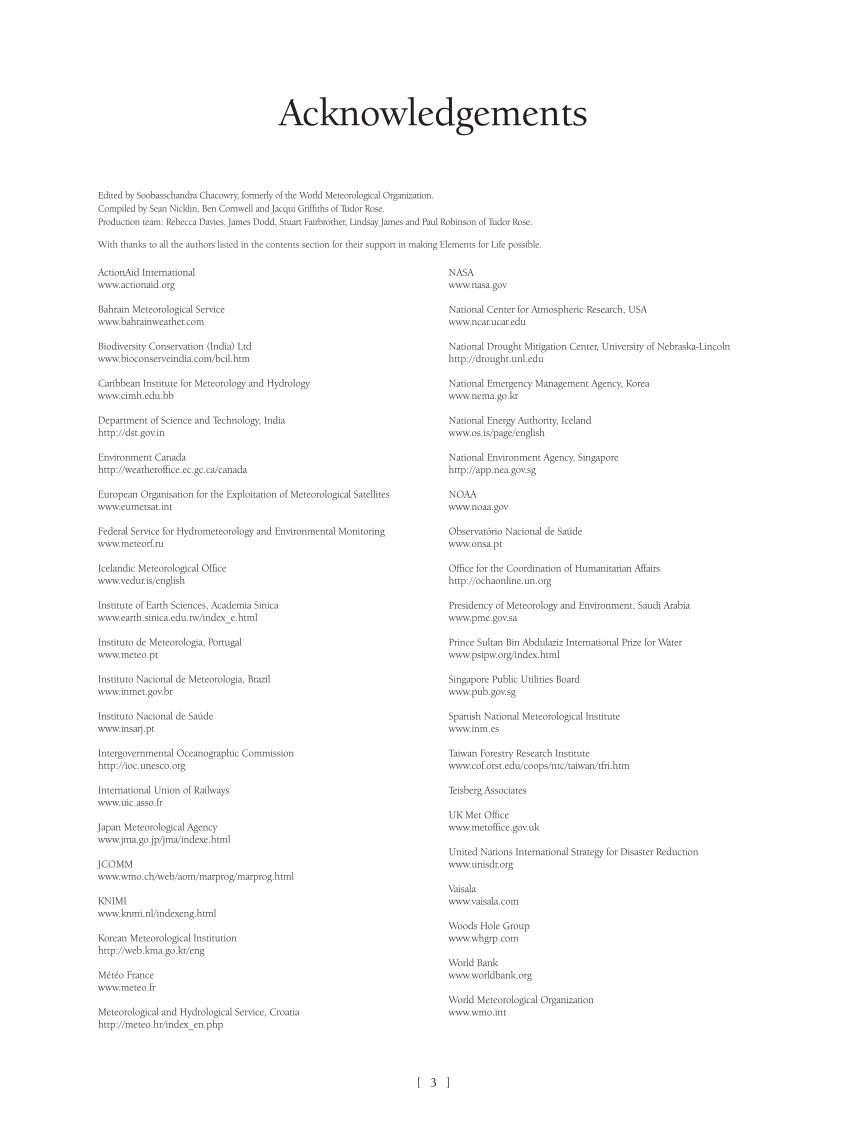
All transport surfaces impinge on natural and agriculturalareas, and can present a threat to the existence of wild plantsand animals. However, in terms of spatial efficiency, railoffers the least harmful of transport surface solutions. Thisis particularly important in urban and densely populatedareas. The transport of 50,000 people per hour along thesame routes requires a 175 metre wide road for cars, a 35metre wide road for coaches, but only a nine-metre wide railnetwork.
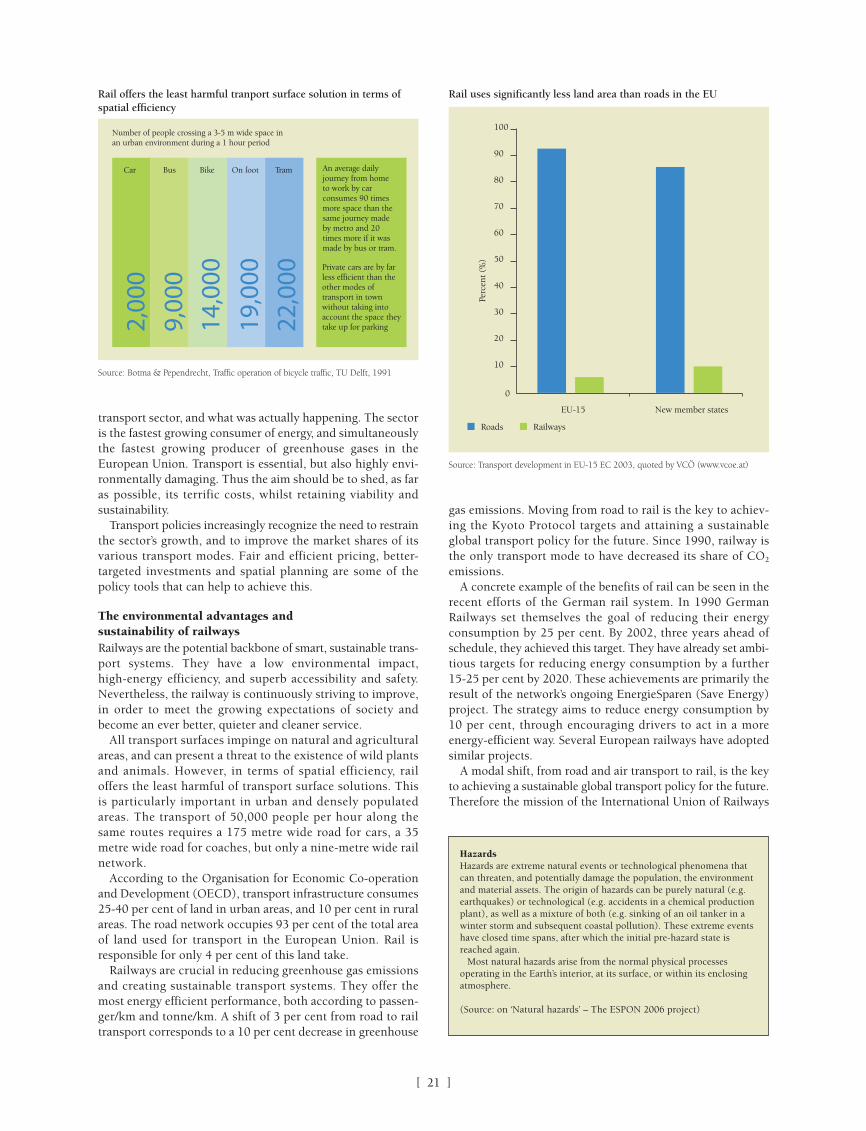
According to the Organisation for Economic Co-operationand Development (OECD), transport infrastructure consumes25-40 per cent of land in urban areas, and 10 per cent in ruralareas. The road network occupies 93 per cent of the total areaof land used for transport in the European Union. Rail isresponsible for only 4 per cent of this land take.
Railways are crucial in reducing greenhouse gas emissionsand creating sustainable transport systems. They offer themost energy efficient performance, both according to passen-ger/km and tonne/km. A shift of 3 per cent from road to railtransport corresponds to a 10 per cent decrease in greenhouse
Rail offers the least harmful tranport surface solution in terms ofspatial efficiency
Source: Botma & Pependrecht, Traffic operation of bicycle traffic, TU Delft, 1991
Car Bus Bike On foot Tram
2,00
0
9,00
0
14,0
00
19,0
00
22,0
00Private cars are by far less efficient than the other modes of transport in town without taking into account the space they take up for parking
Number of people crossing a 3-5 m wide space in an urban environment during a 1 hour period
An average daily journey from home to work by car consumes 90 times more space than the same journey made by metro and 20 times more if it was made by bus or tram.
Rail uses significantly less land area than roads in the EU
0
10
20
30
40
50
60
70
80
90
100
EU-15 New member states
Perc
ent (
%)
Roads Railways
HazardsHazards are extreme natural events or technological phenomena thatcan threaten, and potentially damage the population, the environmentand material assets. The origin of hazards can be purely natural (e.g.earthquakes) or technological (e.g. accidents in a chemical productionplant), as well as a mixture of both (e.g. sinking of an oil tanker in awinter storm and subsequent coastal pollution). These extreme eventshave closed time spans, after which the initial pre-hazard state isreached again.
Most natural hazards arise from the normal physical processesoperating in the Earth’s interior, at its surface, or within its enclosingatmosphere.
(Source: on ‘Natural hazards’ – The ESPON 2006 project)
Source: Transport development in EU-15 EC 2003, quoted by VCÖ (www.vcoe.at)
1.Policy planning & Governance:Master spread 16/2/07 09:33 Page 21

[ ]22
(UIC) is to ‘promote rail transport in order to meet the chal-lenges of mobility and sustainable development.’
Climate change and transport – cause and effectGlobal warming is becoming more visibly evident, and withthis revelation, climate change is receiving increased globalattention. The pressure is on governments and individuals tolearn more about the cause and the effects of global warming,and how to deal with it.
However, while we have a decent understanding of the likelycauses of climate change, the consequences advance quickly andare hard to predict. Observable effects vary from region to region,and include track buckling, heavy rain, storms, flooding, land-slides and avalanches, and catastrophic scenarios such ashurricanes and tsunamis. These threats represent huge poten-tial damage to transport infrastructure, and demand newattitudes toward its planning, construction and maintenance.
It is important to differentiate between natural hazards andthe effects of climate change. While the appearance of the twois often similar, the causes and consequences are significantlydifferent.
Traditionally, the threat of natural hazards has been an inte-grated element in the planning and construction of railinfrastructure. For example, Swedish construction of roads andtracks incorporates specific dimensioning in order to cope withthe ‘50 years deluge’. However, much international rail infra-structure was constructed more than 100 years ago, and inmany places rail tracks have suffered from lack of proper main-tenance, due primarily to company cutbacks.
The increased occurrence of extreme weather eventsdemands a re-evaluation of how we design and maintain ourtransport systems. Policymakers, planners and constructors
will have to work harder and with greater innovation to ensuretransport safety, availability and quality.
The consequences of extreme weather differ according tofactors such as geography, topography, geology and populationdensity. For example, the effects of heavy rain on a landscapewill differ depending on the porosity of the soil. Trends insociety, such as the urbanization process, are also influential.For example, asphalt and clear-felled areas increase the inten-sity of flooding.
More specifically for the rail services, extreme weather canlead to actual damage of the tracks, signals, etc. This can causefurther damage to trains, staff, passengers and property. In addi-tion, such damage can lead to extended suspension of service.In a vulnerable society where transport and economy areclosely linked, this will lead to major costs.
There is also the potential that technical aspects of the train,designed for a certain environment, might not function asexpected when the context changes. A rail fleet is normallydesigned to last 30 years. Thus, changes in the natural envi-ronment represent a challenge for the future design of trains.For example, disruptions in UK rail services have been putdown to the ‘wrong’ type of leaves causing wheel slip, or eventhe ‘wrong’ type of snow resisting rail clearance procedures.To reduce and avoid such weaknesses in planning andconstruction, closer cooperation with local climatologists,meteorologists and hydrologists is necessary.
Another practical difficulty resulting from global warmingrelates to the prediction of soil structure. In particular theimpact on mountainous, coastal and riverine regions has beenwell documented. In Tibet, the enormous railway project tolink the area with the rest of China has been dogged by envi-ronmental concerns. With the loss of permafrost as a directconsequence of climate change, the long-term sustainabilityof the project is severely weakened. Similarly, increased rain-fall in areas of Asia prone to landslips (Philippines andIndonesia in particular) will prove dangerous to fixed landinfrastructure in the future. Early consultation with climatol-ogists can highlight regions of increased disaster probability,and ensure that the tracks are built in more sustainable areas.The study of the consequences of global warming on transportand rail infrastructure is in continuous development; increasedobservations, studies and data are required to cope with thisadvancement.
Rail infrastructure: a UIC studyRecently, UIC launched its first study into the effects ofclimate change on rail infrastructure in Alpine regions, in flatregions near the coast and near rivers in central Europe. Theaim of the project is to examine the rise in temperature andits consequences for permafrost areas in the Alpine regions,as well as considering the necessity for early detection ofrisks, and the securing of tracks. Specific cases for investiga-tion include:
• Hydroelectric power plants as a secure power supply forrailways
• Simultaneous melting of snow in the Alps and in the lowmountain ranges, and how this will affect seasonal riverflow
• Effects of sea-level rise on track safety • Effects of heavy storms on power supply, tracks (fallen
trees) and the driving dynamics related to cross winds andwind shear. Rail tracks in tough weather
Phot
o: J
an S
kogl
und
1.Policy planning & Governance:Master spread 16/2/07 09:33 Page 22

These expected climate change effects, along with the increaseddemand for rail transport, strongly emphasise the need forenvironmentally aware rail transport programmes.
Strengthened international and inter-regional cooperation isanother evident consequence of global warming. It is essentialthat this unification be channelled towards the planning andconstruction of transport infrastructure. Regions that are famil-iar with extreme climate conditions will have valuableexperience to share with less experienced regions. For example,Canadian and Alaskan railway operators are experienced atpreparing for, and reducing the effects of landslips on theirservice. This technology and experience could be transferredto railway infrastructures in less developed economies that arebeginning to experience similar problems.
UIC will be at the forefront of international development inthe rail sector. For example, the findings and results of the firstUIC project regarding climate change effects on rail infra-structure will be transferred to UIC members all over the world.
It is important to bear in mind that in developing countriesthe consequences of climate change on transport and railinfrastructure have an extra dimension. Transportation repre-sents access to food, medicines, education and employment;everything that represents human well-being and economicgrowth. More specifically, infrastructure development plays anessential role in the reduction of rural poverty because of itsimportance to agriculture. Electricity and irrigation are bothinitially possible only through the advances of transportsystems. Furthermore, effective transport is needed to sellagricultural products to the relevant distributors andconsumers.
Therefore, new thinking is required when it comes to trans-port in developed countries and in emerging economies. Asmart and sustainable, unified transport system is necessary to
[ ]23
Freight transport offers a more sustainable alternative particuarly in terms of safety, landtake and energy efficiency
Phot
o: U
IC
reduce human and economic costs. Social and environmentaleffects of climate change need to be included into cost-benefitanalyses and decision-making. Governments must support thedevelopment of sustainable mobility by educating the publicabout the effects of conventional transport on the environment,and by giving the market economic incentives to facilitate theneeded modal shift. This should also include incentives forpeople to make more sustainable transport choices.
What needs to be doneTo be prepared for the increasing consequences of globalwarming to its infrastructure the rail sector is addressing boththe causes and the effects of climate change – firstly, by offer-ing a service that causes fewer emissions than its alternatives,and secondly, by expanding its existing expertise to minimisethe effects of climate change on rail infrastructure, and thusreducing the damages and costs these effects imply for society.
Such expansion of knowledge and its application will notcome easily. New thinking and non-traditional cooperationacross sectors and professional areas will be necessary. Forexample, despite much practical experience, the transportsystem could benefit from working more closely with meteo-rologists and climatologists to predict, and mitigate the effectsof extreme weather. This technology transfer will lead to newexpertise and generate greater ‘preparedness’.
Since climate change represents a uniform, internationalthreat, the cooperative process can then be applied to the globalstage. This strategy should also include the development ofsmart, sound and sustainable transport systems in all parts ofthe world. The advantages of rail recommend it as the idealbackbone for such a system. It promises greater safety,improved access and reduced emissions; in short, a higherquality of mobility, and a higher quality of life.
1.Policy planning & Governance:Master spread 16/2/07 09:33 Page 23
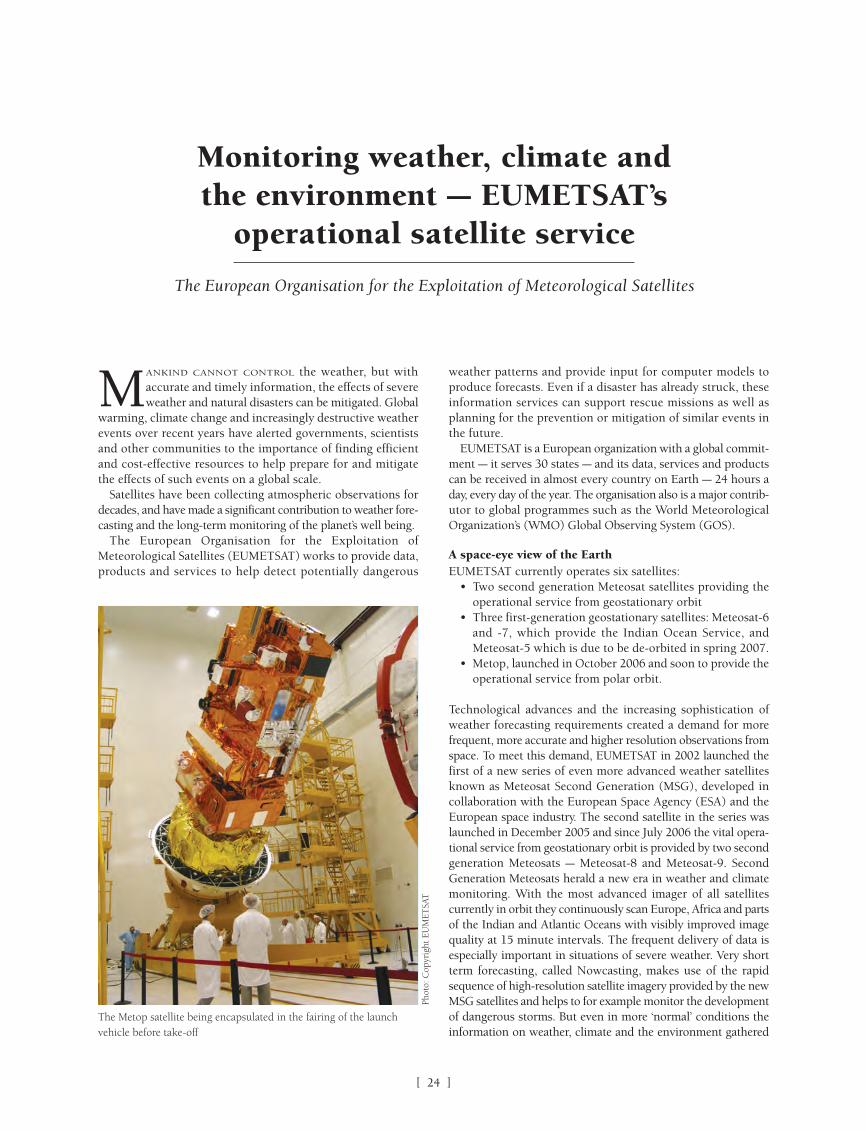
[ ]24
MANKIND CANNOT CONTROL the weather, but withaccurate and timely information, the effects of severeweather and natural disasters can be mitigated. Global
warming, climate change and increasingly destructive weatherevents over recent years have alerted governments, scientistsand other communities to the importance of finding efficientand cost-effective resources to help prepare for and mitigatethe effects of such events on a global scale.
Satellites have been collecting atmospheric observations fordecades, and have made a significant contribution to weather fore-casting and the long-term monitoring of the planet’s well being.
The European Organisation for the Exploitation ofMeteorological Satellites (EUMETSAT) works to provide data,products and services to help detect potentially dangerous
weather patterns and provide input for computer models toproduce forecasts. Even if a disaster has already struck, theseinformation services can support rescue missions as well asplanning for the prevention or mitigation of similar events inthe future.
EUMETSAT is a European organization with a global commit-ment – it serves 30 states – and its data, services and productscan be received in almost every country on Earth – 24 hours aday, every day of the year. The organisation also is a major contrib-utor to global programmes such as the World MeteorologicalOrganization’s (WMO) Global Observing System (GOS).
A space-eye view of the EarthEUMETSAT currently operates six satellites:
• Two second generation Meteosat satellites providing theoperational service from geostationary orbit
• Three first-generation geostationary satellites: Meteosat-6and -7, which provide the Indian Ocean Service, andMeteosat-5 which is due to be de-orbited in spring 2007.
• Metop, launched in October 2006 and soon to provide theoperational service from polar orbit.
Technological advances and the increasing sophistication ofweather forecasting requirements created a demand for morefrequent, more accurate and higher resolution observations fromspace. To meet this demand, EUMETSAT in 2002 launched thefirst of a new series of even more advanced weather satellitesknown as Meteosat Second Generation (MSG), developed incollaboration with the European Space Agency (ESA) and theEuropean space industry. The second satellite in the series waslaunched in December 2005 and since July 2006 the vital opera-tional service from geostationary orbit is provided by two secondgeneration Meteosats – Meteosat-8 and Meteosat-9. SecondGeneration Meteosats herald a new era in weather and climatemonitoring. With the most advanced imager of all satellitescurrently in orbit they continuously scan Europe, Africa and partsof the Indian and Atlantic Oceans with visibly improved imagequality at 15 minute intervals. The frequent delivery of data isespecially important in situations of severe weather. Very shortterm forecasting, called Nowcasting, makes use of the rapidsequence of high-resolution satellite imagery provided by the newMSG satellites and helps to for example monitor the developmentof dangerous storms. But even in more ‘normal’ conditions theinformation on weather, climate and the environment gathered
Monitoring weather, climate and the environment – EUMETSAT’s
operational satellite service
The European Organisation for the Exploitation of Meteorological Satellites
The Metop satellite being encapsulated in the fairing of the launchvehicle before take-off
Phot
o: C
opyr
ight
EU
ME
TSA
T
1.Policy planning & Governance:Master spread 16/2/07 09:33 Page 24

[ ]25
In addition, the NWP SAF hosted by the UK Met Office canexploit Metop’s data to generate supporting data, software pack-ages, validation products and other services for use in NWP,climate studies and atmospheric research.
Scatterometer wind measurements are of great importance toweather forecasting and climate monitoring, as demonstratedthrough various research missions over the past decade. Datafrom the advanced scatterometer (ASCAT) is further processedby the Ocean and Sea Ice (OSI) SAF, led by Météo-France, toprovide global ocean surface wind vectors that are necessaryfor the definition of atmospheric circulation on small scales andin the tropics. The main application of this is the assimilationof wind measurements into NWP models. Scatterometermeasurements can also be used for monitoring sea ice, snowcover or land surface parameters such as soil moisture.
A combination of the advanced TIROS Operational VerticalSounder (ATOVS) suite and the Advanced Very High-resolu-tion Radiometer (AVHRR), currently flown on NOAAsatellites, are also operated on board Metop. ATOVS/AVHRRcovers the visible, infrared and microwave spectral regions,making this combination useful for a variety of applicationssuch as cloud and precipitation monitoring, determination ofsurface properties or humidity profiles, all of which play a keyrole in NWP.
Monitoring climate and the environmentThe likely impact of extreme weather events, climate changeand human activities on the environment can be predictedusing computer models that use satellite data collectedcontinuously over many decades. These predictions revealpressing environmental issues and enable them to beaddressed more effectively, ensuring that national policiesand activities are consistent with the goal of sustainable devel-opment.
All the instruments on board Metop contribute to globalclimate monitoring models and applications, helping scientiststo understand the complex interactions between the variousfactors that influence the Earth’s climate system.
In particular, IASI’s ability to detect and accurately measurethe levels and circulation patterns of gasses known to influ-ence the climate, such as carbon dioxide (CO2), will herald abreakthrough in the global monitoring of the climate. The datacollected by IASI will feed into models to show for the firsttime the variable global distribution of CO2 as a function ofseasons and circulation anomalies, such as the southern oscil-lation (also known as El Niño) and the North Atlanticoscillation.
The depletion of the ozone layer is currently of particularenvironmental concern, and is especially noticeable over theArctic and Antarctic regions. The resulting increased levels ofultraviolet radiation have harmful effects on agriculture, forestsand water ecosystems – and people.
The Global Ozone Monitoring Experiment (GOME-2) willmeasure ozone profiles, total columns of ozone and otheratmospheric constituents like nitrogen dioxide and sulphurdioxide. The trace gases observed are related not only to thedepletion of ozone in the stratosphere, but also to sources suchas volcanic eruptions and biomass burning. Long-term moni-toring of the trace gases will provide more insight into theimpact of man-made sources of pollution on the environment(including air quality) and the climate, on both regional andglobal scales.
by the new generation of Meteosat satellites is vital to ensure dailylife and business. For scientists, the data gathered by satellites arealso invaluable for climate monitoring. However, the geostation-ary position of the Meteosat satellites implies that in order todeliver the highly detailed observations of atmospheric conditionsthat meteorologists and climatologists require, a low earth orbitsystem was needed to complement the geostationary service.
In response to this need, the councils of EUMETSAT and theEuropean Space Agency (ESA) agreed plans to design, develop,launch and operate a polar satellite system for Europe. TheEUMETSAT Polar System (EPS) programme was then approvedin 1999.
In 1998 EUMETSAT and the National Oceanic andAtmospheric Administration (NOAA) began collaborating onthe Initial Joint Polar System (IJPS), comprising two polar-orbiting satellite systems and their respective ground segments.A further agreement in 2003, the Joint Transition Activitiesagreement, saw the two organizations working to provide anoperational polar-orbiting service until at least 2019.
Metop and Numerical Weather PredictionNumerical Weather Prediction (NWP) is the basis of all modernglobal and regional weather forecasting, and EUMETSAT’s Metopsatellites will make a substantial contribution in this area.
Metop serves the operational requirements of the meteoro-logical services and other users around the world, includingthe WMO and EUMETSAT’s Member and Cooperating States.The first satellite of the EPS system was launched in 2006 fromBaikonur, Kazakhstan. Its altitude of 837km makes it approx-imately 42 times closer to the Earth than a geostationarysatellite, and it can therefore observe smaller areas in consid-erably finer detail. Data gathered by Metop will revolutionisethe way weather, climate and environment are observed, andwill significantly improve operational meteorology.
Data generated by instruments onboard Metop can be assim-ilated directly into NWP models in order to compute forecastsranging from a few hours to ten days ahead. Measurements frominfrared and microwave radiometers and sounders on boardMetop provide NWP models with global information on thetemperature and humidity of the atmosphere with a high verti-cal resolution. The Infrared Atmospheric SoundingInterferometer (IASI), for example, provides important dataincluding highly detailed global measurements of atmospherictemperature and water vapour, making it possible to ascertaintemperature and humidity profiles with a vertical resolution of1km, accurate to 1 degree Celsius and ten per cent respectively,at a horizontal sampling of 20km.
Metop’s Global Navigation Satellite System Receiver forAtmospheric Sounding (GRAS) instrument presents a newmethod for using satellite observations in NWP models forweather forecasting and climate monitoring. Using radiosignals continually broadcast by the GPS satellites of the GlobalNavigation Satellite System orbiting the Earth, GRAS measuresthe time delay of the refracted GPS radio signals as the raysignal path skirts the Earth’s atmosphere on its way from thetransmitting GPS satellite to the GRAS receiver on Metop. Thisdelay is then processed to obtain vertical profiles of atmos-pheric parameters, such as temperature and water vapour inthe stratosphere and troposphere.
The data collected by GRAS will be further processed intosounding products by the GRAS satellite application facility(SAF), which is hosted by the Danish Meteorological Institute.
1.Policy planning & Governance:Master spread 16/2/07 09:33 Page 25

[ ]26
GOME-2’s capacity to significantly extend the long timeseries of measurements already gathered by GOME-1 is veryimportant, as this will significantly impact our capability tomodel the climate system, leading to improved medium tolong-term climate forecast capabilities.
Towards operational ocean altimetry – Jason-2To better understand the forces behind global climate changesand to predict seasonal anomalies in weather patterns, it is vitalto understand the physics of the ocean. Satellites offer a real-timeglobal view of the oceans, in addition to sparse in-situ observa-tions. Radar altimetry can measure the height of the sea surfaceand detect the slightest variation in ocean levels to the nearestcentimetre. Using this information to study the growth and evolu-tion of surface waves in response to winds and tidal forcing willenable calculations of dynamic topography to derive the posi-tions and intensities of ocean currents, eddies and thermal fronts.
The Jason mission is built around a series of satellites that willcollect global ocean surface data on a continuous basis for severaldecades. EUMETSAT will soon extend its activities and servicesinto ocean altimetry, with the launch of Jason-2 in 2008. Jointlydeveloped by NASA and the French space agency, Jason-2 willbe operated by NOAA and EUMETSAT. The satellite will overlapwith the Jason-1 mission to allow more precise cross-calibrationbetween the two systems, to within a few tenths of millimetres.
Jason-2 is a Low Earth Orbit (LEO) satellite, flying at an alti-tude of around 1300km. The main instruments on board are aradar altimeter, a microwave radiometer, and several preciseorbit determination systems. The aim is to measure the globalsea surface height to an accuracy of a few centimetres everyten days, in order to determine ocean circulation, climatechange and rising sea levels.
These data can be applied in marine meteorology, operationaloceanography, seasonal prediction and climate monitoring. Theinformation on sea surface height can be assimilated into numer-ical ocean circulation and wave models, and in combination within-situ measurements it will provide vastly improved ocean fore-casts, both for shorter and longer timescales.
Jason-2 is expected to provide an important contribution toEUMETSAT’s future activities in the field of oceanography,serving the marine core services of the Global Monitoring forEnvironment and Security initiative (GMES).
View of EUMETSAT headquarters at Darmstadt, Germany
Phot
o: C
opyr
ight
EU
ME
TSA
T
Global Monitoring for Environment and SecurityEUMETSAT is working to provide a major contribution to theGMES initiative, led by the European Commission and ESA.The initiative is a strategic response to environment and secu-rity issues, and contributes to the Global Earth ObservationSystem of Systems.
The goal of GMES is to establish an operational Europeancapacity for the timely provision of quality ground, air andspace-based data, information and knowledge in support of awide range of European policy areas. EUMETSAT’s work as aprovider of timely, high quality near-real-time satellite data ona continuous basis is crucial to the operational remit of GMESand constitutes a key element of its operational services.
These services are provided through EUMETSAT’s opera-tional satellite systems. The latest of these, MSG, will be fullyoperational until 2015, and planning is already underway forMeteosat Third Generation (MTG) satellites to continue theservice beyond this timeframe. EUMETSAT will also be theoperator of the ESA GMES satellites (called “Sentinels”) foroperational oceanography and atmosphere monitoring.
High-capacity data distributionEUMETSAT’s unique high-capacity data distribution system,EUMETCast, has already demonstrated its ability to deliver awide variety of data gathered by its own and other satellitenetworks, all of which are potential sources of data for GMES.Any EUMETCast user station can provide end-users with rapid,with rapid, low cost operational access to global data andimagery in near real time, 24 hours a day, every day of the year.
Among its many uses, EUMETCast supplies continuoussatellite data and products free of charge for the AfricanMonitoring of the Environment for Sustainable DevelopmentInitiative, in which EUMETSAT plays a key role. The serviceis also set to play a significant role in the future of globalclimate monitoring.
In the longer term, EUMETSAT has the capability to becomethe satellite operator for selected future GMES missions. Theorganization plans to achieve this through the operation andmanagement of satellite and ground systems, as well asonboard instruments on behalf of the EC, and by facilitatingopportunities for EC-sponsored instruments to be carried onthe satellites of EUMETSAT’s international partners.
1.Policy planning & Governance:Master spread 16/2/07 09:33 Page 26

[ ]27
STRICTLY SPEAKING, Planet Earth should more properly beknown as Planet Water, or Planet Ocean. Monitoring andforecasting the behaviour of the ocean is a major chal-
lenge for the 21st century, as it equates to the sustainabledevelopment of economic activities in the open sea and incoastal areas, and to the implementation of global climatemonitoring and prediction systems.
Real-time operational data, information, products andpredictions will increasingly be used in support of a large andexpanding range of societal applications and benefits.Undeniably then, the oceans constitute a critical componentof the lifeblood of our society – thus monitoring, in order tounderstand and manage them, is vital.
The observing systemDelivery of effective ocean products and services requires long-term and reliable access to global data of guaranteed quality.The Global Climate Observing System’s second report gives asummary of the capability of the present observing system toaddress large-scale climate requirements, and recommends theimplementation of the initial global ocean observing system.This strategy will, in practice, support a full range of diverseuser requirements, including numerical weather prediction,marine hazard warning and mitigation, and marine environ-mental monitoring and management.
Ocean observations are currently collected entirely on an inde-pendent, national basis. In the interest of greater range, accuracy
Ocean data, information, products andpredictions in the service of society
Dr Peter Dexter, Co-president, JCOMM, MelbourneJohannes Guddal, past Co-President, JCOMM, Bergen
Candyce Clark, Intergovernmental Oceanographic Commission (IOC) Secretariat, Paris
In situ ocean observing system status, September 2006 (JCOMMOPS)
Source: JCOMMOPS
1.Policy planning & Governance:Master spread 16/2/07 09:33 Page 27

[ ]28
• High-resolution hydrodynamic models for coastal navi-gation and hazard reduction
• Sediment transport and turbidity• Advance warning of environmental impacts/events.
Marine ecosystems management: fisheries and biogeochemistry –Maritime nations share the challenge of managing and sustain-ing the oceans’ living and non-living marine resources forpresent and future generations. This requires an integratedecosystems approach. Such strategies are characterized by accu-rate knowledge of the factors that affect the oceans, andestimates and predictions of circulation and biogeochemicalinteractions and cycles. These issues are a major focus of GlobalOcean Observing System’s coastal ocean observing systemdesign and implementation plans.
There is a growing need for oceanographic information ofvarious timescales in order to support the monitoring, andsustainable management of fisheries. The most important infor-mation relates to extreme ecosystem events, since these willhave the greatest impact on the largest number of people.Extreme weather predictions can be used effectively in predict-ing, and thus mitigating the effects of global problems such ascoral bleaching, HABs, river pollutant pulses and mass extinc-tion due to ecosystem imbalance.
Crisis management: search and rescue, and marine emergencyresponse – In what is generally termed ‘public good services’,ocean data, products and predictions are made available for arange of activities and operations which take place in the publicdomain, or for which governments have a direct responsibility.
There are two types of applications: 1. Data and products used in an immediate and disposable
fashion to mitigate or alleviate the impacts of crises such asoil spills or search and rescue
2. Data and products that are used regularly in the opera-tion of a business or service, to manage risk associatedwith the marine environment and to enhance efficiency andeffectiveness.
and effectiveness, international coordination and compliancewith agreed standards is necessary. Most in situ ocean observa-tion activities are currently coordinated by the Joint IOC/WMOTechnical Commission for Oceanography and MarineMeteorology (JCOMM). However, it is clear that there are fewnational commitments for sustained global ocean observations.
Applications and benefitsNatural hazards and coastal impacts – There is a clear require-ment for ocean data, information and products to facilitate theprediction and mitigation of natural hazards, including storms,tropical cyclones, tsunamis, coral bleaching, climate impacts(in coastal regions and island states) and harmful algal bloomsHABs).
Integrated coastal management – Integrated coastal manage-ment is a prominent theme at regional, national andinternational levels. The World Summit on SustainableDevelopment, Johannesburg 2002, and the Commission forSustainable Development, have both highlighted the impor-tance of effective integrated coastal area management. Thesepolicies stress the importance of efficient access to oceaninformation, to guide the development of management strate-gies and to contribute to the implementation and sustainedoperation of management processes. Coastal managementissues include human habitations, coastal and shorelineindustry and engineering, food production including aqua-culture, coastal marine ecosystems and marine protectedareas, and the increasingly important marine tourism andrecreation industry.
Issues that are of direct and increasing relevance to coastalusers and applications include:
• Storm surge and wave prediction models • Linking estuaries to offshore • Warnings of harmful algal blooms• Downscaling of the impacts of climate variability and
climate change • Zooplankton and fish diseases
The tsunami at Phuket, Thailand, 26 December 2004
Phot
o: T
revo
r G
ilber
t (A
ustr
alia
)
The future of all species depends on an understanding of the oceans
1.Policy planning & Governance:Master spread 16/2/07 09:33 Page 28

[ ]29
Ocean data and products provide substantial improvements tothe operational decisions made in crisis management. If suchdata and products are fully integrated into the existing responsetools and procedures, effective reaction time is much improved.Accessibility, reliability and timeliness are vital to the successof such strategies. Crisis management operations require rele-vant information as soon as possible if they are to implementeffective responses to, for example, a search and rescue oper-ation or a major oil spill. In order to improve services and crisisresponse, operational agencies are working with direct endusers and ‘middle users’ in the private sector, to adapt prod-ucts and information to meet the specific requirements ofdifferent crisis situations.
Risk management – industry, engineering, defence and otherat-sea operations – Risk management is a key issue for allindustries operating within the marine environment. Theyrequire dependable, accurate information to develop appro-priate strategies and plans for efficient and effective modes ofoperation. Such information is often gathered as it is needed bythe specific sector or by individual operators. However, this isoften not adequate in accuracy or scope. As a result, and dueto the recognized importance of risk management data andproducts to marine industries, such services are frequentlyprovided by private and/or public companies (middle users)that specialize in the provision of such information.
Climate: assessment and prediction of climate variability andchange – Climate and climate change are prominent issues forboth the developed and developing communities. Knowledgeof the ocean is needed for initialisation and verification ofpredictions, as well as for assessing and understanding climatevariations and change. Operational ocean products are mostfrequently used as the basis for research into understandingthe long-term variability of the ocean and for defining the
Phot
o: A
ustr
alia
n M
arit
ime
Safe
ty A
utho
rity
A case for crisis management
Two-week salinity forecast, North Atlantic
Source: Mercator Project, France
requirements and strategy for an ocean observing system forclimate monitoring.
Ocean monitoring and prediction for societyOur ability to measure and monitor the oceans, and our under-standing of ocean processes and behaviour, is growing rapidly.The future of human society, and of the very planet and its lifeforms is, and will increasingly be, dependent on our under-standing of the oceans, on predicting their future states, and onapplying this knowledge in the service of society and the globalenvironment. This can only be realistically viable through long-term and sustained ocean monitoring – in effect, taking thepulse of the planet’s lifeblood.
JCOMM has, as its primary mandates: • The further development of observing networks in the
world’s oceans and seas • The implementation of data management systems to meet
the needs of real-time operational services and globalobserving systems
• The delivery of products and services needed by bothoperational and scientific user communities.
Thus WMO and IOC, working through JCOMM as a primarycoordination mechanism, stand at the forefront of our effortsto understand, harness and responsibly manage the oceans andtheir resources in the interests of humanity and the future ofthe earth.1
1.Policy planning & Governance:Master spread 16/2/07 09:33 Page 29

[ ]30
EVERY DAY, THE life and the economic prosperity ofmillions of people throughout the world depend on thedecisions taken in various countries on the basis of avail-
able hydrometeorological information and generalized analysisof the climate. This indisputable fact, which is borne out by amultitude of research, shows the important role of NationalHydrometeorological Services (NHMS) in the sustainabledevelopment of the economy and of society as a whole.
This is particularly apparent in cases where adverse weatherconditions and hazardous hydrometeorological conditionsaffect the population and economy. As research and experiencehave shown, this effect is often considerable.
According to data from the World Conference on NaturalDisaster Reduction (Yokohama, 1994) the number of disastersthat caused a high level of economic damage (on a scale ofmore than 1 per cent of the annual gross domestic product ofthe country in which they occurred) rose 4.1 times globallybetween 1984 and 1994. The number of victims rose 3.5 times,and the number of deaths 2.1 times. Over the past 25 years,
natural disasters have claimed more than 3 million lives, 90per cent of which were in developing countries.
Over the past decade, even more hazardous manifestationsof weather and climate change have been noted. Thus, in 2002,the annual report of the Munich Reinsurance Company statedthat between 1991 and 2001, the number of significant naturaldisasters increased 2.6 times in comparison with the 1960s.This led to an increase in economic losses of 7.3 times.
According to the available statistical information, between1994 and 2004 natural disasters caused more than 730 billiondollars worth of damage and affected 1.1 billion people.
The same trend can be seen in Russia: the graph below showsthe distribution of the total cases of adverse weather conditionsand hazardous hydrometeorological conditions that causedsocial and economic damage between 1991 and 2006.Furthermore, the concentration of hazardous weather that gripsindividual regions of Russia (for example, the North Caucasusregion, Chita Oblast, Altai Krai, Kemerovo Oblast) is a causefor particular alarm. Other countries face the same situation.
The climatic and meteorological vulnerabilityof the population and economy of Russia as a
factor in safe and sustainable development
A.I. Bedritsky, Head of the Federal Service for Hydrometeorology and Environmental Monitoring (Roshydromet); President, WMO
1991
1992
1993
1994
1995
1996
1997
1998
1999
2000
2001
2002
2003
2004
2005
2006
130
180
230
280
330
380
Num
ber
of c
ases
Distribution of cases of adverse weather conditions and hazardoushydrometeorological conditions that caused social and economicdamage in Russia between 1991 and 2006
1991
1992
1993
1994
1995
1996
1997
1998
1999
2000
2001
2002
2003
5
10
15
20
25
30
Econ
omic
loss
(bill
ion
roub
les)
Economic losses (in billion roubles) in the agricultural sectorowing to the effect of hazardous hydrometeorologicalphenomena and adverse weather conditions
Source: A. I. Bedritsky Source: A. I. Bedritsky
1.Policy planning & Governance:Master spread 16/2/07 09:33 Page 30
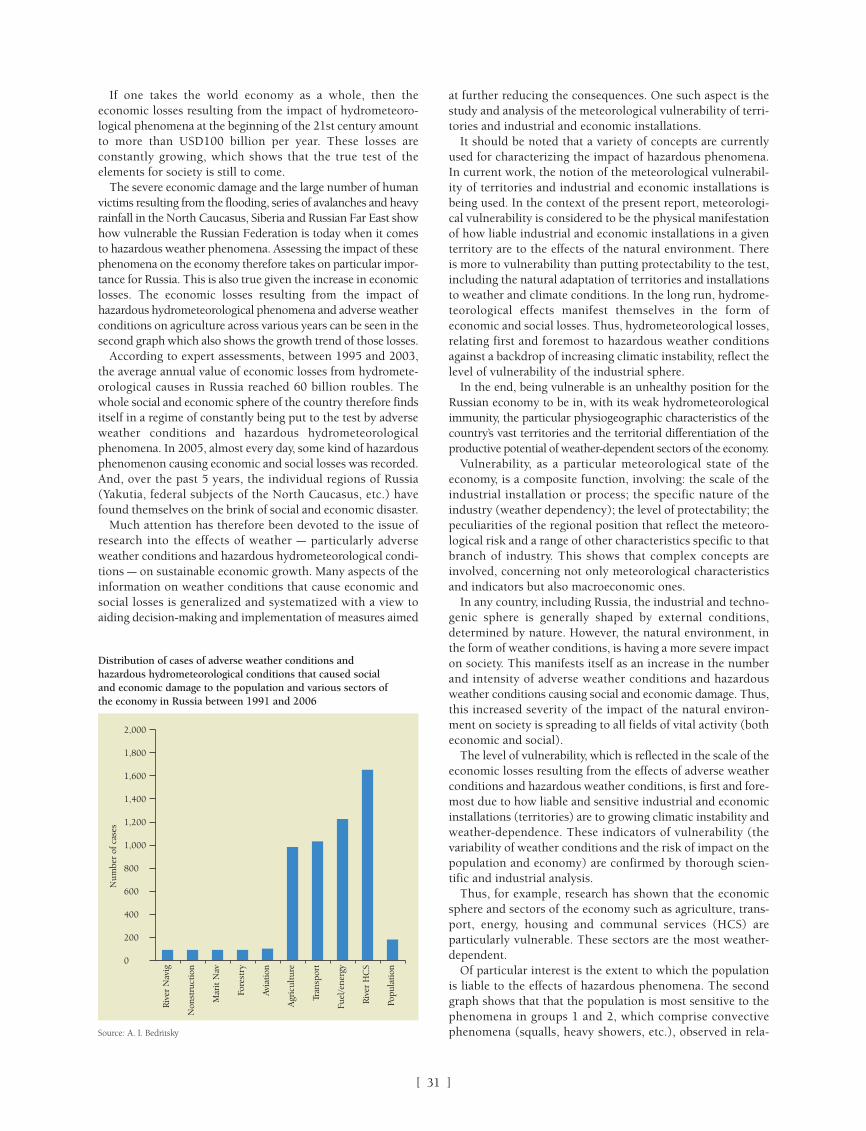
[ ]31
at further reducing the consequences. One such aspect is thestudy and analysis of the meteorological vulnerability of terri-tories and industrial and economic installations.
It should be noted that a variety of concepts are currentlyused for characterizing the impact of hazardous phenomena.In current work, the notion of the meteorological vulnerabil-ity of territories and industrial and economic installations isbeing used. In the context of the present report, meteorologi-cal vulnerability is considered to be the physical manifestationof how liable industrial and economic installations in a giventerritory are to the effects of the natural environment. Thereis more to vulnerability than putting protectability to the test,including the natural adaptation of territories and installationsto weather and climate conditions. In the long run, hydrome-teorological effects manifest themselves in the form ofeconomic and social losses. Thus, hydrometeorological losses,relating first and foremost to hazardous weather conditionsagainst a backdrop of increasing climatic instability, reflect thelevel of vulnerability of the industrial sphere.
In the end, being vulnerable is an unhealthy position for theRussian economy to be in, with its weak hydrometeorologicalimmunity, the particular physiogeographic characteristics of thecountry’s vast territories and the territorial differentiation of theproductive potential of weather-dependent sectors of the economy.
Vulnerability, as a particular meteorological state of theeconomy, is a composite function, involving: the scale of theindustrial installation or process; the specific nature of theindustry (weather dependency); the level of protectability; thepeculiarities of the regional position that reflect the meteoro-logical risk and a range of other characteristics specific to thatbranch of industry. This shows that complex concepts areinvolved, concerning not only meteorological characteristicsand indicators but also macroeconomic ones.
In any country, including Russia, the industrial and techno-genic sphere is generally shaped by external conditions,determined by nature. However, the natural environment, inthe form of weather conditions, is having a more severe impacton society. This manifests itself as an increase in the numberand intensity of adverse weather conditions and hazardousweather conditions causing social and economic damage. Thus,this increased severity of the impact of the natural environ-ment on society is spreading to all fields of vital activity (botheconomic and social).
The level of vulnerability, which is reflected in the scale of theeconomic losses resulting from the effects of adverse weatherconditions and hazardous weather conditions, is first and fore-most due to how liable and sensitive industrial and economicinstallations (territories) are to growing climatic instability andweather-dependence. These indicators of vulnerability (thevariability of weather conditions and the risk of impact on thepopulation and economy) are confirmed by thorough scien-tific and industrial analysis.
Thus, for example, research has shown that the economicsphere and sectors of the economy such as agriculture, trans-port, energy, housing and communal services (HCS) areparticularly vulnerable. These sectors are the most weather-dependent.
Of particular interest is the extent to which the populationis liable to the effects of hazardous phenomena. The secondgraph shows that that the population is most sensitive to thephenomena in groups 1 and 2, which comprise convectivephenomena (squalls, heavy showers, etc.), observed in rela-
If one takes the world economy as a whole, then theeconomic losses resulting from the impact of hydrometeoro-logical phenomena at the beginning of the 21st century amountto more than USD100 billion per year. These losses areconstantly growing, which shows that the true test of theelements for society is still to come.
The severe economic damage and the large number of humanvictims resulting from the flooding, series of avalanches and heavyrainfall in the North Caucasus, Siberia and Russian Far East showhow vulnerable the Russian Federation is today when it comesto hazardous weather phenomena. Assessing the impact of thesephenomena on the economy therefore takes on particular impor-tance for Russia. This is also true given the increase in economiclosses. The economic losses resulting from the impact ofhazardous hydrometeorological phenomena and adverse weatherconditions on agriculture across various years can be seen in thesecond graph which also shows the growth trend of those losses.
According to expert assessments, between 1995 and 2003,the average annual value of economic losses from hydromete-orological causes in Russia reached 60 billion roubles. Thewhole social and economic sphere of the country therefore findsitself in a regime of constantly being put to the test by adverseweather conditions and hazardous hydrometeorologicalphenomena. In 2005, almost every day, some kind of hazardousphenomenon causing economic and social losses was recorded.And, over the past 5 years, the individual regions of Russia(Yakutia, federal subjects of the North Caucasus, etc.) havefound themselves on the brink of social and economic disaster.
Much attention has therefore been devoted to the issue ofresearch into the effects of weather – particularly adverseweather conditions and hazardous hydrometeorological condi-tions – on sustainable economic growth. Many aspects of theinformation on weather conditions that cause economic andsocial losses is generalized and systematized with a view toaiding decision-making and implementation of measures aimed
Rive
r N
avig
Non
stru
ctio
n
Mar
it N
av
Fore
stry
Avia
tion
Agr
icul
ture
Tran
spor
t
Fuel
/ene
rgy
Rive
r H
CS
Popu
latio
n
0
200
400
600
800
1,000
1,200
1,400
1,600
1,800
2,000
Num
ber
of c
ases
Distribution of cases of adverse weather conditions andhazardous hydrometeorological conditions that caused socialand economic damage to the population and various sectors ofthe economy in Russia between 1991 and 2006
Source: A. I. Bedritsky
1.Policy planning & Governance:Master spread 16/2/07 09:33 Page 31

[ ]32
tively few areas. The majority of the gaps relate to these cate-gories (where 70 per cent and 71 per cent respectively of thecases were predicted). New approaches are therefore neededfor forecasting regional synoptic processes, their energyconcentration, cyclogenetic activity, and other manifestationsof processes on the synoptic scale.
The variability of weather conditions is defined as theclimatic characteristic of non-periodic variation in weatherconditions in a given territory. The extent to which extremevalues vary (deviate) from mean values of the main meteoro-logical variables was selected to depict that characteristic. Inorder to assess variability, a corpus of daily meteorological datafor the period 1991 to 2004 was selected: minimum tempera-ture (Tmin), maximum temperature (Tmax), precipitation (P)and maximum wind speed (Wmax) observed during a 24-hourobservation period. Calculations are done according to theformula.
Where Y is the dimensionless indicator of the variability ofweather conditions;
Tmax, Tmin, Pmax and Wmax – signifying the absolute extremesof maximum temperature (the highest air temperatureobserved during the given period), the minimum temperature
1 2 3 4 5 6 70
20
40
60
80
100
120
1. Wind, hurricane, tornado, dust storm 2. Rain, heavy rain, hail, thunderstorm 3. Snow, sleet, snowstorm, ice-cover, snow drifts 4. Frost, hot weather, sharp rise (fall) in temperature 5. Flooding (including high river levels, flash floods, snowmelt, combined phenomena), ice break-offs, mudflows 6. Avalanche risks 7. Fog.
Total Predicted
Num
ber
of c
ases
Distribution of cases of adverse and hazardous weather conditions(by type of phenomenon) that led to loss of human life or social andeconomic losses for the population between 1991 and 2006
(the lowest observed during the given period), the maximumdaily total of precipitation (the highest quantity of daily precip-itation observed during a given period), the maximum windspeed (the highest wind or gust speed observed during a givenperiod) – have been chosen from the statistical distributionsof meteorological variables being examined in a selected region;
Tmax, Tmin, Pmax and Wmax are the average climatic values ofmeteorological variables being examined – are calculatedaccording to statistical distributions.
Fi is the average annual recurrence (frequency) of extremevalues for meteorological variables. The maximum andminimum temperatures and maximum wind speed are calcu-lated as the number of cases, within a 5 per cent range, dividedby the number of years in the sample. The maximum dailytotal of precipitation is the number of cases, within a 10 percent range, divided by the number of years in the sample. Thisis done in order to minimize the influence of the span of thesample on the size of the indicator of the variability of theweather conditions in a given territory.
The maps below show an example of the variability ofweather conditions in a territory in the central and southernpart of European Territory of Russia. It is clear from the inte-gral variability coefficient Y, the 40 federal subjects beingstudied from the point of view of extreme phenomena possessterritorial particularities. In the warm period, a smooth tran-sition from north to the south is observed in the increase invariability of weather conditions. The greatest variability canbe seen in the Volgograd and Saratov oblasts. In the coldperiod, variation is more diverse, but there is still an increasetowards the south. This indicates the high level of meteoro-logical vulnerability of federal subjects in the southern part ofthe European Territory of Russia, from the point of view of theimpact of hazardous hydrometeorological conditions andadverse weather conditions on the economy.
In terms of the increased severity of effects of the naturalenvironment on society and industrial and economic installa-tions users of hydrometeorological information, particularlyforecasts have to adopt a policy of optimal adaptation (tech-nical, technological and informational) to current and expectedweather conditions. Optimal adaptation – meaning optimal(economically effective) use of hydrometeorological informa-tion – allows maximum reduction of vulnerability.
It must be pointed out that the effects of weather conditionsmay be long-lasting, reflecting the adverse effects of many yearsof climatic variability. Climate trends of a meteorologicaldimension that are shaped by this variability give rise to inte-gral climatic costs (economic losses) in sectors of the economy,which can be obtained on the basis of statistical reports at localand federal level. The costs of this kind show the climaticvulnerability of individual types of industrial activity in theeconomic sphere. Knowledge of climatic vulnerability calls forthe amendment of statistical evaluations, prospects, and trendsin economic development.
The atmosphere, along with other components of the envi-ronment, will also be resource-loaded. As was the casehistorically, and remains so today, meteorological resources canbe used for supporting life. Forecasting and giving warningsof hazardous weather conditions are fundamental meteoro-logical resources.
Various sectors of the economy use daily information aboutexpected weather conditions and timely warnings of hazardousweather conditions provided by the forecasting division of
Tmax
Y = Tmax
Tmin
• F1 + Tmin
Pmax
• F2 + Pmax
Wmax
• F3 + • F4
Wmax
Source: A. I. Bedritsky
1.Policy planning & Governance:Master spread 16/2/07 09:33 Page 32

Roshydromet. This is an invaluable natural resource for theeconomy – a social product, whose general and economicsignificance is universally recognized.
At present, the success of weather forecasting and warningsreaches 85 per cent to 90 per cent. Routine use of Roshydromet’sforecast information products by sectors of the economy enablesthem essentially to avoid weather-related losses. Forecast infor-mation allows for timely preparations for the impact of theweather, in order to reduce the vulnerability of the industrialsphere and its infrastructure. Even more pertinent is special-ized hydrometeorological information support, which is specificto the individual or address and meets the demands and needsof users in the territories of federal subjects.
According to the assessments of Russian specialists, thereduction of weather-related losses for each sector of theeconomy ranges from 10 to 85 per cent of the maximum possi-ble losses. On average, the coefficient of prevented losses forthe economy as a whole is 40 per cent, and prevented lossestotal 23 to 24 billion roubles. This solves the issue of theconceptual unity of reducing meteorological vulnerability andthe ensuring hydrometeorological safety, which contributesdynamically to the sustainable development of society. It there-fore follows that hydrometeorological safety is not onlycomponent of Russia’s economic security, but also of thecountry’s national security as a whole.
At present, it is generally possible to assess the order ofmagnitude of use of hydrometeorological resources. This isaided by newly developed joint economic and meteorologicalmodels of optimal adaptation, selection of optimal regulationsfor activities, and assessment of the economic usefulness ofhydrometeorological forecasting. These modern mathematicalsolutions are employed in operational synoptic practice. Byway of example, over the past five years, the value of preventedmeteorological losses is at least 47 billion roubles. The RussianNHMS has therefore made a substantial contribution topreserving the economic wealth of the country.
Such sectors of the economy as agriculture, fuel and energy,transport and HCS are the most liable to the weather condi-tions. In each of these sectors, the approach to the use ofhydrometeorological information, particularly weather fore-casts, is far from rational, economic, or prudent. Often, thedecisions and actions taken are far from adequate given theexpected weather conditions.
Hydrometeorological information support, directed to thespecific nature and needs of each individual sector – in otherwords, specialized hydrometeorological information support– is regarded as invaluable for saving economy’s materialresources and ensuring the safety of industrial and other activ-ity. Moreover, the development of specializedhydrometeorological information support enables economiclosses to be minimized. The NHMS of Russia therefore meetssocial and economic needs.
However, in many cases, use of hydrometeorological fore-casting is still too basic. The protective measures taken by usersof hydrometeorological information are inadequate in relationto the expected effects of the weather and climate. An intuitiveapproach based on past industrial experience or the currentweather patterns is not always effective. At present, scientificfindings that guide users to best effect are often ignored.
Roshydromet research establishments have developedmethods for optimal adaptation by users to expected weatherconditions, selection of a optimal number of solutions (level of
protective measures), assessment of the economic effects andthe success of using meteorological forecasts. All these moderndevelopments must be employed to their full capacity by theorganizations of Roshydromet and by users of hydrometeoro-logical information.
The Roshydromet system has a well-defined assessmentsystem in place throughout the territory of Russia. Thus, theeconomic impact (approximately – the prevented losses) ofthe use of hydrometeorological information in 2004 was 11.4billion roubles (80.6 per cent of the effect occurs in the mostweather-dependent sectors – agriculture, transport, energy,HCS), and in 2005 it was 13.9 billion roubles (80.4 per centrespectively). These reductions are confirmed by the specificusers of hydrometeorological information. However, it mustbe noted that the existing method of evaluating the economicimpact has not yet taken on a interdepartmental character.
The development of specialized hydrometeorological infor-mation support in the current economic circumstances requiresa more dynamic approach to taking up market methods forconducting business, ensuring greater guarantees of the qualityof hydrometeorological products on the one hand, and on theother, more effective application of these products by its users.This will lead to a maximum reduction of economic losses.Thus, hydrometeorological information support is a reliableState mechanism for reducing meteorological vulnerability andconsequently, ensuring social protection and the economicpotential of the country.
Roshydromet’s programme of technical renovation andresearch and production development constitutes the basis fora further reduction in hydrometeorological vulnerability and allthe negative consequences of adverse weather conditions andhazardous hydrometeorological conditions. However, at thesame time, partnerships between State and private entities arenot ruled out for investment in regional programmes. Thus,overall, the following is envisaged:
• Assurance of the safety of the population in their livingand working environments
• Preservation of the physical state of the technosphere,industry, and infrastructure
• Development of energy and resource reduction• Efficient functioning of industry.
All this will be possible once the following fundamental issuesof meteorology and economic meteorology have been resolved.
First issue – To develop new and perfect existing methods offorecasting meteorological values and weather phenomena onthe basis of which, the introduction of highly effective hydrom-eteorological information products is envisaged.
Second issue – In accordance with the expansion of the proce-dures for concluding General agreements with ministries anddepartments, to plan, introduce, and implement in economicpractice the aforementioned methods for optimal use of hydrom-eteorological forecasts. In addition, resolution of this issue alsorequires the development of an Inventory of sector-specifichydrometeorological losses, and in accordance with the estab-lished research methods their formal presentation in matrix form.It will simply not be possible to secure new successes in the useof specialized forecasts without setting up such a mechanism.
Given that hazardous synoptic processes grip an increasingnumber of countries simultaneously, the development of thiskind of inventory may require joint international efforts in thesearch for the determining factors.
[ ]33
1.Policy planning & Governance:Master spread 16/2/07 09:33 Page 33

[ ]34
Third issue – Interdepartmental assessment of the reliabilityand economic usefulness of hydrometeorological forecasts,which requires perfection of the technology for collecting,collating and analysing information, particularly abouteconomic losses.
The issues presented above must be highlighted and theirsector-specific solutions given as part of the‘Hydrometeorological passportization’ project developed inconjunction with users. It is a substantial task of federal signif-icance, which must be put into practice in Roshydromet’sterritorial Administrations on the basis of a conceptualprogramme. The programme is determined by the fact thatalongside the nationwide problems of economic developmentremains the problem of ensuring the daily hydrometeorologi-cal safety of the population and economic practices. The usermust learn to understand the economic content of the meteo-rological environment, its natural indifference, and its dangers,and by means of a mechanism such as the optimal use of fore-casts, know how to preserve its beneficial effects, reducemeteorological losses, and develop economic gains.
Thus, it is glaringly obvious that the hydrometeorologicalvulnerability of the economy and the social and economicsustainability of society share a common cause-and-effect rela-tionship: namely the need to reduce meteorological losses,ensure hydrometeorological safety and therfore contribute tosustainable social and economic development.
At the present time, the country has an industrial infrastruc-ture adapted to previous climatic conditions, although theseare now changing. However, climatic changes that are takingplace at global and regional level, particularly their extrememanifestation beyond the usual level of intensity, can give riseto catastrophic damage in economic and social spheres. In thisconnection, the battle to reduce economic and social losses willnever be won if they are not taken into account at State level.This is particularly important for minimizing the losses, whichleads to a reduction in meteorological vulnerability.
The variability of weather conditions in the territories of the federal subjects of the central and southern part of the European Territory of Russia
Taking into account these losses at State level and their mini-mization requires ministries and departments to develop ofcommon interdepartmental procedures for evaluating thedamage caused by extreme natural events and for classifyingand taking stock of these extreme situations. Interdepartmentalprocedures are needed for evaluating the losses that wereavoided by using of hydrometeorological information andtaking protective measures.
The development of interdepartmental procedures for evaluat-ing the prevented losses, taking stock of and analysing these lossesenables ministries and departments to develop guidelines fortaking the optimal decisions regarding weather and the economythat are required for implementing the essential rational protec-tive measures that lead to a maximum reduction in losses.
In carrying out national and sectoral assessments of theeffects of weather conditions and meteorological vulnerability,Roshydromet has had to develop and supplement on a regularbasis databases on adverse weather conditions, hazardoushydrometeorological phenomena and extreme manifestationsof climate change, which ought to help reduce the losses expe-rienced by the population and economy of federal subjects.These assessments are important for planning current activitiesand for the development of a State “reaction” strategy, neededfor coping with future extreme phenomena.
A permanent archive is required, to be created using theaforementioned databases. This is because comparative analy-sis of the negative consequences of adverse weather conditionsand hazardous hydrometeorological phenomena enables moreprecise procedures for forecasting the effects on humanity ofhazardous phenomena, and weather as a whole, to be devel-oped, and measures for anticipating them to be formulated. Itis also required for perfecting standard forecasts and forecastsabout hazardous hydrometeorological phenomena, particularlydifficult to forecast convective phenomena, and for perfectingsystems for effectively conveying those forecasts to the peoplemaking decisions about the protective measures to be taken.1
Source: A. I. Bedritsky
1.Policy planning & Governance:Master spread 16/2/07 09:34 Page 34

[ ]35
WEATHER, CLIMATE AND water cross all nationalboundaries, and affect every aspect of life. Over thelast 150 years, scientists have been sharing their
observations and information about weather, climate, waterand the environment, and using the best available communi-cation and scientific tools in order to produce useful weatherand climate forecasts, and other knowledge-based productsand services. Monitoring and predicting our weather andclimate and how they affect the Earth’s environment and societyrequires international cooperation. However, in developingcountries, limited resources and lack of human capacityprevent them from producing and applying information forthe benefit of their own communities, as well inhibiting thedissemination of data to other centres.
The World Meteorological Organization recognized thisproblem, and set up the Voluntary Cooperation Programme(VCP).2 The aim is to link the needs of NationalMeteorological and Hydrological Services (NMHS) of devel-oping countries with the technical ability and fundingavailable in developed countries. The VCP provides a mech-anism through which the NMHS of developing countries canrequest assistance in terms of equipment, expert services,
training and education, in order for them to be able to partic-ipate in the programmes of WMO. These programmes coverthe role of NMHS in taking observations, communicatingthem to stakeholders, archiving them for climatology studies,and in producing forecasts and warnings for their users. Thereare various types of end-user services, but first among theseis ensuring the safety and well being of their nations’ citizens.NMHS are responsible for monitoring weather, climate andthe natural environment, and for giving public warnings andinformation in a timely, reliable and comprehensive manner.Each NMHS has links through its government to nationaldisaster prevention and risk management authorities. Theyalso have knowledge of the local environment in order toassess potential impacts, as well as an awareness of cultureand languages, so as to be able to communicate directly tothe people, particularly at the local community level. Theforecasts and other information on weather- and climate-related events that the NMHS provide are a vital componentin the decision making processes for many weather-sensitivesectors.
Developing countries are often the most vulnerable tonatural disasters, because they are located in regions prone to
Technical cooperation for weather, water and climate services in developing countries
Steve Palmer, UK Met Office1
Launching a radio-sonde at Gan, Maldives after the station was re-equipped by USA and UK VCP contributions
Phot
o: M
et O
ffice
, UK
A forecaster in Sri Lanka finishes her weather presentation for broadcaston the national TV company using equipment provided by UK VCP
Phot
o: S
yner
gy M
edia
Ser
vice
s
1.Policy planning & Governance:Master spread 16/2/07 09:34 Page 35

[ ]36
natural hazards, and usually lack the resources to invest inadequate infrastructure. Poverty limits choice, and forcespeople to take risks, such as living on land vulnerable toflooding or landslip. Many humanitarian and environmentaldisasters are directly related to weather and water. Some occuron very short timescales, such as hurricanes and flash floods.Others, such as droughts and food shortages, can be stretchedover a period of months, or even several years. Even whennot directly involved in a hazard, weather often complicatesattempted relief and rescue operations. In the short term,disaster warning systems can prevent much loss of life andlivelihood by alerting people to particular threats. Climatechange will alter the incidence of natural disasters, as well ashaving impacts on the sustainability of environments andlivelihoods over the coming decades. Because of this, qualityinformation is vital to prepare people to adapt their liveli-hoods.
The primary source of funding for NMHS is for the provi-sion of the public weather service. Thus, validation of thisservice has become increasingly important in order to justifygovernment funding. In developing countries, as a broad gener-alization, NMHS get very little funding from private-sectorwork, even where they are able to exploit commercial oppor-tunities. Commercial aviation weather services, for thoseNMHS which provide them, are a very important part of thejustification argument, since international civil aviation paysthe national authorities in hard currency. Unfortunately, inmany countries this does not translate directly into funds forthe NMHS.
Developing country NMHS have great difficulty with afford-ing the equipment for observing the environment. This isparticularly the case with the consumables for upper-airmeasurement. Each radio-sonde observation costs approxi-mately USD200. With developments in numerical weatherprediction and satellite capability, as well as the data gath-ered by Aircraft Meteorological Data Relay (AMDAR)equipment on civil airline flights, there is no longer scien-tific justification for upper air observations, as beneficial tolocal forecasting. The exceptions are for low-level aviationforecasting and applications such as tracing pollutants anddisease vectors. Increasingly, the primary requirements for anetwork of high-quality upper air observations are to providea long-term record for monitoring global climate, and toprovide the baseline calibration for satellite instruments.Surface observations generally have lower costs. Though thecapital cost of equipment may be significant, the unit cost foreach observation will be made up mainly from staff andcommunication expenses. There is also a much stronger argu-ment for the utility of surface observations in providing localand national benefit. Surface observations are also commu-nicated and used globally; under international agreementsthrough WMO, observations from the Global ClimateObserving System and other networks are freely availablethrough NMHS and global data centres.
It can be seen that environmental observation data and meta-data has high costs, but the value of the observation lies in theuse made of it, and not in the observation itself. Hence it isunrealistic to argue that any individual user of the observationshould pay a particular proportion of the cost. Even if chargesare levied on users for the cost of observations, it is very diffi-cult to make these equitable, and the result is likely to be thatpotential services will be rendered uneconomic. In contrast, it
Phot
o: I
nsti
tuto
Nac
iona
l de
Met
eoro
logi
a, S
pain
Commissioning a solar photometer at Tamanrasset in Southern Algeriawith support from Spain to monitor aerosols and dust in air massesover the Sahara desert, especially for early warning of dust clouds
is generally in the interest of NMHS to increase the numberand range of users of their data in order to strengthen theircase for adequate government funding for the public weatherservice. Therefore charges for the use of data should reflect thevalue added by the information and services derived from saiddata.
It is instructive to consider these data using the concept of‘Global Public Good’3 where ‘good’ means a thing or condition(in this case data and the metadata needed to interpret it) butmakes no assumptions about the costs, benefits or valuationof the good; ‘global’ means spanning all divides and borders;‘public’ refers to the general population, civil society organi-zations and corporate citizens; the ‘global public’ includes statesand international organizations. These observations thereforemeet the economists’ definition of ‘public good’ as having bothnon-excludable and non-rival benefits, as well as being non-exclusive. It is worth emphasising the huge potential currentand future benefits of these observations in providing a clima-tological record during a period of rapid change, in supportingcurrent forecasting on periods from immediate response toseasons, and in providing the baseline and future verificationas the climate changes. However, only some of these benefitswill accrue in the countries where the observations are taken,particularly in the developing countries. Remote islands areespecially important for global observations, and many of theseare in Small Island Developing States. It is likely that the major-ity of economic benefits of “global public good” observationswill accrue in developed countries, despite the developingcountries suffering most from the social impacts of extremeevents and climate change.
This analysis shows why it is difficult to persuade develop-ment aid partners, whose interests are primarily to enhancefree trade and economic growth, achieve sustainable develop-ment, promote good governance and democracy and increasesafety and security, to be interested in funding observations,particularly of the upper air. For funding by NMHS of devel-oped countries, including through the WMO VCP, it is
1.Policy planning & Governance:Master spread 16/2/07 09:34 Page 36

[ ]37
reasonable to argue that such voluntary contributions are not‘aid’ but investments in global public good through delivery ofthe observations which primarily benefit the developed coun-tries. This is an imperfect method of achieving an equitableprovision of global public goods, because the voluntary naturedoes not fit with long-term planning. On the other hand, the‘club’ nature of the partners to WMO VCP means that there isa high degree of understanding, and therefore efficiency in thedetail. In the future, it may be that a coordinated mechanismwill be realized to fund global observations, in much the sameway as Europe has developed its own.
The VCP partners are not only concerned with the globalsupply of meteorological and hydrological observations, butalso work with other development agencies, and therefore alsoconsider aims including the Millennium Development Goalsand natural disaster mitigation.
Extending this analysis, the NMHS of developing countriesneed to be sustainable organizations, and therefore they mustdeliver effective and sustainable services to the public in theircountries. These will include services as part of their nationaldisaster plan, and their national development strategy. Suchservices will include statistical information using current andpast data, forecasting on a range from a few hours to seasonal,and the setting of all this into the context of climate changeimpacts. The VCP donors appreciate the need for the NMHSof developing countries to be effective and sustainable, andtherefore support projects across this range of services. RecentVCP projects include the provision of Numerical WeatherPrediction products specifically for the developing countries,systems for communication such as satellite and the Internet,workstations for forecasters to visualize the weather andproduce forecasts with, systems for climatology databases andassessing regional climate change impacts, and equipmentfor delivering services to the public. Sustainable organiza-tions need people trained as effective practitioners, and herethe VCP donors also help by supporting a range of trainingand professional development.
Examples of projects supported through WMO VCPTraining and fellowshipsTraining and fellowships form an important component of theVCP Programme. Whilst almost all VCP Projects have someform of training associated with them, there is a need todevelop the basic and specialist skills of personnel withinNMHSs. The aim is to build a “critical mass” of people whocan manage and nurture the services provided by an NMHS,from observations through to forecasting and understandingthe likely impacts of climate change. Traditionally this hasbeen achieved by offering a range of fellowships for short- andlong-term courses hosted by other NMHSs, WMO designatedRegional Training Centres and universities around the world.Much of this is coordinated by the WMO Education andTraining Department.
Recent projects have explored the benefits of using e-learn-ing techniques to improve the efficiency, quality andaccessibility of this training. One example is the Statistics inApplied Climatology Programme (SIAC). The “e-SIAC” wasdeveloped by a team from Reading University in the UK, withsupport primarily from UK VCP. The e-SIAC teaches partici-pants how to analyse climatic data and produce simpleproducts that are useful primarily in the agricultural sector,but also to those working in health, food security, construc-tion and tourism. These products are becoming increasinglyimportant as it is widely recognised that knowledge of climatevariability is key to understanding the likely impacts of climatechange. The e-SIAC has so far successfully engaged over 100-participants from more than 20 Countries in Africa and is alsoproving popular in other regions. For further details visit:www.met-elearning.org/moodle.
RANETRANET is an international collaboration to make weather,climate, and related information more accessible to remote andresource poor populations. RANET undertakes this mission inorder to aid day-to-day resource decisions and preparedness
A training workshop for several South Pacific countries held byMétéo-France in Noumea on ensemble forecasts and application tomonthly and seasonal forecasts
Phot
o: M
étéo
-Fra
nce
A monthly observations sheet for Mbarara, Uganda in January 1910.Digital photos of paper archives are easy to share and can be digitisedto add to climatology databases
Phot
o: M
et O
ffice
, UK
1.Policy planning & Governance:Master spread 16/2/07 09:34 Page 37
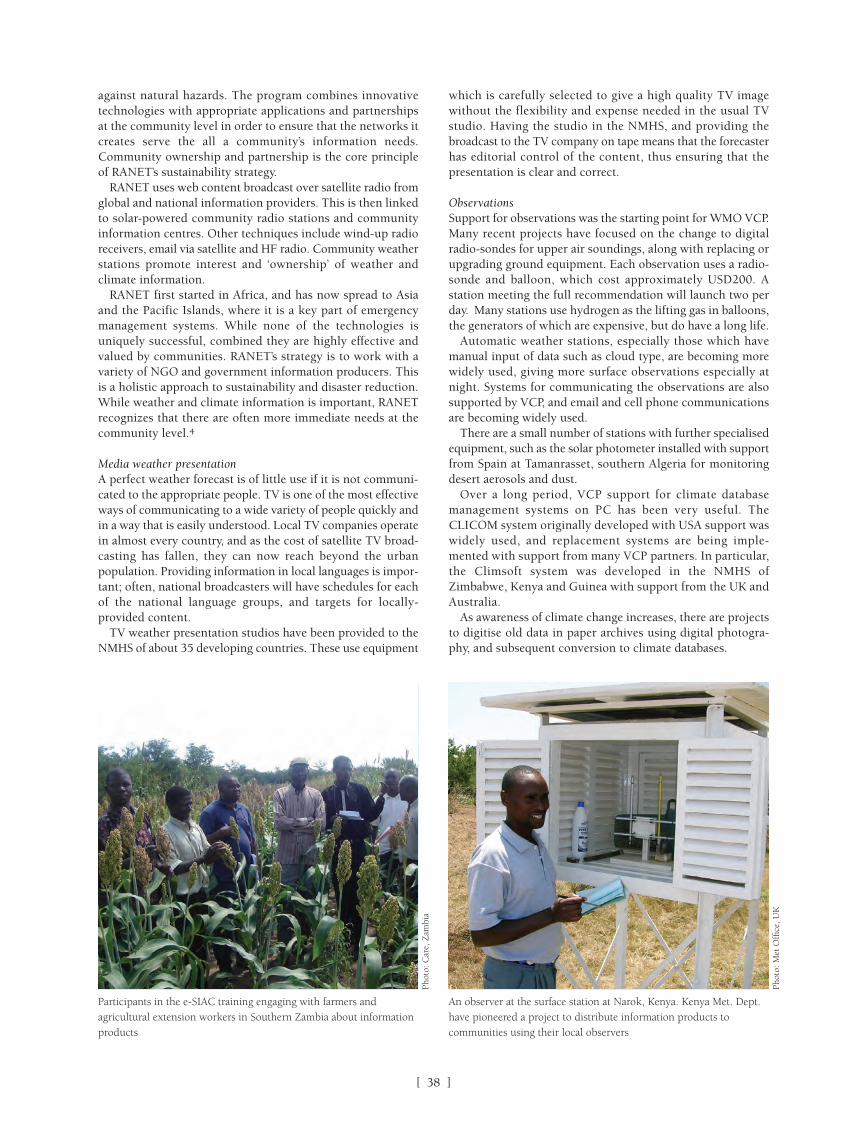
against natural hazards. The program combines innovativetechnologies with appropriate applications and partnershipsat the community level in order to ensure that the networks itcreates serve the all a community’s information needs.Community ownership and partnership is the core principleof RANET’s sustainability strategy.
RANET uses web content broadcast over satellite radio fromglobal and national information providers. This is then linkedto solar-powered community radio stations and communityinformation centres. Other techniques include wind-up radioreceivers, email via satellite and HF radio. Community weatherstations promote interest and ‘ownership’ of weather andclimate information.
RANET first started in Africa, and has now spread to Asiaand the Pacific Islands, where it is a key part of emergencymanagement systems. While none of the technologies isuniquely successful, combined they are highly effective andvalued by communities. RANET’s strategy is to work with avariety of NGO and government information producers. Thisis a holistic approach to sustainability and disaster reduction.While weather and climate information is important, RANETrecognizes that there are often more immediate needs at thecommunity level.4
Media weather presentationA perfect weather forecast is of little use if it is not communi-cated to the appropriate people. TV is one of the most effectiveways of communicating to a wide variety of people quickly andin a way that is easily understood. Local TV companies operatein almost every country, and as the cost of satellite TV broad-casting has fallen, they can now reach beyond the urbanpopulation. Providing information in local languages is impor-tant; often, national broadcasters will have schedules for eachof the national language groups, and targets for locally-provided content.
TV weather presentation studios have been provided to theNMHS of about 35 developing countries. These use equipment
which is carefully selected to give a high quality TV imagewithout the flexibility and expense needed in the usual TVstudio. Having the studio in the NMHS, and providing thebroadcast to the TV company on tape means that the forecasterhas editorial control of the content, thus ensuring that thepresentation is clear and correct.
ObservationsSupport for observations was the starting point for WMO VCP.Many recent projects have focused on the change to digitalradio-sondes for upper air soundings, along with replacing orupgrading ground equipment. Each observation uses a radio-sonde and balloon, which cost approximately USD200. Astation meeting the full recommendation will launch two perday. Many stations use hydrogen as the lifting gas in balloons,the generators of which are expensive, but do have a long life.
Automatic weather stations, especially those which havemanual input of data such as cloud type, are becoming morewidely used, giving more surface observations especially atnight. Systems for communicating the observations are alsosupported by VCP, and email and cell phone communicationsare becoming widely used.
There are a small number of stations with further specialisedequipment, such as the solar photometer installed with supportfrom Spain at Tamanrasset, southern Algeria for monitoringdesert aerosols and dust.
Over a long period, VCP support for climate databasemanagement systems on PC has been very useful. TheCLICOM system originally developed with USA support waswidely used, and replacement systems are being imple-mented with support from many VCP partners. In particular,the Climsoft system was developed in the NMHS ofZimbabwe, Kenya and Guinea with support from the UK andAustralia.
As awareness of climate change increases, there are projectsto digitise old data in paper archives using digital photogra-phy, and subsequent conversion to climate databases.
[ ]38
Participants in the e-SIAC training engaging with farmers andagricultural extension workers in Southern Zambia about informationproducts
Phot
o: C
are,
Zam
bia
An observer at the surface station at Narok, Kenya. Kenya Met. Dept.have pioneered a project to distribute information products tocommunities using their local observers
Phot
o: M
et O
ffice
, UK
1.Policy planning & Governance:Master spread 16/2/07 09:34 Page 38

[ ]39
FROM ITS RELATIVELY small beginnings as a reportingstation in the early part of the last century, the Kingdomof Bahrain has grown, despite its tiny geographical
proportions, to become a major force in the world of meteo-rology in the Middle East, and within the family of nations thatis known as the World Meteorological Organization (WMO)Regional Association II (Asia).
Over the past few years, thorough training and planningwithin the Bahrain Meteorological Service (BMS) has reduceda staff of 90 to a more manageable and economically viable65, with most of the remaining and newly recruited staff atgraduate level or its equivalent. The leadership of the DeputyPrime Minister H.E. Sheikh Ali Bin Khalifa Al Khalifa hasbeen fundamental to this transformation.
Services have been extended to include an automated avia-tion service for both military and civil aviation, and a marineservice that covers the entire Arabian Gulf region includingthe Gulf of Oman and its approaches.
Tailor-made services are also available for commerce and indus-try. In addition to these vital services, BMS is the official voicefor meteorological warnings and advice for the general populace,as well as for the Government of the Kingdom of Bahrain.
A proportion of the high-level staff training has been due tothe help and advice given by the WMO and the United NationsDevelopment Project (UNDP). This support is freely acknowl-edged and highly appreciated by BMS.
The BMS is now itself a training entity and has providedmeteorological training for a number of Gulf States in statisti-cal analysis, general meteorology, and pre-initial forecasting.Its plans are in place to extend this operation in an effort tooffset core costs funded by the Government.
Partnership with WMOA productive and cordial partnership between BMS and WMOgoes back many years. The guidance and advice provided byWMO has been invaluable.
Planning and governance: Bahrain Meteorological Service
Abdulmajeed Husain Isa, Assistant Undersecretary for Meteorology, President of Regional Association II (Asia)
Bahrain Meteorological Service forecast operation centre
Phot
o: B
MS
1.Policy planning & Governance:Master spread 16/2/07 09:34 Page 39

[ ]40
modified locally for both forecast upper winds and forecastsignificant weather charts. After an initial period when theseproducts were delivered via fax systems, they are now deliv-ered electronically to the airport computer network, fromwhich the briefing officers, aircrew and users can extract them.This has significantly speeded up the process of productionand dissemination.
Climate changeAs the Kingdom of Bahrain is an archipelago of 33 islands, theeffects of climate change will significantly impact the popula-tion. Under normal climate conditions Bahrain has to mitigatethe natural affects of desertification and the long dry periodsexperienced throughout the year. However, the extreme effectsof climate change need urgent attention if further damagingeffects such as a rise in sea level are to be allayed.
Comprehensive information and advice is necessary if chang-ing climatological conditions are to be offset, and BMS has longbeen aware of the need to provide an infrastructure for this.Its newly extended climate section is conducting ongoingresearch with highly qualified staff and has a number ofprogrammes in hand to this end.
During the past two years a completely new databasemanagement system has been purchased and installed toreplace the old Climate Computing Project (CLICOM) system.This new system has greater capabilities for the analysis andpresentation of statistical data, and has significantly extendedthe scope for both research purposes and for commercialexploitation.
Regional Association II (Asia)The Assistant Under-Secretary for Meteorology, AbdulmajeedHussain Isa, has been the President of the WMO RegionalAssociation for Asia since 2001. This has been of great benefit
Practical assistance is given in many areas, not only in stafftraining but also through the provision of equipment underthe auspices of the UNDP. The most notable example of this isthe UNDP Project (Bahrain) 1998, which provided for shortand long-term fellowships for staff, and the supply of vitalequipment to extend remote sensing capability through theinstallation of automatic weather stations in and around theKingdom of Bahrain.
A number of senior staff were given short-term fellowships.These entailed on-the-job training in many different countriesincluding the People’s Republic of China, Poland, South Korea,Hong Kong and Egypt. This comprehensive training includedsatellite meteorology, agricultural meteorology, marine meteo-rology, remote sensing, environmental meteorology and radarmeteorology.
This type of training for senior and experienced staff provedto be most beneficial. Feedback was very positive, and atten-dees were subsequently able to train junior staff in their newlyacquired expertise.
Long-term fellowships awarded under the UNDP schemeprovided graduate courses for 13 members of staff, includingboth junior and senior members. This part of the UNDPscheme kick-started BMS’s long term plans to employ onlygraduate staff, an initiative that is now close to completion.
After a stringent testing and interviewing process, the staffselected for the programme successfully completed a BSc orMSc degree in business and administration, computer science,applied geography, physics, mathematics or meteorology. Mostcourses were held at the University of Bahrain, but some staffattended courses in the UK.
Participation in this scheme has raised the academic stan-dards of BMS staff and, perhaps more importantly, has increasedenthusiasm among other staff for involvement in educationalschemes. Staff-strengthening schemes seem to have a ‘rippleeffect’, and this has certainly been the case for BMS. Juniormembers of staff now demonstrate a desire to improve theirstatus and to undergo further training.
The effect of the training provided by the UNDP scheme, inaddition to the extensive ongoing programme of locally initi-ated and funded training programmes, has raised the standardof general competence. This is reflected in BMS’s services tothe military, civil aviation and marine activities (both commer-cial and leisure), through a tremendous improvement in theaccuracy of our forecasts. The five-day forecast is now widelypromulgated and is the subject of very positive feedback, notonly from commercial users, but also from numerous govern-ment departments and royal family members who have cometo rely on its content.
Improvements in the aviation sectorGreat strides have been made over the past five to seven yearsin the methods and distribution of aviation sector products.
Initially, all forecast upper wind charts were analysed by handwith streamlines, copied, reduced and distributed by hand tovarious users. Significant weather charts above FL200 inter-nationally, and above FL100 regionally were also hand-drawnwith local modification, before being distributed in a similarmanner.
The introduction of the forecaster workstation systemdramatically altered methods of production. Charts receivedthrough Meteorological Data Distribution (MDD) broadcastswere produced automatically, though still with the facility to be BMS Meteorological enclosure
Phot
o: B
MS
1.Policy planning & Governance:Master spread 16/2/07 09:34 Page 40

[ ]41
to the Kingdom of Bahrain and has raised the profile of BMSglobally.
The president has worked tirelessly throughout the tenure ofhis office and has initiated and overseen a number of success-ful projects. This has been done in addition to his work as head
of BMS and with the assistance of a very small but highly qual-ified staff.
WMO sub-regional officeThe sub-regional office is an integral part of the Secretariat ofthe Organization. It is located in the city of Manama, capital ofthe Kingdom of Bahrain. Its responsibilities are defined by theorganization and its specific activities by the Secretary-General.Its responsibilities include liaising with the Members ofRegional Association II (Asia), with the WMO regional officefor Asia and the South-West Pacific, with the regional officesof the United Nations, the United Nations DevelopmentProgramme and of other UN subsidiary bodies, with regionaloffices of other specialized agencies, and with regional inter-governmental organizations in the fields of meteorology andoperational hydrology related disciplines.
The establishment of a WMO sub-regional office in Bahrainshould mitigate this workload.
Aviation services provided by BMSPre-flight briefing – This is achieved through the provision ofpre-flight briefing documents, including forecast en-routewinds, forecast en-route significant weather, and forecast climband descent winds, issued to all aircraft departing from BahrainInternational Airport for international and regional destina-tions. This service is part of the aeronautical informationservices provided by the briefing office through the recentlyestablished automated system.
In-flight meteorological services – The meteorological oper-ations centre is linked directly to the control tower, approach,and area control centres, where information collected fromautomatic weather stations and satellite distribution (SADIS)is processed and then displayed at air traffic controllers’ workstations for onward transmission to all appropriate users inflight.
70
60
80
90
100
JAN FEB MAR APR MAY JUN JUL AUG SEP OCT NOV DEC
Perc
enta
ge
24hrs 48hrs 72hrs
Bahrain Meteorological Service long term forecast verification – (2000-2005)
Source: Bahrain Meteorological Service (BMS) – Climatology section – 2001
Phot
o: B
MS
School visit to BMS
1.Policy planning & Governance:Master spread 16/2/07 09:34 Page 41

In addition to these services, all other necessary and appro-priate meteorological reports are made available on thebroadcast systems and volume meteorological (VOLMET)centres through designated radio frequencies and data links.
Dissemination of routine METARs and TAFsBahrain has been designated one of the main collection anddistribution centres in the Middle East region within theInternational Civil Aviation Organization (ICAO) regionalOperational Meteorological (OPMET) bulletin exchangescheme. All aviation routine weather report (METAR, from theFrench) and terminal aerodrome forecast (TAF) issues are sentthough a data link to the Bahrain Aeronautical FixedTelecommunication Network/Common ICAO Data InterchangeNetwork (AFTN/CIDIN) centre for onward transmission inaccordance with predefined address lists.
Services to the mediaBMS has for many years provided services to the press, radioand television:
Radio – Live radio broadcasts are made to the BahrainRadio and Television Company several times each day in theArabic language. These broadcasts are immensely popularwith the general public and very often lead to lively discus-sions regarding the weather. Regular feedback is generallyvery positive.
Press – Forecasts are made to all published newspapers inthe Kingdom of Bahrain, both English and Arabic-speaking.Feedback is positive and any letters to the press regardingweather phenomena are answered fully and promptly.
Television – BMS has for many years provided both theEnglish-speaking station and the Arabic-speaking station withwritten forecast scripts. In 2002, a TV graphics system waspurchased to enable a comprehensive broadcast to Bahrain tele-vision. This service appeared to be popular with the viewingpublic, but unfortunately staffing difficulties necessitated itssuspension in 2005. BMS recently upgraded the TV graphicssystem, and after successful negotiation with Bahrain TV, theservice is due to resume in the near future.
All of these media services can be used to issue urgent messagesof highly inclement weather that could endanger or inconve-nience government services and the general public.
Flight safetyIt is clear that weather phenomena have a significant impact onflight safety, even allowing for major improvements in aircraftconstruction and onboard instrumentation. BMS will continueto provide all the necessary resources within its budget to main-tain and improve its contribution to flight safety andconvenience of delivery.
To this end, it has recently installed the latest forecasterworkstation system incorporating the Meteosat second-gener-ation satellite receiving system. It will continue to review allmajor developments in equipment and techniques for provid-ing the best and safest possible service.
Forward planningPlanning for the short and long-term future of meteorologicalservices is a vital part of BMS’s strategy in conjunction withthe Deputy Prime Minister responsible for Meteorology. Weare confident that this policy will continue to flourish.
With this in mind we have appointed specialists withinBMS to constantly review and inform the Assistant Under-Secretary for Meteorology of all developments and revisedtechniques in providing the best services possible to the avia-tion sector.
Our in-house specialists will advise on:• Developments in computing equipment and services
relevant to meteorological services• Developments in satellite reception and analysis• Climate change and research• Developments in communication and dissemination
techniques.
StaffingMany of the current BMS staff members are graduates at BSc orMSc level. Those who are not graduates are at senior staff levels,persons of long experience in operational forecasting. Suchstaff members have undertaken postgraduate courses relatingto meteorology. They have also attended courses in numerouscountries on disciplines such as satellite meteorology, agricul-tural meteorology, remote sensing and marine meteorology.
BMS management intends to replace these experiencedmembers of senior staff, upon their retirement, with graduates.Future recruitment of junior-level operational forecasting,climatology, computing and research staff will be at graduatelevel. In addition, support staff are being encouraged to under-take graduate training.
BMS wishes to express its gratitude to the individuals andorganisations that have contributed to its success and devel-opment over recent years.
[ ]42
BMS weather radar image, 19 Nov 2000
Phot
o: B
MS
1.Policy planning & Governance:Master spread 16/2/07 09:34 Page 42

[ ]43
IN CANADA, weather-related disasters and extreme eventscontinue to place increasing burdens on citizens and theeconomy. Flooding disasters alone are about four times as
frequent today as they were 50 years ago. The ice storm of 1998was the single most expensive natural disaster in Canadianhistory, resulting in over 30 deaths and USD5.5 billion indamages. In addition, wildland-urban interface fires have, overthe last several summers, presented unique management chal-lenges related both to property loss and the design ofevacuation and response plans.
Canada is signatory to the Hyogo Framework for Action,which calls upon all nations to reduce the frequency of disas-ters within a decade. As over 80 per cent of all Canadian
disasters have been weather related in the past, weather andclimate adaptation strategies will almost certainly reduce disas-ter risk in the future. Adaptation strategies can take many forms– the more successful are those that seek a balanced approachemphasizing both long and short-term lines of defence.
As a consequence, within Canadian disaster managementcircles, it is commonly accepted that the Meteorological Servicedoes, and will continue to play an increasingly important disas-ter risk reduction role. However, Canada’s geographic extentand decentralized approach to emergency managementpresents a unique challenge. Canadians from coast to coast areregularly exposed to a variety of environmental conditions,making a nationally consistent approach difficult to achieve.
Reducing disaster risk in Canada: newlegislation and policies that enable citizens to adapt to weather and climate extremes
Magda Little, Environment Canada, David Grimes, A/Assistant Deputy Minister, Meteorological Service of Canada, Environment Canada and Alvin Lau A/Coordinator, Business Policy Directorate, Meteorological Service of Canada, Environment Canada
Working with provinces and insurance companies, the Meteorological Service of Canada has developed RWIS to ensure safe driving conditions for Canadian highways
Phot
o: C
orel
Cor
pora
tion
199
4
1.Policy planning & Governance:Master spread 16/2/07 09:34 Page 43

[ ]44
tional issues. Through this system of government the provincesare left to develop emergency preparedness and disaster miti-gation planning and are responsible for the assessment ofpotential impacts of natural disasters within their communities.As there are no meteorological services at the provincial level,assessment of natural hazard impact scenarios from both a day-to-day standpoint and a more long-term planning one isdifficult. With the exception of a few fledgling programmes,provinces and other stakeholders have been forced to rely oninformal consultative networks with the Meteorological Serviceto develop emergency plans.
As the new Emergency Management Act emphasizes federalinvolvement in all four pillars of emergency managementincluding prevention/mitigation, preparedness, response andrecovery, through this proposed legislation federal departmentsare tasked with the assessment of risk for hazards within theirjurisdiction. For the Department of the Environment and itsMeteorological Service, this encompasses risks associated withweather and climate. Assessment of risk has traditionally beenwithin the provincial jurisdiction, while federal involvementhas been focused on hazard assessment. Although this newproposed Act does raise some questions related to federalversus provincial purview, it does show great promise as itallows for the development of nationally consistent emergencymanagement policies and programmes including naturalhazard risk assessments.
For the Meteorological Service of Canada, this new Act comesat a good time since internationally, as well as nationally thereis renewed interest in the services that National Meteorologicaland Hydrometeorological Services (NMHS) are able to providewith respect to the mitigation of natural hazard impacts.International focus, led by the UN International Strategy forDisaster Reduction (ISDR) and the World Meteorological
Canada’s Meteorological Service is housed within theDepartment of the Environment and, through the Departmentof the Environment Act, mandated to provide meteorologicalinformation for all civil and military purposes. This is a broadmandate but when combined with other federal legislative toolsincluding the Emergency Preparedness Act, coverage is sufficient.
Emergency management legislation in Canada, as in manynations, has its origins in political conflict. Not until 1988 wasthe antiquated War Measures Act replaced with theEmergencies Act due to a perceived need for emergency legis-lation during peacetime. This recognition came about in partas a result of an effort to manage the impacts of natural hazardsincluding floods and earthquakes. The Emergencies Act israrely invoked and is intended for use only in times of nationalcrisis, or when national resources are overwhelmed.
A second act, the Emergency Preparedness Act which alsocame into force in 1988, outlines the roles and responsibilitiesof all the federal departments in relation to preparedness. Thisincludes the development of effective tools, policies, proce-dures and plans for how to best manage an actual event. TheEmergency Preparedness Act designates the MeteorologicalService of Canada (as agent of the Minister of the Environment)as responsible for:
• The identification of environmental hazards and theirassociated risk
• Conducting observations and forecasts, and providingtimely warnings to the general public and to emergencyresponders with respect to weather, ice and sea-state
• Projecting the dispersion of toxic or polluting substancesin air and water
• Placing under coordinated federal control, where required,any meteorological, limnological, or hydrologicalresources, facilities and services in Canada (except thoseoperated by the Canadian Forces)
• Providing increased meteorological, limnological or hydro-logical support to the Canadian Forces.
These activities, though important within the spectrum ofemergency management activity, do not directly address mitiga-tive strategies for disaster risk reduction. However, emergencymanagement legislation in Canada is in a state of transition. Anew Emergency Management Act is set to replace theEmergency Preparedness Act. The intent of this new act is tobetter address all aspects of emergency management includ-ing prevention/mitigation, preparedness, response and recovery,as well as the respective and often interlinked roles of federaldepartments. Proactive measures are emphasized which werenot addressed in the Emergency Preparedness Act. TheEmergency Management Act has now passed a second readingwithin parliament, but has not yet been legislated. This act hassignificant implications for disaster risk reduction program-ming on a national level within Canada.
Under the current system of government, responsibility foremergencies rests primarily with the individual. Differentorders of government intervene only as the individual’s abilityto manage is compromised. If an individual cannot cope,municipal resources are tapped. Provincial involvement isrestricted only to instances where municipal resources are inad-equate or intercity/interagency coordination is required.Federal governments are involved only when aid is formallyrequested by the provinces, or when activity is within thefederal purview, as is the case for trans-border and interna-
The Canadian Ice Service provides a wide range of products andservices to the navigation sectors
Phot
o: C
orel
Cor
pora
tion
199
4
1.Policy planning & Governance:Master spread 16/2/07 09:34 Page 44

[ ]45
Organization’s disaster mitigation/prevention, has turned to thedevelopment of products and services for the early warning ofnatural high impact events that reduce disaster risk.
Early in January 2007, in the aftermath of the Stanley Parkblow-down which destroyed thousands of historic trees in oneof Canada’s most visited national parks, federal, provincial andterritorial ministers responsible for emergency managementannounced a framework for emergency management empha-sizing a federal role in disaster mitigation, early warning anddisaster financial assistance arrangements. Although disastermitigation and hazard assessment services are related, they arenot one and the same. Disaster mitigation is readily recognizedas focused on the impacts rather than the quantification of thehazard itself. This is what differentiates disaster mitigation fromthe more traditional meteorological services. In fact, new legis-lation and the new national emergency managementframework for Canada result in a good prognosis for harness-ing the capability of the Meteorological Service of Canada interms of developing weather and climate adaptation measuresbenefiting all Canadians, their livelihoods and their naturalenvironment. Although there are many other avenues to pursuewhich are enabled by impending legislation and policies, theMeteorological Service of Canada with its many partners hasprovided, and continues to provide citizens with some of thetools they require to reduce disaster risk. Some examples ofsuch provisional measures are detailed below.
Air quality – In collaboration with provincial governmentsand regional authorities, the Meteorological Service of Canadahas established a strong air quality forecast system. Air qualityin Canada is based on the Air Quality Index and is monitoredon a daily basis. Air quality forecasts are issued in partnershipwith provinces, while air quality advisories are issued once airpollution levels exceed national standards in partnership withprovinces and local regional health authorities. Advice is issuedin these advisories intended to protect the health of Canadiansand the environment.
Northern Rangers – The Meteorological Service of Canadacollaborates with the Northern Rangers, a group of 4,000 volun-teers and reservists within the Canadian military, primarilyconsisting of members of the Inuit and Native communities.Their main role is to maintain a Canadian presence in the Northwhile performing other tasks such as training the Canadianmilitary, collecting data and conducting surveillance using tradi-tional geographical, navigational and survival skills. Recenttrends such as the melting of sea ice in the Arctic, have ampli-fied the role and importance of Canada’s Northern Rangers.
Road Weather Information System – One of the MeteorologicalService of Canada’s most successful programmes is the RoadWeather Information System (RWIS). In partnership withTransport Canada, the provinces and the private sector, theRWIS is a complex road condition monitoring system.Automatic sensors report road forecasts, current conditions anddata to decision makers, resulting in safer driving conditionsand a reduced usage of unnecessary road treatment chemicals.There have now been negotiations with the United States andMexico to implement a continental system for the entire roadand highway network across North America.
Online information – The Meteorological Service of Canadahas developed an online database and Web site detailing back-ground information and maps regarding natural hazards in theprovince of Ontario. A collection of background informationand maps assists local decision makers and individuals in prepa-
ration for disasters and the evaluation of associated risks. ThisWeb site has been a useful tool for local municipalities in emer-gency preparedness planning, as required by provincial law.
Warning preparedness meteorologists – Warning preparednessmeteorologists act as a useful resource for the media and emer-gency management personnel. In the event of a natural disasteror emergency, they act as coordinators and advisors. In numer-ous events of severe weather hazards, this programme hasprovided scientific advice for the media. The meteorologistsare also responsible for training and educating the Canadianpublic on severe weather related issues, through a series ofworkshops and forums with emergency management person-nel and decision makers.
Canadian Ice Service – The Canadian Ice Service providesproducts and services to the offshore gas and oil industry byproviding iceberg and sea ice information for exploration andproduction, both onsite and in transit. This includes the moni-toring and tracking of icebergs and the forecasting of marineweather conditions, mostly on the Atlantic Coast.
Hot weather information – The Meteorological Service ofCanada is responsible for issuing weather forecasts and relatedhot weather information. Actual heat warnings and advisoriesare to be issued at the discretion of local health authorities. Atthe request of local and provincial authorities, EnvironmentCanada will assist in the event of extreme heat conditions. TheMeteorological Service of Canada has developed a nationalmeasurement system called the Humidex, based on hightemperature and humidity to assist local authorities with heatwave related decision making. The city of Toronto was selectedas one of the UN and World Health Organization’s trial citiesto pilot the heat wave warning system, and plans are underwayto explore and develop a national heat wave warning system.
Weatheradio – The Meteorological Service of Canada’sWeatheradio network broadcasts from 185 locations across thecountry, reaching over 92 per cent of Canadians. These arepassive systems enabling citizens to be alerted to high impactevents even when not actively seeking information. Now, 92per cent of Canadians can access a Weatheradio signal, andrecent technological advances have made it possible for listen-ers to programme radio receivers to deliver only certain typesof warnings for their specific locations. ‘Weatheradio is evolv-ing into an “all-hazards” alert system. Warnings for non-weatherrelated natural disasters, technological accidents, AMBER alertsand terrorist attacks will eventually be added to the broadcasts’.
A member of the Canadian Forces discusses training exercises withtwo Northern Rangers
Phot
o: S
gt F
rank
Hud
ec, D
epar
tmen
t of
Nat
iona
l Def
ence
Can
ada,
200
4
1.Policy planning & Governance:Master spread 16/2/07 09:34 Page 45

[ ]46
SOCIO-ECONOMIC ACTIVITIES in Japan, as well as in otherparts of East Asia are increasingly vulnerable to weatherand climate variability. Timely and user-oriented weather
and climate information is needed in order to prevent andmitigate adverse weather effects, and to produce socio-economic benefits. For this reason, the Japan MeteorologicalAgency (JMA) has been engaged in operational daily-to-seasonal forecasts disseminated to central and localgovernments and to the public, while making efforts in collab-oration with user communities to facilitate application ofweather/climate information.
Pilot project: tailored weather/climate information serviceAfter the cool summer of 2003, which caused extensive damageto socio-economic activities, especially agriculture, JMA initi-ated collaborative research with eight prefectural governmentsin Japan. These were intended as model cases to developtailored weather/climate information for agriculture, based onmedium- and extended-range ensemble forecasts.
Tailored forecasts for different types of agricultural damagewere identified in cooperation with local governments.Relevance differs from region to region, due to difference incrop natures, weather/climate conditions and other reasons.For example, paddy rice cultivation in northern parts of Japanis vulnerable to cool weather. Deep-water-irrigation manage-ment is an effective measure to protect the rice fromcool-weather damage, especially in the early stage of thegrowth period. Thus, in Hokkaido, the prefectural govern-ment issues agricultural management advice to farmers, whendaily minimum temperatures of 13 degrees Celsius or beloware predicted by the weekly weather forecast.
In order to verify tailored forecasts and the timing ofissuance of agricultural advice, a simulation study wasconducted with the forecast services in Hokkaido for thecool summer of 2003. In this experiment, a meteorologicalobservatory issued a special agro-meteorological report,which consisted of a brief description of the expectedweather situation and a probabilistic forecast of temperaturebelow specific thresholds derived from medium/extended-range ensemble forecast. The local government issued anagricultural management report according to the forecasts.The simulation result indicated that the agricultural manage-ment advice could have been issued five times, whereas itwas actually issued only once. The results also indicated thatthe ratio of sterile rice could have been reduced by 5 per cent
from 14-23 per cent, if early warnings and agriculturalmanagement advice had been issued more promptly to guidefarmers.
These pilot studies confirmed that it is essential for meteo-rological and agricultural organizations to form collaborativeapproaches in developing appropriate and timelyweather/climate information, which can be incorporated intousers’ decision-making processes.
Following this successful investigation, other meteorolog-ical observatories, in collaboration with local governmentsand institutions, started to consider the possibility of issuingtailored probabilistic forecasts and agrometeorological infor-mation to mitigate agricultural damage related to weather andclimate. Since June 2006, tailored forecasts and informationusing ensemble forecasts have been operational in 14 prefec-tures out of 47 in Japan, with a further ten underconsideration.
Early warning information on extreme temperature eventsIn March 2007 JMA initiated the provision of early warninginformation on extreme temperature events (hereafter,called ‘early warning information’). The early warning infor-mation forecasts the possible occurrence of significantlyhigh/low temperature events with a one-to-two-week leadtime. This information aims to mitigate the impacts of theextremely high/low temperatures on socio-economic activ-ities such as agriculture, electric power industry, and humanhealth.
Through dialogues with user communities, it became evidentthat the early warning information was expected to be applic-able to a variety of sectors.
Agriculture – Deep-water irrigation is one of the most effec-tive management measures to prevent and mitigate coolweather damage to paddy rice. In citrus cultivation, earlyprediction of low temperatures can prompt early harvesting,thus reducing frost and freeze damage.
Electric power – Scheduled maintenance of power plants isconducted through the year to guarantee stable service. Re-scheduling of maintenance is reliant on power supply outlook,which is closely related to temperature variations. Thus earlywarning information on extreme temperature events will aidthe more effective running of power plants.
Health – Early warning information on extreme tempera-ture events can be used for predicting the numbers affected bytemperature-sensitive diseases such as flu or heat stroke. This
Weather and climate information services forsocio-economic benefit: challenges in Japan
Koichi Kurihara, Japan Meteorologial Agency
1.Policy planning & Governance:Master spread 16/2/07 09:34 Page 46

[ ]47
information helps medical institutions to prepare, and to raisepublic awareness.
Disaster prevention – Snowfall is one of the major factorswhich considerably affects socio-economic activities innorthern Japan and areas along the Sea of Japan. Early infor-mation on snowfall enables local governments to preparehuman resources and snow-removal machines for quickresponse.
Early warning information is issued when an extreme temper-ature is predicted within two weeks, and with a probability ofoccurrence at 20 per cent or more. An extreme temperatureevent is defined as having a climatological occurrence rate ofless than 10 per cent. The information consists of a briefdescription of the expected weather situation and probabilis-tic forecast information. The probabilistic prediction productsderived from the extended-range ensemble forecast for 11climatological divisions over Japan are produced twice a week,thus allowing regular updates.
The early warning information service is operating on a trialbasis until early 2008, with limited provision to specific orga-nizations, each of which is well experienced in utilizingprobabilistic forecast information (hereafter, called ‘coopera-tive organizations’). In the trial period, the information will bereviewed and improved according to requirements and sugges-tions from the cooperative organizations. After the trial, theinformation will be improved based on feedback from users.There are also plans to develop early warning techniques forother extreme climate events associated with precipitation andsunshine duration in the near future.
International cooperationTechniques and knowledge accumulated in Japan are expectedto be applicable in other parts of the world. JMA has beenassisting National Meteorological and Hydrological Services(NMHS) in the Asia-Pacific region with climate servicesthrough the Tokyo Climate Center (TCC). TCC providesvarious kinds of climate monitoring and forecast products viaits Web site (http://okdk.kishou.go.jp/) and has organizedtraining courses and workshops.
In order to further assist NMHS in advancing climate infor-mation application, JMA has developed statistical techniquesdownscaling one-month ensemble forecast GPV data toobservation stations in East and Southeast Asia. Probabilisticforecasts for the stations will be available through thewebsite.
Towards upgrading climate information servicesFully user-oriented weather and climate information services,where information supports each user to judge and act prop-erly in respective socio-economic activities, is our long termgoal. JMA is also planning to expand the contents of earlywarning information according to emerging needs, and basedon an improved understanding of weather and climate predic-tions.
Efforts in Japan towards providing user-orientedweather/climate information and forecasts unquestionablycontribute to socio-economic benefits. However, it is neces-sary to continue, and extend cooperation with NMHS, sharingexpertise and experience, in order to improve internationalweather and climate service.
Selected tailored forecasts for agriculture in Japan
Prefecture Crop Targeted Tailored probabilistic forecast Target period Damage damage or Target element Threshold Used forecast preventionoperation Degrees (˚C) management
Hokkaido paddy rice cool-weather daily minimum below 13 weekly weather July to August deep-water damage temperature forecast management
weekly mean below 19 weekly mean temperature forecast one-week
ahead
Aomori and Miyagi paddy rice timing of accumulated daily 960 or above weekly mean mid August to mid harvesting mean temperature forecast up until September
from head spout one-month ahead
Iwate and Miyagi paddy rice cool-weather daily minimum 17 or below weekly weather July to early August deep-water damage temperature forecast management
Miyagi paddy rice warm-weather daily minimum 25 or above weekly weather August to mid water-flow damage temperature forecast September management
Nagano apple frost damage daily minimum below -4, weekly weather April to May and fanning and temperature -2, 0 or 2 forecast October to combustion
November
Hiroshima citrus frost damage daily minimum below -2 or 0 weekly weather December to March early harvestingtemperature forecast
weekly mean below 4 weekly mean temperature forecast one-week
ahead
Source: Investigation on the improvement of agrometeorological service (in Japanese). JMA, 2005
1.Policy planning & Governance:Master spread 16/2/07 09:34 Page 47

[ ]48
IN VIEW OF the increasing global urbanization and disastervulnerability of megacities, Meteorological Services mustmeet new challenges not only from disaster risk manage-
ment, but also from human settlement and sustainabledevelopment. This includes public security, energy supply,environment protection, and transportation control.
With its rapid urbanization and population growth,Shanghai, a megacity of China, has become more vulnerableto disasters such as typhoons, severe convective weather, thickfog, heat waves and city fires. Sometimes non-severe weathermay bring serious problems because an increasing number ofactivities are more sensitive to weather and climate. Forexample, a light snowfall of 1.7 millimetres caused a severetraffic jam in Shanghai on 28 February 2005.
The Shanghai Regional Meteorological Center, ChinaMeteorological Administration (SRMC / CMA) recognizes theimportance and relevance of Meteorological Services in megac-
ities such as Shanghai, and aims to explore and understandthem as far as possible.
Meteorological Services in multi-hazard mitigationMulti-agency preparedness, multi-hazard integration andmulti-phase response are three crucial factors of disaster riskmanagement in megacities. As 89 per cent of disasters involvethe weather, water, climate-related hazards and conditions,Meteorological Services should play a basic but very impor-tant role in multi-disaster risk management, especially in theestablishment of early warning systems.
Multi-agency preparedness – This requires joint efforts frommultiple government agencies to support disaster risk manage-ment. In Shanghai, the Emergency Response/MitigationCommittee consists of 50 members from government agencies,collectively equipped to deal with matters including flooding,severe weather, earthquakes, fire, traffic accidents, chemical
New challenges to meteorological services for human settlement and
sustainable development in megacities
Xu Tang, PhD, Director-General, Shanghai Regional Meteorological Center, China Meteorological Administration
Seamless dissemination of multi-hazard warning information
1.Policy planning & Governance:Master spread 16/2/07 09:34 Page 48
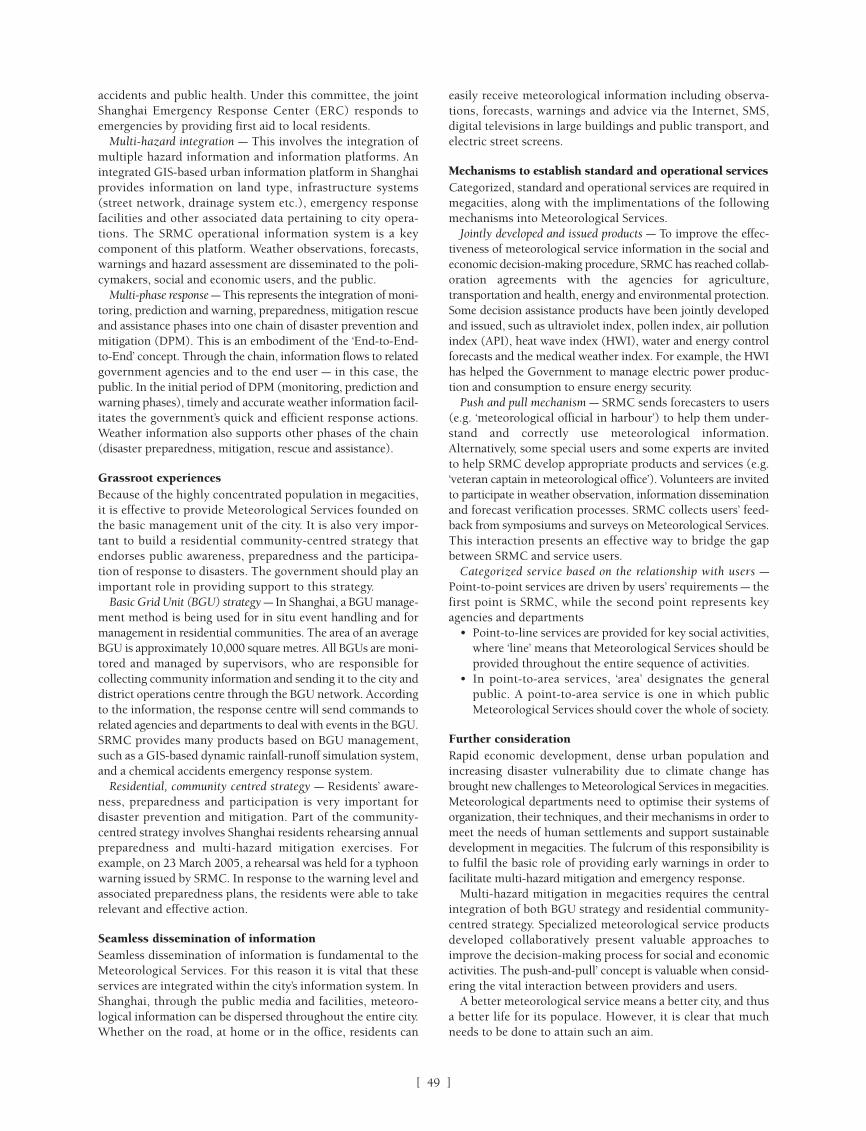
[ ]49
easily receive meteorological information including observa-tions, forecasts, warnings and advice via the Internet, SMS,digital televisions in large buildings and public transport, andelectric street screens.
Mechanisms to establish standard and operational servicesCategorized, standard and operational services are required inmegacities, along with the implimentations of the followingmechanisms into Meteorological Services.
Jointly developed and issued products – To improve the effec-tiveness of meteorological service information in the social andeconomic decision-making procedure, SRMC has reached collab-oration agreements with the agencies for agriculture,transportation and health, energy and environmental protection.Some decision assistance products have been jointly developedand issued, such as ultraviolet index, pollen index, air pollutionindex (API), heat wave index (HWI), water and energy controlforecasts and the medical weather index. For example, the HWIhas helped the Government to manage electric power produc-tion and consumption to ensure energy security.
Push and pull mechanism – SRMC sends forecasters to users(e.g. ‘meteorological official in harbour’) to help them under-stand and correctly use meteorological information.Alternatively, some special users and some experts are invitedto help SRMC develop appropriate products and services (e.g.‘veteran captain in meteorological office’). Volunteers are invitedto participate in weather observation, information disseminationand forecast verification processes. SRMC collects users’ feed-back from symposiums and surveys on Meteorological Services.This interaction presents an effective way to bridge the gapbetween SRMC and service users.
Categorized service based on the relationship with users –Point-to-point services are driven by users’ requirements – thefirst point is SRMC, while the second point represents keyagencies and departments
• Point-to-line services are provided for key social activities,where ‘line’ means that Meteorological Services should beprovided throughout the entire sequence of activities.
• In point-to-area services, ‘area’ designates the generalpublic. A point-to-area service is one in which publicMeteorological Services should cover the whole of society.
Further considerationRapid economic development, dense urban population andincreasing disaster vulnerability due to climate change hasbrought new challenges to Meteorological Services in megacities.Meteorological departments need to optimise their systems oforganization, their techniques, and their mechanisms in order tomeet the needs of human settlements and support sustainabledevelopment in megacities. The fulcrum of this responsibility isto fulfil the basic role of providing early warnings in order tofacilitate multi-hazard mitigation and emergency response.
Multi-hazard mitigation in megacities requires the centralintegration of both BGU strategy and residential community-centred strategy. Specialized meteorological service productsdeveloped collaboratively present valuable approaches toimprove the decision-making process for social and economicactivities. The push-and-pull’ concept is valuable when consid-ering the vital interaction between providers and users.
A better meteorological service means a better city, and thusa better life for its populace. However, it is clear that muchneeds to be done to attain such an aim.
accidents and public health. Under this committee, the jointShanghai Emergency Response Center (ERC) responds toemergencies by providing first aid to local residents.
Multi-hazard integration – This involves the integration ofmultiple hazard information and information platforms. Anintegrated GIS-based urban information platform in Shanghaiprovides information on land type, infrastructure systems(street network, drainage system etc.), emergency responsefacilities and other associated data pertaining to city opera-tions. The SRMC operational information system is a keycomponent of this platform. Weather observations, forecasts,warnings and hazard assessment are disseminated to the poli-cymakers, social and economic users, and the public.
Multi-phase response – This represents the integration of moni-toring, prediction and warning, preparedness, mitigation rescueand assistance phases into one chain of disaster prevention andmitigation (DPM). This is an embodiment of the ‘End-to-End-to-End’ concept. Through the chain, information flows to relatedgovernment agencies and to the end user – in this case, thepublic. In the initial period of DPM (monitoring, prediction andwarning phases), timely and accurate weather information facil-itates the government’s quick and efficient response actions.Weather information also supports other phases of the chain(disaster preparedness, mitigation, rescue and assistance).
Grassroot experiencesBecause of the highly concentrated population in megacities,it is effective to provide Meteorological Services founded onthe basic management unit of the city. It is also very impor-tant to build a residential community-centred strategy thatendorses public awareness, preparedness and the participa-tion of response to disasters. The government should play animportant role in providing support to this strategy.
Basic Grid Unit (BGU) strategy – In Shanghai, a BGU manage-ment method is being used for in situ event handling and formanagement in residential communities. The area of an averageBGU is approximately 10,000 square metres. All BGUs are moni-tored and managed by supervisors, who are responsible forcollecting community information and sending it to the city anddistrict operations centre through the BGU network. Accordingto the information, the response centre will send commands torelated agencies and departments to deal with events in the BGU.SRMC provides many products based on BGU management,such as a GIS-based dynamic rainfall-runoff simulation system,and a chemical accidents emergency response system.
Residential, community centred strategy – Residents’ aware-ness, preparedness and participation is very important fordisaster prevention and mitigation. Part of the community-centred strategy involves Shanghai residents rehearsing annualpreparedness and multi-hazard mitigation exercises. Forexample, on 23 March 2005, a rehearsal was held for a typhoonwarning issued by SRMC. In response to the warning level andassociated preparedness plans, the residents were able to takerelevant and effective action.
Seamless dissemination of informationSeamless dissemination of information is fundamental to theMeteorological Services. For this reason it is vital that theseservices are integrated within the city’s information system. InShanghai, through the public media and facilities, meteoro-logical information can be dispersed throughout the entire city.Whether on the road, at home or in the office, residents can
1.Policy planning & Governance:Master spread 16/2/07 09:34 Page 49

[ ]50
SOUTH-EASTERN EUROPE is surrounded by the Adriaticand Ionian seas to the west, the Black and Marmara seasto the east, and the Mediterranean and Aegean seas to
the south. On the northern border it touches the Pannonianlowland. The southern edges of the Alps, the Carpathians andthe Dinaric Alps indicate the parameters of the area.According to these various influences, a multitude of climatetypes prevail, including continental, mountainous andmaritime (Mediterranean). This in turn results in a broadrange of recorded temperature and precipitation. The annualaverage precipitation ranges from 500 millimetres in the eastlowland up to 5,000 millimetres in the West Mountains. Thehighest temperature is above 40 degrees Celsius and thelowest below –35 degrees Celsius.
The area is frequently subjected to strong winds – forexample, Bora experiences gusts of up to 70 metres per secondalong the Eastern Adriatic Coast and through Košava in theDanube River valley. It is also common to find deep snow inthe mountainous areas during the winter season. Agriculturesuffers every year due to spring and autumn frosts. Heat andcold waves, landslides, flash floods and droughts represent apermanent risk to human safety, the environment and theeconomy. Severe thunderstorms are frequent in the summerperiod, as well as hail, and water and land spouts. More frequentand severe weather extremes, the visible symptoms of globalclimate warming, are also evident. Such occurrences indicatethe necessity for closer collaboration between NMHSs (NationalMeteorological and Hydrological Services) in the sub-region.
CountriesSouth-eastern Europe constitutes a small overall area, butembraces a plethora of countries each representing a differentculture and a different level of economy. The following areconsidered to represent south-eastern Europe: Albania, Bosniaand Herzegovina, Bulgaria, Croatia, Cyprus, Greece, Hungary,Israel, the Former Yugoslav Republic of Macedonia, Republicof Moldova, Montenegro, Romania, Serbia, Slovenia and Turkey.
Recent conflict has detrimentally affected the sustainabilityof the area, including the attempts at collaboration over mete-orological and hydrological policy. This prompted the WMOto bring back the alliance of the countries, by organizing theInformal Conference of South-Eastern Europe (ICEED) withall NMHS Directors invited. The first ICEED meeting held inSofia, Bulgaria in 2001 resulted in the attending countriessigning a Memorandum of Understanding. Each successiveICEED meeting (2002: Geneva, Switzerland; 2003: Athens,Greece; 2004: Bucharest, Romania; 2005: Sarajevo, Bosnia andHerzegovina; 2006: Dubrovnik, Croatia) has produced signif-icant progress in collaboration over ideas and actions. Similarsuccess is expected of the Belgrade, Serbia meeting in 2007.
Constraints and challenges In general, the gathering and sharing of meteorological andhydrological information in South-Eastern Europe is not at asatisfactory level. Other areas of Europe gather data more thor-oughly and more frequently, as well disseminating the resultsto forecasting centres with speed and reliability.
This important topic was discussed at the Sixth AnnualMeeting of the ICEED held in Dubrovnik, Croatia in May 2006.The need for sharing data in order to improve the short, mediumand long term accuracy of weather and flood forecasting wasofficially recognized. This sharing ideology was envisaged on aregional level, along with data-sharing protocols and capacitybuilding for fully operational instrument networks.
The expectation of the ICEED directors is that the feasibilitystudy will enable them to identify the gaps in their capacity aswell as to improve coordination among the various countries.Furthermore, the feasibility study could be the basis for a sub-regional programme supported by the WMO, World Bank,Finnish Meteorological Institute, and other potential donors.
There are clear advantages of a regional approach to support-ing the NMHS:
• South-eastern Europe includes many small countries thatlack independent weather and flood forecasting resources,and thus particularly require the input of other countries
• Implementation of the system will be much cheaper if itis designed regionally; for example, the number of expen-sive radars for each country will be reduced significantly.
NMHS Strategy in south-eastern Europe
Ivan Čačić Meteorological and Hydrological Service (DHMZ), Croatia
South Eastern Europe
Phot
o: P
ublic
web
1.Policy planning & Governance:Master spread 16/2/07 09:34 Page 50
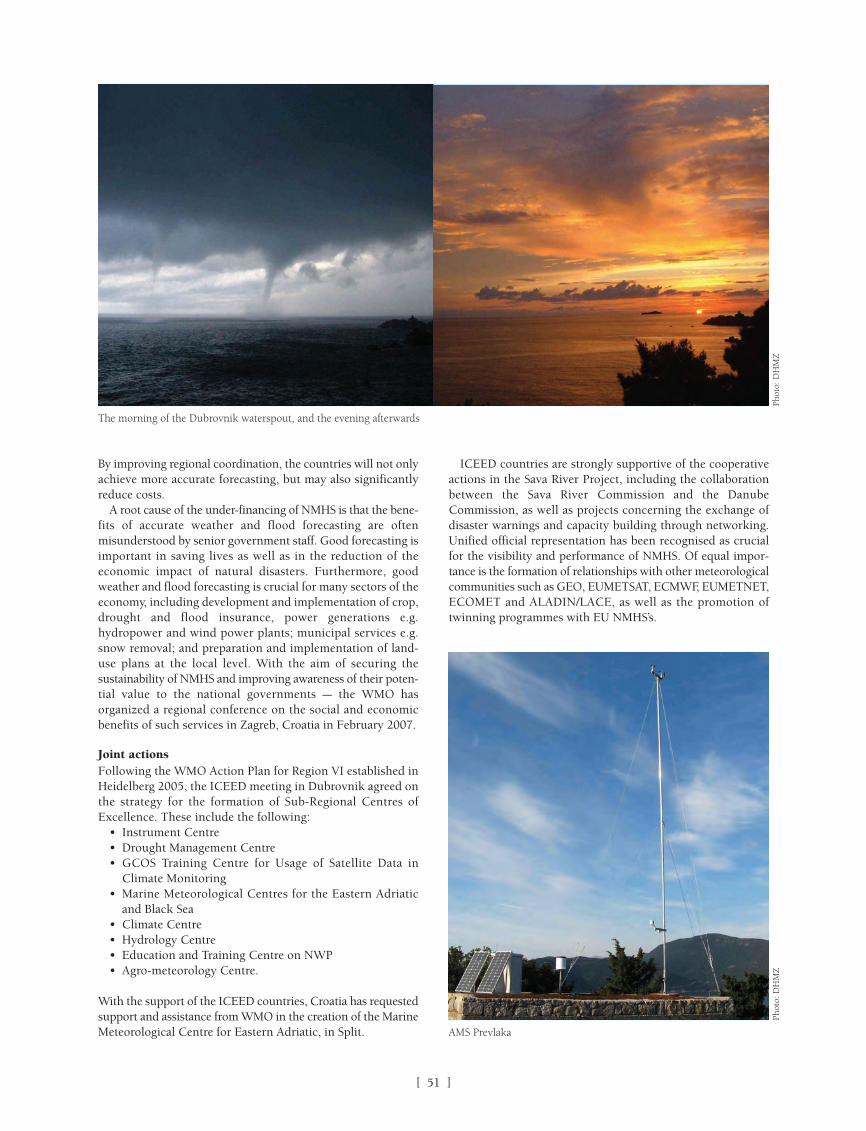
[ ]51
By improving regional coordination, the countries will not onlyachieve more accurate forecasting, but may also significantlyreduce costs.
A root cause of the under-financing of NMHS is that the bene-fits of accurate weather and flood forecasting are oftenmisunderstood by senior government staff. Good forecasting isimportant in saving lives as well as in the reduction of theeconomic impact of natural disasters. Furthermore, goodweather and flood forecasting is crucial for many sectors of theeconomy, including development and implementation of crop,drought and flood insurance, power generations e.g.hydropower and wind power plants; municipal services e.g.snow removal; and preparation and implementation of land-use plans at the local level. With the aim of securing thesustainability of NMHS and improving awareness of their poten-tial value to the national governments – the WMO hasorganized a regional conference on the social and economicbenefits of such services in Zagreb, Croatia in February 2007.
Joint actionsFollowing the WMO Action Plan for Region VI established inHeidelberg 2005, the ICEED meeting in Dubrovnik agreed onthe strategy for the formation of Sub-Regional Centres ofExcellence. These include the following:
• Instrument Centre• Drought Management Centre• GCOS Training Centre for Usage of Satellite Data in
Climate Monitoring• Marine Meteorological Centres for the Eastern Adriatic
and Black Sea• Climate Centre• Hydrology Centre• Education and Training Centre on NWP • Agro-meteorology Centre.
With the support of the ICEED countries, Croatia has requestedsupport and assistance from WMO in the creation of the MarineMeteorological Centre for Eastern Adriatic, in Split.
The morning of the Dubrovnik waterspout, and the evening afterwards
Phot
o: D
HM
Z
AMS Prevlaka
Phot
o: D
HM
Z
ICEED countries are strongly supportive of the cooperativeactions in the Sava River Project, including the collaborationbetween the Sava River Commission and the DanubeCommission, as well as projects concerning the exchange ofdisaster warnings and capacity building through networking.Unified official representation has been recognised as crucialfor the visibility and performance of NMHS. Of equal impor-tance is the formation of relationships with other meteorologicalcommunities such as GEO, EUMETSAT, ECMWF, EUMETNET,ECOMET and ALADIN/LACE, as well as the promotion oftwinning programmes with EU NMHS’s.
1.Policy planning & Governance:Master spread 16/2/07 09:35 Page 51

[ ]52[ ]52
2.Econ & social issues & perspectives:Master spread 16/2/07 10:02 Page 52

IIECONOMIC & SOCIAL ISSUES
& PERSPECTIVES
2.Econ & social issues & perspectives:Master spread 16/2/07 10:02 Page 53
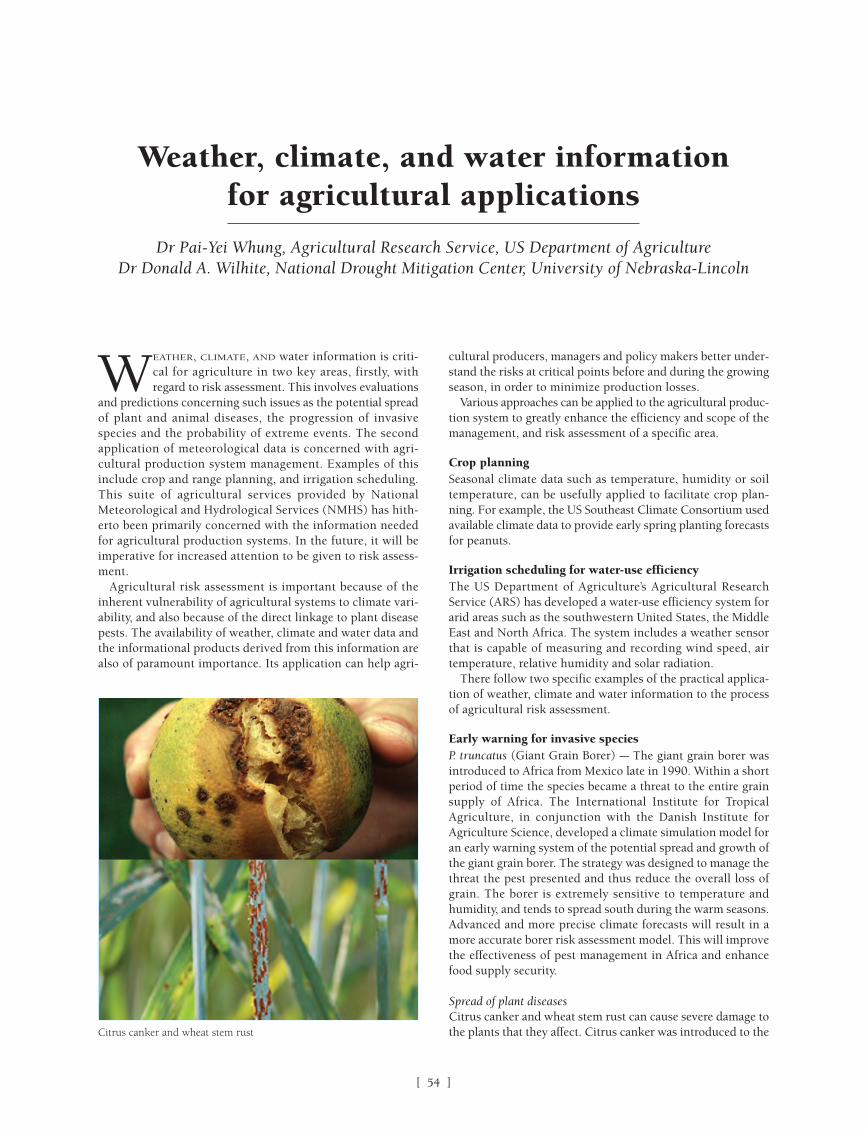
[ ]54
WEATHER, CLIMATE, AND water information is criti-cal for agriculture in two key areas, firstly, withregard to risk assessment. This involves evaluations
and predictions concerning such issues as the potential spreadof plant and animal diseases, the progression of invasivespecies and the probability of extreme events. The secondapplication of meteorological data is concerned with agri-cultural production system management. Examples of thisinclude crop and range planning, and irrigation scheduling.This suite of agricultural services provided by NationalMeteorological and Hydrological Services (NMHS) has hith-erto been primarily concerned with the information neededfor agricultural production systems. In the future, it will beimperative for increased attention to be given to risk assess-ment.
Agricultural risk assessment is important because of theinherent vulnerability of agricultural systems to climate vari-ability, and also because of the direct linkage to plant diseasepests. The availability of weather, climate and water data andthe informational products derived from this information arealso of paramount importance. Its application can help agri-
cultural producers, managers and policy makers better under-stand the risks at critical points before and during the growingseason, in order to minimize production losses.
Various approaches can be applied to the agricultural produc-tion system to greatly enhance the efficiency and scope of themanagement, and risk assessment of a specific area.
Crop planningSeasonal climate data such as temperature, humidity or soiltemperature, can be usefully applied to facilitate crop plan-ning. For example, the US Southeast Climate Consortium usedavailable climate data to provide early spring planting forecastsfor peanuts.
Irrigation scheduling for water-use efficiencyThe US Department of Agriculture’s Agricultural ResearchService (ARS) has developed a water-use efficiency system forarid areas such as the southwestern United States, the MiddleEast and North Africa. The system includes a weather sensorthat is capable of measuring and recording wind speed, airtemperature, relative humidity and solar radiation.
There follow two specific examples of the practical applica-tion of weather, climate and water information to the processof agricultural risk assessment.
Early warning for invasive speciesP. truncatus (Giant Grain Borer) – The giant grain borer wasintroduced to Africa from Mexico late in 1990. Within a shortperiod of time the species became a threat to the entire grainsupply of Africa. The International Institute for TropicalAgriculture, in conjunction with the Danish Institute forAgriculture Science, developed a climate simulation model foran early warning system of the potential spread and growth ofthe giant grain borer. The strategy was designed to manage thethreat the pest presented and thus reduce the overall loss ofgrain. The borer is extremely sensitive to temperature andhumidity, and tends to spread south during the warm seasons.Advanced and more precise climate forecasts will result in amore accurate borer risk assessment model. This will improvethe effectiveness of pest management in Africa and enhancefood supply security.
Spread of plant diseasesCitrus canker and wheat stem rust can cause severe damage tothe plants that they affect. Citrus canker was introduced to the
Weather, climate, and water information for agricultural applications
Dr Pai-Yei Whung, Agricultural Research Service, US Department of AgricultureDr Donald A. Wilhite, National Drought Mitigation Center, University of Nebraska-Lincoln
Citrus canker and wheat stem rust
2.Econ & social issues & perspectives:Master spread 16/2/07 10:02 Page 54
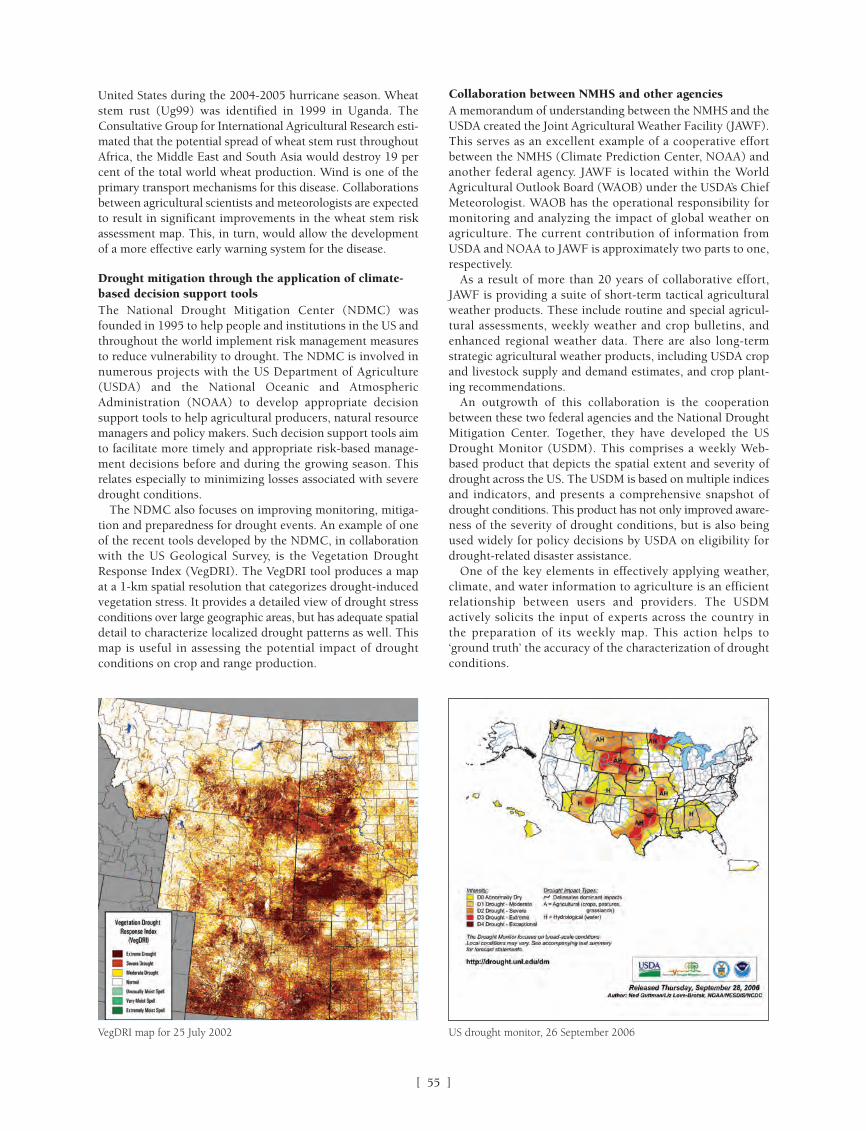
[ ]55
United States during the 2004-2005 hurricane season. Wheatstem rust (Ug99) was identified in 1999 in Uganda. TheConsultative Group for International Agricultural Research esti-mated that the potential spread of wheat stem rust throughoutAfrica, the Middle East and South Asia would destroy 19 percent of the total world wheat production. Wind is one of theprimary transport mechanisms for this disease. Collaborationsbetween agricultural scientists and meteorologists are expectedto result in significant improvements in the wheat stem riskassessment map. This, in turn, would allow the developmentof a more effective early warning system for the disease.
Drought mitigation through the application of climate-based decision support toolsThe National Drought Mitigation Center (NDMC) wasfounded in 1995 to help people and institutions in the US andthroughout the world implement risk management measuresto reduce vulnerability to drought. The NDMC is involved innumerous projects with the US Department of Agriculture(USDA) and the National Oceanic and AtmosphericAdministration (NOAA) to develop appropriate decisionsupport tools to help agricultural producers, natural resourcemanagers and policy makers. Such decision support tools aimto facilitate more timely and appropriate risk-based manage-ment decisions before and during the growing season. Thisrelates especially to minimizing losses associated with severedrought conditions.
The NDMC also focuses on improving monitoring, mitiga-tion and preparedness for drought events. An example of oneof the recent tools developed by the NDMC, in collaborationwith the US Geological Survey, is the Vegetation DroughtResponse Index (VegDRI). The VegDRI tool produces a mapat a 1-km spatial resolution that categorizes drought-inducedvegetation stress. It provides a detailed view of drought stressconditions over large geographic areas, but has adequate spatialdetail to characterize localized drought patterns as well. Thismap is useful in assessing the potential impact of droughtconditions on crop and range production.
Collaboration between NMHS and other agenciesA memorandum of understanding between the NMHS and theUSDA created the Joint Agricultural Weather Facility (JAWF).This serves as an excellent example of a cooperative effortbetween the NMHS (Climate Prediction Center, NOAA) andanother federal agency. JAWF is located within the WorldAgricultural Outlook Board (WAOB) under the USDA’s ChiefMeteorologist. WAOB has the operational responsibility formonitoring and analyzing the impact of global weather onagriculture. The current contribution of information fromUSDA and NOAA to JAWF is approximately two parts to one,respectively.
As a result of more than 20 years of collaborative effort,JAWF is providing a suite of short-term tactical agriculturalweather products. These include routine and special agricul-tural assessments, weekly weather and crop bulletins, andenhanced regional weather data. There are also long-termstrategic agricultural weather products, including USDA cropand livestock supply and demand estimates, and crop plant-ing recommendations.
An outgrowth of this collaboration is the cooperationbetween these two federal agencies and the National DroughtMitigation Center. Together, they have developed the USDrought Monitor (USDM). This comprises a weekly Web-based product that depicts the spatial extent and severity ofdrought across the US. The USDM is based on multiple indicesand indicators, and presents a comprehensive snapshot ofdrought conditions. This product has not only improved aware-ness of the severity of drought conditions, but is also beingused widely for policy decisions by USDA on eligibility fordrought-related disaster assistance.
One of the key elements in effectively applying weather,climate, and water information to agriculture is an efficientrelationship between users and providers. The USDMactively solicits the input of experts across the country inthe preparation of its weekly map. This action helps to‘ground truth’ the accuracy of the characterization of droughtconditions.
VegDRI map for 25 July 2002 US drought monitor, 26 September 2006
2.Econ & social issues & perspectives:Master spread 16/2/07 10:02 Page 55

[ ]56
THE LOSS OF biodiversity and a significant deteriorationof soil productivity have resulted from a number ofcauses such as agricultural practices, ecosystem
fragility, human pressure and climate aggressivity. In tropi-cal areas, sugar cane cultivation during the last threecenturies, and especially in the late 18th century, was theprimary cause of forest cover removal as unsustainableproduction systems were installed. Much of this land hadonly shallow and fragile soils, which were highly prone toerosion due to the steepness of the slopes. Consequently itthe loss of significant amounts of topsoil was observed inmany areas, especially in the volcanic soils of Meso America.Although the worst affected areas are no longer in cultiva-tion, the natural vegetation that has recolonised these areasis much poorer in species composition and accumulatedbiomass than the original vegetation
In arid and semiarid parts of the continent, low rainfall andfrequent periods of drought stress generally produce poorstands of sparse vegetation, which provide ineffective protec-tion to the soil from the erosive effects of rainfall. The samelow rainfall reduces the rates of weathering that lead to soilformation, thus tilting the balance towards a shallower soil.
Argentina has significant soil erosion in La Rioja, San Luisand La Pampa provinces. Overgrazing has been severe,causing erosion and river sedimentation. In the west, salin-ization due to unsound irrigation practices has become aserious problem.
The semiarid North East of Brazil supported cotton plan-tations for centuries, moving to sugar cane in the last decades.The small size of exploitations, poverty and high climaticvariability make this extensive area highly vulnerable.Periodic droughts and land degradation provoked massivemigrations to the south and the Amazonian states.1
The Andean region from Venezuela to the Patagonia is verysensitive to climatic extremes due to the presence of popu-lated human settlements in the highlands, and to its complextopography and hydrology. Land slides and avalanches are apermanent threat. In some areas of the Chilean Andes, havinga Mediterranean climate with a long dry spring and summer,the first precipitations in winter fall over a dry, bare soil,provoking erosion and massive sedimentation transported bythe rivers to the lower land of the Central Valley. Thisphenomenon was exacerbated in the last century as a conse-quence of the change of natural shrub cover by degradedannual herbs. In some areas close to the cities, the Andean
piedmont has been urbanized, provoking a rapid runoff andflooding during intensive precipitations.
Populated highlands of Bolivia, as high as 3,800 metres atthe border of Titicaca Lake, support intensive agriculture(potatoes, quinoa). In addition, these highlands supportgrazing pressure from Llamas and Alpacas. Soils are moder-ately to intensely degraded by water and Aeolian erosion. Theintensive extraction of water from the small watershed ispushing rich and biodiverse wetlands to desiccation.
The Valdivian Forest in Chile is one of the last two exten-sive temperate rainforests on Earth. After a century of logging,under 2,600 km2 of Alerc forest remains (in the rugged, rainycoastal mountains south of Puerto Montt). Today, 18 per centof the original Alerc forest survives; this is the second oldestforest in the world (trees aged more than 2,500 years).
The tropical rain forest continues to be cleared to open landfor pastures. Fire continues to be used for this purpose. In2000, more than 12,260 km2 of rainforest were cut down inthe Amazon. On the southwestern coast of Brazil, the MataAtlantica vegetation has been reduced to small patches.
In Central America about 36 per cent of tropical forestlosses seem to be attributable to grazing. Tropical SouthAmerica’s share of total tropical deforestation is 610,730 km2
per decade, while Central America and Mexico’s share is111,200 km2 per decade. These figures indicate a total rate oftropical deforestation via grazing of 480,000 km2 per decadeplus whatever occurs elsewhere in the world. The originalforests of Latin America covered 6.93 million km2. The esti-mate for 2000 is 3.66 million km2.
The human drivers of land degradation interact in thiscontinent with climatic trends everywhere. On the SouthPacific coast of Chile, rainfall showed a clear negative trendthroughout the 20th century. At the same time this trend waspositive in the Atlantic coast of Argentina and southern Brazil,as in many other parts of the world.2 There is evidence ofincreased climatic variability in northeastern Brazil and nega-tive trends in water regimes of the Amazonian basin. Meantemperature has increased about 0.6 degrees in the lastcentury, provoking a rapid reduction in the Andeanpermafrost and glaciers, the lower edges of which have movedup by 300 metres or more in a century. Some glaciers fromSouthern Argentina and Chile have retreated hundreds ofmetres and reduced their thickness at a rate of 100 centime-tres per year. All these trends are affecting global hydrologyand water availability for irrigation.
Global warming, climatic trends and climaticthreats in Latin America and the Caribbean
Fernando Santibañez and Paula Santibañez, Centre on Agriculture and Environment (AGRIMED) University of Chile
2.Econ & social issues & perspectives:Master spread 16/2/07 10:02 Page 56

[ ]57
unfavourable conditions for investments in agriculture. Underhighly hazardous climatic conditions, farmers prefer to workwith low inputs for agriculture, in order to reduce economicrisk. This leads to low yields and low income, and conse-quently, social deterioration. Very often, it is the primarycause of migrations. This phenomenon has been very markedin northeastern Brazil, northern Argentina, Chile andMexico.3
Crop yield decreases, especially in tropical climates, arecaused primarily by the increase in temperature, which short-ens the duration of crop growth cycle. Biological phenomenaoccur faster at high temperature, reducing the time of dry matteraccumulation and, consequently, the production of fruits, grainsand plant aerial organs. In arid climates of the continent (north-eastern Brazil, northern Mexico, Peru and Chile, and southernArgentina), this negative impact is reinforced by a decreasingannual rainfall. In humid tropical climates (Amazon basin,
In extensive areas of the continent, the productivity of agri-cultural lands shows a decreasing trend affecting thelivelihood of population, and ecosystems as well as naturalplant cover and biodiversity. This is the final result of anumber of causes, such as unsound agricultural practices,ecosystem fragility, human pressure and climate change,which is becoming more hazardous. Land degradation is thefirst phase of a long chain affecting the integrity of the ecosys-tems, ecosystem services and the capacity of the territory tohold human activities. One example of this is the El Niño-LaNiña phenomenon. During the warm period of Pacific waters,intensive precipitations occur in the Southern Cone (Peru,Chile, Argentina, Pacific and Atlantic coasts), while droughtsaffect Colombia, Venezuela, Mexico, northeastern Brazil andthe Amazon basin. During cold spells, antagonic effects tendto occur. This phenomenon, apart from being a threat tohuman settlements, produces floods and landslides, creating
Main changes forced by global warming in Latin America and the Caribbean
Ice bodies Elevation of lower border of Andean glaciers, decrease in the Anctartic Ice extent, retreat of the Patagonic glaciers, reduction
of permafrost, reduction of solid precipitation and snow reserves in the Andes and high elevations.
Freshwater availability Increased runoff in winter reducing availability of water in spring and summer. Loss of capacity of hydrological regulation of
the main river basins in the Andes Mountain based on snow reserves.
Decreasing precipitation is reducing potential for rainfed agriculture in arid environments. As consequence of this,
groundwater is being overused, increasing depth of water tables.
Water quality Intensive storms are more frequent, causing more soil erosion and sediment transportation to rivers.
Higher temperatures tend to reduce dissolved oxygen impairing aquatic organisms.
Stalinization of river deltas due to the increase in sea level.
Climatic variability Extreme climatic events are increasing in frequency, making life hazardous. This is affecting wildlife and agriculture.
Some ecosystems from the Atacama Desert border are in ecological regression due to the increased climatic variability which
magnifies human pressures. Drought, floods and landslides are affecting agriculture and human settlements. In some cases
causing loss of human lives.
Rangelands Important areas of the continent support extensive cattle production, in some cases this activity represents an important
export product (Uruguay and Argentina). These agricultural ecosystems are threatened by water and wind erosion due to
increased climatic aggresivity.
Forests The continent holds one of the bigger world forest reserves. Tropical forest is threatened by a combination of human action
and climate. Tropical forest soils in the Amazon basin are very sensitive.
Biodiversity Global warming and changes in water regime are threatening important biodiversity of tropical rain forest (Amazon basin and
Central America), Semiarid tropical steppes (Caatinga from the NE Brazil), Cold Steppes of the Andean highlands (mainly
Peru, Bolivia, Argentina and Chile), Subdesertic and semiarid temperate Steppes in Mexico, Peru, Chile and Argentina,
Humid temperate forest (evergreen and deciduous) in Chile and Argentina and Cold Patagonian Steppes. Primary factors of
degradation of these biomes is soil desiccation and droughts, displacement of isotherms faster than species adaptation and
frequent intense storms which degrades or saturate soils. Temperature increase also creates favorable conditions for new
species of insects or diseases.
Soil carbon and organic mater Higher temperatures favour organic matter degradation when soils are cultivated. This accelerates the loss of carbon from
cultivated soils. This is the normal situation in tropical soils, which is shifting to temperate zones.
Crop seasonality Higher temperatures will be compensated with changes in crop seasonality. Sowing dates will move towards the coldest
season to maintain yields. In Mediterranean climates this could help in a better use of winter rains, reducing water
requirements. This paradox has already been seen during simulation models in South America.
Source: modified from Santibañez (1991), IPCC (2001) and van Dam et al. (2002), Campos, 1996
2.Econ & social issues & perspectives:Master spread 16/2/07 10:02 Page 57
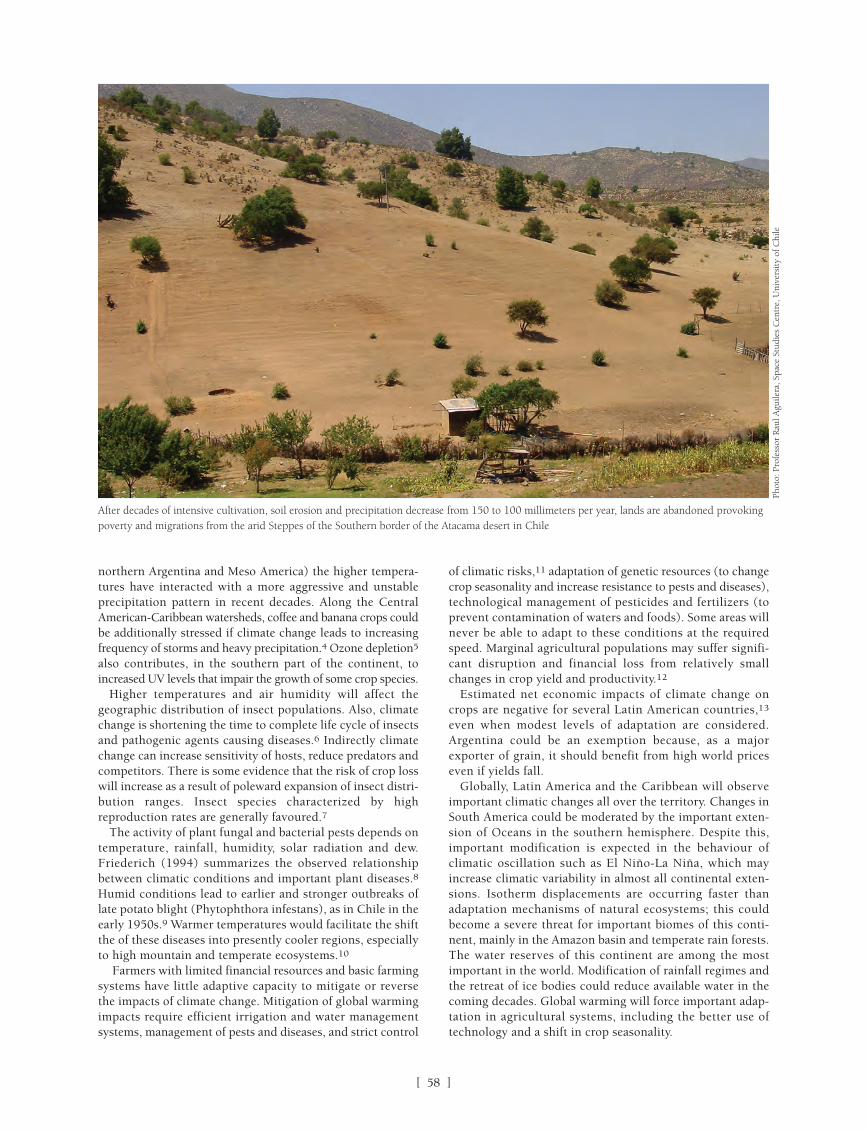
[ ]58
northern Argentina and Meso America) the higher tempera-tures have interacted with a more aggressive and unstableprecipitation pattern in recent decades. Along the CentralAmerican-Caribbean watersheds, coffee and banana crops couldbe additionally stressed if climate change leads to increasingfrequency of storms and heavy precipitation.4 Ozone depletion5
also contributes, in the southern part of the continent, toincreased UV levels that impair the growth of some crop species.
Higher temperatures and air humidity will affect thegeographic distribution of insect populations. Also, climatechange is shortening the time to complete life cycle of insectsand pathogenic agents causing diseases.6 Indirectly climatechange can increase sensitivity of hosts, reduce predators andcompetitors. There is some evidence that the risk of crop losswill increase as a result of poleward expansion of insect distri-bution ranges. Insect species characterized by highreproduction rates are generally favoured.7
The activity of plant fungal and bacterial pests depends ontemperature, rainfall, humidity, solar radiation and dew.Friederich (1994) summarizes the observed relationshipbetween climatic conditions and important plant diseases.8
Humid conditions lead to earlier and stronger outbreaks oflate potato blight (Phytophthora infestans), as in Chile in theearly 1950s.9 Warmer temperatures would facilitate the shiftthe of these diseases into presently cooler regions, especiallyto high mountain and temperate ecosystems.10
Farmers with limited financial resources and basic farmingsystems have little adaptive capacity to mitigate or reversethe impacts of climate change. Mitigation of global warmingimpacts require efficient irrigation and water managementsystems, management of pests and diseases, and strict control
of climatic risks,11 adaptation of genetic resources (to changecrop seasonality and increase resistance to pests and diseases),technological management of pesticides and fertilizers (toprevent contamination of waters and foods). Some areas willnever be able to adapt to these conditions at the requiredspeed. Marginal agricultural populations may suffer signifi-cant disruption and financial loss from relatively smallchanges in crop yield and productivity.12
Estimated net economic impacts of climate change oncrops are negative for several Latin American countries,13
even when modest levels of adaptation are considered.Argentina could be an exemption because, as a majorexporter of grain, it should benefit from high world priceseven if yields fall.
Globally, Latin America and the Caribbean will observeimportant climatic changes all over the territory. Changes inSouth America could be moderated by the important exten-sion of Oceans in the southern hemisphere. Despite this,important modification is expected in the behaviour ofclimatic oscillation such as El Niño-La Niña, which mayincrease climatic variability in almost all continental exten-sions. Isotherm displacements are occurring faster thanadaptation mechanisms of natural ecosystems; this couldbecome a severe threat for important biomes of this conti-nent, mainly in the Amazon basin and temperate rain forests.The water reserves of this continent are among the mostimportant in the world. Modification of rainfall regimes andthe retreat of ice bodies could reduce available water in thecoming decades. Global warming will force important adap-tation in agricultural systems, including the better use oftechnology and a shift in crop seasonality.
After decades of intensive cultivation, soil erosion and precipitation decrease from 150 to 100 millimeters per year, lands are abandoned provokingpoverty and migrations from the arid Steppes of the Southern border of the Atacama desert in Chile
Phot
o: P
rofe
ssor
Rau
l Agu
ilera
, Spa
ce S
tudi
es C
entr
e, U
nive
rsit
y of
Chi
le
2.Econ & social issues & perspectives:Master spread 16/2/07 10:03 Page 58
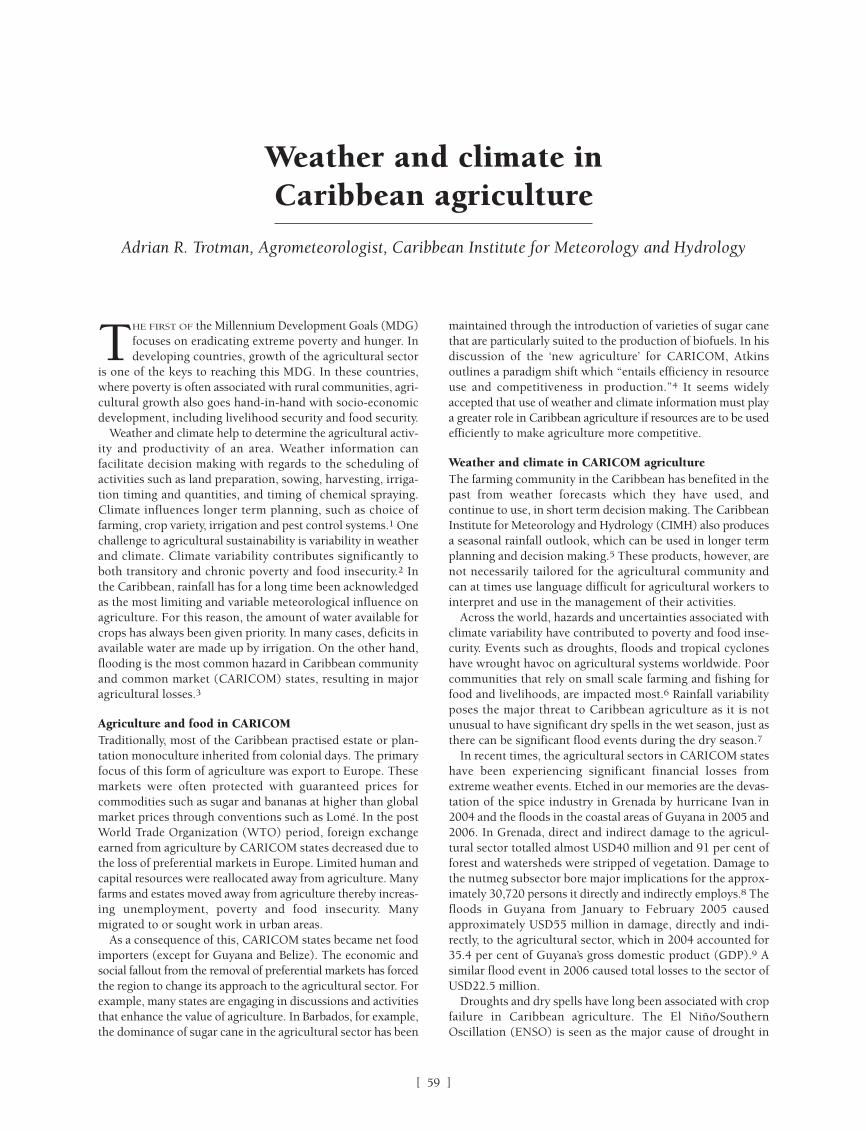
[ ]59
THE FIRST OF the Millennium Development Goals (MDG)focuses on eradicating extreme poverty and hunger. Indeveloping countries, growth of the agricultural sector
is one of the keys to reaching this MDG. In these countries,where poverty is often associated with rural communities, agri-cultural growth also goes hand-in-hand with socio-economicdevelopment, including livelihood security and food security.
Weather and climate help to determine the agricultural activ-ity and productivity of an area. Weather information canfacilitate decision making with regards to the scheduling ofactivities such as land preparation, sowing, harvesting, irriga-tion timing and quantities, and timing of chemical spraying.Climate influences longer term planning, such as choice offarming, crop variety, irrigation and pest control systems.1 Onechallenge to agricultural sustainability is variability in weatherand climate. Climate variability contributes significantly toboth transitory and chronic poverty and food insecurity.2 Inthe Caribbean, rainfall has for a long time been acknowledgedas the most limiting and variable meteorological influence onagriculture. For this reason, the amount of water available forcrops has always been given priority. In many cases, deficits inavailable water are made up by irrigation. On the other hand,flooding is the most common hazard in Caribbean communityand common market (CARICOM) states, resulting in majoragricultural losses.3
Agriculture and food in CARICOMTraditionally, most of the Caribbean practised estate or plan-tation monoculture inherited from colonial days. The primaryfocus of this form of agriculture was export to Europe. Thesemarkets were often protected with guaranteed prices forcommodities such as sugar and bananas at higher than globalmarket prices through conventions such as Lomé. In the postWorld Trade Organization (WTO) period, foreign exchangeearned from agriculture by CARICOM states decreased due tothe loss of preferential markets in Europe. Limited human andcapital resources were reallocated away from agriculture. Manyfarms and estates moved away from agriculture thereby increas-ing unemployment, poverty and food insecurity. Manymigrated to or sought work in urban areas.
As a consequence of this, CARICOM states became net foodimporters (except for Guyana and Belize). The economic andsocial fallout from the removal of preferential markets has forcedthe region to change its approach to the agricultural sector. Forexample, many states are engaging in discussions and activitiesthat enhance the value of agriculture. In Barbados, for example,the dominance of sugar cane in the agricultural sector has been
maintained through the introduction of varieties of sugar canethat are particularly suited to the production of biofuels. In hisdiscussion of the ‘new agriculture’ for CARICOM, Atkinsoutlines a paradigm shift which “entails efficiency in resourceuse and competitiveness in production.”4 It seems widelyaccepted that use of weather and climate information must playa greater role in Caribbean agriculture if resources are to be usedefficiently to make agriculture more competitive.
Weather and climate in CARICOM agricultureThe farming community in the Caribbean has benefited in thepast from weather forecasts which they have used, andcontinue to use, in short term decision making. The CaribbeanInstitute for Meteorology and Hydrology (CIMH) also producesa seasonal rainfall outlook, which can be used in longer termplanning and decision making.5 These products, however, arenot necessarily tailored for the agricultural community andcan at times use language difficult for agricultural workers tointerpret and use in the management of their activities.
Across the world, hazards and uncertainties associated withclimate variability have contributed to poverty and food inse-curity. Events such as droughts, floods and tropical cycloneshave wrought havoc on agricultural systems worldwide. Poorcommunities that rely on small scale farming and fishing forfood and livelihoods, are impacted most.6 Rainfall variabilityposes the major threat to Caribbean agriculture as it is notunusual to have significant dry spells in the wet season, just asthere can be significant flood events during the dry season.7
In recent times, the agricultural sectors in CARICOM stateshave been experiencing significant financial losses fromextreme weather events. Etched in our memories are the devas-tation of the spice industry in Grenada by hurricane Ivan in2004 and the floods in the coastal areas of Guyana in 2005 and2006. In Grenada, direct and indirect damage to the agricul-tural sector totalled almost USD40 million and 91 per cent offorest and watersheds were stripped of vegetation. Damage tothe nutmeg subsector bore major implications for the approx-imately 30,720 persons it directly and indirectly employs.8 Thefloods in Guyana from January to February 2005 causedapproximately USD55 million in damage, directly and indi-rectly, to the agricultural sector, which in 2004 accounted for35.4 per cent of Guyana’s gross domestic product (GDP).9 Asimilar flood event in 2006 caused total losses to the sector ofUSD22.5 million.
Droughts and dry spells have long been associated with cropfailure in Caribbean agriculture. The El Niño/SouthernOscillation (ENSO) is seen as the major cause of drought in
Weather and climate in Caribbean agriculture
Adrian R. Trotman, Agrometeorologist, Caribbean Institute for Meteorology and Hydrology
2.Econ & social issues & perspectives:Master spread 16/2/07 10:03 Page 59

[ ]60
production, processing, distribution and consumption of foodleading to outcomes which have consequences for food andenvironmental security and the society at large.14
GECAFS has a regional project in the Caribbean to imple-ment its conceptual framework. CIMH is a key organizationinvolved in the development and implementation of this frame-work. The overarching questions for GECAFS Caribbeanresearch are:
• How will global environmental change (GEC), especiallyland degradation, variability in rainfall distribution, seasurface temperature, tropical storms, hurricanes and sea-level rise, affect vulnerability of food systems in theCaribbean?
• What combinations of policy and technical diversificationin food harvested and traded for local consumption, inexport commodities and in tourism would best provideeffective adaptation strategies in light of GEC?
• What would be the consequences of these adaptationstrategies for national and regional food security, locallivelihoods and the natural resource base?
A suite of scenarios has been developed for food systems inthe Caribbean.15 These scenarios are regionally downscaledversions of the Millennium Ecosystem Assessment (MA)scenarios.16 A team from the region recently completed ascience plan and implementation strategy for GECAFSCaribbean. The plan is being reviewed by key stakeholders inthe region.
Disaster risk managementThrough the Caribbean Disaster Emergency Response Agency(CDERA) the Caribbean region has been in the process of
the Caribbean.10 However, dry periods are not always yieldreducers for crops such as sugar cane, but in such cases canincrease the sucrose yield in the months just before harvest-ing, whereas when occurring in July to September sugar canegrowth is significantly retarded. Unfortunately, agriculturaldrought monitoring in the Caribbean has been limited to basicrainfall and crop indices.
CIMH has been involved in a number of projects and initia-tives to increase agricultural production, enhance food andlivelihood security through research, and influence policy anddecision making strategies.
Climate change adaptation initiatives in the CaribbeanClimate change is one of the major concerns for Caribbeanagriculture. Changes in temperature and other climate para-meters, sea level rise and in particular uncertainties in thepatterns of future rainfall have serious implications for biodi-versity, water and agriculture in the Caribbean.11 Suchimplications mean that urgent attention has to be paid to theresilience of Caribbean agriculture and strategies to adapt tofuture changes in climate.
Mainstreaming Adaptation to Climate Change (MACC)In 1999, the Caribbean Planning for Adaptation to GlobalClimate Change (CPACC) project began sensitising the regionto the implications of climate change. At that time, the focuswas mainly on sea level rise, which has implications for salt-water intrusion and, by extension, water quality andsalinization of soils. This is particularly crucial in Guyanawhere the majority of the population and agricultural activityis located within 10 km of a coastline that is below sea level.Research showed that sea level rise associated with anthro-pogenic climate change can result in increased salinity of thewater supply, in particular the surface water.12 On the comple-tion of the CPACC project the region recognized the need tomainstream climate change information into the productive(agriculture and tourism) and supportive (water and health)sectors. From this, the MACC project was developed.
The MACC project includes the dynamic downscaling of theglobal climate models (GCMs). Work has begun in developinga strategy for coupling these GCMs with models in the agri-cultural and water sectors to support impact and vulnerabilitystudies which will help to guide policy making and planning.CIMH will support these studies by investigating issues suchas the potential impacts of climate change on crop yields,growing seasons, crop water use and requirements and agro-ecological zones in Guyana.
Global environmental change and food systems (GECAFS)GECAFS is an “international, interdisciplinary research projectfocused on understanding the links between food security andglobal environmental change.”13 Its goals are:
• To develop adaptation strategies to cope with the impactsof environmental change on the food system
• To assess the environmental and socio-economic feedbackof such adaptation strategies.
Environmental changes addressed in GECAFS include changesin climate, quality and quantity of water, nitrogen cycling,atmospheric composition, sea level and conditions, land cover,soils and biodiversity. Note that a food system encapsulates
Main features of food system
Source: Global Environmental Change and Food Systems (www.gecafs.org)
Food System ActivitiesProducing food: Natural resources, inputs, technology
Processing & packaging food: Raw materials, standards, consumer demandDistributing & retailing food: Marketing, advertising, trade
Consuming food: preparation, consumption
Food System Outcomes Contributing to:
Social Welfare• Income• Empoyment• Wealth• Social & political capital• Human capital• Infrastructure• Peace• Insurance
Food Secutity Environment security/Natural capital• Ecosystems, stocks, flows• Ecosystem services• Access to natural capital
FoodUtilistaion
• Nutritional value• Social value• Food safety
Food Access• Affordability• Allocation• Preference
FoodAvailability• Production
• Distribution• Exchange
2.Econ & social issues & perspectives:Master spread 16/2/07 10:03 Page 60

[ ]61
developing a five year strategic plan for disaster mitigation andmanagement of the agricultural and food sectors as a part of acomprehensive disaster management (CDM) strategy.17 Foodand livelihood security in the face of natural disasters is thekey to the CDM strategy.
Other efforts in the mitigation of disaster managementinclude the development of flood plain maps for someCaribbean territories through the Japanese funded CaribbeanDisaster Management project.18 CIMH was one of the key insti-tutions involved in the production of these maps. It is expectedthat this activity will be expanded to vulnerable areas in allCaribbean countries.
Five year strategic plan for agrometeorology in the CaribbeanCIMH is developing a strategic plan for agrometeorology inthe Caribbean. In the light of the erosion of preferentialmarkets, the need to diversify agriculture in the Caribbean, thegreater emphasis being placed on food security, and the chang-ing patterns of the Caribbean climate, it is imperative thatmeteorology play a greater role in agriculture than it has in thepast. The main aim is to provide valuable products and infor-mation to the farming, decision-making and policycommunities in an effort to develop sustainable forms of agri-culture in the region. The figure below, which shows thebeginning and end of the rainfed growing season of hot peppersin Barbados, is an example of such products. This illustratesthat planting and harvesting of the pepper crop under rainfedconditions would be better at different times according to thelocation of the farm. Important in the strategy is a proposal torevamp the focus of meteorological services to tailor informa-tion and products for the productive and supportive sectors
like agriculture and water resources. Capacity building in themeteorological services and agricultural institutions is a keycomponent of the strategy. CIMH has a wealth of experience inthe region in capacity building.
The main achievements expected by the end of the five-yearperiod (2007-2012) are:
• Trained personnel in meteorological services and key agri-cultural institutions in agrometeorology
• Dialogue and collaborative links developed betweennational and regional institutions
• Links developed with national and regional projects withagrometeorological implications such as MACC andGECAFS.
• Expansion of the network of persons within the collabo-rative and dialogue forum CarAgMet19
• Improved agrometeorological databases and data collec-tion networks
• Pilot study sites using agrometeorological information thatcan be used as examples of the benefits of such informa-tion. Proof of concept will be illustrated mainly throughcost-benefit analyses and social improvements.
CIMH will be the regional institution implementing the strat-egy and will be engaging key regional stakeholders such as theCaribbean Community Climate Change Centre, the CaribbeanAgricultural Research and Development Institute and the Inter-American Institute for Cooperation in Agriculture, farmercooperatives and ministries of agriculture. Through its strate-gic planning and research and development roles in projectsin the region, CIMH is poised to be one of the key regionalinstitutions in the revival and efficient management of the agri-cultural sector in the Caribbean.
Start and end of the rainfed growing season of Capsicum chinense ‘West Indies Red’ in Barbados (work in progress)
Source: Caribbean Institute for Meteorology and Hydrology (CIMH)
2.Econ & social issues & perspectives:Master spread 16/2/07 10:03 Page 61

[ ]62
RECENT SPECULATION ON the possible past existence ofwater on Mars reinforces the idea that our home planet,with its abundance of surface water, is unique in our
solar system. So much so that Earth is known as the blueplanet. Earth as seen from space reminds us of a fact we some-times take for granted – the Earth is a world of water. Theseimages show that roughly 70 per cent of the globe is coveredby water. One only has to look at the land surfaces to under-stand the regional differences in the distribution of water.Lush green areas reflect regions of adequate water resources
and yellow-brown regions are indicative of perpetual watershortages.
Life on Earth began in water and, other than oxygen, wateris the single compound most necessary for sustaining life. Somesimple organisms can exist without air, but none can survivewithout water. Great civilizations arose around abundant waterand subsequently disappeared from the lack of it. Over millionsof years water has shaped and reshaped our planet throughglaciers, erosion, and sedimentation. In today’s society, water,along with other nutrients, is vital to making soil suitable forproducing the food we eat; it also powers the machines ofmodern technology and provides a medium for the transportof people and goods.
What is it about water that makes it uniquely indispensable?Water has a variety of unusual properties that help to set it apart.As a chemical it is odourless, colourless and without flavour, aswell as being compound of unusual stability. It can exist simul-taneously in three phases, as a gas, a liquid and a solid. Whenfrozen, it expands rather than contracting; contrary to almost allother substances. It can also absorb and release more heat thenmost other substances. These qualities allow for the establish-ment of an astonishing mechanism that we call the hydrologiccycle – an endless recycling process of the water in the Earth’ssystem where water is used, disposed of, purified and used again.
The water cycle is tightly linked to a global energy cycle thatdistributes the sun’s radiant energy over the Earth’s surface. Theenergy cycle is responsible for providing the heat necessary tochange liquid water into water vapour – evaporation fromoceans, lakes and from plants – and this heat is released duringa reverse process known as condensation-precipitation.Consequently, weather systems in the atmosphere move enor-mous quantities of water and energy around the globe. Theimpact of the water cycle is not limited to weather. Water is avery powerful solvent that is responsible for transporting chem-icals over the land and into lakes and oceans. Thus, the watercycle is linked to the other major cycles necessary for life – forexample the carbon and nitrogen cycles – and their ecosystemfunctions.
A global water balanceThe total amount of water on Earth has remained unchangedfor millions of years. The amount of water in various phaseshowever has changed over the millennia due to glacial forma-tion and melting.
The hydrologic cycle and the sustainability of water resources
Shahid Habib, Chief of the Office of Utilization; Stephen Ambrose, Programme Manager, Disaster Management, Applied Sciences Programme; Fritz Policelli, Technical Manager,
Office of Science Utilization; and Ted Engman, Science Applications International, NASA
The blue planet as seen from space
2.Econ & social issues & perspectives:Master spread 16/2/07 10:03 Page 62

[ ]63
Most of the world’s water – approximately 97.2 per cent –has little potential for human use because it is salt water. Thismeans that just 2.8 per cent of the world’s water is potentiallyuseful for humans, and most of this is locked up in ice sheetsat the poles or as deep groundwater. The fresh water accessi-ble to humans amounts to a paltry 0.26 per cent of the totalavailable water.
Sustainability of water resources: the issuesEven in an ideal world the natural variations in the hydrologiccycle from day-to-day and place-to-place would result in huge
discrepancies in the amount of available water. In addition,human impacts on the hydrologic cycle can be dramatic, andincreases in the global population have put major constraintson available fresh water supplies. For example, the globalrunoff per capita in 1970 was (on average) 12,900 metres3. By1995, this had decreased to 7,600 metres3 due to increases inthe global population. This is still a lot of water, but it repre-sents a global average, and not the amount available where thepopulation pressures are the greatest. Human activities canmodify the local hydrologic cycle and can seriously pollute thewater, rendering scarce water supplies unusable. Changes in
Imag
e: N
ASA
A schematic of the major features of the hydrologic cycle
The world’s water supply
Location Volume, cubic km Per cent
Total water 1,358,000,000 100
Oceans 1,321,000,000 97.2
Atmosphere 12900 .001
Icecaps and glaciers 29,100,000 2.15
Subsurface water
Soil moisture 66,700 .005
Ground water (near surface) 4,168,000 .31
Ground water (deep) 4,168,000 .31
Surface water
Fresh water lakes 125,000 .009
Saline lakes 104,000 .008
Rivers and streams 1250 .0001
Source: NASA
2.Econ & social issues & perspectives:Master spread 16/2/07 10:03 Page 63

[ ]64
land use and land cover, climate change, building dams andchannels, inter-basin transfers, irrigation, and drainage can alldramatically change the local hydrological balance.
Sustainability of water resources: assessmentWater resources assessment is necessary to the developmentof sustainable activities such as domestic and industrial watersupplies, maintenance of human health, hydropower, irriga-tion, flood protection, droughts, navigation, recreation, andpreservation of the environment. The first step in developinga water resources sustainability strategy and management planis to know the quantity and quality of water available. This isnot a trivial task even in data-rich regions of the world, but indata-sparse regions it becomes almost impossible. One has tostart with adequate reliable hydrologic data on the quantityand the quality of the available water resources. One must thenaccount for modifications in the hydrology brought about byhuman uses, agriculture, manufacturing, and pollution control.For many regions of the world, and particularly in the devel-oping world, these data do not exist or are unreliable.Embarking on a data collection campaign with traditionalmethods and instrumentation is extremely expensive andrequires a large supporting infrastructure.
A satellite hydrology solutionThe major space agencies and their partnering meteorologicalservices maintain a vast array of Earth observing satellitescapable of providing basic measurements of hydrological data,weather, climate, land use, water use and diversions, and naturaland anthropogenic hazards. Recognizing the potential of Earthobservations has lead to the establishment of the Group onEarth Observations (GEO) and the Global Earth ObservationSystem of Systems (GEOSS), an international partnershippromoting the free exchange of Earth observational data. TheUS participates in GEO and GEOSS through the United StatesGroup on Earth Observations (US GEO) – a standing subcom-mittee that replaced the Interagency Working Group on EarthObservations (IWGEO) – consisting of representatives from a
collection of 15 US Federal agencies that either supply or useobservational data. Data collected and information created fromEarth observations have the potential for providing criticalinputs to sustainable water resources development and manage-ment. These Earth observations also provide information forinformed decision-making and for monitoring conditions andprogress at multiple special and temporal scales. NASA’s fleetof satellites are able to provide important measurements of thehydrologic cycle that can be used for water resources assess-ment and management in regions of the world where traditionaldata are insufficient or nonexistent.
Satellite contributions to sustainability of water resourcesThere are numerous examples that demonstrate how measure-ments obtained from Earth observing satellites have been usedin data-sparse regions of the Earth. The following are briefexamples of some, but not all of the existing satellite data andproducts that could make significant contributions to waterresources assessment for sustainable development.
Snow cover and snow water equivalent – The Aqua and Terrasatellites provide daily images of global snow cover via theModerate Resolution Imaging Spectroradiometer (MODIS)sensor. In addition, the Advanced Microwave ScanningRadiometer-Earth Observing System (AMSR-E) passivemicrowave measurements are being used to augment snowcover products by providing estimates of snow water equiva-lent for much of the Earth.
Ground water – The Gravity Recovery and ClimateExperiment (GRACE) mission, under the joint partnershipof NASA and the German Aerospace Agency DeutschesZentrum für Luft- und Raumfahrt (DLR), was launched inMarch 2002 with the goal of obtaining accurate global andhigh-resolution measurements of the static and time-varyingcomponents of the Earth’s gravity field. Variations in thegravity field can be used to monitor changes in large groundwater aquifers, and thus provide measurements of abstrac-tions or recharge.
Imag
e: N
ASA
NASA missions for water resources assessment and management
2.Econ & social issues & perspectives:Master spread 16/2/07 10:03 Page 64

Water quality – The visible and near infrared regions of thespectrum can be used to empirically detect water quality indi-cators such as suspended sediments, algae, eutrophicationindices, and thermal pollution. In addition, remote sensingproducts such as Landsat images provide for excellent track-ing of these water quality indicators, spatially and temporally,in large lakes, reservoirs and estuaries.
Data assimilation – Data assimilation projects are character-ized as real-time, hourly, distributed, uncoupled, land-surfacesimulation systems that are scaled to different domains andresolutions. Data assimilation merges satellite data, in situ landsurface measurements, and model estimates (all at differing timeand space scales) into one uniform product. The Global LandData Assimilation System (GLDAS) project is designed toproduce optimal output fields of land surface states and fluxesfor water cycle research, initialization of weather and climatemodels, and water resources applications. To fully address landsurface and application research problems, GLDAS has beenimplemented globally to a high resolution of 1 km with finerUniversal Transverse Mercator (UTM) level scales and 1-hourand shorter time scales through the development of a proto-type software library called the Land Information System (LIS).The current LIS tools consist of a high performance land surfacemodelling and data assimilation system to quantify terrestrialwater and energy fluxes (precipitation, runoff) and storages(soil moisture, snow), critical for applications in water resourcesassessment and management. Remotely sensed hydrologic stateor storage observations (temperature, snow, and soil moisture)are integrated into the LSMs to improve prediction and produceresearch-quality datasets.
Steps needed to realize the potential of satellite hydrologyUnfortunately, there is a substantial gap between the potentialof satellite products and their application to real-world problemsolving and the development of water resources sustainabilitystrategies. There is an opportunity for developing countries to‘leap-frog’ into the 21st century and adapt these technologiesimmediately. To do this we suggest the following steps:
1. Select a real water resources sustainability problem.Examples might be:
• A ground water management problem to prevent over-pumping or salt water intrusion
• A flood warning and damage mitigation scheme• A fresh water supply for human consumption• A new town with supporting agriculture, industry and
fresh water supply for human use.2. Identify the decision support tools (DSTs) available to
conduct an assessment for the implementation of asustainable water resources management plan
3. Identify those data required by 2 that may be met withremote sensing data or data products
4. Arrange to obtain these data from the various space agen-cies
5. Arrange for training and capacity building in the use ofthe DSTs and interpretation of the data
6. Implement the assessment and the DSTs7. Define the initial baseline and document the improve-
ments made and the improvements possible with theremote sensing data
8. Set up the infrastructure for implementing the proceduresand maintaining the sustainability of the particular waterresources issue
9. Integrate the technical DST products within a frameworkthat includes social sciences, legal frameworks, and envi-ronmental considerations.
Most of these steps cost little or nothing. Many remote sensingdata and DSTs are free, and much of the organizational workcould be done through existing governmental ministries withlittle or no added expense. Training and capacity building mayresult in the largest expense. Item 9 is an essential step if allstakeholders are going to accept the proposed plans for imple-mentation. This item is also one that is often ignored or notimplemented for lack of experience in methods for involvingstakeholder participation. Fortunately, there are now organi-zations and programmes that focus on public participation indecision-making. The United Nations Educational, Scientificand Cultural Organization (UNESCO) crosscutting programmeHydrology for the Environment, Life and Policy (HELP) is anexample of this. HELP provides a framework that encouragesscientists, stakeholders, managers, and law and policy expertsto come together to address locally defined water-related issues.Water communication and public participation are central tocreating effective water policy issues. HELP provides a plat-form for sharing experiences across an international networkof catchments.
In summary, sustainability of water resources is essentialfor almost all aspects of a successful and healthy society.Developing sustainable water resources requires technicalknowledge of the type and extent of available water, and thenecessary tools to make plans and management decisions forthe benefit of society and the economy. Unfortunately, inmany parts of the world the basic data for planning andmanagement are sparse or nonexistent, However, recentadvances in Earth remote sensing provide an alternativesource of data and information for the planning and manage-ment of water resources.
[ ]65
Imag
e: N
ASA
Heavy rains flooded the Pasni area of Pakistan in 2005
2.Econ & social issues & perspectives:Master spread 16/2/07 10:03 Page 65

[ ]66
AUSTRALIA IS A large island continent in the southern hemi-sphere with a diverse range of climate zones. These varyfrom tropical regions in the north, through the arid
expanses of the interior, to temperate regions in the south.Australia’s rainfall is the lowest of the five continents (exclud-
ing Antarctica). Around 80 per cent of the land mass receives lessthan 600 mm of rainfall per year, and 50 per cent receives lessthan 300 mm. Low rainfall combined with very high evapora-tion (particularly inland) leads to low surface-water flows andseasonal river systems, contributing to problems of salinity andalgal blooms.
The most notable feature of Australia’s climate is its high year-to-year rainfall variability. This is influenced by the SouthernOscillation, which is driven largely from the tropical Pacific Oceanand overlying atmosphere. El Niño is part of this system andmakes a significant contribution to this variability. The El Niño-Southern Oscillation is linked to persistent seasonal anomalies
in many parts of the globe, but Australia is one of the mostaffected continents, experiencing major droughts interspersedwith extensive wet periods.
Federal, state and local governments have various responsi-bilities for managing these risks, protecting citizens andensuring the well-being of constituents. Risk managementrequires an understanding of the risks, and the impacts asso-ciated with them.
The Bureau of Meteorology (the Bureau) is the national mete-orological authority for Australia. Its role is to observe andunderstand the Australian weather and climate, and providemeteorological, hydrological and oceanographic services bothnationally and internationally. A key responsibility is to providewarnings on a range of phenomena that can lead to natural disas-ters/hazards. The Bureau is also responsible for managing thenational climate database, monitoring and predicting theAustralian climate, and providing information on the likelihood
Operational weather and climate forecasting, and its impact on
water management in Australia
Geoff Love, Director of Meteorology, Bureau of Meteorology, Australia
0
2
4
6
8
10
12
14
16
18
20
Australia S. Africa Germany France NZ India UK Canada China USA Russia
Coe
ffici
ent (
%)
Country
Variability of rainfall for major agricultural producers (the ratio, expressed as a percentage, of the standard deviation of the long term national rainfall divided by the mean)
Source: Bureau of Meteorology
2.Econ & social issues & perspectives:Master spread 16/2/07 10:03 Page 66

[ ]67
The south-east region of Australia is particularly vulnerable tobushfires – along with southern California and southern Franceit is identified as one of the three most fire-prone areas in theworld. Over the past three decades, Australia has been affectedby between 20 and 25 major bushfires, and every year manysmall-scale bushfires occur across Australia. The risk to propertyand human life continues to grow as forest areas on urban fringesbecome more densely populated.2
One of the primary objectives of the Bureau’s fire weatherservice is to provide fire-management authorities, civil defenceorganizations, police, and other emergency services with:
• Detailed routine forecasts during the fire season• Special forecasts for hazard reduction burns• Advice regarding the installation and operation of special
meteorological stations operated by fire authorities• Climatological advice and information to assist with assess-
ment of risk, development of fire prevention strategy, andother aspects of fire management.
The Bureau is also a key player in the Bushfire CooperativeResearch Centre (CRC), which is focusing on the provision ofresearch to enhance the management of bushfire risk in aneconomically and ecologically sustainable way. The Bushfire CRCis a partnership between state fire and land management agencies,eight universities, and federal government agencies, EmergencyManagement Australia and the Commonwealth Scientific andIndustrial Research Organisation.
Climate changeAustralia is experiencing climate change. Since the mid-twenti-eth century, temperatures have, on average, risen by around 0.7degrees Celsius, with increased frequency of heatwaves and adecreasing number of frosts and cold days.
Rainfall patterns have also changed – the north-west regionhas seen an increase in rainfall over the last 50 years, while muchof eastern Australia and the far south-west of the country haveexperienced a decline.
The significant vulnerability of Australia to the drying trendalready observed in the southern and eastern part of the continentsince 1950 has adversely affected water resources, agriculturalproductivity and unique ecosystems across substantial areas. Thecause of this climate change is not fully understood, and the like-lihood of its continuance yet to be firmly established. Given the
of rainfall deficiencies. Most of the meteorological services itprovides, are government funded.
Water managementGiven Australia’s low and variable rainfall, there is environmen-tal concern about the sustainable management of surface water,its use, quality and even its existence in some places.
Over the last two decades, water management and the needfor water reform have gained the increasing attention of govern-ments and policy makers. The Australian Government hasidentified water management as “the key national conservationchallenge of our age.”1 Water restrictions have become part ofthe normal way of life in Australian cities, as have droughts inrural areas.
The Bureau of Meteorology is one of many agencies involvedin supporting the National Water Initiative but it has an impor-tant role beyond this. Policy makers need to understand the actuallong-term patterns of rain and water supply and be informedabout the potential effects of climate change.
The Bureau is among the scientific agencies and researchgroups that have formed a coalition in support of advanced watermanagement, with the goal of taking a coordinated whole-of-government approach to the preparation of high quality, targetedand timely water research and advice to meet the needs of govern-ment and the National Water Initiative through the NationalWater Commission.
Bushfire managementBushfires are a natural and devastating part of the Australiansummer landscape, with communities across the country regu-larly struggling with loss of life, loss of property and the hugefinancial costs of bushfires, from infrastructure damage, reducedagricultural and forest production, livestock losses, and the directcosts of fire-fighting. Bushfires also impact upon biodiversity,clean air and water, and Australia’s cultural heritage.
The value of fire weather services
Fire weather services ranging from warnings to special forecasts forhazard reduction burns are important inputs into the decision makingprocesses of fire-management authorities. They enable effective decisionmaking at various stages of fire management. Two examples illustratethe value of these services:• Over the Christmas/New Year 2006 period, severe fire weather
conditions developed quickly. As a result of early warnings of theimpending conditions, the Rural Fire Service issued pre-emptive firebans across the state. Although there was one major fire on NewYear’s day, the Fire Service credits the Bureau’s early advice forpreventing many more catastrophic fires.
• The Rural Fire Service was preparing the costly exercise of mobilisingheavy equipment in a high threat area. Despite their natural instinctsthat conditions would persist, the Bureau provided direct advice tothe Fire Service that rain was imminent. The Fire Service acted onthis advice and were able to save significant costs by avoidingredeploying equipment.
The framework for water policy development and implementation inAustralia and the contributions made by the Bureau of Meteorology.
Source: Bureau of Meteorology
Council of Australian GovernmentsPrime Minister, State Premiers, Territory Chief Ministers
Natural resource ministerial councilFederal, State and Territory ministers
(The Bereau of Meteorology is an observer)
National WaterCommission
Agreed water policies
• Water pricing• Water allocations• Water accounting• Urban water
Natural resource managment standing committeeCEOs of Federal and State water agencies including the Bureau
Catchmentmanagement
boards
Public landmanagers
Private landmanagers
Water corporations
Industrialconsumers
Domesticconsumers
Agriculturalconsumers
2.Econ & social issues & perspectives:Master spread 16/2/07 10:03 Page 67

[ ]68
national significance of this long-term drying trend, it is impor-tant that we move to address these knowledge gaps and to takeclimate change into account in long-term planning.
When it comes to understanding and mitigating climatechange, the Bureau has a number of key roles. In the first instance,the Bureau has a particular role in informing policy makers aboutthe scientific basis for climate change. Secondly, information onhistorical climate variability and change is available to helpgovernment and industry better comprehend how climate vari-ations might affect their interests. Thirdly, the Bureau promotesthe formulation of more effective strategies to lessen the adverseimpacts and exploit the opportunities.
Regular briefings of government ministers and their advisers oncurrent climatic conditions and outlooks support governmentplanning and the development of policy priorities and responses.
The production of special statements has continued to evolve tomeet the growing demand for concise factual data relating tosignificant climate anomalies or short-term weather events thatbreak long-standing records. These statements have also formedthe basis for press statements and briefings to external agencies.
The Bureau also collaborates with the Australian GreenhouseOffice and the Commonwealth Scientific and Industry ResearchOrganization to develop and implement scientific agenda onclimate change research and communication strategies forinforming governments and industry.
El Niño/Southern Oscillation and its effectsAustralia’s rainfall climate consists of about three good years andthree bad years out of ten. These fluctuations have many causes,but the most significant is the Southern Oscillation. This is amajor air pressure shift between the Asian and east Pacific regions– its best-known extreme is El Niño. The opposite extreme isknown as La Niña.
The Bureau produces a national Seasonal Climate Outlookevery month, which gives the likelihood of warm or cool, andwet or dry conditions occurring in the subsequent three months.The Bureau’s coupled climate model, the Predictive OceanAtmosphere Model for Australia (POAMA), is used to provideeight-month forecasts of the likely evolution of El Niño/La Niñaprocesses in the Pacific Ocean. The value of this modelling systemhas been demonstrated in recent years, with an excellent long-lead forecast of the decay of the 2002-2003 El Niño event, and asuccessful long-lead prediction of the persistent above-averagesea-surface temperatures that prevailed through the second halfof 2004 and early 2005.
One major impact of variable rainfall and El Niño is drought.The Bureau’s Drought Watch Service has been a key componentof national drought management since 1965. It is based on anationwide daily rainfall measuring network and established rela-tionships between rainfall deficiency and the severity of recordeddrought. This information assists government, business and the
-2
-1
0
1
2
1920 1930 1940 1950 1960 1970 1980 1990 2000
Mea
n T
Ano
mal
y (˚
C)
Year
The Australian annual mean temperature (blue bar) and five-year running mean temperature anomaly from the 1961-1990 long term mean
Source: Bureau of Meteorology
The trend in annual rainfall over the interval 1950 to 2003 (in mm per decade)
Source: Bureau of Meteorology
2.Econ & social issues & perspectives:Master spread 16/2/07 10:03 Page 68

rural community. It also helps to assess the current situation,providing early indication of the need for contingency action ordrought relief.
Using monthly rainfall analysis, areas suffering from rainfalldeficiencies appear in the Drought Statement as well as theMonthly Drought Review. If the accumulated rainfall over threesuccessive months (six months for arid regions) was within thelowest 10 per cent on record, a drought watch begins and theregion is highlighted. Consideration is also given to whether anarea is usually dry at that time of the year. There are two rainfalldeficiency categories:
• Severe rainfall deficiency exists where rainfall for threemonths or more is in the lowest 5 per cent of records
• Serious deficiency lies in the next lowest 5 per cent, ie. thelowest 5-10 per cent of historical records for three monthsor more.
Allowing for seasonal conditions, the drought watch maycontinue for many months and only ceases when plentiful rain-fall returns. ‘Plentiful’ is defined as well above average rainfall forone month, or above-average rainfall over a three-month period.
Rural productivity, especially in Queensland and New SouthWales, is linked to the behaviour of the Southern Oscillation.An understanding of how the climate affects agriculture, and howagricultural producers can better use climate information, is vitalto the sustainability of agricultural enterprises. To assist planningand decision making across the agricultural arena, the Bureau’sSilo Web site provides a rich source of meteorological and agri-cultural data of particular interest to policy makers and farmoperators. The Silo Web site is supported by a number of otherstate and federal agencies with expertise in agriculture andprimary production. Its objectives include:
• Providing a rich source of national meteorological and agri-cultural data that is readily accessible to decision makers,researchers and educationalists, particularly in the agricul-tural area
• Developing a coordinated information service that will facil-itate further adoption of climatic risk managementtechniques by landholders and agribusiness
• Providing a framework to encourage future additions to theagrometeorological data bank
• Establishing the collaborations required to ensure thesystem remains operational beyond the term of theresearch funding.
The Bureau has recently released a ‘Water and the Land’ Website which provides an integrated suite of information forpeople involved in primary production and natural resourcemanagement. The site brings together information from differ-ent Bureau services and presents links in groups organized byweather elements including rainfall, cloud, temperature, wind,pressure, El Niño and La Niña, humidity, evaporation andsunshine. Depending on the range of products available for thegroup, long-term outlooks are listed first, followed by shorter-term forecasts, latest weather, recent weather, averages, andlong-term trends.
One example of the Bureau’s seasonal forecasts being used tofine-tune farming practices is in crop selection.3 In April andMay, when the Southern Oscillation index (SOI) is negative, thereis a high chance of poor wheat yields and negative profits. Butsorghum in the summer following a negative SOI in April andMay often proves profitable. Farmers at Roma in Queenslandfound sorghum more profitable than wheat during the El Niñoyears of the 1990s and that a cutback in wheat area in these yearswas profitable.
Meteorology and related fields such as hydrology andoceanography, have applications at every level of government,in all sectors of the economy and for every citizen. This is notime for complacency. Greater pressure on water resources,increased focus on sustainability and the likely impact ofclimate change will continue to pose challenges for govern-ments at all levels.
[ ]69
0.00
0.20
0.40
0.60
0.80
1.00
1.20
1.40
1.60
1.80
2.00
1940 1950 1960 1970 1980 1990 2000
Tonn
es/H
ecta
res
-25.0
-20.0
-15.0
-10.0
-5.0
0.0
5.0
10.0
15.0
20.0
25.0
SOI (
June
-Sep
tem
ber)
Year
Wheat Yield SOI
Australia’s annual wheat yields and the Southern Oscillation Index (SOI) from 1939 to 2002. Generally speaking an El Niño is considered to be underway when the SOI remains less than -10 for 5 months or more.
Source: Bureau of Meteorology
2.Econ & social issues & perspectives:Master spread 16/2/07 10:03 Page 69

[ ]70
INAUGURATED IN 1987 on the Bafing River in Mali, theManantali dam controls approximately half of the river flowdownstream in the valley of the Senegal River. Shared prop-
erty of the member states of the Organisation pour la Mise enValeur du fleuve Sénégal (OMVS), this structure responds tomultiple goals which contribute to the sustainable develop-ment of the sub-region.
The first challenge of the water management of the Manantalidam is an economical one, targeting a yearly energy productionof 800GWh, guaranteed for nine out of every ten years for threecountries of West Africa: Mali, Senegal and Mauritania. Butthere is also the challenge of dealing with environmentalconsiderations contributing to the maintenance of the ecolog-ical equilibrium of the catchments of the Senegal River, or tosocio-economic goals such as securing and improving theincome of local populations thanks to the traditional agricul-ture allowed into the valley. The traditional flood recessioncultures, which are sown in the ground that was submergedonce the waters have receded, will remain vital to the valley’s
inhabitants for a long time yet. Their yield depends on theextent of the flood. The ecological equilibrium of the Senegalvalley, also linked to the annual flood and very important inthe arid context of the region, must be preserved.
The provision of drinking water for the main towns of thesub-region including the capital cities of riverside countrieslike Dakar (or neighbouring Nouakchott) is strongly relatedto the optimization of dam management. Support for the navi-gability of the river, still in progress, is also a crucial aspect ofthe life all along the river.
The Charte des Eaux du fleuve Sénégal (OMVS- May 2002)defines the clauses used for an interdependent, fair and partic-ipating management of water resources. It is essential and thereference for all actors and users of the cross boundary SenegalRiver’s basin.
The water resource management of the Manantali dam isnotably based on the scheduling of water releases in order toflood the downstream valley and consequently to allow reces-sion cultures (traditional) which need this resource.Additionally, the maintenance of a stable minimal water levelduring the December-June period is also considered. Theamplitude of the water release which defines the potentialcultivable surfaces once the waters have receded is proposed tothe Minister Council of OMVS by the Permanent WaterCommission which brings together, on 20 of August each year,all the stakeholders and decision makers concerned with thecatchment’s water resources.
This crucial decision leads to the scheduling of waterreleases, and to sufficient flooding for permitted recessionculture surfaces which totally depend on them. These waterreleases are mainly issued during September. However, theimpact of the flood on the other objectives is mainly related tothe remaining water stock at the end of the rainy season, whichis highly dependent on the targeted hydrogram during theflooding episode. Obviously, one tries to minimize the impactof this decision on energy production as well as on low waterlevel monitoring. Consequently, the potential amount of rainduring the September-October period (which is the end of therainy season) is a crucial piece of information for the dammanager and the Water Permanent Commission in order toanticipate the partial restoration of water stock into the damand consequently to issue a better decision for concurrent usesof the water during the dry season (from November to May).
Seasonal forecasting in West Africa: a strategic partnership for a the
sustainable development of a cross boundary river catchment
Axel Julie, OMVS & JP Céron, Direction of Climatology, Meteo-France
Artificial flood of the floodplain of the Senegal river in October 1999.Region of Kaédi (Mauritania)
Phot
o: I
RD
and
OM
VS
2.Econ & social issues & perspectives:Master spread 16/2/07 10:03 Page 70
[ ]71
releasing a sufficient discharge at Manantali, taking into accountof the real-time discharge of Bakoye and Faleme Rivers, whichare downstream of the dam. This time, scheduling allows thestarting of recession cultures before mid-November, in relationto the properties and needs of the plants.
The now research aims to improve the potential benefitsgiven by the forecasts for Manantali. With this aim, manydifferent rules for use of the forecast in management will betested leading to an improved set of management rules.Furthermore, similar research will be done for neighbouringcatchments of West Africa, aiming to forecast the natural flooddischarges of rivers like Niger or Volta with Arpége results. Theuse of the probabilistic forecast will be also tested in the nearfuture, notably translating it in terms of possible scenarios andactions for the dam manager. Finally recalibration of the wholeapplication will be scheduled by the end of 2007/beginning of2008, in order to benefit from an improved version of theArpège model, namely a coupled version using improved para-meterisations and improved assimilation for the oceanic state,an increased size for the ensemble (41 members) and for thehindcast experience. These perspectives are clearly supportedby the agreement signed in November 2005 between OMVS,Météo-France and IRD (Protocol of Paris) allowing the wholeprocess to be put into a sustainable form, notably with theprovision of forecasts free of charge by Météo-France until2015.
So, the partnership between OMVS, Météo-France and IRDstands, without any doubt, as a prominent international refer-ence in terms of use of seasonal forecasting information to thebenefit of a cross boundary African river basin, contributingto an interdependent and sustainable development of this semiarid region.
By the end of July, the seasonal forecasting model developedby the Institut de Recherche pour le Développement (IRD) andMétéo-France allows estimations of the natural flow of theSenegal River at Bakel (at the entrance of the valley, down-stream of the dam) over the September-October period. Usingdownscaled information (both in space and time) derived fromthe forecast rainfall of the Arpège Climat model, this providesvery accurate forecasts of the river flow. Interestingly, criticalyears, which correspond mainly to dry years, are quite wellpredicted. Consequently, the information brought by thismodel limits the risk of taking a bad water resource manage-ment decision in such years. A first evaluation usingsimulations on the hindcast experience, showed that the use ofseasonal forecasting information brings around 80 per cent ofthe maximum possible profits corresponding to a perfect fore-cast of the flow river. This information coupled with theoptimization management software of the Manantali (POGR –a joint effort between OMVS and IRD), brings energy produc-tion optimization to near 35-40 per cent, and the artificialflood, allowing a surface of 50,000 hectares for recessionculture, is guaranteed for 20 years over 24, compared to onlyfive years in a natural regime (over the 1970-1994 period).
The concrete procedure starts from Toulouse, where rainfallforecasts are issued at the end of July. These forecasts are specif-ically formatted and sent to Dakar at the beginning of Augustusing mail facilities. The information is then transformed intoa flow forecast and introduced into the POGR software in orderto issue the relevant information to the Water PermanentCommission. According to the available water stock on 20August and related to the decision about a minimal surface ofrecession cultures in the valley, an idealized hydrogram in Bakelis targeted. This hydrogram is then realized until October by
The catchment of the Senegal River, with blue bars delineating the zone where recession crops are evaluated. Calibrating the forecasting model:using forecast and downscaled rainfall from the Arpège model and adapting them to the specific flow forecast to estimate the ‘natural’ flow of theSenegal river at Bakel, September-October
Phot
o: I
RD
and
OM
VS
2.Econ & social issues & perspectives:Master spread 16/2/07 10:03 Page 71
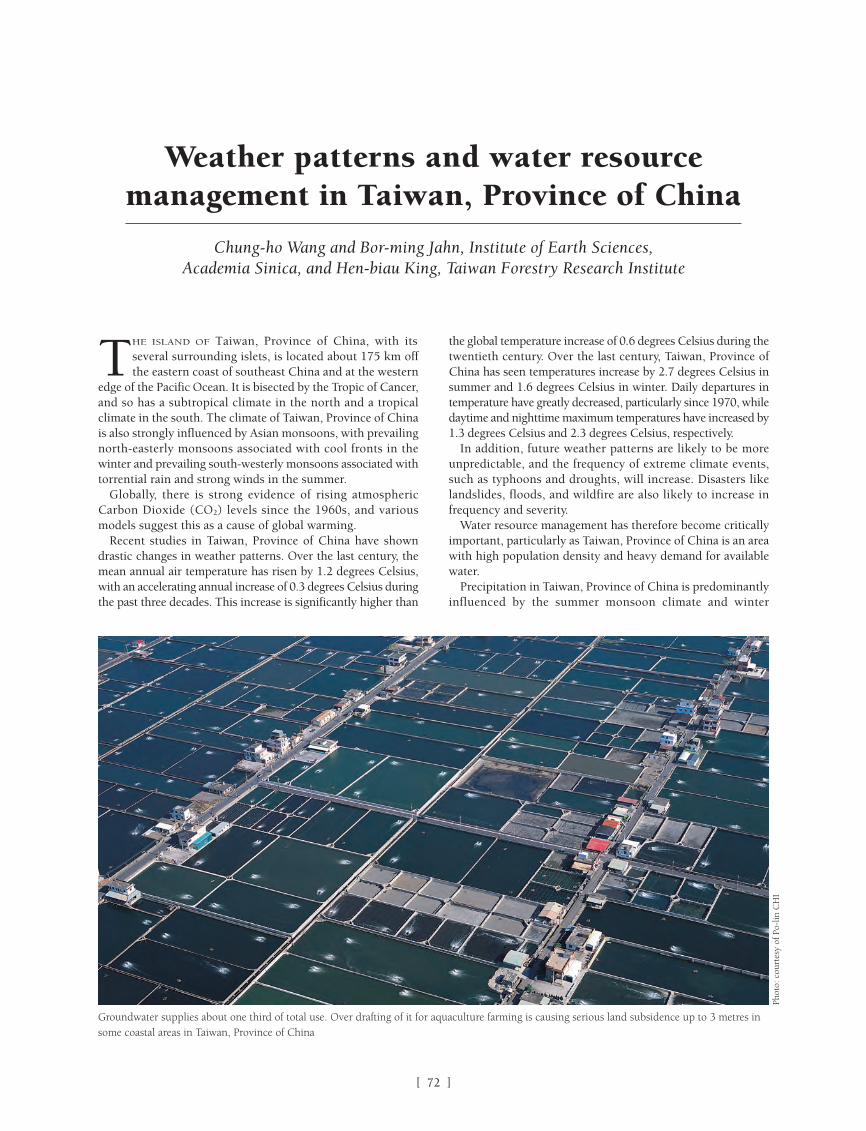
[ ]72
THE ISLAND OF Taiwan, Province of China, with itsseveral surrounding islets, is located about 175 km offthe eastern coast of southeast China and at the western
edge of the Pacific Ocean. It is bisected by the Tropic of Cancer,and so has a subtropical climate in the north and a tropicalclimate in the south. The climate of Taiwan, Province of Chinais also strongly influenced by Asian monsoons, with prevailingnorth-easterly monsoons associated with cool fronts in thewinter and prevailing south-westerly monsoons associated withtorrential rain and strong winds in the summer.
Globally, there is strong evidence of rising atmosphericCarbon Dioxide (CO2) levels since the 1960s, and variousmodels suggest this as a cause of global warming.
Recent studies in Taiwan, Province of China have showndrastic changes in weather patterns. Over the last century, themean annual air temperature has risen by 1.2 degrees Celsius,with an accelerating annual increase of 0.3 degrees Celsius duringthe past three decades. This increase is significantly higher than
the global temperature increase of 0.6 degrees Celsius during thetwentieth century. Over the last century, Taiwan, Province ofChina has seen temperatures increase by 2.7 degrees Celsius insummer and 1.6 degrees Celsius in winter. Daily departures intemperature have greatly decreased, particularly since 1970, whiledaytime and nighttime maximum temperatures have increased by1.3 degrees Celsius and 2.3 degrees Celsius, respectively.
In addition, future weather patterns are likely to be moreunpredictable, and the frequency of extreme climate events,such as typhoons and droughts, will increase. Disasters likelandslides, floods, and wildfire are also likely to increase infrequency and severity.
Water resource management has therefore become criticallyimportant, particularly as Taiwan, Province of China is an areawith high population density and heavy demand for availablewater.
Precipitation in Taiwan, Province of China is predominantlyinfluenced by the summer monsoon climate and winter
Weather patterns and water resourcemanagement in Taiwan, Province of China
Chung-ho Wang and Bor-ming Jahn, Institute of Earth Sciences, Academia Sinica, and Hen-biau King, Taiwan Forestry Research Institute
Groundwater supplies about one third of total use. Over drafting of it for aquaculture farming is causing serious land subsidence up to 3 metres insome coastal areas in Taiwan, Province of China
Phot
o: c
ourt
esy
of P
o-lin
CH
I
2.Econ & social issues & perspectives:Master spread 16/2/07 10:03 Page 72

[ ]73
to stop subsidence with current technology. In the case of south-ern Ping-tung Plain, the saltwater intrusion rate averages 300 to500 metres annually. The affected area of deep aquifer was about115 km2, and 85 km2 of it was at shallow free water depth. Asa result of this intrusion, 3 billion metric tons of groundwatercapacity is regarded as unfit for drinking or irrigation.
These recent changes in temperature, precipitation patterns,rainy days, flood intensity, drought severity and frequency,intensity of storms, extreme weather conditions, and depen-dence on aquifers for freshwater are all compelling indicationsof the climate changes occurring in Taiwan, Province of China.
Taiwan, Province of China’s precipitation averages 250cmper year, but with varying topography and a monsoon climate,its rainfall is highly variable. These phenomena create greatstresses for water resource management. Water bodies are alsohome to countless fish and plants, and the impact on theseecosystems should not be ignored. Water policy plannersshould not merely focus on adapting water resource manage-ment to climate changes, but also on pervasive pollution,depletion of groundwater supply, falling of groundwater tablesand damage to ecosystems.
It is vital that water policy makers implement simultaneousefforts in a number of areas, including:
• Enacting and enforcing laws and regulations regarding thesustainable use of water resources
• Investment in and development of new technologies andprocesses to enable the more efficient use of existing waterresources
• The protection and preservation of ecosystems.
In conclusion, in pursuing a sustainable society, it is inarguablynecessary to create a universal environmental ethics guide tomanage not only water resources, but the environments andecosystems dependent upon it.
Mongolian high pressures. Climate patterns are further compli-cated by Taiwan, Province of China highly varied topography.The island is only 36,000 km2 but has more than 200 moun-tain peaks over 3,000 metres in elevation. The highest peakreaches nearly 4,000 metres above mean sea level.
Rainfall mainly occurs during the typhoon season (from Juneto September), accounting for about 60 per cent of annualprecipitation in the north and 90 per cent in the south ofTaiwan, Province of China. This uneven distribution causeswater availability problems in some areas, creating a challengein terms of water resource management.
Annual mean precipitation averages 250 cm and has variedvery little since the 1940s, but the amount has increased innorthern Taiwan, Province of China and decreased in southernTaiwan, Province of China relative to the long-term average.In the same period, however, the annual number of rainy dayshas decreased significantly across the island as a whole. Thedecrease was more pronounced in the southwest region thanthe northern region, and exacerbated by a high runoff ratio.
The intensity of tropical storms has increased over the lastfifty years, posing flooding risk, especially in lowlands thathave experienced substantial land subsidence, and acceleratinglandslides in foothill residential areas.
Typhoon occurrence in Taiwan, Province of China averaged3.5 events annually over the last 100 years, but the ten mostsevere typhoons during this period have occurred in the last tenyears. Of five droughts occurring during the last 100 years,four were during the last 50 years.
These changes in weather patterns, together with otherfactors, have had a severe impact on water resource manage-ment. Dependence has increasingly shifted from surface waterto groundwater over the last 25 years. This change is, in part,due to changes in seasonal distribution patterns of precipita-tion, surface water pollution, and increased demand in watersupply.
Water quality is an equally important issue when consider-ing water availability and strategies of water resourcemanagement. River pollution is the top factor in reducing waterintake from surface water. Industry, agriculture, and untreatedmunicipal sewage discharge are major sources of river pollu-tion. The proportional length of river considered highlypolluted has increased from less than 20 per cent in the early1980s to about 40 per cent. As of 2002, only one third of riverlength was classified as clean. Official reports showed that themost seriously polluted rivers were found in the southernregion, where dry winters were prevalent and water wasrequired for irrigation and aqua-cultural practices.
Groundwater accounts for nearly one third of total waterconsumption in Taiwan, Province of China. This annualconsumption amounts to 5.7 billion metric tons with annualnatural recharging rate of 4.0 billion tons. Over-pumping ofgroundwater results in many environmental problems.
Twenty per cent of flood plain area, or nearly 2,700 km2, hasexperienced land subsidence to varying degrees. Subsidenceaveraged 1.9 metres and could have been up to 3.3 metres insome areas in 2004. The groundwater tables of the 171 metre-deep monitoring well in ShiKang have dropped at 1.2 metresper year, totaling over 12 metres between 1994 and 2004. Thedamage caused by land subsistence is extensive.
Saltwater intrusion into inland areas presents other environ-mental and socio-economic problems when excessive pumpingof freshwater from aquifers is practiced. It is almost impossible
Phot
o: c
ourt
esy
of D
ong-
kun
LIA
O
Reservoirs supply slightly less than 30% of total water consumption inTaiwan, Province of China. Te-chi Reservoir, highest in elevation at 1,245meter a.s.l. and one of the 49 reservoirs, was designed for electricitygeneration and water supply for central Taiwan, Province of China
2.Econ & social issues & perspectives:Master spread 16/2/07 10:03 Page 73

[ ]74
SINGAPORE IS A small island nation located just north ofthe equator. With a land area of 699 km2 and a popula-tion of 4.4 million, Singapore has been ranked by the UN
as the 170th among a list of 190 countries in terms of freshwater availability. This is not because of a lack of rainfall (2,400millimeters per year), but because of limited land to catch therainfall. As a densely populated city, the pressure of competingland uses such as those for industry, housing, recreation andcommerce abound. Water supply is but one facet of societythat requires the use of scarce land. Thus, there exists a crucialneed for a comprehensive planning strategy to holistically dealwith water cycle management as part of overall urban plan-ning and management.
The development of Singapore’s local supply sources beganin the mid-19th century, with the first reservoir completed in1867. Then known as the Thomson Reservoir, it was laterrenamed the MacRitchie Reservoir. In the early years,Singapore’s water supply came from water catchments inprotected areas, characterized by limited development and pris-tine water. However, with economic growth and populationincrease, the lack of land availability meant that the develop-
ment of water catchments in other non-protected areas had tobe looked into.
The Public Utilities Board (PUB) was set-up as a statutoryboard on 1 May 1963 to take over the responsibility of provid-ing water, electricity and piped gas from the former CityCouncil. PUB embarked on a programme of building estuarinereservoirs in the 1970s, impounding a slew of mangroveswamps and rivers to increase Singapore’s water storage capac-ity. The 1980s saw PUB move into urbanized areas, with thedevelopment of reservoirs that utilize storm water runoff. Thehigher level of impurities in urban storm water runoff meantthat urbanized catchments were previously infeasible, butthrough the advancement of treatment technologies, suchwater could now be harvested.
PUB was reorganized in 2001 to become Singapore’s nationalwater agency, overseeing the management of the entire waterloop, from the supply of potable water, to the collection andtreatment of used water, and the management of the drainagesystem.
In addressing the need to manage water resources compre-hensively, PUB’s water management strategy includes both
Singapore integrated water management
Singapore Public Utilities Board
Marina Barrage: ‘the reservoir in the city’
Phot
o: P
UB
–Si
ngap
ore’s
Nat
iona
l Wat
er A
genc
y
2.Econ & social issues & perspectives:Master spread 16/2/07 10:03 Page 74
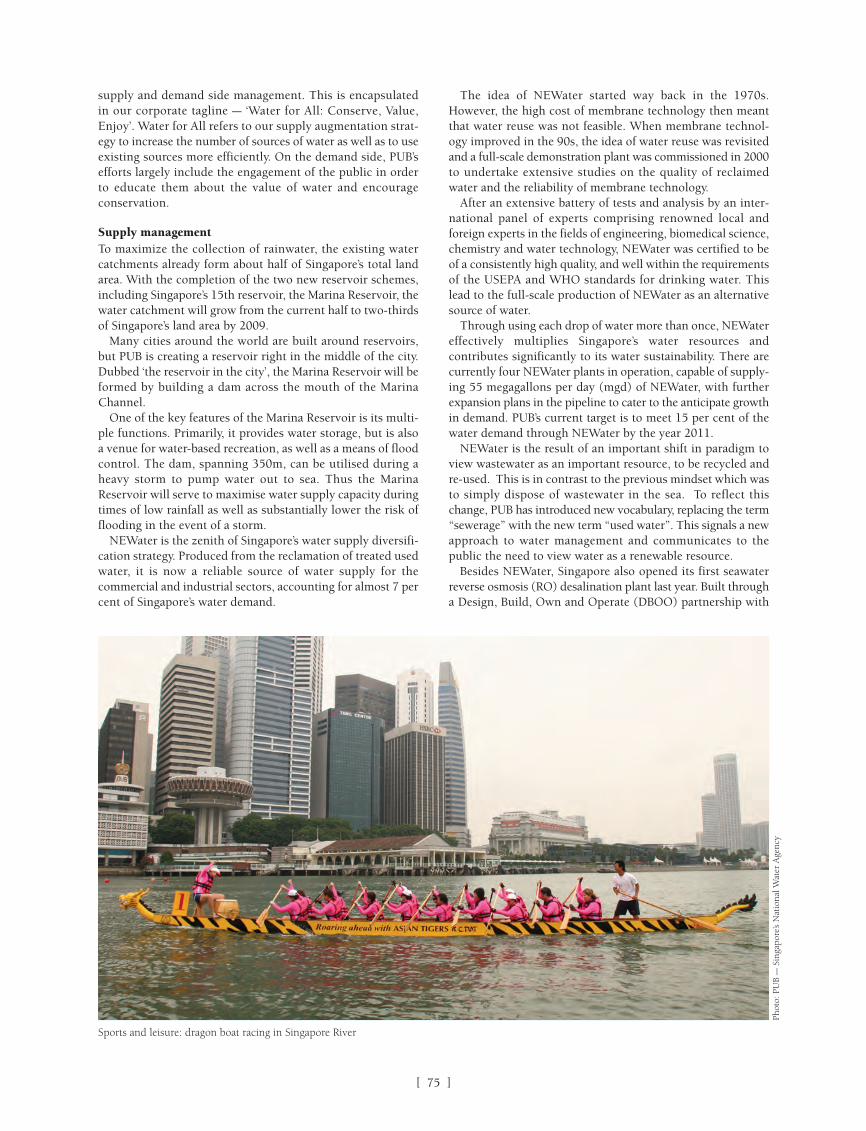
[ ]75
The idea of NEWater started way back in the 1970s.However, the high cost of membrane technology then meantthat water reuse was not feasible. When membrane technol-ogy improved in the 90s, the idea of water reuse was revisitedand a full-scale demonstration plant was commissioned in 2000to undertake extensive studies on the quality of reclaimedwater and the reliability of membrane technology.
After an extensive battery of tests and analysis by an inter-national panel of experts comprising renowned local andforeign experts in the fields of engineering, biomedical science,chemistry and water technology, NEWater was certified to beof a consistently high quality, and well within the requirementsof the USEPA and WHO standards for drinking water. Thislead to the full-scale production of NEWater as an alternativesource of water.
Through using each drop of water more than once, NEWatereffectively multiplies Singapore’s water resources andcontributes significantly to its water sustainability. There arecurrently four NEWater plants in operation, capable of supply-ing 55 megagallons per day (mgd) of NEWater, with furtherexpansion plans in the pipeline to cater to the anticipate growthin demand. PUB’s current target is to meet 15 per cent of thewater demand through NEWater by the year 2011.
NEWater is the result of an important shift in paradigm toview wastewater as an important resource, to be recycled andre-used. This is in contrast to the previous mindset which wasto simply dispose of wastewater in the sea. To reflect thischange, PUB has introduced new vocabulary, replacing the term“sewerage” with the new term “used water”. This signals a newapproach to water management and communicates to thepublic the need to view water as a renewable resource.
Besides NEWater, Singapore also opened its first seawaterreverse osmosis (RO) desalination plant last year. Built througha Design, Build, Own and Operate (DBOO) partnership with
supply and demand side management. This is encapsulatedin our corporate tagline – ‘Water for All: Conserve, Value,Enjoy’. Water for All refers to our supply augmentation strat-egy to increase the number of sources of water as well as to useexisting sources more efficiently. On the demand side, PUB’sefforts largely include the engagement of the public in orderto educate them about the value of water and encourageconservation.
Supply managementTo maximize the collection of rainwater, the existing watercatchments already form about half of Singapore’s total landarea. With the completion of the two new reservoir schemes,including Singapore’s 15th reservoir, the Marina Reservoir, thewater catchment will grow from the current half to two-thirdsof Singapore’s land area by 2009.
Many cities around the world are built around reservoirs,but PUB is creating a reservoir right in the middle of the city.Dubbed ‘the reservoir in the city’, the Marina Reservoir will beformed by building a dam across the mouth of the MarinaChannel.
One of the key features of the Marina Reservoir is its multi-ple functions. Primarily, it provides water storage, but is alsoa venue for water-based recreation, as well as a means of floodcontrol. The dam, spanning 350m, can be utilised during aheavy storm to pump water out to sea. Thus the MarinaReservoir will serve to maximise water supply capacity duringtimes of low rainfall as well as substantially lower the risk offlooding in the event of a storm.
NEWater is the zenith of Singapore’s water supply diversifi-cation strategy. Produced from the reclamation of treated usedwater, it is now a reliable source of water supply for thecommercial and industrial sectors, accounting for almost 7 percent of Singapore’s water demand.
Sports and leisure: dragon boat racing in Singapore River
Phot
o: P
UB
–Si
ngap
ore’s
Nat
iona
l Wat
er A
genc
y
2.Econ & social issues & perspectives:Master spread 16/2/07 10:04 Page 75

[ ]76
the private sector, the plant is one of the biggest seawater ROplant in the world, and has the capacity to supply 30 mgd ofdesalinated water.
Although desalination reduces Singapore’s reliance on tradi-tional water supply sources, it also makes it moreenergy-dependant. This, coupled with rising climate stresscompounds the need to secure energy sources that do not havesuch a large impact on the environment. Desalination may alsohave detrimental impacts on local marine ecology if its seawa-ter intake and discharge is not well monitored. To this end,PUB has commissioned a long-term study of the quality ofseawater surrounding Singapore. It is through such measuresthat PUB aims to mitigate environmental impacts.
Demand managementAs well as expanding water supply, PUB also believes that aPeople-Public-Private approach is essential. This method ofdemand side management involves the design of programmesthat will engage the community, businesses and civic groups.This includes programmes aimed at encouraging water conser-vation and promoting public ownership of water resources.
In the area of water conservation, PUB adopts a multi-prongapproach of appropriate water pricing, mandatory waterconservation measures, public education and efficient manage-ment of the water distribution system to keep our waterconsumption levels in check.
On water pricing, PUB’s water tariff is set to recover the fullcost of production and distribution. In addition, to encouragewater conservation, and reflecting the limited supply of waterin Singapore and the higher incremental cost of additionalsupplies, a water conservation tax is also levied. This tax isimposed on the first drop consumed to drive home the messagethat every drop is precious. The tax is increased for householdsthat consume more than 40 cubic metres per month.
To promote water conservation, PUB also adopts a host ofmandatory and voluntary measures. Mandatory measuresinclude the use of low capacity flushing cisterns and constantflow regulators. PUB has also embarked on community-drivenpublic education programmes such as the ‘Water EfficientHomes’ programme and the ‘Water Efficient Buildings’programme to encourage homeowners and building ownersto adopt water conservation habits and measures. This hasresulted in the reduction of per capita domestic consumptionfrom 165 litres per day in 2003 to 160 litres per day last year.
In order to further lower consumption to 155 litres per day,PUB has embarked on its latest programme – The 10-LitreChallenge. This programme aims to encourage all Singaporeansto reduce their daily water consumption by ten litres throughsimple but effective water saving tips, such as how to installwater bags in cisterns to reduce the amount used for flushing,taking shorter showers and washing full loads of laundry.
In terms of unaccounted-for-water, PUB has made mucheffort to ensure that leaks in our water pipe network are keptto a minimum, and water sold to customers is accuratelymetered. This has enabled PUB to lower unaccounted-for-waterfrom 10 per cent in the early 1990s to about 5 per cent today.Hence, by reducing water losses, water demand is kept in checkand there is less pressure to expand our water sources.
Beyond water conservation, PUB has launched the “OurWaters” Programme and the Active, Beautiful, Clean (ABC)Waters Programme to get people to value and enjoy our waterassets.
Under “Our Waters”, organizations and community groupscan adopt stretches of water and pledge to take care of the waterresources by conducting clean-ups, river patrols and seminars topromote greater awareness of water issues among the commu-nity. With ABC Waters, utilitarian drains will be transformedinto beautiful and vibrant community spaces for recreational
Connecting with the community: kayaking in our reservoirs
Phot
o: P
UB
–Si
ngap
ore’s
Nat
iona
l Wat
er A
genc
y
2.Econ & social issues & perspectives:Master spread 16/2/07 10:04 Page 76

activities. This will not only enhance the overall quality of lifefor Singaporeans, but will also help foster a greater sense of envi-ronmental ownership, leading to a deeper awareness of theenvironment and the importance of its precious resources.
Our next stepAs a small-island state, Singapore is far from immune to theeffects of globalization. In order to keep pace with global tech-nology developments, Singapore needs to continue to investheavily in research and development to ensure technologicalrelevance in this fast-changing world. As such, the Singaporegovernment has ear-marked USD5 billion to fund R&Dprojects in three sectors, including the environmental andwater technology sector, with an Environment and WaterIndustry Development Council (EWI) set up to map outstrategies and oversee growth in this sector. It is Singapore’sgoal to be a Global HydroHub, the centre of a vibrant globalindustry, a place for the generation and exchange of ideas inthe field of water.
Running parallel to this strong belief in the merits of ideaexchange is PUB’s active participation in global water eventssuch as at the 4th World Water Forum in Mexico, theInternational Desalination Association Forum in Tianjin, Chinalast year and of course, the World Water Week in Stockholm.Singapore will also be playing host to the International WaterAssociation’s Leading Edge Technology conference in a fewmonths time. Singapore’s HydroHub and the existing opportu-nities for international partnerships not only complement eachother, but are vital if progress in this sector is to be maintained.
Climate change is no longer speculation, it is reality. For PUB,the key areas of concern will be the impact of rising sea levelson flooding and coastal supply infrastructure. As such, PUB iscurrently monitoring developments in the international arenato facilitate forward planning. Through such measures, PUB
hopes to reduce water supply uncertainty as a result of meteo-rological events.
The road forwardImplementing an integrated water management system requiresvision and proper planning. However, these factors alone arenot sufficient. The key to the success of a multi-stakeholder,multi-use system is strong political will and good governance.It is only through a cohesive national effort that any large-scalesystem can attain its goal.
[ ]77
Phot
o: P
UB
–Si
ngap
ore’s
Nat
iona
l Wat
er A
genc
yPh
oto:
PU
B –
Sing
apor
e’s N
atio
nal W
ater
Age
ncy
Active, beautiful and clean waters: transforming our waterways – Rochor Canal (before and after)
Reverse osmosis membranes for NEWater production
2.Econ & social issues & perspectives:Master spread 16/2/07 10:04 Page 77

[ ]78
IN RIYADH, Saudi Arabia on 21 October 2002, His RoyalHighness Prince Sultan Bin Abdulaziz, Crown Prince,Deputy Prime Minister, Minister of Defence and Aviation
and Inspector General, announced the commencement ofcandidates’ nominations for the ‘Prince Sultan Bin AbdulazizInternational Prize for Water’. This international scientific prizerepresents a significant contribution from the Kingdom of SaudiArabia to the global water issues that represent one of the mostpressing human, economic and political concerns worldwide.
The prize council is headed by His Royal Highness PrinceKhalid Bin Sultan Bin Abdulaziz. The General Secretariat ofthe prize is headquartered in the Prince Sultan Research Centrefor Environment, Water and Desert, at King Saud University inRiyadh, Kingdom of Saudi Arabia. There follows an accountof the centre and its activities, including a more in-depth lookat the reasons and accomplishments of the prize.
The Prince Sultan Research Centre for Environment,Water and Desert (www.psrcewd.edu.sa)Prince Sultan Research Centre for Environment, Water andDesert (formerly known as the Centre for Desert Studies) wasestablished in 1986 as an independent administration directly
linked to the office of the Rector of King Saud University. Itwas set up as part of a national initiative, under the leadershipof the Custodian of the Two Holy Mosques, to create special-ized research centres, particularly in important areasconcerning the prevailing dry desert climate of the Kingdom.Its purpose is to design and conduct scientific research relatedto desert development and combating desertification in theArabian Peninsula in general, and in the Kingdom of SaudiArabia in particular.
The centre works to fulfil its mission through scientificstudies and research, particularly in the realms of combatingdesertification, preserving natural and environmental resourcesand organizing their exploitation through afforestation and theexpansion of natural vegetation cover, forest and rangeland. Italso endeavours perpetually to ameliorate its technical andresearch capacities in the field of remote sensing and geograph-ical information systems, in order to support its scientificresearch activities. In addition, it uses these technologies in itswork with specialised authorities to implement applied researchprojects devoted to studying the Kingdom’s desert environment.
Among the research products published by the centre areseveral scientific and advisory publications. It acts as a home
Fostering sustainable water resources: the Prince Sultan Bin Abdulaziz
International Prize for Water
Dr. Abdulmalek A. Al Al-Shaikh, General Secretary of the Prince Sultan Bin AbdulazizInternational Prize for Water, Riyadh, Saudi Arabia, www.psipw.org
HRH Crown Prince Sultan bin Abdulaziz (centre) with HRH PrinceKhalad bin Sultan bin Abdulaziz and Professor Howard Wheater
Phot
o: P
SIPW
Some winners of the PSIPW 2nd Award 2004-2006
Phot
o: P
SIPW
2.Econ & social issues & perspectives:Master spread 16/2/07 10:04 Page 78

[ ]79
tally friendly while each of the other four prize categories varieswith each award
The second awards (2004-2006)In the second awards (2004-2006), prizes were awarded asfollows:
• The topic for the surface water prize was water harvesting.No prize was awarded due to a lack of nominations thatmet the required standards and conditions.
• Management of coastal aquifers was the topic for theground water prize, which was awarded to the watersection research institute at the King Fahd University forPetroleum and Minerals, Kingdom of Saudi Arabia and toProfessor Abdelkader Larabi of Morocco.
• In the alternative (non-traditional) water resourcesbranch, the prize was based on the treatment and reuse ofwastewater, and was awarded to Professor Abdul LatifAhmad of Malaysia.
• For water resources management, the prize focused onintegrated and sustainable water resources managementin arid and semi-arid regions, and was awarded toProfessor Howard S. Wheater of the United Kingdom.
• The King Abdulaziz City for Science and Technology –The Kingdom of Saudi Arabia won the prize for the protec-tion of water resources for its work concerning groundwater pollution by urban activities.
The third awards (2006-2008)Looking towards the third awards, which will be given in 2008,the topics for specialised branches are as follows:
• Surface water: sedimentation control in surface water systems• Ground water: exploration and assessment of ground
water• Alternative (non-traditional) water resources: innovative
methods and systems in desalination• Water resources management and protection: water
demand management in urban areas.
Any individual or organization that has made a pioneeringscientific contribution in one of the branches of the prize willbe considered eligible for nomination. The entrant must benominated by a well known scientific organization.
Academic or scientific organizations can nominate one ormore individuals or organizations. A scientific organizationcan nominate itself, but nominations put forward by individ-uals, whether on their own behalf or on behalf of others, willnot be accepted.
No more than five research or work projects can be submit-ted for nomination. All of these should be related to the currentnominated prize topic, and must not have previously beenawarded any international prize, either on its own or jointlywith another organization.
Nominated works are sent to specialized referees across theworld, and winners are announced in September of the prizeyear (e.g. 2006; 2008), when the topics for the next prizes arealso announced.
By perpetuating this two-year cycle of renewed topics withinthe prize categories, the Prince Sultan Bin AbdulazizInternational Prize for Water can help to ensure continued workand progress towards the provision and preservation of adequateand sustainable water resources across the world, and especiallyin the arid regions where they are needed the most.
for data documenting and support for desert-related scientificresearch activities conducted by the specialized divisions ofthe university. The centre is also continually committed tocooperating and strengthening links with the authoritiesconcerned in drought and desert studies at local, regional andinternational levels. It has participated in various academicactivities, particularly ‘University Days’ and ‘Community Days’and has provided the relevant authorities with seeds and trees.
The centre has also provided students and researchers, fromwithin the university and from outside, with technical coun-selling. It has organized various scientific conferences andseminars, and has taken an active part in such events in accor-dance with its focus on cooperation and the exchange of dataand knowledge. Its cooperation with governmental authoritiesand non-governmental bodies at all local, regional and interna-tional levels, has led to its participation in a number of researchand scientific projects, including agreements of cooperation withsome outstanding organizations that share its research activities.
Having laid a firm foundation due to the support and assis-tance offered by the university administration, the centrestarted working to improve its goals and extend its activities intune with more recent developments. Thus, the terms ‘envi-ronment’ and ‘water’ were added to its name to reflect broaderenvironmental concerns and the need for processes to conservewater and make it more available by developing new, low-costtechnical methods. In these areas, several studies and appliedprojects were implemented, such as ‘King Fahad’s Project forrainwater harvesting and storage in the Kingdom’. In addition,the centre adopted the Prince Sultan bin AbdulazizInternational Prize for Water and became its secretary’s head-quarters, with the director of the centre as secretary general.
The prizeThe Prince Sultan bin Abdulaziz International Prize for Wateris intended to reward the efforts undertaken by innovativescholars and scientists as well as applied organizations in therealm of water resources worldwide. It was established toacknowledge the special contributions that have been made tothe development of scientific solutions that help solve the prob-lems associated with the provision and preservation ofadequate and sustainable water resources, particularly in aridregions.
The prize includes awards according to five categories:• Creativity prize• Surface water• Ground water• Alternative (non-traditional) water resources • Water resources management and protection.
The creativity prize is SAR1 million (approximatelyUSD266,000), while each of the other categories carries a prizeof SAR500,000 (USD133,000). Prizewinners also receive a goldmedallion, a trophy and a certificate.
Prizes are awarded every two years, and nominations mustbe received by the end of each odd-numbered year – forexample, nominations for the third awards (2006-2008),nominations must be received by 31 December 2007.
The creativity prize covers several different water-relatedsubjects simultaneously. It is awarded for any original work(research, invention, technique etc.) that is considered as abreakthrough in any water-related field. The work must bepractically applicable, economically feasible and environmen-
2.Econ & social issues & perspectives:Master spread 16/2/07 10:04 Page 79

[ ]80
GOOD HEALTH STATUS is one of the primary aspirationsof human social development. Consequently, healthindicators are key components of human development
indices – for example, the Millennium Development Goals(MDGs), by which we measure progress toward sustainabledevelopment. Certain diseases and ill health are associated withparticular environmental, seasonal and climatic conditions.This was recognized by the ancient writers of Vedic literature,and by Hippocrates, but largely overlooked during the devel-opment of modern medicine. However, the community andpublic services are showing increased awareness of these asso-ciations, and climate and health interactions are the focus ofconsiderable research today.
Climate may impact on health through a number of mech-anisms. This could be directly, through cold or heat stress, orindirectly through its impact on communicable and non-communicable diseases. The World Health Organization
(WHO) recently identified 14 climate sensitive communicablediseases, including malaria, cholera and dengue. WHOdescribes these diseases as being promising candidates for thedevelopment of climate-informed early warning systems.1 Italso acknowledges that some non-communicable coronary andrespiratory diseases are climate sensitive.
Evidence-based health policyThe role of evidence in the creation of health policy has beenstrongly promoted in recent years through, for example, theCochrane systematic reviews.2 Before using climate informa-tion in routine decision making, health policy advisors anddecision makers should ask for:
• Evidence of the impact of climate variability on theirspecific outcome of interest
• Evidence that using climate information is a cost-effectiveand practical means to improve health outcomes.
Managing climate-related health risks
Dr Stephen J. Connor, Director, PAHO/WHO Collaborating Centre on Early Warning Systems for Malaria and other Climate Sensitive Diseases; Director, Environmental Monitoring Research
International Research Institute for Climate & Society
Poor air quality due to atmospheric smog over New York
Phot
o: C
DC
/Dr.
Edw
in P
. Ew
ing,
Jr
2.Econ & social issues & perspectives:Master spread 16/2/07 10:04 Page 80

[ ]81
change in improving air quality in their communities. Similaractivities are taking place across the border in the United States.
Epidemic malaria in AfricaIt is now widely recognized that malaria is a major constraintto both socio-economic development5 and the MDGs6 in Africa,where there are an estimated 90 per cent of all malaria deaths,and immeasurable sickness occurs.7 Approximately 500 millionAfricans live in regions endemic to malaria. Endemic malaria ishighly correlated with climate in terms of its spatial distributionand its seasonality. A further 125 million Africans live in regionsprone to epidemic malaria, which is again highly correlatedwith climate, but in this case, with climate anomalies.8
Significant resources are now being made available to controlmalaria in African countries through the Global Fund for AIDS,TB and Malaria. It is considered that climate information couldbe used to help focus these resources more effectively. Whilesignificant gaps have been identified between climate servicesand end-users in Africa,9 a number of African countries seek touse climate information as part of integrated epidemic earlywarning and response systems. The most advanced example canbe found in Botswana where the National Malaria ControlProgram uses tailored seasonal climate forecasts10 and weatherscale information11 received through the National MeteorologicalServices as part of an effective Malaria Early Warning System.Botswana’s example is being promoted by WHO to encourageother African countries to follow suit.12
However, if such initiatives are to perform at the scalerequired, significant interdisciplinary collaboration is essen-tial. Training must be provided, and mechanisms developedacross disciplines, to address socio-economic vulnerability tosevere disease outcomes.
This demand asserts the importance of evidence in effectivepolicy making while placing climate in a broader context asone amongst several imperatives. If evidence is to have agreater impact on policy and practice, four key requirementsare necessary:
• Agreement on the nature of acceptable evidence• A strategic approach to evidence creation, together with
the development of a cumulative knowledge base• Effective dissemination and access to knowledge• Initiatives to increase the uptake of evidence in both policy
and practice.
Improving routine health surveillance is clearly one essentialcomponent of this strategic approach, but more effective part-nerships need to be developed to integrate the climate factoreffectively. The following three diverse examples illustrate this.
Heat stress in EuropeThe European heat wave during the summer of 2003 is asso-ciated with an estimated 40,000 excess deaths, with 15,000 ofthese deaths occurring in France alone. Since then, theEuropean Office of WHO, with funding from the EuropeanUnion (Euro-Heat), has joined research institutions, health-care providers and many of the National MeteorologicalServices in studies to establish the factors and mechanismsresponsible for these deaths. This information is then used toset up early warning systems to increase public awareness andto reduce vulnerability and associated risk.3
The socio-economic factors implicated with heightened riskand vulnerability are complex but include age, existing medicalconditions, poor levels of physical fitness, urban residence andpoor ventilation. The climatic factors involved focus largelyon the stability and persistence of elevated temperatures, rela-tive humidity and cloud cover, where these create a high localheat stress index.
Meteo-France, a Euro-Heat partner, recently declared July2006 as the warmest on record. Yet preliminary figures suggestthat heat-related deaths in France number only a few hundred,and for Europe a few thousand. While this is extremely goodnews, and suggests that early warning systems are workingwell, the importance of socio-economic factors vis-à-visclimatic factors is yet to be clearly understood.
Respiratory disease in North AmericaThere are numerous studies linking atmospheric air quality,airborne particulate matter (airborne PM: particulate matter lessthan 10 micrometres in size), aggravated cardiac and respiratorydiseases (such as asthma, bronchitis and emphysema) and variousforms of heart disease. A strong correlation exists between highlevels of airborne PM and increases in emergency room visits,hospital admissions and fatalities. Children, the elderly andpeople with respiratory disorders are particularly susceptible.
The Canadian Meteorological Service produces a daily airquality forecast. Air quality is expressed using an Air QualityIndex (AQI).4 Air Quality Advisories are issued when the airpollution levels exceed national standards. They are issued inpartnership with provincial and municipal environment andhealth authorities and contain advice on action that can betaken to protect health and the environment. A cornerstone ofthis process is the development of relevant and timely healthmessages that allow Canadians to safeguard their own health,as well as the health of those in their care, and to motivate Ph
oto:
Chr
isto
pher
Phe
lps
2.Econ & social issues & perspectives:Master spread 16/2/07 10:04 Page 81

[ ]82
AIR POLLUTION IS the cause of many environmental andpublic health problems. Exposure to particulate matterand ozone can cause cardiovascular and respiratory
systems diseases. While the health risks presented by some airpollutants, such as second-hand tobacco smoke or carbonmonoxide, have led to campaigns to raise awareness of therisks, other forms of air pollution are more difficult to avoid:particulate matter can be generated from a variety of sourcesincluding vehicle emissions, road dust, power generation,construction and demolition processes, pollens, molds andeven sea spray. Many people are unavoidably exposed to thesepollutants throughout their lifetime, and need more informa-tion about air quality in order to mitigate the risks.1
Environmental problems arising from this include regionalhaze, impairing visibility in national parks and wildernessareas; acidification of lakes, streams and forests; acidic damageand erosion to buildings and other materials; ozone damageto plants, and eutrophication in coastal areas. In addition, theaccumulation of toxic compounds in plants and wildlife resultsin associated effects on the ecosystem and public health.
Awareness of these hazards has grown in recent years, andseveral measures are now taken to address air quality issues.These include:
• Environmental conventions to establish a broad frame-work for cooperative action on reducing the impact of airpollution and to set up a process for negotiating concretemeasures to control the emission of air pollutants throughlegally binding protocols
• Development and implementation of air pollution controlstrategies
• Accounting for emissions• Developing, achieving and maintaining air pollutant standards• Taking regular measurements of pollutants, providing air
quality modelling and forecasting, and air quality index(AQI).
In particular, developing countries with rapid economic growthhave serious problems in balancing the need for economic andsocial development on one hand, and issues of resource conser-vation and environmental protection on the other.
The WMO and its Members carry out a combination ofmeasurement and modelling activities to provide air qualityinformation for use by decision makers and the general public.Given the widespread effects of pollution, these services canbe applied by communities at all levels to mitigate the envi-ronmental and public health risks associated with air qualityin a wide range of activities.2,3
EmissionsAmong the many sources of emissions that cause air pollution,some are particularly problematic:
Power generation – In most countries, power generation isresponsible for the major part of the sulphur dioxide (SO2)and nitrogen oxides (NOx) released into the environment byhuman activity.
While measures in many countries have significantlyimproved air quality, additional reductions are necessary toaddress persistent public health and environmental problems.Because these pollutants move beyond local and regional bound-aries, individual localities experiencing environmental effectscannot always control them. In addition, current laws in manycountries tend to address each environmental problem inde-pendently, even if one pollutant contributes to several problems.
Transportation – This equates mainly to ozone and particulatepollution. Measures taken to protect public health and the envi-ronment include regulating air pollution from motor vehicles,engines, and the fuels used to operate them, and by encouragingtravel choices that minimize emissions. As an alternative to usingprivate cars, governments may seek to improve public transport,provide tax incentives for more environmentally friendly cars,and put in place restrictions on fuel and vehicle use. Consumerscan help by learning what can be done to reduce air pollution,and how to make decisions that improve air quality.
EffectsAir pollution contributes to respiratory and cardiovasculardiseases, cancer, and nervous system and developmental disor-ders. The link between exposure to air pollution and consequenceson health, depends upon the pollutant and the disease, and is alsoinfluenced by genetic constitution, age, nutrition, lifestyle, andsocioeconomic factors such as poverty and level of education.
As reported by WHO, the environmental factor with the great-est impact on health in Europe is indoor and outdoor airpollution.4 The European Commission Clean Air for Europe(CAFÉ) programme, found that in the EU about 350,000 peopledied prematurely in 2005 due to outdoor fine particulate matterpollution. This corresponds to an average loss of life expectancyof 9 months per EU citizen, and is comparable to the lifeexpectancy loss due to road accidents in the EU.5 There are greatdifferences between East and West Europe, and between indus-trialized and developing countries. Globally there are about 1.5million deaths annually from lower respiratory infections, largelycaused by indoor and outdoor air pollution.6 It has also beenfound that during heat waves, 20-40 per cent of excess deathsare due to air pollution.
Air quality: meteorological services for safeguarding public health
Dr Liisa Jalkanen, WMO Secretariat
2.Econ & social issues & perspectives:Master spread 16/2/07 10:04 Page 82

[ ]83
Public and preventive health strategies that consider envi-ronmental health interventions are often cost-effective and yieldbenefits that contribute to the overall well-being of communi-ties. Respiratory health improves when air quality improves ashas been shown by many intervention studies. Examplesinclude industrial plant shutdowns and lowering of fuel sulphurcontent. The Olympic games are usually a great incentive forimproving air quality. For instance, during the summer 1996games in Atlanta implementation of an alternative transportstrategy resulted in lower traffic emissions. Hospital admissionsof children with acute asthmatic symptoms fell by 41.6 per centduring the period of the games.7 More recently, Beijing hasconducted some of China’s most ambitious environmentalactions, including controls on emissions, adopting alternativefuel use, and relocating heavily polluting plants outside ofBeijing. The importance of regional air quality has also beenrecognized and possible measures are being considered.
Excessive UV radiation is harmful to humans, as well as floraand fauna. Reporting of a UV index, a service that is providedby many National Meteorological and Hydrological Services(NMHS), may initiate preventive measures against conditionsthat can cause skin cancer, certain types of cataracts andimmune system suppression.8
Tourism can suffer significant economic impacts fromincreased air pollution and reduced visibility. EnvironmentCanada surveyed tourists in the Greater Vancouver area regard-ing poor visibility and found that for a single extreme visibilityevent, a loss of USD7.45 million in tourist revenue waspredicted.9 Evidently, these losses can seriously threatenregional economies that rely heavily on tourism.
Biomass burning is a major contributor of gaseous andparticulate air pollutants in many parts of the world. As aconsequence it has a severe effect on the health of the popula-tion, civil aviation operations, maritime shipping, agriculturalproduction, and the tourist industry. Southeast Asia witnessedone of the worst smoke and haze episodes in autumn 1997,with estimated economic losses at USD 9.3 billion.10
Air quality servicesAmongst other services, NMHSs, working alone or togetherwith environmental agencies, issue AQIs giving details of dailyair quality, as well as air quality forecasts (AQF) in a simple andinstructive manner. These are designed to enable the generalpublic and authorities to take appropriate measures both inimmediate and future actions, thus counter-acting the negativeeffects as far as possible.
WMO addresses air pollution problems on all scales
Source: GURME (GAW Urban Research Meteorology and Environment project)
2.Econ & social issues & perspectives:Master spread 16/2/07 10:04 Page 83

[ ]84
SINGAPORE IS A small city state comprising of one mainisland and a number of islets. Located about 1.5 degreesnorth of the equator; it has a climate with uniform
temperature and pressure, high humidity and heavy rainfall.With a land area of only 699 km2, Singapore has a popula-
tion of more than 4.3 million, has over 750,000 motor vehicles,and handles 423 million tonnes of sea cargo and over 1.8million tonnes of air cargo each year. Furthermore, Singaporehas many large-scale industries such as oil refineries, petro-chemical complexes, and pharmaceutical and electronicfactories. As a result, the challenges Singapore faces in achiev-ing and sustaining a clean and healthy environment areimmense, in particular ensuring good air quality to protect thehealth and well-being of its inhabitants.
Despite its many challenges and constraints, Singapore hassucceeded, over the years, in keeping its air healthy. Singaporecontinues to enjoy good ambient air quality, assessed as ‘good’most days of the year. The average levels of key air pollutants arelow and have been stable over the years, except for 1994 and1997, because of trans-boundary smoke haze from land and forest
fires in the region. Singapore has adopted the use of the PollutantStandards Index (PSI) to measure its air quality. This indicator,which was developed by the United States EnvironmentalProtection Agency (USEPA), shows that in 2005, Singaporeenjoyed 88 per cent of days with ‘good’ air quality, with theremaining 12 per cent in the ‘moderate’ range.
Environmental management in SingaporeThe main cause of air pollution in Singapore is the burning offossil fuels in industrial processes, electricity generation and trans-portation. Fuel consumption, with its resulting emissions,inevitably increases with economic and population growth.Although climate and geography do play a role in facilitating thesafe dispersion of the air pollutants emitted, there is a limit as tohow much emission the environment in Singapore can assimilatewithout resulting in a deterioration of its air quality. A rigorousenvironmental management programme, comprising of envi-ronmental planning and development controls, regulatorycontrol, ambient air quality monitoring, partnership initiativesand international cooperation, is required to keep emissions
Improved air quality in Singapore
Foong Chee Leong, Director-General, Meteorological Services Division,Joseph Hui, Director-General, Environmental Protection Division,
The National Environment Agency, Singapore
Singapore continues to enjoy good air quality most days of the yearEnvironmental considerations are incorporated in land-use planning,development and building control
Phot
o: N
atio
nal E
nvir
onm
ent
Age
ncy
and
Sing
apor
e E
nvir
onm
ent
Cou
ncil
Phot
o: N
atio
nal E
nvir
onm
ent
Age
ncy
and
Sing
apor
e E
nvir
onm
ent
Cou
ncil
2.Econ & social issues & perspectives:Master spread 16/2/07 10:04 Page 84

[ ]85
and, if necessary, take corrective measures to comply with thestipulated air emission standards. NEA officers also carry outinspections on industrial and trade premises to ensure compli-ance with pollution control requirements, as well as conductingfuel analyses and smoke observations.
Air emissions from vehicles are kept in check through theimplementation of stringent emission standards for new vehi-cles, mandatory periodic inspection of vehicles, and enforcementoperations. Over the years, NEA has tightened the emission stan-dards in tandem with advances in vehicle technology. InSingapore, diesel vehicles contribute approximately 50 percentof the total particular matter (PM) 2.5 emissions. PM2.5 is veryfine particulate matter of 2.5 microns in size and smaller, andhigh levels of PM2.5 pose health risks such as asthma and otherrespiratory diseases. NEA implemented the Euro IV emissionstandards for all new vehicles in October 2006 to help reducePM2.5 emissions. As part of the efforts to reduce PM2.5 emis-sions, NEA implemented the Euro IV emission standards for allnew vehicles in October 2006. The quality of fuel used by vehi-cles is also controlled. Unleaded petrol was introduced inJanuary 1991 and leaded petrol was phased out by 1 July 1998.The sulphur content of diesel was reduced to 0.005 per cent byweight in December 2005. Various tax incentives were alsointroduced to promote the early introduction of Euro IV dieselvehicles, CNG vehicles and green vehicles.
Ambient air quality monitoringThe ambient air quality in Singapore is continuously moni-tored through the Telemetric Air Quality Monitoring andManagement System (TAQMMS). The system, whichcomprises 13 remote air monitoring stations linked to a centralcontrol system, provides an efficient means of obtaining airquality data. Eleven of the stations measure ambient air qualityand two stations measure roadside air quality. Automatic analy-sers and equipment are deployed at the stations to measure theconcentrations of major air pollutants such as sulphur dioxide,oxides of nitrogen, carbon monoxide, ozone and respirablesuspended particles.
Partnership initiativesPartnering with other stakeholders in the environment, suchas the private and voluntary (people) sectors, is essential forsustaining good air quality. Key partnership initiatives includethe following:
Motor Industry Certification Board – To help providevehicle owners with a better standard of maintenance, NEAinitiated the formation of an industry-led Motor IndustryCertification Board (MICB) for the administration of theCertification Scheme for Motor Workshop on 1 September2000. Under this scheme, certificates are awarded to motorworkshops with trained mechanics, proper equipment andprocedures and quality assurance checks for the maintenanceof diesel-driven vehicles to prevent black smoke emissions.Currently, more than 30 workshops are certified under thisscheme.
Promoting use of cleaner fuel – Natural gas is a cleaner fuelthan either petrol or diesel. The use of natural gas vehicles willreduce the emission of air pollutants and carbon dioxide. In2002, NEA and its project partners, a gas supply company anda bus company, launched the first CNG refuelling station anda pilot project to introduce CNG buses to the masses. A taxicompany has also registered and deployed a fleet of CNG taxis
within this limit and the ambient air quality in the ‘good’ range.The National Environment Agency (NEA) of Singapore is respon-sible for environmental management in Singapore.
Environmental planning and development controlRight from the conceptual and planning stages of a development,potential air pollution problems are assessed and minimized orprevented by incorporating a judicious mix of siting, technicaldesign and pollution control measures. This is implemented usingan integrated land-use planning and development controlapproach that encompasses all new developments, whether resi-dential or industrial. This approach enables environmentalconsiderations and factors to be incorporated at the land-useplanning, development control and building control stages.Under this integrated approach, NEA works with the variousauthorities of Singapore, such as the Urban RedevelopmentAuthority (URA), the Jurong Town Corporation (JTC) and theHousing and Development Board (HDB) as well as private sectorindustrial developers on all land use and development proposals.
In addition, NEA assesses all industrial proposals to ensurethat they meet siting and technical requirements. These sitingand technical requirements help ensure that the proposed indus-tries, when in operation, do not pose unmanageable hazards orpollution impacts. Large-scale industrial projects are required tocarry out pollution impact studies and quantitative risk assess-ments with accredited consulting firms to quantify potentialpollution risks and hazards. These studies take into account theprevailing climatic conditions and the design of the plants. NEAreviews these studies and imposes technical requirements to mini-mize the identified pollution impacts and hazards. The technicalrequirements imposed include:
Fuel quality – The type and quality of fuel used by proposedindustries are stipulated. The maximum sulphur content infuel oil used by power stations is controlled at 2 per cent byweight. Other industrial plants are allowed to use fuel oil withthe sulphur content capped at 1 per cent. Fuel-burning equip-ment such as boilers, in premises which are located near to orin built-up areas, is required to use cleaner fuel, such as dieselwith 0.005 per cent sulphur content or gas (liquefied petro-leum, compressed natural gas (CNG) or town gas).
Pollution control equipment – Industries are required toprevent emissions as much as possible through design measuresand to further mitigate them by installing appropriate pollu-tion control equipment to meet the stringent emission standardsstipulated under the environmental legislation in Singapore.
Regular dialogues are held with professional engineers, archi-tects, contractors and developers to disseminate newenvironmental codes and technical requirements as well as to seekfeedback on environmental control requirements. Comprehensiveguidelines and codes of practice are available on the NEA Website (www.nea.gov.sg) to guide these professionals and developersin their work. In addition, NEA provides walk-in consultationsessions for engineers and architects to seek clarification andwaivers to facilitate the approval of pollution control equipment.
Regulatory controlAir pollution in Singapore is regulated under theEnvironmental Pollution Control Act. The latest air emissionstandards for industry are stipulated in the EnvironmentalPollution Control (Air Impurities) Regulations 2000.
A source emission testing scheme is set up to ensure opera-tors of major industrial plants monitor their emissions regularly
2.Econ & social issues & perspectives:Master spread 16/2/07 10:04 Page 85

[ ]86
since December 2005. NEA will continue to promote vehiclesthat use cleaner fuel.
National Climate Change Committee – The NationalClimate Change Committee (NCCC) is an inter-agencycommittee with people, private and public sector (3P) repre-sentation. It seeks to integrate the promotion of energyefficiency and the use of clean energy sources with the reduc-tion of emissions of air pollutants and greenhouse gases inthe power generation, manufacturing, building, transporta-tion and consumer sectors. The key thrusts of the NCCC arepromotion of energy efficiency, promotion of the use ofcleaner energy sources and test bedding of innovative andalternative energy technologies. A USD6.5 million co-funding scheme for energy studies to improve energyefficiency in the manufacturing and building sectors waslaunched in April 2005.
Power generation – Power generation is a major source ofair pollution. Using clean fuel and adopting efficient generat-ing technologies helps to reduce emissions of air pollution andcarbon dioxide. About 80 per cent of electricity in Singaporeis generated from natural gas and using combined cycle gener-ation or cogeneration.
Partnerships with NGOs – The Singapore EnvironmentCouncil (SEC), an environmental non-governmental organi-zation (NGO), introduced the Associate Green CornersProgramme in July 2005 to encourage retailers to display air-conditioners and refrigerators labelled under the EnergyLabelling Scheme. The SEC also administers the fuel economylabelling scheme for passenger vehicles. The two schemes arevoluntary labelling schemes aimed at promoting energy effi-cient appliances and passenger vehicles. NEA had alsodeveloped the Energy Smart Building Scheme jointly with theNational University of Singapore to recognise energy efficientbuildings. To support this, an accreditation scheme for energyservices companies was launched in April 2005.
Singapore Green Plan 2012 In 1992, Singapore unveiled the Singapore Green Plan (SGP),the national environmental master plan that sets out the strate-gic directions Singapore should take to further improve itsliving environment and raise public health standards. The SGPalso maps out the policies and strategies the government wouldimplement to transform Singapore into a model green city.
The successful implementation of action programmes underthe SGP has helped to keep Singapore’s environment clean andgreen even as Singapore’s economy has continued to grow overthe past decade.
With changing economic and environmental landscapes, areview was initiated to keep the SGP relevant. In August 2002,the SGP 2012 was launched in Singapore. The SGP 2012 wascirculated at the World Summit on Sustainable Development(WSSD) in Johannesburg in August and September of 2002.
The SGP 2012 relays the message to our nation and theworld, that the challenge Singapore now faces is to movebeyond environmental performance towards environmentalsustainability. This updated master plan charts Singapore’sapproach to achieving environmental sustainability over thenext ten years. It also sets out the broad directions and thestrategic thrust that will help ensure Singapore’s long-termenvironmental sustainability.
International cooperationNEA also works through bilateral, regional and internationalprogrammes to strengthen Singapore’s environmental cooper-ation with regional countries and international organizations.At the bilateral level, the Malaysia-Singapore Joint Committeeon the Environment (MSJCE) covers environmental issues ofmutual concern such as the control of vehicular emissions.Similarly, the Indonesia-Singapore Working Group on theEnvironment (ISWGE) discusses various areas of collabora-tion and projects between the two countries, such as thetrans-boundary haze pollution problem. In June 2006, theinaugural bilateral meeting of the Brunei-Singapore WorkingGroup on the Environment (BSWGE) was convened inSingapore. This bilateral cooperation provides opportunitiesfor both countries to share their experiences in various envi-ronmental challenges, which include air quality managementand vehicular emission control.
Since its inception in 2003, Singapore has been chairing theAssociation of Southeast Asian Nations (ASEAN) WorkingGroup on Environmentally Sustainable Cities (AWGESC).Under AWGESC, an ASEAN Initiative on EnvironmentallySustainable Cities (AIESC), which focused initially on keyurban environmental issues such as clean air, water and land,was established. A total of 24 cities in ASEAN are currentlyparticipating in this Initiative. In 2006, a set of key performanceindicators and award criteria to measure the state of environ-mental sustainability in participating cities was established.
Looking aheadDespite being highly urbanized and industrialized, Singapore’sambient air pollutant levels have generally been kept withinthe US Environmental Protection Agency (USEPA) ambient airquality standards through strong planning and regulatorycontrols. However, as its industrial and transport base expandsand energy demand grows, maintaining clean air as a resourcewill be a key challenge to Singapore.
Singapore will continue to tighten emission controls and tomove towards cleaner fuels for both stationary and mobilesources of pollution. The promotion of clean fuel burningequipment in industry will continue to be encouraged, espe-cially with greater availability of natural gas. Singapore ismoving towards a sustainable transport system, with a compre-hensive and seamless public transport network and greateradoption of green vehicles.An energy label for air-conditioner
Phot
o: N
atio
nal E
nvir
onm
ent
Age
ncy
and
Sing
apor
e E
nvir
onm
ent
Cou
ncil
2.Econ & social issues & perspectives:Master spread 16/2/07 10:04 Page 86

[ ]87
IT IS KNOWN that meteorological conditions, and climate ingeneral affect human health. The effects can be direct, suchas through increased heat stress and loss of life in floods
and storms, or indirect through alterations in the range ofdiseases as well as food availability and quality.
Thus, it is becoming increasingly important, taking intoaccount global warming, that health and meteorologicalauthorities form a close partnership and cooperate in order tomitigate the impact of meteorological conditions on humanhealth.
Such cooperation began in Portugal in 1999 between thePortuguese Institute of Meteorology and the Portuguese HealthInstitute, with the aim of creating an operational watchwarning system on heat waves with effect on mortality.
The occurrence of heat waves is recognized as a danger topublic health,1 since it is a phenomenon causally associatedwith avoidable excess mortality. Still fresh in our minds is theEuropean heat wave of 2003, which is estimated to have causedapproximately 50,000 excess deaths.2 Whilst the impact of
heat waves on human mortality rate is widely established, thereare also causal links to disease, and excess strain to health careservices.3
During the heat wave of 1980, average daily temperatures inMemphis, USA, rose above the mean on 25 June and remainedelevated for 26 consecutive days. During the July period 83heat-related deaths were recorded, most of which involvedelderly, poor, black inner-city residents.4
A heat wave occurred in July 1988 in Allegheny County,USA, with daily maximum temperatures near or above 90degrees Fahrenheit for 15 consecutive days.5 During thatperiod there were a total of 694 related deaths in the county,with the most affected being persons over 65 years old.
In July and August of 1995, during a heat wave in Englandand Wales, 619 extra deaths were estimated relative to theexpected number of deaths based on the 31-day movingaverage for that period. Excess deaths were apparent in all agegroups, most noticeably in women and for respiratory and cere-brovascular disease.6
The watch warning system on heat waves with effect on mortality
Eleonora Paixão, Paulo Nogueira and José Marinho Falcão, Instituto Nacional de Saúde Dr. Ricardo Jorge, Observatório Nacional de Saúde, Portugal
Fátima Espírito Santo, João Ferreira and Teresa Abrantes, Instituto de Meteorologia, Portugal
Source: IM Portugal
Heat Wave Duration Index (left), number of consecutive tropical nights (Tn ≥ 20°C) (second left), 7-18 July 2006 – (third left), and 1-14 August 2006 – (right)
2.Econ & social issues & perspectives:Master spread 16/2/07 10:04 Page 87

[ ]88
lance system, which includes Direcção Geral de Saúde(National Directorate for Health) and Serviço Nacional deBombeiros e Protecção Civil (National Service for CivilProtection) receive a warning in order to enable action to miti-gate the possible severe consequences of the phenomenon.
Recent heat waves in PortugalIn recent years the population of Portugal’s mainland has beenexposed to several heat waves associated with large excessesof mortality.
Four heat episodes with a large impact on mortality occurredin June 1981 with estimated excess deaths of approximately1,900.16 Also in July 1991, there were estimated excess deathsof approximately 1,000.17 In July/August 2003 estimatedexcess deaths were approximately 1,953,18 and in July 2006estimated excess deaths were approximately 1,123.19
Heat episodes with a lower impact on mortality occurred inPortugal during the following periods: 14-25 July 1990 (esti-mated excess deaths 690); 19-28 May 1991 (estimated excessdeaths 475); 27 May to 2 June 2001 (estimated excess deaths441)20; at regional level, in Algarve 27 July to 4 August 2004(estimated excess deaths 80)21, 3-7 and 12-16 August 2005(estimated excess deaths 462)22 and 4-8 August 2006 (esti-mated excess deaths 136).23
The table above shows the calculations leading to the estima-tion of the number of excess deaths for the two most recent, severeheat waves. The observed deaths were estimated through a systemthat surveys daily mortality. The number of expected deaths wasbased on figures from an appropriate comparison period.
The number of excess deaths was then calculated by thedifference ‘observed’ minus ‘expected’ (O-E) and an estimationof the relative excess was obtained by the ratio ‘observed’divided by ‘expected’ (O/E).
The heat wave24 of 29 July-14 August 2003 was a rare andunprecedented event in terms of both unusually highmaximum and minimum temperatures, and accompanying lowrelative humidity. Occurring in the inland territory with a dura-tion of 17 days, it was the longest recorded heat wave inPortugal since 1941.
The highest values for both maximum and minimumtemperatures were exceeded in this period. In Amareleja on 1August, Portugal’s highest ever temperature was measured at47.3 degrees Celsius. In 97 per cent of meteorological stations,maximum air temperatures above 35 degrees Celsius wererecorded between 1 and 14 August; maximum air tempera-tures above 40 degrees Celsius were recorded in two out ofthree stations. As to minimum air temperature, 97 per cent ofmeteorological stations recorded temperatures above 20degrees Celsius and 40 per cent above 25 degrees Celsius.
Reference should be made to the heat wave that occurredbetween 7 and 18 July 2006. Occurring in the Alentejo region,
In Japan, a study made by Nakai, Itoh and Morimoto,7 whichinvestigated heat-related deaths from 1968 through 1994,concluded that such fatalities were most likely to occur on dayswith a peak daily temperature above 38 degrees Celsius, andthat the incidence of these deaths showed an exponentialdependence on the number of hot days. Thus, even a small risein atmospheric temperature may lead to a considerable increasein heat-related mortality. Furthermore, 50.1 per cent of thesedeaths occurred in children (four years and under) and theelderly (70 years and over) irrespective of gender. This clearlyindicates the importance of combating global warming.
Portugal is no exception to this danger. Episodes of excessiveheat have sporadically occurred in Lisbon throughout the 20thcentury. The impact of the heat wave of June 1981 on the popu-lation of the district of Lisbon was first published in 1988.8 Infact, multiple episodes of heat waves with different durationsand health consequences have been identified in Portugalbetween 1980 and 2006.
In terms of vulnerability, advanced age; cognitive limitations;existing illness; the consumption of certain medication; hydra-tion level; isolation and habitation conditions are all relevant.9
Case-control studies carried out in France found that loss ofautonomy and social isolation played a major role in the riskfactors for the elderly, as did living directly below the roof ofa building, particularly in cities.10
Whilst there is general agreement that the elderly are mostvulnerable to severe heat impacts, there are cases in which allage groups have been affected, such as the heat wave of June1981 in Portugal.11
Forecasting the effects on mortalityMost European countries have implemented heat wave surveil-lance and alert systems.12 However, time of occurrence andthe expected consequences of these heat waves in terms ofduration, intensity and populations affected, are difficult toestimate precisely.13
With knowledge based mainly on the incidents of 1981 and1991, a warning system for heat waves and their effects onmortality14 was developed by the National Observatory of Healthof the National Institute of Health, Dr Ricardo Jorge and theInstitute of Meteorology, and has been operational since 1999.This warning system, the ÍCARO surveillance system of heatwaves, was implemented using a statistical model for the rela-tionship between high temperatures and mortality in Lisbon.15
The ÍCARO surveillance system operates yearly from Mayto September and calculates an index – the ICARUS INDEX –that relates predicted deaths (based on three-day forecasts forair temperature provided by the Institute of Meteorology) dueto the occurrence of high temperatures to those expectedwithout such climate effect. Whenever a heat wave is predictedwithin the next three days, institutions involved in the surveil-
Expected and excess of deaths (95% confidence intervals) during the heat waves of 2003 and 2006 in the Portugal Mainland
Heat waves Comparison period Expected deaths Excess of deaths CI 95% for the excess of deaths Ratio observed/expected
30thJuly to 15th 2000-2001 4499.3 1952.7 (1866.1 ; 2039.3) 1.43August 2003
7th-17thJuly 2006 July 2004 4163.9 1122.5 (876.3; 1381.0) 1.27
Source: Instituto Ricardo Jorge
2.Econ & social issues & perspectives:Master spread 16/2/07 10:04 Page 88

[ ]89
this was the longest recorded heat wave in July since 1941. Itis noticeable that during this heat wave a large number of warmdays and nights occurred, where the values of maximum andminimum air temperature were above values that only occurin 10 per cent of cases. There were also a great number ofconsecutive days with very high minimum air temperatures.Of particular relevance is the observation that the greatestvalues of the number of consecutive days with minimumtemperature ≥ 20ºC (tropical nights) were exceeded in theperiod 8-18 July.
From 2 to 13 August a heat wave occurred in coastal north-ern and central regions, with a duration of 8-11 days; howeverthe greatest values of the number of consecutive days withminimum temperature ≥ 20ºC occurred in central and south-ern inner regions.
Weather stress index The weather stress index (WSI) is related to human physio-logical discomfort, and is based on the calculation of NetEffective Temperature (NET). The parameters used in the NETcomputation are temperature, relative humidity and wind, allof which are derived from numerical weather predictionmodels. The effective temperature (the NET predecessor),initially proposed by Missenard in 1937,25 included the rela-tive humidity effects, but was limited to hot conditions.Modifications by Gregorczuk26 incorporated the wind effectand generalized its use to include cold conditions.
The NET is consistent with common human perception:• In hot weather, the NET increases with increasing temper-
ature and/or relative humidity, and decreases withincreasing wind
• In cold weather, the NET decreases with decreasingtemperature and with increasing relative humidity and/orwind.
This is an important advantage over less complex indexes usingonly the temperature, and over more complex indexes thatrequire parameters, such as radiation, which are difficult toforecast.
The WSI is a percentile derived from the ‘NET climatology’.For example, a day with a WSI=99 per cent means that only 1per cent of the days in the analysed period had a NET greaterthan the NET calculated for that day. Similarly, a day with aWSI=1 per cent means that only 1 per cent of the days had asmaller NET. Extreme values of WSI are correlated withextreme physiological discomfort, and therefore the WSI canbe used as a risk index in bioclimatic studies.
The effect of global climate change, and specifically of globalwarming on population health is an important issue for allprofessional groups that work in the field of public health. Thetask of predicting the consequences and reducing the effectsof continuing global warming upon the health of the popula-tion must continue. With insight and application, many of thehealth impacts of extreme weather events can, in fact, beprevented.
NET = 37 -37 - T
-0-29T (1-0.01RH)
0.68-0.0014RH + 11.76+1.4v0.75
T is the dry thermometer temperature in degrees Celsius.v is the wind speed in metres per secondRH is the relative humidity in per cent
Source: IM Portugal
Calculation of NET Effective Temperature (NET)
Source: IM Portugal
iCARO Surveillance System
2.Econ & social issues & perspectives:Master spread 16/2/07 10:04 Page 89
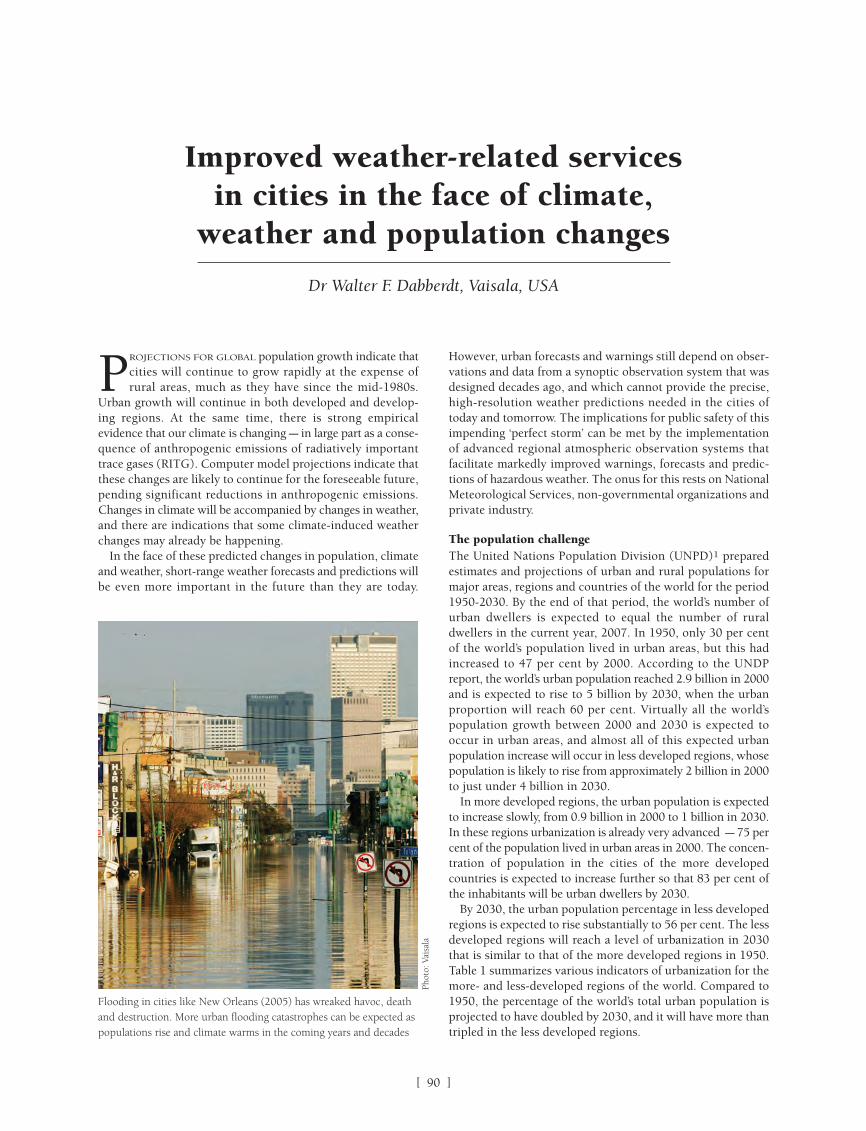
[ ]90
PROJECTIONS FOR GLOBAL population growth indicate thatcities will continue to grow rapidly at the expense ofrural areas, much as they have since the mid-1980s.
Urban growth will continue in both developed and develop-ing regions. At the same time, there is strong empiricalevidence that our climate is changing – in large part as a conse-quence of anthropogenic emissions of radiatively importanttrace gases (RITG). Computer model projections indicate thatthese changes are likely to continue for the foreseeable future,pending significant reductions in anthropogenic emissions.Changes in climate will be accompanied by changes in weather,and there are indications that some climate-induced weatherchanges may already be happening.
In the face of these predicted changes in population, climateand weather, short-range weather forecasts and predictions willbe even more important in the future than they are today.
However, urban forecasts and warnings still depend on obser-vations and data from a synoptic observation system that wasdesigned decades ago, and which cannot provide the precise,high-resolution weather predictions needed in the cities oftoday and tomorrow. The implications for public safety of thisimpending ‘perfect storm’ can be met by the implementationof advanced regional atmospheric observation systems thatfacilitate markedly improved warnings, forecasts and predic-tions of hazardous weather. The onus for this rests on NationalMeteorological Services, non-governmental organizations andprivate industry.
The population challengeThe United Nations Population Division (UNPD)1 preparedestimates and projections of urban and rural populations formajor areas, regions and countries of the world for the period1950-2030. By the end of that period, the world’s number ofurban dwellers is expected to equal the number of ruraldwellers in the current year, 2007. In 1950, only 30 per centof the world’s population lived in urban areas, but this hadincreased to 47 per cent by 2000. According to the UNDPreport, the world’s urban population reached 2.9 billion in 2000and is expected to rise to 5 billion by 2030, when the urbanproportion will reach 60 per cent. Virtually all the world’spopulation growth between 2000 and 2030 is expected tooccur in urban areas, and almost all of this expected urbanpopulation increase will occur in less developed regions, whosepopulation is likely to rise from approximately 2 billion in 2000to just under 4 billion in 2030.
In more developed regions, the urban population is expectedto increase slowly, from 0.9 billion in 2000 to 1 billion in 2030.In these regions urbanization is already very advanced – 75 percent of the population lived in urban areas in 2000. The concen-tration of population in the cities of the more developedcountries is expected to increase further so that 83 per cent ofthe inhabitants will be urban dwellers by 2030.
By 2030, the urban population percentage in less developedregions is expected to rise substantially to 56 per cent. The lessdeveloped regions will reach a level of urbanization in 2030that is similar to that of the more developed regions in 1950.Table 1 summarizes various indicators of urbanization for themore- and less-developed regions of the world. Compared to1950, the percentage of the world’s total urban population isprojected to have doubled by 2030, and it will have more thantripled in the less developed regions.
Improved weather-related services in cities in the face of climate,
weather and population changes
Dr Walter F. Dabberdt, Vaisala, USA
Flooding in cities like New Orleans (2005) has wreaked havoc, deathand destruction. More urban flooding catastrophes can be expected aspopulations rise and climate warms in the coming years and decades
Phot
o: V
aisa
la
2.Econ & social issues & perspectives:Master spread 16/2/07 10:05 Page 90

[ ]91
surfaces; anthropogenic emissions of sensible heat; and changesin the air-land exchange of water and the corresponding impacton the radiation budget. Changes in surface roughness in urbanareas also affect the exchange of heat, mass, and momentumbetween the surface and the atmosphere, as well as the depthof the urban mixed layer. Hydrological processes are altered toa significant degree by the effect of buildings and pavements onsurface moisture, runoff and streamflow. There are also someindications6 that large urban areas may influence the genesis,intensity, and movement of convective storms and frontalboundaries.
Weather impacts urban areas and urban residents in manyways. Heavy rains can cause severe flooding, snow and freez-ing rain can disrupt transportation systems, severe storms cancause power failures, and so forth. The major direct impact onhuman mortality results from heat waves, and urban areas areparticularly vulnerable because of their high population densi-ties and because urban areas exacerbate conditions that leadto heat stress. An analysis of deaths from various weatherconditions in the United States in the twentieth century clearlyshowed that heat waves caused more deaths, both on an annualaverage basis and from single events, than all other weatherconditions combined.7 The temperature-mortality relationshiphas a strong latitudinal dependence, with mortality rates innorthern cities affected more by higher temperatures, and insouthern cities by lower temperatures.
As the resolution increases in mesoscale prediction models,it will be ever more important to properly represent urbaninfluences on the radiation budget, surface moisture, sensibleheat exchange processes, and anthropogenic heat and mois-ture fluxes. This also means that weather observation networkswill need to be enhanced in order to provide the three-dimen-sional observations required to properly initialize the models,but also to provide improved information on weather condi-tions in cities.
Enhanced urban weather observations and forecastsAs important as weather observations and forecasts are today,they will be even more critical in the future, as urban popu-lation growth contributes to changes in global and regionalclimates. The importance of observation systems suitable fortomorrow’s cities is receiving international attention. Forexample, the Global Earth Observation System of Systems(GEOSS) has included a new task in its GEO 2007-2009 workplan.8 Task US-07-01, Nowcasting and Forecasting UserApplications, seeks to “facilitate the transfer of advancednowcasting and forecasting capabilities from and to majorcities in developed and developing countries [by building]upon the Helsinki Testbed experience to develop user appli-cations related to precision weather forecasts, severe weather
Earth’s changing climate and urban weatherOver the past decade, the climate change debate has shifteddramatically. In the early 1990s, the questions being askedwere: “Is the climate really changing?” and “Is there a percep-tible contribution from human activities?” Today, the questionsare very different: “Will the climate change gradually orabruptly?”; “How can anthropogenic impacts on climate bediminished or reversed?” and “Will the frequency and inten-sity of severe weather episodes change, and what will be thesocio-economic impacts?”
In 1988, the World Meteorological Organization and theUnited Nations Environment Programme established theIntergovernmental Panel on Climate Change (IPCC). The roleof the IPCC is to assess scientific, technical and socio-economicinformation relevant to the risk of human-induced climatechange, its potential impacts, and options for adaptation andmitigation. The IPCC’s assessments are undertaken by hundredsof global experts who base their analyses on peer reviewed,scientific and technical literature. The third and most recentIPCC assessment report was completed in 20012 and the fourthassessment is scheduled for completion in 2007. The IPCC’sprojected changes in climate have been summarized in Table2.3 They predict profound socio-economic implications as aconsequence of higher temperatures; increased heat indices;more intense precipitation events; increased risk of drought;and increased severity of tropical cyclones.
The urban weather problem is multidimensional. Weatherhas special and significant impacts on those who live in largeurban areas4. Conversely, large urban areas can impact the localweather and hydrologic processes in various ways. And urbandwellers have different weather information needs than theirrural counterparts, due to the diversity of user groups andpopulation sectors. These include the following:
• the general public • air quality management agencies • water supply and sewage providers• electric power industry• fuel suppliers – natural gas, fuel oil, coal, gasoline• transportation sectors – aviation, marine, and surface• emergency response agencies• public safety agencies• insurance companies and underwriters• health care providers• recreation facility providers.
Urban heat islands can yield temperatures that are up to 5degrees Celsius greater than their rural counterparts, but night-time differences up to 12 degrees Celsius have been observed.5
These increased temperatures result from the combined effectsof the thermal and radiative properties of buildings and road
Table 1: Urban indicators
Urban Percentage Urbanization rate (%) Doubling time (years)
1950 1975 2000 2030 1950-2000 2000-2030 1950-2000 2000-2030
29.8 37.9 47.2 60.2 0.92 0.81 75 86
54.9 70.0 75.4 82.6 0.63 0.31 ... ...
17.8 26.8 40.4 56.4 1.63 1.11 42 62
World
MDR*
LDR*
* MDR = More developed regions *LDR = Less developed regions
Source: UNPD, 2001
2.Econ & social issues & perspectives:Master spread 16/2/07 10:05 Page 91

[ ]92
warnings, hydrology (including flood control), air-qualityforecasting, chemical emergency response, transportationsafety, and energy management… The Helsinki Testbed9 is aFinnish initiative aimed at developing enhanced three-dimen-sional mesoscale observation networks critical to theadvancement of modeling systems and related user applica-tions. It is a public-private-academic partnership. Theprogram is open to all interested parties and the data is freelyaccessible through the Internet. Related stakeholder groupsinclude homeland security, agriculture, insurance, urbanmanagement, coastal zone management, media, and publicsafety.”
A recent community workshop10 with international partic-ipation considered the requirements of effective mesoscalemeasurement networks, and concluded that: “existingmesoscale measurement networks do not provide observa-tions of the type, frequency, and density that are required tooptimize mesoscale predictions and nowcasts. To be viable,three-dimensional mesoscale observation networks mustserve multiple applications, and the public, private, and acad-emic sectors must all actively participate in their design andimplementation as well as in the creation and delivery ofvalue-added products. The [urban] measurement challengecan best be met by an integrated approach that considers allelements of an end-to-end solution: identifying end users andtheir needs; designing an optimal mix of observations; defin-ing the balance between static and dynamic (targeted oradaptive) sampling strategies; ensuring data standards anddata quality, establishing long-term testbeds (such as evalu-ation and demonstration programs); and developing effectiveimplementation strategies.”
The challenge is to determine the most effective mix of obser-vations, including alternative network configurations andsampling strategies. For example, in improving mesoscale
analyses and predictions, it may be more cost effective tosample only the boundary layer, with denser coverage, than tosimilarly enhance observations in the upper troposphere. Itmay be more cost effective to deploy intermittent, targetedobservations at high resolution than to maintain dense arraysof continuous sensors. Regional testbeds are an intermediatestep needed to provide answers to these and other questions.Testbeds must carefully gauge the value of forecast productsprovided to end users.
Improved mesoscale observations present many chal-lenges. For example, the top observational priority foroperational nowcasting is to establish a dense mesoscalenetwork of surface weather stations to measure winds andstate variables and provide real-time sub-hourly reports.Minimum station spacing in urban areas should be 10 kmor less, and the reporting frequency should be every fiveminutes or less. Radar is an invaluable tool for nowcastingapplications, yet the current operational systems have notkept pace with technological advances. Dual-polarizationcapability should be implemented on existing radars, andprivate and academic radars should be integrated into oper-ational networks. Consideration should also be given todeploying X-band polarimetric radars, as well as techniquesfor improving boundary layer coverage through the use ofclosely spaced, low power X-band radars. Radar refractivitymeasurements should be evaluated as a possible tool forimproving nowcasting by sensing moisture discontinuities.Products detailing near-surface water vapour fields shouldbe provided in real time to forecasters and assimilated intomodels to demonstrate their potential to improve nowcast-ing. There is also a pressing need to provide boundary layerobservations using radio frequency (RF) wind profilers. Notonly are additional observation systems required – includ-ing in situ and remote sensors, both earth- and satellite-based
500
1000
1500
2000
2500
3000
3500
4000
4500
01950
Popu
latio
n (m
illio
ns)
Urban-more developed regions Rural-more developed regions Urban-less developed regions Rural-less developed regions
1955 1960 1965 1970 1975 1980 1985 1990 2000 2005 2010 2015 2020 2025 2030
Urban and rural population of the more and less developed regions, 1950-2030
Source: UNPD, 2001
2.Econ & social issues & perspectives:Master spread 16/2/07 10:05 Page 92

– there is also a critical need to seamlessly integrate datafrom all of the disparate observation systems to extractmaximal information.
Projects like the Helsinki Testbed are a valuable interme-diate step in designing networks and sampling strategies;evaluating new observation systems; setting data-qualitystandards; creating products that better meet user needs; andtesting the ability of the public, private, and academic sectorsto form effective partnerships to enable operationalmesoscale networks. Successful testbeds should meet thefollowing criteria:
• Address the detection, monitoring, and prediction ofregional phenomena
• Engage experts in the relevant phenomena• Define expected products and outcomes, and establish
criteria for measuring success • Provide specialised observation networks for pilot studies
and research• Define strategies for achieving the expected outcomes• Involve stakeholders in planning, operation, and evalua-
tion of the testbeds.
The implementation of advanced 3D mesoscale measurementnetworks entails many practical issues in addition to the tech-nical and scientific ones. A national collection of regional andurban networks will require a significant commitment and amajor infusion of financial resources. In many countries, themost viable model for developing and supporting operationalmesoscale networks leans toward a consortium of public,private and academic partners. In the old paradigm of synop-tic-scale networks, government took responsibility for allaspects of the observational problem – design, testing, stan-dard-setting, quality assurance, implementation, and operation.But with the reduction in scale size demanding more and
improved observations, and improved sampling strategies andmodeling systems, a partnership approach may offer the great-est likelihood of successful and timely implementation.Establishing one or more end-to-end mesoscale testbeds is atangible first step in establishing the urban networks neededby the world’s growing cities.
[ ]93
Table 2: PCC estimates of confidence in observed and projected changes in extreme weather and climate events
Changes in phenomena Confidence in observed changes Confidence in projected changes(latter half of the 20th century) (during the 21st century)
Higher maximum temperatures and more hot Likely Very Likely days over nearly all land areas
Higher minimum temperatures, fewer cold days Very Likely Very Likelyand frost days over nearly all land areas
Reduced diurnal temperature range Very Likely Very Likelyover most land areas
Increase of heat index (a measure of human Likely, over many areas Very Likely, over most areas discomfort) over land areas
More intense precipitation events Likely, over many Northern Hemisphere Very Likely, over many areas mid- to high latitude land areas
Increased summer continental drying Likely, in a few areas Likely, over most midlatitude continental interiors and associated risk of drought (lack of consistent projections in other areas)
Increase in tropical cyclone peak wind intensities Not observed in the few analyses available Likely, over some areas
Increase in tropical cyclone mean and peak Insufficient data for assessment Likely, over some areas precipitation intensities
Virtually certain: greater than 99% chance that a result is true; Very likely: 90–99% chance; Likely: 66–90% chance; Medium likelihood: 33–66% chanceUnlikely: 10-33% chance; Very unlikely: 1–10% chance; Exceptionally unlikely: less than 1% chance.
Source: McBean and Henstra, 2003
One example of urban smog – Kuala Lumpur, Malaysia
Phot
o: V
aisa
la
2.Econ & social issues & perspectives:Master spread 16/2/07 10:05 Page 93

[ ]94
ENERGY IS A global trillion-dollar sector that includes bothnon-renewable (oil, gas, coal) and renewable(hydropower, solar, wind, geothermal, biomass)
resources. It covers a wide range of activities, from energyresources exploration, extraction, storage and transport, toelectricity production, transport and distribution.1 It is alsocharacterized by industrial competitiveness and its influence onpolitical, economic and strategic decisions. An optimal andcost effective management of the energy sector is crucial fornational and global economies and development.
Between 1973 and 2004, global energy consumptionincreased by 66 per cent and there has been a three-fold multi-plication of the generation of electricity.2 Over the next 30 years,global electricity demand is expected to double, and it is antic-ipated that the global primary demand for energy will expandby about 60 per cent. Two-thirds of this increase will concernthe developing world, mostly India and China. Fossil fuels will
continue to dominate the global energy mix, raising questionsabout the sustainability of the current energy system.3
The energy sector is highly dependent on climate conditionsand water resources, whatever the particular field of activity,means of production or timescale. Moreover, the rising use ofrenewable energy, while desirable to mitigate the effects ofclimate change, will make energy production and distributionincreasingly dependent on climate conditions.4
Weather, climate and water information are very importantin short- and medium-term energy management processes.Extreme events such as heat or cold waves, windstorms orfloods can have major impacts on production units and elec-trical grids, but ‘normal’ weather variations also have an impacton load level, production capacity, transport and distribution.For example, a temperature anomaly of minus one degreeCelsius in winter in France corresponds to an increase inproduction of 1,500 megawatts, equivalent to the capacity of
Weather, climate and water information and the energy sector
Dr Laurent Dubus, EDF R&D
Energy operations aided by reductions in environmental forecast uncertainty
Source: Courtesy of M.G. Altalo, Science Applications International Corp.
Forecast lead time
Fore
cast
unc
erta
inty
Minutes
6-10 days
8-14 days
MonthsSeasons Years
Hours
• Tariff calling • Utility grid management • Wind generation dispatch • Hydro supply management • Ship/tanker routing • Refining operations management • Pipeline laying logistics
• Customer billing service • Pump load forecasting • Fuel supply forecasting • Energy switching strategy • Distributed generat. management • Maintenance scheduling • Sequestration timing • Inventory management • Pipeline throughput management
• Sales/earnings forecasting • Energy storage replenishment strategies •‘Flexible’ energy production and delivery • Storage requirements needs assessment • Storage logistics planning • Regional energy management planning • Stockpile planning • Seasonal demand forecasts • Delivery rate setting • Hydro regional water management strategy• Compliance projections estimates
• Infrastructure design • Regional infrastructure plan • New storage capacity plans • Mitigation strategy design • Plant/infrastructure siting • Energy grid adaptation plans • Energy policy setting
• Load balancing • Electricity pricing/trading • Outage/surge management • ‘Intelligent’ infrastructure • ‘Neck’ metering • Dispatch management • Hazard response • Platform operations
Forecast uncertainty
Critical forecast periodsSub day, 2-4 day, 90 day
2.Econ & social issues & perspectives:Master spread 16/2/07 10:05 Page 94

[ ]95
In developed countries, the energy sector is one of the biggestusers of earth observation products and weather forecasts. Thepriority over the next decade is to promote a better and shareduse of existing data and forecast information, and to prepare theindustry to use new products as they become available. Thesewill include medium-term weather predictions (notably ensem-ble predictions) and atmospheric environment monitoringproducts.
Optimizing information deliveryDue to the complexity of energy systems management, it isimportant for energy companies and NMHS to collaborate. Thelevel of weather, climate and water information needed in theenergy sector is high, and it is necessary to master complexinformation such as ensemble forecasting. Energy sector person-nel have to deal with very diverse problems, and do not alwayshave the necessary expertise in earth sciences. It is thereforedesirable to establish an intermediary between disciplines.
User training is also important, in order to ensure an up-to-date knowledge of products and services and to identifypotential future developments of interest to the sector. A coor-dination team should be formally set in place, and regularmeetings with feedback and event review mechanisms shouldbe planned, in order to maintain good communication.
Bridging gaps between users and providersThere are many challenges ahead in improving and rationaliz-ing the use of weather, climate and water information in thedevelopment of environmentally responsible and equitableenergy systems. These challenges include:
• Raising awareness among the general public, scientistsand decision-makers about the potential impacts of energyconsumption on climate and environment
• Ensuring recognition that advances will require an invest-ment in research to improve scientific and technicalcapabilities
• Ensuring recognition that resources for HMS are invest-ments that are highly beneficial to the energy sector, andto society, rather than needless expenditures
• Maintaining and developing the operational capability ofthe service providers
• Ensuring that the users are aware of and understand thelimitations of data and forecasting and warning systems
• Developing the use of short-, medium- and long-termweather and climate forecasts, with a particular focus onensemble predictions
• Understanding that failures will occur, but that the appli-cation of risk management approaches can minimize thepossible impacts, and that doing nothing will always beworse.
In conclusion, energy is a prerequisite for economic and socialdevelopment. It will therefore be a crucial element in theUnited Nations Millennium Development Goals.7 Efforts fromNMHS and energy companies and agencies will be necessaryat both local and national levels, to meet each country’s needs.However, regional and international efforts will also be essen-tial to ensure a global, equitable and sustainable developmentof energy systems. Here, international organizations like theWorld Meteorological Organization, The Group on EarthObservation, and the International Energy Agency will have amajor role to play.
one nuclear reactor or about 500-700 windmills. In the USA,electricity generators save USD166 million annually, using 24-hour temperature forecasts to manage the available mix ofgenerating units.5 Finally, archive data and future climatescenarios, including both mean trends and extreme values, areessential to long-term supply planning, production unit dimen-sioning, and therefore to investment decisions.
Issues and concerns for information providers and userexpectationsBy 2030, the investment needed to meet projected demand islikely to be around USD16 trillion, with half of this amountneeded for developing countries.6 Reducing the risks associatedwith those investments and with the management of energysystems is crucial. Weather, climate and water information havea major role to play. Vital issues include environmentally respon-sible and equitable energy management, a better match of energysupply and demand, a reduction of risk to energy infrastructure,more accurate inventory of greenhouse gases and pollutants,and a better understanding of renewable energy potential.
In developing countries, the vital issues are energy accessand reliability, with efficient energy management being asecondary issue. For many of these countries climate variabil-ity and risks are significant. Weather, climate and waterinformation are therefore crucial for the development andsafety of their energy systems. The primary concern for NMHSis to provide databases that help to establish sites and dimen-sion future grids and production units (especially those basedon renewable resources). Secondary concerns include provid-ing services in the short- and medium-term management ofenergy systems, and issuing warnings to minimize the impactof rare meteorological events.
Tignes lake and dam (France)
Phot
o: L
a m
edia
theq
ue E
DF/
Joha
nn R
ouss
elot
2.Econ & social issues & perspectives:Master spread 16/2/07 10:05 Page 95

[ ]96
HEAT SUPPLY MANAGERS need sound scientific informa-tion on which to base their decisions. In order toachieve this, in 2000 the Beijing Meteorological Bureau
has initiated a study of the benefits of meteorological services,focusing on energy saving in the heat supply market, particu-larly during the winter months. Through preliminaryapplications in the heat supply market, the findings of this studyhave been proven to have clear impacts on the heating sector.The meteorological information can be used as a basis forhousehold heating management. Also targets for both energy-saving and pollution reduction are achievable through theprovision of dedicated meteorological services. On average,approximately CNY 100 million Yuan (USD12.5 million) can besaved annually in the heating sector alone.
Basic features of the heat supply in BeijingNormally, the winter heating season begins on 15 Novemberevery year, and ends on 15 March the following year. However,according to the climatic situation at the time, these dates canvary. In so-called ‘warm winters,’ the intensity of heating levelsweakens to a larger extent and, in general, it seems that thelength of annual heat supply is being shortened.
Although more clean energies (e.g. hydro-power, natural gas,etc.) are being progressively used and overall power or gas
consumption is increasing, municipal heating still dependsmostly on coal burning, and annual coal consumption is up toeight million tons. Coal burning is a major source of sulphurdioxide and suspended particles, and therefore it is also themain source of air pollution during the winter in Beijing.
Outstanding issues in the application of meteorologicalinformation to the heating sectorA number of factors have an impact on the heat supply and energysaving.The heat supply industry has yet to attach enough impor-tance to the potential of meteorological services in this context. Atthe same time, meteorological information is too generalised totarget the sector, and thus gives it an inaccurate description ofchanging weather. Another main factor is the irrational scheduleof heat supplies, which often leads to a waste of energy.
More specifically, a public weather forecast gives the dailymaximum and minimum temperatures. The average of these isthe mean daily temperature, and its deviation from the situmean temperature differs by one degree Centigrade, and in somecases even by two or three degrees Centigrade. Obviously, suchinformation leaves too much doubt to be used as a basis foradjusting both inflow and outflow heat temperatures.
The public weather forecast is so inadequately refined that itcannot be downscaled to cover all temperature differences at
Meteorological services and the social and economic benefits of energy saving
in the Beijing heat supply
Xie Pu and Duan Yuxiao, Beijing Meteorological Bureau, Beijing, China
A total of 800 tons of coal has to be burned in order to keep households warm enough within the Beijing municipality
2.Econ & social issues & perspectives:Master spread 16/2/07 10:05 Page 96

[ ]97
particles. Again taking 1998 as an example, a total of 800 tonsof coal has to be burned in order to keep households warmenough within the Beijing municipality. Supposing five percent of coal is saved, this means a saving of 400,000 tons ofcoal – the emissions of sulphur dioxide, nitrogen oxide, NOxand total suspended particles can be reduced by 4,600, 3,080and 4,560 tons respectively in one season, which will make asignificant contribution to the effort to reverse aggravatingpollutants over the capital.
Meteorological offices at various levels keep a close watch onthe changing weather and climate and provide more special-ized, refined and targeted meteorological information, whichcan be used by heat suppliers and relevant decision makers asa useful scientific reference to control the heating facilities, allaimed at maintaining more comfortable living conditions. Thisdemonstrates the meteorological offices’ awareness that thewell-being of people is their fundamental interest.
Meteorological products for winter heatingTemperature, total solar radiation, temperature rise and net solarradiation all have negative effects on heat supply capacity fore-casts. During daytime, the effect of temperature accounts for60 per cent while that of solar radiation amounts to 18.8 percent – hence solar radiation is a factor that must be consideredin forecasting daytime heat supply capacity. However, at nightthe effect of temperature contributes 80 per cent so that theeffect of solar radiation is negligible.
Wind speed also has an effect. Temperature drop caused byhigh winds has a significant impact on a heat supply capacityforecast, and increased wind speed has a positive effect on theforecast. On 4 December 2005, a temperature drop caused bystrong winds made natural gas consumption soar from anaverage of 14 million metres3 per day to 21.85 million metres3
per day.Humidity can affect the speed of heat transfer for outer walls.
The effect of humidity on the forecast differs during day andnight. In daytime, due to solar radiation, the greater the humid-ity, the more heat will be absorbed by outer walls. Therefore,heat release from the room would be slowed down and less heatsupply capacity is needed. On the contrary, at night the greaterthe humidity, the easier it is for heat to be released from theinside to the outside of the outer wall.
Temporal and spatial resolutions of weather forecastproductsThe time validity of forecasts is as follows: forecasts of meandiurnal temperature cover one to three days; weather elementforecasts for morning, noon and evening are issued twice a day;three to five-day forecasts are given for the beginning and endof the heating season; and significant weather forecasts areproduced on an irregular basis.
There are also localized forecasts – the city is divided intofour zones: northeast, northwest, southeast and southwest.Location-specific forecasts on water temperature of inflow andoutflow pipes will be updated according to the heat island effectof each zone.
Application of meteorological information to the heat supply Firstly, a monitoring network needs to be set up for collectinginformation and data, such as indoor temperature in theneighbourhood, ambient temperature and wind speed, as well
any specific localities in different periods of a day within themunicipality, particularly for a winter morning. For example, inthe various segments within Ring Road 4, the maximum airtemperature difference may vary from three to four degreesCentigrade in the same day, and this variation is expected to beeven larger across the outskirts of Beijing.
The elements in the public weather forecast do not satisfydemand. Apart from air temperatures, solar radiation, windintensity and other factors are also relevant.
Benefits of a meteorological service dedicated to theheating sectorTaking 1998 for example, the total isolated floorage scatteringwithin the city is up to 121 million metres2, and the coalconsumption is 0.026 ton per square metre, with a cost of aboutCNY 600 million. On condition that the specialized meteoro-logical information is appropriately used to keep the householdindoor temperature no lower than 16 degrees Centigrade, itmeans that energy can be saved by five per cent, saving at least156,000 tons of coal or equivalent to 30 million CNY annually.Similarly, it can be estimated that the benefits of energy savingfrom central heating facilities will also be substantial. Somespecific cases are given below to illustrate the practicaleconomic benefits made through energy saving, based on mete-orological services by four companies in Beijing:
1. Beijing Heat Supply Group – heat supply floorage 9,000metres2. It is estimated that the company can save approx-imately 17 million giga joules per year, which equates toCNY 42.427 – a saving of 5.3 per cent in terms of energyor 89,500 tons of coal, giving a 430-ton reduction insulphur dioxide emissions and an additional reduction of4475.4 tons of soot annually.
2. The Beijing Aircraft Maintenance Engineering Company – aSino-German joint venture with heating floorage of450,000 metres2. Appropriate application of householdheating-oriented weather forecasts for scheduling thecompany’s heat-generation boilers and for controlling thetemperature adjustment range of both heat inflow andoutflow pipes provided by a local meteorological office,saves about 800 tons of coal compared with normal heatingseasons, with an energy saving rate up to 14 per cent.
3. Beijing Yanqing Heat Supply Company – the heating floor-age is 300,000 metres2. The enterprise acceptedheating-oriented weather information by strictly followingthe heating index issued by a meteorological office, adjust-ing the outflow temperature and controlling inflow watertemperature. As a result, it saved 0.006 ton per metres2 interms of coal consumption while ensuring that all house-holds enjoy a comfortable and warm indoor temperature.This practice saves CNY1.2 per square metre, or around1,800 tons of coal in one heating season alone.
4. The Hengyouyuan S/T Development Company introduced anationally advanced geothermal heating technology. Itstotal heated floorage of 2.4 million metres2 is distributedin different locations surrounding Beijing. By applyingdedicated meteorological information, energy consump-tion (electricity) has been reduced by 5.3 per cent incomparison with the annual average.
According to the national Category 2 Emission Criteria,combustion of one ton of coal releases 11.5 kg of sulphurdioxide, 7.7 kg of nitrogen oxide and 11.4 kg of suspended
2.Econ & social issues & perspectives:Master spread 16/2/07 10:05 Page 97
[ ]98
as the temperature of inflow water and outflow water to andfrom boilers.
Secondly, short-term and medium-term forecast numericalmodels are created for predicting both inflow and outflow watertemperature on the basis of the collected information and dataanalyses.
Thirdly, a one to three-day diurnal temperature forecastmodel is established considering the local heat island effect.
A model for revealing the relationship of the energy-savingtemperature to heat supply in function of weather conditions isthen developed, based on thermodynamic and meteorologicalprinciples, and the energy-saving indices are established.
Finally, a management system that incorporates heat supplymonitoring and weather forecasting is established; respectiveoperational platforms are created at relevant meteorologicaloffices for producing one to three-day weather forecast andenergy-saving temperature and heat-supply indices, andweather information application terminals are installed atheat suppliers. This will constitute a complete meteorologi-cal forecast system for winter heating sectors in Beijing, whichwill provide professional services for energy saving from heatsupplies.
Applications by heat suppliersAt the application terminals, the forecasts continue to beupdated every 12 hours, including diurnal air temperatures(daytime and night time means, maximum, minimum and dailymeans), heat-supply related weather indices, thermal parame-ter forecasts, indoor and outdoor temperatures as well astemperatures of both inflow and outflow water for the next oneto three days. With this information, in particular the temper-ature of the water cycle for the next few days, heat supplymanagers will be in a better position to calculate the total heatsupply capacity needed for a specific day, to adjust the temper-ature of supplied water, and to anticipate the amount of fuel tobe used. This will improve heating quality, energy-saving effi-ciency and pollution reduction.
Medium- and long-range forecasts and three to five-day fore-casts for both the beginning and end of a heating season willfacilitate proper arrangements of fuel procurement and storage,which helps to maximize capital use.
Assessment of the benefits of meteorological services forheat supplyAssessments and analysis of the benefits of meteorologicalservices from energy saving in various heat suppliers, indicatethe following:
Meteorological Services can improve the energy efficiency ofthe heat supply. Weather monitoring and forecasts providescientific guidance for the heating industry at both the macroand micro levels. It is helpful to carry out heating operationsin a more targeted and timely manner, and to achieve the bestheating efficiency in a most cost-effective fashion.
Apart from the temperature, wind speed, humidity, solar radi-ation, cloud cover and precipitation, other meteorologicalelements also have an impact on the heat supply. The meteo-rological offices need to develop forecasts about additionalmeteorological elements in order to achieve greater benefits forenergy-efficient heating.
As heat supply is a weather-sensitive sector, not only arenowcasting and short-term weather forecasts useful for deci-sion-makers in the heating sector, but medium- and long-range
forecasts are also playing an increasing role along with the devel-opment of forecasting capabilities.
Due to urban heat island effects and the different underlyingimpacts, the existing forecasts by zone and the 24-hour meantemperature forecast in the forthcoming one to three days doesnot satisfy the actual demands for different zones during heatsupply season. With the rise of living standards and social-economic development, there is an imperative need for morerefined and specific meteorological services.
Suggestions for improving meteorological services forenergy-saving heat supplyEnhance communication with end users – meteorologicalinformation itself does not create values. Only its application bythe users can achieve significant socio-economic benefits.Therefore, meteorological offices should proactively commu-nicate with users, investigating their changing needs in order toprovide targeted meteorological information that meets theirdemands.
Providing further guidance to users on the use of meteorologicalinformation – meteorological services yield added value whenusers are fully utilizing them while avoiding their potentialrisks. It is also vital that users know when such information isdisseminated. Therefore, meteorological offices should have aclear understanding as to how users apply meteorological infor-mation and provide them with guidance in their practicaldecision-making process.
Enhance the combination of scientific research with operationalapplications – including faster transfer of scientific research tooperations. Market-oriented demands and service-orientedproducts imply that meteorological services have tremendouseconomic potential for the heat supply industry. However, thesimplicity of existing meteorological information can no longermeet user needs, and current service products remain inade-quate in terms of their depth, comprehensiveness, refinementand flexibility. Personalized weather information can yield bene-fits only after this information is processed and analysedaccording to user requirements.
Meteorological Services bring about tremendous benefits forenergy saving in the heating sector. Regardless of the fuel usedfor heating – be it coal, electricity or natural gas – the heatingindustry consumes energy. According to 2001 statistics, theapplication of meteorological services to heat supply could savethree to five per cent of the energy consumed. Based on anaverage saving of four per cent, CNY 144 million can be savedin Beijing in terms of expenditure on energy consumption everyyear, while the ecological and environmental benefits can besignificantly increased.
In addition, there is considerable market potential for specialmeteorological services. Although only a few large heatingcorporations currently take full advantage of the meteorolog-ical forecast, there will be growing demand for meteorologicalinformation from various sectors. Meteorological offices willplay an increasingly important role in various nationaleconomic sectors. In the rapid socio-economic developmentprocess, and with improved meteorological offices, the generalpublic has an increasingly greater awareness about risks andthey will increasingly depend on meteorological information.In particular, some weather-sensitive companies have realizedthat if they want to remain well placed in the competitivemarket, they should attach greater importance to meteorolog-ical information.
2.Econ & social issues & perspectives:Master spread 16/2/07 10:05 Page 98

[ ]99
ENERGY PRODUCTION IN Iceland is primarily from renew-able sources. The primary energy supply is made up of55 per cent geothermal, 16 per cent hydropower and 29
per cent fossil fuels. About 81 per cent of the production ofelectricity is from hydropower. Hydropower is highly depen-dent on runoff from ice caps and glaciers, which cover about11 per cent of Iceland and receive about 20 per cent of theprecipitation that falls on the country. They store, in the formof ice, the equivalent of 15–20 years of annual average precip-itation over the whole country. Substantial changes in thevolume of glacier ice may, therefore, lead to large changes in thehydrology of glacial rivers, with important implications for thehydropower industry and other water users. Glacial runoff isparticularly important for the hydropower industry becausehydropower plants use runoff from highland areas, where glac-iers tend to be located.
The consequences of climate change for the Nordic Energysector, in particular for the use of renewable energy sources, havebeen investigated in several collaborative Nordic researchprojects, the most recent of which is Climate and Energy (CE),which was financed by Nordic Energy Research under the Nordic
Council of Ministers. The main national hydrological and mete-orological institutes in the Nordic countries have in theseprojects joined forces with the energy industry to assess theimpact of climate change on the energy system and to advise theindustry regarding adaptation to long term changes in climateand water resources. This paper describes the main results ofglaciological investigations within the CE project with empha-sis on implications for the hydropower industry in Iceland.1
Role of glaciersThe effect of climate warming on glacial runoff includes an initialincrease in total runoff and peak flows, and a considerable ampli-fication in the diurnal runoff oscillation, followed by significantlyreduced runoff totals and diurnal amplitudes as the glaciersretreat. In addition to the direct effect on runoff caused by glaciermass balance changes due to variations in climate, feedbackeffects caused by glacier dynamics may lead to migration of icedivides, sub glacial watersheds and changes in sub glacial watercourses. This can in some cases cause very large relative changesin the discharge of rivers that comes from glacier margins, withimplications for bridges, roads and other infrastructure.
The effect of climate change on glaciers and hydropower in Iceland
Tómas Jóhannesson, Icelandic Meteorological Office Árni Snorrason, Hydrological Service Division, National Energy Authority
The forefields of Brikdalsbreen in western Norway (left) and an outlet glacier on the south side of the Langjökull ice cap in western Iceland (right)show clear signs of past changes in the position of the glacier margin
Phot
o: K
jøllm
oen,
200
6
Phot
o: O
ddur
Sig
urðs
son,
200
3
2.Econ & social issues & perspectives:Master spread 16/2/07 10:05 Page 99

[ ]100
Glaciers and ice caps in the Nordic countries have retreatedand advanced during historical times in response to climatechanges, which are believed to have been much smaller thanthe greenhouse-induced climate changes that are expectedduring the next 100–200 years. These changes have in manycases left clear marks on the landscape in the neighbourhoodof the glaciers.
Simulated changes in ice volume and glacial runoffSeveral ice caps and glaciers in the Nordic countries werestudied within the CE project using mass balance and dynamicmodels to project future changes in ice volume and glacialrunoff based on scenarios for future climate change.
In simulated ice wastage for the modelled glaciers, simula-tions with a 2D ice flow model are run to 2200, but theNorwegian and Swedish glaciers are only run to 2100 becauseof limitations in a simplified dynamic model used for theseglaciers. The time evolution of ice volume has a similar char-acter for the modelled glaciers, except for Engabreen in Norwayand Mårmaglaciären in Sweden. The modelled ice volume isreduced by more than half within the next 100 years, and theglaciers essentially disappear in 100–200 years after the startof the simulations, given that the rate of warming with timeremains the same. One of the Norwegian glaciers retreats moreslowly because of a substantial increase in precipitation, whichis projected by the CE scenario for the area where this glacieris located.
The projected change in the mass balance of the glaciersleads to a marked increase in runoff from the area covered byice at the start of the simulations. Due to the large amplitudeof the projected changes, the changes with respect to therunoff at the start of the simulations are similar to changeswith respect to a 1961–1990 baseline, which was not explic-itly modelled for most of the glaciers. By around 2030, annualaverage runoff is projected to have increased by approxi-mately 0.4–0.7 mw.e.a-1 for the Norwegian and Swedishglaciers, and 1.5–2.5 mw.e.a-1 for the Icelandic ice caps. Therunoff increase reaches a comparatively flat maximumbetween 2025 and 2075 (except for Engabreen in Norway)when the increasing contribution from the negative massbalance is nearly balanced by the counteracting effect due tothe diminishing area of the glacier. For all the glaciers, thismaximum in relative runoff increase is over 50 per cent withrespect to the current runoff from the area presently coveredwith ice.
For the Icelandic ice caps, the specification of a compara-tively large change in climate during the initial decades of thesimulation, based on the observed climate of recent years, andthe seasonality of the climate change with the largest warmingin spring and fall, leads to a rapid increase in runoff with time.The simulated runoff changes may be compared to averagerunoff from these ice caps between 1981 and 2000, which is inthe range 2.4–4.1 mw.e.a-1. In model results for Engabreen inNorway, although the precipitation increase for the other glac-iers is of much smaller importance than the temperaturechange, the assumed precipitation change can significantlyalter the simulation results in cases where substantial precip-itation changes take place. The fact that this only happens forone of the glaciers highlights the uncertainty of the climatechange scenario.
These results clearly suggest large changes in runoff fromglaciated areas, which are projected to have reached quite
Location of the the glaciers and ice caps studied in the CE project
significant levels compared with current runoff, well before2030. The associated changes that may be expected in diurnaland seasonal characteristics of glacial runoff will come on topof the changes in the annual average.
Hydropower is the most important renewable source of elec-tricity in Iceland and it is the renewable energy source moststrongly affected by climate. The results from the CE projectand the related national research programmes show that thisimpact can be quite strong. Global warming will shorten thewinter season, make it less stable and lengthen the ablationseason on glaciers and ice caps. This leads to a more evenlydistributed river flow over the year, which is a profitable situ-ation for the industry.
There is also potential for increased hydropower productionas the highest modelled increase in river flow is simulated inhighland areas that are most important for hydropower. Thisimplies that the projected hydrological changes may beexpected to have practical implications for the design and oper-ation of many hydroelectric power plants, and also for otheruse of water, especially from glaciated highland areas.
One negative aspect is that the new annual rhythm in runoffindicated in the simulations will put more stress on the spill-ways. They will probably have to be operated more often inwinter, as the unstable winter climate will generate morefrequent sudden inflows when reservoirs may be full. Thiswill also have an impact on the infrastructure with morefrequent flooding problems downstream at the reservoirs.These areas are normally adapted to the present-day climatewith stable winters and without high flows from autumn tospring.
In summary, the power industry needs to develop a newstrategy characterized by flexibility because it must be possi-ble to adapt the operation and even the design of power plantsas climate change leads to changes in the discharge and season-ality and other hydrological characteristics. Continued researchon climate change is essential to address the added uncertaintywith which the industry is faced due to this situation and inorder to supply the necessary information for proper adapta-tion to the evolving climate.
Imag
e: F
enge
r (
2007
)
2.Econ & social issues & perspectives:Master spread 16/2/07 10:05 Page 100
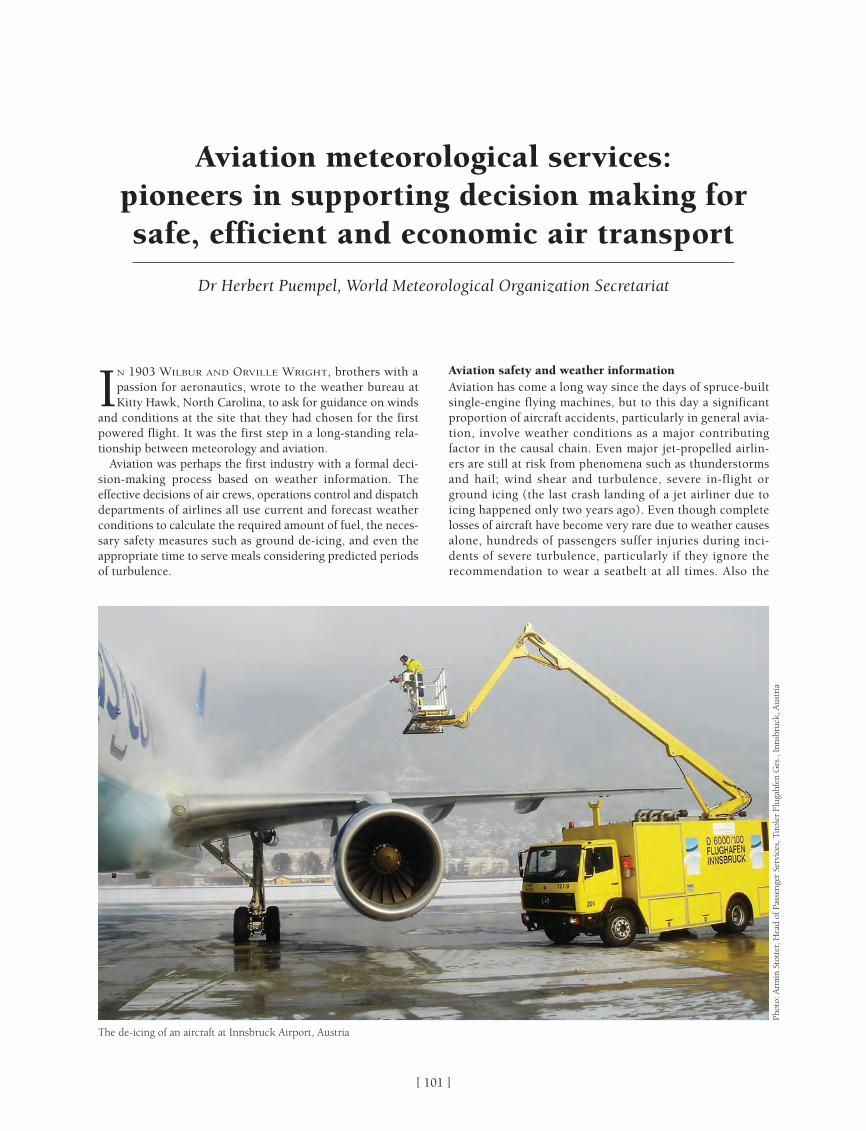
[ ]101
IN 1903 WILBUR AND ORVILLE WRIGHT, brothers with apassion for aeronautics, wrote to the weather bureau atKitty Hawk, North Carolina, to ask for guidance on winds
and conditions at the site that they had chosen for the firstpowered flight. It was the first step in a long-standing rela-tionship between meteorology and aviation.
Aviation was perhaps the first industry with a formal deci-sion-making process based on weather information. Theeffective decisions of air crews, operations control and dispatchdepartments of airlines all use current and forecast weatherconditions to calculate the required amount of fuel, the neces-sary safety measures such as ground de-icing, and even theappropriate time to serve meals considering predicted periodsof turbulence.
Aviation safety and weather informationAviation has come a long way since the days of spruce-builtsingle-engine flying machines, but to this day a significantproportion of aircraft accidents, particularly in general avia-tion, involve weather conditions as a major contributingfactor in the causal chain. Even major jet-propelled airlin-ers are still at risk from phenomena such as thunderstormsand hail; wind shear and turbulence, severe in-flight orground icing (the last crash landing of a jet airliner due toicing happened only two years ago). Even though completelosses of aircraft have become very rare due to weather causesalone, hundreds of passengers suffer injuries during inci-dents of severe turbulence, particularly if they ignore therecommendation to wear a seatbelt at all times. Also the
Aviation meteorological services: pioneers in supporting decision making forsafe, efficient and economic air transport
Dr Herbert Puempel, World Meteorological Organization Secretariat
The de-icing of an aircraft at Innsbruck Airport, Austria
Phot
o: A
rmin
Sto
tter
, Hea
d of
Pas
seng
er S
ervi
ces,
Tir
oler
Flu
gahf
en G
es.,
Inns
bruc
k, A
ustr
ia
2.Econ & social issues & perspectives:Master spread 16/2/07 10:05 Page 101
[ ]102
serious stress on pilots in severe weather has contributed tofatal pilot errors.
Advance warnings of serious weather hazards are providedduring flight planning, in the form of charts of significantweather, depicting critical areas to warn crews in good time ofexpected turbulence or convection. Proper estimation of boththe required flight time and the conditions expected at theterminal aerodrome are used to enable calculation of therequired amount of fuel, including a safety margin in case ofunexpected problems.
New challenges to aviation weather provision arise from thenon-linear dependence of acceptance rates at major hubairports on extreme forms of weather. Here, passing thresholdsthat are difficult to define a priori lead to a breakdown of airtraffic in areas around the aerodrome affected by severe, wide-spread convection or massive snowfalls. New products foradvanced planning are currently being developed by individ-ual aviation weather service providers, but internationalcoherence and coordination of such procedures will be neces-sary to avoid economic losses and delays to the travellingpublic.
Aircrews in flight are alerted by significant meteorologicalinformation (SIGMET) and airmen’s meteorological informa-tion (AIRMET) messages transmitted to the aircraft byuplinking or voice communication. In addition, new forms ofdigital communication such as automatic dependent surveil-lance broadcast (ADS-B) permit rapid, unambiguous andtargeted information on critical situations. These systemscontribute to making airline flights the safest way of travellingin terms of passenger deaths per mile travelled. The proceduresto be adhered to by all stakeholders are defined very preciselyby the International Civil Aviation Organization (ICAO) inclose cooperation with the World Meteorological Organization(WMO), with safety and security taking first priority.
Economy and regularity of aviation operations underICAO and national aviation authoritiesAviation, in terms of passenger miles flown per year, hasshown a robust growth of an average five to seven per centover the past 30 years. Short downturns following worldcrises such as oil shortages, terrorist attacks and epidemicssuch as severe acute respiratory syndrome (SARS) and AvianInfluenza have typically been compensated for by increasedgrowth during subsequent years. Growth rates of aviation aretypically linked to the speed and strength of economicgrowth, as can be currently seen in East Asia, where growthrates in double figures are now common, and aircraft arepurchased at the rate of around one per day. Despite thesehealthy growth rates, the economics of scheduled aviationare far from easy, with capacity often running ahead ofdemand, leading to a serious price war. This fierce competi-tion leads to a very detailed scrutiny of all external costs tothe airlines. Service providers, from airports and air naviga-tion services to aeronautical meteorologists, are asked toprove a positive cost-to-benefit ratio.
The growth of aviation in many areas of the world is nowlimited by the acceptance capacity of airports, which is stronglylinked to prevailing weather conditions. These acceptance ratesmay be reduced to less than half in conditions of low visibil-ity, cloud-ceiling height, thunderstorms, or with snowfall andicing. Several studies undertaken in the US and Europe haveshown a direct link between weather and air traffic delays,
leading to costs of millions of US dollars or euros for a singlelarge airport on a day affected by severe weather conditions.Although it is difficult to specify exactly what percentage oftheses losses could be avoided with the aid of accurate and reli-able weather information, it is safe to say that the potentialbenefits far outweigh the costs for the provision of theseservices.
All services to the aviation industry have to be providedunder the regulations given in the annexes of the ICAOconvention, and are subject to approval and directions by thenational or, as in the case of the emerging Single European Sky,trans-national aviation authorities. These regulations are begin-ning to have an impact on the nature of service delivery –enforcing, for example, the implementation of quality manage-ment systems, accountability and regional harmonization ofprocedures. It is expected that these regulations will furthercontribute to a restructuring of service provisions on thenational and international level.
Aviation and the environmentIncreasing concern about the effects of aviation on globalclimate change is becoming apparent from IntergovernmentalPanel on Climate Change (IPCC) assessment reports. Concernsregarding local air quality are also beginning to affect planningpermission for extensions of existing hub airports in the vicin-ity of megacities. Not only is the contribution of aviation tolevels of carbon dioxide and nitrous oxides considered, butalso the radiative forcing from aviation contrails and cirrusclouds, particularly at night, where they have a clear warmingimpact. It is expected that the inclusion of aviation in nationalinventories will be debated in future meetings of the UnitedNations Framework Convention on Climate Change(UNFCCC), Conference of Parties, and other relevant bodies.Aviation meteorology may be able to contribute to mitigatingmeasures, for example by identifying dry layers unlikely toproduce contrails and cirrus clouds, and to issues of local airquality by determining and forecasting episodes of highconcentrations of pollutants that could be used in advancetraffic planning.
User-provider cooperation and information transferThough it is clear that the potential savings based on accurateweather information are very large, the devil is, as always, inthe detail. Even a perfect weather forecast has no economicvalue if it is not used properly in the decision-making process.The formal requirements established by regulatory authorities(national and international) were designed with safety as thefirst priority, and their universal application in all states, inde-pendent of technological development, makes them a veryslowly reacting tool for economic decisions. The lack of precisestatistical data on the reliability of the forecasts, which is inpart due to antiquated code forms and product specifications,makes it difficult to use the information in an optimal statisti-cal manner. Decision making in a typical cost-loss situationrequires the full spectrum of probabilities for all event cate-gories, and full knowledge of the verification characteristics ofall forecast and warning products. In the context of itsAeronautical Meteorology Programme, WMO in close coop-eration with ICAO, will address this issue over the comingyears as a matter of priority to ensure that services to aviationcontinue to be a good investment and are viewed by the indus-try as such.
2.Econ & social issues & perspectives:Master spread 16/2/07 10:05 Page 102

[ ]103
METEOROLOGICAL INFORMATION PLAYS an essentialrole in air navigation and is required to ensure thesafety and efficiency of civil aviation operations. Most
people working in the aviation industry or meteorology arefamiliar with the effects of hazardous weather phenomena onflights. Pilots, dispatchers and air traffic controllers need obser-vations, reports and forecasts as well as warnings of suchphenomena. What is often less clear is the important effect thatseemingly ‘innocent’ meteorological elements (such as surfaceand upper winds, visibility and runway visual range, temper-atures and surface pressure) can have on the safety andefficiency of flight operations.
Information on wind direction and speed is vital for take-offand landing, and is the basis for the choice of runway. If the heador tailwind component and the crosswind components are madeavailable separately, the length of runway needed can be deter-mined. One can also ascertain whether the crosswindcomponent falls within the design limits of individual aircraft.For the en route phase of flight, information is required on winds
along the route at cruising levels. Strong headwinds mean thatmore fuel must be carried at the expense of passengers or freight.
Pilots need to know what the temperature will be at theirflight level because temperature affects jet engine efficiency.The same applies during take-off: a higher temperature resultsin a longer take-off run because temperature affects air density.Temperature affects the lift at a given speed and hence also thetake-off run. Similarly, atmospheric pressure affects the take-off run due to its relationship with air density.
The surface wind, temperature and pressure referred to abovehave to be accounted for in pre-flight calculations for the take-off run. The provision of accurate and timely information onthese meteorological elements helps ensure the safety of flightand also improves the efficiency of airline operations.
Information on visibility and runway visual range is of crit-ical importance as landing and take-off minima aredetermined on the basis of these elements, and precisionapproach operations cannot take place without them.Furthermore, the height of the cloud base is highly useful
WMO and ICAO: working together for international air navigation
OM Turpeinen, International Civil Aviation Organization Secretariat1
A higher temperature results in a longer take-off run because temperature affects air density
2.Econ & social issues & perspectives:Master spread 16/2/07 10:05 Page 103
[ ]104
The meteorological requirements for international air navigationare laid out in Annex 3 – ‘Meteorological service for internationalair navigation to the Convention on International Civil Aviation’.3
The various chapters of Annex 3/Technical Regulations[C.3.1] outline the overall responsibilities of the designatedmeteorological authority for the provision of services and facil-ities for international air navigation. The associated appendicesprovide detailed specifications for use by those actually provid-ing these services. The areas covered include aerodromeobservations and forecasts; warnings (both in the terminal areaand en route); forecasts for en route issued by the World AreaForecast Centres (WAFC) in London and Washington; advi-sories for volcanic ash and tropical cyclones; air reporting;needs for meteorological information by air traffic service unitsand communications requirements.
A number of other documents are issued as guidance mate-rial by ICAO and WMO in order to provide ICAO ContractingStates and WMO members with additional information to assistthem in implementing the provisions contained in Annex 3.4
In accordance with the working arrangements between thetwo organizations, major amendments to Annex 3 are developedby conjoint ICAO/WMO meetings. Between meetings, most ofthe proposed amendments are developed by the ICAO Secretariatwith the assistance of ICAO operations and study groups. Theseare composed of experts nominated by states and internationalorganizations, including WMO. Currently, there are six suchgroups working on the World Area Forecast System, satellitedistribution system for information relating to air navigation(SADIS), international airways volcano watch, wind shear, auto-matic meteorological observing systems and the use of data linkfor the uplink and downlink of meteorological information. Alldraft amendments developed by these groups are sent for consul-tation to ICAO Contracting States and WMO Members beforebeing submitted for adoption by the ICAO Council and approvalby the WMO Executive Council.
In accordance with the working arrangements, through theWMO Commission for Aeronautical Meteorology (CAeM)which is responsible for implementing the WMO AeronauticalMeteorology Programme (AeMP), WMO is responsible fortraining meteorological personnel and for specifying the tech-nical methods and practices to be used for the provision ofmeteorological services to international air navigation.
CAeM has established expert teams to deal with training,improvements to forecasts in the terminal area, quality manage-ment, customer focus and cost recovery. The Commission isalso involved in the Aircraft Meteorological Data Relay(AMDAR) programme and in studies related to the impact ofaviation on the global atmospheric environment. In order toensure that the needs of aviation users are fully addressed, repre-sentatives of ICAO, the International Air Transport Association(IATA) and the International Federation of Air Line PilotsAssociations are invited to participate in meetings of CAeM.Furthermore, in 2004, WMO and IATA established focal pointsbetween the two organizations to facilitate frequent contactsfollowed by similar arrangements with EUROCONTROL in2005. This was prompted by the increased involvement of thatorganization in activities related to the newly established SingleEuropean Sky.
In addition, the WMO Commission for Basic Systems (CBS) isactively involved in ensuring the timely availability of basic mete-orological data on which aviation weather forecasts are based. Inthis regard, the contribution of the AMDAR programme to the
when assessing whether the prevailing conditions are abovethe landing and take-off minima and whether the pilot is ina position to establish the required visual reference at thedecision altitude.
With regard to hazardous weather phenomena for take-off orlanding, pilots need to be warned of the existence or forecast offog, snowstorms, wind shear, tropical cyclones, etc. During theflight, pilots need to know whether they are likely to encountersevere thunderstorms involving hail, severe turbulence, icingor volcanic ash to enable them to avoid these hazardousphenomena. Thunderstorms are notorious for extreme up- anddowndraughts, and the associated turbulence can easily exceedthe structural limits of the aircraft. Moreover, thunderstormsare particularly dangerous in the vicinity of aerodromes as theassociated downdraughts can cause aircraft to sink below theglide path. This may mean that the aircraft could strike an obsta-cle or the ground before it can regain its flight path.
Explosive volcanic eruptions produce clouds of dense ashthat can reach into the stratosphere. When the ash is ingestedinto aircraft jet engines, these are severely damaged and mayflame out completely, as has happened on at least three occa-sions. This is a serious hazard to aviation and has beenaddressed over the last few years by the International CivilAviation Organization (ICAO), in coordination with WMO.
WMO and ICAO working arrangementsIn order to meet the needs of international civil aviation in anefficient manner, it is important that ICAO and WMO workclosely together and ensure that stated aviation requirementscan be met without any unnecessary overlap of activities. Thishas been recognized from the early days of aviation, andworking arrangements between WMO and ICAO were estab-lished as early as 1953.2 These arrangements can besummarized as follows:
• ICAO is responsible for defining aeronautical meteoro-logical requirements
• WMO is responsible for defining the most appropriatemethods for fulfilling the requirements, including thetraining of aeronautical meteorological personnel.
It is important to note that the dissemination of operationalmeteorological (OPMET) data is the prerogative of ICAO andthat the planning for such dissemination is undertaken by it.Furthermore, the provisions in Annex 3/Technical Regulations[C.3.1] stipulate that the ICAO aeronautical fixed service shouldbe used for the dissemination of such information.
One constant challenge is to ensure that the work is carriedout in an efficient and cost-effective manner. To this end,proper coordination between the two organizations has to beconstantly maintained with full consultation and cooperationat every stage of the process. This coordination is also achievedby the systematic participation of WMO in the work of ICAOoperations and study groups, and of ICAO in the work of therelevant WMO technical commissions. This ensures that:
• No aviation requirement is generated that is impossibleto fulfil
• No methodology is developed for a requirement that isnot foreseen to exist
• Both organizations continue to operate according to theworking arrangements, to avoid the duplication of effortand redundancy of services and facilities established forinternational civil aviation by their respective members.
2.Econ & social issues & perspectives:Master spread 16/2/07 10:05 Page 104

[ ]105
availability of timely and accurate upper-air observations atvarious forecasting centres, including the two WAFCs, hasresulted in positive impacts on aviation forecast accuracy.
CBS is also responsible for developing and updating the aero-nautical meteorological codes used to disseminatemeteorological aviation information. In this context, any newor updated aeronautical requirements included in ICAO Annex3 are subsequently reflected in the WMO Manual on Codes5
following approval by CBS. ICAO is also interested in the emer-gency response activities of CBS, in particular theComprehensive Nuclear Test Ban Treaty Organization/WMOEmergency Response Activities. The potential usefulness ofmonitoring information for the early detection of explosivevolcano eruptions could serve as an early indication of the possi-ble presence of airborne volcanic ash that is a serious threat toflight safety.
The contribution of the WMO Commission for Instrumentsand Methods of Observations (CIMO) is essential for ensur-ing that the latest information concerning the capability ofautomatic meteorological observing systems are forwarded toICAO for the development of future requirements. TheCommission for Atmospheric Sciences (CAS), through itsWorld Weather Research Programme, is accelerating researchon the prediction of high-impact weather and encouraging theuse of advances in weather prediction systems to the benefitof all WMO programmes including the AeMP.
WMO is responsible for the training and qualification ofpersonnel providing meteorological services for internationalair navigation. In this regard, guidelines for the education andtraining of personnel in aeronautical meteorology, as well asrelevant training material, are developed by the WMOEducation and Training Programme (ETR) in close collabora-tion with relevant CAeM structures and the active involvementof ICAO. This collaborative effort is expected to be activelypursued in the future.
Key challenges to the meteorological community for ensuringthe continued availability of good-quality, timely and cost-effec-tive meteorological service to aviation include the need forensuring the sustainability of the WMO World Weather Watchprogramme that provides the basic data, data processing, trans-mission and forecasting on which meteorological services toaviation are based; increased automation of aerodrome meteoro-logical observing systems; and improved terminal forecasts.Capacity building needs to be enhanced to ensure that aeronau-tical meteorologists, particularly those in developing countries,are abreast of new technologies and adequately trained.
Other challenges include increased reliance on the recoveryof meteorological service costs from the aviation industry tofund aeronautical meteorological activities and meteorologi-cal infrastructure, particularly in view of a noted trend towardthe disengagement of states from fully funding the traditionalproviders of service to aviation, namely NationalMeteorological Services (NMS). This tendency has resulted inthe increased use of alternative service delivery for aeronauti-cal meteorological services, including the commercializationof some of these services and, increasingly, the establishmentof fully autonomous national meteorological entities.
Continued closer contacts with aviation users and their repre-sentative organizations at the global, regional and national levelsare particularly important to ensuring that the services providedmeet users’ needs and that users understand the existing capa-bilities and limitations of such providers to deliver the required
services to the aviation industry. In view of the financial diffi-culties being experienced by a number of airlines, due in partto increased expenditure on fuel, and other constraints such asmore competition among air carriers, the airline industry is morethan ever before insisting on the transparency of charges paidto air navigation service providers.
The airlines have developed strict procedures for the use ofmeteorological information to improve safety and cost effec-tiveness, based on a thorough evaluation of the value andlimitations of meteorological observations and forecasts. Withcontinuing aviation growth and demands for safety, efficiencyand capacity, airlines and air-traffic management organizationsare more than ever dependent on weather information for plan-ning and safety. Future challenges will be for meteorologicalservice providers to exploit the increasing availability of infor-mation and relevant detail in predictions from numericalmodels to improve the accuracy, content and relevance of theinformation provided to the aviation industry.
Future perspectivesThe future requirements for aeronautical meteorology areexpected to reflect technological developments which willallow more efficient methods of production and disseminationof meteorological information. The recent investments inresearch by the two WAFCs are expected to result in theirability to produce gridded forecasts of turbulence, icing andconvective clouds. Conceivably, in the future, these forecastswill replace the current significant weather information.Gridded forecasts will provide aviation users with more accu-rate information at the pre-flight planning stage and that theproduction of such forecasts will be more efficient and will,ultimately, be fully automated.
One of the most important anticipated developments overthe next few years will be the introduction of table-driven codes(principally BUFR) for METAR/SPECI and TAF. The currentcommunications infrastructure operated by ICAO is not ableto cope with such digital codes. A careful planning process forthis migration at the global, regional and national levels willtherefore be necessary. The intention is that the migration willbe completed globally by 2015.
Requirements for meteorological information in support ofthe ICAO air traffic management (ATM) concept are expectedto be developed by a number of ICAO initiatives over the nextfew years. The purpose of the ATM systems is the optimiza-tion of the use of airspace. In this context, it is expected thatnew requirements will be formulated for meteorological infor-mation. Work in this area will involve close coordination withthe relevant Air Traffic Services authorities, and it is expectedthat specific proposals by ATM and meteorological experts willbe developed by ICAO in close coordination with WMO.
EUROCONTROL and the Single European Sky
Since 2001, air traffic management in the European Union (EU) hasbeen undertaken by member states cooperating throughEUROCONTROL, an intergovernmental organization comprising EUmember states and most other European States.
The Single European Sky initiative is intended to organize airspaceand air navigation at a European rather than at a local level. It willorganize this airspace uniformly, with air traffic control areas based onoperational efficiency, not national borders, integrating civil andmilitary air traffic management.
2.Econ & social issues & perspectives:Master spread 16/2/07 10:05 Page 105

[ ]106
FLYING MEANS TAKING an aeroplane into the air - the airis an environment with very specific characteristics thathas to be treated with respect. Many natural disasters are
weather related. Be it a thunderstorm, a hurricane, heavy orfreezing rain, all these events can have serious consequences ifnot handled properly.
Aviation and weather are intimately related. In between 15and 20 per cent of all aviation accidents, weather is a factor. Thishighlights the importance of correct weather information for asafe flight.
Over the years, weather information has improved dramati-cally. Accurate weather forecasts are extremely important for asafe and efficient flight. Both National Meteorological Services(NMS) and private weather service providers, whether these areprivate companies or airline meteorological departments,continue to work towards improving the performance of theirprediction models and services. The implications of theseimprovements are not limited to airlines and air travel – indeed,the aviation industry is itself involved in providing vital meteo-rological data, and the benefits stretch far and wide.
Airlines as end usersAirlines need accurate weather information and predictions inorder to plan flight schedules efficiently and ensure passengersafety. Both the safety and operating efficiency of aircraft aregreatly affected by the accuracy of meteorological forecasting.But weather services also have a significant environmentalimpact – as airlines strive to limit emissions and minimize theenvironmental effects of air travel, better flight planning canhelp keep fuel usage, as well as costs, to a minimum.
The World Area Forecast System (WAFS) is responsible forproviding basic, essential meteorological products to the avia-tion community in a cost-effective manner, through acomprehensive, integrated and consistent worldwide system.There are two World Area Forecast Centres (WAFC), onebased at the UK Met Office and one at the US NationalOceanic and Atmospheric Administration in Washington andKansas City (the National Weather Service’s Aviation WeatherCenter). The WAFCs provide global significant weather, windand temperature forecasts, and a suite of OPMET data. Eachworks to support and back up the other in providing real-time meteorological information broadcasts for aviationpurposes. Both the London and Washington WAFCs havestudied possible failure scenarios in their WAFS operations,and each centre is able to replace the other in the event of afailure, ensuring that there is no break in the provision ofthese crucial services.
Each WAFC operates its own satellite-based broadcast systemto distribute data to airports across the world for pilot briefings.The UK Met Office’s Satellite Distribution System (SADIS)
primarily covers Europe, Asia, the Indian Ocean and Africa,while NOAA’s International Satellite Communications System(ISCS) mainly covers America, the Atlantic and the PacificOceans. WAFC broadcasts are supervised by the InternationalCivil Aviation Organization (ICAO) under the requirements ofICAO Annex 3, which concerns meteorological information forinternational air navigation.
Both WAFCs continually strive to improve the performance oftheir numerical prediction models of upper air wind and temper-atures. The graph below shows WAFC London forecasts ofwinds at 250 hectopascals (hPa), flight level (FL) 340. It indi-cates that forecasts of winds at 250hPa (FL340) have improvedin accuracy by around 20 per cent over the northern hemispherein the past six years.
This can be attributed to higher resolution models (WAFCLondon’s global model now has a horizontal resolution of 40kilometres); better model physics, and an increased density ofobservations both from aircraft and satellites.
The net result is that forecasts of flight durations for long-haulflights are typically within a few minutes accuracy. Adverseweather can lead to much greater delays en route (for examplethunderstorms and turbulence) and within the terminal area. Itis the aspects of weather forecasting of the latter where the great-est environmental benefits can be made in the coming years. Byworking more closely with Air Traffic Management authorities,National Meteorological Services can provide timelier, moreaccurate and more detailed weather information up to 24 hoursin advance, and this will provide the greatest gains in terms ofimproved capacity and fuel savings in the future.
While aviation meteorology focuses on mitigating the effectof hazardous weather on passengers and operations, the envi-ronmental record of the aviation industry is coming underincreasing scrutiny. Air transport represents 2 per cent ofglobal carbon emissions, but airlines are working hard to limitthis. Airlines are continuously modernizing their fleets, andone of the effects of this is a reduction in fuel burn for thesame payload. For example, at one US air carrier, a switchfrom DC10 to A330 aircraft has reduced fuel burn for the samepayload by over 30 per cent – in other words, 30 per cent lesscarbon dioxide is being left in the atmosphere for the samenumber of passengers. Overall fuel efficiency has improved10 per cent over the past five years. The new generation ofaircraft such as the Airbus A380 will have a fuel consumptionof less than three litres per 100 passenger kilometres, lowereven than a hybrid car.
Airlines as information providersHowever, limiting emissions is not the only benefit fromimprovements in aircraft technology. While the role of satellitetechnology in weather monitoring is fairly well-known (satel-
Airlines and weather
Adriaan Meijer, International Air Transport Association
2.Econ & social issues & perspectives:Master spread 16/2/07 10:05 Page 106

[ ]107
flight planning, greater safety for aircraft, passengers and crew,and industry cost savings.
Funded by the aviation industry, the benefits of these systemsstretch far beyond this in terms of meteorological forecastingand the climate. It is making an increasingly important contri-bution to the observational database of the WMO’s WorldWeather Watch (WWW), and the data they supply is expectedto supersede manual air reporting.
In recent years the numerical weather prediction community’srequirement for capturing substantial amounts of automaticmeteorological data from aircraft has continued to grow, neces-sitating further investigation into ways of capturing this data.As a result, several national AMDAR programmes have been setup, some of which are operational and some still in the plan-ning stage.
Far-reaching benefitsWhile airlines clearly stand to benefit economically fromincreasingly accurate weather forecasts, they also make a signif-icant contribution to them. In addition, the benefits stretch farbeyond the world of commerce and air travel. Better, moreaccurate meteorological information can enable more accuratepredictions of weather phenomena, such as the course andintensity of hurricanes, the type of winter precipitationexpected and the severity of thunderstorms. Thus, it enablesbetter, more timely and accurate warnings of dangerousweather events, and helps to save lives. In the event of a disas-ter, the same services contribute vital information for theplanning and execution of rescue and aid operations.
The relations between aircraft and their natural environment,the air, will remain challenging. Aircraft will continue to flythrough the air. They will increasingly provide real-time feed-back to the ground about the quality of the layers of air they arecrossing. Doing so provides increasingly more accurate weatherprediction possibilities. This enables more safe and more effi-cient flights and provides the world with a better weatherpredicting capability in general.
lite pictures have been featured in television weather reports forsome years now) the role of aircraft in providing weather infor-mation is perhaps less familiar.
For an accurate weather forecast, no matter what its purpose,information about the air movement and temperature, andincreasingly humidity, at various altitudes is critical. Withoutsuch information, no accurate weather forecast can be provided.The only reliable information about these events is collected andtransmitted by aircraft crossing vertically and horizontallythrough these layers of air. In this way, more accurate informa-tion is delivered enabling forecasters to more precisely do theirwork.
The aviation industry funds and provides a significant amountof crucial meteorological data. Two programmes in particularprovide millions of observations for use in the global model,which is used not only for near-time forecasting but also to helpestablish a baseline for climate models, due to its understandingof how the atmosphere works. In addition, the climate commu-nity uses surface observations from the aviation community toestablish a baseline.
MDCRS and AMDAROver recent years it has become evident that significant valu-able meteorological data can be obtained from large areas of theworld by collecting data from aircraft. The Meteorological DataCollection and Reporting System (MDCRS) and the AircraftMeteorological Data Reporting (AMDAR) system are designedto support improved weather forecasting, particularly for upper-air wind and severe weather. Both systems work to feedinformation to their respective homeland WAFC, in the US forMDCRS and Europe for AMDAR.
The systems collect and organize up to 28,000 real-time, auto-mated position and weather reports per day from the aircraft ofparticipating airlines. The data are then forwarded to the relevantWAFC where it is used as input for the global forecast model.
By helping forecasters to more accurately predict winds aloftand areas of severe weather, the system contributes to better
1996 1997 1998 1999 2000 2001 2002 2003 2004 2005 20063.5
4.0
4.5
5.0
5.5
3.5
4.0
4.5
5.0
5.5
FC-A
nol T
ime-
Av R
MS
Vect
or E
rror
Wind (m/s) at 250.0 hPa: Analysis Northern Hemisphere (CBS area 90N-20N): T+24
WAFC London wind forecasts
Source: http://www.metoffice.gov.uk/icao/wind/nhemi.html
2.Econ & social issues & perspectives:Master spread 16/2/07 10:05 Page 107
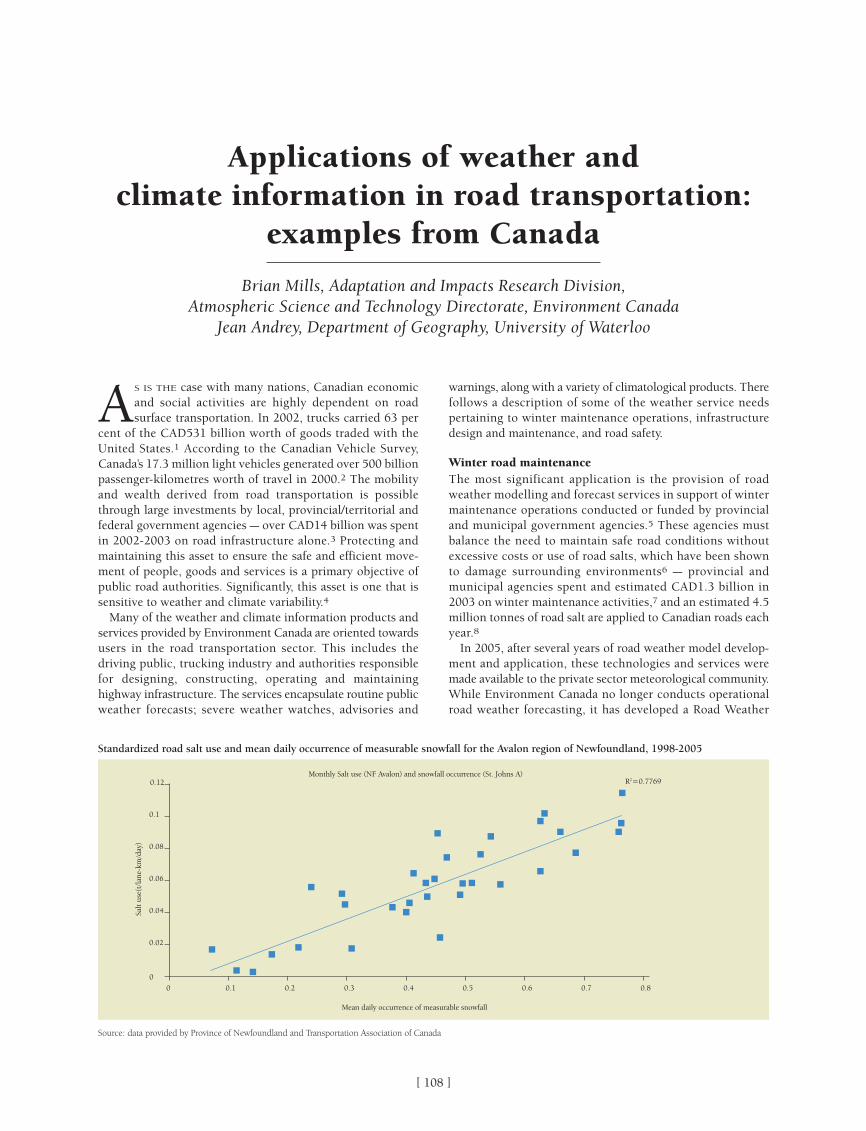
[ ]108
AS IS THE case with many nations, Canadian economicand social activities are highly dependent on roadsurface transportation. In 2002, trucks carried 63 per
cent of the CAD531 billion worth of goods traded with theUnited States.1 According to the Canadian Vehicle Survey,Canada’s 17.3 million light vehicles generated over 500 billionpassenger-kilometres worth of travel in 2000.2 The mobilityand wealth derived from road transportation is possiblethrough large investments by local, provincial/territorial andfederal government agencies – over CAD14 billion was spentin 2002-2003 on road infrastructure alone.3 Protecting andmaintaining this asset to ensure the safe and efficient move-ment of people, goods and services is a primary objective ofpublic road authorities. Significantly, this asset is one that issensitive to weather and climate variability.4
Many of the weather and climate information products andservices provided by Environment Canada are oriented towardsusers in the road transportation sector. This includes thedriving public, trucking industry and authorities responsiblefor designing, constructing, operating and maintaininghighway infrastructure. The services encapsulate routine publicweather forecasts; severe weather watches, advisories and
warnings, along with a variety of climatological products. Therefollows a description of some of the weather service needspertaining to winter maintenance operations, infrastructuredesign and maintenance, and road safety.
Winter road maintenanceThe most significant application is the provision of roadweather modelling and forecast services in support of wintermaintenance operations conducted or funded by provincialand municipal government agencies.5 These agencies mustbalance the need to maintain safe road conditions withoutexcessive costs or use of road salts, which have been shownto damage surrounding environments6 – provincial andmunicipal agencies spent and estimated CAD1.3 billion in2003 on winter maintenance activities,7 and an estimated 4.5million tonnes of road salt are applied to Canadian roads eachyear.8
In 2005, after several years of road weather model develop-ment and application, these technologies and services weremade available to the private sector meteorological community.While Environment Canada no longer conducts operationalroad weather forecasting, it has developed a Road Weather
Applications of weather and climate information in road transportation:
examples from Canada
Brian Mills, Adaptation and Impacts Research Division, Atmospheric Science and Technology Directorate, Environment Canada
Jean Andrey, Department of Geography, University of Waterloo
0
0.02
0.04
0.06
0.08
0.1
0.12
Mean daily occurrence of measurable snowfall
Salt
use(
t/la
ne-k
m/d
ay)
0 0.1 0.2 0.3 0.4 0.5 0.6 0.7 0.8
Monthly Salt use (NF Avalon) and snowfall occurrence (St. Johns A)R2=0.7769
Standardized road salt use and mean daily occurrence of measurable snowfall for the Avalon region of Newfoundland, 1998-2005
Source: data provided by Province of Newfoundland and Transportation Association of Canada
2.Econ & social issues & perspectives:Master spread 16/2/07 10:05 Page 108
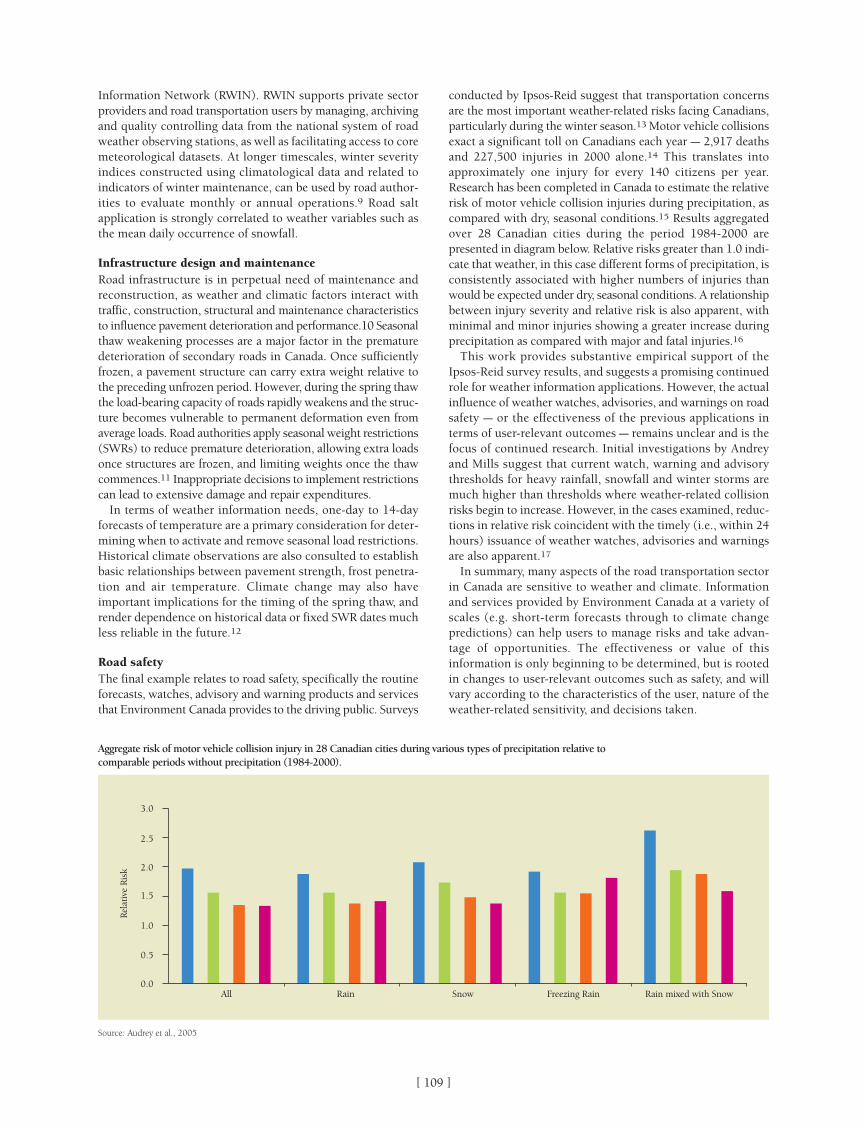
[ ]109
Information Network (RWIN). RWIN supports private sectorproviders and road transportation users by managing, archivingand quality controlling data from the national system of roadweather observing stations, as well as facilitating access to coremeteorological datasets. At longer timescales, winter severityindices constructed using climatological data and related toindicators of winter maintenance, can be used by road author-ities to evaluate monthly or annual operations.9 Road saltapplication is strongly correlated to weather variables such asthe mean daily occurrence of snowfall.
Infrastructure design and maintenanceRoad infrastructure is in perpetual need of maintenance andreconstruction, as weather and climatic factors interact withtraffic, construction, structural and maintenance characteristicsto influence pavement deterioration and performance.10 Seasonalthaw weakening processes are a major factor in the prematuredeterioration of secondary roads in Canada. Once sufficientlyfrozen, a pavement structure can carry extra weight relative tothe preceding unfrozen period. However, during the spring thawthe load-bearing capacity of roads rapidly weakens and the struc-ture becomes vulnerable to permanent deformation even fromaverage loads. Road authorities apply seasonal weight restrictions(SWRs) to reduce premature deterioration, allowing extra loadsonce structures are frozen, and limiting weights once the thawcommences.11 Inappropriate decisions to implement restrictionscan lead to extensive damage and repair expenditures.
In terms of weather information needs, one-day to 14-dayforecasts of temperature are a primary consideration for deter-mining when to activate and remove seasonal load restrictions.Historical climate observations are also consulted to establishbasic relationships between pavement strength, frost penetra-tion and air temperature. Climate change may also haveimportant implications for the timing of the spring thaw, andrender dependence on historical data or fixed SWR dates muchless reliable in the future.12
Road safetyThe final example relates to road safety, specifically the routineforecasts, watches, advisory and warning products and servicesthat Environment Canada provides to the driving public. Surveys
conducted by Ipsos-Reid suggest that transportation concernsare the most important weather-related risks facing Canadians,particularly during the winter season.13 Motor vehicle collisionsexact a significant toll on Canadians each year – 2,917 deathsand 227,500 injuries in 2000 alone.14 This translates intoapproximately one injury for every 140 citizens per year.Research has been completed in Canada to estimate the relativerisk of motor vehicle collision injuries during precipitation, ascompared with dry, seasonal conditions.15 Results aggregatedover 28 Canadian cities during the period 1984-2000 arepresented in diagram below. Relative risks greater than 1.0 indi-cate that weather, in this case different forms of precipitation, isconsistently associated with higher numbers of injuries thanwould be expected under dry, seasonal conditions. A relationshipbetween injury severity and relative risk is also apparent, withminimal and minor injuries showing a greater increase duringprecipitation as compared with major and fatal injuries.16
This work provides substantive empirical support of theIpsos-Reid survey results, and suggests a promising continuedrole for weather information applications. However, the actualinfluence of weather watches, advisories, and warnings on roadsafety – or the effectiveness of the previous applications interms of user-relevant outcomes – remains unclear and is thefocus of continued research. Initial investigations by Andreyand Mills suggest that current watch, warning and advisorythresholds for heavy rainfall, snowfall and winter storms aremuch higher than thresholds where weather-related collisionrisks begin to increase. However, in the cases examined, reduc-tions in relative risk coincident with the timely (i.e., within 24hours) issuance of weather watches, advisories and warningsare also apparent.17
In summary, many aspects of the road transportation sectorin Canada are sensitive to weather and climate. Informationand services provided by Environment Canada at a variety ofscales (e.g. short-term forecasts through to climate changepredictions) can help users to manage risks and take advan-tage of opportunities. The effectiveness or value of thisinformation is only beginning to be determined, but is rootedin changes to user-relevant outcomes such as safety, and willvary according to the characteristics of the user, nature of theweather-related sensitivity, and decisions taken.
0.0
0.5
1.0
1.5
2.0
2.5
3.0
Rela
tive
Risk
All Rain Snow Freezing Rain Rain mixed with Snow
Aggregate risk of motor vehicle collision injury in 28 Canadian cities during various types of precipitation relative to comparable periods without precipitation (1984-2000).
Source: Audrey et al., 2005
2.Econ & social issues & perspectives:Master spread 16/2/07 10:05 Page 109

[ ]110
THERE FOLLOWS A summary of results from a study ofthe economic value of short-range forecasts of snow-storms in winter road-maintenance decisions in
Sweden.1 The study had two objectives – to assess the valueof these forecasts in economic terms, and to assess ways ofimproving decision-making and all aspects of the servicequality. Thus, when quality is mentioned it should be under-stood to be technical quality (TQ).
When viewed as weather-related decision-making problems(DMPs), three types of Swedish road-maintenance DMPs canbe identified:
• Snowstorms• Black-ice• Frost problems.
Each type of problem arises under distinct meteorologicalconditions and involves different road-maintenance strategies.The case study described here is concerned exclusively withsnowstorm problems.
This decision-analytic approach involves several steps,including the structuring of the DMP, the quantification of therelevant costs and losses, and the specification of probabilitiesof the relevant weather events given the forecast informationin question. Optimal strategies and forecast-value estimates
are determined here under the assumption that the overall goalof Swedish road authorities is to minimize total expenditurewhere these expenses consist of both road-maintenance costsand snowstorm losses.
The case study reported here focuses on snowstorm-relatedwinter road-maintenance activities on major highways in adistrict in south-central Sweden. The relationship between fore-cast quality and forecast value in the context of thissnowstorm/road-maintenance DMP is briefly examined.
Basic structureA decision tree depicting the basic structure of the snow-storm/road-maintenance DMP is presented in the diagrambelow. The tree identifies the actions and events included inthe model, as well as the outcomes associated with the varioussequences of actions and events. Two sequential decisions areconsidered:
• The wake-up decision made by central road-maintenanceauthorities
• The pre-salt decision made by local road-maintenanceauthorities.
Both decisions are assumed to involve a choice between binaryactions: namely, wake-up (W)/don’t wake-up (W’) in the case
The economic value of snowstorm forecastsin winter road-maintenance decisions
Erik Liljas, Swedish Meteorological and Hydrological Institute
Basic decision tree for snowstorm/road-maintenance DMP
Source: Liljas, E., and Murphy, A.H.
Wake updecision
Wake upperiod
Pre-saltdecision
Pre-saltperiod
O1
O2
O3
O4
O5
O6
O7
O8
O9
O10
O11
Maintenanceperiod
Decision node
Event node
Timeline for decision-making
Source: Liljas, E., and Murphy, A.H.
Wake updecision
Wake upperiod
Pre-saltdecision
Pre-saltperiod
Maintenanceperiod 1
Maintenanceperiod 2
Time (hours)
0 1 4 6 12
2.Econ & social issues & perspectives:Master spread 16/2/07 10:05 Page 110

[ ]111
activities/environmental impacts, were obtained from publi-cations prepared by road/traffic organizations in Sweden andfrom discussions with Swedish road authorities. On the basisof these data it was possible to estimate most of the dimen-sions of the costs and losses identified here. However, the dataavailable were inadequate to derive reliable estimates of thelosses associated with both accident-related roadway damagesand inconveniences caused by traffic delays, as well as the costsdue to salt damage to roadways, and these three dimensionsof the expenses have been ignored in this study.
In estimating the total expenses associated with the variousaction-event sequences (or branches of the tree), an additivemodel of losses and costs has been assumed. That is, the termi-nal expense assigned to a particular branch of the tree is thesum of the costs and/or losses associated with the particularcombination of actions and events that define this branch. Thetotal expenses calculated for the eleven basic terminaloutcomes are listed in the second table.
Outcomes 04, 07, and 011 are associated with action/eventsequences in which the snowstorm event has not yet occurred.In these cases, expected expenses associated with subsequentiterations of the snowstorm/road-maintenance DMP have beenadded to the basic terminal expense. These expected expensesvary depending upon the type of snowstorm information usedas a basis for decision making in these iterations. The terminalexpenses given in the table relate to the situation in whichthese decisions are based on forecast information.
Snowstorm events and snowstorm forecastsA typical snowstorm event in this district in south-centralSweden has a duration of six hours, with snow falling at a rateof approximately 1cm per hour. In this study, it is assumed thatsnowfall is continuous; specifically, a snowstorm event consistsof uninterrupted snowfall for a six-hour period, with a totalaccumulation of 6cm. The unknown characteristic of snow-storms of interest here is their time of initiation. Thus, theshort-range snowstorm forecasts evaluated in this case studyare forecasts of the initiation time of snowfall events.
Three types of snowstorm information are considered in thisstudy:
• Climatological information based on current weather datafrom automatic stations along highways and roads andweather radar information
• Forecast information• Perfect information.
of the wake-up decision and pre-salt (S)/don’t pre-salt (S’) inthe case of the pre-salt decision. The weather events are alsoassumed to be binary in nature: namely, the occurrence (x =1) or non-occurrence (x = 0) of a snowstorm in a particularperiod.
The timeline identifies the time (in hours) at which the deci-sions are made. The wake-up decision is taken as the arbitrarypoint in time at which this DMP initially arises (t = 0), and thepre-salt decision is made one hour later (t = 1). This diagramalso defines the time intervals associated with the four periodsof interest; namely, the wake-up period (x1 : 0 ≤ t ≤ 1), the pre-salt period (x2: 1 ≤ t ≤ 4), maintenance period 1 (x3: 4 ≤ t ≤6),and maintenance period 2 (x4: 6 ≤t ≤ 12).
Each branch of the decision tree terminates in a node thatrepresents the outcome of the corresponding sequence of actionsand events. Eleven distinct outcomes (or branches) are identi-fied, denoted here by 01, 02, …, 011. Outcomes 04, 07, and 011are associated with sequences of actions/events in which thesnowstorm does not occur during any of the four basic periods.In these cases it is assumed that road-maintenance authoritiesface this same decision-making problem again at a later time.This assumption leads to an extended version of the basic DMP.In effect, the basic wakeup/pre-salt decision-making process isreiterated on these three branches of the decision tree until thesnowstorm occurs, or until the incremental change in the asso-ciated terminal expense becomes insignificant.
Outcome expensesThe expenses associated with the outcomes are assumed to beof two basic types:
• Losses due to the snowstorms themselves• Costs due to maintenance activities.
Each type of expense (the generic term for costs or losses)contains two categories of loss or cost. In the case of snow-storms, the expenses are losses due to traffic accidents (La)and losses due to traffic delays (Ld). In the case of maintenanceactivities, the expenses are costs due to maintenance activities(Cm) and costs due to environmental impacts of maintenanceactivities (Ce). In addition, each category of cost or losspossesses two or more dimensions. The types, categories, anddimensions of the expenses considered in this snowstorm/road-maintenance DMP can be seen in the table.
Road and traffic statistics, as well as basic data related tolosses due to accidents/delays and costs due to maintenance
Table 1: Types, categories, and dimensions of expenses associated with terminal outcomes
Type Category Dimension
Snowstorm Accident losses (La) Injurieslosses Deaths
Vehicle damageRoadway damages
Delay Losses (Ld) Loss of work timeLoss of leisure timeInconvenience
Maintenance Maintenance costs(Cm) Personnel costscosts Equipment costs
Material costs
Environmental costs (Ce) Salt damage to environmentSalt damage to vehiclesSalt damage to roadway
Source: Liljas, E., and Murphy, A.H.
Table 2: Expenses associated with terminal outcomes in the case of state-of-the-art snowstorm forecasts
Terminal Expense Terminal Expenseoutcome (1,000 SEK) outcome (1,000 SEK)
01 11,200 07 11,206
02 9,300 08 11,400
03 8,500 09 1 1,400
04 1 1,453 010 11,400
05 11,100 011 11,006
06 11,000
Source: Liljas, E., and Murphy, A.H.
2.Econ & social issues & perspectives:Master spread 16/2/07 10:05 Page 111

[ ]112
Each type of information is assumed to specify the probabilityof occurrence of a snowstorm event in the four basic periods.Further, it is assumed here that in the absence of forecast infor-mation, road-maintenance personnel base their decisions on(tailored) climatological information. In effect, climatologicalinformation defines the zero points (or baseline values) on thescales on which forecast quality and forecast values aremeasured. Perfect information, although obviously not avail-able in the real world, provides a useful upper boundary forthe quality and value of imperfect forecasts.
Conditional and marginal distributions characterizing forecastquality for the wake-up, pre-salt, and maintenance-2 periods arerelated to this maintenance-1 period forecast information.2 Tofacilitate the comparison of snowstorm event probabilities forthe three types of information, the marginal probabilities of snow-storm events initiating in the four basic periods are required.
ResultsAs previously noted, it is assumed that the goal of Swedishroad-maintenance authorities is to minimize total expectedexpenses on each occasion on which a snowstorm constitutesa threat to traffic safety and highway maintenance in theJönköping district. The value of snowstorm forecasts of a spec-ified level of quality is determined as the difference in totalexpected expense between the situation in which thewakeup/pre-salt decisions are based on climatological infor-mation, and the situation in which these decisions are based onforecast information.
Optimal strategiesWhen the wakeup and pre-salt decisions are based on climato-logical information, it is always optimal for central authorities to
Table 3: Marginal probabilities of snowstorm-event occurrence in four basic periods for three types of information
Period Climatological Forecast Perfect(Event: hours) information information information
Wake-up (x1: 0-1) 0.060 0.025 0.000
Pre-salt (x2: 1-4) 0.399 0.150 0.000
Maintenance-1 (x3: 4-6) 0.266 0.550 0.720
Maintenance-2 (x4: 6-12) 0.275 0.275 0.280
Source: Liljas, E., and Murphy, A.H.
Table 4: Expected expense and expected value associated with optimal strategies for different types of meteorologicalinformation for Jönköping district in south-central Sweden
Type of Expected expense Expected valueInformation (1,000 SEK) (1,000 SEK)
Per snowstorm Per year Per snowstorm Per year
Climatological 10,285 205,700 0 0
Forecast 9,806 196,120 479 9,580
Perfect 8,955 179,100 1,330 26,600
Source: Liljas, E., and Murphy, A.H.
A snowplough (Swedish: plogbil) during a snowstorm in Sweden
Phot
o: K
erst
in E
rics
son
2.Econ & social issues & perspectives:Master spread 16/2/07 10:05 Page 112

wake up district personnel and for these road-maintenancepersonnel to initiate pre-salting activities. On the other hand, theoptimal strategy given forecast information is to wake-up andpre-salt given the forecast f=1 and to not wake-up or pre-saltgiven the forecast f=0. It is through the difference in optimalstrategies between climatological information and forecast infor-mation that the latter acquires its positive economic value. Perfectinformation leads to the same optimal strategy as forecast infor-mation.
Forecast-value estimatesThe expected expenses associated with optimal strategiesbased on climatological, forecast, and perfect information areindicated – on a per-snowstorm basis and on an annual basis(assuming 20 snowstorms on average per year) – in Table 4.Expected forecast value is also listed in this table, under theassumption that climatological information defines the zeropoint on the value scale. The economic value of snowstormforecasts (of current quality) is 0.48 million SEK per snow-storm or 9.60 million SEK for a typical year. Correspondingestimates for perfect information are 1.33 million SEK and26.60 million SEK, respectively. Thus, current forecast infor-mation realizes approximately 36 per cent of the value ofperfect information in the context of this DMP.
Quality/value RelationshipIn addition to estimates of the value of forecasts of current quality,the relationship between forecast quality and forecast value isalso of interest.3 The basic quality/value question can be posedas follows: Given a specific change in the level of forecast quality,what change can be expected in the level of forecast value?
The availability of a model of the snowstorm/road-mainte-nance DMP including a submodel that characterizes forecastquality – makes it relatively easy to evaluate the quality/value
relationship in this context. To simplify this analysis, a scalarquadratic error measure of forecast quality was introduced.4
Various incremental changes (improvements and deteriora-tions) in forecast quality were postulated, and thesnowstorm/road-maintenance model was used to determinethe optimal strategies and forecast-value estimates corre-sponding to each level of quality. Relative forecast value V* isplotted against relative forecast quality Q* in the graph here(these rescaled quantities are defined in the figure legend). Thisdiagram reveals that the quality/value relationship is approxi-mately linear for relatively modest levels of quality but is highlynonlinear over higher levels of quality. In this regard, the Q*value for forecasts of current quality is 0.725.5
Short discussion of the winter road maintenance problemThis paper has summarized some results of a decision-analyticstudy of the value of short-range snowstorm forecasts in road-maintenance decisions in the Jönköping district in south-centralSweden. The study focused on the wake-up/pre-salt decisionsmade by central/local road-maintenance authorities, evaluateda relatively broad range of expenses associated with mainte-nance activities and snowstorm events, and estimated theeconomic benefits – in the context of this DMP – of state-of-the-art forecasts from the time of initiation of a typicalsnowstorm. Specifically, the incremental benefits of basing theseroad-maintenance decisions on forecast information – insteadof on climatological information – is approximately 0.5 millionSEK per snowstorm or about 10 million SEK per winter season.It should be kept in mind that these estimates refer only to theeconomic benefits of snowstorm forecasts in decisions involv-ing main roads in the Jönköping district. The overall annualeconomic benefits of forecast information in road-maintenancedecisions relating to both snowstorm and black-ice events forall major roads in Sweden are estimated – by a rough scaling-up process – to exceed 300 million SEK.6
In evaluating these estimates of benefits, it is also importantto recognize that a relatively sophisticated form of climato-logical information has been used as a standard of reference inthis study. If road-maintenance authorities only had access toa relatively rudimentary form of climatological information inthe absence of snowstorm forecasts, then the value of the fore-cast information of interest here would increase (because theeconomic value of the zero point had decreased). Alternatively,this relatively sophisticated climatology could be viewed as anintermediate form of information (between the rudimentaryform of climatology and state-of-the-art forecasts) with consid-erable economic value in its own right.
When looking at the combined result of nowcasting as theresult of mapping of current weather by radar, satellite andautomatic stations (~700) +, forecast information, and theassumption that the user optimised the economic outcomewith efficient decision-making, a figure on the order of 100million euros was saved in Sweden each winter. Of this, 60 percent came from improved decisions due to better mapping byweather radar, satellite images and automated weather stations(AWS); 40 per cent came from the forecasts for the next 12hours. Potential to improve the outcome by increasing fore-cast quality was postulated. A clear conclusion was that aneffective decision-making process is important in order toimprove the outcomes of weather services to save lives, health,the environment and money.
[ ]113
Quality/value relationship for snowstorm/road-maintenance DMP.Q* and V* are rescaled measures of quality and value, respectively,where Q* = 0 and V* = 0 for climatological information and Q* =1 and V*=1 for perfect information. Q* 0.725 and V* = 0.360 forstate-of-the-art snowstorm forecasts
Source: Liljas, E., and Murphy, A.H.
0.5
1.0
0
Fore
cast
val
ue V
*
0.5 1.0
Forecast quality Q*
2.Econ & social issues & perspectives:Master spread 16/2/07 10:05 Page 113

[ ]114
HUMANS ARE JUSt one of the many species affected byclimate change – the number could be anywhere fromfour million to 8.5 million, according to various scien-
tific and historical sources. But there is clear evidence thathuman excesses have caused significant environmental damageover the past 100 years, and that we now need to find ways toreverse this trend or to use natural-resource management thatenable efficiency while continuing conventional developmentobjectives.
One hugely significant element of this problem is thatnearly 50 per cent of all fossil energy consumed in the worldgoes to just one industry: building. This understanding isessential if humans are to find effective ways of reducing theconsumption of fossil fuel and the damage it does to the envi-ronment.
For 50 years, many in the environment sector have focusedon how to get governments to enact policies that will makebusinesses behave more ‘responsibly’ in their use of naturalresources. Embedded in this logic is a notion that there is aconflict between markets and the environment.
Beyond the Green BrigadeOver the past decade there has been significant growth in India,with a compounded annual average growth of eight per cent ongross domestic product. New avenues have opened out,enabling some ‘renegade’ institutions in the development sectorto move away from ‘activism’, beyond the current crop of the‘Green Brigade.’ Instead, they are looking for solutions usingtechnology, both ancient and modern, which can continue toserve the conventional objectives of economic developmentwhile being sensitive over the use of natural resources.
Sangharsh (in Hindi, meaning struggle or political activism)and nirmaan (development that brings social and economicvalue) represent polar opposites that have been seen by envi-ronmentalists and governments in India – and throughout theworld – as mutually exclusive, conflicting objectives.
Management gurus today are beginning to see that the world’sbusiness sector and governments have to take a different view.C. K. Prahalad, hailed recently by BusinessWeek as a businessprophet, says: “Increased efficiency through innovation is thekey to sustainable development.” Arthur D. Little talks of how
Sustainable, energy-efficient building: the BCIL approach
By Chandrashekar Hariharan, Biodiversity Conservation (India) Ltd
0
2000
4000
6000
8000
10000
12000
Zed partial basement Conventionalfull basement
CO
2 em
issi
ons
– M
T
1165
10089.56
0
850
900
950
1000
1050
1100
1150
Zed load bearinghybrid structure
Conventional RCCframed structure
CO
2 em
issi
ons
– M
T
966.1
1144.12
Basement structure Independent home super structure
Source: BCIL Source: BCIL
2.Econ & social issues & perspectives:Master spread 16/2/07 10:05 Page 114

[ ]115
doing so, it has shown that governments must first dispel thenotion that there is a trade-off between growth and being envi-ronmentally friendly. As a developing country that imports 70per cent of its energy, India cannot ignore the need for strate-gies in the building industry that will reduce consumption byenhancing the country’s energy security.
Energy security is not primarily about generation so muchas it is about achieving energy efficiency. The question thatBCIL has often asked is: if economic agents reduce their energyuse, and therefore their costs, how can this be bad for thegrowth and productivity of a company or government?
If you observe the quality of a product and service, orcustomization in the marketplace, you will see that until veryrecently, these goals were considered costly to achieve. WhatBCIL has effectively done over the past decade, with every evolv-ing project, is to break free from this dominant logic and usequality and customization as means to both acquire customersand reduce costs. This is both applicable at the capital stage ofconstruction, and at the post-project stage when reduced energyand water use brings financial savings to customers. The graphsaccompanying this article illustrate the approach, the strategyand the process management methods that are employed toachieve such goals at the brick-and-mortar level.
Incentives and subsidies only encourage excess use, and wasteprecious resources. Energy efficiency does not need any incen-tive, for it always shows a positive impact on corporate bottomlines across the board. That is adequate motivation for compa-nies like BCIL, and should be so for all corporations. Subsidizingenergy or water costs, instead of focusing on their efficiency, isagainst growth, as indeed it is against sustainability.
As a corporate enterprise, BCIL has been mindful of thecomfort and convenience that our products offer to ourcustomers, be it in the segment of the urban rich or the ruralpoor. Normal market behaviour suggests that higher comfortmeans higher use of resources.
“sustainability is the key to winning tomorrow’s markets.” AndKofi Annan said recently: “I hope corporations understand thatthe world is not asking them to do something from their normalbusiness; rather it is asking them to do business differently.”
BCIL’s raison d’etreIn 1994, a fledgling group of development workers in the sub-Himalayan districts of India chose to move away from ‘socialmodels’ of development with grants and subsidies. The groupestablished an enterprise that sought to identify an array oftechnologies in building, water and energy management thatcould demonstrate resource-sensitivity while also being finan-cially viable. Eleven years down the road, BiodiversityConservation (India) Ltd. (BCIL) has shown that sustainabil-ity can be a central platform for business growth.
In 1995, its first year of operations, BCIL had a businessvalue of USD 500,000. From this modest beginning, it hasgrown to become a USD 25 million enterprise. This clearlysuggests that markets are both willing and in need of processesand technologies that make no compromise on the definedurban frameworks of development, comfort and convenience,while delivering efficiency in natural resources.
This philosophy lies at the core of BCIL, which is India’slargest Sustainable Built Environment (SBE) enterprise today.BCIL has made a case in every business and developmentforum for ending the present perverse system of offering subsi-dies and incentives in the form of artificially lower prices for‘green’ technologies. BCIL sees a highly productive marriagebetween the two forces of growth and environmental respon-sibility, which need to be made compatible.
With 330 per cent annual growth registered in just the pastyear of performance, BCIL is a standing testimony for movingaway from such regressive thinking on ‘nurturing’ green devel-opment. Since its inception, BCIL has promoted successfulbusiness models that have mainstreamed the ‘alternative’. In
0
200
400
600
800
1000
1200
1400
Zed SSB andlaterite walls
Conventional solid concreteblocks and burnt clay bricks
CO
2 em
issi
ons
– M
T
769.31
1360.01
External walls Home lighting
Source: BCIL
0
50
100
150
200
250
300
CFL lights Halogen and flouroscent lights
Kw
h
56.92
269.85
Source: BCIL
2.Econ & social issues & perspectives:Master spread 16/2/07 10:05 Page 115

[ ]116
In every one of the 1.4 million square feet [or 150,000 squaremetres] of building projects that the enterprise is executingtoday, BCIL has looked at implementation that pursues a four-pronged strategy for bringing natural resource efficiency:
• Environmental compatibility• Economic efficiency• Endogeneity • Equity.
These are addressed while focusing on two primary ideas: 1. How to improve transport energy within our campus areas2. Building efficiencies in home energy use – this covers betterwashing machines, refrigerators, air-conditioners and watercoolers; smarter lighting systems; efficient cooking systemsand water heating systems.
BCIL’s adherence to these values, as a profit-making company,is non negotiable. BCIL is about the human spirit; our missionstatement is merely a hollow catchphrase. As an organization,we have pushed the boundaries of economic possibility, alwaysknowing that we will not bend to curtail that spirit or the soulof our company.
With this bedrock foundation, we have created an entirelynew business model in India, which offers us the opportunityto grow exponentially as an organization. If the past five yearshas shown a cumulative growth rate of a staggering 5,000 percent – from USD500,000 to USD25 million – the next threeyears (financial years 2007-2010) will take us to a top linerevenue, on projects that are already committed to beingexecuted, to the region of USD150 million. The bulk of therevenues today arise out of sustainable buildings, while ourbusinesses in areas of sustainable built environment – watersupply to the urban and rural poor; organic farm products thatenhance growth potential and improve soils; and afforestationwith corporate partnerships – are all well on the way to becom-ing robust revenue models over the coming years.
While many analysts have successfully outlined contours ofsuch strategies for the building industry as a view from the sky,little is available in the world from companies that have success-fully created projects and management systems that recognizethese imperatives at the stages of design, architecture, andfurther down into the various components of execution.
There is either a fixed mindset that refuses to comprehendthe compatibilities that lie between successful business modelsand ecological compatibility, or there is an unwillingness toinvest in innovation and incubation that can show the way forthe future. The idea in itself is not new, of course. Inventorslike Thomas Alva Edison in the late nineteenth century regret-ted their inability, or lack of time to work on technologicaldirections for such a future: “We’re like tenant farmers,” saidEdison, “chopping down the fence around our house for fuelwhen we should be using nature’s inexhaustible sources ofenergy – the sun, wind and tide.” With breathtaking foresight,Edison added, “I’d put my money on solar energy. What asource of power! I hope we don’t have to wait until coal and oilrun out before we tackle that. I wish I had more years left.”
Case study: T-ZedThe T-Zed campus is the first of its kind. Located at AirportWhitefield Road, Bangalore, this five-acre site comprises 95homes built on the principles of sustainable resources.
Every aspect of T-Zed has been designed to conserve naturalresources and to have minimal impact on the environment. Inthese homes, built-in, customized environment-friendly (brine-based), zero electricity fridge-freezers, fully controlledair-conditioning based 100 per cent on fresh air, and built-inenergy-efficient lights are among the features that help to bringdown energy consumption in the home while preservingcomfort levels and ensuring market value.
At another project of ours, BCIL Collective, we have devisedair conditioning systems that keep homes dust-free and cool
0
50
100
150
200
250
300
350
Zed solarwater heating
Conventionalhot water geysers
CO
2 em
issi
ons
– M
T
1.71
337.32
Water heating Street lights
Source: BCIL
0
5
10
15
20
25
Zed LED/CFLstreet lights
Halogen lamps
CO
2 em
issi
ons
– M
T
1.66
20.81
Source: BCIL
2.Econ & social issues & perspectives:Master spread 16/2/07 10:06 Page 116
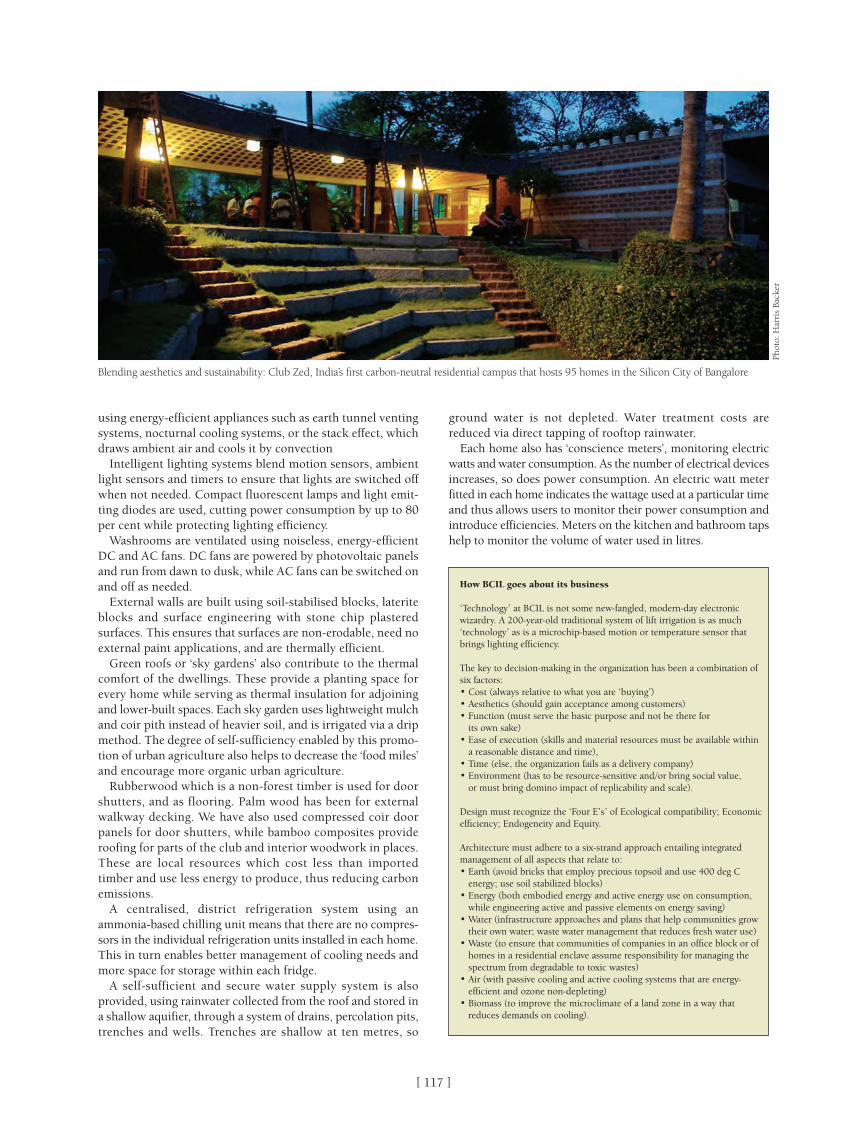
using energy-efficient appliances such as earth tunnel ventingsystems, nocturnal cooling systems, or the stack effect, whichdraws ambient air and cools it by convection
Intelligent lighting systems blend motion sensors, ambientlight sensors and timers to ensure that lights are switched offwhen not needed. Compact fluorescent lamps and light emit-ting diodes are used, cutting power consumption by up to 80per cent while protecting lighting efficiency.
Washrooms are ventilated using noiseless, energy-efficientDC and AC fans. DC fans are powered by photovoltaic panelsand run from dawn to dusk, while AC fans can be switched onand off as needed.
External walls are built using soil-stabilised blocks, lateriteblocks and surface engineering with stone chip plasteredsurfaces. This ensures that surfaces are non-erodable, need noexternal paint applications, and are thermally efficient.
Green roofs or ‘sky gardens’ also contribute to the thermalcomfort of the dwellings. These provide a planting space forevery home while serving as thermal insulation for adjoiningand lower-built spaces. Each sky garden uses lightweight mulchand coir pith instead of heavier soil, and is irrigated via a dripmethod. The degree of self-sufficiency enabled by this promo-tion of urban agriculture also helps to decrease the ‘food miles’and encourage more organic urban agriculture.
Rubberwood which is a non-forest timber is used for doorshutters, and as flooring. Palm wood has been for externalwalkway decking. We have also used compressed coir doorpanels for door shutters, while bamboo composites provideroofing for parts of the club and interior woodwork in places.These are local resources which cost less than importedtimber and use less energy to produce, thus reducing carbonemissions.
A centralised, district refrigeration system using anammonia-based chilling unit means that there are no compres-sors in the individual refrigeration units installed in each home.This in turn enables better management of cooling needs andmore space for storage within each fridge.
A self-sufficient and secure water supply system is alsoprovided, using rainwater collected from the roof and stored ina shallow aquifier, through a system of drains, percolation pits,trenches and wells. Trenches are shallow at ten metres, so
ground water is not depleted. Water treatment costs arereduced via direct tapping of rooftop rainwater.
Each home also has ‘conscience meters’, monitoring electricwatts and water consumption. As the number of electrical devicesincreases, so does power consumption. An electric watt meterfitted in each home indicates the wattage used at a particular timeand thus allows users to monitor their power consumption andintroduce efficiencies. Meters on the kitchen and bathroom tapshelp to monitor the volume of water used in litres.
[ ]117
How BCIL goes about its business
‘Technology’ at BCIL is not some new-fangled, modern-day electronicwizardry. A 200-year-old traditional system of lift irrigation is as much‘technology’ as is a microchip-based motion or temperature sensor thatbrings lighting efficiency.
The key to decision-making in the organization has been a combination ofsix factors: • Cost (always relative to what you are ‘buying’)• Aesthetics (should gain acceptance among customers)• Function (must serve the basic purpose and not be there for
its own sake) • Ease of execution (skills and material resources must be available within
a reasonable distance and time), • Time (else, the organization fails as a delivery company)• Environment (has to be resource-sensitive and/or bring social value,
or must bring domino impact of replicability and scale).
Design must recognize the ‘Four E’s’ of Ecological compatibility; Economicefficiency; Endogeneity and Equity.
Architecture must adhere to a six-strand approach entailing integratedmanagement of all aspects that relate to:• Earth (avoid bricks that employ precious topsoil and use 400 deg C
energy; use soil stabilized blocks)• Energy (both embodied energy and active energy use on consumption,
while engineering active and passive elements on energy saving)• Water (infrastructure approaches and plans that help communities grow
their own water; waste water management that reduces fresh water use)• Waste (to ensure that communities of companies in an office block or of
homes in a residential enclave assume responsibility for managing thespectrum from degradable to toxic wastes)
• Air (with passive cooling and active cooling systems that are energy-efficient and ozone non-depleting)
• Biomass (to improve the microclimate of a land zone in a way thatreduces demands on cooling).
Blending aesthetics and sustainability: Club Zed, India’s first carbon-neutral residential campus that hosts 95 homes in the Silicon City of Bangalore
Phot
o: H
arri
s Ba
cker
2.Econ & social issues & perspectives:Master spread 16/2/07 10:06 Page 117

activities. This will not only enhance the overall quality of lifefor Singaporeans, but will also help foster a greater sense of envi-ronmental ownership, leading to a deeper awareness of theenvironment and the importance of its precious resources.
Our next stepAs a small-island state, Singapore is far from immune to theeffects of globalization. In order to keep pace with global tech-nology developments, Singapore needs to continue to investheavily in research and development to ensure technologicalrelevance in this fast-changing world. As such, the Singaporegovernment has ear-marked USD5 billion to fund R&Dprojects in three sectors, including the environmental andwater technology sector, with an Environment and WaterIndustry Development Council (EWI) set up to map outstrategies and oversee growth in this sector. It is Singapore’sgoal to be a Global HydroHub, the centre of a vibrant globalindustry, a place for the generation and exchange of ideas inthe field of water.
Running parallel to this strong belief in the merits of ideaexchange is PUB’s active participation in global water eventssuch as at the 4th World Water Forum in Mexico, theInternational Desalination Association Forum in Tianjin, Chinalast year and of course, the World Water Week in Stockholm.Singapore will also be playing host to the International WaterAssociation’s Leading Edge Technology conference in a fewmonths time. Singapore’s HydroHub and the existing opportu-nities for international partnerships not only complement eachother, but are vital if progress in this sector is to be maintained.
Climate change is no longer speculation, it is reality. For PUB,the key areas of concern will be the impact of rising sea levelson flooding and coastal supply infrastructure. As such, PUB iscurrently monitoring developments in the international arenato facilitate forward planning. Through such measures, PUB
hopes to reduce water supply uncertainty as a result of meteo-rological events.
The road forwardImplementing an integrated water management system requiresvision and proper planning. However, these factors alone arenot sufficient. The key to the success of a multi-stakeholder,multi-use system is strong political will and good governance.It is only through a cohesive national effort that any large-scalesystem can attain its goal.
[ ]77
Phot
o: P
UB
–Si
ngap
ore’s
Nat
iona
l Wat
er A
genc
yPh
oto:
PU
B –
Sing
apor
e’s N
atio
nal W
ater
Age
ncy
Active, beautiful and clean waters: transforming our waterways – Rochor Canal (before and after)
Reverse osmosis membranes for NEWater production
2.Econ & social issues & perspectives:Master spread 21/2/07 14:16 Page 77

[ ]100
Glaciers and ice caps in the Nordic countries have retreatedand advanced during historical times in response to climatechanges, which are believed to have been much smaller thanthe greenhouse-induced climate changes that are expectedduring the next 100–200 years. These changes have in manycases left clear marks on the landscape in the neighbourhoodof the glaciers.
Simulated changes in ice volume and glacial runoffSeveral ice caps and glaciers in the Nordic countries werestudied within the CE project using mass balance and dynamicmodels to project future changes in ice volume and glacialrunoff based on scenarios for future climate change.
In simulated ice wastage for the modelled glaciers, simula-tions with a 2D ice flow model are run to 2200, but theNorwegian and Swedish glaciers are only run to 2100 becauseof limitations in a simplified dynamic model used for theseglaciers. The time evolution of ice volume has a similar char-acter for the modelled glaciers, except for Engabreen in Norwayand Mårmaglaciären in Sweden. The modelled ice volume isreduced by more than half within the next 100 years, and theglaciers essentially disappear in 100–200 years after the startof the simulations, given that the rate of warming with timeremains the same. One of the Norwegian glaciers retreats moreslowly because of a substantial increase in precipitation, whichis projected by the CE scenario for the area where this glacieris located.
The projected change in the mass balance of the glaciersleads to a marked increase in runoff from the area covered byice at the start of the simulations. Due to the large amplitudeof the projected changes, the changes with respect to therunoff at the start of the simulations are similar to changeswith respect to a 1961–1990 baseline, which was not explic-itly modelled for most of the glaciers. By around 2030, annualaverage runoff is projected to have increased by approxi-mately 0.4–0.7 mw.e.a-1 for the Norwegian and Swedishglaciers, and 1.5–2.5 mw.e.a-1 for the Icelandic ice caps. Therunoff increase reaches a comparatively flat maximumbetween 2025 and 2075 (except for Engabreen in Norway)when the increasing contribution from the negative massbalance is nearly balanced by the counteracting effect due tothe diminishing area of the glacier. For all the glaciers, thismaximum in relative runoff increase is over 50 per cent withrespect to the current runoff from the area presently coveredwith ice.
For the Icelandic ice caps, the specification of a compara-tively large change in climate during the initial decades of thesimulation, based on the observed climate of recent years, andthe seasonality of the climate change with the largest warmingin spring and fall, leads to a rapid increase in runoff with time.The simulated runoff changes may be compared to averagerunoff from these ice caps between 1981 and 2000, which is inthe range 2.4–4.1 mw.e.a-1. In model results for Engabreen inNorway, although the precipitation increase for the other glac-iers is of much smaller importance than the temperaturechange, the assumed precipitation change can significantlyalter the simulation results in cases where substantial precip-itation changes take place. The fact that this only happens forone of the glaciers highlights the uncertainty of the climatechange scenario.
These results clearly suggest large changes in runoff fromglaciated areas, which are projected to have reached quite
Location of the glaciers and ice caps studied in the CE project
significant levels compared with current runoff, well before2030. The associated changes that may be expected in diurnaland seasonal characteristics of glacial runoff will come on topof the changes in the annual average.
Hydropower is the most important renewable source of elec-tricity in Iceland and it is the renewable energy source moststrongly affected by climate. The results from the CE projectand the related national research programmes show that thisimpact can be quite strong. Global warming will shorten thewinter season, make it less stable and lengthen the ablationseason on glaciers and ice caps. This leads to a more evenlydistributed river flow over the year, which is a profitable situ-ation for the industry.
There is also potential for increased hydropower productionas the highest modelled increase in river flow is simulated inhighland areas that are most important for hydropower. Thisimplies that the projected hydrological changes may beexpected to have practical implications for the design and oper-ation of many hydroelectric power plants, and also for otheruse of water, especially from glaciated highland areas.
One negative aspect is that the new annual rhythm in runoffindicated in the simulations will put more stress on the spill-ways. They will probably have to be operated more often inwinter, as the unstable winter climate will generate morefrequent sudden inflows when reservoirs may be full. Thiswill also have an impact on the infrastructure with morefrequent flooding problems downstream at the reservoirs.These areas are normally adapted to the present-day climatewith stable winters and without high flows from autumn tospring.
In summary, the power industry needs to develop a newstrategy characterized by flexibility because it must be possi-ble to adapt the operation and even the design of power plantsas climate change leads to changes in the discharge and season-ality and other hydrological characteristics. Continued researchon climate change is essential to address the added uncertaintywith which the industry is faced due to this situation and inorder to supply the necessary information for proper adapta-tion to the evolving climate.
Imag
e: F
enge
r (
2007
)
2.Econ & social issues & perspectives:Master spread 21/2/07 14:17 Page 100

[ ]118[ ]118
3.Natural & Human induced disasters:Master spread 16/2/07 09:49 Page 118
IIINATURAL &
HUMAN-INDUCED DISASTERS
3.Natural & Human induced disasters:Master spread 16/2/07 09:49 Page 119

[ ]120
THE ELEMENTS OF weather and, water in its differentforms and their interaction in climatic processes, makeup the basis for sustaining various life forms in nature.
These natural forces, acting together with the soils and land ofEarth are responsible for the life and well being of people andtheir communities. Together with humankind’s collectiveknowledge and experience, these natural resources also provideall the other forms of sustenance that people need to prosperand for communities and nations to develop.
Elements of life – as well as riskSince the beginning of recorded history people have gathered,lived, and created assets of social and economic value in loca-tions where they could take advantage of rich, wateredfloodplains, abundant grasslands and forests, bountiful coastalshores, and other areas nurtured by conducive weather andproductive climatic conditions. However, as the global popula-tion increases, and more people choose to live in productive orotherwise desirable locations of opportunity, they continue tocourt disaster at least in part because they have often failed toidentify vulnerability and risk, and thus failed to protect them-selves and their livelihoods sufficiently from harm and loss.
Forces of weather encroach on societies with the ever-presentrisk of disruption, destruction and loss that people associatewith the occurrence of extreme events. Every year, extremeweather, water and climate conditions intrude on the lives andcritical functioning of millions of people living together in soci-eties. They disrupt food production, access to water, publichealth, assured shelter, functioning institutional infrastructure,transportation, provision of essential supplies, individualpersonal livelihoods and the benefits of combined economicendeavour.
Natural hazards, such as wildfires, which occur and arefanned by specific climatic conditions; or avalanches, land-,mud- and debris slides which are generated or augmented byhydrometeorological conditions; or the complex associationof hazards identified with climatic variation attributed to ElNiño conditions or other seasonal anomalies and globalwarming, all display the powerful forces that can and dodestroy the lives, livelihoods and physical infrastructure whichhumankind has otherwise created.
During 2006 there were 375 disasters with nationwide conse-quences. These disasters killed more than 20,000 people andcaused USD18.3 billion worth of damage in 106 countries.1
In 2005, there were 650 major natural hazard events aroundthe world, amounting to a record USD219 billion in losses.Although about 90 per cent of the 100,000 fatalities during the
year were attributable to the Himalayan earthquake that struckPakistan and India in October 2005, typically about 85 per centof the disasters and more than 95 per cent of the losses werebased on weather, water or climate-related hazards.
For Munich Re, the annual losses for 2006 alone totalledUSD45 billion, around one-fifth of the previous year’s figure.Dr Torsten Jeworrek, a member of Munich Re’s Board ofManagement commented: “The fact nevertheless remains that,in the longer term, the number of severe weather-relatednatural catastrophes is set to increase due, among other things,to global warming. Combined with further increasing concen-trations of values in exposed areas, this means continuallyrising loss potentials.”2
During its 61st session, The UN Secretary General reportedsimilar concerns to the UN General Assembly, highlighting thatbetween June 2005 and May 2006 there were 404 disasterswith nationwide consequences. That was 25 per cent higherthan the average for the preceding 10-year period. Altogether,115 countries were affected and the economic costs were 2.6times the 10-year average, reaching USD173 billion. Thenumber of floods was nearly 50 per cent higher and accountedfor 97 per cent of these economic damages.3
These dynamic conditions call for expanded political lead-ership and enhanced technical capacity of practitioners frommany professional disciplines. They also require informationdissemination, awareness-raising campaigns and greatercommunity involvement to motivate individual and collectivebehaviour to protect life-sustaining conditions from unneces-sary loss. Educational opportunities, access to information andmeans of communications must reach, in their languages,communities in disaster-risk areas and become more instru-mental in developing a ‘culture of disaster resilience’.
How ‘natural’ are disasters?Disaster reduction begins with the identification of naturalhazards, recognizing the risks they pose to people, livelihoodsand human settlements before they become a disaster. Whilethese adverse circumstances are routinely referred to in ageneral sense as ‘catastrophes’ or ‘disasters’, it is useful tounderstand that a disaster can be elaborated further as ‘a seriousdisruption of the functioning of a community or a societycausing widespread human, material, economic or environ-mental losses which exceed the ability of the affectedcommunity or society to cope using its own resources.’ Thisdemonstrates that much can be done to minimize people’sexposure to unnecessary harm and loss by enhancing theirresources and capabilities. Despite the fact that the hazards or
Using what we know about disasters for safer lives and livelihoods
Sálvano Briceño, Director, International Strategy for Disaster Reduction (UN/ISDR)
3.Natural & Human induced disasters:Master spread 16/2/07 09:49 Page 120

[ ]121
of the Inter-Agency Task Force of ISDR co-chaired by the WorldMeteorological Organization and the UN Office for theCoordination of Humanitarian Affairs, the resulting report waspresented to the 61st session of the UN General Assembly inOctober 2006.5 The report concludes that while some warningsystems are well advanced, there are numerous gaps and short-comings, especially in developing countries and in terms ofeffectively reaching and serving the needs of those at risk. Itthen recommends the development of a globally comprehen-sive system in support of existing early warning systems forvarious hazards. It also suggests a set of specific actions towardsbuilding national and local people-centred early warningsystems, filling in the main gaps in global early warning capac-ities, strengthening the scientific and data foundations for earlywarning, and developing the institutional foundations for aglobal early warning system.
Only months after the Indian Ocean tsunami, the period ofparticularly numerous and intense hurricanes along theAtlantic and Caribbean coastal regions provided the unforget-table images of Hurricane Katrina’s impact on New Orleansand nearby areas of the United States of America. Despiteadvanced technical capabilities and adequate advance warningof the various meteorological, hydrological, and even envi-ronmental and infrastructure threats involved, the severe policy,organizational and operational failures demonstrated thecrucial importance of shared knowledge associated with theneed for prior investment in risk management.
There extensive losses must lead to more mutually awareand effective actions between the public, technical practition-ers and political leaders at multiple levels of responsibility.None of these professional disciplines, nor the various respon-sible sectors of society, can any longer remain secure in onlyrelating to their own immediate, isolated, subject areas. Moderndisaster risks demand much greater outreach and wider rangingrelationships among technical professionals if their work is tohave wide public merit.
The Himalayan earthquake spanning Pakistan and India inOctober 2005 demonstrated the severe consequences ofweather and climatic conditions for relief and recovery activ-ities as more than three million people lost their houses just asharsh winter conditions rapidly approached. Without mini-mizing the needs for effective and timely relief services, thelong-felt implications of this Himalayan earthquake havedemonstrated the limitations of relying only on emergencyrelief capabilities, as Pakistan now seeks to establish a compre-hensive national approach to disaster risk awareness andmanagement.
Other seasonal considerations and the need for wide rangingglobal communication capabilities were also apparent duringthe northern hemisphere’s winter of 2005-06. The threat of awidespread global pandemic such as avian influenza, spreadby such uncontrollable factors as wildfowl migration, is causingmuch political anxiety and frantic contingency planning. Inmore localized environments, such as in tropical Africa, theneed for local communications between government authori-ties, health professionals, meteorologists and local communityleaders has been recognized as crucial to capitalize on the well-known temporal relationship between weather conditions andthe outbreak of serious malaria incidents.
Throughout this period, the growing concern about theeffects of global warming, climate variation and change contin-ued. The ten warmest years on record occurred during the
physical forces that generate these disasters may be natural inorigin as cited above, resulting in the commonly used phraseof ‘natural disasters’,4 a much wider importance needs to begiven to minimizing the conditions that contribute to theirmost severe effects.
Any potential disaster is a function of the risk process, occur-ring from the combination of a physical hazard and theconditions of vulnerability or physical, social and economicexposure in which people live. The extent of public under-standing about the natural hazards to which people are exposedto in a specific location, and the existing institutional capaci-ties or operational abilities local communities possess, equallycan reduce their exposure to threatening hazards. Technicalknowledge and a variety of communications services are essen-tial for maintaining such states of disaster preparedness andrisk management.
While natural hazards are part of nature and cannot beavoided, there is much existing knowledge, technical, andprofessional experience already existing within societies that canbe employed to minimize people’s exposure to the threats posedby weather, water and climatic conditions and thus reduce disas-ter risk. Many of these abilities exist within the NationalMeteorological Services of all countries.
Given the nature of global weather and climate, as well asdisaster risks which know or respect no political boundaries,it is essential that multi-disciplinary relationships dedicated togreater disaster awareness and risk management be createdwithin and between countries through organized internationalstructures like the United Nations International Strategy forDisaster Reduction (UN/ISDR).
Learning from disastersRecent disaster events can illustrate some of the challenges aswell as the opportunities for galvanizing a wider public recog-nition and motivating professional responsibilities and policycommitments in order to reduce future disasters. The tragicIndian Ocean tsunami of 26 December 2004, in which morethan 230,000 people died and which devastated the livelihoodsand property of millions more in the 12 countries directlyaffected, was a dramatic example of the rationale for educa-tion and effective early warning systems. Work has proceededrapidly over the past two years to recover, with shared resourcescommitted through the participation of many governments,international and local organizations, commercial businesses,NGOs, media and communications providers.
The global recognition of the practical value of early warning,and its feasibility to save people’s lives at the time of a disasterwas another direct benefit of the tsunami disaster. The interna-tional ISDR Platform for Promotion of Early Warning (PPEW)located in Bonn, Germany is dedicated to advancing the system-atic development of ‘people-centered’ early warning systems.Through greater awareness and practical projects such as thoseshowcased at the Third International Conference on EarlyWarning, held in Bonn in March 2006, these expanding insti-tutional commitments bring together the linked responsibilitiesof risk assessments, hazard monitoring and warning services,means of communications and better-prepared communities.
Global early warning received a further boost by the requestof UN Secretary General Kofi Annan to conduct a global surveyof early warning systems to assess capacities, gaps and oppor-tunities for building a comprehensive global early warningsystem for all natural hazards. Undertaken by a working group
3.Natural & Human induced disasters:Master spread 16/2/07 09:49 Page 121

[ ]122
period 1995-2006. In the words of Professor Peter Höppe, Headof Munich Re’s Geo Risks Research, “No one seriously disputesclimate change any more. In the long term, it will be a factorwhich increases the number of severe natural catastrophes.”6
A UK Government report highlighted several possible conse-quences of climate change related to future disasters:7
• There will be more examples of extreme weather patterns• Extreme weather could reduce global gross domestic
product (GDP) by up to 1 per cent• Floods from rising sea levels could displace up to 100
million people• Rising sea levels could leave 200 million people perma-
nently displaced• Melting glaciers will increase flood risks• Melting glaciers could cause water shortages for 1 in 6 of
the world’s population• Wildlife will be harmed; at worst up to 40 per cent of
species could become extinct• Droughts may create tens or even hundreds of millions of
‘climate refugees’• Crop yields will decline, particularly in Africa.
These examples provide indications that both the nature andthe potential magnitude of disaster impacts are changing,with far-reaching implications in global terms. These impli-cations must drive together the interests of policy makers,national and local government authorities, business leaders,and professionals or practitioners engaged with disaster risks,climate, food production, or other natural resource use orstewardship. There needs to be a thorough reconsiderationof how people in positions of responsibility understand thedisaster risks that they are likely to be exposed to, and a muchgreater need to reach out and relate to other associated profes-sional interests.
It becomes increasingly important too, to identify and relateto ‘wider area networks’ in spatial, professional and commu-nications terms. In the inter-connected, globalized world ofthe modern era it is not even necessary for a crisis to occur inpeople’s immediate environment for them still to be affected.This recognition needs to become the basis for wider publicawareness, further education and systematic global arrange-ments in order to link future disaster reduction with the idealof more secure and safer societies and to protect the develop-ment accomplishments and ensure sustainability.
Opportunities for action through the ISDR systemA key development in shifting global awareness towards amore active engagement in disaster risk reduction was theUnited Nations World Conference on Disaster Risk Reduction(WCDR) held in Kobe, Japan in January 2005, a few weeksafter the Indian Ocean Tsunami tragedy. There, representa-tives of 168 countries adopted the Hyogo Framework for Action2005-2015: Building the Resilience of Nations and Communitiesto Disasters.8 This framework lays out a detailed ten-year planto make disaster risk reduction an essential component ofdevelopment policies, plans and programmes. The manysubjects related to disaster risk reduction span abilities andconcerns routinely identified within professional disciplinesengaged with various development sectors, environment,hazard studies and risk management practices, as well as thoseof disaster or emergency management, response and recoveryprogrammes.
As the basis for future accomplishment and an expressionof the key elements of effective disaster risk reduction in prac-tice, the Hyogo Framework puts forward three strategic goalswhich may serve as guiding principles in any efforts to advancefuture education for disaster reduction. It calls for the inte-gration of disaster risk reduction into sustainable developmentpolicies and planning; the need to develop and strengthen insti-tutions and capacities to build resilience to hazards; and thesystematic incorporation of risk reduction practices into emer-gency preparedness, response and recovery programmes.
Most importantly, it provides a basis that commits govern-ments as well as regional, international, and non-governmentalorganizations to reduce disaster risks through a range of possi-ble approaches and activities presented in five priority areasfor action. This framework provides an outline and elaboratesmany possible activities to be pursued by various actors thatwill necessarily be involved, practitioners of different profes-sional disciplines in commercial, educational, public or privateentities.
The five priority areas of action of the Hyogo Framework arecited below, with some suggestions whereby technical practi-tioners and professionals engaged in weather, water and climatepractice can apply their knowledge and experience in the realmof disaster risk reduction.
1. Governance – to ensure that disaster risk reduction is anational and local priority with strong institutional basis forimplementation:
• National Meteorological and Hydrological Services(NMHSs) can provide important leadership and supportto participation in national disaster reduction platforms,given their long-standing institutional viability, public visi-bility and relationship with many social, economic andtechnical activities
• National climate change planning processes shouldbecome crucial instruments for wider disaster risk reduc-tion commitments
• The trans-national aspects of weather, water and climatecombined with extensive established and continuousinternational communications provides an existingnetwork for disaster risk communications, and as may berequired, mobilization related to disaster risks with neigh-bouring countries
• NMHSs should develop closer and interactive relation-ships with various other sectors involved in DRR forcontinuous exchange of information and developmentat local and national levels.
2. Risk identification – to identify, assess and monitor disasterrisks and enhance early warning:
• The wealth of accumulated national historical data andanalytical abilities existing within NMHSs provides a firmfoundation to develop national or local hazard and disas-ter databases, essential for disaster risk assessments
• Specialized technical centres can provide institutionalfocus for disaster risk monitoring, analysis and commu-nications for routine economic and commercialendeavours as well as early warning activities at time ofspecific threat
• Hazard identification, technical analysis and monitoringare inherent to effective early warning of potential disas-ter circumstances
3.Natural & Human induced disasters:Master spread 16/2/07 09:49 Page 122

• Existing NMHSs communications for technical data,sector-relevant information, and public information arecritical elements for all aspects of disaster risk assessmentprocesses and early warning practices. When associatedwith accumulated data and information resources, suchcommunications facilities provide a basis for wider profes-sional synergy and commercial engagement in managingdisaster risks.
3. Knowledge – use knowledge, innovation and education tobuild a culture of safety and resilience at all levels:
• The extensive influence of weather, water and climatethroughout societies provide considerable opportunitiesfor the development and delivery of educational materials– for policy relevance, professional training, private andpublic educational curricula, and public information andawareness
• Opportunities abound to link weather, water and climateinformation and knowledge with wider societal awarenessand policy commitments to disaster risk managementopportunities – prior to the onset of (as well as follow-ing) emergency or crisis conditions
• Multi-disciplinary and wide-spread, policy relevantresearch agendas that relate to weather, water, climate, anddisaster risks can be spearheaded by NMHSs, with partic-ular relevance given to their shared economic, commercialor social implications
• Develop joint NMHS – educational institution programmeswith research, learning, or professional training opportu-nities that marry weather, water, climate and disaster riskinterests and insights.
4. Reduce underlying risk factors that increase the likelihood ofdisasters by involving (‘mainstreaming’) disaster risk aware-ness and management with other professional or sectoralsubject areas:
• Associate climate and disaster risk interests, data andcommunications abilities within NMHSs explicitly withthe roles and interests of other professional, commercialand policy requirements of related sectors, including thoseof:
- Agriculture, animal husbandry, fisheries- Food processing and distribution- Water resource use and management- Environment, natural resource management- Health - Energy generation, distribution, and use- Transportation- Tourism, recreation and sports- Construction, engineering, critical public infrastructure- Information and communications technology- Space technology, remote sensing, planning and land-use
analysis- Economics, financial investment, risk transfer, insurance- Social benefits, public information and engagement,
community participation.
5. Strengthen disaster preparedness for effective response:• Provide data and historical knowledge as contribution to
the creation, review or revision of national disaster andrisk management legislation, land-use regulations, zoningpractices, etc
• Prior establishment of data and information requirementsof governing authorities, emergency services and/orcommercial interests related to disaster requirements inair, on land or water at the time of crisis or as may beappropriate for longer-termed climatic threats such associal and economic implications of El Niño, globalwarming, etc
• Prior established roles and capabilities related to data,information, analysis or research related to weather, wateror climate and disaster risk implications following crisismanagement / emergency response event; post factolessons learned and communicated to wider communityof interests, within an immediate affected community,regional, national, provincial officials or metropolitan localauthorities and/or specific business interests affected bythe crisis.
The challenge now is to turn these many possibilities andopportunities into practical measures and activities at all levels,and within means by which progress in disaster reduction canbe measured. Contrary to conventional public views, there isan abundance of technical knowledge, professional experienceand even specific examples especially within the professionalcommunities associated with weather, water and climate, thatcan guide and inform efforts to lessen disaster risks much morewidely and with considerable effectiveness.9
A great need remains, however, to sustain the allocation ofresources and to realize institutional capabilities to use, and toshare more widely, what is already known, so that more peoplemay be safe from disasters by reducing their vulnerability tonatural hazards.
[ ]123
El Salvador Earthquake, 2001
Phot
o: M
r. Jo
rge
Jenk
ins,
PA
HO
3.Natural & Human induced disasters:Master spread 16/2/07 09:49 Page 123
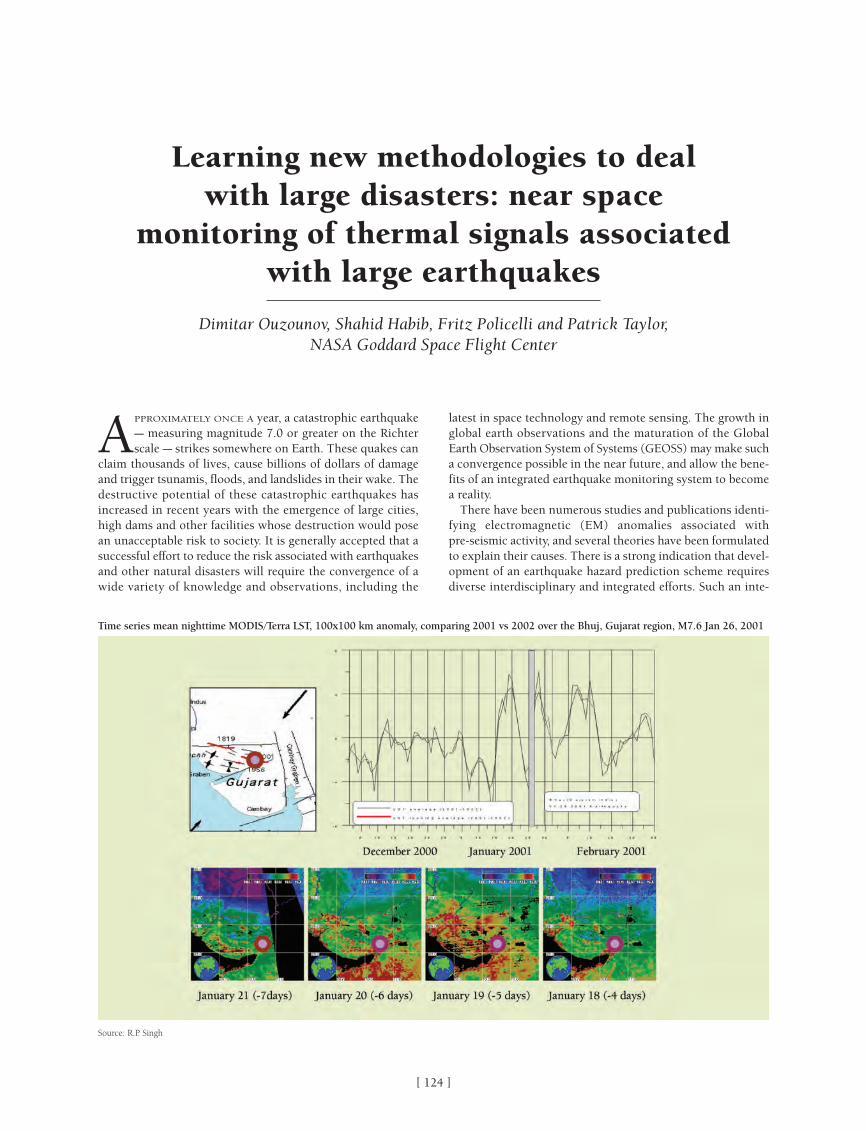
[ ]124
APPROXIMATELY ONCE A year, a catastrophic earthquake– measuring magnitude 7.0 or greater on the Richterscale – strikes somewhere on Earth. These quakes can
claim thousands of lives, cause billions of dollars of damageand trigger tsunamis, floods, and landslides in their wake. Thedestructive potential of these catastrophic earthquakes hasincreased in recent years with the emergence of large cities,high dams and other facilities whose destruction would posean unacceptable risk to society. It is generally accepted that asuccessful effort to reduce the risk associated with earthquakesand other natural disasters will require the convergence of awide variety of knowledge and observations, including the
latest in space technology and remote sensing. The growth inglobal earth observations and the maturation of the GlobalEarth Observation System of Systems (GEOSS) may make sucha convergence possible in the near future, and allow the bene-fits of an integrated earthquake monitoring system to becomea reality.
There have been numerous studies and publications identi-fying electromagnetic (EM) anomalies associated withpre-seismic activity, and several theories have been formulatedto explain their causes. There is a strong indication that devel-opment of an earthquake hazard prediction scheme requiresdiverse interdisciplinary and integrated efforts. Such an inte-
Learning new methodologies to deal with large disasters: near space
monitoring of thermal signals associated with large earthquakes
Dimitar Ouzounov, Shahid Habib, Fritz Policelli and Patrick Taylor, NASA Goddard Space Flight Center
Time series mean nighttime MODIS/Terra LST, 100x100 km anomaly, comparing 2001 vs 2002 over the Bhuj, Gujarat region, M7.6 Jan 26, 2001
Source: R.P. Singh
3.Natural & Human induced disasters:Master spread 16/2/07 09:49 Page 124

[ ]125
of a number of major earthquakes with a magnitude greaterthan 5.0 and a focal depth of less than 50 km.
NASA analysed data from a number of satellites including:NASA’s Moderate Resolution Imaging Spectroradiometer(MODIS) on Terra and Aqua; NASA’s Atmospheric InfraredSounder (AIRS) on Aqua; NOAA’s Geostationary OperationalEnvironmental Satellite (GOES) and Polar OrbitingEnvironmental Satellites (POES); the French Centre Nationald’Etudes Spatiale’s Detection of Electro-Magnetic EmissionsTransmitted from Earthquake Regions (DEMETER); and groundobservations The rationale for using this ensemble of observa-tions was sufficient spatial and temporal coverage of precursorsignals to enable correlations to past earthquake events.
Bhuj, IndiaOn 26 January 2001, a magnitude 7.7 earthquake struck Bhuj(Gujarat), India. The quake occurred during a period of clearweather, which is ideal for TIR observations. NASA analyseddata fromTerra/MODIS, which observes the Gujarat regiontwice a day. As shown in the image above, the main stress wasreleased along the Katrol Hill and Mainland faults.4 The timeseries in the upper right shows the average land surface temper-ature (LST) anomaly (departure from average) as measured bythe nighttime overpass of Terra/MODIS from December 2000to February 2001 as well as a running average that smoothesout some of the more extreme values – the day of the quakeis shaded in grey. The time series shows that there is apronounced and statistically significant positive LST anomaly,with temperatures running up to 4 degrees Celsius above theaverage background values. This anomaly starts five to six daysprior to the quake in the area within 200 km of the epicentre.5
Shown in the bottom portion of the illustration are a series ofimages from Terra/MODIS taken between 18 January and 21January that show the evolution of the LST anomaly over a100 km2 region a few days prior to the quake. The anomalouslyhigh temperature values are observed over this period, andvalues return to near normal on 22 January. This kind ofanomaly could be associated with stress-related changes of airnear the ground in response to the release of radon gas andchanging humidity levels. (Water vapour and radon would behighly absorbed in the 10-11 μm range).6
Colima, MexicoOn 21 January 2003, a magnitude 7.8 earthquake struckColima, Mexico. NASA used a variety of independent datasources to analyse the atmospheric variations caused by thequake. For this analysis, we had access to data from MODISon both Terra and Aqua – Aqua had not yet launched at thetime of the Gujarat eruption – and we also analysed ground-based temperature data. The appearance and temporalevolution of the atmospheric variations are synchronised intime and demonstrate a similar spatial distribution in all of thedatasets used. Using nighttime emissions from polar orbitingsatellite data, we have analyzed the LST data over 90 days bymeans of the 11-12 metre emissivity ratio covering an area of100 km2 around the epicentre.7
The graph illustrates the variations of the nighttime LST forTerra (curve A) and daytime LST for Aqua (curve B) for theperiod from 1 December 2002 up to 1 March 2003 for thesquare 100km2 around the Colima epicentre. Between 15 and17 January, a pronounced LST increase can be observed for thearea close to the epicentre of the event. To verify the signifi-
grated, interdisciplinary approach is advocated by US seis-mologist Ari Ben-Menahem, who said: “Unless we launch aconcentrated interdisciplinary effort, we will always besurprised by the next major earthquake.”
Current scientific research indicates that satellite thermalimaging data has not only revealed stationary (long-lived) thermalanomalies associated with large linear structures and fault systemsin the Earth’s crust1 but also transient (short-lived) features priorto major earthquakes.2 These short-lived anomalies:
• Typically appear between four and fourteen days beforean earthquake
• Affect regions of several to tens of thousands of squarekilometres
• Display a positive deviation of 2-4 degrees Celsius or more• Die out a few days after the event.
These anomalies are not simply the result of thermal variationscaused by a heat pulse rising from below the Earth’s crust, asthe speed at which the anomalies appear and disappear is muchmore rapid than what is seen with a heat pulse.
Feasibility of space observations for earthquake studiesObservational and scientific evidence collected over the last20 years confirms that EM phenomena often accompany orprecede earthquake events. Recent studies also confirm thatthere is strong coupling between EM activity in the atmos-pheric boundary layer and the ionosphere – both directcoupling through EM phenomena and indirect couplingthrough tectonically forced vertically propagating gravity wavesthat are strongly related to enhanced tectonic activity. Theconcept of lithosperic-atmospheric-ionospheric coupling(LAIC)3 links increased gas emanations in advance of seismicactivity to a chain of physical processes involving ionisationof air molecules and plasma chemical reactions in the ionos-phere. LAIC views the ionosphere as part of the global electriccircuit, and suggests that the ionosphere immediately reacts tochanges in electric properties near the ground. A number ofdifferent spacecraft have detected these kinds of phenomenafrom space over the past few decades.
It is unlikely that any single existing method for advanceearthquake detection – for example magnetic field, electricfield, thermal infrared, surface latent heat flux (SLHF), andglobal positioning system (GPS)/total electron count (TEC) –can provide sufficient information to detect potential earth-quake phenomena from space on a global scale. Rather, theenvisioned solution would bring together a number of differ-ent satellite Earth observations and ground measurements inan integrated ‘sensor web’ to provide the information neces-sary for advance warning of tectonic events.
Using TIR measurements to detect earthquakesThermal infrared (TIR) measurements are a possible methodof detecting earthquakes in advance from space. The increasednumber of satellite measurements (including a number ofNational Aeronautics and Space Administration (NASA) andNational Oceanic and Atmospheric Administration (NOAA)satellites) of surface temperature at different infrared wave-lengths in recent years has opened up this ‘thermal brand’ ofdetection techniques. TIR surveys gave an indication of theappearance – from days to weeks before the event – of anom-alous space-time TIR transients that have been associated withthe location (epicentre and local tectonic structures) and time
3.Natural & Human induced disasters:Master spread 16/2/07 09:49 Page 125

[ ]126
cance of this enhancement we built the yearly LST anomalybetween 2002 and 2003.
LAIC concept can explain the existence of the TIR anomaliesprior to major earthquakes. Using the collected experimentaldata, we can reconstruct the possible evolution of the atmos-phere-ionosphere anomalies preceding the Colima earthquake.From the end of December 2003 we observe nighttime surfacetemperature increases in the area of the earthquake preparation(Curve A). One can associate this anomaly with the start of thepossible radon gas anomaly – the heating starts in the surfaceground layer. Then the gases appear in the near surface layer ofthe atmosphere and heating becomes noticeable on the daytimerecords of MODIS and on the records of the local meteorologi-cal observatories (Curve D). The thermal air anomaly reaches itsmaximum in the middle of January and is accompanied by theabsolute monthly minimum of the relative air humidity.8
In summary, the complex analysis of TIR satellite dataretrieved by polar orbiting satellite measurements around thetime of selected earthquakes reveals that transient TIR anom-alies occurred prior to these earthquakes and confirmed theearlier findings. The process starts along the main tectonicfault zone and variations could be seen in a radius of approx-imately 100km around the epicentre over the land and sea.The optimal conditions for detecting similar anomalies aredry, cloud-free, low-vegetation scenes with a long observa-tion baseline. Independent techniques based on differentEarth observation satellite sources confirms the existence ofpositive TIR anomalies prior to strong earthquakes, charac-terised by different seismo-tectonic settings. This outcomecould be used as basis for theoretical studies refining themechanism of these phenomena and for creating a new layerof a global earthquake monitoring system which could benefitthe current seismic regional network and have huge economicand societal effects on the building of early warning systemsover the major hazardous regions.
Earthquakes have significant impacts on society through thedestruction they bring. A local earthquake has the potentialfor global impact when one includes societal loss in produc-tion, energy, health, food and water resources. The ability tosense earthquake potential could have enormous benefits forsociety if the information is used intelligently to relay riskpotential. Much more research is needed in this area, but itcertainly offers a great deal of potential and should be an areafully supported by the science community. We advocate a size-able increase in the Earth observations used for land remotesensing. This will allow us to understand the uncertainty insuch predictions, and realise the social science impacts of earth-quake prediction.
10
20
30
0
30 Nov
RMS
Tem
pera
ture
res
idua
l 200
3-20
04 (˚
C)
A. Running average T2003-T2004 Terra/MODIS LST night B. Running average T2003-T2004 Aqua/MODIS LST day
C. Running average T2003-T2004 test area MODIS/Terra LST night D. Running average T2003-T2004 night air T for Colima
04 Dec
08 Dec
12 Dec
16 Dec
20 Dec
24 Dec
28 Dec
01 Jan
05 Jan
09 Jan
13 Jan
17 Jan
21 Jan
25 Jan
29 Jan
02 Feb
06 Feb
10 Feb
14 Feb
18 Feb
22 Feb
26 Feb
02 Mar
Colima M7.9 earthquake - January 21, 2003
Joint temperature variations (A, B, and C) satellite, and ground air temperature (D) variations around M7.6 Colima 01.22.2003.
Source: NASA
Bhuj earthquake 2001: Image created by combining Landsat 7 andSRTM data. The gray area in the middle of the picture shows the cityof Bhuj, which was almost completely destroyed
Phot
o: N
ASA
/JPL
/NG
A
3.Natural & Human induced disasters:Master spread 16/2/07 09:49 Page 126

[ ]127
THERE HAVE BEEN many recent studies suggesting thatlosses due to flooding have increased over the pasttwenty years. Some studies claim that these losses have
been increasing at a faster rate than growth in population andeconomic development. This in turn suggests that the numberof people in danger, the amount of property at risk and thefrequency of severe events may also be growing.
Flood forecasting and warning systems are an integral partof emergency and floodplain management. Effective floodwarning systems maximize the opportunity for the imple-mentation of response strategies aimed at securing the safetyof people and property, and reducing avoidable flood damage.The total flood warning system concept has been promoted torepresent all of the elements of a system that need to worktogether to provide effective forecasts and warnings. The totalsystem includes elements of monitoring, prediction, interpre-tation, message construction, communication and protectivebehaviour. For flood warning systems to be effective, they mustprovide information for emergency service groups and thepublic, that is timely, accurate, easy to understand and clear inits practical application.
Specific requirements will depend on local conditions,including the scale of the problem and the level of access to
information. However, as a general principle, initial require-ments are:
• Advance warning of when a river will reach a specifiedheight that will cause flooding
• Sufficient warning lead-time for appropriate protectiveaction to be taken
• Awareness of the potential future level of flooding • Assure awareness of the flood risk in the threatened
community.
Basic hydrological information, river height and flow, catch-ment modelling capabilities and any additional weatherinformation that will contribute to the warning lead-time areessential factors to the forecast and warning agency.
Concerns of information providers and user expectations The primary issues and concerns for information providersinclude the operation and maintenance of monitoring systems,the quality of modelling capabilities, the accuracy (measure ofuncertainty) of the forecast and the amount of warning lead-time that can be provided. In particular, key steps undertaken byinformation providers include the operation of in-situ monitor-ing and measuring devices (both rainfall and river level) and the
Disaster mitigation and preparedness: flood forecasting and warning
Mr Bruce Stewart, President, WMO Technical Commission for Hydrology
Flood impact is usually widespread
3.Natural & Human induced disasters:Master spread 16/2/07 09:49 Page 127

[ ]128
occur at any time, but also that there can be long periodsbetween events, during which awareness can decline.
In a more practical sense, it is imperative that the mainte-nance and operational capability of service providers isensured, and that users understand the importance of thesustainability of these systems. Furthermore, users must beaware of, and grasp the implications of the capabilities andlimitations of the warning systems. This includes the vitalunderstanding that the total system will only be as strong as itsweakest link, and therefore all components must be regularlyreviewed and examined. Lastly, both parties must appreciatethat advances will require an investment in research to improvethe scientific and technical facets of the service.
Service providers, of course, have an equal responsibility tomaintain the relationship. They must understand the specificrequirements of the users in each situation, determine the keytrigger points as well as when and what type of action should betaken. However, it is also necessary to consider social and culturalissues. There is no one specific solution for all situations, andeven within a community, vulnerabilities differ and thus requiredifferent approaches for the effective warning of each group.There should also be common recognition that with growingpopulations and economies, and also the possible implications ofclimate change, the community at risk may be increasing andtherefore that problems can arise in previously unaffected areas.
Ultimately, success relies on a balance in the relationshipbetween the users and providers. Vitally, contact must be main-tained between the two. Most users and providers have otherroles and responsibilities, and therefore interaction and coordi-nation must be formally set in place and regularly reviewed. Itis also vital to recognize the important role of the media in theprovision of services, and to consider how to optimise this undercurrent arrangements. Finally, adequate feedback and eventreview mechanisms must be implemented, with the conditionalunderstanding that mistakes will occur and that while negativeconsequences can be minimized through the application of riskmanagement approaches, having resilient community structuresin place to learn from such failures is also essential.
development of hydrological models that can use current andforecast information to provide estimates of future flood levels.
Information users including the emergency services, indus-try, the community at risk and the media, are primarilyconcerned with access to the information, its accuracy, andunderstanding the actions they need to take. Users expect toreceive accurate and timely information on which they canmake specific decisions and undertake prescribed actions, suchas providing supplies and equipment, prompting evacuationsor building sandbag levees. Users also need information on theexpected period of inundation, the possibility of follow-upevents and the status of key services such as power, watersupply and sewerage.
A further issue is that providers need to be prepared to ‘persuade’users. Users must be sensitized to the information that will beprovided, so that they are ready to take the right action. Publiceducation also plays a role here, but it is not the whole story.
In the case of floodplain management, users require advanceinformation on areas and services at risk of flooding. Thisallows them to undertake appropriate and effective land-useplanning, thus mitigating the impacts of future flooding. Suchinformation is also valuable in the development and construc-tion of physical flood control works. However, a balancebetween structural and non-structural measures aimed at‘living with floods’ is promoted.
How to optimize information delivery Delivery processes usually fall into ‘push’ or ‘pull’ mechanisms.Because of the need to deliver information promptly and effi-ciently to all of the required recipients, most information isprovided using push techniques. These will vary from situa-tion to situation, but include facsimiles, phone calls, SMSmessages, e-mails, sirens, loud speakers, radio, television andword of mouth. The delivery mechanism will depend on thecharacteristics and location of the community at risk, theamount of lead warning time required and the capabilities andlimitations of the early warning system in place.
Consultation and communication are therefore the keyelements in determining the optimum delivery mechanism ineach case. This must involve discussions and input from all ofthe responsible authorities and stakeholders, and in particu-lar the community at risk. National Meteorological andHydrological Services, water authorities, emergency serviceagencies and local government groups must work together todevelop and implement sound and sustainable systems. Thecommunity at risk must understand when it is best to imple-ment prescribed actions, and the possible consequences of suchactions. The media can therefore play a significant role bywarning of danger, but also by contributing to communityeducation and preparedness.
The importance of community awareness should not beoverlooked. The use of pamphlets, fridge magnets, newspaperarticles, school education programmes, television shows andcommunity groups should be strongly considered. In parti-clular the Internet is invaluable as both an information sourceand a service delivery mechanism.
Bridging the gap between users and providersA healthy relationship between users and providers is essential,but presents numerous challenges. A fundamental, sharedunderstanding of the risk that floods represent is needed. Thisincludes the recognition that floods are event-based and can Floods affect significant sections of the community
3.Natural & Human induced disasters:Master spread 16/2/07 09:49 Page 128

[ ]129
SOLVING COMPLEX HUMAN environment problems hasincreasingly required that organizations employ interdis-ciplinary strategies.1 Organizations that have been able
to successfully integrate data and ideas from both the socialsciences and the physical sciences are of particular interest toremote sensing data producers seeking to demonstrate the soci-etal benefit of their work. The US Agency for InternationalDevelopment’s (USAID) Famine Early Warning SystemNetwork (FEWS NET) uses biophysical datasets to inform thepolitical process of humanitarian aid and response to food secu-rity crises in the developing world.
Interdisciplinary organizations such as FEWS NET face manychallenges, among them a large and continually changing bodyof stakeholders; working with and understanding diverseconcepts; finding a common language to communicate ideasand strategies; trusting research that many team members haven’tthe skills to assess, and having strong leadership to ensure
mission success and ultimately continued funding. How thesechallenges are met will have a significant impact on the organi-zation’s ability to continue to secure funding and to be successfulin achieving its mission.
As a long-standing USAID-funded project, FEWS NETprovides an example of the processes and methodologiesrequired for a large interdisciplinary decision support system.FEWS NET has recently been reauthorized until 2009, and sinceits inception in the mid-1980s, has used state-of-the-art socialscience methodologies for food security monitoring, coupledwith advanced models, satellite measurements and geographicinformation system (GIS) technology for monitoring threats tofood production and biophysical hazards. FEWS NET providesdecision support to a wide range of decision makers, from headsof international organizations to local and national decisionmakers who require specific, integrative analysis for smallgeographical areas. By focusing on the food security impact ofbiophysical variations, FEWS NET is able to connect images ofremote sensing to their impact on the lives and livelihoods oflocal residents.
Satellite remote sensing data from NASA are used in manyaspects of FEWS NET’s work. By providing spatially complete,accurate, and timely data, NASA contributes significantly to theability of the humanitarian field to provide appropriate decisionsupport to a wide variety of decision makers. In a complex deci-sion-making environment, remote sensing information providesa robust foundation upon which consensus regarding the needsand hazards facing a particular community can be built.Although FEWS NET has a broad range of other informationsources, remote sensing information remains a critical input totheir analysis.
USAID’s Famine Early Warning System Network The goal of FEWS NET is “to provide decision makers withaccurate, timely and actionable information to prevent hunger-related deaths, mitigate food insecurity, and strengthenlivelihoods in Africa, Central America and the Caribbean, andAfghanistan through providing early warning information relatedto food security threats, developing information networks, andbuilding capacity for information generation and dissemina-tion”.2 FEWS NET involves an intergovernmental agreementbetween USAID, the National Aeronautics and SpaceAdministration (NASA), the National Oceanic and AtmosphericAdministration (NOAA), the US Department of Agriculture(USDA) and the US Geological Survey (USGS).
Although FEWS NET activities conducted in the participat-ing organizations are important to its ability to provide data
Satellite remote sensing for early warning of food security crises
Molly E. Brown, NASA Goddard Space Flight Center
Rainfall data from the National Oceanic and AtmosphericAdministration’s Climate Prediction Center’s rainfall estimate in mm during the month of December, 2006
Source: NASA
3.Natural & Human induced disasters:Master spread 16/2/07 09:49 Page 129
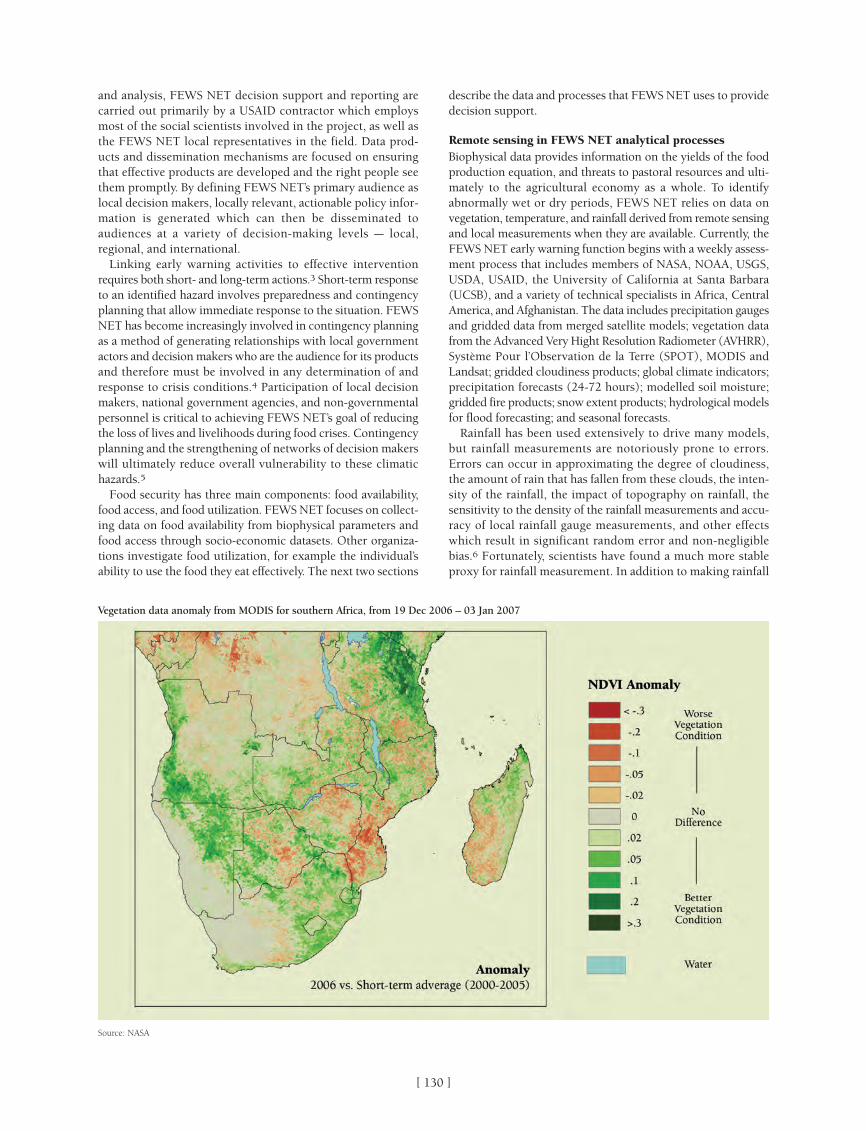
[ ]130
describe the data and processes that FEWS NET uses to providedecision support.
Remote sensing in FEWS NET analytical processesBiophysical data provides information on the yields of the foodproduction equation, and threats to pastoral resources and ulti-mately to the agricultural economy as a whole. To identifyabnormally wet or dry periods, FEWS NET relies on data onvegetation, temperature, and rainfall derived from remote sensingand local measurements when they are available. Currently, theFEWS NET early warning function begins with a weekly assess-ment process that includes members of NASA, NOAA, USGS,USDA, USAID, the University of California at Santa Barbara(UCSB), and a variety of technical specialists in Africa, CentralAmerica, and Afghanistan. The data includes precipitation gaugesand gridded data from merged satellite models; vegetation datafrom the Advanced Very Hight Resolution Radiometer (AVHRR),Système Pour l’Observation de la Terre (SPOT), MODIS andLandsat; gridded cloudiness products; global climate indicators;precipitation forecasts (24-72 hours); modelled soil moisture;gridded fire products; snow extent products; hydrological modelsfor flood forecasting; and seasonal forecasts.
Rainfall has been used extensively to drive many models,but rainfall measurements are notoriously prone to errors.Errors can occur in approximating the degree of cloudiness,the amount of rain that has fallen from these clouds, the inten-sity of the rainfall, the impact of topography on rainfall, thesensitivity to the density of the rainfall measurements and accu-racy of local rainfall gauge measurements, and other effectswhich result in significant random error and non-negligiblebias.6 Fortunately, scientists have found a much more stableproxy for rainfall measurement. In addition to making rainfall
and analysis, FEWS NET decision support and reporting arecarried out primarily by a USAID contractor which employsmost of the social scientists involved in the project, as well asthe FEWS NET local representatives in the field. Data prod-ucts and dissemination mechanisms are focused on ensuringthat effective products are developed and the right people seethem promptly. By defining FEWS NET’s primary audience aslocal decision makers, locally relevant, actionable policy infor-mation is generated which can then be disseminated toaudiences at a variety of decision-making levels – local,regional, and international.
Linking early warning activities to effective interventionrequires both short- and long-term actions.3 Short-term responseto an identified hazard involves preparedness and contingencyplanning that allow immediate response to the situation. FEWSNET has become increasingly involved in contingency planningas a method of generating relationships with local governmentactors and decision makers who are the audience for its productsand therefore must be involved in any determination of andresponse to crisis conditions.4 Participation of local decisionmakers, national government agencies, and non-governmentalpersonnel is critical to achieving FEWS NET’s goal of reducingthe loss of lives and livelihoods during food crises. Contingencyplanning and the strengthening of networks of decision makerswill ultimately reduce overall vulnerability to these climatichazards.5
Food security has three main components: food availability,food access, and food utilization. FEWS NET focuses on collect-ing data on food availability from biophysical parameters andfood access through socio-economic datasets. Other organiza-tions investigate food utilization, for example the individual’sability to use the food they eat effectively. The next two sections
Vegetation data anomaly from MODIS for southern Africa, from 19 Dec 2006 – 03 Jan 2007
Source: NASA
3.Natural & Human induced disasters:Master spread 16/2/07 09:49 Page 130

[ ]131
measurements, they also use normalized difference vegetationindex (NDVI) measurements to assess the impact of rain onlocal vegetation. NDVI data derived from satellites measurethe photosynthetic activity resulting from vegetation growththat occurs as a result of rainfall, and are an important sourceof information for FEWS NET.7 Because they measure verydifferent things, both variables continue to be of value tohazard identification.
Members of the many FEWS NET organizations teleconfer-ence weekly to discuss and identify potential flood and droughthazards, and then prepare and issue weekly weather hazardreports, which are posted on the FEWS NET site.8 These reportsare delivered to a large local, regional, and international audi-ence in Africa, Latin America, Asia, and in the United States.They provide information that indicates where more intense,on-the-ground monitoring should occur. The weekly weatherhazard discussions are led by the meteorologists at NOAA’sClimate Prediction Center, and guided by FEWS NET food secu-rity experts who orient hazard discussion towards identifyingits affect on local livelihoods.
By collaborating with scientists from NOAA, NASA andUSGS, as well as with FEWS regional and country represen-tatives and the USGS FEWS NET regional representatives,expert FEWS personnel work together to determine theimpact of these weather hazards on local communities. Thisis done using a livelihoods-based analysis system that providesthe framework for interpretation of routine monitoring data,for example rainfall, vegetation, crop production, and marketprices. These monitoring data are valuable indicators of foodsecurity, but it is difficult to link changes in these indicatorsto changes in the food security status of affected households.9
Using remote sensing data constructively in a complexenvironmentThe FEWS NET activity is on its fifth reauthorisation atUSAID, and in the next phase FEWS NET will be charged
with continuing its current activities, expanding itsgeographic scope, and increasing the types of issues it reportson. This extraordinary length of experience coupled with thediversity of its interagency and international partners makethe FEWS NET project worthy of study. Although FEWS NETis unable to solve the underlying structural and fundamentalproblems of the humanitarian and development sector, itplays a key role in helping to prevent people from perishingin crises, and ensuring that these crises are not ignored bythe wider world.
The need for FEWS NET reporting is projected to continueto increase, and as it does it is crucial that the informationand presentation of its decision support analysis be as audi-ence-focused as possible. In many regions, FEWS NET isoperating in a continually worsening environment, whereenvironmental hazards, increasing populations, and declininginvestment in local data and information gathering, holdingand reporting activities result in increased reliance on outsidesources of information. Working in concert with multiplegovernmental and non-governmental development agencies,FEWS NET continues to play a key role in information gath-ering and distribution for early warning of food insecurity inthe regions in which it works. The credibility of the infor-mation it produces is one of FEWS NET’s primary assets inits role of consensus building. Remote sensing informationand analysis remains at the centre of these efforts, as it is thefoundation upon which FEWS NET’s hazard identificationand food production analysis rests.
Examples of satellite contributions to humanitarian actionThere are numerous examples that demonstrate how data fromEarth-observing satellites have been used in data-sparse regionsof the Earth, improving estimates of food aid needs in vulner-able areas. The following are some brief examples of theexisting products that have contributed to decision support.
Snow depth for water available for irrigation – The productis used in estimating irrigated water supply and ultimatelyfood security for the northern regions of Afghanistan. Due toan early melt of the snow pack in the spring of 2006, foodprices increased significantly in northern Afghanistan follow-ing the harvest. Coupled with a shortage of animal food,livestock prices have decreased by 30-40 per cent in the north-western provinces. These factors together have increased foodinsecurity, and the remote sensing data has provided a goodunderstanding of what was happening in an otherwise inac-cessible region.
Extreme rainfall impacts on crop production in Honduras –NASA data informs hazard analysis in Honduras, a countrythat is very vulnerable to severe tropical weather. Basic grains,African palm, banana trees, and sugar cane are particularly atrisk from damage caused by heavy rainfall throughout thecountry. Immediate hazards to citizens from floods and land-slides are also monitored. Heavy rains increase the risk of cropplagues and disease (such as oidium) which can result in croplosses between 25 and 30 per cent.
Crop production monitoring using MODIS data – MODISanomalies from a five-year mean are used to estimate cropproduction anomalies and pasture deficits in semi-arid regionsof West Africa. The five-year mean from 16-31 October 2006in West Africa indicated strongly positive conditions enablinga recovery of food insecure regions of Niger.
0
5000
10000
15000
20000
25000
30000
Year
CFA
F
0
10
20
30
40
50
60
70
80
Kg
Mill
et p
er G
oat
Jan Feb Mar Apr May Jun Jul
Millet price (100kg) Goat price (1 goat) Ratio Goat/Millet
Analysis of the terms of trade for pastoralists and farmers in Nigerseeking to sell livestock to augment food supplies
Source: NASA
3.Natural & Human induced disasters:Master spread 16/2/07 09:49 Page 131

[ ]132
IN NEW RESEARCH with slum dwellers in six African cities,ActionAid has uncovered that there are few, if any, collec-tive mechanisms for reducing flood risks or for managing
floods once they do happen. Instead, poor people are left tofend for themselves however they are able.1
Urbanization and climate change in AfricaEnvironmental refugees are already swelling the tide of rural-to-urban migration across Africa. The trend is expected toincrease as climate-related drought and floods intensify andgrow more frequent, and rural Africans seek a more secure lifein the city. By 2030, the majority of Africa’s population will livein urban areas. However, global warming is also bringingincreased chronic flooding to the cities, increasing the vulner-ability of the urban poor throughout Africa.
Already the urban poor have no choice but to build theirhomes and grow their food in hazardous places such as riverflood plains. Others construct their shelters on steep, unsta-ble hillsides, or along the foreshore on former mangroveswamps or tidal flats. Whether already vulnerable to destruc-tive floods, damaging landslides or storm surges, climatechange is making the situation of the urban poor worse.
The right to adequate housing and ‘continuous improvementof living conditions’ was recognized more than three decadesago by the governments that ratified the InternationalCovenant on Economic, Social and Cultural Rights. Six yearsago, at the UN Millennium Summit, world leaders set a specifictarget for realizing that right by pledging to achieve ‘a signifi-cant improvement in the lives of at least 100 million slumdwellers’ by 2020. However, in Africa – the world’s fastest
Climate change, flooding and the protection of poor
urban communities in Africa
Ian Douglas, Emeritus Professor, School of Environment and Development, University of Manchester, Jack Campbell and Yasmin McDonnell,
Emergencies and Conflict Team, ActionAid International
Flooding in Lagos, Nigeria
Phot
o: G
ideo
n M
ende
l/Cor
bis/
Act
ionA
id
3.Natural & Human induced disasters:Master spread 16/2/07 09:49 Page 132

[ ]133
originally two metres deep, is now only 30 cm deep due to anaccumulation of sediment and rubbish. It is also linked to theincreased number of houses which yield much more runofffrom a given quantity of rain.
Local Kampala people claim that floods are now morefrequent and more severe. The flooding used to occur inpredictable cycles in the two main rain seasons of April-Mayand October-November, but now occurrences have becomeerratic and unpredictable
The response to floods in July 2006 was characterized by adhoc individual short-term efforts to survive and protect prop-erty. In addition, some residents undertook collective work toopen up drainage channels, some temporarily moved to lodgesand public places like mosques and churches until the waterlevel receded and others constructed barriers to water entry atthe doorsteps. Some made outlets at the rear of their housesso any water entering their homes flowed out quickly. Therewere limited collective efforts at the community level, andvirtually no significant intervention by the relevant localgovernment at the division level.
What helped the residents most was the fact that the rainsthat caused the flooding were not the continuous peak rainsthat last several days, such as those experienced in April andNovember. What limited the response of the residents was thefact that almost all activities were uncoordinated, and were atthe individual level.
Case study: Maputo, MozambiqueIn Block 40B of the Luis Cabral slum neighbourhood ofMaputo, Mozambique, residents argue that flooding has wors-ened since 1980, pointing out that the 2000 floods completelydestroyed the area. A single one-day rain event can cause floodsthat persist for three days. If the rains persist from three daysto one week, the water depth rises to one metre and it maytake a month to disappear.
urbanizing region – climate change is already threatening thatgoal, putting the continent’s already strained urban cities underadditional stress.
Flooding in urban areas is not just related to heavy rainfalland extreme climatic events, but also to changes in the built-up areas themselves. Urbanization aggravates flooding byrestricting where floods waters can go, covering large areas ofground with roofs, roads and pavements, obstructing sectionsof natural channels, and building drains that ensure that watermoves to rivers more rapidly than it did under natural condi-tions. As people crowd into African cities, these human impactson urban land surfaces and drainage intensify. Even quitemoderate storms now produce high flows in rivers becausemore of the catchment area supplies direct surface runoff fromits hard surfaces and drains.
Flooding from rising sea levels as a result of climate changeis a potential hazard for the quarter of Africa’s population livingin coastal zones.2 It is estimated that the average annualnumber of people in Africa impacted by flooding could increasefrom one million in 1990 to 70 million in 2080.3 The capitalof The Gambia, Banjul, could disappear in 50-60 years throughcoastal erosion and sea-level rise, putting more than 42,000people at risk.4
Trends in urban flooding in AfricaMany African cities have experienced extreme flooding since1995. Heavy rains and cyclones in February and March 2000in Mozambique led to the worst flooding in 50 years andbrought widespread devastation to the capital city, Maputo.Upwards of one million people were directly affected. Waterand sanitation services were disrupted, causing outbreaks ofdysentery and cholera.
In Ethiopia in August 2006, floods killed more than 100people in the capitalAddis Ababa, and destroyed homes in theeast of the country after heavy rains caused a river to overflow.The overflowing Dechatu river hit Dire Dawa town at nightdrowning 129 people and wiping out 220 homes.
The clear messages emerging are that:• Urban flooding is becoming an increasingly frequent and
severe problem for the urban poor• Climate change is altering rainfall patterns and increasing
storm frequency and intensity, thus increasing the poten-tial for floods
• Local human factors, especially urban growth, occupationof flood plains and lack of attention to waste managementand maintenance of drainage channels, are also aggravat-ing the flood problem.
Case study: Kampala, UgandaIn Kampala, Uganda, construction of unregulated shelters bypoor inhabitants has reduced infiltration of rainfall, increas-ing runoff to six times that which would occur in naturalterrain. Some of the increase is probably due to climate change,but some is the direct result of land cover change.
Fifty-nine-year-old Masitula Nabunya, of Bwaise III Parishin Kampala said that after the 1960 floods a channel fromNsooba to Lubigi was dug and workers were employed to cleanit regularly. There were no further flood problems until the1980s, but since then she has had to rebuild her house afterflooding six times. Flooding in these places is now much morefrequent, every small downpour appearing to produce intenseflooding. Some of this is because the main drainage channel,
Phot
o: A
ctio
nAid
Sie
rra
Leon
e. F
reet
own,
Sie
rra
Leon
e
Girl affected by flood
3.Natural & Human induced disasters:Master spread 16/2/07 09:49 Page 133

[ ]134
Case study: Accra, GhanaWomen in Alajo, Accra, observed that patterns of rain andflooding have become unpredictable since the 1980s: “Insome years the rain will fall greatly and destroy everythingand other times nothing will happen.” They noted that it usedto rain heavily in June and July but since 2000, the heavyrains sometimes start earlier than June and in other years afterJuly. Consequently, it is difficult to prepare for flooding inAlajo.
Men in Alajo described the impact of the flooding on theirlives: “Flooding makes people go hungry for days.” Slumdwellers’ livelihoods depend on such activities as small-scalecommerce, petty trading and artisanal trades, which aredisrupted by floods: “Flooding makes the inhabitants of Alajounable to do anything.” People lose working time, economicopportunities and income during floods. Several Alajo resi-dents engage in petty trading and petty merchandising inwooden kiosks which do not withstand the force of the floods.The immediate impact is the loss of livelihood support forfood and bills, including children’s education and health bills.
In the Alajo community people dealt with the June and July2006 floods in a variety of ways. Some used blocks, stones andfurniture to create high places on which to put their most valu-able possessions during floods. Some placed their items on topof wardrobes and in the small spaces between ceilings androofs, sharing such high places with others who have no similar‘safe’ sites. Others temporarily moved away from the area tostay with friends and family during the flood.
One woman in Alajo described her experience: “As soon asthe clouds gather I move with my family to Nima to spend thenight there. When the rain starts falling abruptly we turn offthe electricity meter in the house. We climb on top of ourwardrobes and stay awake till morning. Our house was built insuch a way that ordinarily water should not flood our rooms,
but this is not so. Our furniture has been custom made to helpkeep our things dry from the water. For instance, our tablesare very high and so also are our wardrobes, they are made insuch a way that we can climb and sit on top of them. Thesemeasures are adaptive strategies as old as I can recollect. I havetwo children but because of the flood my first child has beentaken to Kumasi to live with my sister in-law.”
When residents of Alajo were in danger, they resorted to self-help or were rescued by other members of the communityusing locally manufactured boats, for example, not by anygovernment disaster agency: “When the rain and the floodscome, women and children suffer. You can be locked up for upto two days with the flood. Sometimes we take our childrenout from the room to the rooftop. Then people bring boats toevacuate people.”
The research found more evidence of individual, rather thancollective coping strategies. Sometimes people share protec-tive storage or accommodation on higher ground. Spontaneouscommunity action to unblock drainage channels is relativelyrare. However, no coordinated action for emergency shelter orrapid response to flooding appears to exist in the studied cities.That said, local people in poor communities have an acuteawareness of the solutions that are required and possible, andhave strong views on who is responsible for taking action.However, there are different levels at which the various stake-holders in flood mitigation can operate to contribute to creatingsolutions.
Responsibilities and actionsThe management of localized flooding, resulting from inade-quate drainage, should be undertaken by the affectedcommunities themselves. This is where local voluntary groups,with assistance where necessary, could be highly effective.Local communities are stakeholders in the good drainage and
Urban flooding in Lagos, Nigeria
Phot
o: G
ideo
n M
ende
l/Cor
bis/
Act
ionA
id
3.Natural & Human induced disasters:Master spread 16/2/07 09:50 Page 134

rapid water removal from their own areas. They benefit fromtheir own actions in improving and maintaining drainagechannels.
Local authorities are best placed to cope with flooding fromsmall streams whose catchment areas lie almost entirely withinthe built-up area. They administer the regulations and bylawsconcerned with land use planning and should be involved inlocal disaster management. However, most African localauthorities lack the human resources and financial power tocarry out such responsibilities effectively.
Where major rivers flood towns and cities, urban floodprotection must be seen in the context of the entire river basin,which may cross political boundaries. Where a river basin lieswithin a single nation state, integrated river basin managementprinciples should be applied by an agency cutting acrossministries concerned with both rural and urban interests toensure that activities in upstream areas do not worsen the floodsituation for towns and cities downstream.
In the Mozambique floods of 1996-1997, the trigger washeavy rains in the Shire river basin. If the Shire and Zambezirivers were managed as one basin system, it would have beenpossible to alleviate flooding in the Zambezi delta by manipu-lating Zambezi river flow, using the flood control capacity ofLakes Kariba and Kabora Bassa.5
Cities faced with coastal flooding from the sea, or by a combi-nation of high tides and high river flows from inland, have tointegrate both river basin and coastal zone management, ensur-ing that the natural wetlands can continue to function as floodstorage areas as far as possible.
The reality: Kampala, Maputo and AccraIn Ghana, relatively little has been undertaken by local govern-ment to combat urban flooding. Local authorities had not doneany work on the drains and were not doing any cleaning andmaintenance. The city’s big drains were “choked with weedsand filth, while developers, possibly factory owners, have builtstructures and walls over some of the drains,” the Ghana NewsAgency reported.
In Uganda, despite noble ideals in the national disastermanagement strategy, the ActionAid research team found thatthe translation of the disaster management policy into prac-tice is far from being realised. Local council leaders are failingto enforce regulations that govern building houses and sanita-tion. No district disaster management committee exists inKampala district, and floods are not seen as a key issue afflict-ing slum dwellers.
Following the war and severe flooding in Mozambique, theGovernment established a new organization, the NationalInstitute of Disaster Management, with the aim of ensuringeffective emergency coordination and establishing a newperspective, based on prevention. With this new organisationthe annual contingency plans were institutionalized and arenow part of the state general budget.
A policy of disaster management was also approved by theMozambique Government in 1999 and, with the consolidationof the second national poverty reduction strategy, a new masterplan for prevention and mitigation of natural disasters wasapproved in March 2006, with a focus on reducing the vulner-ability of those communities most exposed to natural disasters.The master plan is part of the strategy for poverty reduction forthe period 2005-2009, and also addresses the issues at a nationallevel, but does not give special attention to urban areas.
The National Adaptation Programme of Action (NAPA) forthe least developed countries aims to prepare urgent projectson adaptation by the sectors of society considered most vulner-able to the effects of climate change. The process of developingthe NAPA for Senegal, Kenya and Mozambique involved across-section of consultations with many stakeholders in thepublic and private sectors. This included non-governmentalorganisations and vulnerable communities. While the prepa-ration of these plans showed that the respective governmentsrecognised the losses caused by climate change, especiallydrought, floods and landslides, the NAPAs do not emphasise,or focus on the way flooding affects the urban poor.
International actionThe Hyogo Framework for Action promotes disaster riskreduction strategies that are integrated with climate changeadaptation.6 The framework foresees dialogue, coordinationand information exchange between disaster managers anddevelopment sectors. But this will be slow in reaching the localgovernments and communities that need to work on alleviat-ing urban flooding affecting poor communities. ActionAid’ssurveys found that, at present, local governments know littleabout the framework. Many however would be happy to coop-erate in the types of partnership the framework envisages inorder to improve service delivery.
Local initiatives to reduce vulnerability and increase commu-nity participation may be facilitated by training, capacity buildingand resource transfers. This is where international action of thetype suggested in the Kyoto protocol is appropriate.
There are serious limits as to what international actionsregarding adaptation can achieve. Such actions need to bedeveloped in ways that support the adaptive capacity andresilience of vulnerable communities. There is a clear challengeto international organizations to get their assistance operatingeffectively at the appropriate level.
Urgent tasks The solutions to the severe flooding of poor urban communi-ties in Africa are relatively simple. Many people understandwhat needs to be done. Communities can do much for them-selves, however, the tasks are best tackled through partnershipswith national and international support. All parties concernedneed to collaborate in:
• Making sure the growing human challenge of urban flood-ing is addressed in all national and internationaldevelopment policies, planning and actions by govern-ments, UN systems, IFIs and NGOs
• Investing in proper and safe infrastructure, such asdrainage, as locally appropriate
• Ensuring that poor people participate in all decision-making processes equally with experts in flood reductionpolicies
• Taking all possible measures to ensure that poor people’srights to adequate and disaster-safe housing are realizedand their tenure is secured
• Making sure that critical services such as health, waterand sanitation are disaster prepared, which means theyare able to provide adequate services during floods
• Holistic thinking in aid programmes to incorporate theeffects of flooding
• Implementing the Hyogo Framework for Action at alllevels of urban planning and service delivery.
[ ]135
3.Natural & Human induced disasters:Master spread 16/2/07 09:50 Page 135
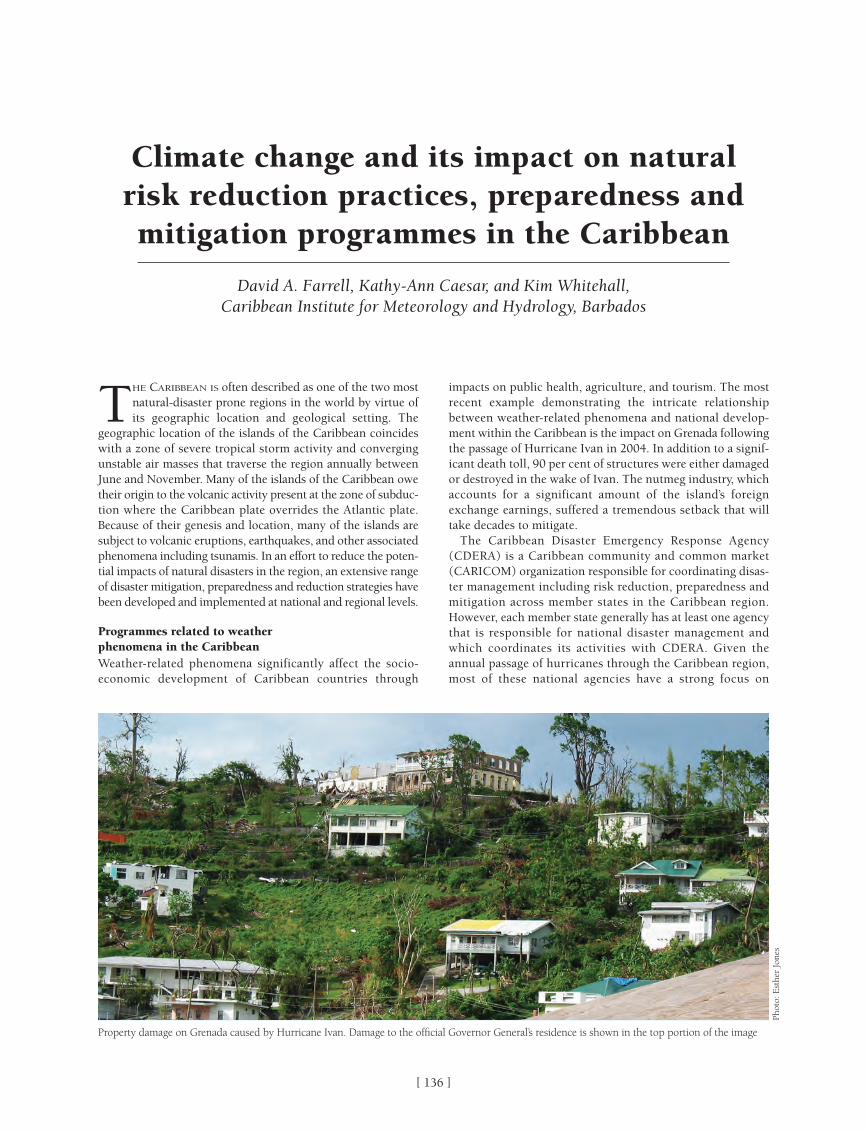
[ ]136
THE CARIBBEAN IS often described as one of the two mostnatural-disaster prone regions in the world by virtue ofits geographic location and geological setting. The
geographic location of the islands of the Caribbean coincideswith a zone of severe tropical storm activity and convergingunstable air masses that traverse the region annually betweenJune and November. Many of the islands of the Caribbean owetheir origin to the volcanic activity present at the zone of subduc-tion where the Caribbean plate overrides the Atlantic plate.Because of their genesis and location, many of the islands aresubject to volcanic eruptions, earthquakes, and other associatedphenomena including tsunamis. In an effort to reduce the poten-tial impacts of natural disasters in the region, an extensive rangeof disaster mitigation, preparedness and reduction strategies havebeen developed and implemented at national and regional levels.
Programmes related to weather phenomena in the CaribbeanWeather-related phenomena significantly affect the socio-economic development of Caribbean countries through
impacts on public health, agriculture, and tourism. The mostrecent example demonstrating the intricate relationshipbetween weather-related phenomena and national develop-ment within the Caribbean is the impact on Grenada followingthe passage of Hurricane Ivan in 2004. In addition to a signif-icant death toll, 90 per cent of structures were either damagedor destroyed in the wake of Ivan. The nutmeg industry, whichaccounts for a significant amount of the island’s foreignexchange earnings, suffered a tremendous setback that willtake decades to mitigate.
The Caribbean Disaster Emergency Response Agency(CDERA) is a Caribbean community and common market(CARICOM) organization responsible for coordinating disas-ter management including risk reduction, preparedness andmitigation across member states in the Caribbean region.However, each member state generally has at least one agencythat is responsible for national disaster management andwhich coordinates its activities with CDERA. Given theannual passage of hurricanes through the Caribbean region,most of these national agencies have a strong focus on
Climate change and its impact on naturalrisk reduction practices, preparedness andmitigation programmes in the Caribbean
David A. Farrell, Kathy-Ann Caesar, and Kim Whitehall, Caribbean Institute for Meteorology and Hydrology, Barbados
Property damage on Grenada caused by Hurricane Ivan. Damage to the official Governor General’s residence is shown in the top portion of the image
Phot
o: E
sthe
r Jo
nes
3.Natural & Human induced disasters:Master spread 16/2/07 09:50 Page 136

[ ]137
Programmes related to future climate change in the CaribbeanNatural disaster risk management, reduction and mitigationprogrammes in the Caribbean are primarily focused on theimmediate threats posed by annual regional weather phenom-ena. However, within the last decade there has been increasingactivity focused on preparedness for the distant future. Theseactivities centre on:
• Identifying the vulnerability of Caribbean societies toglobal climate change and climate variability
• Developing mitigation and adaptation strategies to minimizethe risks posed to Caribbean societies by these phenomena.
Significant efforts at national and regional levels have beenexpended to quantify the impacts of global climate change onthe Caribbean region. These have put particular focus onregional initiatives, especially their effectiveness in identifyingregional vulnerabilities to climate change and in developingand implementing strategies for their mitigation.
Global climate change is expected to result in increasingtemperatures in both the Earth’s atmosphere and oceans.Increasing atmospheric temperatures are accelerating the meltingof the Earth’s polar ice caps, thereby increasing the volume ofwater present in the oceans. Thermal expansion of the water iscausing sea levels to rise globally. Within the Caribbean region,the affects of global climate change are anticipated to be sea levelrises, increasing mean annual temperatures, increasing rainfallvariability, and increasing tropical storm activity and intensity.
The most significant impacts of sea level rise in theCaribbean and coastal regions of South and Central Americawill be inundation of low-lying coastal zones. For example, inGuyana sea level rise is expected to result in the permanentinundation of thousands of square miles of the coastal regionand the significant inland migration of seawater up river chan-nels. The combination of these processes is expected to leadto the displacement of significant numbers of coastal residents,salinization of aquifers and soils, and the destruction of tradi-tional farming areas. Increases in sea levels, coupled with stormsurges, may further exacerbate flooding in low-lying coastalcommunities. The combined effects of these outcomes areexpected to result in considerable economic losses at the localand national levels if significant mitigation and adaptationmeasures are not put in place.
impacts caused by weather phenomena. To effectively performtheir functions, organizations responsible for disastermanagement rely on an integrated structure that couplesseveral other specialized organizations into a comprehensivedecision-making framework.
In Barbados, the Central Emergency Relief Organization(CERO) is one of the agencies responsible for natural disasterrisk reduction, preparedness and mitigation. When severeweather threatens Barbados, CERO’s decision-making frame-work includes inputs from, and coordination with, organizationssuch as the Barbados Meteorological Services, the Barbados FireService, the Royal Barbados Police Force, the Barbados DefenseForce and the Barbados medical fraternity, among others.
National Meteorological Services in the Caribbean providevital information that support decision-making associated withpotential weather-related disasters and disasters that may beexacerbated by meteorological processes. As a matter ofnational policy, these services are responsible for issuing warn-ings and advisories during periods of severe weather. Theseactivities and responsibilities require staff within these Servicesto interact with individuals from a range of disciplines and toprovide information that is easy to understand and easily inte-grated in a multidisciplinary natural disaster managementframework. With the growing complexity of natural disastermanagement in the Caribbean, disaster management interac-tions within multidisciplinary teams can no longer be limitedto on-the-job training, but must be an integral part of acade-mic and professional training programmes.
The Caribbean Institute for Meteorology and Hydrology(CIMH) is a World Meteorological Organization (WMO) recog-nized Regional Meteorological Training Centre (RMTC),responsible primarily for training staff to serve in nationalmeteorological services. Training is performed in-house atdiploma level and in collaboration with the University of theWest Indies (UWI), Cave Hill Campus, at degree level. Staff atCIMH are also key participants in graduate researchprogrammes in pure and applied meteorology at UWI.
CIMH has not traditionally included natural disaster manage-ment in its training programmes. However, given the changingdemands on National Meteorological Services in the Caribbean,CIMH is in the process of formally integrating natural disastermanagement into its training programmes to prepare studentsfor integration into natural disaster management teams.
CIMH is involved in a number of collaborative efforts thatsupport natural disaster management through the identificationof vulnerabilities and the formulation of mitigation strategies.For example, the organization has been involved in:
• Flood plain mapping projects that provide information toguide land-use and flood mitigation policies at the nationallevel
• Storm surge mapping to support the identification ofvulnerable coastal communities
• Research programmes using numerical simulators to betterforecast regional and local weather systems that may havean adverse effect on public health and safety
• Agrometeorological programmes that address the vulner-ability of food systems in the Caribbean to natural disasters.
Information from these activities, as well as input from relevantstakeholders such as regional and national disaster manage-ment agencies, is being used to develop a weather-relateddisaster management component to CIMH’s programmes.
Example of numerical weather prediction produced by CIMH staffusing the MM5V3 model in operational mode during the 2006Atlantic hurricane season
Source: Caribbean Institute for Meteorology and Hydrology (CIMH)
3.Natural & Human induced disasters:Master spread 16/2/07 09:50 Page 137

[ ]138
Higher temperatures coupled with increased rainfall variabilityare expected to impact the type of agriculture currently practicedin the region. For example, variability in rainfall and increasedtemperatures are expected to reduce soil moisture and increaseheat stress to animals and plants, thereby reducing agriculturalproductivity and increasing economic losses. Rainfall variabilityis expected to lead to increased surface water runoff and reducedinfiltration and recharge of aquifers. These processes are expectedto increase the risk of severe flooding and aquifer depletion.
Several regional initiatives geared to addressing the impact ofclimate change and variability on Caribbean societies have beenfunded by regional and international agencies including theWorld Bank, the Global Environmental Fund (GEF) and theCanadian International Development Agency. These aremanaged by regional institutions including the CARICOMSecretariat and the Caribbean Community Climate ChangeCentre (CCCCC). Regional institutions involved in climatechange activities include the University of the West Indies, theUniversity of Guyana, the University of Belize, and CIMH amongothers. National agencies are generally integrated into regionalactivities through the provision of data, expertise, and servicesto support sectoral analyses at local pilot sites. Outcomes fromthese studies not only benefit local agencies but also provide abasis for further development and implementation regionally.
The first major regional initiative related to climate changein the Caribbean was the Caribbean Planning for Adaptationto Climate Change (CPACC) initiative, which received USD6.5 million from GEF and operated from 1997 to 2001. TheCPACC initiative was implemented by the World Bank,executed by the Organization of American States, and over-seen by a Project Advisory Committee chaired by theCARICOM Secretariat. The objectives of the CPACC initiativewere to build capacity in the Caribbean region for adaptationto the impacts of climate change, particularly sea level rises.These objectives were achieved through a series of vulnerabil-ity assessments, adaptation planning exercises, and capacitybuilding initiatives. The CPACC initiative included:
• Design and implementation of a sea level/climate moni-toring network
• Establishment of databases and information systems• Inventory of coastal resources• Formulation and application of initial adaptation policies.
Key achievements of the CPACC project were: • Establishment of 18 sea level monitoring stations in 12
countries in the region• An increased appreciation of climate change issues by
regional policy makers and planners, and the articulationof regional positions on the issue
• Establishment of coral reef monitoring protocols• Improved access to and availability of regional data on
climate change• The articulation of climate change adaption policies and
implementation plans in eleven of the twelve participatingcountries.
The CIMH was a beneficiary of the CPACC initiative as itprovided CIMH with an opportunity to enter into regionalclimate change research through the provision of climatic datafor the region that extended in some cases over 100 years, andthrough the sea level monitoring programme, in which CIMHwas heavily involved.
The Adaptation to Climate Change in the Caribbean (ACCC)initiative extended the climate change activities started underthe CPACC initiative. The ACCC initiative lasted from 2001to 2004 and received CAD3.5 million in funding from theCanadian International Development Agency (CIDA).Important achievements of the ACCC initiative were:
• Political endorsement and the establishment of the basisfor financial self-sustainability for the CCCCC
• Development of a set of guidelines to facilitate incorpo-ration of climate change effects into the EnvironmentalImpact Assessment process
• Development of capacity building programmes
20
22
24
26
28
30
32
Year
Tem
pera
ture
(Deg
C)
1971
1972
1973
1974
1975
1976
1977
1978
1979
1980
1981
1982
1983
1984
1985
1986
1987
1988
1989
1990
1991
1992
1993
1994
1995
1996
1997
1998
1999
2000
Tmin Tmax Linear Tmin Linear Tmax
Temperature trends on Barbados during the period 1971-2000: Trends in the maximum and minimum temperatures recorded(squares represent the measured data; solid line represents the inferred linear trend)
Source: Caribbean Institute for Meteorology and Hydrology (CIMH)
3.Natural & Human induced disasters:Master spread 16/2/07 09:50 Page 138

• Implementation of pilot projects on climate changeimpacts in the water, health and agricultural sectors
• Generation of statistically downscaled climate scenariosfor Jamaica, Trinidad & Tobago, and Barbados
• Development of a regional public education and outreachstrategy on climate change.
Within the context of the capacity building programmes, CIMHstaff benefited from training related to detection and analysisof trends in climate data. This training supports CIMH’songoing development of climate change products using itsextensive climate databases. The climatic databases currentlybeing stored at CIMH are being used by individuals partici-pating in climate change research.
The Mainstreaming Adaptation to Climate Change (MACC)initiative builds on the achievements of CPACC and ACCC.This initiative, which runs from 2004 to 2007, received USD5 million of funding from GEF and is being implemented bythe World Bank and executed by the regional CaribbeanCommunity Climate Change Centre. The MACC initiativeseeks to:
• Further build capacity in the region to address climatechange issues including the mitigation of vulnerabilitiesidentified under the CPACC initiative
• Rehabilitate and strengthen climate change data collec-tion and monitoring networks
• Extend the analysis of the impacts of climate change oncritical sectors (including water resources, tourism andagriculture) within the Caribbean region
• Expand public education and outreach programmes.
The CIMH’s role within the MACC initiative is considerablygreater than in previous initiatives. In particular, CIMH willbe a key participant in the reestablishment and maintenance ofsea level monitoring stations, installed under the CPACC initia-tive and currently inoperable. This inoperability reflects tosome degree the low priority that some national government
agencies have assigned to global climate change monitoringduring CPACC. It is hoped that by placing the responsibilityfor maintaining these stations within a regional organization,the performance and sustainability of the sea level monitoringnetwork will be significantly improved.
The CIMH is also taking a leading role in sectoral analysesthat examine the impacts of climate change on agriculture andwater resources in the region. The CIMH will be a key regionalinstitution involved in the design and simulation of the climatechange scenarios used to support sectoral analyses.
Future directionsReduction of the risks posed to life and to the economy isbringing climate change preparedness to the forefront in theCaribbean. As a result, regional institutions are expected toprovide leadership in these areas. The CIMH, through itsmandate and training programmes, is integral to weather-and climate-related risk reduction, preparedness and miti-gation programmes in the area. As such, CIMH plays animportant role in the mainstreaming of adaptation and miti-gation strategies related to climate change and other weatherphenomena.
With this in mind, CIMH is expanding its role in these areasbeyond the provision of support for regional programmes. Inparticular, the organization intends to include aspects of naturaldisaster risk reduction, preparedness, and mitigation in its train-ing programmes. This integration will encompass both weather-and climate-induced events, and will build on relationships thatCIMH has developed with regional organizations.
More specifically, CIMH intends to include aspects ofweather and climate modelling in its training programmes,along with projects emphasizing multidisciplinary data analy-sis and decision-making to sensitise students to integrateddisaster management environments. CIMH staff will continueto build on completed and ongoing work on natural risk reduc-tion to assess the impacts of climate change and climatevariability on food security and water resources.
[ ]139
5
5.5
6
6.5
7
7.5
8
8.5
9
Year
Diff
eren
ce in
Tem
pera
ture
(Deg
C)
1971
1972
1973
1974
1975
1976
1977
1978
1979
1980
1981
1982
1983
1984
1985
1986
1987
1988
1989
1990
1991
1992
1993
1994
1995
1996
1997
1998
1999
2000
Temperature trends on Barbados during the period 1971-2000: Decreasing diurnal temperature range (squares represent the measured data; solid line represents the inferred linear trend)
Source: Caribbean Institute for Meteorology and Hydrology (CIMH)
3.Natural & Human induced disasters:Master spread 16/2/07 09:50 Page 139
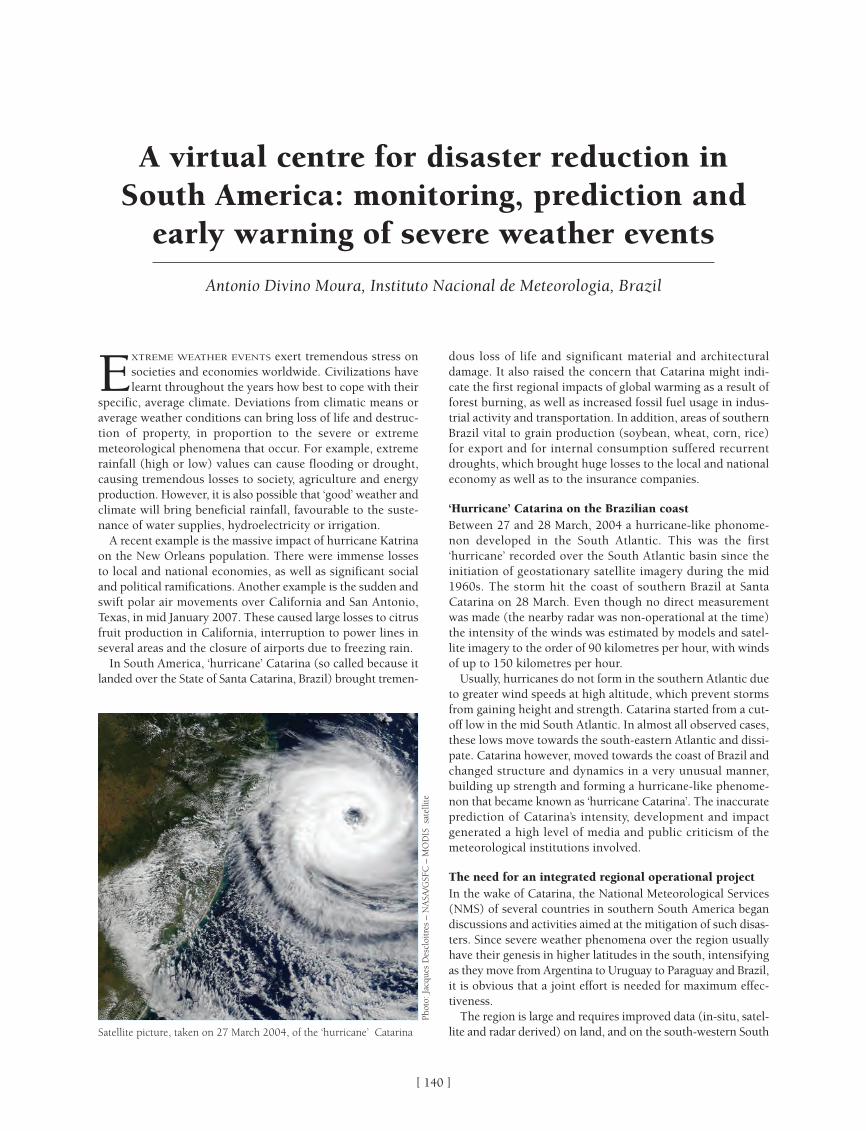
[ ]140
EXTREME WEATHER EVENTS exert tremendous stress onsocieties and economies worldwide. Civilizations havelearnt throughout the years how best to cope with their
specific, average climate. Deviations from climatic means oraverage weather conditions can bring loss of life and destruc-tion of property, in proportion to the severe or extrememeteorological phenomena that occur. For example, extremerainfall (high or low) values can cause flooding or drought,causing tremendous losses to society, agriculture and energyproduction. However, it is also possible that ‘good’ weather andclimate will bring beneficial rainfall, favourable to the suste-nance of water supplies, hydroelectricity or irrigation.
A recent example is the massive impact of hurricane Katrinaon the New Orleans population. There were immense lossesto local and national economies, as well as significant socialand political ramifications. Another example is the sudden andswift polar air movements over California and San Antonio,Texas, in mid January 2007. These caused large losses to citrusfruit production in California, interruption to power lines inseveral areas and the closure of airports due to freezing rain.
In South America, ‘hurricane’ Catarina (so called because itlanded over the State of Santa Catarina, Brazil) brought tremen-
dous loss of life and significant material and architecturaldamage. It also raised the concern that Catarina might indi-cate the first regional impacts of global warming as a result offorest burning, as well as increased fossil fuel usage in indus-trial activity and transportation. In addition, areas of southernBrazil vital to grain production (soybean, wheat, corn, rice)for export and for internal consumption suffered recurrentdroughts, which brought huge losses to the local and nationaleconomy as well as to the insurance companies.
‘Hurricane’ Catarina on the Brazilian coastBetween 27 and 28 March, 2004 a hurricane-like phonome-non developed in the South Atlantic. This was the first‘hurricane’ recorded over the South Atlantic basin since theinitiation of geostationary satellite imagery during the mid1960s. The storm hit the coast of southern Brazil at SantaCatarina on 28 March. Even though no direct measurementwas made (the nearby radar was non-operational at the time)the intensity of the winds was estimated by models and satel-lite imagery to the order of 90 kilometres per hour, with windsof up to 150 kilometres per hour.
Usually, hurricanes do not form in the southern Atlantic dueto greater wind speeds at high altitude, which prevent stormsfrom gaining height and strength. Catarina started from a cut-off low in the mid South Atlantic. In almost all observed cases,these lows move towards the south-eastern Atlantic and dissi-pate. Catarina however, moved towards the coast of Brazil andchanged structure and dynamics in a very unusual manner,building up strength and forming a hurricane-like phenome-non that became known as ‘hurricane Catarina’. The inaccurateprediction of Catarina’s intensity, development and impactgenerated a high level of media and public criticism of themeteorological institutions involved.
The need for an integrated regional operational projectIn the wake of Catarina, the National Meteorological Services(NMS) of several countries in southern South America begandiscussions and activities aimed at the mitigation of such disas-ters. Since severe weather phenomena over the region usuallyhave their genesis in higher latitudes in the south, intensifyingas they move from Argentina to Uruguay to Paraguay and Brazil,it is obvious that a joint effort is needed for maximum effec-tiveness.
The region is large and requires improved data (in-situ, satel-lite and radar derived) on land, and on the south-western South
A virtual centre for disaster reduction inSouth America: monitoring, prediction and
early warning of severe weather events
Antonio Divino Moura, Instituto Nacional de Meteorologia, Brazil
Satellite picture, taken on 27 March 2004, of the ‘hurricane’ Catarina
Phot
o: J
acqu
es D
escl
oitr
es –
NA
SA/G
SFC
– M
OD
IS s
atel
lite
3.Natural & Human induced disasters:Master spread 16/2/07 09:50 Page 140

[ ]141
Product dissemination to national Civil Defence services – Thedissemination of forecasts and products is the foundation ofeach country’s NMS. Such distribution ensures the optimal useof information and will prevent any national service releasinginformation in an inappropriate format or language, or at anunsuitable time, due to its lack of awareness of the possibleregulations, restrictions or implications entailed.
Coordination – The regional virtual centre will have its workcoordinated by each node of the participating network of insti-tutions, and the NMS will also be connected amongthemselves. This will constitute the regional network. Withineach country, according to internal arrangements, nationaloperational and research institutions may also form a networkcoordinated by the NMS for that individual country.
Participating countries and institutionsThe regional network is comprised of the ServicioMeteorologico Nacional of Argentina, the Instituto Nacionalde Meteorologia of Brazil, the Dirección de Meteorologia eHidrologia of Paraguay and Dirección Nacional deMeteorologia of Uruguay. These regional nodes will constitutethe focal points for the network of participating countries.
In the case of Brazil, an internal, national network is beingformed by INMET, with the National Meteorological Instituteas the focal point. This development is possible through closecoordination with INPE/CPTEC (Center for WeatherPrediction and Climate Studies), the Center for Hydrographyof the Brazilian Navy, the Meteorological System of Paraná State(SIMEPAR), and the Center for Integrated EnvironmentalResources of Santa Catarina (CIRAM).
Expected benefitsImproved monitoring, prediction and coordination, as well asenhanced expertise in severe weather phenomena will providea basis for the provision of timely and comprehensive infor-mation. Such information will be released to decision makerswithin Argentina, Brazil, Paraguay and Uruguay. Technicalbenefits will include the ability to:
• Test the capacity of Meteorological Services to use a varietyof numerical products, including multi-model ensembleforecasts, in the dissemination of results to existing insti-tutions, in order to minimize risks under severe weatherconditions
• Control and decrease the time needed for emission alerts• Improve the interaction between meteorological services
and Civil Defence bodies in each country• Augment the accuracy of products offered by global
models and global centres when adapted to local usage• To use a hierarchical (cascading) process for disseminat-
ing information.
The major, tangible benefit will be a decrease in disasterimpacts on the population. This will be realized through areduction in loss of life and damage to property caused bydangerous synoptic and mesoscale meteorological phenomenasuch as flooding, windstorms, freezing rain and frosts.
The regional cooperation of meteorological institutions willallow the effective application of knowledge in order to dealwith common regional phenomena. This example may triggerother regional collaborations in the field of geophysicalsciences connected to biological issues (e.g. malaria and dengueepidemics) and social sciences applications.
Atlantic, where almost no direct oceanic measurements arecurrently made. Better understanding of phenomena that bringsevere or extreme weather, and improved methods to predictthem are also required.
Fundamental to the success of this endeavour is institutionalcapacity building, as well as the training of specialized person-nel for the Meteorological Services of each region. This wouldprovide the fundamental basis for a high quality virtual centrefor the reduction of disaster impacts. Such a centre wouldprovide precise and timely information that could be immedi-ately released to the relevant decision makers (civil defenceservices, authorities etc.) in each country.
Project concept and componentsThe envisaged southern South American regional virtualcentres for monitoring, prediction and early warning will bebuilt on the strength of each country’s capability in terms ofoperational services, as well as existing research and trainingfacilities. The virtual centre is in fact a network of nationalinstitutions, closely coordinated by a national node thatconnects all of the countries. It will deal with all aspects ofdata collection, dissemination and the exchange of forecastsand conferencing between service providers. When a productis finalized, its dissemination and the issuance of warnings, inclose coordination with Civil Defence, will be the purview ofeach country. The meteorological aspects (data, forecast) ofthe joint venture are common to all participants, but the finaldissemination is exacted by each individual NMSs of Argentina,Brazil, Paraguay, and Uruguay in view of the differing nationalimplications and institutional frameworks for decision making.
Data gathering – There is a need to further enhance thenetwork of automatic weather stations in each country of theregion. Also, better use of the satellite and radar informationcurrently available is a must. Since many of the phenomenathat bring severe weather events have their genesis and/oramplification in oceanic areas, the implementation and main-tenance of oceanic buoys and meteo-oceanographic stationsin costal areas deserves special attention.
Understanding the genesis and evolution of extreme weatherevents – There is a need for more research into understandingboth synoptic scale and mesoscale weather systems that areprone to severe conditions. Fortunately, there are excellentresearch and university groups capable of producing informa-tion on the events that potentially bring flooding, as well asextreme conditions related to frost, wind storms, and so on.
Forecasting – The virtual centre forecasters will be trained inMadrid, thanks to cooperation with the Instituto Nacional deMeteorologia (INM) of Spain. This indicates the beginnings ofa live network of the people and institutions involved on anational basis. The training will bring the team up to date oncurrent forecast methodology as well as modern ways to releaseproducts to the civil defence services, media and public author-ities of each country.
Routine exchange of data, products and information – The NMSaround the world regularly exchange geophysical data andproducts using the Global Telecommunications System of theWorld Meteorological Organization. In addition, a specialintranet connection will be established for all participatingagencies and forecasters involved with the operation of thevirtual centre. This closed link is necessary due to the natureof the data and products exchanged, and the particularities ofeach partner institution within a country.
3.Natural & Human induced disasters:Master spread 16/2/07 09:50 Page 141

[ ]142
ACCORDING TO THE Korea Meteorological Administration(KMA), the average temperature in Korea is increasing.The annual average temperature from 1908 to 1940 was
recorded between 10 and 11 degrees Celsius, whereas it wasrecorded between 12 and 13 degrees Celsius from 1970 to recentyears. This trend can be seen clearly when comparing monthlyaverage temperatures. In April, from 1960 to 1965 the averagetemperature was 11.5 degrees Celsius, and from 1995 to 2000it was 12.9 degrees Celsius in the same month. Temperaturedemonstrates a dramatic increase after 1987. It was also foundthat the temperature in the eastern coastal area of the Koreanpeninsula has increased by 1.8 to 2.0 degrees Celsius during thelast century, which exceeds the global average.
Because of climate change in the Korean peninsula, newthreats from natural disasters such as floods, droughts, wildfires, and blizzards are emerging and the ecosystem is changing,including the spatial and seasonal coverage of cultivating plants.In the last three decades the temperature in Korea increased by1.2 degrees Celsius, which again exceeds the global average 0.8
degrees Celsius. The impact of temperature increase is moresevere in urban areas during the winter. Korea has had almostcontinuous, abnormally warm winters since 1986.
In the 1960s and the 1990s the average temperature inJanuary, and monthly minimum temperature in metropolitanareas such as Seoul and Daegu increased by 2.7 degrees Celsiusand 3.0 degrees Celsius, respectively. This increase is believedto be related to human-induced environmental factors such asincreased consumption of fuel, population, emission, build-ings, traffic, urbanization and deforestation. Conversely, inpreserved rural areas like Chupungryeong, temperatureincrease was found to be as low as 0.4 degrees Celsius.
The pattern of precipitation is also changing. In Korea 40 to60 per cent of annual precipitation is concentrated during thesummer, i.e. from June to August, and is affected by typhoonsand monsoons. Recently, the activity of the seasonal rain fronthas become irregular and the overall precipitation is decreasingduring the wet season. However, the precipitation by typhoonsand concentrated rains after the regular wet season is increasing.
The rising incidence of natural disaster events on the Korean Peninsula
due to climate change
Dugkeun Park, PhD, Senior Analyst, National Emergency Management Agency (NEMA), Seoul, Korea
-1.5
-1.0
-0.5
0.0
0.5
1.0
1.5
2.0
Tem
pera
ture
Dev
iatio
n (˚
C)
1961
1964
1967
1970
1973
1976
1979
1982
1985
1988
1991
1994
1997
2000
Year
Changes in annual average temperature in the Korean Peninsula from 1961 to 2000
Source: KMA
3.Natural & Human induced disasters:Master spread 16/2/07 09:50 Page 142

[ ]143
Most of the natural disaster damages in Korea are due towater and wind-related events. From 1997 to 2006, an annualaverage of 117 people lost their lives, mostly from floods andlandslides caused by typhoons and torrential rains in thesummer. Typhoons caused 58 per cent of the property damages,while torrential rains were responsible for 23 per cent.
Property damages from natural disasters during the last 10years amounts to USD2.1 billion per year, as well as USD3.7billion spent each year on recovery costs. Although generalhuman loss has decreased, property damage, which isconverted and normalized by current values, is increasing dueto the affect of climate change on vulnerability. Eight out often of the most severe natural disasters occurring between 1958and 2006 took place in the last ten years.
According to KMA the temperature and precipitation inten-sity in the Korean peninsula has undeniably increased sincethe 1980s. The most severe drought in 90 years occurred in2001, and in August 2002 sunshine hours were 50 per centless than normal. In 2002 and 2003, property damages bytyphoon Rusa and Maemi were USD6.6 billion and USD4.7billion, respectively. In March 2004 a sudden blizzard causedmass societal panic because nobody was prepared for such anatural hazard in the spring.
Water and wind-related disasters are anticipated to increasein the Korean peninsula. Normally, typhoons develop in theSouth Pacific where they downgrade to extra tropical depres-sions due to the low sea surface temperature as they approachthe Korean peninsula. However, when the sea surface temper-ature in the typhoon’s path is not low enough, they carry onto the Korean peninsula at full strength and cause severedamage.
The Korean government is setting up systematic counter-measures such as multi-hazard warning systems, to cope withthe emerging risks, and to minimize the damage on criticalinfrastructure. One of the most effective preventive measuresin Korea is the implementation of the Disaster ImpactAssessment (DIA) system. DIA aims to eliminate the poten-tial causes of disasters inherent in various development
Before the 1970s the Seoul metropolitan area precipitationwas concentrated in prolonged wet seasons from the end ofJune to the end of July. However, recent statistics show thatmost precipitation now occurs from the end of July andAugust through localized torrential rains, after the regularwet season.
Whilst there is no explicit change in the total precipitationlevels, the total days of precipitation is steadily decreasing, whilstthe precipitation intensity, which has direct correlations withwater-related disasters, is increasing dramatically. As shown instatistics since the 1920s, the annual precipitation in the last twodecades has increased only 7 per cent compared to the 1920s.However, the days of precipitation decreased by 14 per cent and,thus, the intensity is estimated to increase by 18 per cent.
From 1992 to 2001 the frequency of concentrated rainswhich exceeded 100 millimetres per day was 325, which is 1.5times more than the number measured in the 1970s. Of partic-ular note was 31 August 2002, when a record-breaking 870.5millimetres precipitation was measured in Gangneung City.
The change in summer precipitation patterns is not the onlyproblem in Korea. Droughts in the Spring is an increasingworry. The Korean peninsula, which is located between theEurasian continent and the Pacific, is affected by continentalhigh pressure developed in China during the autumn. Thiscontinental air mass is replaced by oceanic air mass in Mayand when strength of the continental air mass is not weaken-ing, Korea experiences the spring drought. 2001 was the worstyear of drought since the beginning of Korean modern climateobservation in 1911.
Compared to normal precipitation levels, the amount in thespring of 2001 was only 12 per cent in the middle of the Koreanpeninsula, whilst the maximum was 74 per cent on Jeju Island,which is located in the most southern part of Korea.Precipitation in most areas was recorded as less than 50 percent and the Seoul metropolitan area recorded only 10 to 30 percent. In June the total water volume in reservoirs was less than39 per cent of the normal volume, which presented a seriousthreat to the whole country.
Source: KMA Source: KMA
1920
-29
1930
-39
1940
-49
1950
-59
1960
-69
1970
-79
1980
-89
1990
-99
1100
1150
1200
1250
1300
MM
Total Precipitation
Total precipitation in the Korean Peninsula
1920
-29
1930
-39
1940
-49
1950
-59
1960
-69
1970
-79
1980
-89
1990
-99
100
110
120
Day
s
Precipitation Days
Precipitation days in the Korean Peninsula
3.Natural & Human induced disasters:Master spread 16/2/07 09:50 Page 143

[ ]144
projects, in advance. This system is a good example ofsupporting sustainable development. The DIA system isimplemented centrally when the area of targeted developmentis at least 300,000 square meters. For smaller developmentprojects, each city and province has introduced a local disas-ter impact assessment system. DIA was introduced in 1996and by 2001 the coverage had expanded to cover 48 admin-istration plans and 47 development areas.
The Korean government is also focusing on disasterpreparedness during the summer season. To reduce the loss oflife, property damage, and economic hardship caused bynatural disasters, the “Disaster Preparedness Period” is desig-nated from February to May. The E-30 emergency evacuationsystem has also been implemented. This involves the complete
Source: KMA
1920
-29
1930
-39
1940
-49
1950
-59
1960
-69
1970
-79
1980
-89
1990
-99
9
10
11
12m
m/d
ay
Precipitation Intensity
Precipitation intensity in the Korean Peninsula
0
200
400
600
800
1000
1200
1500
0
1000
2000
3000
4000
5000
6000
7000
Dea
d an
d m
issi
ng
Prop
erty
dam
age
(US$
mill
ion)
Year
1958
1961
1964
1967
1970
1973
1976
1979
1982
1985
1988
1991
1994
1997
2000
2003
2006
Dead and missing Property damage
Human loss and property damage by natural disasters in Korea from 1958 to 2006
Source: NEMA
evacuation of a disaster-prone area when a warning alarm istriggered, and is designed to improve the safety of citizens.
Korea identified 787 sites susceptible to inundation, collapse,and isolation by typhoons, floods, and landslides, and labelledthem as Disaster Prone Areas. A total of USD3.3 billion will beinvested for numerous improvements between 1998 and 2007.In 2004 and 2005 USD822 million and USD169 million wasinvested in 326 and 107 sites, respectively.
Since prompt and accurate information is so important forprotecting people’s lives and national infrastructures, a compre-hensive network has been established connecting disastermanagement agencies and disaster prevention facilities.Equipment and various resources for rescue activities havebeen secured, and emergency countermeasures against trans-portation cut-off and isolation situations are in place.
From the use of conventional, commercial electronic displayboards to cutting-edge information technologies; six differentearly warning systems are in place for natural disasters inKorea. These include: CBS mobile phone message system, auto-matic verbal notification system, automatic rainfall warningsystem, disaster notification board system, TV disaster warningbroadcasting systems, and radio disaster warning broadcast-ing system using radio data system (RDS).
Rehabilitation plans have been developed, and vulnerablesites and structures have been strengthened in response to thepotential affects of climate change. This practice is importantbecause previous recovery plans simply restored the damagedsites and facilities to their original status, thus leaving themvulnerable to relapse.
Despite the various measures and systems developed tocounteract the emerging risks posed by climate change, therecent disaster figures suggest that Korea will continue to payan increasing price. It is difficult to estimate the overall costto society, but it is clear that the negative effects of climatechange need to be studied and quantified as far as possible.Such knowledge and understanding can then be applied indisaster management systems that will mitigate the price ofclimate change as far as possible.
3.Natural & Human induced disasters:Master spread 16/2/07 09:50 Page 144

[ ]145
INDIA, DUE TO its unique geography and climatology, isprone to a large spectrum of natural disasters ranging fromavalanches in the snow-clad Himalayan slopes, to tsunamis
and tropical cyclones along the coasts in the southern penin-sula. Floods, droughts, cyclones, earthquakes and landslideshave been recurrent phenomena. About 60 per cent of the land-mass is prone to earthquakes of various intensities; over 40million hectares is prone to floods; about eight per cent of thetotal area is prone to cyclones and 68 per cent of the area issusceptible to drought.
Between 1990 and 2000, an average of 4,344 people lost theirlives and about 30 million people were affected by disastersevery year. Increasing population densities, changing land-usepatterns and climate have contributed to the vulnerability,particularly to that of the poverty-ridden communities in theregion. These factors are set to exacerbate as time goes on,leading to irreparable damages affecting sustained develop-ment. The major positive aspect is that due to the intricate
linkages among these issues, actions initiated to mitigate theeffects of any one will have collateral benefits.
The climate change contextClimate change is not only a major global environmentalproblem, but is also an issue of great concern to a developingcountry like India. The changes observed in the regionalclimate have already affected many of the physical and biolog-ical systems and there are indications that social and economicsystems have also been affected. Climate change is likely tothreaten food production, increase water stress and decreaseits availability, resulting in a rise in sea level that could floodcrop fields and coastal settlements, and increase the occurrenceof diseases such as malaria.
India is a large developing country with a population of overone billion, whose growth is projected to continue in thecoming decades. Its rural populations depend largely on theagriculture sector, followed by forests and fisheries for their
Adapting to climate change through resilience to natural disasters
Sanjiv Nair, G Srinivasan and KJ Ramesh, Department of Science & Technology, New Delhi, India
Climate change scenarios over India produced by Hadley Center PRECIS Regional Climate Model showingexpected changes in number of rainy days (left panel) and rainfall intensity (mmday-1) of rainy days
Source: : Krishna Kumar, Indian Institute of Tropical Meteorology, Pune, India
3.Natural & Human induced disasters:Master spread 16/2/07 09:50 Page 145

[ ]146
livelihood. Indian agriculture is monsoon dependent, with over60 per cent of the crop area under rain-fed agriculture that ishighly vulnerable to climate variability and change. Given thelack of resources, and access to technology and finances, manycountries in the Asia region presently have limited capacity todevelop and adopt strategies to reduce their vulnerability tochanges in climate.
In India, apart from the strong seasonality of rainfall (withmost of the rainfall occurring during a span of three monthsduring mid-June to mid-September), there are remarkable vari-ations within the season from one year to another. Suchvariations produce extremes in seasonal anomalies resultingin large-scale droughts and floods, and also short-period precip-itation extremes in the form of heavy rainstorms or prolongedbreaks. The Indian climate is also marked by cold waves duringwinter in the north, and heat waves during the pre-monsoonseason over most parts of the country. Tropical cyclones, affect-ing the coastal regions through heavy rainfall, high wind speedsand storm surges, often leave behind widespread destructionand loss of life, and constitute a major natural disaster associ-ated with climatic extremes. Indeed, it is these extremes thathave the most visible impact on human activities and there-fore, receive greater attention by all sections of the society.
Future projections with high-resolution regional climatemodels indicate an all-round increase in temperatures, and ageneral increase in rainfall during the monsoon season qual-ified with large spatial variations. An overall decrease in thenumber of rainy days over a major part of the countrycoupled with an increase in the rainy day intensity can beseen. The temperature projections indicate an increase(maximum and minimum) of the order of 2-4 degreesCentigrade over the southern region, which may exceed 4degrees Centigrade over the northern region. Although thissummary of projected changes compiled in India’s NationalCommunication1 come with caveats of large model uncer-tainties, they do point to a future possibility of enhancedextreme weather events.
Linkages between climate change and natural disastersAdaptation refers to actions to help communities and ecosys-tems cope with changing climatic conditions. The internationalcommunity has given a high priority to these measures, ofwhich disaster reduction is a crucial part. Reducing vulnera-bility to climatic hazards today is essential to building futureresilience. We need to significantly strengthen our ability towithstand the adverse effects of current and future naturaldisasters, which are likely to be even more severe.
Although adaptation to climate change is a global issue, it isparticularly relevant to developing countries, as they are likelyto be the hardest hit by the effects of climate change. We mustevolve systems that raise the adaptive capacity of the mostvulnerable groups, through strategies for risk reduction andeffective response. As a large proportion of natural disastershave meteorological causes, the national meteorologicalservices have a key role to play in building adaptive capacitiesof nations. This significant and urgent role can however beplayed by the meteorological services only if they get connectedto the users in a very intricate and sensitive manner – withthe clear recognition that ‘adaptation’ has to happen in thesecommunities. This means that the forecasts have to translateinto useful information that can be directly used in decision-making.
There are several cases of extreme rainfall events in the recentyears that have lead to loss of lives and property in India. Themost significant of these was the Mumbai heavy rainfall eventof 26 July 2005, followed by similar incidents in Bangalore 24October 2005 and Chennai and surroundings during 2-4December 2005. All these cases occurred in densely populatedurban areas. Many more such examples can be quoted from allover the globe – and perhaps are glimpses of the most plausi-ble scenarios under the influence of climate change that wemay witness frequently in future.2 These cases have broughtto our attention the need to look at heavy rainfall spells incombination with the prevailing conditions under which theyoccur.
In his observations on the Mumbai heavy rainfall event, R.R. Kelkar highlighted: “Had Mumbai received the rainfall of94.4 mm in a day a century ago, the severity of problems wouldsurely have been much less. The population of Greater Bombay,now called Brihan Mumbai, was less than a million at thebeginning of the last century. The mid-century figure wasaround three million. By 2001, the population had grown toalmost 12 million. The city has risen vertically, open spaceshave dwindled, the arterial roads cannot be widened anyfurther, smaller roads have become car parks, and the drainagesystems cannot keep pace with the ever-increasing needs ofthe metropolis. Many people are literally living on the edge, inareas that are known to be prone to landslides.”3
The key message for the national weather services here isthat weather forecasts of the future cannot be stand-alone, butmust be presented with a context that makes them sociallyrelevant, and aids decision making. For this to happen, weneed to take an integrated approach that includes vulnerabil-ity analysis and impact assessments.
Recent efforts in disaster managementRecognizing the importance and need for an effective disasterpreparedness framework, the Government of India has set up
VULNERABILITY ASSESSMENTS
AND RISK ANALYSIS ON A GEO SPATIAL
FRAMEWORK
IMPACT ANALYSIS
MONITORING AND EARLY
WARNING SYSTEMS
DECISION SUPPORT SYSTEM FOR
DISASTER MANAGEMENT
TARGETED ALERTS, RISK REDUCTION,
APPROPRIATE RESPONSE AND
RAPID RECOVERY – MINIMIZE DAMAGES
R&D components that need to be integrated for an effective Disaster Management System
3.Natural & Human induced disasters:Master spread 16/2/07 09:50 Page 146

[ ]147
a National Disaster Management Authority (NDMA) in theyear 2006, as an apex body at the highest level under theChairmanship of the Prime Minister. All activities related todisasters are being brought into this framework to make well-orchestrated efforts across the concerned departments of theCentral government and the various state governments thatwould be the actual responders. A dedicated institution calledthe National Institute for Disaster Management has been estab-lished for training and improving awareness at all levels.
One of the significant priorities of the NDMA, has been tobring together the existing scientific capacities in research insti-tutes to address disaster management issues. This effort is beingsupported by the Department of Science & Technology, with anultimate aim to create systems for enhancing the relevance ofearly warnings through customized decision support and rapidinformation/alert delivery through novel communicationprotocols. Once created, these integrated frameworks shouldalso have capabilities to dynamically upgrade themselves byassimilating state-of-the-art technologies. Creating systemiclinkages among research institutions specializing in the variouscomponents of the integrated system will ensure sustainedcapacities.
The following enhancements are planned:• Observational aspects – Improved observational systems
over the land and oceans, enhanced use of satellite dataand improved weather radar networks
• Forecasting and warning – Improved processing of obser-vational data, multi-model ensemble forecast systems thatcan give probabilistic tropical cyclone landfall scenariogeneration at finer scales and warnings of extreme weather
• Impact assessment – Development of appropriate regionalscale models for storm surge inundation, Wind DamageAssessment and catchments-scale coastal river hydrolog-ical models for heavy rainfall induced inundationcombined with GIS capabilities to identify regions ofmaximum risk
• Vulnerability (Physical, Economic and Social) – enhance-ment and integration of topographic and thematic layers
under the National Database for Emergency Management(NDEM) Project for multi-hazard vulnerability assess-ment
• Communication and Dissemination – Integration of multi-departmental communication infrastructure andinstitutionalization of 24-7 operations of hazard mitigationinformation and dissemination infrastructure at nationaland state levels, and development of multiple communica-tion options for alerts and in post disaster situations.
Integrating technologies and capacities for disaster managementEffective disaster management strategies must be able to bringtogether a variety of expertise that may be available with adiverse set of research groups. For example, information aboutthe impending risks from a severe cyclonic storm must incor-porate information about the area that will experiencemaximum winds/rains, magnitude of surge near the coast andlikely regions of damage by high winds and heavy rains. Thisinformation should be available to decision makers in a user-friendly graphical interface on a geo-referenced platform. In apost disaster situation we must be able to restore communica-tions within the shortest possible time to facilitate aid andmedical redress. Building robust disaster management systemswill enable us to adapt to the threats of severe weather inducedby climate change.
Regional assessments, especially in developing and underdeveloped countries, have shown that many systems and poli-cies are not well adjusted even to today’s climate and climatevariability. Increasing losses both in terms of human lives andcapital costs, from drought, storms and floods demonstrate thecurrent vulnerability. Integrating technologies and research,leading up to better decision-making and evolution of strate-gies for disaster management would not only contributetowards adaptation to future climate change, but also improvethe existing systems. Appropriate research and policies that areconsistent with broader societal objectives will promotesustainable development in communities.
Mumbai, India after the heavy rains on 26 July 2005
Phot
o: S
ushm
a N
air
3.Natural & Human induced disasters:Master spread 16/2/07 09:50 Page 147
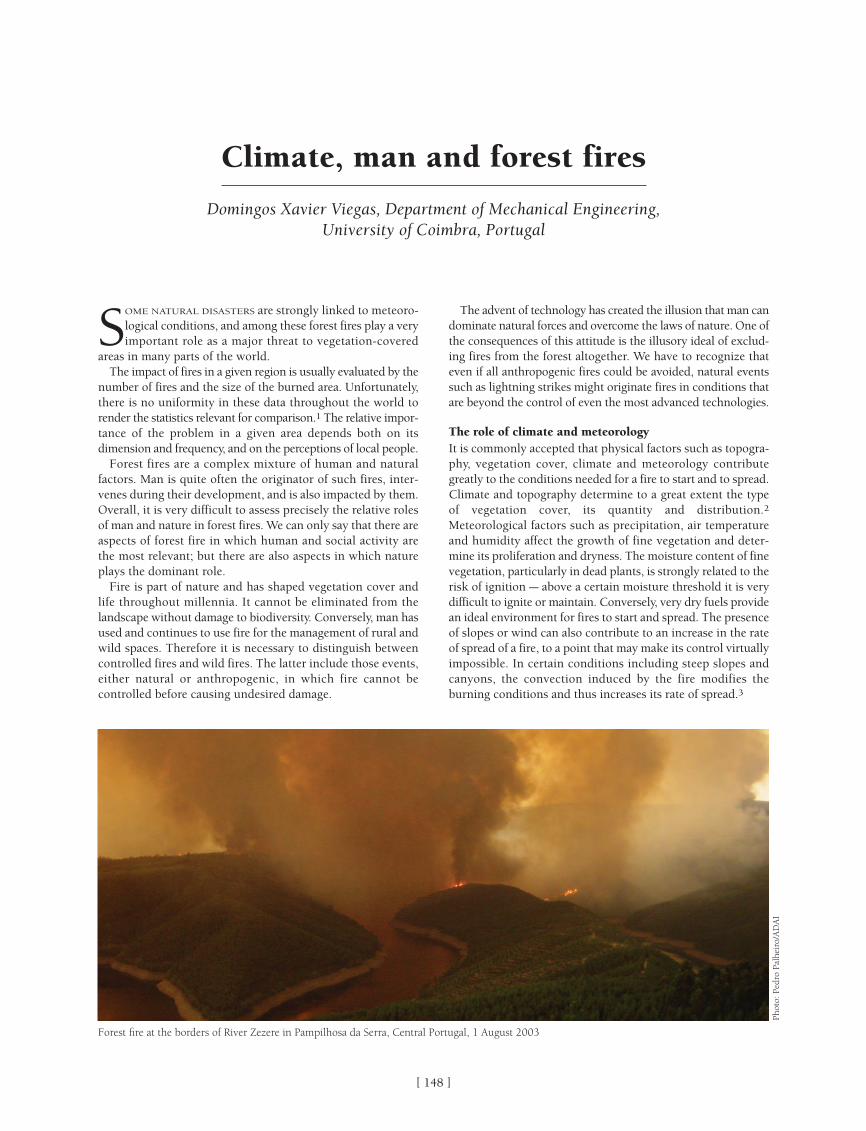
[ ]148
SOME NATURAL DISASTERS are strongly linked to meteoro-logical conditions, and among these forest fires play a veryimportant role as a major threat to vegetation-covered
areas in many parts of the world.The impact of fires in a given region is usually evaluated by the
number of fires and the size of the burned area. Unfortunately,there is no uniformity in these data throughout the world torender the statistics relevant for comparison.1 The relative impor-tance of the problem in a given area depends both on itsdimension and frequency, and on the perceptions of local people.
Forest fires are a complex mixture of human and naturalfactors. Man is quite often the originator of such fires, inter-venes during their development, and is also impacted by them.Overall, it is very difficult to assess precisely the relative rolesof man and nature in forest fires. We can only say that there areaspects of forest fire in which human and social activity arethe most relevant; but there are also aspects in which natureplays the dominant role.
Fire is part of nature and has shaped vegetation cover andlife throughout millennia. It cannot be eliminated from thelandscape without damage to biodiversity. Conversely, man hasused and continues to use fire for the management of rural andwild spaces. Therefore it is necessary to distinguish betweencontrolled fires and wild fires. The latter include those events,either natural or anthropogenic, in which fire cannot becontrolled before causing undesired damage.
The advent of technology has created the illusion that man candominate natural forces and overcome the laws of nature. One ofthe consequences of this attitude is the illusory ideal of exclud-ing fires from the forest altogether. We have to recognize thateven if all anthropogenic fires could be avoided, natural eventssuch as lightning strikes might originate fires in conditions thatare beyond the control of even the most advanced technologies.
The role of climate and meteorologyIt is commonly accepted that physical factors such as topogra-phy, vegetation cover, climate and meteorology contributegreatly to the conditions needed for a fire to start and to spread.Climate and topography determine to a great extent the typeof vegetation cover, its quantity and distribution.2
Meteorological factors such as precipitation, air temperatureand humidity affect the growth of fine vegetation and deter-mine its proliferation and dryness. The moisture content of finevegetation, particularly in dead plants, is strongly related to therisk of ignition – above a certain moisture threshold it is verydifficult to ignite or maintain. Conversely, very dry fuels providean ideal environment for fires to start and spread. The presenceof slopes or wind can also contribute to an increase in the rateof spread of a fire, to a point that may make its control virtuallyimpossible. In certain conditions including steep slopes andcanyons, the convection induced by the fire modifies theburning conditions and thus increases its rate of spread.3
Climate, man and forest fires
Domingos Xavier Viegas, Department of Mechanical Engineering, University of Coimbra, Portugal
Forest fire at the borders of River Zezere in Pampilhosa da Serra, Central Portugal, 1 August 2003
Phot
o: P
edro
Pal
heir
o/A
DA
I
3.Natural & Human induced disasters:Master spread 16/2/07 09:50 Page 148

[ ]149
will help to suppress fires while they are small, under normalconditions. Repeated, frequent incidence of fire disrupts theeconomy of a region, and in the long term may challenge thesustainability of biodiversity and of forest activities. Recoveryactions after a fire can minimize the loss of biodiversity, loss ofsoil, and other irreversible effects in burned areas.
An ever-increasing problem is that of the urban/wild landinterface, in which wildfires reach populated areas, fromisolated houses to the suburbs of large cities. This problem isassociated with many factors, including the desirability ofliving ‘closer to nature’, the lack of planning and managementin some areas, as well as changes in the climate.
Smoke produced by fires can be as much a problem as the fireitself. Smoke can travel a long way from the site of the fire andpersist for long periods of time, limiting visibility and creatinga health hazard in populated areas.
It is imperative to change attitudes to forest fires around theworld, particularly in those regions where fires are mainly causedby human actions. We know that it is not possible or even desir-able to exclude fire entirely from nature, but incidences ofanthropogenic forest fires should clearly be eliminated.
An increase in fire prevention activities is needed everywhere,ranging from the planning and management of forested and ruralareas to the creation of well-organized fire detection and initialattack services to stop fires while they are still small. Investmentin expensive fire-fighting equipment – although necessary up toa point – is not the solution to the problem. It never will be ifother activities are not carried out, including the fundamentalinvolvement of the entire population in this common effort.
Forest fire incidence is not uniform throughout the world,but everywhere it is the result of both natural and anthro-pogenic factors. Climate change is already bringing anincreased risk of forest fires, and this tendency is likely to leadto even larger and more widespread problems in the future.
Science and technology can support man in managing andcontrolling fire in rural areas, but not in mastering it and evenless in eliminating it from nature. A common effort by all insti-tutions and citizens is required to minimize the incidence offires, especially in these days of high risk. Man is part of thisproblem and must be part of its solution.
Even in areas of the world where fires are mainly caused byhuman actions, there is a strong correlation between goodburning conditions and fire incidence. It is therefore convenientto express these burning conditions in the form of a fire dangerindex. This index is based on meteorological parameters andtakes into consideration the fire history of the region. Its estab-lishment is a very basic step towards the management of forestfires. The Canadian Fire Weather Index is rapidly becoming acommon standard for the assessment of fire danger worldwide.
Natural fires caused by lightning have, over millennia, modi-fied natural vegetation to balance and contain biomass growth.In some regions this fire cycle has a period of tens of years,while in other regions it can take several centuries before agiven area is burned again. In some areas of the world, whereintensive forest exploitation is not possible, this natural cyclestill occurs. However, human intervention has changed thispattern, sometimes introducing new species and controllingfuel accumulation cycles through harvesting. The result is thatit is increasingly difficult to protect both native and introducedspecies from fire.4
Climate change, with its likelihood of a rise in temperatureand a decrease in relative humidity, is likely to exacerbate firerisks, and even to promote fire risk in currently less fire-proneareas. Increased temperature and reduced precipitation in thelong term will modify vegetation cover, promoting fire-pronespecies. Global warming, with the increase of energy in theatmosphere, will produce greater variability in meteorologicalconditions. As a consequence, fire seasons will be extended,and the number of very high-risk days will tend to increase.As a result of these changes, many countries have already expe-rienced increased fire incidence over the last decade.
Forests act as a sink for carbon monoxide and contribute tosettle the overall balance of carbon in the atmosphere. Butwhen they burn, not only is this sink effect lost, but very largequantities of carbon monoxide, carbon dioxide and othernoxious products are also emitted, compounding the problem.
The role of manFrom initially passively observing fire working in nature, manbegan to use it to clear vegetation for habitation, crops andgrazing. In modern times the destruction of natural habitatshas been restricted, and some areas have been legally protected.Prior to this there had been a kind of equilibrium, due to anextensive consumption of biomass by fire. The exclusion offire in this context, in combination with other social andnatural factors, brought about an accumulation of vegetation.Episodic fires that threatened human life and property createdthe need to suppress them in an organized way. In response tothis some countries reintroduced fire in controlled conditionsin a tentative effort to re-establish the natural balance. In spiteof this effort, fire remains a threat not only to natural and culti-vated areas, but also to urban areas.
Forest fires are unique among natural disasters in that humanintervention can be effective at all stages of their development:before, during and after. In non-natural landscapes such asrural areas and forest plantations, the organization of the areaand the way the plantations are planned and managed canmodify the conditions that facilitate fire ignition and spread.The choice of species and reduction of fuel loads can contributeto reducing fire impact in most high-risk conditions, with theexception of the very extreme. The existence of fire-breaks anda distributed network of fire detection and fire-fighting systems Fire spreading in a valley near Maxial-Sertã, Portugal, 6 August 2003
Phot
o: L
uis
Pita
/AD
AI
3.Natural & Human induced disasters:Master spread 16/2/07 09:50 Page 149

[ ]150
FOREST FIRES ARE one of the most serious natural risksaffecting Portugal, especially during the summer time.They are dependent on many factors and produce
various effects, making them a very complex and challengingproblem. For the deflagration of a forest fire it is necessary tohave combustible substance and a source of heat. Its evolutiondepends on atmospheric conditions and the state of the vege-tation.
In countries with a Mediterranean climate, the predominantmeteorological conditions over the summer months such asheat and dehydration of vegetation encourage the occurrenceof forest fires. Portugal has a relatively long warm and dryseason, during which wild fires can occur. In the period of thefire season, considered to be between May and October,Portugal suffers a large number of forest fires and burnt area.Forest fire spread is related to social factors, often consuminga vast forested area.
In Portugal, different institutions are directly involved in theprevention and combat of forest fires. These include thePortuguese Civil Protection and Fireman Service, the ForestryService and the Portuguese Institute of Meteorology. In recentyears, research and a successful collaboration between theseinstitutions has led to a better understanding of the deflagra-tion and propagation of the forest fires and the investment oftime and resources to provide guidelines and possible solutions.
When evaluating the global risk of forest fires, it is absolutelyessential to take into consideration the impact of meteorolog-ical conditions. The fire risk brings together detailedinformation from meteorological net stations all over the world,aiming to provide a very precise analysis of meteorologicalconditions, weather forecasts and climate conditions affectingall domestic territories.
The research from the Portuguese Institute of Meteorologyincludes, beyond all the general meteorological information,specific products, such as the Fire Weather Index (FWI) of theCanadian System and the Combined Risk Index of Forest Fire(ICRIF), which are all directly used to support the preventionof forest fires. This information is made available to all nationalentities that have responsibilities in the prevention and combatof forest fires. A daily brief is established between the WeatherForecasting Centre and the National Civil Protection andFireman Centre. The information is made available to thepublic during the most critical parts of the year.
Fire Weather Index The information distributed by the Portuguese Institute ofMeteorology is based on the Fire Weather Index (FWI). Thecalculation of the FWI includes several meteorological vari-ables; the temperature, the relative humidity of air, the windspeed at surface and the amount of precipitation observed inall the meteorological stations, taking into account the fore-cast for the next two days.
The information also contains charts with different classes offire risk defined by regions. The predicted fire risk classes arebased on the FWI integrated with the country vegetation typemap from the Portuguese Forestry Service. The different classesof Fire Risk are shown in different colours, relative to the inten-sity of risk from yellow to red.
The Portuguese Institute of Meteorology also computes adaily combined Forest Fire Risk Index, the ICRIF (ÍndiceCombinado de Risco de Incêndio Florestal). It is a dynamicindex, combining meteorological, vegetation status and struc-tural information and computing, not just the probability offorest fire ignition, but also the capability of fire spread.
The Portuguese Institute of Meteorology and forest fires
Luis Pessanha, Julia Silva and Teresa Abrantes, Instituto de Meteorologia, Portugal
Forest fire risk classes by regions
Source: IM Portugal
3.Natural & Human induced disasters:Master spread 16/2/07 09:50 Page 150

[ ]151
The ICRIF agglomerates several factors, taking into accountboth structural and meteorological indices, combining the FWIwith a fuel map and a vegetation parameter. It is calculated byweighting the FWI value with a factor connected with a fuelburn index, obtained from the CORINE 2000 (Coordination ofInformation on the Environment), and a vegetation index, theNDVI. The weights are values scaled from 0 to 100 and thefinal value of ICRIF can range from 0 to about 100.
The CORINE 2000 database is an update of the old CORINE1990, a programme introduced by the European Commissionin 1985, in order to gather information relating to the envi-ronment for the European countries. CORINE land cover is aEuropean wide land cover and land use classification, producedusing satellite images. The mapping accuracy is at least100metres.
Forests are periodically burned, resulting in an immediatechange of the land cover in the burned surface. This can resultin the recovery of natural vegetation or forest species that werepresent before the fire affecting the structural fire risk map.The new characterization of the land cover is completed,updating the value of the fuel risk pixel. This update is doneat least once a year at the beginning of the fire season (April)and can be done using imagery and observing changes in theNDVI index.
The Normalized Difference Vegetation Index (NDVI) is oneof the most used vegetation indexes and is a measure of theamount and vigour of vegetation at the surface. The magni-tude of NDVI is related to the level of photosynthetic activityin the observed vegetation. NDVI is calculated using measure-ments from the Advanced Very High Resolution Radiometer(AVHRR) on board the USA’s NOAA polar orbiting meteoro-logical satellites. The reflectance measured from Channel 1(visible: 0.58 - 0.68 microns) and Channel 2 (near infrared:0.725 - 1.0 microns) is used to calculate this index. The differ-ential reflectance in these bands provides a means ofmonitoring density and vigour of green vegetation growthusing the spectral reflectivity of solar radiation. Green leavescommonly have larger reflectance in the near infrared than inthe visible range. As the leaves come under water stress,become diseased or die back, they become more yellow andreflect significantly less in the near infrared range.
Clouds, water and snow have larger reflectance in the visiblethan in the near infrared, leading to a negative value of NDVI,while the difference is almost zero for rock and bare soil. The
NDVI is affected by a number of different phenomena, includ-ing cloud contamination, atmospheric perturbations, variableillumination and viewing geometry, all with an impact of reduc-ing the NDVI value. To address these effects, NDVI data is oftenused as a composite, taking the maximum value over a speci-fied time period, usually a week or ten days. To minimize theerror due to illumination and viewing geometry, every day aprogram chooses the image NOAA with the best observationalzenith angle below 45 degrees and the best solar zenith anglebelow 35 degrees of the solar elevation angle. With this imagea geometric correction is automatically made by the receivingstation with several reference ground control points. The finalerror is estimated on a one-pixel basis.
An example of the ICRIF is shown here, which illustratesthat by the end of May and beginning of June there were verygood synoptic conditions for forest fires in the northern partof Portugal. On the contrary, in the southern part of Portugal,the lower temperature and cloudy conditions were observedwith precipitation in some of the regions.
The third image illustrates the severity of the fire risk regis-tered in Portugal during the fire season over the past years.You can see that the severity rating has been generally veryhigh, but in the year 2005 it reaches an exceptional value.Although in 2006 the fire risk was also very high on some days,they were interspersed with periods of precipitation, impact-ing the overall risk assessment for the year.
Both FWI and ICRIF are used by the civil protection agencyto prevent and combat forest fires. From this informationseveral measures can be taken to protect the areas where therisk is higher.
During the summer of 2006, the value of the fire risk wasrecognised as very useful information, reducing the impact offorest fires, and therefore reducing the number of occurrencesand burn area. This daily contribution to support forest fireprevention and combat is an example of successful coopera-tion between decision makers, in this case the Portuguese CivilProtection Service and the Portuguese Institute ofMeteorology.
Source: IM Portugal
ICRIF values showing the evolution of the fire risk
Source: IM Portugal
The evaluation of seasonal severity of fire risk in Portugal
3.Natural & Human induced disasters:Master spread 16/2/07 09:50 Page 151

[ ]152
SURROUNDED BY THE Alpine mountains to the west, andthe Carpathian mountains to the north and east Hungary’sbasin situation is accompanied by several long and short-
term weather extremities despite its temperate climate, whichis accredited to its 46-48 N geographical latitude. Four suchextreme events are droughts, heat waves, vast local precipita-tion (flash-floods) and convective windstorms. By looking atthe phenomenology and regional characteristics of theseevents, it will be possible to point to the relevant servicesprovided in each case by the National Meteorological Service(NMS), including forecasts and warnings of the event.
The phenomena are listed in decreasing order of their timescales. Hence, the possibility and importance of forecasting(i.e. the factor of timely warning) rapidly increases, whereasour ability to judge more recent and future trends, diminishes.
DroughtHungary is situated in the Carpathian basin, surrounded bymountains but open to the south. This geographical positioncan also contribute to the fact that precipitation tendencies inHungary are similar to those in the Mediterranean region. Inaddition, the largest decrease of precipitation can be found inthe more humid areas. Therefore, almost the whole territoryof the country suffers from water scarcity, mostly throughfrequent drought events.
Monthly precipitation can reach 200 millimetres in almostany month and region, but months without a drop of precipita-tion may also occur in any season. Sometimes both flood and
drought are experienced in the same region during the sameyear. Annual and seasonal precipitation amounts are decreasing,with one exception. The summer precipitation totals have nodefinite trend themselves, but the water management situationis still worsening, as precipitation occurs in fewer cases and withhigher intensity. Besides this inconvenient dosage of precipita-tion, positive temperature trends also intensify the problem.
The average situation is well characterized by the temporalevolution of annual minima and maxima of the PalmerDrought Severity Indices (PDSI) in Debrecen. Both the annualmaxima and minima have a decreasing tendency, indicating anincreasingly large chance of droughts. Debrecen is situated inthe north-east region of Hungary. From among the three typicalclimats that influence Hungary (oceanic, Mediterranean andcontinental), the climate of Debrecen is mainly governed bythe latter.
The Hungarian Meteorological Service (HMS) operates aninteractive irrigation advisory system through its homepage,free of charge (www.met.hu). The irrigation model uses theobserved data of precipitation and plant-specific, estimatedevapotranspiration, all obtained from automatic weatherstations to describe the actual plant water demand.
Heat wavesThe mean summer temperature was 19.6 degrees Celsius in the1961-1990 normal period. Since its end, however, both the averageand the deviations from it seem to have changed significantly.Parallel to global warming, the simple linear trend of the summer
Battling extreme weather under a temperate climate – Hungary
Gyuró, Gy., Á. Horváth, M. Lakatos, S. Szalai and J. Mika, Hungarian Meteorological Service
Change in annual precipitation (%) in Hungary for the period 1951-2004. Exponential trend estimation is applied, and the results relate to the 54-year long interval
Source: OMSZ
Severe weather warning for 20 August 2007, issued at 17:38 UTCfor the official website of the Hungarian Meteorological Service
Source: OMSZ
3.Natural & Human induced disasters:Master spread 16/2/07 09:50 Page 152
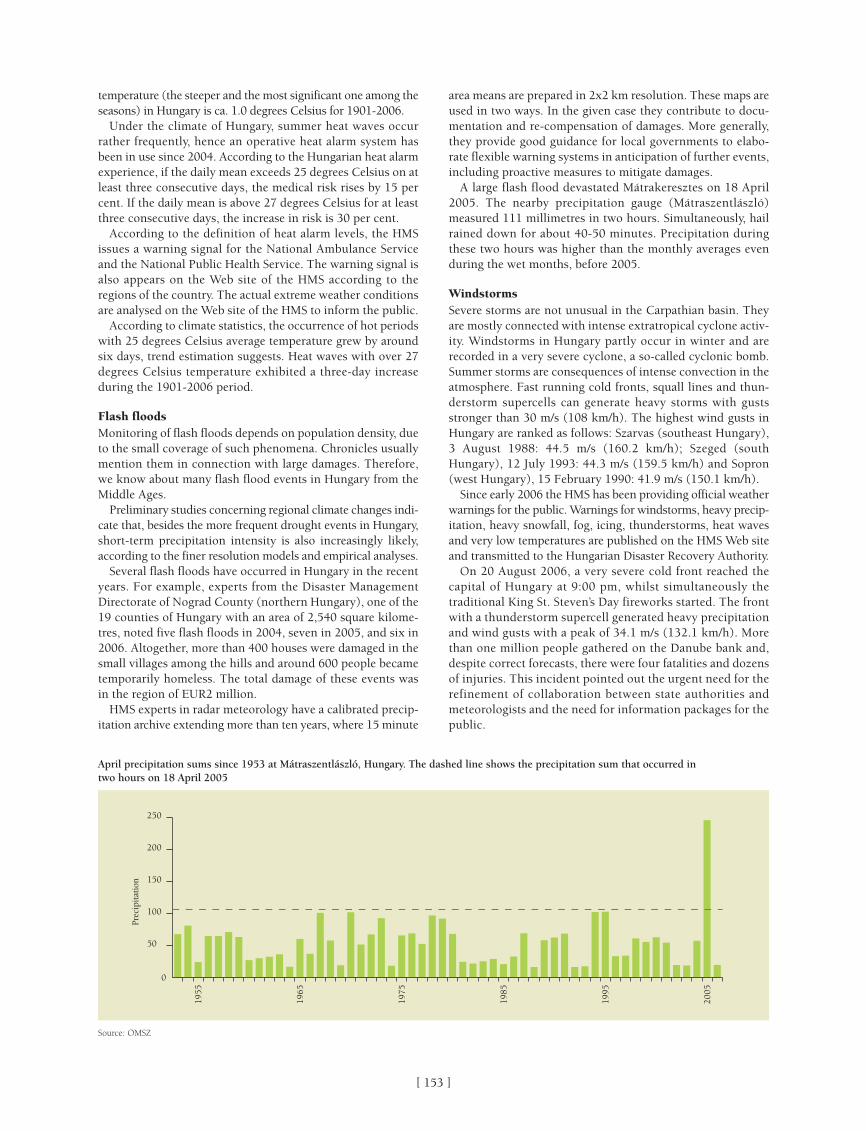
[ ]153
temperature (the steeper and the most significant one among theseasons) in Hungary is ca. 1.0 degrees Celsius for 1901-2006.
Under the climate of Hungary, summer heat waves occurrather frequently, hence an operative heat alarm system hasbeen in use since 2004. According to the Hungarian heat alarmexperience, if the daily mean exceeds 25 degrees Celsius on atleast three consecutive days, the medical risk rises by 15 percent. If the daily mean is above 27 degrees Celsius for at leastthree consecutive days, the increase in risk is 30 per cent.
According to the definition of heat alarm levels, the HMSissues a warning signal for the National Ambulance Serviceand the National Public Health Service. The warning signal isalso appears on the Web site of the HMS according to theregions of the country. The actual extreme weather conditionsare analysed on the Web site of the HMS to inform the public.
According to climate statistics, the occurrence of hot periodswith 25 degrees Celsius average temperature grew by aroundsix days, trend estimation suggests. Heat waves with over 27degrees Celsius temperature exhibited a three-day increaseduring the 1901-2006 period.
Flash floodsMonitoring of flash floods depends on population density, dueto the small coverage of such phenomena. Chronicles usuallymention them in connection with large damages. Therefore,we know about many flash flood events in Hungary from theMiddle Ages.
Preliminary studies concerning regional climate changes indi-cate that, besides the more frequent drought events in Hungary,short-term precipitation intensity is also increasingly likely,according to the finer resolution models and empirical analyses.
Several flash floods have occurred in Hungary in the recentyears. For example, experts from the Disaster ManagementDirectorate of Nograd County (northern Hungary), one of the19 counties of Hungary with an area of 2,540 square kilome-tres, noted five flash floods in 2004, seven in 2005, and six in2006. Altogether, more than 400 houses were damaged in thesmall villages among the hills and around 600 people becametemporarily homeless. The total damage of these events wasin the region of EUR2 million.
HMS experts in radar meteorology have a calibrated precip-itation archive extending more than ten years, where 15 minute
0
50
100
150
200
250
1955
1965
1975
1985
1995
2005
Prec
ipita
tion
April precipitation sums since 1953 at Mátraszentlászló, Hungary. The dashed line shows the precipitation sum that occurred in two hours on 18 April 2005
Source: OMSZ
area means are prepared in 2x2 km resolution. These maps areused in two ways. In the given case they contribute to docu-mentation and re-compensation of damages. More generally,they provide good guidance for local governments to elabo-rate flexible warning systems in anticipation of further events,including proactive measures to mitigate damages.
A large flash flood devastated Mátrakeresztes on 18 April2005. The nearby precipitation gauge (Mátraszentlászló)measured 111 millimetres in two hours. Simultaneously, hailrained down for about 40-50 minutes. Precipitation duringthese two hours was higher than the monthly averages evenduring the wet months, before 2005.
WindstormsSevere storms are not unusual in the Carpathian basin. Theyare mostly connected with intense extratropical cyclone activ-ity. Windstorms in Hungary partly occur in winter and arerecorded in a very severe cyclone, a so-called cyclonic bomb.Summer storms are consequences of intense convection in theatmosphere. Fast running cold fronts, squall lines and thun-derstorm supercells can generate heavy storms with gustsstronger than 30 m/s (108 km/h). The highest wind gusts inHungary are ranked as follows: Szarvas (southeast Hungary),3 August 1988: 44.5 m/s (160.2 km/h); Szeged (southHungary), 12 July 1993: 44.3 m/s (159.5 km/h) and Sopron(west Hungary), 15 February 1990: 41.9 m/s (150.1 km/h).
Since early 2006 the HMS has been providing official weatherwarnings for the public. Warnings for windstorms, heavy precip-itation, heavy snowfall, fog, icing, thunderstorms, heat wavesand very low temperatures are published on the HMS Web siteand transmitted to the Hungarian Disaster Recovery Authority.
On 20 August 2006, a very severe cold front reached thecapital of Hungary at 9:00 pm, whilst simultaneously thetraditional King St. Steven’s Day fireworks started. The frontwith a thunderstorm supercell generated heavy precipitationand wind gusts with a peak of 34.1 m/s (132.1 km/h). Morethan one million people gathered on the Danube bank and,despite correct forecasts, there were four fatalities and dozensof injuries. This incident pointed out the urgent need for therefinement of collaboration between state authorities andmeteorologists and the need for information packages for thepublic.
3.Natural & Human induced disasters:Master spread 16/2/07 09:50 Page 153

[ ]154[ ]154
4.Environment:Master spread 16/2/07 10:11 Page 154

IVENVIRONMENT
4.Environment:Master spread 16/2/07 10:11 Page 155

[ ]156
THE AFRICAN DROUGHTS of the 1990s brought worldwideattention to the devastating effects of severe weatherevents. The dependence of African economies on rain-
fed agriculture, combined with weak institutional and physicalinfrastructure, social conflict, and an inconsistent politicalenvironment, puts African livelihoods at high risk to climaticfluctuations. Over the past 20 years scientists have improvedtheir understanding of the role played by El Niño-SouthernOscillation (ENSO) – the coupled ocean-atmosphere interac-tions in the equatorial Pacific Ocean – in African climatevariability. Recent improvements in sea surface temperaturemodels enable scientists to predict the onset of ENSO events,and also their effect on global climate. To explore how climateprediction could be used as a social benefit the United StatesNational Oceanic and Atmospheric Administration (NOAA)has launched a number of programmes aimed at studyingpolicy processes under climate variability and the utility ofseasonal climate predictions. The results have brought to lightthe intricate relationship between climate and society, and pointto the opportunity for climate science to become a criticalcomponent of African development policy.
Since 1995 NOAA, along with key partners such as theUnited States Agency for International Development Office forForeign Disaster Assistance (USAID-OFDA), has funded over100 workshops and research projects across Africa. The workprovides support for local organizations to create and dissem-inate seasonal climate forecasts, and identifies areas whereforecasting can be used to promote socio-economic stability.Through these projects NOAA recognized that accurate infor-mation on seasonal precipitation has the potential to benefitdecision-making in multiple sectors. Within the agriculturalsector the most important decisions are when and where toplant. Accurate forecasts allow farmers to know when to plantdrought resistant seeds, or capitalize on good rain years bysupplementing with cash crops. At the government level thisinformation helps determine the amount of food to import anddistribute to maintain national food security. Many vector andwater borne diseases are dependant on swings in temperatureand precipitation. The ability to forecast these variations hasthe potential to warn health ministries of an impendingoutbreak. Given this information, officials within the healthsector can stockpile medication and fresh water, perform
indoor residual spraying, and distribute insecticide treated netswhere needed. Within the water management sector informa-tion on cumulative rainfall can be used to manage dam levels.In particular, information on a dry year can give hydroelectricofficials time to seek out alternative power supplies.
NOAA has used a wide range of approaches to address thediversity of institutions that stand to benefit from accurate fore-casting. The first priority has been creating integratedprogrammes that bridge scientific research with decision-makingat the local level. Currently, NOAA supports three main regionalclimate centres through direct funding and research support: theAfrican Centre of Meteorological Applications for Development(ACMAD) in Niger, the Southern African DevelopmentCommunity Drought Monitoring Centre (SDMC) in Zimbabwe,and the Intergovernmental Authority on Development ClimatePrediction and Application Center (ICPAC) in Kenya. Allprovide the opportunity for members of the NationalMeteorological and Hydrological Services (NMHS) from variouscountries to work together on regional forecasting projects.
Each centre creates a seasonal climate forecast for its regionprior to the start of the rainy season. The forecast indicates thelikelihood that a given area’s rainfall will be close to, above orbelow a thirty year average. To ensure visibility of the forecastand encourage its timely distribution, each centre organizes aClimate Outlook Forum (COF). The COFs provide an opportu-nity for scientists to present findings to stakeholders from allsectors. In turn, the stakeholders gain a platform for sharing theirneeds. The result is an enhanced understanding of the complex-ity surrounding how society responds to climate information.
While the COFs represent the most visible efforts, they areonly one of the many research activities NOAA and USAID-OFDA support. By holding workshops with small communitiesof subsistence and commercial farmers, NOAA has gainedinsight on the needs of the end users. Workshops can bebroken down into two main categories: exploratory and educa-tional. The exploratory workshops aim to determine if theforecasts are being used. Most have indicated that while manyfarmers are aware of the existence of an official seasonal fore-cast, few use it in their planning. Interviews have shown thatfarmers are eager to use the forecasts; however, they do notreceive information in time to adjust their behaviour accord-ingly. The education and outreach workshops give participants
Knowledge for sustainable development: assessing a decade of
African climate forecasting
Jordan R. Winkler, Boston UniversityAnthony Patt, International Institute for Applied Systems Analysis
Kabineh Konneh, NOAA Climate Programs Office
4.Environment:Master spread 16/2/07 10:11 Page 156

[ ]157
Once the forecast is given at the COFs the responsibilityfor dissemination is left to the national, provincial and localgovernments. Often training is minimal, funding is low, andforecasts get caught up in the bureaucratic process. By thetime they have reached the end user they are incomplete ortoo late. Radio has been identified in many studies as aprimary source of forecast delivery; however, workshopparticipants pointed out an inability for listeners to ask ques-tions or receive clarification. The most effectivecommunication method will constitute a two-way processwith active participation from the end user.
Often, the form of the forecast offers little help to the recip-ient. In some cases, the information may conflict withindigenous methods and can be met with distrust. The prob-abilistic forecasts offer no information on temporaldistribution of precipitation. Many farmers are accustomedto the accuracy and detail of the ten-day updates they regu-larly receive from NMHS, and expect similar detail for theseasonal forecasts. Other times the spatial scale may be inap-propriate and require adjustment. There have been caseswhere NMHS have waited until the season started to scaledown the forecast for fear of being incorrect. Training mustbe available at all levels of the dissemination process.
These results, though preliminary, offer insight for futureresearch. The main objectives of future studies should be tosupport and enhance existing successes while improving fore-cast design, communication, and training for both users andproducers. A need exists to tailor forecasts based on the specificrequirements of national agencies and smaller user groups. Moreeffective means of mass communication need to be developed,including sensitising the media to act as a responsible partnerin the dissemination process. Lastly, every project should worktowards enhancing regional ownership of the processes that arenow internationally sponsored. This can be achieved by devel-oping frameworks for regional and national funding andidentifying sustainable sources for COFs and other outreach.The responsibility of scientists and policy makers remains toprovide the information and education necessary for the endusers to gain the most benefit from utilizing the forecasts. Theend users’ opinions, their ability to use the forecasts, and thebenefits they ultimately derive from them, should be the mostimportant measure of success.
the ability to ask questions regarding the forecast process, andgain a better understanding of the terminology of the forecasts.
Other research efforts have focused on improving the processof creating and adjusting forecasts for specific applications.Within the health sector, new understanding of the link betweenmalaria and temperature and precipitation, has led to the devel-opment of malaria forecast models. These models combine theseasonal forecast with daily ground monitoring and allow offi-cials to predict malaria outbreaks months in advance. In Kenya,daily monitoring is being utilized for hydroelectric manage-ment on the Tana River and is combined with information onsea surface temperatures to create river flow models.
In hopes of evaluating the effectiveness of these efforts, NOAAhas engaged a team from Boston University and theInternational Institute for Applied System Analysis to conducttwo research tasks. First, the team is conducting a meta-analy-sis of the published and unpublished empirical findings fromthe past decade. Second, the team is gathering feedback fromgovernmental and non-governmental agencies within theregion. The primary goal of the work is to organize and evalu-ate the results around a set of thematic issues present at both thetop and bottom of the process. Within each issue they willdescribe the state of knowledge that existed prior to the start ofthe NOAA programmes. Next, the methodologies of theresearch are examined and presented alongside the results,allowing the reader to assess the reliability of the work. Mostimportantly they are attempting to identify gaps in the currentstate of knowledge, which will provide a stimulus for futureresearch. The purpose is not to answer definitively the ques-tions associated with these issues, or promote application inany particular sector, but to offer a neutral assessment forpolicy-makers.
The preliminary findings have shown common achievementsand setbacks through nearly every sector. The majority ofsuccessful applications occur where end users have a high levelof education, regular exposure to the forecasts, or work in asector with well-established links to climate scientists. But it isclear that knowledge of the forecasts is not limited to theeducated. Media coverage of the 1997-1998 ENSO events drewwidespread attention to the existence of the forecasts; however,the amount of use among less educated groups is limited dueto issues with communication and dissemination.
Global effects of El Niño, showing conditions over Africa
Wet & Warm
Wet
Wet
Dry
Dry
Dry & Warm
Warm Warm
Warm Warm
Warm
Dry
Wet & Cool
Warm
Sour
ce: I
RI
4.Environment:Master spread 16/2/07 10:11 Page 157
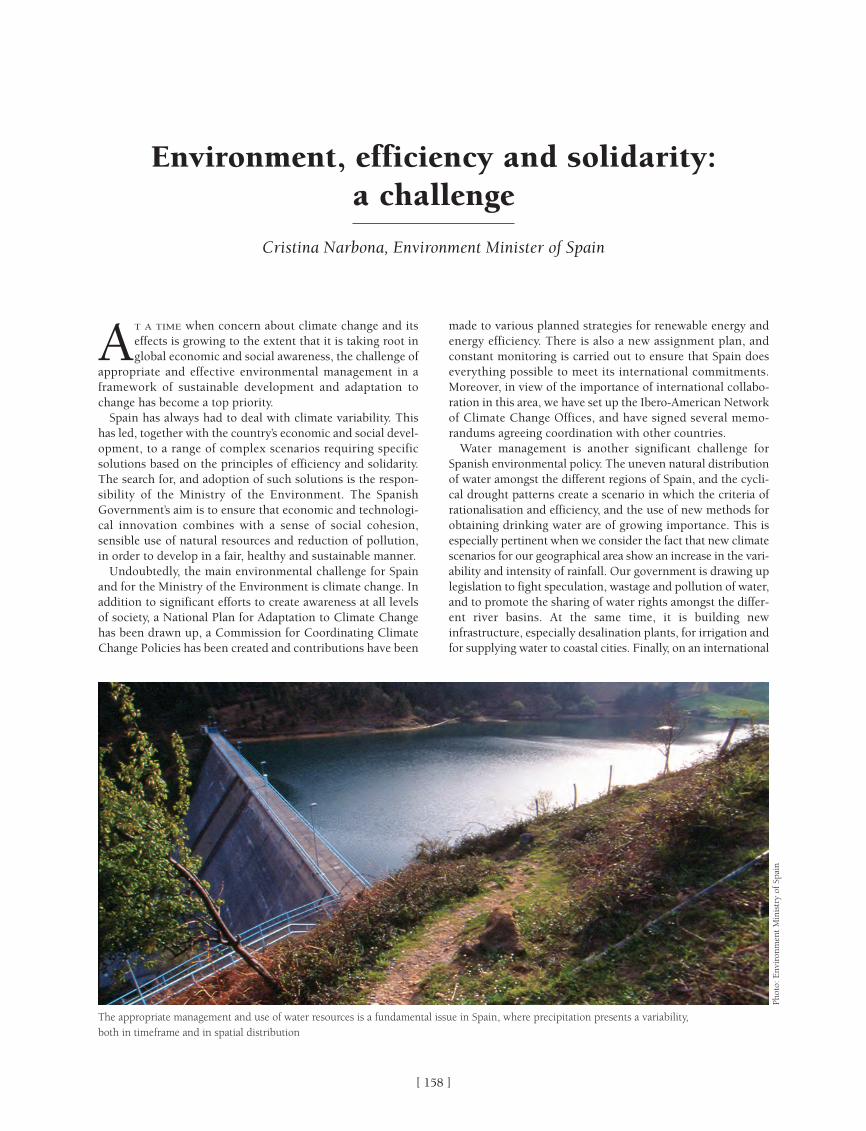
[ ]158
AT A TIME when concern about climate change and itseffects is growing to the extent that it is taking root inglobal economic and social awareness, the challenge of
appropriate and effective environmental management in aframework of sustainable development and adaptation tochange has become a top priority.
Spain has always had to deal with climate variability. Thishas led, together with the country’s economic and social devel-opment, to a range of complex scenarios requiring specificsolutions based on the principles of efficiency and solidarity.The search for, and adoption of such solutions is the respon-sibility of the Ministry of the Environment. The SpanishGovernment’s aim is to ensure that economic and technologi-cal innovation combines with a sense of social cohesion,sensible use of natural resources and reduction of pollution,in order to develop in a fair, healthy and sustainable manner.
Undoubtedly, the main environmental challenge for Spainand for the Ministry of the Environment is climate change. Inaddition to significant efforts to create awareness at all levelsof society, a National Plan for Adaptation to Climate Changehas been drawn up, a Commission for Coordinating ClimateChange Policies has been created and contributions have been
made to various planned strategies for renewable energy andenergy efficiency. There is also a new assignment plan, andconstant monitoring is carried out to ensure that Spain doeseverything possible to meet its international commitments.Moreover, in view of the importance of international collabo-ration in this area, we have set up the Ibero-American Networkof Climate Change Offices, and have signed several memo-randums agreeing coordination with other countries.
Water management is another significant challenge forSpanish environmental policy. The uneven natural distributionof water amongst the different regions of Spain, and the cycli-cal drought patterns create a scenario in which the criteria ofrationalisation and efficiency, and the use of new methods forobtaining drinking water are of growing importance. This isespecially pertinent when we consider the fact that new climatescenarios for our geographical area show an increase in the vari-ability and intensity of rainfall. Our government is drawing uplegislation to fight speculation, wastage and pollution of water,and to promote the sharing of water rights amongst the differ-ent river basins. At the same time, it is building newinfrastructure, especially desalination plants, for irrigation andfor supplying water to coastal cities. Finally, on an international
Environment, efficiency and solidarity: a challenge
Cristina Narbona, Environment Minister of Spain
The appropriate management and use of water resources is a fundamental issue in Spain, where precipitation presents a variability, both in timeframe and in spatial distribution
Phot
o: E
nvir
onm
ent
Min
istr
y of
Spa
in
4.Environment:Master spread 16/2/07 10:11 Page 158

[ ]159
level, it has helped establish cooperation with Latin America inthe fields of water availability and management.
Forest fires are another serious challenge. The long periodsof drought, high temperatures and a growing number of openair activities are giving rise to a large number of fires. A properforestry policy, with legislation that takes into account thecurrent situation and promotes public awareness, wouldpresent a simple but effective line of defence against this threat.
The preservation and improvement of biodiversity in naturalareas of Spain is also of special importance to the Ministry.Conservation strategies are in place, the creation of newnational parks is planned, and a thorough review of the policyfor coastal area management is being implemented.
Another problem is the social, economic and environmentaleffects of adverse atmospheric phenomena in Spain. Heavyrainfall in the Mediterranean areas, heat waves, strong windsand snowfalls often have direct consequences for our society.Preparedness along with a fast and effective response are essen-tial. Our Ministry makes a substantial contribution to attainingthis through the National Meteorology Institute. The instituteoperates and maintains a modern warning and forecastingsystem, which benefits from active coordination with otherEuropean meteorological institutions.
When drawing up long-term policies and strategies, or adopt-ing urgent measures, one of the key requirements for theplanning and management of weather services is the availabil-ity of high-quality climatic, meteorological and hydrologicalforecasts. The development of regionalized climatic scenarios isessential for the adaptation and development of weather servicesin the long term. Also, precise meteorological and, where appro-priate, hydrological forecasts are a basic requirement foractivities in the short and medium term, and for facilitating fastreactions to adverse weather events. The Spanish NationalMeteorology Institute has extended its traditional tasks in orderto meet these challenges and to provide more substantialsupport to environmental planning and management in general.It is essential to maintain well-equipped, effective state meteo-
Preserving biodiversity is a high priority in environmental protectionactivities in Spain. This is implemented through a wide network ofnatural parks and protected spaces
Phot
o: E
nvir
onm
ent
Min
istr
y of
Spa
in
Spain is one of the leading countries in the exploitation of renewableenergies, particularly wind energy
Phot
o: E
nvir
onm
ent
Min
istr
y of
Spa
in
rological services – services that can provide reliable observa-tions and basic climatological, forecasting and surveillanceproducts, in order to meet the needs of users in general, and ofan increasing number of economic and social activities.
Although great improvements have been made in the qualityand availability of such environmental information, furtherprogress is still necessary, along with a fresh multidisciplinaryapproach. Through international collaboration, experts acrossthe world have been able to compile, share and refine their dataand research so that accurate, effective application is possible.We have invested large amounts in international development,notably through the Araucaria XXI programme and an agree-ment with the Spanish Agency for International Cooperationregarding the Azahar programme. We have also significantlyincreased our contribution to United Nations EnvironmentProgramme, for the purpose of fighting desertification in Africa,improving access to drinking water in Latin America and train-ing personnel in environmental tasks. Also, by bringing togetherexperts from different areas on a national level, we are able tooffer a greater quantity of information and produce more valu-able conclusions. This enables swift, accurate short and mediumterm responses. We have fostered the Sectoral Conference onthe Environment, and the Advisory Council on theEnvironment, while intensifying media campaigns for envi-ronmental awareness amongst both the general public andprofessionals in all sectors of economic and social activity.
However, we need to continue working towards solving globalenvironmental problems. Useful solutions require better knowl-edge of the atmospheric environment and its trends. Scientistsmust develop a clearer understanding of the needs of users, andan awareness of those who will be most affected by meteoro-logical and climatic events. Conferences such as Secure andSustainable Living: Social and Economical Benefits of Weather,climate and Water Services 2007 are of fundamental importance.The guaranteed availability of accurate forecasting would enableeffective environmental management. Such an improvementwould enhance the living conditions for all humanity.
4.Environment:Master spread 16/2/07 10:11 Page 159

[ ]160
SUB-SAHARAN AFRICA is home to many of the world’sdeveloping nations – and to some of its poorest, forwhom life is precarious. Crop failure, environmental
degradation and increasing competition for scarce naturalresources caused by extreme weather events and climatechanges are posing unprecedented threats to economies, liveli-hoods and traditional ways of life.
Weather forecasting capabilities across the continent havebeen greatly enhanced in recent years by initiatives such asPreparation for the Use of MSG in Africa (PUMA), the firstpan-African technology project focusing on Earth observationfunded by the European Union. PUMA has made available dataand products from the latest satellites of the EuropeanOrganisation for the Exploitation of Meteorological Satellites(EUMETSAT), enabling African National Meteorological andHydrological Services (NMHS) to provide accurate weatherforecasts, monitor extreme weather events, improve disastermanagement and forestall drought and starvation.
The African Monitoring of the Environment for SustainableDevelopment (AMESD) initiative takes PUMA a stage furtherby significantly extending the use of remote sensing data toenvironmental and climate monitoring applications. AMESD,in which EUMETSAT also plays a key role, is financed out ofthe European Union’s European Development Fund. LikePUMA, AMESD is an international cooperation project withthe objective of providing all African nations with the resourcesthey need to manage their environment more effectively andensure long-term sustainable development in the region.
The European Union’s strategy for AfricaPeace, security and good governance are prerequisites forsustainable development in Africa. Accordingly, the EuropeanUnion’s strategy for Africa addresses actions in areas that arecritical to creating the necessary environment for economicgrowth, stability, trade and infrastructure. In particular, the strat-egy promotes investment in sectors which impact directly onthe United Nations Millennium Development Goals (MDGs).These goals aim to eliminate poverty, promote sustainable devel-opment and improve the health, education and well being ofthe world’s developing and impoverished nations.
Earth observation technologies have been identified as vitaltools in the MDGs’ pursuit of sustainable development, espe-cially with regard to the environment. AMESD is, therefore,expected to play an essential role in the implementation of theEuropean Union’s strategy for Africa.
AMESD would also be the precursor of the extension ofEurope’s Global Monitoring of the Environment and Security(GMES) initiative to Africa, as requested by key African deci-sion-makers in the Maputo Declaration signed on 15 October2006 at the seventh EUMETSAT African User Forum inMozambique.
AMESD builds on PUMA’s successPUMA laid the groundwork for AMESD by providing theNMHS of all African countries with the equipment, trainingand support required for receiving the latest space-basedimages and products from EUMETSAT via the EUMETCastdistribution system.
In creating a successful pan-African network with opera-tional access to state-of-the-art satellite technology, PUMAprovided each country with the means to develop their ownapplications with the potential to enhance quality of life
The African Monitoring of the Environment forSustainable Development Initiative: a timely
initiative to save an endangered continent
Paul Counet, the European Organisation for the Exploitation of Meteorological Satellites
Signing of the Dakar Declaration, 29 September 2002
Phot
o: C
opyr
ight
EU
ME
TSA
T
4.Environment:Master spread 16/2/07 10:11 Page 160

[ ]161
the use of operational space technologies in environmentalmonitoring for some time.
The programme aims to provide decision-makers in theRegional Economic Communities, the Commission of theAfrican Union and at national level with full access to theenvironmental data and products they need to improvenational and regional policy and decision-making processes.It is hoped that this will enable better management of naturalresources and confidence to successfully face the challengesof sustainable development.
AMESD will provide continuity to PUMA by ensuring thatthe equipment deployed during the latter project is main-tained and upgraded. Additionally, AMESD will greatlyexpand the resources and capabilities of the national andregional institutions involved in the daily management andmonitoring of environmental resources such as water, crop-lands, rangelands, natural habitats and coastal and marineresources. The initiative will also benefit institutions in envi-ronment-related sectors such as disaster management,including hydrometeorological, agricultural, livestock,forestry, wildlife and sea safety services.
Most importantly, however, AMESD aims to improve thelives and prospects of the 350 million disadvantaged people inAfrica currently enduring poverty and hardship, whose liveli-hoods depend heavily on their environment.
EUMETSAT: making AMESD a realityEUMETSAT’s participation in AMESD – and in PUMA beforeit – reflects its commitment to supporting, through its satel-lite data, products and services, sustainable development inAfrica. EUMETSAT’s role, as the organisation responsible forEurope’s operational meteorological satellites, is fundamen-tal to the successful implementation of AMESD. Itencompasses:
through, for example, better water and agricultural manage-ment. It also equipped them with effective tools to monitorand mitigate extreme weather events and improve disastermanagement strategies, thus saving lives and property.
PUMA also established six successful pilot projects to fosterthe use of Earth observation data for non-meteorologicalpurposes for example, monitoring coastal fish stocks off Kenyaand Senegal, as well as providing South Africa’s power gridindustry with an early warning system for land fires (a majorcause of power outages and service disruptions).
In August 2002, the World Summit on SustainableDevelopment, held in Johannesburg, South Africa, publishedan implementation plan prioritising the need for timely accessto accurate and reliable satellite information. It was acknowl-edged that meeting the plan’s objectives required developingcountries to build and strengthen their capacity to assimilateand generate knowledge about their environments and supportsustainable development through the use of modern satelliteimaging technologies.
As a direct consequence of PUMA, the five participatingAfrican Regional Economic Communities were able to respondalmost immediately. In September 2002 they signed the DakarDeclaration, requesting the European Union to commission andfund a feasibility study of AMESD as a natural progression ofPUMA.
Safeguarding Africa’s people and natural resourcesAMESD extends the operational use of Earth observation tech-nologies and data from merely meteorological, to environmentand climate monitoring applications. The initiative will enableall African national and regional institutions focusing on envi-ronment and natural resources, as well as the continent’sNMHS, to catch up technologically with their counterparts inEurope, America and Asia, all of whom have benefited from
Like PUMA, AMESD is an international cooperation project with the objective of providing all African nations with the resources they need tomanage their environment more effectively and ensure long-term sustainable development
Phot
o: C
opyr
ight
EU
ME
TSA
T
4.Environment:Master spread 16/2/07 10:11 Page 161
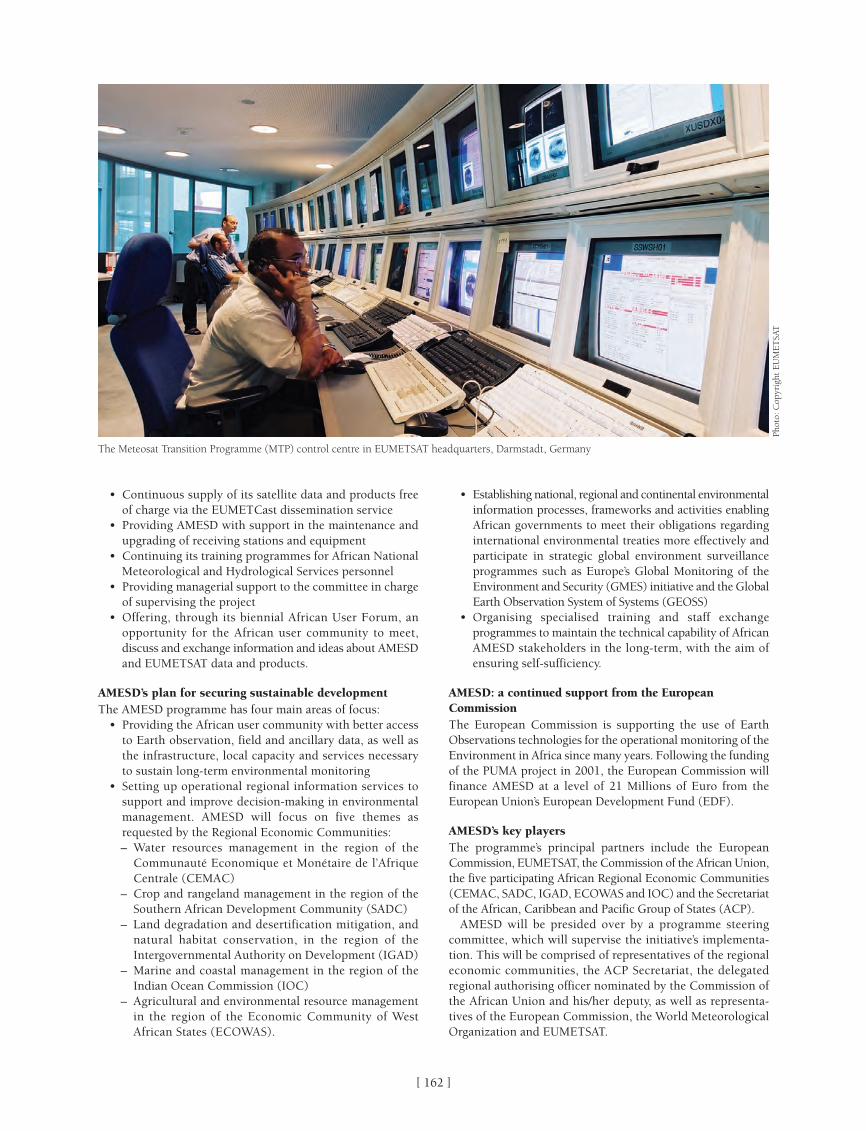
[ ]162
• Continuous supply of its satellite data and products freeof charge via the EUMETCast dissemination service
• Providing AMESD with support in the maintenance andupgrading of receiving stations and equipment
• Continuing its training programmes for African NationalMeteorological and Hydrological Services personnel
• Providing managerial support to the committee in chargeof supervising the project
• Offering, through its biennial African User Forum, anopportunity for the African user community to meet,discuss and exchange information and ideas about AMESDand EUMETSAT data and products.
AMESD’s plan for securing sustainable developmentThe AMESD programme has four main areas of focus:
• Providing the African user community with better accessto Earth observation, field and ancillary data, as well asthe infrastructure, local capacity and services necessaryto sustain long-term environmental monitoring
• Setting up operational regional information services tosupport and improve decision-making in environmentalmanagement. AMESD will focus on five themes asrequested by the Regional Economic Communities: – Water resources management in the region of the
Communauté Economique et Monétaire de l’AfriqueCentrale (CEMAC)
– Crop and rangeland management in the region of theSouthern African Development Community (SADC)
– Land degradation and desertification mitigation, andnatural habitat conservation, in the region of theIntergovernmental Authority on Development (IGAD)
– Marine and coastal management in the region of theIndian Ocean Commission (IOC)
– Agricultural and environmental resource managementin the region of the Economic Community of WestAfrican States (ECOWAS).
• Establishing national, regional and continental environmentalinformation processes, frameworks and activities enablingAfrican governments to meet their obligations regardinginternational environmental treaties more effectively andparticipate in strategic global environment surveillanceprogrammes such as Europe’s Global Monitoring of theEnvironment and Security (GMES) initiative and the GlobalEarth Observation System of Systems (GEOSS)
• Organising specialised training and staff exchangeprogrammes to maintain the technical capability of AfricanAMESD stakeholders in the long-term, with the aim ofensuring self-sufficiency.
AMESD: a continued support from the EuropeanCommissionThe European Commission is supporting the use of EarthObservations technologies for the operational monitoring of theEnvironment in Africa since many years. Following the fundingof the PUMA project in 2001, the European Commission willfinance AMESD at a level of 21 Millions of Euro from theEuropean Union’s European Development Fund (EDF).
AMESD’s key players The programme’s principal partners include the EuropeanCommission, EUMETSAT, the Commission of the African Union,the five participating African Regional Economic Communities(CEMAC, SADC, IGAD, ECOWAS and IOC) and the Secretariatof the African, Caribbean and Pacific Group of States (ACP).
AMESD will be presided over by a programme steeringcommittee, which will supervise the initiative’s implementa-tion. This will be comprised of representatives of the regionaleconomic communities, the ACP Secretariat, the delegatedregional authorising officer nominated by the Commission ofthe African Union and his/her deputy, as well as representa-tives of the European Commission, the World MeteorologicalOrganization and EUMETSAT.
The Meteosat Transition Programme (MTP) control centre in EUMETSAT headquarters, Darmstadt, Germany
Phot
o: C
opyr
ight
EU
ME
TSA
T
4.Environment:Master spread 16/2/07 10:12 Page 162

[ ]163
NATURAL VARIATIONS IN climate can be seen on alltimescales, whether days, months or years. They mayoccur due to external influences such as changes in
the sun’s energy output, or they may be generated by inter-actions among the different components of the global climatesystems: the atmosphere, oceans, biosphere, ice cover, andland surface. Natural variability of weather and climate canproduce extreme events such as droughts, floods, severestorms, heat waves and frosts, among others. Accurateprediction and early warning of such changes depends onthe availability of accurate diagnostic tools.
Africa is one of the most vulnerable regions to the impact ofweather and climate on national economies and communitylivelihoods, with such phenomena often associated with foodshortages, severe famine, lack of water, energy, diseases, lossof life and property and many other socio-economic disrup-tions. The demographic pressure and the vulnerability ofrainfall-dependent agricultural systems make Africa one of themost food-insecure and drought-prone regions in the world.The low level of preparedness as well as inadequate capacityfor rapid and effective response to disasters poses a seriousthreat to the continent’s achievement of the UN MillenniumDevelopment Goals (MDGs). Climate-related disasters arethreatening development and limited gains in many countriesin Africa. Extreme climate events such as droughts and floodshave in recent years had devastating socio-economic impactsin various parts of the continent. Still fresh in our memoriesare the October-November 2006 floods across the GreaterHorn of Africa (GHA) countries, the Sudan, Ethiopia, Somaliaand Kenya, which affected an estimated 1.8 million people.
Recent progress in climate research and forecasting hasresulted in further development of methods for predictingshort-term variations in climate and their socio-economicimpacts. These advances have provided enormous economicbenefits in coping with extreme weather and climate events.In Africa, seasonal rainfall variability is one of the majorthreats to sustainable socio-economic development. Theheavy rains and floods that occasionally affect the continentare as equally devastating as the severe, protracted droughts.The greatest threat to food security posed by excess rainfallis not related to production or marketing, but to the inabil-ity of farmers to dry their harvested crops.1 The application
of climate information could significantly improve planningand management of climate sensitive activities and reducethe associated socio-economic catastrophes prevalent inmany parts of the continent.
Climate products and servicesThe African Centre of Meteorological Applications forDevelopment (ACMAD) participates in supporting Africaninitiatives in climate impact studies and multidisciplinaryactivities related to climate variability. Using specializedinternational products and observed meteorological data, thecentre has developed methods and techniques to monitorand predict extreme climate events. ACMAD is responsiblefor the preparation and dissemination of climate informa-tion and products for early warnings on agriculture and foodsecurity, water resources, energy, health and climate disasterrisk reduction in Africa.
To improve weather and climate monitoring, predictionand early warning systems continent-wide, ACMAD usesMeteosat Second Generation (MSG) data with the support ofpartners in the Satellite Application Facility (SAF) consor-tium, with particular emphasis on severe weather andextreme climate events, as well as product development.Such products include seasonal forecasts for West Africarainfall and Climate Watch Africa monthly and dekadalbulletins. In order to enhance and improve the quality ofweather and climate products and services, ACMAD isinvolved in the development and application of improvedmodels to provide skilled predictions. It has made greatadvances in the ongoing development of new techniques forapplying numerical weather prediction model outputs to theproduction of synthetic weather analyses and forecasts. Someof these activities have been realized within the frameworkof the ongoing African Monsoon Multidisciplinary Analysis(AMMA) project for West Africa, which is now beingextended to the rest of Africa.
In collaboration with partners, ACMAD has maintainedthe provision of products and services to assist users andstakeholders in deciding on response strategies and adapta-tion measures to mitigate the impacts of weather andclimate-related disasters. This partnership has continued tostrengthen national capacities to cope with effects of climate
Climate information applications for sustainable
development in Africa
Dr Leonard N. Njau, Mohamed Kadi, Marie Christine Dufresne, Jocelyn Perrin, Dr Anthony Patt, and Dr Andre Kamga
4.Environment:Master spread 16/2/07 10:12 Page 163

[ ]164
variability and change, thereby enabling countries to developnational, social and economic policy, as well as programmesto ensure the sustainable development and achievement ofMDGs.
Sector-specific application of climate informationThe emerging demonstration of good practices in the appli-cation of early warning systems and the integration ofseasonal forecasts in poverty reduction, food security, health,water resources and energy resource management should beencouraged. It is imperative, therefore, that appropriate mech-anisms be established to raise awareness and promote betterunderstanding through the provision of climate informationand user demand-driven products as management tools.
ACMAD’s Seasonal Rainfall Forecast Forums have beenheld for nearly ten years. At the ninth session, held in westAfrica, participants made strong recommendations forcontinuing the work undertaken at the preceding forum. Theobjectives were to better respond to the needs of users andtheir use of seasonal forecast products, in the process ofensuring improved food security and the prevention andmanagement of natural hazards. This initiative requiresgreater synergy between the producers of climate and envi-ronmental information, public and private users and themedia, at the national and regional levels. In particular, thefirst meeting of these groups allowed the development ofseveral recommendations and a plan of action for ACMADand its partners including:
• Supervising a survey of users to identify the existinguses of climate forecasts, new potential uses, and areaswhere users need additional assistance in understand-ing forecasts
• Collaborating with ongoing efforts sponsored by theNational Oceanic and Atmospheric Administration(NOAA) and the World Meteorological Organization(WMO) to assess forecast use in relation to the survey.
To this end, ACMAD circulated a questionnaire to identifyfocal points in the countries, after which responses wereposted to both ACMAD and Boston University’s Web sites. Atotal of 48 responses from climate-dependent sectors (agri-culture, water resources and health, among others) in 14countries were analysed.
Agriculture and food securityAgriculture is the economic mainstay and major employmentsector of several countries in Africa. Extreme climate eventssuch as floods and droughts have had severe impacts on agri-cultural yield, survival of livestock and marine ecosystems.This in turn heavily impacts food security, often resulting inhunger, malnutrition, diseases and loss of life. Studies haveshown that heat stress and drought are likely to have a nega-tive impact on animal health, production of dairy products,meat and reproduction. Climate information can be used todevelop strategies and programmes for sustainable agricul-tural development. In 1999 ACMAD launched a pilotdemonstration project using radio and Internet (RANET)technology as a tool to disseminate climate information torural communities and stakeholders. Economy-wide model-ling in Mozambique suggests considerable potentialaggregate benefits from market applications of climate fore-casts in staple grain markets. Farm system models that
incorporate details of soils, crops and management optionshave been developed for application.2 Integrating seasonalforecasts into food security assessment has been explored atsub-regional levels.
The economies of many African countries are driven byrain-fed agriculture. Studies have shown that gross domes-tic product (GDP) is strongly correlated with rainfall in thesecountries. The occurrence of poor rainfall or drought willadversely affect agriculture and food security with seriousimplications for economic growth in Africa.
WaterAfrica’s water resources are not evenly distributed, and areoften not located in areas with the greatest demand. Africahas 17 major river basins with catchment areas of above100,000 km². However, rainfall is the major source of water,be it surface water or groundwater. The construction of damsin rivers is mainly to generate hydropower for both manu-facturing industries and domestic use. Geothermal powergeneration also depends on groundwater, which is rechargedby rainfall. The application of climate information has playeda significant role in integrated water resources management(IWRM) and in the development of long-term implementa-tion strategies under conditions of water scarcity. Themanagement of several dams in major rivers in Africa ishighly dependent on seasonal rainfall forecasts. Severalauthorities in charge of water resource management have notonly integrated climate products into the management ofwater resources, but also formed partnerships with climateproduct providers in developing models as water resourcemanagement tools. For example, ICPAC has developed aregional capacity in streamflow forecasting and theregional/national Food Risk Information and Early WarningSystem (FRIEWS). Several countries in Africa rely on hydro-electricity, which is controlled by rivers’ streamflow intohydropower generating dams. ICPAC has developed simplemodels relating the sea surface temperature and rainfall vari-ability to hydro-energy production.3
EnergyThe energy sector is very important for the socio-economicdevelopment of countries in Africa. Electricity is vital forboth industrial manufacturing and domestic use.Hydropower production is significantly affected by extremeclimate events such as droughts and floods. Too much rain-fall causes silting that could damage turbines as well asposing a threat to dam structures, as witnessed in theNovember 2006 floods in Kenya. Severe droughts have led topower rationing, disrupting various socio-economic activi-ties in many countries in Africa. The provision of climateinformation and products that are sector-specific for inte-grated hydropower resources management has contributedgreatly to sustainable power generation.
HealthTemperatures in most African countries fall within a range of15-25 degrees Celsius. Information on temperature is impor-tant in the control of malaria and other vector-borne diseaseoutbreaks. Incidences of cholera are higher in areas with hightemperatures and during periods of heavy rain accompaniedby floods. Temperatures between 20 and 28 degrees Celsiuswith high rainfall (high relative humidity) favour the survival
4.Environment:Master spread 16/2/07 10:12 Page 164
[ ]165
of the vector and the development of the parasite, resultingin very high incidences of malaria even in low prevalenceareas. High temperatures (above 30 degrees Celsius) and lowhumidity would greatly reduce the lifespan of the anophelinemosquito, resulting in a lower incidence of malaria. Lowtemperatures (below 18 degrees Celsius) would reduce thedevelopment of the protozoan parasite in the mosquito,resulting in low transmission of malaria and low incidenceof the disease.
Studies and experiences in eastern Africa have shown thatheavy rains are strongly linked to epidemics of vector-bornediseases such as Rift Valley Fever, malaria, yellow fever anddengue fever.4 The heavy rains of 1997 and 1998 in Kenyaand southern Somalia were associated with an outbreak ofRift Valley Fever that caused 46 human deaths. The healthministries in Uganda, Rwanda and Burundi used the ICPACclimate outlook in its decision to order more drugs andmosquito nets to curb malaria outbreaks. Further, Kenya,Uganda, Sudan, Tanzania, Rwanda and Burundi governmentsused the same consensus climate outlook to initiate somevector-borne disease management practices that alsoinvolved clearing of drainage systems.5
The perceived benefit of climate information to healthservices is demonstrated by donor support for meteorologi-cal stations and early warning activities at health facilities inEritrea and Niger. This is a clear demonstration of good prac-tice in the use and application of climate information tomitigate catastrophic impacts of extreme climate events. Anintegrated warning system approach, combining seasonalclimate forecasts with vulnerability assessment within anational malaria control programme, has been demonstratedin Botswana over the past few years and is seen as an exampleof best practice in the region. The African Development Bankis currently planning to invest substantially in epidemicmalaria control in East and West Africa, where implement-ing organizations are keen to learn from the Southern Africanexperience.
Disaster managementThe climate information and support services are used bydecision makers in governments, the private sector and civilsociety to meet priority needs in operational climate riskmanagement and overall social and economic development.The climate outlook forums and users capacity-buildingworkshops have prompted a number of stakeholders to initi-ate efforts towards the development of integratedregional/national management policies.
The global centres’ products and data banks have beenused to improve climate model and prediction methods.National atlases for sectoral risk zoning on climate stresshave been developed. Climate stress information has beenused by UN systems and donors to estimate levels of donorassistance and operations. National platforms on disasterrisk reduction (DRR) advocating enactment of the DisasterManagement Bill 2005 are already available in most Africancountries, and such initiatives will help to harmonize furtherintervention strategies. Climate Watch Africa, an earlywarning system of ACMAD, is an effective tool for disasterrisk reduction management. These initiatives will lead tointegrated capacity and policy implementation in climateDRR management for improved community livelihoods andeconomies in Africa.
Women and youthThe provision and application of climate early warning infor-mation for rural women and youths is becoming increasinglycrucial for poverty reduction, disaster risk management andsustainable development in many countries in Africa. Thisawareness has been created through capacity building, educa-tion and access to information for enhanced effectiveness inthe use of climate information. Climate informationproviders are working with WMO and other partners toaddress climate challenges and variability and the role ofwomen and youths in several countries.
Wildlife and tourismWildlife management and tourism are dependent on climate.Growth in the tourism industry contributes to developmentthrough the generation of foreign exchange, the creation ofincome-earning opportunities, agricultural market expan-sion and the development of local entrepreneurship. Extremeclimate events pose a substantial threat to the survival ofwildlife and the tourism industry.
Trade and industrySeveral trade and industry activities depend on naturalresources and prevailing climate conditions. Trade in themajority of African countries relies on agricultural goods.Extreme climate events have often disrupted agriculturalproduction and activities, affecting markets, transportsystems, infrastructure and industry systems, resulting inheavy losses. The integration of climate information into tradedevelopment planning and industry policies would enhanceAfrica’s future competitive power. For example, a weatherindex insurance based on a trigger point related to rainfallaccumulation is being piloted in Ethiopia and Malawi. Suchinsurance schemes can be used to overcome delays in earlyresponses to climate-related crises. In Malawi, index-basedinsurance, designed around good rainfall records, has enabledthe private sector to lend funds to farmers for improved seedvarieties. The Ethiopian pilot project compared climatologiesfrom 30 weather stations to enable the private industry todesign an appropriate insurance product.
Infrastructure In Africa, extreme weather and climate events destroy build-ings, railways, roads and dams, impacting heavily on theeconomy. It is necessary to integrate climate information intodevelopment policy and planning for the management ofclimate-related disasters to reduce this vulnerability.
Looking forwardThere are potential socio-economic benefits to be derived fromrecently developed climate prediction tools that are capable offorecasting extreme climate events. These tools have sufficientlead time to allow early warning of impending catastrophicclimate events. However, decision makers in African countriesface many challenges in understanding how to integrate climateinformation into development policy and planning in themanagement of limited natural resources. There is a need toenhance national as well as local community-driven integratedprogrammes for addressing climate variability with a view toimproving applications of seasonal forecasts. Education andawareness through community participation on issues thatcould affect their livelihoods is of crucial importance.
4.Environment:Master spread 16/2/07 10:12 Page 165

[ ]166
CHINA HAS ONE of the fastest growing economies in theworld. Between 1990 and 2004 its gross nationalproduct has increased by a factor of seven. This growth
in economic activity is accompanied by a strong increase ofemissions from tropospheric pollutants, leading to extra pres-sure on the environment.
The European Space Agency (ESA) and the NationalRemote Sensing Centre of China (NRSCC – an entity underthe Ministry of Science and Technology of the People’sRepublic of China) have cooperated in the field of Earthobservation application development for the last ten years.The cooperation has now taken on a new momentum withthe creation of a dedicated three-year Earth observationexploitation programme called Dragon. Within Dragon, theRoyal Netherlands Meteorological Institute (KNMI) has beenworking on the Air quality Monitoring and Forecasting InChina (AMFIC) project to analyse the air quality in Chinausing a ten-year data set of satellite observations of nitrogendioxide (NO2).
NO2 is an important precursor of smog and is formed mainlyby combustion of fossil fuels. Using a chemical transportmodel, concentrations measured by satellites can be connected
to nitrogen dioxide emissions. Model calculations show a trendin increasing NO2 emissions over China, which is proportionalto the country’s economic growth. The calculations also showthat the consequences are not limited to China but affect theentire global environment.
Atmospheric nitrogen oxidesNitrogen oxides (NOx, the collective name for NO and NO2)play an important role in atmospheric chemistry. They haveboth natural sources (lighting and soil emissions) and anthro-pogenic sources (biomass burning, fossil fuel combustion).Nitrogen oxides are bad for the health of both humans andanimals. They irritate the lungs and lead to lower resistance torespiratory infections such as influenza. Frequent exposure tohigh concentrations may cause acute respiratory illness.Another serious problem caused by NOx is the formation ofaerosols and tropospheric ozone (i.e. smog), which also hasharmful health effects.
The most significant source of nitrogen oxides is the combus-tion of fossil fuels, mainly by traffic and large power plants,but the burning of biomass and lightning are also importantcontributors. Close to the ground surface, the lifetime of NOxis just a few hours, which is why NO2 concentrations will behighest close to the source.
Satellite observations of the increasingnitrogen dioxide emissions in China
Ronald van der A, Bas Mijling, Jeroen Kuenen, Ernst Meijer, Hennie Kelder, KNMI
The yearly average tropospheric NO2 density measured bySCIAMACHY for 2004. High values are measured above the majorcities. The industrial area around the yellow river (Huang He) is alsonoticeable and highlights the river stream
Source: KNMI
Trend of the NOx concentration over China for the period March1996 – November 2005
Source: KNMI
4.Environment:Master spread 16/2/07 10:12 Page 166

[ ]167
Satellite observations of tropospheric nitrogen dioxideSatellite instruments use spectroscopy to retrieve atmospherictrace gas concentrations in the atmosphere. By comparing themeasured spectrum of the backscattered light from the Earth’satmosphere with a reference spectrum, the column density ofnitrogen dioxide along the light path can be determined. TheNO2 stratospheric column is deduced from a chemistry-trans-port model assimilation run of the NO2 column data.Subsequently, the assimilated stratospheric column issubtracted from the retrieved total column, resulting in atropospheric column.1
NO2 has been monitored by satellite since 1995 with theGlobal Ozone Monitoring Experiment (GOME), since 2002with the Scanning Imaging Absorption Spectrometer forAtmospheric Chartography (SCIAMACHY), and since 2004with the Ozone Monitoring Instrument (OMI), the latter twoinstruments having the advantage of a high spatial resolu-tion.
The yearly averaged NO2 column for 2005 as measured withSCIAMACHY can be seen in the first image. It shows highconcentrations of NO2 above highly populated regions likeBeijing, Shanghai, Hong Kong and South Korea. It can also beseen that the satellite detects the emissions around the YellowRiver (Huang He). Over the sparsely populated western part ofChina, low NO2 concentrations are observed, except over thelarge city Urumqi in the northwest.
Growth of NO2 concentrations over ChinaThe combined measurement series of both GOME and SCIA-MACHY span almost a decade, which favours a trend analysisof Chinese emissions. To do this, the averaged monthlytropospheric NO2 columns are fitted with a linear model thatalso includes a sinus to represent the seasonal variation ofNO2.
Seasonal variation is mainly determined by the changing daylength over the year. In the absence of sunlight NO2 has alonger lifetime in the atmosphere, which explains why the NO2
columns are higher on average during wintertime. The secondimage shows the derived annual growth in the tropospheric
The difference in ground-level ozone caused by the increase ofChinese NOx emissions between 1997 and 2005
Source: KNMI
The increase in tropospheric ozone columns caused by risingChinese NOx emissions between 1997 and 2005
Source: KNMI
NO2 columns from this analysis. The highest trend is found ineast China, where economic growth is faster. The fastestgrowing city with respect to both economy and troposphericNO2 is Shanghai.2
Global implicationsThe fast growing emissions in China lead locally to rapidlyincreasing NO2 concentrations, which affect local ozoneconcentrations. Clearly these large increases will have severeconsequences for local air quality, but effects on a global scalecan be expected, because the lifetime of tropospheric ozone ismuch longer than the lifetime of NO2.
Therefore, ozone can be transported over large distancesby the wind. Using a chemical transport model the change inozone due to increasing emissions in China can be calculated.The image below shows increasing ozone concentrations inthe northern hemisphere caused by growing Chinese emis-sions in the period 1997-2005. In this period of eight yearsthe global averaged tropospheric ozone column has increasedby 0.54 per cent. The largest growth in tropospheric ozone isfound in a plume reaching from China to the east along thedirection of the prevailing winds. From this image, weconclude that the tropospheric ozone concentrations in theentire northern hemisphere are increased due to the growingemissions in China. These increases seem small, but are stillimportant. In Europe, air pollution has been increased as aresult of intercontinental transport. In addition, since ozoneis a strong greenhouse gas, the effects on climate changecannot be neglected.
A decade of satellite observations of nitrogen dioxide in theatmosphere has been used to find trends in emissions in China.As expected, the nitrogen dioxide concentration is growingmost rapidly in east China, where there is the most economicgrowth. By feeding the derived trends to a global chemicaltransport model of the atmosphere, the effects on the concen-trations of the worldwide tropospheric ozone can bedetermined. According to the model, the background concen-tration of ozone has been increased in the entire northernhemisphere as a result of the growing emissions in China.
4.Environment:Master spread 16/2/07 10:12 Page 167
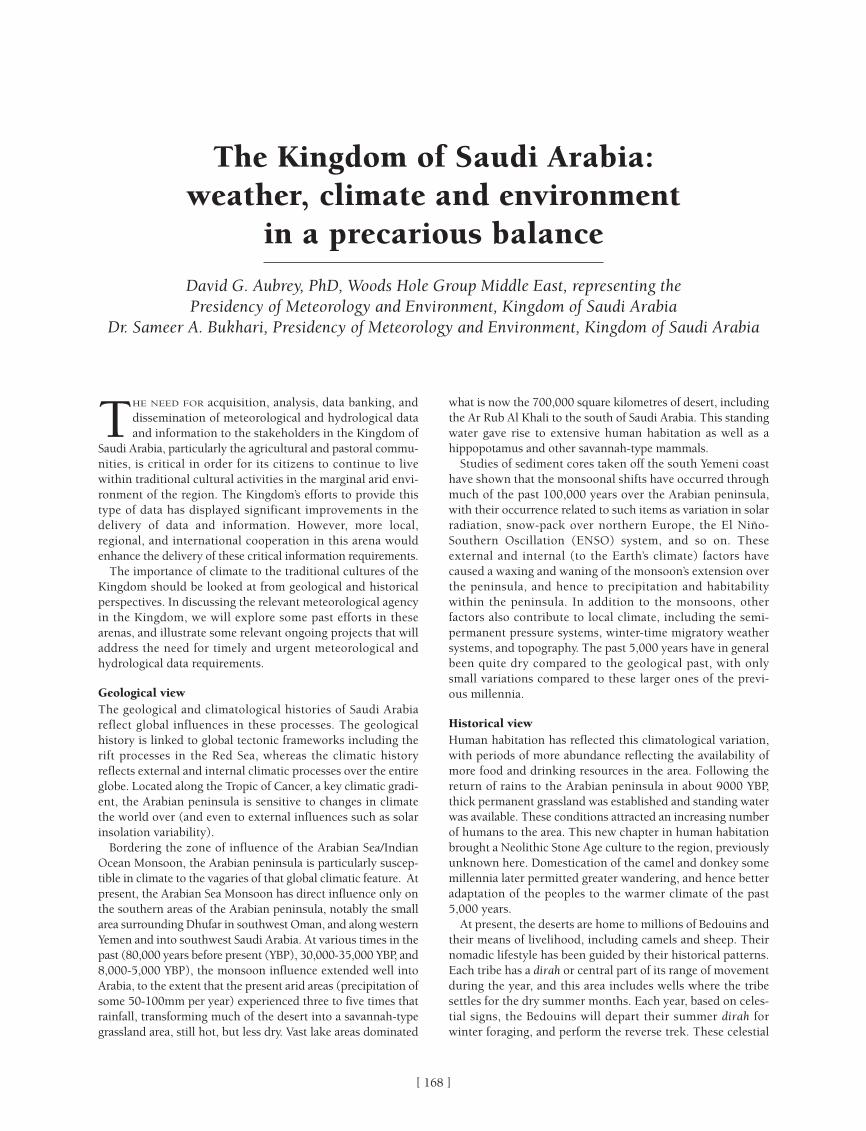
[ ]168
THE NEED FOR acquisition, analysis, data banking, anddissemination of meteorological and hydrological dataand information to the stakeholders in the Kingdom of
Saudi Arabia, particularly the agricultural and pastoral commu-nities, is critical in order for its citizens to continue to livewithin traditional cultural activities in the marginal arid envi-ronment of the region. The Kingdom’s efforts to provide thistype of data has displayed significant improvements in thedelivery of data and information. However, more local,regional, and international cooperation in this arena wouldenhance the delivery of these critical information requirements.
The importance of climate to the traditional cultures of theKingdom should be looked at from geological and historicalperspectives. In discussing the relevant meteorological agencyin the Kingdom, we will explore some past efforts in thesearenas, and illustrate some relevant ongoing projects that willaddress the need for timely and urgent meteorological andhydrological data requirements.
Geological viewThe geological and climatological histories of Saudi Arabiareflect global influences in these processes. The geologicalhistory is linked to global tectonic frameworks including therift processes in the Red Sea, whereas the climatic historyreflects external and internal climatic processes over the entireglobe. Located along the Tropic of Cancer, a key climatic gradi-ent, the Arabian peninsula is sensitive to changes in climatethe world over (and even to external influences such as solarinsolation variability).
Bordering the zone of influence of the Arabian Sea/IndianOcean Monsoon, the Arabian peninsula is particularly suscep-tible in climate to the vagaries of that global climatic feature. Atpresent, the Arabian Sea Monsoon has direct influence only onthe southern areas of the Arabian peninsula, notably the smallarea surrounding Dhufar in southwest Oman, and along westernYemen and into southwest Saudi Arabia. At various times in thepast (80,000 years before present (YBP), 30,000-35,000 YBP, and8,000-5,000 YBP), the monsoon influence extended well intoArabia, to the extent that the present arid areas (precipitation ofsome 50-100mm per year) experienced three to five times thatrainfall, transforming much of the desert into a savannah-typegrassland area, still hot, but less dry. Vast lake areas dominated
what is now the 700,000 square kilometres of desert, includingthe Ar Rub Al Khali to the south of Saudi Arabia. This standingwater gave rise to extensive human habitation as well as ahippopotamus and other savannah-type mammals.
Studies of sediment cores taken off the south Yemeni coasthave shown that the monsoonal shifts have occurred throughmuch of the past 100,000 years over the Arabian peninsula,with their occurrence related to such items as variation in solarradiation, snow-pack over northern Europe, the El Niño-Southern Oscillation (ENSO) system, and so on. Theseexternal and internal (to the Earth’s climate) factors havecaused a waxing and waning of the monsoon’s extension overthe peninsula, and hence to precipitation and habitabilitywithin the peninsula. In addition to the monsoons, otherfactors also contribute to local climate, including the semi-permanent pressure systems, winter-time migratory weathersystems, and topography. The past 5,000 years have in generalbeen quite dry compared to the geological past, with onlysmall variations compared to these larger ones of the previ-ous millennia.
Historical viewHuman habitation has reflected this climatological variation,with periods of more abundance reflecting the availability ofmore food and drinking resources in the area. Following thereturn of rains to the Arabian peninsula in about 9000 YBP,thick permanent grassland was established and standing waterwas available. These conditions attracted an increasing numberof humans to the area. This new chapter in human habitationbrought a Neolithic Stone Age culture to the region, previouslyunknown here. Domestication of the camel and donkey somemillennia later permitted greater wandering, and hence betteradaptation of the peoples to the warmer climate of the past5,000 years.
At present, the deserts are home to millions of Bedouins andtheir means of livelihood, including camels and sheep. Theirnomadic lifestyle has been guided by their historical patterns.Each tribe has a dirah or central part of its range of movementduring the year, and this area includes wells where the tribesettles for the dry summer months. Each year, based on celes-tial signs, the Bedouins will depart their summer dirah forwinter foraging, and perform the reverse trek. These celestial
The Kingdom of Saudi Arabia:weather, climate and environment
in a precarious balance
David G. Aubrey, PhD, Woods Hole Group Middle East, representing the Presidency of Meteorology and Environment, Kingdom of Saudi Arabia
Dr. Sameer A. Bukhari, Presidency of Meteorology and Environment, Kingdom of Saudi Arabia
4.Environment:Master spread 16/2/07 10:12 Page 168
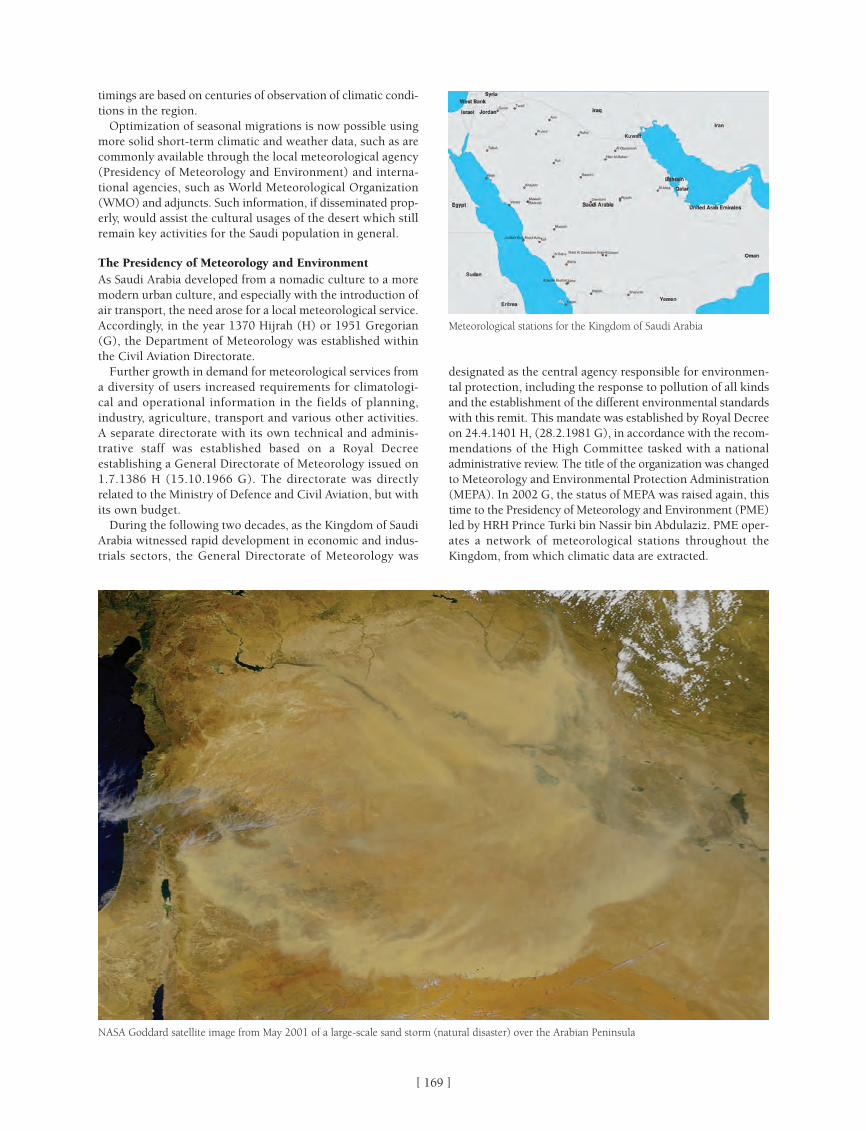
[ ]169
designated as the central agency responsible for environmen-tal protection, including the response to pollution of all kindsand the establishment of the different environmental standardswith this remit. This mandate was established by Royal Decreeon 24.4.1401 H, (28.2.1981 G), in accordance with the recom-mendations of the High Committee tasked with a nationaladministrative review. The title of the organization was changedto Meteorology and Environmental Protection Administration(MEPA). In 2002 G, the status of MEPA was raised again, thistime to the Presidency of Meteorology and Environment (PME)led by HRH Prince Turki bin Nassir bin Abdulaziz. PME oper-ates a network of meteorological stations throughout theKingdom, from which climatic data are extracted.
timings are based on centuries of observation of climatic condi-tions in the region.
Optimization of seasonal migrations is now possible usingmore solid short-term climatic and weather data, such as arecommonly available through the local meteorological agency(Presidency of Meteorology and Environment) and interna-tional agencies, such as World Meteorological Organization(WMO) and adjuncts. Such information, if disseminated prop-erly, would assist the cultural usages of the desert which stillremain key activities for the Saudi population in general.
The Presidency of Meteorology and EnvironmentAs Saudi Arabia developed from a nomadic culture to a moremodern urban culture, and especially with the introduction ofair transport, the need arose for a local meteorological service.Accordingly, in the year 1370 Hijrah (H) or 1951 Gregorian(G), the Department of Meteorology was established withinthe Civil Aviation Directorate.
Further growth in demand for meteorological services froma diversity of users increased requirements for climatologi-cal and operational information in the fields of planning,industry, agriculture, transport and various other activities.A separate directorate with its own technical and adminis-trative staff was established based on a Royal Decreeestablishing a General Directorate of Meteorology issued on1.7.1386 H (15.10.1966 G). The directorate was directlyrelated to the Ministry of Defence and Civil Aviation, but withits own budget.
During the following two decades, as the Kingdom of SaudiArabia witnessed rapid development in economic and indus-trials sectors, the General Directorate of Meteorology was
NASA Goddard satellite image from May 2001 of a large-scale sand storm (natural disaster) over the Arabian Peninsula
Meteorological stations for the Kingdom of Saudi Arabia
4.Environment:Master spread 16/2/07 10:12 Page 169

[ ]170
Prior human ecology/climate studies – MEPA conducted severalstudies on the conditions of the nomads over the last twodecades of the twentieth century. One of these was EnvironmentalSupport of Nomads (ESON), a pilot study conducted from 1994through 1997 in close collaboration with the Office of Arid LandsStudies of the University of Arizona. The objective of the studywas to provide information to Nomads and other pastoraliststhat would assist them to use the marginal range resource in asustainable and economically viable manner. These studies wereconducted to investigate the situation of the Bedouin nomadsin the Kingdom, including their socio-economic, cultural, andgeographical aspects. The ESON study culminated in the publi-cation of a major work clarifying the condition of the nomadicpopulation in the pilot study area, and suggested areas whereMEPA might concentrate further efforts to improve the sustain-ability of the Bedouin culture.
Ongoing PME activities Having conducted studies on Nomads in the past (as MEPA),and with an improved understanding of the needs of thenomads, the PME is undertaking a number of major initiativesintended, to assist the condition of the nomads. Some of theseactivities are listed below.
Human ecology – Starting in 2007, the PME will be under-taking a national programme of human ecology and urbandevelopment in the Kingdom of Saudi Arabia. Based on thesecond article of the Saudi Environmental Law, PME has beengiven responsibility for environmental planning related toindustry, agriculture, urban development and other matters.According to article ten of the Saudi Environmental Law, thenational programme of ecology and urban development willbe responsible for the environmental planning, management,and conservation of rural and urban areas in the Kingdom.
Public awareness – The Kingdom of Saudi Arabia recentlyannounced the opening of a first ever environmental televi-sion channel. A public-private partnership, this channel willbe broadcasting general items of concern about the environ-ment, including meteorology and climatology. This soon-to-bepan-Arabian channel is now broadcasting throughout theKingdom, and demonstrates a commitment to get informationfrom the PME to users throughout the Kingdom.
Cloud seeding – Understanding the paucity of water in thepeninsula, the Kingdom continues to undertake experimentsin cloud seeding to optimize the geography and timing of deliv-ery of precipitation to rural areas. Previous experiments oncloud seeding were in the Abha area in 1989 and 2004. Thisyear, experiments are being conducted in the central region ofSaudi Arabia.
Critical issues The geographical-geological-climatological context of SaudiArabia includes a marginally usable resource for agricultureand pastoralism, due to the lack of water, extreme heat, andstrong seasonal climatic variability. The socio-economic contextof Saudi Arabia includes rapid change from rural to urban habi-tation, relative impoverishment of the rural population, and aswitch from domestic pastoral use of rangelands to moremarket-oriented herding with subsequent destruction of theenvironment. In order to maximize the use of the desert range-land resources, optimization is required. This must includeaspects of rangeland management, information transmissionand sharing, and perhaps economic incentives to modify
pastoral behaviours. Since desert life is essential to the cultureof the Arabian peninsula, there is great public demand for itspreservation and extension.
Critical issues include the need to acquire, process, analyseand disseminate climatic information, including those in thefollowing areas;
• Global and regional climate change• Natural disasters: dust storms associated with “Shamal”
or northern and “Aziab” or southern winds and droughts• Rainfall: patterns and intensities• Agriculture and pastoralism• Nomadic status: socio-economic, geographical, and
cultural aspects.
As indicated in the discussion above, PME has initiated projectsto facilitate acquisition, analysis, availability, dissemination,and use of data by appropriate stakeholders at all socio-economic levels within the Kingdom.
The SeaWiFS Project is among the initiatives supported by PME
4.Environment:Master spread 16/2/07 10:12 Page 170

[ ]171
THE FIRST RECORD of dust phenomenon in Korea wasfound during the reign of the Silla Dynasty’s King Ahdalla(174 A.D.) and was called ‘Woo-To’. At that time, people
believed that the god became so angry he lashed down dirtinstead of rain or snow. Since then, the Asian Dust has beenconsidered an unavoidable natural phenomenon in Korea,which comes uninvited every year.
However, unprecedented severe Asian Dust, about forty timesmore severe than usual, attacked Korea in March 2002 andcaused the temporary closure of 4,373 primary schools, 164flight cancellations and the reduction of working hours in facto-ries for semi conductors and other precision products.Following this, both the media and the general publicdemanded that the government should take all possiblemeasures to reduce the impact of the Asian Dust Storm.
The most fundamental measure to protect Korea from the AsianDust was to forest the desert areas in China and Mongolia, which
are deemed to be the source of the Asian Dust. However, as deser-tification progresses faster than forestation, the best way for theKorea Meteorological Administration (KMA) to protect the peoplefrom the Asian Dust was to more accurately predict the density ofthe Asian Dust which comes from China, and provide quantifiedinformation on it. For this, the establishment of an observationnetwork for the Asian Dust in China is needed.
In cooperation with the Korea International CooperationAgency (KOICA) and the Korea Ministry of Foreign Affairs andTrade (MOFAT), KMA negotiated with and persuaded the ChinaMeteorological Administration (CMA) to establish the jointmonitoring network of the Asian Dust. About three years laterKMA and CMA accomplished this and have shared the AsianDust data observed at the five joint monitoring stations in realtime since March 2005. The observed data from the KMA-CMAjoint monitoring stations is used as input data for the numeri-cal prediction model for the Asian Dust. Since then, it has beenpossible to produce more accurate and quantitative forecasts.
The Meteorological Research Institute (METRI) of KMAdeveloped the trajectory model that has been used routinely toforecast the air stream movement including dust since 2000.The trajectories are initiated in the source region on the isen-tropic surface of 295K, 300K, and 305K.
Recently, KMA raised the forecast accuracy of the Asian Dust,named the Asian Dust Aerosol Model (ADAM), which wasjointly developed by METRI and Seoul National University.
After the installation and optimization of ADAM on the KMAsupercomputer, KMA has made great strides in producing morerapid Asian Dust forecasts. ADAM is operating routinely to fore-cast the dust concentration after 48 hours at intervals of threehours.
The KMA-CMA joint network proved its real capability inApril 2005. The extremely severe Asian Dust affected the Koreanpeninsula again on 20 April 2005. But the situation was quitedifferent from that in 2002. It was possible for KMA to issueand deliver the pre-warning report of the Asian Dust to themedia and related agencies on 19 April, giving them time totake measures and prepare for the events of the next day.
Even though the thick dust covered the sky over the Koreanpeninsula on 20 April, following the countermeasures made on theprevious day, industries had already changed filters of the air clean-ers before the dust attacked Korea, and primary schools allowedthe students to return home after morning classes on 20 April.This clearly illustrates that the people coped with the event calmlyand systematically. It was a striking contrast to the case of 2002.
KMA is processing the project in cooperation with CMA toextend the joint monitoring network in the northeast area ofChina for better monitoring and forecasting of the Asian Dustwhich moves from the Inner Mongolia to the north area of theKorean peninsula. CMA agreed with KMA on the extension of
Saving the public from the Asian Dust Storm
Nam Jae-Cheol, Korean Meteorological Administration
(a) 10:00 LST 21 March 2002
(b) 10:00 LST 23 March 2002
During and after the dust in Korea
Phot
os: K
MA
4.Environment:Master spread 16/2/07 10:12 Page 171

[ ]172
area, in cooperation with the National Agency for Meteorology,Hydrology and Environmental Monitoring (NAMHEM).
Minimization of economic and public losses in Korea can beexpected following completion of the project, with the estab-lishment of radical measures against the Asian Dust byproviding more accurate and rapid predictions.
the joint monitoring network with five more observationstations in 2006 with financial support by KOICA.
KMA and CMA are executing the project, aiming to finish itin March 2007. KMA also has a plan to establish a joint obser-vation tower for the Asian Dust in the Gobi desert to monitorthe meteorological condition of the Asian Dust at the source
Phot
o: K
MA
Red circles indicate the joint monitoring stations
Forecast chart of dust concentration from ADAM on 19 April 2005
Source: KMA
4.Environment:Master spread 16/2/07 10:12 Page 172
VASSESSMENT
METHODOLOGIES
5.Assessment Methodologies:Master spread 16/2/07 10:15 Page 173

[ ]174
THIS ARTICLE BRIEFLY introduces methods for assessingthe economic value of hydrometeorological informationprovided by National Meteorological and Hydrological
Services (NMHS).Weather, water, and climate information and forecasts
(hydrometeorological information) help people avoid the dangerof hazardous weather conditions and reduce the costs associatedwith unfavourable weather or climate conditions. It also allowsindividuals to take increased advantage of favourable conditions.In most cases, any number of people can use this informationwithout diminishing its value to other users, meaning that theinformation is ‘nonrival’. In addition, it is inherently difficult toprevent people who have not paid for the information from usingit, meaning that the information is ‘nonexclusive’. For thesereasons, hydrometeorological information and improvements toit are appropriately treated as ‘public goods’.
Because hydrometeorological information is a public good,economists would generally agree that competitive marketswould not provide it at socially optimal levels. Consequently,there is justification for paying for its provision from publicrevenues and distributing it to anyone who wants it, chargingonly the marginal costs of its distribution. We note that in theUnited States, a limited number of private companies havesuccessfully found a role in distributing weather informationby tailoring its presentation to appeal to wide audiences, orby meeting the specialized needs of particular users.
However, the public good status of hydrometeorologicalinformation alone does not justify making it widely available.Instead, if we are to determine the right kind and amount ofinformation to produce and disseminate, we must understandthe costs and the benefits of the information. If the total benefitaccruing to users exceeds the total cost of producing the infor-mation, then the service is justified.
Although the cost of producing hydrometeorological infor-mation is usually straightforward to estimate, the benefitstypically are not.
Steps in benefit estimationTo quantify the benefits of hydrometeorological information,we need to consider how humans and hydrometeorologicalsystems interact, how access to hydrometeorological informa-tion improves these interactions, and how we measureimprovements in the interactions.
If information is to change the interactions between hydrom-eteorological systems and humans, that information must makeit possible for people to change their behaviour in ways thatproduce better results, on average, over time. When accessingthe benefits of such information it is helpful to apply a six-stepprocess:
1. Identify the hydrometeorological system/human interac-tion affected
2. Identify the changes in human behaviour that may resultbecause information is available or improved
3. Choose one or more measures that will be used to quan-tify the benefits of changes in behaviour
4. For the measure(s) chosen, estimate the change (orexpected change) in the benefits, in each instance wherebehaviour is changed because of the information content
Methodologies for assessing the economic benefits of National Meteorological
and Hydrological Services
Jeffrey K. Lazo, National Center for Atmospheric ResearchThomas J. Teisberg, Teisberg Associates
Rodney F. Weiher, Chief Economist, National Oceanic and Atmospheric Administration
Hurricane Katrina from space
Phot
o: N
ASA
5.Assessment Methodologies:Master spread 16/2/07 10:15 Page 174

[ ]175
5. Estimate the number of instances (e.g. people, transac-tions) where behaviour is changed
6. Combine the results of steps 4 and 5 to estimate a totalbenefit of information.
Benefit measuresMany metrics can be used to measure interactions betweenhydrometeorological systems and humans. Although it ispossible to measure the effect of people on hydrometeoro-logical systems, the focus here is on measuring the effect ofthose systems on people. These effects include the numberof lives lost to natural disasters, along with measures ofeconomic activity (e.g. output, employment) or economicwelfare (e.g. willingness to pay), in weather-sensitive indus-tries or activities.
The distinction between measures of economic activity andmeasures of economic welfare is important. Measures of activ-ity, even if expressed in monetary units, do not tell us the valueof the activity. These measures do not tell us what people wouldbe willing to pay for that activity. Welfare measures, on theother hand, are specifically designed to quantify what peopleare willing to pay for something. As a result, welfare measuresof benefits are appropriately compared to the costs that peoplepay for those benefits.
Programmes that save lives pose a special and importantproblem in benefits estimation. Saving lives may be seen asdesirable regardless of costs. Public and private decisions,however, routinely make implicit trade-offs between costs andrisks to human life. In policy analysis, economists do not puta value on any specific individual’s life – instead they look athow much people are willing to pay to reduce the risk of peopledying in future events. For instance, suppose a study deter-mines that one million people in a city are each willing to payUSD50 per year on average for a programme to reduce thechance of death by 1 in 100,000 per year – say from 20 in
100,000 to 19 in 100,000 each year. Total willingness to pay isthus USD50 million (USD50 × 1,000,000) and the programmewould save ten lives per year on average; thus, the people of thecity are willing to pay USD50 million to prevent ten deaths. Sothe value per statistical life (VSL) is USD5 million. The USEnvironmental Protection Agency, for example, uses a similarVSL in cost-to-benefit analyses of programmes that reducemortality risk, such as reducing air pollution.
There are three general approaches to estimate the benefitsof hydrometeorological information using welfare measures:
• Stated preference• Economic modelling• Data analysis.
The value of weather forecasts to US householdsBecause weather forecasts have the properties of public goods,little market data exist on the value that households place onhydrometeorological information. Economists can use two basicapproaches to estimate the economic value of ‘nonmarket goods’:revealed preference methods and stated preference methods.Revealed preference methods are applied to actual behaviourand market transactions. Such information may reveal the valuesimplicitly placed on a nonmarket good in the context of thechoices people make about market goods. In stated preference
Forecasting of snow and snow events
Potential benefits from better forecasting of snow and snowevents include:• Improvements in frost forecasts (up to USD6,000 per hectare
per year for fruit orchards)• Long-range stream flow forecasts (over USD170 million per
year in hydropower benefits for three river systems)• Temperature predictions (over USD500 million per year from
natural gas and electric utility providers)• Icing diagnostics at airports (exceeds USD600 million per
year at US airports)• Predictions of road ice formation and fog (exceeds USD29
million per year from rerouting trucks in the US)• Marine forecasts of winds and waves (exceeds USD95 million
per year from transit time savings and cargo loss reductionsin US coastal waters).
Source: Adams, R, Houston, L and Weiher, R. The value of snow and snow informationservices. Report prepared for NOAA’s National Operational Hydrological Remote SensingCenter, August 2004.
Transport and agriculture are among the sectors that benefit most from accurate snow warnings
Phot
o: N
OA
A
5.Assessment Methodologies:Master spread 16/2/07 10:15 Page 175

[ ]176
studies, we estimate value using surveys in which a representa-tive sample of the relevant population expresses a statedpreference. This preference can then be directly or indirectlyused to determine willingness to pay for a good or service. Thevalue obtained for the good or service is contingent on the natureof the constructed market described in the survey scenario.
A recent study used the stated preference approach to esti-mate US households’ values for potential improvements inday-to-day weather forecasts.1 In this study, the researchersdeveloped a survey instrument to elicit the value placed byhouseholds on improved weather forecasting services. Theinvestigators took great care in developing the survey to ensurethat respondents would understand the commodity beingvalued (weather forecasts) and to make sure that the survey’sresults would be valid and reliable. In addition to valuationinformation, the survey elicited information on households’sources, uses, and perceptions of weather information.
Four attributes of weather forecasts were considered in thesurvey: the frequency of forecast updates, the accuracy of one-dayforecasts, the accuracy of multiday forecasts, and the geographicdetail of forecasts. Different combinations of improvements inforecast quality were offered to individuals who were asked tochoose between forecast ‘packages’ and a proposed cost for theforecast improvement. This means that the study used a ‘statedchoice’ approach to stated preference valuation. The researchersthen used statistical analysis to determine individuals’ marginalvalues for changes in the different forecast attributes.
Using the values estimated for changes in the attribute levels,the study calculated individuals’ value for a programme thatwould increase all attributes to their maximum level asUSD17.88 per year per household. As expected, values forimproving weather forecasts were found to be related tosociodemographic characteristics such as income and educa-tion, the amount of time an individual spends workingoutdoors, and how individuals use weather information inmaking behavioural decisions.
Using a different valuation question, the study also elicitedindividuals’ value for weather forecasts as currently providedthrough both public and private distribution channels. Thisvalue was USD109 per year per household.
Based on 2000 census estimates of approximately 105 millionUS households, the investigators estimated the total value forimproving weather forecasts to the maximum levels proposedin the survey to be USD1.87 billion per year. Similarly, the totalvalue to US households for weather forecasts as currentlyprovided was estimated to be USD11.4 billion per year.
The benefits of improved weather forecast quality, as esti-mated in the US households study, could be used to evaluatea programme to improve forecasting capabilities, if an estimateof the cost of improvement is available. Consider the follow-ing hypothetical illustration: in the 1980s, the NationalWeather Service undertook the Modernization and Associated
Tornado warnings
Between 1992 and 2004, the National Weather Service’s (NWS)NEXRAD radar system prevented over 330 fatalities and 7,800injuries from tornadoes, at a monetized benefit of over USD3billion, compared with a total capital and site acquisition andpreparation cost of less than USD1.7 billion (in 2004).
Tornadoes during the day are much less dangerous than atnight, with fatalities 64 per cent lower and injuries 43 per centlower for daytime tornadoes. This provides indirect evidencethat tornado warnings are saving lives, but suggests thatimprovements in the dissemination of warnings at night couldsave more lives.
Residents of mobile homes remain at risk from tornadoes: over40 per cent of fatalities occur in mobile homes, and the fatalityrate is more than ten times greater than that for residents ofpermanent homes.
In 2002, 186 million person hours were spent under tornadowarnings in the US, and the value of this time was about USD3billion. The NWS is experimenting with refining its tornadowarnings from the current county basis. This could reduce theperson hours under tornado warnings by half, or more.
Source: Sutter, D and Simmons, K. The value of tornado warnings and improvements inwarnings. Presentations at the American Economics Association annual meeting (Boston,January 2006) and the American Meteorological Society annual meeting (February 2006).
The economic benefit of tornado warnings is huge
Phot
o: N
OA
A
5.Assessment Methodologies:Master spread 16/2/07 10:15 Page 176

production costs, decision making, or similar economicprocesses. For such a model to be useful for estimating thevalue of information, information itself has to play a role inthe model’s operation. Then we can use the model, with differ-ent kinds or amounts of information available within it, andobserve how the different information available changes themodel results. From this, we can infer the economic benefitsof different kinds, amounts, or quality of information.
An example of the economic modelling approach ispresented in a recent estimate of the cost savings in US elec-tricity generation from using 24-hour temperature forecasts toplan production operations.2 Particularly in the southernUnited States during the summer air-conditioning season, next-day temperature has an important influence on next-dayelectricity demand.
An electricity generator typically has many alternative gener-ating units, and any combination of these units could be usedto serve the next day’s demand for electricity. Among thevarious units, lead times and cost characteristics differ. Forexample, preparing different units for service may requiredifferent lead times (with varying costs), and operational costsmay differ as well once a unit is operational. As a result, thecosts of generation to meet a given demand for electricity canbe reduced if a good next-day forecast is available.
In the example study, the investigators used three levels ofmodelling to produce an estimate of cost savings from tempera-ture forecasts in electricity generation. First was a model thatchose, in advance, the best set of generating units to prepare fornext-day use, given a forecast of next-day electricity demand.Second was a model that made appropriate ‘real-time’ adjust-ments on the next day to compensate for error in the previousday’s forecast. This modelling step produced a relationshipbetween the degree of accuracy in the electricity demand fore-cast and the ultimate cost of meeting the next-day electricitydemand. The third step in the modelling procedure involved
[ ]177
Restructuring (MAR) Programme to significantly upgradeobserving and forecasting systems at a cost of approximatelyUSD4.5 billion over 20 years. Suppose, that the improvementsspecified in the US households study would cost twice as muchand would also take 20 years to complete. Further, assume thatmaintenance and operation costs would begin in the tenth yearat a rate of USD60 million per year. Finally, assume that onetenth of the benefits (USD0.187 billion) begin in the tenth yearand increase linearly over ten years to the full level estimatedin the study, USD1.87 billion a year. Using a 5 per cent rate ofdiscount, the net present value of such a program (over a 100-year time horizon) is USD13.5 billion. This means that thepresent value of the benefits of this programme is about 3.02times as much as the present value of the capital, maintenance,and operation costs over the time period. This illustrationdemonstrates how the values estimated from research such asthe US household study could be used in policy decision-making to evaluate weather forecast improvement programs.
The value of temperature forecasts in electricity generationIn some situations, we can use a model to directly representeconomic activities. By a model, economists indicate a set ofequations or relationships that is used to describe behaviour,
Agriculture
A recent study of the potential benefits of improved NOAAhydrological information by the Office of the NOAA ChiefEconomist examined the potential economic value of soilmoisture information for private irrigation management in thesemi-arid Great Plains.
The study estimated significant benefits to farmers which, ifaggregated for the states of Nebraska and Kansas, are worthUSD55 million per year and potentially over USD200 millionper year.
About 45 per cent of these benefits result from more profitableirrigation and 55 per cent from the opportunity value ofconserved groundwater. Other private or public benefits of soilmoisture data would add to these advantages.
Source: Supalla, R, Martin, D, Adams, R and Weiher, R. Potential economic value of soilmoisture data for irrigation management in the central Great Plains, October 2005:www.economics.noaa
The agricultural industry saves money if given accurate predictions of wind and rain
Phot
o: N
OA
A
5.Assessment Methodologies:Master spread 16/2/07 10:15 Page 177

[ ]178
representing the connection between the accuracy of the 24-hourtemperature forecast and the electricity demand forecast. Fromthis third step, the researchers could infer the extent of electric-ity production cost savings that result from having temperatureforecasts (versus no forecasts), or from having improved temper-ature forecasts (relative to the current forecast quality). The studyconcluded, that the availability of 24-hour temperature forecastsof the current quality produces annual cost savings in the US ofUSD166 million relative to having no forecasts available.
Data analysis: the value of a heat wave warning systemin PhiladelphiaIn some cases, data can be generated by experiment, in whichinformation availability is dependent on time and place. Inthese situations, we can analyse the data to determine whetherthe existence, or use of the information, created benefits.
A study of a heat wave warning system implemented inPhiladelphia in 1995 provides an example of this kind ofapproach.3 Largely because of split responsibilities for devisingand implementing the warning system, warnings were declaredduring some, but not all, of the periods of time when heat waspotentially a health risk. The investigators in this studyanalysed mortality data for Philadelphia during this time periodto determine whether heat wave warnings reduced mortality.
When a warning was issued, a number of steps were taken toameliorate the effects of heat, particularly for those most suscep-tible to it. These steps included publicizing the impending heatevent through mass media, publicizing and staffing a ‘Heatline’made available to answer questions from the public, directlycontacting nursing homes to alert them to the situation, encour-aging formation of “buddy systems” to look in on vulnerableneighbours, increasing staffing for emergency medical teams, andextending hours of operation for air-conditioned senior centres.
To measure the benefits of warnings, the researchers collecteddata on mortality for people aged 65 and older and expressedthese data as excess mortality relative to an underlying trendestimated from historical data. Next, they used statistical analy-sis to relate this excess mortality to possible causal factors,including whether or not a heat wave warning was in effect.Overall, this study concluded that the heat warnings that wereissued during this three-year period saved 117 lives. Based onseveral relevant VSL studies, investigators concluded that theamount people would be willing to pay to save this many liveswas on the order of USD500 million.
National Meteorological and Hydrological Services producehydrometeorological information that delivers benefits to awide spectrum of people and activities that are affected byweather, water, and climate. Most of this information is appro-priately thought of as a public good, legitimately funded frompublic sources. Because there are always competing uses forpublic funding, however, we must be able to compare the bene-fits and costs of hydrometeorological information whendeciding how much and what kind of information to produce.
We believe that estimating benefits of hydrometeorologicalinformation using economic welfare or willingness to paymeasures is key to this endeavour. These benefit measures canbe appropriately compared to the monetary costs of produc-ing the information, allowing us to determine if benefits of theinformation exceed its costs.4
Coastal ocean observing systems
Preliminary estimates of the potential economic benefits fromnew investments in regional coastal ocean observing systems inUS waters range from USD500 million to USD1 billion per year,estimated largely in terms of increased economic activity andsocial surplus realized as a result of improved information aboutcoastal marine conditions.
The estimates are constructed for ten geographic regionsencompassing all coastal waters of the US, and cover a widerange of industrial and recreational activities, includingrecreational fishing and boating, beach recreation, maritimetransportation, search and rescue operations, spill response,marine hazards prediction, offshore energy, power generationand commercial fishing.
Source: Kite-Powell, HL, Colgan, CS, Kaiser, M et al. Estimating the economic benefits ofregional ocean observing systems. A report prepared for the National OceanographicPartnership Program, Marine Policy Center, Woods Hole Oceanographic Institution, 2004.
The aftermath of Katrina
Phot
o: N
OA
A
5.Assessment Methodologies:Master spread 16/2/07 10:16 Page 178

[ ]179
EVENTS OF 1997-1998 marked an important turning pointin the application of climate forecasts in southern Africa.It had been known for several years that it was possible
to issue a rainfall forecast for the summer growing season upto six months in advance, based on the developing under-standing of the statistical relationship between the ElNiño-Southern Oscillation (ENSO) and rainfall patterns overthe region. But making these forecasts is an imprecise art, andthe development of several competing forecasts had led toconfusion among decision makers over which forecast to trust,and what actions to take in response. In 1996, key players inthe early warning community for the region began to plan fora single regional consensus forecast. This was to be followedby the National Meteorological and Hydrological Services(NMHS) issuing national forecasts consistent with the regionalforecast, with the forecasting community taking a proactive
role in communicating these predictions to users. With supportfrom several international donors, including the United StatesNational Oceanic and Atmospheric Administration (NOAA),the Southern Africa Drought Monitoring Centre hosted thefirst Southern African Regional Climate Outlook Forum(SARCOF) in Kadoma, Zimbabwe, in September 1997.
The participants at the 1997 SARCOF had something impor-tant to say. In the first half of 1997, it had become clear that anintense El Niño was developing, suggesting the high likelihoodof drought over much of the region. By June, alarms bells wereringing, and organizations such as the Famine Early WarningSystem (FEWS) began to track the development of sea surfacetemperatures. Participants at SARCOF issued a forecast of ahigh probability of drought for much of the region. OverZimbabwe, for example, the prediction for the importantJanuary-February-March rains was of a 50 per cent chance ofbelow normal rains, a 35 per cent chance of near normal rains,and a 15 per cent chance of above normal rains. The mediareported that the ‘mother of all El Niños’ was developing, andwarned of catastrophic crop failures to come. Many subsistencefarmers then restricted their planting to a small area of theirfields, either by choice or because they were unable to obtaincredit. When summer rains fell that were in the near normalrange, there was widespread criticism of the NMHS, namelythat they had misled people into taking inappropriate actions,leading to a lower harvest than would otherwise have occurred.
Potential value of forecasts to farmers, and barriers to adoptionIn the months and years following these events, a number ofstudies suggested that forecasts could be of use to farmers ifused correctly. Farmers could optimize across the range of seedvarieties – trading off potential yield for water requirementsand growing season length – and by changing the crop density,the time of planting, and the application of fertilizer. At thesame time, however, these studies suggested that a number offactors prevented farmers from making these optimal choices.First, farmers may not trust the forecasts, based on their expe-riences in past years. Events in Zimbabwe following the1997-1998 season, and in Brazil following a similar experiencein the early 1990s, suggested that a perceived error of one fore-cast could lead to lower trust for years to come, and an
Evaluating the value of seasonal climateforecasts for subsistence farmers: lessons from NOAA applications
research in Zimbabwe
Anthony Patt, International Institute for Applied Systems Analysis, Austria
Seasonal climate forecasts can help subsistence farmers plantappropriate crops, such as short-season maize and groundnuts
Phot
o: A
ntho
ny P
att
5.Assessment Methodologies:Master spread 16/2/07 10:16 Page 179

[ ]180
bility of forecasts following years in which something otherthan the most likely events occurred. Third, they could workwith farmers to develop response strategies at the village level,incorporating both local geographical factors and the tradi-tional indicators. This would address the legitimacy and scaleconstraints. NOAA funded a pilot project in Zimbabwe led byAnthony Patt and Pablo Suarez of Boston University, andChiedza Gwata of the University of Zimbabwe, to test whetherthese theoretical solutions would work in practice, andwhether actual benefits to farmers could be demonstrated oncethese constraints had been addressed.
Using probabilistic informationThe first issue explored in the project was whether farmerscould actually understand a probabilistic forecast. Theresearchers used experimental techniques from psychology andbehavioural economics to examine the responses to proba-bilistic information among a sample of almost 100 subsistencefarmers from seven different farming communities.
The participants played a series of gambling games with amodified roulette wheel, choosing which colour to place theirbets on. In one game, for example, the roulette wheel wasexactly half red and half green, and the rules of the game werethat a successful bet on red would win a prize of ZWD2(Zimbabwe dollars), while a successful bet on green would wina prize of ZWD3. Participants who were able to optimise wouldplace all of their bets on green, while those with a poorerunderstanding of probability and uncertainty would betempted to bet on red at least some of the time. In anothergame, the regions of the roulette wheel were marked to repre-sent ‘good rains’ and ‘drought’. The bets consisted of plantingmaize, which paid ZWD5 if the wheel landed on good rainsand nothing for drought; and planting millet, which paidZWD3 for good rains and ZWD2 for drought. Over a series ofplays, the researchers changed the relative sizes of good rainsand drought on the wheel, and observed the effect that thishad on the bets farmers placed.
The results of the experiment showed that farmers clearlycould work with probabilistic information, if given the oppor-tunity to familiarize themselves with it. When participantsplayed five rounds of the red/green betting game at the begin-ning of the session, almost all of them placed some of theirbets on red, even though it had a lower expected payoff. Overten rounds of the maize/millet game, farmers changed theirbets in response to different probabilities of good rains anddrought. In another five rounds of the red/green game, comingat the end of the experimental session, almost half of the partic-ipants placed all bets on green – the correct strategy. Womenoutperformed men: close to 60 per cent of the women hadadopted the optimal strategy, compared to slightly more than30 per cent of the men.
A methodology to identify forecast valueThe next stage of research was to explore whether subsistencefarmers, having access to a timely probabilistic forecast thatthey could discuss with agricultural advisors and compare withtheir traditional indicators, would use the forecast to makedifferent decisions and derive added value as a consequence.Zimbabwe was an ideal country to conduct this research, sincethe NMHS was already active in broadcasting the forecast viaradio, making it possible to test the added value of a partici-patory approach.
unwillingness to use the information at all. Second, farmersmay not see the forecast as a legitimate basis for action, bothbecause it could be seen as supplanting established forecast-ing methods within the community, and because it could beseen to be benefiting the political and financial elite, such asbankers who restricted credit, rather than the individualfarmers themselves. As with a lack of credibility, a lack of legit-imacy may lead farmers to reject the information.
Third, the forecast may be at too coarse a scale to benefitfarmers. In a geographically heterogeneous country such asZimbabwe, it was not obvious to farmers how to apply anational-level forecast to their own particular village. Fourth,farmers may not understand the forecast. Many had inter-preted the 1997 forecast in Zimbabwe to mean that therewould be no rains, and acted accordingly rather than takingits suggestion of probability into account. Fifth, establishedprocedures may stand in the way of using the forecast. If theforecast is communicated to farmers via the local agriculturalextension service offices, and if this requires a series of meet-ings at the national, provincial, and then local level, it cantake weeks, meaning that the forecast reaches farmers afterthey have had to purchase their seeds and begin planting.Finally, particular choices may simply be unavailable toparticular farmers: the local store may have decided not tostock the seed variety that the forecast suggests is appropri-ate, or families may not have access to draft power to plantat an appropriate time.
In theory, better communication practices by the NMHS andthe agricultural extension services could overcome at leastfour of these constraints. First, the services could alter theirstandard procedures for information flow in order to reachfarmers within days of the SARCOF meeting, giving them theopportunity to use the forecasts in their seed purchasing deci-sions. Second, they could better explain the forecasts’probabilistic character. This would address the constraint ofunderstanding the forecast, and may also increase the credi-
An agricultural extension officer discusses local soils and precipitation at a forecast workshop
Phot
o: A
ntho
ny P
att
5.Assessment Methodologies:Master spread 16/2/07 10:16 Page 180

[ ]181
Beginning in 2000 and continuing through 2004, theresearchers organized and facilitated annual forecast work-shops in four representative farming communities. Workingwith the local agricultural extension service and other commu-nity leaders, they invited a representative sample of roughly50 farmers to each workshop. Farmers presented their inter-pretation of the previous season’s events: what had beenforecast; how the rains had actually fallen; and which crop vari-eties had produced the best results. They then presented theirown local indicators for the coming growing season. Next, theresearchers presented the probabilistic forecast, which had beenissued only days before at the SARCOF and downscaled by theZimbabwe NMHS. They answered farmers’ questions about theforecast, including the role of ENSO and other global drivers,and a comparison of the forecast with the local indicators. Withconsideration of local historical rainfall records, they discussedwhat the probabilistic forecast implied in terms of actual rain-fall quantities. Representatives from the agricultural extensionservice then discussed with farmers specific actions – the selec-tion of crop varieties and planting dates – that could be takenin response to the forecast and other economic considerations.The workshops ended with a meal, where other communityissues were discussed.
To reach robust conclusions about the value of the forecast,the researchers administered a household survey at the conclu-sion of the growing season, asking farmers about the plantingdecisions they had made, and their estimated yields for eachcrop variety from that season and prior seasons. Over two yearsof the survey (2003 and 2004) enumerators obtained valid datafor 495 households, a random sample within each communityincluding both those who had and had not participated in thepre-season workshop.
Results of the studyThe study generated both qualitative and quantitative results,which were published in the 30 August 2005 issue ofProceedings of the National Academy of Sciences. At the work-shops, farmers expressed enthusiasm for receiving the forecast,
and participated actively in discussion of ENSO and other rain-fall determinants. They expressed greater confidence in theforecast after they had been able to ask questions about it, andsaid that this opportunity also increased their appreciation ofthe forecast they heard over the radio, realizing that it wasfundamentally the same forecast. Data from the survey wasused to provide one of the first robust estimates of the fore-casts’ added value, and the added value of a participatorycommunication approach.
To examine forecast value, the researchers compared farmers’yield estimates with their estimated historical yields to generatea relative harvest indicator. The indicator corrected for individ-ual farmers’ estimation error and took into account diversegrowing conditions. The first year of the survey, 2003, had beenan El Niño year with normal, to below normal forecasted rains.The actual rains had been below normal. The relative harvestindicator showed that most farmers had received close to theirlowest historical yields. In this year, farmers who reported usingthe forecast to make different decisions outperformed those whodid not use the forecast by an average of 3.6 per cent, althoughthe difference between the two groups was not statistically signif-icant. The second year, 2004, had neutral ENSO conditions, andactual rains that were in the near-normal range. The yield indi-cator showed that most farmers had obtained yields that wereclose to their historical average. In this year, farmers whoreported using the forecast to make different decisions outper-formed those who had not by an average of 18.7 per cent. Thedifference was significant at a 90 per cent confidence level, usingboth parametric and non-parametric statistical tests. Averagedover the two years, farmers who reported using the forecastoutperformed those who had not by an average of 9.4 per cent,a difference significant at a 95 per cent confidence level. Thesedata provided the most convincing evidence to-date that fore-casts could benefit individual subsistence farmers.
The second quantitative finding was that workshop atten-dance made a large difference in farmers’ use of the forecast. Intwo of the communities, the data indicated that the farmerswho had attended the workshops represented a biased sampleof very good farmers, making it impossible to compare themwith those who had not attended the workshops. In the othertwo communities, however, there did not appear to be a differ-ence between the two groups, making a comparison possible.The majority of farmers who had attended a workshop reportedusing the forecast to make different decisions, whereas roughly10 per cent of those who had not attended a workshop but hadheard the forecast through another channel reported using itto make different decisions. Thus, workshop attendanceboosted forecast-use by a factor of five.
These results were the first of their kind, in that they showedbenefits from forecasts using a participatory disseminationstrategy, with a research methodology that allowed for robuststatistical tests. In these communities, which faced growingconditions similar to those across much of the region, seasonalclimate forecasts made a profound difference to those farmerswho chose to use the information. Using the information,however, is not easy, and a participatory communication strat-egy was the major determinant of farmers’ using theinformation. Timely and accurate seasonal climate forecastscan help subsistence farmers – among the poorest of the poor– but NMHS need to continue to work with other stakehold-ers to communicate the information in ways that increasefarmers’ understanding of, and trust in, the information.
0
0.1
0.2
0.3
0.4
0.5
0.6
2002-03 2003-04
Aver
age
valu
e of
har
vest
indi
cato
r
Used forecast
Did not use forecast
Harvest indicator showing how farmers performed relative to their own historical yields
Source: Patt, Suarez and Gwata, Proceedings of the National Academy of Sciences, 30 August 2005
5.Assessment Methodologies:Master spread 16/2/07 10:16 Page 181
[ ]182
WEATHER HAS SIGNIFICANT and increasing societal andeconomic impacts in every country and in almostevery human activity. Weather forecasts allow deci-
sion makers to mitigate some of the impacts of weather and thuscreate significant economic value. Understanding the economicimpacts of weather and weather forecasts is critical to NationalMeteorological and Hydrological Services (NMHS) efforts toserve society. It is important therefore to understand theeconomic aspects of weather impacts and weather forecasts, inorder to gain a better understanding of several key perspectives:
• The distinction between weather impacts and weatherforecasts
• How to value weather impacts and weather forecasts• How economic information is important in the decision
making that supports NMHS.
Weather impacts and forecasts The term, ‘economics of weather impacts’ relates to the way inwhich different weather conditions change or affect economicactivity and decision making. Weather impacts include the lossof crops to freezing temperatures, or energy demands thatincrease with higher temperatures. The economics of weatherforecasts relates to how decision makers respond to weatherpredictions – for example, protective action in response tofreeze warnings to reduce crop losses, or an investigation intothe extent of energy-cost savings that can be realized with betterone-day temperature forecasts.
The relationship between the economic impact of weatherand the economic value of weather forecasts is neither directnor clear. In general though, if weather forecasts are to havevalue, decision makers must be able to change their behaviourin response to weather information. If they cannot makechanges, the forecasts can have no direct value.
Valuing impacts and forecastsTo assess the value of forecasts then, it is necessary to under-stand the relationships between the impacts of weather, andthe information given in weather forecasts. In addition, it isimportant to be aware of how decision makers use that infor-mation, how decisions change with different forecastinformation, and how economic impacts alter with changes indecision making and behaviour. This leads to the question:what exactly should be taken into account when we talk aboutthe value of weather forecasts?
The process of valuation always entails the comparison ofthe value in one situation to that in another situation. The valu-ation of weather forecasts involves comparing two differentlevels, qualities or types of weather information, based on theassumption that all other factors are equal. The diagram belowshows a continuum of weather-information value, beginningwith ‘no information’ and ending with ‘perfect information’.When speaking of the value of weather information, it is neces-sary to specify which components of the continuum are beingcompared.
Other aspects of the valuation problem include:• Who is receiving the value (e.g. the users of the infor-
mation)• The temporal and spatial scales of the valuation study• The type of information being valued (e.g. all weather
information or just temperature information).
In order to make it possible to estimate economic value, it isalso important to understand the weather forecast and impact‘value chain’, (represented in the second diagram below).Although NMHS focus mainly on activities in the ‘weather fore-cast enterprise’ box, much of the value added or lost occurs inthe ‘communication’ and ‘users and decision making’ boxes.
Economics of weather impacts and weather forecasts
Jeffrey K. Lazo, National Center for Atmospheric Research, US
Source: Jeffrey K. Lazo
No Information Climatology Persistence1 CurrentInformation
ImprovedInformation
Perfect Information
1 The value of climatology may be higher or lower than persistence but is shown as lower for the current purposes
Continuum of weather-information value
5.Assessment Methodologies:Master spread 16/2/07 10:16 Page 182
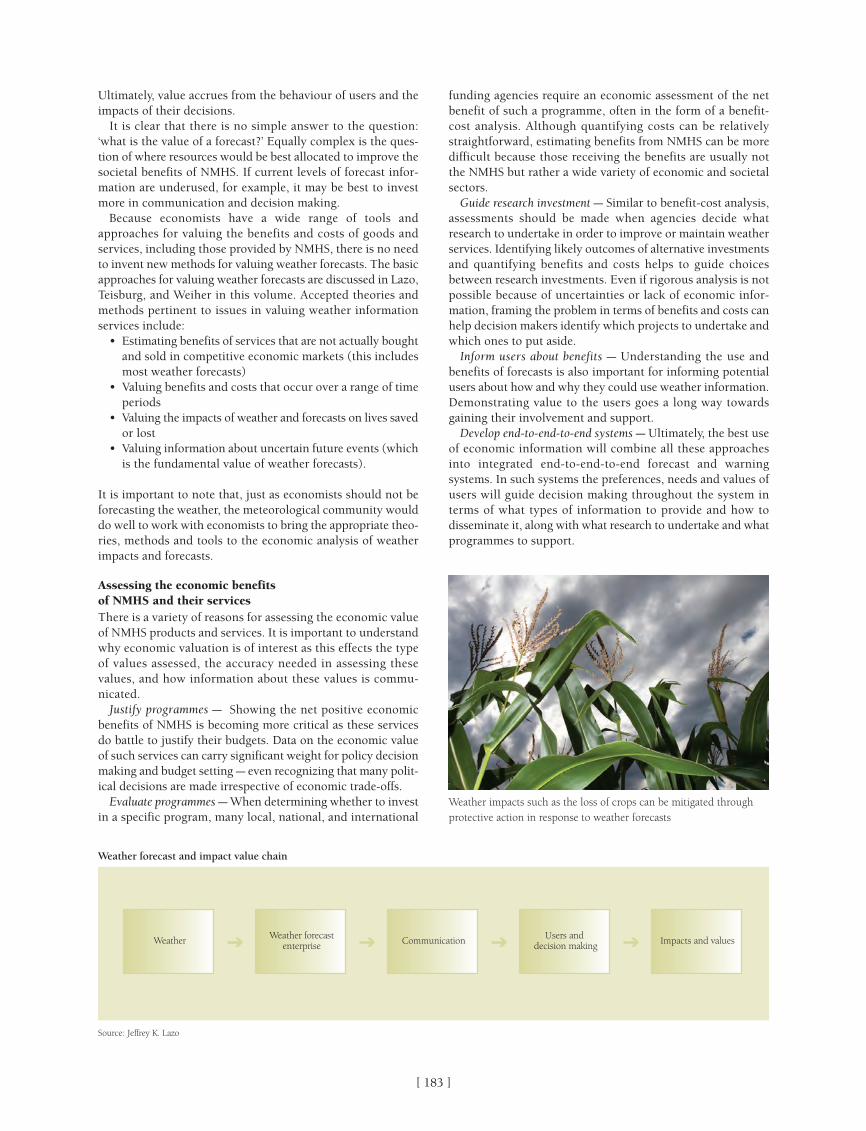
[ ]183
funding agencies require an economic assessment of the netbenefit of such a programme, often in the form of a benefit-cost analysis. Although quantifying costs can be relativelystraightforward, estimating benefits from NMHS can be moredifficult because those receiving the benefits are usually notthe NMHS but rather a wide variety of economic and societalsectors.
Guide research investment – Similar to benefit-cost analysis,assessments should be made when agencies decide whatresearch to undertake in order to improve or maintain weatherservices. Identifying likely outcomes of alternative investmentsand quantifying benefits and costs helps to guide choicesbetween research investments. Even if rigorous analysis is notpossible because of uncertainties or lack of economic infor-mation, framing the problem in terms of benefits and costs canhelp decision makers identify which projects to undertake andwhich ones to put aside.
Inform users about benefits – Understanding the use andbenefits of forecasts is also important for informing potentialusers about how and why they could use weather information.Demonstrating value to the users goes a long way towardsgaining their involvement and support.
Develop end-to-end-to-end systems – Ultimately, the best useof economic information will combine all these approachesinto integrated end-to-end-to-end forecast and warningsystems. In such systems the preferences, needs and values ofusers will guide decision making throughout the system interms of what types of information to provide and how todisseminate it, along with what research to undertake and whatprogrammes to support.
Ultimately, value accrues from the behaviour of users and theimpacts of their decisions.
It is clear that there is no simple answer to the question:‘what is the value of a forecast?’ Equally complex is the ques-tion of where resources would be best allocated to improve thesocietal benefits of NMHS. If current levels of forecast infor-mation are underused, for example, it may be best to investmore in communication and decision making.
Because economists have a wide range of tools andapproaches for valuing the benefits and costs of goods andservices, including those provided by NMHS, there is no needto invent new methods for valuing weather forecasts. The basicapproaches for valuing weather forecasts are discussed in Lazo,Teisburg, and Weiher in this volume. Accepted theories andmethods pertinent to issues in valuing weather informationservices include:
• Estimating benefits of services that are not actually boughtand sold in competitive economic markets (this includesmost weather forecasts)
• Valuing benefits and costs that occur over a range of timeperiods
• Valuing the impacts of weather and forecasts on lives savedor lost
• Valuing information about uncertain future events (whichis the fundamental value of weather forecasts).
It is important to note that, just as economists should not beforecasting the weather, the meteorological community woulddo well to work with economists to bring the appropriate theo-ries, methods and tools to the economic analysis of weatherimpacts and forecasts.
Assessing the economic benefits of NMHS and their servicesThere is a variety of reasons for assessing the economic valueof NMHS products and services. It is important to understandwhy economic valuation is of interest as this effects the typeof values assessed, the accuracy needed in assessing thesevalues, and how information about these values is commu-nicated.
Justify programmes – Showing the net positive economicbenefits of NMHS is becoming more critical as these servicesdo battle to justify their budgets. Data on the economic valueof such services can carry significant weight for policy decisionmaking and budget setting – even recognizing that many polit-ical decisions are made irrespective of economic trade-offs.
Evaluate programmes – When determining whether to investin a specific program, many local, national, and international
Source: Jeffrey K. Lazo
Weather Weather forecastenterprise Communication Users and
decision making Impacts and values
Weather forecast and impact value chain
Weather impacts such as the loss of crops can be mitigated throughprotective action in response to weather forecasts
5.Assessment Methodologies:Master spread 16/2/07 10:16 Page 183

[ ]184
NATIONAL METEOROLOGICAL AND HydrometeorologicalOrganizations (NMHOs) aim to provide their respec-tive citizens with world class meteorological and
environmental information, predictions and services to ensurethe safety of the population, support economic activity andfacilitate improved environmental decision-making. This infor-mation includes millions of weather forecasts and thousandsof severe weather warnings that are issued each year, alongwith billions of archived environmental observations and asso-ciated applications for decision-makers in health, agriculture,energy, forestry, transportation, construction, insurance andmany other sectors. The production of this information inCanada is dependent on a public monitoring, computer,telecommunication and research laboratory infrastructurevalued at over CAD330 million, and on the contributions ofabout 2,000 meteorologists, scientists, technicians and support
staff. A significant effort is also provided through the acade-mic community, private meteorological service providers,media and experts employed directly by large user businesses,institutions and organizations.
In light of such investments, public meteorological agenciesthe world over have become increasingly interested in identi-fying, tracking and evaluating the costs and benefits ofproviding timely, precise and accurate information about thepast, current and future states of the atmosphere. This desireis also driven by broader globalisation pressures that haveencouraged the proliferation of international quality control,quality assurance and other standard-setting and performance-measuring practices. Clearly there is a need to justify the costof current operations and this objective has underpinned publicagency support to date for societal and economic valuationresearch.
Moving from hindsight to foresight: a challenge in the application
of valuation research
Brian Mills, Adaptation and Impacts Research Division, Atmospheric Science and Technology Directorate, Environment Canada
Understanding the decision-making behaviour of users – in this case drivers – is critical to developing improved weather services
Phot
o: J
. Sug
gett
5.Assessment Methodologies:Master spread 16/2/07 10:16 Page 184
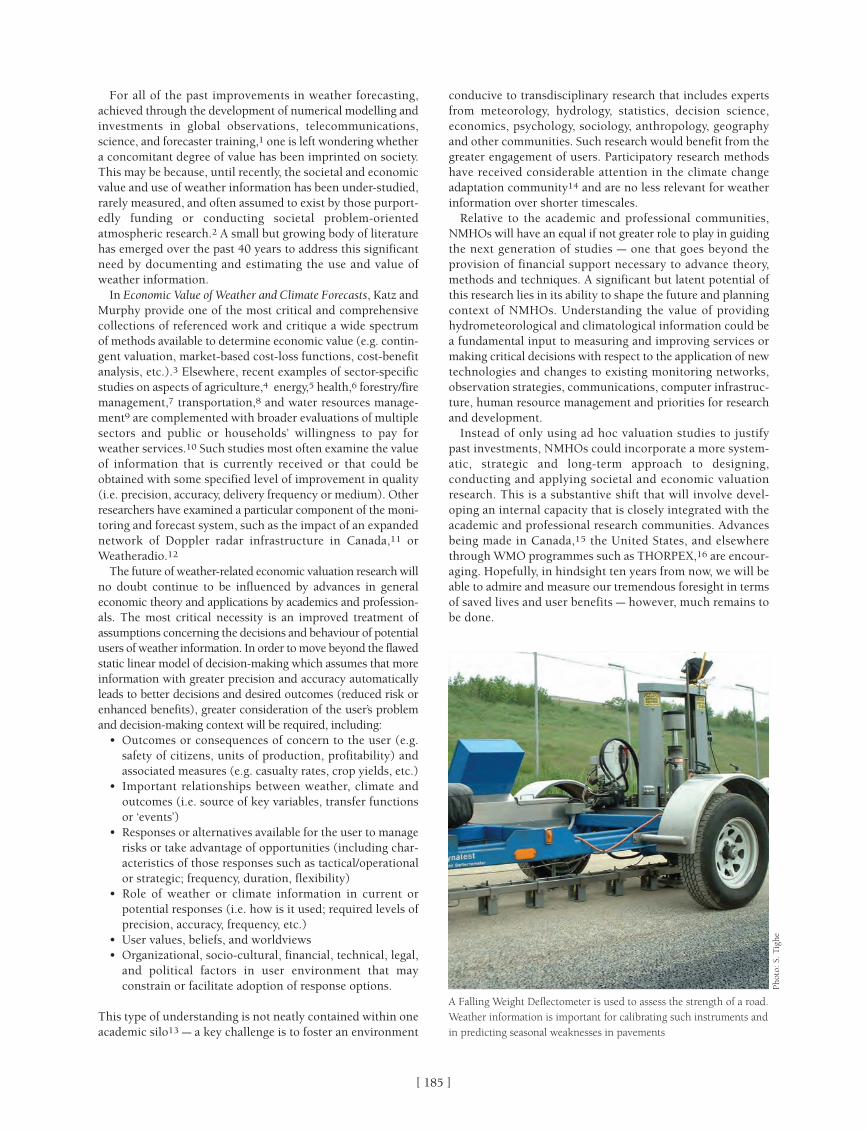
[ ]185
conducive to transdisciplinary research that includes expertsfrom meteorology, hydrology, statistics, decision science,economics, psychology, sociology, anthropology, geographyand other communities. Such research would benefit from thegreater engagement of users. Participatory research methodshave received considerable attention in the climate changeadaptation community14 and are no less relevant for weatherinformation over shorter timescales.
Relative to the academic and professional communities,NMHOs will have an equal if not greater role to play in guidingthe next generation of studies – one that goes beyond theprovision of financial support necessary to advance theory,methods and techniques. A significant but latent potential ofthis research lies in its ability to shape the future and planningcontext of NMHOs. Understanding the value of providinghydrometeorological and climatological information could bea fundamental input to measuring and improving services ormaking critical decisions with respect to the application of newtechnologies and changes to existing monitoring networks,observation strategies, communications, computer infrastruc-ture, human resource management and priorities for researchand development.
Instead of only using ad hoc valuation studies to justifypast investments, NMHOs could incorporate a more system-atic, strategic and long-term approach to designing,conducting and applying societal and economic valuationresearch. This is a substantive shift that will involve devel-oping an internal capacity that is closely integrated with theacademic and professional research communities. Advancesbeing made in Canada,15 the United States, and elsewherethrough WMO programmes such as THORPEX,16 are encour-aging. Hopefully, in hindsight ten years from now, we will beable to admire and measure our tremendous foresight in termsof saved lives and user benefits – however, much remains tobe done.
For all of the past improvements in weather forecasting,achieved through the development of numerical modelling andinvestments in global observations, telecommunications,science, and forecaster training,1 one is left wondering whethera concomitant degree of value has been imprinted on society.This may be because, until recently, the societal and economicvalue and use of weather information has been under-studied,rarely measured, and often assumed to exist by those purport-edly funding or conducting societal problem-orientedatmospheric research.2 A small but growing body of literaturehas emerged over the past 40 years to address this significantneed by documenting and estimating the use and value ofweather information.
In Economic Value of Weather and Climate Forecasts, Katz andMurphy provide one of the most critical and comprehensivecollections of referenced work and critique a wide spectrumof methods available to determine economic value (e.g. contin-gent valuation, market-based cost-loss functions, cost-benefitanalysis, etc.).3 Elsewhere, recent examples of sector-specificstudies on aspects of agriculture,4 energy,5 health,6 forestry/firemanagement,7 transportation,8 and water resources manage-ment9 are complemented with broader evaluations of multiplesectors and public or households’ willingness to pay forweather services.10 Such studies most often examine the valueof information that is currently received or that could beobtained with some specified level of improvement in quality(i.e. precision, accuracy, delivery frequency or medium). Otherresearchers have examined a particular component of the moni-toring and forecast system, such as the impact of an expandednetwork of Doppler radar infrastructure in Canada,11 orWeatheradio.12
The future of weather-related economic valuation research willno doubt continue to be influenced by advances in generaleconomic theory and applications by academics and profession-als. The most critical necessity is an improved treatment ofassumptions concerning the decisions and behaviour of potentialusers of weather information. In order to move beyond the flawedstatic linear model of decision-making which assumes that moreinformation with greater precision and accuracy automaticallyleads to better decisions and desired outcomes (reduced risk orenhanced benefits), greater consideration of the user’s problemand decision-making context will be required, including:
• Outcomes or consequences of concern to the user (e.g.safety of citizens, units of production, profitability) andassociated measures (e.g. casualty rates, crop yields, etc.)
• Important relationships between weather, climate andoutcomes (i.e. source of key variables, transfer functionsor ‘events’)
• Responses or alternatives available for the user to managerisks or take advantage of opportunities (including char-acteristics of those responses such as tactical/operationalor strategic; frequency, duration, flexibility)
• Role of weather or climate information in current orpotential responses (i.e. how is it used; required levels ofprecision, accuracy, frequency, etc.)
• User values, beliefs, and worldviews• Organizational, socio-cultural, financial, technical, legal,
and political factors in user environment that mayconstrain or facilitate adoption of response options.
This type of understanding is not neatly contained within oneacademic silo13 – a key challenge is to foster an environment
A Falling Weight Deflectometer is used to assess the strength of a road.Weather information is important for calibrating such instruments andin predicting seasonal weaknesses in pavements
Phot
o: S
. Tig
he
5.Assessment Methodologies:Master spread 16/2/07 10:16 Page 185

[ ]186
THERE IS A growing understanding that hydrometeoro-logical data, and weather forecasts in particular, bringeconomic and social benefits to any country. The use of
hydrometeorological information in decision-making makes itpossible to minimize economic damages and loss of humanlives, as well as to gain additional economic benefits from theforecasts of favourable weather conditions. However, existingmethods for assessing the economic benefits of hydrometeoro-logical information and services require reliable econometricand specialized data, considerable resources and expertise. Allor many of these ingredients are missing in the developingcountries, making it difficult for national hydrometeorologicalservices (NMHS) to demonstrate the economic efficiency oftheir services and justify the need for adequate public support.
The World Bank was first faced with the need to develop amethod for an express assessment of the economic efficiency ofNMHS in 2003 while preparing the National HydrometeorologicalModernization Project in Russia. The results of the study, carriedout jointly with Roshydromet, were well received by the RussianGovernment and World Meteorological Organization (WMO).This positive experience has encouraged the bank to launchfurther studies in cooperation with NMHS.
Over the past 15 years, the NMHS of the transitioneconomies in the Europe and Central Asia (ECA) regionsuffered greatly from the massive underfunding. This resultedin increased economic losses from hydrometeorologicalhazards and unfavourable weather conditions, the frequencyand scale of which increased in most ECA countries.Modernization of NMHS and improvement of hydrometeoro-logical service (HMS) delivery is one of the key factors inminimizing economic losses from these events and increas-ing pubic safety. Before allocating resources for suchmodernizations, the national governments demand thatNMHS prove the economic benefits of such a decision.
For most NMHS, this poses a great challenge due to the absenceof a generally accepted methodology for assessing the effective-ness of HMS delivery or modernization programmes; lack of basiceconometric information needed to assess losses and benefits,and the shortage of expertise in NMHS and weather dependentsectors capable of making this assessment. The process of collec-tion and evaluation of the information is time-consuming andrequires substantial funding which is often unavailable.
The World Bank, jointly with a number of NMHS in Europeand Asia (among them Albania, Armenia, Azerbaijan, Belarus,
Customizing methods for assessing economicbenefits of hydrometeorological services
and modernization programmes:benchmarking and sector-specific assessment
V. Tsirkunov, S. Ulatov, M. Smetanina, A. Korshunov
In the last five years, 15 cases of waterspouts have occurred 3-5 km from the coast, on two occasions causing the loss of human lives
Phot
o: M
r P
Luri
e
5.Assessment Methodologies:Master spread 16/2/07 10:16 Page 186

[ ]187
The benchmarking method has two stages: determining thebenchmarks; and correcting them according to country-specificcharacteristics.
Determining benchmarksIn order to estimate benchmarks, we have used various dataand estimates obtained from studies conducted in other coun-tries alongside estimates from experts working for NMHS. Forthe purposes of this study, the following values for principalbenchmarks have been assumed:
1. Average annual level of losses from adverse and dangerousweather conditions as a percentage of GDP – 0.45 per cent.The range of annual losses is assumed to be 0.1-1.0 per centof GDP. There is no comprehensive database on this impor-tant parameter, the estimates available in the literature varyfrom about 0.1 per cent to over 5 per cent of GDP
2. Average annual level of prevented losses as a percentageof total losses – 40 per cent (range – 20-60 per cent).
It is also assumed that the country corresponding to thesebenchmarks would have the following characteristics:
Georgia, Kazakhstan, Russia and Serbia), has been engaged indeveloping and piloting new approaches for estimating addi-tional economic benefits from the modernization anddevelopment of HMS, as well as for assessing the currenteconomic benefits from existing HMS. These efforts weredriven primarily by practical considerations in the process ofdevelopment modernization initiatives and fostering a betterdialogue between HMS and national economic and fiscalauthorities. As a result of this cooperation, two simplifiedmethods – benchmarking and sector-specific assessment –have been developed. These two approaches are independentand yet complementary.
Why benchmarking?Benchmarking offers an express method of obtaining resultsabout damages caused by weather impacts in the absence ofessential information, and with financial and time constraintsfor more detailed studies. The method employs the availableofficial statistics and expert assessment of the weather-depen-dence of a country's economy, meteorological vulnerability ofits territory, and existing NMHS provision.
Main parameters and results of economic efficiency of HMS delivery and proposed modernization programmes (economic parameters are in USD of 2000 constant prices)
Albania Azerbaijan Armenia Belarus Georgia Kazakhsatan Serbia
Average Annual GDP, $ million 4,229 7,061 2,579 15, 011 3,620 23,991 9,763
Territory, thousand km2 28.8 86.6 29.8 207.6 69.7 2,720 89.0
Population, million. 3.1 7.8 3.0 10.3 4.9 15.1 8.1
NMHS funding, $ million 0.44 1.7 0.47 2.96 0.47 4.21 5.15
Share of agriculture in GDP, % 24 12 30 10 25 7.0 17
Weather dependent sectors in GDP, % 65 51 69 43 62 45 44
Meteorological vulnerability «relatively high» «relatively high» «relatively high» «relatively high» «relatively high» «relatively high» «average»
State of NHMS and HMS delivery «poor» «poor» «poor» «poor» «poor» «poor» «satisfactory»
Adjusted share of losses incurred, benchmarking 1.00 0.5 1.25 0.38 0.99 0.32 0.44
(% of GDP)
Assessment of economic losses,$ million benchmarking 37.9 35.5 32.2 57.5 35.8 77.9 42.
Assessment of economic losses (direct and indirect), 32.1 54.5 50.1 72.3-83.1 53.6 - 95
$ million sectoral assessments
Assessment of preventable losses, $ million, benchmarking 10.5 13.9 7.0 28.8 9.3 39.0 33.5
Assessment of efficiency of the existing 432 165 277 206 362 198 219
HMS delivery (%), benchmarking
Annual incremental effect of improvement the status of 2.5 3.8 1.6 8.6 2.2 11.5 5.5
NHMS and HMS delivery to “adequate” – benchmarking
assesment, $ million
Annual incremental effect of improvement the status of 1.8-3.9 12.3 9.2 7.9-9.1 8.0 - 4.34
NHMS and HMS delivery to “adequate” – sector-specific
assesment, $ million
Estimated cost of modernization program, $ million 4.0 6.0 5.3 11.5 6.0 14.9 4.4
Investment efficiency, % (across 7 years), benchmarking 630 430 210 530 260 540 880
Investment efficiency, % (across 7 years), 320-680 1440 1070 480 –550 1,050 -* 690
sector-specific assessment
Source: Authors’ estimates based on official statistics and national hydrometeorological and sectoral experts’ assessment
5.Assessment Methodologies:Master spread 16/2/07 10:16 Page 187

[ ]188
• Weather dependence (aggregate share of weather-depen-dent sectors in GDP) – 50 per cent
• Share of agriculture in GDP – 15 per cent• Meteorological vulnerability – ‘average’• Status of HMS provision – ‘satisfactory’.
The meteorological vulnerability of the territory was assessedaccording to specially designed methodology that took accountof the observed extreme values of major meteorological compo-nents, among them temperatures (minimum and maximum),precipitation and wind, along with characteristics of theirstatistical distributions.
Correcting benchmarksAt the second stage, the benchmarks are corrected according tocountry-specific characteristics. The intervals for possible distri-bution of country-specific estimates and the methods foradjusting benchmarks were devised on the basis of expert assess-ment and the results of studies conducted in other countries.Finally, the estimates obtained for a specific country are used forcalculating the marginal efficiency of the existing HMS and itspotential improvement in case of proposed modernization.
One of the constraints of this method is that it allows forassessing the efficiency of HMS only in relation to preventionof direct losses, while indirect losses (including the loss ofhuman lives, profits etc.) are not factored in. As a result, theobtained estimates of economic benefits from NMHS substan-tially understate their real economic value. Another importantconstraint comes from the assumption on homogeneity ofacountry’s territory with regards to its meteorological vulnera-bility and weather-dependence, which imposes constraints onits use in large and diverse countries. However, the bench-marking method is appropriate for large countries if theirterritories are broken down into more homogeneous zones.
Methodology on sector-specific assessmentThe methodology on sector-specific assessment is based on thespecially-designed surveys of experts from weather-dependentsectors and aims at obtaining:
1. Information on the level of direct and indirect losses fromhazardous weather events and adverse weather condi-tions in a specific sector
2. Estimates of possible variations in the share of preventablelosses and costs of protective measures due to more accu-rate and timely hydrometeorological information andforecasts as a result of modernization programmes. Thedata received through these surveys are then used to eval-uate the marginal effects from modernization for eachweather-dependent sector and the integral effect for theeconomy as a whole.
One of the advantages of sector-specific assessment is the possi-bilty of factoring into efficiency estimates some indirect lossesfrom hazardous weather events and adverse weather condi-tions, in particular those related to lost profits. This methodcould be particularly useful for the evaluation of NMHSmodernization projects, as it allows for estimation of the poten-tial benefits related to improvements in the provision of generaland specialized HMS, and takes into account the present andfuture needs of specific users.
In spite of significant constraints, both methods – the bench-marking and sector-specific assessment – help to generate
useful indicative economic estimates of NMHS performancein the surveyed countries. The table presents the baseline para-meters for the benchmarking method, the main results ofevaluation of economic efficiency of the existing NMHS andefficiency of proposed modernization programmes by bothmethods – benchmarking and sector-specific assessments –applied in studies carried out in Albania, Armenia, Azerbaijan,Belarus, Georgia, Kazakhstan, Russia, and Serbia.
The state of national NMHS and HMS delivery was rated bynational experts of all the countries (except for Serbia) as ‘poor’.Meteorological vulnerability for all the countries (except forSerbia) was calculated as ‘relatively high’. The estimates ofeconomic losses from hazardous weather events varies between0.32 per cent of GDP for Kazakhstan and 1.25 per cent of GDPfor Armenia.
For the target countries the assessment of the preventedlosses was undertaken for the first time and the results shouldbe viewed as tentative. Nonetheless, we believe they indicatea high economic value of the hydrometeorological servicesand information. The benchmarking estimates of losses wereusually lower than the ones evaluated based on sectoral assess-ments, as the latter attempt to evaluate both direct and indirectlosses.
Estimates of relative economic efficiency of the existing NMHS,calculated by comparing the estimates of prevented losses andthe cost of NMHS funding, show that the efficiency (or benefit-cost ratio) is rather high, ranging from 165 per cent for Azerbaijanto 568 per cent for Albania. Overall, for each dollar spent forsupporting the existing NMHS, the countries usually gain twoor more dollars through the avoided economic losses.
Both methods show that an annual incremental benefits ofthe proposed modernization (improving the status of NMHSand HMS delivery from ‘poor’ to an ‘adequate’) will be quitesubstantial for all the countries concerned. The repaymentperiod of investments in NMHS modernization will be withintwo to three years. The economic efficiency of the proposedmodernization (assumed to be accrued evenly over the seven-year period) ranges from 210 per cent for Armenia to 880 percent for Serbia assessed by the benchmarking method.Estimates based on sector-specific assessment show even morefavourable efficiency ranging from 500 per cent for Belarus andAlbania to 1,440 per cent for Azerbaijan. The variability of theresults between the two methods is smaller for the countrieswith better quality of data (Serbia, Belarus). Data in Kazakhstanhas proved insufficient to undertake a sectoral assessment.
The results of this study have been discussed at the nationalworkshops in the surveyed countries. The importance ofproposed approaches and preliminary results were confirmedby the HMS specialists, sectoral experts and governmental offi-cials. The participants expressed the opinion that the results ofeconomic assessment could be used for justifying adequatefinancial support of existing NMHS activities as well as forpotential NMHS modernization. Some participant countrieshave already embarked on preparation of large-scale NMHSmodernization programmes.
Being fully aware of the deficiencies of the proposedapproaches, we believe, nevertheless, that the proposed expressmethod of economic assessment and its preliminary findingscan be a useful tool both for the hydrometeorological servicesin positioning themselves as important public sector, and forthe national fiscal/economic authorities seeking rational justi-fication for better targeting its scarce resources.
5.Assessment Methodologies:Master spread 16/2/07 10:16 Page 188
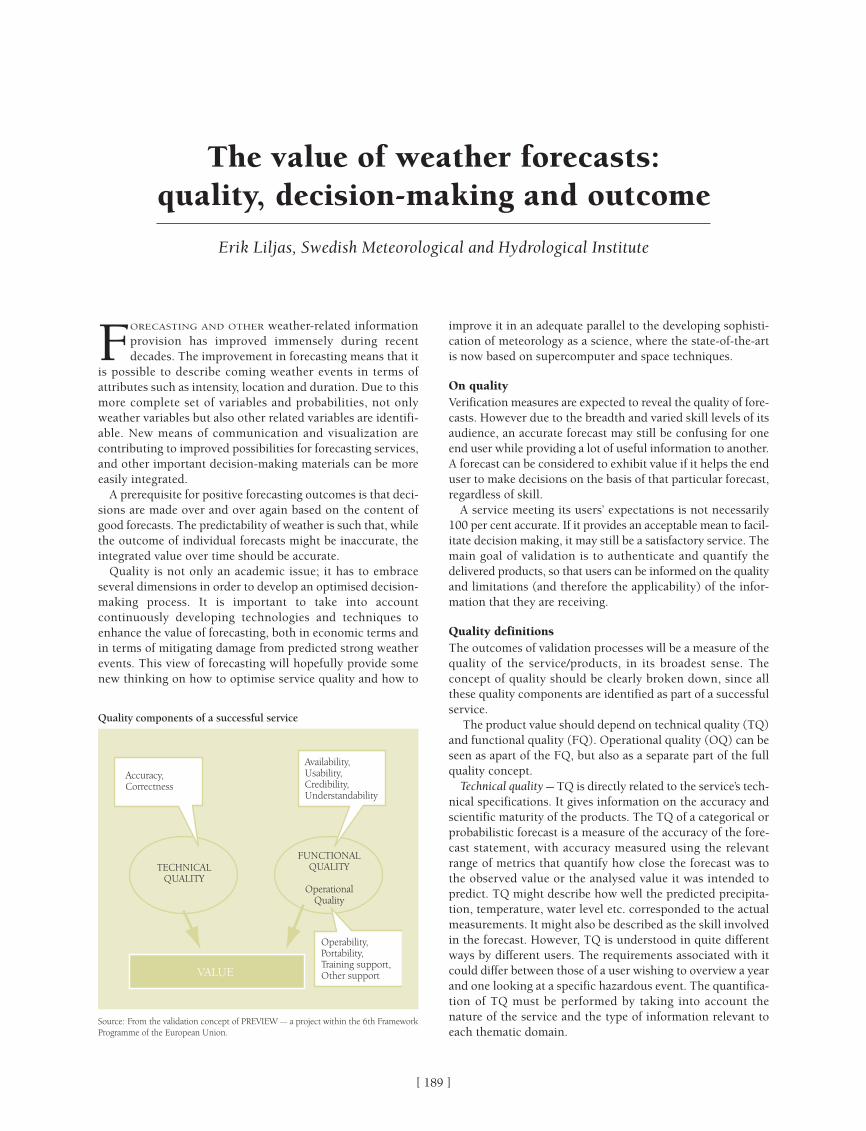
[ ]189
FORECASTING AND OTHER weather-related informationprovision has improved immensely during recentdecades. The improvement in forecasting means that it
is possible to describe coming weather events in terms ofattributes such as intensity, location and duration. Due to thismore complete set of variables and probabilities, not onlyweather variables but also other related variables are identifi-able. New means of communication and visualization arecontributing to improved possibilities for forecasting services,and other important decision-making materials can be moreeasily integrated.
A prerequisite for positive forecasting outcomes is that deci-sions are made over and over again based on the content ofgood forecasts. The predictability of weather is such that, whilethe outcome of individual forecasts might be inaccurate, theintegrated value over time should be accurate.
Quality is not only an academic issue; it has to embraceseveral dimensions in order to develop an optimised decision-making process. It is important to take into accountcontinuously developing technologies and techniques toenhance the value of forecasting, both in economic terms andin terms of mitigating damage from predicted strong weatherevents. This view of forecasting will hopefully provide somenew thinking on how to optimise service quality and how to
improve it in an adequate parallel to the developing sophisti-cation of meteorology as a science, where the state-of-the-artis now based on supercomputer and space techniques.
On qualityVerification measures are expected to reveal the quality of fore-casts. However due to the breadth and varied skill levels of itsaudience, an accurate forecast may still be confusing for oneend user while providing a lot of useful information to another.A forecast can be considered to exhibit value if it helps the enduser to make decisions on the basis of that particular forecast,regardless of skill.
A service meeting its users’ expectations is not necessarily100 per cent accurate. If it provides an acceptable mean to facil-itate decision making, it may still be a satisfactory service. Themain goal of validation is to authenticate and quantify thedelivered products, so that users can be informed on the qualityand limitations (and therefore the applicability) of the infor-mation that they are receiving.
Quality definitionsThe outcomes of validation processes will be a measure of thequality of the service/products, in its broadest sense. Theconcept of quality should be clearly broken down, since allthese quality components are identified as part of a successfulservice.
The product value should depend on technical quality (TQ)and functional quality (FQ). Operational quality (OQ) can beseen as apart of the FQ, but also as a separate part of the fullquality concept.
Technical quality – TQ is directly related to the service’s tech-nical specifications. It gives information on the accuracy andscientific maturity of the products. The TQ of a categorical orprobabilistic forecast is a measure of the accuracy of the fore-cast statement, with accuracy measured using the relevantrange of metrics that quantify how close the forecast was tothe observed value or the analysed value it was intended topredict. TQ might describe how well the predicted precipita-tion, temperature, water level etc. corresponded to the actualmeasurements. It might also be described as the skill involvedin the forecast. However, TQ is understood in quite differentways by different users. The requirements associated with itcould differ between those of a user wishing to overview a yearand one looking at a specific hazardous event. The quantifica-tion of TQ must be performed by taking into account thenature of the service and the type of information relevant toeach thematic domain.
The value of weather forecasts: quality, decision-making and outcome
Erik Liljas, Swedish Meteorological and Hydrological Institute
Quality components of a successful service
Source: From the validation concept of PREVIEW – a project within the 6th FrameworkProgramme of the European Union.
Accuracy,Correctness
TECHNICALQUALITY
FUNCTIONALQUALITY
OperationalQuality
Operability, Portability,Training support,Other support
Availability, Usability,Credibility,Understandability
VALUE
5.Assessment Methodologies:Master spread 16/2/07 10:16 Page 189

[ ]190
These technical-functional-operational dimensions arecomplementary and partially interwoven, and all have to becontinuously validated. Correctness, accuracy, functionality,reliability, efficiency and usability determine the total qualityfor an end user in an operational context.
Only when weather dependence is fully understood andthe relevant FQ is fully deployed will there be a direct corre-lation between TQ and outcome. We can then say thatweather-dependence has been transformed into weather-information-dependence.
Forecasting and other varieties of weather information haveimproved immensely during the last decades, even if tradi-tional verification shows only moderate improvements. Buthave the benefits followed the same trend? Yes, in somebranches where the weather-information-sensitivity is so highthat all quality aspects are immediately updated to maximizethe outcome. In other cases, the availability and immediacy ofinformation online has had the impact of prioritising simplis-tic data at the expense of more complex insights.
Too much high value information remains in temporary data-bases at meteorological institutes. Many institutes are certifiedaccording to the ISO 9001 manual and procedures. However,this is no guarantee that weather information is converted tosavings in terms of safety, economy or disaster mitigation. Thechain of processes has to be thoroughly investigated. Qualityaspects should improve in such a way that a direct link betweentechnical quality and outcome is possible. In parallel, the deci-sion-making process should focus on recognizing whatauxiliary information is needed to make optimal decisions.
The ideas presented here are mainly relevant for sophisticatedusers of weather information, but not only commercialcustomers. Civil protection authorities, local and central, areperhaps the most important targets for this enhanced qualityand decision making. The developing sophistication of meteo-rological science, where the state-of-the-art has supercomputersand space techniques as integral factors, also requires a morethorough look into the world of the users of our service. Thisis central for further stimulation, feedback, justification andfunds.
Functional quality – TQ is not a guarantee of FQ. Forexample, a perfect forecast that is communicated to the user toolate has zero functional quality although it is technicallycorrect. A less accurate forecast that is communicated to theuser early enough to allow protective action to reduce poten-tial losses, is technically less correct but functionally morevaluable. This example illustrates the fact that the distinctionbetween technical and functional quality is not academic, butreflects the real-time use of the forecasts.
FQ is mainly related to the ‘quality in use’ of the products:it includes both subjective judgment and understanding bythe user, and technical capabilities regarding service provi-sion.
The former is mostly user-centred, and can be defined as theusability of the service/product – that is, the extent to whicha product can be used by specified users to achieve specifiedgoals with effectiveness, efficiency and satisfaction in a contextof use. The latter globally identifies the context of use for theservice, encompassing the following parameters: availabilityof the service, frequency of delivery, means of delivery, perfor-mance, timeliness, understandability and learnability.
To sum up, FQ measures the efficiency of the service to meetthe users’ needs, resulting in user satisfaction and productiv-ity. It is directly related to the capability of the service to beunderstood, delivered and used in accordance with users’expectations.
Operational quality – Even if a service meets users’ expecta-tions (FQ) and the delivered products are technically/scientificallycorrect (TQ), it does not necessarily mean that its operationaldeployment satisfies the user. For example, if the service is notaccessible at the right time, if it is too often unavailable becauseof insufficient reliability, or if the user encounters too many prob-lems regarding training or user support for the service, then itwill not be useful in an operational sense.
OQ measures the capabilities required for a successful oper-ational deployment, such as reliability, operability, efficientsupport, maintenance, training, interoperability, security andportability. OQ also depends on TQ and FQ values, in the sensethat a zero TQ or a bad FQ would mean a poor OQ.
Shipping has to a great extent a well developed weather-information-sensitivity
Phot
o: S
MH
I im
age
arch
ive
5.Assessment Methodologies:Master spread 16/2/07 10:16 Page 190

[ ]191
The Congress,Noting:1. Resolution 23 (EC-XLII) – Guidelines on international
aspects of provision of basic and special meteorologi-cal services
2. Resolution 20 (EC-XLVI) –WMO policy on the exchangeof meteorological and related data and products
3. Resolution 21 (EC-XLVI) – Proposed new practice forthe exchange of meteorological and related data andproducts
4. Resolution 22 (EC-XLVI) – WMO guidelines oncommercial activities
5. The report to Twelfth Congress of the chairman of theExecutive Council Working Group on theCommercialization of Meteorological and HydrologicalServices, established at the request of Eleventh Congressby the Executive Council in Resolution 2 (EC-XLIII) –Working Group on the Commercialization ofMeteorological and Hydrological Services.
Recalling:1. The general policies of the Organization, as set down
in the Third WMO Long-term Plan (1992–2001)adopted by Eleventh Congress, which include, interalia, that Members should reaffirm their commitmentto the free and unrestricted international exchange ofbasic meteorological data and products, as defined inWMO Programmes (Third WMO Long-term Plan, PartI, Chapter 4, paragraph 127)
2. The concern expressed by Eleventh Congress thatcommercial meteorological activities had the potential
to undermine the free exchange of meteorological data andproducts between national Meteorological Services.
Considering:1. The continuing fundamental importance, for the provi-
sion of meteorological services in all countries, of the exchange of meteorological data and products betweenWMO Members’ national Meteorological orHydrometeorological Services (NMSs), WMCs, andRSMCs of the WWW Programme
2. Other programmes of world importance such asGCOS, GOOS, WCRP, and IGOSS, which are spon-sored and implemented in cooperation with otherinternational organizations
3. The basic role of WMO Members’ NMSs in further-ing applications of meteorology to all humanactivities,
4. The call by the world leaders at UNCED (Brazil, 1992)for increasing global commitment to exchange scien-tific data and analysis and for promoting access tostrengthened systematic observations
5. The provision in the UN/FCCC committing all Partiesto the Convention to promote and cooperate in thefull, open, and prompt exchange of information relatedto the climate system and climate change.
Recognizing:1. The increasing requirement for the global exchange of
all types of environmental data in addition to the estab-lished ongoing exchange of meteorological data andproducts under the auspices of the WWW
RESOLUTION 40 (CG-XII, 1995)
WMO policy and practice for the exchange of meteorological and relateddata and products including guidelines
on relationships in commercialmeteorological activities
Annexes
6.Annexes:UN198_212 16/2/07 11:02 Page 191

[ ]192
2. The basic responsibility of Members and their NMSs toprovide universal services in support of safety, securityand economic benefits for the peoples of their coun-tries
3. The dependence of Members and their NMSs on thestable, cooperative international exchange of meteo-rological and related data and products for dischargingtheir responsibilities
4. The continuing requirement for Governments to providefor the meteorological infrastructure of their countries,
5. The continuing need for, and benefits from, strengthen-ing the capabilities of NMSs, in particular in developingcountries, to improve the provision of services
6. The dependence of the research and educationcommunities on access to meteorological and relateddata and products
7. The right of Governments to choose the manner by,and the extent to, which they make data and productsavailable domestically or for international exchange.
Recognizing further:1. The existence of a trend towards the commercializa-
tion of many meteorological and hydrological activities,2. The requirement by some Members that their NMSs
initiate or increase their commercial activities3. The risk arising from commercialization to the estab-
lished system of free and unrestricted exchange of dataand products, which forms the basis for the WWW,and to global cooperation in meteorology
4. Both positive and negative impacts on the capacities,expertise and development of NMSs, and particularlythose of developing countries, from commercial oper-ations within their territories by the commercial sectorincluding the commercial activities of other NMSs.
Reminds Members of their obligations under Article 2 ofthe WMO Convention to facilitate worldwide cooperationin the establishment of observing networks and to promotethe exchange of meteorological and related information;and of the need to ensure stable ongoing commitment ofresources to meet this obligation in the common interest ofall nations;
Adopts the following policy on the international exchangeof meteorological and related data and products:
As a fundamental principle of the World MeteorologicalOrganization (WMO), and in consonance with the expand-ing requirements for its scientific and technical expertise,WMO commits itself to broadening and enhancing the freeand unrestricted1 international exchange of meteorologicaland related data and products;
Adopts the following practice on the internationalexchange of meteorological and related data and products:1. Members shall provide on a free and unrestricted basis
essential data and products which are necessary forthe provision of services in support of the protectionof life and property and the well-being of all nations,
particularly those basic data and products, as, at aminimum, described in Annex 1 to this resolution,required to describe and forecast accurately weatherand climate, and support WMO Programmes
2. Members should also provide the additional data andproducts which are required to sustain WMOProgrammes at the global, regional, and national levelsand, further, as agreed, to assist other Members in theprovision of meteorological services in their countries.While increasing the volume of data and productsavailable to all Members by providing these additionaldata and products, it is understood that WMOMembers may be justified in placing conditions on their re-export for commercial purposes outside of thereceiving country or group of countries forming a singleeconomic group, for reasons such as national laws orcosts of production
3. Members should provide to the research and educationcommunities, for their non-commercial activities, freeand unrestricted access to all data and productsexchanged under the auspices of WMO with the under-standing that their commercial activities are subject tothe same conditions identified in Adopts (2) above.
Stresses that all meteorological and related data and prod-ucts required to fulfil Members’ obligations under WMOprogrammes will be encompassed by the combination ofessential and additional data and products exchanged byMembers;
Urges Members to:1. Strengthen their commitment to the free and unre-
stricted exchange of meteorological and related dataand products
2. Increase the volume of data and products exchangedto meet the needs of WMO Programmes;
3. Assist other Members, to the extent possible, and asagreed, by providing additional data and products insupport of time-sensitive operations regarding severeweather warnings
4. Strengthen their commitments to the WMO and ICSUWDCs in their collection and supply of meteorologi-cal and related data and products on a free andunrestricted basis
5. Implement the practice on the international exchangeof meteorological and related data and products, asdescribed in Adopts (1) to (3) above
6. Make known to all Members, through the WMOSecretariat, those meteorological and related data andproducts which have conditions related to their re-exportfor commercial purposes outside of the receiving countryor group of countries forming a single economic group;
7. Make their best efforts to ensure that the conditionswhich have been applied by the originator of additionaldata and products are made known to initial andsubsequent recipients.
6.Annexes:UN198_212 16/2/07 11:02 Page 192

[ ]193
Further urges Members to comply with:1. The Guidelines for Relations among National
Meteorological or Hydrometeorological ServicesRegarding Commercial Activities as given in Annex 2to this resolution
2. The Guidelines for Relations between NationalMeteorological or Hydrometeorological Services and theCommercial Sector as given in Annex 3 to this resolution.
Invites Members to provide explanation of the WMO policy,practice, and guidelines to the commercial sector and otherappropriate agencies and organizations;
Requests the Executive Council to:1. Invite the president of CBS, in collaboration with the
other technical commissions as appropriate, to provideadvice and assistance on the technical aspects of imple-mentation of the practice
2. Invite the president of CHy to continue his work onthe issue of commercialization and the internationalexchange of hydrological data and products
3. Keep the implementation of this resolution underreview and report to Thirteenth Congress.
Requests the Secretary-General to:1. Keep Members informed on the impacts of commer-
cialization on WMO Programmes and to facilitate theexchange of relevant information on commercializa-tion among NMSs
2. Report on a timely basis to all Members on those mete-orological and related data and products on whichMembers have placed conditions related to their re-export for commercial purposes
3. Maintain effective coordination with IOC and otherinvolved international organizations in respect of jointprogrammes during WMO’s implementation of thepractice.
Decides to review the implementation of this resolution atThirteenth Congress.
ANNEX 1 TO RESOLUTION 40 (CG-XII)DATA AND PRODUCTS TO BE
EXCHANGED WITHOUT CHARGE AND
WITH NO CONDITIONS ON USE
PurposeThe purpose of this listing of meteorological and relateddata and products is to identify a minimum set of data andproducts which are essential to support WMO Programmesand which Members shall exchange without charge andwith no conditions on use. The meteorological and relateddata and products which are essential to support WMO
Programmes include, in general, the data from the RBSNsand as many data as possible that will assist in defining thestate of the atmosphere at least on a scale of the order of200 km in the horizontal and six to 12 hours in time.
Contents1. Six-hourly surface synoptic data from RBSNs, e.g. data
in SYNOP, BUFR or other general purpose WMO Code;2. All available in situ observations from the marine envi-
ronment, e.g. data in SHIP, BUOY, BATHY, TESACcodes, etc.
3. All available aircraft reports, e.g. data in AMDAR,AIREP codes, etc.
4. All available data from upper air sounding networks,e.g. data in TEMP, PILOT, TEMP SHIP, PILOT SHIPcodes etc.
5. All reports from the network of stations recommendedby the regional associations as necessary to provide agood representation of climate, e.g. data inCLIMAT/CLIMAT TEMP and CLIMAT SHIP/CLIMATTEMP SHIP codes, etc.
6. Products distributed by WMCs and RSMCs to meettheir WMO obligations
7. Severe weather warnings and advisories for the protec-tion of life and property targeted upon end-users;
8. Those data and products from operational meteoro-logical satellites that are agreed between WMO andsatellite operators. (These should include data andproducts necessary for operations regarding severeweather warnings and tropical cyclone warnings).
ANNEX 2 TO RESOLUTION 40 (CG-XII)GUIDELINES FOR RELATIONS AMONG
NATIONAL METEOROLOGICAL OR
HYDROMETEOROLOGICAL SERVICES (NMHS)REGARDING COMMERCIAL ACTIVITIES
PurposeThe purpose of these guidelines is to maintain andstrengthen in the public interest the cooperative andsupportive relations among NMSs in the face of differingnational approaches to the growth of commercial meteo-rological activities.
GuidelinesIn order to ensure the maintenance of the internationalexchange of data and products among WMO Members,and to develop the applications of meteorology, whileadapting to the new challenge from the growth of commer-cial meteorological activities:1. NMSs should provide the first point of receipt within
a country for WWW data and products, in order to
6.Annexes:UN198_212 16/2/07 11:02 Page 193

[ ]194
have complete and timely access to all the informationnecessary for the production of weather forecasts andwarnings and other meteorological/climatologicalservices necessary for the protection of life and prop-erty and other public interest responsibilities entrustedto the NMSs and without prejudice to the national lawsof their territory of location
2. NMSs should make their best efforts to ensure that theconditions which have been applied by the originatorof additional data and products3 are made known toinitial and subsequent recipients
3. In the case where conditions accompanying theexchange of additional data and products are not honoured, the originating NMS may take appropriateactions including denial of access of these additionaldata and products to the receiving Member
4. NMSs may export NWP regional model productsemploying additional data and products for commer-cial purposes outside the country of the Memberrunning the model, unless objected to by an affectedMember. Every effort should be made to coordinatethe provision of such services prior to implementationto avoid possible harm to other Members
5. NMSs may distribute and export products from globalNWP models without regard to conditions whichwere attached to the original data used in the models
6. Services or products whose construction would suffersignificant degradation by removal of the additionaldata or products and from which the additional dataand/or products can be retrieved easily, or their usecan be identified unambiguously, should carry thesame conditions on their re-export for commercialpurposes as those additional data or products
7. An NMS receiving a request from a local client forservice that it cannot fulfil may seek assistance fromanother NMS with the capacity to provide it. Whereappropriate to enhance the free and unrestrictedexchange of data and products among WMOMembers, the service should as far as possible be madeavailable through the offices of the NMS of the countrywithin which the client is located
8. Similarly, unless other arrangements have been agreedto, an NMS receiving a request to provide service inanother country should refer the request back to theNMS in that country, i.e. to the local NMS. In the eventthat the local NMS is unable to provide the service forlack of facilities or other legitimate reasons, the exter-nal NMS may seek to establish a collaborativearrangement with the local NMS to provide the service
9. Where the service originated by one NMS is likely toaffect other Members (e.g. in the provision of regionalbroadcasts of meteorological information or the widedistribution of seasonal or climate forecasts), the NMSoriginating the service should seek, well in advance,and take into account the response of the NMSs of theaffected Members, to the extent possible
10. NMSs should, to the extent possible, refrain fromusing basic WWW data and products received fromother countries in ways which jeopardize the perfor-mance of the public interest responsibilities of theoriginating NMSs within their own countries. If anNMS finds that, in the undertaking of its public inter-est responsibilities it is affected adversely by a publicor private organization in another country, it may warnthe NMS in the country from which the organizationis deriving the data and products. The latter NMSshould consider measures to mitigate these adverseeffects and take those actions appropriate under itsnational laws
11. NMSs with experience in commercial activities shouldmake their expertise available, on request, to otherNMSs, especially NMSs of developing countries,through the WMO Secretariat and bilaterally, andprovide relevant documentation, seminars and trainingprogrammes to developing countries, on request, onthe same financial basis as other WMO education andtraining courses are provided.
In implementing these guidelines, NMSs should take intoaccount and, as far as possible, respect the different legal,administrative, and funding frameworks which govern thepractices of NMSs in other countries or group of countriesforming a single economic group. NMSs should, in partic-ular, note that other NMSs will be bound by their ownnational laws and regulations regarding any trade restric-tive practices. Furthermore, where a group of countriesform a single economic group, the internal laws and regu-lations appropriate to that group shall, for all internalgroup activities, take precedence over any conflictingguidelines.
ANNEX 3 TO RESOLUTION 40 (CG-XII)GUIDELINES FOR RELATIONS BETWEEN
NATIONAL METEOROLOGICAL OR
HYDROMETEOROLOGICAL SERVICES (NMHS)AND THE COMMERCIAL SECTOR
PurposeThe purpose of these guidelines is to further improve therelationship between NMSs and the commercial sector. Thedevelopment of the exchange of meteorological and relatedinformation depends greatly upon sound, fair, transparent,and stable relations between these two sectors.
GuidelinesThese guidelines apply to the commercial sector engaged inmeteorological activities, which includes government orga-nizations engaged in commercial meteorological activities.
6.Annexes:UN198_212 16/2/07 11:02 Page 194
[ ]195
In order to enhance the relationship between the twosectors:1. In the common interest, the commercial sector is urged
to respect the international data exchange principlesof the WWW and other WMO Programmes
2. The commercial sector is urged to recognize andacknowledge the essential contribution of NMSs andof WMO to the activities of the commercial sector.NMSs and the commercial sector are urged to recog-nize the interdependence and mutual benefit possiblefrom cooperative interaction
3. In the case where the NMS of a country, particularly ofa developing country, were to consider itself affected bythe commercial sector’s commercial use of data originated in its own country, all parties involved shallundertake negotiations to achieve appropriate andsatisfactory agreements
4. Unless authorized to do so by the relevant Member,commercial sector providers of meteorologicalservices should not publicly issue warnings and fore-casts relevant to the safety of life and property in thecountry or maritime area where they operate.Warnings and forecasts relevant to the safety of lifeand property publicly issued by the commercialsector should be consistent with those originated byNMSs or by other official originators in the courseof the performance of their public service responsi-bilities
5. In providing services, the commercial sector should beencouraged to employ meteorological terminologyconsistent with established national and internationalpractice
6. Commercial sector providers of meteorologicalservices should respect the sovereignty and rules andregulations of the countries in which they deliverservices;
7. NMSs are encouraged to discuss with their countries’meteorological community and professional societiesthe issues associated with the international activitiesof the commercial sector
8. NMSs are encouraged to collaborate with their coun-tries’ commercial sector and their professional societiesto maximize the use of meteorological informationwithin their country.
ANNEX 4 TO RESOLUTION 40 (CG-XII)DEFINITIONS OF TERMS IN THE PRACTICE AND
GUIDELINES
PracticeSpecifications for the classification of, and the conditionsattached to, the use of data and products exchanged amongWMO Members.
Re-exportRedistribute, physically or electronically, outside the receiv-ing country or group of countries forming a single economicgroup, directly or through a third party.
For commercial purposesFor recompense beyond the incremental cost of reproduc-tion and delivery.
Commercial sectorGovernmental or non-governmental organizations or indi-viduals operating for commercial purposes.
Meteorological and related data and productsGeophysical (meteorological, oceanographic, etc.) obser-vational data and products developed from these dataacquired and/or produced by Members to support WMOProgramme requirements.
Notes:1. Meteorological and related data and products are
considered to include climatological data and products2. Hydrological data and products, at this stage, are not
included in the application of the practice3. Aeronautical information generated specifically to serve
the needs of aviation and controlled under theConvention on International Civil Aviation (Chicago,1944) is not included in the application of the practice.
Free and unrestrictedNon-discriminatory and without charge (Resolution 23(EC-XLII) – Guidelines on international aspects of provi-sion of basic and special meteorological services. “Withoutcharge”, in the context of this resolution means at no morethan the cost of reproduction and delivery, without chargefor the data and products themselves.
Research and education communitiesResearchers, teachers and students in academic andresearch institutions, in other research institutions withingovernmental and non-governmental organizations, andthese institutions themselves, as provided for in nationallaws and regulations.
6.Annexes:UN198_212 16/2/07 11:02 Page 195

[ ]196
The Congress,Noting:1. Resolution 40 (Cg-XII) – WMO policy and practice for
the exchange of meteorological and related data andproducts including guidelines on relationships incommercial meteorological activities
2. The inclusion of dedicated observations of the climatesystem, including hydrological phenomena, as one ofthe four main thrusts of The Climate Agenda, whichwas endorsed by Twelfth Congress
3. That Technical Regulation [D.1.1] 8.3.1(k), states that,in general, the routine functions of national HydrologicalServices (NHSs) should include, inter alia, “making thedata accessible to users, when, where and in the formthey require” and that the Technical Regulations alsocontain a consolidated list of data and product require-ments to support all WMO Programmes
4. That the nineteenth Special Session of the United NationsGeneral Assembly agreed, in its overall review andappraisal of the implementation of Agenda 21, that thereis an urgent need to “... foster regional and internationalcooperation for information dissemination and exchangethrough cooperative approaches among United Nationsinstitutions, …” (A/RES/S-19/2, paragraph 34(f))
5. That the fifty-first session of the United Nations GeneralAssembly adopted, by resolution 51/229, theConvention on the Law of the Non-navigational Usesof International Watercourses, Article 9 of whichprovides for “regular exchange of data and information”
6. That the Intergovernmental Council of theInternational Hydrological Programme of the UnitedNations Educational, Scientific and CulturalOrganization (UNESCO) adopted at its twelfth sessionResolution XII-4 which dealt with the exchange ofhydrological data and information needed for researchat the regional and international levels.
Considering:1. The significance attached by the International
Conference on Water and the Environment (ICWE)(Dublin, 1992) to extending the knowledge base onwater and enhancing the capacity of water sectorspecialists to implement all aspects of integrated waterresources management
2. The call of world leaders at the United NationsConference on Environment and Development(UNCED) (Rio de Janeiro, 1992) for a significantstrengthening of, and capacity building in, waterresources assessment, for increasing global commitmentto exchange scientific data and analyses and for promot-ing access to strengthened systematic observations
3. That the United Nations Commission on SustainableDevelopment (CSD) in its Decision 6/1 “StrategicApproaches to Freshwater Management” has stronglyencouraged States to promote the exchange anddissemination of water-related data and information,and has recognized “the need for periodic assessments… for a global picture of the state of freshwaterresources and potential problems”
4. The call by the nineteenth Special Session of theUnited Nations General Assembly “for the highestpriority to be given to the serious freshwater problemsfacing many regions, especially in the developingworld” and the “urgent need … to strengthen the capa-bility of Governments and international institutions tocollect and manage information … and environmentaldata, in order to facilitate the integrated assessmentand management of water resources”
5. The requirements for full, open and prompt exchangeof hydrological data and products in support of variousinternational conventions, such as the Convention onBiological Diversity, the United Nations FrameworkConvention on Climate Change, and the Conventionto Combat Desertification
6. The requirement for the global exchange of hydrolog-ical information in support of scientific investigationsof world importance such as those on global changeand the global hydrological cycle, and as a contribu-tion to relevant programmes and projects of WMO,other United Nations agencies, the InternationalCouncil for Science (ICSU) and other organizations ofequivalent status
7. The opportunities for more efficient management ofwater resources and the need for cooperation in miti-gating water-related hazards in transboundary riverbasins and their water bodies which depend on theinternational exchange of hydrological data and infor-mation
RESOLUTION 25 (CG-XIII, 1999)
Exchange of hydrological data and products
6.Annexes:UN198_212 16/2/07 11:02 Page 196

[ ]197
8. The increasing recognition through scientific and tech-nical endeavours, such as the Global Energy and WaterCycle Experiment (GEWEX), of the importance ofhydrological data and products in improving theunderstanding of meteorological processes and subse-quently the accuracy of meteorological products.
Recognizing:1. The responsibility of Members and their NHSs to
provide for the security and well-being of the people oftheir countries, through mitigation of water-relatedhazards and sustainable management of water resources
2. The potential benefits of enhanced exchange of hydro-logical data and information within shared river basinsand aquifers, based on agreements between theMembers concerned
3. The continuing need for strengthening the capabilitiesof NHSs, particularly in developing countries,
4. The right of Governments to choose the manner bywhich, and the extent to which, they make hydrologi-cal data and products available domestically andinternationally
5. The right of Governments also to choose the extent towhich they make available internationally data whichare vital to national defense and security. Nevertheless,Members shall cooperate in good faith with otherMembers with a view to providing as much data aspossible under the circumstances
6. The requirement by some Members that their NHSsearn revenue from users, and/or adopt commercialpractices in managing their businesses
7. The long-established provision of some hydrologicalproducts and services on a commercial basis and in acompetitive environment, and the impacts, both posi-tive and negative, associated with such arrangements.
Adopts a stand of committing to broadening and enhancing,whenever possible, the free and unrestricted1 internationalexchange2 of hydrological data and products, in consonancewith the requirements for WMO’s scientific and technicalprogrammes;
Further adopts the following practice on the internationalexchange of hydrological information:1. Members shall provide on a free and unrestricted basis
those hydrological data and products which are neces-sary for the provision of services in support of theprotection of life and property and for the well-being ofall peoples
2. Members should also provide additional hydrological dataand products, where available, which are required tosustain programmes and projects of WMO, other UnitedNations agencies, ICSU and other organizations of equiv-alent status, related to operational hydrology and waterresources research at the global, regional and nationallevels and, furthermore, to assist other Members in theprovision of hydrological services in their countries
3. Members should provide to the research and educa-tion communities, for their non-commercial activities,free and unrestricted access to all hydrological dataand products exchanged under the auspices of WMO
4. Respecting (2) and (3) above, Members may placeconditions on the re-export3, for commercial purposes,of these hydrological data and products, outside thereceiving country or group of countries forming a singleeconomic group
5. Members should make known to all Members, throughthe WMO Secretariat, those hydrological data andproducts which have such conditions as in (4) above;
6. Members should make their best efforts to ensure thatthe conditions placed by the originator on the addi-tional hydrological data and products are made knownto initial and subsequent recipients
7. Members shall ensure that the exchange of hydrolog-ical data and products under this resolution isconsistent with the application of Resolution 40 (Cg-XII) — WMO policy and practice for the exchange ofmeteorological and related data and products includ-ing guidelines on relationships in commercialmeteorological activities.
Urges Members, in respect of the operational and scientificuse of hydrological data and products, to:1. Make their best efforts to implement the practice on
the international exchange of hydrological data andproducts, as described in Further adopts (1) to (7)
2. Assist other Members, to the extent possible, and asagreed upon, in developing their capacity to implementthe practice described in Further adopts (1) to (7).
Requests the Executive Council to:1. Invite the Commission for Hydrology to provide advice
and assistance on technical aspects of the implemen-tation of the practice on the international exchange ofhydrological data and products
2. Keep the implementation of this resolution underreview and report to Fourteenth Congress.
Decides to review the implementation of this resolution atFourteenth Congress.
6.Annexes:UN198_212 16/2/07 11:02 Page 197

[ ]198
Key social and economic drivers1. Governments are striving to improve the well-being of
their citizens. Population growth, reducing poverty,water security, food security, increasing prosperity,and improving public health, safety and security arekey drivers. To deal with these issues, governmentshave to develop and implement effective policy, andpromote fundamental tenets of societal and environ-mental governance. However, as regards theenvironment, it is common knowledge that we arechallenged by our natural environment, made worseby changes in the climate, which threatens thesustainable development of human societies throughextreme weather events causing disasters, reducedfood security, reduced availability of uncontaminatedfreshwater, and the rise and spread of diseases. Thisis further compounded by growing urbanization andthe expansion of human habitation into previouslyunoccupied places, such as arid zones, mountainslopes, flood plains and the sea’s edge. These areexposing populations to air and waterborne diseases,heat stress, drought, landslides, floods, storm surgesand tsunamis
2. The safety of life and protection of property is impor-tant for all countries but especially for the sustainabilityof emerging economies. These countries are highlyvulnerable to natural disasters, which can wipe out 10to 15 per cent of a developing nation’s gross domesticproduct. Only with a clear understanding of the poten-tial threats, advanced warning, and adequate disasterreduction and mitigation efforts can we properlyprotect our societies
3. These are issues that must be dealt with if the globalcommunity is to attain the targets set through the2000 Millennium Declaration, which are also high-lighted by the 2002 Johannesburg Plan ofImplementation of the World Summit on SustainableDevelopment.
The role of National Meteorological andHydrological Services4. As has been the case since the beginning of the modern
era of societal and environmental management, knowledge of weather and climate is key to all aspects ofhuman endeavours. It is within this framework thatNational Meteorological and Hydrological Services(NMHSs) in various countries have been well posi-tioned to identify and deal with a wide range ofweather-, climate- and water-related issues that affecthuman life and socio-economic development. Forexample, with regard to natural hazards, NMHSs havebeen tasked to sensitize the population to theirimpacts, and to provide warnings of individual events,to save lives, to sustain productivity, and to reducedamage to property
5. NMHSs constitute the single authoritative voice onweather warnings in their respective countries, andin many they are also responsible for climate, airquality, seismic and tsunami warnings. To reduce andmitigate disasters requires well prepared NMHSs aswell as governments and populations to take appro-priate action in response to warnings. NMHSs, withinthe framework of the World MeteorologicalOrganization (WMO), are working to help govern-ments improve decision-making to enablepopulations to adapt to climate change, mitigatenatural hazards and sustain development. By helpinggovernments and the people to avert potential disas-ters, NMHSs are a fundamental component of therisk management infrastructure of countries in theirnation-building endeavours and, indeed, a contribu-tor to sustainable development, particularly thepoverty alleviation effort. NMHSs are workingtogether to implement the WMO Multi-hazardPrevention Strategy, which aims to reduce by 50 percent over the decade 2010-2019 the number of fatal-ities caused by meteorological-, hydrological- and
EC STATEMENT ON THE ROLE AND OPERATION
OF NMHS FOR DECISION MAKERS (EC-LVII, 2005)
Executive council statement on the role and operation of nationalmeteorological and hydrolological
services for decision-makers
6.Annexes:UN198_212 16/2/07 11:02 Page 198

[ ]199
climate-related natural disasters compared with the10-year average fatalities of 1995-2004
6. NMHSs are continuously monitoring the environmentthrough observations of the Earth system and predict-ing changes in this system. They provide governmentswith timely and precise warnings of most potentialnatural hazards and contribute essential environmen-tal information and services for urban planning, sustainable energy development, access to freshwater,and food production
7. Cooperation between various organizations is essentialto provide governments with these services.Partnerships between NMHSs and academia, govern-ment departments, international and non-governmentalorganizations, and where appropriate and possible, theprivate sector, help society make better decisions basedon more complete and accurate weather, water andclimate information. These partnerships provide betterdata coverage and information processing, higher reso-lution models, and more precise and useful specializedproducts for societal benefits, including opportunitiesto provide better support to governments and otherdecision makers regarding safety, economy and secu-rity. NMHSs are encouraging these partnerships byadopting open and unrestricted data policies whichmake their information easy to access in real time, inuseful forms, and at low cost.
Future requirements8. In the year 2000, through the internationally-agreed
development goals, including those contained withinthe Millennium Declaration, the international commu-nity set forth specific targets to be reached by 2015.To ensure that these goals are met, it is essential thatgovernments take advantage of the myriad advancesin science and technology provided by NMHSs andtheir partners, that include the provision of multi-hazard warnings and related services, 24 hours a day,seven days a week for 365 days a year, which whenproperly applied can provide societies with the under-pinning information to reduce and mitigate naturaldisasters. International cooperation is essential, bothbetween countries and within the larger UnitedNations framework
9. Access to good communication ensures that infor-mation is available wherever it is needed.Governments must recognize the importance ofcontinuous monitoring of the environment and theability of their NMHSs to provide timely and accu-rate information to support critical decisions.Governments should sustain the NMHSs and theirmodernization and development
10. It is essential that societies be prepared to act appro-priately in response to warnings. Education and trainingis paramount for improvement of preparedness. Earlywarning systems for natural hazards work only if
governments and their public know how to respond.Information must be easy to understand and use
11. Climate change requires societies to understand andassess impacts and to develop the necessary adapta-tion strategies. By providing fundamental knowledge ofthe climate system and predictions based on climatemodels, NMHSs can help societies transform
12. To be completely effective, NMHSs and their interna-tional network, coordinated through the WMO, mustbe recognized as critical partners in societies’ goal toreduce poverty and increase the prosperity of theworld’s citizens.
6.Annexes:UN198_212 16/2/07 11:02 Page 199

[ ]200
WE, THE DELEGATES from 170 Member States andTerritories of the World MeteorologicalOrganization (WMO), meeting in Geneva from 4
to 26 May 1999 at the Thirteenth World MeteorologicalCongress, declare as follows:
We note that the United Nations General Assembly, theEconomic and Social Council and the regional economic andsocial commissions have appealed to WMO to contribute,within its field of competence, to the action taken at the inter-national, regional and national levels to promote and supportsustainable development, especially activities pertinent toweather- and climate-related natural disasters, climate changeand the protection of the environment.
We further note the contributions already made by, andthrough, WMO in response to the above appeal, particularlythrough the global ensemble of national Meteorological andHydrometeorological Services which is crucial to internationalstrategies for the protection of the global environment suchas in addressing climate change and stratospheric ozonedepletion issues, among others.
We recognize the importance of a unique and integratedinternational system for the observation, collection, process-ing and dissemination of meteorological and related data andproducts, implemented within the framework of WMO’sWorld Weather Watch.
We are aware of the need to ensure the appropriate imple-mentation of the letter and spirit of Resolution 40 adopted bythe Twelfth World Meteorological Congress on the “WMOpolicy and practice for the international exchange of meteoro-logical and related data and products, including guidelines onrelationships in commercial meteorological activities”.
We appeal to all Governments to ensure that the nationalpractices in force in their countries, especially through theirnational Meteorological and Hydrometeorological Services,conform with the above referred policy, practice and guide-lines for the international exchange of meteorological andrelated data and products.
We reaffirm the vital importance of the mission of thenational Meteorological and Hydrometeorological Services inobserving and understanding weather and climate and inproviding meteorological and related services in support ofnational needs. This mission may be expressed as a contri-bution to national needs in the following areas:(a) Protection of life and property(b) Safeguarding the environment(c) Contributing to sustainable development
(d) Ensuring continuity of the observations of meteorologi-cal and related data including climatological data
(e) Promotion of endogenous capacity building(f) Meeting international commitments(g) Contributing to international cooperation.
We are cognizant that, weather and climate systems do not recog-nize political borders and are continuously interacting. Hence,no one country can be fully self-reliant in meeting all of itsrequirements for meteorological services and countries need towork together in a spirit of mutual assistance and cooperation.
We express deep concern about the potential impacts on theprovision of meteorological services worldwide of any develop-ment which endangers the unique and integrated internationalsystem for obtaining and exchanging meteorological and relateddata and products; a system which has benefited the globalcommunity for over 100 years. These developments canadversely affect the effective and efficient provision of appro-priate meteorological data, information, products and servicesas well as the role and operation of national Meteorological andHydrometeorological Services, resulting in unfavourable impactson national economies, the environment, the well being ofpeoples and the whole world community.
We recognize that it is for the various stakeholders in eachcountry, in full awareness of their country’s national goals,requirements, resources and aspirations to evaluate anddecide on a country-specific strategy for future provision ofmeteorological and related services and to find the greatestpossible harmony between the principle of their nationalsovereignty and their international obligations under theWMO Convention and other related environmental treatiesand agreements.
We urge that whatever form or model the nationalMeteorological and Hydrometeorological Services take, govern-ment financial support be provided to operate and maintainthe required relevant basic infrastructure, monitoring andservices in the national and global public interest, and thatsuch support be strengthened where needed.
We call on all Governments to give due consideration to thestatements expressed in this Declaration. We believe that thiswill be in the interest of sustainable development, in support ofnational economies and social progress; and that this contributessignificantly to the reduction of loss of life and property causedby natural disasters and other catastrophic events, as well as tosafeguard the environment and the global climate for presentand future generations of humankind.
GENEVA DECLARATION (CG-XIII, 1999)
Geneva declaration of the ThirteenthWorld Meteorological Congress
6.Annexes:UN198_212 16/2/07 11:02 Page 200
[ ]201
IntroductionFor thousands of years people have sought to modifyweather and climate so as to augment water resources andmitigate severe weather. The modern technology ofweather modification was launched by the discovery inthe late 1940s that supercooled cloud droplets could beconverted to ice crystals by insertion of a cooling agentsuch as dry ice or an artificial ice nucleus such as silveriodide. Over 50 years of subsequent research have greatlyenhanced our knowledge about the microphysics, dynam-ics and precipitation processes of natural clouds (rain,hail, snow) and the impacts of human interventions onthose processes.
Currently, there are dozens of nations operating morethan 100 weather modification projects, particularly in aridand semi-arid regions all over the world, where the lack ofsufficient water resources limits their ability to meet food,fibre, and energy demands. The purpose of this documentis to present a review of the status of weather modification.
The energy involved in weather systems is so large thatit is impossible to create artificially rainstorms or to alterwind patterns to bring water vapour into a region. The mostrealistic approach to modifying weather is to take advan-tage of microphysical sensitivities wherein a relatively smallhuman-induced disturbance in the system can substantiallyalter the natural evolution of atmospheric processes.
The ability to influence cloud microstructures has beendemonstrated in the laboratory, simulated in numericalmodels, and verified through physical measurements insome natural systems such as fogs, layer clouds andcumulus clouds. However, direct physical evidence thatprecipitation, hail, lightning, or winds can be significantlymodified by artificial means is limited.
The complexity and variability of clouds result in greatdifficulties in understanding and detecting the effects ofattempts to modify them artificially. As knowledge of cloudphysics and statistics and their application to weathermodification has increased, new assessment criteria haveevolved for evaluating cloud-seeding experiments. Thedevelopment of new equipment – such as aircraft plat-forms with microphysical and air-motion measuringsystems, radar (including Doppler and polarization capa-bility), satellites, microwave radiometers, wind profilers,automated raingauge networks, mesoscale networkstations – has introduced a new dimension. Equally
important are the advances in computer systems thatpermit large quantities of data to be processed. Newdatasets, used in conjunction with increasingly sophisti-cated numerical cloud models, help in testing variousweather modification hypotheses.
Chemical and chaff tracer studies help to identify airflowin and out of clouds and the source of ice or hygroscopicnucleation as the seeding agent. With some of these newfacilities, a better climatology of clouds and precipitationcan be prepared to test seeding hypotheses prior to thecommencement of weather modification projects.
If one were able to predict precisely the precipitationfrom a cloud system, it would be a simple matter to detectthe effect of artificial cloud seeding on that system.
The expected effects of seeding, however, are almostalways within the range of natural variability (low signal-to-noise ratio) and our ability to predict the naturalbehaviour is still limited.
Comparison of precipitation observed during seededperiods with that during historical periods presents prob-lems because of climatic and other changes from one periodto another, and therefore is not a reliable technique. Thissituation has been made even more difficult with themounting evidence that climate change may lead to changesin global precipitation amounts as well as to spatial redis-tribution of precipitation.
In currently accepted evaluation practice, randomisationmethods (target/control, crossover or single area) areconsidered most reliable for detecting cloud-seeding effects.Such randomized tests require a number of cases readilycalculated on the basis of the natural variability of theprecipitation and the magnitude of the expected effect. Inthe case of very low signal-to-noise ratios, experiment dura-tions in the range of five to over 10 years may be required.Whenever a statistical evaluation is required to establishthat a significant change resulted from a given seeding activ-ity, it must be accompanied by a physical evaluation to:(a) Confirm that the statistically-observed change is likely
due to the seeding(b) Determine the capabilities of the seeding method to
produce the desired effects under various conditions.
The effect of natural precipitation variability on the requiredlength of an experiment can be reduced through theemployment of physical predictors, which are effective in
WMO STATEMENT ON WEATHER MODIFICATION (EC-LIII, 2001)
WMO statement on the status of weather modification
6.Annexes:UN198_212 16/2/07 11:02 Page 201

[ ]202
direct proportion to our understanding of the phenome-non. The search for physical predictors, therefore, holds ahigh priority in weather modification research. Physicalpredictors may consist of meteorological parameters (suchas stability, wind directions, pressure gradients) or cloudquantities (such as liquid water content, updraught speeds,concentrations of large drops, ice-crystal concentration orradar reflectivity).
Objective measurement techniques of precipitation quan-tities are to be preferred for testing weather modificationmethods. These include both direct ground measurements(e.g. raingauges and hail pads) and remote sensing tech-niques (e.g. radar, satellite). Secondary sources, such asinsurance data (as have in the past been employed to showchanges in hail intensity) are, at least by themselves, notheld to be satisfactory in most situations.
Operational programmes should be conducted withrecognition of the risks inherent in a technology which isnot totally developed. For example, it should not be ignoredthat, under certain conditions, seeding may cause morehail or reduce precipitation. However, properly designedand conducted operational projects seek to detect and mini-mize such adverse effects. Therefore, weather modificationmanagers are encouraged to add scientifically-accepted eval-uation methodologies to be undertaken by expertsindependent of the operators.
Brief summaries of the current status of weather modifi-cation are given in the following sections. These summarieswere restricted to weather modification activities thatappear to be based on acceptable physical principles andwhich have been tested in the field.
Fog dispersalDifferent techniques are being used to disperse warm (i.e.at temperatures greater than 0°C) and cold fogs. The rela-tive occurrence of warm and cold fogs is geographically andseasonally dependent.
The thermal technique, which employs intense heatsources (such as jet engines) to warm the air directly andevaporate the fog, has been shown to be effective for shortperiods for dispersal of some types of warm fogs. Thesesystems are expensive to install and to use.
Another technique that has been used is to promoteentrainment of dry air into the fog by the use of hoveringhelicopters or ground-based engines. These techniques arealso expensive for routine use.
To clear warm fogs, seeding with hygroscopic materialshas also been attempted. An increase in visibility is some-times observed in such experiments, but the manner andlocation of the seeding and the size distribution of seedingmaterial are critical and difficult to specify. In practice, thetechnique is seldom as effective as models suggest. Onlyhygroscopic agents should be used that pose no environ-mental and health problems.
Cold (supercooled) fog can be dissipated by growth andsedimentation of ice crystals. This may be induced with high
reliability by seeding the fog with artificial ice nuclei fromground-based or airborne systems. This technique is in oper-ational use at several airports and highways where there isa relatively high incidence of supercooled fog. Suitable tech-niques are dependent upon wind, temperature and otherfactors. Dry ice has commonly been used in airbornesystems. Other systems employ rapid expansion ofcompressed gas to cool the air enough to form ice crystals.For example, at a few airports and highway locations, liquidnitrogen or carbon dioxide is being used in ground-basedsystems. A new technique, which has been demonstratedin limited trials, makes use of dry ice blasting to create icecrystals and promote rapid mixing within the fog. Becausethe effects of this type of seeding are easily measured and theresults are highly predictable, randomized statistical verifi-cation generally has been considered unnecessary.
Precipitation (rain and snow) enhancementThis section deals with those precipitation enhancementtechniques that have a scientific basis and that have beenthe subject of research. Other non-scientific and unproventechniques that are presented from time to time should betreated with the required suspicion and caution.
Orographic mixed-phase cloud systemsIn our present state of knowledge, it is considered that theglaciogenic seeding of clouds formed by air flowing overmountains offers the best prospects for increasing precip-itation in an economically-viable manner. These types ofclouds attracted great interest in their modification becauseof their potential in terms of water management, i.e. thepossibility of storing water in reservoirs or in the snowpackat higher elevations. There is statistical evidence that, undercertain conditions, precipitation from supercooledorographic clouds can be increased with existing tech-niques. Statistical analyses of surface precipitation recordsfrom some long-term projects indicate that seasonalincreases have been realized.
Physical studies using new observational tools andsupported by numerical modelling indicate that super-cooled liquid water exists in amounts sufficient to producethe observed precipitation increases and could be tappedif proper seeding technologies were applied. The processesculminating in increased precipitation have also beendirectly observed during seeding experiments conductedover limited spatial and temporal domains. While suchobservations further support the results of statistical analy-ses, they have, to date, been of limited scope. The causeand effect relationships have not been fully documented,and thus the economic impact of the increases cannot beassessed.
This does not imply that the problem of precipitationenhancement in such situations is solved. Much workremains to be done to strengthen the results and producestronger statistical and physical evidence that theincreases occurred over the target area and over a
6.Annexes:UN198_212 16/2/07 11:02 Page 202

[ ]203
prolonged period of time, as well as to search for the exis-tence of any extra-area effects. Existing methods shouldbe improved in the identification of seeding opportuni-ties and the times and situations in which it is notadvisable to seed, thus optimizing the technique andquantifying the result.
Also, it should be recognized that the successful conductof an experiment or operation is a difficult task that requiresqualified scientists and operational personnel. It is difficultand expensive to fly aircraft safely in supercooled regionsof clouds. It is also difficult to target the seeding agent fromground generators or from broad-scale seeding by aircraftupwind of an orographic cloud system.
Stratiform cloudsThe seeding of cold stratiform clouds began the modernera of weather modification. Shallow stratiform clouds canbe under certain conditions made to precipitate, oftenresulting in clearing skies in the region of seeding. Deepstratiform cloud systems (but still with cloud tops warmerthan –20°C) associated with cyclones and fronts producesignificant amounts of precipitation. A number of fieldexperiments and numerical simulations have shown thepresence of supercooled water in some regions of theseclouds and there is some evidence that precipitation canbe increased.
Cumuliform cloudsIn many regions of the world, cumuliform clouds are themain precipitation producers. These clouds (from small fairweather cumulus to giant thunderclouds) are characterizedby strong vertical velocities with high condensation rates.They can hold the largest condensed water contents of allcloud types and can yield the highest precipitation rates.Seeding experiments continue to suggest that precipitationfrom single cell and multicell convective clouds haveproduced variable results. The response variability is notfully understood.
Precipitation enhancement techniques by glaciogenicseeding are utilized to affect ice phase processes whilehygroscopic seeding techniques are used to affect warmrain processes. Methods to assess these techniques varyfrom direct measurements with surface precipitationgauges to indirect radar-derived precipitation estimates.Both methods have inherent advantages and disadvan-tages.
During the last 10 years there has been a thoroughscrutiny of past experiments using glaciogenic seeding. Theresponses to seeding seem to vary depending on changesin natural cloud characteristics and in some experimentsthey appear to be inconsistent with the original seedinghypothesis.
Experiments involving heavy glaciogenic seeding ofwarm-based convective clouds (bases about +10°C orwarmer) have produced mixed results. They were intendedto stimulate updraughts through added latent heat release
which, in turn, was postulated to lead to an increase inprecipitation. Some experiments have suggested a positiveeffect on individual convective cells but conclusive evidencethat such seeding can increase rainfall from multicellconvective storms has yet to be established. Many steps inthe postulated physical chain of events have not been suffi-ciently documented with observations or simulated innumerical modelling experiments.
In recent years, the seeding of warm and cold convectiveclouds with hygroscopic chemicals to augment rainfall byenhancing warm rain processes (condensation/collision-coalescence/break-up mechanisms) has received renewedattention through model simulations and field experiments.Two methods of enhancing the warm rain process have beeninvestigated: first, seeding with small particles (artificial CCNwith mean sizes about 0.5 to 1.0 micrometres in diameter)is used to accelerate precipitation initiation by stimulatingthe condensation-coalescence process by favourably modi-fying the initial droplet spectrum at cloud base; and second,seeding with larger hygroscopic particles (artificial precipi-tation embryos about 30 micrometres in diameter) toaccelerate precipitation development by stimulating thecollision-coalescence processes. A recent experiment utiliz-ing the latter technique indicated statistical evidence of radarestimated precipitation increases. However, the increaseswere not as contemplated in the conceptual model but seemto occur at later times (one to four hours after seeding), thecause of this effect is not known.
Recent randomized seeding experiments with flares thatproduce small hygroscopic particles in the updraughtregions of continental, mixed-phase convective clouds haveprovided statistical evidence of increases in radar-estimatedrainfall. The experiments were conducted in different partsof the world and the important aspect of the results wasthe replication of the statistical results in a differentgeographical region. In addition, physical measurementswere obtained suggesting that the seeding produced abroader droplet spectrum near cloud base that enhancesthe formation of large drops early in the lifetime of thecloud. These measurements were supported by numericalmodelling studies.
Although the results are encouraging and intriguing, thereasons for the duration of the observed effects obtainedwith the hygroscopic particle seeding are not understoodand some fundamental questions remain. Measurementsof the key steps in the chain of physical events associatedwith hygroscopic particle seeding are needed to confirmthe seeding conceptual models and the range of effective-ness of these techniques in increasing precipitation fromwarm and mixed-phase convective clouds.
Despite the statistical evidence of radar estimated precip-itation changes in individual cloud systems in bothglaciogenic and hygroscopic techniques, there is noevidence that such seeding can increase rainfall over signif-icant areas economically. There is no evidence of anyextra-area effects.
6.Annexes:UN198_212 16/2/07 11:02 Page 203

[ ]204
Hail suppressionHail causes substantial economic loss to crops and property.Many hypotheses have been proposed to suppress hail andoperational seeding activities have been undertaken inmany countries. Physical hypotheses include the conceptsof beneficial competition (creating many additional hailembryos that effectively compete for the supercooledwater), trajectory lowering (intended to reduce the size ofhailstones) and premature rainout. Following theseconcepts, seeding methods concentrate on the peripheralregions of large storm systems, rather than on the mainupdraught.
Our understanding of storms is not yet sufficient to allowconfident prediction of the effects of seeding on hail. Thepossibilities of increasing or decreasing hail and rain insome circumstances have been discussed in the scientificliterature. Supercell storms have been recognized as aparticular problem. Numerical cloud model simulationshave provided insights into the complexity of the hailprocess, but the simulations are not yet accurate enoughto provide final answers. Scientists in operational andresearch programmes are working to delineate favourabletimes, locations and seeding amounts for effective modifi-cation treatments.
A few randomized trials have been conducted for hailsuppression using such measures as hail mass, kineticenergy, hailstone number and area of hailfall. However,most attempts at evaluation have involved non-randomizedoperational programmes. In the latter, historical trends incrop hail damage have often been used, sometimes withtarget and upwind control areas, but such methods can beunreliable. Large reductions have been claimed by manygroups. The weight of scientific evidence to date is incon-clusive, neither affirming nor denying the efficacy of hailsuppression activities. This situation is motivation for oper-ational programmes to strengthen the physical andevaluation components of their efforts.
In recent years, anti-hail activities using cannons toproduce loud noises have re-emerged. There is neither ascientific basis nor a credible hypothesis to support suchactivities. Significant advances in technology during the lastdecade have opened new avenues to document and betterunderstand the evolution of severe thunderstorms and hail.New experiments on storm organization and the evolutionof precipitation including hail are needed.
Other severe weather moderationTropical cyclones contribute significantly to the annual rain-fall of many areas, but they are also responsible forconsiderable damage to property and for a large loss of life.Therefore, the aims of any modification procedure shouldbe to reduce the wind, storm surge and rain damage, butnot necessarily the total rainfall. Hurricane modificationexperiments were conducted in the 1960s and early 1970s.However, there is no generally accepted conceptual modelsuggesting that hurricanes can be modified.
While modification of tornadoes or of damaging winds isdesirable for safety and economical reasons, there ispresently no accepted physical hypothesis to accomplishsuch a goal.
There has been some interest in the suppression of light-ning. Motivation includes reducing occurrences of forestfires ignited by lightning and diminishing this hazardduring the launching of space vehicles. The conceptusually proposed involves reducing the electric fieldswithin thunderstorms so that they do not become strongenough for lightning discharges to occur. To do this, chaff(metallized plastic fibres) or silver iodide have been intro-duced into thunderstorms. The chaff is postulated toprovide points for corona discharge which reduces the elec-tric field to values below those required for lightning,whereas augmenting the ice-crystal concentration is postu-lated to change the rate of charge build up and the chargedistribution within the clouds. Field experiments haveused these concepts and limited numerical modellingresults have supported them. The results have no statisti-cal significance.
Inadvertent weather modificationThere is ample evidence that biomass burning, and agri-cultural and industrial activities modify local andsometimes regional weather conditions. Land-use changes(e.g. urbanization and deforestation) also modify local andregional weather. Air quality, visibility, surface and low-levelwind, humidity and temperature, and cloud and precipi-tation processes are all affected by large urban areas. Asenvironmental monitoring and atmospheric modellingcapabilities are improved, it is increasingly evident thathuman activities have significant impacts on meteorologi-cal parameters and climatological mechanisms thatinfluence our health, productivity and societal infrastruc-ture. Inadvertent effects need to be considered in the designand analyses of weather modification experiments and oper-ations (e.g. changes in background aerosol distributionsaffect the cloud structure and may affect precipitationprocesses).
Economic, social and environmental aspects ofweather modificationWeather modification is sometimes considered by coun-tries when there is a need to improve the economy in aparticular branch of activity (for example, increase in watersupply for agriculture or power generation) or to reducethe risks that may be associated with dangerous events(frosts, fogs, hail, lightning, thunderstorms, etc.). Besidesthe present uncertainties associated with the capability toreach such goals, it is necessary to consider the impacts onother activities or population groups. Economic, social,ecological and legal aspects should be taken into account.Thus, it is important to consider all the important complex-ity and recognize the variety of possible impacts, duringthe design stage of an operation.
6.Annexes:UN198_212 16/2/07 11:02 Page 204

[ ]205
Legal aspects may be particularly important whenweather modification activities are performed in the prox-imity of borders between different countries. However, anylegal system aimed at promoting or regulating weathermodification must recognize that scientific knowledge isstill incomplete.
The implications of any projected long-term weathermodification operation on ecosystems need to be assessed.Such studies could reveal changes that need to be takeninto account. During the operational period, monitoring ofpossible environmental effects should be undertaken as acheck against anticipated impacts.
Summary statement and recommendationsTo answer the need for more water and less hail in manyregions of the world, some progress has been made duringthe past 10 years in the science and technology of weathermodification. Large numbers of programmes in fog disper-sion, rain, snow enhancement and hail suppression are inoperation. Several research experimental programmes aresupported in some countries and include randomizedstatistical evaluations. Improved observational facilities,computer capabilities, numerical models and understand-ing now permit more detailed examination of clouds andprecipitation processes than ever before, and significantadvances are consequently possible. New technologies andmethods are starting to be applied and will help to lead tofurther understanding and development in this field.
In the light of this review of the status of weather modi-fication, the following recommendations are made tointerested Members of WMO:(a) Cloud, fog and precipitation climatologies should be
established in all countries as vital information forweather modification and water resource studies andoperations
(b) Operational cloud-seeding projects should be strength-ened by allowing an independent evaluation of theresults of seeding. This should include measurementsof physical response variables and a randomized statis-tical component
(c) Education and training in cloud physics, cloud chem-istry, and other associated sciences should be anessential component of weather modification projects.Where the necessary capacity does not exist, advantageshould be taken of facilities of other Members
(d) It is essential that basic measurements to support andevaluate the seeding material and seeding hypothesisproposed for any weather modification experiments beconducted before and during the project
(e) Weather modification programmes are encouraged toutilize new observational tools and numerical modellingcapabilities in the design, guidance and evaluations offield projects.
While some Members may not have access or resources toimplement these technologies, collaboration between
Member States (e.g. multinational field programmes, inde-pendent expert evaluations, education, etc.) are encouragedthat could provide the necessary resources for implement-ing these technologies.
Guidelines for advice and assistance related to theplanning of weather modification activities1. These guidelines are addressed to Members requesting
advice or assistance on weather modification activities.They include recommendations that are based onpresent knowledge gained through the results of world-wide theoretical studies as well as laboratory and fieldexperiments. A synthesis of the main basic conceptsand main results obtained in the weather modificationprogrammes is given in the WMO Statement on theStatus of Weather Modification. This Statement wasrevised during the twentieth session of the ExecutiveCouncil Panel of Experts/CAS Working Group onPhysics and Chemistry of Clouds and WeatherModification Research and was approved by the fifty-third session of the Executive Council in June 2001
2. Members wishing to develop activities in the field ofweather modification should be aware that researchand operational applications are still under develop-ment
It should not be ignored that under certain condi-tions, seeding may be ineffective or may even enhancean undesirable effect (increase of hail, reduction inrain). However, properly designed and conductedprojects seek to detect and minimize such adverseeffects. It is recognized that scientific evaluation maybe a difficult task, but this is the only way presentlyknown to avoid negative results, quantify positiveeconomic effects and allow improvements in the under-standing and methodology that is used. The revisedWMO Statement on the Status of Weather Modificationreferred to in paragraph 1 distinguishes the varioustypes of weather modification and the degree of confi-dence necessary to obtain the desired effect from cloudseeding. The confidence level is very high for opera-tional dissipation of supercooled fog and moderate forincreasing snowfall from orographic clouds. The confi-dence level is not high for suppressing hail.
3. WMO recommends that operational cloud seedingprojects for precipitation modification be designed toallow evaluation of the results of seeding through phys-ical measurements and statistical controls associatedwith some randomization of the seeding events. Thephysical measurements should include characterization of the seeding material. Care should be taken to engagequalified operators. The objective evaluation shouldbe performed by a group independent of the opera-tional one. Such programmes should be planned on alongduration basis because precipitation variability isgenerally much greater than the increases or decreasesclaimed for artificial weather modification. The use of
6.Annexes:UN198_212 16/2/07 11:02 Page 205
[ ]206
appropriate numerical models may help in reducingthe time required to evaluate the project
4. WMO recommends that a detailed examination of thesuitability of the site for cloud seeding should beconducted similar to that done in the PrecipitationEnhancement Project, for which WMO reports areavailable. To increase the chances of success in aspecific situation, it should be verified through prelim-inary studies that:
(a) The climatology of clouds and precipitation at the siteindicates the possibility of favourable conditions forweather modification
(b) Conditions are suitable for the available modificationtechniques
(c) Modelling studies support the proposed weather modi-fication hypothesis
(d) For the frequency with which suitable conditions occur,the changes resulting from the modification techniquecan be detected at an acceptable level of statisticalsignificance
(e) An operational activity can be carried out at a costacceptably lower than the socio-economic benefit thatis likely to result.
All prospective studies require expert judgement and theresults are expected to depend on the site chosen and onthe season.
5. There are no quantitative criteria for the acceptance ofthe results of a weather modification experiment.
Acceptance will depend on the degree of the scien-tific objectivity and the consistency with which theexperiment was carried out and the degree to whichthis is demonstrated. Also important are the physicalplausibility of the experiment, the degree to which biasis excluded from the conduct and analysis of the exper-iment, and the degree of statistical significanceachieved. There have been few weather modificationexperiments that have met the requirements of thescientific community with respect to these general crite-ria. However, there are exciting possibilities now formaking progress in our understanding of weather modi-fication issues using modern research tools, includingadvanced radar, new aircraft instruments and powerfulnumerical models
6. Weather modification should be viewed as a part of anintegrated water resources management strategy.Instant drought relief is difficult to achieve. In partic-ular, if there are no clouds, precipitation cannot be artificially stimulated. It is likely that the opportuni-ties for precipitation enhancement will be greaterduring periods of normal or above normal rainfall thanduring dry periods
7. The Members should be aware that the scope of effortsinvolved in the design, conduct or evaluation of aweather modification programme precludes the WMO
Secretariat from giving detailed advice. However, ifrequested, the Secretary-General may assist (by obtainingadvice from scientists on other weather modificationprojects or with special expertise) on the understandingthat:(a) Costs will be met by the requesting country(b) The Organization can take no responsibility for the
consequences of the advice given by any invited scien-tist or expert
(c) The Organization accepts no legal responsibility in anydispute that may arise.
6.Annexes:UN198_212 16/2/07 11:02 Page 206

[ ]207
Noting:1. The UN Conference on Environment and Development;
(UNCED), 1992, Rio Declaration and relevant parts ofAgenda 21
2. UN General Assembly Resolution 49/234, 1994, on theelaboration of an International Convention to CombatDesertification in those countries experiencing seriousdrought and/or desertification, particularly in Africa
3. Ratification of the United Nations Convention to CombatDesertification in December 1996
4. The Abridged Final Report with Resolutions of theFourteenth World Meteorological Congress (WMO-No.960) general summary, paragraph 3.2.2.15
5. UN General Assembly Resolution 54/223, 2000, on theimplementation of the United Nations Convention toCombat Desertification in those countries experiencingserious drought and/or desertification, particularly in Africa
6. UN General Assembly Resolution 58/211, 9 February 2004,on the declaration of 2006 as the International Year ofDeserts and Desertification (IYDD)
7. UNCCD Decision 20 from COP-7, October 2005, on theProgramme of work of the Committee on Science andTechnology.
Considering:1. The role played by climate and climatic factors in deserti-
fication processes and the importance of meteorology andhydrology in many aspects of the combat against deserti-fication
2. That drought and desertification have continued to affectmany countries
3. That drought and desertification have serious implicationsfor socio-economic development and the environment inmany countries, especially in arid, semi-arid and dry sub-humid areas
4. That WMO has for many years contributed to the combatagainst the adverse effects of drought and desertification atnational, regional and international levels,
5. Articles 10, 16 and 19 of the UNCCD6. That WMO has participated effectively in the sessions 1 to
7 of the Conference of Parties (COP) of the UNCCD, and willcontinue to do so in future sessions of COP,
7. That WMO has produced a brochure entitled “Climate andLand Degradation” in support of IYDD
8. That WMO and UNCCD are working together to organize aworkshop entitled “Climate and Land Degradation”, from 11to15 December 2006 in Arusha, Tanzania also in support ofIYDD.
Recognizing that the subject of drought and desertificationhas been considered in detail by UNCED,Urges Members of WMO:1. To continue to strengthen national and regional meteorological
and hydrological networks and monitoring systems to ensureadequate gathering and dissemination of basic data and infor-mation nationally, regionally and internationally
2. To support as appropriate national, regional and globalprogrammes for integrated data collection and to carry outassessment and research related to land degradation and deser-tification and mitigation of drought problems
3. To continue to review, study and undertake research on theinteractions between climate, drought and desertification, andtheir socio-economic impacts
4. To draw the attention of appropriate authorities and experts tothe use and applications of meteorological and hydrologicalinformation in National Action Programmes for the imple-mentation of UNCCD
5. To stimulate education and training on the meteorological andhydrological aspects of the multi-disciplinary fields in thecombat against desertification
6. To support the Secretary-General in the further implementa-tion of the recommendations of UNCED.
Requests the Secretary-General:1. To bring the relevant recommendations on the follow-up to
UNCED to the attention of all Members2. To continue to circulate to Members for information and appro-
priate action any relevant decisions of COPs of UNCCD whichmay have implications for Member countries of WMO
3. To continue to take steps towards the implementation ofactions recommended by UNCED, which are of direct rele-vance to WMO
4. To cooperate, as appropriate, within the budgetary resources,with other relevant international and regional organizations inthe implementation of the UNCCD
5. To ensure that WMO continues to participate effectively, asappropriate, in the implementation activities in support ofthe UNCCD.
WMO RECOMMENDATIONS RELATED TO DROUGHT AND DESERTIFICATION
WMO Recommendations related toDrought and Desertification
6.Annexes:UN198_212 16/2/07 11:02 Page 207

[ ]208
1. Introduction1.1 Every day around the world, the NMSs and the
private sector meteorological service providers of theMember States and Territories of WMO providehundreds of thousands of forecasts and warnings ofweather and climate conditions and events. Theseforecasts and warnings provide information for thebenefit of the community at large and for a widerange of specialized user sectors, on a broad spec-trum of atmospheric phenomena ranging from thosewith timescales of seconds to minutes and spacescales of metres to kilometres, such as severe storms,through to those, such as El Niño-related drought,with multi-year and global impact. The forecast infor-mation provided is used to inform and improvedecision making in virtually every social andeconomic sector and the globally aggregatedeconomic benefits of meteorological services are reck-oned to be of the order of hundreds of billions ofUnited States dollars
1.2 The capacity to provide these socially- and econom-ically-beneficial services to the citizens of the 185Members of WMO results from the operation of theunique international system of cooperation of theWMO World Weather Watch Programme which isbased on:
(a) The collection and international exchange of theglobal observational data that are essential to describethe current (initial) state of the atmosphere (and theunderlying land and ocean) at any point in time
(b) The fact that the physical and dynamical processesgoverning the behaviour of the atmosphere and oceancan be represented in numerical models which arecapable of providing forecasts of daily weather condi-tions with significant skill out to several days fromthe ‘initial’ state as well as useful indications, incertain circumstances, of general trends of climatefor months and seasons ahead
(c) The existence of a coordinated international meteo-rological system of global, regional and nationaldata-processing and modelling centres producingreal-time products from which skilled professional
forecasters are able to prepare forecasts and warningsin forms that are relevant and useful to the usercommunity;
(d) The ability to monitor extreme events in real-timeand to issue warnings by combining classical mete-orological observations, model output andinformation from remote-sensing systems such assatellites and radar.
1.3 The scientific understanding and technological capa-bilities underlying this globally cooperative system ofweather and climate forecasting have made enormousprogress over the past 25 years as a result, in partic-ular, of such cooperative international researchprogrammes as the WMO/ICSU Global AtmosphericResearch Programme, the WMO World WeatherResearch Programme and the WMO/ICSU/IOCWorld Climate Research Programme. The skill levelsand utility of the resulting forecasts and warningshave steadily increased. Indeed three-day forecasts ofsurface atmospheric pressure are now as accurate asone-day forecasts 20 years ago. But the observationaldatabase necessary to describe the ‘initial’ state ofthe atmosphere will always be limited by considera-tions of scale and measurement accuracy, theprocesses governing the behaviour of the atmosphereare non-linear and the phenomenon known as chaosimposes fundamental limits on predictability. Whilenew techniques are emerging which help potentialusers of weather and climate forecasts to understandbetter, and make allowance for, the inherent uncer-tainties in the forecasts, the WMO Executive Councilbelieves it is important that all those who make useof such forecasts in decision making should be madebetter aware of both their scientific foundation andtheir scientific and practical limitations. It thereforerequested that CAS prepare a statement on thecurrent status of weather and climate forecasting.
1.4 This statement has been prepared by CAS with inputfrom other WMO and external scientific organiza-tions and programmes including the World ClimateResearch Programme. It was approved by the thir-teenth session of CAS in Oslo in February 2002 and
STATEMENT OF SCIENTIFIC BASIS (EC-LIV, 2002)
WMO statement on the scientific basisfor, and limitations of weather and
climate forecasting
6.Annexes:UN198_212 16/2/07 11:02 Page 208

[ ]209
endorsed by the Executive Council at its fifty-fourthsession in June 2002. It is provided for the informa-tion of all those with an interest in the scientificfoundations and limitations of weather and climateforecasting on timescales from minutes and hoursthrough to decades and centuries.
2. The science of weather forecastingDynamical and physical processes within the atmosphere,and interactions with the surroundings (e.g. land, ocean,and ice surfaces), determine the evolution of the atmosphereand, hence, the weather. Scientifically-based weather fore-casts are possible if the processes are well enoughunderstood and if the current state of the atmosphere is wellknown enough, for predictions to be made of future states.Weather forecasts are prepared using a largely systematicapproach, involving observation and data assimilation,process understanding, prediction and dissemination. Eachof these components has, and will continue, to benefit fromadvances in science and technology.
2.1 Observations and data assimilation2.1.1 Over the past few decades, substantial advances in
science have resulted in improved and more efficientmethods for making and collecting timely observa-tions, from a wide variety of sources including radarand satellites. Using these observations in scientifi-cally-based methods has caused the quality ofweather forecasts to increase dramatically, so thatpeople around the world have come to rely onweather forecasts as a valued input to many decision-making processes
2.1.2 Computer-generated predictions are initialised froma description of the atmospheric state built from pastand current observations in a process called dataassimilation, which uses the NWP model (see para-graph 2.3.2) to summarize and carry forward in timeinformation from past observations. Data assimila-tion is very effective at using the incomplete coverageof observations from various sources to build a coher-ent estimate of the atmospheric state. But, like theforecast, it relies on the NWP model and cannoteasily use observations of scales and processes notrepresented by the model
2.1.3 The international scientific community is emphasiz-ing the still very poorly observed areas as being alimiting factor in the quality of some forecasts. As aconsequence, there is a continued need for improvedobservation systems and methods to assimilate theseinto NWP models.
2.2 Understanding of the atmosphere: inherent limi-tations to predictability2.2.1 The scientific understanding of physical processes
has made considerable progress through a variety ofresearch activities, including field experiments, theo
retical work and numerical simulation. However,atmospheric processes are inherently non-linear andnot all physical processes can be understood or repre-sented in NWP models. For instance, the wide varietyof possible cloud water and ice particles must behighly simplified, as are small cumulus clouds thatcan lead to rain showers. Continued research effortusing expected improvements in computer technol-ogy and physical measurements will enable theseapproximations to be improved. Even then, it willstill not be possible to represent all atmosphericmotions and processes
2.2.2 There is a wide spectrum of patterns of atmosphericmotion, from the planetary scale down to local turbu-lence. Some are unstable and are arranged so thatflow is amplified using, for example, energy fromheating and condensation of moisture. This propertyof the atmosphere means that small uncertaintiesabout the state of the atmosphere will also grow, sothat eventually the unstable patterns cannot beprecisely forecast. How quickly this happens dependson the type and size of the motion. For convectivemotions such as thunderstorms, the limit is of theorder of hours, while for large scales of motion it isof the order of two weeks.
2.3 Weather prediction2.3.1 Nowcasting: Forecasts extending from 0 out to 6 to
12 hours are based upon a more observations-inten-sive approach and are referred to as nowcasts.Traditionally, nowcasting has focused on the analy-sis and extrapolation of observed meteorologicalfields, with a special emphasis on mesoscale fieldsof clouds and precipitation derived from satelliteand radar. Nowcast products are especially valuablein the case of small-scale hazardous weatherphenomena associated with severe convection andintense cyclones. In the case of tropical cyclones,nowcasting is an important detection and subse-quent short-term prediction approach that providesforecast value beyond 24 hours in some cases.However, the time rate of change of phenomenasuch as severe convection is such that the simpleextrapolation of significant features leads to aproduct that deteriorates rapidly with time – evenon timescales of the order of one hour. Thus,methods are being developed that combine extrap-olation techniques with NWP, both through ablending of the two products and through theimproved assimilation of detailed mesoscale obser-vations. These are inherently difficult tasks and,although accuracy and specificity will improve overcoming years, these products will always involveuncertainty regarding the specific location, timingand severity of weather events such as thunder andhail storms, tornadoes and downbursts
6.Annexes:UN198_212 16/2/07 11:02 Page 209

[ ]210
2.3.2 Numerical weather prediction: Forecasts for leadtimes in excess of several hours are essentially basedalmost entirely on NWP. In fact, much of theimprovement in the skill of weather forecasts overthe past 20 years can be attributed to NWPcomputer models, which are constructed using theequations governing the dynamical and physicalevolution of the atmosphere. NWP models repre-sent the atmosphere on a three-dimensional grid,while typical operational systems in 2001 use a hori-zontal spacing of 50–100 km for large-scaleforecasting and five to 40 km for limited area fore-casting at the mesoscale. This will improve as morepowerful computers become available.Only weather systems with a size several times thegrid spacing can be accurately predicted, so phenom-ena on smaller scales must be represented in anapproximate way using statistical and other tech-niques. These limitations in NWP models particularlyaffect detailed forecasts of local weather elements,such as cloud and fog and extremes such as intenseprecipitation and peak gusts. They also contribute tothe uncertainties that can grow chaotically, ultimatelylimiting predictability
2.3.3 Ensemble prediction: Uncertainty always exists – evenin our knowledge of the current state of the atmos-phere. It grows chaotically in time, with much of thenew information introduced at the beginning nolonger adding value, until only climatological infor-mation remains. The rate of growth of this uncertaintyis difficult to estimate since it depends upon the three-dimensional structure of the atmospheric flow. Thesolution is to execute a group of forecasts – anensemble – from a range of modestly different initialconditions and/or a collection of NWP models withdifferent, but equally plausible, approximations. If theensemble is well designed, its forecasts will span therange of likely outcomes, providing a range of patternswhere uncertainties may grow. From this set of fore-casts, information on probabilities can be derivedautomatically, tailored to users’ needsForecast ensembles are subject to the limitations ofNWP discussed earlier. Additionally, since the groupof forecasts are being computed simultaneously, lesscomputer power is available for each forecast. Thisrequires grid spacings to be increased, making it moredifficult to represent some severe weather events ofsmaller horizontal scale. Together with the limitednumber of forecasts in an ensemble, this makes itharder to estimate probabilities of very extreme andrare events directly from the ensemble. Moreover it isnot possible to modify the NWP models used tosample properly modelling errors, so sometimes allmodels will make similar errors
2.3.4 Operational meteorologist: There remains a critical rolefor the human forecaster in interpreting the output
and in reconciling sometimes seemingly conflictinginformation from different sources. This role is espe-cially important in situations of locally severe weather.Although vigorous efforts are being made to provideforecasters with good quality systems such as inter-active workstations for displaying and manipulatingthe basic information, they still have to cope withvast amounts of information and make judgementswithin severe time constraints. Furthermore, fore-casters are challenged to keep up to date with thelatest scientific advances.
3. Prediction at seasonal to interannual timescales3.1 Beyond two weeks, weekly average predictions of
detailed weather have very low skill, but forecasts ofone-month averages, using NWP with predictedseasurface temperature anomalies, still have signifi-cant skill for some regions and seasons to a range ofa few months
3.2 At the seasonal timescale, detailed forecasts ofweather events or sequences of weather patterns arenot possible. As mentioned above, the chaotic natureof the atmosphere sets a fundamental limit of theorder of two weeks for such deterministic predictions,associated with the rapid growth of initial conditionerrors arising from imperfect and incomplete obser-vations. None the less, in a limited sense, somepredictability of temperature and precipitation anom-alies has been shown to exist at longer lead times outto a few seasons. This comes about because of inter-actions between the atmosphere, the oceans, and theland surface, which become important at seasonaltimescales
3.3 The intrinsic timescales of variability for both the landsurface and the oceans are long compared to that ofthe atmosphere, due in part to relatively large thermalinertia. Ocean waves and currents are slow incomparison to their atmospheric counterparts, dueto the large differences in density structure. To theextent that the atmosphere is connected to the oceanand land surface conditions, then, a degree ofpredictability may be imparted to the atmosphere atseasonal timescales. Such coupling is known to existparticularly in the tropics, where patterns of atmos-pheric convection ultimately important to global scaleweather patterns are quite closely tied to variations inocean surface temperature. The most importantexample of this coupling is found in the ENSOphenomenon, which produces large swings in globalclimate at intervals ranging from two to seven years
3.4 The nature of the predictability at seasonal timescalesmust be understood in probabilistic terms. It is notthe exact sequence of weather that has predictabilityat long lead times (a season or more), but rather someaspects of the statistics of the weather – for example, the mean or variance of temperature/precipitation
6.Annexes:UN198_212 16/2/07 11:02 Page 210

[ ]211
over a season – that has potential predictability.Though the weather on any given day is entirelyuncertain at long lead times, the persistent influenceof the slowly evolving surface conditions may changethe odds for a particular type of weather occurringon that day. In rough analogy to the process of throw-ing dice, the subtle but systematic influence of theboundary forcing can be likened to throwing dicethat are “loaded”. On any given throw, we cannotforetell the outcome, yet after many throws the biaseddice will favour a particular outcome over others. Thisis the sort of limited predictability that characterizesseasonal prediction
3.5 Currently, seasonal predictions are made using bothstatistical schemes and dynamical models. The statis-tical approach seeks to find recurring patterns inclimate associated with a predictor field such as sea-surface temperature. Such models havedemonstrated skill in forecasting El Niño and someof its global climate impacts. The basic tools fordynamical prediction are coupled models – modelsthat include both the atmosphere and the othermedia of importance, particularly the oceans. Suchmodels are initialized using available observationsand integrated forward in time to produce a seasonalprediction. The issue of uncertainty is handled usingan ensemble approach, where the climate model isrun many times with slightly different initial condi-tions (within the range of observation errors orsampling errors). From this, a distribution of resultsis obtained, whereupon statistics of the climate canbe estimated. Recently, encouraging results havebeen obtained from ensemble outputs of more thanone model being combined
3.6 There are several limitations attending current predic-tions. Most coupled models (and to a lesser extentuncoupled models) exhibit some serious systematicerrors that inevitably reduce forecast skill. Data avail-ability is a limitation for both statistical models andfor dynamical models. In the latter case, very limitedinformation is available for much of the global oceansand for the land surface conditions. Also, currentinitialisation methods do not account properly forsystematic model errors, further limiting forecastperformance. A final set of limitations arises for prac-tical reasons. Due to resource requirements, mostseasonal predictions cannot be done at resolutionscomparable to weather predictionFurthermore, rather small ensemble sizes (of theorder of 10) are used for some models, certainly less than is optimal for generating robust probabilistic forecasts. Current research is addressing the potential for regional “downscaling” of climate forecastsby various means and the possibilities for moredetailed probabilistic climate information fromexpanded ensembles of one or more models
3.7 Possible use of seasonal forecasts is currently beingexplored in various contexts. In each case, effectiveuse will require careful attention to the issue of uncer-tainty inherent in seasonal forecasts. Futureadvancements can be expected to improve the esti-mates of uncertainty associated with forecasts, thusallowing better use of forecast products.
4. Projection of future climate4.1 As explained above, based on the current observed
state of the atmosphere, weather prediction canprovide detailed location and time-specific weatherinformation on timescales of the order of two weeks.Some predictability of temperature and precipitationanomalies has been shown to exist at longer leadtimes out to a few seasons. This comes about becauseof interactions between the atmosphere, the oceans,and the land surface, which become important atseasonal timescales. At longer timescales, the currentobserved state of the atmosphere and even thoselarge-scale anomalies which provide predictive skill atseasonal to interannual timescales are no longer ableto do so due to the fundamental chaotic nature ofthe Earth-atmosphere system. However, long-termchanges in the Earthatmosphere system at climatetimescales (decades to centuries) are dependent onfactors which change the balance of incoming andoutgoing energy in the Earth atmosphere system.These factors can be natural (e.g. changes in solaroutput or volcanoes) or human induced (e.g.increased greenhouse gases). Because simulations ofpossible future climate states are dependent onprescribed scenarios of these factors they are moreaccurately referred to as “projections” not “predic-tions” or “forecasts”
4.2 In order to perform climate projections, physically-based climate models are required in order to repre-sent the delicate feedbacks which are crucial onclimate timescales. Physical processes and feedbacksthat are not important at NWP or even at thetimescales of seasonal prediction become crucialwhen attempting to simulate climate over longperiods, e.g. cloud-radiation interaction and feed-back, water vapour feedback (and correctly modellinglong-term trends in water vapour), ocean dynamicsand processes (in particular an accurate representa-tion of the thermohaline circulation). The treatmentsof these key features are adequate to reproduce manyaspects of climate realistically though there remainmany uncertainties associated with clouds andaerosols and their radiative effects, and many ocean processes. Nevertheless, there is reasonable confi-dence that state-of-the-art climate models do provide useful projections of future climate change. Thisconfidence is based on the demonstrated perfor-mance of models on a range of space timescales
6.Annexes:UN198_212 16/2/07 11:03 Page 211

[ ]212
4.3 Notably, the understanding of key climate processesand their representation in models (such as the inclu-sion of sea-ice dynamics and more realistic ocean heattransport) has improved in the past few years. Manymodels now give satisfactory simulations of climatewithout the need for non-physical adjustments ofheat and water fluxes at the ocean-atmosphere inter-face used in earlier models. Moreover, simulationsthat include estimates of natural and anthropogenicforcing are well able to reproduce observed large-scalechanges in surface temperature over the twentiethcentury. This large-scale consistency between modelsand observations lends confidence in the estimatesof warming rates projected over the next century. Thesimulations of observed natural variability (e.g.ENSO, monsoon circulations, the North AtlanticOscillation) have also improved
4.4 On the other hand, systematic errors are still all tooapparent, e.g. in simulated temperature distributionsin different regions of the world or in different partsof the atmosphere, in precipitation fields, clouds (inparticular marine stratus). One of the factors thatlimits confidence in climate projections is the uncer-tainties in external forcing (e.g. in predicting futureatmospheric concentrations of carbon dioxide andother greenhouse gases, and aerosol loadings)
4.5 As with NWP and seasonal forecasts, ensembles ofclimate projections are also extremely important.Ensembles enable the magnitude and effects ofnatural climate variability to be gauged and affect itsimpact on future projections, and thereby permit anysignificant climate change signal to be picked outmore clearly statistically (the magnitude of naturalclimate variability will be comparable with that ofclimate change for the next few decades).
5. Dissemination to end-users5.1 The weather forecasts have to be communicated to
a vast array of users such as emergency managers, airtraffic controllers, flood forecasters, public eventmanagers, etc. in a timely and user-applicable form.This in itself poses another major challenge that isincreasingly benefiting from advances in informationtechnology. Predictions at seasonal to interannualtimescales and climate projections are also being usedby an increasingly wide range of users
5.2 The value of forecasts to decision makers is greatlyenhanced if the inherent uncertainty can be quanti-fied. This is particularly true of severe weather, whichcan cause such damage to property and loss of lifethat precautions may be well advised even if the eventis unlikely, but possible. Probabilities are a natural way of expressing uncertainty. A range of possibleoutcomes can be described with associated proba-bilities and users can then make informed decisionsallowing for their particular costs and risks
5.3 Forecasts expressed as probabilities, or ensembles,contain much more information than deterministicforecasts, and it is difficult to convey it all to users.Broadcast forecasts can only give a broad picture ofthe most likely outcome, with perhaps some idea ofimportant risks. Each user’s decision may be basedon the probabilities of a few specific occurrences.What these are, and the probability thresholds foracting on the forecasts, will differ. So for importantuser decisions it is necessary to apply their particu-lar criteria to the detailed forecast information.
6. Conclusions6.1 The skill in weather forecasting has advanced
substantially since the middle of the twentiethcentury, largely supported by the advancement ofcomputing, observation and telecommunicationssystems, along with the development of NWP modelsand the associated data-assimilation techniques. Thishas been greatly facilitated because of the vast expe-rience of both forecasters and decision makers inproducing and in using forecast products.Nevertheless, each component within the science andtechnology of weather forecasting and climate projec-tion has its own uncertainties. Some of these areassociated with a lack of a complete understandingof, or an inherent limitation of, the predictability ofhighly complex processes. Others are linked still tothe need for further advances in observing or comput-ing technology, or to an inadequate transfer betweenresearch and operations. Finally, one cannot under-estimate the importance of properly communicatedweather forecasts to well educated users
6.2 Without a doubt, significant benefits will result fromcontinued attention to scientific research and thetransfer of knowledge gained from this work into thepractice of forecasting. Furthermore, a recognition ofthe limitations of weather forecasts and climateprojections, and when possible, an estimate of thedegree of uncertainty, will result in the improved useof forecasts and other weather information by deci-sion makers. Ultimately the objective is for thescientific and user communities to work bettertogether, realizing even greater benefits.
6.Annexes:UN198_212 16/2/07 11:03 Page 212
[ ]213
The following are notes and bibliographical references to the articles contained within Elementsfor Life, as provided by the individual authors. For further information on any article or author,please contact the publisher.
I POLICY PLANNING & GOVERNANCE
Weather, climate, water and air quality, and the risk to development1. United Nations, 2000: United Nations Millennium Declaration, General Assembly
Resolution A/Res/55/2, 18 September 2000, p. 6. 2. UNDP, 2004: Reducing Disaster Risk: A Challenge for Development, A Global Report. United
Nations Development Programme, Bureau for Crisis Prevention and Recovery, 146pp.3. Munich Re 2002: Topics: annual review, natural catastrophes 2002, Munich, p. 15.4. DFID (Department for International Development), 2006: Reducing the Risks of Disasters
– Helping to Achieve Sustainable Poverty Reduction in a Vulnerable World: A DFID policypaper. 30 pp. Available from http://www.dfid.
5. UNDP, 2004 op. cit.6. World Disaster Report 2002: Focus on Reducing Risk. International Federation of the Red
Cross and Red Crescent Societies (http://www.ifrc.org/publicat/wdr/) 7. Davidson, J. and M.C. Wong, 2005: WMO Guidelines on Integrating Severe Weather
Warnings in Disaster Risk Management, with contributions from C.Y. Lam, C. Alex, S.Wass, C. Dupuy. PWS-13, Haleh Kootval (ed.), WMO/TD No. 1292.
8. Stern, N, 2006: Stern Review: The Economics of Climate Change. Cambridge UniversityPress, 579 pp. van Aalst, M., 2006: Managing Climate Risk. Integrating Adaptation intoWorld Bank Group Operations. The International Bank for Reconstruction andDevelopment/The World Bank, Washington, DC, 32 pp.
9. UNDP, 2004 op. cit.10. World Meteorological Organization (WMO), 2005a: Statement on the Role and Operation
of Meteorological Services, 2pp11. van Aalst, M. 2006 op.cit. 12. Bettencourt, S., R. Croad, P. Freeman, J. Hay, R. Jones, P. King, P. Lal, A. Mearns, G.
Miller, I. Pswarayi- Riddihough, A. Simpson, N. Teuatabo, U. Trotz and M. va n Aalst,2006: Not if, but when: adapting to natural hazards in the Pacific Islands region. A PolicyNote, World Bank Washington, DC.
13. van Aalst, M., 2006 op. cit.
Ocean data, information, products and predictions in the service of society1. This article is a condensed and modified version of the article: ‘Ocean data, products
and predictions in the service of society’ by P.E. Dexter, WMO Bulletin Vol. 54, No. 4,October 2005.
The climatic and meteorological vulnerability of the population and economy of Russia asa factor in safe and sustainable development1. Article prepared using material from the report ‘The meteorological vulnerability and
sustainable development of Russia’ by A.I. Bedritsky, Korshunov, L. Khandozhko and Z.Shaimardanov, for the International Conference on Problems of HydrometeorologicalSecurity, Moscow, 26-29 September 2006.
Technical cooperation for weather, water and climate services in developing countries1. The author is very grateful for contributions from members of the WMO Informal Planning
Meeting on the Voluntary Cooperation Programme, especially Penehuro Lefale, MetService,New Zealand, Christian Blondin, Météo-France, Ven Tsui, Bureau of Meteorology Australia,Tom Butcher, Met Office, UK
2. World Meteorological Organization (2007), The WMO Voluntary Cooperation Programme(VCP), Retrieved 17.01.2007 from http://www.wmo.ch/web/tco/vcp/ .
3. Kaul, I., Conceicao, P., Le Goulven, K & Mendoza, R.U. (2003) ‘Why do global publicgoods matter today?’ in Kaul, I., Conceicao, P., Le Goulven, K & Mendoza, R.U. (eds)Providing global public goods, Oxford University Press for United Nations DevelopmentProgramme, New York. P. 14.
4. For details see: http://www.ranetproject.net/
Weather and climate information services for socio-economic benefit: challenges in JapanFor further information see: JMA, 2005: Investigation on the improvement of agrometeorologicalservice (in Japanese). FUJITSU FIP Co., 2006: Development of techniques of probabilistic one-month prediction products for major observation stations in Southeast Asia (in Japanese).
II ECONOMIC & SOCIAL ISSUES & PERSPECTIVES
AgricultureGlobal warming, climatic trends and climatic threats in Latin America and the Caribbean1. IPCC, Climate Change 2007: The Physical Science Basis. Contribution of Working Group I to
the Fourth Assessment Report of the Intergovernmental Panel on Climate Change. www.ipcc.ch.2. Ibid. 3. MA Secretariat, 2002: Millennium Ecosystem Assessment:Millennium Ecosystem Assessment
Methods [Reid,W., N. Ash, E. Bennett, P. Kumar, M. Lee, N. Lucas, H. Simons,V.Thompson, and M. Zurek (eds.)]. Millenium Assessment.
4. Campos, M., C. Hermosilla, J. Luna, M. Marin, J. Medrano, G. Medina, M. Vives, J.Diaz, A. Gutierrez, and M. Dieguez, 1997: Global Warming and the Impacts of Sea LevelRise for Central America: an Estimation of Vulnerability. Workshop organized by U.S. EPA,
Chinese Taipei, USCSP, Government of The Netherlands, and NOAA, February 24 28,1997,Taipei, Taiwan, Province of China.
5. WMO, 2003: Scientific Assessment of Ozone Depletion: 2002. Global Ozone Research andMonitoring Project - Report No. 47, World Meteorological Organization, Geneva,Switzerland, 498 pp.
6. Porter, J.H., M.L. Parry and T.R. Carter, 1991: The potential effects of climate change onagricultural insect pests. Agricultural/Forest Meteorology, 57, pp. 221-240.
7. Ibid.8. Friederich, S. 1994: Wirkung veräderter Klimatischer factorem auf pflanzenschaedlinge.
In: Klimaveraenderungen und Landwirtschaft, Part II Landbauforsc, [Brunnert, H. and U.Dämmgen (eds.)] Vlkenrode, 148, pp. 17 26
9. Löpmeier, F.J., 1990: Klimaimpaktforschung aus agrarmeteorologischer sicht. Bayer.Landw. Jarhb., 67(1), 185 190
– Parry, M.L., J.H. Porter and T.R. Carter, 1990: Agriculture: climate change and itsimplications. Trends in Ecology and Evolution, 5, pp. 318-322.
– Parry, M., T.R. Carter, and N.T. Konijn (eds.), 1988: The Impact of Climatic Variations on Agriculture. Vol. 2, Assessment in Semi-Arid Regions. Kluwer Academic Publishers, Dordrecht, The Netherlands, 764 pp.
10. Treharne, K., 1989: The implications of the “greenhouse effect” for fertilizer andagrochemicals. In: The Greenhouse Effect and UK Agriculture 19 [de Bennet, R.M. (ed.)].Centre for Agricultural Strategy, University of Reading, United Kingdom, pp. 67 78.
11. ‘Management of early warning systems,’ GCOS, 2003: The Second Report on the Adequacyof the Global Observing Systems for Climate in Support of the UNFCCC. WMO-IOC-UNEP-ICS, GCOS-82,Technical Document No. 1143, World Meteorological Organization,Geneva, Switzerland, 85 pp.
12. Parry et al. 1988. Op. Cit.– Downing, T.E., 1992: Climate Change and Vulnerasble places: Global Food Security and
country studies in Zimbawe, Kenya, Senegal and Chile. Research Report 1, EnvironmentalChange Unit, University of Oxford, United Kingdom,54 pp.
– GEF 2006, A conceptual design tool for exploiting interlinkages between the focal areas ofthe GEF Scientific and Technical Advisory Panel (STAP) www.unep.org/stapgef
13. As analysed in Reilly, J., N. Hohmann, and S. Kane, 1994: Climate change and agricultural trade: who benefits, who loses? Global Environmental Change, 4(1), 24 36.
Further reference:Campos, M., 1996: Estimación de la Vulnerabllidad de los Recursos Hidricos, Marinos-Costeros yAgricolas en Centroamerrica, ante un Potencial Cambio Climático, USCSP/ProyectoCentroamericano sobre Cambio Climático (in press).NRC, 2002: Abrupt Climate Change: Inevitable Surprises. Committee on Abrupt Climate Change,Ocean Studies Board, Polar Research Board, Board on Atmospheric Sciences and Climate,Division on Earth and Life Sciences, National Research Council, National AcademyPress,Washington, DC, USA, 230 pp.Santibañez Q.F. 1991 Possible variations agroclimatiques en Amerique de Sud, au XXIème
siècle. La Météorologie (38) :17-24, France van Dam, R., Gitay, H. and Finlayson, M. 2002.Wetlands and Climate Change 2003. Ramsar Convention COP paper.www.ramsar.org/cop8_doc_11_e.htm.
Weather and climate in agriculture in the Caribbean1. Rijks D and Baradas M. W. (2000) The clients for agrometeorological information.
Agricultural and Forest Meterology 103: 27-42.2. Hansen J.W., Dilley M., Goddard L., Ebrahimian E. and Erickson P. (2004) Climate
variability and the Millennium Development Goal hunger target. International ResearchInstitute for Climate Prediction (IRI) Technical Report No. 04-04.
3. http://www.cdera.org/projects/cadm/index.php4. Atkins V. J. (2005) Priorities for the rationalisation of regional agricultural production and
trade in the CSME. Invited paper presented to the joint INTAL – UWI/IIR seminar on “TheCSME: Status, Issues and Priorities” UWI, St. Augustine, Trinidad and Tobago, 24 November
5. http://www.cimh.edu.bb6. Hansen, op. cit.7. Trotman (1994) Agroclimatic study of Barbados 1970 to 1990: Rainfall. Technical Note
No. 28. Caribbean Meteorological Institute.8. OECS (2005) Grenada: Macro-Socio-Economic Assessment of the damages caused by
Hurricane Ivan September 7,2004. Organisation of Eastern Caribbean States, OECS2004.
9. ECLAC (2005) Guyana: socio-economic assessment of the damages and losses causedby the January-February 2005 flooding. Economic Commision for Latin American andthe Caribbean
10. Chen A. A., Falloon T. and Taylor M. (2005) Monitoring agricultural drought in theCaribbean. In Boken, V.K., Cracknell A.P. and Heathcote R. L. eds. Monitoring andpredicting agricultural drought: A global study. Oxford University Press.
11. Trotz, U., Trotman, A. and Narayan K (2001) Climate change impacts on agriculture,water resources and coastal environments in the Caribbean. In: Land and Water Resourcesin the Caribbean (Paul, C.L and Opadeyi, J. eds.). Chapter 4 pp 73 – 107. CLAWRENET,of PROCICARIBE, CARDI, St. Augustine Campus, University of the West Indies,Trinidad & Tobago.
12. Narayan K. (2006) Climate change impacts on water resources in Guyana. ClimateVariability and Change – Hydrological Impacts. Proceedings of the Fifth Friend WorldConference, Havana, Cuba, IAHS, 413-417.
13. GECAFS (2005) Science plan and implementation strateg. Earth System SciencePartnership (IGBP, IHDP, WCRP, DIVERSITAS. Report No. 2; 36 pp, Wallingford.http://www.gecafs.org.
14. Ibid, Figure 115. GECAFS (2006) Caribbean prototype GEC/Food System scenarios.
http://www.gecafs.org
Notes and References
7.References:Paginated book 16/2/07 10:21 Page 213

16. http://www.millenniumassessment.org17. http://www.cdera.org18. Ibid19. http://www.cimh.edu.bb
Water Resources ManagementOperational weather and climate forecasting and its impact on water management in Australia1. Australian Government, Securing Australia’s Water Future: July 2006 update2. See CIE 2001.3. Dr Peter Wylie, ‘Managing Climate on Grain Farms’,
http://www.bom.gov.au/climate/cli2000/pWylie.html
Fostering sustainable water resources: the Prince Sultan Bin Abdulaziz International Prize for WaterFor further information, and nomination forms and attachments, please visit the prize Web sitewww.psipw.org or contact the General Secretariat of the prize at the following address:Prince Sultan Bin Abdulaziz International Prize for Water General SecretariatPrince Sultan Research Center for Environment, Water and Desert King Saud UniversityP. O. Box 2454 Riyadh 11451, Kingdom of Saudi Arabia Phone: +966-1-4675571, Fax:+966-1-4675574 E-mail: [email protected], Web site: www.psipw.org
HealthManaging climate-related health risks1. WHO, Using climate to predict infectious disease epidemics. 2005, World Health
Organization: Geneva. p. 54.2. http://www.cochrane.org/3. WHO, Improving Public Health Responses to Extreme Weather/Heat-waves - EuroHEAT:
Report on a WHO Meeting Rome, Italy 20-22 June 2005. 2005, World HealthOrganization- European Regional Office: Rome. p. 52.
4. Hewings, J., Air Quality Indices: A review. 2001, Environment Canada: Ottawa. p. 49.http://www.msc-smc.ec.gc.ca/aq_smog/glossary_e.cfm#aqi
5. Sachs, J.D. and P. Malaney, ‘The economic and social burden of malaria.’ Nature, 2002(415): p. 680-685.
6. WHO, Global Strategic Partnership for Roll Back Malaria 2005-2015. 2005, World HealthOrganization.
7. Breman, J.G., ‘The ears of the hippopotamus: manifestations, determinants, and estimatesof the malaria burden.’ American Journal of Tropical Medicine and Hygiene, 2001. 64(1-2 S): p.1-11.
8. Connor, S.J. and M.C. Thomson, ‘Epidemic malaria: preparing for the unexpected. APolicy Brief’, SciDevNet Dossier on Malaria. 2005, SciDevNet.
9. IRI, A gap analysis for the implementation of the Global Climate Observing System programmein Africa. 2006, Columbia University: New York. p. 47.
10. Thomson, M.C., et al., ‘Malaria early warnings based on seasonal climate forecasts frommulti-model ensembles’, Nature, 2006. 0: p. 000-000.
11. Thomson, M.C., et al., ‘Use of rainfall and sea surface temperature monitoring formalaria early warning in Botswana’, American Journal of Tropical Medicine and Hygiene,2005. 73(1): p. 214-221.
12. Da Silva, J., et al., ‘Improving epidemic malaria planning, preparedness and response inSouthern Africa’, Malaria Journal, 2004. 3:37(1).
Air quality: meteorological services for safeguarding public health1. American Heart Association, Air pollution, heart disease and stroke
http://www.americanheart.org/presenter.jhtml?identifier=44192. WMO, Report and Proceedings of the WMO RA II/RA V GAW Workshop on Urban
Environment (Beijing, China, 1-4 Nov 1999), 2000, GAW Rep No 137.3. WMO, Guidelines on Biometeorology and Air Quality Forecasts, 2004, PWS-10,
WMO/TD No. 1184.4. WHO, Air quality guidelines, Global update 2005, WHO 2006.5. European Commission, Clean Air for Europe (CAFE),
http://ec.europa.eu/environment/air/cafe/index.htm.6. WHO, Preventing disease through healthy environments – towards an estimate of the
environmental burden of disease, 2006.7. Friedman, M.S. et al., JAMA, 2001, Vol 285, pp. 897-905.8. Global Solar UV Index – A Practical Guide: A joint recommendation of WHO, WMO, UNEP
and ICNIRP, WHO, 2002, ISBN 92 4 159007 6.9. Environment Canada, Green Lane, Pacific and Yukon Region, http://www.pyr.ec.gc.ca/.10. ASEAN, http://www.aseansec.org/
The watch warning system on heat waves with effect on mortality1. Clarke J. Some Effects of the Urban Structures on Heat Mortality. Environmental Health.
1972;5:93-104. Clarke JF. Some climatological aspects of heat waves in the contiguousUnited States. Environ Res. 1972 Mar;5(1):76-84. Conti S, Meli P, Minelli G, Solimini R,Toccaceli V, Vichi M, et al. Epidemiologic study of mortality during the Summer 2003heat wave in Italy. Environ Res. 2005 Jul;98(3):390-9. Kunst AE, Looman CW,Mackenbach JP. Outdoor air temperature and mortality in The Netherlands: a time-seriesanalysis. Am J Epidemiol. 1993 Feb 1;137(3):331-41. Centers for Disease Control andPrevention. MMWR. Heat-related deaths—four states, July-August 2001, and UnitedStates, 1979-1999. MMWR Morb Mortal Wkly Rep. 2002 Jul 5;51(26):567-70. Smoyer-Tomic K, Kuhn R, Hudson A. Heat wave hazards: An overview of heat wave impacts inCanada. Natural hazards 2003 Mar 2003 28(2-3) :463-85
2. Brucker G, Vulnerable populations: Lessons learnt from the summer 2003 heat waves inEurope. Eurosurveillance. 2005 (7-9):147. Kosatsky T. The 2003 European heat waves.Eurosurveillance 10 (7-9). 2005:148-9.
3. Koppe C. Heat Waves: risk and responses: World Health Organization.; 2004. Hajat S,Kovats RS, Atkinson RW, Haines A. Impact of hot temperatures on death in London: atime series approach. J Epidemiol Community Health. 2002 May;56(5):367-72.
4. Applegate WB, Runyan JW, Jr., Brasfield L, Williams ML, Konigsberg C, Fouche C.Analysis of the 1980 heat wave in Memphis. Journal American Geriatric Society. 1981Aug;29(8):337-42.
5. Ramlow JM, Kuller LH. Effects of the summer heat wave of 1988 on daily mortality inAllegheny County, PA. Public Health Rep. 1990 May-Jun;105(3):283-9.
6. Rooney C, McMichael AJ, Kovats RS, Coleman MP. Excess mortality in England andWales, and in Greater London, during the 1995 heatwave. J Epidemiol CommunityHealth. 1999 Aug;52(8):482-6.
7. Nakai S, Itoh T, Morimoto T. Deaths from heat-stroke in Japan: 1968-1994. Int JBiometeorol. 1999 Nov;43(3):124-7.
8. Falcão JM, Castro MJ, Falcão MLM. Efeitos de uma onda de calor na mortalidade dapopulação de Lisboa. Saúde em Números. 1988;3(2):10-2.
9. Koppe, C. 2004. Op. Cit. Kilbourne EM. The spectrum of illness during heat waves. AmJ Prev Med. 1999 May;16(4):359-60 Mcgeehin MA, Mirabelli M. The potential of climatevariability and change on temperature-related morbidity and mortality in the UnitedStates. Environmental Health Perspectives. May 2001. 109: Suppl 2.:185-9 Semenza JC.Acute renal failure during heat waves. Am J Prev Med. 1999 Jul;17(1):97.
10. Kosatsky T. 2005. Op. Cit.11. Garcia AC, Nogueira PJ, Falcão JM. Onda de calor de Junho de 1981 em Portugal: efeitos
na mortalidade. Revista Portuguesa de Saúde Pública. 1999; I:67-77.12. Brucker G, 2005. Op. Cit. Nunes B, Canto e Castro L. Não morrer de calor! … Será uma
questão de habituação? In: Miranda SM PIe, editor. Estatística: A diversidade na UnidadeNovas tecnologias, 7. Lisboa, Portugal: Edições Salamandra; 1998. Organization; 2005.
13. Brucker G, 2005. Op. Cit.14. Nogueira PJ, Nunes B, Dias CM, Falcão JM. Um sistema de vigilância e alerta de
ondas de calor com efeitos na mortalidade: o índice Ícaro. Revista Portuguesa de SaúdePública. 1999; I:79-84.
15. Nunes B, Canto e Castro L. 2005. Op. Cit. Nogueira PJ, Paixão EJ. Um sistema devigilância e alerta de ondas de calor com efeitos na mortalidade por regiões. ObservatórioNacional de Saúde Dr. Ricardo Jorge. Internal document (not published). Setembro 2005.
16. Falcão, JM et al. 1998. Op. Cit. Garcia, AC et al. 1999. Op. Cit.17. Paixão, E et al. 2003. Op. Cit.18. Calado R, Botelho J, Catarino J, Carreira M, Nogueira P, Paixão E, et al. (2004a) A onda
de calor de agosto de 2003 e os seus efeitos sobre a mortalidade da populaçãoportuguesa. Revista Nacional de Saúde Pública. Julho/Dezembro 2004;2:7-20. Calado R, Botelho J, Catarino J, Carreira M, Nogueira P, Paixão E, et al.(2004b). Onda de calor de Agosto de 2003: os seus efeitos sobre a mortalidade dapopulação portuguesa. Lisboa.: Observatório Nacional de Saúde – Instituto Nacional deSaúde Dr. Ricardo Jorge e Direcção de Serviços de Informação e Análise – Direcção-Geralda Saúde 2004.
19. Paixão E, Nogueira P, Nunes A, Nunes B, Falcão JM. Onda de calor de Julho de 2006:Efeitos na mortalidade Estimativas preliminares para Portugal Continental. Lisboa:Observatório Nacional de Saúde – Instituto Nacional de saúde Dr. Ricardo Jorge; 2006.
20. Paixão E, Nogueira P. Avaliação do sistema de vigilância ÍCARO no ano 2001: Efeitos docalor na mortalidade. Lisboa.: Observatório Nacional de Saúde – Instituto Nacional desaúde Dr. Ricardo Jorge.; 2003 Setembro
21. Falcão J, Paixão E, Nogueira P, Nunes B. Onda de calor de Julho de 2004: efeitos sobre amortalidade na região do Algarve, Agosto de 2004. Lisboa.: Observatório Nacional deSaúde – Instituto Nacional de Saúde Dr. Ricardo Jorge.
22. Nogueira P, Paixão E, Nunes B, Falcão JM. Excesso de calor em Agosto de 2005: Efeitos namortalidade: Estimativas para Portugal Continental. Lisboa.: Observatório Nacional deSaúde – Instituto Nacional de saúde Dr. Ricardo Jorge. 2005.
23. Paixão E, Nogueira P, Nunes A, Nunes B, Falcão JM. Temperaturas elevadas em Agostode 2006: Evidências de um efeito moderado na mortalidade (Nota preliminar). Lisboa:Observatório Nacional de Saúde – Instituto Nacional de saúde Dr. Ricardo Jorge; 2006.
24. Maximum period > five consecutive days with Tmax >5 degrees Celsius above the1961-1990 Tmax normal (WMO – TD No. 1110).
25. Hentschel, G. (1987). A human biometeorology classification of climate for large andlocal scales. In Proc. WMO/HMO/UNEP Symposium on Climate and Human Health,Leningrad 1986, Vol. I, WCPA–No. 1, WMO.
26. WMO (1972). The Assessment of Human Bioclimate. WMO Tech. Note No. 123, WMONo. 331, WMO, Geneva. Hentschel, G. (1987). Op. Cit.
Further reading:– Collier, C. G. & Hardaker, P. J. (1995). Weather, air quality and health. Meteorol. Appl., 2:
313-322.– Ferreira, João; Álvaro Silva e F. Espírito Santo (2004) Caracterização do Conforto
Bioclimático em Portugal Continental. Monografia nº48, Instituto de Meteorologia.Lisboa, Portugal
– Kalkstein, L. S., Jamson, P. F., Greene, J. S., Libby, J. & Robinson, L. (1996). ThePhiladelphia Hot Weather - Health Watch/Warning System: development andapplication, Summer 1995. Bull. Am. Meteorol. Soc., 77: 1519-1928.
– Li. P.W. & Chan S.T., (2000) Application of A Weather Stress Index for Alerting thePublic to Stressful Weather in Hong Kong Meteorological Applications, 7, p.p.369-375
– Steadman, R. G. (1979). The assessment of sultriness. Part I: A temperature humidityindex based on human physiology and clothing science. J. Appl. Meteorol., 18: 861-873.
– Steadman, R. G. (1984). A universal scale of apparent temperature. J. Climat. Appl.Meteorol., 23: 1674-1687.
– WHO/WMO/UNEP (1987). Climate and Human Health. WCAP, WMO,Geneva.WHO/WMO/UNEP (1996a). Climate and Human Health (edited by Kalkstein, L.S., Maunder, W. J. and Jendritzky, G.), WMO No. 843, WMO, Geneva.WHO/WMO/UNEP (1996b). Climate Change and Human Health (edited by McMichael,A. J., Haines, A., Slooff, R. and Kovats, S.), WHO.
– WMO (1972). The Assessment of Human Bioclimate. WMO Tech. Note No. 123, WMONo. 331, WMO, Geneva.
Improved weather-related services in cities in the face of climate, weather and population changes1. United Nations Population Division, 2002. World Urbanization Prospects: The 2001
Revision, Data Tables and Highlights. ESA/P/WP.173, Department of Ecocnomic and SocialAffairs, United Nations Secretariat, New York, March 20, 2002.
2. Watson, R.T. and Core Writing Team, 2002. Climate Change 2001: Synthesis Report.Summary for Policymakers: An Assessment of the Intergovernmental Panel on Climate Change,Cambridge University Press, Cambridge and New York, 34pp.
3. McBean, G. and D. Henstra, 2003: Climate change, natural hazards and cities. ILCRResearch Paper Series, No. 31, Institute for Catastrophic Loss Reduction, University ofWestern Ontario, London, Ontario, Canada, 16pp.
4. Dabberdt, W.F. et al., 2000. ‘Forecast issues in the urban zone: report of the 10th
Prospectus Development Team of the US Weather Research Program’, Bull. Amer. Meteor.Soc., 81(9), 2047-2064.
5. Voogt, J. A., 2004. Urban heat islands: hotter cities,http://www.actionbioscience.org/environment/voogt.html#Primer
6. Bornstein and Lin, 1999.7. Changnon, S. A., K. E. Kunkel, and B. C. Reinke, 1996: ‘Impacts and responses to the
1995 heat wave: A call to action’, Bull. Amer. Meteor. Soc., (77), 1497–1506.8. http://www.earthobservations.org/progress/transverse_areas/
capacity_building.html
[ ]214
7.References:Paginated book 16/2/07 10:21 Page 214
[ ]215
9. Dabberdt, W.F. et al., 2005a. ‘The Helsinki mesoscale testbed: an invitation to use a new3-D observation network’, Bull. Amer. Meteor. Soc., 86(7), 906-907.
10. Dabberdt, W.F. et al., 2005b. ‘Multifunctional mesoscale observation networks’, Bull.Amer. Meteor. Soc., 86(7), 961-982.
EnergyWeather, climate and water information and the energy sector1. GEOSS 10-Year Implementation Plan Reference Document.2. Key World Energy Statistics, 2006. International Energy Agency.3. World Energy Outlook, 2004. International Energy Agency.4. IPCC Third Assessment Report, 2001.5. Thomas J. Teisberg, Rodney F. Weiher, and Alireza Khotanzad: ‘The economic value of
temperature forecasts in electricity generation’, Bulletin of the American MeteorologicalSociety, December 2005
6. World Energy Outlook, 2004, op. cit.7. United Nations, 2000: United Nations Millennium Declaration, General Assembly Resolution
A/Res/55/2, 18 September 2000.
Effect of climate change on glaciers and hydropower in Iceland1. Bergström, S., Jóhannesson, T., Aðalgeirsdóttir, G., Ahlstrøm, A., Andreassen, L. M.,
Andréasson, J., Beldring, S., Björnsson, H., Carlsson, B., Crochet, P., de Woul, M.,Einarsson, B., Elvehøy, H., Flowers, G. E., Graham, P., Gröndal, G. O., Guðmundsson,S., Hellström, S-S., Hock, R., Holmlund, P., Jónsdóttir, J. F., Pálsson, F., Radic, V., Roald,L. A., Rosberg, J., Rogozova, S., Sigurðsson, O., Suomalainen, M., Thorsteinsson, Th.,Vehviläinen, B., and Veijalainen, N. 2007. Impacts of climate change on river runoff,glaciers and hydropower in the Nordic area. Joint final report from the CE HydrologicalModels and Snow and Ice Groups. SMHI Report. Fenger, J. (editor) 2007. Impacts ofClimate Change on Renewable Energy Sources - Their Role in the Nordic Energy System.Copenhagen, Nordic Council of Ministers.
TransportationWMO and ICAO: working together for international air navigation1. The author gratefully acknowledges the contribution of the WMO Secretariat in producing
this article, which is based on a previously published piece: ‘WMO and ICAO worktogether for international air navigation’, WMO Bulletin 55:2, April 2006.
2. See ‘Working arrangements between the WMO and ICAO’, (ICAO Doc 7475 andWMO-No. 60).
3. Annex 3 – ‘Meteorological service for international air navigation to the Convention onInternational Civil Aviation’ is a document maintained by ICAO. Annex 3 is also issued,mutatis mutandis, by WMO as Technical Regulations [C.3.1], i.e. a document identicalto ICAO Annex 3 except for a few minor details involving terminology that do not alterthe substance of the document.
4. A complete list of ICAO and WMO manuals and guides is available from the ICAO andWMO Web sites at www.icao.int and www.wmo.int, respectively.
5. WMO-No. 306, Volume I.1, Part A.
Applications of weather and climate information in road transportation: examples from Canada1. Transport Canada, 2003. Transportation in Canada 2003 Annual Report. TP13198E.
Transport Canada, Ottawa, ON. http://www.tc.gc.ca/.2. Transport Canada, 2000. Canadian Vehicle Survey.
http://www.tc.gc.ca/pol/en/cvs/files/TC_2000_CVS%20Report_E.pdf3. Transport Canada 2003, op.cit.4. Andrey, J. and B. Mills. ‘Climate change and the Canadian transportation system:
vulnerabilities and adaptations’, chapter 9 in J. Andrey and C. Knapper (eds) Weatherand Transportation in Canada, Department of Geography Publication Series, No. 55.University of Waterloo, Waterloo, Canada. 2003. pp.235-279.http://www.fes.uwaterloo.ca/Research/GeogPubs/pdf/transportation_andrey01.pdfAndrey, J. and B. Mills. ‘Transportation’, Chapter 8 in D.S. Lemmen and F.J. Warren(eds) Climate Change Impacts and Adaptation: A Canadian Perspective. Government ofCanada, Ottawa. 2004. pp. 131-149.http://adaptation.nrcan.gc.ca/app/filerepository/F80B56D9915F465784EBC57907478C14.pdf
5. Crevier, L-P. and Y. Delage. METRo: A New Model for Road-Condition Forecasting inCanada, Journal of Applied Meteorology, 40(11):2026-2047. 2000.
6. Environment Canada and Health Canada 2001. Priority Substances List Assessment Report– Road Salts. Prepared under the Canadian Environmental Protection Act, 1999.http://www.ec.gc.ca/substances/ese/eng/psap/final/roadsalts.cfm. Accessed June 2002.
7. Jones, B. ‘The cost of safety and mobility in Canada: winter road maintenance’, chapter5 in J. Andrey and C.K. Knapper (eds) Weather and Road Transportation, Department ofGeography Publication Series, Monograph 55. University of Waterloo, Waterloo, Canada.2003. pp. 121-142.
8. Morin, D. and M. Perchanok. ‘Road salt use in Canada’, chapter 6 in J. Andrey and C.K.Knapper (eds) Weather and Road Transportation, Department of Geography PublicationSeries, Monograph 55. University of Waterloo, Waterloo, Canada. 2003. pp. 143-160.
9. Suggett, J., A. Hadayeghi, J. Andrey, B. Mills, and G. Leach. ‘Development of winterseverity indicator models for Canadian winter road maintenance’, 86th Annual MeetingPreprint CD-ROM, proceedings of the Transportation Research Board annual meeting,January, 2007, Washington, D.C.
10. Haas, R. Pavement Design and Management Guide. Transportation Association of Canada,Ottawa, ON. (ed.) 1997.
11. Clayton, A., J. Montufar, and R. McGregor. Using Intelligent Transportation Systems toAdapt to Potential Climate Change Impacts on Seasonal Truck Weight Limits. Report prepared for the Climate Change Impacts and Adaptation Program, Natural ResourcesCanada. Transportation Information Group, University of Manitoba, and EBAEngineering Consultants Ltd., Winnipeg, MB. 2006. 60pp; Huen, K., S. Tighe, B. Mills,and C. Haas. Using Road Weather Information Systems (RWIS) to Control Load Restrictionson Gravel and Surface Treated Highways: Phase I Final Report. Prepared for the HighwayInfrastructure Innovation Funding Program, Engineering Standards Branch, OntarioMinistry of Transportation. Department of Civil Engineering, University of Waterloo,Waterloo, ON. 2006. 63pp.
12 Mills, B., S. Tighe, J. Andrey, K. Huen and S. Parm. Climate change and the performance ofpavement infrastructure in southern Canada: Context and case study. CD Proceedings of theEIC Climate Change Technology Conference, Engineering Institute of Canada, Ottawa,May 10-12, 2006. ISBN 1-4244-0218-2.For a review of the potential implications of climate change for many other forms ofinfrastructure, see: Auld, H. and MacIver, D. ‘Cities and Communities: The ChangingClimate and Increasing Vulnerability and Infrastructure’, in A. Fenech, D. MacIver, H.
Auld, R. Bing Rong, and Y. Yin (Eds.) Climate Change: Building the Adaptive Capacity,Meteorological Service of Canada, Environment Canada, Toronto, Ontario, Canada. 2004.pp. 289-305; Auld, H., D. MacIver, and J. Klaassen.. Adaptation options for infrastructureunder changing climate conditions. CD Proceedings of the EIC Climate Change TechnologyConference, Engineering Institute of Canada, Ottawa, May 10-12, 2006. ISBN 1-4244-0218-2; Auld, H., J. Klaassen, and N. Comer. Weathering of building infrastructure and thechanging climate: Adaptation options. CD Proceedings of the EIC Climate ChangeTechnology Conference, Engineering Institute of Canada, Ottawa, May 10-12, 2006.ISBN 1-4244-0218-2.
13. Ipsos-Reid Corporation. Public Views on Weather Warnings. Final report submitted toEnvironment Canada, May 2001. 27pp.
14. Transport Canada 2001. Transportation in Canada 2001 Annual Report. TP13198E.Transport Canada, Ottawa, ON. http://www.tc.gc.ca/.
15. Andrey, J, B. Mills, D. Unrau, M. Christie and S. Michaels. Toward a National Assessmentof the Travel Risks Associated with Inclement Weather, ICLR Paper Series, Institute forCatastrophic Loss Reduction, London, Ontario. 2005. 35 pp.http://www.iclr.org/research/publications_climate.htm.
16. Ibid.17. Andrey, J. and B. Mills. ‘Climate change and the Canadian transportation system:
vulnerabilities and adaptations’ 2003. Op. Cit.
The economic value of snowstorm forecasts in winter road-maintenance decisions1. Bramshill Consultancy (1995). Study on improved methods for quantifying the benefits of ESA
programmes. Basingstoke, United Kingdom, Bramshill Consultancy Limited, Final Report(ESA 10699/93/F/HEW): 56 pp; Liljas, E., and Murphy, A.H. (1996). On the economicvalue of snowstorm forecasts in winter road-maintenance decisions in Sweden. Eight StandingRoad Weather Conference, Birmingham, United Kingdom
2. Bramshill, op. cit.3. Murphy, A.H. (1994). ‘Assessing the economic value of weather forecasts: an overview of
methods, results, and issues’. Meteorological Applications, 1: 69-734. Bramshill, op. cit.5. Ibid.6. Ibid.
ConstructionSustainable, energy-efficient building: the BCIL approachChandrashekar Hariharan is the CEO of BCIL. An economist with a doctorate in wave theory,he moved from development work to focus for the past 17 years on alternative enterprise.Working mainly in India, he has also partnered sustainability programmes with the Manila-based Asian Development Bank and organizations in France.
III NATURAL & HUMAN-INDUCED DISASTERS
Using what we know about disasters – for safer lives and livelihoods1. According to preliminary figures of the Centre for Research on the Epidemiology of Disasters
of the University of Louvain (CRED), Brussels, 29 January 2007, http://www.cred.be/2. Munich Re Press Release, 28 December 2006. http://www.munichre.com/ Munich Re has
a different set of criteria to estimate losses and categories of disasters to those of CRED.3. Report of the Secretary-General on the Implementation of the International Strategy for
Disaster Reduction, A/61/229, 8 August 2006. Paragraph 1.4. This common expression is recognized as being imprecise in describing disaster events for
the reasons cited. It is used here only to make the initial distinction from other types ofdisasters resulting from more deliberate human intervention such as violence, civil conflict,terrorism and similar war-like conditions associated with matters of state security, subjectswhich are not addressed by this article. In many instances, the use of natural hazards caneasily replace that of “natural” disasters, which in addition to being imprecise and incorrectis also misleading as it implies that if they are “natural”, they must be unavoidable or “actsof God”. In order to be more precise, the longer term of ‘disasters caused by vulnerabilityto natural hazards’ should be used or at the minimum that of ‘disasters triggered by naturalhazards’ and in extremis the use of quotes on “natural “ disasters
5. The Global Survey of Early Warning Systems, United Nations, September 2006. Presented tothe UN General Assembly, 61st session, Second Committee, Agenda item 53(c) underA/C.2/61/CRP.1 of 3 October 2006.
6. Professor Peter Höppe, Head of Munich Re’s Geo Risks Research, Munich Re, Press Release,28 December 2006. http://www.munichre.com/
7. Stern Review on the Economics of Climate Change, Nicholas Stern, HM Treasury, London,October, 2006.
8. The full text of the Hyogo Framework, as well as the Final Report of the WCDR can beseen at http://www.unisdr.org/eng/hfa/hfa.htm
9. Many examples can be found in the ISDR publication, Living with Risk: A global review ofdisaster reduction initiatives. (United Nations, 2004). Additional examples can also be foundin Know Risk, (United Nations, 2004) published through a private-public partnershipbetween the ISDR secretariat and Tudor Rose Publishers for the World Conference onDisaster Reduction, and a later volume, Real Risk (Tudor Rose, 2006). The recent guide“Words into Action” also provides practical examples and recommendations for theimplementation of the Hyogo Framework (see http://www.unisdr.org/eng/hfa/docs/words-into-action-consultation-draft.pdf).
Learning new methodologies to deal with large disasters: Near space monitoring ofthermal signals associated with large earthquakes1. Carreno E, R.Capote, A.Yague et al., ‘Observations of thermal anomaly associated to
seismic activity from remote sensing’, General Assembly of European SeismologyCommission, Portugal, 265-269, 2001; Fizzola C., N.Pergola, C.Pietrapertosa andV.Tramutoli, ‘Robust satellite techniques for seismically active area monitoring: asensitivity analysis on September 7, 1999 Athens’s earthquake’. Phys. Chem. Earth,Vol.29, pp.517-527, 2004
2. Tronin A. A., Molchanov O.A., Biagi P.F. ‘Thermal anomalies and well observations inKamchatka’. International Journal of Remote Sensing, Vol. 25, No. 13, 2649-2655, 2004;Tramutoli, V., Cuomo V, Filizzola C., Pergola N., Pietrapertosa, C.: ‘Assessing thepotential of thermal infrared satellite surveys for monitoring seismically active areas. Thecase of Kocaeli ( zmit) earthquake, August 17th, 1999’, Remote Sensing of Environment,96(3-4), 409-426, 2005
3. Pulinets et al, 20064. Singh and Ouzounov, 20035. Ouzounov, D., and F. Freund, Mid-infrared emission prior to strong earthquakes
7.References:Paginated book 16/2/07 10:21 Page 215

[ ]216
analyzed by remote sensing data, Adv. Space Res., 33(3), 268-273, 20046. Ouzounov D., N. Bryant, T. Logan, S. Pulinets, P.Taylor Satellite thermal IR phenomena
associated with some of the major earthquakes in 1999-2004, Physics and Chemistry ofthe Earth, 31,154-163, 2006
7. Pulinets et al., 2005b 8. Pulinets et al, 2006.
Satellite remote sensing for early warning of food security crises1. Skole, D. L. (2004) ‘Geography as a great intellectual melting pot and the preeminent
interdisciplinary environmental discipline’. Annals of the Association of AmericanGeographers, 94, 739-743
2. FEWS (2005) Famine Early Warning System Network Home Page. USAID FEWS NET3. Dilley, M. (2000) Warning and intervention: What kind of information does the response
community need from the early warning community? Washington DC, USAID, Office of US Foreign Disaster Assistance 2000
4. FEWS (2000) Framework for food crisis contingency planning and response. Arlington, VA,FEWS-ARD
5. Ibid; Dilley, M. and Boudreau, T. E. (2001) ‘Coming to terms with vulnerability: acritique of the food security definition’. Food Policy, 26, 229-247
6. Waymire, E. (1985) ‘Scaling limits and self-similarity in precipitation fields’. WaterResources Research, 21, 1271-1281; Xie, P. & Arkin, P. A. (1997) ‘Global Precipitation: A 17-year monthly analysis based on gauge observations, satelliteestimates, and numerical model outputs’. Bulletin American Meteorological Society, 78,2539-2558
7. Tucker, C. J., Newcomb, W. W., Los, S. O. and Prince, S. D. (1991) ‘Mean and Inter-Annual Variation of Growing-Season Normalized Difference Vegetation Index for theSahel 1981-1989’. International Journal of Remote Sensing, 12, 1133-1135
8. www.fews.net9. Mathys, E. (2005) FEWS NET’s Approach to Livelihoods-Based Food Security Analysis.
Washington DC, FEWS NET USAID.
Unjust waters: climate change, flooding and the protection of poor urban communities in Africa1. This article is an edited version of the research report ‘Unjust Waters’ (ActionAid, 2006.
Download at www.actionaid.org), and highlights findings from three cities from the study,Accra in Ghana, Maputo in Mozambique and Kampala in Uganda. The other cities in thestudy are Freetown (Sierra Leone), Maputo (Mozambique) and Nairobi (Kenya). Policyanalysis was also carried out to understand whether there is a gap between poor urbanpeople’s experiences of climate change impacts and current disaster managementpolicies. ActionAid International works with more than 13 million individuals acrossAfrica, Asia, Latin America and the Caribbean through some 2,000 civil societypartners. For more information, visit www.actionaid.org or [email protected]
2. IPCC Working Group II, 2001, Impacts, Adaptation and Vulnerability: Chapter 10 ‘Africa’,Cambridge University Press, Cambridge.
3. Nicholls R, Hoozemans F and Marchand M, 1999, Increasing flood risk and wetlandlosses due to global sea-level rise: regional and global analyses. Global EnvironmentalChange 9, S69-S87
4. Jallow B, Toure S, Barrow M and Mathieu A, 1999, ‘Coastal zone of the Gambia andthe Abidjian region in Cote d’Ivoire: sea level rise vulnerability, response strategiesand adaptation options’. Climate Research Special Issue 6, 137-143
5. IPCC Working Group II, 20016. Signed by 168 countries at the World Conference for Disaster Reduction, Kobe, Jan
2005. See www.unisdr.org
Adapting to climate change through resilience to natural disasters1. Ministry of Environment and Forests, Government of India, (2004) India’s Initial
National Communication to the United Nations Framework Convention on ClimateChange, pp 266. (www.natcomindia.org)
2. Goswami, B. N., V. Venugopal, D. Sengupta, M. S. Madhusoodanan, Prince K. Xavier,(2006) Increasing Trend of Extreme Rain Events Over India in a Warming Environment,Science, 314, 1442-1445.
3. Kelkar, R. R., (2005) Understanding the Extreme Weather Events, IWRS Newsletter,November 2005.
Climate, man and forest fires1. Goldammer, J.G. and Mutch, R. W. (2001) FRA 2000. Global Forest Fire Assessment 1990-
2000. FAO Forestry Department. Forest Resources Assessment Programme. WorkingPaper 55. Rome 2001.
2. Chandler, C., Cheney P., Thomas P., Trabaud L., Williams D. (1983) Fire in Forestry(Vol.I) John Wiley & Sons, New York.
3. Viegas, D.X. (2005) ‘A Mathematical Model for Forest Fires Blow-up’, Combustion Scienceand Technology, 177: 27-51.
4. Pyne, S. J., P. Andrews and R. D. Laven (1996) Introduction to Wildland Fire (SecondEdition) - Ed. John Wiley & Sons, New York.
IV ENVIRONMENT
The African Monitoring of the Environment for Sustainable Development Initiative: atimely initiative to save an endangered continent1. About EUMETSAT: EUMETSAT is responsible for operating Europe’s weather satellites
in geostationary and polar orbits, and for delivering satellite data, services and productsto the European National Meteorological Services, research and training institutions andother end users. EUMETSAT currently has 20 Member States and 10 Cooperating Statesand works in close collaboration with the World Meteorological Organization (WMO),the European Union, the European Space Agency and other European and internationalpartners, industrial companies and space agencies. In addition to AMESD and PUMA,EUMETSAT contributes to other strategically important projects such as the EuropeanGlobal Monitoring for Environment and Security (GMES) initiative, the Global EarthObservation System of Systems (GEOSS) and the WMO’s World Weather Watch andGlobal Observing System.
Climate information applications for sustainable development in Africa1. FEWS 1998: USAID-financed Famine Early Warning System. January 28, 1998, AFR/98-
01, 8 pp
2. Hammer, G. L., 2000: ‘A general system approach to applying seasonal climate forecasts’.Applications of seasonal climate forecasting in agricultural and natural ecosystems: the Australianexperience. Atmospheric and Oceanographic Sciences Library, vol. 21
3. ICPAC, 2005: ‘Media Workshop Report’. Fifteenth Greater Horn of Africa Climate OutlookForum (GHA-COF15), Mombasa, Kenya. 19pp
4. Linthicum K.J., Anyamba, A, Tucker C J., Kelly P. W., Myers M. F., Peters C. J., 1999:‘Climate and satellite indicators to forecast Rift Valley Fever’. Science 285:397-400
5. ICPAC, Op. Cit.
V ASSESSMENT METHODOLOGIES
Methodologies for assessing the economic benefits of National Meteorological andHydrological Services1. Lazo, J.K. and L.G. Chestnut. 2002. Economic Value of Current and Improved Weather
Forecasts in the U.S. Household Sector. Prepared for Office of Policy and Strategic Planning,NOAA. November 22.
2. Teisberg, Thomas J., Rodney F. Weiher, and Alireza Khotanzad. 2005. ‘The EconomicValue of Temperature Forecasts in Electricity Generation’, Bulletin of the AmericanMeteorological Society 86, 12, 1765–1771.
3. Ebi, Kristie L., et al., 2004. ‘Heat Watch/Warning Systems Save Lives: Estimated Costsand Benefits for Philadelphia 1995–1998’, Bulletin of the American Meteorological Society,85, 8, 1067–1073.
4. The authors thank Charles S. Colgan for helpful discussions. All economic sectors, regions, and individuals on Earth are affected by weather. In any application areas, a better understanding of these interactions could enhancepersonal safety, reduce property damage, and increase economic efficiency, savingmultiple lives and millions of dollars each year. If we are to realize these potentialbenefits, we need to thoroughly understand how individuals and socioeconomicsectors do and could use different types of weather information. To learn more about work toward this goal, visit NOAA’s Economics & Social Science(NESS) Web site at www.economics.noaa.gov. As an agency, NOAA is focused on theearth’s physical sciences, but recognizes that interactions between earth science andsocial science are vital to its ultimate goal – giving users what they need. The NESSprogramme and Web site is part of NOAA’s Office of Program Planning and Integration(PPI). Another valuable resource can be found at www.sip.ucar.edu. NCAR, withfunding from the US Weather Research Program, established the CollaborativeProgram on the Societal Impacts and Economic Benefits of Weather Information (SIP)to create a dedicated focal point for assembling, coordinating, developing, andsynthesizing research and information on the societal impacts and economic benefitsof weather information.
Moving from hindsight to foresight: a challenge in the application of valuation research1. This is acknowledged, among other places, in Shapiro, M A and A J Thorpe,
THORPEX International Science Plan Version III, International Science SteeringCommittee, 2004. http://www.wmo.int/thorpex/publications.html.
2. Mills, B. Decision Support Systems: Considerations for THORPEX SERA. Background themepaper for the workshop on North American THORPEX Societal and Economic Researchand Applications, Boulder, CO, August. 2006. 14-16.
3. Katz, R.W. and A.H. Murphy. Economic Value of Weather and Climate Forecasts. CambridgeUniversity Press, New York. 1997. 222 pp.
4. See, for example, Jochec, K.G., J.W. Mjelde, A.C. Lee, and J.R. Conner. ‘Use of seasonalclimate forecasts in rangeland-based livestock operations in West Texas’, Journal ofApplied Meteorology, 40(9). 2001.1629–1639; Fox, G., J. Turner, and T. Gillespie. ‘hevalue of precipitation forecast information in winter wheat production’ Agricultural andForest Meteorology, 95. 1999. 99-111.
5. Roulston, M.S., D.T. Kaplan, J. Hardenberg and L.A. Smith, ‘Using medium-rangeweather forecasts to improve the value of wind energy production’, Renewable Energy, 28.2002. 585-602.
6. For example: Ebi, K.L., T.J. Teisberg, L.S. Kalkstein, L. Robinson and R.F. Weiher. ‘Heatwatch/warning systems save lives: Estimated costs and benefits for Philadelphia 1995–98’,Bulletin of the American Meteorological Society, 85(8). 2004. 1067–1073.
7. Gunasekera, D., G. Mills, N. Plumier, T. Bannister, L. Anderson-Berry, M. Williams, A.González-Cabán, and J. Handmer. Economic Value of Fire Weather Services. BMRC ResearchReport No. 112, Bureau of Meteorology Research Centre, Melbourne. 2005. 61pp.
8. Keith, R. ‘Optimization of value of aerodrome forecasts’, Weather and Forecasting, 18(5)2003. 808–824; Smith, K. and S.D. Vick. Valuing weather radar benefits for winter roadmaintenance: a practical case example, Meteorological Applications,1. 1994. 103-115;Stewart, T.R., R. Pielke Jr., and R. Nath. ‘Understanding user decision making and thevalue of improved precipitation forecasts’, Bulletin of the American Meteorological Society,85(2). 2004. 223-235.
9. Hamlet, A.F., D. Huppert, and D.P. Lettenmaier. ‘Economic value of long-lead streamflowforecasts for Columbia River hydropower’, Journal of Water Resources Planning andManagement, 128. 2002. 91-101.
10. Rollins, and J. Shaykewich. ‘Using willingness-to-pay to assess the economic value ofweather forecasts for multiple commercial sectors’, Meteorological Applications, 10.2003. 31-38; Lazo, J.K. and L. Chestnut. Economic value of current and improved weatherforecasts in the US household sector. Stratus Consulting, SC10050. 2002. 21 pp; Brown,J.S. Valuation of weather forecast services: discrete choice and CVM approaches. MSc. thesis,University of Guelph, Guelph, Canada. 2003.
11. Vodden, K. and D.A. Smith. Valuing Meteorological Products and Services: Case Study of theNational Radar Project. Report prepared for the Adaptation and Impacts Research Group,Meteorological Service of Canada. Applied Research Consultants, Ottawa, Canada.2003. 20 pp.
12. Cavlovic, A., J. Forkes and K. Rollins. The Economic Value of Environment Canada’sWeatheradio Service for Users in Maritime Communities of Atlantic Canada. Department ofAgricultural Economics and Business, University of Guelph. 1997.
13. As noted in Morss, R.E., J.K. Lazo, H.E. Brooks, B.G. Brown, P.T. Ganderton and B.N.Mills. ‘Societal and Economic Research and Application Priorities for the North AmericanTHORPEX Program’, Bulletin of the American Meteorological Society. Submitted. 2007.
14. E.g., Dempsey and Fisher, 2005; Cohen et al., 2006 15. For example, Environment Canada’s Climate Change Impacts and Adaptation Research
Network consist of federal scientists working in academic institutes and faculties; alsoEnvironment Canada is in the process of developing an Environmental PredictionStrategy
16. http://www.wmo.int/thorpex/
7.References:Paginated book 16/2/07 10:21 Page 216
Related Documents