PUBLIC TREATMENT OF PRIVATE WASTE: INDUSTRIAL USE OF MUNICIPAL WASTEWATER TREATMENT Winston Harrington and Peter Nelson February 2006

Welcome message from author
This document is posted to help you gain knowledge. Please leave a comment to let me know what you think about it! Share it to your friends and learn new things together.
Transcript

PUBLIC TREATMENT OF PRIVATE WASTE: INDUSTRIAL USE OF MUNICIPAL
WASTEWATER TREATMENT
Winston Harrington and Peter Nelson
February 2006

Table of Contents Acknowledgments ................................................................................................................ii Executive Summary ............................................................................................................ iii I. Introduction........................................................................................................................ 1 II. Regulatory Structure ....................................................................................................... 3
Overview of the Clean Water Act.................................................................................. 3 Regulations for Point Sources ........................................................................................ 5
POTWs..........................................................................................................................6 Direct Discharges from Industrial Plants ................................................................8 Indirect Discharges from Industrial Plants .............................................................9
III. Performance................................................................................................................... 11 Has Water Quality Improved?..................................................................................... 12
IV. Long-Run Responses of Point Sources to the CWA.............................................. 14 Legacy of the POTW Construction Grants Program ................................................ 16
Incentives for Building Excess Capacity................................................................16 Incentives Encouraging Technical Inefficiency ....................................................18
Trends in Direct and Indirect Discharge .................................................................... 19 Beyond Anecdotal Evidence ...................................................................................22 Three Specific Cases..................................................................................................25 Total Discharge..........................................................................................................28
Spread of Waste-Based Sewer Surcharges ................................................................. 29 Background................................................................................................................29 Trends in Use of Surcharges....................................................................................30 Trends in Surcharge Rates .......................................................................................33
Are Waste-Based Surcharges Effluent Fees?.............................................................. 35 Are the Rates High Enough? ...................................................................................35 Do Plant Operators Respond to Fees?....................................................................38 Are Waste Surcharges Policy Instruments? ..........................................................43
V. Conclusions, Qualifications, and Future Trends..................................................... 44 Some Qualifications ....................................................................................................... 45 Future Trends ................................................................................................................. 46
References............................................................................................................................. 50
i

Acknowledgments This research was made possible by a generous grant from the Andrew W. Mellon Foundation. We are grateful for the assistance of numerous individuals in the wastewater treatment industry, who patiently answered questions and provided with data. It would be impossible to name all the individuals consulted, but a partial list is as follows: Roy Carawan, Ken Rubin, Ed Stone, Gary Kelman, Lyle Milby, Wende Smith, Rene Javier, Carey Johnston, Jan Pickrel, Chris Hornback, Guy Aydlett, Richard Sustich, Peter Pineda, Marvin Rubin, Mary Smith, Mahesh Podar, William Anderson. Both the initial and final drafts of the report benefited tremendously from the superb editorial work provided by Felicia Day and Pam Angulo. Naturally, any errors that remain are the sole responsibility of the authors.
© 2006 Resources for the Future. All rights reserved. No portion of this paper may be reproduced without permission of the authors.
ii
Public Treatment of Private Waste: Industrial Use of Municipal Wastewater Treatment
Winston Harrington and Peter Nelson
Executive Summary This report traces the evolution of water pollution regulation for industrial stationary
sources in the United States since the enactment of the Clean Water Act (CWA) in 1972. It is a follow-on to an earlier study (Harrington 2004) that was a retrospective look at industrial water pollution regulation prepared as a chapter in a book published by RFF Press. An unintended outcome of that study was the discovery of some tantalizing evidence suggesting that water pollution policy for industrial sources had evolved over time so as to be a considerably different policy from what had been envisaged when the CWA was first passed. Briefly, the new evidence suggested a decline in the importance of the direct discharge of industrial pollutants into receiving waters relative to indirect discharge (i.e., into publicly owned treatment works [POTWs]). Along with this change came others: a shift in the balance of decisionmaking away from federal officials and toward officials at the state and local levels, and a decentralization of data-gathering and record-keeping functions. In addition, findings indicated that for some industries and for some pollutants, the policy instrument controlling wastewater discharges was no longer direct regulation, as specified in the CWA, but a form of economic incentive.
If these tentative findings were borne out, it would mean that the CWA as implemented is now quite different from the CWA as originally designed. The CWA was one of the earliest and is still one of the most important pieces of environmental legislation passed in the United States in the modern era of environmental concern. In addition to vastly expanding an existing grant program for POTWs, it gave the federal government a role in water pollution regulation, which had hitherto been a matter for state and local governments. The purpose was to restore the nation’s waters to conditions safe for swimming, fishing, and boating by 1983, on the way to achieving the ultimate goal of “zero discharge” of pollutants by 1985. The CWA required every discharger into the nation’s waters to have a discharge permit, and it directed the then-new U.S. Environmental Protection Agency (EPA) to develop an elaborate set of effluent controls for POTWs and industrial point sources of pollution that would set the terms for these permits. These point-source controls were to be based on the performance achievable by a set of increasingly capable technologies to be identified by EPA. Local and state governments were expected to play a prominent role, which included operating local programs under federal
iii

Public Treatment of Private Waste: Industrial Use of Municipal Wastewater Treatment
oversight. To assist local governments in meeting their responsibilities, the CWA massively expanded an existing cost-sharing program to build new POTWs or expand existing ones.
In other words, the policy approach to industrial wastewater dischargers in the CWA was designed to be one of the most controlling, centralizing legislative packages that one could imagine. Over time, it has decentralized as state and local governments took on more and more operational responsibilities. Somewhat unexpectedly, however, it appears also to have evolved toward the significant use of economic incentives.
Briefly, our story is that Congress provided POTWs with incentives to overbuild, giving them considerable excess capacity during the early years of the CWA. This overcapacity also gave POTWs an incentive to attract indirect dischargers at user fees those dischargers found attractive. In response to greater industrial use of POTW capacity and congressional requirements on facilities with construction grants to recover costs from industrial users, POTWs resorted to waste surcharges for certain pollutants. Surcharged pollutants differed from one POTW to the next; they were most commonly used for organic pollutants and rarely, if ever, for toxic pollutants. As this capacity was drawn down, POTWs increasingly relied on surcharges for revenues. As they went up, eventually the rates began to create abatement incentives for plants with low marginal abatement costs. Plants with high marginal costs did not change their behavior but did pay the fees. Plants that only discharged pollutants without surcharges had no incentives and paid no fees.
Our argument consists of four hypotheses, and the main objective of this report is to evaluate the evidence for and against each, then come to some judgment about the extent and significance of the evolution of industrial water pollution policy. Those four propositions are
1. POTWs responded to Construction Grants program subsidies by overinvesting in plants and equipment.
2. The importance of direct dischargers (those that send their wastewater directly to receiving waters) slowly declined relative to that of indirect dischargers (those that discharge into a sewer).
3. POTWs introduced and steadily increased waste surcharge fees on industrial discharges (i.e., fees charged per unit of waste discharged).
4. Some firms began to respond to surcharges on conventional pollutants rather than effluent limits.
We find that the available evidence supports these propositions, although that evidence is not always as abundant as we would like, and that support is qualified for all cases except Proposition 1.
iv

Public Treatment of Private Waste: Industrial Use of Municipal Wastewater Treatment
No original research was done for this report with respect to the first hypothesis, which most detached observers generally have accepted as true, largely on theoretical grounds. We rely on one of the surprisingly few empirical studies of the question, a study prepared by the Congressional Budget Office (CBO) in 1985, which compared the investment choices of POTWs eligible for the subsidies with POTWs that were not and found strong support for the notion that the subsidy program would cause excessive investment. The study showed that subsidized plants were not only more capital intensive but also much larger than warranted by current and anticipated future treatment needs.
Evidence for Proposition 2, concerning the trends in the relative and absolute importance of direct and indirect dischargers, comes from several sources, including the Toxic Release Inventory (TRI)—industry studies conducted by EPA in the 1970s and 1980s to support the development of effluent guidelines—and data from EPA’s Permit Compliance System (PCS). Even taken together, however, these data do not produce a complete picture. For 16 industries we compare the number of direct and indirect dischargers in the late 1970s or early 1980s with the corresponding number in the 1990s or later in the same 16 industries. What is most obvious from this comparison is that the number of dischargers, both direct and indirect, has fallen drastically, reflecting the shift away from manufacturing in American industry during the 1980s and 1990s. For 10 of the 16 industries studied, the counts also show a shift from direct to indirect discharge, and considering the total number of plants in these industries, this trend is very strong. The number of direct dischargers fell by 91 percent during the period, whereas that of indirect dischargers fell by 44 percent.
Proposition 3 concerns trends in waste surcharges. Here, the main source of information is surveys conducted every 3 years by the Association of Metropolitan Sewerage Agencies (AMSA), one of the principal trade associations for POTWs, between 1990 and 2002. A comparison of the surveys for various years shows that by 1990, the frequency of use of surcharges and water volumetric charges was very high, at around 80 percent and 90 percent of the respondents in the AMSA survey, respectively. Had our dataset on the use of fees extended back further—say, to 1980—we believe that we would have seen an increasing trend during the 1980s as well. After 1990, contrary to our expectations, usage then dropped steadily until 2002, when waste surcharges were used by only 65 percent of POTWs and volumetric charges by 72 percent.
Proposition 4 concerns the effect of the waste surcharges on pollutant loadings. Again, data from several sources reflect mixed results. First, surcharge rates from the plants in the AMSA surveys indicate that the charges imposed on a typical plant at the typical POTW were generally much lower than fees imposed by regional water boards in the Netherlands, where
v

Public Treatment of Private Waste: Industrial Use of Municipal Wastewater Treatment
fees have incentive effects. However, 7 percent of the POTWs in the AMSA survey had fees that exceeded those in the Netherlands, so at least some POTWs in the United States have fees at least as high as fees known to have incentive effects in other jurisdictions. Finally, data on actual surcharges paid and effluents discharged for a set of plants discharging into the Baltimore City POTW for several years show substantial reductions in both total loads and waste concentrations of biochemical oxygen demand (BOD) and total suspended solids (TSS) in most industrial categories. This result is consistent with that of a system in which fees are effective.
Looking back, it appears as though this train of events was first set in motion, at least in part, by the expansion of the Construction Grants program. In the future, the industry cannot count on the reappearance of such large federal subsidies. On the one hand, it suggests that the conditions favoring a shift from direct to indirect discharge will not recur, and conceivably, the trend could reverse. On the other hand, the need for revenues will make the surcharges difficult to live without and may drive up the rates, increasing the likelihood of their having incentive effects. So far, waste surcharges have been applied primarily to BOD and TSS, but their potential applicability is much wider. They have been used—much less frequently—for nitrogen; phosphorus; and fats, oils, and grease (FOG). They have not been used for toxic pollutants that might damage POTWs or for pass-through pollutants, although in principle they could be.
The limitations of the available data and the lack of complete support for the hypotheses suggest opportunities for additional research. Currently, there is no nationwide database to track permit limitations, discharges, or surcharge rates. Better data would of course allow more definitive tests of these hypotheses and might suggest refinements to some of them. Certainly, the partial evidence for the propositions presented here suggests that even more interesting findings await discovery.
Finally, despite the apparent incentive effects of the waste surcharges in some instances, little hard evidence indicates that their use for this purpose has been deliberate. They are still considered primarily as revenue-raising devices. In the future, perhaps that view will change. The allocation of industrial waste influent to POTWs is an eminently feasible application of economic incentives for pollution abatement cap-and-trade programs as well as effluent fees. Still, direct regulation remains an important instrument, perhaps the dominant instrument, for the control of indirect dischargers. But the experience of waste surcharges, which appear to have created these incentive effects by stealth, may have the track record to assure skeptics of the value and effectiveness of economic incentives.
vi

1
Public Treatment of Private Waste: Industrial Use of Municipal Wastewater Treatment
Winston Harrington and Peter Nelson
I. Introduction Water pollution regulation in the United States is guided primarily by the Clean
Water Act (CWA; 33 U.S.C. Chapter 26) enacted in 1972.1 The CWA was a controversial departure from previous water pollution regulation. On two points, however, everyone agreed.
First, the federal government inserted itself into water quality regulation in a major way. Previously, responsibility for water quality management had resided almost exclusively with local and state authorities. Second, the CWA decisively settled the “instrument choice” question—that is, whether the principal mechanism for water pollution abatement was to be direct regulation or economic incentives. In November 1971, Senator William Proxmire offered an effluent-charge amendment to clean water legislation then under consideration, and he and Senator Edmund Muskie debated the issue on the Senate floor. Muskie’s main objection, apparently, was “We cannot give anyone the option of polluting for a fee.”2 Muskie may or may not have won the debate, but he definitely won the vote. P.L. 92–500 combined a stringent technology-based regulatory regime with a large public works program; economic incentives were not mentioned. To this day, Senator Muskie is generally regarded as the father of the CWA.
Over time, however, policy can evolve and eventually may differ considerably from the original version. In this paper we examine the changes that have taken place in the structure of the CWA since its inception. In particular, we ask whether the mix of local and federal authority and responsibility has shifted and whether there has been any shift away from a pure regulatory program toward greater use of economic incentives.
Policy generally is considered to change from the top down, in any number of ways. Practical experience with legislation can reveal problems in original design, for example. Or, regulators in the executive branch may use the discretion provided for in the statute in unanticipated ways, and their use of this discretion may confound the expectations of some observers. Judicial interpretations may have the same result.
1 The Federal Water Pollution Control Act Amendments of 1972, P.L. 92-500, was renamed the Clean Water Act when amended in 1977. 2 Quoted in Kelman (1982, p. 102)

Public Treatment of Private Waste: Industrial Use of Municipal Wastewater Treatment
Legislators may be unhappy with implementation by regulatory agencies or with judicial interpretation, or they may become aware of opportunities that were not available when the statute was first passed. Certainly the CWA has experienced this sort of change, with major amendments in 1977, 1981, and 1989, in addition to a vast amount of judicial interpretation and volumes of U.S. Environmental Protection Agency (EPA) regulations and EPA guidance documents.
Policies also can change from the bottom up. More precisely, policies can be changed by the manner in which individual actors respond to the provisions of a policy and to the responses of others. The aggregation of these responses can produce a policy that is quite different from what policymakers initially anticipated. What is more, when policies evolve from the bottom up, the change takes place so slowly and subtly that it often takes some time for observers to notice—especially, as in this case, when there is no centralized database where trends can be easily observed.
A recent case study of industrial water pollution abatement policy in the United States from 1972 to the early 1990s (Harrington 2004) finds some indications of such bottom-up change in the CWA. Specifically, the aggregate impact of decisions made by thousands of individual actors at industrial plants, publicly owned treatment works (POTWs), and regulatory agencies has produced a policy that differs not only from the original policy but also from what policymakers in Washington think it is. In particular, these decisions may have a decentralizing effect, shifting responsibility back to states and localities somewhat. They also may encourage the introduction of economic incentives into the CWA in a largely unanticipated way. These interesting possibilities could not be followed up in that study, hence this follow-on report.
“Different” doesn’t necessarily mean “bad.” Certainly, there are reasons to be concerned about some of the policy changes we describe. For example, recent trends may decentralize information collection, making it more difficult to paint an accurate picture of water quality management. They also may shift frontline responsibility for regulating industrial point-source discharges away from EPA and state regulators and toward local POTWs. However, they also may bring about real opportunities for achieving policy objectives more cost-effectively. In particular, what was originally a purely regulatory program now offers the prospect of at least three different possibilities for using economic incentives for abatement using various mechanisms, including pollution offsets, cap-and-trade programs, and effluent fees. Taking advantage of these opportunities, as well as responding to concerns, will require increased understanding of what is actually happening on the ground (and in the water).
2
Public Treatment of Private Waste: Industrial Use of Municipal Wastewater Treatment
In Section II, we briefly describe the regulatory environment for point sources from 1972 (when the CWA was first passed) to the present. In Section III, we turn to CWA performance, discussing evidence of the CWA’s effect on both pollutant discharges (again focusing on point sources) and on water quality. We examine in some detail the aforementioned trends that, taken together, appear to be changing the nature of the CWA in important ways. Finally, in Section IV, we summarize our findings and outline some research needs.
II. Regulatory Structure
Overview: The Clean Water Act
Before 1972, water quality was primarily a state and local concern. The federal government’s role was limited to providing grants for wastewater treatment to municipalities—a program that began in 1956—and providing information and planning assistance about wastewater treatment to the states. During this time, the states’ approach to water quality was use-based; water bodies were classified according to the highest desired use, and water quality standards were set accordingly. Waste disposal was implicitly accepted as a legitimate use of the nation’s water resources.
By 1970, however, a strong consensus believed that this approach had not prevented the steady decline in water quality throughout the country. Several well-publicized examples of poor water quality in the late 1960sdramatized what appeared to be a growing problem, culminating on June 22, 1969, when an oil slick on the Cuyahoga River near Cleveland, Ohio, caught fire. (Whether such occurrences accurately portrayed water quality trends is doubtful. EPA’s first National Water Quality Inventory, conducted in 1973, found that water quality generally had improved during the preceding decade, at least in levels of fecal bacteria and organic matter [CEQ 1976].)
Water quality became a mainly federal responsibility in 1972, with the passage of the Water Pollution Control Act Amendments of 1972 (P.L. 92–500), which was renamed the Clean Water Act in 1977. The new federal approach set as a national goal nothing less than the elimination of pollutant discharges into the nation’s waters by 1985. This zero-discharge goal did not refer to effluent itself but to the pollutants in effluent. It meant that, in the long run, waste disposal and assimilation would no longer to be an acceptable use of water resources. Two interim goals were set: The nation’s waters were to be “fishable and swimmable” by 1983, and toxic pollutants in amounts harmful to human activities or aquatic ecosystems were to be eliminated.
3

Public Treatment of Private Waste: Industrial Use of Municipal Wastewater Treatment
The CWA relied primarily on three tools. The first was the system of point-source permits, the National Pollutant Elimination Discharge System (NPDES). All dischargers into navigable waters had to have an NPDES permit. Permit requirements actually originated in the Refuse Act of 1899, which required all dischargers of refuse into navigable waters to obtain a permit from the Secretary of the Army (as head of the U.S. Army Corps of Engineers).3 This long-ignored requirement was rediscovered in the late 1960s and, for a few years, was used as a tool to begin implementing a permit system for wastewater dischargers. In the CWA, the permit requirement was reaffirmed and unambiguously linked to water quality objectives (instead of navigation, which was the main focus of the Refuse Act).
The second tool was the Construction Grants program, which provided massive increases in federal support: a $16 billion authorization for 1972–1976 for the construction of POTWs (i.e., wastewater treatment plants owned and operated by municipalities and local sewer districts. Federal capital subsidies to POTWs increased from half a billion dollars a year in 1970 to $6 billion per year in 1977. These grants paid up to 75 percent of the cost of building new wastewater treatment plants or expanding existing plants.4 A 1977 modification allowed an additional 10-percent subsidy for “innovative” technologies, and in 1981, the maximum subsidy amount was reduced from 75 percent to 55 percent of total construction costs. The Construction Grants program paid out grants totaling $60 billion during its years of operation (1973–1988) and then was replaced by a revolving loan fund.
The third tool was a system of technology-based regulations, called effluent guidelines, governing the discharge of water pollution from point sources and serving as a basis for the NPDES permits and pretreatment standards for dischargers into POTWs. These point sources included both POTWs and two classes of industrial facilities: direct dischargers, which discharge effluent directly into receiving waters, and indirect dischargers, which discharge effluent into a sewer that carries the effluent to a POTW. EPA was directed to develop effluent guidelines for 30 industries specified in
3 In addition, it contained a forerunner of the “citizen suit” provision that became such a prominent part of later legislation. Violations were subject to criminal prosecution, potentially leading to fines or imprisonment. A citizen who gave information about a violation of the permit requirement was entitled to one-half of the fine. If the government failed to prosecute, then the citizen could sue the violator to collect his share of the fine. 4 In addition to these federal funds, several states contributed matching funds to the capital costs of municipal wastewater treatment plants. Maryland, for example, contributed an additional 5 percent.
4
Public Treatment of Private Waste: Industrial Use of Municipal Wastewater Treatment
P.L. 92–500. Guidelines for other significantly polluting industries were to be added later. The industrial standards that are the focus of this investigation are described in more detail in the next section.
The CWA was amended in 1977 and again in 1987 to extend deadlines for promulgating and complying with the standards. In addition, in 1987 the EPA was ordered to promulgate effluent guidelines for additional point-source categories.
Regulations for Point Sources
For point sources, the regulatory backbone is the NPDES, which requires all significant dischargers of wastewater into surface waters to obtain permits. These permits state the effluent discharge limits that the source must not exceed, usually in terms of kilograms of pollutant per day. The dischargers affected include industrial plants and POTWs.
The specific permit requirements are determined by a complex system of regulations that begins with federally established effluent guidelines.5 The guidelines establish a set of technology-based performance standards that all point sources must meet, except where water quality considerations demand even more stringent standards.6 To allow for the vast heterogeneity found in American industry, the guidelines are very detailed, breaking industrial plants into 56 point-source categories with more than 450 subcategories, each with its own set of pollutant-specific regulations. In each subcategory are several sets of effluent standards, each depending on type of plant (i.e., existing or new, direct or indirect discharger) and type(s) of pollutant(s) (i.e., conventional, toxic, or nonconventional). Conventional pollutants are those typically found in domestic waste, including biochemical oxygen demand (BOD); total suspended solids (TSS); organic phosphorus and nitrogen; and fats, oils, and grease (FOG). EPA has classified 65 kinds of pollutants, including 126 specific substances, as toxic. All other pollutants are classified as nonconventional. Within each set of standards, effluent limitations also can differ according to other features, including the kind of product, industrial process, equipment age, geographic region, and size of the plant.
5 40 CFR 403. Statutory authority for the Effluent Guidelines is found in the Clean Water Act (33 U.S.C., Chapter 26, Sections 301, 304, 306, 307, and 402). For more information, see USEPA n.d. 6 Technology-based standards are effluent limits for dischargers that are based on the performance of a designated abatement technology, without consideration of the environmental or social problem caused by the discharges.
5
Public Treatment of Private Waste: Industrial Use of Municipal Wastewater Treatment
EPA is required to review the effluent guidelines every year and to produce a biennial plan for revising existing guidelines and identifying new categories that may require guidelines. For an industrial facility to which no set of effluent guidelines applies, the permit writer evaluates technology-based options without effluent guidelines on the basis of best professional judgment.
For water bodies where application of the technology-based effluent guidelines would be insufficient to achieve the water quality objective, permit writers were required to set even more stringent “water quality–limited” standards. Setting these standards was a matter of allocating to individual plants the total waste load that the water body could handle. This maximum load necessarily depended on the current conditions of the receiving water body and its capacity to absorb waste.
The front-line administration of this program—that is, writing the NPDES permits and routinely monitoring and enforcing permit requirements—could be delegated to appropriate state agencies on their demonstrating sufficient legal and institutional capacity for the job. EPA regional offices would administer the program in other states and provide oversight to the delegated programs. At present, nearly all the states have delegated programs. The state departments of environmental quality (DEQs)7 are supervised by the 10 EPA regional offices.
POTWs
POTWs are designed primarily to treat household wastewater, which consists of about 100 gallons per person per day of organic waste rich in fecal bacteria and containing about 300 milligrams per liter (mg/L) each of BOD and TSS, plus varying amounts of organic phosphorus and nitrogen. As shown in Table 1 below, 32 percent of all households were not connected to sewer systems and instead were connected to septic tanks and other methods. The remaining two thirds of all households in 1972 were connected to sewer systems, including 2 percent that discharged raw sewage, and 25 percent served by POTWs with primary treatment—physical processes such as skimming, screening, and settling capable of removing about 65 percent of BOD and TSS. An additional 40 percent of all households were connected to plants using at least “secondary treatment,”—biological processes that raised BOD and TSS removal to 80–90 percent, or a waste concentration of about 15–30 mg/L.
7 DEQ is a convenient generic term for this kind of agency. Actual names of the state agencies responsible for environmental quality are quite varied.
6
Public Treatment of Private Waste: Industrial Use of Municipal Wastewater Treatment
As direct dischargers of effluent, all POTWs were required to obtain NPDES permits. The technology standard that these plants had to meet was secondary treatment. One of the goals and eventual achievements of the CWA was to implement this standard throughout the United States and tertiary (advanced) wastewater treatment processes where needed to meet water quality standards. The large federal subsidies removed much of the local financial burden that this standard otherwise would have required.
The Construction Grants program is not directly addressed in this report but may have had a powerful if indirect effect on industrial wastewater discharges. As noted earlier, federal construction grants were available between 1973 and 1988 that could provide up to 75 percent of the capital cost of installing or upgrading abatement technology. In addition, many states added another 5–10 percent in matching grants.
This massive infusion of federal funds into wastewater treatment was intended to increase substantially the funds devoted to treatment of municipal wastewater and thereby reduce the population of the country not served by secondary treatment. In fact, the total population served by POTWs increased from 142 million in 1972 to 190 million in 1996 (Table 1). However, the population not served expanded as well, from 68 million to 80 million and the fraction of the population not served by POTWs declined only slightly, from 34 percent to 30 percent (USEPA 2001). Evidently, while POTW service was extended to many new and existing residential areas, even more new houses were built in areas still beyond their reach.
Fears that the large federal subsidy would “crowd out” spending by local governments did not materialize. Average spending in the years 1974–1980 by local governments was about the same as it had been in 1970. However, the pattern had changed. As capital spending by local POTWs dropped, operation and maintenance spending increased. In 1980, a total of $12.2 billion was spent for municipal wastewater treatment: 52 percent by local government, 43 percent by the federal government, and the remainder by the states. That year was the high-water mark of the program. By 1985, annual spending in the construction grants program had dropped to $2.7 billion.
In 1987, amendments to the CWA began phasing out the Construction Grants program, replacing it with the Clean Water State Revolving Fund (CWSRF). Initially, annual federal contributions and 20-percent matching state funds were pooled to make loans to local governments at very favorable rates. These annual contributions and local loan repayments were expected to eventually build up the fund to a point at which federal contributions would no longer be needed. Between 1986 and 2004, $42.3 billion
7

Public Treatment of Private Waste: Industrial Use of Municipal Wastewater Treatment
($1.8 billion to $2.7 billion per year, all in current dollars) in federal funds went into the state revolving fund (CRS 2003).
However, two trends have prolonged indefinitely the time to self-sufficiency. First, eligible projects have expanded to include almost the entire gamut of municipal water quality concerns, including drinking water infrastructure and nonpoint-source control. Although the goal of reaching sufficiency may have been delayed as a result of increasing the range of activities supported, this expansion probably was a move toward more efficient use of funds. Not only did state officials have greater flexibility to move resources into high-return areas, but also the large subsidy to capital-only projects was substantially reduced. The second trend—the practice of earmarking part of the annual appropriation for specific projects—has counteracted these efficiency benefits to some extent. These special projects usually get more favorable terms than those funded out of the state revolving fund because they are generally eligible for 55-percent federal grants, similar to those of the Construction Grants program of 1981–1990. They also are exempt from the review process that projects vying for loans from state revolving funds must undergo.
Table 1. Progress in Municipal Waste Treatment Coverage, 1972–1996
Access to POTWs,
1972 Access to POTWs,
1996
Millions percent of total pop. Millions
percent of total pop.
Total served 141.7 68 189.7 70 by technology: Raw (no treatment) 4.9 2 0.0 0 Less than secondary 51.9 25 17.2 6 Secondary 76.3 36 81.9 30 More than secondary 7.8 4 82.9 31 No discharge 0.8 0 7.7 3 Total not served 67.6 32 79.7 30 Source: USEPA 2001.
Direct Discharges from Industrial Plants
The 30 industries for which guidelines were specified in the 1972 Act were the most important point sources of water pollutants and included pulp and paper, organic chemicals, seafood, and fruit and vegetable processing. In addition, EPA concluded in 1974 that 18 more industries required effluent guidelines. As noted above, today there
8
Public Treatment of Private Waste: Industrial Use of Municipal Wastewater Treatment
are effluent guidelines for 56 point-source categories with more than 450 subcategories, including all of the large manufacturing industries.
P.L. 92–500 specified several types of technology-based standards. There was best practicable technology (BPT), which all plants in affected industries were to adopt by mid-1977. Congress did not define practicable, but EPA appeared to rely on two rules of thumb: Where applicable, BPT meant secondary or biological treatment, and otherwise it was what EPA called the “average of the best.” At the beginning of a rulemaking process, EPA or its contractors conducted a survey of technology and pollution abatement by the plants in the industry. A set of plants with the best performance was identified, and BPT was specified as the average performance in this set.
At the next, more stringent, level were the best available technology economically achievable (BAT) standards, which were what EPA called the “best of the best.” Existing plants were to install abatement technology capable of meeting the BAT standards by mid-1983. Still more stringent were the New Source Performance Standards (NSPS), which were to be applied to new plants seeking permits after the standards were promulgated.
Indirect Discharges from Industrial Plants
Limits on discharges also were necessary for industrial plants that discharged wastewater into sewers for treatment at POTWs—which, having been designed primarily for the treatment of household wastewater, were not suited for treating some industrial waste streams. Some wastewater constituents would pass through the plant unaffected (or insufficiently affected) by POTW treatment processes. For such categorical pollutants, POTWs would not have sufficient incentive to require upstream industrial dischargers to reduce their discharges or to install the abatement equipment to do it themselves.8 Thus, EPA was required to implement a set of pretreatment standards limiting the quantity of categorical pollutants sent to POTWs.
For other pollutants, POTWs were allowed to set local limits on the quality of industrial wastewater. Many industrial waste streams (e.g., food processing and industrial laundries) contain the same constituents as household wastes—oxygen-
8 EPA typically does not establish pretreatment standards for conventional pollutants because POTWs are designed to treat them. On occasion, the agency has used its authority to establish categorical pretreament standards for these pollutants as surrogates for toxic or nonconventional pollutants or to prevent interference.
9
Public Treatment of Private Waste: Industrial Use of Municipal Wastewater Treatment
demanding materials, suspended solids, phosphorus, and nitrogen. Although POTWs are certainly capable of treating these wastes, local limits are needed because industrial dischargers can produce wastewater in overwhelming volume or strength.9 In addition, such wastes are often accompanied by toxic, acidic, or alkaline material that can disrupt or destroy the microbial ecology of a POTW. Still other wastes might be treatable but cause problems in the sewer itself. For example, alcohol discharges are generally prohibited because of risk of fire or explosion, and FOG can create deposits in sewer pipes, leading to sewer backups. According to a recent EPA report, nearly half of sewer overflows with a known cause resulted from full or partial blockage. Of those blockages, 47 percent were blamed on grease buildup (USEPA 2004b).
To set the local limits for pollutant discharge by industries, each POTW is supposed to conduct a pollutant-by-pollutant headworks analysis (a kind of estimate) of the total waste loading that the plant can safely accept from nonhousehold sectors. An EPA guidance document (USEPA 2001) provides detailed instructions on the preparation of a headworks analysis and recommends repeating the analysis every year.
Next, each POTW must allocate the allowable pollutant-specific discharges for each pollutant to the industrial users. Evidently, the most common allocation method is to set “uniform-concentration local discharge limitations,” which “have become synonymous in the Pretreatment Program with the term local limits,” according to the EPA guidance (USEPA 2004a, p. 6–3). In this method, the allowable discharges of each pollutant are allocated to users so that the limits, expressed in terms of pollutant concentration, are the same for each discharger. However, this method is not required. EPA guidance and regulations do not, for example, rule out the use of marketable permits to allocate the plant capacity available to industrial dischargers—much as emissions offsets and ultimately cap-and-trade programs grew out of aggregate emission limits in nonattainment areas of the Clean Air Act. As yet, POTWs apparently have made little use of tradable permits. One exception is in Passaic, New Jersey, where a tradable permit program has been used since 1998 for the allocation of heavy metals (PVSC n.d.).
Indeed, as a practical matter, it is not clear that local limits are required in most cases. Of the POTWs contacted as part of the research for this report, none had limits for the common household pollutants that most affect water quality—BOD, suspended solids, and phosphorous. A few had limits on FOG. However, some POTWs have
9 A dairy, for example, can produce wastewater with a BOD concentration of 6,000 mg/l.
10

Public Treatment of Private Waste: Industrial Use of Municipal Wastewater Treatment
instituted local limits for conventional pollutants. These POTWs are near capacity and are in danger of NPDES violations. EPA recently released a new guidance document for developing local limits (USEPA 2004) that added BOD and TSS as pollutants of concern (POCs), which means that POTWs should conduct a minimal level of screening to determine whether local limits might be required. A POC “is any pollutant that might reasonably be expected to be discharged to the POTW in sufficient amounts to pass through or interfere with the works, contaminate its sludge, cause problems in its collection system, or jeopardize its workers” (p.18)
III. Performance A major component of evaluating how a regulation has worked in practice is a
description of its effectiveness. Regulations may have many consequences that were unintended by those who developed them. But to understand the full significance of a regulation, it is necessary to consider all the effects on actual regulatory performance, intended and unintended. Whereas this study makes no judgment on whether a regulation was well or poorly conceived, a crucial piece of context is how well it has achieved its stated goals. In this section, we discuss the environmental outcomes of the CWA by reference to a review of published retrospective studies. The evidence is fairly mixed. We consider two outcomes of the industrial water pollution permitting process: the extent to which the new permits resulted in actual reductions in the amounts of pollutants entering water bodies, and the evidence related to changes in water quality.
According to an EPA estimate made in the early 1990s, full compliance with BAT-based permits and secondary treatment for POTWs would lead to a 97-percent reduction in the direct discharge of priority pollutants generated by POTWs and industrial point sources into the nation’s waters (Adler et al. 1993). This estimate is based on the assumptions that discharge permits would be based on BAT and that sources would fully comply with the permit conditions.
Evidence indicates that by the mid-1980s, direct discharges had achieved a very high compliance rate. According to a 1984 EPA estimate, only 6 percent of major direct dischargers were in “significant noncompliance” with their permit requirements. Excluding a brief spike to about 14 percent in 1990, this rate remained more or less constant over the following decade (USEPA 1987, 1995). Although compliance rates were high, most dischargers had permits based on BPJ, not the more stringent BAT standards. By the mid-1990s, direct dischargers had dramatically reduced effluent reductions but still were short of the BAT target.
11
Public Treatment of Private Waste: Industrial Use of Municipal Wastewater Treatment
Additionally, the massive investment in POTWs increased the fraction of the United States served by wastewater treatment plants from 42 percent in 1970 to 74 percent by 1985. Like other direct dischargers, POTWs attained a high rate of compliance with their effluent permits. Among all POTWs, the rate of significant noncompliance with permits was 11 percent in 1984 and had declined to about 9 percent by 1994. Compliance by indirect dischargers was another matter. However, An EPA audit found that by 1992, a large share of significant industrial users (SIUs) were still in “significant noncompliance,” meaning they failed to observe at least one component of the POTW’s pretreatment program (Adler et al. 1993).
A more direct measure than compliance rates is the change in BOD effluent and influent loadings at POTWs from before the CWA was enacted to afterward. As the population served by POTWs increased, there was a consequent rise in BOD influent to these facilities. According to a 2001 EPA retrospective on the impacts of the CWA, BOD influent loadings into POTWs rose by 35 percent between 1968 and 1996. However, thanks to improvements in removal efficiency at POTWs, total net BOD effluent loadings actually decreased. Improvements in treatment technology at POTWs more than offset the increased BOD influent associated with higher population growth.
However, because population continues to grow, technological improvements will continue to be necessary to maintain these gains. EPA estimates that if the efficiency of the design for BOD removal does not continue to improve, then ultimate BOD effluent loadings from POTWs will return to the historic 1968 highs by 2025.
POTW loadings account for only a fraction of total national effluent loadings. The same EPA report estimates that POTWs are responsible for only 38 percent of national point-source BOD loadings and 21 percent of total loadings (from point and nonpoint sources). Industrial facilities (major and minor) account for almost two-thirds of all point-source loadings.
Has Water Quality Improved?
The CWA appears to have achieved some important local successes in improving water quality. In rivers near major cities, contact recreation is now encouraged in areas where it had been forbidden in the 1970s, an outcome probably attributable to the regulation of point-source pollutants. Knopman and Smith (1993) cite water quality improvements in the Potomac River near Washington, D.C., the Delaware River near Philadelphia, Pennsylvania, and the Flint River in Georgia. State water quality control administrators, assessing their states’ progress during the first decade of the CWA,
12
Public Treatment of Private Waste: Industrial Use of Municipal Wastewater Treatment
report significant improvement (ASIWPCA 1984). A report by the National Research Council (1993) acknowledges these improvements but warns that many problems remain.
Even today, a systematic assessment of the effects of the CWA on water quality is very difficult and uncertain because of difficulties in obtaining suitable data and a lack of consensus on the most meaningful ways to aggregate trend data across water bodies and pollutants. In general, the data reflect mixed results. For example, evidence from the 424 stations in the National Stream Quality Assessment Network (NASQAN)10 indicates that dissolved oxygen (DO)—the water quality criterion that might be expected to show the most improvement (i.e., increase) as a result of pollution abatement from point sources—did not increase significantly during the 1980s when averaged across all NASQAN sites. Taken individually, DO increased at 38 stations, decreased at 26, and did not change significantly at the remaining 360. The 26 stations near urban areas apparently improved, because the percentage reporting large DO deficits (average concentrations less than 6.5 mg/L) decreased from 40 percent to 20 percent of all stations. The sample size was small, however (Smith et al. 1991).
Smith et al. (1991) also examine the loadings of several pollutants discharged into streams. For nitrate, the data show no change in loadings except in two of the nation’s 14 water resource regions, where annual concentrations declined by 0.4 percent (lower Mississippi River) and 1.6 percent (upper Mississippi River). For phosphorus, annual concentrations declined in all but one national region—in three midwestern regions, by more than 3 percent per year. The authors attributed the improvement to reductions in point-source discharges and more widespread use of low-phosphorus detergents. Finally, suspended solids declined in 11 national regions (by 1.3 percent per year at most) and increased modestly in 3 regions.
10 Though there are thousands of water-quality monitoring sites in rivers, streams, and estuaries across the country, the data make it difficult to discern long-term trends in water quality because appropriate data—collected over long periods, by the same methods, and for the same pollutants—have been obtained at relatively few stations. As of 1993, the only exceptions were two networks operated by the U.S. Geological Survey (USGS) NASQAN, which included 420 stations located on major rivers; and the Hydrologic Basin Network, 55 stations located on headwaters in pristine areas, designed to provide baseline data on water quality. Two long-term environmental monitoring projects were initiated in more recently: In 1991, the USGS began the National Water Quality Assessment (NAWQA), a long-term effort that only now is beginning to yield results. In the late 1980s, EPA launched the Environmental Monitoring and Assessment Program (EMAP), designed to monitor general trends in ecological resources.
13
Public Treatment of Private Waste: Industrial Use of Municipal Wastewater Treatment
Using DO as a measure of improvement is not straightforward, given the many other factors that affect DO levels (e.g., effluent from nonpoint sources and natural fluctuations in stream flow and water temperature). For this reason, EPA (USEPA 2000) used a paired dataset culled from its STORET database of monitored worst-case DO levels in selected reaches during drought years before and after the CWA (1961–1965 vs. 1986–1990).
At the reach scale, of the 311 reaches with sufficient data to compare conditions before and after the CWA, DO levels improved in 215 (69 percent). The percentage of evaluated reaches characterized by undesirable worst-case DO levels (below the 5-mg/L threshold) was reduced from 54 percent to 31 percent. A total of 85 reaches classified as having undesirable DO levels before the CWA improved to desirable levels, whereas 15 reaches with desirable worst-case DO levels before the act dropped below the 5 mg/L, yielding a net improvement of 70 reaches out 311.
At the larger river-basin scale, sufficient data to compare conditions before and after the CWA are available for 11 of 18 major river basins. Of these 11, 8 showed statistically significant improvements in worst-case DO and the 3 that did not improve showed no statistically significant degradation.
Finally, the EPA report closely examines nine case study waterways identified as having significant water quality problems before the CWA was enacted (USEPA 2000). The bases for a waterway’s selection as a case study were location in a major urban industrial region, the presence of municipal wastewater as a significant point source, and the availability of historical data and water quality models. The report concludes that all the case study sites “clearly demonstrate dramatic improvements during the period after the CWA from 1986–1995” using increased DO concentration as the criterion.
These results suggest that the CWA—particularly its point-source programs—has effected at least modest improvements in water quality, especially considering the increase in economic activity during the 1980s. Incomplete implementation of the CWA during the 1980s is one reason improvements were not larger, but probably a far more important factor was the failure of the CWA to adequately address discharges from nonpoint sources.
IV. Long-Run Responses of Point Sources to the CWA On the basis of case reports, interviews with knowledgeable observers of the
CWA, and other anecdotal sources of information, Harrington (2004) hypothesized that
14

Public Treatment of Private Waste: Industrial Use of Municipal Wastewater Treatment
POTWs and industrial plants respond to the CWA in four ways and that these four responses interact to push water pollution policy simultaneously toward greater decentralization and greater use of economic incentives. The four hypothetical responses are
1. POTWs respond to Construction Grants program subsidies by overinvesting in plants and equipment.
2. The importance of direct dischargers relative to indirect dischargers slowly declines.
3. POTWs introduce and steadily increase waste surcharge fees. 4. Individual firms begin to respond to surcharges rather than effluent limits.
The first and third of these hypothetical responses apply to the behavior of POTWs and the second and fourth apply to the behavior of the industrial dischargers. Their arrangement here is suggestive of cause and effect, and deliberately so. Congress provided POTWs with incentives to overbuild, creating considerable excess capacity during the early years of the CWA. This overcapacity then gave POTWs an incentive to attract indirect dischargers at user fees that those dischargers found attractive. Because industrial wastewater was increasingly discharged to POTWs for treatment and because Congress required facilities that had received construction grants to recover costs from industrial dischargers, POTWs resorted to waste surcharges. As excess capacity was drawn down, POTWs increasingly relied on surcharges for revenues. Increasing rates eventually began to create abatement incentives for plants that had low marginal abatement costs.
When considering the impacts of waste surcharges, it is important to remember that they do not affect all industrial dischargers the same way. Although the trends toward indirect dischargers can be observed in a range of industries, waste surcharges affect the behavior of plants in a subset of those industries. Surcharges generally apply to only one class of pollutants: conventional pollutants such as BOD and TSS. Thus the incentive effects of surcharges, if they exist, disproportionately affect industries that discharge high levels of these pollutants, such as dairy processors and industrial laundries. As discussed in a previous section, many industrial users of POTWs discharge categorical pollutants that POTWs are not designed to treat. Companies that discharge categorical pollutants but only small amounts of chargeable conventional pollutants would not feel the incentive effects of waste surcharges but still would be governed by a predominantly command-and-control regime.
With these caveats in mind, we next examine whether the four predicted responses are supported by documentary evidence.
15

Public Treatment of Private Waste: Industrial Use of Municipal Wastewater Treatment
Legacy of the POTW Construction Grants Program
As noted in Sections II and III, the federal subsidies associated with the Construction Grants program massively increased the capacity of U.S. POTWs and probably deserves some of the credit for improving the water quality downstream from major cities. However, some aspects of the program created perverse incentives for POTWs. For example, they may have encouraged POTWs to build plants that were larger than required and to spend too much per unit of wastewater treatment capacity. Several economists (e.g., Freeman 1978) noted these perversities at the time, and others accepted them because they accorded so well with economic theory. However, the assertions of inefficiency made by Freeman and others have not been subjected to extensive empirical examination.. In fact, we are aware of only one such study (CBO 1985). This study of 68 POTWs conducted by the Congressional Budget Office (CBO) provides evidence that the Construction Grants program did indeed result in perverse outcomes.
The existence of federal subsidies did not necessarily mean that all POTWs received the maximum subsidy, because the total requests exceeded the total appropriated funds. Grants were made to the states, which distributed them to local communities according to a priority system that favored communities with the largest secondary treatment deficit and the most serious environmental problems. In some cases, a POTW low on the priority list nonetheless had to begin plant construction or expansion in order to meet statutory deadlines. As a result, not all local governments received the full 75-percent federal subsidy, and some were obliged to pay an investment cost share of 100 percent. Among the 68 plants in the CBO study, funds from local sources provided 18–100 percent of the total lifetime costs. This variance in the local cost share made it possible for CBO to examine the effect of federal and state funding on the local investment choices.
Incentives for Building Excess Capacity
The limited duration of the subsidy (initially through 1976) and the initial $16 million funding ceiling provided an incentive for POTWs to seek as much funding as possible, regardless of current needs. It was not known whether the authorized ceiling would later be raised or whether the full, authorized amount would ever be appropriated. With a limited amount of funds available, grant applicants had the incentive to apply early and make their grant requests as large as possible. After all, extra capacity might not be needed right away but would be good to have paid for and
16
Public Treatment of Private Waste: Industrial Use of Municipal Wastewater Treatment
in place in case of future growth. For that matter, the extra capacity could be a selling point to attract growth. Perhaps there would have been no incentive for excess capacity if POTWs could have been certain that the subsidy always would be available, but such a guarantee would have been impossible to give.
The CBO study uses case studies to examine the relationship between reserve capacity and local cost share, comparing the results at four POTW projects of two sizes (CBO 1985). In each size pair, one POTW had participated in the Construction Grants (CG) program, and one had not. and two had not, so as to represent every combination of capacity and amount of subsidy received. The reserve capacity of the two unsubsidized projects was only one-tenth of that of the EPA projects (about 20 percent compared to 220 percent). However, these examples are rather extreme; the average reserve capacities of small and large plants in the sample were 81 percent and 86 percent, respectively, of the unsubsidized plants and 105 percent and 125 percent, respectively, of those that received federal grants.
These cost differences may reflect selection bias, but CBO’s close inspection of the project details revealed that the unsubsidized projects seemed to receive more attentive management. For example, management of the two projects that participated in the Construction Grants program was contracted out. In contrast, the unsubsidized projects were managed in-house, which not only provided more opportunities for local scrutiny of expenses but also ensured that the people who later would be operating the plant were involved in its design and construction. Unsubsidized projects paid close attention to opportunities provided by local situations (whereas grant recipients took designs off the shelf) and opted for phased expansion plans. Finally, the unsubsidized plants completed their projects much more quickly their CG counterparts. This last observation points to an additional explanation for the better performance of the unsubsidized projects: The complexity of the Construction Grants program requirements was a key element in increasing construction time and costs.
In interviews conducted in 2002 with pretreatment coordinators at POTWs in Maryland, we found evidence to support CBO’s conclusions regarding excess capacity. For example, the Washington Suburban Sanitary Commission (WSSC), which serves Montgomery and Prince George’s Counties, Maryland, near Washington, DC, obtained construction grants for plants that doubled its capacity (Laszlo 2002). Twenty-five years later, WSSC still has excess capacity that dates to this period. It does not even monitor for conventional pollutants, because it can treat anything its industrial sources send to their plants. (However, it does monitor for pH and toxic pollutants, which can interfere with plant operations.)
17
Public Treatment of Private Waste: Industrial Use of Municipal Wastewater Treatment
Incentives Encouraging Technical Inefficiency
Theory suggests that a capital-only subsidy distorts the choice between capital and other productive inputs by making capital equipment appear to be cheaper than it actually is, thereby encouraging the installation of equipment that is excessively capital-intensive. More seriously, the larger the federal subsidy, the smaller the local government share, hence the smaller the incentive of local governments to maintain a careful watch over expenditures (CBO 1985).
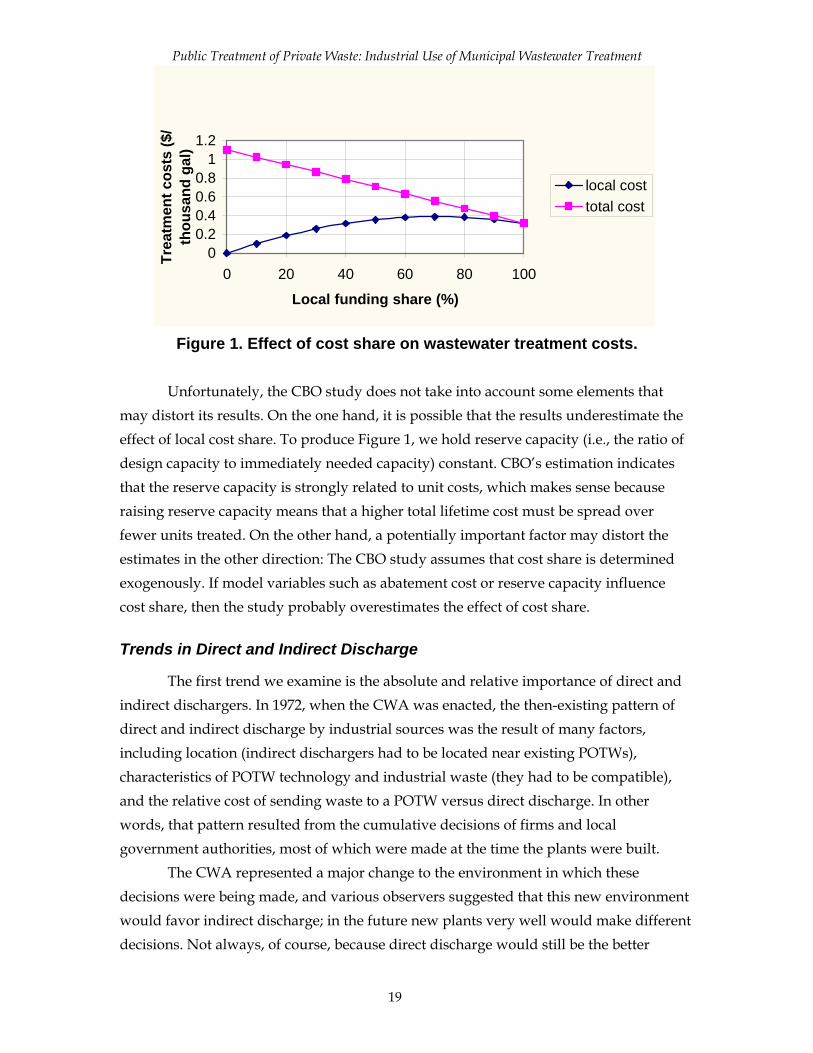
The CBO report also used its 68-POTW dataset to examine this issue (CBO 1985); results are illustrated in Figure 1. The total cost line plots the full unit costs as a function of the local cost share. The large effect of local cost share on unit cost results primarily from the two elements mentioned earlier. First, local governments did not necessarily choose the mix of capital and labor inputs that minimized full costs but those that minimized local costs, and because they were paying only a fraction of the capital, they had an incentive to choose capital-intensive technologies. Second, because the local construction cost share was small, local governments had less incentive to monitor those costs closely.
In Figure 1, local cost is that paid by the local governments (i.e., total unit cost multiplied by the local cost share). As local cost share increases from 0, local unit cost increases, but at a decreasing rate. Interestingly, when local cost share exceeds 70 percent, local cost begins to decline. Given the certain limitations of this study (explained later), we are reluctant to accept this result conclusively; however, it does suggest that the subsidy rate must be very high to help local governments. For example, with the 55-percent rate (the maximum subsidy rate in 1981), the local government is no worse off than it would have been if it had been required to foot the entire bill. But between these two alternatives, society is much worse off, because the lifetime unit cost is more than twice as high at a 45 percent instead of a 100 percent local cost share.
18
Public Treatment of Private Waste: Industrial Use of Municipal Wastewater Treatment
19
00.20.40.60.8
11.2
0 20 40 60 80 100
Local funding share (%)
Trea
tmen
t cos
ts ($
/ th
ousa
nd g
al)
local costtotal cost
Figure 1. Effect of cost share on wastewater treatment costs. Unfortunately, the CBO study does not take into account some elements that
may distort its results. On the one hand, it is possible that the results underestimate the effect of local cost share. To produce Figure 1, we hold reserve capacity (i.e., the ratio of design capacity to immediately needed capacity) constant. CBO’s estimation indicates that the reserve capacity is strongly related to unit costs, which makes sense because raising reserve capacity means that a higher total lifetime cost must be spread over fewer units treated. On the other hand, a potentially important factor may distort the estimates in the other direction: The CBO study assumes that cost share is determined exogenously. If model variables such as abatement cost or reserve capacity influence cost share, then the study probably overestimates the effect of cost share.
Trends in Direct and Indirect Discharge
The first trend we examine is the absolute and relative importance of direct and indirect dischargers. In 1972, when the CWA was enacted, the then-existing pattern of direct and indirect discharge by industrial sources was the result of many factors, including location (indirect dischargers had to be located near existing POTWs), characteristics of POTW technology and industrial waste (they had to be compatible), and the relative cost of sending waste to a POTW versus direct discharge. In other words, that pattern resulted from the cumulative decisions of firms and local government authorities, most of which were made at the time the plants were built.
The CWA represented a major change to the environment in which these decisions were being made, and various observers suggested that this new environment would favor indirect discharge; in the future new plants very well would make different decisions. Not always, of course, because direct discharge would still be the better

Public Treatment of Private Waste: Industrial Use of Municipal Wastewater Treatment
alternative in plenty of situations. For some industrial categories (e.g., offshore oil platforms) indirect discharge would remain clearly impractical. Other categories (e.g., feedlots) might have waste suitable for treatment at POTWs but be located in remote areas without POTW access. Despite such situations, the balance of cost and convenience had shifted significantly toward indirect discharge for most new plants. The cost hurdle for shifting from direct to indirect was higher for existing plants, many of which had treatment facilities that would be made redundant by the switch. Nonetheless, the advantages of indirect discharge might be great enough to justify a switch—even for some existing plants.
At least in terms of numbers of plants, indirect dischargers now greatly outnumber direct dischargers. In 1995, about 7,000 major dischargers held NPDES permits and discharged directly into receiving waters; of these dischargers, more than half were POTWs. Meanwhile, more than 35,000 SIUs were discharging into POTWs.11 These statistics do not address the question of whether indirect discharge is growing in absolute or relative terms but do indicate that indirect discharge plays a very important role in industrial wastewater treatment.
One result of the CWA is considerably improved access to POTWs for commercial and industrial plants. A shift toward indirect discharge was facilitated by the major expansion in POTW capacity put in motion by the Construction Grants program. This increase resulted from not only an expansion of treatment capacity but also the extension of service lines into areas that had not been connected to sewer systems previously. By most accounts, demand increased as well as supply. For several reasons, indirect discharge tended to suit the needs and desires of most of the local principals concerned with water quality management, specifically, the industrial plants themselves, the POTWs, and the state regulators that had been delegated responsibility for enforcing the CWA.
Industry representatives, consultants, state officials, and pretreatment coordinators that we interviewed all agreed that most plants would vastly prefer to send wastes to a POTW. The reasons are not hard to find. In many cases, sending waste to a
11 These numbers omit minor dischargers, which are numerous but usually do not contribute significantly to water quality problems. There were an estimated 90,000 or so minor direct dischargers in 2003 (Water Quality Products 2004). We were not able to find an estimate of the number of minor indirect dischargers, but inasmuch as they include restaurants and other commercial establishments, they are very numerous. For example, McDonald’s alone has more than 12,800 restaurants in the United States, most of which discharge into sewers (Nationmaster.com, n.d.).
20

Public Treatment of Private Waste: Industrial Use of Municipal Wastewater Treatment
POTW is cheaper than treating it on site. One plant owned by a major manufacturer of dairy products and without access to a POTW incurred incremental costs of $3.16/lb of BOD or TSS to meet BAT requirements. As discussed further in the next section, these costs are an order of magnitude greater than the unit fees that POTWs impose. Moreover, the excess capacity induced by the Construction Grants program probably made POTW operators eager to process industrial waste because they could charge very low fees and still more than cover their short-run marginal costs.
Industrial dischargers have other less tangible reasons for avoiding direct discharge: Permit requirements for direct dischargers are much more stringent and more closely scrutinized than those for indirect dischargers. They also are more visible, because environmental watchdog groups pay close attention when no POTW mediates the discharge. Direct dischargers also are concerned about liability, although recent federal regulations making violations of indirect discharge permits a violation of federal law may prompt more concern among indirect discharges.
Initially, opportunities for industrial dischargers to connect to POTWs were limited by the ability of POTWs to accept additional wastewater. Especially before 1981, the Construction Grants program may have had important effects on this issue because it encouraged the installation of treatment capacity far beyond POTWs’ immediate needs. The excess capacity became an attractive alternative to pollution abatement for many direct dischargers facing major expenses in complying with permit requirements based on the new effluent guidelines, particularly in plants processing organic wastes that could easily be handled by POTWs.
Accepting industrial wastewater has significantly benefited the many POTWs that had used federal funds to build excess capacity. Biological wastewater treatment plants tend not to work well at low usage rates, and excess capacity meant that usage rates would be low for a while after construction. Thus POTWs were eager to attract waste from suitable industrial sources in order to improve performance.
Moreover, POTWs could charge industrial dischargers fees for waste disposal. According to EPA regulations, Construction Grants program monies were to be awarded to POTWs that treated primarily domestic wastewater and were not allowed “for control or removal of pollutants in wastewater introduced into the treatment works by industrial users, unless the applicant is required to remove such pollutants introduced from nonindustrial users” (40 CFR Sec. 35.2125). But after a plant was built or improvements in place, nothing prevented the plant from accepting waste from industrial sources, especially if the industrial user paid a share of the costs. In fact, given excess POTW capacity, treating industrial waste is efficient as long as there are no pass-
21
Public Treatment of Private Waste: Industrial Use of Municipal Wastewater Treatment
through or interference issues, because otherwise the POTW would be underused. (Of course, that is not to say that overbuilding POTWs with the expectation of using the excess capacity to treat industrial waste is efficient.)
State environmental agencies—some of which were taking over responsibility for permit writing and enforcing CWA permit requirements—occasionally encouraged direct dischargers that were having trouble complying with NPDES permit requirements to discharge their wastes into sewers. This is how authorities in Ohio dealt with direct dischargers in the Cleveland area that were having trouble meeting permit requirements, for example [Bastian 2003]). Another case involving Smithfield Foods provides an excellent example.12 In the late 1980s, the state of Virginia promulgated new effluent regulations limiting phosphorus discharges from point sources into the Chesapeake Bay watershed to 2.0 mg/L. Two plants operated by Smithfield Foods in Isle of Wight County found it extremely difficult to meet this requirement and challenged the regulation. As the suit went through the courts, the plants continued to discharge wastewater with excessive phosphorus concentrations, and the state brought an enforcement action. The case was eventually resolved in part when the firm agreed to pipe the wastewater from these two plants 20 miles to an underutilized POTW operated by the Hampton Roads Sanitary District.
Beyond Anecdotal Evidence
We sought data that would support or disprove our general observations about direct and indirect dischargers. Any shift in the relative importance of direct and indirect discharge ought to be observable in several ways. We first examine some data on the historical number of plants in each industry and compare them with the current number of plants. An ideal dataset for this purpose would be a census of industrial plants administered at regular intervals and containing information about wastewater discharge patterns. Unfortunately, no such dataset exists, so we combined data from different sources, collected for different purposes.
Estimates of the number of plants in selected categories from 1975 to 1985 were taken from EPA industry surveys. During the 1970s, as part of the rulemaking process to develop the effluent guidelines, EPA administered a survey to the known plants in most important water-polluting industries. These surveys are not available today, but the
12 The facts of the case are summarized in United States v. Smithfield Foods, Inc., 965 F. Supp. 769, 772–781 (E.D. Va. 1997).
22
Public Treatment of Private Waste: Industrial Use of Municipal Wastewater Treatment
plant counts and other information generated sometimes made it into the development documents that EPA published to support the regulation. Such documents describe the industry, the wastewater treatment technologies used by various sectors, and sometimes the number of direct and indirect discharging plants in the industry. We were able to identify the numbers of direct and indirect dischargers for only 16 industries; however, they include some of the most important categories of industrial wastewater dischargers.
For current data on the number of plants, we use the 2000 Toxic Release Inventory (TRI) and several development documents that were completed between 1998 and 2002, when effluent guidelines were revisited in several important industries. The TRI contains information on each plant that discharges toxic wastes, including it is a direct or indirect discharger of water pollution. Unfortunately, the TRI dataset excludes facilities with small staffs and indirect discharging plants that have little or no toxic constituents in waste. Thus, the class of plants for which conversion to indirect discharge would be least expensive and most technically feasible (e.g., dairies and food processors) are underrepresented.
Table 2 compares the numbers and percents of direct- and indirect-discharging plants in the early 1980s and in 2000 for these 16 industries. Before turning to the direct-indirect comparison, we note some other important aspects of the table. The most striking is that the total number of plants in most categories has declined substantially from 1980 to 2000. For example, in the iron and steel industry, the total number of plants declined by 72 percent from 903 to 255. This change reflects the massive deindustrialization experienced in the United States in the 1980s and 1990s as manufacturing declined and industries went overseas. In addition, the table indicates the emergence of a new category, the “combined” dischargers, plants discharging some wastewater directly into receiving waters and some indirectly into sewers. As shown, combined dischargers barely existed in the early 1980s, but their numbers were considerable in 2000. Finally, Table 2 omits zero dischargers, which were fairly common in some industries in the early 1980s, because the TRI dataset does not offer a similar category for comparison.
23
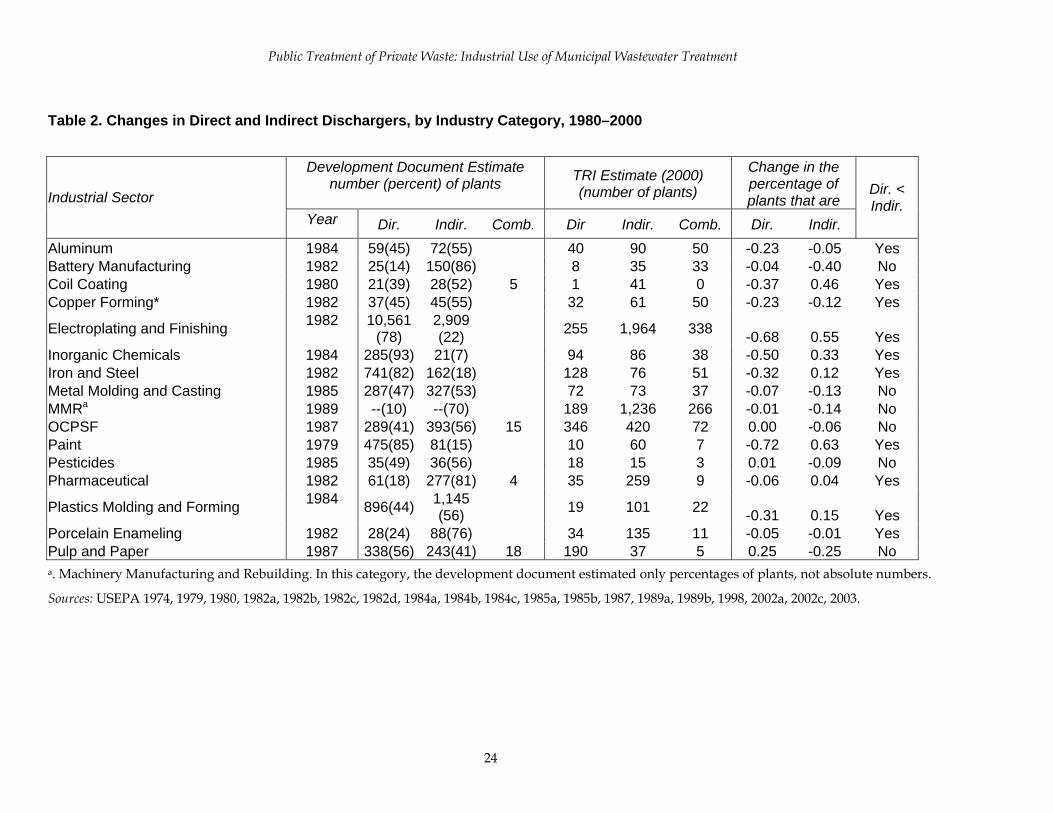
Public Treatment of Private Waste: Industrial Use of Municipal Wastewater Treatment
Table 2. Changes in Direct and Indirect Dischargers, by Industry Category, 1980–2000
Development Document Estimate
number (percent) of plants TRI Estimate (2000) (number of plants)
Change in the percentage of plants that are Industrial Sector
Year Dir. Indir. Comb. Dir Indir. Comb. Dir. Indir.
Dir. < Indir.
Aluminum 1984 59(45) 72(55) 40 90 50 -0.23 -0.05 YesBattery Manufacturing 1982 25(14) 150(86) 8 35 33 -0.04 -0.40 No Coil Coating 1980 21(39) 28(52) 5 1 41 0 -0.37 0.46 Yes Copper Forming* 1982 37(45) 45(55) 32 61 50 -0.23 -0.12 Yes
Electroplating and Finishing 1982 10,561
(78) 2,909 (22) 255 1,964 338 -0.68 0.55 Yes
Inorganic Chemicals 1984 285(93) 21(7) 94 86 38 -0.50 0.33 YesIron and Steel 1982 741(82) 162(18) 128 76 51 -0.32 0.12 Yes Metal Molding and Casting 1985 287(47) 327(53) 72 73 37 -0.07 -0.13 No MMRa 1989 --(10) --(70) 189 1,236 266 -0.01 -0.14 NoOCPSF 1987 393(56)289(41) 15 420346 72 0.00 -0.06 NoPaint 1979 81(15)475(85) 10 760 -0.72 0.63 YesPesticides 1985 36(56)35(49) 18 15 3 0.01 -0.09 NoPharmaceutical 1982 61(18) 277(81) 4 35 259 9 -0.06 0.04 Yes
Plastics Molding and Forming 1984 896(44) 1,145 (56) 19 101 22 -0.31 0.15 Yes
Porcelain Enameling 1982 28(24) 88(76) 34 135 11 -0.05 -0.01 YesPulp and Paper 1987 338(56) 243(41) 18 190 37 5 0.25 -0.25 No a. Machinery Manufacturing and Rebuilding. In this category, the development document estimated only percentages of plants, not absolute numbers.
Sources: USEPA 1974, 1979, 1980, 1982a, 1982b, 1982c, 1982d, 1984a, 1984b, 1984c, 1985a, 1985b, 1987, 1989a, 1989b, 1998, 2002a, 2002c, 2003.
24
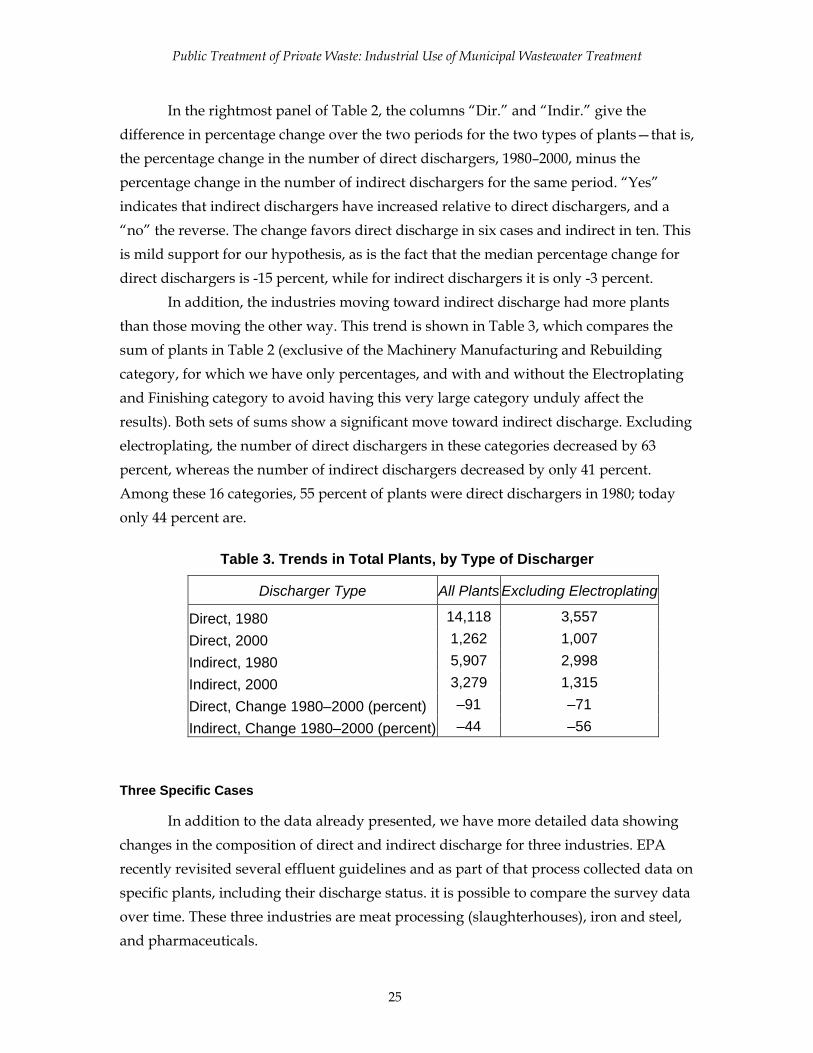
Public Treatment of Private Waste: Industrial Use of Municipal Wastewater Treatment
In the rightmost panel of Table 2, the columns “Dir.” and “Indir.” give the difference in percentage change over the two periods for the two types of plants—that is, the percentage change in the number of direct dischargers, 1980–2000, minus the percentage change in the number of indirect dischargers for the same period. “Yes” indicates that indirect dischargers have increased relative to direct dischargers, and a “no” the reverse. The change favors direct discharge in six cases and indirect in ten. This is mild support for our hypothesis, as is the fact that the median percentage change for direct dischargers is -15 percent, while for indirect dischargers it is only -3 percent.
In addition, the industries moving toward indirect discharge had more plants than those moving the other way. This trend is shown in Table 3, which compares the sum of plants in Table 2 (exclusive of the Machinery Manufacturing and Rebuilding category, for which we have only percentages, and with and without the Electroplating and Finishing category to avoid having this very large category unduly affect the results). Both sets of sums show a significant move toward indirect discharge. Excluding electroplating, the number of direct dischargers in these categories decreased by 63 percent, whereas the number of indirect dischargers decreased by only 41 percent. Among these 16 categories, 55 percent of plants were direct dischargers in 1980; today only 44 percent are.
Table 3. Trends in Total Plants, by Type of Discharger
Discharger Type All Plants Excluding Electroplating
Direct, 1980 14,118 3,557 Direct, 2000 1,262 1,007 Indirect, 1980 5,907 2,998 Indirect, 2000 3,279 1,315 Direct, Change 1980–2000 (percent) –91 –71 Indirect, Change 1980–2000 (percent) –44 –56
Three Specific Cases
In addition to the data already presented, we have more detailed data showing changes in the composition of direct and indirect discharge for three industries. EPA recently revisited several effluent guidelines and as part of that process collected data on specific plants, including their discharge status. it is possible to compare the survey data over time. These three industries are meat processing (slaughterhouses), iron and steel, and pharmaceuticals.
25
Public Treatment of Private Waste: Industrial Use of Municipal Wastewater Treatment
Meat Processing
According to a 1974 development document, an estimated 5,991 red meat processing plants were located in the mainland United States and Hawaii as of March 1, 1973. The largest 15 percent were estimated to account for more than 90 percent of the production and wastewater load. Even before the CWA, there was a trend toward indirect discharge. In 1966, about 70 percent of all wastewater in the meat packing industry was discharged into municipal systems; at that time, it was projected that 80 percent would be discharged to municipal systems by 1972.
An economic analysis of the guidelines indicates that roughly 55 percent of all meat processing plants discharged into municipal sewers in 2000. Indirect discharge was the major type of wastewater treatment for all types of plants except complex slaughterhouses, predominantly large-scale “kill and chill” operations that tend to locate in rural areas adjacent to locales with high demand (Table 4).
Table 4. Wastewater Destinations in the Meat Packing Industry, 2000
Destination (percent of Total Wastewater) Plant Type Municipal Lagoons Other
Simple Slaughterhouse 56 33 11 Complex Slaughterhouse 29 65 6 Low-Process Packing House 70 11 19 High-Process Packing House 59 14 27 All plants 55 28 17
Sources: www.epa.gov/guide/mpp/
EPA recently revisited effluent guidelines for the meat and poultry processing industries. The development document for this effort estimates direct and indirect discharges in the slaughterhouse category. The vast majority (well over 90 percent) of the approximately 1,200 plants surveyed are indirect dischargers, but among the larger plants, a bare majority (52 percent) still are direct dischargers. The evidence clearly indicates a trend toward indirect discharge in the meat processing industry over the past 30 years, although as noted above, the trend may have begun before the passage of the CWA.
26
Public Treatment of Private Waste: Industrial Use of Municipal Wastewater Treatment
Iron and Steel
EPA promulgated regulations for the iron and steel industry in 1982. Beginning in the early 1990s, the agency began to reassess the guidelines as part of an agreement negotiated with the Natural Resources Defense Council (1992) and concluded that the industry had changed substantially. Revised standards were released in 2002.
During the period between 1982 and guideline reassessment, the U.S. iron and steel industry underwent severe contraction and consolidation. As a result, the number of facilities discharging wastewater dropped significantly. Table 2 lists the changes in direct and indirect discharge between 1980 and 2000. In addition, numerous steel plants were zero dischargers in both 1982 (117 plants) and 1997 (56 plants). The most dramatic change was in the number of direct dischargers, which dropped by 83 percent. The number of indirect zero dischargers also declined, but the percentage declines were much smaller. As a percentage of plants, indirect and zero discharge became much more common forms of wastewater disposal during the same time: The percentage breakdown for direct-indirect-zero discharge changed from 73–16–11 to 51–27–22. Nonetheless, all forms of dischargers decline in absolute terms because of the decline of the industry.
Pharmaceuticals
The case of the pharmaceutical industry also provides clear evidence of a shift from direct to indirect discharge. In the final development document for the 1982 effluent guidelines, the agency noted that it had identified nine direct dischargers that had switched to indirect discharge during the course of guideline development. As with the iron and steel industry, EPA subsequently revisited the guidelines in the late 1990s and conducted a follow-up survey on wastewater disposal methods.
Between the original and revised guidelines, the number of direct dischargers decreased by nearly half, whereas the number of direct dischargers declined by only about 6 percent (although, as noted above, this masks a shift by at least some specific facilities to indirect discharge). As in the steel industry, a good number (133) of pharmaceutical plants were zero dischargers in 1982. It is unknown how many zero discharge facilities remain, because the later survey was not designed to report direct dischargers.
Observations
Two observations can be drawn from the industries that have good data on direct and indirect dischargers over time. First, the recent surveys for the iron and steel and the pharmaceuticals industries line up fairly well with estimates for those industries
27

Public Treatment of Private Waste: Industrial Use of Municipal Wastewater Treatment
based on the TRI data, offering some evidence that TRI provides a reasonable picture of the shares of indirect and direct discharge. Second, industry evidence indicates that the growth in indirect discharge as a disposal method can be attributed to various factors, depending on the case: long-standing trends that predate the CWA (as in the meat industry), fundamental changes in economic activity so that shares rise while absolute numbers decline (as in the iron and steel industry), and decisions by individual plants to shift to from direct to indirect discharge (as in the pharmaceuticals industry).
Total Discharge
Trends in the total discharge of wastewater by industrial plants are more difficult to establish because of a lack of data. For direct dischargers, recent data are available, but we are unaware of any dataset containing historical data. For indirect dischargers, some relatively recent information is available in surveys conducted by the Association of Metropolitan Sewerage Agencies (AMSA) by source, but we only obtained source-specific data (for 62 POTWs) since 1996, i.e. close to the end of the period during which direct and indirect dischargers were compared by category above. For those POTWs, both industrial and residential discharge increased by about 9 percent (Table 5). Total waste treated did not increase because of a sharp drop in infiltration. This comparison says nothing about the growth of direct versus indirect, but it does indicate that industrial discharge continues to be an important part of the wastewater stream treated by POTWs. These results are consistent with the results from the preceding section, for although the number of indirect dischargers increased relative to direct dischargers, it declined absolutely.
Table 5. Sources of POTW Influent, 1996 and 2002 (Average of 62 POTWs)
Influent (Million Gallons/Day) Source
1996 2002 Residential 84.7 93.2 Industrial 28.3 30.8 Infiltration 35.1 26.1 Total 150.7 151.2 Sources: AMSA 1996, 2002.
Note: Totals do not sum because of missing values for infiltration.
28

Public Treatment of Private Waste: Industrial Use of Municipal Wastewater Treatment
Spread of Waste-Based Sewer Surcharges
In this section, we examine the third element of our argument, namely, that surcharges for industrial waste sent to POTWs are extremely common and that the level of the fees continues to grow. The decentralized nature of CWA implementation makes finding appropriate evidence to answer this question more difficult than for the other issues we examine. Fortunately, industrial rates going back to 1983 are available for Baltimore, Maryland. We also have a set of member surveys conducted every 3 years by AMSA, a trade association for POTWs, which provide less detailed information for a sample of POTWs around the country. The findings are available on CD-ROM for 2002 but only in hard copy for 1999 and 1996. Surveys before 1996 were not published and are unavailable, unfortunately, except for a limited amount of information from prior surveys presented in the 1996 report.
Background
Nearly all POTWs charge users for the waste disposal services they render, and most have fee structures that contain one or more of the following components: a fixed annual fee, regardless of use; a volumetric fee, based on the volume of water sent to the POTW; and a waste surcharge fee, based on the strength and volume of the waste. Fees also are distinguished by user class: Residential users most commonly pay only a volumetric charge, whereas industrial dischargers often pay all three components.13
For industrial users, waste surcharges are levied per pound of waste discharged, subject to one important proviso. Usually, there is a surcharge limit—a waste concentration that is exempt from the fees—set at around 250 mg/L for BOD and TSS. The annual waste surcharge (WS) is thus calculated as
8.34 ( ) if
WS0 other
L LGr C C C C− >⎧= ⎨
⎩ wise
where G is wastewater volume (in millions of gallons per year), r is the surcharge rate (in dollars per pound), C is the waste concentration (in parts per million or mg/L), and CL is the surcharge limit (in parts per million or mg/L). The constant 8.34 is the conversion factor that translates gallons of water into pounds. The rate r is most often based on cost recovery and usually requires some fairly elaborate calculation to
13 Commercial users are lumped with industrial users in the AMSA surveys. Their waste streams tend to be of lower strength, often not more than those of households, although some commercial establishments (e.g., restaurants) can have high waste loads relative to their size.
29
Public Treatment of Private Waste: Industrial Use of Municipal Wastewater Treatment
apportion total plant costs between domestic and industrial or commercial users. The 1996 AMSA survey indicates that rates are recalculated every 4 years or so, although this frequency is highly variable.
For BOD and TSS, the surcharge limits approximate the concentrations found in domestic wastewater; for these pollutants, therefore, industrial users pay only to the extent that their wastes exceed the strength of household waste. More than 70 percent of POTWs use surcharge limits of between 200 and 300 mg/L. For other pollutants with surcharges, the surcharge limits are much more variable.
Evidence from Baltimore (discussed more fully in the next section) indicates that waste concentrations vary enormously by industrial category. For some categories, BOD concentrations, for example, exceed 3,000 mg/L; in others, 300 mg/L or less. For the industrial dischargers in our sample, the BOD and TSS concentrations comfortably exceed the surcharge limits, so that at the margin all are paying fees for each unit discharged. However, for nitrogen and phosphorus, discharge concentrations commonly do not exceed or barely exceed the surcharge limits of 30 and 12 mg/L, respectively.
Trends in Use of Surcharges
Conversations with a longtime observer of POTWs revealed that some POTWs have based fees on waste load since the 1960s, that is, before significant federal involvement in water quality. Over time, more and more POTWs have resorted to the use of waste-based fees, and they have gradually increased the range of pollutants on which a fee is collected. Today, a majority of POTWs charge for oxygen-demanding materials (usually BOD, by pound or kg of oxygen demanded) and TSS. A few charge for a variety of other pollutants, including nitrogen, phosphorus, and FOG. Once again, surcharges do not apply to the categorical pollutants, which often are toxic chemicals that are governed by pretreatment standards.
AMSA survey data reveal a slightly different pattern since 1990. Table 6 shows the percentage of POTWs reporting volumetric rates, BOD surcharges, and TSS surcharges between 1990 and 2002. The prevalence of these instruments had already reached levels approaching 80 percent for pollutants and 90 percent for volumetric rates. Their frequency of use remained fairly constant until the mid-1990s, then began to decline rapidly. By 1990 the portions of the sample using BOD and TSS surcharges had declined to 64 percent and 66 percent, respectively.
30
Public Treatment of Private Waste: Industrial Use of Municipal Wastewater Treatment
Table 6. Prevalence of Wastewater Charges in AMSA Surveys, 1990–2002
POTWs Reporting (percent) Year POTWs Responding
Volumetric Rates BODa Surcharges TSS Surcharges
1990 90 90 77 83 1993 110 91 77 81 1996 107 79 77 80 1999 119 71 68 70 2002 132 72 64 66
Sources: AMSA Financial Survey, various years. a Includes all measures of in-water oxygen demand reported by POTWs, including BOD, carbonaceous BOD (CBOD), and chemical oxygen demand (COD).
However, an apparent change in the sampling strategy of the AMSA surveys
after 1996 may skew these results. It can be seen most clearly in the breakdown of the respondents to the 1996 and 2002 surveys by size (Table 7): The 2002 sample is larger, but nearly all the increase is in the smallest two size categories. If, as seems reasonable, smaller plants are less likely to adopt volumetric or waste surcharges, then the observed change in surcharge frequency could be due to the change in sample composition.
Table 7. Distribution of AMSA Survey Samples, by Plant Size
Plant Size Category 1996 Survey 2002 Survey0–15 mgd 7 27 15–30 mgd 20 29 30–75 mgd 38 35 >75 mgd 33 36 Not reported 9 5 Total 119 132
Sources: AMSA 1996, 2002.
Note: mgd = million gallons per day processed.
However, a further breakdown of the data in the 1996 and 2002 surveys (Table 8)
demonstrates that the observed decline cannot be attributed to sample composition. The use of fees increased substantially in the smallest size category (although the small 1996 sample cautions against making inferences). In the other groups, the change in use of variable fees is mixed but mostly exhibits decreases. Although the sample size in all categories is rather small, it the use of surcharges and volumetric fees appears to have
31

Public Treatment of Private Waste: Industrial Use of Municipal Wastewater Treatment
declined somewhat since 1990 but still is substantially greater than 50 percent in all by the smallest size category.
Table 8. Prevalence of Fees by Plant Size, 1996 and 2002
Prevalence (percent of Total Plants) Plant Size Category
Volumetric Fees BOD Surcharges TSS Surcharges0–15 mgd 1996 43 28 28 2002 63 48 48 15–30 mgd 1996 80 75 80 2002 72 66 72 30–75 mgd 1996 79 84 87 2002 63 74 77 >75 mgd 1996 78 78 85 2002 92 75 75
Sources: Amsa (1996, 2002).
Note: mgd = million gallons per day processed.
Surcharges for other pollutants are much less common. In 2002 only 17 percent of POTWs reported surcharges for nitrogen (ammonia nitrogen or Kjeldahl nitrogen), 8 percent for phosphorus, and 8 percent for FOG.
Among those plants that use surcharges, the range of fees is very large. As shown in Table 9, the interquartile range in the AMSA survey is 12.8–28¢/lb for BOD and 10.5–24¢/lb for TSS. Ranges of phosphorus and nitrogen surcharges are listed in Table 10 for the few POTWs that reported this information.
Table 9. BOD and TSS Surcharges in the AMSA Survey: Interquartile Range
Surcharge ($) Pollutant
25th Percentile 75th PercentileBOD 0.128 0.28 TSS 0.105 0.24
Sources: AMSA (2002)
32

Public Treatment of Private Waste: Industrial Use of Municipal Wastewater Treatment
Table 10. Maximum and Minimum Surcharges for Phosphorus and Nitrogen
Surcharge ($) Pollutant
Minimum MaximumPhosphorus 0.56 5.32 Total Nitrogen 0.107 2.609
Sources: AMSA (1996, 2002)
Trends in Surcharge Rates
Surcharge rates have generally increased, not only in current dollars but also in real dollars. Once set, rates tend to remain constant in nominal terms for several years until they are eventually reviewed and reset. According to the 1999 AMSA survey, on average, the rates had remained constant for about 2 years, which suggests that the rates are reset every 4 years or so.
Surcharge rates in Baltimore provide an illustrative example. Waste surcharges were first established in 1976 at 3.2 and 3.8¢/lb for BOD and TSS, respectively, and remained at this level for the next 8 years. Thereafter, periods of rapid increase alternated with periods in which nominal rates remained fixed, giving (in real terms) the sawtooth patterns illustrated in Figures 2 and 3. Currently, rates for BOD and TSS are rising rapidly—reaching 15¢/lb and 23¢/lb, respectively, in 2004. Baltimore implemented a phosphorus charge in 1986 that has increased rapidly but in a sawtooth pattern similar to those of BOD and TSS. A fee for nitrogen discharges was implemented only in 2002.
0
0.05
0.1
0.15
0.2
0.25
1970 1980 1990 2000 2010
$/lb
BODTSSTotal N
Figure 2. BOD, TSS, and total N waste surcharges, Baltimore City, 1976–2004.
33
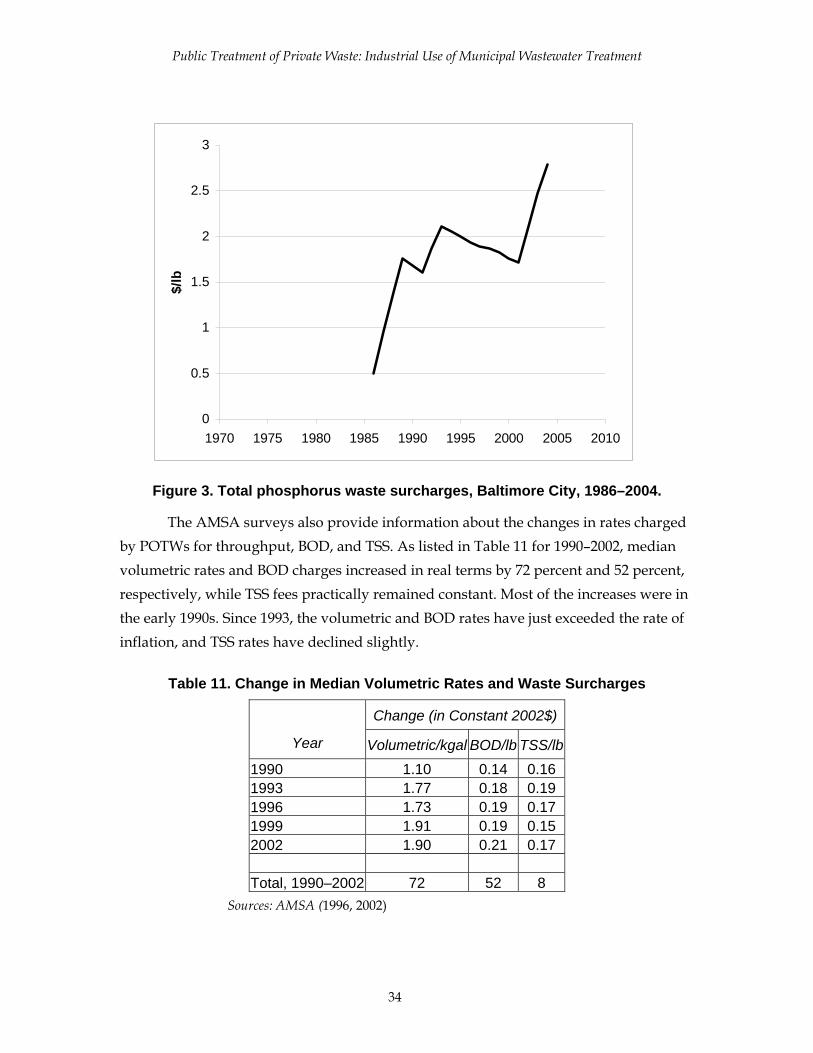
Public Treatment of Private Waste: Industrial Use of Municipal Wastewater Treatment
0
0.5
1
1.5
2
2.5
3
1970 1975 1980 1985 1990 1995 2000 2005 2010
$/lb
Figure 3. Total phosphorus waste surcharges, Baltimore City, 1986–2004.
The AMSA surveys also provide information about the changes in rates charged by POTWs for throughput, BOD, and TSS. As listed in Table 11 for 1990–2002, median volumetric rates and BOD charges increased in real terms by 72 percent and 52 percent, respectively, while TSS fees practically remained constant. Most of the increases were in the early 1990s. Since 1993, the volumetric and BOD rates have just exceeded the rate of inflation, and TSS rates have declined slightly.
Table 11. Change in Median Volumetric Rates and Waste Surcharges
Change (in Constant 2002$)
Year Volumetric/kgal BOD/lb TSS/lb
1990 1.10 0.14 0.16 1993 1.77 0.18 0.19 1996 1.73 0.19 0.17 1999 1.91 0.19 0.15 2002 1.90 0.21 0.17 Total, 1990–2002 72 52 8
Sources: AMSA (1996, 2002)
34
Public Treatment of Private Waste: Industrial Use of Municipal Wastewater Treatment
Finally, a few POTWs also levy waste surcharges on other pollutants, including ammonia or total nitrogen (about 16 percent of all plants surveyed), phosphorus (about 8 percent), and FOG (about 8 percent). These percentages do not change much between 1996 and 2002, but again the numbers are very small.
Compared with the median plant in the AMSA survey, the rate policy of Baltimore’s POTW is fairly typical. The TSS and phosphorus rates are a little above the median and the BOD and nitrogen rates a little below.
Are Waste-Based Surcharges Effluent Fees?
In form, at least, waste-based surcharges look very much like effluent fees. They would look exactly like effluent fees if it weren’t for the surcharge limits, which exempt a portion of a plant’s wastewater from the fee. Whether these surcharges perform like effluent fees depends on answers to three questions:
• Are the rates large enough—and the surcharge limits small enough—to have incentive effects?
• If so, do plant managers respond to these incentives by installing pretreatment or some method of source reduction of waste loads?
• Finally, do environmental authorities use the fees to limit waste loads? That is, are these fees truly policy instruments for pollution abatement or deliberate attempts to reduce waste loads, or are any waste-reduction properties purely accidental?
Are the Rates High Enough?
Economic theory tells us that to have an incentive effect, emissions fees must exceed the marginal cost of additional waste reduction. Plants usually are assumed have an increasing marginal abatement cost, and the abatement level is chosen so that the marginal abatement cost equals the emissions fee rate. The presence of surcharge limits complicates the plant’s decision, however. Surcharge limits weaken the incentive effect by limiting the effluent reduction potential, because there is no incentive to reduce effluent discharges below the limit. Incentive effects also can be limited by the characteristics of the abatement cost function, such as the presence of large fixed costs. If there were no fixed cost, abatement would proceed up to the point at which the marginal cost equals the fee. A fixed cost entails an additional test beyond this marginal condition: a total cost test. The total cost at the optimum abatement level must be compared with the total cost without abatement (i.e., the effluent fee payments). When both the surcharge limit and fixed costs are present, the incentive effect is doubly diminished.
35

Public Treatment of Private Waste: Industrial Use of Municipal Wastewater Treatment
As noted in the preceding section, surcharge rates are highly variable; the marginal costs of source abatement probably are equally variable. What this means is that at a typical POTW, the fees will provide abatement incentives for some SIUs and not for others. Other things being equal, as rates increase, the proportion of SIUs responding to the fees also will increase.
Predicting whether a waste surcharge is high enough to have incentive properties thus requires a lot of information, much of which is publicly unavailable. About the best that can be done with the data that are available is to determine whether the unit costs of abatement are comparable with the fee levels. If they are, then they at least indicate the potential for incentive effects in some sources. We have been able to collect small amounts of evidence from various sources.
First, engineering studies provide some abatement cost information for plants in some industries. For example, Bough et al. (1988) estimate costs in terms of BOD removal at dairies. Table 12 lists the incremental costs of wastewater treatment for five dairy processing plants in Missouri, expressed in terms of BOD removal. Only three plants practice pretreatment, and the unit costs of abatement at those plants are 12–24¢/lb of BOD (19–38¢/lb in 2004 dollars). These data are average costs, not the marginal costs we really want. But at least a comparison with typical surcharges will indicate whether the surcharges and costs are in the same ballpark for an important industry.
These costs are not directly comparable with waste surcharges. Bough et al. (1988) do not mention suspended solids, apparently because BOD and TSS are more or less jointly produced in dairy plants, so only BOD must be considered. But surcharges usually are applied to both pollutants, so either the rates or the discharges must be
Table 12. Cost of Wastewater Disposal at Five Dairy Plants
Onsite Wastewater Treatment Plant No.
Flow (million gallons/year)
BOD in (lb/year)
BOD Out
(lb/year)
Annual Abatement
Cost ($)
Cost/lb Removed
($/lb)
Wastewater Strength
Delivered to POTW (mg/L)
Plants with pretreatment 2 157.4 973,000 176,000 193,000 0.242 649 3 116.3 2,514,000 76,000 526,000 0.216 377 181 74.0 1,285,000 193,000 134,000 0.123 1,516
Plants without pretreatment 1 153.8 1,023,999 — — — 3,868 5 74.3 649,000 — — — 5,072 Sources: Bough et al. 1988 and authors’ calculations.
36

Public Treatment of Private Waste: Industrial Use of Municipal Wastewater Treatment
adjusted to account for this difference. Roy Carawan of North Carolina State University suggests a rule of thumb for relating the concentrations of the two pollutants: TSS concentration in untreated dairy plant effluents, not including cheese plants, usually is the greater of 500–600 mg/L or one-quarter of the BOD concentration. Thus, adding one-quarter of the TSS fee to the BOD fee yields an effective fee that roughly represents the waste surcharge for both TSS and BOD that can be applied to the BOD concentration alone.
For comparative purposes, we calculate an effective fee in this way using the 2002 AMSA survey. The estimated costs of 19¢/lb and 38¢/lb are the 30th and 82nd percentiles of distribution of effective fees, respectively—in other words, 70 percent of the plants sampled have fees in excess of 19¢/lb and 18 percent in excess of 38¢. In other words, fee rates are comparable to average unit costs at many POTWs.
Another useful method of comparison is to look for examples of behavior in other countries that use effluent fees. One such country is the Netherlands, which has a point-source water pollution control system that consists primarily of large publicly owned regional wastewater treatment plants, to which most industrial dischargers are connected. Both households and industrial plants are charged fees for the disposal of organic wastewater. Since they were implemented in 1979, these fees have provided a powerful incentive for pollution abatement in the Netherlands. Bressers and Lulofs (2004) credit the fees for the dramatic (80 percent) reduction in industrial pollutant discharges between 1975 and 1995.
Dutch fee levels are chosen by 30 regional water boards, the organizations that operate the 450 public wastewater treatment plants. Direct comparison with U.S. fees is made difficult by the fact that the Dutch fee is charged per population equivalent (PE), a composite pollutant that is supposed to represent the pollutant load of the average individual over a fixed interval. In the Dutch system, the PE is defined to be 136 grams/day of total oxygen demand. The number of daily PEs in a wastewater stream is therefore the sum of total carbonaceous and nitrogenous oxygen demand in the stream. It is calculated as
0.001 (COD 4.67TKN) /136L Q= +
where
L is the number of PEs, Q is the daily flow (in L), COD is the concentration of chemical oxygen demand (in mg/L), and TKN is the total Kjeldahl nitrogen.
37
Public Treatment of Private Waste: Industrial Use of Municipal Wastewater Treatment
The difference in units used to calculate fees complicates the comparison of Dutch and U.S. fee levels. Because our purpose is to determine whether U.S. fees are large enough to have incentive effects, we take the following approach. To a specimen wastewater stream, we apply the fees of each POTW in the 2002 AMSA survey, thereby producing a distribution of annual wastewater charges. Then we calculate the PEs according to the Dutch formula and apply to them the average rate among Dutch regional water boards in 1998 (€40, or about $45).
For this comparison, we use plant-level wastewater discharge data from plants subject to waste surcharges the Baltimore City POTW: annual data for various years on flows and average concentrations of all pollutants for which surcharges are levied (BOD, TSS, total nitrogen, and phosphorus). We compare the mean and median wastewater streams in 2004 and find that the fee paid by the mean plant in Baltimore would be about 10 times that of the median plants in Baltimore, in the Netherlands, or in the AMSA survey. As already noted, about one-third of the plants in the 2002 AMSA survey did not report having fees; for the rest, the annual fee for the median Baltimore plant discussed here was $1,700–$122,000/year. The average Dutch fee would have been $45,000, higher than all but 7 percent of the Baltimore plants with fees in the AMSA survey, whereas the fees that would have been collected in Baltimore were much smaller, only $18,000 per year. Baltimore’s fees would have been lower than those of 58 percent of the Dutch plants with fees.
The evidence presented here are not strong enough to determine conclusively whether waste surcharge fees are large enough to have incentive properties. The fees apparently are high enough at some POTWs to be at least comparable to abatement costs at some plants. At some (only 7 percent) of the POTWs listed in the AMSA survey, the fees are higher than in the Netherlands, where fees are known to have incentive properties. Nonetheless, we are confident that at a far higher share of POTWs, rates are high enough to encourage some waste reductions in at least some of their industrial subscribers. In the next section we test this hypothesis against the behavior of dischargers into the Baltimore City POTW, a provider whose surcharge rates are much lower than those found in the Netherlands.
Do Plant Operators Respond to Fees?
Anecdotal evidence indicates that SIUs respond to waste surcharges by reducing pollutant discharges into sewer systems. A manager of a large POTW told AMSA officials that without waste surcharges, “We would be swamped” (Aydlett 2004). Similarly, the pretreatment coordinator in Philadelphia remarks that waste surcharges
38
Public Treatment of Private Waste: Industrial Use of Municipal Wastewater Treatment
effectively limited industrial discharges of surcharged wastes. Like several pretreatment coordinators in the Washington, D.C., metropolitan area, he indicates that surcharges are the only instrument influencing the quantity of waste discharges. Local limits, which are supposed to define the maximum discharge of various waste constituents, do not exist at these facilities for BOD, TSS, and other wastes with surcharges (although some POTWS have local limits for FOG). The philosophy is, “we can take all the waste you want to send us, but you must pay for it,” he says (Pineda 2004). User charges also have been cited as an effective method for controlling BOD from deicing fluids used at Chicago-area airports (Kollias 2004).
To be sure, some local pretreatment authorities question whether plant managers are fully aware of the possible benefits of reducing waste surcharges that could be achieved simply because the waste loads of their plants have never been examined. One pretreatment coordinator recounted a story about a dairy that was paying millions of dollars per year in waste surcharges. The plant was one unit of a large multistate, multiplant operation, and the bills were paid by the headquarters office, which had little idea of what kinds of waste-reduction economies were available at the plant; meanwhile, no one at the dairy was aware of the exorbitant charges. When this pretreatment coordinator brought the magnitude of these fees to the attention of his technical contact at the dairy, that individual was able to contact the home office and implement a study of local waste-load reduction possibilities (Milby 2002).
Also, in at least some instances, waste surcharges provide incentives for completely different behavior. Rather than encouraging abatement, they may encourage players to get out of the game or discourage them from getting in. In one case, surcharges prevented a large direct-discharging dairy from connecting to the POTW, which would have been to its advantage (Javier 2004). Similarly, a 1971 EPA-sponsored assessment of dairy industry food plant wastes and wastewater treatment practices mentions a company that “recently closed two plants after municipalities imposed a surcharge on BOD and suspended solids” (Harpe et al. 1971).
We looked for data on surcharge payments and wastewater discharges that might support or contradict these assertions. Unfortunately, we were able to acquire detailed data from only one POTW, for the city of Baltimore.14 Table 13 lists the total water volume and pollutant loads for the noncategorical plants discharging into city sewers, by year, for 1989–1991 and 2001–2004. Total water volume and total discharges 14 Baltimore City treats waste for both Baltimore City and Baltimore County. We have data only for Baltimore City.
39

Public Treatment of Private Waste: Industrial Use of Municipal Wastewater Treatment
of the three pollutants listed declined slightly.15 Between the two periods, separated by a decade, both volumetric and surcharge rates increased substantially: more than 30 percent in real terms for BOD and total phosphorus (TP) and 10 percent for suspended solids. The observed decrease in pollutant discharges would be consistent with these price changes. However, the number of plants also declined—presumably the continuation of the secular retreat of manufacturing—and that could also account for the decline in water use and pollutants discharged.
Table 13. Industrial Water Use and Pollutant Loads Delivered to Baltimore City POTW
Pollutant Load (× 106 lb)
Year No. of PlantsWater Volume
(× 106 gal) BOD TSS TP 1989 75 1,343 39.2 10.0 0.25 1990 75 1,436 34.5 11.2 0.28 1991 75 1,301 15.1 12.5 0.36 2001 60 1,287 17.1 8.1 0.21 2002 59 1,280 28.7 7.8 0.20 2003 57 609 13.7 2.3 0.03 2004 60 1,132 25.1 7.7 0.25
We also can examine the performance of 32 firms that have records both before and after the rate increases described above. Unfortunately, aside from for their standard industrial classification (SIC) codes and water use and pollutant discharge rates, we don’t know much about these plants except that they represent a range of industries. Abatement (or other) costs, outputs, sales, and profits are unknown.
Table 14 summarizes the water use and discharge data on these firms (identified by SIC code) by time period, Before (1989–1991) or After (2001–2004). Water use, pollutant loads, and pollutant concentrations are listed.16 Declines in any of these indicators could be consistent with a decline in pollutant discharges, but a decline in water use or pollutant loads also would be consistent with a decline in business activity.
15 This decline is apparent even without considering 2003, which appears to be anomalously light in terms of both water use and pollutant discharges. The anomalies extend to the reports for individual plants. 16 Surcharges for total nitrogen began in 2002, but we were unable to compare discharges of this pollutant. Because no surcharges had been collected for this pollutant during the Before period, its concentrations had not been monitored.
40

Public Treatment of Private Waste: Industrial Use of Municipal Wastewater Treatment
If pollutant concentration declines as well, then the plant probably undertook further abatement action.
Shaded pairs of cells in Table 14 highlight substantial reductions in pollutant load or concentration between the Before and After periods, and more than half the entries are highlighted. Nearly every substantial reduction in pollutant load is accompanied by a substantial reduction in pollutant concentration. These parallel trends present reasonably strong evidence that large reductions in pollutants sent to POTWs by these plants were not simply the result of declines in production.
Whether the observed declines were driven by the surcharges is another question, and a more difficult one to answer. One possible reason for skepticism is that the declines in TSS, for which the fees increased by only 11 percent, were just as common as the declines in BOD, where fees increased by 30 percent. However, the decline in TSS is more likely to result form complementarities in BOD and TSS abatement. A better reason for skepticism is evident from the data in Table 15, which reports the average fees paid for each pollutant by the plants in each industry. For BOD and TP both, the per-firm average fees paid in the “before” period tend to be lowest in the industries that that show the greatest waste reductions. This is not the pattern one would expect if the fees were really having incentive effects. The TP payments are particularly low—sometimes even zero because the phosphorus concentrations are below the surcharge limit.
Thus our evidence from Baltimore provides only limited support for the argument of several pretreatment coordinators who believe that the surcharges have incentive effects. However, Baltimore’s surcharge limits (except for phosphorus) are relatively low among POTWs that have surcharges, so the apparent failure of surcharges provide incentive effects in Baltimore does not imply that they do not provide incentive effects elsewhere, or indeed that they will not have incentive effects in the future.
41
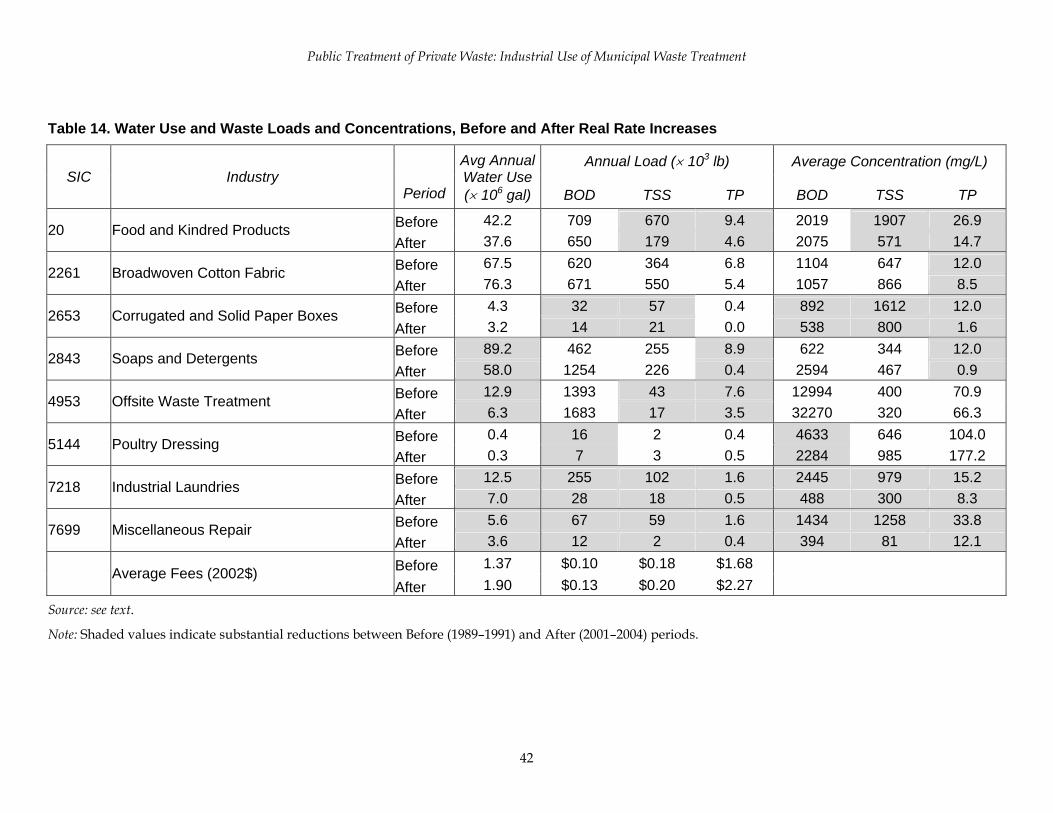
Public Treatment of Private Waste: Industrial Use of Municipal Waste Treatment
Table 14. Water Use and Waste Loads and Concentrations, Before and After Real Rate Increases
Annual Load (× 103 lb) Average Concentration (mg/L) SIC
Industry
Period
Avg Annual Water Use (× 106 gal) BOD TSS TP BOD TSS TP
Before 42.2 709 670 9.4 2019 1907 26.9 20 Food and Kindred Products After 37.6 650 179 4.6 2075 571 14.7 Before 67.5 620 364 6.8 1104 647 12.0 2261 Broadwoven Cotton Fabric After 76.3 671 550 5.4 1057 866 8.5 Before 4.3 32 57 0.4 892 1612 12.0 2653 Corrugated and Solid Paper Boxes After 3.2 14 21 0.0 538 800 1.6 Before 89.2 462 255 8.9 622 344 12.0 2843 Soaps and Detergents After 58.0 1254 226 0.4 2594 467 0.9 Before 12.9 1393 43 7.6 12994 400 70.94953 Offsite Waste Treatment After 6.3 1683 17 3.5 32270 320 66.3Before 0.4 16 2 0.4 4633 646 104.05144 Poultry DressingAfter 0.3 7 3 0.5 2284 985 177.2Before 12.5 255 102 1.6 2445 979 15.2 7218 Industrial LaundriesAfter 7.0 28 18 0.5 488 300 8.3 Before 5.6 67 59 1.6 1434 1258 33.8 7699 Miscellaneous RepairAfter 3.6 12 2 0.4 394 81 12.1 Before 1.37 $0.10 $0.18 $1.68
Average Fees (2002$)
After 1.90 $0.13 $0.20 $2.27Source: see text.
Note: Shaded values indicate substantial reductions between Before (1989–1991) and After (2001–2004) periods.
42
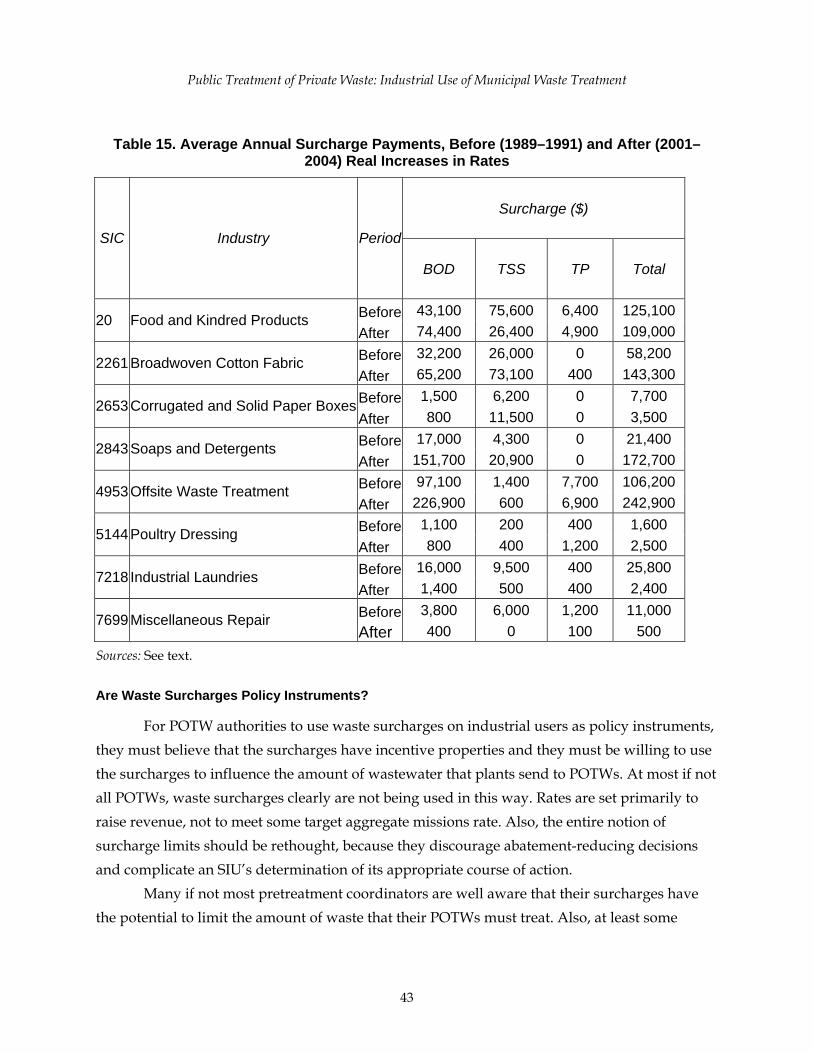
Public Treatment of Private Waste: Industrial Use of Municipal Waste Treatment
Table 15. Average Annual Surcharge Payments, Before (1989–1991) and After (2001–2004) Real Increases in Rates
Surcharge ($)
SIC Industry Period
BOD TSS TP Total
Before 43,100 75,600 6,400 125,100 20 Food and Kindred Products After 74,400 26,400 4,900 109,000 Before 32,200 26,000 0 58,200 2261 Broadwoven Cotton Fabric After 65,200 73,100 400 143,300 Before 1,500 6,200 0 7,700 2653 Corrugated and Solid Paper BoxesAfter 800 11,500 0 3,500 Before 17,000 4,300 0 21,400 2843 Soaps and Detergents After 151,700 20,900 0 172,700 Before 97,100 1,400 7,700 106,200 4953 Offsite Waste Treatment After 226,900 600 6,900 242,900 Before 1,100 200 400 1,600 5144 Poultry Dressing After 800 400 1,200 2,500 Before 16,000 9,500 400 25,800 7218 Industrial Laundries After 1,400 500 400 2,400 Before 3,800 6,000 1,200 11,000 7699 Miscellaneous Repair After 400 0 100 500
Sources: See text.
Are Waste Surcharges Policy Instruments?
For POTW authorities to use waste surcharges on industrial users as policy instruments, they must believe that the surcharges have incentive properties and they must be willing to use the surcharges to influence the amount of wastewater that plants send to POTWs. At most if not all POTWs, waste surcharges clearly are not being used in this way. Rates are set primarily to raise revenue, not to meet some target aggregate missions rate. Also, the entire notion of surcharge limits should be rethought, because they discourage abatement-reducing decisions and complicate an SIU’s determination of its appropriate course of action.
Many if not most pretreatment coordinators are well aware that their surcharges have the potential to limit the amount of waste that their POTWs must treat. Also, at least some
43
Public Treatment of Private Waste: Industrial Use of Municipal Waste Treatment
pretreatment coordinators believe that their surcharges are even now affecting the effluent they must treat, even though their rates are not set with this purpose in mind.
The waste-reducing potential of surcharges also has been noted by higher authorities, including national and regional EPA officials. As noted in the Introduction, EPA’s 2004 local limits guidance document put BOD and TSS on the list of candidates for the development of local limits (USEPA 2004). According to this document, the need to monitor industrial discharges of BOD and TSS becomes increasingly important as a POTW’s volume of wastewater treated increases. A “POTW that is approaching its design capacity for BOD/TSS should begin planning to avoid future violations,” and “reducing industrial sources of conventional pollutants through incentives and disincentives” is listed as one of the options. Among those incentives, of course, are waste surcharges.
V. Conclusions, Qualifications, and Future Trends Evidence presented in the preceding section supports three propositions concerning
CWA implementation:
1. During the first two decades after the CWA was enacted, POTWs tended to overinvest in capital equipment, building capital-intensive facilities with capacities that well exceeded their needs.
2. Although these facilities were intended primarily to treat household wastewater, the excess capacity presented an incentive for POTWs to attract industrial dischargers (thereby increasing wastewater volume, treatment efficiency, and net revenue) and for industrial dischargers to dispose of their wastewater inexpensively. Along with other factors, this situation led to a significant (but far from total) shift from direct to indirect discharge among industrial users.
3. POTWs, both for their own reasons and to respond to federal regulations designed to prevent industrial dischargers from being subsidized by federal grants, increasingly imposed waste surcharges to generate revenues from industrial users. As the amount of wastewater treated has increased, these fees have gradually increased as well.
On a fourth, proposition, the jury is still out: 4. At most POTWs and for some pollutants, these fees provide incentives to reduce
waste discharges.
44

Public Treatment of Private Waste: Industrial Use of Municipal Waste Treatment
Some Qualifications
Although we believe that these trends are, on the whole, supported by the evidence we have been able to obtain, we must reiterate that the support is not unequivocal, nor are the data as complete and comprehensive as we might like. In fact, several regulators we talked with cited deficiencies in federal data collection on compliance with CWA implementation. For example, EPA does not have access to the current breakdown of direct and indirect dischargers by industry, even though such data should be relatively easy to collect as part of normal compliance monitoring. Similarly, although a rich database on expenditures under the Construction Grants program is available, data on outlays from the state revolving fund program are fragmented across state agencies. Therefore, analyzing the impacts of this program in great detail would require an onerous data-collection effort. The paucity of data qualifies our conclusions in several ways.
First, although the effect of capital subsidies on capital use is well supported by economic theory and is generally accepted by policy analysts and observers of the wastewater treatment industry, its empirical basis is limited. We are aware of only one study of the issue (CBO 1985).
Second, in support of the shift from direct to indirect discharge, before-and-after data are available for only 16 of 56 industrial point-source categories for which EPA has written effluent guidelines. For the 16 industries for which we have data, the trend is far from universal. Indirect discharge gained relative to direct discharge in 10 industries, and indirect gains tended to be larger than direct gains. In absolute terms, both direct and indirect discharge declined substantially—91 percent for direct dischargers and by 44 percent for indirect dischargers, mostly because of the substantial shift away from manufacturing to services in the United States during 1970–1990. Considering that indirect discharge is infeasible or impractical for some industries and some plants, direct discharge may be declining but certainly is not disappearing.
Third, evidence of increasing use of waste surcharges depends on a survey conducted every 3 years by AMSA. That survey is valuable but not ideal for our purposes because it is not a panel and because its sampling strategy apparently changed during the period we examined. The survey results indicate that for wastewater volume and two pollutants (BOD and TSS), many POTWs use surcharges; nearly three-quarters use volumetric charges and nearly two-thirds use waste surcharges. However, these fractions appear to have dropped appreciably since 1990, and surcharge incidence is low or nonexistent for other pollutants. A few POTWs have surcharges for phosphorus, nitrogen, or FOG, but none charges fees for heavy metals or other toxic pollutants, which are regulated by means of EPA’s federal pretreatment standards.
45

Public Treatment of Private Waste: Industrial Use of Municipal Waste Treatment
Therefore, whereas many indirect dischargers are subject only to the waste surcharges, many others are subject only to the federal pretreatment standards, and still others are subject to both.
Finally, the evidence of response to surcharges is limited to anecdotal reports by pretreatment coordinators and monitoring data from Baltimore City POTW. Not all dischargers show a decline in emissions as waste surcharges increase, but then, not all should be expected to.
Taken together, limitations on the available data and the lack of complete support for the hypotheses suggest opportunities for further research. Better data would allow more definitive tests of the four hypotheses and might in some cases lead to their refinement. Certainly, the merely partial evidence presented here suggests that an even more interesting story is out there waiting to be discovered.
Future Trends
To claim that the trends discussed in this report were directly caused by the Construction Grants program subsidies between 1972 and about 1991 would be going too far. But that program did reduce the cost of indirect discharge (relative to direct discharge) and, in so doing, may have set in motion the process that did result in current trends.
Congressional action consistently, if intermittently, chipped away at those subsidies between 1981 and the mid-1990s. As the incentives for overcapacity were removed, the excess capacity of POTWs has been drawn down and seems unlikely to reappear in the future. As facilities age, more funding must be devoted to maintenance and rehabilitation. At the same time, population increases will make new investments necessary just to keep water quality from deteriorating. EPA forecasts that without improvements in effluent removal, effluent loadings from POTWs could return to all-time highs by 2016. According to another EPA assessment, updating existing wastewater treatment plants, sewer maintenance and construction, and combined sewer overflow corrections will cost $57.2 billion, $54.1 billion, and $50.6 billion, respectively (USEPA 2002b).
If POTWs no longer have significant excess capacity, then what next? Will the trends we have highlighted continue? The trend toward indirect discharge probably will slow and perhaps reverse as its advantage over direct discharge lessens, but a strong shift in the opposite direction is not expected.
However dischargers change, the changes are not likely to affect appreciably the use of waste surcharges. The revenue-raising feature of surcharges will be difficult for POTWs to live without, especially without the renewal of generous federal subsidies.
46

Public Treatment of Private Waste: Industrial Use of Municipal Waste Treatment
The incentive properties of waste surcharges may come to be valued as much as subsidies. As policy instruments, economic incentives are very well suited to the regulation of indirect dischargers. Even though economic incentives (in the form of waste surcharges) are now used extensively only for BOD and TSS, they are applicable to other pollutants—not only phosphorus, nitrogen, and FOG (for which they are now used only occasionally). They also are applicable to categorical pollutants. POTWs have several characteristics that make them good candidates for incentive-based regulation. For one, they are essentially closed systems, in which it is difficult for unauthorized dischargers to discharge into the system routinely. To be sure, midnight dumping is always possible, but it is true of direct dischargers as well, and avoiding detection is much more difficult for regular rather than occasional illegal dischargers. For most pollutants, POTWs are also essentially aspatial environments. The wastewater is collected from all over and brought, well mixed, to a single point. No “hot spots” are created, because all waste in the system is equally costly to treat, regardless of its source. (One of the few exceptions to this rule is FOG, which is a concern mainly because it can clog distribution systems.) As a result, a POTW’s application of economic incentives ought to enjoy the theoretical advantages of this instrument without suffering from the practical difficulties. Such advantages include cost minimization and cost revelation (i.e., by their actions, dischargers in regimes that use economic incentives disclose the marginal cost of abatement, whereas in direct regulatory regimes they do not).
Another advantage is what might be called abatement awareness. A 1971 analysis of dairy food plant waste treatment practices surveyed 647 large plants—about 10 percent of total U.S. dairy plants, accounting for about 65 percent of “all the milk sold off the farm in 1969” (Harpe et al. 1971). At that time, indirect discharge was the predominant method of wastewater disposal in the dairy industry. Of the 647 plants, 564 (87.1 percent) discharged into a municipal sewer and 55 (8.6 percent) treated their own waste; only 44 (6.8 percent) paid a waste surcharge. Interestingly, the survey also asked plants if they knew how much BOD effluent they were discharging; a small fraction (less than 10 percent) said they did. Surely, most if not all the plants paying surcharges knew what they were discharging; they would have to in order to calculate the surcharge. That means that only a very small percentage of the plants that did not pay surcharges knew what their discharges were. If so, then surcharges can play a role in providing information to plants.
Our analysis of the impacts of waste surcharges on industrial effluent discharges provides only limited evidence that effluent fees have an incentive effect. However, another class of discharger may exhibit a more clearly observable response. Commercial users, such as fast food restaurants, tend to discharge the sorts of pollutants that normally are subject to waste
47

Public Treatment of Private Waste: Industrial Use of Municipal Waste Treatment
surcharges: TSS, BOD, and FOG. Commercial sources are far more numerous than industrial sources, allowing for a potentially richer data analysis. In particular, restaurant chains offer the prospect of observing the behavior of virtually identical facilities operating in different regulatory environments. One official with a POTW told us that, from his perspective, fees had a clear incentive effect—to the point that without them, the POTW would have to be expanded to handle the load from this class of users. How effluent fees affect the behavior of commercial sources may be a promising subject for future analysis.
Waste surcharges are not the only type of economic incentive that may be of use. Whereas waste surcharges are price instruments, cap-and-trade programs are quantity instruments. Both are quite feasible instruments for POTWs; in fact, both are in use. Waste surcharges are very common, as we have discussed, and a cap-and-trade program has been designed for a program in New Jersey. Both kinds of instruments have the same revenue-raising potential. In the standard neoclassical economic model, they are identical in the sense that for every price instrument, there is a corresponding quantity instrument that produces the same results. In the real world, however, they have some important differences. The disadvantage of price instruments is that it is impossible to know before the fact how the plants will respond. Thus, if a POTW wants to use waste surcharges to reduce the pollutant load from A to B, it will have to guess at the surcharge rate that will achieve this result. Under current regulations, POTWs face discharge limits that cannot be exceeded without incurring NPDES permit violations.
Surcharges might work for a POTW if its current loadings are sufficiently below capacity that it can tolerate some uncertainty in influent loadings without it affecting POTW effluent. Otherwise, the use of pricing instrument upstream from the POTW to control total influent appears to be incompatible with the use of a quantity instrument downstream. Compared with a cap-and-trade program, using waste surcharges to control industrial influent to POTWs does not seem to work as well with the coming system of total maximum daily loads, which will limit the daily discharges of all affected pollutants.
The main disadvantage of quantity instruments is that they require a more novel and elaborate institutional structure than waste surcharges, and one that is less robust. POTWs have vast experience in setting and levying waste surcharges. In contrast, setting up and operating artificial markets in pollution permits is entirely new to them. Experience counts; in other contexts, setting up and operating permit markets has been subject to several snafus (e.g., in the California RECLAIM program). An additional issue with cap-and-trade programs is the problem of thin markets. A permit market with only a few traders may not function properly.
48

Public Treatment of Private Waste: Industrial Use of Municipal Waste Treatment
Another potential issue affects both types of instruments. In theoretical models, rising fees or permit prices cause firms to reduce pollutant discharge smoothly, so that marginal abatement cost equals the fee (or permit price). Such smoothness is unlikely in a world of real abatement costs, where fixed costs and other economies of scale may be present. In the real world, an increase in fees could cause not a smooth adjustment of waste output but a quantum jump after a period of no reaction. With such stickiness in the abatement cost function, a POTW could raise rates and find itself without enough waste to treat, leaving it with insufficient revenue and poor performance. Problems of this sort have afflicted the Dutch effluent fee system in recent years and will have to be worked out if surcharge fees are to continue to play a prominent role U.S. POTW policies.
49
Public Treatment of Private Waste: Industrial Use of Municipal Waste Treatment
References Adler, Robert W., Jessica C. Landman, and Diane M. Cameron. 1993. The Clean Water Act Twenty
Years Later. Washington, DC: Island Press for the Natural Resources Defense Council. AMSA (Association of Metropolitan Sewerage Agencies). 1996. Financial Survey. Washington,
DC: AMSA. Available from www.amsa-cleanwater.org. ———. 1999. Financial Survey. Washington, DC: AMSA. Available from www.amsa-
cleanwater.org. ———. 2002. Financial Survey. Washington, DC: AMSA. Available from www.amsa-
cleanwater.org. ASIWPCA (Association of State and Interstate Water Pollution Control Administrators). 1984.
America’s Clean Water: The States’ Evaluation of Progress: 1972–1982. Washington, DC: ASIWPCA. Available from www.asiwpca.org.
Aydlett, Guy. 2004. Personal communication from Guy Aydlett, general manager, Hampton Roads Sanitation District. May.
Bastian, Robert. 2003. Personal communication from Robert Bastian, U.S. Environmental Protection Agency, November.
Bough, Wayne A., Ed McJimsey, and Donna Clark-Thomas. 1988. Operating Costs of Dairy Pretreatment vs. POTW Facilities and the Establishment of a Waste Minimization Program. Paper presented at the Food Processing Waste Conference, Oct. 31–Nov. 2, 1988, Atlanta, GA.
Bressers, J.T.A., and K.R.D. Lulofs. 2004. Industrial Water Pollution in the Netherlands: A Fee-Based Approach. In Choosing Environmental Policy: Comparing Instruments and Outcomes in the United States and Europe, edited by W. Harrington, R.D. Morgenstern, and T. Sterner. Washington, DC: RFF Press.
CBO (Congressional Budget Office). 1985. Efficient Investment in Wastewater Treatment Plants. Washington, DC: CBO.
CEQ (Council on Environmental Quality). 1976. Washington, DC: CEQ. CRS (Congressional Research Service). 2003. Water Infrastructure Financing: History of EPA
Appropriations. 96–647 ENR. Washington, DC: CRS. Freeman, A. Myrick. 1978. Air and Water Pollution Policy. In Current Issues in U.S.
Environmental Policy, edited by Paul Portney. Baltimore, MD: Johns Hopkins University Press for Resources for the Future.
50
Public Treatment of Private Waste: Industrial Use of Municipal Waste Treatment
Harpe, J., J. Blaisdel, and J. Grosshop. 1971. Dairy Food Plant Wastes and Waste Treatment Practices. EPA 12060-EGU. Columbus, OH: Ohio State University Research Foundation.
Harrington, W., 2004. Industrial Water Pollution in the United States: Direct Regulation or a Fee-Based Approach? In Choosing Environmental Policy: Comparing Instruments and Outcomes in the United States and Europe, edited by W. Harrington, R.D. Morgenstern, and T. Sterner. Washington, DC: RFF Press.
Industrial Economics, Inc. 1998. Sharing the Load: Effluent Trading for Indirect Dischargers. EPA 231-R-98-003. Washington, DC: U.S. Environmental Protection Agency.
Javier, Rene. 2004. Personal communication from Rene Javier, pretreatment coordinator, Little Patuxent Water Reclamation Plant, Howard County Bureau of Utilities, Howard County, Maryland. April 1.
Kelman, Steven. 1982. What Price Incentives? Economists and the Environment. Westport, CT: Auburn House.
Knopman, Debra S., and Richard A. Smith. 1993. Twenty Years of the Clean Water Act: Has U.S. Water Quality Improved? Environment 35(1): 16.
Kollias, Lou, and MWRDGC. 2004. Airport Discharge Issues: One POTW’s Perspective. Paper presented at the 2004 Pretreatment Coordinators Workshop, Norfolk, VA, Oct. 28.
Laszlo, Steve. 2002. Personal communication from Steve Laszlo, pretreatment coordinator, Washington Suburban Sanitary Commission, Laurel, MD, Sept. 10.
Milby, Lyle. 2002. Personal communication from Lyle Milby, pretreatment coordinator, Norman, OK, Sept. 24.
National Research Council (NRC). 1993. Managing Wastewater in Coastal Urban Areas. Washington, DC: National Academy Press.
Nationmaster.com. n.d. McDonald’s Restaurants. www.nationmaster.com/graph-T/foo_mcd_res. Accessed Sept. 10, 2004.
Pineda, Peter. 2004. Personal communication from Peter Pineda, Philadelphia Water Department, Philadelphia, PA, Sept. 27.
PVSC (Passaic Valley Sewerage Commissioners). n.d. Rules and Regulations Concerning Discharges to the Passaic Valley Sewerage Commissioners Treatment Works. PVSC, Newark, NJ, Section B-104. www.pvsc.com/pdf/rules.pdf. Accessed June 6, 2005.
Smith, Richard A., Richard B. Alexander, and Kenneth J. Lanfear. 1991. Stream Water Quality in the Conterminous United States: Status and Trends of Selected Indicators During the 1980s. In National Water Summary 1990–91: Stream Water Quality—Hydrology. Water-Supply Paper 2400. Reston, VA: U.S. Geological Survey.
51

Public Treatment of Private Waste: Industrial Use of Municipal Waste Treatment
permanent.access.gpo.gov/waterusgsgov/water.usgs.gov/nwsum/sal/index.htm. Accessed July 21, 2005.
USEPA (U.S. Environmental Protection Agency). 1974. Economic Analysis of Effluent Guidelines: Meat Packing Industry. EPA 68-01-1533. Washington, DC: USEPA, Office of Planning and Evaluation.
———. 1979. Development Document for Proposed Effluent Limitations Guidelines, New Source Performance Standards, and Pretreatment Standards for the Paint Formulating Point Source Category. EPA 440-1–79-049B. Washington, DC: USEPA, Effluent Guidelines Division.
———. 1980. Development Document for Effluent Limitations Guidelines and Standards for the Coil Coating Point Source Category (Draft). EPA 440-1-81-071-B. Washington, DC: USEPA, Effluent Guidelines Division.
———. 1982a. Development Document for Effluent Limitations Guidelines and Standards for the Battery Manufacturing Point Source Category. EPA 440-1–82-067-B. Washington, DC: USEPA, Effluent Guidelines Division.
———. 1982b. Development Document for Effluent Limitations Guidelines and Standards for the Iron and Steel Manufacturing Point Source Category (Final). EPA 440-1–82-024. Washington, DC: USEPA, Effluent Guidelines Division.
———. 1982c. Development Document for Effluent Limitations Guidelines New Source Performance Standards and Pretreatment Standards for the Metal Molding and Casting (Foundries) Point Source Category (Final). EPA 440-1–82-070B. Washington, DC: USEPA, Effluent Guidelines Division.
———. 1982d. Development Document for Effluent Limitations Guidelines and Standards for the Porcelain Enameling Point Source Category (Final). EPA 440-1–82-072. Washington, DC: USEPA, Effluent Guidelines Division.
———. 1984a. Development Document for Effluent Limitations Guidelines and Standards for the Inorganic Chemicals Manufacturing Point Source Category (Proposed). EPA 440-1-84-007. Washington, DC: USEPA, Effluent Guidelines Division.
———. 1984b. Development Document for Effluent Limitations Guidelines and Standards for the Aluminum Forming Point Source Category, Volume 1 (Final). EPA 440-1–84-073A. Washington, DC: USEPA, Effluent Guidelines Division.
———. 1984c. Development Document for Effluent Limitations Guidelines and Standards for the Plastics Molding and Forming Point Source Category (Final). EPA 440-1-84-069. Washington, DC: USEPA, Office of Water Regulations and Standards.
52

Public Treatment of Private Waste: Industrial Use of Municipal Waste Treatment
———. 1985a. Development Document for Effluent Limitations Guidelines and Standards for the Pesticide Point Source Category (Final). EPA 440-1-85-079. Washington, DC: USEPA, Industrial Technology Division.
———. 1985b. Development Document for Final Effluent Limitations and Guidelines for the Pharmaceutical Manufacturing Point Source Category (Final). EPA 440-1-83-084. Washington, DC: USEPA, Effluent Guidelines Division.
———. 1987. Development Document for Effluent Limitations Guidelines and Standards for the Organic Chemicals Plastics and Synthetic Fibers Point Source Category, Volume 1 (Final). EPA 440-1-87-009.1. Washington, DC: USEPA, Industrial Technology Division.
———. 1989a. Preliminary Data Summary for the Machinery Manufacturing and Rebuilding Industry. EPA 440-1-89-106. Washington, DC: USEPA, Office of Water Regulations and Standards.
———. 1989b. Preliminary Data Summary for the Pulp, Paper and Paperboard Point Source Category. EPA 440-1-89-025. Washington, DC: USEPA, Industrial Technology Division.
———. 1998. Development Document for Final Effluent Limitations Guidelines and Standards for the Pharmaceutical Manufacturing Point Source Category. EPA 821-R-98-005. Washington, DC: USEPA, Office of Water.
———. 2000. Progress in Water Quality: An Evaluation of the National Investment in Municipal Wastewater Treatment. EPA 832-R-00-008. Washington, DC: USEPA, Office of Water.
———. 2001. Financing America’s Clean Waste Since 1987: A Report of Progress and Innovation. EPA 832-R-00-001. Washington, DC: USEPA, Office of Water.
———. 2002a. Development Document for the Proposed Effluent Limitations Guidelines and Standards for the Meat and Poultry Products Industry Point Source Category (40 CFR 432). EPA 821-B-01-007. Washington, DC: USEPA, Office of Water.
———. 2002b. The Clean Water and Drinking Water Infrastructure Gap Analysis, Office of Water. Washington, DC: USEPA,. EPA 816-R-02-020.
———. 2002c. Development Document for Final Effluent Limitations Guidelines and Standards for the Iron and Steel Manufacturing Point Source Category. EPA 821-R-02–004. Washington, DC: USEPA, Office of Water.
———. 2003, "Description and Results of EPA Methodology to Synthesize Screening Level Results for the Effluent Guidelines Program Plan for 2004/2005," Public Record for the Effluent Guidelines Program Plan for 2004/2005 DCN 548, Section 3.0, Memo from Carey Johnston, December 23.
———. 2004a. Local Limits Development Guidance. EPA 833-R-04-002A. Washington, DC: USEPA, Office of Water.
53

Public Treatment of Private Waste: Industrial Use of Municipal Waste Treatment
———. 2004b. Report to Congress: Impacts and Control of CSOs and SSOs. EPA 833-R-04-001. Washington, DC: USEPA.
———. n.d. Industrial Water Pollution Controls: Effluent Guidelines. www.epa.gov/waterscience/pollcontrol/. Accessed January 18, 2006.
Water Quality Products. 2004. 90,000 Facilities in U.S. Treat and Then Discharge Wastewater. www.wqpmag.com/wqp/index.cfm/powergrid/rfah=%7Ccfap=/CFID/808978/ CFTOKEN/59387818/fuseaction/showNewsItem/newsItemID/7391. Accessed July 7, 2004.
54

INDEPENDENT. BALANCED. OBJECTIVE.
1616 P STREET, NW • WASHINGTON, DC 20036–1400 TELEPHONE: (202) 328–5000 • FAX: (202) 939–3460
WWW.RFF.ORG
Related Documents