Public Supply and Domestic Water Use in the United States, 2015 Open-File Report 2017–1131 U.S. Department of the Interior U.S. Geological Survey

Welcome message from author
This document is posted to help you gain knowledge. Please leave a comment to let me know what you think about it! Share it to your friends and learn new things together.
Transcript

Public Supply and Domestic Water Use in the United States, 2015
Open-File Report 2017–1131
U.S. Department of the InteriorU.S. Geological Survey

Cover: Photograph of Montebello Filtration Plant, Baltimore, Maryland, 2015. (Photograph by Cheryl Dieter, U.S. Geological Survey)

Public Supply and Domestic Water Use in the United States, 2015
By Cheryl A. Dieter and Molly A. Maupin
Open-File Report 2017–1131
U.S. Department of the InteriorU.S. Geological Survey
U.S. Department of the InteriorRYAN K. ZINKE, Secretary
U.S. Geological SurveyWilliam H. Werkheiser, Acting Director
U.S. Geological Survey, Reston, Virginia: 2017
For more information on the USGS—the Federal source for science about the Earth, its natural and living resources, natural hazards, and the environment—visit https://www.usgs.gov or call 1–888–ASK–USGS.
For an overview of USGS information products, including maps, imagery, and publications, visit https://store.usgs.gov.
Any use of trade, firm, or product names is for descriptive purposes only and does not imply endorsement by the U.S. Government.
Although this information product, for the most part, is in the public domain, it also may contain copyrighted materials as noted in the text. Permission to reproduce copyrighted items must be secured from the copyright owner.
Suggested citation:Dieter, C.A., and Maupin, M.A., 2017, Public supply and domestic water use in the United States, 2015: U.S. Geologi-cal Survey Open-File Report 2017-1131, 6 p., https://doi.org/10.3133/ofr20171131.
ISSN 2331-1258 (online)
Contents
Introduction.....................................................................................................................................................1Total Population ..............................................................................................................................................1Public-Supply Use and Population Served ................................................................................................2Public-Supply Deliveries to Domestic Users ............................................................................................3Self-Supplied Domestic Use ........................................................................................................................4Total Domestic Use ........................................................................................................................................4Summary..........................................................................................................................................................6References Cited ...........................................................................................................................................6
Figures
1. Graph showing total population and public-supply withdrawals by state and source, 2015 ...................................................................................................................................3
2. Graph showing public-supply withdrawals by state, 2010 and 2015....................................3 3. Graph showing total domestic water use by state, 2010 and 2015 ......................................5 4. Graph showing total domestic per capita water use by state, 2010 and 2015 ...................5
iii
Conversion FactorsMultiply By To obtain
Area
acre 4,047 square meter (m2)
acre 0.4047 hectare (ha)
acre 0.4047 square hectometer (hm2)
acre 0.004047 square kilometer (km2)
Volume
gallon (gal) 3.785 liter (L)
gallon (gal) 0.003785 cubic meter (m3)
gallon (gal) 3.785 cubic decimeter (dm3)
million gallons (Mgal) 3,785 cubic meter (m3)
million gallons (Mgal) 3.07 acre-foot (acre-ft)
cubic foot (ft3) 7.48 gallon (gal)
acre-foot (acre-ft) 1,233 cubic meter (m3)
acre-foot (acre-ft) 0.001233 cubic hectometer (hm3)
Flow rate
acre-foot per year (acre-ft/yr) 1,233 cubic meter per year (m3/yr)
gallon per day (gal/d) 0.003785 cubic meter per day (m3/d)
million gallons per day (Mgal/d) 0.04381 cubic meter per second (m3/s)
Abbreviations
GPCD gallons per capita per day
NWUSP National Water Use Science Project
USGS U.S. Geological Survey
WAUSP Water Availability and Use Science Program
iv


Public Supply and Domestic Water Use in the United States, 2015
By Cheryl A. Dieter and Molly A. Maupin
IntroductionThe U.S. Geological Survey (USGS) National Water Use
Science Project (NWUSP), part of the USGS Water Avail-ability and Use Science Program (WAUSP), has estimated water use in the United States every 5 years since 1950. This report provides an overview of total population, public-supply use, including the population that is served by public-supply systems and the domestic deliveries to those users, and self-supplied domestic water use in the United States for 2015, continuing the task of estimating water use in the United States every 5 years. In this report, estimates for the United States include the 50 States, the District of Columbia, Puerto Rico, and the U.S. Virgin Islands (hereafter referred to as “states” for brevity).
County-level data for total population, public-supply withdrawals and the population served by public-supply systems, and domestic withdrawals for 2015 were published in a data release (Dieter and others, 2017) in an effort to provide data to the public in a timely manner. Data in the current ver-sion (1.0) of Dieter and others (2017) contains county-level total withdrawals from groundwater and surface-water sources (both fresh and saline) for public-water supply, the deliveries from those suppliers to domestic users, and the quantities of water from groundwater and surface-water sources for self-supplied domestic users, and total population. Methods used to estimate the various data elements for the public-supply and domestic use categories at the county level are described by Bradley (2017).
This Open-File Report is an interim report summarizing the data published in Dieter and others (2017) at the state and national level. This report includes discussions on the total population, totals for public-supply withdrawals and popula-tion served, total domestic withdrawals, and provides com-parisons of the 2015 estimates to 2010 estimates (Maupin and others, 2014). Total domestic water use, as described in this report, represents the summation of deliveries from public-water supply to domestic users plus self-supplied domestic withdrawals.
Values for 2010 are the best available data for 2010 from the USGS Aggregate Water-Use Data System (AWUDS). The 2010 values presented in this report may have been revised from 2010 values published in Maupin and others (2014), and
therefore values for 2010 in this report may not exactly match values in Maupin and others (2014).
Withdrawal and population values in this report are rounded to three significant figures. All values are rounded independently, so the sums of individually rounded numbers may not equal the totals. Percent change is calculated on unrounded data and is expressed as an integer. Differences between 2010 and 2015 values are calculated on unrounded data, then the differences are rounded.
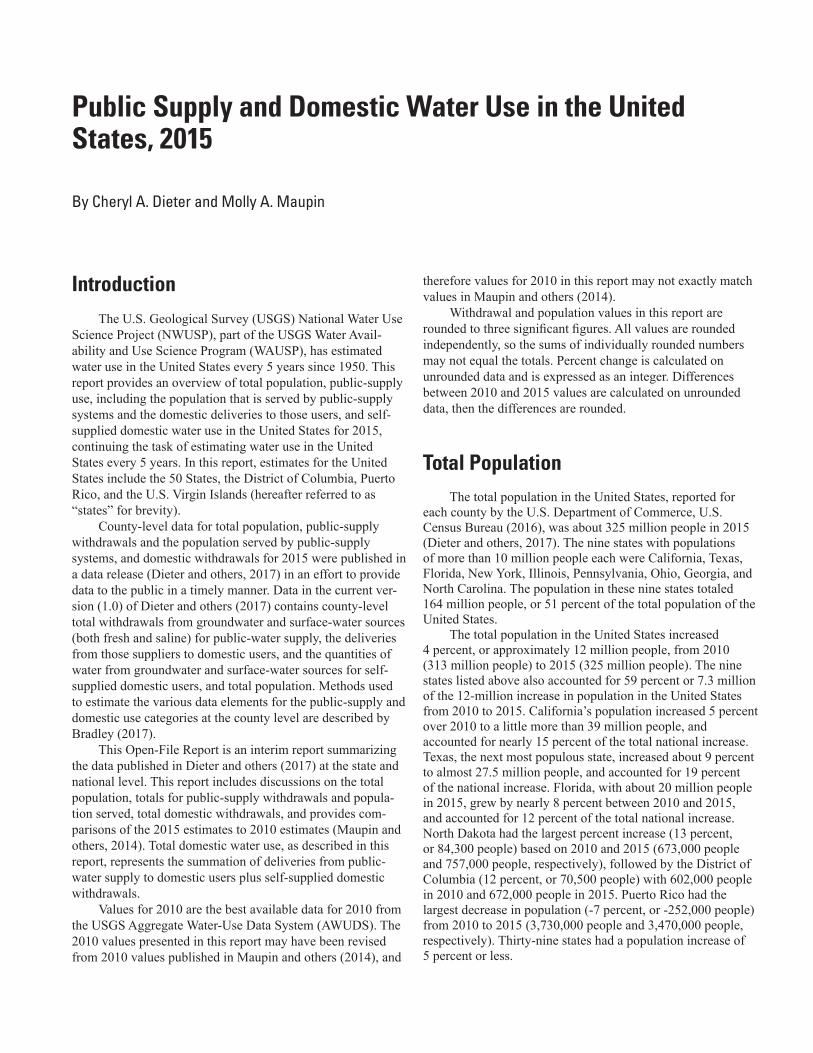
Total PopulationThe total population in the United States, reported for
each county by the U.S. Department of Commerce, U.S. Census Bureau (2016), was about 325 million people in 2015 (Dieter and others, 2017). The nine states with populations of more than 10 million people each were California, Texas, Florida, New York, Illinois, Pennsylvania, Ohio, Georgia, and North Carolina. The population in these nine states totaled 164 million people, or 51 percent of the total population of the United States.
The total population in the United States increased 4 percent, or approximately 12 million people, from 2010 (313 million people) to 2015 (325 million people). The nine states listed above also accounted for 59 percent or 7.3 million of the 12-million increase in population in the United States from 2010 to 2015. California’s population increased 5 percent over 2010 to a little more than 39 million people, and accounted for nearly 15 percent of the total national increase. Texas, the next most populous state, increased about 9 percent to almost 27.5 million people, and accounted for 19 percent of the national increase. Florida, with about 20 million people in 2015, grew by nearly 8 percent between 2010 and 2015, and accounted for 12 percent of the total national increase. North Dakota had the largest percent increase (13 percent, or 84,300 people) based on 2010 and 2015 (673,000 people and 757,000 people, respectively), followed by the District of Columbia (12 percent, or 70,500 people) with 602,000 people in 2010 and 672,000 people in 2015. Puerto Rico had the largest decrease in population (-7 percent, or -252,000 people) from 2010 to 2015 (3,730,000 people and 3,470,000 people, respectively). Thirty-nine states had a population increase of 5 percent or less.
2 Public Supply and Domestic Water Use in the United States, 2015
Public-Supply Use and Population Served
Public supply refers to water withdrawn by public and private water suppliers that provide water to at least 25 people or have a minimum of 15 connections. Public-supply water is delivered to users for domestic, commercial, and industrial purposes, and also is used for public services and accounted for by system losses. Public-supply deliveries to commercial and industrial users have not been reported by the USGS NWUSP since 2000, but deliveries to domestic users are included in these data as public-supply deliveries to domes-tic users (see section below), which represent a part of the total public-supply withdrawals. The public-supply data also include the population that is served by public-supply with-drawals for each county. The residual county population (total county population minus population served by public supply) is the self-supplied domestic population (discussed in the Self-Supplied Domestic Use section).
Total withdrawals for public supply were about 39,200 million gallons per day (Mgal/d) in 2015 (Dieter and others, 2017). Sixty-one percent of these withdrawals were from fresh surface-water sources (24,000 Mgal/d), 38 per-cent were from fresh groundwater sources (14,900 Mgal/d), less than 1 percent was from saline groundwater sources (263 Mgal/d), and less than 0.5 percent was from saline surface-water sources (7.21 Mgal/d) (Dieter and others, 2017). Sixty percent or almost 23,300 Mgal/d (Dieter and others, 2017) of the total public-supply withdrawals were delivered to domestic users.
States with the largest populations also had the larg-est withdrawals for public supply. Seven states – California, Texas, New York, Florida, Illinois, Pennsylvania, and Ohio – each withdrew more than 1,300 Mgal/d for public supply in 2015 (fig. 1) (Dieter and others, 2017). California withdrew about 5,150 Mgal/d, of which 2,370 Mgal/d (46 percent) was from groundwater and 2,780 Mgal/d (54 percent) was from surface water (Dieter and others, 2017) (fig. 1). Texas withdrew about 2,890 Mgal/d total for public supply, of which 1,170 Mgal/d (41 percent) was from groundwater and 1,710 Mgal/d (59 percent) was from surface water (Dieter and others, 2017) (fig. 1). New York withdrew less than Texas, 2,420 Mgal/d; however, only 614 Mgal/d (25 percent) was
from groundwater and 1,810 Mgal/d (75 percent) was from surface water (Dieter and others, 2017) (fig. 1). In contrast, Florida withdrew a total of 2,380 Mgal/d for public sup-ply, with 2,080 Mgal/d (87 percent) from groundwater, and 307 Mgal/d (13 percent) from surface-water sources (Dieter and others, 2017) (fig. 1).
In 2015, public-supply water systems provided an estimated 282 million people (Dieter and others, 2017), or 87 percent of the total population in the U.S. with potable drinking water. In California, more than 37 million people (96 percent of the population) are served by public water supplies; in Texas, more than 26 million people (95 percent of the population), are served by public water supplies (Dieter and others, 2017). Populations in the District of Columbia and Puerto Rico are supplied almost completely by public-supply systems, whereas only half of the populations in the U.S. Virgin Islands (about 52,000 people) and Maine (about 669,000 people) are supplied by public-supply systems (Dieter and others, 2017).
Total withdrawals for public supply decreased 7 percent, or about 2,890 Mgal/d from 2010 (42,100 Mgal/d) to 2015 (39,200 Mgal/d), continuing the decline in public-supply withdrawals observed from 2005 to 2010 (Maupin and oth-ers, 2014). Total public-supply withdrawals in 2015 were at the lowest levels since 1995 (approximately 40,200 Mgal/d) (Maupin and others, 2014). Total groundwater withdrawals for public supply decreased slightly from about 15,900 Mgal/d in 2010 to 15,200 Mgal/d in 2015, and surface-water withdrawals decreased from about 26,200 Mgal/d in 2010 to 24,000 Mgal/d in 2015. In 2010, groundwater withdrawals accounted for 38 percent of the total withdrawals for public supply and surface-water withdrawals accounted for 62 percent of the total withdrawals. Similarly, in 2015, groundwater withdraw-als accounted for 39 percent of the total withdrawals for public supply, and surface-water withdrawals accounted for 61 percent of the total withdrawals.
The largest decreases in total public-supply withdrawals at the state level were in California and Texas (1,150 Mgal/d and 1,110 Mgal/d, respectively) (fig. 2). Whereas withdraw-als increased for 16 states, ranging from 2 to 117 Mgal/d, decreases in California and Texas accounted for 78 percent of the overall decrease of 2,890 Mgal/d. Thirty-four other states had estimated decreases in public-supply withdrawals ranging from less than 1 Mgal/d to 187 Mgal/d.

Public-Supply Deliveries to Domestic Users 3
0
1,000
2,000
3,000
4,000
5,000
6,000WEST EAST
Tota
l with
draw
als,
in m
illio
n ga
llons
per
day
Hawaii
Alaska
Oregon
Washington
California
NevadaIdaho
Arizona
Utah
Montana
Wyoming
New Mexic
o
Colorado
North Dako
ta
South Dakota
NebraskaTe
xas
Kansas
Oklahoma
MinnesotaIowa
Missouri
Louisi
ana
Arkansa
s
Wisc
onsin
Mississ
ippi
Illinois
Alabama
Tenness
ee
Indiana
Kentucky
Michigan
GeorgiaOhio
Florid
a
South Carolina
West Virg
inia
North Carolin
a
Virginia
Pennsylva
nia
Maryland
Distric
t Of C
olumbia
New York
Delaware
New Jersey
Connecticut
Vermont
Massachuse
tts
Rhode Island
New HampshireMaine
Puerto Rico
U.S. Virg
in Islands
0
5,000
10,000
15,000
20,000
25,000
30,000
35,000
40,000
45,000
Popu
latio
n, in
thou
sand
sEXPLANATIONGroundwater withdrawals
Surface-water withdrawals
Total population
Figure 1. Total population and public-supply withdrawals by state and source, 2015.
0
1,000
2,000
3,000
4,000
5,000
6,000
7,000WEST EAST
Tota
l with
draw
als,
in m
illio
n ga
llons
per
day
Hawaii
Alaska
Oregon
Washington
California
NevadaIdaho
Arizona
Utah
Montana
Wyoming
New Mexic
o
Colorado
North Dako
ta
South Dakota
NebraskaTe
xas
Kansas
Oklahoma
MinnesotaIowa
Missouri
Louisi
ana
Arkansa
s
Wisc
onsin
Mississ
ippi
Illinois
Alabama
Tenness
ee
Indiana
Kentucky
Michigan
GeorgiaOhio
Florid
a
South Carolina
West Virg
inia
North Carolin
a
Virginia
Pennsylva
nia
Maryland
Distric
t Of C
olumbia
New York
Delaware
New Jersey
Connecticut
Vermont
Massachuse
tts
Rhode Island
New HampshireMaine
Puerto Rico
U.S. Virg
in Islands
EXPLANATION
2010
2015
Figure 2. Public-supply withdrawals by state, 2010 and 2015.
Public-Supply Deliveries to Domestic Users
Public-supply deliveries to domestic users represent that part of total public-supply withdrawals that are potable water that is provided to domestic households for indoor and outdoor uses. These deliveries represent a part of total public-supply withdrawals. Domestic deliveries from public-water suppli-ers totaled about 23,300 Mgal/d, representing 60 percent of total public-supply water use, and supplying 87 percent, or 282 million people, with their domestic water (Dieter and others, 2017). California, Texas, Florida, and New York had the largest deliveries to domestic users by public suppliers: 3,230 Mgal/d, 2,120 Mgal/d, 1,500 Mgal/d and 1,230 Mgal/d, respectively (Dieter and others, 2017). Arizona and Illinois
were the next largest users, with each state delivering about 950 Mgal/d to domestic users from public-water suppliers (Dieter and others, 2017). Per capita water use for domestic deliveries ranged from 35 gallons per capita per day (GPCD) in Connecticut to 186 GPCD in Idaho (Dieter and others, 2017). The national average per capita water use for domestic deliveries was 83 GPCD (Dieter and others, 2017).
The population served by public-supply systems increased by almost 14 million people (5 percent) from 269 million people in 2010 to 282 million people in 2015. Deliveries to domestic users from public-water supplies decreased 381 Mgal/d, or 2 percent, from 23,700 Mgal/d in 2010 to 23,300 Mgal/d in 2015. The national average per capita water use for domestic deliveries, which represents the daily water use for the population that is only supplied by pub-lic-supply systems, also decreased 6 GPCD from 89 GPCD in 2010 to 83 GPCD in 2015.
4 Public Supply and Domestic Water Use in the United States, 2015
Self-Supplied Domestic UseDomestic water use includes indoor and outdoor uses at
residences. Indoor uses include cooking, drinking, food prepa-ration, and daily sanitary uses. Outdoor uses mostly include irrigation and other landscape feature uses, such as for pools, ponds, and fountains. Self-supplied domestic water use rep-resents water that each homeowner provides for themselves, predominantly from groundwater sources such as wells, but also from surface-water sources such as springs, creeks, rivers, or cisterns.
An estimated 42.5 million people in the United States, or 13 percent of the population, provided their own water for domestic use in 2015 (Dieter and others, 2017). Total self-supplied domestic withdrawals were estimated to be almost 3,260 Mgal/d, with 98 percent or 3,210 Mgal/d from ground-water sources, and 49 Mgal/d, or 2 percent, from surface-water sources (Dieter and others, 2017). Pennsylvania had the largest self-supplied domestic withdrawals (208 Mgal/d), followed by New York and Michigan, with withdrawals of 187 Mgal/d each (Dieter and others, 2017). Both the District of Columbia and Puerto Rico have populations that are almost entirely sup-plied by public-supply systems: the District of Columbia had zero self-supplied domestic withdrawals estimated in 2015, and less than 1 Mgal/d was estimated for Puerto Rico in 2015 (Dieter and others, 2017). The self-supplied per capita use ranged from 36 GPCD in Connecticut to 220 GPCD in Utah (Dieter and others, 2017). The national self-supplied domestic per capita use was 77 GPCD (Dieter and others, 2017).
The domestic self-supplied population, the residual from total county population and the population served by public supplies, decreased by 1.4 million people (3 percent) from 44.0 million people in 2010 to 42.6 million people in 2015. The domestic self-supplied withdrawals decreased by 9 percent from 3,570 Mgal/d in 2010 to 3,260 Mgal/d in 2015. This represents a continued decline in self-supplied domestic withdrawals observed from 2005 to 2010 (Maupin and oth-ers, 2014). Total domestic self-supplied withdrawals in 2015 were at the lowest levels since prior to 1980 (approximately 3,400 Mgal/d) (Maupin and others, 2014). The national aver-age for the domestic self-supplied per capita, which represents the daily use per person for only those people who provide their own domestic-use water, decreased 4 GPCD from 81 GPCD in 2010 to 77 GPCD in 2015.
Total Domestic UseThis section describes water use and per capita use
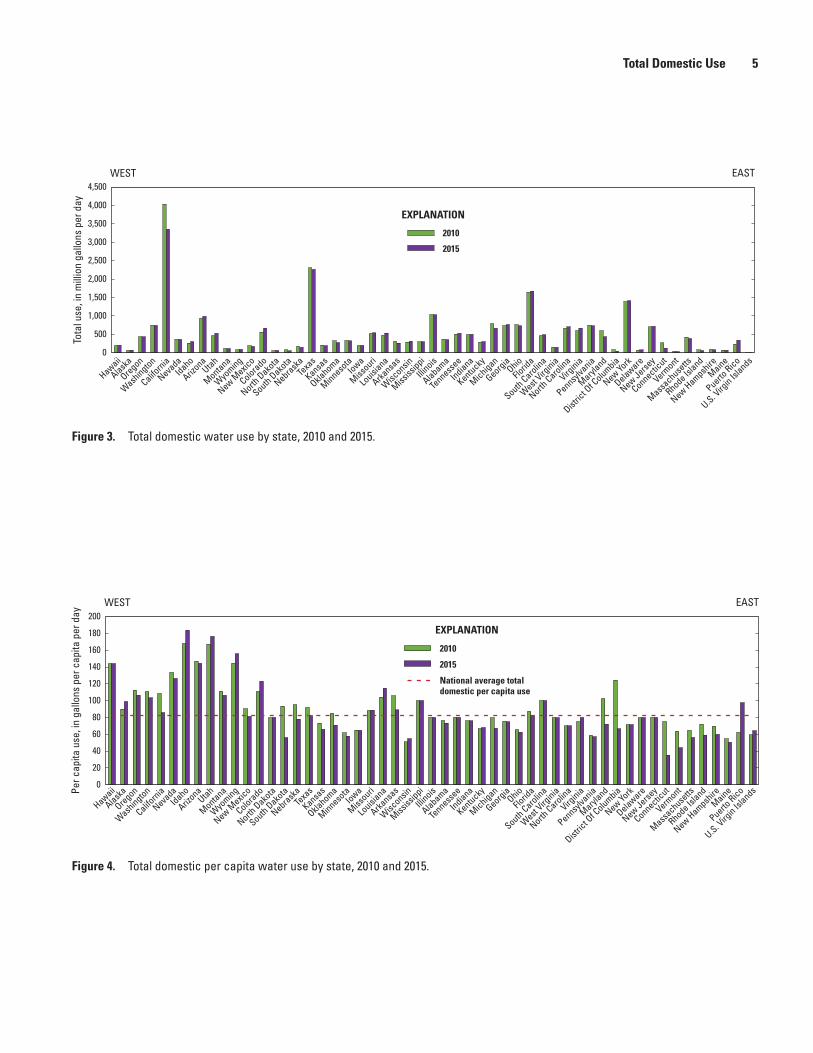
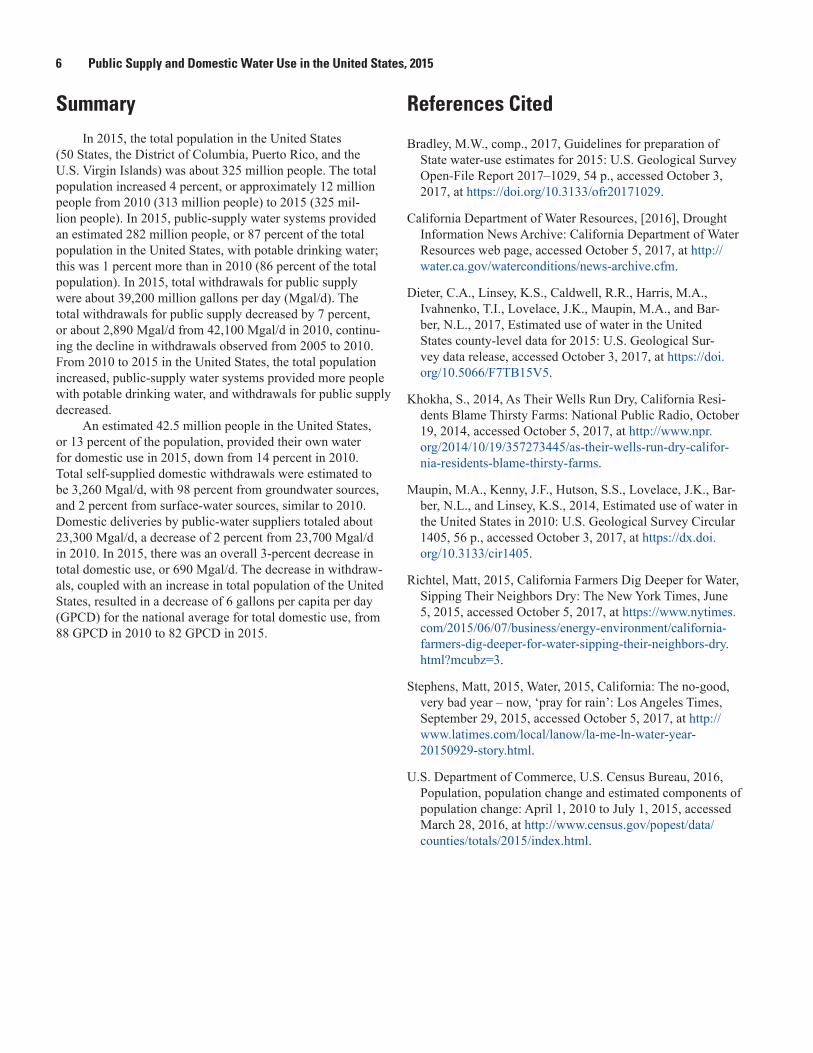
for total domestic use, which is the combined water from public-supply deliveries to domestic users plus self-supplied domestic withdrawals. Total domestic use for 2015 was about 26,600 Mgal/d, with 23,300 Mgal/d from public-supply deliv-eries (88 percent) and 3,260 Mgal/d self-supplied withdraw-als (12 percent) (Dieter and others, 2017). California, Texas, Florida, and New York had the largest total domestic use: 3,350 Mgal/d, 2,260 Mgal/d, 1,680 Mgal/d, and 1,410 Mgal/d, respectively (fig. 3) (Dieter and others, 2017). Illinois and Ari-zona followed, with total domestic use of about 1,000 Mgal/d each (Dieter and others, 2017) (fig. 3). Total domestic per capita use ranged from 35 GPCD in Connecticut to 184 GPCD in Idaho (Dieter and others, 2017) (fig. 4). The national aver-age total domestic per capita use for 2015 was 82 GPCD (Dieter and others, 2017).
From 2010 to 2015, California reported a 17-percent decrease in total domestic use (fig. 3). In 2015, California was enduring one of the worst drought years on record (Califor-nia Department of Water Resources, [2016]; Khokha, 2014; Richtel, 2015; Stephens, 2015), with wide-scale water-use reductions and curtailments in effect statewide. The reduction of over 680 Mgal/d represented one of the largest declines in total domestic use in the United States. Similarly, Texas was in a drought year in 2015 as well, and reported 46 Mgal/d less domestic use, or 2 percent less comparatively from 2010 to 2015 (fig. 3). A comparison of total domestic use by state for 2010 and 2015 is shown in figure 3, and indicates increases or decreases in total domestic use by state. Overall, for the United States, 3 percent less domestic water use was estimated from 2010 to 2015, with about 690 Mgal/d less water use. Some states, such as Colorado and Utah, reported increases from 2010 to 2015 (fig. 3), but the magnitude of these increases relative to the total United States difference from 2010 to 2015 was not a large volume of water.
With the decrease in self-supplied domestic withdraw-als, and a decrease in deliveries to domestic use by public-water suppliers, there was an overall decrease (690 Mgal/d, or 3 percent) in total domestic use from 2010 to 2015. With an increase in total population of the United States, and a decrease in total domestic use, the national average total domestic per capita use decreased 6 GPCD from 88 GPCD in 2010 to 82 GPCD in 2015. Total domestic per capita water use by state for 2010 and 2015 is shown in figure 4, and indicates that the total domestic per capita use increased for some states, such as Idaho, Colorado, Alaska, and Puerto Rico, and decreased for other states, such as California, Maryland, the District of Columbia, South Dakota, and Connecticut. However, the decreases in total domestic per capita use were greater than the increases, resulting in a decrease in total domestic per capita use from 2010 to 2015.
Total Domestic Use 5
0
1,000
2,000
2,500
3,000
3,500
4,000
4,500WEST EAST
Tota
l use
, in
mill
ion
gallo
ns p
er d
ay
Hawaii
Alaska
Oregon
Washington
California
NevadaIdaho
Arizona
Utah
Montana
Wyoming
New Mexic
o
Colorado
North Dako
ta
South Dakota
NebraskaTe
xas
Kansas
Oklahoma
MinnesotaIowa
Missouri
Louisi
ana
Arkansa
s
Wisc
onsin
Mississ
ippi
Illinois
Alabama
Tenness
ee
Indiana
Kentucky
Michigan
GeorgiaOhio
Florid
a
South Carolina
West Virg
inia
North Carolin
a
Virginia
Pennsylva
nia
Maryland
Distric
t Of C
olumbia
New York
Delaware
New Jersey
Connecticut
Vermont
Massachuse
tts
Rhode Island
New HampshireMaine
Puerto Rico
U.S. Virg
in Islands
EXPLANATION
2010
2015
500
1,500
Figure 3. Total domestic water use by state, 2010 and 2015.
0
20
40
60
80
100
120
140
160
180
200WEST EAST
Per c
apita
use
, in
gallo
ns p
er c
apita
per
day
Hawaii
Alaska
Oregon
Washington
California
NevadaIdaho
Arizona
Utah
Montana
Wyoming
New Mexic
o
Colorado
North Dako
ta
South Dakota
NebraskaTe
xas
Kansas
Oklahoma
Minnesota
Iowa
Missouri
Louisi
ana
Arkansa
s
Wisc
onsin
Mississ
ippi
Illinois
Alabama
Tenness
ee
Indiana
Kentucky
Michigan
GeorgiaOhio
Florid
a
South Carolina
West Virg
inia
North Carolin
a
Virginia
Pennsylva
nia
Maryland
Distric
t Of C
olumbia
New York
Delaware
New Jersey
Connecticut
Vermont
Massachuse
tts
Rhode Island
New HampshireMaine
Puerto Rico
U.S. Virg
in Islands
EXPLANATION
2010
2015
National average total domestic per capita use
Figure 4. Total domestic per capita water use by state, 2010 and 2015.
6 Public Supply and Domestic Water Use in the United States, 2015
SummaryIn 2015, the total population in the United States
(50 States, the District of Columbia, Puerto Rico, and the U.S. Virgin Islands) was about 325 million people. The total population increased 4 percent, or approximately 12 million people from 2010 (313 million people) to 2015 (325 mil-lion people). In 2015, public-supply water systems provided an estimated 282 million people, or 87 percent of the total population in the United States, with potable drinking water; this was 1 percent more than in 2010 (86 percent of the total population). In 2015, total withdrawals for public supply were about 39,200 million gallons per day (Mgal/d). The total withdrawals for public supply decreased by 7 percent, or about 2,890 Mgal/d from 42,100 Mgal/d in 2010, continu-ing the decline in withdrawals observed from 2005 to 2010. From 2010 to 2015 in the United States, the total population increased, public-supply water systems provided more people with potable drinking water, and withdrawals for public supply decreased.
An estimated 42.5 million people in the United States, or 13 percent of the population, provided their own water for domestic use in 2015, down from 14 percent in 2010. Total self-supplied domestic withdrawals were estimated to be 3,260 Mgal/d, with 98 percent from groundwater sources, and 2 percent from surface-water sources, similar to 2010. Domestic deliveries by public-water suppliers totaled about 23,300 Mgal/d, a decrease of 2 percent from 23,700 Mgal/d in 2010. In 2015, there was an overall 3-percent decrease in total domestic use, or 690 Mgal/d. The decrease in withdraw-als, coupled with an increase in total population of the United States, resulted in a decrease of 6 gallons per capita per day (GPCD) for the national average for total domestic use, from 88 GPCD in 2010 to 82 GPCD in 2015.
References Cited
Bradley, M.W., comp., 2017, Guidelines for preparation of State water-use estimates for 2015: U.S. Geological Survey Open-File Report 2017–1029, 54 p., accessed October 3, 2017, at https://doi.org/10.3133/ofr20171029.
California Department of Water Resources, [2016], Drought Information News Archive: California Department of Water Resources web page, accessed October 5, 2017, at http://water.ca.gov/waterconditions/news-archive.cfm.
Dieter, C.A., Linsey, K.S., Caldwell, R.R., Harris, M.A., Ivahnenko, T.I., Lovelace, J.K., Maupin, M.A., and Bar-ber, N.L., 2017, Estimated use of water in the United States county-level data for 2015: U.S. Geological Sur-vey data release, accessed October 3, 2017, at https://doi.org/10.5066/F7TB15V5.
Khokha, S., 2014, As Their Wells Run Dry, California Resi-dents Blame Thirsty Farms: National Public Radio, October 19, 2014, accessed October 5, 2017, at http://www.npr.org/2014/10/19/357273445/as-their-wells-run-dry-califor-nia-residents-blame-thirsty-farms.
Maupin, M.A., Kenny, J.F., Hutson, S.S., Lovelace, J.K., Bar-ber, N.L., and Linsey, K.S., 2014, Estimated use of water in the United States in 2010: U.S. Geological Survey Circular 1405, 56 p., accessed October 3, 2017, at https://dx.doi.org/10.3133/cir1405.
Richtel, Matt, 2015, California Farmers Dig Deeper for Water, Sipping Their Neighbors Dry: The New York Times, June 5, 2015, accessed October 5, 2017, at https://www.nytimes.com/2015/06/07/business/energy-environment/california-farmers-dig-deeper-for-water-sipping-their-neighbors-dry.html?mcubz=3.
Stephens, Matt, 2015, Water, 2015, California: The no-good, very bad year – now, ‘pray for rain’: Los Angeles Times, September 29, 2015, accessed October 5, 2017, at http://www.latimes.com/local/lanow/la-me-ln-water-year-20150929-story.html.
U.S. Department of Commerce, U.S. Census Bureau, 2016, Population, population change and estimated components of population change: April 1, 2010 to July 1, 2015, accessed March 28, 2016, at http://www.census.gov/popest/data/counties/totals/2015/index.html.
For additional information, contact: Director, MD-DE-DC Water Science Center U.S. Geological Survey 5522 Research Park Drive Baltimore, MD 21228
or visit our website at:http://md.water.usgs.gov/
Prepared by USGS West Trenton Publishing Service Center

Dieter and Maupin—
Public Supply and Dom
estic Water U
se in the United States, 2015—
Open-File Report 2017–1131
ISSN 2331-1258 (online)https://doi.org/10.3133/ofr20171131
Related Documents


