1 Public Sector Hospital Competition, New Private Market Entrants and Their Combined Impact on Incumbent Providers’ Efficiency: Evidence from the English National Health Service - September, 2011 - Zack Cooper – [email protected] The Centre for Economic Performance, The London School of Economics Stephen Gibbons – [email protected] Department of Geography, The Spatial Economics Research Centre and The Centre for Economic Performance, The London School of Economics Simon Jones – [email protected] LSE Health, The London School of Economics Alistair McGuire – [email protected] LSE Health and the Department of Social Policy, The London School of Economics Abstract: This paper uses a difference-in-difference style estimation strategy to separately test the impact of competition from public sector and private sector hospitals on the productivity of public hospitals. Our identification strategy takes advantage of the phased introduction of a recent set of substantive reforms introduced in the English NHS. These reforms forced public sector health care providers to compete with other public hospitals and eventually face competition from existing private sector providers for care delivered to publicly funded patients. In this study, we measure efficiency using hospitals’ average length of stay (LOS) for patients undergoing elective surgery. For a more nuanced assessment of efficiency, we break LOS down into its two key components: the time from a patient’s admission until their surgery and the time from their surgery until their discharge. Here, pre-surgery LOS serves as a proxy for hospitals’ lean efficiency. Our results suggest that competition between public providers prompted public hospitals to improve their productivity by decreasing their pre-surgery length of stay. In contrast, competition from private hospitals left incumbent public providers with a more costly case mix of patients and led to increases in post-surgical LOS. Acknowledgements: The authors would like to thank John Van Reenen, Mark McClellan, Julian Le Grand, Stephen Seiler, and Mirko Draca for their helpful feedback on this work. We would also like to thank the participants at the various forums where previous versions of this article were presented. All errors are undoubtedly our own. Funding for this research was generously provided by an Economic and Social Research Council Postdoctoral Fellowship and a Seed Fund Grant from the London School of Economics.

Welcome message from author
This document is posted to help you gain knowledge. Please leave a comment to let me know what you think about it! Share it to your friends and learn new things together.
Transcript

1
Public Sector Hospital Competition, New Private Market Entrants and Their Combined Impact on Incumbent Providers’ Efficiency:
Evidence from the English National Health Service
- September, 2011 - Zack Cooper – [email protected] The Centre for Economic Performance, The London School of Economics Stephen Gibbons – [email protected] Department of Geography, The Spatial Economics Research Centre and The Centre for Economic Performance, The London School of Economics Simon Jones – [email protected] LSE Health, The London School of Economics Alistair McGuire – [email protected] LSE Health and the Department of Social Policy, The London School of Economics Abstract: This paper uses a difference-in-difference style estimation strategy to separately test the impact of competition from public sector and private sector hospitals on the productivity of public hospitals. Our identification strategy takes advantage of the phased introduction of a recent set of substantive reforms introduced in the English NHS. These reforms forced public sector health care providers to compete with other public hospitals and eventually face competition from existing private sector providers for care delivered to publicly funded patients. In this study, we measure efficiency using hospitals’ average length of stay (LOS) for patients undergoing elective surgery. For a more nuanced assessment of efficiency, we break LOS down into its two key components: the time from a patient’s admission until their surgery and the time from their surgery until their discharge. Here, pre-surgery LOS serves as a proxy for hospitals’ lean efficiency. Our results suggest that competition between public providers prompted public hospitals to improve their productivity by decreasing their pre-surgery length of stay. In contrast, competition from private hospitals left incumbent public providers with a more costly case mix of patients and led to increases in post-surgical LOS. Acknowledgements: The authors would like to thank John Van Reenen, Mark McClellan, Julian Le Grand, Stephen Seiler, and Mirko Draca for their helpful feedback on this work. We would also like to thank the participants at the various forums where previous versions of this article were presented. All errors are undoubtedly our own. Funding for this research was generously provided by an Economic and Social Research Council Postdoctoral Fellowship and a Seed Fund Grant from the London School of Economics.
2
1. Introduction
As health care spending has continued to rise across the developed world, a number of countries
have recently introduced market-based health care reforms designed to create financial
incentives for providers to improve their clinical quality and efficiency. Interestingly, despite its
global reputation to the contrary, the English National Health Service (NHS) has been at the
forefront of these efforts. Over the last decade in England, policy-makers in the NHS have given
patients greater choice over where they receive secondary care; they have published more
information on providers’ performance; they have diversified the hospital sector by allowing
private providers to deliver care to NHS-funded patients; and they have introduced a new,
prospective, fixed-payment provider payment system modeled on the Medicare diagnosis related
group (DRG) system in the US (Cooper et al., 2011). Collectively, these reforms were designed
to introduce hospital competition into the NHS within a market with fixed prices (Le Grand,
2007). This paper assesses the impact of these reforms on NHS hospitals’ productive efficiency.
Thus far, empirical evidence suggests that the NHS reforms have proven largely successful.
Recent evidence by Cooper et al. (2010 and 2011), Gaynor et al. (2010) and Bloom et al. (2010)
suggests that these reforms have lowered mortality rates, shortened patients’ length of stay and
are associated with improvements in hospitals management quality. Nevertheless, for a host of
reasons, these market-based reforms both in England and abroad remain controversial. First,
despite increasing efforts to expand hospital competition, the evidence on the impact of
competition on providers’ efficiency and quality is mixed, and the theoretical literature suggests
that the underlying market structure and payment systems that are in place can greatly influence
how providers respond to competition (Gaynor and Town, 2011). Second, in spite of the
intuitive appeal of increasing transparency, there has been some evidence that suggests that
publishing information on providers’ performance can lead to short-term reductions in welfare
(Dranove et al., 2003). Third, while proponents argue that encouraging the entry of new types of
health care providers that are specialized and focused on individual segments of the health care
market (like elective surgery for orthopedics) will encourage competition and improve
productive efficiency; critics have argued that these new market entrants, who are generally
privately owned, will cherry-pick healthier patients for care and destabilize larger incumbent
3
hospitals (Barro et al., 2006). This final point is particularly salient in England where, beginning
in 2007, the NHS began paying for NHS patients to receive care in private facilities that are
largely focused on elective care and resemble ambulatory surgical centers that are increasingly
common in the US.
In this paper, we exploit the timing of the recent market-based reforms in the NHS to create a
quasi-natural experiment using difference-in-difference (DD) style estimators to test the impact
of hospital competition, after it was formally introduced, on the efficiency of care delivered in
NHS (public) hospitals. Our analysis is focused on assessing whether efficiency increased more
in the period after competition was introduced from 2006 onwards for NHS hospitals located in
markets where patients had a greater amount of choice. In addition, we also examine whether
the entrance of private providers into the market for NHS patients also prompted incumbent NHS
providers to improve their efficiency. Finally, we test whether the entrance of new private sector
providers into the market for publicly funded care left incumbent NHS hospitals treating a more
costly case mix of patients. Crucially, the staggered timing of the NHS reforms allows us to
identify separately the impact of competition between public sector providers that began in 2006
and the impact of private sector providers that began in 2007.
Within the broader hospital competition literature, it has generally been challenging to identify
the impact of competition on hospital quality and efficiency because hospital market structure is
likely endogenous with providers’ performance (Gaynor et al., 2010b, Gaynor and Town, 2011).
However, the NHS reforms provide two sources of exogenous variation that aid us in identifying
the impact of public sector and private sector hospital competition on efficiency. First, we are
able to identify the impact of competition on efficiency by taking advantage of exogenous policy
changes that were introduced separately in 2006 and 2007, both of which applied universally to
the whole of England. Second, to measure hospital competition, we use counts of hospitals in
local markets and we benefit from the fact that both public and private hospital locations in
England are exogenous to hospitals’ NHS performance. Indeed, the geographical location of
public hospitals in England largely dates back to the founding of the NHS in 1948 (Klein, 2006).
Likewise, of the 162 private hospitals currently operating in England and potentially accessible
to NHS patients, the mean opening year for these private facility was 1979, and 158 of the 162
4
private providers who were eligible to provide care to NHS funded-patients were opened prior to
the NHS reforms.
Because there is no reliable information on hospital costs in England, we measure hospital
efficiency using patients’ length of stay (LOS) for hip replacements, knee replacements,
arthroscopies and hernia repairs. Indeed, because of the inadequacy of cost data in health
services more broadly, LOS has been used as a proxy for efficiency (Fenn and Davies, 1990,
Martin and Smith, 1996). In England, since each additional bed day from 2006 onwards reduces
hospitals’ marginal profit for each patient by £225.00, providers face significant incentives to
discharge patients from the hospital more quickly. We examine whether or not those incentives
motivated on changes in behavior.
However, we are not exclusively interested in examining whether higher hospital competition
was associated with lower LOS. We are also interested in examining whether any changes we
observe in LOS were driven by genuine improvements in productive efficiency that are
consistent with improvements in lean manufacturing, or were instead driven by hospitals
selecting healthier patients for surgery or providers discharging patients ‘sicker and quicker’. To
differentiate between genuine efficiency gains versus quality skimping or cream-skimming, we
disaggregate LOS into its key component parts. A patient’s LOS is composed of two parts: 1)
the time from the patient’s admission until surgery; and 2) the time from the patient’s surgery
until discharge. The pre-surgery LOS is largely determined by hospitals’ admissions and
surgical theatre policies and is largely unrelated to patient characteristics. As a result, according
to the NHS Institute for Innovation and Improvement, it should be a strong proxy for efficiency
and serve as a measure of hospitals lean processing ability (NHS Institute for Innovation and
Improvement, 2006, NHS Institute for Innovation and Improvement, 2008). In contrast, the
post-surgery LOS is heavily dependent on patient characteristics (some of which will be latent)
which directly influence recovery and discharge time (Epstein et al., 1990, Martin and Smith,
1996, Sudell et al., 1991). Therefore, in this analysis, we examine whether the incentives created
within the English NHS reforms produced incentives that drove providers to quality skim in
order to garner additional revenue or, instead, prompted providers to take concrete steps to
become more efficient.
5
We present evidence below consistent with the finding that the introduction of patient choice and
competition between NHS providers from 2006 onwards was associated with reductions in
patients’ LOS. More precisely, after 2005, outcomes for patients treated in incumbent hospitals
that were more exposed to the incentives created by the reforms showed the greatest reductions
in LOS. Crucially, higher competition led to a relative reduction in pre-surgery LOS that was
approximately double the relative reduction in post-surgery LOS. This implies that competition
between NHS providers did lead to greater efficiency in the throughput of patients.
Conversely, the introduction of private sector competition, which was formally introduced in
2008, was not associated with stimulating improvements in incumbent public hospitals’
efficiency. Indeed, ceteris paribus, patients in public hospitals located in areas with more private
providers tended to have statistically significant higher post-operative LOS in 2008, 2009 and
2010 with no statistically significant changes in pre-surgery LOS. Our work suggests that these
changes were by the entrance of private sector market into the market, which left public sector
incumbents with older and less wealthy patient case mix after the reforms were introduced in
2007.
2. The NHS Reforms
The NHS, founded in 1948, is a tax-funded health system that is free at the point of use. The
primary care system in England is organized around general practitioners (GPs) who provide
patients with referrals for secondary care. Until recently, secondary care was mainly delivered in
publicly owned NHS hospitals that were largely funded by annual budgets set by the Department
of Health. From the 1990s until 2003, annual hospital budgets were phased out and hospitals in
England were paid using annual block contracts that paid providers a fixed amount for delivering
a large, fixed volume of services (Chalkley and Malcomson, 1998).
In 2002, following the announcement of substantial increases in health care spending, the UK
government launched reforms to the NHS (Department of Health, 2002). The reforms were
introduced on a rolling basis from 2002 onwards and involved substantial changes to both the
6
organization of the demand side and the supply side of the NHS. The reforms were broadly
designed to give patients a choice over where they received care, alongside a new prospective
hospital payment system that paid providers a predetermined fee for each episode of care they
delivered. In addition to the expansion of patient choice, the government also encouraged new
providers to enter the market, and introduced a wave of regulatory reforms designed to guarantee
minimum standards of hospital performance. Collectively, these reforms were designed to
introduce non-price competition between hospitals together with giving hospitals additional
fiscal and clinical autonomy so that they could differentiate themselves on non-price aspects of
their care.
The new payment system was designed with two primary objectives in mind (Department of
Health, 2009a). The first objective was to encourage hospitals to increase their activity levels by
paying them a fixed price per episode of care that they delivered (with prices set ex ante on
average national NHS costs), which allowed hospitals to generate larger revenues by expanding
their activity. The second objective was to allow hospitals to face a financial consequence for
poor performance by wedding this new payment system with the introduction of patient choice.
Here, combining patient choice with the new payment reforms meant that a substantial portion of
hospitals’ income (up to 70%) was contingent on their annual activity levels, which were a direct
function of their ability to attract local patients and maintain market share. In addition, as this
new payment system was being rolled out, the government rewarded high performing hospitals
with additional fiscal and managerial autonomy by granting them ‘foundation trust’ (FT) status.
Here, hospitals’ financial stability served as the key arbiter of whether or not a hospital became a
FT. As a result, the FT program provided an additional incentive for hospitals to retain their
market share, so that their financial position was not compromised post 2005.
The second key element of the NHS reforms was an effort to give patients a formal choice over
where they received secondary care. Prior to 2002, patients had little or no choice over the
hospital that they attended for surgery, and patients were generally referred, by their GP, to their
nearest provider. Beginning in 2002, the government introduced choice pilot programs around
the country and commenced giving patients who were waiting for over a year for care (later
lowered to nine months) the ability to attend an alternative provider that had spare capacity. On

7
January 1st, 2006, the government required that all NHS patients referred for elective care be
offered a choice of four or more providers (Department of Health, 2009b). This was the first
point that the new payment system and patient choice worked in tandem to create financial
incentives for hospitals to maintain market share. We regard this as the ‘policy-on’ date where
public hospitals faced competition from other public providers.
The introduction of patient choice was accompanied by the development of a paperless hospital
referral system that allowed patients and their GPs to book hospital appointments online or over
the phone. The main online interface for the referral system allowed patients and their referring
physicians to search for nearby hospitals and included a growing amount of information on
providers’ performance and information on average waiting times at each facility.
Over time, policy-makers sought to diversify the hospital sector in England and slowly expanded
patients’ choice sets to cover a wider range of providers from both the public and private sector.
From 2006 through the first half of 2007, patients were generally only able to choose between
their local NHS providers and newly established Independent Sector Treatment Centres (ISTCs).
ISTCs were small, privately run surgical centers that focused on elective care and were
frequently co-located on the grounds of existing NHS facilities (Department of Health, 2005).
The ISTC program was run by the Department of Health and the treatment centers were located
in areas where there was a perceived shortage of supply that resulted in long waiting times
(Department of Health, 2005). By mid-2006, there were 21 ISTCs established to deliver care to
NHS patients, with an additional 10 intended to open over the next 12 months (Department of
Health, 2006). However, on balance, the ISTC program never fully materialized because of
political constraints and was responsible for less than one percent of overall NHS care (Timmins,
2007).
In financial year 2007/8, patient choice was expanded to cover the ‘Extended Care Network’
(Department of Health, 2007). This network was comprised of all the NHS ‘Foundation Trusts’
across the country, the newly developed ISTCs and a limited number of private sector providers
that were approved by the Department of Health to deliver care to NHS funded patients
8
(Department of Health, 2007).1 In financial year 2007/2008, according to NHS Information
Centre, there were 87 private hospitals sites offering care to NHS funded patients, which marked
a substantial increase in the number of providers offering care to NHS patients in England (The
NHS Information Centre, 2010). We regard this as the second ‘policy-on’ date, where
incumbent public NHS hospitals first faced competitive pressure of private sector health care
providers.
In England, the private hospitals only account for 6.5% of the total hospital beds in the country
(Boyle, 2011). Of those seeking health care in private facilities in England, over 60% pay for
their treatment using supplemental insurance and the rest have historically paid out of pocket for
care (Boyle, 2011). In 2010, approximately 12% of the population in England had private health
insurance, which they used to pay for care in private facilities (Emmerson et al., 2010). In the
long-run, the demand for private insurance in the UK has been elastic to NHS (public sector)
waiting times, and so, it is not surprising that the private hospital market has developed to offer
mainly elective care in orthopedics and general surgery (precisely the conditions we examine in
our analysis) (Emmerson et al., 2010).
In general, private hospitals are analogous to what would be regarded in the US as small
ambulatory surgical centers. Private sector hospitals in England have, on average, fewer than 50
beds and are predominantly focused on acute elective care (Laing and Buisson, 2011). Private
providers have further differentiated themselves by offering higher levels of customer service
and greater amenities alongside their clinical care (Boyle, 2011). As is the case with secondary
care in the NHS, those wishing to receive secondary care in the English private hospital sector
generally also require a referral from their GP.
Beginning in financial year 2008/9, the government extended patient choice again and
substantially expanded the number of private providers that were able to provide care to NHS
funded patients (Department of Health, 2007). From April 2008 onwards, any private provider
1 http://www.dh.gov.uk/en/Healthcare/PatientChoice/DH_085719?IdcService=GET_FILE&dID=192370&Rendition=Web is a link to the list of approved private providers registered to deliver care on the extended choice network.
9
in England that was registered with the government hospital regulator (the Care Quality
Commission2) could provide care to NHS funded patients, assuming that the public providers
were willing to be paid the NHS tariff prices that also applied to public sector hospitals. This
meant that all of the 162 private hospitals in England offering elective secondary care with
overnight beds were potentially accessible to NHS patients, at no extra charge, if the hospitals
agreed to the be paid off of standard NHS tariffs. In addition, to facilitate more referrals to the
private sectors, these hospitals were included on the NHS ‘Choose and Book’ website and could
receive paperless referrals from NHS GPs (Department of Health, 2008). Of note, unlike public
NHS hospitals, these private facilities were allowed to refuse treatment to certain patients based
on a set of exclusion criteria that were agreed to with the Department of Health’s commercial
directorate (Mason et al., 2008). Here, private facilities could refuse to offer care to patients
whom the providers viewed as having medical conditions that were ‘a constant threat to life’ or
had American Society of Anesthesiologist Scores (severity scores) of 3 or more.3
2. Literature Review, Hypothesis and the Specification of Our Empirical Model
Background
In isolation, the new payment system in England should, in and of itself, lead to substantial
reductions in patients’ length of stay. The new hospital reimbursement system in England is a
per case, prospective payment system that strongly resembles the US Medicare Prospective
Payment System (PPS) introduced in 1983 (Frank and Lave, 1985, Lave and Frank, 1990,
Manton et al., 1993). Introducing prospective, fixed hospital reimbursement should have a
negative effect on patients’ LOS because a hospital’s net revenue per patient is decreased for
each additional day of care it provides(Cutler, 1995). Consistent with the theoretical literature,
there is expansive literature from various countries that has found that the introduction of case-
2 http://www.cqc.org.uk/ 3 ASA 1: Healthy patient with localized surgical pathology and no systemic disturbance; ASA 2: Patient with mild to moderate systemic disturbance (i.e. surgical pathology or other disease process); ASA 3: Patient with severe systemic disturbance from any cause; ASA 4: Patient with life threatening systemic disorder which severely limits activity; ASA 5: Gravely ill patient with little chance of survival.

10
based, prospective payment systems has led to a reduction in LOS and overall spending. In the
US, several studies, including Feder et al. (1987), and Guterman and Dobson (1986) have found
that the introduction of PPS in the US reduced LOS by between 3% and 10%. Similarly,
Feinglass and Holloway (1991) and Kahn et al. (1990) found that PPS led to a drop in LOS of
over 10%. Such significant drops in LOS prompted fears that PPS may have also led to
concurrent drops in clinical quality. However, Cutler (1995) looked at outcomes for 67
diagnoses and found that PPS did not lead to lower clinical quality.
Looking abroad, evidence from the introduction of a new prospective hospital reimbursement in
Israel in 1990 mirrored the experience observed in the US. Looking at outcomes for five
procedures, Shmueli et al. (2002) found that the new reimbursement system was associated with
a significant reduction in LOS, but it did not lead to any statistically significant changes in
mortality. Likewise, after the Italian government introduced a DRG-based financing system in
1995, Louis et al. (1999) observed that LOS dropped, without having an adverse impact on
mortality or readmission rates.
There is also evidence on the impact of PbR in the English NHS. In a recent study, Farrar et al.
(2009) conducted a difference-in-difference analysis comparing various outcomes measures in
Scotland and England from 2002 through 2006. Unlike England, Scotland did not introduce a
prospective funding system from 2003 through 2006. As a result, the authors were able to treat
Scotland as a quasi-control and estimate the impact that PbR had on quality, volume and costs in
the English NHS. Farrar et al. (2009) found that in England, under a fixed price payment
system, LOS fell more quickly and the proportion of day cases rose relative to Scotland. Their
work suggests that PbR was successful at reducing unit costs in the NHS and driving down LOS.
Echoing Cutler’s (1995) results, Farrar found no association between PbR and changes in
mortality or readmission rates.
More broadly, there is a large body of theoretical work which suggests that shifting towards
prospective payment systems will lower overall health care spending (Robinson, 2001,
Hornbrook and Rafferty, 1982, Ellis and McGuire, 1986b, Pope, 1989). This theoretical
assertion has also been demonstrated empirically by looking at the impact of the introduction of
11
the US Medicare Prospective Payment program on Medicare spending in the 1980s (Russell and
Manning, 1989, Chulis, 1991, Davis and Rhodes, 1988). However, the shift towards prospective
payments could also create incentives for hospitals to avoid treating patients whose expected
costs would be above ex ante reimbursement rates (Hodgkin and McGuire, 1994, Hornbrook and
Rafferty, 1982, Newhouse, 1989). While there is not a great deal of evidence suggesting that
hospitals facing prospective payments have systematically avoided treating more costly patients,
there is some evidence that suggests that it has occurred (Frank and Lave, 1989, Berta et al.,
2010).
There is evidence that, with respect to clinical quality, hospitals located in less concentrated
markets behave differently than hospitals located in monopoly markets when they are exposed to
competition (Cooper et al., 2011, Gaynor et al., 2010a, Kessler and McClellan, 2000). A
growing body of research looking at the impact of fixed price competition on clinical quality in
the US and England suggests that in a market with fixed prices, competition catalyzes
improvements in clinical performance. In a widely cited study examining the impact of market
structure on quality, Kessler and McClellan (2000) looked at the impact of hospital competition
in the US on AMI mortality for Medicare beneficiaries from 1985 to 1994. The authors simulate
demand in order to create measures of competition that are not based on actual patient flows.
They find that in the 1980s, the impact of competition was ambiguous, but in the 1990s, higher
competition led to lower mortality. Using related methodology, Kessler and Geppert (2005)
found that competition was not only associated with improved outcomes in their Medicare
population, but it also led to more intensive treatment for sicker patients and less intense
treatment for healthier patients who needed less care.4
In England, recent evidence examining the impact of the introduction of patient choice on
clinical outcomes finds similar results. Cooper et al. (2011) use a modified difference-in-
difference analysis to analyze mortality from heart attacks and find that hospitals located in
4 It is important to note that there have been some studies on the impact of fixed priced hospital competition, which have not found positive results. Gowrisankaran and Town (2003) find that hospital competition for Medicare enrollees lowered quality. However, they ascribe their findings to the level at which the administered prices were set. Mukamel et al. (2001) find that hospital competition for Medicare prices has no significant effect.

12
competitive markets improved their mortality more quickly than hospitals located in less
competitive markets after patient choice and hospital competition were introduced nationally in
2006. They find that from 2006 onwards, after the introduction of patient choice and hospital
competition, mortality fell more quickly in hospitals facing greater competition. In that study,
the authors find that their results remain consistent across a number of different measures of
market structure. In similar analysis, a working paper produced by Cooper et al. (2010) find that
hospitals located in more competitive markets also reduced their LOS, with the bulk of these
changes being driven by reductions in patients’ pre-surgery LOS. More recently, separate work
by Gaynor et al. (2010) using a similar DD approach also found that competition in the NHS in
2006 was associated with reductions in hospitals’ annual length of stay and reductions in AMI
and overall hospital mortality without concurrent increases in spending.
A related strand of research has examined whether new market-entrants will create competitive
pressure that will prompt incumbent hospitals to improve their performance. Cutler et al. (2010)
looked at this issue by examining the impact of a policy change in Pennsylvania that rolled back
of the use of hospital certificates of need regulation. This had the effect of allowing more
providers to enter the market for coronary artery bypass grafting. The authors analyze this set of
reforms and find that quality improved in markets with a higher share of new market entrants
(Cutler et al., 2010). Barro et al. (2006) looked the impact that new specialty hospitals in the US
were having on the costs of care in cardiac care markets in US. Here, the authors find that
markets with new entrants had lower rates of cost growth between 1996 and 1999 (Barro et al.,
2006).
Alongside this work assessing the impact of competition on quality and spending, there has been
additional research focused on assessing whether competition in markets with prospective
payments can prompt providers to avoid treating more costly patients. Here, there are strong
theoretical evidence that hospitals paid using prospective payments and located in more
competitive markets will seek to avoid attracting more costly patients in favor of patients who
will have larger margins (Dranove, 1987, Ellis, 1998, Ellis and McGuire, 1986a, Meltzer et al.,
2002). The lone empirical work in this area is by Meltzer et al. (2002), who use discharge data
from California from 1983 to 1993 to examine the impact of competition on hospital costs for

13
low and high cost hospital patients before and after the introduction of the Medicare fee for
service payment system in the US. Here, the authors find that there were greater reductions in
spending for more costly patients in more competitive areas. They viewed this finding as
consistent with the theory that hospitals in more competitive markets under prospective payment
would seek to avoid treating more expensive patients (Meltzer et al., 2002).
Additional research has examined whether specialty hospitals (largely analogous to the private
providers in England) have tended to attract younger, healthier or wealthier patients. In addition
to assessing the impact of cardiac specialty hospitals on quality, Barro et al. (2006) also examine
whether these facilities attracted a relatively healthier patient population. They found that
following the entry of specialized providers into the market, these specialty hospitals attracted a
healthier patient case mix, leaving the population in incumbent general hospitals with a more
risky patient population (Barro et al., 2006). These findings are echoed by similar analysis which
finds that the Medicare patient population treated at ambulatory surgical centers in 1999 tended
to be healthier and less costly to treat than the population treated at larger, traditional hospital
facilities (Winter, 2003).
Hypothesis
This paper builds on this body of research and examines the impact of public and private sector
competition on incumbent public hospitals’ efficiency. In addition, we test whether the entrance
of private sector providers into markets for publicly funded patients left incumbent public
providers caring for a more costly mix of patients. More specifically, this paper tests whether
public hospitals improved their performance after they were required to compete with other
public providers from 2006 onwards and after they were required to compete with private
providers from 2007/8 onwards.
We expect the incentives for hospitals to compete during this period to be substantial. First, both
FT and not FT hospitals are heavily incentivized to generate annual surpluses. That is because
hospitals with FT status are allowed to keep their surpluses and non-FT hospitals are considered
for FT-status based on their financial performance. Second, under the new ‘payment by results’
14
system in England, hospitals could lose a substantial share of their revenues if, from 2006
onwards, these providers were not able to maintain their historical market shares. Third, all
referrals for secondary care must flow through general practitioners. As a result, GPs will
provide an agency function for multiple patients with the same diagnosis and will be in a position
to observe and be responsive to ex post hospital quality.
Existing research from the NHS suggests that the introduction of hospital competition in 2006
was associated with decreases in hospital mortality and patients’ length of stay (Cooper et al.,
2011, Cooper et al., 2010, Gaynor et al., 2010a). Consistent with this evidence, we hypothesize
that hospitals facing greater competition will take additional steps to shorten their LOS because it
will 1) allow hospitals to lower their marginal costs per patient (and generate larger surpluses)
and 2) will allow hospitals to free up additional operating room capacity which they can use to
treat additional patients to increase their revenue and maximize their market share. Consistent
with this hypothesis, written material provided by the government and made exclusively
available to public providers states that “same-day admissions are seen as an imperative by
independent [private] providers. Acute [public] trusts will need to reflect this as an integral
element of any marketing strategy when seeking to demonstrate competitive advantage’ (NHS
Institute for Innovation and Improvement, 2006).
In addition, Bloom et al. (2010) have found that hospital competition in the NHS is associated
with improvements in hospitals’ management performance. As a result, we also hypothesize that
these general improvements in management performance that stemmed from competition will
lead to leaner hospital operating room and admissions procedures, which will result in lower pre-
surgery LOS for patient receiving care in more competitive hospital markets.
However, consistent with Ellis (1998), it is also likely that incumbent public hospitals facing
more private competition will be left caring for a more costly mix of patients. That is because 1)
private providers are, in contrast to NHS providers, allowed to reject care to center paints and 2)
wealthier may be more aware of or familiar with private providers because, prior to the reforms,
these patients could have afforded to pay to get care privately in an era when these private
providers were exclusively offering care to non-NHS funded patients. Further, while all NHS
15
providers do face a theoretical incentive to avoid treating patients whose costs are likely to
exceed their reimbursement rates, these incentive might be more substantial for private, for profit
facilities who have different utility functions than NHS providers.
Nevertheless, we hypothesize that, once private competition is fully introduced from the
beginning of financial year 2007/8 onwards, private sector competition will also prompt
incumbent public providers to improve their efficiency above and beyond the gains produced
from public sector competition as public providers fight to maintain their market share. This
view is consistent with results found in Barro (2006).
Empirical Estimation Strategy
Our empirical analysis is focused on using a series difference-in-difference style estimators to
test whether patients in more competitive markets had observable changes in their LOS and
patient case mix after hospital competition in the public sector was introduced in 2006 and
private sector providers were allowed to compete with NHS from providers from 2007 onwards.
Rather than estimating off of cross-sectional changes in hospital competition, we use our
measures of hospital competition to determine which hospitals had greater potential to be
impacted by the policy change that allowed patients to select from their local public providers in
2006 and select among a wider network of private providers in 2008. Hence, our identification
strategy rests on the assumption that hospitals located in areas where there are no alternative
public or private competitors will not be impacted by the introduction of choice in 2006 and
2007. In contrast, we argue that the incentives from the two sets of reforms will be sharper in
areas where patients had a genuine choice of more than one public provider in 2006 and 1 or
more private providers in 2008.
As we described in Cooper et al. (2011), the NHS competition reforms that we are studying do
not fit neatly within the traditional difference-in-difference framework. First, every area in
England was potentially exposed, at some degree, to the NHS reforms. However, as we
discussed above, we assume that areas with more potential patient choice will be more greatly
exposed to the financial incentives created by hospital competition. Therefore, rather than using

16
a binary definition of policy exposure, we use a continuous measure of hospital competition and
assume that areas with more competition are more substantially exposed to the policy.
Second, within this policy setting, there is not a strict division between the pre-policy period and
the post-policy period. Here, it is likely that the formal introduction of patient choice on January
1 2006 took time to bed in and was likely delayed by early operational problems with the NHS
paperless referral system (Dixon et al., 2010). Likewise, while the start of financial year 2008/9
marked the most substantial expansion of the role of private sector providers into the NHS,
private sector providers, to a limited degree, were offering care to NHS patients from 2005
onwards. As a result, rather than defining strict pre and post policy periods, we examine the
interaction between our measure of treatment intensity (hospital counts) and year dummies. We
also assume that these year dummies capture any background trends in hospital LOS induced by
technological improvements in care and the national introduction o the payment by results
program. Further, as we discuss in more detail below, we use time fixed counts of hospitals in
the public and private sector to measure treatment intensity.
Therefore, our general empirical regression takes the form:
1) losijkt = pub_countk • yt`β1 + priv_countk • yt`β2 + yt`δ + xijkt`γ + θ j + θk + θp + ν ijkt
Here, ijktlos is the length of stay in the hospital of patient i, who was referred by GP k and
received care in year t at public hospital j. Potential choice and competition in the public and
private sectors is specified by counts of hospitals in the market local to the patient’s GP, where
pub_countj is a count of public sector hospitals (measured at t = 2002) and priv_countj is a
count of private sector hospitals in market j who had the potential to provide care to patient i.
Vector xijkt includes of individual patient and provider hospital characteristics. Market, hospital
and procedure unobservables (θj + θk + θp) are (optionally) treated as fixed effects in the
estimation. Other time varying unobservables are captured by the error term νijkt. In later
specifications, we also include interactions between the public and private counts, priv_countj
and pub_countj , and interact that public/private interaction with year dummies.

17
The vector yt contains 1 and year dummies from 2003-2010 (2002 being the baseline) i.e. yt = [1
y2003 y2004…y2010]. The impact of policy changes between 2002 and 2010 is estimated
through the estimates of coefficient vectors β1 and β2, which are the year specific effects of
exposure to potential competition from NHS and private providers. For example, considering the
introduction of choice within the NHS sector in 2006, we can partition the vector yt and its
corresponding coefficients β1 into pre-policy (pub_countj • y_pret`β10) and post-policy groups
(pubj • y_postt`β11 ) where:
y_pret` = [2003 … 2005] and y_postt` = [y2006 y2007 …y2010] for public sector competition
and [y2007 y2008 … y2010] for private sector competition.
The effects of the introduction of choice between NHS providers in 2006 are then estimated from
differences between β1 and β2.
We estimate (1) using Ordinary Least Squares and cluster the standard errors in our estimates at
the GP level to allow for error correlation across patients within GP markets. Also note that the
interaction terms between our counts and year dummies reflect changes in LOS off of 2002
levels.
3. Data sources and Our Measures of Hospital Market Structure
This paper relies on patient-level Hospital Episodes Statistics (HES) data from 2002 through
2010. This is a large administrative data set that records nearly every consultant episode
delivered in the English NHS.5 This dataset includes a wide range of information on patients,
providers and local area characteristics. In addition, we also use data on the private sector in
England that were obtained from Laing and Buisson, a private data holding company in the UK.6
This data include the name, location, and bed numbers for private providers and the dates that
these facilities opened. We limit our analysis to private providers who offer elective care and
are eligible to provide care to NHS-funded patients. We have used further micro data on
5 Each HES record is a consultant episode, which we then collapsed to spells (admissions). 6 http://www.laingbuisson.co.uk/

18
population levels and population density across the UK at the Middle Super Output Area level
that we obtained from the Office of National Statistics. These measures were used in the
construction of our hospital competition measures. All hospital and GP postcodes were matched
to their corresponding X and Y geographical coordinates using the UK National Postcode
Directory.
In our analysis, we focus on elective hip replacements, knee replacements, hernia repairs and
arthroscopies performed on patients age 18 and over.7 We excluded any observations missing
admissions or discharge dates and observations that were missing data on patient characteristics.
This represented less than 2% of our sample. We also exclude observations with a LOS in the
99th percentile of the distribution, so that our estimates are not biased by outlying data
observations.8 We focused on elective hip replacements, knee replacements, arthroscopies and
hernia repairs in this analysis because they collectively account for a large share of public and
private providers’ elective activity and because there was little substantive change in clinical
practice across these procedures during the period of our analysis (Hamilton and Bramley-
Harker, 1999).
Our dependent variable of interest is hospitals’ annual, average LOS for patients admitted for an
elective hip replacement, knee replacement, hernia repair or arthroscopy at an NHS acute
hospital between 2002 and 2010. LOS is measured in days from the date of a patient’s
admission to the date of their discharge. There has been significant attention within the health
economics literature focused on the use LOS as a proxy for efficiency, since cost data is
frequently not available (Fenn and Davies, 1990, Martin and Smith, 1996, Gaynor et al., 2010a).
7 We defined hip replacements as procedures with an Office of Population, Census and Surveys Classification of Surgical Operations and Procedures 4th Edition (OPCS 4) code of W37.1, W38.1 or W39.1. We defined knee replacements as procedures with an Office of Population, Census and Surveys Classification of Surgical Operations and Procedures 4th Edition (OPCS 4) code of W40.1, W42.1, or W42.1. We defined hernia repairs as procedures with an Office of Population, Census and Surveys Classification of Surgical Operations and Procedures 4th Edition (OPCS 4) code of T20.1, T20.2 or T20.3. We defined arthroscopies as procedures with an Office of Population, Census and Surveys Classification of Surgical Operations and Procedures 4th Edition (OPCS 4) code of W82 through W89. 8 Our results are robust when we include the 99th percentile of the LOS distribution, but it does increase the size of our point estimates.
19
However, we believe that a key factor in successfully using LOS as a proxy for hospital
efficiency is factoring out the influence of patient characteristics in determining how long a
patient is in the hospital. As a result, in order to get a stronger proxy for hospital efficiency, we
divided patients’ length of stay in the hospital into two components. The first component of
LOS, which we refer to as the ‘pre-surgery’ LOS, is the time from when the patient was admitted
for care until elective surgery was performed. For elective surgery, this component of LOS is
likely not highly influenced by patient characteristics and should be heavily influenced by
hospitals’ operating room and admissions policies. The second component is the ‘post-surgery’
LOS, which is time from the surgery itself until a patient’s discharge. The literature suggests
that this component of LOS should be heavily influenced by patient characteristics (Epstein et
al., 1990, Martin and Smith, 1996, Sudell et al., 1991).
Our patient level data allow us to risk-adjust for clinical severity by controlling for various
patient characteristics in our estimates. These patient characteristics include gender, age and
Charlson comorbidity score (Charlson et al., 1978). In addition, the HES database links patients’
home addresses with local area characteristics like various dimensions of the 2004 Index of
Multiple Deprivations (IMD), which are measured at the lower super output area (Department of
Communities and Local Government, 2009).
For confidentiality reasons, the patients’ home addresses are not available for use in our analysis.
However, we do have access to codes that identify the patients’ GP and GP postcode. There are
approximately 8000 GPs in each year in our data. Patients can usually (at the time relevant for
our study) only register at a GP practice if they live in a GP’s catchment area, so a patient’s GP
practice location serves as a strong proxy for a patient’s home addresses. As a result, we use the
distance between a patient’s registered GP and their local hospitals as a proxy for the distance
between a patient’s home address and their local hospitals.
Quantifying Public and Private Hospital Competition
Within the literature assessing the impact of hospital competition on provider performance, there
is significant attention focused on how to measure hospital market structure. This discussion
20
centers on two main empirical challenges. The first is using a measure of hospital competition
that is not endogenous to hospital performance (Cooper et al., 2011, Gaynor et al., 2010a,
Kessler and McClellan, 2000). Here, for example, a high performing hospital may appear to be
operating in a less competitive market because it has been able to attract market-share from its
competitors or even drive them out of the market. Likewise, poorly performing providers may
appear to be operating in more competitive markets because their lack of quality and efficiency
has encouraged other competitors to enter the market and offer better services to patients at more
reasonable prices. The second challenge, which is particularly relevant to this analysis, is using a
measure of market structure that genuinely captures differences in hospital market dynamics, but
is not simply capturing urban population density (Cooper et al., 2011). In what follows, we
discuss how we construct our measures of competition to attenuate these two concerns.
First, as we have discussed, we use hospital counts as our measure of market structure. Here, we
measured these counts for public facilities based on hospitals operating in the NHS market in
2002, prior to the introduction of the choice policies in 2006. In general, NHS hospital locations
in England are a historical artifact and have not changed substantially since the NHS was
founded in 1948 (Klein, 2006). As a result, we view the location of these NHS facilities as
exogenous to hospital performance and unaffected by the NHS reforms that were introduced in
the 2000s. Further, we use counts in the market in 2002, prior to any chances that could have
been induced by the introduction of hospital competition in 2006.
Similarly, nearly every private provider in England was founded prior to the expansion of NHS
patient choice to private providers in 2008. As a result, we also view the location of private
providers in England as exogenous to performance. Nevertheless, private providers did have a
choice about whether or not, as an organization, they offered care to NHS patients. As a result,
within our analysis, if we used the count of private providers who actually chose to deliver care
to NHS patients, there is a risk that this measure could be endogenous to local NHS performance.
Here, for example, private providers could decide to only enter the market for NHS market when
they perceived that their local NHS providers were inefficient or were offering a poor level of
service. As a result, we base our counts of private hospitals on the number of private providers

21
that were operating in the NHS during this period that could have decided to offer care to NHS
patients, as opposed to counting those that actually did offer care.
Second, we endeavor to use measures of market structure that will not be heavily correlated with
population density. Traditionally, many studies that seek to quantify hospital market structure
define hospital markets using fixed radii extended out from the market center. Here, the market
size is constant across all markets, irrespective of the local population density. As a result, these
measures will likely find that urban will be more competitive than rural areas. To break the link
between hospital competition and urban density, we use a definition of hospital market size that
is a function of the local population density within that market. As a result, we allow our radius
that defines the size of our public and private sector markets to expand in areas with low
population density and contract in urban areas.
Details on our methodology for constructing our market definitions are as follows. We begin
with a matrix of Middle Super Output Areas (MSOAs) in UK, which are predefined geographic
areas in the UK that each capture between 5000 – 7000 people. For each MSOA, we calculate
the radius that extends from its center out to the distance that would be required to bound a
circular area with a population of 333,000 adults over the age of 18, which we measure using
data from the 2001 census. We chose these population levels because 333,000 people is roughly
the catchment area for each hospital in England, based on the ratio of the current population of
adults over the age of 18 in England divided by the number of hospitals in the county. In
addition, we also calculate the radius for circular areas around each MSOA that would capture
666,000 people and 999,000 people respectively. Then, each general practice in England is
assigned a radius, based on the MSOA where it is located. As a result, for each GP in England,
we get three radii; one that defines the area around that practice that captures 333,000 adults, one
that defines the area that captures 666,000 adults and one that defines the area that captures
999,000 adults. These radii serve as our market boundaries. Within those markets, we calculate
the counts of public and private health care provider based on the number of public providers
that were offering care in 2002 and the number of private providers who could have potentially
offered care to NHS patients. There are a small number of GP markets where the various
22
population radii do not capture an NHS provider. For those markets, we extend the radius out to
a distance that captures the nearest NHS provider located outside of the market.
As a result, we end up with over 8000 separately defined markets in England that are each
centered on GP practices. We chose to center our markets on GP practices for two reasons.
First, this definition mirrors the post-2005 NHS environment, where patients choose their
secondary provider with help from their GP (Dixon et al., 2010). Second, we center our markets
on GP practices so that the level of competition associated with each patient observation is not a
function of the choices that a patient makes. Here, it is useful to contrast our strategy with one
where hospital markets are centered on hospitals. In the latter case of hospital centered markets,
if unobserved factors that influenced a patient’s choice of where to receive care were correlated
with patient demographics, then this measure would be biased (Kessler and McClellan, 2000).
Table 1 includes the correlations between our public and private measures of market structure.
Figures 1 and 2 illustrate visually why we prefer our population based market definition to
traditional fixed definitions of hospital markets used elsewhere in the literature. Figure 1 is the
count of public hospitals measured within 20km fixed radius markets, superimposed on a map of
England; Figure 2 is a count of public hospitals within a radius associated with each GP that
captures 666,000 patients. As you can see, the fixed radius market counts presented in figure 1 is
highly correlated with population density and areas with high hospital competition tend to
correspond to English city centers. In contrast, as Figure 2 illustrates, while our preferred
population-based measure of market structure does find that urban centers are more competitive,
the distribution of the counts across England is more varied and less associated with population
density.
4. Results
Our analysis included 2,039,070 patients treated at 161 public NHS hospitals who received
referrals for care from 8024 separate GP practices. During the latter 4 years of our analysis,

23
there were also 162 private facilities that could potentially offer care for NHS-funded patients.
As Table 2 illustrates, NHS hospitals are significantly larger than their private counterparts.9
From 2002 onwards the patients’ mean length of stay in public NHS facilities fell by over 30%
from 3.26 days in 2002 to 2.27 days in 2010. Interestingly, in 2002, over 36% of patients
undergoing routine elective care waited in the hospital for longer than a day, prior to their
elective surgery. This can be regarded as nearly pure inefficiency in the admissions and theatre
policies operated by individual hospitals. However, over the next eight years, that percentage
fell to just over 8% who were waiting over a day prior to their surgery in 2010, which amounts to
a decrease in pre-surgery LOS of 78.3% during the period from 2002 through 2010.
In large part, these reductions in LOS were seemingly not driven by competition alone. Instead,
they were also likely the result of the shift to the new NHS payment by results prospective
payment system. However, in what follows, we present evidence assessing whether patients
located in more competitive hospital markets had lower LOS from 2006 onwards that were
driven by public and private sector competition and were above and beyond the reductions
driven by the payment changes.
Table 4 presents estimates of (1) on overall LOS, where the counts of public and private
hospitals are measured within a market defined by a radius that captures 333,000 people in the
area surrounding the GPs’ practices based on 2002 hospital market structure. From 2006
onwards, just as patients were given the ability to select their NHS providers, higher counts of
public hospitals were associated with steady and consistent reductions in LOS. From 2006
through 2010, each addition of another NHS hospital was associated with a 0.17-day reduction in
LOS, which corresponds to a relative reduction of LOS of 5.5% off of 2002 through 2005 levels.
We have performed an F-Test to test the equivalence of the 2005 * Public Count interaction with
the 2010 * Public Count interaction. This test of equivalence be rejected at p < 0.0001.
In contrast, from 2007 onwards, higher counts of private hospitals were associated with higher
waits in the incumbent public facilities. Here, higher private counts only led to increases in LOS
9 Descriptive statistics for our key variables are included in Appendix 1

24
during the 2007 through 2010 period, when NHS patients could choose to receive care in private
facilities. Table 4 illustrates that both our public sector and private sector competition findings
are robust to the inclusion and exclusion of GP and hospital fixed effects and patient
characteristics. Likewise, we have also performed an F-Test to test the equivalence of the
2006*Private Count interaction with the 2010 * Private Count interaction. This test can also be
rejected at p < 0.0001
Table 5 presents estimates of (1) on overall LOS, where the counts of public and private
hospitals are measured within a market defined by a radius that captures 666,000 people in the
area surrounding GPs’ practices. Here, there is a similar pattern to Table 2. From 2006
onwards, following the introduction of patient choice of public providers, a higher count of
public facilities is associated with a reduction in overall LOS off of 2002-2005 pre-reform levels.
Here, the addition of one hospital during the 2006 through 2010 period was associated with a
reduction in LOS of 0.088 days, corresponding to a relative reduction of 2.9 percent off of 2002-
2005 levels Likewise, consistent with Table 4, in this specification, higher counts of private
providers from 2007 onwards was associated with a small but significant increase in the LOS of
patients receiving care at public facilities. Again, all of our main results are robust to the
inclusion and exclusion of GP and hospital fixed effects and patient characteristics. As with
previous results, F-Tests confirm that the neither the 2005 * Public Count interaction and the
2010 * Public Count interaction nor are the 2006*Private Count interaction and the 2010 *
Private Count interaction are equivalent at p < 0.0001.
Table 6 presents estimates of (1) on overall LOS, where the counts of public and private
hospitals are measured within a market defined by a radius that captures 999,000 people in the
area surrounding GPs’ practices. The results within this specification again echo the results
presented in Tables 4 and 5. Higher counts of public hospitals were associated with reductions
in LOS during the period that NHS patients were extended choice of public facilities and higher
counts of private hospitals were associated with increases in LOS during the period where
patients could opt to attend a private provider. The various specifications in Table 6 also pass
our various F-Tests to reject the equivalence of the interactions before and after the public sector
and private sector reforms.

25
Taken as a whole, Tables 4, 5, and 6 suggest that the hospital competition within the public
sector that took force from 2006 onwards was associated with reductions in patients’ LOS and
was robust across all three measures of competition. Here, the impact of public competition on
LOS is modest but significant. Across the three measures, a one-hospital increase in the hospital
counts was associated with a relative reduction in LOS of between 2% and 5.5% from 2006
through 2010 off of 2002-2005 levels. In contrast, higher competition from the private sector,
introduced from 2007 onwards was associated with a small but significant increase in LOS in
public facilities. All of these findings are robust to the inclusion and exclusion of GP and
hospital fixed effects and patient characteristics. This latter finding on the impact of private
sector competition is consistent with the concerns that private sector providers had the potential
to leave public providers treating a more costly mix of patients. Later in this paper, we explore
more direct evidence on whether or not the entrance of private sector providers left incumbent
public hospitals treating a more costly mix of patients.
Table 7 presents separate estimates of (1) on pre-surgery and post-surgery LOS using our three
separate measures of market structure Recall that we view pre-surgery LOS as a purer measure
of hospital efficiency, since it is likely less impacted by patient characteristics. Here, across all
three measures of competition, higher public hospital competition is associated with reductions
in pre-surgery LOS during the period where NHS patients could choose their public sector
provider. These changes become statistically significant from 2006 onwards. Of note, the
relative reduction in pre-surgery LOS produced by a one hospital increase in public sector counts
ranged from 4.2 to 9.0% off of 2002-2005 levels. This effect is substantially larger than the
relative reduction in post-surgery LOS produced by the addition of an extra-hospital, which
ranged from 1.7 to 5%. This suggests that competition between NHS providers, introduced from
2006 onwards did indeed lead to productive efficiency gains in public sector hospitals. F-tests
on each specification in Table 7 allow us to reject the equivalence between the 2005 * Public
counts and the 2010 * public counts.
In contrast, private sector competition, introduced from 2007 onwards was again associated with
small but statistically significant increases in post-surgery LOS. Importantly, while private
26
sector market entry was associated with increases in post-surgery LOS, it did not have a
statistically significant effect on public hospitals’ pre-surgery LOS off of 2002-2005 levels.
Here, if the entrance of private sector providers was associated with increases in pre-surgery
LOS, this would suggest that their entrance into the market actually made the productivity of
public providers worse. However, the fact that their entrance is only associated with increases
post-surgery LOS is consistent with the hypothesis that, from 2007 onwards, the entrance of new
private providers left incumbent NHS facilities treating a less healthy and potentially more costly
patient population. Here, as with the previous specifications, F-tests on each specification in
Table 7 allow us to reject the equivalence between the 2006 * private counts and the 2010 *
private counts for post-surgery LOS. We cannot reject the equivalence for pre-surgery LOS
Figures 3, 4 and 5 present the changes in pre-surgery and overall LOS driven using the point
estimates from the specifications presented in Tables 5 and 7. The dashed line in Figures 3 and 4
shows the trend in LOS for public providers located in monopoly public sector markets and the
solid line shows the impact of having two public competitors in the same market as the
incumbent public hospital where the patient received care. These figures illustrate that prior to
the reforms, there was little difference in the trends in pre-surgery and overall LOS between
competitive and monopoly markets. However, from 2006 onwards, hospitals facing greater
competition appear to have taken steps to improve their productivity, which led to reductions in
pre-surgery and overall LOS. These changes correspond precisely with the time of the market-
based policy-changes introduced in the NHS. In contrast, the introduction of private sector
competition appears to have the opposite effect. In Figure 5, the dashed line represents the
trends in overall LOS for a hospital operating in a market without private competition and the
solid line illustrates the trends in overall LOS for hospitals located in markets with 2 private
providers. Here, from 2007 onwards, incumbent public hospitals facing more private
competition actually had an increase in their overall LOS that expanded in 2008, 2009 and 2010.
This increase in LOS induced by private sector competition also corresponds precisely with time
that private providers were allowed to compete with NHS hospitals. Taken as a whole, Figures
3, 4, and 5 illustrate visually that are main results are not the product of pre-reform trends and
were associated with the policy reforms introduced in England.

27
Table 8 presents estimates of (1) on overall LOS, where, in addition to the interactions between
public and private counts and dummies that we have discussed above, we have also included
additional interactions between public and private counts and further included the interaction of
these interactions with year dummies. This specification serves as a robustness check on the
results that have presented in Tables 4-7 and confirms that our results are not highly sensitive to
our underlying specification. Table 8b presents the sums of the interactions between our public *
private counts with the separate interactions between the year dummies and public and private
counts. Again, across all three measures of competition, from 2006 onwards, higher public
sector competition was associated with statistically decreases in LOS. In contrast, from 2007
onwards, the entry of new private sector entrants was associated with year on year increases in
public sector hospitals’ LOS.
Evidence of Private Sector Competition Altering the Case Mix of Patients Receiving Care at
Public Facilities
Tables 9 – 11 present tests of whether or not public sector providers in more competitive areas
were cherry picking healthier patients for care or whether the case mix in incumbent public
hospitals facing more substantial private competition changed over time. In table 9, we present
estimates of (1) on the age of patients at public facilities. Interestingly, the age of patients in
hospitals treating patients from more competitive public sector markets actually increased over
time, suggesting that they were able to make the productivity gains observable in Tables 4 – 8
despite an older patient population. In contrast, results from Table 9a and 9b suggest that the
case mix of patients in hospitals drawing patients from markets with more private competition
tended to have an older patient population as well. This is also consistent with our previous
results and suggests that the entrance of these private facilities into public sector markets were
leaving incumbent hospitals with an older patient population.
Tables 10a and 10b presents estimates of (1) on the socio-economic status of patients treated in
public facilities. Here, patients’ socio-economic status is measured using the income vector of
the 2004 Index of Multiple Deprivations. Again, consistent with results presented in Tables 9a
and 9b, hospitals treating patients from more competitive public markets tended to draw less

28
wealthy patients over time. In contrast, it would appear the case mix at NHS hospitals drawing
patients from more competitive private markets tended to get less wealthy over time as well. This
result also is consistent the previous evidence that the entrance of private providers from 2007
onwards left NHS providers treating a more challenging mix of patients.
Table 11 presents a similar test of the cream-skimming hypothesis where we estimate (1) on the
severity of illness of NHS funded patients treated at public facilities. Here, while the case mix of
patients at public hospitals facing more competition does get sicker over time, there is no
evidence that the entrance of the private sector, from 2007 onwards altered the severity of illness
of patients treated at nearby public facilities.
Further Tests of Robustness
Because we are using patient-level data with GP-level competition measures, it is possible for
two patients receiving care at the same facility, but referred from different GPs, to each have
separate levels of competition associated with their observations. This could potentially raise
fears that rather than estimating the impact of NHS and private market structure on efficiency,
we are instead spuriously examining the impact of population density. To allay these fears,
Table 12 presents estimates of (1) on LOS and the characteristics patients in public facilities.
However, in this specification, we substitute the population density in the area around GPs
practices for our measures of public and private counts. Here, while some of the interactions
between population density and our year dummies are statistically significant, the magnitude of
the coefficients on the interactions are substantially smaller than they are when we use our
measures of public and private hospital market structure. These results confirm that our main
findings are in fact being driven by variations in public and private hospital market structure,
rather than spurious correlations with population density.
Magnitude of the effects
In England, each additional bed day in the hospital has an estimated cost of £225.00 pounds
(NHS Institute for Innovation and Improvement, 2006). As a result, to give a sense of the scale

29
of the magnitude of the reforms, we have used these cost estimates to calculate the potential
hospital days gained and money saved from the reductions in pre-surgery, overall and post-
surgery LOS that were driven by the reforms. Likewise, we have also calculated the average
economic burden that the entrance of private sector competition placed on incumbent public
NHS providers, which were left treating a more costly mix of patients.
The hypothetical savings from the reduction in overall LOS driven by the reforms can be
calculated as the product of our year * public count interactions (differenced from the previous
year) and the mean hospital counts in 2006, 2007, 2008, 2009, and 2010 (for all our estimates,
we used counts measured in our 666,000-person radius market definitions). These potential
savings are calculated under on the assumption that, were the reforms not to have been
introduced, the trend in LOS would have followed the trend for providers located in monopoly
markets, which we captured in our year dummies. Based on these calculations, the introduction
of competition shortened overall LOS and produced a decrease in total hospital days across our
four procedures of 222,393 days. Since each hospital day costs £225.00, this produced a savings
for the NHS of £13,320,042 from 2006 through 2010. If we assumed that the benefits we saw
for hip replacements, knee replacements, hernia repairs and arthroscopies were consistent across
all elective surgical care in England, then the introduction of public sector competition was
associated with savings of £356,162,167 from 2006 through 2010, based on the total number of
inpatient elective procedures performed during this period. For reference, the NHS has an
annual budget of roughly £100 billion, so these savings are approximately a third of percent of
total NHS spending.
Previously, we argued that pre-surgery LOS was a purer measure of efficiency than overall LOS,
and captured the lean productivity of the admissions and operating room theatre policies at NHS
hospitals. As a result, using a similar strategy as we did for overall LOS, we have calculated the
hospital time that was gained and the money that was saved from these reforms. Based on our
estimates presented in Table 7, we have estimated that the increase in competition led to savings
of £3,161,999 from 2006 through 2010 and a reduction of 14,053 pre-surgical bed days. Across
the NHS, the savings from the reduction in pre-surgery LOS alone would have led to a 41,000-
day reduction in hospital bed use and saved £40.3 million pounds from 2006 through 2010. Bear
30
in mind that this savings is from reductions in bed days alone and that this reduction of pre-
surgery LOS would also have freed up operating room time and allowed hospitals to treat more
patients. Elsewhere, the NHS Institute for Innovation and Improvement estimated that if NHS
hospitals could make their operating room and admissions policies more productive, they could
each generate an additional £7 in annual revenue from expanding their activity (The NHS
Institute for Innovation and Improvement, 2009). Further, the cost savings that we have
produced are base on reductions in pre-surgery LOS alone, where the addition of one hospital
was associated with approximately a 7% improvement in productive efficiency from 2006
through 2010. Here, if we assumed that the improvements in operating room policies that were
driven by the reforms were consistent with overall improvements in hospital efficiency, then the
cumulative effect of hospital competition on health care spending in England would be much
more substantial.
In contrast, we have also calculated the financial impact that the entrance of private sector
providers had on incumbent NHS hospitals, which were left delivering care to an older and less
wealthy patient population in 2007, 2008, 2009 and 2010. Using a similar strategy, for 2007,
2008, 2009 and 2010, we can multiply our year * private count interactions by the average
number of private hospitals in each market to get the increase in post-operative bed days in
incumbent NHS hospitals that resulted from the entrance of private providers. Here, from 2007
through 2010, we have estimated that the entrance of private sector hospitals led to an increase in
spending for each NHS hospital of approximately £27,000 during this period. While this is not a
substantial sum, if we again assume that the effect we observed for these four procedures was
constant across all four hospitals, then the entrance of private providers would have led to an
increase in sending of £714,000 for each incumbent public provider during this period. To give a
sense of the scale of this effect on a typical NHS hospital, the 2009/10 annual financial report
from the Royal Free Hospital in Hampstead (a non-academic, non-FT hospital located just
outside of Central London) reports that the hospital had an annual revenue of £501,954,000 with
an annual income of £18,497,000 (Royal Free Hospital Hampstead, 2010).
5. Discussion and Concluding Thoughts

31
Over the last decade, policy-makers in England have introduced a series of reforms to the NHS
that were designed to use patient choice and provider competition in an effort to create financial
incentives for public sector health care providers to improve their performance. These efforts are
consistent with the increasing use of market-based reforms in public services, like health care
and education, across the developed world.
Thus far, evidence suggests that the impact of this set of reforms in the English NHS has been
positive. Several studies have found that, consistent with theory, the introduction of fixed price
hospital competition has lowered hospital mortality rates and shortened hospitals’ mean length of
stay (Cooper et al., 2011, Cooper et al., 2010, Gaynor et al., 2010a). However, there is scant
evidence on the impact of these reforms on providers’ productivity and little evidence on the
impact that private providers have had on the performance of incumbent public hospitals.
Likewise, outside of England, the evidence of the impact of competition on providers’ efficiency
remains murky and there is little firm evidence on whether or not competition induces hospitals
to avoid treating potentially more costly patients (Ellis, 1998, Meltzer et al., 2002).
This paper seeks to fill this evidence gap. In this study, we utilize patient-level data from the
English NHS to not only examine the impact of public and private sector performance on public
hospitals’ efficiency, but to also examine whether the combination of the new prospective
payment system together with public and private sector competition led providers in England to
avoid treating patients who might have higher than average costs.
From an empiricists’ perspective, the recent policy reforms in the English NHS provide an ideal
environment to test the impact of public sector and private sector competition on incumbent
hospitals’ performance. First, unlike the case of hospitals in the US, the location of public and
private hospitals in England is an historical artifact. As a result, this allows us to develop
measures of market structure that are unrelated to performance. Second, recent reforms in the
NHS have been introduced universally across the country. This allows us to avoid concerns that
the policies we are studying were endogenous to regional pre-reform trends in hospital
performance. Third, the phased introduction of the reforms in England (i.e. public competition
32
in 2006; private competition in 2007/8) means that we can identify separately the effect of public
sector versus private sector competition on incumbent NHS hospitals.
The results from our analysis suggest that competition between public sector hospitals from 2006
onwards led to moderate but statistically significant reductions in pre-surgery LOS. These
changes led to a relative reduction in pre-surgery LOS of between 4% and 9%., which is
approximately double the size of the impact of competition had on post surgery LOS. Our
estimates were robust across a number of specifications and measures of competition.
Interestingly, as public competition in the NHS took force, NHS hospitals facing more
competition also tended to treat patient populations, which grew sicker, older and less wealthy
over our period of analysis. This is likely related to the fact that these hospitals facing higher
amounts of competition have higher quality (Cooper et al., 2011, Gaynor et al., 2010a). Here,
Gaynor et al. recently found that that following the introduction of choice in the NHS in 2006,
less wealthy and sicker patients became more elastic to providers’ quality relative to the average
NHS patient (Gaynor et al., 2011).
While the impact of competition between public sector firms led to clear productivity gains, the
policy of opening up NHS markets to private sector competition did not. Incumbent NHS
providers located in more competitive hospital markets actually saw their LOS increase after
competition with the private sector took force from 2007 onwards. Interestingly, while private
sector competition did lead to a significant increase in incumbent public hospitals’ post-surgery
LOS, private sector competition had no statistically significant effect on pre-surgery LOS. This
result suggests then that private sector market entrants may have attracted a healthier patient
population and left incumbent public hospitals with a patient case mix that is more costly to treat.
Consistent with this assertion, further evidence from our work suggests that incumbent hospitals
in more competitive private markets saw the average age and proportion of poorer patients in
their case mix increase after competition took force in 2007.
It is unclear from our analysis whether or not private sector providers actively avoided treating
less costly patients or whether these results stem from healthier and younger patients choosing to
receive care in the private sector. Nevertheless, our results do suggest that more attention needs

33
to be paid in England to suitably risk-adjusting payments for both public and private sector
providers. Elsewhere, Barro et al. (2006) found that while privately owned specialty hospitals
tended to draw healthier patients away from incumbent general hospitals, the entrance of these
facilities still led to a net reduction in overall spending in these markets. Seemingly this was
because the entrance of these new providers induced broader productivity gains that led to
market-wide improvements in efficiency that swamped any losses from cream skimming. This
certainly could still be the case in the NHS, but given that we failed to see that private sector
competition led to reductions in pre-surgery LOS for incumbent public hospitals, this assertion
has no empirical justification.
The conclusion then is twofold. First, it is clear from our findings that hospital competition can
lead to improvements in public providers’ productivity. Here, if we assume that the impact of
competition on LOS captured overall improvements in hospital efficiency, than these effects
would have produced non-trivial savings. However, we also find that the underlying market
dynamics and the specifics of the hospital payment program in place can greatly affect the
impact of competition. While we did find that competition improved providers’ productivity, we
also found that that there is a real risk that hospital competition between public and private
providers and between general hospitals and ambulatory surgical centers can lead to risk
segmentation, with large incumbent hospitals at risk of inheriting a riskier patient case mix that
are likely more costly to treat. This suggests that in order to maximize the welfare gains from
these types of market-based reforms, policy-makers must investigate and introduce more
sophisticated risk-adjustment of hospital payments.

34
References BARRO, J. R., HUCKMAN, R. S. & KESSLER, D. P. (2006) The effects of cardiac specialty
hospitals on the cost and quality of medical care. J Health Econ, 25, 702-21.
BERTA, P., CALLEA, G., MARTINI, G. & VITTADINI, G. (2010) The effects of upcoding, cream-skimming and readmissions on Italian hospitals' efficiency: a population-based investigation. Economic Modeling, 27, 812-821.
BOYLE, S. (2011) Health System Review - United Kingdom (England). Health Systems in Transition. London, European Observatory on Health Systems and Policies.
CHALKLEY, M. & MALCOMSON, J. (1998) Contracting For Health Services with Unmonitored Quality. The Economics Journal, 108, 1093-1110.
CHARLSON, M., POMPEI, P., ALES, K. & MACKENZIE, C. (1978) A new Method of Classifying Prognostic Comorbidity in Longitudinal Studies: Development and Validation. Journal of Chronic Disease, 40, 373-383.
CHULIS, G. S. (1991) Assessing Medicare's prospective payment system for hospitals. Med Care Rev, 48, 167-206.
COOPER, Z., GIBBONS, S., JONES, S. & MCGUIRE, A. (2011) Does Hospital Competition Save Lives: Evidence from the English NHS Patient Choice Reforms. Economic Journal, 121, 228 - 260.
COOPER, Z. N., GIBBONS, S., JONES, S. & MCGUIRE, A. (2010) Does Hospital Competition Save Lives? Evidence From the NHS Patient Choice Reforms. LSE Health Working Paper - 16. London, London School of Economics.
CUTLER, D. M. (1995) The Incidence of Adverse Medical Outcomes under Prospective Payment. Econometrica, 63, 29-50.
CUTLER, D. M., HUCKMAN, R. S. & KOLSTAD, J. T. (2010) Input Constraints and the Efficiency of Entry: Lessons from Cardiac Surgery. American Economic Journal: Economic Policy, 2, 51-76.
DAVIS, C. & RHODES, D. J. (1988) The impact of DRGs on the cost and quality of health care in the United States. Health Policy, 9, 117-31.
DEPARTMENT OF COMMUNITIES AND LOCAL GOVERNMENT (2009) Indices of Deprivation 2007. http://www.communities.gov.uk/communities/neighbourhoodrenewal/deprivation/deprivation07/ (accessed on January 25, 2009).
DEPARTMENT OF HEALTH (2002) Delivering the NHS Plan - Next Steps on Investment, Next Steps on Reform. London, Department of Health.
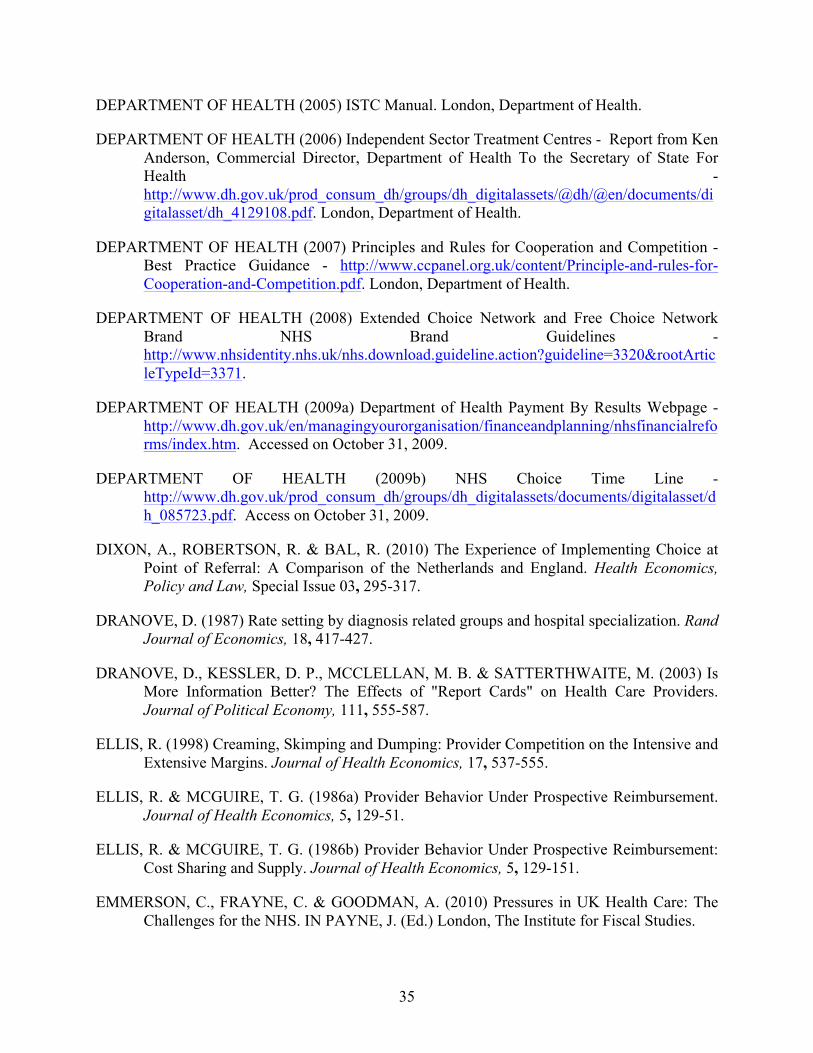
35
DEPARTMENT OF HEALTH (2005) ISTC Manual. London, Department of Health.
DEPARTMENT OF HEALTH (2006) Independent Sector Treatment Centres - Report from Ken Anderson, Commercial Director, Department of Health To the Secretary of State For Health - http://www.dh.gov.uk/prod_consum_dh/groups/dh_digitalassets/@dh/@en/documents/digitalasset/dh_4129108.pdf. London, Department of Health.
DEPARTMENT OF HEALTH (2007) Principles and Rules for Cooperation and Competition - Best Practice Guidance - http://www.ccpanel.org.uk/content/Principle-and-rules-for-Cooperation-and-Competition.pdf. London, Department of Health.
DEPARTMENT OF HEALTH (2008) Extended Choice Network and Free Choice Network Brand NHS Brand Guidelines - http://www.nhsidentity.nhs.uk/nhs.download.guideline.action?guideline=3320&rootArticleTypeId=3371.
DEPARTMENT OF HEALTH (2009a) Department of Health Payment By Results Webpage - http://www.dh.gov.uk/en/managingyourorganisation/financeandplanning/nhsfinancialreforms/index.htm. Accessed on October 31, 2009.
DEPARTMENT OF HEALTH (2009b) NHS Choice Time Line - http://www.dh.gov.uk/prod_consum_dh/groups/dh_digitalassets/documents/digitalasset/dh_085723.pdf. Access on October 31, 2009.
DIXON, A., ROBERTSON, R. & BAL, R. (2010) The Experience of Implementing Choice at Point of Referral: A Comparison of the Netherlands and England. Health Economics, Policy and Law, Special Issue 03, 295-317.
DRANOVE, D. (1987) Rate setting by diagnosis related groups and hospital specialization. Rand Journal of Economics, 18, 417-427.
DRANOVE, D., KESSLER, D. P., MCCLELLAN, M. B. & SATTERTHWAITE, M. (2003) Is More Information Better? The Effects of "Report Cards" on Health Care Providers. Journal of Political Economy, 111, 555-587.
ELLIS, R. (1998) Creaming, Skimping and Dumping: Provider Competition on the Intensive and Extensive Margins. Journal of Health Economics, 17, 537-555.
ELLIS, R. & MCGUIRE, T. G. (1986a) Provider Behavior Under Prospective Reimbursement. Journal of Health Economics, 5, 129-51.
ELLIS, R. & MCGUIRE, T. G. (1986b) Provider Behavior Under Prospective Reimbursement: Cost Sharing and Supply. Journal of Health Economics, 5, 129-151.
EMMERSON, C., FRAYNE, C. & GOODMAN, A. (2010) Pressures in UK Health Care: The Challenges for the NHS. IN PAYNE, J. (Ed.) London, The Institute for Fiscal Studies.
36
EPSTEIN, A. M., STERN, R. S. & WEISSMAN, J. S. (1990) Do the poor cost more? A multi-hospital study of patients' socioeconomic status and use of hospital resources. N Engl J Med, 322, 1122-8.
FENN, P. & DAVIES, P. (1990) Variations in length of stay. A conditional likelihood approach. J Health Econ, 9, 223-34.
FRANK, R. G. & LAVE, J. R. (1985) The impact of Medicaid benefit design on length of hospital stay and patient transfers. Hosp Community Psychiatry, 36, 749-53.
FRANK, R. G. & LAVE, J. R. (1989) A comparison of hospital responses to reimbursement policies for Medicaid psychiatric patients. Rand Journal of Economics, 24, 588-600.
GAYNOR, M., MORENO-SERRA, R. & PROPPER, C. (2010a) Death by Market Power: Reform, Competition and Patient Outcomes in the National Health Services. CMPO Working Papers. Bristol, Bristol University.
GAYNOR, M., PROPPER, C. & SEILER, S. (2010b) The Effect of Patient Choice: Evidence from Recent NHS Reforms. CEP Conference Paper - 2/25/2010 - accessible at http://cep.lse.ac.uk/conference_papers/10-05-2010/seiler.pdf (access October 10, 2010).
GAYNOR, M., PROPPER, C. & SEILER, S. (2011) Free to Choose: Reform and Demand Response in the British National Health Service. Unpublished manuscript. Carnegie Mellon University, Imperial College London and the London School of Economics.
GAYNOR, M. & TOWN, R. J. (2011) Competition in Health Care Markets. IN MCGUIRE, T. G., PAULY, M. V. & BAROS, P. P. (Eds.) Handbook of Health Economics. New York, North Holland.
HAMILTON, B. H. & BRAMLEY-HARKER, R. E. (1999) The Impact of The NHS Reforms on Queues and Surgical Outcomes in England: Evidence From Hip Fracture Patients. The Economic Journal, 109, 437-462.
HODGKIN, D. & MCGUIRE, T. G. (1994) Payment Levels and Hospital Response to Prospective Payment. Journal of Health Economics, 13, 1-29.
HORNBROOK, M. & RAFFERTY, J. (1982) The Economics of Hospital Reimbursement. Advances in Health Economics and Health Services Research, 3, 79-115.
KESSLER, D. P. & MCCLELLAN, M. B. (2000) Is Hospital Competition Socially Wasteful? . The Quarterly Journal of Economics, 115, 577-615.
KLEIN, R. (2006) The new politics of the NHS : from creation to reinvention, Oxford ; Seattle, Radcliffe.
LAING AND BUISSON (2011) Private Hospital Market Report and Data (Obtained directly from Laing and Buisson). London, Laing and Buisson.

37
LAVE, J. R. & FRANK, R. G. (1990) Effect of the structure of hospital payment on length of stay. Health Serv Res, 25, 327-47.
LE GRAND, J. (2007) The Other Invisible Hand: Delivering Public Services Through Choice and Competition, New York, Princeton University Press.
MANTON, K. G., WOODBURY, M. A., VERTREES, J. C. & STALLARD, E. (1993) Use of Medicare services before and after introduction of the prospective payment system. Health Serv Res, 28, 269-92.
MARTIN, S. & SMITH, P. (1996) Explaining variations in inpatient length of stay in the National Health Service. J Health Econ, 15, 279-304.
MASON, A., MIRALDO, M., SICILIANI, L., SIVEY, P. & STREET, A. (2008) Establishing a Fair Playing Field for Payment by Results. York, Centre for Health Economics, University of York.
MELTZER, D., CHUNG, J. & BASU, A. (2002) Does Competition Under Medicare Prospective Payment Selectively Reduce Expenditures on High-Cost Patients? Rand Journal of Economics, 33, 447-468.
NEWHOUSE, J. P. (1989) Do Unprofitable Patients Face Access Problems. Health Care Finance Review, 11.
NHS INSTITUTE FOR INNOVATION AND IMPROVEMENT (2006) Delivering Quality and Value: Focus on Primary Hip and Knee Replacement. The Productivity Series. Nottingham, NHS Institute for Innovation and Improvement.
NHS INSTITUTE FOR INNOVATION AND IMPROVEMENT (2008) Quality and Service Improvement Tools: Lean - Seven Wastes. The Productivity Series. Nottingham, NHS Institute for Innovation and Improvement.
POPE, G. C. (1989) Hospital non-price competition and Medicare Reimbursement Policy. Journal of Health Economics, 8, 147-172.
ROBINSON, J. C. (2001) Theory and Practice in the Design of Physician Payment Incentives. Milbank Quarterly, 79, 149 - 178.
ROYAL FREE HOSPITAL HAMPSTEAD (2010) Annual Report and Accounts 2009/2010 - http://www.royalfree.nhs.uk/pdf/Annual-report-and-annual-accounts-0910.pdf. London, Royal Free Hospital.
RUSSELL, L. B. & MANNING, C. L. (1989) The effect of prospective payment on Medicare expenditures. N Engl J Med, 320, 439-44.
SUDELL, A. J., HORNER, J. S., JOLLY, U. & PAIN, C. H. (1991) Length of stay in general medical beds; implications for the NHS White Paper of variance within one performance indicator. J Public Health Med, 13, 88-95.
38
THE NHS INFORMATION CENTRE (2010) The Role of the Independent Sector in NHS Funded Care - http://www.ic.nhs.uk/services/independent-sector-information-programme/news/the-role-of-the-independent-sector-in-nhs-funded-care (access Sept 21, 2011).
THE NHS INSTITUTE FOR INNOVATION AND IMPROVEMENT (2009) The Productive Operating Theatre: Improving Quality and Efficiency in the Operating Theatre - A Lifeline for Financial Leaders - http://www.institute.nhs.uk/images//documents/Quality_and_value/Productive%20Operating%20Theatre/Finance%20leaflet.pdf. Coventry, The NHS Institute for Innovation and Improvement.
TIMMINS, N. (2007) Private Treatment Centre Scheme Cancelled. Financial Times. London.
WINTER, A. (2003) Comparing the mix of patients in various outpatient surgery settings. Health Aff (Millwood), 22, 68-75.
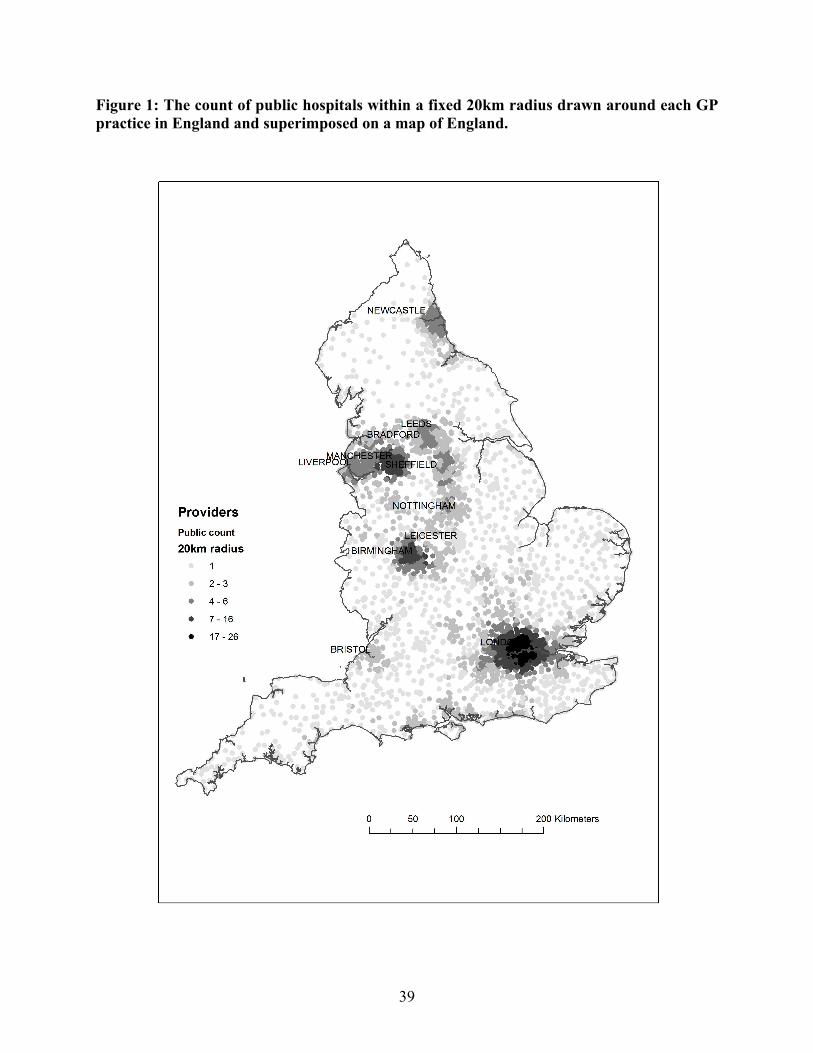
39
Figure 1: The count of public hospitals within a fixed 20km radius drawn around each GP practice in England and superimposed on a map of England.

40
Figure 2: The count of public hospitals within a radius based on the distance necessary to capture 666,000 adults drawn around each practice in England and superimposed on a map of England
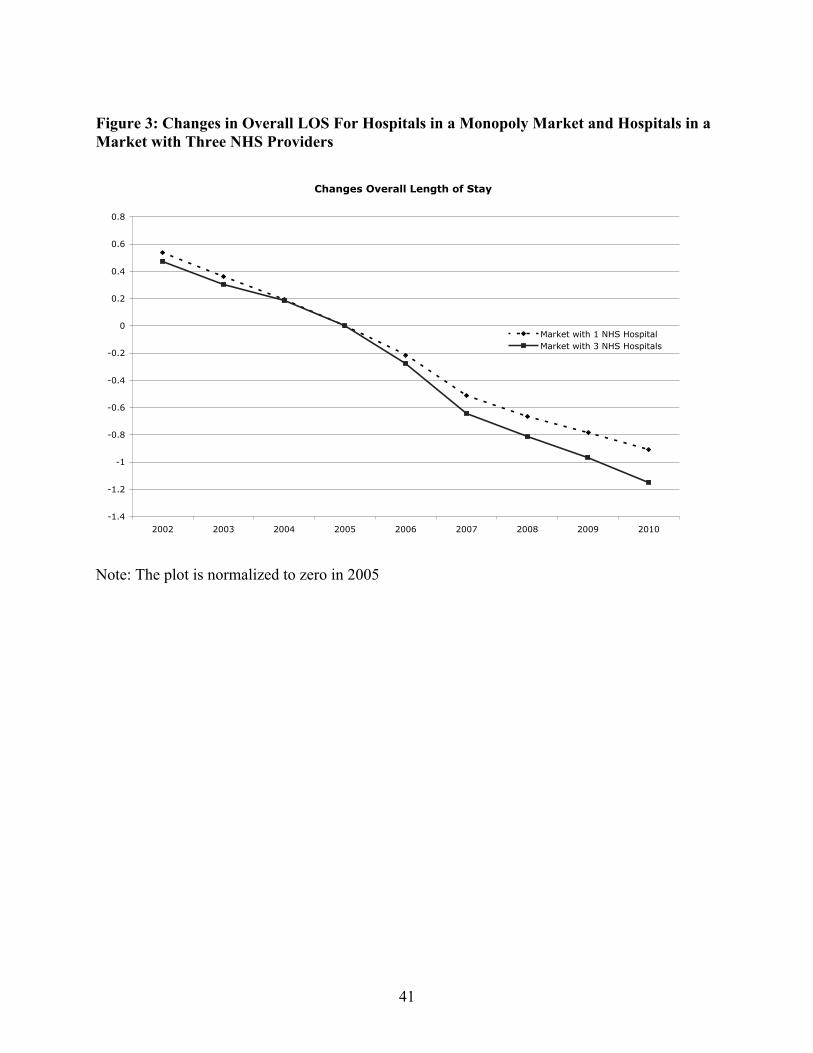
41
Figure 3: Changes in Overall LOS For Hospitals in a Monopoly Market and Hospitals in a Market with Three NHS Providers
Note: The plot is normalized to zero in 2005
Changes Overall Length of Stay
-1.4
-1.2
-1
-0.8
-0.6
-0.4
-0.2
0
0.2
0.4
0.6
0.8
2002 2003 2004 2005 2006 2007 2008 2009 2010
Market with 1 NHS Hospital
Market with 3 NHS Hospitals
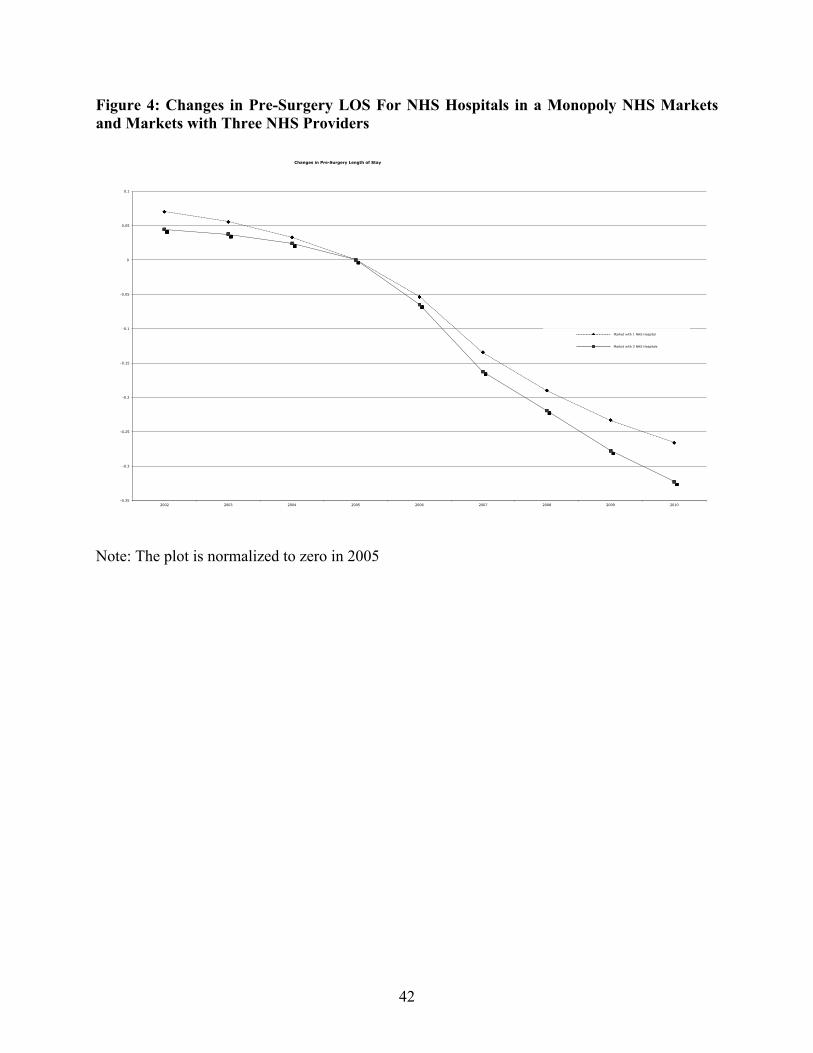
42
Figure 4: Changes in Pre-Surgery LOS For NHS Hospitals in a Monopoly NHS Markets and Markets with Three NHS Providers
Note: The plot is normalized to zero in 2005
-0.35
-0.3
-0.25
-0.2
-0.15
-0.1
-0.05
0
0.05
0.1
2002 2003 2004 2005 2006 2007 2008 2009 2010
Changes in Pre-Surgery Length of Stay
Market with 1 NHS Hospital
Market with 3 NHS Hospitals
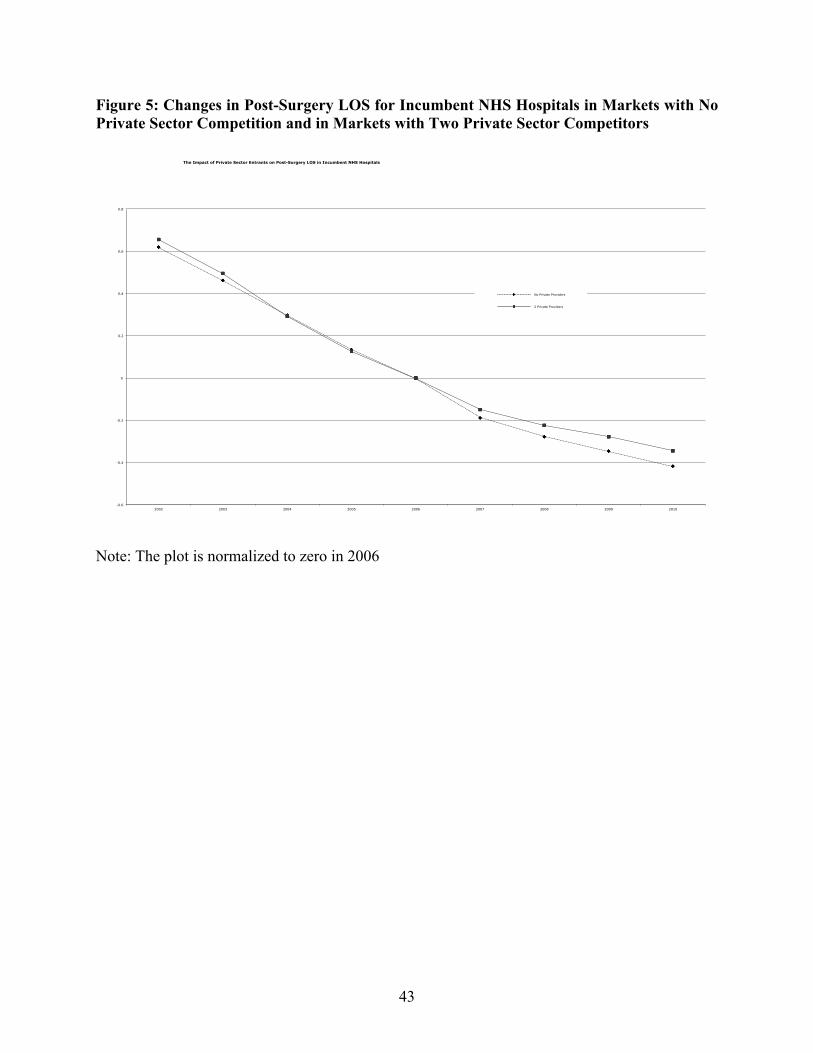
43
Figure 5: Changes in Post-Surgery LOS for Incumbent NHS Hospitals in Markets with No Private Sector Competition and in Markets with Two Private Sector Competitors
Note: The plot is normalized to zero in 2006
-0.6
-0.4
-0.2
0
0.2
0.4
0.6
0.8
2002 2003 2004 2005 2006 2007 2008 2009 2010
The Impact of Private Sector Entrants on Post-Surgery LOS in Incumbent NHS Hospitals
No Private Providers
2 Private Providers
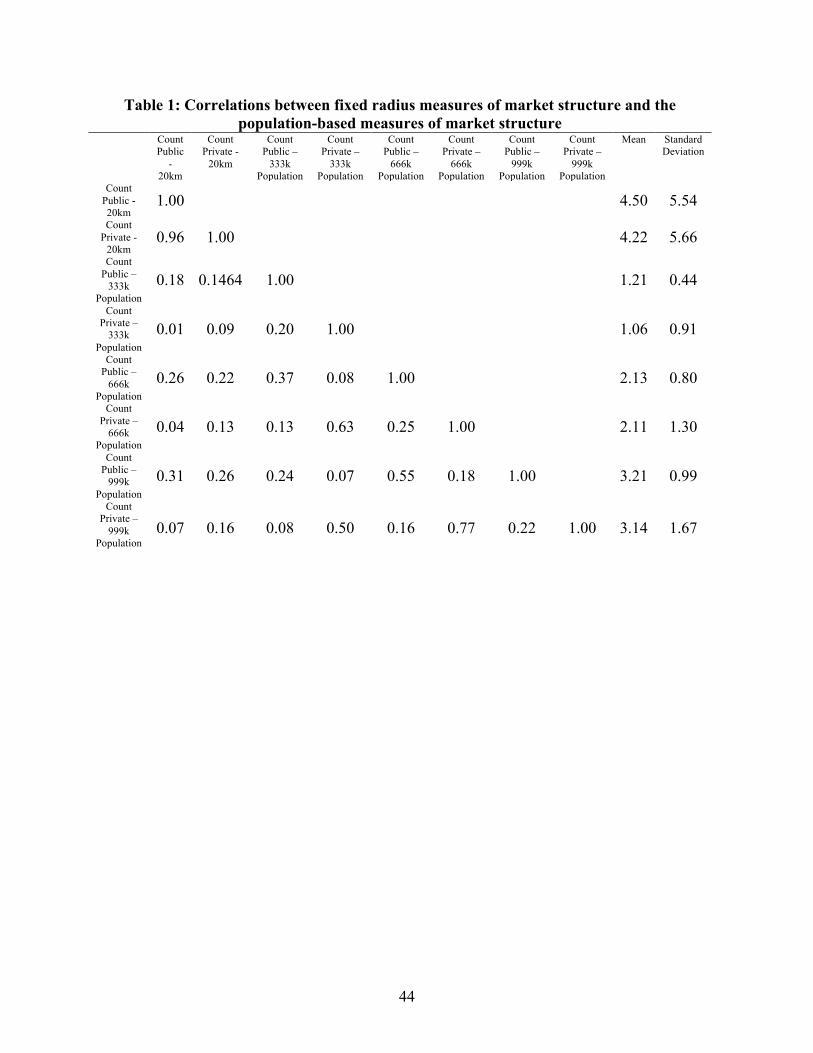
44
Table 1: Correlations between fixed radius measures of market structure and the population-based measures of market structure
Count Public
- 20km
Count Private -
20km
Count Public –
333k Population
Count Private –
333k Population
Count Public –
666k Population
Count Private –
666k Population
Count Public –
999k Population
Count Private –
999k Population
Mean Standard Deviation
Count Public - 20km
1.00 4.50 5.54 Count
Private - 20km
0.96 1.00 4.22 5.66 Count
Public – 333k
Population 0.18 0.1464 1.00 1.21 0.44
Count Private –
333k Population
0.01 0.09 0.20 1.00 1.06 0.91
Count Public –
666k Population
0.26 0.22 0.37 0.08 1.00 2.13 0.80
Count Private –
666k Population
0.04 0.13 0.13 0.63 0.25 1.00 2.11 1.30
Count Public –
999k Population
0.31 0.26 0.24 0.07 0.55 0.18 1.00 3.21 0.99
Count Private –
999k Population
0.07 0.16 0.08 0.50 0.16 0.77 0.22 1.00 3.14 1.67
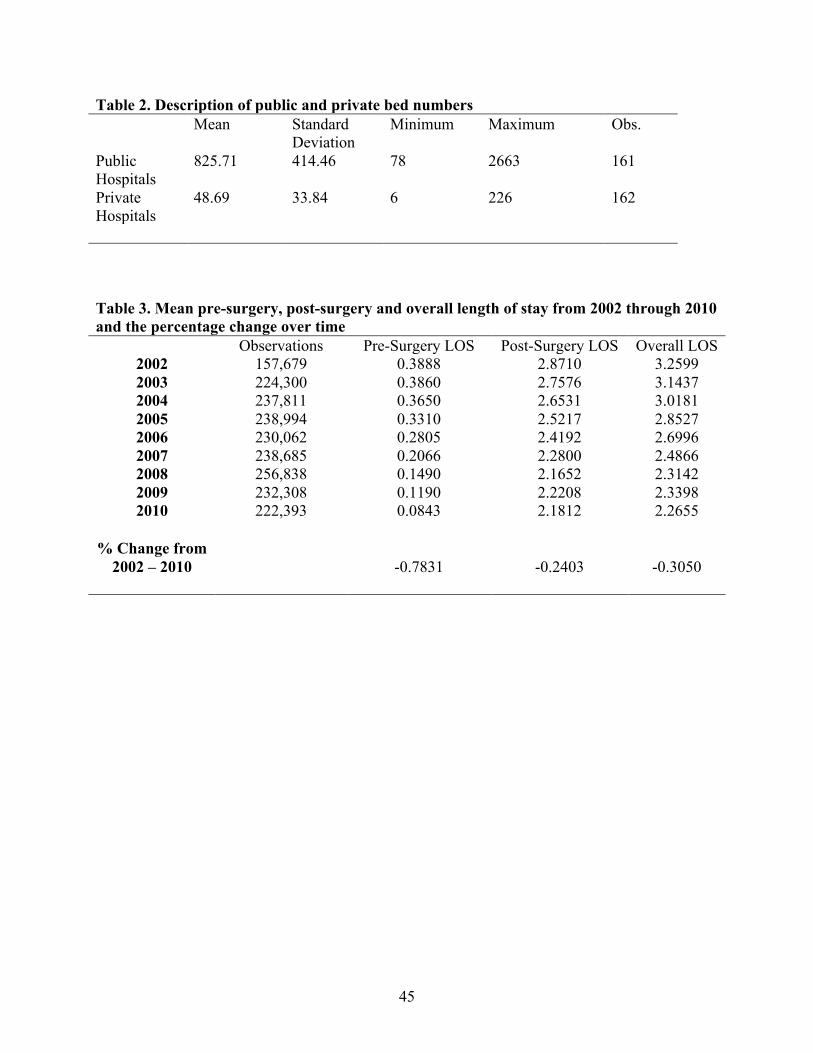
45
Table 2. Description of public and private bed numbers Mean Standard
Deviation Minimum Maximum Obs.
Public Hospitals
825.71 414.46 78 2663 161
Private Hospitals
48.69 33.84 6 226 162
Table 3. Mean pre-surgery, post-surgery and overall length of stay from 2002 through 2010 and the percentage change over time Observations Pre-Surgery LOS Post-Surgery LOS Overall LOS
2002 157,679 0.3888 2.8710 3.2599 2003 224,300 0.3860 2.7576 3.1437 2004 237,811 0.3650 2.6531 3.0181 2005 238,994 0.3310 2.5217 2.8527 2006 230,062 0.2805 2.4192 2.6996 2007 238,685 0.2066 2.2800 2.4866 2008 256,838 0.1490 2.1652 2.3142 2009 232,308 0.1190 2.2208 2.3398 2010 222,393 0.0843 2.1812 2.2655
% Change from
2002 – 2010 -0.7831 -0.2403 -0.3050

2
Table 4: The impact of hospital counts on length of stay Estimates of (1) on overall LOS with counts of public and private providers measured within a radius that captures 333,000 over 18s around a the patient’s GP practice (1) (2) (3) (4) (5) Coef S.E. Coef S.E. Coef S.E. Coef S.E. Coef S.E. Count public 0.0834 0.0133 0.0835 0.0128 0.0559 0.0112 - - - - 2003 * count public 0.0243 0.0089 0.0152 0.0086 0.0101 0.0085 0.0102 0.0086 0.0098 0.0086 2004 * count public 0.0387 0.0109 0.0279 0.0106 0.0224 0.0103 0.0220 0.0105 0.0224 0.0104 2005 * count public 0.0305 0.0128 0.0180 0.0125 0.0110 0.0122 0.0121 0.0124 0.0104 0.0123 2006 * count public -0.0240 0.0133 -0.0374 0.0131 -0.0490 0.0128 -0.0482 0.0130 -0.0516 0.0129 2007 * count public -0.0658 0.0145 -0.0839 0.0142 -0.0941 0.0139 -0.0929 0.0141 -0.0975 0.0140 2008 * count public -0.0810 0.0151 -0.0932 0.0148 -0.1008 0.0145 -0.1014 0.0146 -0.1056 0.0146 2009 * count public -0.0981 0.0153 -0.1144 0.0149 -0.1171 0.0147 -0.1217 0.0147 -0.1238 0.0148 2010 * count public -0.1289 0.0164 -0.1558 0.0159 -0.1593 0.0157 -0.1651 0.0157 -0.1673 0.0158 Count Private -0.0010 0.0074 -0.0017 0.0072 0.0067 0.0065 - - - - 2003 * count private -0.0025 0.0071 0.0002 0.0069 0.0004 0.0067 0.0001 0.0068 0.0006 0.0068 2004 * count private -0.0167 0.0076 -0.0168 0.0074 -0.0169 0.0072 -0.0174 0.0073 -0.0167 0.0073 2005 * count private -0.0183 0.0082 -0.0191 0.0080 -0.0159 0.0078 -0.0188 0.0080 -0.0168 0.0079 2006 * count private -0.0197 0.0084 -0.0176 0.0084 -0.0130 0.0082 -0.0168 0.0083 -0.0137 0.0083 2007 * count private 0.0002 0.0088 0.0026 0.0087 0.0055 0.0086 0.0036 0.0087 0.0060 0.0087 2008 * count private 0.0052 0.0089 0.0045 0.0087 0.0095 0.0086 0.0081 0.0087 0.0102 0.0087 2009 * count private 0.0202 0.0089 0.0193 0.0088 0.0233 0.0086 0.0206 0.0087 0.0210 0.0087 2010 * count private 0.0174 0.0094 0.0179 0.0092 0.0178 0.0091 0.0171 0.0092 0.0173 0.0093 2003 -0.1856 0.0098 -0.1829 0.0095 -0.1791 0.0094 -0.1783 0.0094 -0.1787 0.0094 2004 -0.3805 0.0126 -0.3803 0.0122 -0.3713 0.0120 -0.3729 0.0121 -0.3688 0.0120 2005 -0.5662 0.0146 -0.5700 0.0143 -0.5610 0.0140 -0.5643 0.0142 -0.5566 0.0140 2006 -0.7340 0.0162 -0.7429 0.0159 -0.7322 0.0156 -0.7327 0.0157 -0.7258 0.0157 2007 -0.9707 0.0176 -0.9912 0.0173 -0.9832 0.0169 -0.9810 0.0171 -0.9772 0.0171 2008 -1.1031 0.0188 -1.1340 0.0186 -1.1246 0.0181 -1.1224 0.0183 -1.1161 0.0183 2009 -1.2095 0.0196 -1.2390 0.0194 -1.2291 0.0190 -1.2253 0.0191 -1.2199 0.0192 2010 -1.3160 0.0205 -1.3414 0.0201 -1.3297 0.0198 -1.3253 0.0199 -1.3201 0.0200 Patient Characteristics
No Yes Yes Yes Yes
Days of the week Yes Yes Yes Yes Yes
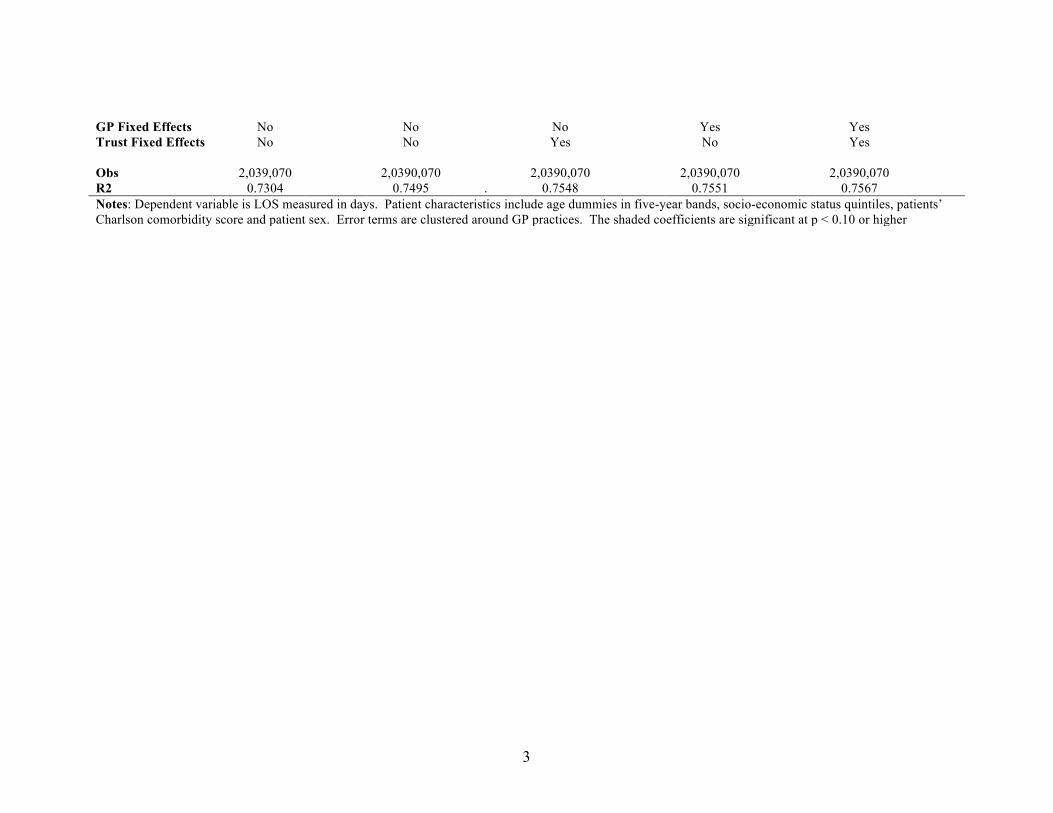
3
GP Fixed Effects No No No Yes Yes Trust Fixed Effects No No Yes No Yes Obs 2,039,070 2,0390,070 2,0390,070 2,0390,070 2,0390,070 R2 0.7304 0.7495 . 0.7548 0.7551 0.7567 Notes: Dependent variable is LOS measured in days. Patient characteristics include age dummies in five-year bands, socio-economic status quintiles, patients’ Charlson comorbidity score and patient sex. Error terms are clustered around GP practices. The shaded coefficients are significant at p < 0.10 or higher
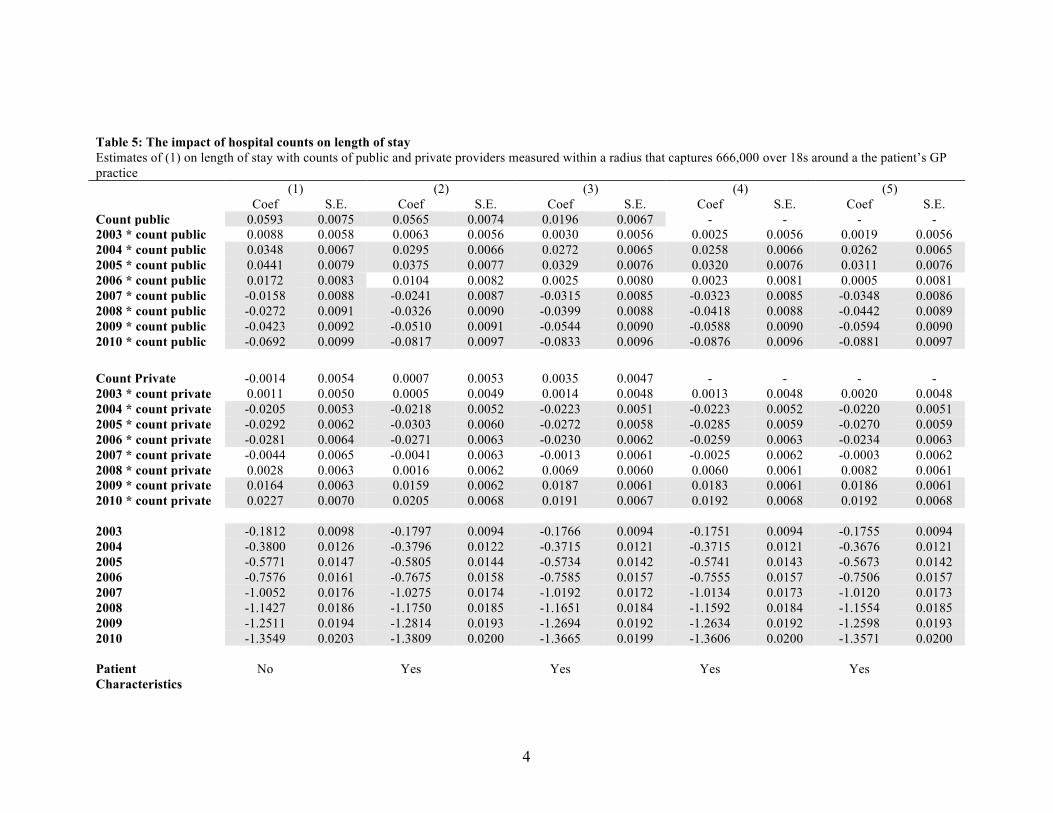
4
Table 5: The impact of hospital counts on length of stay Estimates of (1) on length of stay with counts of public and private providers measured within a radius that captures 666,000 over 18s around a the patient’s GP practice (1) (2) (3) (4) (5) Coef S.E. Coef S.E. Coef S.E. Coef S.E. Coef S.E. Count public 0.0593 0.0075 0.0565 0.0074 0.0196 0.0067 - - - - 2003 * count public 0.0088 0.0058 0.0063 0.0056 0.0030 0.0056 0.0025 0.0056 0.0019 0.0056 2004 * count public 0.0348 0.0067 0.0295 0.0066 0.0272 0.0065 0.0258 0.0066 0.0262 0.0065 2005 * count public 0.0441 0.0079 0.0375 0.0077 0.0329 0.0076 0.0320 0.0076 0.0311 0.0076 2006 * count public 0.0172 0.0083 0.0104 0.0082 0.0025 0.0080 0.0023 0.0081 0.0005 0.0081 2007 * count public -0.0158 0.0088 -0.0241 0.0087 -0.0315 0.0085 -0.0323 0.0085 -0.0348 0.0086 2008 * count public -0.0272 0.0091 -0.0326 0.0090 -0.0399 0.0088 -0.0418 0.0088 -0.0442 0.0089 2009 * count public -0.0423 0.0092 -0.0510 0.0091 -0.0544 0.0090 -0.0588 0.0090 -0.0594 0.0090 2010 * count public -0.0692 0.0099 -0.0817 0.0097 -0.0833 0.0096 -0.0876 0.0096 -0.0881 0.0097 Count Private -0.0014 0.0054 0.0007 0.0053 0.0035 0.0047 - - - - 2003 * count private 0.0011 0.0050 0.0005 0.0049 0.0014 0.0048 0.0013 0.0048 0.0020 0.0048 2004 * count private -0.0205 0.0053 -0.0218 0.0052 -0.0223 0.0051 -0.0223 0.0052 -0.0220 0.0051 2005 * count private -0.0292 0.0062 -0.0303 0.0060 -0.0272 0.0058 -0.0285 0.0059 -0.0270 0.0059 2006 * count private -0.0281 0.0064 -0.0271 0.0063 -0.0230 0.0062 -0.0259 0.0063 -0.0234 0.0063 2007 * count private -0.0044 0.0065 -0.0041 0.0063 -0.0013 0.0061 -0.0025 0.0062 -0.0003 0.0062 2008 * count private 0.0028 0.0063 0.0016 0.0062 0.0069 0.0060 0.0060 0.0061 0.0082 0.0061 2009 * count private 0.0164 0.0063 0.0159 0.0062 0.0187 0.0061 0.0183 0.0061 0.0186 0.0061 2010 * count private 0.0227 0.0070 0.0205 0.0068 0.0191 0.0067 0.0192 0.0068 0.0192 0.0068 2003 -0.1812 0.0098 -0.1797 0.0094 -0.1766 0.0094 -0.1751 0.0094 -0.1755 0.0094 2004 -0.3800 0.0126 -0.3796 0.0122 -0.3715 0.0121 -0.3715 0.0121 -0.3676 0.0121 2005 -0.5771 0.0147 -0.5805 0.0144 -0.5734 0.0142 -0.5741 0.0143 -0.5673 0.0142 2006 -0.7576 0.0161 -0.7675 0.0158 -0.7585 0.0157 -0.7555 0.0157 -0.7506 0.0157 2007 -1.0052 0.0176 -1.0275 0.0174 -1.0192 0.0172 -1.0134 0.0173 -1.0120 0.0173 2008 -1.1427 0.0186 -1.1750 0.0185 -1.1651 0.0184 -1.1592 0.0184 -1.1554 0.0185 2009 -1.2511 0.0194 -1.2814 0.0193 -1.2694 0.0192 -1.2634 0.0192 -1.2598 0.0193 2010 -1.3549 0.0203 -1.3809 0.0200 -1.3665 0.0199 -1.3606 0.0200 -1.3571 0.0200 Patient Characteristics
No Yes Yes Yes Yes

5
Days of the week Yes Yes Yes Yes Yes GP Fixed Effects No No No Yes Yes Trust Fixed Effects No No Yes No Yes Obs 2,039,070 2,0390,070 2,0390,070 2,0390,070 2,0390,070 R2 0.7305 0.7496 . 0.7548 0.7551 0.7567 Notes: Dependent variable is LOS measured in days. Patient characteristics include age dummies in five-year bands, socio-economic status quintiles, patients’ Charlson comorbidity score and patient sex. Error terms are clustered around GP practices. The shaded coefficients are significant at p < 0.10 or higher

6
Table 6: The impact of hospital counts on length of stay Estimates of (1) on length of stay with counts of public and private providers measured within a radius that captures 999,000 over 18s around a the patient’s GP practice (1) (2) (3) (4) (5) Coef S.E. Coef S.E. Coef S.E. Coef S.E. Coef S.E. Count public 0.0377 0.0057 0.0381 0.0056 0.0123 0.0051 - - - - 2003 * count public 0.0096 0.0043 0.0070 0.0042 0.0026 0.0042 0.0028 0.0042 0.0016 0.0042 2004 * count public 0.0216 0.0050 0.0166 0.0049 0.0138 0.0048 0.0126 0.0048 0.0127 0.0048 2005 * count public 0.0287 0.0057 0.0217 0.0056 0.0162 0.0055 0.0159 0.0055 0.0146 0.0055 2006 * count public 0.0177 0.0061 0.0096 0.0060 0.0018 0.0059 0.0028 0.0059 0.0005 0.0060 2007 * count public -0.0050 0.0064 -0.0144 0.0063 -0.0193 0.0062 -0.0202 0.0062 -0.0214 0.0063 2008 * count public -0.0171 0.0067 -0.0251 0.0066 -0.0307 0.0065 -0.0325 0.0065 -0.0340 0.0065 2009 * count public -0.0274 0.0069 -0.0366 0.0068 -0.0388 0.0068 -0.0432 0.0067 -0.0435 0.0068 2010 * count public -0.0442 0.0075 -0.0567 0.0073 -0.0585 0.0073 -0.0626 0.0072 -0.0630 0.0073 Count Private 0.0027 0.0043 0.0035 0.0042 0.0064 0.0038 - - - - 2003 * count private -0.0035 0.0038 -0.0036 0.0038 -0.0015 0.0037 -0.0020 0.0037 -0.0009 0.0037 2004 * count private -0.0167 0.0041 -0.0169 0.0040 -0.0168 0.0039 -0.0165 0.0039 -0.0163 0.0039 2005 * count private -0.0252 0.0046 -0.0248 0.0044 -0.0213 0.0043 -0.0222 0.0044 -0.0208 0.0044 2006 * count private -0.0298 0.0049 -0.0275 0.0048 -0.0235 0.0048 -0.0261 0.0048 -0.0239 0.0048 2007 * count private -0.0087 0.0051 -0.0071 0.0050 -0.0067 0.0049 -0.0066 0.0049 -0.0063 0.0050 2008 * count private 0.0021 0.0050 0.0030 0.0049 0.0053 0.0048 0.0060 0.0048 0.0064 0.0049 2009 * count private 0.0112 0.0052 0.0117 0.0050 0.0111 0.0050 0.0130 0.0050 0.0119 0.0050 2010 * count private 0.0125 0.0057 0.0126 0.0055 0.0097 0.0055 0.0116 0.0055 0.0105 0.0055 2003 -0.1803 0.0099 -0.1772 0.0096 -0.1724 0.0095 -0.1710 0.0095 -0.1713 0.0095 2004 -0.3693 0.0130 -0.3663 0.0126 -0.3555 0.0124 -0.3557 0.0124 -0.3515 0.0124 2005 -0.5583 0.0154 -0.5575 0.0150 -0.5472 0.0148 -0.5487 0.0149 -0.5411 0.0148 2006 -0.7410 0.0174 -0.7450 0.0169 -0.7321 0.0167 -0.7304 0.0167 -0.7240 0.0167 2007 -1.0004 0.0190 -1.0153 0.0186 -1.0024 0.0183 -0.9983 0.0184 -0.9947 0.0185 2008 -1.1449 0.0202 -1.1688 0.0200 -1.1530 0.0197 -1.1491 0.0198 -1.1424 0.0199 2009 -1.2540 0.0211 -1.2758 0.0209 -1.2568 0.0207 -1.2526 0.0208 -1.2455 0.0209 2010 -1.3533 0.0222 -1.3707 0.0219 -1.3483 0.0217 -1.3442 0.0217 -1.3368 0.0219 Patient Characteristics
No Yes Yes Yes Yes

7
Days of the week Yes Yes Yes Yes Yes GP Fixed Effects No No No Yes Yes Trust Fixed Effects No No Yes No Yes Obs 2,039,070 2,0390,070 2,0390,070 2,0390,070 2,0390,070 R2 0.7305 0.7495 . 0.7548 0.7551 0.7567 Notes: Dependent variable is LOS measured in days. Patient characteristics include age dummies in five-year bands, socio-economic status quintiles, patients’ Charlson comorbidity score and patient sex. Error terms are clustered around GP practices. The shaded coefficients are significant at p < 0.10 or higher
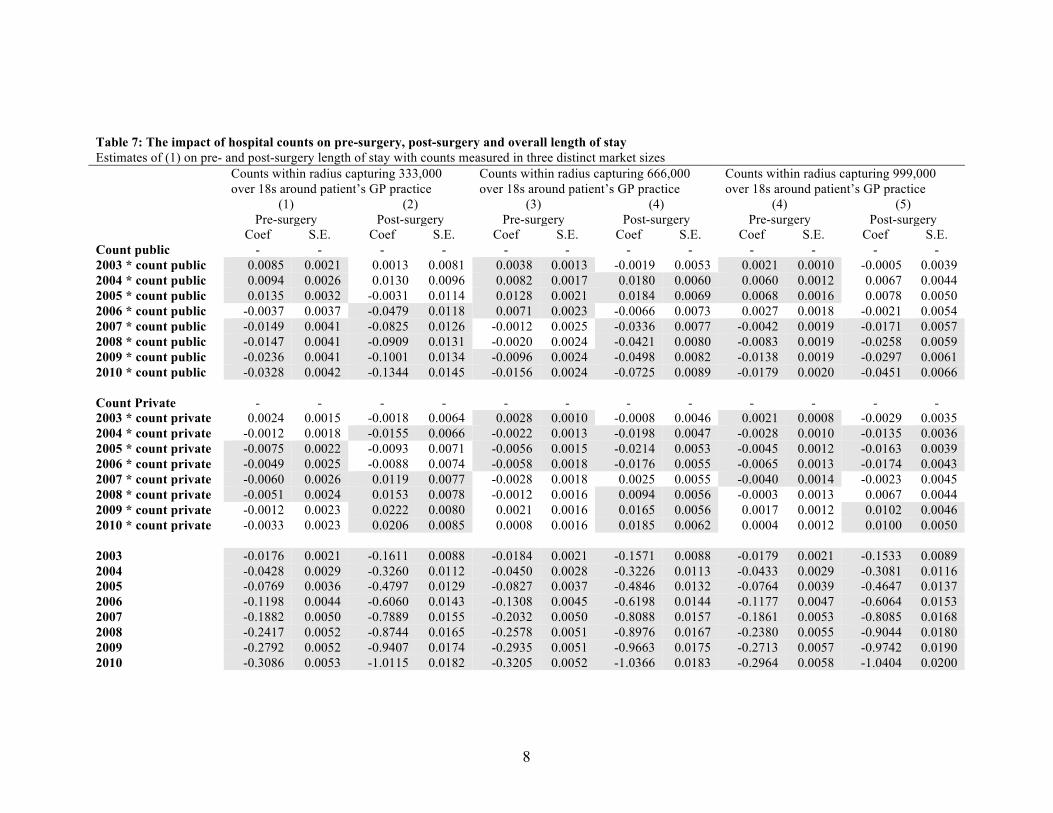
8
Table 7: The impact of hospital counts on pre-surgery, post-surgery and overall length of stay Estimates of (1) on pre- and post-surgery length of stay with counts measured in three distinct market sizes Counts within radius capturing 333,000
over 18s around patient’s GP practice Counts within radius capturing 666,000 over 18s around patient’s GP practice
Counts within radius capturing 999,000 over 18s around patient’s GP practice
(1) (2) (3) (4) (4) (5) Pre-surgery Post-surgery Pre-surgery Post-surgery Pre-surgery Post-surgery Coef S.E. Coef S.E. Coef S.E. Coef S.E. Coef S.E. Coef S.E. Count public - - - - - - - - - - - - 2003 * count public 0.0085 0.0021 0.0013 0.0081 0.0038 0.0013 -0.0019 0.0053 0.0021 0.0010 -0.0005 0.0039 2004 * count public 0.0094 0.0026 0.0130 0.0096 0.0082 0.0017 0.0180 0.0060 0.0060 0.0012 0.0067 0.0044 2005 * count public 0.0135 0.0032 -0.0031 0.0114 0.0128 0.0021 0.0184 0.0069 0.0068 0.0016 0.0078 0.0050 2006 * count public -0.0037 0.0037 -0.0479 0.0118 0.0071 0.0023 -0.0066 0.0073 0.0027 0.0018 -0.0021 0.0054 2007 * count public -0.0149 0.0041 -0.0825 0.0126 -0.0012 0.0025 -0.0336 0.0077 -0.0042 0.0019 -0.0171 0.0057 2008 * count public -0.0147 0.0041 -0.0909 0.0131 -0.0020 0.0024 -0.0421 0.0080 -0.0083 0.0019 -0.0258 0.0059 2009 * count public -0.0236 0.0041 -0.1001 0.0134 -0.0096 0.0024 -0.0498 0.0082 -0.0138 0.0019 -0.0297 0.0061 2010 * count public -0.0328 0.0042 -0.1344 0.0145 -0.0156 0.0024 -0.0725 0.0089 -0.0179 0.0020 -0.0451 0.0066 Count Private - - - - - - - - - - - - 2003 * count private 0.0024 0.0015 -0.0018 0.0064 0.0028 0.0010 -0.0008 0.0046 0.0021 0.0008 -0.0029 0.0035 2004 * count private -0.0012 0.0018 -0.0155 0.0066 -0.0022 0.0013 -0.0198 0.0047 -0.0028 0.0010 -0.0135 0.0036 2005 * count private -0.0075 0.0022 -0.0093 0.0071 -0.0056 0.0015 -0.0214 0.0053 -0.0045 0.0012 -0.0163 0.0039 2006 * count private -0.0049 0.0025 -0.0088 0.0074 -0.0058 0.0018 -0.0176 0.0055 -0.0065 0.0013 -0.0174 0.0043 2007 * count private -0.0060 0.0026 0.0119 0.0077 -0.0028 0.0018 0.0025 0.0055 -0.0040 0.0014 -0.0023 0.0045 2008 * count private -0.0051 0.0024 0.0153 0.0078 -0.0012 0.0016 0.0094 0.0056 -0.0003 0.0013 0.0067 0.0044 2009 * count private -0.0012 0.0023 0.0222 0.0080 0.0021 0.0016 0.0165 0.0056 0.0017 0.0012 0.0102 0.0046 2010 * count private -0.0033 0.0023 0.0206 0.0085 0.0008 0.0016 0.0185 0.0062 0.0004 0.0012 0.0100 0.0050 2003 -0.0176 0.0021 -0.1611 0.0088 -0.0184 0.0021 -0.1571 0.0088 -0.0179 0.0021 -0.1533 0.0089 2004 -0.0428 0.0029 -0.3260 0.0112 -0.0450 0.0028 -0.3226 0.0113 -0.0433 0.0029 -0.3081 0.0116 2005 -0.0769 0.0036 -0.4797 0.0129 -0.0827 0.0037 -0.4846 0.0132 -0.0764 0.0039 -0.4647 0.0137 2006 -0.1198 0.0044 -0.6060 0.0143 -0.1308 0.0045 -0.6198 0.0144 -0.1177 0.0047 -0.6064 0.0153 2007 -0.1882 0.0050 -0.7889 0.0155 -0.2032 0.0050 -0.8088 0.0157 -0.1861 0.0053 -0.8085 0.0168 2008 -0.2417 0.0052 -0.8744 0.0165 -0.2578 0.0051 -0.8976 0.0167 -0.2380 0.0055 -0.9044 0.0180 2009 -0.2792 0.0052 -0.9407 0.0174 -0.2935 0.0051 -0.9663 0.0175 -0.2713 0.0057 -0.9742 0.0190 2010 -0.3086 0.0053 -1.0115 0.0182 -0.3205 0.0052 -1.0366 0.0183 -0.2964 0.0058 -1.0404 0.0200

9
Patient Characteristics
Yes Yes Yes Yes Yes Yes
Days of the week Yes Yes Yes Yes Yes Yes GP Fixed Effects Yes Yes Yes Yes Yes Yes Trust Fixed Effects Yes Yes Yes Yes Yes Yes Obs 2,039,070 2,039,070 2,039,070 2,039,070 2,039,070 2,039,070 R2 0.3478 0.7462 0.3477 0.7462 0.3479 0.7462 Notes: Dependent variable is pre-surgery and post-surgery LOS measured in days. Patient characteristics include age dummies in five-year bands, socio-economic status quintiles, patients’ Charlson comorbidity score and patient sex. Error terms are clustered around GP practices. The shaded coefficients are significant at p < 0.10 or higher

10
Table 8a: Impact of Interacted Public and Private Counts on Length of Stay Estimates of (1) on length of stay with counts of public and private providers measured within a radius that captures 333,000, 666,000 and 999,000 over 18s around a the patient’s GP practice, with interactions between public and private counts 333,000 Person Radius Counts 666,000 Person Radius Counts 999,000 Person Radius Counts (1) (2) (3) Coef. S.E. Coef. S.E. Coef. S.E. Count public - - - - - - 2003 * count public 0.0108 0.0086 0.0004 0.0056 0.0004 0.0043 2004 * count public 0.0160 0.0104 0.0201 0.0065 0.0068 0.0048 2005 * count public -0.0001 0.0123 0.0207 0.0075 0.0042 0.0054 2006 * count public -0.0685 0.0129 -0.0153 0.0080 -0.0144 0.0058 2007 * count public -0.1215 0.0141 -0.0567 0.0086 -0.0416 0.0061 2008 * count public -0.1374 0.0148 -0.0707 0.0089 -0.0590 0.0063 2009 * count public -0.1618 0.0149 -0.0904 0.0090 -0.0723 0.0066 2010 * count public -0.2027 0.0161 -0.1181 0.0097 -0.0911 0.0071 Count private - - - - - - 2003 * count private -0.0078 0.0078 0.0003 0.0053 -0.0032 0.0040 2004 * count private -0.0219 0.0092 -0.0252 0.0060 -0.0196 0.0045 2005 * count private -0.0315 0.0105 -0.0393 0.0071 -0.0316 0.0051 2006 * count private -0.0383 0.0113 -0.0456 0.0079 -0.0455 0.0057 2007 * count private -0.0265 0.0120 -0.0288 0.0079 -0.0359 0.0060 2008 * count private -0.0265 0.0125 -0.0251 0.0080 -0.0278 0.0061 2009 * count private -0.0253 0.0129 -0.0193 0.0084 -0.0262 0.0064 2010 * count private -0.0478 0.0137 -0.0276 0.0090 -0.0335 0.0069 Count Public * Private - - - - - - 2003 * public * private 0.0119 0.0047 0.0010 0.0018 0.0011 0.0010 2004 * public * private 0.0051 0.0056 0.0001 0.0020 0.0004 0.0011 2005 * public * private 0.0125 0.0063 0.0040 0.0022 0.0025 0.0012 2006 * public * private 0.0200 0.0063 0.0094 0.0024 0.0065 0.0013 2007 * public * private 0.0266 0.0068 0.0116 0.0025 0.0092 0.0013 2008 * public * private 0.0297 0.0073 0.0144 0.0025 0.0109 0.0013 2009 * public * private 0.0324 0.0072 0.0145 0.0026 0.0114 0.0014 2010 * public * private 0.0522 0.0078 0.0207 0.0028 0.0143 0.0015

11
2003 -0.1891 0.0106 -0.1751 0.0117 -0.1747 0.0128 2004 -0.3640 0.0126 -0.3519 0.0131 -0.3309 0.0143 2005 -0.5489 0.0145 -0.5450 0.0149 -0.5085 0.0161 2006 -0.7113 0.0159 -0.7233 0.0162 -0.6888 0.0176 2007 -0.9544 0.0174 -0.9672 0.0178 -0.9442 0.0187 2008 -1.0830 0.0188 -1.1024 0.0190 -1.0772 0.0200 2009 -1.1737 0.0198 -1.1881 0.0198 -1.1586 0.0208 2010 -1.2840 0.0205 -1.2975 0.0204 -1.2624 0.0216 Patient Characteristics Yes Yes Days of the week Yes Yes GP Fixed Effects Yes Yes Trust Fixed Effects Yes Yes Obs 2,039,070 2,039,070 R2 0.7567 0.7567 Notes: Dependent variable is LOS measured in days. Patient characteristics include age dummies in five-year bands, socio-economic status quintiles, patients’ Charlson comorbidity score and patient sex. Error terms are clustered around GP practices. The shaded coefficients are significant at p < 0.10 or higher Table 8b: Sum of public plus the public * private interaction terms and private plus public * private interaction terms from Table 5a (1) (2) (3) 333,000 Person Radius Counts 666,000 Person Radius Counts 999,000 Person Radius Counts Public + public *
private interactions Private + public * private interactions
Public + public * private interactions
Private + public * private interactions
Public + public * private interactions
Private + public * private interactions
2003 0.0227 0.0041 0.0014 0.0013 0.0016 -0.0021 2004 0.0211 -0.0168 0.0202 -0.0251 0.0072 -0.0192 2005 0.0124 -0.0190 0.0247 -0.0353 0.0067 -0.0292 2006 -0.0485 -0.0182 -0.0059 -0.0362 -0.0079 -0.0390 2007 -0.0948 0.0001 -0.0451 -0.0172 -0.0324 -0.0267 2008 -0.1076 0.0032 -0.0563 -0.0107 -0.0481 -0.0168 2009 -0.1294 0.0071 -0.0758 -0.0047 -0.0609 -0.0148 2010 -0.1505 0.0044 -0.0974 -0.0069 -0.0768 -0.0192

12
Table 9a: Test of Cream-Skimming on Age Estimates of (1) on age of patients in public hospitals with counts of public and private providers measured within a radius that captures 333,000, 666,000 and 999,000 over 18s around a the patient’s GP practice, with interactions between public and private counts (1) (2) (3) 333,000 Person Radius Counts 666,000 Person Radius Counts 999,000 Person Radius Counts Coef. S.E. Coef. S.E. Coef. S.E. Count public - - - - - - 2003 * count public 0.3054 0.0599 0.0633 0.0381 -0.0271 0.0063 2004 * count public 0.3119 0.0690 0.1456 0.0427 -0.0296 0.0071 2005 * count public 0.3667 0.0720 0.1731 0.0451 -0.0295 0.0075 2006 * count public 0.5144 0.0765 0.2439 0.0477 -0.0355 0.0079 2007 * count public 0.5808 0.0784 0.2777 0.0485 -0.0508 0.0084 2008 * count public 0.4904 0.0817 0.2387 0.0501 -0.0565 0.0089 2009 * count public 0.5693 0.0851 0.2830 0.0525 -0.0734 0.0094 2010 * count public 0.7575 0.0929 0.4122 0.0555 -0.0801 0.0095 Count private - - - - - - 2003 * count private 0.0562 0.0539 0.1256 0.0342 0.0742 0.0268 2004 * count private 0.1774 0.0593 0.1515 0.0380 0.0755 0.0284 2005 * count private 0.2427 0.0646 0.2041 0.0414 0.1191 0.0316 2006 * count private 0.1768 0.0666 0.2018 0.0434 0.1229 0.0331 2007 * count private 0.2607 0.0681 0.2551 0.0454 0.1671 0.0337 2008 * count private 0.3771 0.0720 0.3039 0.0469 0.2170 0.0353 2009 * count private 0.4621 0.0758 0.3534 0.0486 0.2884 0.0367 2010 * count private 0.3986 0.0849 0.3107 0.0556 0.2416 0.0399 Count Public * Private - - - - - - 2003 * public * private -0.0438 0.0322 -0.0448 0.0115 -0.0271 0.0063 2004 * public * private -0.1470 0.0362 -0.0695 0.0127 -0.0296 0.0071 2005 * public * private -0.1075 0.0376 -0.0588 0.0135 -0.0295 0.0075 2006 * public * private -0.1269 0.0397 -0.0690 0.0148 -0.0355 0.0079 2007 * public * private -0.1785 0.0410 -0.0931 0.0158 -0.0508 0.0084 2008 * public * private -0.2327 0.0438 -0.1061 0.0159 -0.0565 0.0089 2009 * public * private -0.2993 0.0446 -0.1191 0.0169 -0.0734 0.0094 2010 * public * private -0.3244 0.0486 -0.1351 0.0176 -0.0801 0.0095
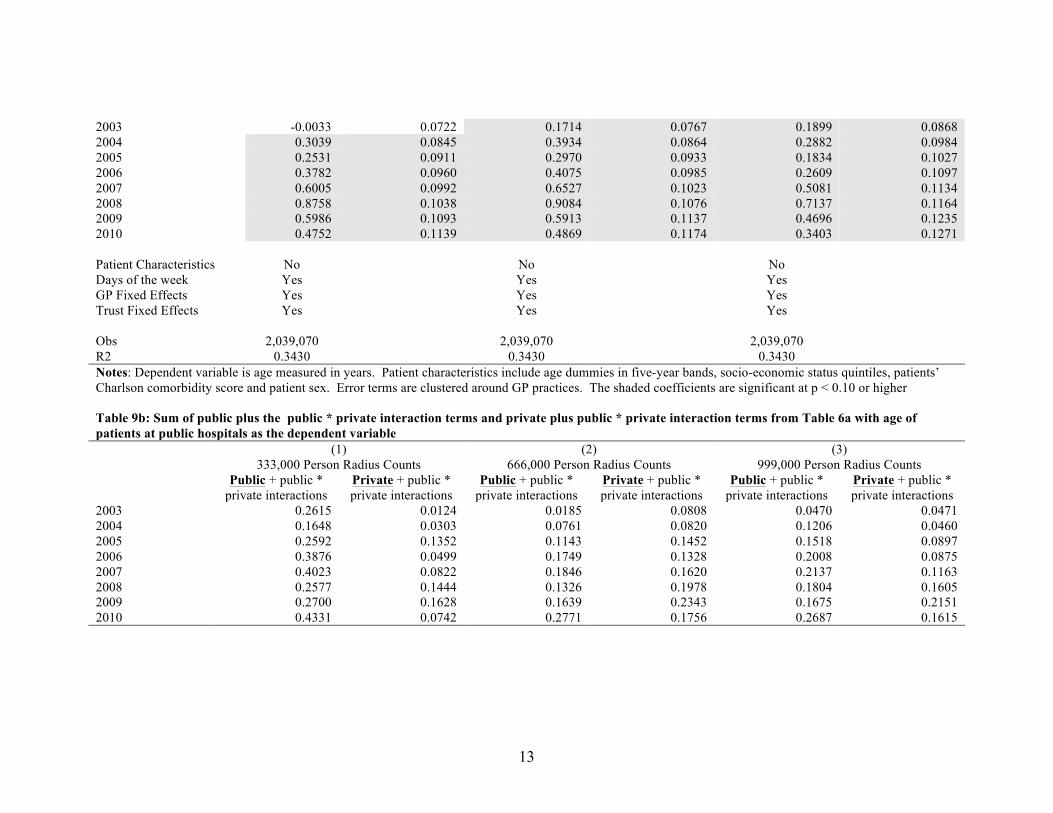
13
2003 -0.0033 0.0722 0.1714 0.0767 0.1899 0.0868 2004 0.3039 0.0845 0.3934 0.0864 0.2882 0.0984 2005 0.2531 0.0911 0.2970 0.0933 0.1834 0.1027 2006 0.3782 0.0960 0.4075 0.0985 0.2609 0.1097 2007 0.6005 0.0992 0.6527 0.1023 0.5081 0.1134 2008 0.8758 0.1038 0.9084 0.1076 0.7137 0.1164 2009 0.5986 0.1093 0.5913 0.1137 0.4696 0.1235 2010 0.4752 0.1139 0.4869 0.1174 0.3403 0.1271 Patient Characteristics No No No Days of the week Yes Yes Yes GP Fixed Effects Yes Yes Yes Trust Fixed Effects Yes Yes Yes Obs 2,039,070 2,039,070 2,039,070 R2 0.3430 0.3430 0.3430 Notes: Dependent variable is age measured in years. Patient characteristics include age dummies in five-year bands, socio-economic status quintiles, patients’ Charlson comorbidity score and patient sex. Error terms are clustered around GP practices. The shaded coefficients are significant at p < 0.10 or higher Table 9b: Sum of public plus the public * private interaction terms and private plus public * private interaction terms from Table 6a with age of patients at public hospitals as the dependent variable (1) (2) (3) 333,000 Person Radius Counts 666,000 Person Radius Counts 999,000 Person Radius Counts Public + public *
private interactions Private + public * private interactions
Public + public * private interactions
Private + public * private interactions
Public + public * private interactions
Private + public * private interactions
2003 0.2615 0.0124 0.0185 0.0808 0.0470 0.0471 2004 0.1648 0.0303 0.0761 0.0820 0.1206 0.0460 2005 0.2592 0.1352 0.1143 0.1452 0.1518 0.0897 2006 0.3876 0.0499 0.1749 0.1328 0.2008 0.0875 2007 0.4023 0.0822 0.1846 0.1620 0.2137 0.1163 2008 0.2577 0.1444 0.1326 0.1978 0.1804 0.1605 2009 0.2700 0.1628 0.1639 0.2343 0.1675 0.2151 2010 0.4331 0.0742 0.2771 0.1756 0.2687 0.1615
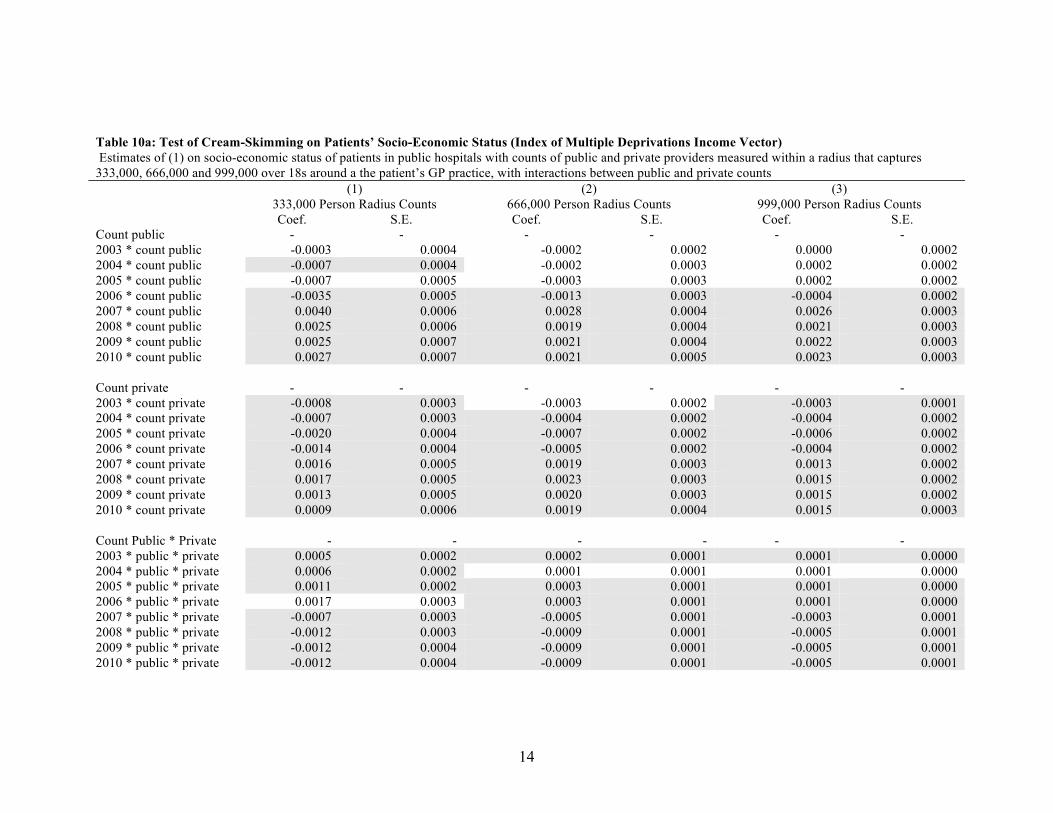
14
Table 10a: Test of Cream-Skimming on Patients’ Socio-Economic Status (Index of Multiple Deprivations Income Vector) Estimates of (1) on socio-economic status of patients in public hospitals with counts of public and private providers measured within a radius that captures 333,000, 666,000 and 999,000 over 18s around a the patient’s GP practice, with interactions between public and private counts (1) (2) (3) 333,000 Person Radius Counts 666,000 Person Radius Counts 999,000 Person Radius Counts Coef. S.E. Coef. S.E. Coef. S.E. Count public - - - - - - 2003 * count public -0.0003 0.0004 -0.0002 0.0002 0.0000 0.0002 2004 * count public -0.0007 0.0004 -0.0002 0.0003 0.0002 0.0002 2005 * count public -0.0007 0.0005 -0.0003 0.0003 0.0002 0.0002 2006 * count public -0.0035 0.0005 -0.0013 0.0003 -0.0004 0.0002 2007 * count public 0.0040 0.0006 0.0028 0.0004 0.0026 0.0003 2008 * count public 0.0025 0.0006 0.0019 0.0004 0.0021 0.0003 2009 * count public 0.0025 0.0007 0.0021 0.0004 0.0022 0.0003 2010 * count public 0.0027 0.0007 0.0021 0.0005 0.0023 0.0003 Count private - - - - - - 2003 * count private -0.0008 0.0003 -0.0003 0.0002 -0.0003 0.0001 2004 * count private -0.0007 0.0003 -0.0004 0.0002 -0.0004 0.0002 2005 * count private -0.0020 0.0004 -0.0007 0.0002 -0.0006 0.0002 2006 * count private -0.0014 0.0004 -0.0005 0.0002 -0.0004 0.0002 2007 * count private 0.0016 0.0005 0.0019 0.0003 0.0013 0.0002 2008 * count private 0.0017 0.0005 0.0023 0.0003 0.0015 0.0002 2009 * count private 0.0013 0.0005 0.0020 0.0003 0.0015 0.0002 2010 * count private 0.0009 0.0006 0.0019 0.0004 0.0015 0.0003 Count Public * Private - - - - - - 2003 * public * private 0.0005 0.0002 0.0002 0.0001 0.0001 0.0000 2004 * public * private 0.0006 0.0002 0.0001 0.0001 0.0001 0.0000 2005 * public * private 0.0011 0.0002 0.0003 0.0001 0.0001 0.0000 2006 * public * private 0.0017 0.0003 0.0003 0.0001 0.0001 0.0000 2007 * public * private -0.0007 0.0003 -0.0005 0.0001 -0.0003 0.0001 2008 * public * private -0.0012 0.0003 -0.0009 0.0001 -0.0005 0.0001 2009 * public * private -0.0012 0.0004 -0.0009 0.0001 -0.0005 0.0001 2010 * public * private -0.0012 0.0004 -0.0009 0.0001 -0.0005 0.0001
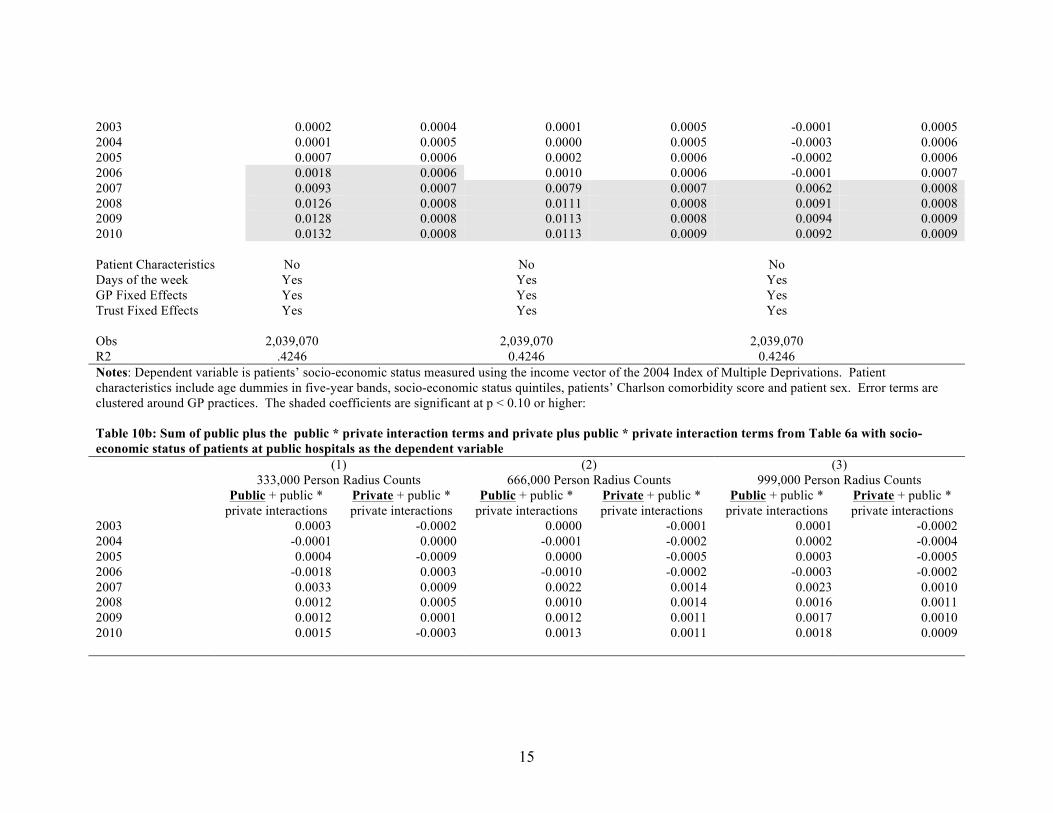
15
2003 0.0002 0.0004 0.0001 0.0005 -0.0001 0.0005 2004 0.0001 0.0005 0.0000 0.0005 -0.0003 0.0006 2005 0.0007 0.0006 0.0002 0.0006 -0.0002 0.0006 2006 0.0018 0.0006 0.0010 0.0006 -0.0001 0.0007 2007 0.0093 0.0007 0.0079 0.0007 0.0062 0.0008 2008 0.0126 0.0008 0.0111 0.0008 0.0091 0.0008 2009 0.0128 0.0008 0.0113 0.0008 0.0094 0.0009 2010 0.0132 0.0008 0.0113 0.0009 0.0092 0.0009 Patient Characteristics No No No Days of the week Yes Yes Yes GP Fixed Effects Yes Yes Yes Trust Fixed Effects Yes Yes Yes Obs 2,039,070 2,039,070 2,039,070 R2 .4246 0.4246 0.4246 Notes: Dependent variable is patients’ socio-economic status measured using the income vector of the 2004 Index of Multiple Deprivations. Patient characteristics include age dummies in five-year bands, socio-economic status quintiles, patients’ Charlson comorbidity score and patient sex. Error terms are clustered around GP practices. The shaded coefficients are significant at p < 0.10 or higher: Table 10b: Sum of public plus the public * private interaction terms and private plus public * private interaction terms from Table 6a with socio-economic status of patients at public hospitals as the dependent variable (1) (2) (3) 333,000 Person Radius Counts 666,000 Person Radius Counts 999,000 Person Radius Counts Public + public *
private interactions Private + public * private interactions
Public + public * private interactions
Private + public * private interactions
Public + public * private interactions
Private + public * private interactions
2003 0.0003 -0.0002 0.0000 -0.0001 0.0001 -0.0002 2004 -0.0001 0.0000 -0.0001 -0.0002 0.0002 -0.0004 2005 0.0004 -0.0009 0.0000 -0.0005 0.0003 -0.0005 2006 -0.0018 0.0003 -0.0010 -0.0002 -0.0003 -0.0002 2007 0.0033 0.0009 0.0022 0.0014 0.0023 0.0010 2008 0.0012 0.0005 0.0010 0.0014 0.0016 0.0011 2009 0.0012 0.0001 0.0012 0.0011 0.0017 0.0010 2010 0.0015 -0.0003 0.0013 0.0011 0.0018 0.0009
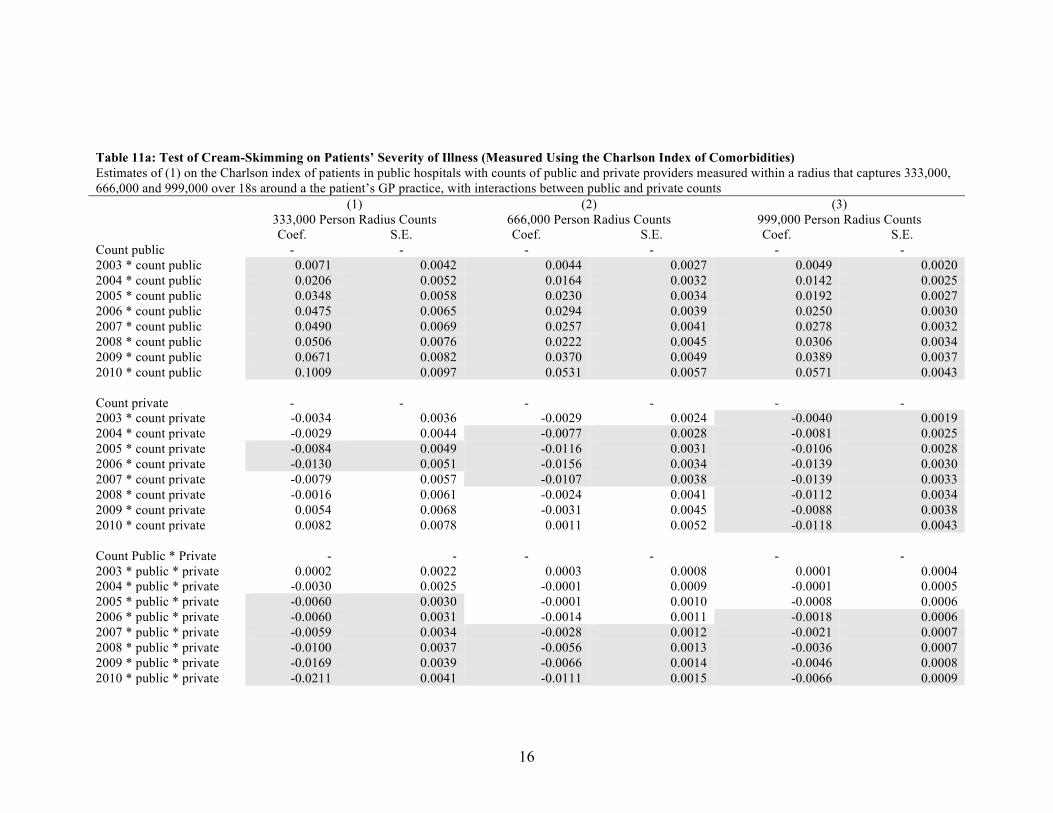
16
Table 11a: Test of Cream-Skimming on Patients’ Severity of Illness (Measured Using the Charlson Index of Comorbidities) Estimates of (1) on the Charlson index of patients in public hospitals with counts of public and private providers measured within a radius that captures 333,000, 666,000 and 999,000 over 18s around a the patient’s GP practice, with interactions between public and private counts (1) (2) (3) 333,000 Person Radius Counts 666,000 Person Radius Counts 999,000 Person Radius Counts Coef. S.E. Coef. S.E. Coef. S.E. Count public - - - - - - 2003 * count public 0.0071 0.0042 0.0044 0.0027 0.0049 0.0020 2004 * count public 0.0206 0.0052 0.0164 0.0032 0.0142 0.0025 2005 * count public 0.0348 0.0058 0.0230 0.0034 0.0192 0.0027 2006 * count public 0.0475 0.0065 0.0294 0.0039 0.0250 0.0030 2007 * count public 0.0490 0.0069 0.0257 0.0041 0.0278 0.0032 2008 * count public 0.0506 0.0076 0.0222 0.0045 0.0306 0.0034 2009 * count public 0.0671 0.0082 0.0370 0.0049 0.0389 0.0037 2010 * count public 0.1009 0.0097 0.0531 0.0057 0.0571 0.0043 Count private - - - - - - 2003 * count private -0.0034 0.0036 -0.0029 0.0024 -0.0040 0.0019 2004 * count private -0.0029 0.0044 -0.0077 0.0028 -0.0081 0.0025 2005 * count private -0.0084 0.0049 -0.0116 0.0031 -0.0106 0.0028 2006 * count private -0.0130 0.0051 -0.0156 0.0034 -0.0139 0.0030 2007 * count private -0.0079 0.0057 -0.0107 0.0038 -0.0139 0.0033 2008 * count private -0.0016 0.0061 -0.0024 0.0041 -0.0112 0.0034 2009 * count private 0.0054 0.0068 -0.0031 0.0045 -0.0088 0.0038 2010 * count private 0.0082 0.0078 0.0011 0.0052 -0.0118 0.0043 Count Public * Private - - - - - - 2003 * public * private 0.0002 0.0022 0.0003 0.0008 0.0001 0.0004 2004 * public * private -0.0030 0.0025 -0.0001 0.0009 -0.0001 0.0005 2005 * public * private -0.0060 0.0030 -0.0001 0.0010 -0.0008 0.0006 2006 * public * private -0.0060 0.0031 -0.0014 0.0011 -0.0018 0.0006 2007 * public * private -0.0059 0.0034 -0.0028 0.0012 -0.0021 0.0007 2008 * public * private -0.0100 0.0037 -0.0056 0.0013 -0.0036 0.0007 2009 * public * private -0.0169 0.0039 -0.0066 0.0014 -0.0046 0.0008 2010 * public * private -0.0211 0.0041 -0.0111 0.0015 -0.0066 0.0009

17
2003 0.0046 0.0051 0.0048 0.0055 0.0056 0.0062 2004 0.0252 0.0061 0.0242 0.0065 0.0242 0.0071 2005 0.0585 0.0071 0.0584 0.0074 0.0626 0.0080 2006 0.0684 0.0078 0.0796 0.0081 0.0855 0.0088 2007 0.0824 0.0087 0.1051 0.0088 0.1029 0.0096 2008 0.1110 0.0094 0.1419 0.0097 0.1348 0.0102 2009 0.1325 0.0103 0.1559 0.0105 0.1491 0.0113 2010 0.1630 0.0113 0.2016 0.0116 0.1898 0.0123 Patient Characteristics No No No Days of the week Yes Yes Yes GP Fixed Effects Yes Yes Yes Trust Fixed Effects Yes Yes Yes Obs 2,039,070 2,039,070 2,039,070 R2 0.1076 0.1076 0.1076 Notes: Dependent variable is the patients’ Charlson comorbidity index scores. Patient characteristics include age dummies in five-year bands, socio-economic status quintiles, patients’ Charlson comorbidity score and patient sex. Error terms are clustered around GP practices. The shaded coefficients are significant at p < 0.10 or higher Table 11b: Sum of public plus the public * private interaction terms and private plus public * private interaction terms from Table 6a with Charlson index of patients’ in public as the dependent variable (1) (2) (3) 333,000 Person Radius Counts 666,000 Person Radius Counts 999,000 Person Radius Counts Public + public *
private interactions Private + public * private interactions
Public + public * private interactions
Private + public * private interactions
Public + public * private interactions
Private + public * private interactions
2003 0.0073 -0.0032 0.0047 -0.0026 0.0050 -0.0039 2004 0.0176 -0.0058 0.0163 -0.0077 0.0141 -0.0082 2005 0.0288 -0.0145 0.0228 -0.0118 0.0184 -0.0114 2006 0.0415 -0.0191 0.0280 -0.0170 0.0232 -0.0157 2007 0.0432 -0.0138 0.0229 -0.0135 0.0257 -0.0161 2008 0.0406 -0.0116 0.0165 -0.0081 0.0269 -0.0148 2009 0.0503 -0.0115 0.0304 -0.0096 0.0343 -0.0134 2010 0.0798 -0.0129 0.0421 -0.0099 0.0504 -0.0184

18
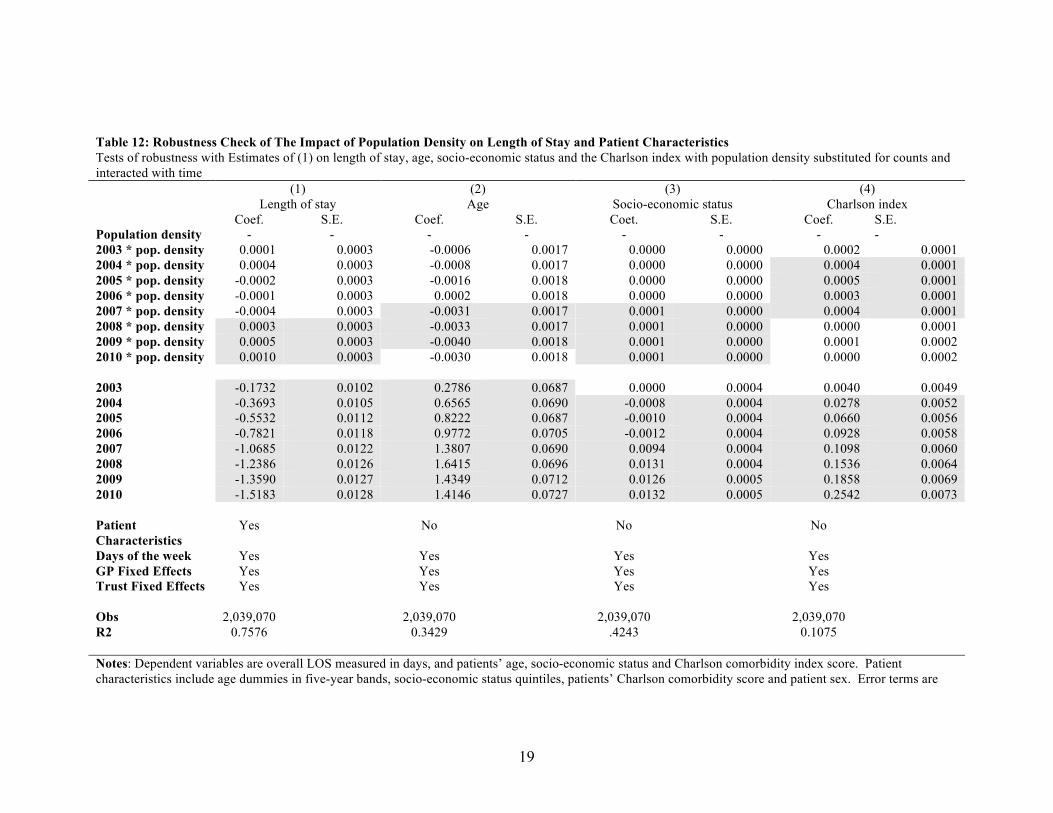
19
Table 12: Robustness Check of The Impact of Population Density on Length of Stay and Patient Characteristics Tests of robustness with Estimates of (1) on length of stay, age, socio-economic status and the Charlson index with population density substituted for counts and interacted with time (1) (2) (3) (4) Length of stay Age Socio-economic status Charlson index Coef. S.E. Coef. S.E. Coet. S.E. Coef. S.E. Population density - - - - - - - - 2003 * pop. density 0.0001 0.0003 -0.0006 0.0017 0.0000 0.0000 0.0002 0.0001 2004 * pop. density 0.0004 0.0003 -0.0008 0.0017 0.0000 0.0000 0.0004 0.0001 2005 * pop. density -0.0002 0.0003 -0.0016 0.0018 0.0000 0.0000 0.0005 0.0001 2006 * pop. density -0.0001 0.0003 0.0002 0.0018 0.0000 0.0000 0.0003 0.0001 2007 * pop. density -0.0004 0.0003 -0.0031 0.0017 0.0001 0.0000 0.0004 0.0001 2008 * pop. density 0.0003 0.0003 -0.0033 0.0017 0.0001 0.0000 0.0000 0.0001 2009 * pop. density 0.0005 0.0003 -0.0040 0.0018 0.0001 0.0000 0.0001 0.0002 2010 * pop. density 0.0010 0.0003 -0.0030 0.0018 0.0001 0.0000 0.0000 0.0002 2003 -0.1732 0.0102 0.2786 0.0687 0.0000 0.0004 0.0040 0.0049 2004 -0.3693 0.0105 0.6565 0.0690 -0.0008 0.0004 0.0278 0.0052 2005 -0.5532 0.0112 0.8222 0.0687 -0.0010 0.0004 0.0660 0.0056 2006 -0.7821 0.0118 0.9772 0.0705 -0.0012 0.0004 0.0928 0.0058 2007 -1.0685 0.0122 1.3807 0.0690 0.0094 0.0004 0.1098 0.0060 2008 -1.2386 0.0126 1.6415 0.0696 0.0131 0.0004 0.1536 0.0064 2009 -1.3590 0.0127 1.4349 0.0712 0.0126 0.0005 0.1858 0.0069 2010 -1.5183 0.0128 1.4146 0.0727 0.0132 0.0005 0.2542 0.0073 Patient Characteristics
Yes No No No
Days of the week Yes Yes Yes Yes GP Fixed Effects Yes Yes Yes Yes Trust Fixed Effects Yes Yes Yes Yes Obs 2,039,070 2,039,070 2,039,070 2,039,070 R2 0.7576 0.3429 .4243 0.1075 Notes: Dependent variables are overall LOS measured in days, and patients’ age, socio-economic status and Charlson comorbidity index score. Patient characteristics include age dummies in five-year bands, socio-economic status quintiles, patients’ Charlson comorbidity score and patient sex. Error terms are

20
clustered around GP practices. The shaded coefficients are significant at p < 0.10 or higher
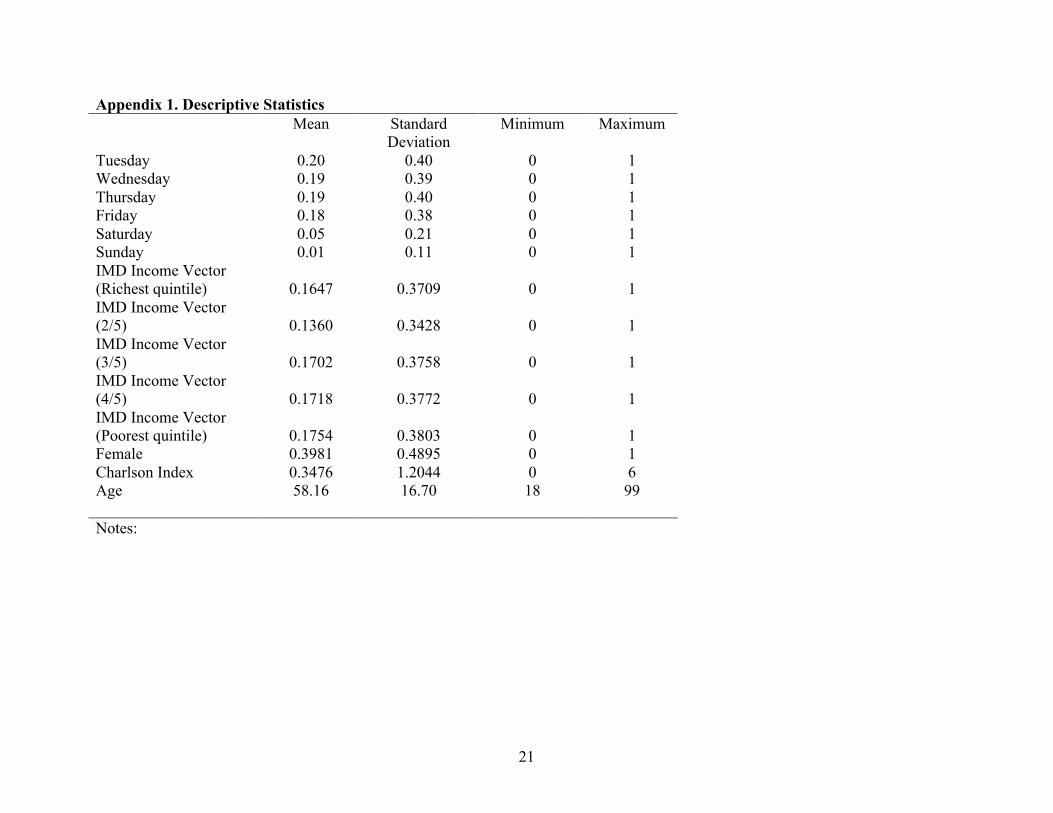
21
Appendix 1. Descriptive Statistics Mean Standard
Deviation Minimum Maximum
Tuesday 0.20 0.40 0 1 Wednesday 0.19 0.39 0 1 Thursday 0.19 0.40 0 1 Friday 0.18 0.38 0 1 Saturday 0.05 0.21 0 1 Sunday 0.01 0.11 0 1 IMD Income Vector (Richest quintile) 0.1647 0.3709 0 1 IMD Income Vector (2/5) 0.1360 0.3428 0 1 IMD Income Vector (3/5) 0.1702 0.3758 0 1 IMD Income Vector (4/5) 0.1718 0.3772 0 1 IMD Income Vector (Poorest quintile) 0.1754 0.3803 0 1 Female 0.3981 0.4895 0 1 Charlson Index 0.3476 1.2044 0 6 Age 58.16 16.70 18 99 Notes:

22
Appendix 2: Percentage of hernia repairs, hip replacements, arthroscopies and knee replacements as a percentage of our sample Hip Replacement Hernia Repair Arthroscopy Knee Replacement
% of total annual activity 0.14 0.26 0.44 0.16 % of total annual activity 0.14 0.25 0.44 0.17 % of total annual activity 0.14 0.24 0.44 0.18 % of total annual activity 0.14 0.23 0.44 0.19 % of total annual activity 0.14 0.23 0.43 0.20 % of total annual activity 0.14 0.23 0.42 0.21 % of total annual activity 0.14 0.21 0.44 0.21 % of total annual activity 0.15 0.22 0.41 0.22 % of total annual activity 0.15 0.21 0.41 0.22
Related Documents