Public Safety, Public Spending: Forecasting America’s Prison Population, 2007- 2011 Adam Gelb, Project Director Public Safety Performance Project The Pew Charitable Trusts, Pew Center on the States October 2, 2007

Public Safety, Public Spending: F orecasting America’s Prison Population, 2007-2011 Adam Gelb, Project Director Public Safety Performance Project The Pew.
Dec 27, 2015
Welcome message from author
This document is posted to help you gain knowledge. Please leave a comment to let me know what you think about it! Share it to your friends and learn new things together.
Transcript
Public Safety, Public Spending: Forecasting America’s Prison Population, 2007-2011
Adam Gelb, Project DirectorPublic Safety Performance Project
The Pew Charitable Trusts, Pew Center on the States
October 2, 2007

Where We’ve Been

Where We’ve Been – Costs
Growth in State Corrections Costs
$0
$5,000,000,000
$10,000,000,000
$15,000,000,000
$20,000,000,000
$25,000,000,000
$30,000,000,000
$35,000,000,000
$40,000,000,000
$45,000,000,000
$50,000,000,000
1986 1988 1990 1992 1994 1996 1998 2000 2002 2004Source: Bureau of Justice Statistics

Where Are We Going?Report Objectives
To estimate the future size and cost of state and federal prison systems
To examine the reasons for projected growth
To highlight state efforts to control corrections spending
To outline the challenges ahead for state policy makers

Projection Formula
2011 State Prison Population =
[2006 population x 0.453957294846] µ 2005 UCR ± 29384823 ÷ Census projection of 16-24 year-olds x .267 –.364SES¥ - [1/HS graduation rate x .8003]
JUST KIDDING! – We called the states

What We Found – National

National

National
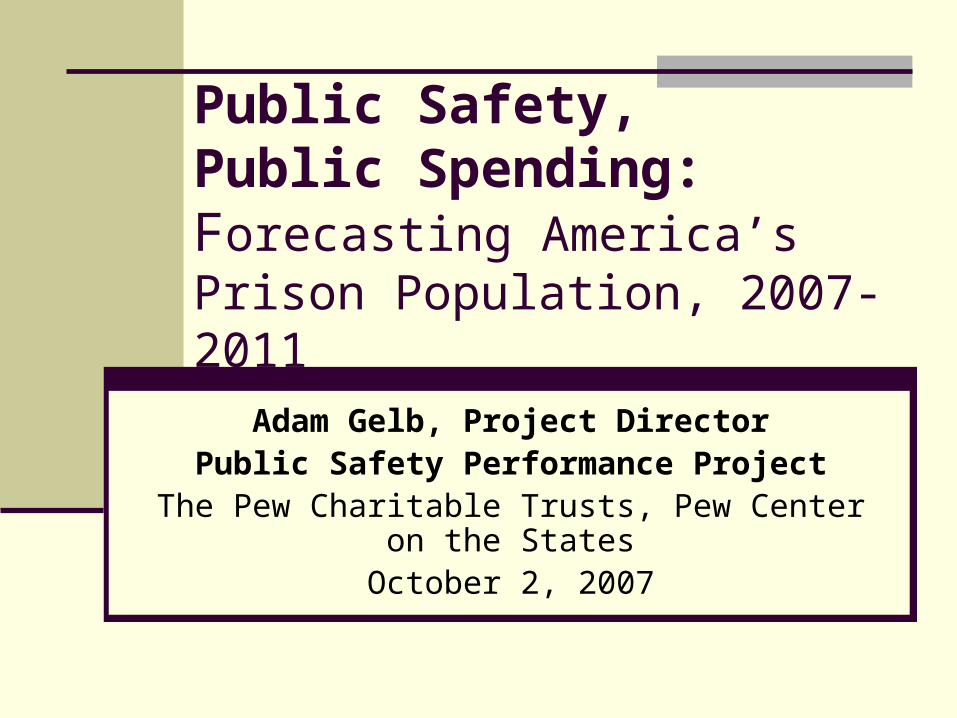
Estimating Future Prison Costs
Operating Costs: National average in 2005 dollars - $23,876 per inmate
Capital Costs: Midpoint estimate $65,000 per bed

What We Found – CostsNew Prison Spending, 2007-2011
$15,000,000,000
$12,500,000,000
$0
$2,000,000,000
$4,000,000,000
$6,000,000,000
$8,000,000,000
$10,000,000,000
$12,000,000,000
$14,000,000,000
$16,000,000,000
Operating Costs Capital Costs

Regions

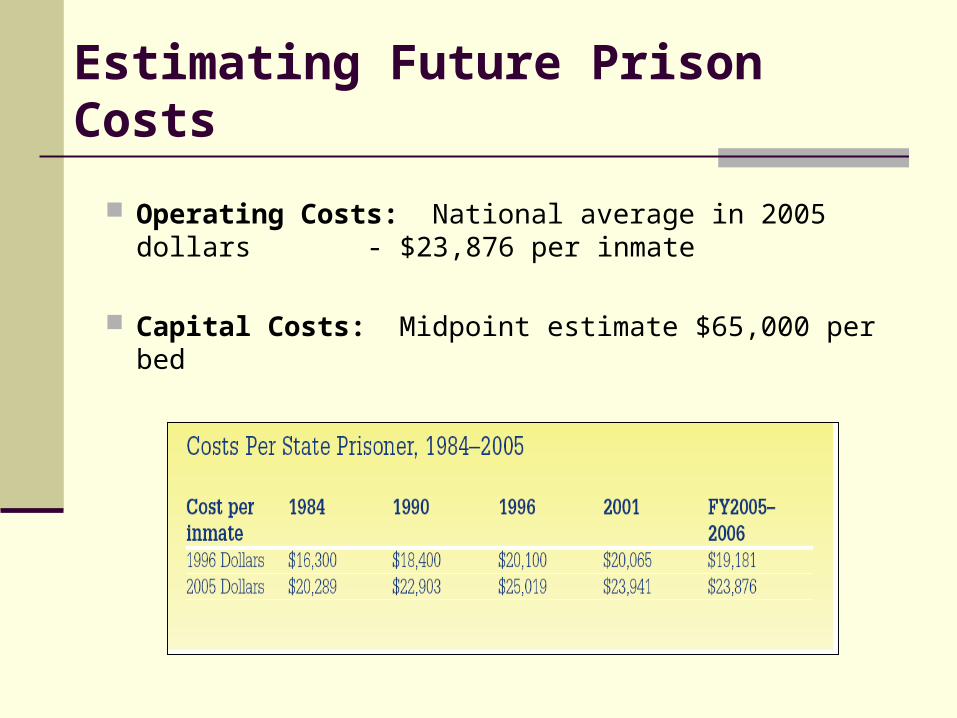
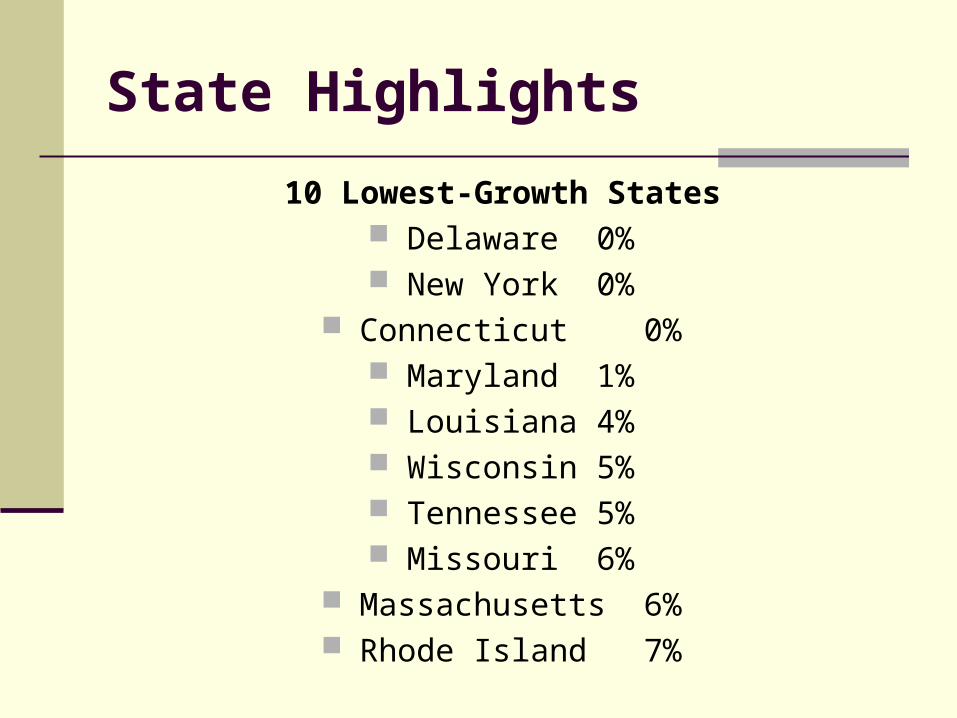
State Highlights
State Highlights
10 Lowest-Growth States Delaware 0% New York 0%
Connecticut0% Maryland 1% Louisiana 4% Wisconsin 5% Tennessee 5% Missouri 6% Massachusetts 6% Rhode Island 7%

Key Drivers and Trends
Population growth, esp. in West Growing admissions (1980-1992) Longer length of stay (1992- ) Probation and parole violators (60% of
growth) Women (57%) growing faster than men (34%) Rising age (up from 31 to 34) Methamphetamine cases Mental health cases Workforce recruitment and retention Sex-offender laws will be felt in out-years
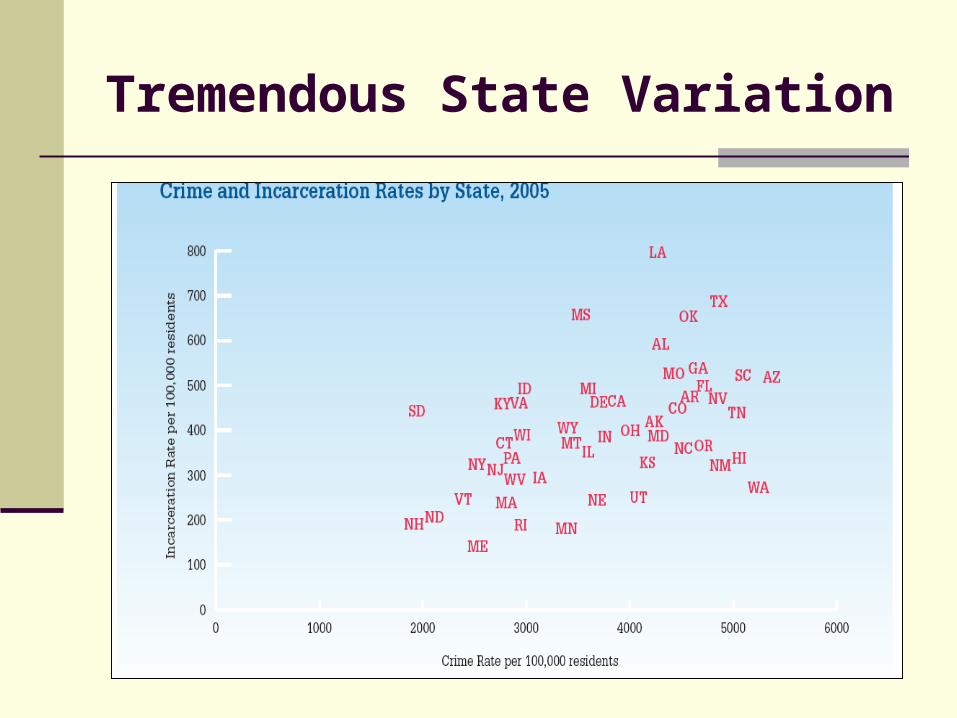
Tremendous State Variation

Tremendous State Variation
Admissions x Length of Stay = Prison Population
Admissions, Length of StayDetermined Largely by Policy Choices
State Policy Choices=
State Prison Population / Costs

CT –Targeted Reform
Problem Identified technical violators as driver
Solution Set goal of reducing TVs by 20% Hired 96 new POs Started 2 new supervision/service
programs Public awareness campaign
Result Highest growth to flat Crime drop parallel to national reduction

NC – Broad System Reform
Problem Lack of truth, violent offenders serving short
terms Solution
Build prisons for violent/chronic offenders Abolish discretionary parole release Establish comprehensive guidelines Create state/local partnership for low risk
Result One of highest incarc. rates to middle of the pack Crime fell in sync with national drop Estimated $2 billion in savings over past 12
years

Exciting Time in Criminal Justice Advances in science of behavior change
Cognitive-Behavioral Treatment Motivational Interviewing Contingency Management
Advances in supervision technology Accurate, on site, rapid-result drug screens GPS monitoring
Broad public support for alternatives Trend toward Managing for Results Budget pressure Bipartisan reform efforts across the nation

Implications
Central Question is Being Reframed
OLD“How can we demonstrate that
we’re tough on crime?”
NEW“How can we deliver taxpayers
the best return on their investment?”

Public Safety, Public Spending: Forecasting America’s Prison Population, 2007-2011
Adam Gelb, Project DirectorPublic Safety Performance Project
The Pew Charitable Trusts, Pew Center on the States
October 2, 2007
Related Documents