Public Private Partnerships Knowledge Series Government of India Ministry of Finance Department of Economic Affairs Government of India Ministry of Urban Development Toolkit for Public Private Partnership frameworks in Municipal Solid Waste Management Volume I – Overview and Process Prepared by ICRA Management Consulting Services Limited INDIA with support from The GOI ADB PPP INITIATIVE Mainstreaming PPPs in India www.pppindia.com

Welcome message from author
This document is posted to help you gain knowledge. Please leave a comment to let me know what you think about it! Share it to your friends and learn new things together.
Transcript
Public Private PartnershipsKnowledge Series
Government of IndiaMinistry of Finance
Department of Economic Affairs
Government of IndiaMinistry of Urban Development
Toolkit for Public Private Partnership frameworks in Municipal Solid Waste Management
Volume I – Overview and Process
Prepared byICRA Management Consulting Services Limited INDIA
with support from
The GOI ADB PPP INITIATIVEMainstreaming PPPs in Indiawww.pppindia.com

GoI-ADB-PPP Initiative Improving delivery of MSWM services in India through PPPs
Volume I – Overview and Process 2
Disclaimer
This Toolkit for ”Improving service delivery in Municipal Solid Waste Management in India through Public
Private Partnerships” is part of a Knowledge series on Public-Private Partnership being developed by the
Department of Economic Affairs, Ministry of Finance, Government of India (DEA) and Ministry of Urban
Development Government of India (MoUD). It has been put together with technical assistance and funding
support from the Asian Development Bank (ADB) as part of the ADB-GoI-PPP Initiative. ICRA Management
Consulting Services Limited (IMaCS), commissioned by the ADB has prepared this Toolkit on the basis of
extensive external consultations.
IMaCS have taken due care and caution in preparing the contents of this Paper. The accuracy, adequacy or
completeness of any information contained in this Paper is not guaranteed and DEA, MoUD and ADB are not
responsible for any errors or omissions, or for the results obtained from the use of such information. The
contents of this Paper should not be construed to be the opinion of the DEA, MoUD and ADB. DEA and MoUD
are not liable for any direct, indirect, incidental or consequential damages of any kind whatsoever to the
subscribers / users / transmitters / distributors of this Paper.
This Toolkit shall not be reproduced in any form, other than those intended by DEA, MoUD and ADB, and
without prior written permission.

GoI-ADB-PPP Initiative Improving delivery of MSWM services in India through PPPs
Volume I – Overview and Process 3
Contents
1. INTRODUCTION ....................................................................................................................................... 1
1.1 BACKGROUND ........................................................................................................................................... 1
1.2 SCOPE OF WORK ........................................................................................................................................ 1
1.3 APPROACH AND METHODOLOGY ................................................................................................................... 2
1.4 TOOLKIT CONTENT AND INTENDED USERS ....................................................................................................... 3
2. PPP IN MSWM – STATUS, ISSUES AND CHALLENGES ............................................................................... 1
2.1 THE MSWM VALUE CHAIN ......................................................................................................................... 1
2.2 MSWM POLICY INITIATIVES AT NATIONAL LEVEL .............................................................................................. 2
2.3 INSTITUTIONAL ROLES AND RESPONSIBILITY ...................................................................................................... 4
2.4 CURRENT STATUS AND SERVICE LEVELS............................................................................................................ 7
2.5 PPPS IN MSWM IN INDIA........................................................................................................................... 8
2.6 CASE STUDIES ON PPP IN SWM: SUMMARY OF FINDINGS ................................................................................ 13
3. PPP PROJECT DEVELOPMENT PROCESS ................................................................................................. 23
3.1 STEP 1: NEEDS ASSESSMENT ...................................................................................................................... 23
3.2 STEP 2: FEASIBILITY EVALUATION ................................................................................................................. 24
3.3 STEP 3: PROJECT SCOPING AND STRUCTURING ............................................................................................... 25
3.4 STEP 4: PROCUREMENT ............................................................................................................................. 26
4. STEP 1: NEEDS ASSESSMENT .................................................................................................................. 28
4.1 SITUATION ANALYSIS ................................................................................................................................ 28
4.2 CRYSTALLISING ISSUES AND GAPS ................................................................................................................ 44
4.3 EVALUATION OF TECHNICAL OPTIONS ........................................................................................................... 47
4.4 IDENTIFICATION AND PRIORITISATION OF ACTIONS .......................................................................................... 54
5. STEP 2: FEASIBILITY EVALUATION .......................................................................................................... 56
5.1 DETERMINE FINANCIAL SOURCES................................................................................................................. 56
5.2 DETERMINE PROJECT COST ........................................................................................................................ 64
5.3 EVALUATE PROJECT VIABILITY ..................................................................................................................... 70
5.4 DETERMINE THE FINANCIAL SUPPORT REQUIREMENT ...................................................................................... 79
6. STEP 3: SCOPING AND STRUCTURING .................................................................................................... 81
6.1 RATIONALE FOR PPP ................................................................................................................................ 81
6.2 PRE-REQUISITES FOR PPP .......................................................................................................................... 82
6.3 PPP PROJECT SCOPING ............................................................................................................................. 83
6.4 PROJECT STRUCTURING ............................................................................................................................. 86
7. STEP 4: PROCUREMENT ......................................................................................................................... 95
7.1 APPROACHES TO PROCUREMENT ................................................................................................................. 95
7.2 SINGLE STAGE VS. TWO STAGE BIDDING ........................................................................................................ 96
7.3 PROCUREMENT PROCESS ........................................................................................................................... 98
GoI-ADB-PPP Initiative Improving delivery of MSWM services in India through PPPs
Volume I – Overview and Process 4
Exhibits
EXHIBIT 1.1 APPROACH AND METHODOLOGY ................................................................................................................... 2
EXHIBIT 2.1 MSWM VALUE CHAIN* .............................................................................................................................. 1
EXHIBIT 2.2 MSWM VALUE CHAIN – GENERIC FLOW CHART .............................................................................................. 2
EXHIBIT 2.3 MSWM - IMPORTANT POLICY LANDMARKS AND FUNDING INITIATIVES OF GOI ....................................................... 3
EXHIBIT 2.4 ROLES & RESPONSIBILITIES OF INSTITUTIONS IN SWM ....................................................................................... 4
EXHIBIT 2.5 MSWM - RESULTS OF SLB EXERCISE CONDUCTED BY MOUD ............................................................................. 8
EXHIBIT 2.6 PREVALENT PPP FORMATS IN MSWM ......................................................................................................... 10
EXHIBIT 2.7 EVOLUTION OF PPP PROJECTS IN MSWM IN INDIA ........................................................................................ 11
EXHIBIT 2.8 RECENT TRENDS OF PPP INTERVENTION IN MSWM IN INDIA ............................................................................ 12
EXHIBIT 2.9 RANGES OF SERVICES ON PPP – EXPERIENCE IN SELECT CITIES ............................................................................ 12
EXHIBIT 3.1 DEVELOPING PPPS IN MSWM - STEPS INVOLVED .......................................................................................... 23
EXHIBIT 3.2 NEEDS ASSESSMENT – KEY ACTIVITIES ........................................................................................................... 24
EXHIBIT 3.3 FEASIBILITY EVALUATION – KEY ACTIVITIES...................................................................................................... 25
EXHIBIT 3.4 PROJECT SCOPING AND STRUCTURING – KEY ACTIVITIES .................................................................................... 26
EXHIBIT 3.5 PROJECT PROCUREMENT – KEY ACTIVITIES ..................................................................................................... 26
EXHIBIT 4.1 MSW GENERATION COEFFICIENT IN INDIAN CITIES .......................................................................................... 29
EXHIBIT 4.2 MSW GENERATION COEFFICIENT FOR VARIOUS POPULATION RANGE CITIES IN INDIA .............................................. 29
EXHIBIT 4.3 WASTE COMPOSITION AVERAGES IN SAMPLE INDIAN CITIES ............................................................................... 30
EXHIBIT 4.4 PHYSICAL CHARACTERISTICS OF MSW IN INDIAN CITIES .................................................................................... 30
EXHIBIT 4.5 BROAD INDICATORS OF PHYSICAL & CHEMICAL CHARACTERISTICS IN SAMPLE INDIAN CITIES .................................... 31
EXHIBIT 4.6 CHEMICAL CHARACTERISTICS OF MSW IN INDIAN CITIES .................................................................................. 31
EXHIBIT 4.7 SIGNIFICANCE OF WASTE PHYSICAL & CHEMICAL CHARACTERISTICS ................................................................... 32
EXHIBIT 4.8 INDICATIVE TEMPLATE FOR LISTING PHYSICAL ASSETS FOR MSWM .................................................................... 33
EXHIBIT 4.9 ILLUSTRATIVE FORMAT FOR EXISTING MANPOWER AVAILABILITY IN SWM DEPARTMENT ........................................ 34
EXHIBIT 4.10 SERVICE LEVEL BENCHMARKS FOR SWM SECTOR DEVELOPED BY MOUD .......................................................... 40
EXHIBIT 4.11 COMPLIANCE CRITERIA IN LINE WITH MSW RULES, 2000 .............................................................................. 42
EXHIBIT 4.12 MAPPING ISSUES AND GAPS ..................................................................................................................... 45
EXHIBIT 4.13 ILLUSTRATIVE TEMPLATE FOR CRYSTALLISING ISSUES AND GAPS ........................................................................ 46
EXHIBIT 4.14 WASTE PARAMETERS FOR TECHNICAL VIABILITY OF ENERGY RECOVERY FROM MSW ............................................. 52
EXHIBIT 4.15 CRITERIA FOR TECHNOLOGY SELECTION ....................................................................................................... 52
EXHIBIT 5.1 STEPS IN FINANCIAL FEASIBILITY EVALUATION ................................................................................................. 56
EXHIBIT 5.2 PRICES FOR RECOVERABLE WASTES ............................................................................................................... 58
EXHIBIT 5.3 12TH
FINANCE COMMISSION GRANTS FOR MSWM ......................................................................................... 62
EXHIBIT 5.4 GOI SUBSIDY FOR WASTE-TO-ENERGY .......................................................................................................... 63
EXHIBIT 5.5 INDICATIVE COMPONENTS OF CAPITAL COST .................................................................................................. 65
EXHIBIT 5.6 TYPICAL VEHICLES AND EQUIPMENT USED IN MSWM – INDICATIVE COSTS AND ECONOMIC LIFE .............................. 66
EXHIBIT 5.7 TYPICAL STORAGE EQUIPMENT – INDICATIVE COSTS AND ECONOMIC LIFE ............................................................ 66
EXHIBIT 5.8 COMPOSTING – INDICATIVE SPECIFICATIONS AND EQUIPMENT FOR A 100 TPD PLANT ........................................... 67
EXHIBIT 5.9 INDICATIVE LANDFILL EQUIPMENT REQUIREMENTS .......................................................................................... 68
EXHIBIT 5.10 INDICATIVE LANDFILL ACTIVITIES AND COSTS ................................................................................................ 69
EXHIBIT 5.11 MSWM O&M COSTS – INDICATIVE HEADS ............................................................................................... 69
EXHIBIT 5.12 PROPORTION OF COSTS FOR VARIOUS ACTIVITIES .......................................................................................... 70
EXHIBIT 5.13 VIABILTY GAP SUPPORT REQUIREMENT IN A PPP PROJECT .............................................................................. 80
EXHIBIT 6.1 PROJECT SCOPING – ILLUSTATIVE FRAMEWORK ............................................................................................... 84
GoI-ADB-PPP Initiative Improving delivery of MSWM services in India through PPPs
Volume I – Overview and Process 5
EXHIBIT 6.2 INDICATIVE RISK ALLOCATION MATRIX .......................................................................................................... 86
EXHIBIT 6.3 PPP CONTRACTING OPTIONS ....................................................................................................................... 90
EXHIBIT 6.4 DATA ROOM AND PROJECT INFORMATION..................................................................................................... 93
EXHIBIT 7.1 INDICATIVE STEPS AND TIMELINES – SINGLE STAGE BIDDING .............................................................................. 96
EXHIBIT 7.2 INDICATIVE STEPS AND TIMELINES – TWO STAGE BIDDING ................................................................................. 97
EXHIBIT 7.3 INDICATIVE STEPS AND TIMELINES – TWO STAGE BIDDING ................................................................................. 98
GoI-ADB-PPP Initiative Improving delivery of MSWM services in India through PPPs
Volume I – Overview and Process 6
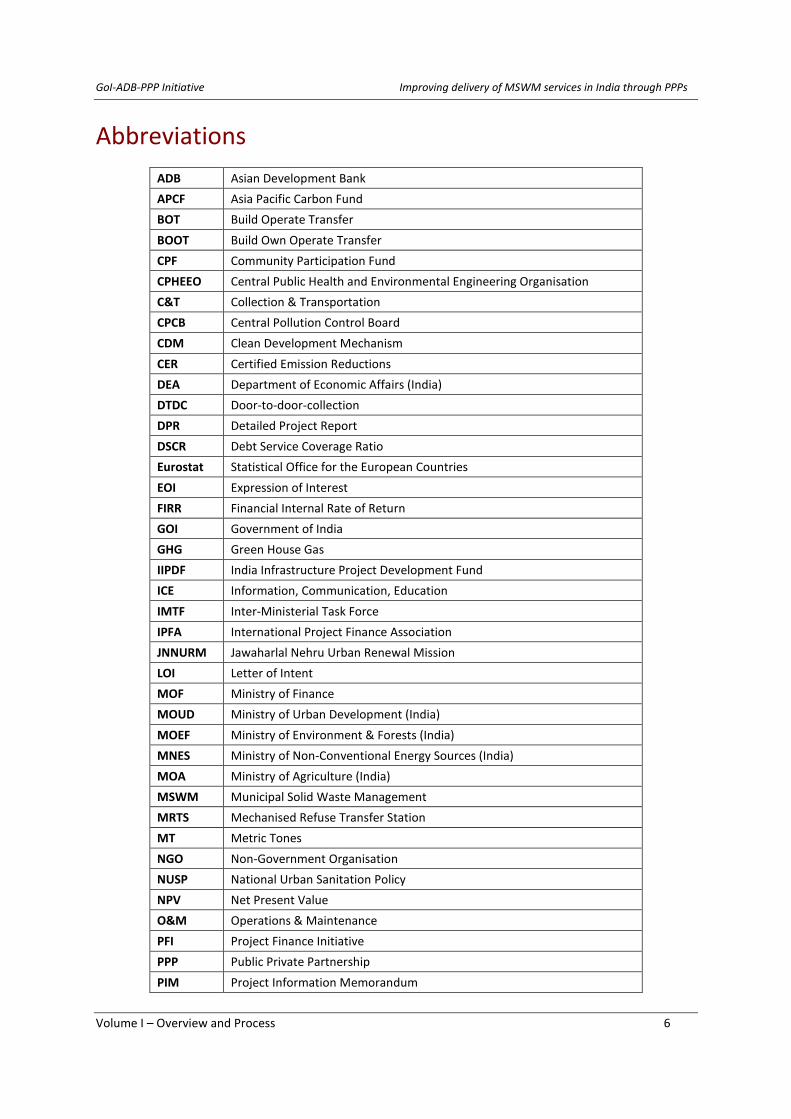
Abbreviations
ADB Asian Development Bank
APCF Asia Pacific Carbon Fund
BOT Build Operate Transfer
BOOT Build Own Operate Transfer
CPF Community Participation Fund
CPHEEO Central Public Health and Environmental Engineering Organisation
C&T Collection & Transportation
CPCB Central Pollution Control Board
CDM Clean Development Mechanism
CER Certified Emission Reductions
DEA Department of Economic Affairs (India)
DTDC Door-to-door-collection
DPR Detailed Project Report
DSCR Debt Service Coverage Ratio
Eurostat Statistical Office for the European Countries
EOI Expression of Interest
FIRR Financial Internal Rate of Return
GOI Government of India
GHG Green House Gas
IIPDF India Infrastructure Project Development Fund
ICE Information, Communication, Education
IMTF Inter-Ministerial Task Force
IPFA International Project Finance Association
JNNURM Jawaharlal Nehru Urban Renewal Mission
LOI Letter of Intent
MOF Ministry of Finance
MOUD Ministry of Urban Development (India)
MOEF Ministry of Environment & Forests (India)
MNES Ministry of Non-Conventional Energy Sources (India)
MOA Ministry of Agriculture (India)
MSWM Municipal Solid Waste Management
MRTS Mechanised Refuse Transfer Station
MT Metric Tones
NGO Non-Government Organisation
NUSP National Urban Sanitation Policy
NPV Net Present Value
O&M Operations & Maintenance
PFI Project Finance Initiative
PPP Public Private Partnership
PIM Project Information Memorandum

GoI-ADB-PPP Initiative Improving delivery of MSWM services in India through PPPs
Volume I – Overview and Process 7
PIOP Project Implementation & Operations Plan
RFQ Request for Qualification
RFP Request for Proposal
RDF Refuse Derived Fuel
RMU Risk Management Unit
SPCB State Pollution Control Board
SLNA State Level Nodal Agency
SPV Special Purpose Vehicle
TA Technical Assistance
TPD Tones per Day
TCLP Toxicity test for leachates
ULB Urban Local Body
UIDSSMT Urban Infrastructure Development Scheme for Small and Medium Towns
UNFCCC United Nations Framework Convention on Climate Change
VGF Viability Gap Funding

GoI-ADB-PPP Initiative Improving delivery of MSWM services in India through PPPs
Volume I – Overview and Process i
Executive Summary
The Asian Development Bank (ADB) retained ICRA Management Consulting Services Limited (IMaCS) to
develop this Toolkit for implementation of Public Private Partnerships (PPPs) in Municipal Solid Waste
Management (MSWM) sector. The toolkit has been prepared on behalf of the Ministry of Urban Development
Government of India (MOUD) and is supported under the Government of India-ADB led initiative, jointly
undertaken with the Department of Economic Affairs Ministry of Finance Government of India (DEA) for
mainstreaming Public Private Partnerships (GoI-ADB-PPP initiative) across infrastructure sectors.
The Toolkit aims to facilitate a better understanding of applicability of potential PPP models in the context of
the issues and challenges faced in the MSWM sector and to provide a step-by-step approach for identifying,
evaluating and implementing PPP projects in the MSWM sector. A rapid assessment of the sector, covering
recent policy developments in the sector, compilation of case studies of select PPP case studies in India and a
review of the baseline scenario in select satellite towns to explore scope for application of PPP models
suggested in this toolkit, was undertaken as part of the process of developing this toolkit
MSWM in India – overview, status and challenges
Though Municipal Solid Waste Management is an essential and obligatory function of the Urban Local Bodies,
service levels in MSWM continues to fall short of desired levels. The recent launch of the National Urban
Sanitation Policy (NUSP) and assistance to integrated MSWM projects under the Jawaharlal Nehru National
Urban Renewal Mission (JnNURM) and the Urban Infrastructure Development Scheme for Small and Medium
Towns (UIDSSMT) have triggered much needed momentum in a sector that is critical to improvement in overall
urban hygiene, but continues to be a relatively neglected and un-attended space. Even though Policy
interventions by Government of India in this sector can be traced to as early as 1960s (the Government of
India through the Ministry of Food and Agriculture provided loans for composting of solid waste), focused
policy attention in the sector followed the plague epidemic in Surat in 1994, when the J.L. Bajaj Committee,
constituted in 1995 made wide ranging recommendations including waste segregation at source, primary
collection, levy of user charges, use of appropriate equipment and vehicles, focus on land filling and
composting, encouraging Private Sector Participation on a pilot basis.
During the same year, the Ministry of Health and Family Welfare initiated a National Mission on Environmental
health and Sanitation, while the Central Public Health Engineering Organisation (CPHEEO) under the MoUD
prepared a draft policy paper that detailed funding issues and requirements for MSWM. The late 1990s also
saw an increase in private role in composting and waste treatment plant and a significant public interest in the
sector as noticed by the large number of Public Interest Litigation relating to MSWM. In the context of the
growing PILs, the Supreme Court set up a Committee under the chairmanship of Mr. Asim Burman with
members drawn from municipal corporations, Ministry of Environment and Forests Government of India
(MoEF) and MoUD. This Committee submitted its report in March 1999 and covered wide-ranging
recommendations on institutional, financial, health and legal aspects. A key recommendation of this report
was to enable Private Sector Participation. In addition to being a potential source of funding, the rationale for
PSP included benefits such as cost savings and improvement in efficiency and effectiveness in service delivery.
PSP was also seen as a means to access new technologies.
The Municipal Waste (Management and Handling Rules) were notified by the MoEF in September 2000 making
it mandatory for ULBs to improve their waste management systems envisaged in the rules in a timeframe
ending 31st December 2003. While these rules have set in motion a number of activities relating to MSWM,
service levels in the sector continue to be below par.
GoI-ADB-PPP Initiative Improving delivery of MSWM services in India through PPPs
Volume I – Overview and Process ii
Apart from the above, a range of other GoI initiatives to support SWM and PPP in SWM were introduced
including the Bio-medical Waste Handling Rules, 1998, the development of a Technical Manual on MSWM, the
setting up of a Technology Advisory Group on MSWM, the Inter-Ministerial Task Force on Integrated Plant
Nutrient Management from city compost, the permissions for issue of Tax Free Bonds by ULBs, Income tax
relief to waste management agencies, overarching guidelines for PSP, introduction of commercial accounting
system in ULBs and other such sector reforms, development of Model Municipal Bye-Laws and making
available financial assistance under various packages/schemes including the 13th Finance Commission grants.
Under JNNURM, ULBS have to implement obligatory reforms, one of which is to encourage PPPs. Accordingly,
while appraising the SWM projects, the MoUD has sent an advisory to all the State Government wherein it had
been advised that the ULBs should explore the possibility of including PPP in SWM projects and also involve
NGOs/CBOs/RWAs in planning, implementation and Operation and Maintenance of SWM services.
With rapid urbanisation and economic growth and an increase in per capita waste generation, annual
municipal solid waste generation is estimated to grow more than five-fold from the current level of 70 million
tons to reach 370 million tons by 2030 (source; McKinsey Global Institute). Even though the quantity of waste
generated is expected to grow significantly, service levels in the MSWM space continue to be below par. The
major gaps exist in the coverage of collection services, scientific processing and disposal of the waste. The
issues and challenges in the sector are outlined below:
Institutional and financing policy related issues include
o Low investment requirement in MSWM leads to “low priority” by urban local bodies
o Coping informal solutions in waste disposal – rag picking and socio-economic implications resulting in
loss of recyclables and low calorific value.
Policy related challenges include
o Not in my backyard (NIMBY) phenomenon – land acquisition is major issue in SWM projects and is a
major cause of delay; especially in processing & landfill facilities
o Developing ‘Regional’ approach to processing & disposal for smaller cities is a logical solution, but lack
of institutional ownership for the same means very few such initiatives have actually happened
o Lack of willingness to charge user fees – provisions in Municipal Acts for levy of user charges
Awareness/perception related – hard held perceptions on issues like source segregation is not practical,
PPPs cannot be implemented in case of existing large workforce at urban local bodies etc.
Project development related challenges include –
o Need to develop SWM Master Plan considering PPP options as an Integrated rather than Standalone
system – Generally PPP is an after-thought once the master plan/DPR for SWM is prepared. Also
disposal points should be identified in Master Plan
o Transition phase to be defined comprehensively in the contract documents – with focus on both
manpower relocation/absorption in PPP activities and physical assets/equipment/vehicles handing
over.
o Contractual issues like fluctuating and volatile fuel costs (justify a fuel related escalation clause in
agreement), weak information baseline; particularly on quality and quantity of waste, and lesser
contract period for collection & transportation component <=5 years leading to constraint to bring-in
new equipment/vehicles.

GoI-ADB-PPP Initiative Improving delivery of MSWM services in India through PPPs
Volume I – Overview and Process iii
PPPs in MSWM – Experience so far
The role and intervention of private sector in municipal solid waste management is growing rapidly in the
country. The initial attempts of large-scale private sector participation kicked off sometime during mid-1990s
in few progressive metro cities like Chennai, Hyderabad etc., aimed at achieving operational efficiency gains
with managerial capability of private sector, however it was limited to specific components of collection,
transportation and road sweeping in the entire MSWM value chain.
During late-1990s, the urban local bodies (ULBs) gradually realised the imperatives of processing/recycling
solid waste to reduce the burden on landfills. This along with notification of MSW Rules (Management &
Handling) 2000, making waste processing and development of sanitary landfill mandatory, resulted in spurt of
initiatives by urban local bodies of even tier II cities apart from metros for establishment of processing facilities
and engineered sanitary landfills. This was majorly driven with private sector participation due to technical,
financial and managerial constraints at ULBs level and led to an increased involvement of private operators
during mid-2000 with successful implementation of public private participation (PPP) projects in the
components of waste processing, sanitary landfill and closure of existing dumpsites.
More recently in the late-2000, it has been observed that there is traction in the large private sector
companies to invest and manage projects on primary collection & transportation, which was earlier limited to
local contractors only. Moreover, few integrated projects have also been successfully developed on PPP
formats including integrated processing & disposal as in the cities of Coimbatore, Bangalore, Chennai, Delhi,
Kolkata, and Ahmadabad and also integrated MSWM system for entire value chain to a single private operator
as in the cities of Guwahati and Hyderabad. There are many successful implemented projects in MSW sector in
the country on PPP format as outlined in the table below:
S. No Services on PPP PPP Projects in India
1 Door-to-door Collection Bangalore, Ahmadabad, Nagpur, Jaipur, North
Dumdum, Gandhinagar, Delhi
2 Street Sweeping Surat, Hyderabad
3 Storage and Transportation Surat, Ahmadabad, Mumbai, Delhi
4 Integrated Treatment & Disposal Delhi, Bangalore, Coimbatore, Kolkata, Chennai,
Ahmadabad, Chennai
5 Integrated primary collection, street sweeping,
storage and transportation
Chennai
6 Integrated MSWM (complete value chain) Guwahati, Hyderabad
Emerging PPP models for MSWM
The table below captures the typical scope of activities and implementation frameworks that have been
prevalent in the MSWM space till date. It has been observed that for the component of primary collection and
transportation, there is a gradual transition from smaller duration service contracts of 2-3 years to longer
duration concessions of more than 7 years in large cities. This has resulted in private player investing and
bringing in new equipment and vehicles for the projects and improving the service delivery for the provision of
SWM services. For technology intensive components like processing/recycling and development of engineered
sanitary landfill, larger concession ranging from 15-25 years exists in many Indian cities.

GoI-ADB-PPP Initiative Improving delivery of MSWM services in India through PPPs
Volume I – Overview and Process iv
Gradually, contracts are also designed such as to give greater flexibility to the private sector in selecting and
implementing the relevant technology to have better commercial realisations while in compliance with all
applicable rules and standards. Further in few select cities like Guwahati and Hyderabad, there was an attempt
to structure and develop an end-to-end integrated solid waste management system, with a single private
operator having a complete responsibility for the entire value chain starting from primary collection, storage,
transportation, processing and disposal. Such projects require relatively higher investments by the private
operator and are designed accordingly for longer concessions in the range of 25-30 years.
S. No Scope of services PPP Format
1 Primary Collection & Transportation Management contracts/Concession
2 Street Sweeping Service contracts
3 Construction/Maintenance of Community Bins Separate EPC and O&M Contract
4 Design, development, operations & maintenance
of processing and treatment facility for MSW
BOT and its variance and/or O&M Contract
5 Design, development, operations & maintenance
of sanitary landfill site.
BOT and its variance and/or DFBOT and/or
Separate EPC and O&M Contract
Key take-away from select PPP cases
1. Pressing need to formulate structured ICE (information, communication, and education) activities to
involve community of informal workers (rag-pickers), residents etc. and internal stakeholders like sanitary
workers, employees. This is crucial to overcome apprehensions on job insecurity/re-structuring among
workers/employees and helps in smooth implementation/transition of activities to the private player.
Further, it can be supplemented with separate policy on community participation like in the case of
Guwahati, where in a separate Guwahati Waste Management Society was created involving rag-pickers,
residents, RWAs, NGOs etc. for primary collection of the waste.
2. Political championing is necessary for successful PPPs: for instance the first attempt to privatize collection
& transportation activities in Chennai received concurrence from all stakeholders as the Mayor steered
clear the rationale for the privatization of MSWM services to the corporation council and passed a council
resolution approving the privatization of MSW services.
3. Need for well-defined transition process/duration – it is imperative to initiate steps in developing “service
handover management competencies”, else it can lead to complete failure of adequate service delivery
during the transition period - as in the case of transition between CES Onyx to Neel Metal Fanalca in
Chennai.
4. Land acquisition is critical for the success of PPP projects; as in the case of Bangalore processing facility,
the BBMP could provide only ~50 acres against contracted 100 acres for the project facilities, resulting in
implementation delay and sub-capacity processing installation of 250 TPD against 600 TPD envisaged
initially.
5. Need to provide flexibility in technology selection to private operator - focus on outcome based indicators
rather than input based factors. The idea to stringently follow Detailed Project Reports (DPRs) for project
implementation sometimes significantly constrained the probable usage of innovative technologies which
may result in higher commercial benefit realization.
6. Waste quantity and quality are determining factors for success of any technology relating to processing of
MSW. Generally it has been observed that few progressive municipalities take the obligations of providing
minimum assured quantity to the processing facility, but, has been successful in few cases like Rajkot.
Mostly, despite assurance, the contracts provide inadequate provisions for commensurate penalization to

GoI-ADB-PPP Initiative Improving delivery of MSWM services in India through PPPs
Volume I – Overview and Process v
the municipalities resulting in sub-optimal operating capacity, thus impacting the commercial viability of
the project. This may be overcome with stringent penalties and/or making private player involved in the
secondary transportation of MSW from specified locations/transfer stations.
7. There is a need for private players to provide for better customized technologies for screening and
segregation of MSW into wet and dry waste to achieve quality processing output like compost, RDF,
pallets, power, eco-bricks etc. For instance in the case of Rajkot, initial experiments led to establishment
of the by-products and their quality in line with market requirements which resulted in sustained
operations with desired returns.
PPP project development process
The profiled select PPP cases in MSWM suggest that in order to contribute to efforts for improving service
delivery performance in a sustainable manner through PPPs, a structured and systematic approach and
rigorous preparatory efforts are critical. The complete process of implementing PPP for the provision of
MSWM services involves 5 (five) steps of project development namely; (i) Needs Assessment, (ii) Feasibility
evaluation , (iii) Scoping and Structuring and (v) Procurement to identify a preferred private service operator
for the proposed project.
The starting point in the project development is to conduct a situational analysis covering an assessment on
the waste Inventorisation including; quantum of MSW generated and quality of MSW (waste composition,
physical and chemical characteristics), followed by a detailed assessment of the existing municipal solid waste
management system to identify the gaps in the service delivery across value chain.
It is imperative for a successful PPP project that the urban local bodies shall at the initial stages of project
preparation and project structuring consult with all key stakeholders such as public /or project users,
community groups and associated NGOs, private operators, financial institutions, political representatives, and
other government organisations etc. Such public and stakeholder consultations shall bring out the concerns,
apprehensions and acceptance of various stakeholders on the project and the ULB should endeavour to build
into the project preparation process the result of such consultations so that the project structure or
performance parameters could be modified to address their concerns and interest.
Based on the above analysis, the ULB should define key output parameters and performance indicators that
need to be achieved.
The next phase is to establish the commercial viability of the identified project, to determine if the project
offers attractive returns on the investment. This is imperative to establish as the outcomes of the assessment
would assist in determining, if any viability gap funding (VGF) either in terms of capital grants/subsidy and/or
additional revenue grant/subsidy is required to make the project viable for a private sector participation, or
the project is viable of its own with the probable revenues stream associated with the project.
The financial viability analysis would be followed by a qualitative assessment of the rationale and pre-
requisites for implementing the proposed project on a PPP format. Depending on the prevailing conditions, an
ULB may choose to implement part of the MSWM solution envisaged through public funding. It is therefore
critical to scope out the parts of the MSWM value chain that is appropriate for implementation through a
Public Private Partnership.
Upon establishing the financial viability of the identified project for the provision of MSWM services along with
the need/scope of services envisaged under a PPP, the next logical step is to determine an appropriate project
structure for implementation and monitoring of the project on PPP route. This involves identification and
GoI-ADB-PPP Initiative Improving delivery of MSWM services in India through PPPs
Volume I – Overview and Process vi
allocation of key obligations and risks (including design/construction risk, operation risk, revenue/demand risk,
environmental/regulatory risk, force majeure risk) between the private operator and the ULB, based on the
party that is best equipped to deal with each of these specific risks. Appropriate project structuring should also
ensure that the service obligations and output requirements expected from the project are adequately defined
without ambiguity along with the measures to deal with non-compliance or default vis-à-vis adhering to these
obligations.
The last phase in project development is the procurement process involving shortlisting of capable private
operators through a combination of appropriate technical and financial criteria and conducting a bid on the
basis of standard bidding documents. A two-stage bidding process namely a) Shortlisting based on Applications
received on the basis of a Request for Qualification (RFQ) which is done typically on the basis of a combination
of Technical and Financial Criteria b) Selection based on responses to a Request for Proposal (RFP) issued to
shortlisted bidders. In some cases, ULBs may choose to adopt a single stage process covering shortlisting and
selection through a composite RFP. In general the choice of procurement method depends on the ULB budget
& capacity, expected level of competition, end objectives of the PPP intervention etc.
However, an efficient, transparent and well contested procurement process leading to selection of a capable
and competitive private operator is critical to ensure efficient and competitive price discovery and effective
project implementation.
Pre-requisites for successful PPPs in MSWM
The public–private partnerships (PPPs) are generally considered as an alternative to full privatization in which
government and private companies assume co-responsibility and co-ownership for the delivery of particular
services. Through these partnerships, the benefits of the private sector—dynamism, access to finance,
knowledge of technologies, managerial efficiency, and entrepreneurial spirit—are combined with the social
responsibility, environmental awareness, local knowledge and job generation concerns of the public sector.
PPPs could offer the best of both sectors, and one may believe that such alliances are naturally inclined to
form. However, for a successful partnership to nurture certain enabling environment /or pre-requisites are
necessary to foster trust and working relationship as outlined below:
Political championing is imperative for PPPs in urban services – the foremost factor for a successful
intervention of private sector is the concurrence and continued support of the political representatives.
Historically privatization has widespread political ramifications such as opposition from labour unions and
ideological opposition from political parties as the provision of MSWM services has traditionally been the
domain of public sector. For the PPP option to be implemented successfully, it is important that there is a
consensus among the political representatives regarding contracting out of the services to the private
operator with a clear understanding on the project benefits and its impact on various strata of the society.
Communication and stakeholder involvement – other key element is creating awareness on the pros of
private sector intervention in the provision of MSWM services. Hence, the need to formulate a clear
communication, information, and education strategies to create such awareness among residents and
other stakeholders. The lack of a clearly articulated communications strategy in place poses significant
risks to any PPP, and this has been amply evidenced from water sector PPPs in India and elsewhere, and
these experiences also apply to SWM PPPs. As such, the importance of putting in place clearly defined
strategies for this at the formative stages of any PPP cannot be overstated.
Legal capacity of urban local bodies to contract out – it is equally crucial to determine the legal capacity of
a particular urban local body to engage directly with a private operator for provision of MSWM services.
This may require clear understanding of the procedural issues on the kind of approvals required at various

GoI-ADB-PPP Initiative Improving delivery of MSWM services in India through PPPs
Volume I – Overview and Process vii
levels of the hierarchy and also at the state level before initiating exercise to involve private sector
participation
Overall competition in the market – to gain overall efficiency on the process & cost parameters, it is
imperative to have a healthy competition in the market in terms of substantial number of private
developers in the market who have the skills and the financial wherewithal to provide the solid waste
management services efficiently. The existence of multiple players in the market enables urban local
bodies to acquire best of the technical expertise at competitive expense.
Ring fencing operating and financial information – the availability of good quality baseline information on
quantity and quality of waste generation is imperative for designing an effective service delivery
mechanism so as to have full utilisation of the resources employed for the provision of services.

GoI-ADB-PPP Initiative Improving delivery of MSWM services in India through PPPs
Volume I – Overview and Process 1
1. Introduction
1.1 Background
An essential and obligatory function of Urban Local Bodies (ULBs), service levels in Municipal Solid Waste
Management (MSWM) continue to pose a number of challenges. Even as the quantity of waste generated is
estimated to grow more than five times from the present level of 70 million tonnes annually to about 370
million tons in 2030, service levels in MSWM continue to be below par. Less than 70% of the waste generated
daily is estimated to be collected and a very small portion of the waste generated undergoes processing.
Dumping continues to be the prevalent mode of disposal and sanitary landfills are yet to be mainstreamed.
The Ministry of Urban Development (MoUD), Government of India has initiated a number of steps to address
policy, capacity building and financing challenges that are faced by ULBs. It recognises Public Private
Partnerships (PPP) as an important element to improve service delivery in Municipal Solid Waste Management
(MSWM), apart from bringing in external investment and requested the Asian Development Bank (ADB) for
technical assistance in developing a toolkit for guiding PPP initiatives in MSWM.
The Asian Development Bank (ADB) retained ICRA Management Consulting Services Limited (IMaCS) to
develop this Toolkit for implementation of Public Private Partnerships (PPPs) in Municipal Solid Waste
Management (MSWM) sector. The toolkit has been prepared on behalf of the Ministry of Urban Development
Government of India (MOUD) and is supported under the Government of India-ADB led initiative, jointly
undertaken with the Department of Economic Affairs Ministry of Finance Government of India (DEA) for
mainstreaming Public Private Partnerships (GoI-ADB-PPP initiative) across Infrastructure sectors.
The Toolkit aims to facilitate a better understanding of applicability of potential PPP models in the context of
the issues and challenges faced in the MSWM sector and to provide a step-by-step approach for identifying,
evaluating and implementing PPP projects in the MSWM sector. A rapid assessment of the sector, covering
recent policy developments in the sector, compilation of case studies of select PPP case studies in India and a
review of the baseline scenario in select satellite towns to explore scope for application of PPP models
suggested in this toolkit, was undertaken as part of the process of developing this toolkit
1.2 Scope of Work
The scope of work for this exercise is to assist MoUD to develop a Tool Kit to facilitate ULBs in identification
and development of Public Private Partnership projects in Municipal Solid Waste Management. The Terms of
Reference for the exercise included the following:
8. Prepare case studies of 10 awarded/operational PPP projects including 2 International PPP projects in
MSWM to distil the learnings from on-going and/or past efforts for PPP interventions in the MSWM space,
covering the following
a. Underlying context and scope of PPP.
b. Project development process covering identification, concept development, feasibility evaluation,
structuring, bid process and monitoring stages
c. Bid process, pre-qualification dimensions, bidding variable and documentation.
d. Observations on risk allocation, obligations (of Private operator and ULB), service levels, revenue &
cost models, penalties and/or incentive, and dispute resolution.
GoI-ADB-PPP Initiative Improving delivery of MSWM services in India through PPPs
Volume I – Overview and Process 2
9. Evolve specific policy guidelines for PPPs in MSWM following a review of MSW rules 2000 and CPHEEO
manual on SWM and learning from the PPP projects profiled. These would cover any additions to PPP
policy and law, institutional framework for PPPs, stakeholder consultations.
10. Prepare a process toolkit for developing PPPs in MSWM covering project inception and pre-feasibility
analysis, risk identification, allocation/mitigation, project, ToR for detailed feasibility evaluation and
transaction advisory support. This would cover description of steps and illustrative checklists for activities
listed above, in the context of MSWM projects.
11. Review the baseline status of MSWM in select 8 (eight) “Satellite Towns” in the country covering
assessment of institutional mechanisms, existing infrastructure for the provision of MSWM services,
financial indicators & service level benchmarks, and suggest options for implementation through PPP,
wherever feasible.
12. Develop model templates for PPP in MSWM across the generic PPP options (viz., service contracts,
management contracts, Build-Operate-Transfer) tailored to MSWM scope and requirements (viz.,
collection & transportation, waste processing, integrated waste processing & disposal, integrated MSWM
system). This will include:
a. Description of PPP model and salient features of the Contract covering obligations of ULB and Private
Operator, risk identification and allocation.
b. Model templates for the Bid process including generic Request for Qualification/Proposal, financial
analysis and cost-benefit assessment and identification and listing of risks.
13. Conduct a half-day workshop in Delhi in collaboration with MoUD and ADB to facilitate consultations with
select stakeholders for dissemination and adoption of the Toolkit.
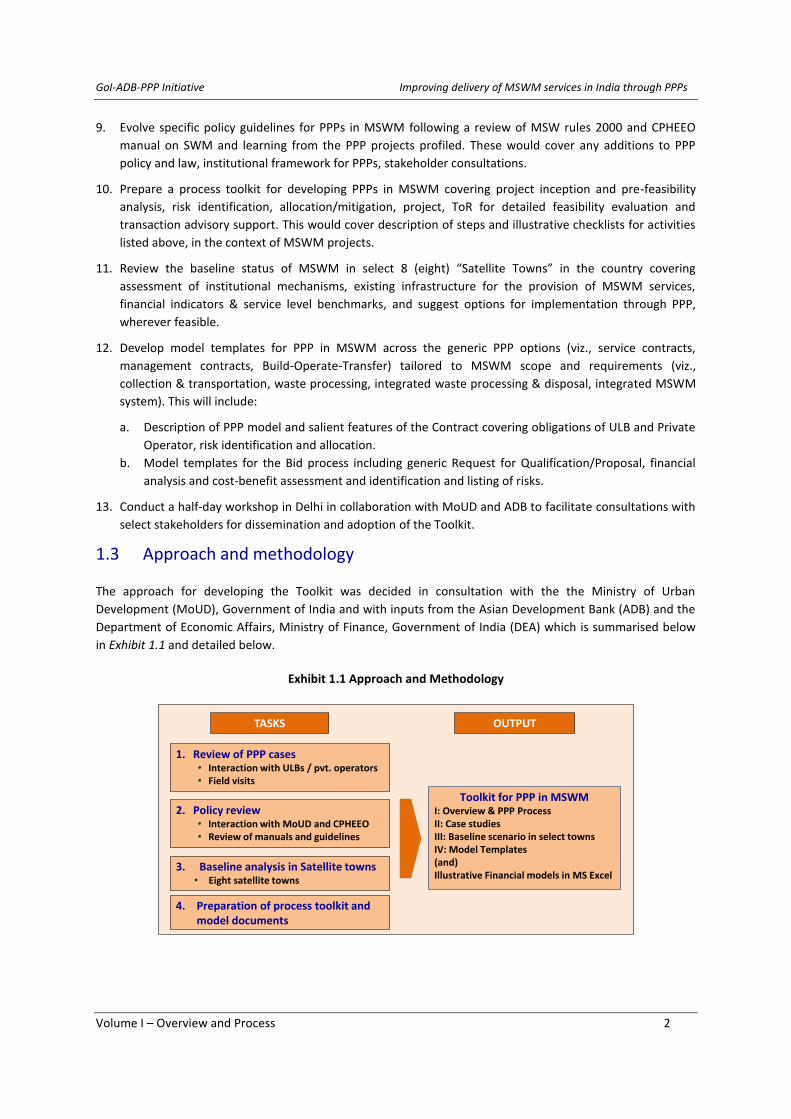
1.3 Approach and methodology
The approach for developing the Toolkit was decided in consultation with the the Ministry of Urban
Development (MoUD), Government of India and with inputs from the Asian Development Bank (ADB) and the
Department of Economic Affairs, Ministry of Finance, Government of India (DEA) which is summarised below
in Exhibit 1.1 and detailed below.
Exhibit 1.1 Approach and Methodology
OUTPUT
Toolkit for PPP in MSWMI: Overview & PPP Process II: Case studies III: Baseline scenario in select townsIV: Model Templates (and)Illustrative Financial models in MS Excel
2. Policy review • Interaction with MoUD and CPHEEO• Review of manuals and guidelines
TASKS
1. Review of PPP cases• Interaction with ULBs / pvt. operators• Field visits
3. Baseline analysis in Satellite towns• Eight satellite towns
4. Preparation of process toolkit and model documents
GoI-ADB-PPP Initiative Improving delivery of MSWM services in India through PPPs
Volume I – Overview and Process 3
The preparation of toolkits involved a review of 10 PPP case studies in MSWM and a review of policy guidleines
and manuals issued by MoUD apart from a baseline analysis of MSWM scenario in eight satellite towns and
involved the following activities:
1. Periodic discussions with ADB team and MoUD: The toolkit has been prepared after extensive
consultations and discussions with PPP experts from MoUD and ADB. Comments and suggestions from
MouD and ADB were received and incorporated while finalising each volume of the toolkit.
2. Interaction with MoUD and CPHEEO on policy matters: The team also met officials of CPHEEO (The
Technical Wing of Ministry of Urban Development, Government of India) for insights on the technical
aspects in the MSWM sector for discussions on policy related issues for engaging private service providers
in MSWM services in the country. Relevant documents including; (i) MSW Rules 2000, (ii) CPHEEO manual
on solid waste management, (iii) Report of the Technology Advisory Group on solid waste management,
and (iv) Report of Inter-Ministerial Task Force on Integrated Plant Nutrient Management were reviewed to
gain insights on various aspects of municipal solid waste management in the country.
3. Review of PPP case studies: The compilation of case studies of PPP projects in MSWM was done following
field visits to respective ULBs, interaction with officials and select private operators. In addition, all
relevant documents provided by the ULBs including City Development Plans, Detailed Project Reports, bid
documents like Request for Qualification/ Proposal and PPP contract agreements were also reviewed
while putting together these case studies.
Fact finding and analysis from these three activities formed inputs for finalisation of the Process toolkit,
Compilation of PPP case studies and Preparation of model documents, which are organised in Volumes I, II
and III of the toolkit respectively.
4. Analysis of Baseline scenario in Satellite towns: At the request of MoUD, a baseline analysis of MSWM
scenario in select Satellite Towns was undertaken to explore possible application of the PPP models
suggested as part of this toolkit. This involved field visits to the respective ULBs that covered a) fact-
finding on waste inventorisation, existing MSWM system, prevailing service level benchmarks and
compliance with MSW Rules, financial indicators focusing on cost recovery aspects and financial health of
the ULB and b) discussions with SWM officials on issues faced, future plans & potential scope for PPP
intervention in MSWM in their respective towns. Based on the discussions, a report on the baseline status
of MSWM services prepared for each of these towns along with preliminary assessment of possible PPPs
that could be undertaken.
5. Presentation to ADB and MoUD: The toolkit has been finalised after a final presentation to MoUD and
ADB in November 2010 and is envisaged to be disseminated formally through a ULB-level workshop that
will be conducted by ADB and MoUD in February 2011.
1.4 Toolkit Content and Intended Users
The Toolkit is organised in four volumes as described below:
Volume I Overview and Process provides an overview of the toolkit and describes the process for
identifying and implementing PPP projects in the MSWM. It provides a structured approach for project
identification, conducting project and financial feasibility, and choosing from a variety of PPP options and
structures for activities across MSWM value chain depending on the context.
Volume II Case studies of awarded PPP projects: This volume presents case studies of select PPP projects
in the MSWM sector in India and internationally and covers details on the need for PPP intervention,

GoI-ADB-PPP Initiative Improving delivery of MSWM services in India through PPPs
Volume I – Overview and Process 4
project benefits, bid process followed, obligations and risk sharing among private developer &
government agency, important contractual features and key lessons for replication.
Volume III Baseline analysis in Satellite Towns: This volume analyses the baseline status of MSWM
services, reviews the existing SWM system and gaps, identifies key issues and required investments and
analyses possible options for implementing PPP projects in these selected satellite towns.
Volume IV Model Templates: This volume is a compilation of model bid documents and covers templates
for a) Request for Qualification (RFQ), b) Request for Proposal (RFP), c) Project Information Memorandum
(PIM) and d) Term Sheets for 5 PPP models including; (i) Integrated MSWM (ii) Waste Processing and
Disposal System, (iii) Waste Processing; (iv) Collection, transportation and disposal, and (v) Mechanized
Refuse Transfer Station. A financial model for analysing integrated solid waste management system is
being submitted along with the Toolkit.
Contents of Volume I
Chapter 2 PPP in MSWM status issues and challenges provides an overview of the MSWM sector in India in
terms of MSWM value chain, policy initiatives and institutional framework. It then traces the trends in PPPs in
MSWM till date and summarises key findings and lessons from the 8 PPP case studies profiled in Volume II of
this Toolkit. Chapter 3 PPP Project Development Process briefly introduces the steps in conceptualising and
developing PPP projects in MSWM, namely a) Needs Analysis, b) Feasibility Evaluation, c) Scoping and
Structuring and d) Procurement. Each of these steps is then discussed in detail in Chapters 4-7.
This Toolkit has been prepared from the perspective of an Urban Local Body and is intended as a high-level
guide for Practitioners and project developers that seek to develop, structure and implement PPP projects in
MSWM at the ULB level. This Manual has three primary audiences: a) Practitioners responsible for
implementing PPP projects at the local and state government level, b) Policy makers responsible for
conceptual clarity on PPPs and for developing sector level PPP programs and c) the support eco-system of
Transaction advisors and other agencies that work with Practitioners and policy makers in conceptualising and
implementing PPPs in the MSWM sector.
The Toolkit has been prepared based on a variety of sources as described earlier and recognises the inherent
capacity limitations and information availability constraints faced at the ULB level. Further, while the toolkit
provides a generic process approach to implement PPPs and complements this with a set of useful model
templates, it recognises the need to fine-tune these while applying them to a specific project context in the
context of the level of heterogeneity that prevails in the MSWM sector in India. In the context of the dynamic
and evolving nature of the PPP landscape and complex nature of issues confronting the MSWM sector in India,
this document definitely provides a useful starting point and would need to be reviewed periodically to keep
the content relevant.

GoI-ADB-PPP Initiative Improving delivery of MSWM services in India through PPPs
Volume I – Overview and Process 1
2. PPP in MSWM – status, issues and challenges
2.1 The MSWM Value chain
Exhibit 2.1 below outlines the broad value chain for Municipal Solid Waste Management (MSWM) services. As
shown the entire value chain can be unbundled into various components, including source segregation,
collection, transportation, cleaning & sweeping, secondary storage, processing and disposal.
Exhibit 2.1 MSWM Value Chain*
*This value chain is mostly followed in cities with decentralized processing facilities. However, in case of an integrated processing and disposal system, the waste transportation component after processing would not appear as a separate activity in the value chain and tends to get handled in an integrated fashion.
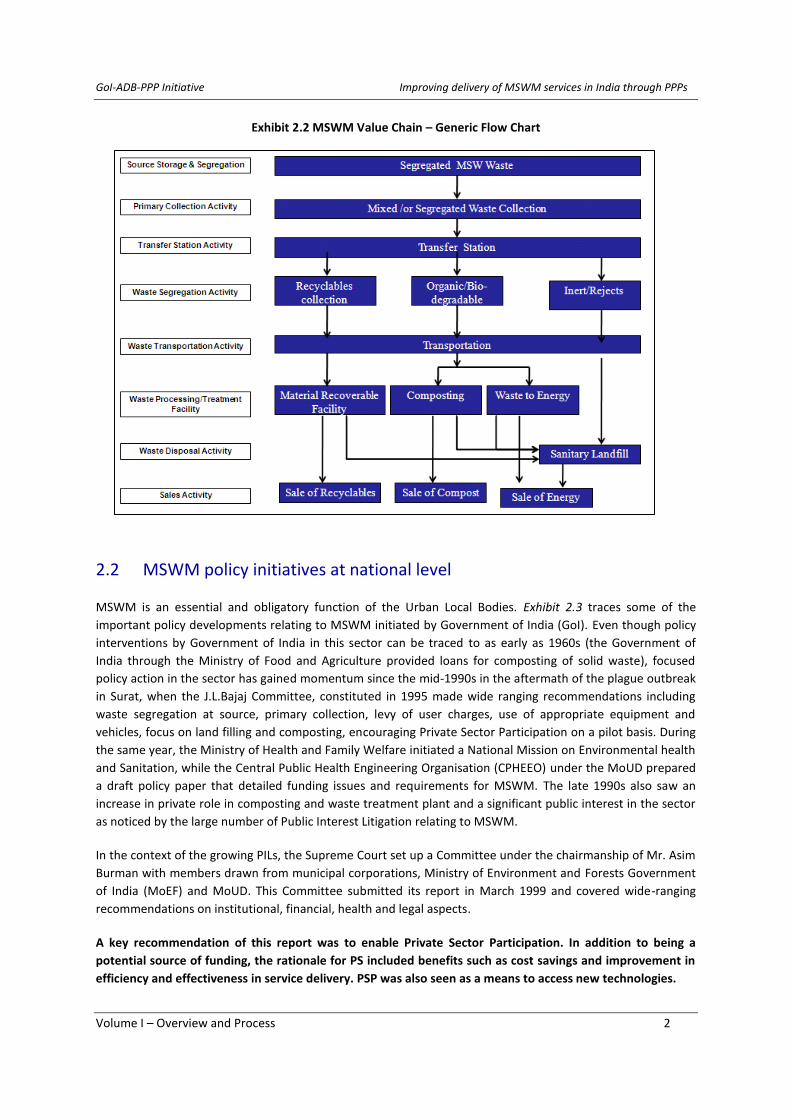
Further, the generic value chain for MSWM services can also be presented in line with the different types of
waste (organic/recyclable/inert) that is present in the municipal solid waste. Exhibit 2.2 outlines the generic
flow chart of activities for handling different types of waste. As highlighted, waste segregation activity is crucial
to separate organic waste from recyclable and inert components. Subsequently, the organic waste is
transported to the processing facility which can either be composting /or waste to energy facility and the by-
products such as compost, power as the case may are finally sold. The recyclable waste is usually sent to the
material recoverable facility and then finally sold. However, the inert/rejects from the MSW are sent directly
to the sanitary landfill for final disposal.
It has been observed that there is a lack of proper MSWM services in the country primarily due to reasons
including; financial constraints of ULBs, institutional problems within the departments, fragile links with other
concerned agencies, lack of suitable staff, and other allied problems. Mostly, expenses towards MSWM are
met from the general budget and allocation from Property taxes. Very often, funding for operations and
maintenance relating to provision of MSWM services is not earmarked and properly budgeted for.
Source Storage & Segregation
Collection &Transportation
SecondaryStorage
Waste Processing
Waste Transportation
Safe Disposal
GoI-ADB-PPP Initiative Improving delivery of MSWM services in India through PPPs
Volume I – Overview and Process 2
Exhibit 2.2 MSWM Value Chain – Generic Flow Chart
2.2 MSWM policy initiatives at national level
MSWM is an essential and obligatory function of the Urban Local Bodies. Exhibit 2.3 traces some of the
important policy developments relating to MSWM initiated by Government of India (GoI). Even though policy
interventions by Government of India in this sector can be traced to as early as 1960s (the Government of
India through the Ministry of Food and Agriculture provided loans for composting of solid waste), focused
policy action in the sector has gained momentum since the mid-1990s in the aftermath of the plague outbreak
in Surat, when the J.L.Bajaj Committee, constituted in 1995 made wide ranging recommendations including
waste segregation at source, primary collection, levy of user charges, use of appropriate equipment and
vehicles, focus on land filling and composting, encouraging Private Sector Participation on a pilot basis. During
the same year, the Ministry of Health and Family Welfare initiated a National Mission on Environmental health
and Sanitation, while the Central Public Health Engineering Organisation (CPHEEO) under the MoUD prepared
a draft policy paper that detailed funding issues and requirements for MSWM. The late 1990s also saw an
increase in private role in composting and waste treatment plant and a significant public interest in the sector
as noticed by the large number of Public Interest Litigation relating to MSWM.
In the context of the growing PILs, the Supreme Court set up a Committee under the chairmanship of Mr. Asim
Burman with members drawn from municipal corporations, Ministry of Environment and Forests Government
of India (MoEF) and MoUD. This Committee submitted its report in March 1999 and covered wide-ranging
recommendations on institutional, financial, health and legal aspects.
A key recommendation of this report was to enable Private Sector Participation. In addition to being a
potential source of funding, the rationale for PS included benefits such as cost savings and improvement in
efficiency and effectiveness in service delivery. PSP was also seen as a means to access new technologies.

GoI-ADB-PPP Initiative Improving delivery of MSWM services in India through PPPs
Volume I – Overview and Process 3
Exhibit 2.3 MSWM - Important Policy landmarks and funding initiatives of GoI
Source: IMaCS analysis
The Municipal Waste (Management and Handling Rules) were notified by the MoEF in September 2000
making it mandatory for ULBs to improve their waste management systems envisaged in the rules in a
timeframe ending 31st
December 2003. While these rules have set in motion a number of activities relating to
MSWM, as explained in the sections below, service levels in the sector continue to be below par.
Apart from the MSWM Rules 2000, today, there is also a National Urban Sanitation Policy (NUSP) in place
(introduced in late 2008), that broadly covers aspects of urban sanitation, with a specific focus to eliminate
open defecation in the cities and towns and re-orienting institutions for developing and deploying city-wide
approaches to sanitation, covering all its aspects. While MSWM is an important focus area in the NUSP, its
primary focus is that all urban dwellers will have access to and be able to use safe and hygienic sanitation
facilities and arrangements so that no one defecates in the open.
Apart from the above, the GoI has taken a range of initiatives to support SWM and PPP in SWM. These include
the Bio-medical Waste Handling Rules, 1998, the development of a Technical Manual on MSWM, the setting
up of a Technology Advisory Group on MSWM, the Inter-Ministerial Task Force on Integrated Plant Nutrient
Management from city compost, the permissions for issue of Tax Free Bonds by ULBs, Income tax relief to
waste management agencies, overarching guidelines for PSP, introduction of commercial accounting system
in ULBs and other such sector reforms, development of Model Municipal Bye-Laws and making available
financial assistance under various packages/schemes including the 13th Finance Commission grants.
Under JNNURM, ULBS have to implement obligatory reforms, one of which is to encourage PPPs. Accordingly,
while appraising the SWM projects, the MoUD has sent an advisory to all the State Government wherein it had
been advised that the ULBs should explore the possibility of including PPP in Solid Waste Management projects
and also involve NGOs/CBOs/RWAs in planning, implementation and Operation and Maintenance of Solid
Waste Management services such as treatment of the waste through composting facilities, door-to-door
collection, transportation, sanitary landfilling etc.
1998 2000 2005 2006 2008 2009 2010 2012
Bio-medical Waste
handling Rules 1998
MSW (Management & Handling) Rules, 2000
Draft document on E-waste handling
Rules 2010
CPHEEO Manual on MSW 2000
Report of the Technology
Advisory Group 2000
Strategy & Action Plan for the use of Compost in cities
2006
Service Level Benchmarking in MSWM
2008
JNNURM (2005-12) – 40 MSW projects of Rs 2186cr sanctioned so far – 65 cities covered
UIDSSMT (2005-12) – 51 MSW projects of Rs 327cr sanctioned so far – 632 cities covered
12th Finance Commission (2005-10) – Rs 2500cr for 423 Class-I cities 13th FC (2010-15) – Rs 5000cr for Grid connected RE
11th Five Year Plan (2007-12) – Working Group recommended an investment of Rs 2210cr for MSWM
MNES promoting Waste to Energy with subsidy ranging from Rs 1.5cr to Rs 3.0 cr per MW
MOEF & MOA subsidising Compost plants up to 50% of the capital cost
1994-95
Strategypaper by
NEERI
Barman Committee
1998
J.L Bajaj Committee
1994
National Urban
Sanitation Policy 2008

GoI-ADB-PPP Initiative Improving delivery of MSWM services in India through PPPs
Volume I – Overview and Process 4
2.3 Institutional roles and responsibility
MSWM is an essential and obligatory function of Urban Local Bodies. According to India’s constitution, SWM
falls within the purview of the state government. The activities are entrusted to Urban Local Bodies (ULBs)
through state legislations. Municipal Solid Waste Management (MSWM) is a part of public health and
sanitation, and is entrusted to the Civic Bodies for execution as per the respective
Corporation/Municipal/Panchayat Acts. Except in the metropolitan cities where a separate department
headed by an Engineer exists, MSWM is generally the responsibility of a health officer who is assisted by the
engineering department in the transportation work and this activity is mostly labour intensive. Exhibit 2.4
below outlines the responsible institutions for SWM and their broad roles & responsibilities:
Exhibit 2.4 Roles & responsibilities of Institutions in SWM
Responsible institutions Roles and responsibilities in SWM
Government of India and State Governments Make Central/ State-level laws and rules; frame policies;
prepare guidelines, manuals, and technical assistance;
provide financial support; monitor implementation of
laws. and rules. Municipal authorities and state government Plan for MSWM treatment facilities
Municipal authorities Collect, transport, treat and dispose of waste
Municipal authorities with state government approval Frame bylaws; levy and collect fees
Municipal authorities, State and central governments Capital investment in SWM systems
Source: IMaCS analysis
Central Government
At Government of India (GoI) level, the Ministry of Urban Development (MoUD) is responsible for formulation
of broad policies and various programmes and prepare guidelines for urban water supply and sanitation sector
including solid waste management and also supports various SWM projects under the Jawaharlal Nehru
National Urban Renewal Mission (JNNURM) and Urban Infrastructure Development Scheme for Small and
Medium Towns (UIDSSMT) schemes, in addition to playing a facilitative role for capacity building of ULBs. The
MoUD also issues various guidelines for projects/schemes, including those for mandatory reforms under
JNNURM and UIDSSMT, and these include the encouraging PPPs.
The Central Public Health and Environmental Engineering Organization (CPHEEO) is the technical wing of the
Ministry, which assists the Ministry in all technical matters relating to water supply and sanitation sector. In
addition, the Central Pollution Control Board (CPCB) plays a monitoring role by convening meetings of the
Chairperson & Member Secretaries of various State Pollution Control Boards (SPCBs) every year and seek
information in respect of initiatives taken by ULBs for improving collection, segregation, storage and
transportation of waste, setting up landfill facility and compost plants, etc. and review the information
furnished by the various SPCBs.
The Ministry of Environment and Forests (MoEF) is also directly involved, by way of deployment of the
Municipal Solid Waste Management (MSWM) Rules, 2000 (see latter sub-section for details), under the
Environment Protection Act, 1986.

GoI-ADB-PPP Initiative Improving delivery of MSWM services in India through PPPs
Volume I – Overview and Process 5
State Level
The Department of Urban Development of the concerned State or the Union Territory, as the case may be,
has the overall responsibility for the enforcement of the provisions of the MSWM Rules, 2000 in the
metropolitan cities. Many states also now have Project Monitoring Units (PMUs) at the State Level Nodal
Agency (SLNA) to oversee project implementation. Further State Level legislation may also have a bearing on
specific state level frameworks for SWM. However, most state legislation does not cover the necessary
technical or organizational details of SWM. Laws talk about sweeping streets, providing receptacles in various
parts of the city for storage of waste, and transporting waste to disposal sites in general terms, but they do not
clarify how this cleaning shall or can be done.
In addition, the State level Pollution Control Boards (SPCBs) have responsibility to issue an authorization to
municipal authorities or operators of a facility stipulating compliance criteria and standards. It is the
responsibility of SPCB to monitor the compliance of the standards regarding waste processing, ground water,
ambient air/leachate quality and the compost quality including incineration standards as specified in the
schedule of the rules. The SPCB is supposed to examine the proposals of SWM taking into consideration the
views of other agencies including State Urban Development Department, the Town and Country Planning
Department, Airport Authority and Ground Water Board prior to issuance of the authorization.
Additionally, under the directives of the National Urban Sanitation Policy (NUSP) of the MoUD, each state is
expected to develop a comprehensive state strategy for sanitation, including SWM. Further there have been
efforts at the level of states to improve the policy and institutional environment for fostering Public Private
Partnerships. These include:
Central Government Level
MOUD
formulates broad policies for sanitation
sector including SWM
prepares guidelines/benchmarks for SWM
services
supports SWM projects under JNNURM/
UIDSSMT schemes
facilitative role for ULBs capacity building
CPHEEO, technical wing of MOUD:
assists in technical matters on SWM
prepare guidelines like technical manual on
SWM
MOEF
directly involved by way of
deployment of municipal
solid waste management
Rules under the
Environment Protection
Act, 1986
CPCB
plays a monitoring role by
convening meetings of
various members of SPCBs
seek information in
respect of initiatives taken
up by ULBs
review the information
furnished by various
SPCBs.
Department of Urban Development
Secretary-in-charge: Overall
responsibility for the enforcement
of SWM Rules (Management &
Handling), 2000
State Level Nodal Agency (SLNA)
Project Monitoring Units
(PMUs)
State Pollution Control Board (SPCB)
plays a monitoring role &
issues an authorisation to
ULBs/ operators stipulating
compliance standards.
State Government Level

GoI-ADB-PPP Initiative Improving delivery of MSWM services in India through PPPs
Volume I – Overview and Process 6
Enactment of Legislation: Recently, a few states in order to encourage private sector participation have
identified a well-defined regulatory framework. It includes enactment of legislation for clearly defining
the types of infrastructure facilities, the governing authorities, the procedural requirements and the scope
of private sector in execution of these projects. For example, States like Andhra Pradesh have enacted an
Infrastructure Authority Act, which aims to facilitate private developers in securing the mandatory
administrative approvals and lays down the provisions for arbitration and fiscal regulation. It covers all the
infrastructure sectors in the State.
Articulating Policy: Some State Governments such as Karnataka and Orissa have also framed an
infrastructure policy with the aim of adopting a co-ordinated and integrated approach towards
infrastructure development. The policy spells out specific incentives and concessions for infrastructure
projects, including up-gradation of the existing facilities as well as encouraging private investments in the
sector.
Setting up Nodal institutions: Select State Governments have also established nodal agencies which look
after the development and maintenance of infrastructural facilities in the particular State. They have been
set up with the objective of facilitating higher flow of funds into the infrastructure sector; encouraging
private sector participation; removing all the procedural bottlenecks and thus increasing the pace of
implementation of infrastructure projects. For instance, Gujarat and Punjab have set up Infrastructure
Development Boards to promote implementation of infrastructure projects.
Local Government
At the sub-state level, the District Magistrate or the Deputy Commissioner of the concerned district had the
overall responsibility for the enforcement of the provisions of the MSWM Rules, 2000 within the territorial
limits of their jurisdiction.
At the city/ULB level, every municipal authority within the territorial area of the municipality was responsible
for implementation of the provisions of these rules, and for any infrastructure development for collection,
storage, segregation, transportation, processing and disposal of municipal solid waste.
Additionally, for monitoring and management of sanctioned projects of various sectors including SWM under
JNNURM, Project Implementation Units (PIUs) at ULB level have been set up in many states. Nevertheless,
Municipal acts very often do not specify in clear terms which responsibilities belong to the citizens (for
example, the responsibility not to litter or the accountability for storing waste at its source). Moreover, they
do not mention specific collection systems (such as door-to-door collection of waste), do not mandate
appropriate types of waste storage depots, do not require covered waste transport issues, and do not mention
aspects of waste treatment or sanitary landfills.
Other important stakeholders
NGOs/Civil Society: NGOs and civil society/social workers often take lead in forming Ward Committees
and community participation. Networking of similar minded organizations in the area and integrated
efforts may be done by them to avoid duplication of the jobs. The NGOs can use existing contacts with the
Municipality and other influential bodies to ensure maximum support. These organizations can involve
unemployed youth in the area for various jobs such as managing collection of garbage, helping the
organizers in conducting road-shows, etc. They can also organize/sponsor Clean City campaigns. For
instance, CDC, an NGO in Jaipur city has pioneered door-to-door waste collection and covers nearly 50,000
households. Exnora International, another NGO spearheads community initiatives in Chennai and nearby
sub-urban areas and organises rag pickers for systematic door-to-door collection effort.

GoI-ADB-PPP Initiative Improving delivery of MSWM services in India through PPPs
Volume I – Overview and Process 7
Communities and Public: Communities and the Public in general could potentially play a vital role by
practicing sustainable consumption, adopting “R-R-R” (reduce, recycle, reuse) philosophy leading to
reduction and segregation of waste at source. To facilitate this, the MoUD have created a Community
Participation Fund (CPF) under which a community can conceive a project on municipal solid waste and
submit it through the local municipality to the Union Government. Funds to the tune of Rs. 9.5 lakh can be
granted with community contributing 5%, in case of slums and 10% in case of others. However, fifty-one
per cent of voters living in the locality there will have to sign a document indicating their interest and
support to the project. Urban Local Bodies could forward such proposals to GoI. However, there have not
been many takers, and MoUD has not received many proposals under this scheme. So far around 21
projects have been sanctioned under CPF, out of which only 2 are on MSWM for Madurai and Bangalore.
Conservancy workers: Conservancy workers at the local level are an important category of stakeholders. It
is critical that initiatives taken at the ULB level include aspects relating to safety, hygiene and working
conditions of conservancy workers.
Rag Pickers: In the Indian context, rag pickers contribute a great deal in waste management as they
scavenge the recyclable matter thereby saving the municipality of the cost and time of collecting,
segregating and transporting garbage to the dumps. It is estimated that about 60 per cent of plastic waste
gets recycled even in the absence of formal systems for waste collection. However, it is to be noted that
rag pickers operating in an informal nature are often exposed to very poor working and living conditions.
Use of child labour as rag pickers in another serious area of concern. While MSWM efforts and planning by
should leverage the presence of rag pickers, these efforts should also focus on formalising and building
adequate safe-guards for the same.
2.4 Current status and service levels
Even though the quantity of waste generated is expected to grow significantly, service levels in the MSWM
space continue to be below par. With rapid urbanisation and economic growth and an increase in per capita
waste generation, annual municipal solid waste generation is estimated to grow more than five-fold from the
current level of 70 million tonnes to reach 370 million tonnes by 20301. Exhibit 2.5 provides the summary of
findings on performance indicators in Solid Waste Management from a recent Service Level Benchmarking
exercise conducted by MoUD in 27 towns, from which the following insights can be drawn from this exhibit.
1. Coverage: 20 of the 27 cities have a household level coverage of less than 85%, indicating that even at a
basic coverage of SWM, service levels are poor.
2. Collection Efficiency: Collection efficiency is relatively better with an average collection efficiency of 78%
among the cities surveyed.
3. Source Segregation: 12 of the 27 cities had not initiated source segregation and median coverage of
source segregation was only 28%.
4. Waste recovery and scientific disposal: Only Bangalore had a reasonable coverage of scientific disposal
among the cities covered while 13 of the 27 cities did not have any waste recovery at all. Dumping
continues to be the prevalent form of waste disposal.
5. Cost recovery and Revenue Collection efficiency: 10 of the 27 cities did not maintain information on cost
recovery and collection efficiency, indicating lack of appropriate budgetary allocation.
1 McKinsey Global Institute. India’s urban awakening. Building inclusive cities sustaining economic growth. 2010

GoI-ADB-PPP Initiative Improving delivery of MSWM services in India through PPPs
Volume I – Overview and Process 8
Exhibit 2.5 MSWM - Results of SLB exercise conducted by MoUD
HH
Coverage
Collection
Efficiency
Segregation
of MSW
MSW
Recovery
Scientific
Disposal
Cost
Recovery
Collection
Efficiency
Complaints
Redressal
Benchmarks 100% 100% 100% 100% 100% 100% 100% 100%
City Val.in % Val.in % Val.in % Val.in % Val.in % Val.in % Val.in % Val.in %
Ahmedabad 75.7 72.9 2.7 17.5 Nil 26.2 58.6 100.0
Amristar 24.8 86.2 Nil Nil Nil 0.4 99.7 100.0
Bangalore 74.5 54.0 30.0 77.3 57.6 Nil NA 80.0
Berhampur 2.6 81.2 Nil Nil Nil Nil NA 99.1
Bhopal 5.6 96.8 Nil Nil Nil 6.5 66.4 100.0
Bhubhaneshwar 28.2 74.5 Nil Nil Nil 0.1 NA 99.6
Bokaro 100.0 52.0 3.9 3.9 Nil Nil NA 100.0
Chandigarh 96.2 73.3 18.0 97.1 Nil 0.1 100.0 100.0
Chas 38.8 45.5 Nil Nil Nil Nil NA 62.5
Delhi 4.2 80.8 31.6 31.6 Nil 1.2 NA 90.0
Dharamshala 21.1 100.0 5.6 5.6 Nil Nil NA 100.0
Guntur 84.9 84.7 Nil Nil Nil 7.4 65.1 75.0
Hyderabad 70.6 78.1 12.8 12.3 Nil 12.8 65.0 73.0
Imphal 33.4 74.0 Nil Nil Nil Nil NA No data
Indore 28.3 75.8 Nil Nil Nil 160.0 50.0 100.0
Jalandhar Nil 93.2 Nil Nil Nil Nil NA 70.0
Kolhapur 91.0 95.6 20.0 100.0 Nil 21.3 79.8 85.0
Kozhikode 24.2 43.2 50.8 50.8 Nil 3.2 72.5 100.0
Nashik 86.9 87.0 34.5 100.0 Nil 33.2 35.0 100.0
Palampur Nil 100.0 15.0 15.0 Nil Nil NA 100.0
Pimpri-Chichwad 65.2 99.7 13.4 16.6 0 4.0 70.2 100.0
Raipur 16.4 82.7 Nil Nil Nil No Data No Data 100.0
Shimla 26.0 61.5 32.5 75.0 Nil Nil NA 82.9
Surat 90.3 87.6 13.1 19.4 0.8 83.0 85.2 100.0
Thiruchirapalli 81.0 94.6 Nil Nil Nil 0.1 NI 96.2
Trivandrum 42.9 54.4 64.9 30.1 Nil Nil NA 100.0
Udhagamandalam 22.0 89.6 Nil Nil Nil 1.9 No Data 100.0
Ujjain 6.0 72.0 Nil Nil Nil 10.0 30.0 100.0
Source: Urban Finance Quarterly, Vol. 13, No. 1 Jan-Mar2010, New Delhi: National Institute of Urban Affairs.
Thus, even though the policy of GoI as outlined in the MSW (Handling and Management) Rules 2000 required
compliance prior to December 2003, service levels in ULBs have a far way before reaching the standards laid
out. There is therefore a need for a coherent set of actions at National, State and Local levels and an escalated
level of attention to MSWM to improve service levels from the prevailing levels.
2.5 PPPs in MSWM in India
2.5.1 Definition / Need for PPPs
Public-Private Partnership (PPP) describes a government service or private business venture which is funded
and operated through a partnership of government and one or more private sector companies. These schemes
are sometimes referred to as PPP, P3 or P3. PPP typically involves a contract between a public sector authority
and a private party, in which the private party provides a public service or project and assumes substantial
financial, technical and operational risk in the project.
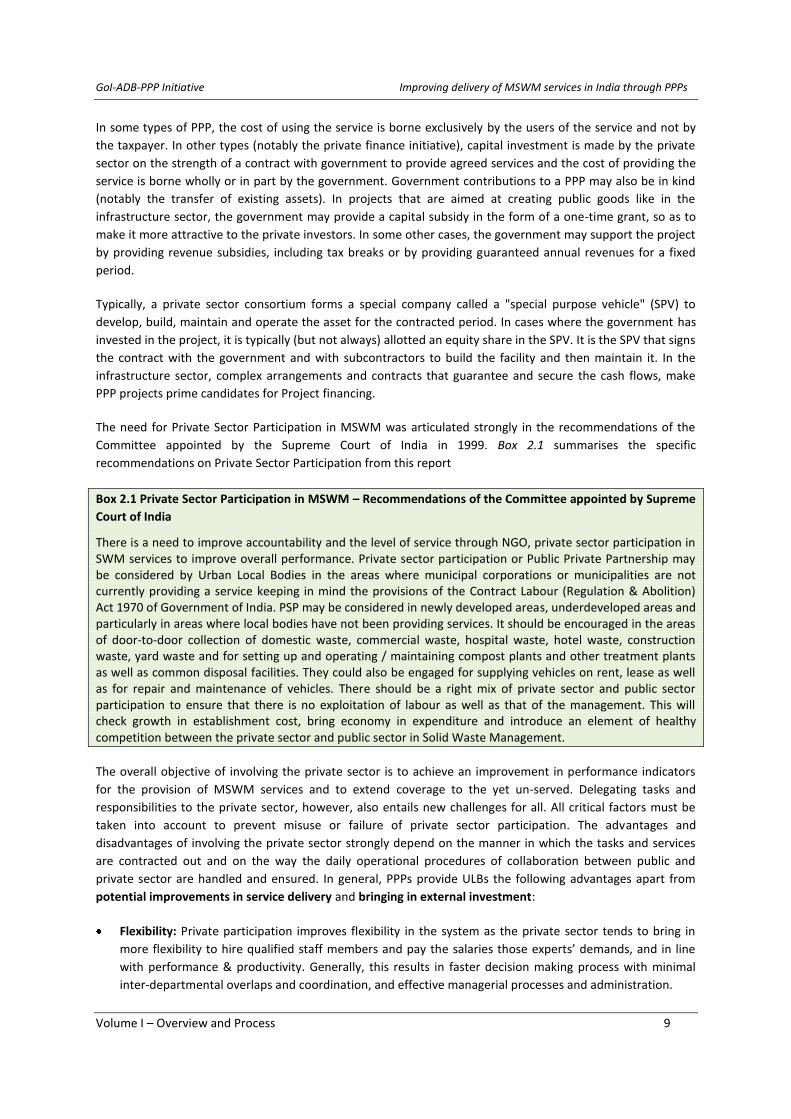
GoI-ADB-PPP Initiative Improving delivery of MSWM services in India through PPPs
Volume I – Overview and Process 9
In some types of PPP, the cost of using the service is borne exclusively by the users of the service and not by
the taxpayer. In other types (notably the private finance initiative), capital investment is made by the private
sector on the strength of a contract with government to provide agreed services and the cost of providing the
service is borne wholly or in part by the government. Government contributions to a PPP may also be in kind
(notably the transfer of existing assets). In projects that are aimed at creating public goods like in the
infrastructure sector, the government may provide a capital subsidy in the form of a one-time grant, so as to
make it more attractive to the private investors. In some other cases, the government may support the project
by providing revenue subsidies, including tax breaks or by providing guaranteed annual revenues for a fixed
period.
Typically, a private sector consortium forms a special company called a "special purpose vehicle" (SPV) to
develop, build, maintain and operate the asset for the contracted period. In cases where the government has
invested in the project, it is typically (but not always) allotted an equity share in the SPV. It is the SPV that signs
the contract with the government and with subcontractors to build the facility and then maintain it. In the
infrastructure sector, complex arrangements and contracts that guarantee and secure the cash flows, make
PPP projects prime candidates for Project financing.
The need for Private Sector Participation in MSWM was articulated strongly in the recommendations of the
Committee appointed by the Supreme Court of India in 1999. Box 2.1 summarises the specific
recommendations on Private Sector Participation from this report
Box 2.1 Private Sector Participation in MSWM – Recommendations of the Committee appointed by Supreme
Court of India
There is a need to improve accountability and the level of service through NGO, private sector participation in SWM services to improve overall performance. Private sector participation or Public Private Partnership may be considered by Urban Local Bodies in the areas where municipal corporations or municipalities are not currently providing a service keeping in mind the provisions of the Contract Labour (Regulation & Abolition) Act 1970 of Government of India. PSP may be considered in newly developed areas, underdeveloped areas and particularly in areas where local bodies have not been providing services. It should be encouraged in the areas of door-to-door collection of domestic waste, commercial waste, hospital waste, hotel waste, construction waste, yard waste and for setting up and operating / maintaining compost plants and other treatment plants as well as common disposal facilities. They could also be engaged for supplying vehicles on rent, lease as well as for repair and maintenance of vehicles. There should be a right mix of private sector and public sector participation to ensure that there is no exploitation of labour as well as that of the management. This will check growth in establishment cost, bring economy in expenditure and introduce an element of healthy competition between the private sector and public sector in Solid Waste Management.
The overall objective of involving the private sector is to achieve an improvement in performance indicators
for the provision of MSWM services and to extend coverage to the yet un-served. Delegating tasks and
responsibilities to the private sector, however, also entails new challenges for all. All critical factors must be
taken into account to prevent misuse or failure of private sector participation. The advantages and
disadvantages of involving the private sector strongly depend on the manner in which the tasks and services
are contracted out and on the way the daily operational procedures of collaboration between public and
private sector are handled and ensured. In general, PPPs provide ULBs the following advantages apart from
potential improvements in service delivery and bringing in external investment:
Flexibility: Private participation improves flexibility in the system as the private sector tends to bring in
more flexibility to hire qualified staff members and pay the salaries those experts’ demands, and in line
with performance & productivity. Generally, this results in faster decision making process with minimal
inter-departmental overlaps and coordination, and effective managerial processes and administration.
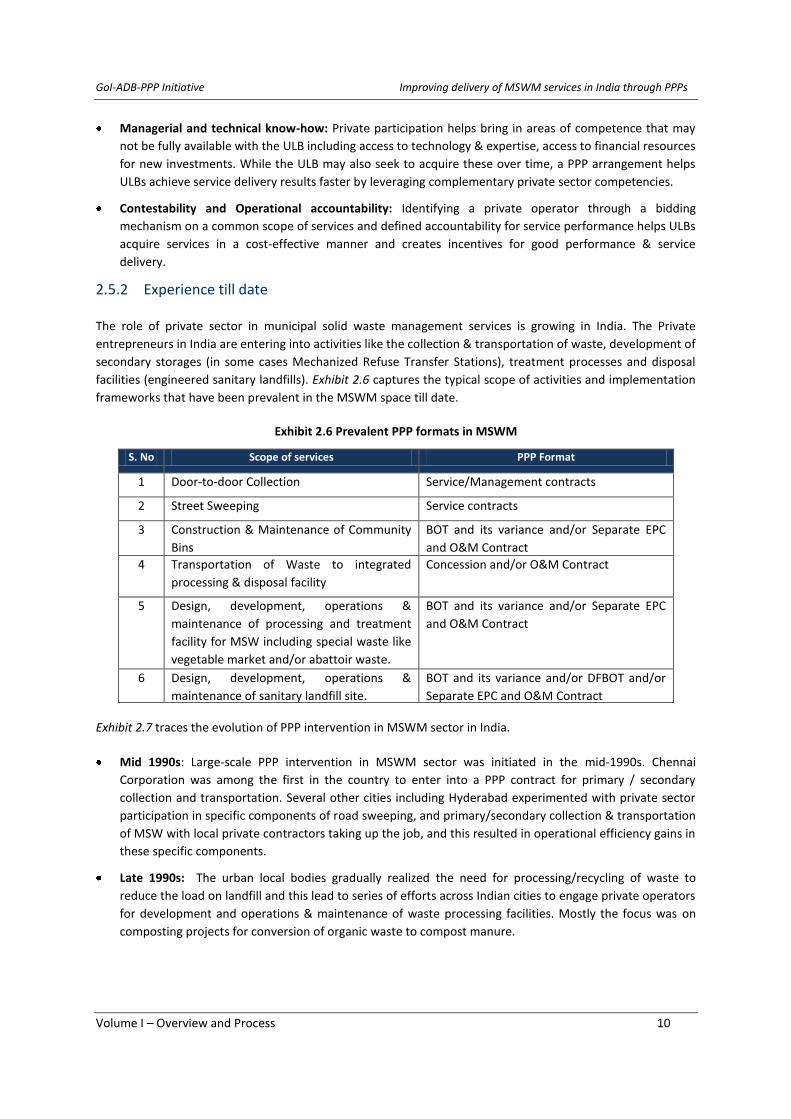
GoI-ADB-PPP Initiative Improving delivery of MSWM services in India through PPPs
Volume I – Overview and Process 10
Managerial and technical know-how: Private participation helps bring in areas of competence that may
not be fully available with the ULB including access to technology & expertise, access to financial resources
for new investments. While the ULB may also seek to acquire these over time, a PPP arrangement helps
ULBs achieve service delivery results faster by leveraging complementary private sector competencies.
Contestability and Operational accountability: Identifying a private operator through a bidding
mechanism on a common scope of services and defined accountability for service performance helps ULBs
acquire services in a cost-effective manner and creates incentives for good performance & service
delivery.
2.5.2 Experience till date
The role of private sector in municipal solid waste management services is growing in India. The Private
entrepreneurs in India are entering into activities like the collection & transportation of waste, development of
secondary storages (in some cases Mechanized Refuse Transfer Stations), treatment processes and disposal
facilities (engineered sanitary landfills). Exhibit 2.6 captures the typical scope of activities and implementation
frameworks that have been prevalent in the MSWM space till date.
Exhibit 2.6 Prevalent PPP formats in MSWM
S. No Scope of services PPP Format
1 Door-to-door Collection Service/Management contracts
2 Street Sweeping Service contracts
3 Construction & Maintenance of Community
Bins
BOT and its variance and/or Separate EPC
and O&M Contract
4 Transportation of Waste to integrated
processing & disposal facility
Concession and/or O&M Contract
5 Design, development, operations &
maintenance of processing and treatment
facility for MSW including special waste like
vegetable market and/or abattoir waste.
BOT and its variance and/or Separate EPC
and O&M Contract
6 Design, development, operations &
maintenance of sanitary landfill site.
BOT and its variance and/or DFBOT and/or
Separate EPC and O&M Contract
Exhibit 2.7 traces the evolution of PPP intervention in MSWM sector in India.
Mid 1990s: Large-scale PPP intervention in MSWM sector was initiated in the mid-1990s. Chennai
Corporation was among the first in the country to enter into a PPP contract for primary / secondary
collection and transportation. Several other cities including Hyderabad experimented with private sector
participation in specific components of road sweeping, and primary/secondary collection & transportation
of MSW with local private contractors taking up the job, and this resulted in operational efficiency gains in
these specific components.
Late 1990s: The urban local bodies gradually realized the need for processing/recycling of waste to
reduce the load on landfill and this lead to series of efforts across Indian cities to engage private operators
for development and operations & maintenance of waste processing facilities. Mostly the focus was on
composting projects for conversion of organic waste to compost manure.
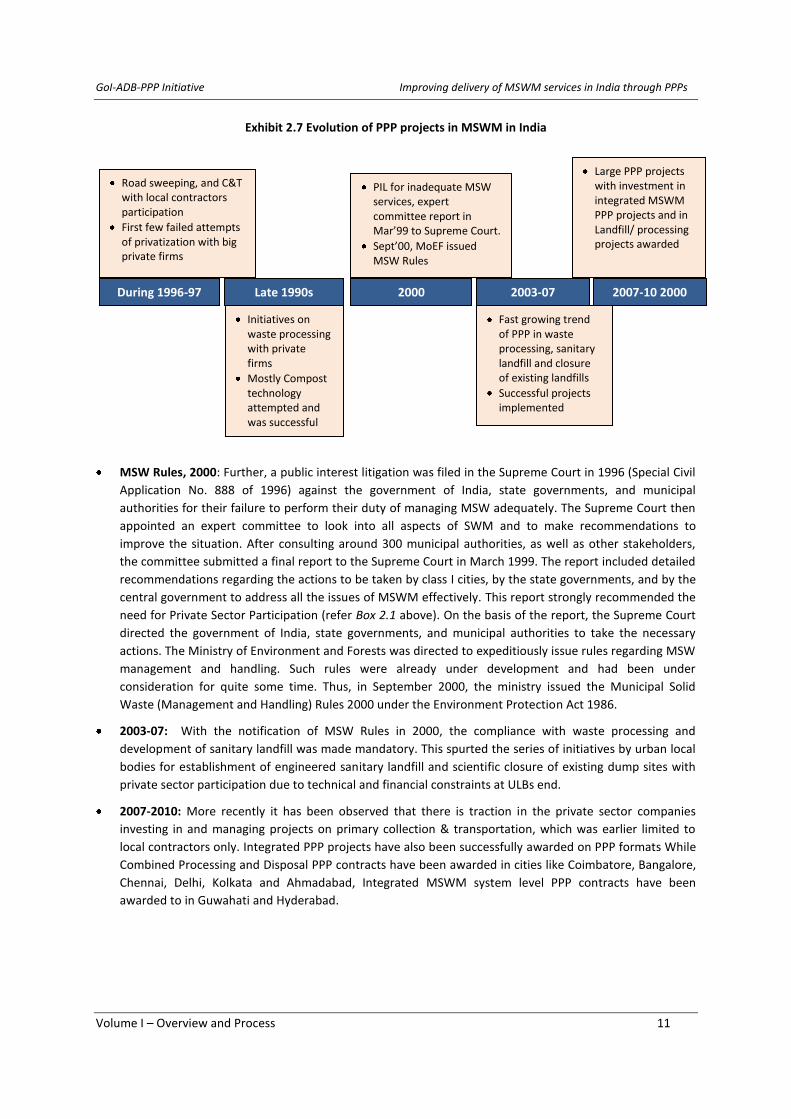
GoI-ADB-PPP Initiative Improving delivery of MSWM services in India through PPPs
Volume I – Overview and Process 11
Exhibit 2.7 Evolution of PPP projects in MSWM in India
MSW Rules, 2000: Further, a public interest litigation was filed in the Supreme Court in 1996 (Special Civil
Application No. 888 of 1996) against the government of India, state governments, and municipal
authorities for their failure to perform their duty of managing MSW adequately. The Supreme Court then
appointed an expert committee to look into all aspects of SWM and to make recommendations to
improve the situation. After consulting around 300 municipal authorities, as well as other stakeholders,
the committee submitted a final report to the Supreme Court in March 1999. The report included detailed
recommendations regarding the actions to be taken by class I cities, by the state governments, and by the
central government to address all the issues of MSWM effectively. This report strongly recommended the
need for Private Sector Participation (refer Box 2.1 above). On the basis of the report, the Supreme Court
directed the government of India, state governments, and municipal authorities to take the necessary
actions. The Ministry of Environment and Forests was directed to expeditiously issue rules regarding MSW
management and handling. Such rules were already under development and had been under
consideration for quite some time. Thus, in September 2000, the ministry issued the Municipal Solid
Waste (Management and Handling) Rules 2000 under the Environment Protection Act 1986.
2003-07: With the notification of MSW Rules in 2000, the compliance with waste processing and
development of sanitary landfill was made mandatory. This spurted the series of initiatives by urban local
bodies for establishment of engineered sanitary landfill and scientific closure of existing dump sites with
private sector participation due to technical and financial constraints at ULBs end.
2007-2010: More recently it has been observed that there is traction in the private sector companies
investing in and managing projects on primary collection & transportation, which was earlier limited to
local contractors only. Integrated PPP projects have also been successfully awarded on PPP formats While
Combined Processing and Disposal PPP contracts have been awarded in cities like Coimbatore, Bangalore,
Chennai, Delhi, Kolkata and Ahmadabad, Integrated MSWM system level PPP contracts have been
awarded to in Guwahati and Hyderabad.
During 1996-97 Late 1990s 2000 2003-07 2007-10 2000
Road sweeping, and C&T with local contractors participation
First few failed attempts of privatization with big private firms
Initiatives on waste processing with private firms
Mostly Compost technology attempted and was successful
PIL for inadequate MSW services, expert committee report in Mar’99 to Supreme Court.
Sept’00, MoEF issued MSW Rules
Fast growing trend of PPP in waste processing, sanitary landfill and closure of existing landfills
Successful projects implemented
Large PPP projects with investment in integrated MSWM PPP projects and in Landfill/ processing projects awarded
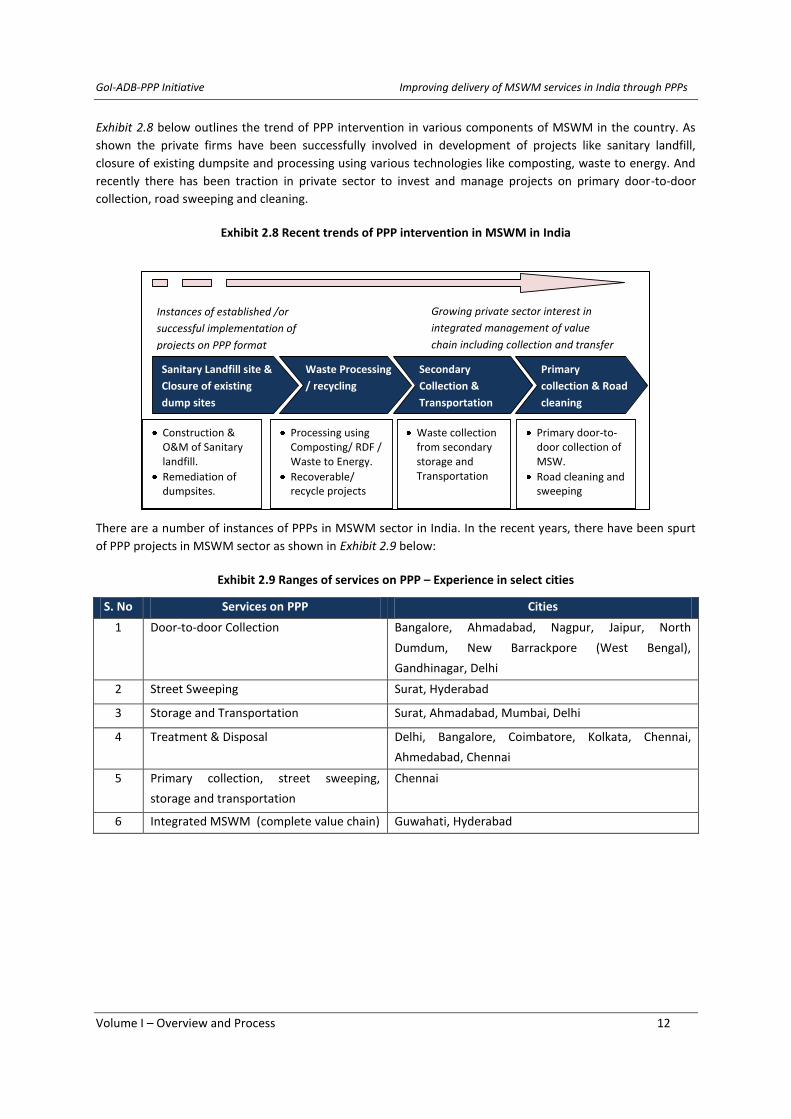
GoI-ADB-PPP Initiative Improving delivery of MSWM services in India through PPPs
Volume I – Overview and Process 12
Exhibit 2.8 below outlines the trend of PPP intervention in various components of MSWM in the country. As
shown the private firms have been successfully involved in development of projects like sanitary landfill,
closure of existing dumpsite and processing using various technologies like composting, waste to energy. And
recently there has been traction in private sector to invest and manage projects on primary door-to-door
collection, road sweeping and cleaning.
Exhibit 2.8 Recent trends of PPP intervention in MSWM in India
There are a number of instances of PPPs in MSWM sector in India. In the recent years, there have been spurt
of PPP projects in MSWM sector as shown in Exhibit 2.9 below:
Exhibit 2.9 Ranges of services on PPP – Experience in select cities
S. No Services on PPP Cities
1 Door-to-door Collection Bangalore, Ahmadabad, Nagpur, Jaipur, North
Dumdum, New Barrackpore (West Bengal),
Gandhinagar, Delhi
2 Street Sweeping Surat, Hyderabad
3 Storage and Transportation Surat, Ahmadabad, Mumbai, Delhi
4 Treatment & Disposal Delhi, Bangalore, Coimbatore, Kolkata, Chennai,
Ahmedabad, Chennai
5 Primary collection, street sweeping,
storage and transportation
Chennai
6 Integrated MSWM (complete value chain) Guwahati, Hyderabad
Sanitary Landfill site &
Closure of existing
dump sites
Waste Processing
/ recycling
Secondary
Collection &
Transportation
Primary
collection & Road
cleaning
Processing using Composting/ RDF / Waste to Energy.
Recoverable/ recycle projects
Waste collection from secondary storage and Transportation
Primary door-to-door collection of MSW.
Road cleaning and sweeping
Instances of established /or
successful implementation of
projects on PPP format
Growing private sector interest in
integrated management of value
chain including collection and transfer
Construction & O&M of Sanitary landfill.
Remediation of dumpsites.

GoI-ADB-PPP Initiative Improving delivery of MSWM services in India through PPPs
Volume I – Overview and Process 13
2.6 Case studies on PPP in SWM: summary of findings
As part of preparation of this Toolkit, Eight PPP projects (including two international cases from Malaysia and
Singapore) were profiled for preparation of detailed case studies which are presented as Volume II of this
Toolkit. Select features of these PPP projects are summarised below:
2.6.1 Waste processing and Sanitary Landfill: Coimbatore Municipal Corporation
City Coimbatore, Tamil Nadu
Project Waste Transportation, Processing & Sanitary Landfill
Month/Year of Issue of RfQ July 2007
Month/Year of Project Award November 2007
Bid process timeframe Five [5] months
No. of Bids Three [3]
Bid Variable/Winning offer NPV of [Transportation – Rs 440 per ton, Processing – Rs
185 per ton, Landfill – Rs 171.5 per tons of inert to
landfill, Closure of dumpsite – Rs 45 lakh per year]
Selected Private Operator Consortium of M/s Bharuch Enviro Infrastructure
Limited (BEIL) and United Phosphorous Ltd. (UPL)
Project Cost Rs 69.0 crore
Investment by Operator (% of project cost) Rs 21.0 crore [rest 48 crore under JnNURM scheme]
Project Scope and Operator Obligations:
MSW Transportation from the existing & proposed transfer stations to Vellalore site;
Establish transfer stations at specified 4 (four) locations and O&M of the same;
Establish MSW processing using aerobic composting along with other suitable options and its O&M;
Closure of existing waste dumpsites at specified 3 (three) locations in the city;
Construction, Development and O&M of Sanitary Landfill in compliance with MSW Rules 2000
ULB obligations:
Capital cost for SFL after phase I (5 yrs.) to the extent of Rs 4.0 crore per year with 5% annual
increment
Collect & Transfer MSW to transfer station; except 50 TPD of organic waste for existing Vermi plant.
Assured minimum waste quantity of 360 TPD in Year 1.
Payment on monthly basis to concessionaire within 30 days of receipt of fee statement
Segregation of waste, non-mandatory (no penalties) target to achieve and maintain
Disburse grants in timely manner and approvals, permissions and authorisations to concessionaire
Landfill need within 12 months upon operator’ request, in case available site falls short of need.
Key lessons:
NPV concept – One of the very few projects in SWM in India where the bidding parameter was Net
Present Value for different components and evaluation was successfully conducted based on
weighted average for technical score (30 marks) and financial offer(70 marks).
JNNURM funding – the project utilised the JnNURM funding (70%) for part of the initial capital
investment and balance (30%) funding by private player in the project. Prima facie this seems to
provide comfort to private operator for investment and also helped in bringing down tipping fee
Risk Allocation summary
Investment risk Private player (30%) and rest 70% by government
Construction/development risk Private Player
Operating Risk Quantity Risk by Government [360 tons per day]

GoI-ADB-PPP Initiative Improving delivery of MSWM services in India through PPPs
Volume I – Overview and Process 14
Waste Quality Risk by Private Player
2.6.2 Integrated SWM: Hyderabad Municipal Corporation
City Hyderabad, Andhra Pradesh
Project Integrated SWM system – Entire value chain
Month/Year of Issue of RfQ August 2008
Month/Year of Project Award February 2009
Bid process timeframe Six [6] months
No. of Bids Two [2]
Bid Variable/Winning offer Tipping Fee per ton of MSW received at the gate of the
disposal facility – Rs 1431 per ton of MSW
Selected Private Operator M/s Ramky Enviro Engineers Ltd. (REEL)
Project Cost Rs 434.91 crore
Investment by Operator (% of project cost) 50% by Private Player; Rs 217.46 crore
[rest 35% under JnNURM scheme and 15% by
Government of Andhra Pradesh]
Project Scope and Operator Obligations:
Primary & secondary collection – entire GHMC area; all 5 zones
Up-gradation, operation & maintenance, and management of existing transfer stations
Development, operations and maintenance of additional transfer stations
Construction & Development of Sanitary Landfill and O&M of the same in line with MSW Rules 2000
Reclamation/ reuse of dumpsites.
ULB obligations:
In the event the grants are not obtained under the JnNURM scheme GHMC would be responsible for
providing equivalent grants contributing to 50% (35% of JnNURM + 15% of GoAP) of the eligible
project cost.
Provide power connections to the transfer stations and treatment & disposal facilities. However,
usage charges and distribution arrangements, as well as back-up to be made by concessionaire.
Road connectivity to the transfer stations and treatment & disposal facilities by GHMC.
Handover all existing infrastructure like dumper bins, vehicles, transfer station to concessionaire.
Key lessons:
Labour Unrest –The GHMC unions were opposing the handing over of collection & transportation to
Ramky on the apprehension that once the private operator would start operations, the municipal
workers will be diverted to activities like road sweeping and drain cleaning than the desired
collection and transportation work. The strike by the unions forced the state government to keep
the agreement on hold and the project implementation was kept in abeyance for 9 months due to
objections/concerns raised by municipal worker’ unions.
Information, communication and awareness programmes – there is a pressing need for running
structured awareness programmes to involve all stakeholders with focus on sharing new
technologies and procedures for handling the SWM activities.
Risk Allocation summary
Investment risk Private player (50%) and rest 50% by Government of AP
Construction/development risk Private Player
Operating Risk Private Player [both Quantity & Quality]

GoI-ADB-PPP Initiative Improving delivery of MSWM services in India through PPPs
Volume I – Overview and Process 15
2.6.3 Collection and Transportation: Delhi
City Delhi
Project Collection & Transportation of MSW – West Zone, Delhi
Month/Year of Issue of RfQ August 2004
Month/Year of Project Award January 2005
Bid process timeframe Six [6] months
No. of Bids Four [4]
Bid Variable/Winning offer Tipping Fee of Rs 693 per tons of waste collected and
transported to the disposal facility
Selected Private Operator M/s Metro Waste Handling Pvt. Ltd. for the West Zone
Project Cost NA
Investment by Operator (% of project cost) 100% by private player
Project Scope and Operator Obligations:
Secondary collection from waste storage depots (WSDs) and transportation to the disposal facility;
Waste segregation at WSDs/dhalaos – the ownership of recyclables waste with private players
Structured communication activities for awareness on segregation and storage of wet and dry waste.
Ensure that the dhalao/WSDs and its defined surroundings of 25 feet are clean and odourless.
ULB obligations:
Give all assistance to the concessionaire to employ the existing informal Municipal Solid Waste
collectors including rag pickers and assist the concessionaire in solving issues arising from the
redeployment and employment of such waste collectors by the concessionaire.
Primary collection till the waste storage depots to be the responsibility of MCD.
Payment on monthly basis to concessionaire within 30 days of receipt of fee statement
Timely manner grants for approvals, permissions and authorizations to concessionaire
Key lessons:
The design of the privatization system was different from other cities in a way that the contract did
not start at the doorstep of the waste generator. Instead, this space was left open for informal
players in the value chain.
The monthly payments are linked to the segregation efficiency achieved as per the pre-determined
benchmarks specified for discrete yeas during the concession period leading to operational gains.
Risk Allocation summary
Investment risk 100% by Private player
Construction/development risk Private Player
Operating Risk Both quantity and quality risk by Private Player

GoI-ADB-PPP Initiative Improving delivery of MSWM services in India through PPPs
Volume I – Overview and Process 16
2.6.4 Collection and Transportation of MSW: Chennai Municipal Corporation
City Chennai, Tamil Nadu
Project Collection and Transportation of MSW
Month/Year of Issue of RfQ May 2007
Month/Year of Project Award July 2009
Bid process timeframe Four [4] months
No. of Bids Six [6]
Bid Variable/Winning offer Tipping Fee per ton of MSW collected & transported –
Rs 673 & Rs 642 per ton of MSW for two separate zones
Selected Private Operator Consortium of Neel Metal Fanalca S.A
Project Cost NA
Investment by Operator (% of project cost) 100% by Private player
Project Scope and Operator Obligations:
Primary & secondary collection – 4 zones out of 12 zones in Chennai
Segregation of MSW at source
Road sweeping including collection, removal, transportation and disposal of road dust
Providing manpower and machinery (including but not limited to vehicles & bins) for collection,
segregation and transportation.
If required, installation of transfer stations with permanent refuse compactors, along with
manpower required for operations.
Providing required number of vehicles with operators/drivers for collection, segregation and
transportation such as small/medium/large capacity compactors, and skip loading vehicles etc.
The operational management of the CoC’ transfer stations will be the responsibility of the private
operator but the ownership of the same will rest with CoC.
ULB obligations:
Security against default in monthly payments - The CoC would provide an irrevocable standby letter
of credit in favour of the concessionaire, which can be utilized against any unpaid invoice that was
delivered to the CoC in accordance with the agreement.
Make arrangements at the disposal area to weigh the MSW disposed by the concessionaire.
Key lessons:
Political championing is necessary for PPPs in urban services: in this case, the Mayor steered clear
the rationale for the privatization of MSWM services to the corporation council and passed a council
resolution approving the privatization of MSW services.
Need for well-defined transition process/duration – it is imperative to initiate steps in developing
service handover management competencies, else it can lead to complete failure of adequate
service delivery as in the case of transition between CES Onyx to Neel Metal Fanalca.
Risk Allocation summary
Investment risk 100% by Private player
Construction/development risk Private Player
Operating Risk Private Player
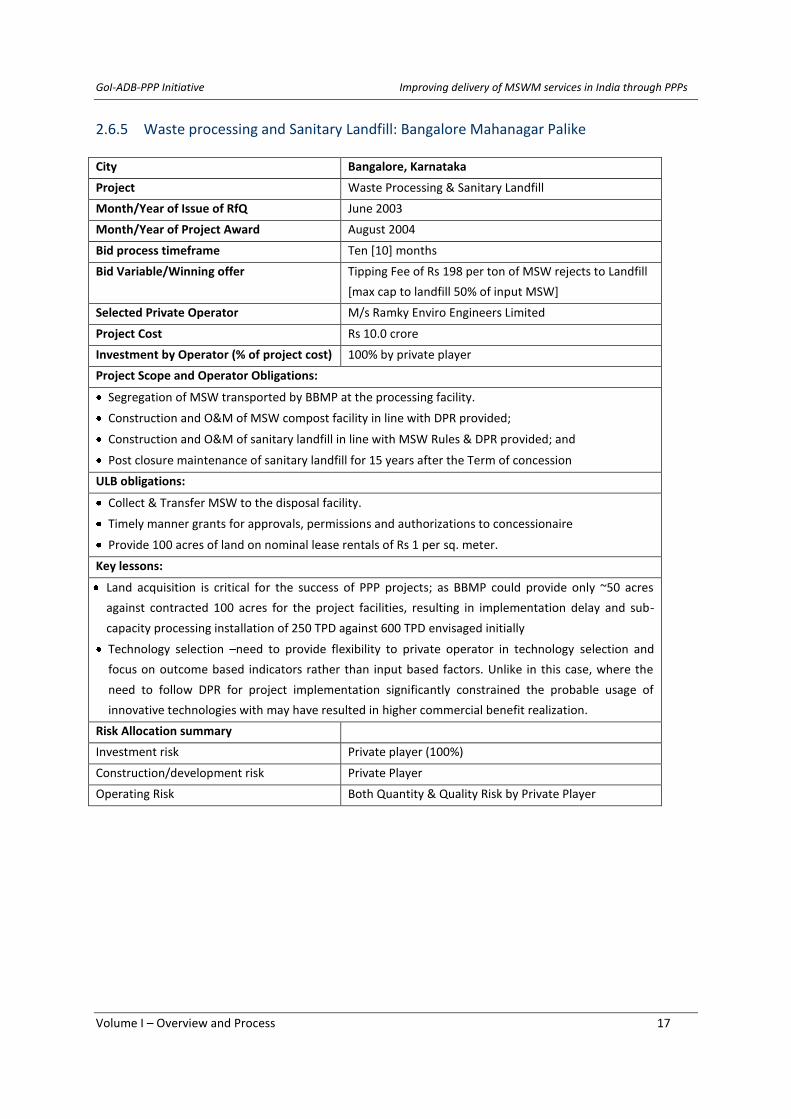
GoI-ADB-PPP Initiative Improving delivery of MSWM services in India through PPPs
Volume I – Overview and Process 17
2.6.5 Waste processing and Sanitary Landfill: Bangalore Mahanagar Palike
City Bangalore, Karnataka
Project Waste Processing & Sanitary Landfill
Month/Year of Issue of RfQ June 2003
Month/Year of Project Award August 2004
Bid process timeframe Ten [10] months
Bid Variable/Winning offer Tipping Fee of Rs 198 per ton of MSW rejects to Landfill
[max cap to landfill 50% of input MSW]
Selected Private Operator M/s Ramky Enviro Engineers Limited
Project Cost Rs 10.0 crore
Investment by Operator (% of project cost) 100% by private player
Project Scope and Operator Obligations:
Segregation of MSW transported by BBMP at the processing facility.
Construction and O&M of MSW compost facility in line with DPR provided;
Construction and O&M of sanitary landfill in line with MSW Rules & DPR provided; and
Post closure maintenance of sanitary landfill for 15 years after the Term of concession
ULB obligations:
Collect & Transfer MSW to the disposal facility.
Timely manner grants for approvals, permissions and authorizations to concessionaire
Provide 100 acres of land on nominal lease rentals of Rs 1 per sq. meter.
Key lessons:
Land acquisition is critical for the success of PPP projects; as BBMP could provide only ~50 acres
against contracted 100 acres for the project facilities, resulting in implementation delay and sub-
capacity processing installation of 250 TPD against 600 TPD envisaged initially
Technology selection –need to provide flexibility to private operator in technology selection and
focus on outcome based indicators rather than input based factors. Unlike in this case, where the
need to follow DPR for project implementation significantly constrained the probable usage of
innovative technologies with may have resulted in higher commercial benefit realization.
Risk Allocation summary
Investment risk Private player (100%)
Construction/development risk Private Player
Operating Risk Both Quantity & Quality Risk by Private Player
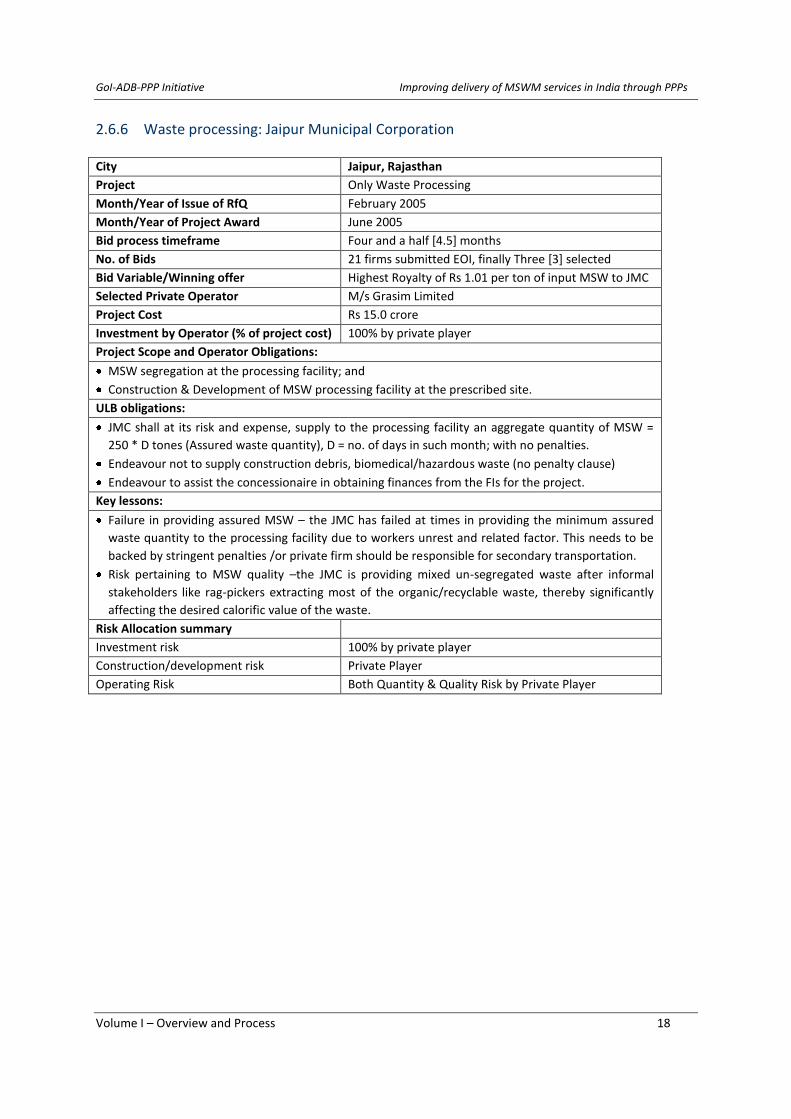
GoI-ADB-PPP Initiative Improving delivery of MSWM services in India through PPPs
Volume I – Overview and Process 18
2.6.6 Waste processing: Jaipur Municipal Corporation
City Jaipur, Rajasthan
Project Only Waste Processing
Month/Year of Issue of RfQ February 2005
Month/Year of Project Award June 2005
Bid process timeframe Four and a half [4.5] months
No. of Bids 21 firms submitted EOI, finally Three [3] selected
Bid Variable/Winning offer Highest Royalty of Rs 1.01 per ton of input MSW to JMC
Selected Private Operator M/s Grasim Limited
Project Cost Rs 15.0 crore
Investment by Operator (% of project cost) 100% by private player
Project Scope and Operator Obligations:
MSW segregation at the processing facility; and
Construction & Development of MSW processing facility at the prescribed site.
ULB obligations:
JMC shall at its risk and expense, supply to the processing facility an aggregate quantity of MSW =
250 * D tones (Assured waste quantity), D = no. of days in such month; with no penalties.
Endeavour not to supply construction debris, biomedical/hazardous waste (no penalty clause)
Endeavour to assist the concessionaire in obtaining finances from the FIs for the project.
Key lessons:
Failure in providing assured MSW – the JMC has failed at times in providing the minimum assured
waste quantity to the processing facility due to workers unrest and related factor. This needs to be
backed by stringent penalties /or private firm should be responsible for secondary transportation.
Risk pertaining to MSW quality –the JMC is providing mixed un-segregated waste after informal
stakeholders like rag-pickers extracting most of the organic/recyclable waste, thereby significantly
affecting the desired calorific value of the waste.
Risk Allocation summary
Investment risk 100% by private player
Construction/development risk Private Player
Operating Risk Both Quantity & Quality Risk by Private Player
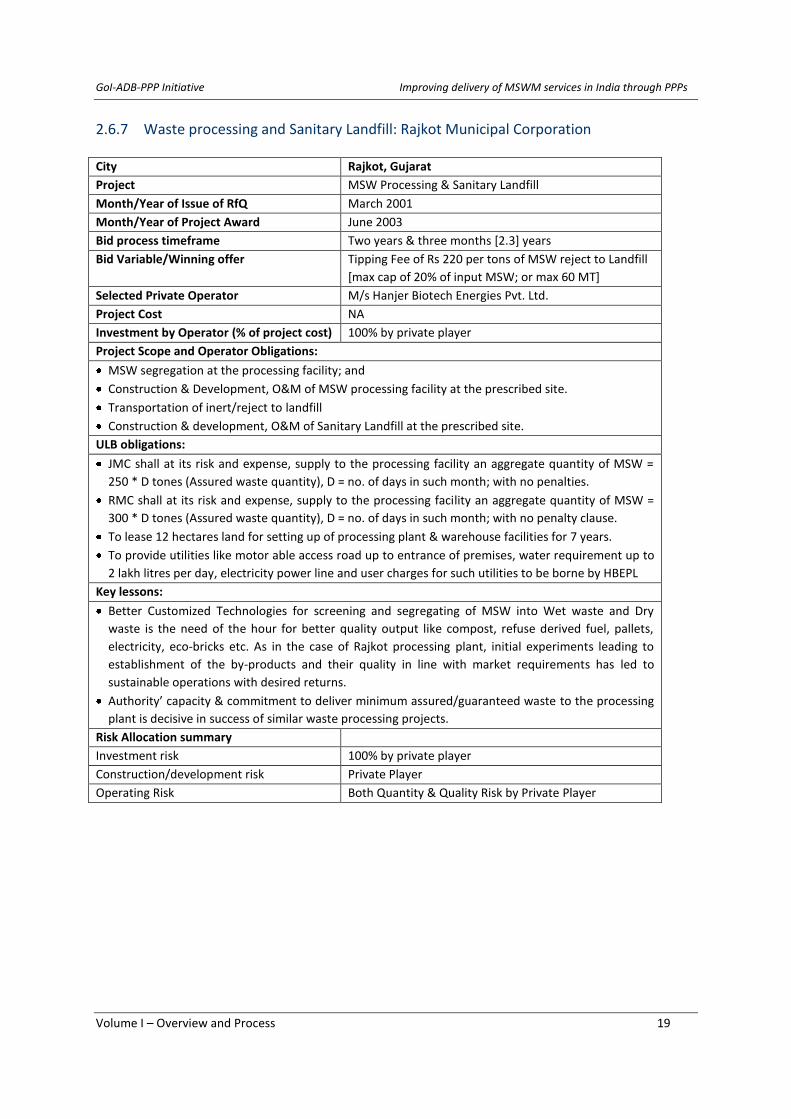
GoI-ADB-PPP Initiative Improving delivery of MSWM services in India through PPPs
Volume I – Overview and Process 19
2.6.7 Waste processing and Sanitary Landfill: Rajkot Municipal Corporation
City Rajkot, Gujarat
Project MSW Processing & Sanitary Landfill
Month/Year of Issue of RfQ March 2001
Month/Year of Project Award June 2003
Bid process timeframe Two years & three months [2.3] years
Bid Variable/Winning offer Tipping Fee of Rs 220 per tons of MSW reject to Landfill
[max cap of 20% of input MSW; or max 60 MT]
Selected Private Operator M/s Hanjer Biotech Energies Pvt. Ltd.
Project Cost NA
Investment by Operator (% of project cost) 100% by private player
Project Scope and Operator Obligations:
MSW segregation at the processing facility; and
Construction & Development, O&M of MSW processing facility at the prescribed site.
Transportation of inert/reject to landfill
Construction & development, O&M of Sanitary Landfill at the prescribed site.
ULB obligations:
JMC shall at its risk and expense, supply to the processing facility an aggregate quantity of MSW =
250 * D tones (Assured waste quantity), D = no. of days in such month; with no penalties.
RMC shall at its risk and expense, supply to the processing facility an aggregate quantity of MSW =
300 * D tones (Assured waste quantity), D = no. of days in such month; with no penalty clause.
To lease 12 hectares land for setting up of processing plant & warehouse facilities for 7 years.
To provide utilities like motor able access road up to entrance of premises, water requirement up to
2 lakh litres per day, electricity power line and user charges for such utilities to be borne by HBEPL
Key lessons:
Better Customized Technologies for screening and segregating of MSW into Wet waste and Dry
waste is the need of the hour for better quality output like compost, refuse derived fuel, pallets,
electricity, eco-bricks etc. As in the case of Rajkot processing plant, initial experiments leading to
establishment of the by-products and their quality in line with market requirements has led to
sustainable operations with desired returns.
Authority’ capacity & commitment to deliver minimum assured/guaranteed waste to the processing
plant is decisive in success of similar waste processing projects.
Risk Allocation summary
Investment risk 100% by private player
Construction/development risk Private Player
Operating Risk Both Quantity & Quality Risk by Private Player
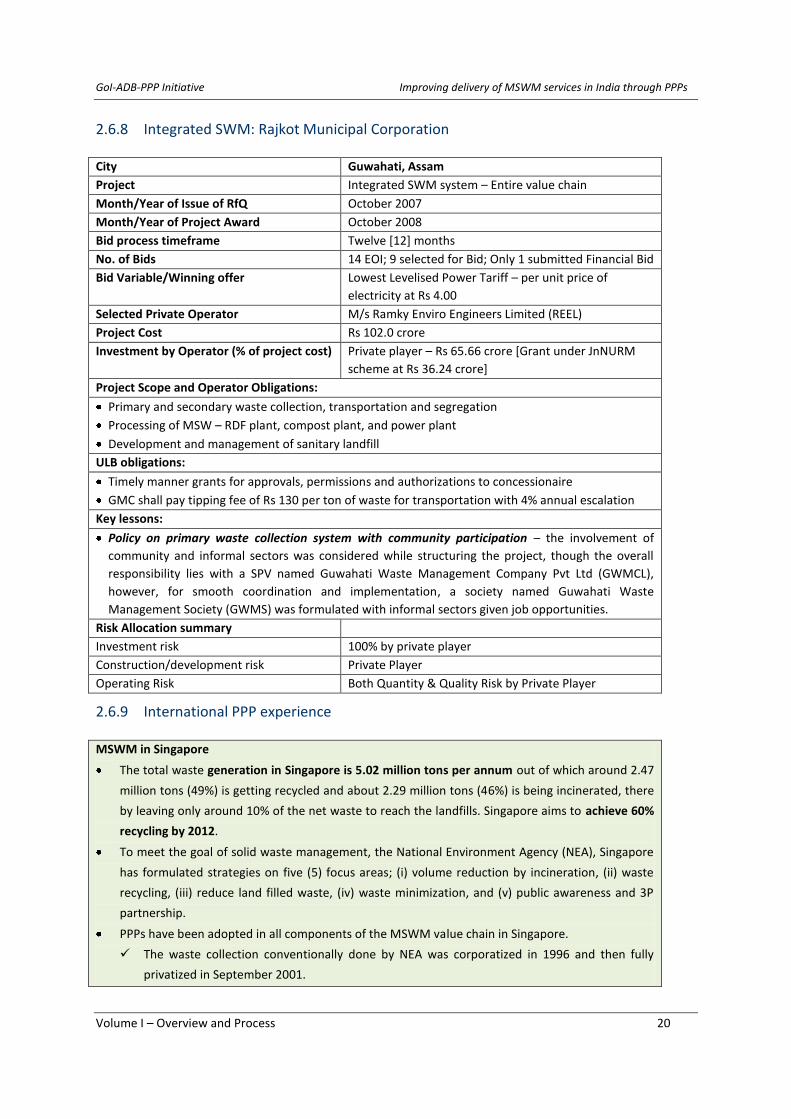
GoI-ADB-PPP Initiative Improving delivery of MSWM services in India through PPPs
Volume I – Overview and Process 20
2.6.8 Integrated SWM: Rajkot Municipal Corporation
City Guwahati, Assam
Project Integrated SWM system – Entire value chain
Month/Year of Issue of RfQ October 2007
Month/Year of Project Award October 2008
Bid process timeframe Twelve [12] months
No. of Bids 14 EOI; 9 selected for Bid; Only 1 submitted Financial Bid
Bid Variable/Winning offer Lowest Levelised Power Tariff – per unit price of
electricity at Rs 4.00
Selected Private Operator M/s Ramky Enviro Engineers Limited (REEL)
Project Cost Rs 102.0 crore
Investment by Operator (% of project cost) Private player – Rs 65.66 crore [Grant under JnNURM
scheme at Rs 36.24 crore]
Project Scope and Operator Obligations:
Primary and secondary waste collection, transportation and segregation
Processing of MSW – RDF plant, compost plant, and power plant
Development and management of sanitary landfill
ULB obligations:
Timely manner grants for approvals, permissions and authorizations to concessionaire
GMC shall pay tipping fee of Rs 130 per ton of waste for transportation with 4% annual escalation
Key lessons:
Policy on primary waste collection system with community participation – the involvement of
community and informal sectors was considered while structuring the project, though the overall
responsibility lies with a SPV named Guwahati Waste Management Company Pvt Ltd (GWMCL),
however, for smooth coordination and implementation, a society named Guwahati Waste
Management Society (GWMS) was formulated with informal sectors given job opportunities.
Risk Allocation summary
Investment risk 100% by private player
Construction/development risk Private Player
Operating Risk Both Quantity & Quality Risk by Private Player
2.6.9 International PPP experience
MSWM in Singapore
The total waste generation in Singapore is 5.02 million tons per annum out of which around 2.47
million tons (49%) is getting recycled and about 2.29 million tons (46%) is being incinerated, there
by leaving only around 10% of the net waste to reach the landfills. Singapore aims to achieve 60%
recycling by 2012.
To meet the goal of solid waste management, the National Environment Agency (NEA), Singapore
has formulated strategies on five (5) focus areas; (i) volume reduction by incineration, (ii) waste
recycling, (iii) reduce land filled waste, (iv) waste minimization, and (v) public awareness and 3P
partnership.
PPPs have been adopted in all components of the MSWM value chain in Singapore.
The waste collection conventionally done by NEA was corporatized in 1996 and then fully
privatized in September 2001.
GoI-ADB-PPP Initiative Improving delivery of MSWM services in India through PPPs
Volume I – Overview and Process 21
To ensure financial viability, every household pays an amount of Sing $ 4.5-7.5 per month and
individual landed property owner pays Sing $ 17-24 per month. Thus the waste collection is
completely viable with no liability on NEA
The 5th
Incineration plant at Tuas was developed on DBOO format. However, the NEA took the
risk of waste quantity and quality for successful implementation of the plant.
MSWM in Malaysia
Daily waste generation in peninsular Malaysia today exceeds 19,000 tons and approximately 75%
of this is collected and disposed in 130 landfills and dumps.
The current recycling rate in Malaysia is around 5.5% and the target is achieving 22% by 2020.
The Ministry of Housing and Local government enacted Solid Waste and Public Cleansing
Management Act (SWPCM) in 2007 with an objective to regulate the management of MSW.
Prior to the implementation of the SWPCM Act 2007, SWM was the responsibility of the Local
Authorities (LAs), and were normally subcontracted to smaller waste management service
providers which resulted in more efficient management in the early stages of implementation.
However, with the increasing costs of waste management, the situation resulted in subcontractors
not being paid promptly, leading to drastically reduced efficiency.
With the passing of the Act, the authority governing solid waste and public cleansing was shifted
from state governments/ LAs to the Federal Government - a Corporation named Solid Waste and
Public Cleansing Management Corporation (the Corporation) was established.
The SWPCM Act requires residents to pay for the waste collection and disposal service provided by
the licensed concessionaire (private authority) under the Act.
The Act provides for penalty provisions for consumers who refuse to pay waste disposal fees – a
fine of up to RM5000 (US$1316) & RM50 (US$13) for each day of the continuation of the offence.
2.6.10 Summary of key take-aways
1. Importance of rigorous project preparation and capacity building: Adequate preparatory efforts are
critical to structure and implement good PPP projects. Wherever local capacity is weak, hand-holding by
the specialist nodal agencies of the State Government is critical. Use of external assistance from
Transaction advisors should be complemented with local training inputs to ensure that the ULB officials
understand the structuring and contractual issues and are geared for managing the monitoring and
supervision roles. As seen in the case of Bangalore, the augmentation of local capacity is reflected in the
reduction in bidding timeframes between the first and the third waste processing facilities that were bid
out on PPP.
2. Structuring focus on focus on Outcomes rather than Inputs: PPPs should be structured to monitor and
focus on outcome based indicators rather than input based factors and in this regard, very often ULBs may
need to provide choice of technology. Very often the tendency to define the input specifications very
tightly can constrain innovation and competition that can potentially trigger greater efficiency and better
service delivery. For instance, rather than restrict a particular type of waste processing, it may be useful to
have all proven waste processing technologies to compete with output specifications, rather than carry
out a bidding on the basis of a specific technology. Allowing flexibility in the nature of waste processing
led to the private operator innovate in creating a whole range of products from processing the waste.

GoI-ADB-PPP Initiative Improving delivery of MSWM services in India through PPPs
Volume I – Overview and Process 22
3. Clarity on Land availability and certainty of meeting concessioning authority’s obligations: Earmarking
and making available land prior at the stage of bidding is critical. In one of the PPP projects profiled, the
concessioning authority could make available only 50% of the land committed as part of the project. Such
deviation from agreed contractual obligations post commencement tends to create uncertainty and opens
the project for protracted negotiations which can be long and painful. In general, the ULB or the greater
the certainty of the Concessioning Authority meeting its obligations, the greater its ability to enforce the
private operator to meet his part of the obligations.
4. Political commitment and policy continuity: Political commitment and support is critical for PPP projects.
Since PPPs require buy-in from a wide range of stakeholders, political commitment early one helps engage
with other stakeholders in a more effective manner. Further signalling policy clarity and continuity
through an over-arching PPP legislation or Policy improves risk perception among potential bidders.
Strong political commitment was a key factor in successful implementation of waste collection and
transportation PPP in Chennai Corporation, which was one of the earliest PPPs in the sector. Strong
political commitment helped overcome employee resistance and also win wider public support for the
project.
5. Effective Communication and Engagement with a wider set of stakeholders: It is critical to have a holistic
communication plan to consult and engage with a wider set of stakeholders. Structured IEC activities to
involve community with informal workers (rag-pickers), residents etc. and internal stakeholders like
sanitary workers, employees is extremely crucial during the early stages of the PPP project. This is crucial
to overcome apprehensions among workers/employees and helps in smooth implementation/transition of
activities to the private player. Further, taking into account community initiatives and addressing such
overlaps can play a constructive role. For instance, in Guwahati, a separate Guwahati Waste Management
Society was created to involve rag-pickers, residents, RWAs, NGOs etc. for primary collection of the waste
even as the PPP project in MSWM was conceptualised.
6. Need for well-defined transition process/duration – it is imperative to initiate steps in developing
“service handover management competencies”, else the teething problems occurring during the early
stages can cause significant pains that can create an unfavourable image early on which may become
difficult to resolve. For instance, inadequate transition planning in Chennai Corporation between an
earlier PPP contract and takeover of the system by a new player, created significant challenges in service
delivery during the transition period.
7. Commitments relating to waste quantity and quality: Given that baseline information on waste quantity
and quality tend to be sketchy, it is critical for ULBs to take this risk by assuring a committed Minimum
assured Quantity or have a two part tipping fee with a fixed portion and a variable portion, where the
fixed portion (paid irrespective of quantity of waste handled) insulates the Operator from Waste
Availability risk.

GoI-ADB-PPP Initiative Improving delivery of MSWM services in India through PPPs
Volume I – Overview and Process 23
3. PPP project development process
The earlier chapter profiled select PPP cases in MSWM and brought out the range of factors that need to be
considered while developing and implementing a PPP project. It is amply clear in order to contribute to efforts
to improve service delivery performance in a sustainable manner through PPPs, a structured and systematic
approach and rigorous preparatory efforts are critical. This chapter introduces a step-by-step project
development process that ULBs could adopt towards developing PPP projects in the MSWM space. Exhibit 3.1
summarises the four steps involved in developing a PPP project which are described below:
Exhibit 3.1 Developing PPPs in MSWM - Steps involved
As outlined above, the complete process of implementing PPP for the provision of MSWM services involves 5
(five) steps of project development namely; (i) Needs Assessment, (ii) Feasibility evaluation, (iii) Scoping and
structuring and (v) Procurement to identify a preferred private service operator for the proposed project.
The following paragraphs discuss the project development process in brief. Each of these four steps is dealt
with in further detail in the following chapters, namely Chapter 4 to 7 of the Toolkit.
3.1 Step 1: Needs Assessment
Exhibit 3.2 summarises the activities involved under Needs Assessment. The starting point for a project
development in case of MSWM services is to conduct a situational analysis covering an assessment on the
waste inventorisation including; quantum of MSW generated & quality of MSW (waste composition, physical &
chemical characteristics), followed by a detailed assessment of the existing municipal solid waste
management system across value chain (collection, transportation, sweeping, segregation, processing, and
disposal) in their respective cities.
The situational analysis needs to be supplemented with a detailed assessment of the non-technical needs
including ICE (information, communication, education) interventions to create public awareness, existing
manpower and transition arrangements, aesthetic & environmental aspects and compliance requirements
with respect to existing applicable rules & regulations including MSW Rules, safety & environmental laws etc.
Further it is imperative for a successful PPP project that the urban local bodies /or municipal authorities shall
at the initial stages of project preparation and project structuring consult with all key stakeholders such as
public /or project users, community groups and associated NGOs, private operators, financial institutions,
political representatives, and other government organisations etc. Such public and stakeholder consultations
shall bring out the concerns, apprehensions and acceptance of various stakeholders on the project and the
• Needs assessmentStep 1
• Feasibility Evaluation Step 2
• Scoping and structuringStep 3
• ProcurementStep 4

GoI-ADB-PPP Initiative Improving delivery of MSWM services in India through PPPs
Volume I – Overview and Process 24
ULB /or municipal authority should endeavour to build into the project preparation process the result of such
consultations so that the project structure or performance parameters could be modified to address their
concerns and interest.
Exhibit 3.2 Needs Assessment – key activities
Based on the above analysis, the ULB should define key output parameters and performance indicators that
need to be achieved. The ULB should also make an assessment of its financial status to determine the revenue
surplus /or deficit and status of the capital account to determine how much investment can possibly be
contributed by ULB for the provisions of MSWM services. During this step, the ULB should also make an initial
assessment of possible technical options available for the for various aspects of the MSWM value chain
including collection, transportation & segregation activities and assessment of the technology option for MSW
recovery and scientific disposal of inert/rejects from MSW.
Chapter 4 in this toolkit comprehensively addresses the details on Needs assessment for developing projects in
MSWM sector. The Needs assessment would provide the necessary inputs and basis for conducting financial
viability, scoping and structuring of a PPP project.
3.2 Step 2: Feasibility evaluation
Exhibit 3.3 summarises the activities involved in financial feasibility evaluation. The next phase after initial
assessment & need analysis is to establish the financial viability for the identified project, which determines if
the identified project offers attractive returns on the investment. This is imperative to establish as the
outcomes of the assessment would assist in determining, if any viability gap funding (VGF) either in terms of
capital grants/subsidy and/or additional revenue grant/subsidy is required to make the project viable for a
private sector participation, or the project is viable of its own with the probable revenues stream associated
with the project. The details on the methodology for conducting a financial viability analysis are described in
Chapter 5 of this toolkit.
Step 1:
Needs Assessment
SITUATIONAL ANALYSIS• Waste Inventory (quantity/quality)• MSWM system assessment in line with:
o Service Level Benchmark norms; and o Compliance with Rules & Regulations
• Existing Assets & Manpower assessment• ULB Fiscal/Internal Budget analysis
• Identification of Issues and Gaps• Identification and Prioritization of Actions
Options/Resources forSegregation, Collection
and Transportation
Options / Resources for Recovery, Processing and
Safe Disposal
Analysis of Technical Options
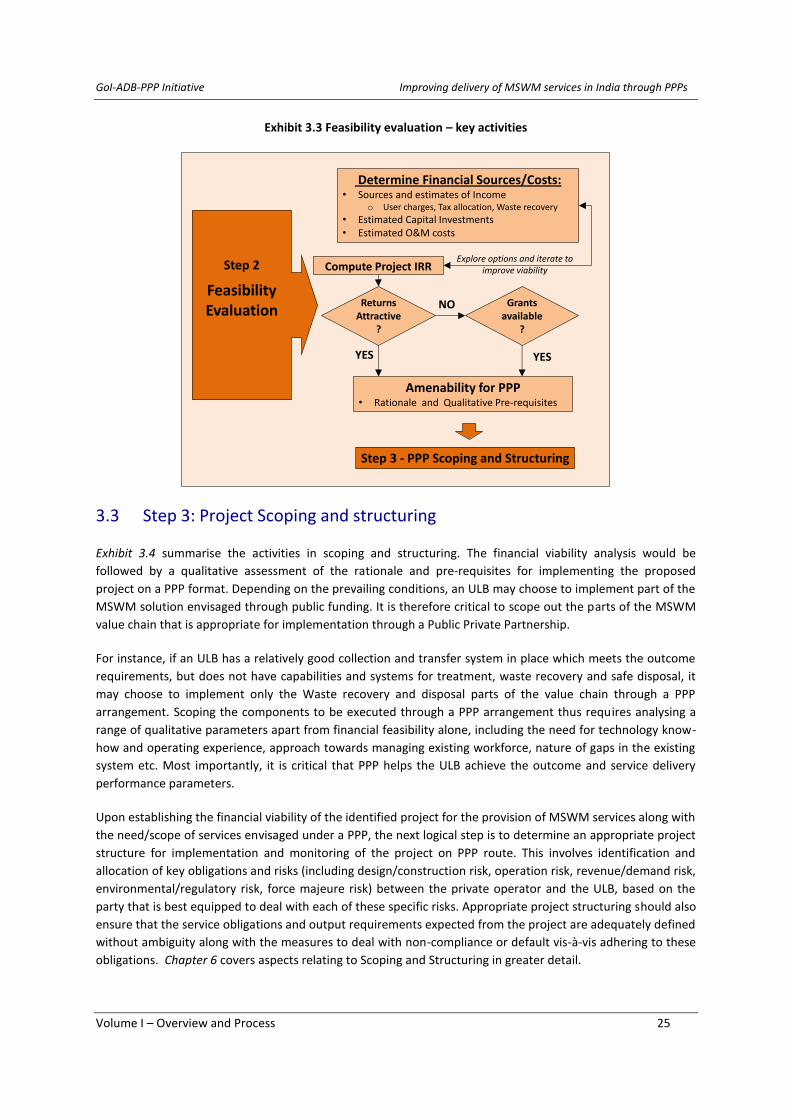
GoI-ADB-PPP Initiative Improving delivery of MSWM services in India through PPPs
Volume I – Overview and Process 25
Exhibit 3.3 Feasibility evaluation – key activities
3.3 Step 3: Project Scoping and structuring
Exhibit 3.4 summarise the activities in scoping and structuring. The financial viability analysis would be
followed by a qualitative assessment of the rationale and pre-requisites for implementing the proposed
project on a PPP format. Depending on the prevailing conditions, an ULB may choose to implement part of the
MSWM solution envisaged through public funding. It is therefore critical to scope out the parts of the MSWM
value chain that is appropriate for implementation through a Public Private Partnership.
For instance, if an ULB has a relatively good collection and transfer system in place which meets the outcome
requirements, but does not have capabilities and systems for treatment, waste recovery and safe disposal, it
may choose to implement only the Waste recovery and disposal parts of the value chain through a PPP
arrangement. Scoping the components to be executed through a PPP arrangement thus requires analysing a
range of qualitative parameters apart from financial feasibility alone, including the need for technology know-
how and operating experience, approach towards managing existing workforce, nature of gaps in the existing
system etc. Most importantly, it is critical that PPP helps the ULB achieve the outcome and service delivery
performance parameters.
Upon establishing the financial viability of the identified project for the provision of MSWM services along with
the need/scope of services envisaged under a PPP, the next logical step is to determine an appropriate project
structure for implementation and monitoring of the project on PPP route. This involves identification and
allocation of key obligations and risks (including design/construction risk, operation risk, revenue/demand risk,
environmental/regulatory risk, force majeure risk) between the private operator and the ULB, based on the
party that is best equipped to deal with each of these specific risks. Appropriate project structuring should also
ensure that the service obligations and output requirements expected from the project are adequately defined
without ambiguity along with the measures to deal with non-compliance or default vis-à-vis adhering to these
obligations. Chapter 6 covers aspects relating to Scoping and Structuring in greater detail.
I
Step 2
Feasibility Evaluation
Determine Financial Sources/Costs:• Sources and estimates of Income
o User charges, Tax allocation, Waste recovery
• Estimated Capital Investments• Estimated O&M costs
Compute Project IRR
Returns Attractive
?
Explore options and iterate to improve viability
Grants available
?
NO
Amenability for PPP• Rationale and Qualitative Pre-requisites
YES YES
Step 3 - PPP Scoping and Structuring

GoI-ADB-PPP Initiative Improving delivery of MSWM services in India through PPPs
Volume I – Overview and Process 26
Exhibit 3.4 Project Scoping and Structuring – key activities
3.4 Step 4: Procurement
Exhibit 3.5 summarise the activities involved in Procurement. An efficient, transparent and well contested
Procurement process leading to selection of a capable and competitive private operator is critical to ensure
efficient and competitive price discovery and effective project implementation.
Exhibit 3.5 Project Procurement – key activities
I
Step 4
Procurement
2. Notice Inviting Applications / Issue of RFQ• Technical and Financial Criteria
3. Issue of RFP to Qualified Private Operators
4. Pre-Bid Meeting and Issue of Clarifications
5. Receipt / Evaluation of Proposals
6. Issue of Letter of Award followed by Signing of Contract
Illustrative steps in a two-stage bidding process. Steps 2 and 3 clubbed in case of a single stage bidding process through issue of Notice Inviting Tender and a composite RFP directly
1. Preparation and Bidding Documentation • RFQ and RFP documents
I
Step 3
Scoping and Structuring
Step 4 - Procurement
Project Scoping• MSWM components by ULB • MSWM components by Private Operator Based on Qualitative analysis of Rationale and Pre-requisites for PPP
Risk Identification and Allocation • Regulatory / Environment risk• Financing risk • Implementation risk • Technology / Operating risk• Demand/ Revenue risk• Others…
Project Structuring • Obligations of Private operator and ULB• Service delivery and performance monitoring • Revenue Model and Payments• Dispute Resolution • Events of Default and Termination• Others…

GoI-ADB-PPP Initiative Improving delivery of MSWM services in India through PPPs
Volume I – Overview and Process 27
The Procurement process involves shortlisting of capable private operators through a combination of
appropriate technical and financial criteria and conducting a bid on the basis of standard bidding documents. A
two-stage bidding process namely a) Shortlisting based on Applications received on the basis of a Request for
Qualification (RFQ) which is done typically on the basis of a combination of Technical and Financial Criteria b)
Selection based on responses to a Request for Proposal (RFP) issued to shortlisted bidders. In some cases, ULBs
may choose to adopt a single stage process covering shortlisting and selection through a composite RFP. In
general the choice of procurement method depends on the ULB budget & capacity, expected level of
competition, end objectives of the PPP intervention etc.
Chapter 7 in this toolkit provides an overview of the procurement process with details on the procurement
documentation, process flow and management. Based on the learning from the case studies developed for
select PPP projects in MSWM sector in the country (detailed case studies presented in Volume II of this
toolkit), and primary interactions with leading private players and select ULB officials, this Toolkit provides
detailed term sheets for 5 different types of PPP options in the MSWM value chain have been developed and
presented in Volume III of this Toolkit. These options include:
1. PPP for Integrated MSWM system (complete value chain)
2. PPP for Waste Processing & disposal facility
3. PPP for MSW processing only
4. PPP for MSW Collection and Transportation
5. PPP for setting up a Mechanized Refuse Transfer Station (MRTS)

GoI-ADB-PPP Initiative Improving delivery of MSWM services in India through PPPs
Volume I – Overview and Process 28
4. Step 1: Needs Assessment
This section outlines the key activities to be carried out in conducting a Needs Assessment for provision of
MSWM services, a necessary pre-cursor for effective development of a MSWM PPP project. It is important to
recognise that aspects of municipal solid waste management are inter-related. For instance, the trends in
quantity and composition of waste generated (in terms of its physical and chemical characteristics) is an
important factor for determining the potential for waste recovery as well as the sizing of Processing/treatment
and Landfill requirements. Hence, there is merit in adopting an integrated approach in delivering effective
waste management services. Consequently, a comprehensive understanding of the various components of the
MSWM value chain within a city through a comprehensive system wide Needs Assessment is the starting point
for development of PPP projects. There are four steps involved in the Needs Assessment stage each of which
are described below:
1. Situation Analysis
2. Crystallising Issues and Gaps
3. Evaluation of Technical options
4. Identification and Prioritisation of Actions
4.1 Situation Analysis
Situation analysis focuses on 4 aspects namely; (i) Waste Inventorisation, (ii) Asset condition assessment, (iii)
Manpower Review and (iv) Analysis of ULB level Finances with focus on MSWM budgets.
4.1.1 Waste Inventorisation
Waste inventorisation involves an assessment of the quantity and quality (composition) of waste generation.
Experience indicates that ULBs often tend to have poor systems to measure even the quantity of waste
generation itself and very often the composition of waste is not monitored except at the dumping sites by the
respective Pollution Control Boards. This needs to be reversed by putting in place adequate systems for
capturing information on the quantity and composition of waste generation. Box 4.1 highlights the significance
of quality and quantity characteristics while designing an appropriate MSWM system.
Box 4.1 Design of Appropriate MSWM System: Influence of Quantity/ characteristics of MSW
Quantity and composition of Waste are major factors in understanding the nature and magnitude of waste management and design of appropriate waste management systems. ULBs should put in place systems to monitor these. Due to the changing consumption patterns, quantities and characteristics of municipal solid waste thus change significantly with time. This aspect is especially significant in the context of growing urbanization in developing countries, where, fast changing socioeconomic conditions influence the pattern of solid waste generation significantly.
Typically waste generation tends to increase with economic growth. However, this increase can be regulated by adoption of appropriate “Reduce, Re-use and Recycling” measures. Conducting regular weighment is necessary to assess the trends in quantity of waste generated. Waste composition also changes over time driven by rising incomes, improved standards of living and changing nature of consumption. For example, paper and plastics content in municipal waste tend to increase with time. Ash and earth content is also expected to decrease with increase in paved surfaces.

GoI-ADB-PPP Initiative Improving delivery of MSWM services in India through PPPs
Volume I – Overview and Process 29
Efficient long-term planning and management of Solid Waste requires ULBs to put in place systems and processes to track baseline information as well as periodic shifts in the quantity and quality of waste generation
Quantity of MSW generation
Even as the ULB initiates steps to put in place systems for capturing information on quantity of waste
generated, there are two methods by which it can do a rapid assessment of waste generation to establish a
reasonably useful baseline for project development
1. Field investigations and Sampling: This involves identifying important points of collection/transfer and
disposal and carrying out a weighing exercise over a period to determine the quantity of waste. This
exercise should ideally be done for a minimum period of 7 days to establish any week level variations and
should also ideally be carried during non-monsoon and monsoon periods to capture the variations due to
change in moisture content of waste (which can be significant). Such surveys can be constrained by the
extent of ‘informal’ parts of the system including unauthorised disposal sites, extent of waste collection
through rag pickers and intermediate capture of waste (such as plastics and paper). Parts of the city may
also have local community level mechanisms including door-to-door collection systems. Thus waste
generation handled by these informal mechanisms could form a sizeable portion of the waste generation
in the city. Therefore any survey to ascertain levels of waste generation need to take into account these
context specific aspects into consideration.
2. Use of standards laid out by CPHEEO and other bodies: For the purposes of project identification, where
an indication of service level must be estimated and data from the project preparation stage have not yet
been developed, the estimate of how much municipal solid waste (MSW) is generated is usually based on
estimated population in the city multiplied by a generation coefficient (per capita waste generation)
measured in kilograms per person per day. These standards are typically laid out by CPHEEO based on
analysis of waste generation in various cities. Exhibit 4.1 and Exhibit 4.2 below presents some facts on
MSW generation coefficient in Indian cities as provided in the CPHEEO manual.2
Exhibit 4.1 MSW generation coefficient in Indian cities
Waste generation coefficients vary according to the
socio-economic activity level in the city
In India, generally varies between 0.2-0.6 kg per
person per day.
Per capita waste generation in Class I Towns in India Approx. 0.4 kg per person per day
Annual Growth of per capita waste generation 1.3%-1.5%
Source: CPHEEO manual
Exhibit 4.2 MSW generation coefficient for various population range cities in India
S No Population Range
(million)
Number of Urban
Centres (Sampled)
Total Population
(million)
Average per capita value
(kg/capita/day)
1 < 0.1 328 68.300 0.21
2 0.1 – 0.5 255 56.914 0.21
3 0.5 – 1.0 31 21.729 0.25
4 1.0 – 2.0 14 17.184 0.27 5 2.0 – 5.0 6 20.597 0.35 6 > 0.5 3 26.306 0.6*
Source: CPHEEO Manual. Note: *0.6kg/capita/day generation of MSW observed in metro cities
2 For more details on the composition and quantity of municipal solid waste in the country, the urban local bodies /or
municipal authorities may also refer to chapter 3 of the CPHEEO Manual on Solid Waste Management. www.cpheeo.nic.in
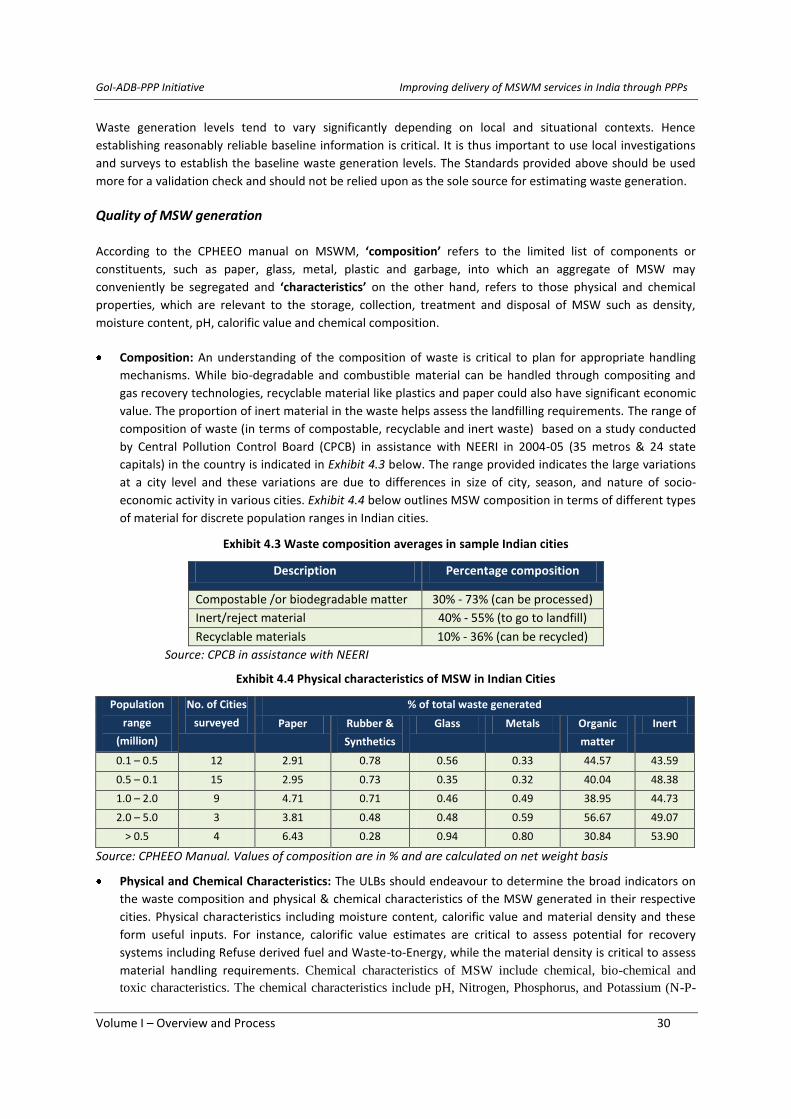
GoI-ADB-PPP Initiative Improving delivery of MSWM services in India through PPPs
Volume I – Overview and Process 30
Waste generation levels tend to vary significantly depending on local and situational contexts. Hence
establishing reasonably reliable baseline information is critical. It is thus important to use local investigations
and surveys to establish the baseline waste generation levels. The Standards provided above should be used
more for a validation check and should not be relied upon as the sole source for estimating waste generation.
Quality of MSW generation
According to the CPHEEO manual on MSWM, ‘composition’ refers to the limited list of components or
constituents, such as paper, glass, metal, plastic and garbage, into which an aggregate of MSW may
conveniently be segregated and ‘characteristics’ on the other hand, refers to those physical and chemical
properties, which are relevant to the storage, collection, treatment and disposal of MSW such as density,
moisture content, pH, calorific value and chemical composition.
Composition: An understanding of the composition of waste is critical to plan for appropriate handling
mechanisms. While bio-degradable and combustible material can be handled through compositing and
gas recovery technologies, recyclable material like plastics and paper could also have significant economic
value. The proportion of inert material in the waste helps assess the landfilling requirements. The range of
composition of waste (in terms of compostable, recyclable and inert waste) based on a study conducted
by Central Pollution Control Board (CPCB) in assistance with NEERI in 2004-05 (35 metros & 24 state
capitals) in the country is indicated in Exhibit 4.3 below. The range provided indicates the large variations
at a city level and these variations are due to differences in size of city, season, and nature of socio-
economic activity in various cities. Exhibit 4.4 below outlines MSW composition in terms of different types
of material for discrete population ranges in Indian cities.
Exhibit 4.3 Waste composition averages in sample Indian cities
Description Percentage composition
Compostable /or biodegradable matter 30% - 73% (can be processed)
Inert/reject material 40% - 55% (to go to landfill)
Recyclable materials 10% - 36% (can be recycled)
Source: CPCB in assistance with NEERI
Exhibit 4.4 Physical characteristics of MSW in Indian Cities
Population
range
(million)
No. of Cities
surveyed
% of total waste generated
Paper Rubber &
Synthetics
Glass Metals Organic
matter
Inert
0.1 – 0.5 12 2.91 0.78 0.56 0.33 44.57 43.59
0.5 – 0.1 15 2.95 0.73 0.35 0.32 40.04 48.38
1.0 – 2.0 9 4.71 0.71 0.46 0.49 38.95 44.73
2.0 – 5.0 3 3.81 0.48 0.48 0.59 56.67 49.07
> 0.5 4 6.43 0.28 0.94 0.80 30.84 53.90
Source: CPHEEO Manual. Values of composition are in % and are calculated on net weight basis
Physical and Chemical Characteristics: The ULBs should endeavour to determine the broad indicators on
the waste composition and physical & chemical characteristics of the MSW generated in their respective
cities. Physical characteristics including moisture content, calorific value and material density and these
form useful inputs. For instance, calorific value estimates are critical to assess potential for recovery
systems including Refuse derived fuel and Waste-to-Energy, while the material density is critical to assess
material handling requirements. Chemical characteristics of MSW include chemical, bio-chemical and
toxic characteristics. The chemical characteristics include pH, Nitrogen, Phosphorus, and Potassium (N-P-

GoI-ADB-PPP Initiative Improving delivery of MSWM services in India through PPPs
Volume I – Overview and Process 31
K), total Carbon, C/N ratio. The Bio-chemical characteristics include biodegradable factors, and Toxicity
characteristics include heavy metals, pesticides, insecticides, toxicity test for Leachates (TCLP) etc. Exhibit
4.5 provides an indicative list of physical and chemical characteristics to be determined along with average
values arrived at in earlier studies. Exhibit 4.6 below outlines the average chemical characteristics of
municipal solid waste for discrete population ranges in Indian cities.
Exhibit 4.5 Broad indicators of Physical & Chemical Characteristics in sample Indian cities
S. No Parameters Range in Indian cities*
PHYSICAL CHARACTERSTICS
1 Moisture Content (%) 20 – 40%
2 Calorific Value (kcal/kg) 800 – 1,000 kcal/kg
3 Density (kg/m3) -----
CHEMICAL CHARACTERSTICS
3 Nitrogen as N 0.5 – 0.7%
4 Phosphorus as P2O5 0.5 – 0.8%
5 Potassium as K2O 0.5 – 0.8%
6 C/N ratio < 30
Source: CPHEEO manual. Note *59 metros & state capitals
Exhibit 4.6 Chemical Characteristics of MSW in Indian Cities
Population
range
(million)
No. Of
Cities
surveyed
Moisture
%
Organic
matter %
Nitrogen
%
Phosphorous
as P2O5 %
Potassium
as K2O %
C/N
ratio
Calorific
value
Kcal/kg
0.1 – 0.5 12 25.81 37.09 0.71 0.63 0.83 30.9 1009.89
0.5 – 0.1 15 19.52 25.14 0.66 0.56 0.69 21.1 900.61
1.0 – 2.0 9 26.98 26.89 0.64 0.82 0.72 23.6 980.05
2.0 – 5.0 3 21.03 25.60 0.56 0.69 0.78 22.4 907.18
> 0.5 4 38.72 39.07 0.56 0.52 0.52 30.1 800.70
Source: CPHEEO Manual. Note: All values, except moisture, are on dry weight basis
Significance of waste inventorisation
1. The assessment of the quantum of MSW getting generated and its density coupled with waste generation
rate (by weight) is important while assessing the payload capacity of the collection equipment and helps in
selection of suitable equipment. The total weight & volume of MSW generated are of greater importance
in planning & design, as it also helps in estimating the number of vehicles required for the collection and
transportation of waste each day.
2. The per capita waste generation is necessary for indicating trends in consumption and production over a
period of time and assists in future planning.
3. The physical property of MSW includes density, moisture content and calorific value and is crucial as
follows:
o Density of waste expressed as its mass per unit volume (kg/m3) is essential for the design of elements
like community storage, transportation, and landfill. For instance – in high income cities, considerable
benefit is derived through the use of compaction vehicles on collection routes, because the waste is
typically of low density.
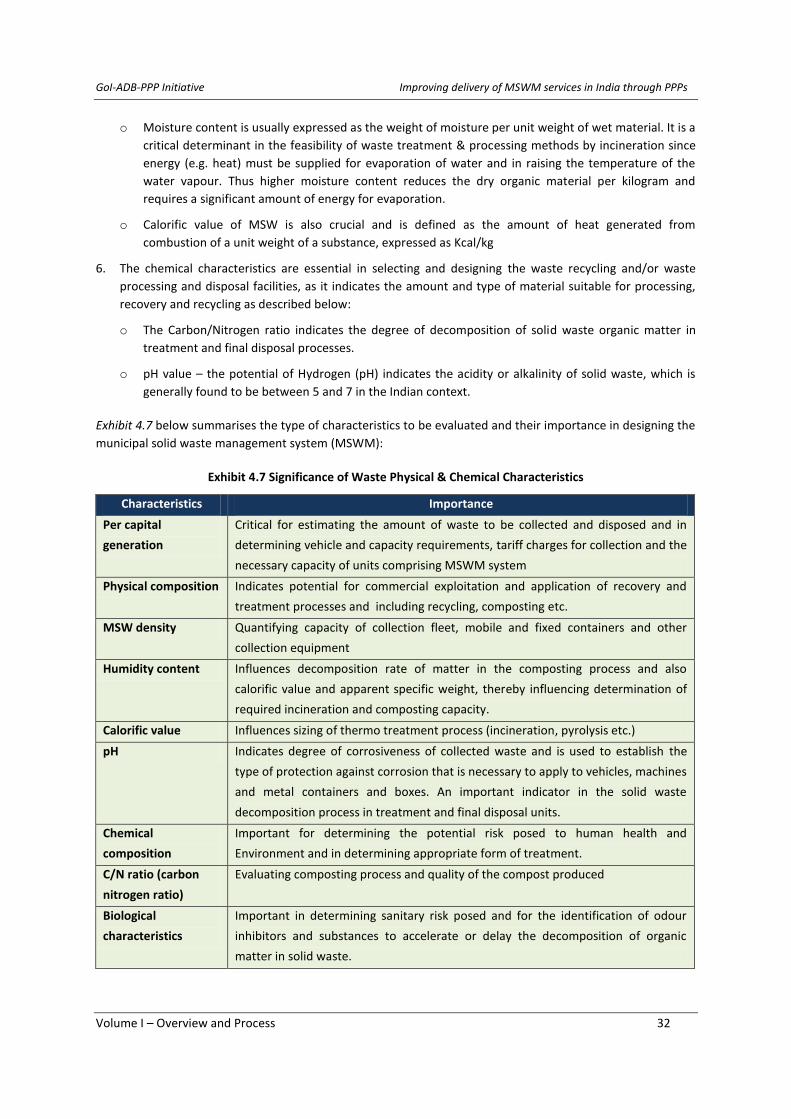
GoI-ADB-PPP Initiative Improving delivery of MSWM services in India through PPPs
Volume I – Overview and Process 32
o Moisture content is usually expressed as the weight of moisture per unit weight of wet material. It is a
critical determinant in the feasibility of waste treatment & processing methods by incineration since
energy (e.g. heat) must be supplied for evaporation of water and in raising the temperature of the
water vapour. Thus higher moisture content reduces the dry organic material per kilogram and
requires a significant amount of energy for evaporation.
o Calorific value of MSW is also crucial and is defined as the amount of heat generated from
combustion of a unit weight of a substance, expressed as Kcal/kg
6. The chemical characteristics are essential in selecting and designing the waste recycling and/or waste
processing and disposal facilities, as it indicates the amount and type of material suitable for processing,
recovery and recycling as described below:
o The Carbon/Nitrogen ratio indicates the degree of decomposition of solid waste organic matter in
treatment and final disposal processes.
o pH value – the potential of Hydrogen (pH) indicates the acidity or alkalinity of solid waste, which is
generally found to be between 5 and 7 in the Indian context.
Exhibit 4.7 below summarises the type of characteristics to be evaluated and their importance in designing the
municipal solid waste management system (MSWM):
Exhibit 4.7 Significance of Waste Physical & Chemical Characteristics
Characteristics Importance
Per capital
generation
Critical for estimating the amount of waste to be collected and disposed and in
determining vehicle and capacity requirements, tariff charges for collection and the
necessary capacity of units comprising MSWM system
Physical composition Indicates potential for commercial exploitation and application of recovery and
treatment processes and including recycling, composting etc.
MSW density Quantifying capacity of collection fleet, mobile and fixed containers and other
collection equipment
Humidity content Influences decomposition rate of matter in the composting process and also
calorific value and apparent specific weight, thereby influencing determination of
required incineration and composting capacity.
Calorific value Influences sizing of thermo treatment process (incineration, pyrolysis etc.)
pH Indicates degree of corrosiveness of collected waste and is used to establish the
type of protection against corrosion that is necessary to apply to vehicles, machines
and metal containers and boxes. An important indicator in the solid waste
decomposition process in treatment and final disposal units.
Chemical
composition
Important for determining the potential risk posed to human health and
Environment and in determining appropriate form of treatment.
C/N ratio (carbon
nitrogen ratio)
Evaluating composting process and quality of the compost produced
Biological
characteristics
Important in determining sanitary risk posed and for the identification of odour
inhibitors and substances to accelerate or delay the decomposition of organic
matter in solid waste.
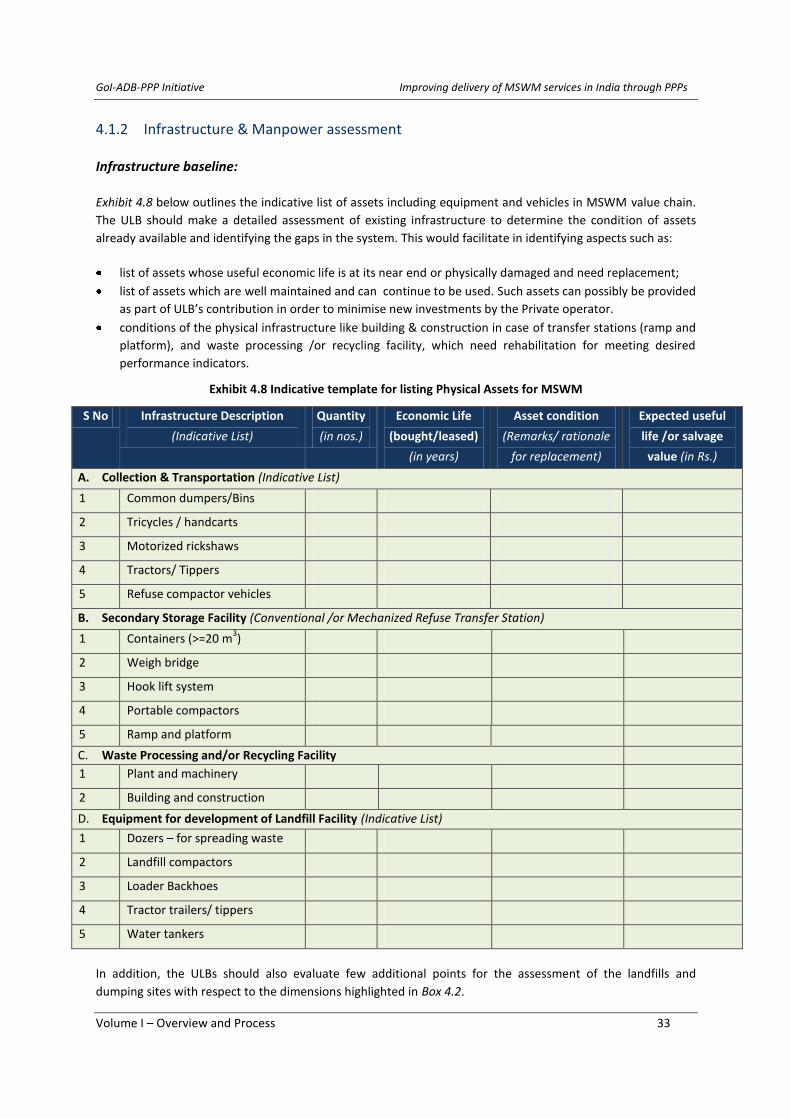
GoI-ADB-PPP Initiative Improving delivery of MSWM services in India through PPPs
Volume I – Overview and Process 33
4.1.2 Infrastructure & Manpower assessment
Infrastructure baseline:
Exhibit 4.8 below outlines the indicative list of assets including equipment and vehicles in MSWM value chain.
The ULB should make a detailed assessment of existing infrastructure to determine the condition of assets
already available and identifying the gaps in the system. This would facilitate in identifying aspects such as:
list of assets whose useful economic life is at its near end or physically damaged and need replacement;
list of assets which are well maintained and can continue to be used. Such assets can possibly be provided
as part of ULB’s contribution in order to minimise new investments by the Private operator.
conditions of the physical infrastructure like building & construction in case of transfer stations (ramp and
platform), and waste processing /or recycling facility, which need rehabilitation for meeting desired
performance indicators.
Exhibit 4.8 Indicative template for listing Physical Assets for MSWM
S No Infrastructure Description
(Indicative List)
Quantity
(in nos.)
Economic Life
(bought/leased)
(in years)
Asset condition
(Remarks/ rationale
for replacement)
Expected useful
life /or salvage
value (in Rs.)
A. Collection & Transportation (Indicative List)
1 Common dumpers/Bins
2 Tricycles / handcarts
3 Motorized rickshaws
4 Tractors/ Tippers
5 Refuse compactor vehicles
B. Secondary Storage Facility (Conventional /or Mechanized Refuse Transfer Station)
1 Containers (>=20 m3)
2 Weigh bridge
3 Hook lift system
4 Portable compactors
5 Ramp and platform
C. Waste Processing and/or Recycling Facility
1 Plant and machinery
2 Building and construction
D. Equipment for development of Landfill Facility (Indicative List)
1 Dozers – for spreading waste
2 Landfill compactors
3 Loader Backhoes
4 Tractor trailers/ tippers
5 Water tankers
In addition, the ULBs should also evaluate few additional points for the assessment of the landfills and
dumping sites with respect to the dimensions highlighted in Box 4.2.

GoI-ADB-PPP Initiative Improving delivery of MSWM services in India through PPPs
Volume I – Overview and Process 34
Box 4.2 Assessment of existing landfills
The ULBs must assess the status & compliance rate of the existing municipal landfill(s) in accordance with the MSW Rules. The assessment should broadly include:
Type: Whether the landfill site is engineered sanitary landfill or conventional dumping yard
Quantity: What are the total quantities of waste lying in the dumping yard (tones) and being added daily
Location, Access and Size: What is the location (from city, ideally from transfer station /or processing
facility); and how big is the landfill area (acres, hectare). What is the access to the landfill (any signage,
fencing, controls)
Life and Available space: What is the remaining landfill life (buffer zones area & capacity)
Technology, Engineering and Safety practices: What is the waste deposition (operation, cover)? What is
the drainage and leachate collection system? What is the aesthetics and nuisances (dust, odours, litter,
visibility)
Other site specific issues.
The above assessment would facilitate a) bringing out reasons for service level gaps which are attributed to
the asset condition (may be obsolete /or non-performing /or in-efficient) or non-availability of required assets
for provision of MSWM services and b) determining areas of investment in infrastructure to achieve the
desired service levels in MSWM system.
Manpower Baseline
Another crucial aspect to consider while determining gaps in the existing MSWM services is the assessment of
capacity and utilization of available manpower. This would facilitate identifying operational issues like low
service coverage and poor efficiency on aspects like waste collection, road sweeping & cleaning, transportation
& disposal that are affecting service levels. Exhibit 4.9 below outlines the format with an indicative list of
hierarchy levels for the provision of services for various components across MSWM value chain:
Exhibit 4.9 Illustrative Format for Existing Manpower Availability in SWM department
S No Category of Manpower Departmental Nature of work
assigned Nos. Shifts
1 Roads Sweeping and Cleaning
a Sweepers
b Supervisor
c Operators
2 Collection, Transfer and Segregation
a Labourer / helper
b Supervisor
c Drivers/Operators
d Mechanic/Fitter etc.
3 Waste Processing
a Labourer / helper
b Operator/ Drivers
c Supervisor/ Technicians
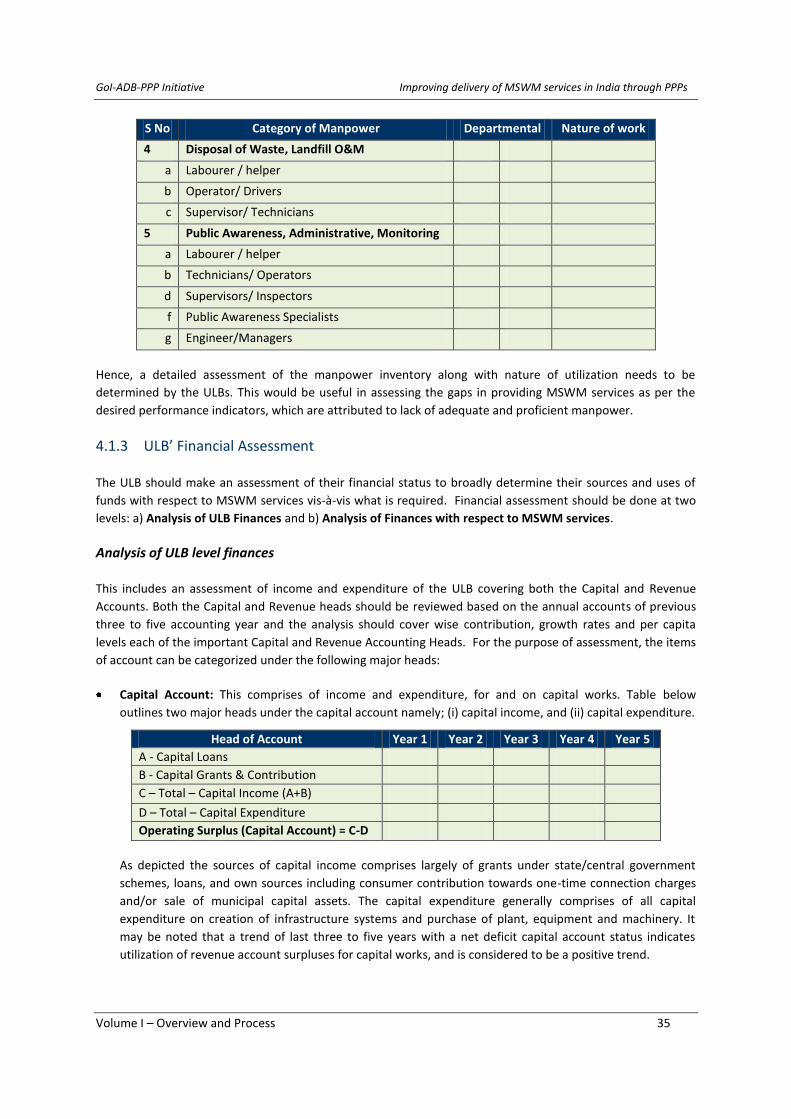
GoI-ADB-PPP Initiative Improving delivery of MSWM services in India through PPPs
Volume I – Overview and Process 35
S No Category of Manpower Departmental Nature of work
assigned 4 Disposal of Waste, Landfill O&M
a Labourer / helper
b Operator/ Drivers
c Supervisor/ Technicians
5 Public Awareness, Administrative, Monitoring
a Labourer / helper
b Technicians/ Operators
d Supervisors/ Inspectors
f Public Awareness Specialists
g Engineer/Managers
Hence, a detailed assessment of the manpower inventory along with nature of utilization needs to be
determined by the ULBs. This would be useful in assessing the gaps in providing MSWM services as per the
desired performance indicators, which are attributed to lack of adequate and proficient manpower.
4.1.3 ULB’ Financial Assessment
The ULB should make an assessment of their financial status to broadly determine their sources and uses of
funds with respect to MSWM services vis-à-vis what is required. Financial assessment should be done at two
levels: a) Analysis of ULB Finances and b) Analysis of Finances with respect to MSWM services.
Analysis of ULB level finances
This includes an assessment of income and expenditure of the ULB covering both the Capital and Revenue
Accounts. Both the Capital and Revenue heads should be reviewed based on the annual accounts of previous
three to five accounting year and the analysis should cover wise contribution, growth rates and per capita
levels each of the important Capital and Revenue Accounting Heads. For the purpose of assessment, the items
of account can be categorized under the following major heads:
Capital Account: This comprises of income and expenditure, for and on capital works. Table below
outlines two major heads under the capital account namely; (i) capital income, and (ii) capital expenditure.
Head of Account Year 1 Year 2 Year 3 Year 4 Year 5
A - Capital Loans
B - Capital Grants & Contribution
C – Total – Capital Income (A+B)
D – Total – Capital Expenditure
Operating Surplus (Capital Account) = C-D
As depicted the sources of capital income comprises largely of grants under state/central government
schemes, loans, and own sources including consumer contribution towards one-time connection charges
and/or sale of municipal capital assets. The capital expenditure generally comprises of all capital
expenditure on creation of infrastructure systems and purchase of plant, equipment and machinery. It
may be noted that a trend of last three to five years with a net deficit capital account status indicates
utilization of revenue account surpluses for capital works, and is considered to be a positive trend.
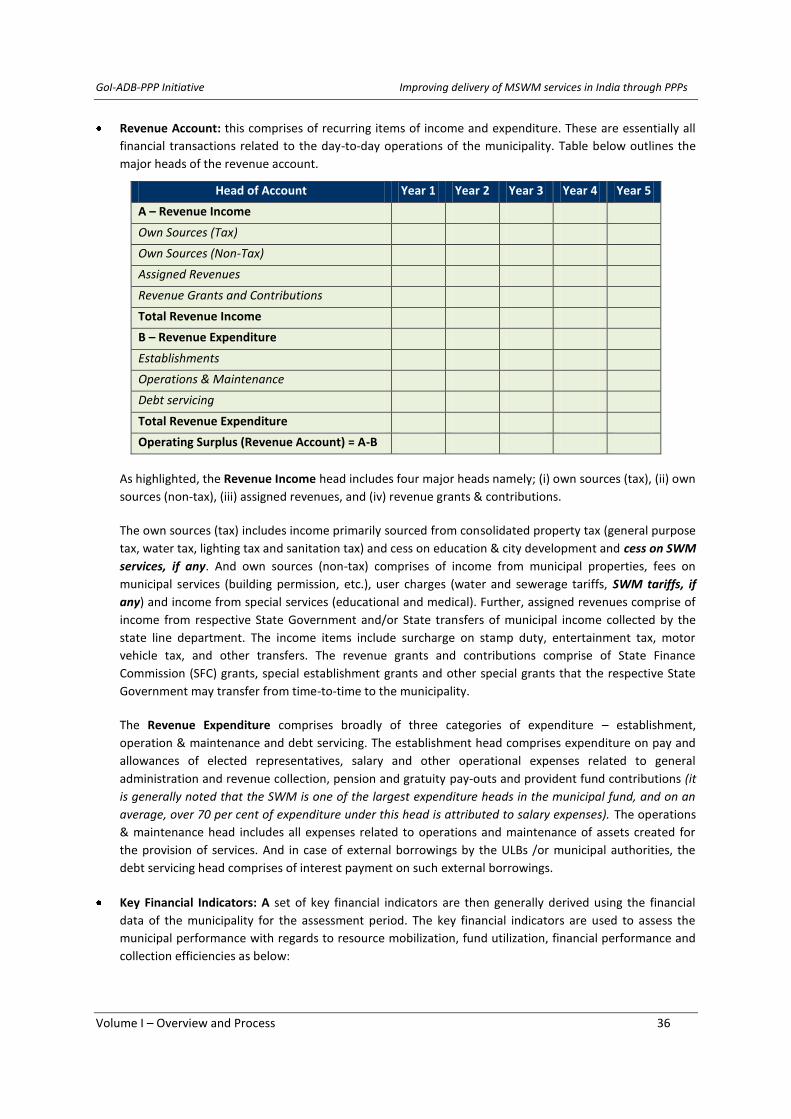
GoI-ADB-PPP Initiative Improving delivery of MSWM services in India through PPPs
Volume I – Overview and Process 36
Revenue Account: this comprises of recurring items of income and expenditure. These are essentially all
financial transactions related to the day-to-day operations of the municipality. Table below outlines the
major heads of the revenue account.
Head of Account Year 1 Year 2 Year 3 Year 4 Year 5
A – Revenue Income
Own Sources (Tax)
Own Sources (Non-Tax)
Assigned Revenues
Revenue Grants and Contributions
Total Revenue Income
B – Revenue Expenditure
Establishments
Operations & Maintenance
Debt servicing
Total Revenue Expenditure
Operating Surplus (Revenue Account) = A-B
As highlighted, the Revenue Income head includes four major heads namely; (i) own sources (tax), (ii) own
sources (non-tax), (iii) assigned revenues, and (iv) revenue grants & contributions.
The own sources (tax) includes income primarily sourced from consolidated property tax (general purpose
tax, water tax, lighting tax and sanitation tax) and cess on education & city development and cess on SWM
services, if any. And own sources (non-tax) comprises of income from municipal properties, fees on
municipal services (building permission, etc.), user charges (water and sewerage tariffs, SWM tariffs, if
any) and income from special services (educational and medical). Further, assigned revenues comprise of
income from respective State Government and/or State transfers of municipal income collected by the
state line department. The income items include surcharge on stamp duty, entertainment tax, motor
vehicle tax, and other transfers. The revenue grants and contributions comprise of State Finance
Commission (SFC) grants, special establishment grants and other special grants that the respective State
Government may transfer from time-to-time to the municipality.
The Revenue Expenditure comprises broadly of three categories of expenditure – establishment,
operation & maintenance and debt servicing. The establishment head comprises expenditure on pay and
allowances of elected representatives, salary and other operational expenses related to general
administration and revenue collection, pension and gratuity pay-outs and provident fund contributions (it
is generally noted that the SWM is one of the largest expenditure heads in the municipal fund, and on an
average, over 70 per cent of expenditure under this head is attributed to salary expenses). The operations
& maintenance head includes all expenses related to operations and maintenance of assets created for
the provision of services. And in case of external borrowings by the ULBs /or municipal authorities, the
debt servicing head comprises of interest payment on such external borrowings.
Key Financial Indicators: A set of key financial indicators are then generally derived using the financial
data of the municipality for the assessment period. The key financial indicators are used to assess the
municipal performance with regards to resource mobilization, fund utilization, financial performance and
collection efficiencies as below:
GoI-ADB-PPP Initiative Improving delivery of MSWM services in India through PPPs
Volume I – Overview and Process 37
o Resource mobilization indicators: these indicators summarize the performance of the municipality
with regards sources of funds. For instance – if in case the revenue income from own sources (both
tax and non-tax) as percentage of total revenue income is substantially higher than the revenue
income from grants and assigned revenues as percentage of total revenue income, it indicates
reliability on grants for operations.
o Fund Application Indicators: These indicators are a measure to ascertain the utilization from the
municipal fund. This is to determine how much percentage of total expenses incurred is spent on
establishment-related heads and how much is spent on operations & maintenance.
o Overall Financial Performance Indicators: These indicators are a measure to assess the overall
financial performance of the municipality with regards operational performance and effective growth
in revenue income and expenditure and include: i) Operating Ratio (OR) or the ratio of revenue
expenditure to revenue income and it indicates “profitability” of local body operations. A OR of less
than one indicates that the ULB has a surplus revenue account. ii) Capital Utilization Ratio (CU) or a
ratio of capital expenditure to the capital income. This ratio indicates the performance of the local
body in terms of utilization of capital income and could also be an indicator of the ULB’s capacity to
utilize capital resources. A capital utilization ratio of greater than unity indicates that the revenue
account surplus has been utilized for capital works, which is a positive feature. A CU ratio below unity
indicates that either capital income is being diverted for revenue expenditure (when OR is also above
1), or that part of the capital income was unspent during the financial year under consideration.
Analysis of MSWM related finances
Apart for a review of overall finances, it is critical to evaluate the specific income and expenditure streams
pertaining to MSWM operations.
Revenue Income: Revenue Income streams for MSWM include user charges, revenue from waste
recovery and budgetary allocation of Property tax/other taxes. Since user charges and revenues from
waste recovery are largely non-existent in most ULBs, SWM expenses are often met directly from general
budget. Therefore very often, ULBs are constrained in earmarking specific revenue streams specifically for
meeting MSWM expenditure. In some ULBs, a portion of property taxes is ‘allocated’ or earmarked,
specifically for SWM services. This is a good practice and needs to be incorporated. Further ULBs should
explore possible means for augmenting revenues specifically from MSWM services.
A review of practices across the country suggests that recovery of SWM costs continues to be primarily
through taxes and there are hardly any instances where cities have shifted to a full user charge based
model in the Indian context. However, possible additional revenue augmentation options based on a
review of practices in select cities are listed below.
c. Bulk Garbage Collection Charges – To start with, sewerage charges can be levied on large bulk Solid
waste generators such as commercial complexes, markets, hotels, function halls and industries. This
practice has been adopted in a few cities like Hyderabad.
d. Voluntary primary collection – In a number of cities, primary collection is being handled through
involvement of NGOs and civic groups, which handle the door-to-door collection and primary transfer
Significance of Fiscal Assessment – The trend analysis of an ULB’s financial status and assessment of the
key financial indicators would facilitate:
1. Determining the investment sustaining capacity of the municipality in the coming short-to-medium
term (3-5 years).
2. Determining the funds available for utilization in the provision of MSWM services.

GoI-ADB-PPP Initiative Improving delivery of MSWM services in India through PPPs
Volume I – Overview and Process 38
of waste from households to transfer points from where the municipal body handles the secondary
collection and transfer. Cost recovery for primary collection effort is managed through conservancy
fees agreed upon by the community and augmenting the same through revenues from composting
and recycling. Such initiatives could be initiated in city areas where there is a strong sense of public
and civic participation and can be progressively extended to other areas. Such citizen hand-holding
and local ownership will also reduce the costs for the municipal corporation and improve waste
collection efficiency.
e. Exploitation of revenue potential from waste recycling and reuse – Recycling, composting and
waste-to-energy projects are seen as a means to actively recover costs of service provision and have
also been implemented in a number of urban local bodies.
Such revenue augmentation mechanisms should be introduced after a careful analysis of willingness and
capacity to pay (through willingness to pay surveys), extent of service delivery commitments with respect
to Urban Poor (where affordability considerations may inhibit levy of user charges and may require cross
subsidisation or grant support) and administrative enforceability and feasibility (for instance, collection
of door-to-door user charges on the basis of volume of waste generated is cumbersome to implement and
it may be more effective to allocate part of property taxes to meet MSWM expenditure in case of
residential households as a means of cost recovery while levying additional user charges for commercial
establishments and large waste generators)
Revenue Expenditure: It is also critical to identify the specific heads of expenditure that pertain to
MSWM. Here again, ULBs may be constrained by the nature of reporting where several MSWM specific
expenditures may be classified under different heads. For instance, costs of manpower may be reported
directly under establishment expenditure. Similarly costs of equipment maintenance may get reported
under different heads like Fuel, repairs etc. It is therefore critical for the ULB to compile and analyse the
expenditure items pertaining to MSWM to establish the baseline O&M costs incurred in absolute terms
and on the basis of expenditure per capita. An analysis of this vis-à-vis the revenue will help the ULB
identify the MSWM services specific financing surplus or gap in the existing system.
4.1.4 Assessment of Service levels and Compliance to regulatory requirements
The assessment of Waste Inventorisation, Manpower/ Asset condition review and Analysis of Finances provide
an understanding of the baseline ‘Inputs’ of the MSWM system. It is also critical to establish the baseline
‘Outputs’ and ‘Outcomes’ achieved by the prevailing MSWM system. This is extremely crucial as very often, a
ULB may have come across fairly well in terms of input indicators, but may fall short of achieving desired
service delivery outcomes. For instance, an ULB may show reasonably good asset availability in terms of
equipment availability vis-à-vis waste generated, but if the waste collection efficiency is less than 60% then
there is a problem. There are two specific aspects of Outcomes that need to be achieved by ULBs with respect
to MSWM services namely, a) Service Levels with respect to Benchmarks and b) Compliance with Regulatory
requirements.
Assessment of baseline Service levels
This can be achieved by comparing the existing MSWM system with the identified Performance Indicators /or
Service Level Benchmarks along with specified norms, developed and documented by the Ministry of Urban
Development, Government of India (MoUD) to be achieved ideally by all urban local bodies /or municipal
authorities in their respective areas. The “Handbook on Service Level Benchmarks”, is a ready reckoner of
sorts to enable ULBs and other city level parastatal agencies to implement systems for measuring, reporting
and monitoring the service level benchmarks. For MSWM system, performance related to reach and access,
effectiveness of network operations and environmental sustainability has been considered, apart from
financial sustainability of operations.

GoI-ADB-PPP Initiative Improving delivery of MSWM services in India through PPPs
Volume I – Overview and Process 39
Exhibit 4.10 outlines the service level benchmarks along with norms as identified by MoUD for MSWM
services. The assessment of the existing MSWM system on the basis of above highlighted parameters would
help the ULB determine gaps in terms of the current service levels vis-à-vis desired service level benchmark
norms. While these performance indicators are most crucial parameters while making an assessment of
service levels, the ULB should also review performance with respect to a few additional factors including the
following:
Road sweeping and cleaning: Identification of road conditions, details on road density (high, medium,
low) for various road classifications based on length & width in the city to design an effective road
cleaning programme and its frequency.
Extent of public awareness and community participation
Service levels specifically with respect to Urban Poor and other special categories: for the provision of
MSWM services in slum areas, markets and other high floating population pockets such as bus terminals,
railway stations etc.
Assessment of baseline regulatory compliance
The Municipal Solid Wastes (Management & Handling) Rules 2000 notified by MoEF provides a comprehensive
framework encompassing collection, transportation, treatment and disposal of municipal solid waste and
provides a detailed set of guidelines, responsibilities and procedures for ULBs. The Rules requires that MSW
generated in the city shall be managed and handled in accordance with the compliance criteria and the
procedures laid down in Schedule II of these Rules. Further the waste processing and disposal facilities to be
set up by the ULBs on their own or through a private operator shall meet the specifications and standards as
specified in Schedules III and IV of MSW Rules. Exhibit 4.11 below outlines the six essential parameters that
need to be considered while designing the MSWM system and outlines the compliance criteria to be
established in accordance with the Municipal Solid Wastes (Management & Handling) Rules for the provision
of MSWM services.
The MSW Rules make it mandatory for a ULB to have design consideration for the MSWM system in line with
the recommended criteria in their respective cities. Further, these criteria would facilitate urban local bodies
/or municipal authorities to establish the gaps and/or issues in the existing MSWM system.

GoI-ADB-PPP Initiative Improving delivery of MSWM services in India through PPPs
Volume I – Overview and Process 40
Exhibit 4.10 Service Level Benchmarks for SWM sector developed by MoUD
S No Performance Indicator Norm Definition Rationale
1
Household level coverage of SWM services through door-to-door collection of municipal solid waste
100%
Number of households & establishments that are covered by daily door-step collection system as percentage of total number of households and establishments in the service area.
This indicator provides the coverage of door-to-door solid waste collection services. Door-step level collection is an essential and critical starting point in the entire chain of specific MSWM services.
2 Efficiency of collection of municipal solid waste
100%
Total waste collected by ULB and authorized service providers as percentage of the total waste generated within the ULB excluding recycling or processing at the generation point. This should exclude any special drives for waste collection, and waste generated from one-off activities such as demolitions, de-silting canals etc.
While the indicator is well understood, the reliability varies significantly on account of different methods used for measurement. Collection efficiency should measure waste collected in normal course by the SWM system. Typically the uncollected waste tends to gradually find its way into recycling, or is strewn along the roads, clogs the drain or in case of organic waste, it putrefies and degrades, hence the significance of collection efficiency indicator.
3
Extent of segregation of municipal solid waste. (Segregation should be at least separation of wet & dry waste at the source. Ideally the segregation should be in the following categories; bio-degradable, non-biodegradable, and hazardous domestic waste like batteries etc.)
100%
Percentage of Household & establishments that segregate their waste. It is important that waste segregated at source, is not mixed again, but transported through the entire value chain in a segregated manner. Hence the need to consider the measurement of MSW arriving in segregated manner at the treatment/disposal site, than measuring the same at the collection point. Extent of Segregation = Quantum of MSW that is segregated as percentage of total quantum of MSW that is collected by the ULB or authorised service provider.
Segregation of waste is a critical requirement for sustainable solid waste management systems. Segregations enables recycling, reuse, treatment and scientific disposal of the different components of waste. Segregation of waste should ideally be at source, and should then also be transported in a segregated manner up to the point of treatment and /or disposal. If waste is received at these points in a segregated manner, it can be safely assumed, that it has been segregated at source and transported so; while the converse may not be true. Therefore, segregation is being measured at this point of receipt, rather than at point of collection.
4 Extent of municipal solid waste recovered
80%
This is an indication of the quantum of waste collected, which is either recycled or processed. This is expressed in terms of % of total waste collected.
Environmental sustainability demands that maximum extent of waste should be recycled, reused or processed. While the processing, recycling and reuse should be carried out without creating any health and environmental hazards, the total quantum of waste recovered is in itself a key performance parameter. Therefore, measurement of this indicator is critical. The benchmark value for this indicator will depend on the amount of inert matter comprised in the waste collected by the ULB.
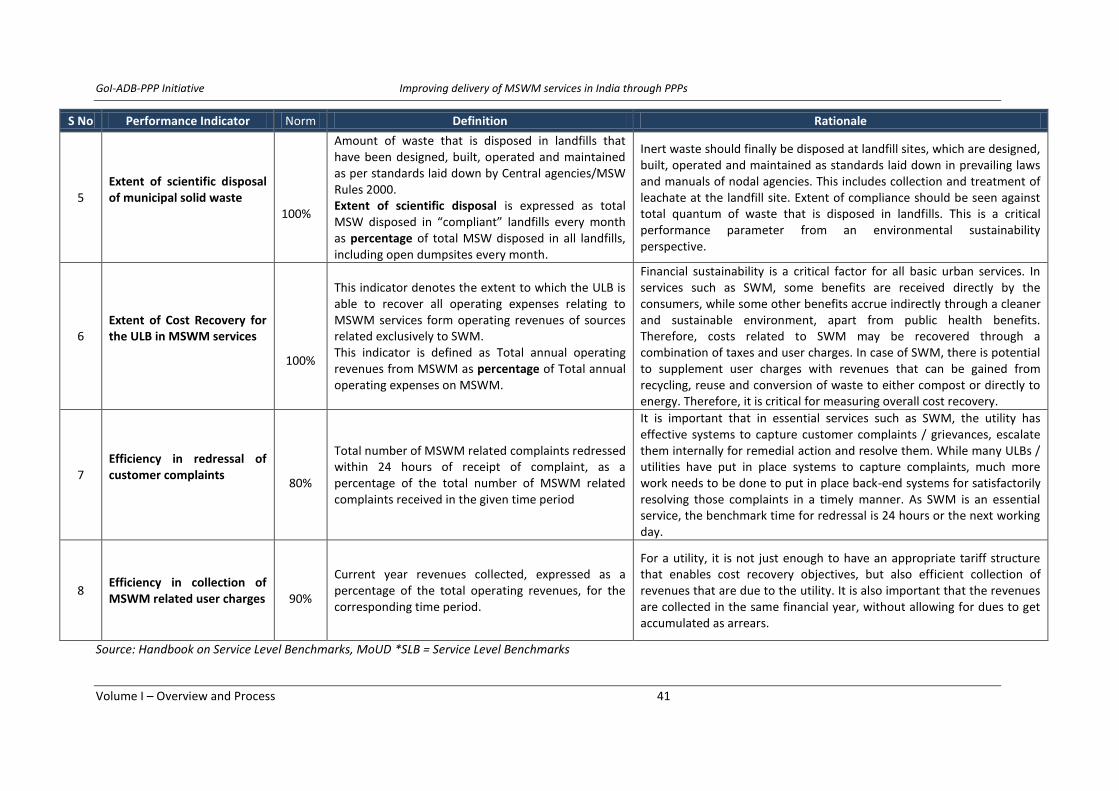
GoI-ADB-PPP Initiative Improving delivery of MSWM services in India through PPPs
Volume I – Overview and Process 41
S No Performance Indicator Norm Definition Rationale
5 Extent of scientific disposal of municipal solid waste
100%
Amount of waste that is disposed in landfills that have been designed, built, operated and maintained as per standards laid down by Central agencies/MSW Rules 2000. Extent of scientific disposal is expressed as total MSW disposed in “compliant” landfills every month as percentage of total MSW disposed in all landfills, including open dumpsites every month.
Inert waste should finally be disposed at landfill sites, which are designed, built, operated and maintained as standards laid down in prevailing laws and manuals of nodal agencies. This includes collection and treatment of leachate at the landfill site. Extent of compliance should be seen against total quantum of waste that is disposed in landfills. This is a critical performance parameter from an environmental sustainability perspective.
6 Extent of Cost Recovery for the ULB in MSWM services
100%
This indicator denotes the extent to which the ULB is able to recover all operating expenses relating to MSWM services form operating revenues of sources related exclusively to SWM. This indicator is defined as Total annual operating revenues from MSWM as percentage of Total annual operating expenses on MSWM.
Financial sustainability is a critical factor for all basic urban services. In services such as SWM, some benefits are received directly by the consumers, while some other benefits accrue indirectly through a cleaner and sustainable environment, apart from public health benefits. Therefore, costs related to SWM may be recovered through a combination of taxes and user charges. In case of SWM, there is potential to supplement user charges with revenues that can be gained from recycling, reuse and conversion of waste to either compost or directly to energy. Therefore, it is critical for measuring overall cost recovery.
7 Efficiency in redressal of customer complaints
80%
Total number of MSWM related complaints redressed within 24 hours of receipt of complaint, as a percentage of the total number of MSWM related complaints received in the given time period
It is important that in essential services such as SWM, the utility has effective systems to capture customer complaints / grievances, escalate them internally for remedial action and resolve them. While many ULBs / utilities have put in place systems to capture complaints, much more work needs to be done to put in place back-end systems for satisfactorily resolving those complaints in a timely manner. As SWM is an essential service, the benchmark time for redressal is 24 hours or the next working day.
8 Efficiency in collection of MSWM related user charges
90%
Current year revenues collected, expressed as a percentage of the total operating revenues, for the corresponding time period.
For a utility, it is not just enough to have an appropriate tariff structure that enables cost recovery objectives, but also efficient collection of revenues that are due to the utility. It is also important that the revenues are collected in the same financial year, without allowing for dues to get accumulated as arrears.
Source: Handbook on Service Level Benchmarks, MoUD *SLB = Service Level Benchmarks
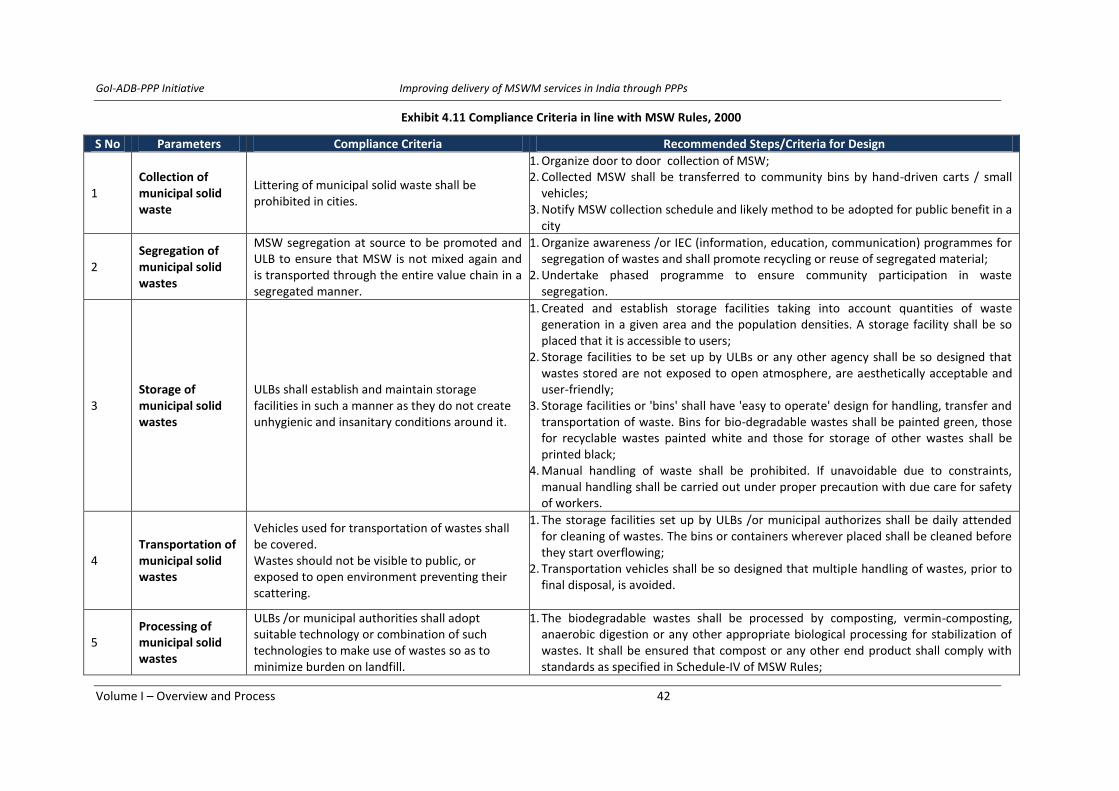
GoI-ADB-PPP Initiative Improving delivery of MSWM services in India through PPPs
Volume I – Overview and Process 42
Exhibit 4.11 Compliance Criteria in line with MSW Rules, 2000
S No Parameters Compliance Criteria Recommended Steps/Criteria for Design
1 Collection of municipal solid waste
Littering of municipal solid waste shall be prohibited in cities.
1. Organize door to door collection of MSW; 2. Collected MSW shall be transferred to community bins by hand-driven carts / small
vehicles; 3. Notify MSW collection schedule and likely method to be adopted for public benefit in a
city
2 Segregation of municipal solid wastes
MSW segregation at source to be promoted and ULB to ensure that MSW is not mixed again and is transported through the entire value chain in a segregated manner.
1. Organize awareness /or IEC (information, education, communication) programmes for segregation of wastes and shall promote recycling or reuse of segregated material;
2. Undertake phased programme to ensure community participation in waste segregation.
3 Storage of municipal solid wastes
ULBs shall establish and maintain storage facilities in such a manner as they do not create unhygienic and insanitary conditions around it.
1. Created and establish storage facilities taking into account quantities of waste generation in a given area and the population densities. A storage facility shall be so placed that it is accessible to users;
2. Storage facilities to be set up by ULBs or any other agency shall be so designed that wastes stored are not exposed to open atmosphere, are aesthetically acceptable and user-friendly;
3. Storage facilities or 'bins' shall have 'easy to operate' design for handling, transfer and transportation of waste. Bins for bio-degradable wastes shall be painted green, those for recyclable wastes painted white and those for storage of other wastes shall be printed black;
4. Manual handling of waste shall be prohibited. If unavoidable due to constraints, manual handling shall be carried out under proper precaution with due care for safety of workers.
4 Transportation of municipal solid wastes
Vehicles used for transportation of wastes shall be covered. Wastes should not be visible to public, or exposed to open environment preventing their scattering.
1. The storage facilities set up by ULBs /or municipal authorizes shall be daily attended for cleaning of wastes. The bins or containers wherever placed shall be cleaned before they start overflowing;
2. Transportation vehicles shall be so designed that multiple handling of wastes, prior to final disposal, is avoided.
5 Processing of municipal solid wastes
ULBs /or municipal authorities shall adopt suitable technology or combination of such technologies to make use of wastes so as to minimize burden on landfill.
1. The biodegradable wastes shall be processed by composting, vermin-composting, anaerobic digestion or any other appropriate biological processing for stabilization of wastes. It shall be ensured that compost or any other end product shall comply with standards as specified in Schedule-IV of MSW Rules;

GoI-ADB-PPP Initiative Improving delivery of MSWM services in India through PPPs
Volume I – Overview and Process 43
S No Parameters Compliance Criteria Recommended Steps/Criteria for Design
2. Mixed waste containing recoverable resources shall follow the route of recycling. 3. Incineration with or without energy recovery including pelletisation can also be used
for processing wastes in specific cases. 4. Municipal authority or the operator of a facility wishing to use other state-of-the-art
technologies shall approach the Central Pollution Control Board to get the standards laid down before applying for grant of authorization.
6 Disposal of municipal solid wastes
Land filling shall be restricted to non-biodegradable, inert waste and other waste that are not suitable either for recycling or for biological processing.
1. Land filling shall also be carried out for residues of waste processing facilities as well as pre-processing rejects from waste processing facilities;
2. Land filling of mixed waste shall be avoided unless same is unsuitable for waste processing;
3. Under unavoidable circumstances or till installation of alternate facilities, land-filling shall be done following proper norms;
4. Landfill sites shall meet the specifications as given in Schedule –III of MSW Rules.

GoI-ADB-PPP Initiative Improving delivery of MSWM services in India through PPPs
Volume I – Overview and Process 44
4.2 Crystallising Issues and Gaps
The next step in Needs Assessment is to identify key issues and/or problems in the existing municipal solid
waste management system in the city. As outlined in the preceding section 4.1, the ULB shall make a detailed
assessment of the waste inventory and its composition, followed by an assessment of the existing
assets/infrastructure and adequacy of the existing manpower and their technical capacity for the provision of
MSWM services. Factoring compliance vis-à-vis Municipal Solid Wastes (Management & Handling) Rules 2000
and desired performance indicators as indicated by Service Level Benchmarks norms for provision of MSWM
services also ensures focus on outcomes during the Needs Assessment stage as discussed. Based on this
assessment, the ULBs shall clearly identify the issues and/or problems in the existing municipal solid waste
management system in their respective cities. Box 4.3 below outlines the most commonly observed
issues/bottlenecks in the provision of MSWM services in the Indian context:
Box 4.3 Indicative Issues in MSWM system
1. Absence of waste storage system at Source (households, commercial establishments etc)
2. Lack of proper waste segregation system at Source
3. Low coverage – lack of adequate primary collection (door-to-door) system
4. Low collection efficiency – lack of proper primary collection (door-to-door) system
5. Lack of proper street sweeping and cleaning on regular basis
6. Waste transportation mostly done in un-covered/open vehicles
7. Redundant/Out-dated vehicles for MSW transportation
8. Design and location of MSW storage depots inappropriate, resulting in littering of waste
9. Absence of waste processing facility and waste collected is disposed directly into landfills
10. Final disposal is done through crude dumping in open dumping yards
11. Lack of an appropriate institutional arrangement for MSWM, planning and designing in ULB
12. Lack of awareness creation mechanism
13. Low efficiency in collection of SWM related user charges
14. Lack of efficient customer complaint management and redressal
The indicative list of issues and/or problems in the MSWM system highlighted above are based on the primary
interactions with select ULB’ officials for preparation of baseline status reports of the identified Satellite Towns
(detailed reports are presented in Volume II of this toolkit) and reports on select PPP case studies in MSWM
system (detailed case studies are also presented in Volume III of this toolkit) and secondary research. Once the
issues and/or problems in the existing MSWM system are identified, the ULBs should endeavour to map the
issues identified in the existing MSWM system with the gaps in two major categories; (i) capacity/capability
gaps to operate and manage MSWM system, and (ii) infrastructure gaps for the provision of MSWM services as
shown in Exhibit 4.12 below. This mapping exercise would facilitate urban local bodies /or municipal
authorities to identify key reasons for the existence of a particular problem relating to operational /or service
level gaps for the provision of MSWM services. For instance –
low waste collection efficiency may be attributed to reasons like inadequate manpower, lack of funds, out
dated/redundant collection and transport equipment, vehicles etc.
service level gaps in proper waste processing capacity may be assigned to reasons like lack of technical
expertise/exposure to modern techniques, lack of funds at ULB levels etc.
low collection efficiency in SWM related user charges may be assigned to lack of adequate manpower,
lack of awareness /or community participation, lack of proper services causing discontent in the customer,
hence, high default rates etc.

GoI-ADB-PPP Initiative Improving delivery of MSWM services in India through PPPs
Volume I – Overview and Process 45
Exhibit 4.12 Mapping Issues and Gaps
The intention of the mapping exercise is to gain clarity on various factors /or parameters causing gaps in
achieving the desired service level benchmarks and defiance in complying with the MSW Rules for the
provision of MSWM services. Exhibit 4.13 below depicts the mapping of the key issues in MSWM system with
indicative list of reasons for operational or service level gaps. The mapping of key identified issues to the likely
reasons for the gaps would also facilitate the ULB in identification of the priority areas for improvement to
match the desired performance indicators in line with prescribed service level benchmarks and/or compliance
rate with MSW Rules.
Capacity/Capability Issues:
Lack of adequate manpower
Lack of technical expertise
Lack of funds at ULB level
Lack of awareness mechanism /community participation
Infrastructure related Issues:
Collection/ Transport Equipment
Secondary Storage Infrastructure
Waste Processing Technology/ Infrastructure
Engineered Sanitary Landfill site
Operational/ Service level Gaps:
Low service coverage area
Low waste collection efficiency
Low waste recovery/ processing
Low scientific disposal of waste
Low redressal of user complaints
Low user fee collection efficiency
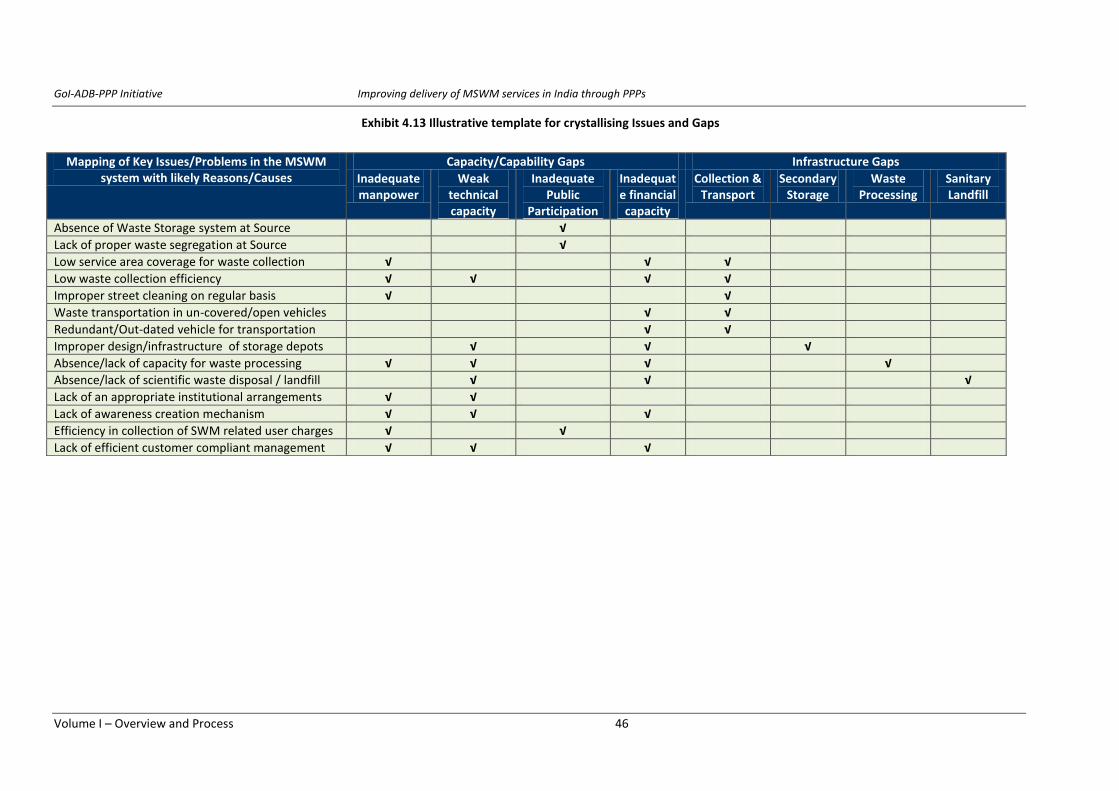
GoI-ADB-PPP Initiative Improving delivery of MSWM services in India through PPPs
Volume I – Overview and Process 46
Exhibit 4.13 Illustrative template for crystallising Issues and Gaps
Mapping of Key Issues/Problems in the MSWM system with likely Reasons/Causes
Capacity/Capability Gaps Infrastructure Gaps
Inadequate manpower
Weak technical capacity
Inadequate Public
Participation
Inadequate financial capacity
Collection & Transport
Secondary Storage
Waste Processing
Sanitary Landfill
Absence of Waste Storage system at Source √
Lack of proper waste segregation at Source √
Low service area coverage for waste collection √ √ √
Low waste collection efficiency √ √ √ √
Improper street cleaning on regular basis √ √
Waste transportation in un-covered/open vehicles √ √
Redundant/Out-dated vehicle for transportation √ √
Improper design/infrastructure of storage depots √ √ √
Absence/lack of capacity for waste processing √ √ √ √
Absence/lack of scientific waste disposal / landfill √ √ √
Lack of an appropriate institutional arrangements √ √
Lack of awareness creation mechanism √ √ √
Efficiency in collection of SWM related user charges √ √
Lack of efficient customer compliant management √ √ √
GoI-ADB-PPP Initiative Improving delivery of MSWM services in India through PPPs
Volume I – Overview and Process 47
4.3 Evaluation of Technical options
The next step after identification key issues/or problems in the existing municipal solid waste management
system is to conduct a detailed technical option analysis for selecting various available options /or resources
/or technology to implement an effective municipal solid waste management system in the city. It is to be
noted that municipal solid waste management activities are inter-related, and there are many technical
options for nearly every activity in the entire value chain of MSWM system. For instance, the technical options
for waste collection can vary from handcarts and bullock carts, to farm tractors and trailers, to the most
modern compaction vehicles with varying capacities. Hence, there is a need to assess all these options in
totality i.e., taking into consideration all the components of the value chain as options in one component may
affect the selection of technical options in another activity of the system, before making any suitable
recommendation for the complete MSWM system.
The technical options analysis will be driven by the needs identified in each component of service delivery:
generation, collection and transport, minimization and recycling, treatment and disposal as discussed in the
preceding section. The technical options analysis should: a) Definition of option, b) Preparation of preliminary
cost estimate and c) evaluation of technical appropriateness, environmental impact and financial feasibility
The objective is to develop each technical option to the point where the urban local bodies /or municipal
authorities can make an informed decision about which options to pursue and its impact on other components
of the value chain. This section outlines the broad parameters to be considered while conducting technical
options analysis across the entire MSWM value chain including sorting & segregation, collection &
transportation, secondary storage system, waste processing, disposal & sanitary landfill.
Sorting and Segregation
The term sorting in municipal solid waste management system indicates separation and storage of individual
constituents of waste material and is generally used synonymously with ‘separation’ and ‘segregation’. The
main objectives of sorting in the Indian context are; (i) storing of recyclables separately for reuse, (ii) storing of
organic portion separately for further processing, and (iii) waste minimization for final disposal to landfill sites.
Sorting can be done at various levels namely, i) at the source/ household level, ii) At the community bins
(municipal bins), iii) At a transfer station /or centralised sorting facility, d) At waste processing facility (pre-
sorting and post-sorting) and e) At the landfill site. It is recommended that the sorting of waste at the source
must be accorded the highest priority by the ULBs. However, if source level sorting is not developed, then
sorting at the community level/ waste storage depot/ processing facility may be considered till a household-
level sorting and collection system is established.
A central sorting facility can be established if the cost of setting up and operating such a facility is met through
the returns accruing from supply of recyclables to various vendors. In the present scenario, a central sorting
facility at an intermediate stage is not visualized to be a viable option in India since the rag-pickers recover
most of the valuable recyclables at the source. Pre-sorting at waste processing facilities is desirable to ensure
that the processed output (such as compost) meets the regulatory standards. At small or decentralised waste
processing facilities, receiving less than 25 tonnes per day of waste, manual pre-sorting is recommended prior
to processing. For waste processing facilities receiving more than 25 tonnes per day of waste, semi-
mechanized pre-sorting is recommended as per CPHEEO manual on SWM.
Technical Options Considerations – The sorting operations can be carried out manually or through semi-
mechanized and fully mechanized systems as indicated below:

GoI-ADB-PPP Initiative Improving delivery of MSWM services in India through PPPs
Volume I – Overview and Process 48
Metal Container/Dumper
o manual sorting comprises activities like unloading of waste collected, manually spreading the waste,
handpicking visually identifiable waste for reuse, and collecting the remaining waste;
o semi-mechanized sorting comprises mechanized unloading of waste, mechanized loading of waste on
conveyor belts (belts may be having magnetic parts at particular locations to collect ferrous material),
handpicking visually identifiable waste for reuse, and mechanized collection, stocking and reloading of
remaining waste; and
o fully-mechanized sorting comprises mechanized unloading of waste, size reduction of waste through
shredders and crushers, size separation of waste using screening devices, density separation (air
classification) of waste, magnetic separation of waste, compaction of waste through balers/crushers,
and reloading of waste. However, semi-mechanized and fully-mechanized sorting systems are used at
central sorting facilities.
The ULBs shall consider options for semi or fully-mechanized sorting only when – there is a probable case of larger economies of scale of recycling units and better product quality to be able to recover higher costs attached with such systems compared to manual sorting systems.
Collection and Transportation
Primary collection & transportation is imperative to ensure that municipal solid waste stored at source is
collected on regular basis and it is not disposed of on the streets, drains, and water bodies etc. The urban local
bodies /or municipal authorities shall endeavour to design an appropriate system of primary collection &
transportation of municipal solid waste such that it synchronizes with storage of MSW at source as well as
waste storage depots facility.
The system shall ensure that waste collected is
transported in a segregated manner processing
/or disposal site. Further, the quality of
collection & transportation system depends
primarily on an appropriate waste storage
system and carefully selected locations for
waste storage in case of community bins, and
waste collection at pre-decided time and frequency. The waste storage system design must be in sync with the
primary collection system to improve the accessibility, ease of operation and for operational efficiency gains
with minimal manual handling wherever possible. The commonly used waste storage include (i) metal
containers/dumpers and (ii) plastic bins with or without wheels.
Further, the waste storage system should have the following characteristics:
A maximum loaded weight of around 30 kg if the collection is manual
Devices that facilitate its movement between its place in the building and
the place of collection
Closable in order to avoid waste spillage or exposure
Economical and affordable for the general public
Not producing excessive noise while handling
Easy to empty without leaving waste at the bottom
Box 4.4 Parameters for selecting Waste Storage system
Municipal solid waste characteristics
Quantum of MSW generation
Frequency of collection
Type of location/building
Container price considerations
Plastic Wheel Bin

GoI-ADB-PPP Initiative Improving delivery of MSWM services in India through PPPs
Volume I – Overview and Process 49
Larger containers should be standardized so that they can be handled by mechanical devices incorporated in
the collector vehicles.
The urban local bodies /or municipal authorities shall arrange for the primary collection of waste stored at
various sources of waste generation by any of the following methods or combination of more than one
method:
Doorstep collection of waste through containerized handcarts/tricycles or other
similar means with active community participation.
Doorstep collection of waste through motorized vehicles having non-conventional/
sounding horns deployed for doorstep waste collection with active community
participation.
Collection through community bins from private societies multi-storied buildings,
commercial complexes etc.
Doorstep or lane-wise collection of waste from authorized/unauthorized slums or
collection from community bins to be provided in the slums by local bodies.
There are two types of specialized vehicle in general use for collection and transportation of municipal solid
waste namely; (i) compactors – rear loader or side loader, and (ii) without compaction – with the box closed by
sliding doors. Particularly in smaller cities with limited budgetary resources conventional open dump trucks are
frequently used. However, a good municipal solid waste collection vehicle should have the following
characteristics:
that it should not spill waste or leachate on the street; preferably rear loading
a compaction rate of at least 3:1, that is 3m3 are reduced by compaction to 1m
3
good manoeuvrability and potency for steep inclines
lifting devices to empty different types of containers
adequate carrying capacity to minimize the trips to waste destination
It is generally recommended that in case of municipal solid waste generation of more than 280 tons per day
and depending on the distance of final disposal landfill site (20 km and above), the most suitable technical
solution is to use compactor vehicles to gain transport efficiencies. However, due to the characteristics of a
particular service provision area/location (the conditions of the street, topography, manoeuvring conditions
etc.) sometimes this is not an ideal option for operational or economic reasons. In such cases, the urban local
bodies /or municipal authorities shall select the most cost efficient type of vehicle and equipment. The
requirement of the large containers and vehicles may be worked out on the basis of total waste quantity and
the number of trips in two shifts.
Roll-on/Roll-off Truck Dumper Carrier Truck Mechanised bin tipping

GoI-ADB-PPP Initiative Improving delivery of MSWM services in India through PPPs
Volume I – Overview and Process 50
Box 4.5 Parameters to be considered for Collection & Transportation (C&T) system:
C&T must synchronise with bulk storage of waste at the temporary waste storage depots;
Multiple and manual handling of waste should be avoided; Large containers should be standardized to
reduce manual loading to collector vehicles;
Handcarts/tricycles to be preferred in narrow lanes where motorised vehicles can’t enter;
Handcart/tricycle should have 4-6 detachable containers of capacity ranging from 30-40 litre;
All vehicles should be utilized in two shifts to lift containers, to ensure full utilization;
Selection of the type of vehicles should be done based on a) Quantity of waste to be transported, b) The
distances to be travelled for waste disposal and c) Road conditions and availability of workshop facilities
for regular maintenance etc.
In cities above 5 lakh population, hydraulic vehicles could be used for waste transportation;
In small cities under 5 lakh population, where small size containers of 0.5-1.0 cum are used, the refuse
collection machine without compaction device of 6-15 cum capacity to be used.
In small cities under 5 lakh population with poor repairs & maintenance facility, where hi-tech vehicles
may not work efficiently, tractor-trolley combination or lifting /toeing of container by tractors may be
used.
Transfer Stations
Transfer stations are secondary storage depots established close to areas of large-scale waste generation so
that collection trucks can unload there and return rapidly to continue their collection route and meet desired
service level benchmarks related to coverage area, collection efficiency etc. It is generally noted that the
disposal sites are being established further and further away from centres of large scale waste generation,
which creates following issues:
delays in completing collection routes thus prolonging the time that waste is exposed on the street
increased unproductive time that collection teams spend waiting for the return of the truck from
unloading at the landfill
increased transport costs
To solve these problems some municipalities are establishing the transfer stations, where in, waste is first
stored in bulk in these transfer stations and is then transported to the sanitary landfill by a larger vehicle that
involves lower transport cost per unit.
Box 4.6 Parameters for setting up of Transfer Station
In general, transfer stations are considered when the distance between the location of large-scale
collection activities and the landfill is greater than 20 km.
However, in larger cities where traffic conditions make travel very slow, transfer stations are sometimes
used even when the distance to the sanitary landfill is shorter.
Moreover, the mechanised refuse transfer station (MRTS) is preferred depending on the quantity (more
than critical mass of 280 TPD) and distance of the landfill site (20 km and above) in a particular city.

GoI-ADB-PPP Initiative Improving delivery of MSWM services in India through PPPs
Volume I – Overview and Process 51
However, it is strongly recommended that the establishment of a transfer station should be preceded by a
feasibility study that evaluates the economic and operational advantages that it could provide to the collection
system. The urban local bodies are also required to consider the option for various types of transfer stations
that can be established depending upon the quantum of waste generation, collection and transportation
system, need for a separate sorting/segregation unit, distance of processing facility /or disposal site etc. The
section below briefly outlines the various types of transfer stations
design which can be considered based upon above mentioned
parameters:
Direct transfer station – it is the most commonly used type of
transfer station. It has a ramp and platform arrangement where in
the incoming loaded vehicle moves to a higher level for unloading
directly into the carrier truck below. These can be with or without
storage facility for segregation. In case of no storage, a larger fleet of vehicles is required to avoid long
waiting periods for the collection trucks for unloading.
Mechanized Refuse transfer station – it comprises of a
hopper and hook lift system other than conventional ramp
and platform arrangement. The main objective of these
stations is to increase the specific mass of waste in order to
reduce transport costs. There is a compaction unit along
with hopper arrangement for compacting the incoming solid
waste and there are hook lift containers in which the waste is compacted and these containers are loaded
to the trailers using mechanical arrangement without any manual handling.
Municipal Solid Waste Treatment
The objectives of municipal solid waste treatment are to reduce its volume and to lower its contaminating
potential by transforming it into inert /or biological stable material. The processes that can be applied to
municipal solid waste are either thermal or biological.
The thermal processes include; (i) incineration – controlled burning at high temperature in purpose built
equipment with environmental control devices, (ii) pyrolysis –thermally induced waste degradation in the
absence, or limited presence, of oxygen at a lower temperature than that involved in incineration, producing
high energy liquids and gases and less atmospheric contamination.
The biological processes include; (i) aerobic – stabilization and composting processes that principally generate
water, carbon dioxide and heat; and (ii) anaerobic – important for the production of methane. Waste
degradation is slower and generates fatty acids, acetic acid, other acids of low molecular weight and some
unpleasantly smelling toxic gases such as sulfuric acid (H2S).
The important chemical parameters to be considered for determining the suitability of waste treatment
through biological or thermo-chemical conversion technologies include –
Amount of volatile solids in the waste
Fixed Carbon Content in the waste
Calorific value of the waste
C/N ratio (carbon-Nitrogen ratio)
Toxicity of the waste

GoI-ADB-PPP Initiative Improving delivery of MSWM services in India through PPPs
Volume I – Overview and Process 52
Exhibit 4.14 below outlines the desirable range of important waste parameters for technical viability of energy
recovery:
Exhibit 4.14 Waste parameters for technical viability of energy recovery from MSW
Waste Treatment Method Basic Principle Important Waste
Parameters
Desirable Range*
Thermo-chemical conversion
- Incineration
- Pyrolysis
- Gasification
Decomposition of
organic matter by
action of heat
Moisture content < 45 %
Volatile matter > 40%
Fixed Carbon < 15%
Total Inert < 35 %
Calorific Value > 1200 k-cal/kg
Bio-chemical conversion
- Anaerobic digestion/
biomethantion
Decomposition of
organic matter by
action of heat
Moisture content > 50%
Organic/volatile matter > 40%
C/N ratio 25-30
Source: CPHEEO manual on SWM
The Ministry of Urban Development and Poverty Alleviation 2005, has laid down broad criteria for selection of
appropriate technology or combination of technologies as given in Exhibit 4.15.
Exhibit 4.15 Criteria for technology selection
Technical Criteria Financial Criteria Managerial Criteria
Experience with technology under
Indian conditions
Scale of operation
Required land, water, power
Availability of local spare parts
Process aesthetics
Environmental impact
Investment cost
Operation cost
Financing mechanisms
Market for end product
Labour requirement
Skills for operations and
maintenance
Skills for monitoring and
management
However, along with the above mentioned parameters the urban local bodies shall also consider below listed
factors while deciding on a particular technology for municipal solid waste treatment:
Existence of a reasonably efficient and regular collection system;
Existence of a market for recyclables and by-products (compost, RDF, power etc.) in the region;
Availability of sufficient space to establish a segregation plant and/or processing area
Availability of resources to finance initial investment;
Availability of personnel with sufficient technical training to select appropriate technology, supervise the
setting up of a plant, maintain machines and supervise their operation.
It is to be noted that the urban local bodies shall conduct a detailed economic feasibility study of any proposed
project taking into account on the advantages of installing a processing facility such as; sale of recyclable
and/or by-products, reduction in the waste to be transported and disposed of, increased life of the sanitary
landfill, environmental benefits, generation of employment etc., and also the financial costs on the other hand
for the implementation, operational and maintenance of the processing facility. This aspect of feasibility
analysis is dealt with in detail in Chapter 5 on financial feasibility analysis.
GoI-ADB-PPP Initiative Improving delivery of MSWM services in India through PPPs
Volume I – Overview and Process 53
Final disposal/ Sanitary Landfill
The sanitary landfill is a technique for the final disposal of solid waste in the ground that causes no nuisance or
danger to public health or safety; neither does it harm the environment during its operations or after its
closure. This technique uses engineering principles to confine the waste to as small areas as possible, covering
it daily with layers of earth and compacting it to reduce its volume. In addition, it anticipates the problems that
could be caused by the liquids and gases produced by the decomposition of organic matter.
A sanitary landfill unit of construction is called a cell, in which each day’s solid waste (or the waste from a
shorter period if the daily amount of waste is too great) is deposited in compacted sloping layers and is
covered with a layer of earth that is also compacted. The cell is built against a retaining wall that can be a pre-
existent natural elevation, a berm previously formed with compacted earth or other cells. Cells are constructed
next to each other, each one supported by the previous one, forming a “landfill level”; the landfill can have
two or more levels, depending on project requirements.
When determining the dimensions of a cell, some basic criteria should be taken into account:
o the width of a cell’s work face should accommodate safe manoeuvring of machines/vehicles;
o the height should be between 3-6 meters depending on the amount of waste to be dealt with;
o the advance should be calculated as per daily waste volume, width & height of the work face;
o dimensions are adjusted according to the stability and availability of the land.
A sanitary landfill consists of operational and support units including:
o municipal solid waste cells;
o waterproofing of the bottom (obligatory) and of the top (optional);
o collection and treatment system for percolated liquid (leachate);
o biogas collection and burning (or use) system;
o rainwater drainage and channelling system;
o environmental, topographical and geotechnical monitoring systems;
o storage area for materials; fence and vegetation barrier;
o access and service roads; weighbridge for trucks and waste checkpoint;
o entrance checkpoint and administrative offices; mechanical and tyre workshops;
Further, the sanitary landfill pre-operational process consists of the selection of the site, obtaining the
necessary licenses, formulating the project master plan and installation. Box 4.7 below indicates the
preliminary calculation of the total area needed for the sanitary landfill:
Box 4.7 Estimation of landfill area requirement
To make an appropriate calculation of the minimum total area necessary for the installation of a sanitary
landfill, in square meters, some experts multiply the quantity of waste collected daily, in tones, by the factor
560. This factor is based on the following landfill project parameters including the following: Useful life = 20
years; landfill height = 20 m; slope of 1:3 (vertical: horizontal) and 80% operational occupation of land.
However the operational usage as a percentage of the total area will depend on the particular conditions of
each site (for instance topography, hydrology, and geometric shape)
GoI-ADB-PPP Initiative Improving delivery of MSWM services in India through PPPs
Volume I – Overview and Process 54
Box 4.8 outlines the broad parameters to be considered while deciding among centralized /or decentralized
MSWM system
Box 4.8 Centralized v/s Decentralized MSWM systems
For large metropolitan areas (greater than 1 million population) comprising several municipal wards, special
institutional models should be developed to take advantage of the characteristics of different phases of
MSWM service provision. In particular, the following distinctions are important:
Experience shows that waste collection areas should not be greater than a population of 50,000 or about
10,000 households. Therefore, it makes sense to maintain local responsibility for domestic refuse
collection at these levels.
As a rule of thumb, transfer stations should be considered when haul distances from the collection area to
the disposal site are greater than 15-20 km or 30 min one-way travel time, as is common in large cities;
otherwise the productivity of collection vehicles and crews may be greatly reduced, being tied up
transporting rather than collecting wastes. Also, wear and tear on collection vehicles may be excessive,
reducing their useful life.
The main concern of the population is getting their wastes collected and keeping the neighbourhood clean
and healthy. Thus, householders generally ignore the importance of transfer/transport, processing and
disposal operations except when a facility is likely to be located nearby (the "not in my backyard," or
NIMBY, syndrome). Similarly, municipalities give lower priority to these operations since most negative
impacts take the form of externalities. These attitudes are too often reflected in the poor management of
such operations, and especially in the lack of environmentally acceptable disposal.
Finally, there are considerable economies of scale in transfer/transport and landfill disposal operations,
but optimization requires taking a system-wide viewpoint when locating, sizing and scheduling such
facilities.
4.4 Identification and Prioritisation of Actions
Having identified the key issues in the existing municipal solid waste management system along with the
underlying reasons for the gaps in desired service level benchmarks and/or deviations from compliance with
the MSW Rules, the next crucial step for the ULB is to determine the core objectives along with prioritization
of the set of actions to address the identified priority issues. The actions should cover both technical and non-
technical interventions as described below:
Technical Interventions that enable addressing the issues and gaps primarily with respect to
o Compliance with MSW (Handling and Management) Rules 2000.
o Conformity to the desired service level benchmarks/performance indicators laid out by MoUD
Non-Technical Interventions which may include:
o Information Infrastructure for effective decision making including capture of revenue and costs of
MSWM services
o Internal Institutional set up and manpower deployment
o Awareness Generation and Needs assessment for IEC campaigns
o Factoring and leveraging informal MSWM mechanisms including rag pickers and community based
systems, while ensuring appropriateness in terms of safety, hygiene and environmental impacts.
o Aesthetics and environment of the city and equitable service delivery for all sections of society
including slum dwellers and Urban Poor.
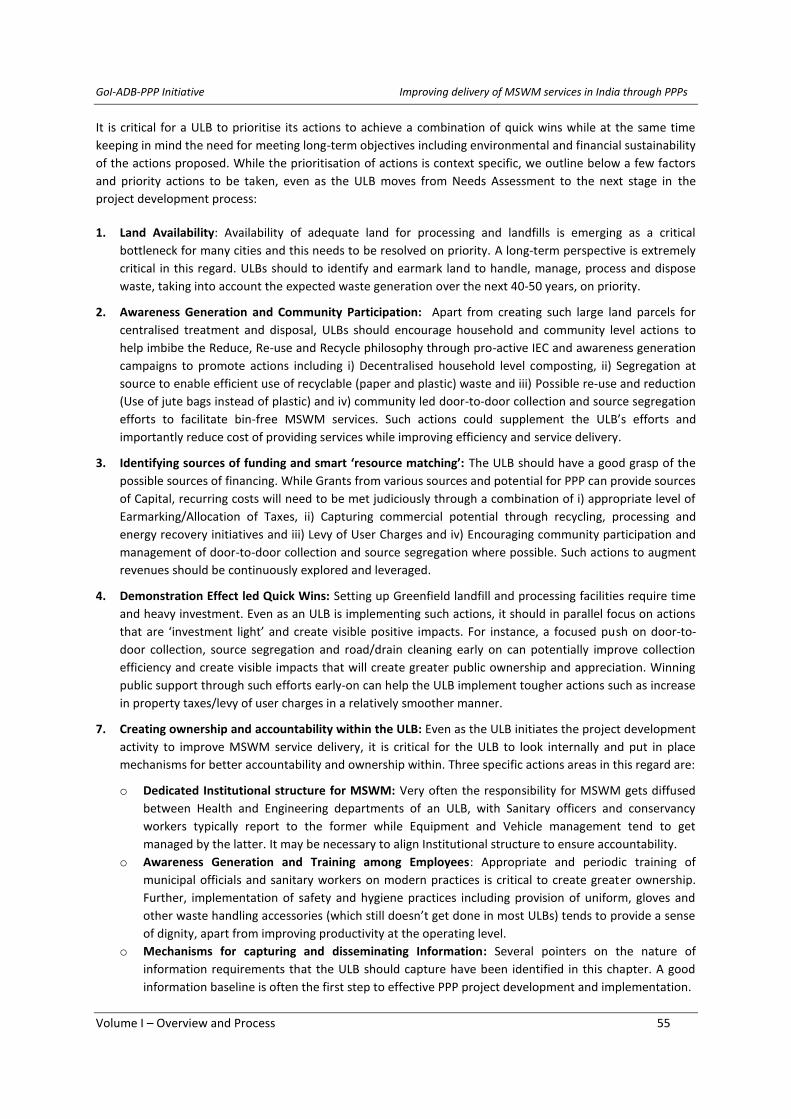
GoI-ADB-PPP Initiative Improving delivery of MSWM services in India through PPPs
Volume I – Overview and Process 55
It is critical for a ULB to prioritise its actions to achieve a combination of quick wins while at the same time
keeping in mind the need for meeting long-term objectives including environmental and financial sustainability
of the actions proposed. While the prioritisation of actions is context specific, we outline below a few factors
and priority actions to be taken, even as the ULB moves from Needs Assessment to the next stage in the
project development process:
1. Land Availability: Availability of adequate land for processing and landfills is emerging as a critical
bottleneck for many cities and this needs to be resolved on priority. A long-term perspective is extremely
critical in this regard. ULBs should to identify and earmark land to handle, manage, process and dispose
waste, taking into account the expected waste generation over the next 40-50 years, on priority.
2. Awareness Generation and Community Participation: Apart from creating such large land parcels for
centralised treatment and disposal, ULBs should encourage household and community level actions to
help imbibe the Reduce, Re-use and Recycle philosophy through pro-active IEC and awareness generation
campaigns to promote actions including i) Decentralised household level composting, ii) Segregation at
source to enable efficient use of recyclable (paper and plastic) waste and iii) Possible re-use and reduction
(Use of jute bags instead of plastic) and iv) community led door-to-door collection and source segregation
efforts to facilitate bin-free MSWM services. Such actions could supplement the ULB’s efforts and
importantly reduce cost of providing services while improving efficiency and service delivery.
3. Identifying sources of funding and smart ‘resource matching’: The ULB should have a good grasp of the
possible sources of financing. While Grants from various sources and potential for PPP can provide sources
of Capital, recurring costs will need to be met judiciously through a combination of i) appropriate level of
Earmarking/Allocation of Taxes, ii) Capturing commercial potential through recycling, processing and
energy recovery initiatives and iii) Levy of User Charges and iv) Encouraging community participation and
management of door-to-door collection and source segregation where possible. Such actions to augment
revenues should be continuously explored and leveraged.
4. Demonstration Effect led Quick Wins: Setting up Greenfield landfill and processing facilities require time
and heavy investment. Even as an ULB is implementing such actions, it should in parallel focus on actions
that are ‘investment light’ and create visible positive impacts. For instance, a focused push on door-to-
door collection, source segregation and road/drain cleaning early on can potentially improve collection
efficiency and create visible impacts that will create greater public ownership and appreciation. Winning
public support through such efforts early-on can help the ULB implement tougher actions such as increase
in property taxes/levy of user charges in a relatively smoother manner.
7. Creating ownership and accountability within the ULB: Even as the ULB initiates the project development
activity to improve MSWM service delivery, it is critical for the ULB to look internally and put in place
mechanisms for better accountability and ownership within. Three specific actions areas in this regard are:
o Dedicated Institutional structure for MSWM: Very often the responsibility for MSWM gets diffused
between Health and Engineering departments of an ULB, with Sanitary officers and conservancy
workers typically report to the former while Equipment and Vehicle management tend to get
managed by the latter. It may be necessary to align Institutional structure to ensure accountability.
o Awareness Generation and Training among Employees: Appropriate and periodic training of
municipal officials and sanitary workers on modern practices is critical to create greater ownership.
Further, implementation of safety and hygiene practices including provision of uniform, gloves and
other waste handling accessories (which still doesn’t get done in most ULBs) tends to provide a sense
of dignity, apart from improving productivity at the operating level.
o Mechanisms for capturing and disseminating Information: Several pointers on the nature of
information requirements that the ULB should capture have been identified in this chapter. A good
information baseline is often the first step to effective PPP project development and implementation.

GoI-ADB-PPP Initiative Improving delivery of MSWM services in India through PPPs
Volume I – Overview and Process 56
Sanand: A nominal service charge of Rs. 100 per annum per household as SWM cess for MSWM activities is
collected along with Property Tax.
5. Step 2: Feasibility Evaluation
The assessment of the financial feasibility for an identified set of components which form the Project is
imperative to determine if the proposed project offers reasonable returns on the investments, hence, evincing
sufficient interest for private sector participation in the project. The financial feasibility process determines the
viability of the project for the given costs (both capital and recurring) associated with the project and the
expected returns and/or revenues over the span of the project. Assessment of financial feasibility assists in
outlining the important financial parameters relating to the project and helps an ULB to explore changes to the
project configuration if required or to consider the most suitable financing option for the project.
The section below outlines the steps involved for the detailed financial analysis including description of the
broad categories of costs namely; capital cost for creation of physical assets and recurring cost arising during
the operation and maintenance of the project components. The financial benefit-cost analysis covers four
steps as described in Exhibit 5.1 below:
Exhibit 5.1 Steps in Financial Feasibility evaluation
5.1 Determine Financial Sources
Identifying of possible sources of financing for meeting capital and recurring expenditure relating to provision
of MSWM services is the first step in evaluating financial feasibility of a MSWM project. The possible sources of
financing are discussed below:
5.1.1 Revenue Streams
SWM Cess/Earmarking of Property Tax
The municipal authorities can use a percentage of the property tax for solid waste services and accordingly
introduce a sanitation /or SWM cess to meet the cost of providing MSWM services. In some Urban Local
Bodies, this portion is clearly identifiable as a conservancy tax. However, the main problem with the property
tax is that the assessment is not done regularly coupled with underassessment and inadequate collection.
With computerization, self-assessment and reform, ULBs can expect to improve the collection of property tax.
However, at best, the conservancy tax can be used only to defray the operating cost of MSWM services.
Step 1 Determine Financial Sources (project revenues & capital funds)
Step 2 Determine Project Costs (capital & revenues expenditures)
Step 3 Evaluate Project Viability
Step 7 Determine Financial Support Requirement

GoI-ADB-PPP Initiative Improving delivery of MSWM services in India through PPPs
Volume I – Overview and Process 57
Box 5.1 User Charges in SWM: Illustrative examples
Coimbatore - User Charges per month for SWM
Low income group households (68,147) - Rs. 10/ month
Households other than Low income (160,562) – Rs. 30/month
Normal shops & establishments (33,567) – Rs. 60/month
Large commercial establishments (1,211) – Avg Rs. 500/month
Kanchrappa, an ULB situated 48 km from Kolkata
Area : 3.07sq.km (~6 sq.km under Indian Railways)
Population : 126,000 (2001) with 20% BPL population
MSW : Approximately 40 MT per day
User Fee : DTDC in a segregated form Residents – Rs 10 per household/month BPL families – Rs 5 per household/ month Market Shops – Rs 5 per household/month Hotels & Restaurant – Rs 50-100 per entity/month
Levy User Charges
Levy of User charges /or fees and can be an equitable means of funding SWM services, if properly
administered. In some countries, the fee is based weight of the solid waste, thus creating an economic
incentive to reduce waste generation and encourage recycling.
In developing countries like India, there is an imperative need to ensure that the fee is affordable, given the
social consideration factors. With a large number of poor households, it may be worthwhile to have an
equitable tariff policy, by cross subsidizing poorer households. Further, increased public awareness of solid
waste issues and public involvement in the decision making process may provide the opportunity to adjust
user charges to reflect real costs of providing solid waste services. It is essential that citizens know the cost of
service and be motivated to share the cost in the form of user fees to sustain the service. Monthly user fee
rates can be prescribed for various categories of waste generators, such as residential, shops and offices, large
commercial establishments, and markets. The user charges generally vary from city to city depending on the
socioeconomic profiles within the cities.
In cities where MSW collection is franchised to private operators, households pay the fee directly to the
operator but the fee is set by the ULB. In some Indian cities, NGOs /or neighbourhood association provide the
primary collection service and collect a fee from the households. Ideally, a small charge can be levied initially
and with improved and consistent service, a higher level of cost recovery through user charges in possible.
Sale of Recyclables recoverable from MSW
In India, the proportion of compostable waste continues to be high and upwards of 40% in most cities. In
addition, a significant part of the waste (paper, plastic, glass and metal) is recyclable (estimated at about 15%
of waste generated currently and growing) and with better sorting and segregation offers good potential for
commercial exploitation. This recoverable /or recyclable part presents a probable revenue stream and can
potentially contribute partly to the cost recovery for the provisions of MSWM services. Exhibit 5.2 below
presents the range of recyclable waste recovery rates.

GoI-ADB-PPP Initiative Improving delivery of MSWM services in India through PPPs
Volume I – Overview and Process 58
Box 5.2 Waste Processing/Treatment approaches 1. Composting 2. Vermi-composting 3. Anaerobic Digestion/Biomethanation 4. Incineration 5. Gasification/Pyrolysis 6. Plasma Pyrolysis 7. Production of Refuse Derived Fuel (RDF)/
Pelletisation 8. Sanitary Land filling/Landfill Gas Recovery
Current ex-plant sale price of compost ranges from Rs. 1,500 – Rs. 3,000 per MT. However, after loading on trucking and distribution costs the sale price may be as high as Rs. 3,500 – Rs. 4,500 per MT
Exhibit 5.2 Prices for recoverable wastes
S. No Recyclable recoverable from MSW Indicative rates (Rs. Per Kg)
1 Metal Rs. 7.0 – 9.0 per kg
2 Ceramic Rs. 1.5 – 2.0 per kg
3 Glass Rs. 3.5 – 4.5 per kg
4 Paper and Corrugated cardboard Rs. 2.5 – 3.0 per kg
5 Plastics Rs. 6.0 – 7.5 per kg
Source: IMaCS analysis. Rates are indicative and may vary from city to city.
Sale of By-products from Processing/Treatment of MSW
As per the report of the Technology Advisory Group on
Solid Waste Management (May 2005) constituted by
Ministry of Urban Development, Government of India
(MoUD), the main technological options available for
processing and treatment of Municipal Solid Waste
(MSW) for Resource /or Energy Recovery and/or Disposal
are highlighted in Box 5.2. The first three technologies
depend upon biological decomposition of the
biodegradable organic fraction of MSW to produce
compost /or biogas /or landfill gas. Technologies listed in
S. No. 4-6, depend upon thermal decomposition of the entire organic fraction of MSW (biodegradable as well
as non-biodegradable fraction) to produce heat energy /or fuel gas /or fuel oil. The technology in S. No. 7 is the
only waste processing method for producing RDF Fluff and/or Pellets, for subsequent energy recovery through
the technologies listed at S. No. 4-6. Landfill Gas discovery helps in disposal of residual wastes from all sources
including those from other waste processing and/or treatment plants. These waste recycling, composting,
waste-to-energy, and methane gas recovery programmes may generate operating revenues. There are two
way benefits of such programmes, a) Direct revenue stream to the project by way of selling by-products
(compost, RDF/Pellets, power generation) from processing/treatment of MSW, and b) Cost savings due to
gains in transporting efficiency and reduced cost for land filling.
Out of the technologies listed above, the most commonly used and practiced in the country is the composting
of MSW and also the most important biological route for recycling matter and nutrients from the organic
fraction of MSW. However, the sustainability of composting operations over long period is a function of proper
operation & maintenance of the plant. The current mechanism for setting compost price is arbitrary and is
essentially driven by market demand. Further there is no tax levied on compost under Indian laws.
The recent developments in promoting composting as one of the technologies for municipal solid waste
conversion includes; standard guidelines from the Central Ministry on the quality of the compost to be
produced; and also some State agricultural departments are considering subsidizing the price of such standard
quality compost to improve the commercial viability of the waste to compost projects. Another potential area
of waste conversion, which is emerging very rapidly, is the waste to energy projects and there lies huge
potential for power generation based on municipal solid waste generated in the county as highlighted in the
Box 5.3.
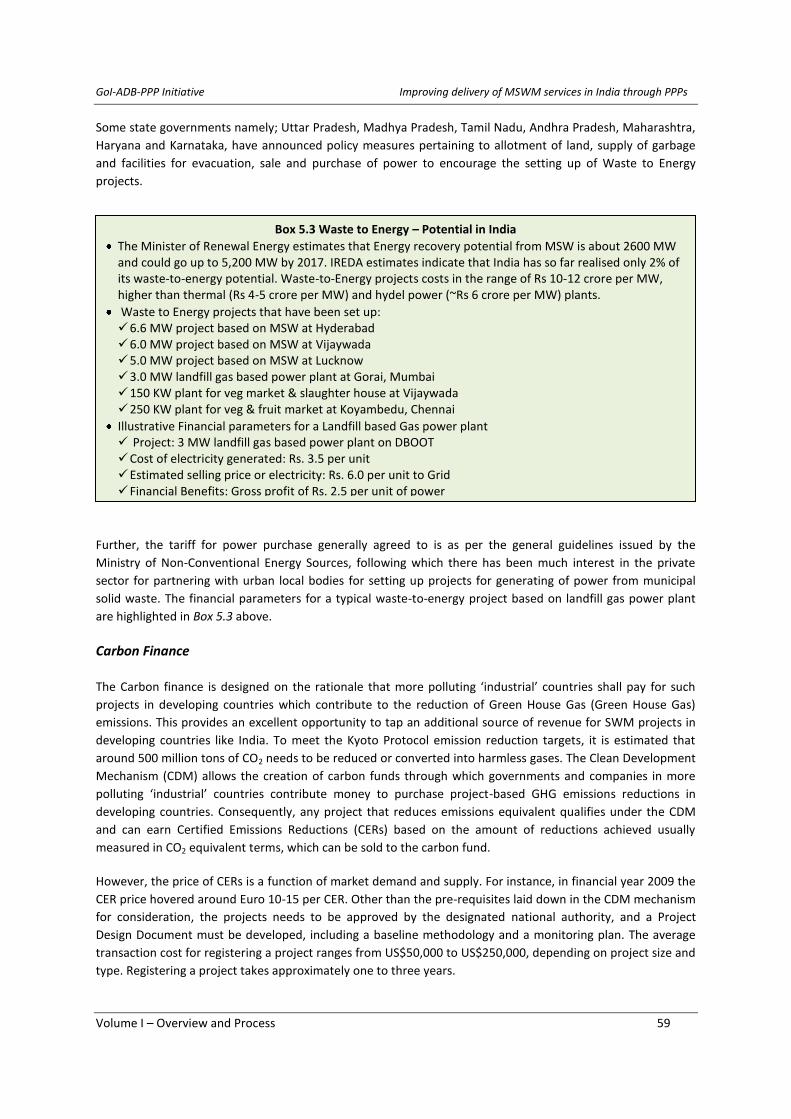
GoI-ADB-PPP Initiative Improving delivery of MSWM services in India through PPPs
Volume I – Overview and Process 59
Box 5.3 Waste to Energy – Potential in India
The Minister of Renewal Energy estimates that Energy recovery potential from MSW is about 2600 MW and could go up to 5,200 MW by 2017. IREDA estimates indicate that India has so far realised only 2% of its waste-to-energy potential. Waste-to-Energy projects costs in the range of Rs 10-12 crore per MW, higher than thermal (Rs 4-5 crore per MW) and hydel power (~Rs 6 crore per MW) plants.
Waste to Energy projects that have been set up: 6.6 MW project based on MSW at Hyderabad 6.0 MW project based on MSW at Vijaywada 5.0 MW project based on MSW at Lucknow 3.0 MW landfill gas based power plant at Gorai, Mumbai 150 KW plant for veg market & slaughter house at Vijaywada 250 KW plant for veg & fruit market at Koyambedu, Chennai
Illustrative Financial parameters for a Landfill based Gas power plant Project: 3 MW landfill gas based power plant on DBOOT Cost of electricity generated: Rs. 3.5 per unit Estimated selling price or electricity: Rs. 6.0 per unit to Grid Financial Benefits: Gross profit of Rs. 2.5 per unit of power
Some state governments namely; Uttar Pradesh, Madhya Pradesh, Tamil Nadu, Andhra Pradesh, Maharashtra,
Haryana and Karnataka, have announced policy measures pertaining to allotment of land, supply of garbage
and facilities for evacuation, sale and purchase of power to encourage the setting up of Waste to Energy
projects.
Further, the tariff for power purchase generally agreed to is as per the general guidelines issued by the
Ministry of Non-Conventional Energy Sources, following which there has been much interest in the private
sector for partnering with urban local bodies for setting up projects for generating of power from municipal
solid waste. The financial parameters for a typical waste-to-energy project based on landfill gas power plant
are highlighted in Box 5.3 above.
Carbon Finance
The Carbon finance is designed on the rationale that more polluting ‘industrial’ countries shall pay for such
projects in developing countries which contribute to the reduction of Green House Gas (Green House Gas)
emissions. This provides an excellent opportunity to tap an additional source of revenue for SWM projects in
developing countries like India. To meet the Kyoto Protocol emission reduction targets, it is estimated that
around 500 million tons of CO2 needs to be reduced or converted into harmless gases. The Clean Development
Mechanism (CDM) allows the creation of carbon funds through which governments and companies in more
polluting ‘industrial’ countries contribute money to purchase project-based GHG emissions reductions in
developing countries. Consequently, any project that reduces emissions equivalent qualifies under the CDM
and can earn Certified Emissions Reductions (CERs) based on the amount of reductions achieved usually
measured in CO2 equivalent terms, which can be sold to the carbon fund.
However, the price of CERs is a function of market demand and supply. For instance, in financial year 2009 the
CER price hovered around Euro 10-15 per CER. Other than the pre-requisites laid down in the CDM mechanism
for consideration, the projects needs to be approved by the designated national authority, and a Project
Design Document must be developed, including a baseline methodology and a monitoring plan. The average
transaction cost for registering a project ranges from US$50,000 to US$250,000, depending on project size and
type. Registering a project takes approximately one to three years.

GoI-ADB-PPP Initiative Improving delivery of MSWM services in India through PPPs
Volume I – Overview and Process 60
Registration ends when an emission reduction purchase agreement is signed. As it is evident that municipal
solid waste is a significant source of methane emissions and the methane gas is considered 21 times more
harmful as a GHG than carbon dioxide (this implies that one ton of methane reduction is equivalent to 21 tons
of CO2 equivalent, or 21 CERs), and this presents an encouraging case for considering SWM as one of the
compelling sector for carbon finance. The following SWM projects can include carbon finance components to
reduce methane emissions:
Landfill gas recovery: Landfills produce gases created by the anaerobic degradation of organic materials.
Instead of letting these gases pollute the environment; landfill operators can recover these gases, treat them,
and use them as sources of energy. Recovering landfill gases produces many benefits, such as reducing odours
from landfills, and producing profits from the sale or use of energy/power. Moreover, for developing countries
like India, carbon finance can provide additional revenues to landfill projects that recover landfill gases. The
amount of credits that can be earned from landfill gas recovery projects depends on several factors, such as
amount of waste, organic fraction of the waste, landfill technology, moisture, age of landfill site, and efficiency
of the landfill gas collection system. The approximate landfill gas potential is as follows:
One million tons of waste “in place” generates around 6 million cubic meter of landfill gas per year.
In 1 cubic meter of landfill gas, there are about 357 grams of methane.
Therefore, 1 million tons of waste generates about 2,140 tons of methane per year.
Of the 2,140 tons of generated methane, 1,500 tons of methane can be recovered (assuming 70 per cent
collection efficiency) and destroyed.
Composting: The composting process uses the biodegradable portion of the municipal solid waste for
producing manure, thereby, reducing the amount of solid waste to be dumped into the landfills. By preventing
organic waste from getting into the landfill, composting projects reduce landfill gas methane emissions, and
this reduction can be claimed as emissions reductions and sold to the carbon fund. In developing countries like
India, where a substantial part of the municipal solid waste consists of organic substances (estimated around
44% of the total MSW generated), finding ways to treat organic waste is an attractive option for protecting the
environment and increasing the life of landfills. Composting results in an economic and rapid solution that can
be easily implemented and can result in carbon credits. See Box for a case study. Further, it is expected that for
around 9 (none) composting projects; 6 (six) in Tamil Nadu and 3 (three) projects covering Jalandhar, Mysore,
and Kozhikode, an upfront carbon advance payment of approximately USD 1.5 million will be made by Asia
Pacific Carbon Fund (APCF). See Box 5.4 for select case studies.
5.1.2 Grants from GoI Schemes
It is evident from the financial analysis of the select ULBs conducted during their baseline status of SWM that
the overall requirement of funds for municipal solid waste management is unattainable from the internal
resources of ULB alone. While conservancy taxes and user charges can be used to defray part/or full operating
costs, capital cost of collection (vehicle and equipment), treatment and disposal may require external source
of finance. Hence, the financial support from the Government agencies either in form of grants and/or
subsidies accelerate the efforts of ULBs to modernize the MSWM system in their respective cities.
Such financial support also provides an impetus to the on-going effort for private sector participation as it
assists in reducing the project cost and depending on the probable revenue sources from the project, would
make the project more amenable for successful private sector participation.
However, such financial support is not always required, as the projects where structuring and scope allows the
private developer to envision reasonable future cash flows from the project, the private developer is generally
prepared to undertake commercial risk for the project.

GoI-ADB-PPP Initiative Improving delivery of MSWM services in India through PPPs
Volume I – Overview and Process 61
Box 5.4 SWM and Clean Development Mechanisms – Case studies Gorai Landfill Closure & Gas Capture Project, Mumbai
Location : Western Suburbs of Mumbai under MCGM
Area : 19.6 hectare
Operational : Open dumping since 1972
Waste quantity : Approx. 2.34 mn. tons of waste was accumulated.
PPP Structuring : 15 years PPP with construction and O&M
Private Player : Consortium of UPL & Van Der Weil Strotgas BV
Implementation Phase: Construction in 20 months at a cost of Rs. 500 million O&M estimated at Rs. 120 million (15 years of post-closure care)
Clean Development Mechanism: Gorai is the 1
st dumpsite closure from India to be registered at UNFCCC
MCGM received a Carbon advance of Rs 25.0 crore against future delivery of carbon credits Advance from Asia Pacific Carbon fund of the Asian Development Bank
Estimated Project Benefits: Reduce Greenhouse Gases by 1.2 million tons of CO2 over a 10 years Power generation from Methane Expected CDM Revenues over 10 year period – Rs. 70.0 crore
NovaGerar, Brazil - Landfill methane to energy
Project Type: Capture of landfill methane
Project Cost: Up to USD 8 million (Rs. 36 crore)
Credits: 500,000 tons/year
CER buyer: World Bank on behalf of Netherland
CER revenue: USD 2 million per year (Rs.8 crore) Okhla, Delhi – SWM Compost Project
Project: Upgradation of the capacity from 150 TPD to 200 TPD, and O&M of Plant
Project Size: 200TPD
UNFCCC Ref No: 2470
CDM Revenue: Estimated Rs. 13.8 crore over 7 years period
The section below dwells on the possible sources of funds available for SWM projects in the country and
depending on the eligibility under mentioned schemes, the ULBs could obtain the financial support for the
provisions of MSWM services.
Finance Commission Grants
The Finance Commission which is responsible for devolution of funds (complete grant) to state governments
every five years had allocated total of around Rs. 25,000 crore (Rs. 20,000 crore for Panchayats and Rs. 5,000
crore for Municipalities) for supplementing the resources of the ULBs for improving urban infrastructure, out
of this total amount around 50 per cent was allocated for solid waste management alone, to be passed
through to urban local bodies for the period 2005-2010. Under the 12th
Finance Commission, an award of Rs.
2,500 crore was made to ULBs of all 423 Class I cities in the country for SWM during the period 2005-2010. The
break-up of grants across MSWM value chain is shown in Exhibit 5.3.

GoI-ADB-PPP Initiative Improving delivery of MSWM services in India through PPPs
Volume I – Overview and Process 62
JNNURM cities coverage – 65 nos. Cities with 4 million plus population – 07 Cities with 1 million plus population – 28 State capitals and other cities – 30
7 year – Starting year 2005-06 till 2011-12
Rs. 50,000 crore (Rs. 16,000 crore addl. in FY10)
Population covered – 12.08 crore (11.71 %)
SWM projects under JNNURM
40 SWM projects approved in 39
cities under JNNURM scheme
Total project cost of Rs 2,186.14
crore
GOI has released Rs. 337.91 cr.
Exhibit 5.3 12th
Finance Commission Grants for MSWM
S. No Description (Rs. in crore)
1 Collection & Transportation equipment & machinery 386.44
2 Waste Processing (Compost Plants) 1001.23
3 Sanitary Landfill Development 1056.88
TOTAL 2444.55
Out of this total investment requirement of Rs. 2444.55 crore, it was envisaged that around 20 per cent (Rs.
500.62 crore) would come from private sector participation, primarily in the waste processing and sanitary
landfill development.
Further, in the recent report on 13th
Finance Commission Grant (2010-2015), an incentive grant of Rs. 5,000
crore is recommended for grid-connected renewable energy based on the states’ achievement in renewable
energy capacity addition from April, 2010 to March 2014. Of India’s total installed capacity of around 156,783
MW, renewable energy contributes only around 10%, or 15,427 MW.
Jawaharlal Nehru Urban Renewal Mission (JNNURM)
Another major programme of the Government of
India is the Jawaharlal Nehru National Urban Renewal
Mission (JNNURM) which is administered by the
Ministry of Urban Development to improve the urban
infrastructure in 63 large cities in the country to start
with and recently 2 more cities have been included.
One of the priority areas within JNNURM is solid waste management. However, JNNURM is not simply a grant
mechanism to create capital assets. One of the primary objectives is to improve urban governance through
various reform measures, which also seeks to create accountability at the grass-roots level. The government
has earmarked Rs. 100,000 crore (approx. US$ 20 billion) over a period of 7 (seven) years for development of
Urban Infrastructure in select 65 Indian cities.
Under the JNNURM programme for select cities in the country, so
far over 40 projects in the Municipal Solid Waste Management
sector have been sanctioned in 39 cities across 20 states. The
corresponding fund requirement is of Rs. 2,184 crore out of
which GoI has released around Rs. 337.91 crore under JNNURM
programme for these approved MSWM projects. The status of
SWM projects under JNNURM is highlighted in the Box. The States like Gujarat, Puduchery, Haryana, Himachal
Pradesh, and Uttar Pradesh have already taken SWM projects in all Mission cities in their states. The funds
allocated under JNNURM have a grant component of 35 to 80 per cent depending upon the size of the city as
shown below.
Urban Infrastructure Development in Small & Medium Towns (UIDSMT)
The Scheme aims at improvement in urban infrastructure for towns and cities in a planned manner. It shall
subsume the existing schemes of Integrated Development of Small & Medium Towns (IDSMT) and Accelerated
Urban Water Supply Programme (AUWSP). The duration of the Scheme is for seven years starting from year
2005-06 and it applies to all cities/towns as per 2001 census, excepting cities/towns under JNNURM mission.

GoI-ADB-PPP Initiative Improving delivery of MSWM services in India through PPPs
Volume I – Overview and Process 63
SWM projects under UIDSSMT
Number of Cities covered – 632
Population covered – 7.04 (6.85%)
SWM Projects approved in 51 towns
across 10 states
Total Project cost of Rs. 327.08 crore
The sharing of funds would be in the ration of 80:10 between
Central Government & State Government and the balance of
10% could be raised by the nodal/implementing agencies
from the financial institutions. The status of SWM projects
approved under UIDSMT scheme has been detailed in the
Box. As highlighted, SWM projects have been approved in 51
small towns across 10 states. The State wise coverage
includes; 1 in Andhra Pradesh, 3 in Arunachal Pradesh, 3 in
Haryana, 7 in Jammu & Kashmir, 3 in Jharkhand, 11 in Kerala, 2 in Meghalaya, 1 in Tamil Nadu, 19 in Uttar
Pradesh. The total project cost of SWM projects approved so far is Rs. 327.08 crore against which GOI has
released around Rs. 135.90 crore. However, in the SWM projects funded under JNNURM /or UIDSSMT
schemes, the share of the ULB funding, which is in the range of 10% to 30% of the project cost, is generally
funded by the private player with PPP arrangement.
Subsidy by GOI for Compost Plant & Waste to Energy Projects
The Ministry of Non-Conventional Energy Sources (MNES) has been promoting waste to energy plants – refuse
derived fuel, biomethanation, biogas, and gasification. The subsidy has been in the range of Rs.15 million to
Rs.30 million per MW as highlighted in Exhibit 5.4. The Ministry of Environment and Forest and the Ministry of
Agriculture have subsidized compost plants up to 50 per cent of the capital cost. The purpose of the subsidies
has been to promote technologies which might otherwise not be taken up on purely financial grounds.
Exhibit 5.4 GoI subsidy for Waste-to-Energy
S. No. Project Description Incentive
1 Power generation from MSW involving RDF Rs. 1.5 crore per MW
2 Power generation on high-rate biomethanation Rs. 2.0 crore per MW
3 Power from MSW on gasification-pyrolysis & plasma arc Rs. 3.9 crore per MW
4 Biomethanation technology for power generation from vegetable
market waste, slaughterhouse waste above 250KW capacity
50% of project cost;
max Rs 3.0 crore per
MW
5 Project Development assistance per project Up to Rs. 10 lakh
6 Capacity Building initiatives Rs 3 lakh per event
Source: MNES
Fiscal Incentives
In addition to the above mentioned programmes and grant/subsidy provided by centre/state governments,
the following incentives are also available for financing infrastructure relating to solid waste management:
Tax Exemption of Certain Bonds Issued by Local Authorities – According to section 10(15) of the Income Tax
Act, in recognition of the need for mobilizing resources for urban infrastructure projects, the central
government has accorded a tax-free status to the interest on certain bonds issued by local authorities each
year. These bonds are specified by notice in the Official Gazette.
Tax Holiday for the Project Entity for SWM – As announced in the Union Budget 2001/02, deduction under
Section 80IA of the Act in respect of profits and gains of undertaking /or enterprise engaged in infrastructure
facilities relating to solid waste management is allowed at 100 per cent of such profits for 10 consecutive

GoI-ADB-PPP Initiative Improving delivery of MSWM services in India through PPPs
Volume I – Overview and Process 64
assessment years out of first 20 years of the project. However, to qualify for tax holiday under this provision,
the enterprise must satisfy the following conditions:
A company or a consortium of companies registered in India owns the enterprise carrying on the
infrastructure business, including solid waste management.
The enterprise has entered into an agreement for developing, maintaining, and operating an
infrastructure facility.
The agreement is with: the central government, the state government, the local authority, any other
statutory body, or such other entity or body as may be notified to the central government.
The infrastructure facility shall be transferred to the govt. within a period stipulated in agreement.
Tax Exemption for Income of Infrastructure Capital Funds/Companies – Section 10(23G) of the Income Tax
Act provides that any income of an infrastructure capital fund or an infrastructure capital company or a
cooperative bank by way of “interest”, dividends, and long-term capital gains from investments made by way
of equity or long term finance is an approved enterprise wholly engaged in the business of (i) developing, (b)
maintaining and operating, or (c) developing, maintaining, and operating an infrastructure facility shall not be
included in computing the total income.
Moreover, to provide impetus for infrastructure development, the scope of the term infrastructure facility, as
defined in subsection (12) of section 80IA, has been enlarged to include solid waste management and water
treatment. As a consequence, income derived by an infrastructure capital fund or infrastructure capital
company from investments in any enterprise wholly engaged in the development of these infrastructure
facilities would be exempt from tax.
However, this income is subject to presumptive tax under section 115JB on book profit. Furthermore, the
criteria for companies that can take advantage of the benefits under section 10(23G) of the Income Tax Act has
been broadened from those maintaining, operating, and developing (that is, all activities were to be performed
by one company) to allow those companies to be doing any of the following: developing, operating,
maintaining, and providing long-term funds and project development support.
Inclusion as Eligible Investments of Charitable Funds – Section 11(5) (ix) of the Income Tax Act provides for
inclusion as eligible investments of charitable funds (a) any deposits with a public company or (b) any
investments in any bonds issued by such a company, provided that the company was formed or registered in
India with an objective of carrying on a business of providing long-term finance for urban infrastructure. This
provision enables sponsors of urban infrastructure projects to have access to investable surpluses of charitable
trust funds.
5.2 Determine Project Cost
The other crucial aspect relating to commercial viability analysis of the project is the careful estimation of the
project cost with details on each & every component/aspect of the project in accordance with the identified
project scope. The Project Costs broadly encompasses the capital investment requirement for setting up of
the project facility (like transfer station, waste processing, sanitary landfill development) including plant &
machinery cost and/or investment required in procuring equipment, vehicles, and machinery for collection &
transportation of MSW within the project area, and recurring expenses for smooth operations of the project
including manpower requirement, operating expenses for utility usage, miscellaneous expenses like insurance,
and also the maintenance cost for equipment, vehicles, plant & machinery relating to the project.

GoI-ADB-PPP Initiative Improving delivery of MSWM services in India through PPPs
Volume I – Overview and Process 65
However, different project investment assets have different lifelines and need replacement within the project
lifetime, and such asset replacement costs should also be reflected in the project cost. Furthermore, the
residual value of project assets at the end of the project life should also be included in the financial analysis as
cash inflows (terminal value) at the end of the project.
5.2.1 Capital Investment
Capital Investment typically covers a one-time expenditure incurred for creating a new asset or for substantial
modernization or renovation of an existing asset. It should include cost of civil works, machinery, equipment,
installation and commissioning expenses. Any substantial expenditure that needs to be incurred during the life
of the project to maintain the useful life of the asset is also taken as a capital expenditure. The following
section dwells on the broad components and/or assets included in the capital investment costs for discrete
activities across the MSWM value chain and can serve as yardstick to assist urban local bodies and/or
municipal authorities in working out the project cost for the identified scope of project. Exhibit 5.5 below
outlines the broad components of the capital cost.
Exhibit 5.5 Indicative components of Capital Cost
S. No Particulars Capital Cost (Rs. crore)
1 Land acquisition cost for Project Facilities*
2 Construction & Installation cost for Project Facilities
3 Plant & machinery, equipment** & vehicle costs
4 Contingency reserves
5 Preliminary and pre-operative expenses
6 Interest during construction
Total Project Cost
** Project facilities may include – transfer station(s), waste processing & recovery, sanitary landfill(s). ** Details of indicative equipment, vehicles required for various components of MSW is provided in section below
Collection & Transportation
The selection of collection & transportation system for MSW in a particular city depends primarily on the local
conditions like housing pattern, street conditions (narrow or wide), geographic and topographic conditions
which determines the routing for the door-to-door collection of MSW. However, in smaller cities/towns
generally primary waste collections is effective using slow and smaller vehicles with multiple containers which
helps in reaching to the city interiors and improve service coverage for provisions of MSWM services.
However, in big cities/metros there is a need for large capacity and motorized vehicles to cover long distances
and collect larger quantum of waste. The most commonly used equipment and vehicles for collection &
transportation of waste along with their useful economic life is indicated in The MSW Rules 2000 provides for
two options for primary collection of MSW; either via door-to-door-collection at prescribed collection
frequency and intervals, or community bin collection wherein common dumpers /or street /or community bins
are provided for waste storage.

GoI-ADB-PPP Initiative Improving delivery of MSWM services in India through PPPs
Volume I – Overview and Process 66
Exhibit 5.6.
The MSW Rules 2000 provides for two options for primary collection of MSW; either via door-to-door-
collection at prescribed collection frequency and intervals, or community bin collection wherein common
dumpers /or street /or community bins are provided for waste storage.

GoI-ADB-PPP Initiative Improving delivery of MSWM services in India through PPPs
Volume I – Overview and Process 67
Exhibit 5.6 Typical Vehicles and Equipment used in MSWM – Indicative costs and economic life
S. No Indicative list of Equipment/Vehicles Indicative Rate (Rs) Economic Life
(in yrs.)
1 Common dumpers (4.5 m3) 60,000 4-5
2 Storage Bins (50 L, 200L) 20,000/70,000 3-4
3 Tricycles and handcarts (400 L) 15,000 2-3
4 Motorized rickshaws 60,000 3-5
5 Tractors with trailers 6,00,000 7-9
6 Tipper with dumpers 10,00,000 7-9
7 Tipper with tilting arrangement (1.5m3) 4,50,000 7-9
8 Refuse compactors (12-13T per trip) 24,00,000 7-9
Source: IMaCS analysis. Costs and Life are indicative only and may vary.
Secondary Storage
The MSW collected through primary collection system is generally pre-transported to the secondary storage
points and/or transfer stations. The secondary storage system shall be in line with the primary collection
system and geographic & topographic conditions of the city/town. It has been observed that generally the
transportation system design consists of two options. One is where the waste collected through
handcarts/rickshaws is transported to common dumpers with capacity ranging from 3-5 cubic meters and then
these dumpers are directly taken to the transfer stations using tippers having arrangement to carry these
dumpers. At transfer station the dumpers are emptied for segregation and then waste is reloaded in to bigger
refuse compactors for final transportation of waste to processing and/or landfill site. Secondly, in some bigger
cites/metros like Delhi, the waste collected in the tipper with tilting arrangement is directly transported to the
transfer station or to the refuse compactors for further disposal.
Recently, the urban local bodies have realized the need for setting up of transfer stations to achieve transport
efficiencies and to carry out activities like segregation, re-loading of inert waste or organic waste in to refuse
compactors for further disposal and/or processing. In cities, where the treatment and disposal site is more
than 15-20 km away from the main city, transfer stations might be appropriate. There have been instances of
setting up of mechanized refuse transfer stations (MRTS) also in few of the progressive cities in the country.
Typically, a transfer station consists of a ramp and a platform designed in a curve shape, where in the small
vehicles can go over the ramp and directly tip waste into a large vehicle (conventional arrangement) or can tip
waste into a hopper with compaction unit (MRTS arrangement) to achieve compaction of waste before final
disposal into the processing or landfill site. Exhibit 5.7 outlines the broad investment for setting up of a MRTS
of capacity 150-200 TPD:
Exhibit 5.7 Typical Storage Equipment – indicative costs and economic life
S. No Description Indicative Rate (Rs.) Economic Life (in yrs.)
1 Containers (20 m3) 60,000 4-5
2 Weigh bridge 20,000/70,000 3-4
3 Hook lift system 15,000 2-3
4 Hopper (1 m3 charge box) 60,000 3-5
5 Portable compactors 6,00,000 7-9
Source: IMaCS Analysis. Costs and Life are indicative only and may vary.
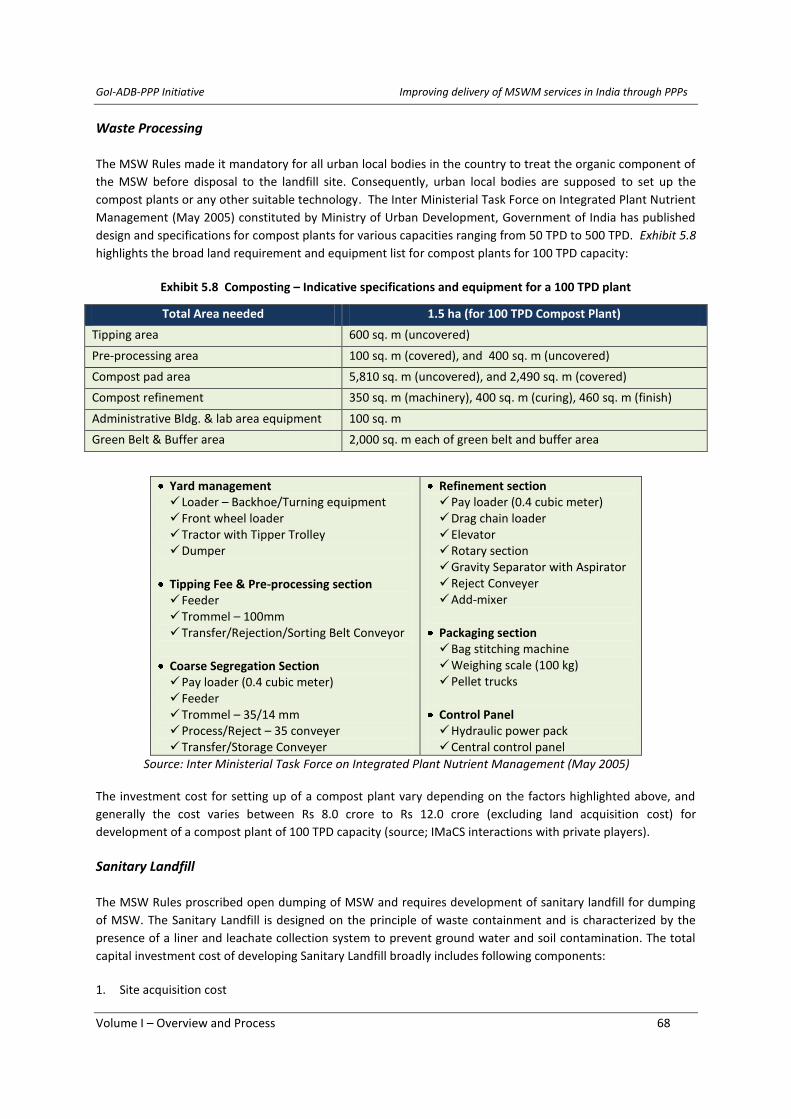
GoI-ADB-PPP Initiative Improving delivery of MSWM services in India through PPPs
Volume I – Overview and Process 68
Waste Processing
The MSW Rules made it mandatory for all urban local bodies in the country to treat the organic component of
the MSW before disposal to the landfill site. Consequently, urban local bodies are supposed to set up the
compost plants or any other suitable technology. The Inter Ministerial Task Force on Integrated Plant Nutrient
Management (May 2005) constituted by Ministry of Urban Development, Government of India has published
design and specifications for compost plants for various capacities ranging from 50 TPD to 500 TPD. Exhibit 5.8
highlights the broad land requirement and equipment list for compost plants for 100 TPD capacity:
Exhibit 5.8 Composting – Indicative specifications and equipment for a 100 TPD plant
Total Area needed 1.5 ha (for 100 TPD Compost Plant)
Tipping area 600 sq. m (uncovered)
Pre-processing area 100 sq. m (covered), and 400 sq. m (uncovered)
Compost pad area 5,810 sq. m (uncovered), and 2,490 sq. m (covered)
Compost refinement 350 sq. m (machinery), 400 sq. m (curing), 460 sq. m (finish)
Administrative Bldg. & lab area equipment 100 sq. m
Green Belt & Buffer area 2,000 sq. m each of green belt and buffer area
Yard management Loader – Backhoe/Turning equipment Front wheel loader Tractor with Tipper Trolley Dumper
Tipping Fee & Pre-processing section Feeder Trommel – 100mm Transfer/Rejection/Sorting Belt Conveyor
Coarse Segregation Section Pay loader (0.4 cubic meter) Feeder Trommel – 35/14 mm Process/Reject – 35 conveyer Transfer/Storage Conveyer
Refinement section Pay loader (0.4 cubic meter) Drag chain loader Elevator Rotary section Gravity Separator with Aspirator Reject Conveyer Add-mixer
Packaging section Bag stitching machine Weighing scale (100 kg) Pellet trucks
Control Panel Hydraulic power pack Central control panel
Source: Inter Ministerial Task Force on Integrated Plant Nutrient Management (May 2005)
The investment cost for setting up of a compost plant vary depending on the factors highlighted above, and
generally the cost varies between Rs 8.0 crore to Rs 12.0 crore (excluding land acquisition cost) for
development of a compost plant of 100 TPD capacity (source; IMaCS interactions with private players).
Sanitary Landfill
The MSW Rules proscribed open dumping of MSW and requires development of sanitary landfill for dumping
of MSW. The Sanitary Landfill is designed on the principle of waste containment and is characterized by the
presence of a liner and leachate collection system to prevent ground water and soil contamination. The total
capital investment cost of developing Sanitary Landfill broadly includes following components:
1. Site acquisition cost

GoI-ADB-PPP Initiative Improving delivery of MSWM services in India through PPPs
Volume I – Overview and Process 69
2. Site selection and environmental impact assessment studies cost
3. Site investigation and characterization cost
4. Design and detailed engineering cost (including laboratory studies)
5. Site development (construction) costs with site infrastructure & leachate/gas treatment facility
6. Landfill equipment costs (if purchased and not hired)
Essential Design Consideration: The sanitary landfill site development may be done as per the site conditions,
permeability of soil etc. Sanitary Landfill design should encompass seven essential components:
1. Liner system at the base and sides to prevent migration of leachate or gas to surrounding soil
2. Leachate collection & control facility to collect & extracts leachate and then final treatment
3. Gas collection & control facility to collect & extract gas & treat/ use it for energy recovery
4. Final cover system to enhance surface drainage, and to prevent infiltrating water
5. Surface water drainage system to collect & remove all surface runoff from the landfill site
6. Environmental monitoring system to analyse air, water, soil-gas around the landfill site
7. Plan for closure/post-closure to close/secure a landfill after completion of filling operation.
Landfill Site Infrastructure: Other than the above mentioned design considerations, the broad indicative list of
site infrastructure to be provided at the Sanitary landfill includes; (i) site entrance and fencing, (ii)
administrative & site control offices, (iii) access roads, (iv) waste inspection & sampling facility, (v) equipment
workshops & garages, (vi) signs & directions, (vii) water supply, (viii) lighting, (ix) vehicle cleaning facility, and
(x) fire fighting equipment.
The Table below outlines the recommended number of each type of equipment at a sanitary landfill is
indicated in table below:
Exhibit 5.9 Indicative Landfill equipment requirements
Waste Received at Landfill Site (Tones per day)
Equipment List Up to 200 TPD 200 – 500 TPD 500 – 1000 TPD
Bulldozers 2 3 5
Loaders 2 3 4
Excavators 2 3 3
Compactors 2 3 5
Water tankers 1 1 2
Tractor trailers/Tippers 2 4 6
Source: CPHEEO manual
The list of equipment, tools and vehicles provided above are all indicative in nature. It is highly recommended
that the urban local bodies /or municipal authorities shall make a detailed assessment of the MSWM system to
be implemented based on the assessment of the total waste generated in their respective areas, the waste
characteristics including physical composition and chemical characteristics of the waste, the availability of the
land area and its topographic conditions.
Exhibit 5.10 outlines the list of activities, and equipment required for the development of a sanitary landfill
with some indicative rates:

GoI-ADB-PPP Initiative Improving delivery of MSWM services in India through PPPs
Volume I – Overview and Process 70
Exhibit 5.10 Indicative Landfill activities and costs
Item Unit Indicative Unit Rate (in Rs)
Geo-membrane Liner sq. m 325
Barrier Layer – Bottom Liner cu. m 200
Drainage Layer – Bottom Liner cu. m 500
Vegetative Layer cu. m 175
Drainage Layer – Final Cover cu. m 425
Barrier Layer – Final Cover cu. m 175
Gas Venting Layer cu. m 475
Leachate Collection cu. m 5,000
Sumps & Pumps no. 27,500
Backhoe and Loader no. 20,00,000
Vibro Compactor no. 21,00,000
Dozer no. 21,50,000
Excavator no. 21,50,000
Tipper Truck no. 11,50,000
Water Tanker no. 12,00,000
Source: IMaCS analysis
5.2.2 Operations & Maintenance Cost
Besides the capital investment requirement for creation of an asset in accordance with the identified scope of
the project, another major estimation of the project costs include the operations and maintenance cost of the
assets created for the provision of MSWM services. The indicative list of the operation and maintenance costs
included for MSWM projects is shown in Exhibit 5.11.
Exhibit 5.11 MSWM O&M Costs – Indicative heads
S. No Particulars Annual Cost (
Rs. crore)
1 Manpower costs (salary plus employee benefits as per applicable laws)
2 Utility charges including power, water etc.
3 Operating charges including fuel for vehicles, chemicals for treatment etc.
4 Consumables for daily operations usage
5 Administrative expenses including insurance costs etc.
6 Maintenance cost for equipment, vehicles (preventive & break-down)
7 Annual land Lease rentals as per applicable lease agreement, if any
8 Any other miscellaneous expenditure
TOTAL ANNUAL O&M COSTS
Estimation of operation & maintenance (O&M) cost can be carried out in discrete ways as below:
1. Based on similar MSWM projects or industry averages to determine O&M cost as percentage of an
aggregate investment cost in the project.
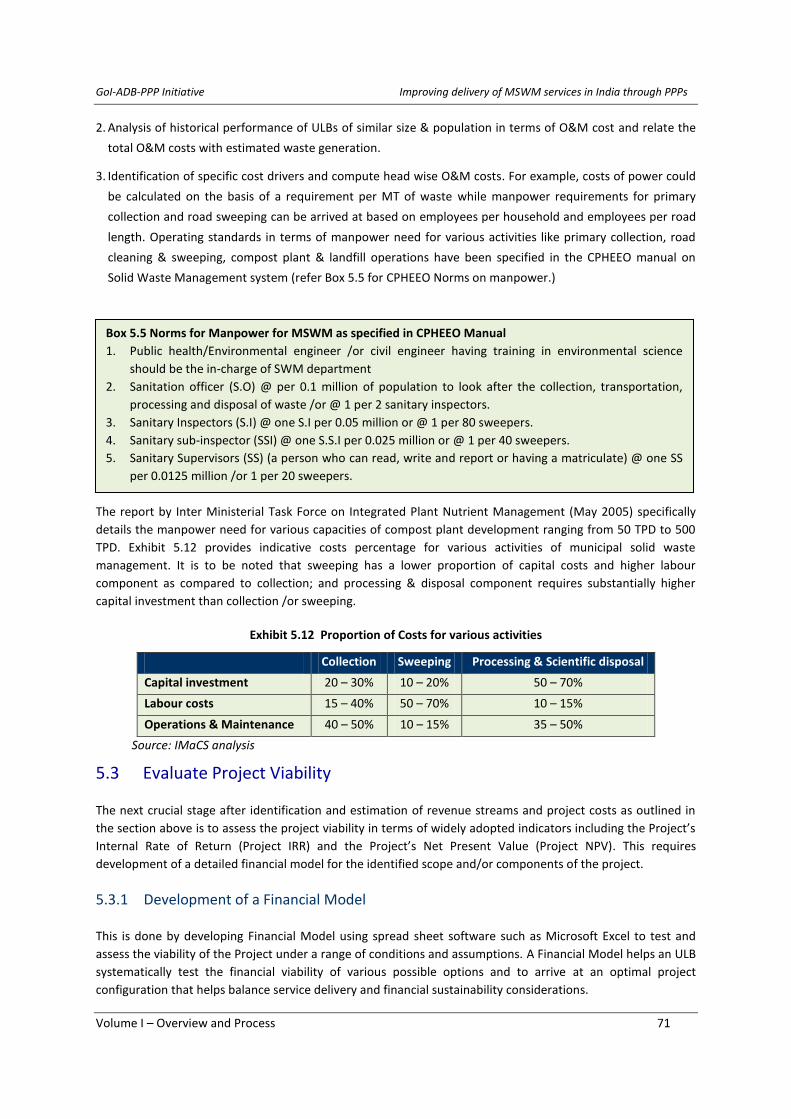
GoI-ADB-PPP Initiative Improving delivery of MSWM services in India through PPPs
Volume I – Overview and Process 71
2. Analysis of historical performance of ULBs of similar size & population in terms of O&M cost and relate the
total O&M costs with estimated waste generation.
3. Identification of specific cost drivers and compute head wise O&M costs. For example, costs of power could
be calculated on the basis of a requirement per MT of waste while manpower requirements for primary
collection and road sweeping can be arrived at based on employees per household and employees per road
length. Operating standards in terms of manpower need for various activities like primary collection, road
cleaning & sweeping, compost plant & landfill operations have been specified in the CPHEEO manual on
Solid Waste Management system (refer Box 5.5 for CPHEEO Norms on manpower.)
The report by Inter Ministerial Task Force on Integrated Plant Nutrient Management (May 2005) specifically
details the manpower need for various capacities of compost plant development ranging from 50 TPD to 500
TPD. Exhibit 5.12 provides indicative costs percentage for various activities of municipal solid waste
management. It is to be noted that sweeping has a lower proportion of capital costs and higher labour
component as compared to collection; and processing & disposal component requires substantially higher
capital investment than collection /or sweeping.
Exhibit 5.12 Proportion of Costs for various activities
Collection Sweeping Processing & Scientific disposal
Capital investment 20 – 30% 10 – 20% 50 – 70%
Labour costs 15 – 40% 50 – 70% 10 – 15%
Operations & Maintenance 40 – 50% 10 – 15% 35 – 50%
Source: IMaCS analysis
5.3 Evaluate Project Viability
The next crucial stage after identification and estimation of revenue streams and project costs as outlined in
the section above is to assess the project viability in terms of widely adopted indicators including the Project’s
Internal Rate of Return (Project IRR) and the Project’s Net Present Value (Project NPV). This requires
development of a detailed financial model for the identified scope and/or components of the project.
5.3.1 Development of a Financial Model
This is done by developing Financial Model using spread sheet software such as Microsoft Excel to test and
assess the viability of the Project under a range of conditions and assumptions. A Financial Model helps an ULB
systematically test the financial viability of various possible options and to arrive at an optimal project
configuration that helps balance service delivery and financial sustainability considerations.
Box 5.5 Norms for Manpower for MSWM as specified in CPHEEO Manual
1. Public health/Environmental engineer /or civil engineer having training in environmental science
should be the in-charge of SWM department
2. Sanitation officer (S.O) @ per 0.1 million of population to look after the collection, transportation,
processing and disposal of waste /or @ 1 per 2 sanitary inspectors.
3. Sanitary Inspectors (S.I) @ one S.I per 0.05 million or @ 1 per 80 sweepers.
4. Sanitary sub-inspector (SSI) @ one S.S.I per 0.025 million or @ 1 per 40 sweepers.
5. Sanitary Supervisors (SS) (a person who can read, write and report or having a matriculate) @ one SS
per 0.0125 million /or 1 per 20 sweepers.
6. Sweepers strength 2 to 3 sweepers per 1000 population
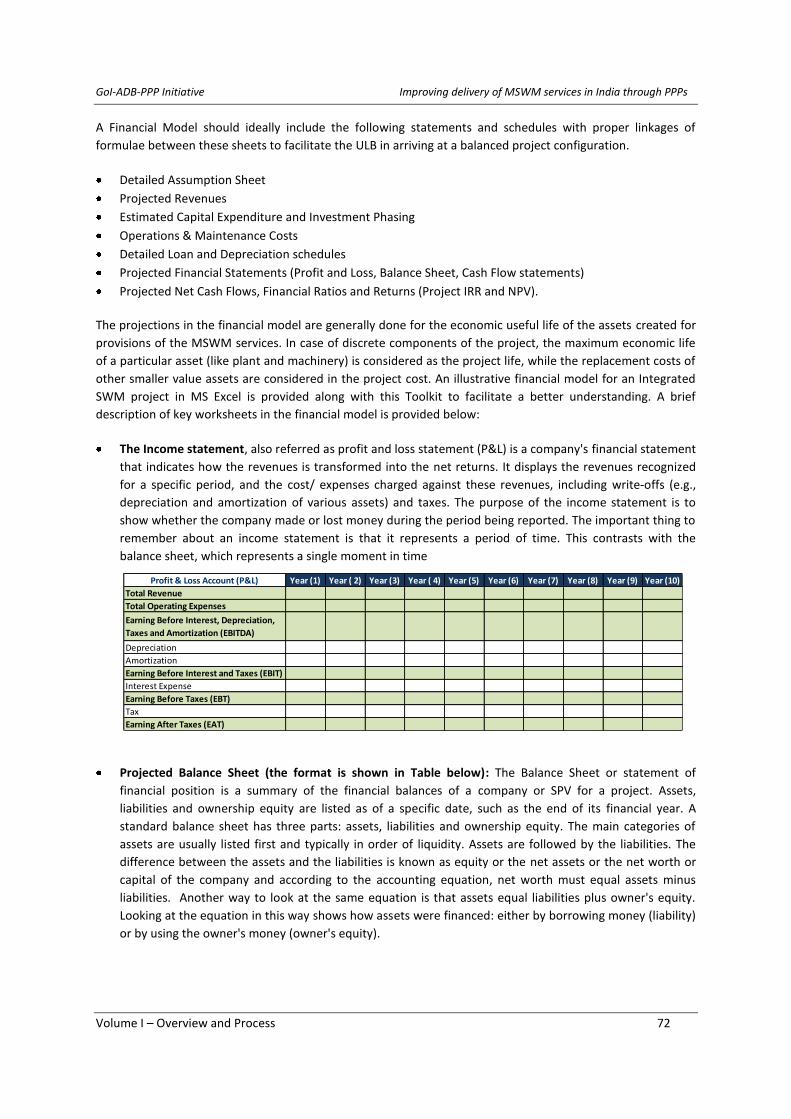
GoI-ADB-PPP Initiative Improving delivery of MSWM services in India through PPPs
Volume I – Overview and Process 72
A Financial Model should ideally include the following statements and schedules with proper linkages of
formulae between these sheets to facilitate the ULB in arriving at a balanced project configuration.
Detailed Assumption Sheet
Projected Revenues
Estimated Capital Expenditure and Investment Phasing
Operations & Maintenance Costs
Detailed Loan and Depreciation schedules
Projected Financial Statements (Profit and Loss, Balance Sheet, Cash Flow statements)
Projected Net Cash Flows, Financial Ratios and Returns (Project IRR and NPV).
The projections in the financial model are generally done for the economic useful life of the assets created for
provisions of the MSWM services. In case of discrete components of the project, the maximum economic life
of a particular asset (like plant and machinery) is considered as the project life, while the replacement costs of
other smaller value assets are considered in the project cost. An illustrative financial model for an Integrated
SWM project in MS Excel is provided along with this Toolkit to facilitate a better understanding. A brief
description of key worksheets in the financial model is provided below:
The Income statement, also referred as profit and loss statement (P&L) is a company's financial statement
that indicates how the revenues is transformed into the net returns. It displays the revenues recognized
for a specific period, and the cost/ expenses charged against these revenues, including write-offs (e.g.,
depreciation and amortization of various assets) and taxes. The purpose of the income statement is to
show whether the company made or lost money during the period being reported. The important thing to
remember about an income statement is that it represents a period of time. This contrasts with the
balance sheet, which represents a single moment in time
Projected Balance Sheet (the format is shown in Table below): The Balance Sheet or statement of
financial position is a summary of the financial balances of a company or SPV for a project. Assets,
liabilities and ownership equity are listed as of a specific date, such as the end of its financial year. A
standard balance sheet has three parts: assets, liabilities and ownership equity. The main categories of
assets are usually listed first and typically in order of liquidity. Assets are followed by the liabilities. The
difference between the assets and the liabilities is known as equity or the net assets or the net worth or
capital of the company and according to the accounting equation, net worth must equal assets minus
liabilities. Another way to look at the same equation is that assets equal liabilities plus owner's equity.
Looking at the equation in this way shows how assets were financed: either by borrowing money (liability)
or by using the owner's money (owner's equity).
Profit & Loss Account (P&L) Year (1) Year ( 2) Year (3) Year ( 4) Year (5) Year (6) Year (7) Year (8) Year (9) Year (10)
Total Revenue
Total Operating Expenses
Earning Before Interest, Depreciation,
Taxes and Amortization (EBITDA)
Depreciation
Amortization
Earning Before Interest and Taxes (EBIT)
Interest Expense
Earning Before Taxes (EBT)
Tax
Earning After Taxes (EAT)

GoI-ADB-PPP Initiative Improving delivery of MSWM services in India through PPPs
Volume I – Overview and Process 73
Balance Sheet Year (1) Year ( 2) Year (3) Year ( 4) Year (5) Year (6) Year (7) Year (8) Year (9) Year (10)
ASSETS
Current Assets
Cash
Accounts Receivables
Inventories
Other Current Assets
Total Current Assets
Fixed Assets
TOTAL ASSETS
LIABILITIES & SHAREHOLDERS EQUITY
CURRENT LIABILITIES
Short Term Debt
Accounts Payable & Accrued Expenses
Other Current Liabilities
Total Curent Liabilities
Long Term Debt
TOTAL LIABILITIES
Share capital
Reserves and Surplus
TOTAL EQUITY
TOTAL LIABILITIES & EQUITY
Projected Cash Flow Statement outlining the project’ cash inflows, cash outflows and terminal cash
inflows (the format is shown in Table below). The Cash Flow Statement, also known as statement of cash
flows is a financial statement that shows how changes in balance sheet accounts and income affect cash
and cash equivalents, and breaks the analysis down to operating, investing, and financing activities.
Essentially, the cash flow statement is concerned with the flow of cash in and cash out of the business.
The statement captures both the current operating results and the accompanying changes in the balance
sheet.
All these statements and sheets linked together form a financial model. The financial model templates in the
excel formats for various components of MSWM value chain has been provided separately in the CD, attached
with this Toolkit manual.
5.3.2 Computation of Project returns
Once the estimates on the project net cash flows is done based on the projected revenues and expenses of the
project for the identified project duration, the next step is to evaluate key financial indicators to assess the
financial viability of the project. Some of the indicators that are used in evaluating the project’s financial
viability and performance are discussed below:
1. Operating ratio: This ratio determines if the project revenues are sufficient enough to meet the revenue
expenditure i.e., the recurring operating expenses of the project. In case of positive operating margins, it
implies that there is excess of project revenues to cover all operating expenses. In case there is an
Cash Flow Statement Year (1) Year ( 2) Year (3) Year ( 4) Year (5) Year (6) Year (7) Year (8) Year (9) Year (10)
Operating Activities
EAT
Add depreciation
Add amortisation
Increase/Decrease of Working Capital
Cash flow from operating activities
Cash flow from investing activities
Cash flow from financing activities
Net cash flow
Cumulative Cash Balance

GoI-ADB-PPP Initiative Improving delivery of MSWM services in India through PPPs
Volume I – Overview and Process 74
operating deficit /or negative operating margins, this stipulates for an operating /or recurring subsidy to
meet recurring expenses.
Definition: The operating ratio is a financial term defined as operating expenses for the project as a
percentage of project revenues.
Significance: Operating ratio shows the operational efficiency of the project and may be expressed in
operating margins (EBIDTA as percentage of revenues)/or net profit margins (EAT as percentage of
revenues).
2. Debt Service Coverage Ratio (DSCR): The DSCR gives an indication of the capacity to repay the debt
incurred for the project from operating surpluses and/or margins. This generally should be above one for
similar infrastructure projects, although lenders may insist on much higher DSCR for additional comfort.
Further, cash reserves and other separate provisions may have to be made to ensure that the DSCR does
not fall below the minimum desired level.
Definition: This ratio measures the capacity to service the debt i.e. repayment of principal and interest.
DSCR measures the number of times earnings from project cover its total long-term debt-servicing
requirement, including interest and principal repayments in term loans, over a period of one year.
DSCR = Cash Flow Available for Debt Service (CFADS)
[Interest (I) + Principal repayment (P)]
Where CFADS = Operating cash flow less tax less working capital increase less capital expenditure/
replacement capital expenditure less money to reserves add money from reserves.
Illustration
Cash Flow Available for Debt Service is shown in the “Row 49” and the total CFADS over the project period
is calculated in “I49” which is equal to 86,607. Further, Interest and Principal amount are shown in
“Row51” and “Row 52” respectively. The total of interest and principal over the project life is calculated in
“I53”, which is equal to 46,383. Finally, the Average DSCR is calculated in “I57” by dividing the total CFADS
to the sum of Principal and Interest over the project life, which is equal to 1.867x.
Calculation method – Total CFADS over sum of (P + I)
Total the CFADS over life of the loan
Total the debt service over the loan life, i.e. sum of principal and interest
Divide the total CFADS over the sum of principal and interest
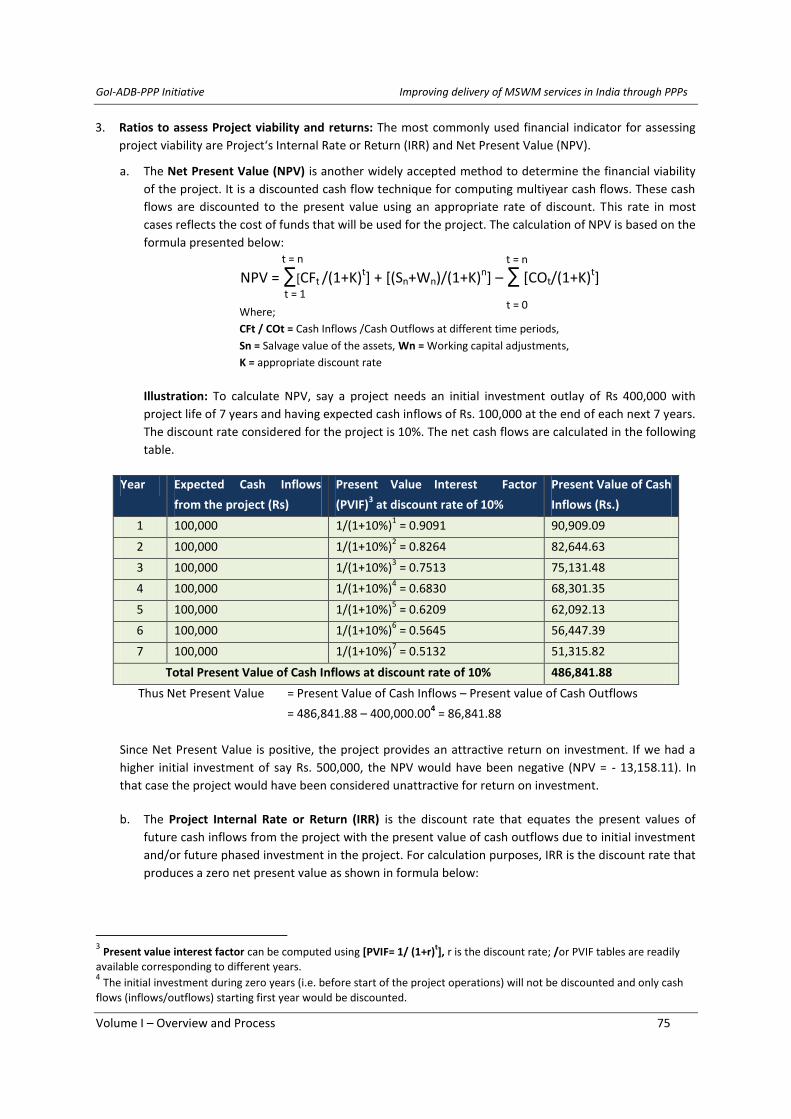
GoI-ADB-PPP Initiative Improving delivery of MSWM services in India through PPPs
Volume I – Overview and Process 75
3. Ratios to assess Project viability and returns: The most commonly used financial indicator for assessing
project viability are Project‘s Internal Rate or Return (IRR) and Net Present Value (NPV).
a. The Net Present Value (NPV) is another widely accepted method to determine the financial viability
of the project. It is a discounted cash flow technique for computing multiyear cash flows. These cash
flows are discounted to the present value using an appropriate rate of discount. This rate in most
cases reflects the cost of funds that will be used for the project. The calculation of NPV is based on the
formula presented below:
NPV = ∑[CFt /(1+K)t] + [(Sn+Wn)/(1+K)n] – ∑ [COt/(1+K)t]
Where;
CFt / COt = Cash Inflows /Cash Outflows at different time periods,
Sn = Salvage value of the assets, Wn = Working capital adjustments,
K = appropriate discount rate
Illustration: To calculate NPV, say a project needs an initial investment outlay of Rs 400,000 with
project life of 7 years and having expected cash inflows of Rs. 100,000 at the end of each next 7 years.
The discount rate considered for the project is 10%. The net cash flows are calculated in the following
table.
Year Expected Cash Inflows
from the project (Rs)
Present Value Interest Factor
(PVIF)3 at discount rate of 10%
Present Value of Cash
Inflows (Rs.)
1 100,000 1/(1+10%)1 = 0.9091 90,909.09
2 100,000 1/(1+10%)2 = 0.8264 82,644.63
3 100,000 1/(1+10%)3 = 0.7513 75,131.48
4 100,000 1/(1+10%)4 = 0.6830 68,301.35
5 100,000 1/(1+10%)5 = 0.6209 62,092.13
6 100,000 1/(1+10%)6 = 0.5645 56,447.39
7 100,000 1/(1+10%)7 = 0.5132 51,315.82
Total Present Value of Cash Inflows at discount rate of 10% 486,841.88
Thus Net Present Value = Present Value of Cash Inflows – Present value of Cash Outflows
= 486,841.88 – 400,000.004 = 86,841.88
Since Net Present Value is positive, the project provides an attractive return on investment. If we had a
higher initial investment of say Rs. 500,000, the NPV would have been negative (NPV = - 13,158.11). In
that case the project would have been considered unattractive for return on investment.
b. The Project Internal Rate or Return (IRR) is the discount rate that equates the present values of
future cash inflows from the project with the present value of cash outflows due to initial investment
and/or future phased investment in the project. For calculation purposes, IRR is the discount rate that
produces a zero net present value as shown in formula below:
3 Present value interest factor can be computed using [PVIF= 1/ (1+r)
t], r is the discount rate; /or PVIF tables are readily
available corresponding to different years. 4 The initial investment during zero years (i.e. before start of the project operations) will not be discounted and only cash
flows (inflows/outflows) starting first year would be discounted.
t = 1
t = n
t = 0
t = n
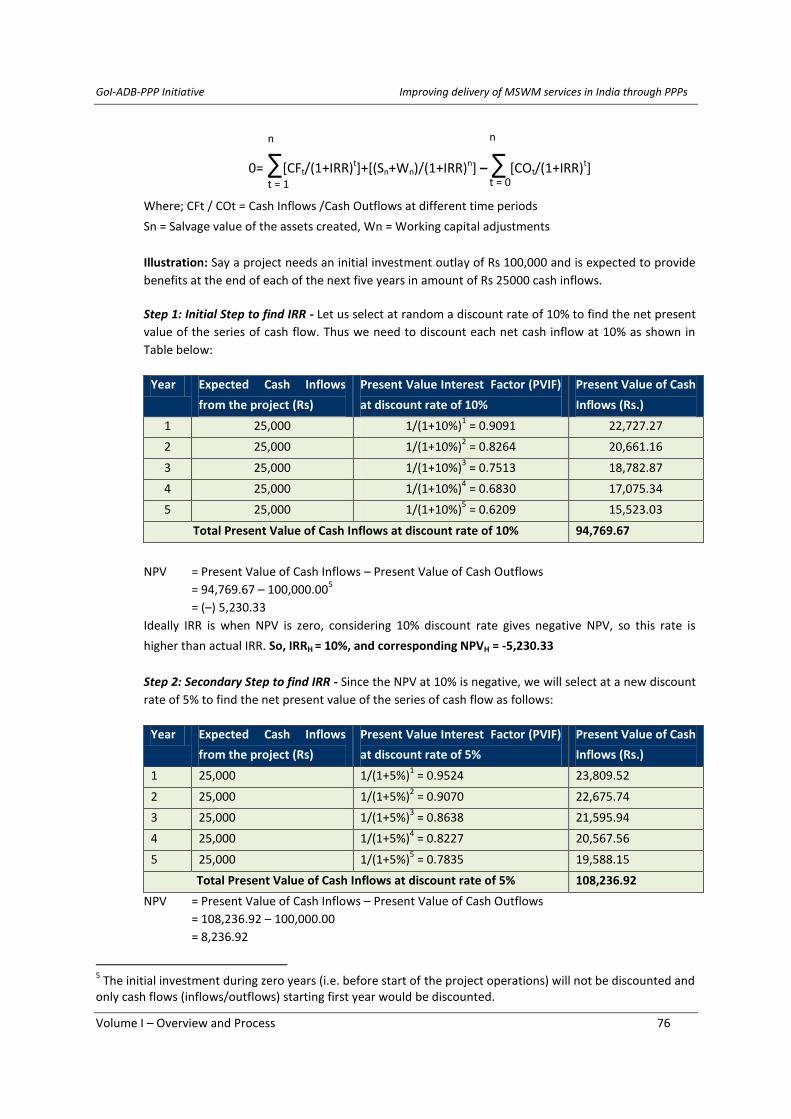
GoI-ADB-PPP Initiative Improving delivery of MSWM services in India through PPPs
Volume I – Overview and Process 76
0= ∑[CFt/(1+IRR)t]+[(Sn+Wn)/(1+IRR)n] – ∑ [COt/(1+IRR)t]
Where; CFt / COt = Cash Inflows /Cash Outflows at different time periods
Sn = Salvage value of the assets created, Wn = Working capital adjustments
Illustration: Say a project needs an initial investment outlay of Rs 100,000 and is expected to provide
benefits at the end of each of the next five years in amount of Rs 25000 cash inflows.
Step 1: Initial Step to find IRR - Let us select at random a discount rate of 10% to find the net present
value of the series of cash flow. Thus we need to discount each net cash inflow at 10% as shown in
Table below:
Year Expected Cash Inflows
from the project (Rs)
Present Value Interest Factor (PVIF)
at discount rate of 10%
Present Value of Cash
Inflows (Rs.)
1 25,000 1/(1+10%)1 = 0.9091 22,727.27
2 25,000 1/(1+10%)2 = 0.8264 20,661.16
3 25,000 1/(1+10%)3 = 0.7513 18,782.87
4 25,000 1/(1+10%)4 = 0.6830 17,075.34
5 25,000 1/(1+10%)5 = 0.6209 15,523.03
Total Present Value of Cash Inflows at discount rate of 10% 94,769.67
NPV = Present Value of Cash Inflows – Present Value of Cash Outflows
= 94,769.67 – 100,000.005
= (–) 5,230.33
Ideally IRR is when NPV is zero, considering 10% discount rate gives negative NPV, so this rate is
higher than actual IRR. So, IRRH = 10%, and corresponding NPVH = -5,230.33
Step 2: Secondary Step to find IRR - Since the NPV at 10% is negative, we will select at a new discount
rate of 5% to find the net present value of the series of cash flow as follows:
Year Expected Cash Inflows
from the project (Rs)
Present Value Interest Factor (PVIF)
at discount rate of 5%
Present Value of Cash
Inflows (Rs.)
1 25,000 1/(1+5%)1 = 0.9524 23,809.52
2 25,000 1/(1+5%)2 = 0.9070 22,675.74
3 25,000 1/(1+5%)3 = 0.8638 21,595.94
4 25,000 1/(1+5%)4 = 0.8227 20,567.56
5 25,000 1/(1+5%)5 = 0.7835 19,588.15
Total Present Value of Cash Inflows at discount rate of 5% 108,236.92
NPV = Present Value of Cash Inflows – Present Value of Cash Outflows
= 108,236.92 – 100,000.00
= 8,236.92
5 The initial investment during zero years (i.e. before start of the project operations) will not be discounted and
only cash flows (inflows/outflows) starting first year would be discounted.
t = 1 t = 0
n n
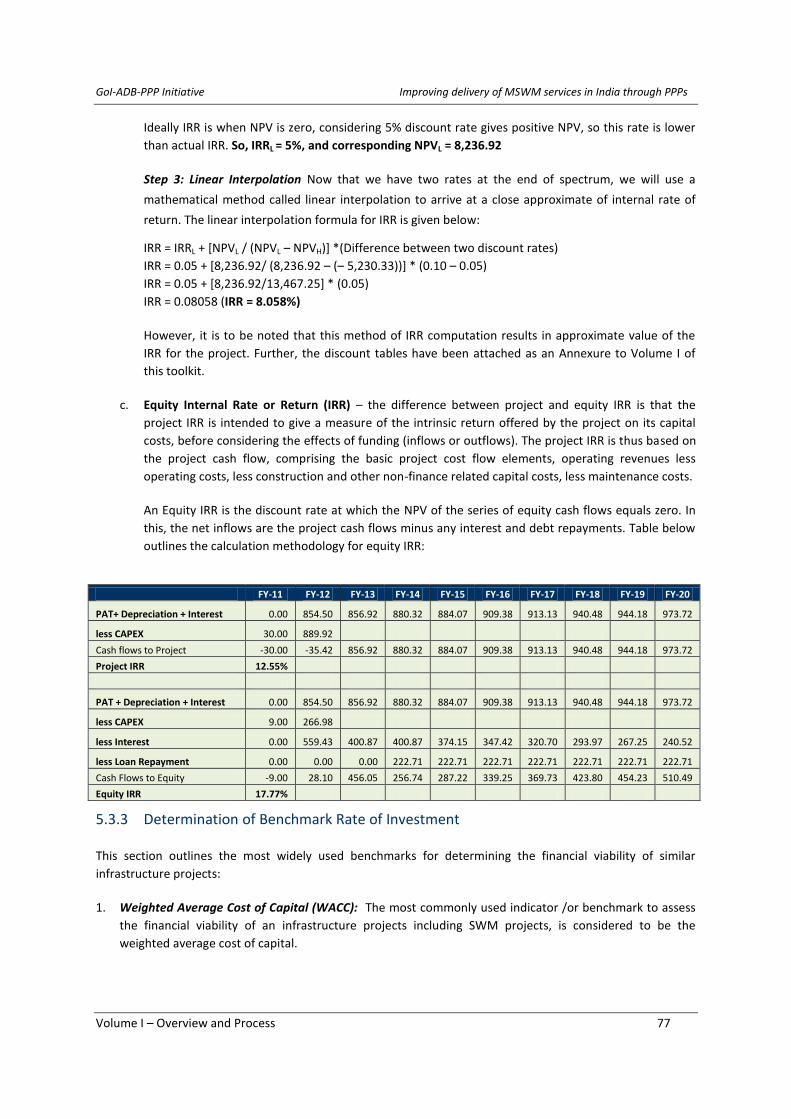
GoI-ADB-PPP Initiative Improving delivery of MSWM services in India through PPPs
Volume I – Overview and Process 77
Ideally IRR is when NPV is zero, considering 5% discount rate gives positive NPV, so this rate is lower
than actual IRR. So, IRRL = 5%, and corresponding NPVL = 8,236.92
Step 3: Linear Interpolation Now that we have two rates at the end of spectrum, we will use a
mathematical method called linear interpolation to arrive at a close approximate of internal rate of
return. The linear interpolation formula for IRR is given below:
IRR = IRRL + [NPVL / (NPVL – NPVH)] *(Difference between two discount rates)
IRR = 0.05 + [8,236.92/ (8,236.92 – (– 5,230.33))] * (0.10 – 0.05)
IRR = 0.05 + [8,236.92/13,467.25] * (0.05)
IRR = 0.08058 (IRR = 8.058%)
However, it is to be noted that this method of IRR computation results in approximate value of the
IRR for the project. Further, the discount tables have been attached as an Annexure to Volume I of
this toolkit.
c. Equity Internal Rate or Return (IRR) – the difference between project and equity IRR is that the
project IRR is intended to give a measure of the intrinsic return offered by the project on its capital
costs, before considering the effects of funding (inflows or outflows). The project IRR is thus based on
the project cash flow, comprising the basic project cost flow elements, operating revenues less
operating costs, less construction and other non-finance related capital costs, less maintenance costs.
An Equity IRR is the discount rate at which the NPV of the series of equity cash flows equals zero. In
this, the net inflows are the project cash flows minus any interest and debt repayments. Table below
outlines the calculation methodology for equity IRR:
5.3.3 Determination of Benchmark Rate of Investment
This section outlines the most widely used benchmarks for determining the financial viability of similar
infrastructure projects:
1. Weighted Average Cost of Capital (WACC): The most commonly used indicator /or benchmark to assess
the financial viability of an infrastructure projects including SWM projects, is considered to be the
weighted average cost of capital.
FY-11 FY-12 FY-13 FY-14 FY-15 FY-16 FY-17 FY-18 FY-19 FY-20
PAT+ Depreciation + Interest 0.00 854.50 856.92 880.32 884.07 909.38 913.13 940.48 944.18 973.72
less CAPEX 30.00 889.92
Cash flows to Project -30.00 -35.42 856.92 880.32 884.07 909.38 913.13 940.48 944.18 973.72
Project IRR 12.55%
PAT + Depreciation + Interest 0.00 854.50 856.92 880.32 884.07 909.38 913.13 940.48 944.18 973.72
less CAPEX 9.00 266.98
less Interest 0.00 559.43 400.87 400.87 374.15 347.42 320.70 293.97 267.25 240.52
less Loan Repayment 0.00 0.00 0.00 222.71 222.71 222.71 222.71 222.71 222.71 222.71
Cash Flows to Equity -9.00 28.10 456.05 256.74 287.22 339.25 369.73 423.80 454.23 510.49
Equity IRR 17.77%

GoI-ADB-PPP Initiative Improving delivery of MSWM services in India through PPPs
Volume I – Overview and Process 78
a. WACC calculation: The WACC is the minimum return a project must earn on existing asset base to
satisfy its creditors, owners, and other providers of capital, or they will invest elsewhere to realise the
financial opportunity cost of capital in the market.
Most projects raise capital from a number of sources like common equity, preferred equity, straight
debt, convertible debt, governmental subsidies, and so on. Each of these sources generally seeks
different returns. The WACC represents a weighted average of the different returns paid to these
sources and is calculated taking into account the relative weights of each component of the capital
structure. The project which is financed by homogenous equity and debt, the weighted average cost
of capital can be calculated using formula as below:
WACC = [{E / (D+E)}] * Ce] + [{D / (D+E)}] * Cd * (1-t)] Where Ce = Rf + β * (Rm - Rf), β is the Beta Coefficient
Symbol Description Units
E Total market value of equity & equity equivalents in the project currency
D Total value of debt and leases in the project currency
Ce Required /or expected rate of return on equity, / or Cost of equity %
Cd Required /or expected rate of return on borrowings before taxes %
t Corporate tax rate applicable %
β
index of the degree of responsiveness or co-movement of return on
investment with market return
_
Rf Rate of return required on a risk-free asset/investment %
Rm Rate of return required on market portfolio of assets %
2. Market rate of return: Although WACC is an accepted benchmark, it is important to understand that the
WACC may not fully reflect the financial opportunity cost of capital (FOCC) in the market. Although a
project may generate sufficient returns to allow full recovery of all investment and O&M costs while still
yielding a small return on investment, this return may not be sufficient incentive for the owner to make
the original investment or to maintain the investment.
Hence, the other possible way of comparing the project returns is with the rate of return of the equity
market over a long term on National /or Bombay Stock Exchange in the country, which can be considered
as a reasonable representation of all business opportunities available to the investors. Furthermore, it is
equally imperative to understand the returns generated through similar projects /or returns that are
considered reasonable by leading private players in the SWM sector.
5.3.4 Determine the Project Financial Viability & Sensitivity Analysis
As highlighted above, the WACC is the “minimum” return a project must earn on existing asset base to satisfy
its creditors, owners, and other providers of capital. The financial viability of the project using IRR as the
financial indicator for returns can be determined using following equation:

GoI-ADB-PPP Initiative Improving delivery of MSWM services in India through PPPs
Volume I – Overview and Process 79
Project Financial Rate of Return (FIRR) >= Weighted Average Cost of Capital (WACC)
i.e. for a project to be financially viable the financial Internal Rate of Return (IRR) should be equal or greater
than the estimated Weighted Average Cost of Capital (WACC).
The financial viability of the project using NPV as the financial indicator for returns can be determined using
following equation:
Net Present Value (NPV) = positive value, using WACC as the discount rate
i.e. the Net Present Value (NPV) positive indicates that the project provides attractive returns on investment.
However, if the rate of return assumed is the market rate of return estimated in accordance with procedure
specified in the section above, the financial indicators on return (IRR, NPV) need to consider such rate of return
for determining the financial viability of the project in line with the equations outlined in this section above.
Sensitivity analysis
It is a technique to determine the impact of key variables in the project on the financial outcomes considering
the base-case, which is the most-probable outcome scenario. The purpose of sensitivity analysis is to identify
the key variables which influence the project cost and benefit streams. In SWM, key variables to be normally
included in sensitivity analysis include waste quantity generation, investment cost; O&M cost, financial
revenues, user charges etc. A Sensitivity analysis also helps investigate the consequences of likely adverse
changes in these key variables and assess whether project decisions are likely to be affected by such changes.
Finally, it helps the ULB identify actions that could mitigate possible adverse effects on the project. The steps
involved in conducting the sensitivity analysis include:
Identification of key variables to which the project decision may be sensitive
Calculate the effect of likely changes in these variables on the base-case IRR or NPV, and calculate a
sensitivity indicator and/or switching value
Consider possible combinations of variables that may change simultaneously in an adverse direction
Analyse the direction and scale of likely changes for the key variables identified, involving identification of
the sources of change
In cases where project results are expected to be particularly sensitive to certain variables, it has to be
assessed how likely it is that such changes would occur. This likelihood can be assessed by studying
experiences in earlier, comparable projects and by investigating the situation in the sector as a whole.
GoI-ADB-PPP Initiative Improving delivery of MSWM services in India through PPPs
Volume I – Overview and Process 80
5.4 Determine the Financial Support Requirement
The financial analysis based on the key financial indicators assessment in accordance with the criteria stated in
the section above, assist urban local bodies /or municipal authorities to stipulate on the next course of action
in line with the following outcomes /or scenarios:
Scenario-1: The project is financially viable and has ability to generate sufficient returns to the
stakeholders; creditors, equity holders, and other providers of capital
Scenario-2: The project is not financially viable given the current estimated cost structure and identified
probable revenue streams
For Scenario-1, i.e. the project having ability to generate sufficient returns, the urban local bodies /or
municipal authorities should follow steps as outlined below to determine the mode of funding:
Step 1: Detailed assessment of the internal financial health of their ULB to determine if the capital
investment requirement for the project can be funded through internal cash surplus /or budgetary
provisions for MSW services
Step 2: This assessment needs to be in tandem with series of qualitative parameters which needs to be
considered as specified in the next section on choosing between public funding and PPP.
For Scenario-2, i.e. the project is not financially viable with the current estimated cost structure and identified
probable revenue streams, the urban local bodies /or municipal authorities shall explore options to (i) reduce
costs in the project, may be with an altered scope and structuring; and (ii) increase revenues to the project.
The project may require subsidy in following forms to become financially viable:
1. Operating Subsidy – this is necessary to bridge the gap between operating expenses and operating
income. In case there is positive operating margins, but still the projects inherently is not capable of
paying off its debt, then subsidy in the form of interest subsidy is required to meet the debt servicing
(interest) costs. In some SWM projects, the government guarantees to compensate private developer if
actual revenues fall below projected revenue (as per the contract obligations) through various
mechanisms like tipping fees, take or pay contracts for by-products from waste processing etc. This is
generally used when the user charges are not adequate to cover the operating costs or need to be kept
low for social considerations or the actual MSW quantity is less than the minimum assured MSW for the
project. Such subsidy /or grant is paid during the operation of the asset and is directed towards supporting
the operating costs or reduced revenues than actually projected. The graph below depicts the operating
subsidy component in the infrastructure projects.
2. Capital Subsidy - this is necessary when the project returns are insufficient to re-coup the capital cost of
the project. It is well accepted fact that infrastructure projects of similar nature generally have a long
gestation period and may not all be fully financially viable on their own. The Government of India has set
up a special facility through the Viability Gap Funding (VGF) to provide financial support to those
infrastructure projects which are being developed on a PPP basis. This viability gap funding scheme was
notified in 2006 and is generally provided in the form of a capital grant, in which case the gross cost of the
project reduces by the amount of the capital grant. However, in certain cases, viability gap funding can
also be provided in the form of deferred grant /or revenue grant to meet the desired operating ratios
and/or debt repayment requirement of the project.

GoI-ADB-PPP Initiative Improving delivery of MSWM services in India through PPPs
Volume I – Overview and Process 81
Exhibit 5.13 Viabilty Gap Support requirement in a PPP project
The Government of India has launched a Viability Gap Funding Scheme to address such Viability Gaps. The
guidelines for eligibility and application to access funds under this scheme can be accessed from
www.pppinindia.com and are summarised in Box 5.6.
Box 5.6 Viability Gap Fund (VGF) Scheme
The scheme provides VGF grants to PPP projects in specific sectors, sponsored by any level of
administration – Central/State/Local Government
The concession /or contract for development and/or implementation of the project shall be awarded to a
company in which a private entity control 51% of more of the paid-up equity
The project is awarded through an international /or national competitive bidding process The private
sector company shall be responsible for financing, development, operation & maintenance of the project
The VGF support is capped at 20% of the project cost.
An additional VGF grant, capped at 20%, can be given by the government agency sponsoring the project
The project shall involve provision of a service against a pre-determined tariff or user charge
The VGF support is issued only after the other options of enhancing viability are exhausted or are not
possible in the case of a specific project.
The approved amount of VGF grant for a project is released in its entirety to the Lead Financial Institution
(lead member of the consortium financing the project).
The Lead Financial Entity releases the grant after the equity of the private partner is exhausted. The
release of the grant to the project is in the ratio of release of the debt.
The urban local bodies /or municipal authorities need to assess the extent of viability gap funding requirement
in case of projects which are not financially viable given their cost structure and expected revenues inflows to
make them attractive and amenable for private sector participation. Apart from the VGF scheme, ULBs may
also tap similar schemes available under State Governments or leverage other Grant schemes such as the
JNNURM or UIDSSMT to address viability gaps while developing PPP projects.
Net Capital
Expenditure
requirement for the
Project
Capital Subsidy /VGF
Net Operation & Maintenance
(O&M) Expenses
Revenue deficit to be supported
by additional operational subsidy
Construction Period Operations Period
Projected
Revenues
Capital
Expense
required
Actual Revenues

GoI-ADB-PPP Initiative Improving delivery of MSWM services in India through PPPs
Volume I – Overview and Process 82
6. Step 3: Scoping and Structuring
This section traces the steps in logically arriving at the possible components and scope of services that need to
be delivered through a PPP project.
Step 1 and 2 of the project development process discussed in chapters 4 and 5 facilitates the ULB in getting a
holistic understanding of the entire MSWM system in the city, helps identify the issues and gaps with respect
to each of the components in a MSWM value chain and overall service delivery. The ULB is now in a position to
identify interventions needed and with a fair assessment of its own internal capacity and understanding of
drivers for financial viability of the MSWM system, can now plan for identifying the components and scope of
services that is appropriate for delivery through a PPP arrangement. Before getting into the specific aspects
and considerations regarding crystallising the scope of a PPP project, it is critical to understand the rationale
and distinguishing factors, and pre-requisites for service delivery through PPP which are discussed below:
6.1 Rationale for PPP
6.1.1 Improved Service delivery and efficiency gains
One of the critical aspects of bringing in private sector participation in MSWM is to bring in greater efficiencies
and improved service delivery. PPPs when structured well have an in-build incentive for efficiency
improvement by a) separating the regulatory/monitoring role from the ‘operating’ role and b) shifting the
focus from asset creation to service delivery. For instance, the report of the Technical Advisory Group
appointed by the Government of India released in 2005 highlights the efficiency gains and reduced cost of
service delivery in SWM PPP contracts in Navi Mumbai and Rajkot as early as the 1990s.
6.1.2 Bringing in Technical and managerial know-how
As discussed in chapter 2, Processing and Disposal facilities continue to be non-existent in the Indian context
with most ULBs resorting to dumping of waste, which is costly and unsustainable. Managing and handling
processing and treatment of waste require expertise and technical know-how that is often not available with
the ULBs. Attempts to set up compositing facilities on an EPC format have often failed due to this reason. PPPs
offer a way to transfer technology and operating risk of such facilities to the private sector operators that have
a proven track record in setting up and managing such facilities. Apart from technical know-how, PPPs also
help bring in best practices in operations and management.
Box 6.1 highlights some of the new management practices that were brought in when a PPP was awarded to
manage the waste transportation and collection in select zones of Chennai Corporation in the 1990s.
Box 6.1 Modern management practices in MSWM PPP – Experience of Chennai Corporation
Modern Equipment and accessories: The Private Operator brought in a number of best practices including
purchase of over 180 auto rickshaws, 60 heavy vehicles, plastic bins of capacity 600 to 1000 litres and
working tools for staff such as brooms, shovels, bicycles etc. Nearly 50% of the investment in value terms
had to be imported. The Operator set up a mechanical workshop for maintenance and repair of
equipment
GoI-ADB-PPP Initiative Improving delivery of MSWM services in India through PPPs
Volume I – Overview and Process 83
Improved Citizen Orientation: The Operator used print media as well as visual media for creating
awareness among Chennai’s residents. Posters and banners were displayed in various streets to inform
citizens about the need for cleanliness and hygiene as well as the proposed timing of cleaning operations.
Street plays were organized on themes such as health, cleanliness and hygiene. Sector Supervisors were
equipped with Radios for faster communication with the zonal managers and a dedicated toll free number
for registering complaints from the citizens relating to collection and transportation of the garbage. The
concessionaire gained accolades from Chennai’s citizens by resolving all registered complaints within 24
hours. The waste management services were available even during holidays and festivals. Citizens
residing in the corporation area served by CoC, but not served by the concessionaire, started comparing
their SWM services with areas served by the Private operator. This in turn aroused a competitive spirit
among the employees/zones managed directly by CoC and there was an overall improvement in MSWM
services across the city.
Employee Training and recognition: The private operator provided attractive remuneration including
employment guarantee during the concession period and creation of a Bank Account. Best practices
relating to safety and work practices were incorporated and all workers were equipped with a uniform
with fluorescent banks and gloves, safety shoes, masks, caps and raincoats for protecting them against
impediments on the job and the vagaries of the weather. A dedicated training department comprising a
manager and ten onsite trainers was set up to train recruits and ensuring adherence to set practices.
Initially, a resource person from France supervised the training imparted to the staff. The training resulted
in a reduction in the number of accidents, reduced damage to equipment, reduction in operation and
maintenance costs, and improved morale of the staff.
6.1.3 Investment substitution
Even though full Investment PPPs based on revenues from waste recovery are non-existent, there have been a
number of instances of the private sector making partial contribution to MSWM investment in a number of
PPP projects. For instance in the Integrated SWM project awarded in Hyderabad, the private operator is
expected to bring in Rs. 217 crore which is 50% of the total project cost as his contribution to the investment.
Similarly in the Guwahati Integrated SWM project, the private operator is expected to bring in Rs. 66 crore out
of the project cost of Rs. 102 crore.
Even though these projects require the ULB to pay a Tipping Fee (discovered through the bid process), such
project structures allow the ULB to phase out their expenditure over a longer term during which they can
potentially introduce reforms to improve their own sources of revenue. In this manner, PPPs allow the ULBs to
leverage the Grant funds received from schemes in a more effective manner.
6.2 Pre-requisites for PPP
While the above factors provide the logic and rationale for implementing PPPs, ULBs also need to ensure the
presence of some critical pre-requisites necessary for implementing PPPs including the following:
6.2.1 Political commitment
The foremost enabling environment for successful intervention of private sector participation is the continued
support by the political representatives. The provision of municipal solid waste management services has
traditionally been the domain of the public sector, the inclusion of private sector in the same is a sensitive
matter. The local governments, hence, need to establish project benefits and address structuring issues

GoI-ADB-PPP Initiative Improving delivery of MSWM services in India through PPPs
Volume I – Overview and Process 84
squarely and transparently upfront in consultation with various stakeholders who are directly or indirectly
related to the provisioning of MSWM services. For the PPP option to be implemented successfully, it is
important that there is consensus among the political representatives regarding contracting out of the
creation and provision of service to the private operator.
6.2.2 Support from public, employees and involvement of other stakeholders
Similarly, when a ULB intends to implement a PPP, it needs to pro-actively engage with a wider set of
stakeholders most importantly, its own employees on the rationale and benefits of the proposed PPP project
with respect to each of these stakeholder groups. Creating a groundswell of support among all stakeholders is
critical for the success and sustainability of a PPP initiative.
6.2.3 Policy clarity and legal capacity
It is often crucial to confirm the legal capacity of a particular Urban Local Body to engage with a private
operator for provision of MSWM services. This may require clear understanding of the procedural issues on
the kind of approvals required at various levels of the hierarchy and also at the state level before initiating
exercise to involve private sector participation. For instance, when one of the Municipal Corporations
intended to implement a PPP for waste transportation and collection, the Labour Union of conservancy
workers filed a Writ Petition challenging the move citing an order issued under the Contract Labour
(Regulation and Abolition) Act, which prohibited the engagement of Contract Labourers for sweeping and
scavenging the work. The Corporation had to engage with the State Government which issued a Government
Order exempting the Municipal Corporation from the purview of the said Act, following which the Writ
Petition was dismissed and the project was awarded. While the eventual decision was favourable for
implementing the project, the legal issue raised led to significant delays which could have been avoided had
the legal compliance issues been identified and resolved at the time of project preparation.
6.2.4 Training of ULB officials
Wherever local capacity is weak, hand-holding by the specialist nodal agencies of the State Government is
critical. Use of external assistance from Transaction advisors should be complemented with local training
inputs to ensure that the ULB officials understand the structuring and contractual issues and are geared for
managing the monitoring and supervision roles.
6.3 PPP Project scoping
6.3.1 Choosing components for implementation on PPP – an illustrative framework
The scope of a PPP project in terms of the components of the Value chain that need to be covered and the
nature of service delivery should be decided by the ULB. Exhibit 6.1 provides a framework to help ULBs analyse
the possible scoping of a PPP project given their context in terms of issues and gaps.
Based on an analysis of the PPPs in MSWM till date and the needs emerging from a value chain perspective,
there are five generic PPP models available from a ‘Project Scope perspective as described below. While there
may be variants possible, these five models are fairly distinctive and provide useful frameworks to consider
while developing and implementing PPPs in MSWM.

GoI-ADB-PPP Initiative Improving delivery of MSWM services in India through PPPs
Volume I – Overview and Process 85
Exhibit 6.1 Project Scoping – illustative framework
Description
Lack of
adequate
human
resources
for C&T
Lack of
technical &
managerial
expertise
Lack of
Funds for
capital
investment
Lack of market
Linkages for sale
of processing by-
products
Waste
generation is
more than
critical mass
of 250 TPD
Distance of
Landfill is
more than 25-
30km from
city
Reasonably
efficient
collection &
transportation
system
Availability of
land for
processing &
landfill facility
Collection &
Transportation √ √ √
MSW Processing
alone √ √ √
√ √ √
Mechanized
Refuse Transfer
Station
√ √
√ √
Integrated
Processing &
Disposal
√ √ √
√ √
Integrated
MSWM (all value
chain)
√ √ √ √
√

GoI-ADB-PPP Initiative Improving delivery of MSWM services in India through PPPs
Volume I – Overview and Process 86
1. PPP for setting up Waste Processing and Land Fill facilities: An ULB could consider a PPP project focused
on waste processing and land fill components when it has a reasonably good collection and transportation
system and land available and earmarked for setting these facilities, but faces the following requirements
and challenges:
o Inadequate Technical & Managerial expertise for sustainable waste processing and disposal facilities
o Inadequate funds for initial capital investment required for setting processing and disposal facilities
o Lack of market linkages for recyclables & by-products (compost, RDF, power etc.);
2. PPP for setting up Waste Processing: A variant of the first model, an ULB could consider a PPP project
focused on waste processing component alone when it has the above conditions, but has an existing
landfill disposal facility which is more than 30 km from the city and requires decentralised processing to
optimise transport expenditure. Under these circumstances, an ULB may choose to implement stand-
alone processing facility (ies) on PPP.
3. PPP for Collection and Transportation: An ULB may choose to implement a PPP for waste collection and
transportation when it is faced with the following requirements and challenges. Even if the ULB does not
have a landfill/processing facility and wants to implement a PPP for this, it may choose to engage different
operators for various components.
o Inadequate manpower and equipment for collection & transportation
o Inadequate technical & managerial expertise for sustainable waste management solution;
o Lack of funds for initial capital investment requirement for equipment, vehicles etc.
4. PPP for Mechanised Refuse Transfer Station (MRTS): While it is very rare that a ULB goes in for a PPP
arrangement only for managing a discrete facility like a Transfer station, such options become
necessary/viable for large cities that require significantly large quantities of waste and require
intermediate storage and sorting before taking the waste to processing/landfill. Such an arrangement is
typically required when
o Distance of processing /landfill is more than 20-25 km; thereby need for MRTS to gain transport
efficiency.
o Quantity of waste is more than critical mass of 280 TPD;
o Lack of technical & managerial expertise for development and operations of MRTS;
o Lack of funds for initial capital investment requirement for equipment, vehicles, MRTS etc.
5. PPP for Integrated SWM: Integrated SWM involves handing all parts of the value chain either for the
whole city (or) for parts of city linked to a specific processing and landfill facility. A Hybrid of this approach
could include transportation and collection in one part of the city (rest managed by either the ULB or
another operator) as well as the processing and disposal facility. Naturally, Integrated SWM contracts will
tend to be complex, but when structured and tendered well to a capable operator presents potential for
greater efficiencies.
o Lack of adequate manpower and equipment for collection & transportation
o Lack of technical & managerial expertise for sustainable waste management solution;
o Lack of funds for initial capital investment requirement for processing facility;
o Lack of market linkages for recyclables & by-products (compost, RDF, power etc.);
o Availability of land for setting up of processing facility and sanitary landfill; and
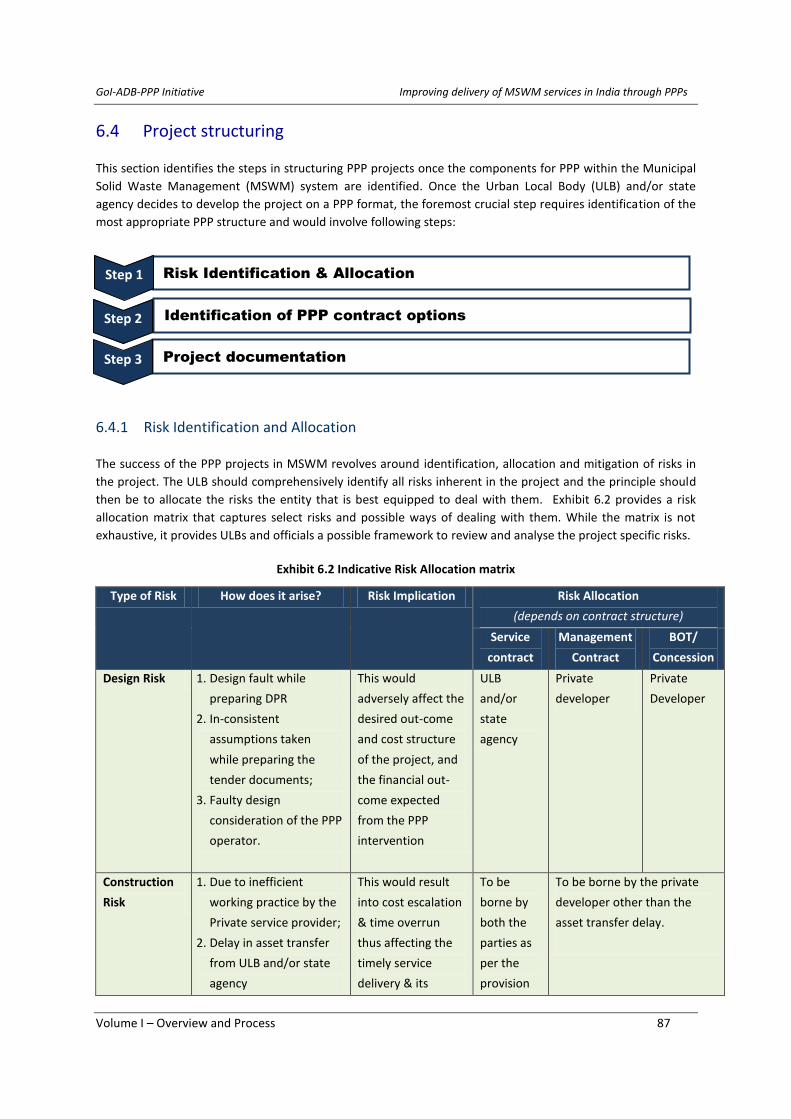
GoI-ADB-PPP Initiative Improving delivery of MSWM services in India through PPPs
Volume I – Overview and Process 87
6.4 Project structuring
This section identifies the steps in structuring PPP projects once the components for PPP within the Municipal
Solid Waste Management (MSWM) system are identified. Once the Urban Local Body (ULB) and/or state
agency decides to develop the project on a PPP format, the foremost crucial step requires identification of the
most appropriate PPP structure and would involve following steps:
6.4.1 Risk Identification and Allocation
The success of the PPP projects in MSWM revolves around identification, allocation and mitigation of risks in
the project. The ULB should comprehensively identify all risks inherent in the project and the principle should
then be to allocate the risks the entity that is best equipped to deal with them. Exhibit 6.2 provides a risk
allocation matrix that captures select risks and possible ways of dealing with them. While the matrix is not
exhaustive, it provides ULBs and officials a possible framework to review and analyse the project specific risks.
Exhibit 6.2 Indicative Risk Allocation matrix
Type of Risk How does it arise? Risk Implication Risk Allocation
(depends on contract structure)
Service
contract
Management
Contract
BOT/
Concession
Design Risk 1. Design fault while
preparing DPR
2. In-consistent
assumptions taken
while preparing the
tender documents;
3. Faulty design
consideration of the PPP
operator.
This would
adversely affect the
desired out-come
and cost structure
of the project, and
the financial out-
come expected
from the PPP
intervention
ULB
and/or
state
agency
Private
developer
Private
Developer
Construction
Risk
1. Due to inefficient
working practice by the
Private service provider;
2. Delay in asset transfer
from ULB and/or state
agency
This would result
into cost escalation
& time overrun
thus affecting the
timely service
delivery & its
To be
borne by
both the
parties as
per the
provision
To be borne by the private
developer other than the
asset transfer delay.
Step 1
Risk Identification & Allocation Step 1
Identification of PPP contract options Step 2
Project documentation Step 3

GoI-ADB-PPP Initiative Improving delivery of MSWM services in India through PPPs
Volume I – Overview and Process 88
Type of Risk How does it arise? Risk Implication Risk Allocation
(depends on contract structure)
Service
contract
Management
Contract
BOT/
Concession
quality, would also
adversely affect the
project financials.
of the
contract
Operation
Risk
1. Change in the project
scope during the
operation period by the
project sponsor;
2. Mobilization delays in
manpower/ equipment;
3. Due to labour unrest,
imprudent management
practices;
4. Financial mis-
management and
significant increase in
the input cost.
Project objective
not achieved,
increased operating
cost and/or
reduced revenue
realization from the
project
To be borne by the Private developer other
than the change in scope of the project by
the ULB and/or state agency.
Revenue Risk 1. Change in tariff rates;
2. Inadequate MSW
generation;
3. Inadequate demand for
the processed waste
and/or by-product.
The financial
objective of the
project not
achieved.
ULB and/or
state agency
Partly by ULB and Private
player as per the provision
of the contract
Financial Risk
1. This will arise due to
improper capital
structure resulting in
high debt component
and fluctuation in the
interest rate.
Not able to service
its financial
obligations.
ULB and/or
state agency
Private
develop
er
Private
developer
Environmental
Risk
1. Non-compliance to the
applicable laws (like
environmental, MSW
Rules etc.), or pre-
existing environmental
liability.
Additional cost
incurred to rectify
an adverse
environmental
impact on the
project
ULB and/or
state agency
Private developer other
than the pre-existing
environmental liability to
be taken care by ULB
and/or state agency
Force Majeure
Risk
1. This may arise due to
act of God, public
unrest, change in tax
and law, breach or
contract cancellation
Additional cost to
rectify resulting in
increased cost or
operation, time
overrun, non-
To be borne by the parties as per the
provisions of the contract.
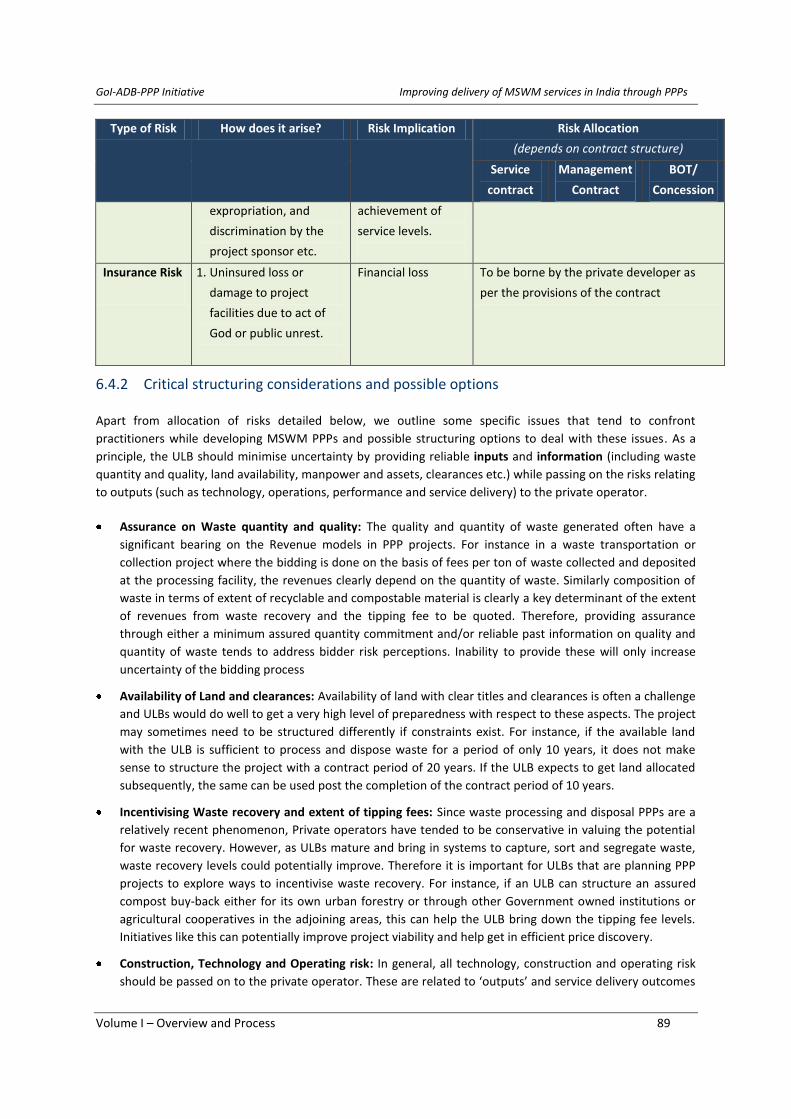
GoI-ADB-PPP Initiative Improving delivery of MSWM services in India through PPPs
Volume I – Overview and Process 89
Type of Risk How does it arise? Risk Implication Risk Allocation
(depends on contract structure)
Service
contract
Management
Contract
BOT/
Concession
expropriation, and
discrimination by the
project sponsor etc.
achievement of
service levels.
Insurance Risk
1. Uninsured loss or
damage to project
facilities due to act of
God or public unrest.
Financial loss To be borne by the private developer as
per the provisions of the contract
6.4.2 Critical structuring considerations and possible options
Apart from allocation of risks detailed below, we outline some specific issues that tend to confront
practitioners while developing MSWM PPPs and possible structuring options to deal with these issues. As a
principle, the ULB should minimise uncertainty by providing reliable inputs and information (including waste
quantity and quality, land availability, manpower and assets, clearances etc.) while passing on the risks relating
to outputs (such as technology, operations, performance and service delivery) to the private operator.
Assurance on Waste quantity and quality: The quality and quantity of waste generated often have a
significant bearing on the Revenue models in PPP projects. For instance in a waste transportation or
collection project where the bidding is done on the basis of fees per ton of waste collected and deposited
at the processing facility, the revenues clearly depend on the quantity of waste. Similarly composition of
waste in terms of extent of recyclable and compostable material is clearly a key determinant of the extent
of revenues from waste recovery and the tipping fee to be quoted. Therefore, providing assurance
through either a minimum assured quantity commitment and/or reliable past information on quality and
quantity of waste tends to address bidder risk perceptions. Inability to provide these will only increase
uncertainty of the bidding process
Availability of Land and clearances: Availability of land with clear titles and clearances is often a challenge
and ULBs would do well to get a very high level of preparedness with respect to these aspects. The project
may sometimes need to be structured differently if constraints exist. For instance, if the available land
with the ULB is sufficient to process and dispose waste for a period of only 10 years, it does not make
sense to structure the project with a contract period of 20 years. If the ULB expects to get land allocated
subsequently, the same can be used post the completion of the contract period of 10 years.
Incentivising Waste recovery and extent of tipping fees: Since waste processing and disposal PPPs are a
relatively recent phenomenon, Private operators have tended to be conservative in valuing the potential
for waste recovery. However, as ULBs mature and bring in systems to capture, sort and segregate waste,
waste recovery levels could potentially improve. Therefore it is important for ULBs that are planning PPP
projects to explore ways to incentivise waste recovery. For instance, if an ULB can structure an assured
compost buy-back either for its own urban forestry or through other Government owned institutions or
agricultural cooperatives in the adjoining areas, this can help the ULB bring down the tipping fee levels.
Initiatives like this can potentially improve project viability and help get in efficient price discovery.
Construction, Technology and Operating risk: In general, all technology, construction and operating risk
should be passed on to the private operator. These are related to ‘outputs’ and service delivery outcomes

GoI-ADB-PPP Initiative Improving delivery of MSWM services in India through PPPs
Volume I – Overview and Process 90
and it is imperative that the private operator handles these risks. There should be stringent obligations
with respect to these aspects and failure to comply should attract penalties and under extreme
circumstances termination.
Financing and Bankability: ULBs should share the sources of income and demonstrate financial capacity to
make payments. Especially when the private operator is required to make an upfront investment, the ULB
should provide adequate comfort to bidders about its ability to pay. Sharing of initiatives taken by the ULB
to increase revenue buoyance, implementation of reforms such as levy of user charges and sharing of
recent improvements in financials transparently will raise bidder confidence. In addition, bankability
considerations will require the ULB to create appropriate payment security mechanisms either in the form
of escrow of portion of its visible revenue streams or through creation of Payment Reserve Account,
where the ULB keeps a fixed amount of money that the bidder has access to in case of delays in payment
beyond a pre-set threshold. Again, initiatives like this are critical to signal seriousness and positive intent
and help in influencing risk perceptions of bidders favourably.
Manpower transitioning: Very often ULBs may have their own manpower which may be resistant to the
idea of a PPP project. It is important that the ULB tackles this issue head-on and get the employees and
labour unions on board early during the preparatory stage. Side-stepping labour resistance will only
postpone the problem and will make things even more difficult. For instance, when a ULB has surplus
manpower, it may choose to handle parts of the MSWM value chain on its own. Further, it can keep the
employees on its roles, second them to the private operator during the concession period with the option
provided to employees to either come back to Government service or quit during the course of the
contract. Further, training and capacity building involving knowledge transfer and minimum training
period for ULB employees can be mandated as part of the contract. Whatever be the approach to manage
the transition, it is critical to ensure employee consensus while structuring a PPP project.
Importance of qualification criteria in mitigating performance risk: A transparent bidding process and
effective shortlisting of reputed bidders with demonstrated track record is a critical aspect for successful
PPP implementation. While developing qualification criteria, ULBs should balance quality/experience
considerations with contestability. While setting very stringent criteria could reduce competition intensity,
defining qualification criteria very loosely could upset the level playing field and could lead to distorted
uneven competition and increase the risk of non-serious operators getting in.
6.4.3 Forms of contracting
The options for the private sector participation in the Municipal Solid Waste Management (MSWM) are spread
across the MSW value chain. At one end of the spectrum the ULB can invest across the value chain by creating
the fixed & movable assets and outsourcing the management of the complete value chain to the private
operator through a Service Contract. On the other end of the spectrum the ULB can invite the private
developer to invest and maintain MSW value chain through the Concession or a Build-Operate-Transfer (BOT)
contract. It is imperative for the ULB to understand the project need and outcomes based of their own internal
project analysis and desired outcome. The main options for private sector participation can be clearly
distinguished by how they allocate responsibility for such aspects as asset ownership and capital investment
between the public and private sectors as shown in Exhibit 6.3.
However in practice private sector arrangements are often hybrids of these contract structures for instance, a
build-operate-transfer (BOT) contract for waste processing might be combined with a management contract
for developing sanitary landfill sites. Further to this, the different types of contracts are explained in the
section below are based on the successful PPP structures implemented in the country.

GoI-ADB-PPP Initiative Improving delivery of MSWM services in India through PPPs
Volume I – Overview and Process 91
Service contracts are widely used in the country for
instance as:
Service agreement between GHMC & private service
provider for Street sweeping in Hyderabad City.
Service agreement between Ahmadabad MC and
Resident Welfare Association & NGOs for MSW
services (collection , transportation in service area)
Exhibit 6.3 PPP contracting options
Options Service contract
(Collect, transport, cleaning,
disposal of MSW)
Management Contract
(Collect, transport,
cleaning, disposal of MSW)
BOOT/ Concession (Integrated
MSWM/ Waste Processing)
Asset
Ownership
Ownership with ULB other
than investment by private
service provider in
transportation fleet.
Ownership with ULB other
than investment by
private service provider in
transportation fleet &
related equipment.
Ownership with private
developer during the contract
period other than the land,
and to be transferred back to
ULB at the end of the contract.
Operation &
Maintenance
Private service provider Private service provider Private developer
Capital
Investment
Only in transportation fleet
by private service provider.
Only in transportation
fleet and related
equipment by private
service provider.
By private developer other
than the land.
Commercial
Risk
ULB or state agency Partly with private service
provider and with ULB
Completely with private
developer
Duration 1-2 years 3-8 years Above 10 years
Service contract (for Collection, Transportation, Street Sweeping & Disposal of MSW)
Service contracts secure private sector assistance for
performing specific tasks – installation of two-bin
system in service area, collection of waste,
segregation of waste, street sweeping and cleaning,
pre-transportation of waste to secondary storage
places, maintenance of the collection &
transportation equipment, disposal of waste to
dumping sites. They are typically short periods, from
one to two years.
Such contracts assist in getting private sector expertise in technical tasks. However, the responsibility for
investment and coordination of these activities lies with the ULB or state agencies only. Service contracts must
be carefully specified and monitored by putting in performance incentives as well as built in penalty clauses in
the contracts. Service contracts are a cost-effective way to meet special technical needs for a utility which has
necessary capital but lacks in the managerial competence in managing the MSW value chain. Following table
captures the basic outline of the Service Contract.
Typically used for 1. Collection, transportation & disposal of MSW; or
2. Street cleaning and sweeping activities; or
3. Operations & Maintenance of sanitary landfill facilities.
Payment Based on Lump sum amount based on quantity of waste and/or household served, and/or
service area covered PLUS performance incentives and/or penalties for failures
to meet agreed performance targets.
Contract Award Based on competitive procurement procedure

GoI-ADB-PPP Initiative Improving delivery of MSWM services in India through PPPs
Volume I – Overview and Process 92
Asset Ownership Facilities are owned by the ULB or state agency but mobile equipment in most
cases are owned by private service provider
Contract Period 1-2 years depending on local conditions
Risk Allocation Contracting authority is responsible for fee collection and cost recovery;
whereas Private service provider bears the operation risk
Management Contract
Management contracts transfer responsibility for the operation and maintenance of MSW management works
to the private sector with partial responsibility of revenue realization from the service provisioning to the
beneficiaries. These contracts are generally for three to eight years.
The simplest of the management contract involves paying a private firm a fixed fee for performing managerial
tasks to complex structures like investment in operation and management of the public assets. More
sophisticated management contracts can introduce greater incentives for efficiency, by defining performance
targets and incentivizing the operator basing remuneration to achieve the target. It is imperative to note that
management contracts must produce efficiency gains and the contract should be very clear in fixing the goal.
However, specifying clear and indisputable targets/milestones is difficult, especially when information about a
system is limited. Some targets may be beyond the private sector partner’s capacity to achieve. For instance,
implementation of source storage and segregation is hard to implement and subsequently there will be higher
cost of segregation of waste and larger land requirement for the transfer station.
Also, there is often a fine dividing line between O&M expenditure for which the private operator is
responsible, and capital investment, for which the government is responsible—and both will affect the
operator’s performance. Management contracts leave all responsibility for capital investment with the ULB
and are not a good option if a government has as one of its main objectives accessing private finance for new
investments in MSW management system. Management contracts are most likely to be useful where the main
objective is to rapidly enhance technical capacity of the ULB or bringing in performance efficiency in MSW
management.
Typically used for 1. Collection, transportation & disposal of MSW; or
2. Street cleaning and sweeping activities; or
3. Operations & Maintenance of sanitary landfill facilities.
Payment Based on Lump sum amount based on waste quantity and/or household served, and/or
service area covered PLUS incentives to achieve performance targets and penalties
for failures to meet agreed performance targets.
Contract Award Based on competitive procurement procedure
Asset Ownership Facilities are owned by the ULB or state agency but mobile equipment in most cases
are owned by private service provider
Contract Period 3-8 years depending on local conditions
Risk Allocation Contracting authority is responsible for capital investment and replacement.
Private Service provider is responsible for maintenance of capital assets as well as
partial/full fee recovery from the users, hence, bearing partial/full revenue risk.

GoI-ADB-PPP Initiative Improving delivery of MSWM services in India through PPPs
Volume I – Overview and Process 93
25 years concession period for 500 TPD Integrated
MSWM project in the City of Guwahati, Assam.
25 years concession period for 3800 TPD Integrated
MSWM project in Hyderabad City.
20 years DBOOT – PPP period for 650TPD Integrated
Processing & Disposal Facility in Coimbatore City.
BOOT/Concession Contract (For Integrated MSWM system /or Integrated Processing & Disposal
Facility /or MSW Processing Facility)
Concession contract gives private partner the
responsibility for O&M of the MSW assets and
also for capital investments in asset creation.
The full use rights to all the assets, including
those created during concession period remains
with the private developer, but at the end of the
contract term, the created asset reverts to the
ULB. Concessions are often bid by price: the bidder that proposes to manage the MSW value chain at the
lowest tariff requirement from Authority /or highest royalty payment to the Authority, as the case may be,
wins the concession. The concession is governed by a contract that sets out such conditions as the main
performance targets (coverage, quality), performance standards, arrangements for capital investment,
mechanisms for adjusting tariffs, and arrangements for arbitrating disputes.
The main advantage of a concession is that it passes full responsibility for capital investment and O&M to the
private sector and instils incentives for gaining efficiencies in managing the MSW value chain. The concession
is therefore an attractive option where large investments are needed to expand the coverage and/or improve
the quality of services. On the ULB side, administering a concession is a complex business, however, because it
confers a long-term monopoly on the concessionaire. The quality of contractual covenants is important in
determining the success of the concession, particularly the distribution of its benefits between the
concessionaire (in profits) and benefits to consumers (in lower user charges and improved service).
Typically used for 1. Integrated Municipal Solid Waste Management system; or
2. Integrated waste processing and disposal facility; or
3. Development of waste processing facility.
Payment Based on Tipping Fee from Authority /or Royalty to Authority per MT of MSW collected &
transported to designated sites (transfer station /or disposal site)
Contract Award Based on competitive procurement procedure
Asset Ownership Facilities are owned by the Private developer except land and all existing and new
facilities developed during the concession are to be transferred back to the ULB at
the end of the concession period
Contract Period Over 20 years depending on project scope and components
Risk Allocation Contracting authority is responsible for only provisioning of land for the project.
All risks related to design, construction, commissioning, commercial, revenue,
force majeure to be borne by the private developer
6.4.4 Procurement preparation
Once the project structuring is complete, the ULB should undertake two important activities that are critical to
conducting an effective procurement process namely, a) Early stage identification and engagement with
potential private operators and b) Preparation of bidding documentation and data room.
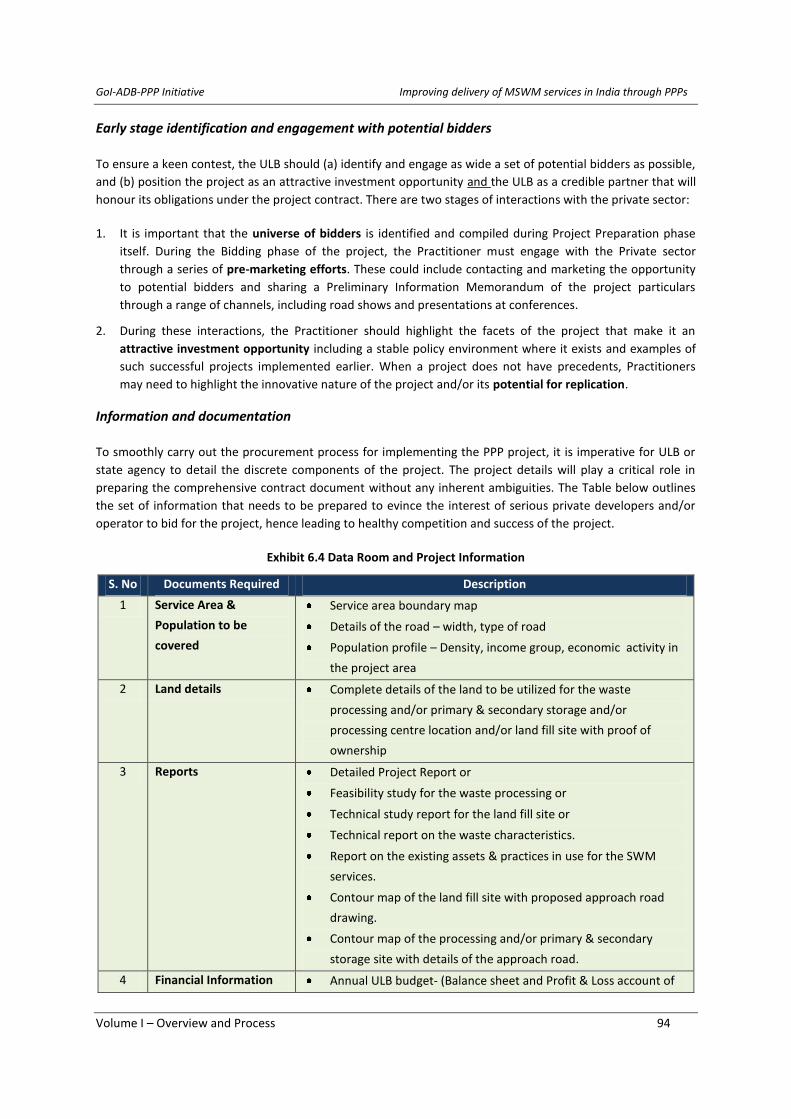
GoI-ADB-PPP Initiative Improving delivery of MSWM services in India through PPPs
Volume I – Overview and Process 94
Early stage identification and engagement with potential bidders
To ensure a keen contest, the ULB should (a) identify and engage as wide a set of potential bidders as possible,
and (b) position the project as an attractive investment opportunity and the ULB as a credible partner that will
honour its obligations under the project contract. There are two stages of interactions with the private sector:
1. It is important that the universe of bidders is identified and compiled during Project Preparation phase
itself. During the Bidding phase of the project, the Practitioner must engage with the Private sector
through a series of pre-marketing efforts. These could include contacting and marketing the opportunity
to potential bidders and sharing a Preliminary Information Memorandum of the project particulars
through a range of channels, including road shows and presentations at conferences.
2. During these interactions, the Practitioner should highlight the facets of the project that make it an
attractive investment opportunity including a stable policy environment where it exists and examples of
such successful projects implemented earlier. When a project does not have precedents, Practitioners
may need to highlight the innovative nature of the project and/or its potential for replication.
Information and documentation
To smoothly carry out the procurement process for implementing the PPP project, it is imperative for ULB or
state agency to detail the discrete components of the project. The project details will play a critical role in
preparing the comprehensive contract document without any inherent ambiguities. The Table below outlines
the set of information that needs to be prepared to evince the interest of serious private developers and/or
operator to bid for the project, hence leading to healthy competition and success of the project.
Exhibit 6.4 Data Room and Project Information
S. No Documents Required Description
1 Service Area &
Population to be
covered
Service area boundary map
Details of the road – width, type of road
Population profile – Density, income group, economic activity in
the project area
2 Land details Complete details of the land to be utilized for the waste
processing and/or primary & secondary storage and/or
processing centre location and/or land fill site with proof of
ownership
3 Reports Detailed Project Report or
Feasibility study for the waste processing or
Technical study report for the land fill site or
Technical report on the waste characteristics.
Report on the existing assets & practices in use for the SWM
services.
Contour map of the land fill site with proposed approach road
drawing.
Contour map of the processing and/or primary & secondary
storage site with details of the approach road.
4 Financial Information Annual ULB budget- (Balance sheet and Profit & Loss account of

GoI-ADB-PPP Initiative Improving delivery of MSWM services in India through PPPs
Volume I – Overview and Process 95
S. No Documents Required Description
about the ULB the ULB)
Annual Budget for SWM services.
Revenue from the SWM services with basis/assumption for fixing
of user charges.
Percentage of household covered under user charges
5 Manuals Construction and O&M guidelines
Environmental guidelines
6 Other relevant
information
Manpower deployed in the SWM services.
Existing contract for the SWM services
Ideally the ULB should also have the set of bidding documents prepared and ready as a precursor to the
bidding process. These include finalisation of the Qualification criteria and preparation of the Request for
Qualification (RFQ) and Request for Proposal (RFP) documents. It is also important to have a detailed Project
Information Memorandum that provides all the key data and information pertaining the Project and the city
and a Term Sheet that captures the Contractual conditions and obligations that will eventually be converted
into a Draft Contract that will go as part of the RFP. Model documents for developing the project related
documentation for a variety of PPP structures are provided in Volume III of this Toolkit.
GoI-ADB-PPP Initiative Improving delivery of MSWM services in India through PPPs
Volume I – Overview and Process 96
7. Step 4: Procurement
7.1 Approaches to Procurement
The Procurement process is critical to translate the intent of an ULB to implement a PPP project towards
selecting an appropriate Private Operator that will partner the ULB to execute and manage the proposed
project. Therefore during the procurement process, the project decisively moves closer towards
implementation.
7.1.1 Unsolicited proposals Vs. Competitive Bidding
When confronted with an Unsolicited Proposal, the ULB has three options namely, a) Direct negotiations to
the offer, b) Purchase the project concept then competitively tender among a range of bidders and c) Offer
original proponent a predefined advantage in recognition of the value of the original proposal and open-up
bidding (through a Swiss Challenge process)
Entering into a sole-source process can save ULB or state agency time and money and may alert government
to an unrealized opportunity for PPP. However, sole sourcing lacks transparency and may result in loss of cost
benefits to ULB or state agency which might have happened in competitive bidding. ULB or state agency has to
be confident of its negotiation skills and its information to ensure that a sole-source deal is advantageous.
However, procurement legislation typically do not allow award of sole source bids on the basis of direct
negotiations. Even when there is no explicit bar on sole source procurement, there is also an elevated risk of
fairness of the award being challenged at a later stage; hence direct negotiation is generally not preferred.
Some states in India recognise the use of Swiss Challenge approach to deal with unsolicited proposals, where a
competitive bid process is conducted with the right to match the lowest offer (provided the offer is within a
range) to the preferred bidder who poses the ‘challenge’. However, even Swiss Challenge bids tend to be
considered unequal and often do not lead to adequate competition or efficient price discovery.
A Competitive Bidding approach is therefore generally the most preferable and suitable approach to identify a
private operator for implementing a PPP project. Mostly ULB or state agency prefers this route of procurement
because of greater transparency inherent in the process. In addition, most national and international lending
institutions and assistance organizations require the use of competitive bidding procedures as a condition of
any associated loan or technical assistance. Competition not only provides transparency in the process but also
provide a mechanism for selecting the best-value proposal (market determined value) based on criteria set.
However, it is important to recognise that the benefits of competition are realized only if there is sufficient
interest to generate multiple bidders. Competitive Bidding therefore requires a significantly higher level of
preparation on the part of the ULB.
Box 7.1 Competitive Bidding – key principles
The primary focus during the course of the Procurement process is to ensure transparency, integrity and
contestability. The ULB should ensure that the procurement process attracts the maximum qualified bidders
to participate to achieve efficient price discovery and effective project implementation. PPP projects are
subject to a high level of public and government scrutiny in general, and during the bidding process in
particular. The ULB should therefore ensure a high level of transparency during the Procurement stage and
facilitate transparent and equitable sharing of information with all stakeholders.

GoI-ADB-PPP Initiative Improving delivery of MSWM services in India through PPPs
Volume I – Overview and Process 97
1. Ensure a well-articulated and clearly laid out process: The ULB should declare the steps and likely
timelines for various steps in the procurement process upfront at the stage of issue of the Notice Inviting
Tender or Application for Qualification.
2. Appropriate Qualification and Eligibility criteria: The Qualification and Eligibility criteria should be set in a
manner that helps the ULB achieves a combination of Reputed and Qualified Bidders while ensuring
adequate competition.
3. Flexibility to incorporate good ideas: An open-competitive bidding facilitates free and fair exchange of
ideas and therefore the ULB should be keen and open to incorporating good ideas and suggestions that
come forth from bidders and others during the course of the bidding process
4. Clarify Evaluation approach and decision making process: The evaluation methodology and approach
should be as clear and unambiguous as possible and should be declared upfront.
5. Clarify Institutional and Decision making accountability for the project: The decision making process with
respect to the project should be made adequately clear at the start of the bidding process.
7.2 Single stage vs. Two stage bidding
Essentially, the Procurement process should enable the ULB to a) shortlist reputed and experienced bidders
with Technical Experience and Financial Strength to execute the project, b) Receive and evaluate Technical
and Financial Proposals from among these shortlisted bidders to select the Preferred Bidder and c) Enter into a
Contract agreement with the Preferred Bidder (or the SPV set up by the Preferred Bidder).6 Depending the
level of clarity of the project structure, the visibility of the universe of bidders and timeframe/cost
considerations, an ULB may choose to go for a Single stage or a Two Stage Bidding process
In the single-stage process, technical and financial bids are submitted simultaneously in response to a request
for proposals. For instance, competitive bidding for basic operation, maintenance, and service contracts can be
relatively straightforward as the scope of services is really defined and often quantifiable. The criteria for
technical and financial capability of bidders and the bidding parameters for financial proposal are to be clearly
mentioned in the bidding documents. Financial proposals of only those bidders are opened who possess
technical and financial capability as per the Bid Document and whose Technical Proposals cross the cut-off
scores required. Exhibit 7.1 captures the key steps in a Single stage bidding process
Exhibit 7.1 Indicative steps and timelines – Single stage bidding
S No Event Description Estimated Date
1 Publication of RFP document Zero date
2 Submission of query by the perspective bidders + 15 days
3 Pre-bid meeting + 20 days
4 Authority response to queries + 30 days
5 Bid Submission Due Date + 60 days
6 Opening of Technical Proposal + 60 days
7 Technical Evaluation & Report + 75 days
6 Service Contracts and other short duration PPP contracts normally do not require setting up of a Special Purpose Vehicle
for the project. However, larger duration PPPs and Concession contracts typically require the Operator to set up an SPV. IN such cases, the Contract Agreement is signed between the SPV and the ULB.

GoI-ADB-PPP Initiative Improving delivery of MSWM services in India through PPPs
Volume I – Overview and Process 98
S No Event Description Estimated Date
8 Acceptance of Technical Evaluation Report by the Tender Committee + 80 days
9 Financial Bid Opening + 90 days
10 Financial Bid Evaluation & Report + 95 days
11 Acceptance of Financial Evaluation Report by the Tender Committee and
Announcement of Successful Bidder
+ 110 days
12 Issuance of Letter of Intent +120 days
13 Signing of the Contract + 150 days
(+ X day’s means time duration from the zero date i.e. the publication date of RFQP)
7.2.1 Two-Stage Bidding
In the first stage, only the qualification applications are invited against threshold technical and financial criteria
specified in the Request for Qualification (RFQ) document. The two stage bidding process is generally followed
for more complex PPPs like BOT, concessions, and joint ventures and since the project is of a relatively
complex nature and is of high value, a pre-bid meeting is conducted to clarify the queries of the prospective
bidders and to ascertain the interest of the private partners. Based on the Technical and Financial capability,
the firms are short-listed. In the second stage, shortlisted firms are required to submit Proposals in response to
a Request for Proposal (RFP) document. The Proposals are then evaluated as per the conditions of the RFP.
Exhibit 7.2 Indicative steps and timelines – Two stage bidding
S No Event Description Estimated Date
Stage-1: Pre-Qualification Stage
1 Publication of RFQ document Zero date
2 Submission of query by the perspective applicants + 15 days
3 Pre-Application meeting + 20 days
4 Authority response to queries + 30 days
5 Application Submission Due Date + 60 days
6 Opening of Technical Bids + 60 days
7 Technical capability Evaluation & Report + 75 days
8 Acceptance of Technical Evaluation Report by the Tender Committee + 80 days
Stage-2: Bid Stage
1 Sale of Bid/RFP document to short-listed applicants + 90 days
2 Submission of query by the perspective applicants + 105 days
3 Pre-Bid meeting + 110 days
4 Authority response to queries + 130 days
5 Bid Submission Due Date + 150 days
6 Opening of Bids + 150 days
7 Letter of Intent (LOI) + within 30 days of Bid
Due date
8 Signing of the Contract + within 30 days of LOI
(+ X day’s means time duration from the zero date i.e. the publication date of RFQ)

GoI-ADB-PPP Initiative Improving delivery of MSWM services in India through PPPs
Volume I – Overview and Process 99
7.3 Procurement process
Exhibit 7.3 provides a flow chart indicating the steps in a two stage Procurement process
Exhibit 7.3 Indicative steps and timelines – Two stage bidding
7.3.1 Formation of procurement committee
A Procurement Committee should be formed for overseeing and conducting the Bidding process. Typically, the
Committee is formed under the chairmanship of the Commissioner with one representative from each Finance
Commercial, Legal and User Departments. This committee will appoint the coordinator if the bid process is to
be managed in house or the external consultant as a Transaction Advisor to manage the bid process. The
Coordinator or the Transaction Advisor will put the evaluation report for approval or seek the guidance from
the committee in case of any ambiguities while interpreting the provisions of the RFQ and RFP documents.
7.3.2 RFQ stage
Notice Inviting Application and Issue of Request for Qualification (RFQ)
The ULB should prepare and issue a Notice inviting Applications from interested Applicants for the proposed
project. This Notice will provide a brief overview of the assignment, the project area and
qualification/eligibility criteria and the deadline for submission of Applications. Along with this, the ULB also
1•Formation of tender Committee comprising officials of ULB for ensuring transparencey
2•Preparation of the Notice Inviting Tenders (NIT) /RfQ documents
3•Publish NIT in leading dailies (at least 2 national dailies) and Upload RfQ on the ULB website
4•Pre-Application Meeting to resolve queries on RfQ document
5•Technical bid opening and evauation based on short-listing criteria as per RfQ document
6•Preparation of the Bid Documents - RfP &draft contract document
7•Issue of RFP document to the short-listed applcants
8•Pre-Bid meeting to resolve queries on RfP document
9•Financial Bid opening and evaluation
10•Certification from the Tender Committee on process transparency & acceptance by the ULB
11•Issuance of the Letter of Intent and Signing of Contract

GoI-ADB-PPP Initiative Improving delivery of MSWM services in India through PPPs
Volume I – Overview and Process 100
issues a Request for Qualification (RFQ) document that provided details of the Qualification and Eligibility
criteria and Instructions for submission of Applications. The Notice inviting Applications should typically be
published in at least two national dailies and the RFQ should be uploaded in the official website of the ULB or
state agency on the same date to reflect the readiness of the engagement of PPP service provider.
The RFQ shall also include the formats for submission of Application and proof/testimonials of eligibility and
qualification including Details of applicant, Power of Attorney, Details of Eligible Projects and their Completion
Certificates, Statement of Legal Capacity, Board Resolution, Solvency Certificate, Non-Collusion certificate, and
Certificate of Incorporation of entity etc., in conformity of the qualification requirement. A detailed template
for RFQ is enclosed in Volume III of this Toolkit.
The RFQ typically provides the threshold Eligibility and Qualification criteria. The Eligibility criteria detail the
type of entities that can bid for the project and lists the conditions under which Consortiums can participate.
Qualification of Applications is normally done through a combination of criteria set to evaluate Technical
Experience and Financial Strength.
The Criteria for various types of PPP structures in MSWM is detailed as part of the Model RFQ that is provided
in Volume III of this Toolkit.
Pre-Application Meeting and Issue of clarifications
A Pre-Application Bid meeting is held to clarify doubts and answer queries of prospective bidders regarding the
Project and the RFQ. After the meeting, considering the nature & genuineness of the queries, the RFQ may be
suitably modified to match the current requirements by issuing an addendum and the revised bid document
should be uploaded again on the website.
Evaluation of Applications and shortlisting of bidders
The bids need to be evaluated based on the technical and financial capability as per various clauses of the RFQ.
At this stage, the evaluation is normally done through a threshold criteria and using a ‘Pass-Fail’ approach.
Compared to awarding marks and scoring, a Pass Fail approach is unambiguous and is generally the preferred
approach for evaluation of Applications for the purpose of shortlisting.
7.3.3 RFP stage
The RFQ stage culminates with approval of the shortlisted bidders by the Tender Committee and issue of RFP
to the shortlisted bidders. Depending on the type of contract and the local requirements, a bid package can
range from several volumes of material to a concise document. Typically the RFP Document is in three parts as
described below:
1. Part I Instructions to Bidders (ITB): This volume will contain the mainly: the introduction of the ULB,
project scope & objective, instruction about the process to be followed for preparing the bid document,
different formats to be enclosed in the bid, timelines of the bidding process, document description and
necessary document to be attached for the bidding.
2. Part II Project Information Memorandum (PIM): The project information memorandum should consists of
Service area boundary map, details of the road – width, type of road; Population profile – Density, income
group, economic activity in the project area; complete details of the land to be utilized for the waste
processing and/or primary & secondary storage and/or processing centre location and/or land fill site with
proof of ownership; “Detailed Project Report” or “Feasibility Study” for the waste processing or Technical

GoI-ADB-PPP Initiative Improving delivery of MSWM services in India through PPPs
Volume I – Overview and Process 101
study report for the land fill site or Technical report on the waste characteristics; Report on the existing
assets & practices in use for the SWM services; Contour map of the land fill site with proposed approach
road drawing; Contour map of the processing and/or primary & secondary storage site with details of the
approach road; Annual ULB budget- (Balance sheet and Profit & Loss account of the ULB); Annual Budget
for SWM services; Revenue from the SWM services with basis/assumption for fixing of user charges;
Percentage of household covered under user charges; Construction and O&M guidelines; Environmental
guidelines; Manpower deployed in the SWM services; Existing contract for the SWM services and any
other pertinent information relevant for the project.
3. Part III Draft Contract Agreement: The Draft Contract Agreement deals with the detailed terms and
conditions on which the project will be awarded and shall broadly cover: Scope of Work, Period of
Contract, construction period, parameters on which contract is to be granted (VGF, Premium, etc.),
obligations of the PPP service provider and sponsoring authority, process of handing over of site to PPP
service provider, monitoring and supervision details, safety requirements, support and incentives to be
given by the sponsoring authority, Operations & Maintenance requirement, Force majeure and
Termination payment, Dispute resolutions mechanism, and other terms and condition relevant to the
project.
Pre-bid conference and issue of clarifications
Pre-bid meetings are a key element of communication strategy that helps the ULB build substantial trust and
confidence among bides and other stakeholders and should not be done as a chore. A few pointers to effective
pre-bid meetings are given below:
1. Adequate time should be provided between the issue of RfQ/ RfP and the date of the pre-bid meeting and
deadlines of submissions. While it is useful to insist that operators should provide their queries in writing
2-3 days before the pre-bid meeting, if time is available, the project implementation agency should, in
most circumstances, allow additional questions to be asked by the bidders at the pre-bid meeting.
2. The pre-bid meeting should be attended by the senior functionaries of the project implementation
agency. In some cases, it may be useful to have the presence of concerned political leaders and
representation from user community through participation of opinion leaders. This will provide a strong
signal on the level of political commitment and user acceptance of the project. This will also add credibility
to the bid process and send a useful favourable signal to the general public.
3. The pre-bid meeting should be followed up with a visit arranged by the implementation agency to the
project site or service area as the case may be to provide a look-and-feel perspective to the bidders. In
case of complex bids, where the time available during the pre-bid meeting has not been adequate to
discuss and clarify all queries, a second pre-bid interaction should be considered
4. The deliberations of the pre-bid meetings should be duly documented and the clarifications should be
disseminated in writing in a similar manner to all bidders. Ideally, the responses should be published on
the implementation agency’s website.
Proposal content and evaluation
At the RFP stage, Bidders may be required to submit their proposals in two parts namely, Technical Offer and
Financial Offer. The Technical Offer typically covers the following and is normally evaluated through a scoring
approach and a with a threshold cut-off score of say 70 marks. Financial Offers of only those Bidders scoring
more than this threshold score will be opened.
GoI-ADB-PPP Initiative Improving delivery of MSWM services in India through PPPs
Volume I – Overview and Process 102
Project Implementation and Operation Plan (PIOP)
o Understanding Project Rationale
o Approach and Methodology
o Expected Milestones – Gantt charts or PERT & CPM Chart.
o Process of meeting performance standards
o Operation & Maintenance Plan – with replacement model of major equipment.
o Innovations and improvements – technology description.
Quality of staffing plan
o Details of staffing plan
o Appropriate experience reflecting required services in staffing plan
o Professional qualification and experience of key staff as shown in curricula vitae
In some cases where the scope of work is clear and the bidder universe is unambiguous, the ULB may invite
only Financial Offers. However, it is generally a better practice to receive and evaluate Technical Offer of the
Proposal as well.
The Financial Offers of all the Bidders crossing the Threshold score are then opened, in the presence of the
bidder’s representative and the quoted price/tariff/fee/royalty is readout aloud in front of the bid evaluation
committee and it is noted. The Preferred Bidder is then identified on the basis of the Bid variable say Lowest
Tipping Fee per ton or Grant support (or) Highest Revenue share/royalty as the case may be
The Least Cost (post Technical Hurdle) approach to selection described above is generally the preferred
method of selection. In some cases, a Quality Cum Cost Based Selection (QCBS) approach is adopted that
identifies the Preferred Bidder on the basis of a weighted scoring and ranking of bidders based a weighted
index of scores computed from Technical score and Financial Offer. However,
Approval by Tender Committee and Issue of Letter of Intent (LOI)
The Coordinator or the Transaction Advisor appointed by the committee will present the evaluation reports –
Technical and Financial, as per the procurement timeline to the “Tender Committee”. The Tender Committee
after deliberation over the report should issue the certificate of transparency after acceptance of the report
and approve the Preferred Bidder identified.
After the certification from the Tender Committee, a Letter of Intent (LOI) of the bid will be issued by the ULB
in favour of the Preferred Bidder. The LOI will specify the Conditions Precedent to be completed by the
Preferred Bidder for signing of the Contract Agreement. These could typically include a) Furnishing the
Performance Security and any other Project Development Fees payable and b) Formation of SPV if required as
per the RFP. Once the Conditions Precedent to the signing of Contract Agreement is met, the Contract
Agreement is then signed between the ULB and the Preferred Bidder.
Related Documents