Public Opinion Research National Report Card on Youth Financial Literacy :: OCTOBER 2011 :: British Columbia Securities Commission 701 West Georgia Street P.O. Box 10142, Pacific Centre Vancouver, BC V7Y 1L2

Welcome message from author
This document is posted to help you gain knowledge. Please leave a comment to let me know what you think about it! Share it to your friends and learn new things together.
Transcript

Public Opinion Research
National Report Card on Youth Financial Literacy
:: OCTOBER 2011 ::
British Columbia Securities Commission 701 West Georgia Street P.O. Box 10142, Pacific Centre Vancouver, BC V7Y 1L2

Copyright © 2011 British Columbia Securities Commission All rights in these materials are reserved except that the British Columbia Securities Commission grants permission to organizations involved in financial literacy to reproduce without modification excerpts from these materials for not-for-profit educational use by financial literacy educators, policy makers and youth in Canada. Published by: The British Columbia Securities Commission 701 West Georgia Street P.O. Box 10142, Pacific Centre Vancouver, BC V7Y 1L2
2
National Report Card on Youth Financial Literacy
THESE MATERIALS ARE NOT INTENDED TO PROVIDE SPECIFIC FINANCAL INVESTMENT, TAX, LEGAL OR ACCOUNTING ADVICE, AND SHOULD NOT BE RELIED ON FOR THAT PURPOSE. THESE MATERIALS ARE INTENDED FOR USE AS GENERAL INFORMATION TO UNDERSTAND YOUTH FINANCIAL LITERACY IN CANADA. THE CONCLUSIONS DRAWN AND OPINIONS STATED ARE THOSE OF THE PUBLISHER. THE DATA IS CURRENT AS OF SEPTEMBER 2011.

Table of Contents
Financial Attitudes
Expectations for the Future
Consumer Culture and Relationship with Money
Methodology and Approach
Financial Behaviour
Financial Knowledge
In-class Experience with Financial Literacy
Impact of Personal Finance Courses
7
12
17
22
25
40
55
65
3

About this Study
Financial literacy means having the knowledge, skills and confidence to make informed and sound financial decisions.
Many students currently leaving high school – and many adults – have weak financial skills and little knowledge of the financial realities they will face. As a result, they make costly mistakes, and are more vulnerable to scams and frauds.
By teaching students financial skills, we can give them the practical abilities and knowledge they will need to effectively manage their finances and achieve their goals.
A key component of the BCSC’s mandate is to protect and promote the public interest by fostering a securities market that is fair and warrants public confidence. Youth with strong financial life skills become informed investors and contribute to a fair securities market.
4
Research Objective:
This is the first comprehensive Canadian benchmark study on youth financial life skills. The British Columbia Securities Commission (BCSC) hired Innovative Research Group to assess the effectiveness of secondary school financial education programs — specifically, financial literacy outcomes (knowledge, attitudes, awareness) — and in preparing young Canadians as financial consumers (behaviours). The BCSC believes that the information and analysis in this study will help educators and policymakers develop and deliver financial literacy programs for Canadian youth.

Financial Life Skills Outcomes
Expectations For the most part, high school graduates are very optimistic about the future. On average, respondents expect to be earning over $70,000 in 10 years time (over double the amount of reported income of Canadian post-secondary graduates 10 years their age1) and almost three quarters expect to purchase a home within 10 years, which is a much higher rate than actual home ownership. 2
Attitudes Recent high school graduates are “talking the talk” when it comes to attitudes towards financial literacy. For the most part, recent high school graduates have the right attitude. A strong majority believe it is important to learn about finances at an early age (93% agreement); it is important to build up personal savings (93%); know where to look to learn about investing and personal financial management (67%); and believe it’s important to have a written financial plan (60%).
Behaviours However, in many cases young Canadians are not “walking the walk” when it comes to financial literacy behaviours. Many lack the financial behaviours that are important to future success. Less than half keep a budget to record income and expenses, 4-in-10 don’t know how much money they earned or spent last month and only 1-in-10 (12%) have a written financial plan.
Knowledge Although many recent high school graduate do relatively well on financial knowledge testing, some do better than others. Respondents were asked to complete a basic financial literacy test to measure their knowledge. Nationally, 35% of graduates scored an “A” or higher on the basic financial literacy test. Over 4-in-10 (42%) British Columbia (BC) graduates scored an “A” or higher, followed by graduates from Alberta at 37% and the Prairie provinces at 36%.
5
1 Statistics Canada. 2010. Census of Canada, 2006, Individuals File (Public Use Microdata File). All computations, use and interpretation of these data are entirely those of the authors.
2 Hou, Feng. 2010. “Home ownership over the Life Course of Canadians: Evidence from Canadian Censuses of Population.” Analytical Studies Research Paper Series, Statistics Canada Catalogue no. 11F0019M, no. 325, Appendix Table 5, page 22. http://www.statcan.gc.ca/pub/11f0019m/11f0019m2010325-eng.pdf

Impact of Secondary School Financial Literacy Courses Nationally, only 45% of recent graduates recall taking a course that covered topics on personal finance. BC and Alberta grads are most likely to recall having taking a high school course on personal finance (60%) while Ontario and Prairie province grads are least likely to recall having taken courses that covered personal finance in high school (37% and 38% respectively).
Impact of taking a course on personal finance
Those who have taken a course score slightly higher on the attitude, behaviour and knowledge indices, though not substantially so. The effects are more pronounced with regard to respondents’ financial attitudes than their behaviours or knowledge.
Not all financial literacy courses are created equal – “Comprehensiveness”
Having taken a “very comprehensive” course – that is, a course or courses that covered multiple personal finance and financial skills topics – makes one much more likely to have higher scores on the attitude, behaviour and knowledge indices. However, those whose courses were “somewhat comprehensive” or “not very comprehensive” score no differently than those who did not take a course at all.
Not all financial literacy courses are effective – “Good Experience vs. Bad Experience”
Having a “good experience” with a personal finance course makes one much more likely to have higher scores on the attitude, behaviour and knowledge indices. However, those who had a “bad experience” largely score no differently than those who did not take a course at all, and in some cases score more poorly (especially with regard to financial behaviour and attitude).
6
Students who took both comprehensive financial literacy courses and had good experiences with them perform better when it comes to positive financial attitudes, behaviour and knowledge. Simply having taken a financial literacy course or not having taken one at all has little impact on financial attitudes, behaviour and knowledge. To have an impact, courses need to be both comprehensive and delivered in an effective and interesting format. Having a bad course experience produces financial literacy outcomes similar to having not taken a course at all.

Methodology and Approach
7 7

Methodology and Approach
This survey was conducted by Innovative Research Group Inc. through an online survey among a representative sample of 3,006 Canadian high school graduates, 17 to 20 years of age. The interviews were conducted between September 7th and September 26th 2011 in both French and English.
The youth sample was provided by Uthink Online. The survey was administered to a series of randomly selected respondents from Uthink Online’s research panel. The survey was weighted to ensure that the overall sample's composition reflects actual young Canadian high school graduates between the ages of 17 and 20 according to 2006 Census data, in order to provide results that are intended to approximate a probability sample. Uthink Online provides each panellist with a unique URL. Only invited panel members are able to complete the survey, and only once.
Prior to fielding this study, the questionnaire was pre-tested among Francophone and Anglophone panelists. They were given special instructions to complete the survey independently, and then they completed the survey with an interviewer. With the interviewer, they went through the survey, question-by-question, providing feedback on comprehensiveness, completeness, and whether the questions were ordered logically.
A probability sample of this size would have an estimated margin of error of +/-1.8 percentage points, 19 times out of 20. The margin of error will be larger within each sub-grouping of the sample.
Note: Graphs and tables may not always total 100% due to rounding values rather than any error in data. Sums are added before
rounding numbers.
8

Regional Segmentation
British Columbia
n=601 +/-4.0%*
Alberta
n=302 +/-5.6%*
Atlantic
n=251 +/-6.2%* Ontario
n=999 +/-3.1%*
Prairies
n=252 +/-6.2%*
Quebec
n=601 +/-4.0%*
Regional groupings included: British Columbia Alberta Prairie Region (Manitoba and Saskatchewan) Ontario Quebec Atlantic (PEI, New Brunswick, Nova Scotia and Newfoundland and Labrador).
9
* Estimated margin of error, 19 times out of 20.
National n=3,006 +/-1.8%*

Age (as of Dec. 31, 2011)
Gender
Demographic Segmentation: Respondent Profile
Language
Living Status
7%
29% 29% 35%
17 years old 18 years old 19 years old 20 years old
78%
22% French
English
55% 45% Male Female
41% 59%
Live with parents
Live outside of parents’ home
10
Note: 17 year olds are largely represented by Quebec respondents who graduate high school a year ahead of other provinces.

91%
2%
7%
Taking courses full time
Taking courses part time
Not engaged in post-secondary
Post-secondary Education Status
Work Status
4%
43%
21%
31%
Working full time
Working part time
Looking for work
Not engaged in workforce
Demographic Segmentation: Education and Employment
Full Time School, 30%
Full Time School and Part Time Work, 40%
Candle Burners, 2% (Full Time School & Full Time Work)
Other, 9%
Making Ends Meet
10%
35%
34%
15%
Very difficult
Somewhat difficult
Not very difficult
Not difficult at all
Full Time School and Looking for Work, 20%
11
DEMOGRAPHIC NOTE: The sample is largely represented by high school graduates who are currently enrolled in post-secondary studies.

Consumer Culture and Relationship with Money
12

Consumer Culture and Relationship with Money
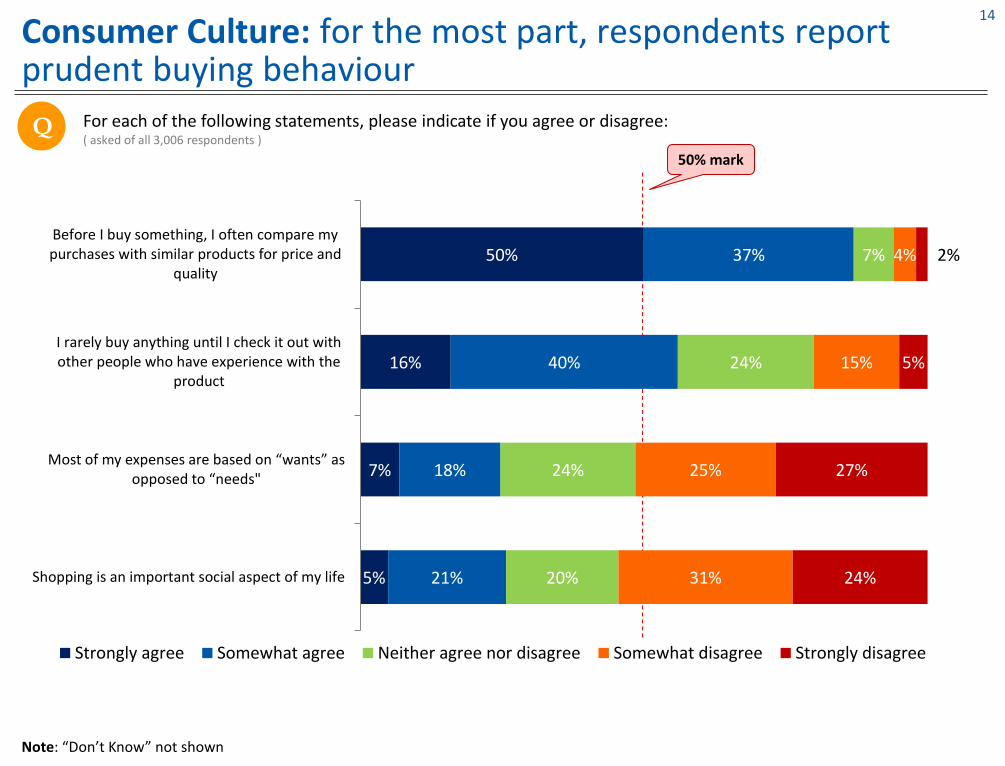
Consumer Culture
For the most part, respondents report prudent buying behaviour:
A majority shop around before making purchases and check in with others who have experience with the product.
A majority disagree their expenses are based on wants rather than needs and that shopping is an important social aspect of their life.
Relationship with Money
Respondents report a very good relationship with money:
Recent graduates want to be financially independent: they strongly agree with “its important to live within ones means”, setting aside money today for the future and having good money habits are necessary to be successful in life.
Although a majority agree that it’s important to have a lot of money in life, it’s the least important tested measure among respondents.
What would you do if you won $5,000?
This groups of respondents has very practical uses for hypothetical lottery winnings:
Most say they would pay for their education if they won $5,000 tomorrow.
The second most cited response is using it for savings and investments.
13
50% mark
Consumer Culture: for the most part, respondents report prudent buying behaviour
Q
Note: “Don’t Know” not shown
For each of the following statements, please indicate if you agree or disagree: ( asked of all 3,006 respondents )
5%
7%
16%
50%
21%
18%
40%
37%
20%
24%
24%
7%
31%
25%
15%
4%
24%
27%
5%
2%
Shopping is an important social aspect of my life
Most of my expenses are based on “wants” as opposed to “needs"
I rarely buy anything until I check it out withother people who have experience with the
product
Before I buy something, I often compare mypurchases with similar products for price and
quality
Strongly agree Somewhat agree Neither agree nor disagree Somewhat disagree Strongly disagree
14

For each of the following statements, please indicate if you agree or disagree: ( asked of all 3,006 respondents )
Relationship with money
Q
Note: “Don’t Know” not shown
50% mark
15%
50%
55%
65%
65%
75%
78%
40%
34%
34%
26%
29%
22%
17%
27%
12%
7%
7%
5%
2%
4%
13%
1%
3%
2%
1%
1%
5%
1%
1%
1%
It’s important to me to have a lot of money in my life.
I know I’ll be successful in life.
You need to have good money habits to be successful inlife.
It’s important that I start setting aside money now in order to reach my future goals.
I like the feeling of earning and managing my own money.
It’s important to know how to live within your means.
I don’t like the feeling of owing anyone money.
Strongly agree Somewhat agree Neutral Somewhat disagree Strongly disagree
15

What would you do with $5,000?
Q I’d like you to think about this hypothetical scenario. Let’s assume you won $5,000 in a lottery tomorrow. What would you do with this money? ( asked of all 3,006 respondents; sum will equal more than 100% as this was a “select all that apply” question )
Note: “Don’t Know” (2%) not shown
55%
46%
10%
9%
8%
8%
6%
6%
4%
Pay for eduction
Savings/investments
Shopping
Student loan repayment
Other debt repayment
Leisure/entertainment/travel
Accommodation/living expenses
Give money to friends/family
Give money to charity
16

Expectations for the Future
17

Expectations for the Future
Overall, respondents are largely optimistic about their future.
Expectations of Earning Potential
49% of respondents predict they will be making between $40k and $80k in 10 years (with an average projected income of $90,735).
The median estimate is $70k. This is over two times the median reported income of cohorts 10 years their age in the 2006 Census.1
1-in-6 think they will be earning more than $100k in 10 years time, while 1-in-10 predict they will earn less than $40k.
Expectations of Home Ownership
73% of respondents say they are likely to purchase a home in the next 10 years; a much higher rate than actual home ownership.
However, only 31% say they are very likely – a number much more in line with Statistics Canada’s estimate that 42% of 25-29 year olds are homeowners.2
A Point of Comparison
A large majority of respondents (81%) believe they will be financially better off in life than their parents.
4-in-10 (41%) say they’ll definitely or very likely be better off than their parents.
Only 12% believe it is unlikely that they will be better off than their parents.
18
1 Statistics Canada. 2010. Census of Canada, 2006, Individuals File (Public Use Microdata File). All computations, use and interpretation of these data are entirely those of the authors.
2 Hou, Feng. 2010. “Home ownership over the Life Course of Canadians: Evidence from Canadian Censuses of Population.” Analytical Studies Research Paper Series, Statistics Canada Catalogue no. 11F0019M, no. 325, Appendix Table 5, page 22. http://www.statcan.gc.ca/pub/11f0019m/11f0019m2010325-eng.pdf

1 Statistics Canada. 2010. Census of Canada, 2006, Individuals File (Public Use Microdata File). All computations, use and interpretation of these data are entirely those of the authors.
Future Earnings Predictions: average respondent expects to earn an annual income of just over $70k in 10 years time
Q What do you think you will earn as an annual income in 10 years? ( asked of all 3,006 respondents )
10%
24%
25%
12%
10%
2%
2%
2%
Less than $40,000
$40,000 to less than $60,000
$60,000 to less than $80,000
$80,000 to less than $100,000
$100,000 to less than $150,000
$150,000 to less than $200,000
$200,000 to less than $300,000
$300,000 or more
Note: “Don’t Know” (13%) not shown
The median survey respondent expects to earn $70,000 in 10 years. According to the 2006 Census1, the median income for a 25 to 29 year old with at least a high school diploma is $26,000. Even among Canadians between 25 to 29 who have at least a post-secondary degree, the median income is only $29,000.
19

Home ownership: nearly 3-in-4 expect to own a home within the next 10 years
Q How likely is it that you’ll purchase a home within the next 10 years? ( asked of all 3,006 respondents )
Note: “Don’t Know” (4%) not shown
73% likely
23% unlikely
According to the 2006 Census, only 42% 1 of 25 to 29 year olds own their home.
31%
42%
18%
5%
Very likely Somewhat likely Not very likely Not likely at all
20
1 Hou, Feng. 2010. “Home ownership over the Life Course of Canadians: Evidence from Canadian Censuses of Population.” Analytical Studies Research Paper Series, Statistics Canada Catalogue no. 11F0019M, no. 325, Appendix Table 5, page 22. http://www.statcan.gc.ca/pub/11f0019m/11f0019m2010325-eng.pdf

Financial Optimism: majority of respondents feel they’ll be financially better off in life than their parents
Q How likely is it that you’ll be financially better off in life than your parents/guardians(s)? ( asked of all 3,006 respondents )
15%
16%
19%
14%
16%
14%
9%
26%
31%
29%
26%
24%
25%
26%
40%
39%
40%
42%
38%
41%
40%
10%
7%
8%
9%
14%
11%
9%
2%
0%
1%
1%
2%
1%
1%
8%
6%
4%
8%
6%
7%
14%
National
Atlantic
Prairies
Ontario
Quebec
BC
Alberta
Definitely Very likely Somewhat likely Not very likely Not likely at all Don't know
21

Financial Attitudes
22

Index of Good Financial Attitudes
24% 29% 29%
18%
Very good attitude Somewhat good attitude Not very good attitude Not good at all
It’s important that people learn about finances at an early age.
It’s important to build up your personal savings and investments.
I know where to look to learn more about investing and financial management skills.
Having a written financial plan is important for people like me.
23
Respondents were asked to agree or disagree with the financial attitude statements below. These answers were then combined in order to create an index of “Good Financial Attitudes”. This allows us to assess how respondents with good financial attitudes differ from those with poor attitudes toward personal finance.

Relevance: Youth believe financial literacy is relevant to them
63%
61%
28%
24%
30%
32%
39%
36%
5%
4%
16%
28%
1%
1%
10%
7%
3%
1%
It’s important that people learn about personal finances at an early age.
It's important to build up your personal savings andinvestments.
I know where to look to learn more about investingand financial management skills.
Having a written financial plan is important for peoplelike me.
Strongly agree Somewhat agree Neither agree nor disagree Somewhat disagree Strongly disagree
50% mark
Q
Note: “Don’t Know” not shown
For each of the following statements, please indicate if you agree or disagree: ( asked of all 3,006 respondents )
24

Financial Behaviour
25

Debt, Savings and Budgeting
Debt
Over half of respondents carry debt, which for nearly 7-in-10 (69%) includes a student loan. Respondents also have loans from family members (27%), outstanding credit card balances (25%) and lines of credit (14%).
A majority carry under $10,000 in debt. The average debt load is just under $8,000.
In order to repay their debts, almost half set aside money from employment, while a quarter are doing nothing.
Among those with a student loan, almost half say they will definitely or very likely pay it off in 5 years.
Savings
Nearly 8-in-10 say they are saving for their education, followed by vacations (27%) and emergencies (26%).
Among the 60% who already have money set aside for the future, almost all keep it in the bank (90%).
A further 12% have GICs and 1-in-10 have mutual funds.
Budgeting and Awareness
Among those who have a budget, a majority use them regularly.
Very few respondents have written financial plans (12%).
Nearly 4-in-10 (38%) respondents admit they do not know how much they earned and spent in the last month.
Finance and Banking Smarts
13% of respondents have shared financial passwords or PIN, while 6% have been the victim of fraud or ID theft.
Majority don’t know the interest rate on their bank account, nor did they shop around for their banking services.
37% pay monthly banking fees, and among them only 62% know how much those fees cost.
26

Index of Good Financial Behaviour
26% 25% 25% 25%
Very good behaviour Somewhat good behaviour Not very good behaviour Not good at all
Do you know how much money you earned and spent last month?
Do you currently have a budget to track your income and expenses?
Do you stick to your budget?
Did you compare the cost of the banking services charges by different institutions before you opened up your last bank account?
Do you currently have a written financial plan that sets out your long-term financial goals and how you will meet them?
Do you know how much your banking services charges add up to in a typical month?
Do you know what the interest rate on your savings account is?
Do you already have money set aside (in savings accounts or other investments) for the future?
Have you ever shared a financially related password or PIN with a friend?
Have you ever been a victim of ID theft or fraud?
27
Respondents were asked a series of questions about their financial behaviour. These answers were then combined in order to create an index of “Good Financial Behaviour”. This allows us to assess how respondents with good financial behaviour differ from those reporting poor financial behaviour.

Debt Burden: Over half carry debt, mostly student loans
Q Do you currently carry any debt (such as a student loan, credit card debt or a loan from a friend or family member)? ( asked of all 3,006 respondents )
51% 47%
2%
Debt-free
Carry debt
Don’t know
Q What kind of debt do you currently have? ( asked only of those who responded yes to having any debt; n = 1,544 )
5%
1%
1%
5%
14%
25%
27%
69%
Other
A mortgage on a property
An outstanding store cardbalance
A car loan
A line of credit
An outstanding credit cardbalance
A loan from a friend orfamily member
A student loan
National Average
28

Debt Load: among those who have debt, a majority currently carry under $10,000 in debt
Q In total, how much debt – excluding any mortgage debt from a property – are you currently carrying? ( asked only of those who responded yes to having any debt; n = 1,544 )
5%
6%
5%
12%
14%
23%
15%
6%
8%
6%
Less than $100
$100 to less than $500
$500 to less than $1,000
$1,000 to less than $2,500
$2,500 to less than $5,000
$5,000 to less than $10,000
$10,000 to less than $15,000
$15,000 to less than $20,000
$20,000 or more
Don't know
Among the 51% of respondents who carry debt, the average debt load carried is $7,966.27
29

Debt repayment plan: almost half set aside money from employment, while a quarter aren’t doing anything
Q What are you currently doing to pay off your non-mortgage debt? ( asked only of those who responded yes to having any debt, n = 1,544 ; sum will equal more than 100% as this was a “select all that apply” question )
4%
4%
10%
17%
26%
48%
Other
Selling assets (such as a car or other valuables)
Cashing in my long term savings (e.g. bonds, GICs,savings accounts, etc.)
Borrowing from my parents or family member
Nothing | Don't know
Setting aside a percentage of what I make from my job
30

50% mark
Student Loan Repayment: almost half of those with student loans say they will definitely or very likely pay it off in 5 years
Q How likely is it that you will have eliminated your student loan within 5 years of completing your program? ( asked only of those who have a student loan; n = 1056 )
24%
35%
31%
24%
29%
19%
17%
25%
26%
28%
23%
17%
25%
24%
31%
23%
26%
31%
40%
33%
34%
14%
10%
8%
12%
10%
16%
17%
4%
5%
4%
5%
4%
4%
4%
3%
1%
4%
5%
1%
4%
3%
National
Quebec
Alberta
BC
Prairies
Ontario
Atlantic
Definitely Very likely Somewhat likely Not very likely Not likely at all Don't know
31

Future savings: nearly 8-in-10 (79%) say they’re saving for their education
Q What future events or purchases are you currently saving money for? ( asked of all 3,006 respondents; sum will equal more than 100% as this was a “select all that apply” question )
11%
7%
8%
15%
22%
22%
26%
27%
79%
Other
My retirement
I’m not currently saving for anything
Home purchase
Electronics purchase
Car purchase
Emergencies
Vacations
Education
Other responses included:
basic essentials/living necessities business investment clothing purchase debt/bills family food home/furniture purchase gifts/charity investments medical/dental moving rent/apartment sports/equipment wedding
32
Note: “Don’t Know” (1%) not shown

Savings Vehicles
1%
1%
2%
2%
6%
7%
10%
12%
90%
Other
Cash
RESP
RRSP
Stocks
Bonds
Mutual funds
Guaranteed Investment Certificates(GICs)
Money in a savings | bank account
Savings and Investments: among the 60% who have money set aside for the future, almost all keep it in the bank
Q Do you already have money set aside (in savings accounts or other investments) for the future? ( asked of all 3,006 respondents )
Q What kind of savings and investments do you currently have? ( asked only of those who currently have savings, n= 1,805; sum will equal more than 100% as this was a “select all that apply” question )
60%
36%
3%
No savings
Have savings
Don’t know
National Average
33

Budgeting: among those who keep a budget, majority use it regularly
Q Do you currently have a budget to track your income and expenses? ( asked of all 3,006 respondents )
Q Do you stick to your budget? ( asked only of those who currently use a budget, n=1,321 )
44%
52%
5%
Don’t keep a budget
Keep a budget
Don’t know
17%
61%
20%
1% 0%
Always Often Sometimes Rarely Never
Note: “Don’t Know” (1%) not shown
National Average
34

Budgeting in Practice: only 6-in-10 (62%) know how much money they earned and spent last month
Q Do you know how much money you earned and spent last month? ( asked of all 3,006 respondents )
62%
38% No Yes
National Average
35
Keep a Budget Don’t Keep a
Budget
Know how much they earned and spent last month
75% 52%
Don’t know how much they
earned and spent last month
25% 48%
Those who keep a budget are more likely to know how much money they earned and spent last month.
Impact of Keeping a Budget

Financial Plans: very few have written financial plans
Q Do you currently have a written financial plan that sets out your long-term financial goals and how you will meet them? ( asked of all 3,006 respondents )
36
12%
88%
No
Yes
National Average
Keep a Budget Don’t Keep a
Budget
Have a written plan 21% 6%
Don’t have a written plan 79% 94%
Impact of Keeping a Budget
Those who keep a budget are over three times more likely to have a written financial plan compared to those who don’t keep a budget.

Banking Fees: among those who pay banking fees, nearly 4-in-10 don’t know what they typically pay
Q Do you pay service charges on the banking services you use (e.g. monthly fees on a bank account, debit card transaction fees, etc.)? ( asked of all 3,006 respondents )
Q Do you know how much your banking service charges add up to in a typical month? ( asked only of those who currently pay banking service fees, n=1,109 )
37%
54%
9%
Don’t pay banking
fees
Pay banking fees
Don’t know 62%
38%
Yes No
National Average
37

Vigilance: 13% have shared financial passwords or PIN with friends while 6% have been victims of financial fraud
Q Have you ever shared a financially related password or PIN number with a friend? ( asked of all 3,006 respondents )
Q Have you ever been a victim of ID theft or fraud? ( asked of all 3,006 respondents )
6%
93%
2%
Yes No Don't know
13%
86%
7%
Yes No Don't know
38
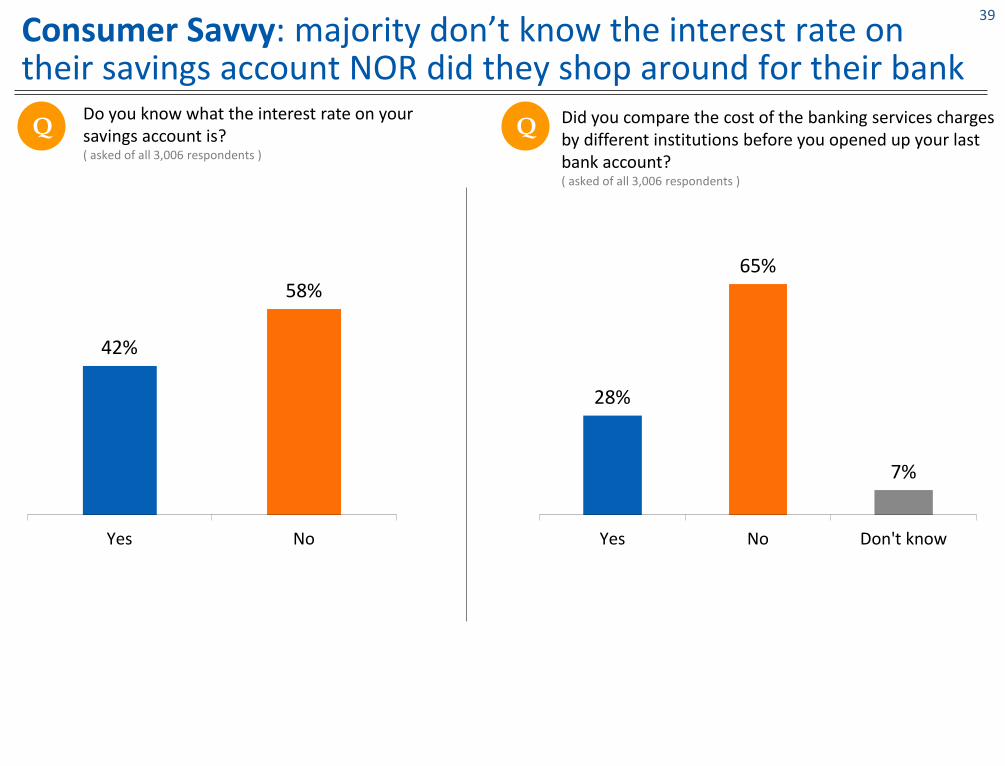
Consumer Savvy: majority don’t know the interest rate on their savings account NOR did they shop around for their bank
Q Do you know what the interest rate on your savings account is? ( asked of all 3,006 respondents )
Q Did you compare the cost of the banking services charges by different institutions before you opened up your last bank account? ( asked of all 3,006 respondents )
42%
58%
Yes No
28%
65%
7%
Yes No Don't know
39

Financial Knowledge
40

Financial Knowledge
Source of Knowledge
For the most part, respondents report learning about personal finance from their parents/family (66%) followed distantly by a course in high school (10%) and through personal experience (6%).
Financial Confidence
Over 4-in-10 respondents say they are either extremely or very confident when it comes to making financial decisions on their own.
Reported Financial Knowledge
Levels of reported financial knowledge are quite high. A majority of respondents feel at least “somewhat knowledgeable” about nearly all financial issues we addressed.
Respondents feel most knowledgeable about budgeting and debit card fees.
They feel least knowledgeable about GICs and income taxes.
Measured Financial Knowledge
There is a lot of room for improvement when it comes to youth financial literacy.
Respondents were asked to complete a basic financial literacy test to measure their knowledge. Nationally, 35% of graduates scored an “A” or higher on the basic financial literacy test.
Over 4-in-10 (42%) of British Columbia (BC) graduates scored an “A” or higher, followed by graduates from Alberta at 37% and the Prairie provinces at 36%.
41

Financial Teachers: majority of respondents learned what they know today about personal finance from their family
Q Where did you learn what you know today about money and personal finance? ( asked of all 3,006 respondents )
66%
10%
6%
3%
3%
2%
1%
1%
1%
1%
1%
1%
3%
1%
Parents/family
Course in high school
Experience/myself
Bank
Internet
Post-secondary institution
Friends
Economics course
Financial advisor
Media/television/newpapers
Books
No one
Other
Don't know
42

Financial Confidence: over 4-in-10 respondents say they are either extremely or very confident in making financial decisions
Q Overall, how confident would you say you are when it comes to making financial decisions on your own? ( asked of all 3,006 respondents )
Note: “Don’t Know” not shown
50% mark
10%
12%
10%
11%
11%
7%
9%
33%
38%
37%
34%
34%
37%
28%
45%
43%
45%
43%
44%
45%
49%
9%
6%
7%
8%
10%
10%
12%
1%
1%
2%
1%
1%
1%
National
Atlantic
Prairies
Ontario
BC
Alberta
Quebec
Extremely confident Very confident Somewhat confident Not very confident Not confident at all
43

Reported Financial Knowledge: respondents least knowledgeable of GICs, income tax and investing
Q Please indicate how knowledgeable you are when it comes to the following financial issues. ( asked of all 3,006 respondents )
31%
37%
34%
34%
28%
19%
19%
24%
14%
13%
10%
54%
45%
45%
45%
45%
41%
38%
29%
38%
37%
19%
12%
14%
15%
14%
19%
26%
26%
25%
33%
33%
32%
2%
3%
5%
6%
6%
12%
14%
18%
13%
14%
33%
1%
1%
2%
2%
2%
3%
3%
3%
2%
2%
7%
Budgeting your money
Debit card fees
Understanding how credit card interest and fees work
Establishing good credit
Knowing how to avoid financial scams and frauds
Knowing what a Registered Retirement Savings Plan (RRSP) is
Knowing what a credit score is
Knowing what a Tax Free Savings Account (TFSA) is
Investing money
Understanding how income taxes work
Knowing what a Guaranteed Investment Certificate (GIC) is
Very knowledgeable Somewhat knowledgeable Not very knowledgeable Not knowledgeable at all Don't know
50% mark
44

Overall Reported Knowledge Index
2% 2% 4%
11%
15%
17%
24%
11% 10%
4%
0-.1 .1-.2 .2-.3 .3-.4 .4-.5 .5-.6 .6-.7 .7-.8 .8-.9 .9-1
Reported as Not Knowledgeable
Reported as Very Knowledgeable
Respondents’ answers to the questions asking them to rate their own financial knowledge have been combined to create an index of reported financial knowledge. This allows us to assess how knowledgeable respondents feel about their own personal financial literacy.
45

Measured Financial Knowledge Index
0% 0% 0% 2% 6%
17% 19% 22% 22%
13%
0-.1 .1-.2 .2-.3 .3-.4 .4-.5 .5-.6 .6-.7 .7-.8 .8-.9 .9-1
Not Knowledgeable Very Knowledgeable Pass Mark
46
Diversifying your investments is a good way to reduce risk.
What of the following are warning flags about potential lenders?
If you were to make investments, it’s best to rely mostly on advice from whom?
In Canada, stockbrokers and others who are in the business of giving investment advice to the public must do what?
What strategy do you think you would use if you decided to invest in the stock market?
Investing in the stock market is riskier than investing in Guaranteed Investment Certificates (GICs) or a savings account at the bank.
Generally speaking, investments that offer a higher than average rate of return have a higher than average level of risk.
When you compare investments, which of the following do you consider important?
After asking respondents to rate their own financial knowledge, we asked them a series of basic financial literacy questions in order to obtain a more objective picture of youth financial literacy.

Measured Knowledge: almost a third (32%) of respondents correctly identified all the potential investment warning signs
Q What of the following are warning flags about potential lenders? ( asked of all 3,006 respondents; sum will equal more than 100% as this was a “select all that apply” question )
71%
45%
7%
70% 72%
They offer to make loans to anyone no matter what the borrower’s credit rating is
They charge you a fee justto apply for a loan
They offer to providedetailed monthly
statements about your loan
There are fees you aren’t told about until the last
minute
You’re asked to sign loan documents before you’ve
had time to read them carefully
Note: “Don’t Know” (9%) not shown
47
Correct Answer
Correct Answer
Correct Answer
Correct Answer

Q If you were to make investments, it’s best to rely mostly on advice from which of the following? Please select the best answer: ( asked of all 3,006 respondents )
3%
0%
1%
1%
2%
25%
65%
Other
Advertisements
Internet chat rooms and bulletin boards
Friends
Tips from company insiders
Parents and family members
A licensed investment adviser or investment dealer
Other responses included:
The bank
Books and publications
My own online research
Combination of many resources
Someone else who I see has done well
managing their own finances
University help centers
48
Note: “Don’t Know” (3%) not shown
Correct Answer
Measured Knowledge: a majority correctly identify the best source of investment advice among various options

Q In Canada, stock brokers and others who are in the business of giving investment advice to the public must … ( asked of all 3,006 respondents; sum will equal more than 100% as this was a “select all that apply” question )
2%
8%
45%
74%
Be over the age of 40
Guarantee that their clients won’t lose money
Graduate from university first
Complete specified courses and beregistered (licensed) by a provincial
regulator
Note: “Don’t Know” (19%) not shown
49
Correct Answer
Measured Knowledge: majority recognize investment advisors need to be licensed by a provincial regulator

Q Which strategy do you think you would use if you decided to invest in the stock market? Please select the best answer: ( asked of all 3,006 respondents )
46%
31%
4% 2%
Make smaller investments inseveral companies to help
reduce risks
Buy shares of well-establishedcompanies and hold them for
many years
Buy shares of high-risk start-upcompanies in the hope of quick
profits
Invest only when you receive a ‘hot tip’ from a friend or relative
50
Correct Answer
Note: “Don’t Know” (18%) not shown
Measured Knowledge: just under half recognize the importance of diversification among the provided investment strategies

Q When you compare investments, which of the following do you consider important? ( asked of all 3,006 respondents )
16%
4% 11%
59%
1%
Risk (how safe will theinvestment be)
Liquidity (can I accessmy money easily if I
need it)
Expected return (how much do I think I’ll
earn on this investment)
All of the above None of the above
51
Correct Answer
Note: “Don’t Know” (10%) not shown
Measured Knowledge: majority understand one should consider risk, liquidity & expected returns when comparing investments

50% mark
Measured Knowledge: majority of respondents answer true and false questions correctly
Q Are the following statements true or false? ( asked of all 3,006 respondents )
63%
70%
55%
82%
10%
7%
8%
5%
27%
24%
38%
13%
Generally speaking, investments thatoffer higher than average rates ofreturn have a higher than average
level of risk.
Investing in the stock market is riskierthan investing in a guaranteed
investment certificate (GIC) or asavings account at a bank.
If you invest in a bond, you are lendingyour money to the company or thegovernment that issued the bond.
Diversifying your investments (“not putting all your eggs in one basket”) is
a good way to reduce risks.
TRUE FALSE Don't know
52
Correct Answer
True
True
True
True

Overall Knowledge Index by Letter Grade
National BC Alberta Prairies Ontario Quebec Atlantic
A+ 13% 16% 12% 16% 12% 11% 11%
A 22% 26% 25% 20% 21% 20% 22%
B 22% 21% 25% 28% 20% 21% 28%
C 19% 16% 18% 19% 18% 23% 13%
D 17% 13% 15% 11% 20% 17% 18%
F 8% 7% 5% 7% 9% 7% 8%
Respondent grades based on basic financial literacy test:
Nationally, 35% of graduates scored an “A” or higher on the basic financial literacy test. Only 2% of respondents answered every question correctly.
42% of BC graduates scored an “A” or higher, followed by graduates from Alberta at 37% and the Prairie provinces at 36%.
53
Note: An “A+” represents scores of 90% or more on the test; “A” 80-89%; “B” 70-79%; “C” 60-69%; “D” 50-59%; “F” less than 50%.

By comparing reported to measured knowledge, a large group of respondents claim to know more than they actually do
35% 41%
25%
Overconfident On Par Underconfident
Respondents were categorized into three cohorts based on their scores on the Reported and Measured financial literacy indices. Below, we assess to what degree their levels of reported and measured knowledge match.
54
Over a third (35%) of respondents report being more knowledgeable than they actually are (as measured by the financial literacy test).

In-class Experience with Financial Literacy
55

In-class Experience
Personal Finance Course
Nation-wide only 45% of respondents recall taking a course that covered topics on personal finance.
60% of BC and Alberta grads recall taking such a course, while approximately 4-in-10 in the Atlantic, the Prairies, and Ontario recall taking a course. 45% of Quebec respondents recall taking a course dealing with personal finance.
Alberta is the only province where a significant number of graduates reported taking the course online (17%).
Majority of graduates believe their course was offered at the right time in high school.
Finance Course Coverage
Budgeting skills was the most cited curriculum topic among respondents who took a personal finance course (86%).
Credit and debt, financial planning, and savings were all cited by more than 6-in-10 respondents.
The least recalled topic area covered was fraud and ID theft at 25%.
Experience with Personal Finance Course
A majority agree the financial courses they took were relevant (84%) and help them manage their finances today (57%).
Less than 2-in-10 respondents agree they “know everything they need to know about personal finance”.
Over 7-in-10 agree that more time should have been spent teaching personal finance in high school.
Curriculum Trouble Areas
Overall, 3-in-10 report that none of the topics covered in their personal finance courses were difficult to understand.
“Investing” was the topic most had difficulties understanding.
56

Personal Finance Course: less than half of graduates recall having taken a class on personal finance in high school
Q Do you recall taking a class in high school that covered personal finance including, but not limited to, topics such as budgeting, investments, credit cards and the cost of education and career options? ( asked of all 3,006 respondents )
45% 52%
3%
Do not recall having taken a course on personal finance
Recall taking a course on personal finance
Don’t know Yes
No/
Don’t know
BC 60% 40%
Alberta 60% 40%
Prairies 38% 62%
Ontario 37% 63%
Quebec 45% 55%
Atlantic 41% 59%
National Average
57

Course Recall: Among those who recall taking a course, nearly three quarters remember the name
Q
73%
27%
Yes No
Do you recall the name of the course or courses you took in high school that covered personal finance? ( asked only of those who recall taking a class, n = 1,343 )
Yes No
BC 84% 16%
Alberta 79% 21%
Prairies 61% 39%
Ontario 66% 34%
Quebec 72% 28%
Atlantic 69% 31%
National Average
58

Online or In-class Courses: Majority of graduates took personal finance course primarily taught by teachers
Q When you took the class in high school that covered personal finance, did you take it as an online course or did you take it as a course taught primarily by a teacher? ( asked only of those who recall taking a class; n = 1,343 )
5% 94% 2%
Course taught by teacher
Took course online
Don’t know
Online In-class Don’t Know
BC 7% 92% 1%
Alberta 17% 81% 2%
Prairies 3% 91% 5%
Ontario 2% 96% 2%
Quebec 0% 99% 1%
Atlantic 1% 98% 1%
National Average
59

Personal Finance: majority of graduates believe their course was offered at the right time in high school
Q Thinking of the personal finance course(s) you took in high school, do you think the course or courses you took were offered to you at the right time? ( asked only of those who recall taking a class; n = 1,343 )
24%
59%
12%
Too early Offered at theright time
Too late
Note: “Don’t Know” (5%) not shown
Too early Right time Too late Don’t Know
BC 32% 55% 6% 7%
Alberta 29% 50% 14% 7%
Prairies 22% 53% 17% 8%
Ontario 23% 57% 17% 3%
Quebec 17% 70% 8% 4%
Atlantic 23% 60% 12% 6%
60
National Average

Finance Course Coverage
Q What was covered in the personal finance courses you took? [Select all that apply] ( asked only of those who recall taking a class, n = 1,343; multiple mention, sum will exceed 100% )
86%
68%
68%
62%
50%
47%
25%
3%
1%
Budgeting Skills
Credit and Debt
Financial Planning
Savings
Investing
Banking Services
Fraud / ID Theft
Other
Don't Know
BC AB Prairies ON QC Atlantic
Budgeting 94% 95% 84% 82% 80% 85%
Credit & debt
58% 57% 68% 71% 82% 55%
Financial Planning
78% 83% 56% 68% 56% 63%
Savings 61% 74% 53% 65% 58% 53%
Investing 36% 41% 44% 60% 57% 37%
Banking Services
39% 42% 51% 55% 48% 35%
Fraud/ ID Theft
22% 23% 11% 31% 24% 20%
Other 1% 4% 5% 3% 4% 4%
Don’t know 2% 1% 5% 1% 1% 1%
National Average Regional Segmentation
61

Experience with Personal Finance Curriculum
Q Thinking about the financial skills you were taught in high school, do you agree or disagree with the following statements? ( asked only of those who recall taking a class; n = 1,343 )
Note: “Don’t Know” not shown
36%
17%
19%
17%
15%
6%
34%
48%
40%
40%
36%
29%
13%
37%
10%
24%
19%
24%
25%
16%
21%
4%
12%
15%
15%
18%
35%
5%
1%
5%
5%
6%
11%
28%
1%
The financial courses I took in high school were relevant forpeople like me.
The financial skills I learned in high school are helping memanage my finances today.
I still remember most of the financial skills I was taught in highschool.
The methods and materials used to teach financial skills wereeffective and interesting.
I needed more help to deal with difficult financial topics taughtin high school.
As a young adult, I think I know everything I need to knowabout personal finance.
More time should have been spent teaching personal finance inhigh school.
Strongly agree Somewhat agree Neither agree nor disagree Somewhat disagree Strongly disagree
62

Curriculum trouble areas: at nearly 4-in-10 (37%), respondent had the most difficulty understanding the topic of “investing”
Q Thinking of the personal finance course(s) you took in high school, what topic areas, if any, did you find difficult to understand? [Select all that apply] ( asked only of those who recall taking a class; n = 1,343 )
32%
37%
26%
20%
16%
15%
11%
10%
1%
None
Investing
Credit and Debt
Banking Services
Financial Planning
Budgeting Skills
Savings
Fraud / ID Theft
Other
BC AB Prairies ON QC Atlantic
None 39% 32% 30% 33% 24% 33%
Investing 30% 44% 33% 37% 38% 35%
Credit & Debt
21% 32% 20% 28% 26% 24%
Banking Services
17% 23% 8% 21% 22% 13%
Financial Planning
12% 18% 13% 20% 14% 18%
Budgeting Skills
14% 12% 10% 18% 15% 14%
Savings 10% 13% 5% 13% 12% 8%
Fraud/ID Theft
8% 11% 5% 14% 8% 8%
Other 1% 1% 1% 0% 1% 1%
Note: “Don’t Know” (9%) not shown
63

A change in confidence: Recent grads realize they don’t know as much as they thought they did about financial literacy
Q After having completed this survey, how confidant would you say you are when it comes to making financial decisions on your own? ( asked only of those who recall taking a class; n = 1,343 )
Note: “Don’t Know” not shown
49%
41%
50%
39%
42%
33%
53%
48%
54%
47%
41%
37%
60%
43%
43%
47%
41%
48%
47%
55%
39%
41%
40%
44%
48%
48%
33%
45%
8%
11%
8%
12%
10%
12%
6%
11%
5%
7%
11%
14%
7%
12%
PrePost
PrePost
PrePost
PrePost
PrePost
PrePost
PrePost
Extremely|Very Confident Somewhat Confident Not Confident
National Average
British Columbia
Alberta
Prairies
Ontario
Quebec
Atlantic
Towards the beginning of the survey, respondents were asked how confident they were at making decisions on their own. After testing knowledge and experience with high school courses, we again asked respondents how confident they were. It appears that after knowledge testing, respondents aren’t as confident as originally thought.
64

Impact of Personal Finance Courses
65

Impact of Personal Finance Courses
Impact of taking a personal finance course in high school
Those who recall taking the course are more likely to have a good financial attitude and less likely to have a bad one.
There are smaller effects with regard to improved financial behaviour and financial literacy.
Taking a comprehensive course
Those who took a “very comprehensive” course – that is, a course or courses that covered multiple personal finance and financial skills topics – are much more likely to have a very good financial attitude than those who had a less comprehensive course, or no course at all.
Similar, but weaker, effects are seen for financial behaviour, indicating that a comprehensive course is more closely related with good financial attitudes than with good financial behaviour.
The impact of having taken a comprehensive course is weakest on financial knowledge. Although respondents who took a “very comprehensive” course are more likely to be in a higher grade category, the difference between those who where not exposed to a comprehensive course or any personal finance course at all is marginal.
Having a good experience in your personal finance course
Having a good classroom experience has a large positive effect on financial attitudes, while having a bad classroom experience is actually more detrimental to financial attitudes than having not taken a personal finance course at all.
The effects are similar with regard to good financial behaviour, with those respondents who had a good experience being much more likely to report good financial behaviour than those with a poor classroom experience or no classroom experience.
With regard to financial knowledge, those who had a good experience are more likely to score higher on the financial literacy test than their “bad experience” and “no experience” counterparts.
66

Personal Finance Courses
• Comparing those who recall taking a course on personal finance to those who do not recall taking such a course
• Comparing the reported comprehensiveness of the course (based on the number of topics the student indicates were covered in the course they took).
• Comparing students who reported having a good experience/a well taught course with the course to those who did not (based on students’ responses to questions about the effectiveness of the course they took)
45% 55%
Yes No/Don't Know
11% 16% 18%
55%
Verycomprehensive
Somewhatcomprehensive
Not verycomprehensive
No course taken
25% 20%
55%
Good experience /taugh well
Bad experience /taught poorly
No experience
The Impact of Personal Finance Courses on our three key outcomes (Good Attitude Index, Good Behaviour Index, and Measured Knowledge) is assessed in three ways:
67

Index of Good Financial Attitude
Note: “Don’t Know” not shown
24%
28%
22%
43%
23%
22%
22%
36%
17%
22%
29%
30%
28%
27%
33%
28%
28%
31%
29%
28%
29%
28%
30%
23%
30%
29%
30%
25%
31%
30%
18%
15%
21%
7%
15%
21%
21%
9%
24%
21%
Overall
Yes
No/Don't Know
Very Comprehensive
Somewhat Comprehensive
Not Very Comprehensive
No Course Taken
Good Experience/Taught Well
Bad Experience/Taugh Poorly
No Experience
Very good attitude Somewhat good attitude Not very good attitude Not good attitude at all
Recall taking Financial Course
Comprehensiveness of Course
Experience with Course
Those with good experiences and very comprehensive courses reported better financial attitudes. Those with less comprehensive courses scored quite similarly to those who did not take a course. Having a bad experience with a course may even be detrimental to financial attitudes when compared to not taking a course at all.
68

Those who had good experiences and had “very comprehensive” courses reported better financial behaviour than those who had less comprehensive courses. Again, having a bad experience could be worse than no experience at all when it comes to financial behaviour.
Index of Good Financial Behaviour
Note: “Don’t Know” not shown
26%
28%
24%
38%
26%
22%
24%
34%
19%
24%
25%
25%
25%
25%
26%
25%
25%
26%
25%
25%
25%
25%
24%
19%
25%
28%
24%
22%
28%
24%
25%
22%
26%
17%
23%
25%
26%
17%
29%
26%
Overall
Yes
No/Don't Know
Very Comprehensive
Somewhat Comprehensive
Not Very Comprehensive
No Course Taken
Good Experience/Taught Well
Bad Experience/Taugh Poorly
No Experience
Very good behaviour Somewhat good behaviour Not very good behaviour Not good behaviour at all
Recall taking Financial Course
Comprehensiveness of Course
Experience with Course
69

13%
14%
12%
19%
12%
12%
12%
17%
11%
12%
22%
24%
21%
23%
25%
23%
21%
23%
25%
21%
22%
23%
21%
24%
25%
22%
21%
23%
24%
21%
19%
17%
20%
17%
16%
19%
20%
17%
19%
20%
17%
15%
19%
11%
16%
17%
19%
14%
16%
19%
8%
7%
8%
7%
6%
7%
8%
8%
6%
8%
Overall
Yes
No/Don't Know
Very Comprehensive
Somewhat Comprehensive
Not Very Comprehensive
No Course Taken
Good Experience/Taught Well
Bad Experience/Taugh Poorly
No Experience
A+ A B C D F
Knowledge Index Grades
Note: “Don’t Know” not shown. An “A+” represents scores of 90% or more on the test; “A” 80-89%; “B” 70-79%; “C” 60-69%; “D” 50-59%; “F” less than 50%.
Recall taking Financial Course
Comprehensiveness of Course
Experience with Course
Those who had good experiences and had “very comprehensive” courses had higher measured financial literacy. The effect does not seem to come from simply taking a course. The course needs to be comprehensive and well-taught.
70

21%
12%
10%
21%
21%
24%
22%
21%
23%
17%
20%
20%
12%
19%
18%
7%
8%
6%
Comprehensive, Good Experience
No Course Taken
Not Comprehensive, Bad Experience
A+ A B C D F
41%
24%
18%
26%
25%
24%
16%
24%
28%
16%
26%
31%
Comprehensive, Good Experience
No Course Taken
Not Comprehensive, Bad Experience
Very good behaviour Somewhat good Not very good Not good at all
Good Financial Literacy Courses: Impact on Attitudes, Behaviour and Knowledge
48%
22%
17%
26%
28%
28%
22%
30%
29%
4%
21%
25%
Comprehensive, Good Experience
No Course Taken
Not Comprehensive, Bad Experience
Very good attitude Somewhat good Not very good Not good at all
Impact on Financial Attitudes
Impact on Financial Behaviour
Impact on Financial Knowledge
The graph below illustrates the impact that taking a comprehensive personal finance course with a good learning experience has on financial attitudes, behaviours and knowledge relative to no course at all and a course with a bad learning experience. Comprehensive, good experience: n=263 (this includes only “very comprehensive” along with good experience) No course taken: n=1664 Not comprehensive, bad experience: n=334
71
Note: “Don’t Know” not shown. An “A+” represents scores of 90% or more on the test; “A” 80-89%; “B” 70-79%; “C” 60-69%; “D” 50-59%; “F” less than 50%.

72
Our mission is to protect and promote the public interest by fostering:
A securities market that is fair and warrants public confidence
A dynamic and competitive securities industry that provides investment opportunities and access to capital
Innovative Research Group Inc. is a national public opinion research and strategy firm with offices in Toronto and Vancouver. We provide critical information needed to assess and overcome public affairs and corporate communications challenges, identify and evaluate potential solutions, and monitor outcomes.
Our vision is to play a leading role in securities regulation that inspires investor confidence and supports fair, efficient, and innovative Canadian capital markets.
A key goal of the BCSC is to help investors protect their financial interests. We have developed InvestRight.org to provide investors with the tools to research and assess potential investments, and protect themselves from unsuitable or fraudulent investments.
We have a comprehensive youth education program and resource, called The City to help BC high school teachers teach students the fundamentals of managing money as part of the province's Planning 10 program.
We partnered with the Financial Consumer Agency of Canada (FCAC), and adapted the resource to an online format and a national audience in both official languages. The City is now widely used in all provinces and territories.
www.bcsc.bc.ca
British Columbia Securities Commission
Innovative Research Group
www.innovativeresearch.ca
Related Documents