Welcome message from author
This document is posted to help you gain knowledge. Please leave a comment to let me know what you think about it! Share it to your friends and learn new things together.
Transcript

Public Management Reform

This page intentionally left blank
Public ManagementReformA Comparative Analysis—New Public
Management, Governance, and the
Neo-Weberian State
THIRD EDITION
Christopher Pollitt
and
Geert Bouckaert
1
3Great Clarendon Street, Oxford OX2 6DP
Oxford University Press is a department of the University of Oxford.It furthers the University’s objective of excellence in research, scholarship,
and education by publishing worldwide in
Oxford New York
Auckland Cape Town Dar es Salaam Hong Kong KarachiKuala Lumpur Madrid Melbourne Mexico City Nairobi
New Delhi Shanghai Taipei Toronto
With offices in
Argentina Austria Brazil Chile Czech Republic France GreeceGuatemala Hungary Italy Japan Poland Portugal SingaporeSouth Korea Switzerland Thailand Turkey Ukraine Vietnam
Oxford is a registered trade mark of Oxford University Pressin the UK and in certain other countries
Published in the United Statesby Oxford University Press Inc., New York
# Christopher Pollitt and Geert Bouckaert, 2011
The moral rights of the authors have been assertedDatabase right Oxford University Press (maker)
First published 2000Second edition published 2004Third edition published 2011
All rights reserved. No part of this publication may be reproduced,stored in a retrieval system, or transmitted, in any form or by any means,
without the prior permission in writing of Oxford University Press,or as expressly permitted by law, or under terms agreed with the appropriate
reprographics rights organization. Enquiries concerning reproductionoutside the scope of the above should be sent to the Rights Department,
Oxford University Press, at the address above
You must not circulate this book in any other binding or coverand you must impose the same condition on any acquirer
British Library Cataloguing in Publication Data
Data available
Library of Congress Cataloging in Publication Data
Data available
Typeset by SPI Publisher Services, Pondicherry, IndiaPrinted in Great Britainon acid-free paper by
MPG Books Group, Bodmin and King’s Lynn
ISBN 978–0–19–959508–2 (Hbk)ISBN 978–0–19–959509–9 (Pbk)
1 3 5 7 9 10 8 6 4 2

For our parents,
Freda, John, Leen, and Michel

This page intentionally left blank
n PREFACE TO THE TH IRD ED I T ION
To go into a third edition is quite a serious step. A second edition betokens amodest degree
of success in attracting readers who hope to find something useful or interesting between
the covers. But a third edition begins to feel like a process of institutionalization—as if one
has now become one of the statues in the park of public management and administration.
Unlike statues, however, our book will not stand still. It evolves almost daily, sometimes
in accordance with our wishes and at other times in a tiresome or annoying way. In fact
this third edition, while inhabiting a similar broad framework of chapters and appendices,
is hugely different from the second. Some chapters are completely new, and all the others
have undergone extensive rewriting and updating. In the remainder of this preface we
would like to explain the logic of this overhaul.
Scope
Our subject—comparative management reform—has grown tremendously over the past
couple of decades. It has changed significantly even since the first edition of this book was
being written, in 1998–9. The literature has expanded fast and the diversity of perspectives
and techniques has also increased. We are delighted that the first two editions of Public
Management Reform: A Comparative Analysis played their part in this growth. It has been
one of the most widely cited publications, and we hope and intend that this very exten-
sively changed third edition will continue to stimulate and inform.
We have stuck to the same twelve countries (plus the EU Commission) as in the second
edition. The practical reasons for thus restricting our focus were several. To begin with, a
dozen states is already a lot to handle, in the sense of becoming familiar with the details of
their reform histories. Further, in order to minimize misunderstandings and superficial
interpretations, we took an early decision not to include states which neither of us had
recently visited. Additionally, in only two cases were neither of us at least minimally able
to understand the mother-tongue: Italy and Sweden. In the case of Italy we were fortunate
in obtaining the detailed help of a leading Italian scholar, Eduardo Ongaro (see, for
example, Ongaro, 2009). In the case of Sweden, so many documents are published in
English as well as Swedish that we felt somewhat reassured. In every country we also
contacted resident scholars who generously helped us check our facts and impressions (see
Acknowledgements for details). For these various reasons we arrived at our final list of
Australia, Belgium, Canada, Finland, France, Germany, Italy, the Netherlands, New Zeal-
and, Sweden, the United Kingdom, the United States of America, and the European
Commission. With considerable regret, we resisted the tempting invitations from various
parties to add (inter alia) Brazil, Denmark, Estonia, Japan, and Norway to our portfolio.
Choosing a time period also has implications. As in previous editions, we started the
clock in 1980. That made reasonable sense, insofar as the first waves of New Public
Management-type reforms began to appear internationally in the early and mid 1980s.
It does mean, however, that we have a huge additional quantity of more recent material,
all to be fitted in to roughly the same number of pages as before. Whereas the second
edition covered roughly twenty-three years of reform, this edition covers twenty-nine—
and the additional six years have been rather busy! A higher degree of selectivity has been
unavoidable.
In a nutshell, therefore, the third edition holds to the same geographical scope as the
second edition, but has to cover much more material because of the longer period covered
and the marked growth in reform activity during that period.
Changes in chapters
The first chapter is entirely new, and did not exist in the first two editions. Its purpose is
twofold. First, it indicates the scope of the book: the nature of the subject matter and how
broadly and deeply we will cover it. Second, it introduces readers to some of the main
recent debates in the field. These will be summarized here, and then continually picked up
in the later chapters, as we proceed. The intention is to give a strong flavour of what our
subject is about—what gets scholars (and often practitioners) excited, and where the main
arguments and controversies currently lie. It also introduces three major models or visions
of what the substance of public management reform has been (or, in some cases, should
be). These three models are then picked up at various points throughout the rest of the
book.
Chapter 2 introduces a model of the process of public management reform which is
basically similar to that in previous editions. However, experiences using the book for
teaching students have led us to revise our explanations of what the model does and does
not do. Its advantages and limitations should now be significantly clearer. One particularly
important development of the original material is the inclusion of a discussion relating
what is basically a model of the process of change in one country to the increasingly
important international dimension of management reform.
The revision of Chapter 3 (‘Many houses: types of politico-administrative regime’) has
benefited considerably from the rapid growth in comparative studies over the past decade.
Whilst we see no need to alter our list of key factors, there is nowmuchmore scholarly and
empirical back-up for this general approach, and we cite a good deal of it. Several new
sections have also been inserted.
Chapter 4 (‘Trajectories of modernization and reform’) has been very extensively rewrit-
ten. There are two principal reasons for this. First, there is simply an awful lot of new
data—recent reform attempts—to be added and considered. Second, the scholarly debate
about trajectories, trends, and patterns has become theoretically and conceptually more
sophisticated since the previous edition.We have needed to refer to, and engage with, that
debate.
viii PREFACE TO THE THIRD EDITION
Chapter 5 (‘Results: through a glass darkly’) is another section of the book that has
required wholesale revision. Since the first edition was written in the late 1990s there has
been an explosion of international indices and ‘league tables’ pertaining to various aspects
of governance (see, e.g. Dixon et al., 2008; Pollitt, 2010b). This growth industry has
spawned both new data and new problems and controversies. We try to report some of
the most relevant data and (necessarily briefly) comment on some of the controversies.
Chapter 6 (‘Politics and management’) was also a large-scale rewrite. The last few years
have seen a number of illuminating studies of the interface between top public servants
and politicians (e.g. Hood and Lodge, 2006; Peters and Pierre, 2004) and we had to catch
up on these. The net result has been a refinement and elaboration of the conceptual
framework we employed in the earlier editions.
Chapter 7 (‘Trade-offs, limits, dilemmas, contradictions, and paradoxes’) is largely new.
Whilst we have not abandoned the insights in the previous edition, we are now able to set
them within a more coherent discussion of developing patterns over time (Pollitt, 2008). In
doing this we have benefited from another recent academic growth area—the debates
around path dependency and cycles.
In Chapter 8 (‘Reflections’) we take the opportunity to look back at the large canvas
constituted by the seven earlier chapters. Like Chapter 1, this is an entirely new chapter, in
which we decided to start afresh rather than modify the previous material. Readers will
make up their own minds concerning the quality of these reflections, but, for our part, we
believe that the mixture or balance, though not utterly transformed since the second
edition, does reflect some significant recent learning by us.
In conclusion, we would say that—although this was not our main aim at the start—the
changes since the second edition have been sufficiently extensive that scholars who read
that earlier work carefully would nevertheless find this third edition of sufficient interest to
work through to the end. For most students, of course, it will be first time round, and we
hope that we have learned enough from those who worked with previous editions to have
further clarified the presentation of some of the key issues, while retaining the overviews
and factual summaries that so many readers have told us are useful.
PREFACE TO THE THIRD EDITION ix
n ACKNOWLEDGEMENTS
Unsurprisingly, for a book of this scope, now in its third incarnation, our debts are too
numerous and go too far back in time for us adequately to acknowledge them all in a small
space here. Thus we are, uncomfortably, obliged to be somewhat selective in our expres-
sions of gratitude.
A first acknowledgement must go to our home institution, Katholieke Universiteit
Leuven. Over the years it has supported our research efforts and, more specifically, enabled
us to spend time together to work on this third edition.
A second acknowledgement is due to our network of colleagues and friends who share
an interest in comparative public administration. Our many citations make clear how
extensively we have drawn on the work of others, but, in addition to the normal processes
of benefiting from each other’s publications, we have received a generous portion of
informal assistance and comment from a number of individuals during the preparation
of this third edition, and its predecessors. Indeed, some of themhave helped on a scale way
beyond normal professional colleagueship, and we were somewhat embarrassed by the
sheer weight of their goodwill. We particularly wish to acknowledge Peter Aucoin, Jona-
than Breul, Maurice Demers, Jean-Michel Eymeri-Douzans, Jan-Eric Furubo, Bob Gregory,
John Halligan, Sigurdur Helgasson, Jan-Coen Hellendoorn, Ralph Heintzman, Annie
Hondeghem, Patricia Ingraham, Werner Jann, Helmut Klages, Walter Kickert, Roger
Levy, Elke L€offler, Rudolf Maes, Nick Manning, John Mayne, Nicole de Montricher, Don
Moynihan, Johanna Nurmi, Jim Perry, Guy B. Peters, Jon Pierre, Rune Premfors, Isabella
Proeller, Beryl Radin, Irene Rubin, Luc Rouban, Fabio Rugge, Donald Savoie, David Shand,
Hilkka Summa, Goran Sunstr€om, Colin Talbot, Sandra van Thiel, Nick Thijs, Turo Virta-
nen, and Petri Uusikyl€a. We must also thank Elio Borgonovi and Edoardo Ongaro at
Universita Bocconi in Milan, who produced an excellent Italian translation of the first
edition, generously allowed us to draw on their material on recent Italian reforms and, in
Edoardo’s case, briefed us for this third edition on recent changes.
Third, we have received some special help with this edition. Arianne Sanders and Jesse
Stroobants have saved us a lot of time by fishing out needed facts and figures. Inge
Vermeulen has worked her magic with diagrams, and Maaike Vandenhaute has tidied up
a lot of stuff that badly needed it. Anneke Heylen has performed her usual immaculate job
in organizing the final stages before handover to Oxford University Press.
Finally, we would like to acknowledge those organizations which have contributed—
indirectly but significantly—to this book by being willing to fund serious empirical
research into public management reform. In the age of the ‘sound bite’ and the ‘pack-
aged’ management consultancy solution it takes some institutional courage to invest in
the kind of time-consuming research which almost always reveals variety and complex-
ity. As this book makes clear, however, if politicians’ hopes, public money, and civil
servants’ time are not to be wasted, such research is desperately needed. We therefore

gratefully acknowledge the support we have at various times received from Brunel
University, the Canadian Centre for Management Development, Erasmus University
Rotterdam, the Finnish Ministry of Finance, the Public Management Institute and
the Research Council of the Katholieke Universiteit Leuven, and the UK Economic and
Social Research Council.
Christopher Pollitt
Geert Bouckaert
ACKNOWLEDGEMENTS xi

This page intentionally left blank
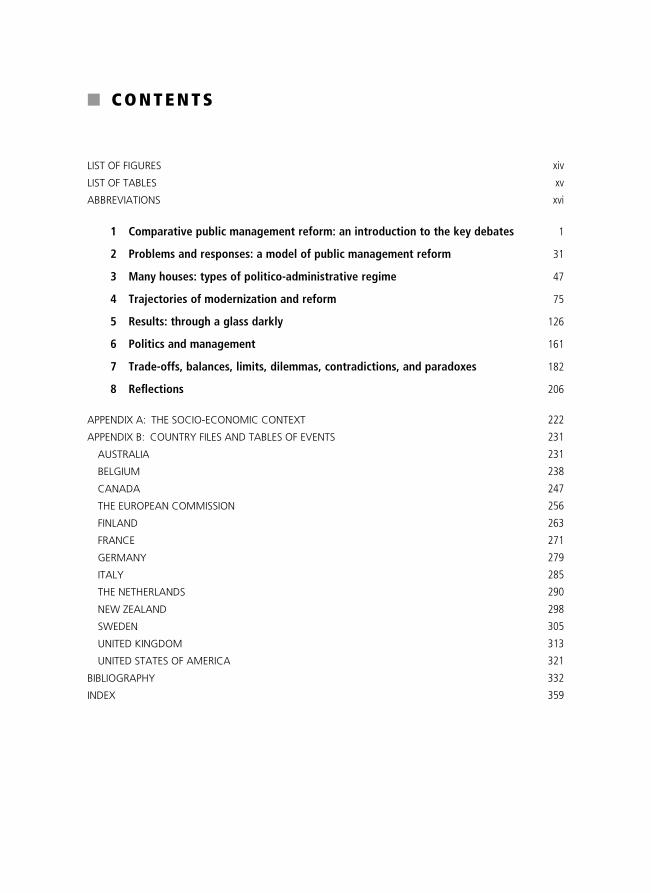
n CONTENTS
LIST OF FIGURES xiv
LIST OF TABLES xv
ABBREVIATIONS xvi
1 Comparative public management reform: an introduction to the key debates 1
2 Problems and responses: a model of public management reform 31
3 Many houses: types of politico-administrative regime 47
4 Trajectories of modernization and reform 75
5 Results: through a glass darkly 126
6 Politics and management 161
7 Trade-offs, balances, limits, dilemmas, contradictions, and paradoxes 182
8 Reflections 206
APPENDIX A: THE SOCIO-ECONOMIC CONTEXT 222
APPENDIX B: COUNTRY FILES AND TABLES OF EVENTS 231
AUSTRALIA 231
BELGIUM 238
CANADA 247
THE EUROPEAN COMMISSION 256
FINLAND 263
FRANCE 271
GERMANY 279
ITALY 285
THE NETHERLANDS 290
NEW ZEALAND 298
SWEDEN 305
UNITED KINGDOM 313
UNITED STATES OF AMERICA 321
BIBLIOGRAPHY 332
INDEX 359
n L I S T OF F IGURES
1.1 The focus of this book 3
1.2 Performance: a conceptual framework 16
1.3 Plats and paradigms 25
2.1 A model of public management reform 33
4.1 The concept of a trajectory 76
4.2 Extent of use of performance budgeting by central governments, 2007 80
4.3 Some types of public service bargain 96
5.1 Performance: a conceptual framework 133
8.1 Some patterns of reform 211
B.1 Financial implications of further state reform for the Belgian federal system 239
n L I S T OF TABLES
1.1 Three waves of reform thinking 11
1.2 Researching public management reforms 13
1.3 Big models—big claims: the basics 22
1.4 Three approaches to cutbacks 28
3.1 Types of politico-administrative regimes: five key features of public administration systems 50
3.2 Distribution of general government expenditure and employment by level of government 53
3.3 State structure and the nature of executive government 55
3.4 Indicators of different cultural aspects in different countries 65
4.1 Aspects of trajectories: context (what) and process (how) 77
4.2 Accounting trajectories 83
4.3 Strategic choices in decentralization 103
5.1 Government effectiveness scores (World Bank Governance Indicators) 128
5.2 Pisa reading scores, 2006 131
5.3 General government expenditures as a percentage of GDP 137
5.4 Employment in general government as a percentage of the labour force 138
5.5 Social expenditure as a percentage of GDP 139
5.6 Government efficiency 2003 according to the IMD’s world competitiveness yearbook 141
5.7 Citizens’ assessments of public and private services (Canada) 145
5.8 Confidence in the civil service (World Values Survey) 147
5.9 Trust in the civil service (Eurobarometer surveys) 147
6.1 Roles for politicians and civil servants: three ideal-type models 169
6.2 Weaknesses in the three ideal-type models 170
A.1 Real GDP growth 223
A.2 Changes in real GDP between the first quarter of 2008 and the third quarter of 2009 223
A.3 International trade in goods and services as a percentage of GDP 224
A.4 General government expenditures as a percentage of GDP 224
A.5 General government gross financial liabilities as a percentage of GDP 225
A.6 Population aged 65 and over as a percentage of the total population 227
A.7 Income inequality mid 2000s 228
A.8 Foreign-born populations as a percentage of total populations 228
A.9 Estimated total populations 2010 229
B.1 Cultural differences between the two linguistic communities in Belgium 240
B.2 The development of public sector employment in Belgium 242
B.3 Employment in the core administrations at federal, state, and local levels in Belgium, 2007 242
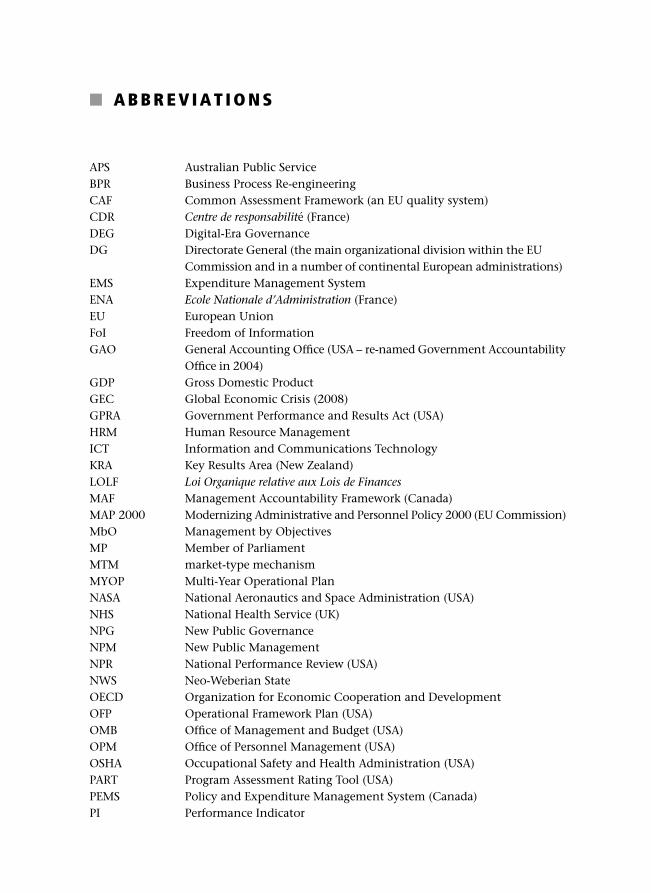
n ABBREV IAT IONS
APS Australian Public Service
BPR Business Process Re-engineering
CAF Common Assessment Framework (an EU quality system)
CDR Centre de responsabilit�e (France)
DEG Digital-Era Governance
DG Directorate General (the main organizational division within the EU
Commission and in a number of continental European administrations)
EMS Expenditure Management System
ENA Ecole Nationale d’Administration (France)
EU European Union
FoI Freedom of Information
GAO General Accounting Office (USA – re-named Government Accountability
Office in 2004)
GDP Gross Domestic Product
GEC Global Economic Crisis (2008)
GPRA Government Performance and Results Act (USA)
HRM Human Resource Management
ICT Information and Communications Technology
KRA Key Results Area (New Zealand)
LOLF Loi Organique relative aux Lois de Finances
MAF Management Accountability Framework (Canada)
MAP 2000 Modernizing Administrative and Personnel Policy 2000 (EU Commission)
MbO Management by Objectives
MP Member of Parliament
MTM market-type mechanism
MYOP Multi-Year Operational Plan
NASA National Aeronautics and Space Administration (USA)
NHS National Health Service (UK)
NPG New Public Governance
NPM New Public Management
NPR National Performance Review (USA)
NWS Neo-Weberian State
OECD Organization for Economic Cooperation and Development
OFP Operational Framework Plan (USA)
OMB Office of Management and Budget (USA)
OPM Office of Personnel Management (USA)
OSHA Occupational Safety and Health Administration (USA)
PART Program Assessment Rating Tool (USA)
PEMS Policy and Expenditure Management System (Canada)
PI Performance Indicator
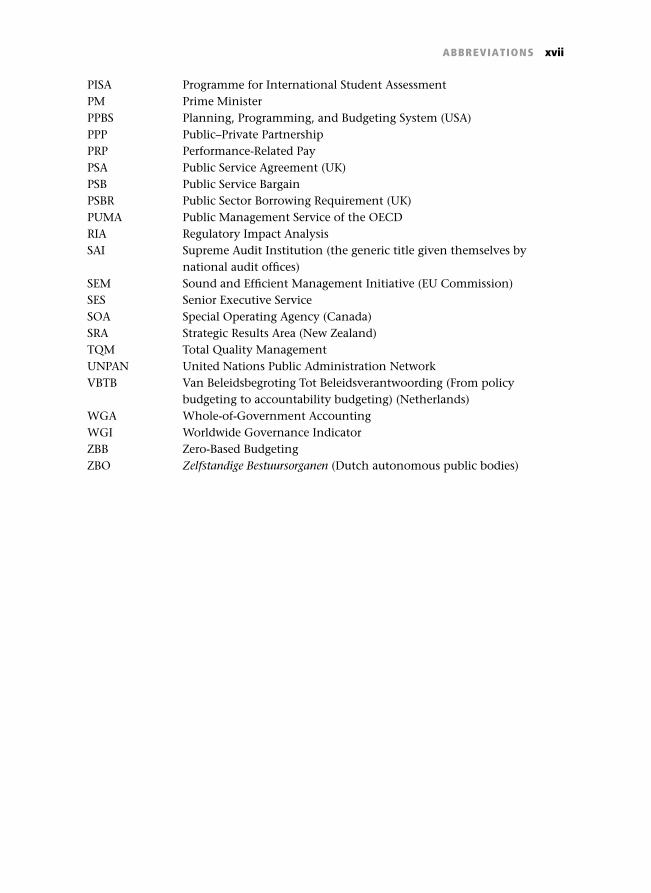
PISA Programme for International Student Assessment
PM Prime Minister
PPBS Planning, Programming, and Budgeting System (USA)
PPP Public–Private Partnership
PRP Performance-Related Pay
PSA Public Service Agreement (UK)
PSB Public Service Bargain
PSBR Public Sector Borrowing Requirement (UK)
PUMA Public Management Service of the OECD
RIA Regulatory Impact Analysis
SAI Supreme Audit Institution (the generic title given themselves by
national audit offices)
SEM Sound and Efficient Management Initiative (EU Commission)
SES Senior Executive Service
SOA Special Operating Agency (Canada)
SRA Strategic Results Area (New Zealand)
TQM Total Quality Management
UNPAN United Nations Public Administration Network
VBTB Van Beleidsbegroting Tot Beleidsverantwoording (From policy
budgeting to accountability budgeting) (Netherlands)
WGA Whole-of-Government Accounting
WGI Worldwide Governance Indicator
ZBB Zero-Based Budgeting
ZBO Zelfstandige Bestuursorganen (Dutch autonomous public bodies)
ABBREVIATIONS xvii

This page intentionally left blank
1 Comparative publicmanagement reform: anintroduction to the keydebates
We’ve got a government in a box, ready to roll in.
(General Stanley A. McChrystal, senior American commander in Afghanistan, speaking
at the beginning of an offensive to retake territory from the Taliban in southern
Afghanistan, February 2010—quoted in Filkins, 2010)
1.1 Purpose
We think General McChrystal was sadly mistaken. No government can be instantly rolled
out from a box, not even in far less adverse circumstances than obtained in southern
Afghanistan in 2010. In this book we are looking, not at Afghanistan, but at the relatively
stable and prosperous democracies of Australasia, Europe, and North America—and yet we
remain less optimistic aboutwhat canbe achieved (andhow it canbedone) than theAmerican
commander. Understanding what is and is not possible in public management reform (which
is, of course only one part of government reform) and seeing over what timescales changes of
different typesmaybehoped for, shouldbevaluable knowledge.Wecannotoffer a six-steps-to-
success cookbook (andwe rather doubt if anybody can), but we can draw out an international
mapof thedebates and the events of the last generation. From thiswemay elicit some cautious
conclusions about what has and has not been achieved under widely varying circumstances.
Our aim is thus toprovide a comparative analytic accountof publicmanagement thinking and
reform in twelve developed countries over a period of thirty years.
Lest our opening scepticism be interpreted as cynicism or ‘negativity’, we should also
affirm that such a broad perspective actually provides plenty of evidence of beneficial
change, and that we certainly think that good management can and does make a big
difference to the impacts and legitimacy of governments. Examples of successful reforms
will be cited as we go along. It is just that the imagery of conjuring good government out of
a box finds no resonance at all in the massive corpus of evidence that we are about to
review. For good reasons, that we will explain, it can never be that simple—or that quick.
1.2 Scope
We focus on public management reform, defined for our purposes as:
Deliberate changes to the structures and processes of public sector organizations with the objective of getting
them (in some sense) to run better.
This is a deliberately open and wide definition which clearly leaves all sorts of important
questions still to be answered. For example, ‘structures or processes’ could be the organi-
zational structures of ministries and agencies, or the processes by which public servants are
recruited, trained, promoted, and (if necessary) dismissed, or the legal and administrative
relationships between the citizens using public services and the organizations providing
them (as in a ‘citizens’ charter, for example). And ‘getting them to run better’ could mean
getting these organizations to run more efficiently, or ensuring that they are more respon-
sive to the citizens who used them, or focusing more strongly on achieving their official
objectives (reducing poverty, promoting exports, etc.). It should be obvious that these
different kinds of objective will sometimes trade off against each other, for example amore
Spartan, efficient service that minimizes the taxpayers’ money spent on each of its
activities may not simultaneously be able to increase its responsiveness to citizens or
effectiveness in achieving policy goals. So the phrase ‘in some sense’ may stand for some
difficult choices and decisions about what the priorities really are. Reforms and ‘moderni-
zation’ almost always necessitate some awkward choices of this kind—decision-makers are
obliged to decide what they think is most important—they can seldom hope to have
everything at the same time.
The empirical area (locus) to which we apply this definition of reform is very broad, but
yet it is still much less than the total field of public management. In brief, we have chosen
to apply ourselves mainly to central government in twelve specific countries, plus the manage-
ment of the European Commission. Thus, obviously, we do not deal with reforms in the
hundreds of other countries, or with reforms at regional or local level, or with reforms
in international organizations other than the European Union (EU), Commission. Central
government, however, means much more than ministries and ‘high politics’. It includes
vital-but-unobtrusive services like registering births and deaths (central in some countries,
local in others), or issuing driving licences. It includes both regulatory and executive
agencies, which may be at arm’s length fromministries and ministers, often with a degree
of statutory independence. It involves major services such as national police forces, and
public hospitals, schools and universities. In most countries these services employ far
more staff and spend much more money than do the ministries themselves. However,
the qualifying phrase ‘inmost countries’ is important. The split of services between central
governments (our focus) and subnational governments varies a lot between countries, and
also somewhat over time. Thus, for example, central government is responsible for a much
bigger share of services in New Zealand or the UK than in Germany, Finland, or the USA
(OECD, 2009a, p. 57).
Yet this broad sweep still leaves a lot out. In all countries, governments seek to achieve
many of their purposes through contracts or partnerships with non-governmental orga-
nizations (NGOs). In some countries (such as the USA) this zone of ‘contracted out’ yet
2 COMPARATIVE PUBLIC MANAGEMENT REFORM: THE KEY DEBATES
still public activity is truly enormous, and some critics have begun to write of the ‘hollow
state’ (e.g. Milward and Provan, 2000). It includes the work of charitable organizations and
other ‘non-profit’ bodies that form part of civil society, as well as for-profit companies that
inhabit the market sector. Some of these contractors and partners are quite small, local
organizations, while others are large and multinational. In other countries, such as
Germany or Belgium, religious and social foundations (‘civil associations’) continue to play
an important role in providing key social, health care, and educational services. Thus this
zone embraces bothpurely commercial contracting and sub-contracting, andmore close and
intimate ‘public private partnerships’ (PPPs—Bovaird and Tizzard, 2009), or long-standing
charitable provision.Wewill not focus directly onmost of this activity.We do note the shifts
towards contracting out and partnerships, and we observe that this has been pursued to
different degrees and in different ways in different countries, but we do not study these
hybrid organizations per se. However, the growth of this penumbra to the core public sector
is a key feature of ‘governance’ and ‘network’ approaches, and we will need to return to it at
various points in the book.
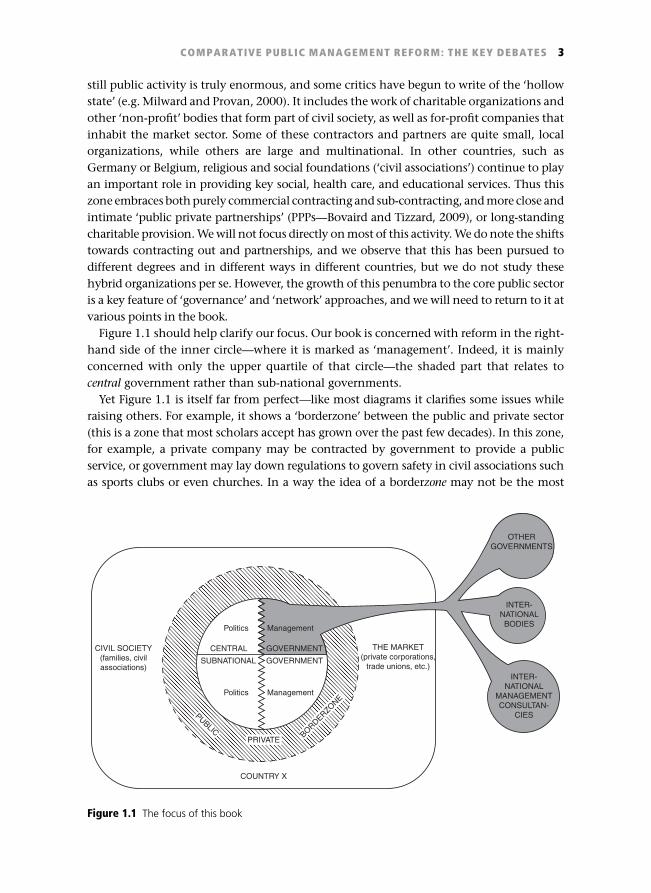
Figure 1.1 should help clarify our focus. Our book is concerned with reform in the right-
hand side of the inner circle—where it is marked as ‘management’. Indeed, it is mainly
concerned with only the upper quartile of that circle—the shaded part that relates to
central government rather than sub-national governments.
Yet Figure 1.1 is itself far from perfect—like most diagrams it clarifies some issues while
raising others. For example, it shows a ‘borderzone’ between the public and private sector
(this is a zone that most scholars accept has grown over the past few decades). In this zone,
for example, a private company may be contracted by government to provide a public
service, or government may lay down regulations to govern safety in civil associations such
as sports clubs or even churches. In a way the idea of a borderzone may not be the most
Politics Management
Politics Management
PRIVATE BORDERZONE
PRIVATE
COUNTRY X
CIVIL SOCIETY(families, civilassociations)
THE MARKET(private corporations,
trade unions, etc.)
OTHERGOVERNMENTS
INTER-NATIONALBODIES
INTER-NATIONAL
MANAGEMENTCONSULTAN-
CIES
BORDERZONE
PUBLIC
CENTRAL GOVERNMENT
SUBNATIONAL GOVERNMENT
Figure 1.1 The focus of this book
COMPARATIVE PUBLIC MANAGEMENT REFORM: THE KEY DEBATES 3
realistic graphic representation. It is perhaps a bit too neat for what are inpractice amyriad of
complex, overlapping public ‘tentacles’ which reach out deep into both civil society and the
business sector. Similarly the tentacles of the private sector reach into the heart of govern-
ment. Government offices may be cleaned by private sector contractors. Government com-
puters may be supplied and maintained by private sector companies, and so on. However,
rather than attempt a potentially confusing figure that involved overlapping spiders’ webs,
we chose a simple and static representation—just to get started.
A second noteworthy feature of Figure 1.1 is the jagged line between ‘politics’ and
‘management’ that crosses the inner circle of the government system (both at national
and subnational levels). The jaggedness is our rather feeble attempt to represent another
set of relationships that are probably too complex to be entirely captured in a simple
graphic. Suffice it to say here that the sensitive relationship between the political and the
managerial has been a perennially debated issue within the academic field of public
administration and management (see, e.g. Peters and Pierre, 2004). It will be touched on
again in almost every chapter, but particularly in Chapter 6. Our focus is on management,
but the insights of many previous scholars tell us that we cannot understand public
management without also paying attention to political structures and processes.
A third feature of the figure is the channel connecting public management within the
government system with ‘other governments’, ‘international bodies’, and ‘international
management consultancies’, all of which lie outside the particular country which may be
under consideration. Once more, this is a form of graphical shorthand. It is intended to
depict the fact that—increasingly—reform ideas circulate round international networks,
not just national ones. Governments copy other governments. Ministers and civil servants
also swap ideas at meetings of the OECD, or the EU Council of Ministers, or the World
Bank. Governments in many countries have also made increasing use of advice from
management consultants, and the big management consultancies are multinational com-
panies (Saint Martin, 2005). We will have a lot more to say about the emergence of this
international community for reform later.
It is important to realize that the main borderlines between the different elements in
Figure 1.1 may shift over time. For example, new powers may be devolved from central
government to subnational authorities, or powers may be taken away from subnational
authorities and centralized at the national level. The public–private borderzone—as men-
tioned above—may expand, with private corporations taking over more and more of the
running of public services (as they have done in both the UK and the USA). These
dynamics will be noted and discussed throughout the book, but we begin here with this
relatively simple, static representation. Later we will shift to ‘moving pictures’, especially
in the final chapter, where we will reconsider these basic elements in the light of the
considerable amount of empirical information which the book will deliver.
1.3 Recent debates in the field
Of course, in one chapter we cannot cover all the different arguments and debates that a
growing and increasingly international community of public management scholars have
4 COMPARATIVE PUBLIC MANAGEMENT REFORM: THE KEY DEBATES
spawned over even the past ten years, let alone a longer period. We have had to be quite
selective, so in the following sections we pick out what we consider to be the most
important or interesting topics, and attempt to summarize the arguments. Those who
wish to go deeper are urged to consult the references that we supply as a starting point for
further study.
These are the issues we have chosen:
� Why has public management reform become a much more prominent issue than it was
in the 1950s or 1960s? (Section 1.4)
� What has been the main direction of reform? (Section 1.5)
� Has there been a global convergence on one particular way of managing the public
sector, or are there a variety of models? (Section 1.6)
� Internationally, how successful has the New Public Management (NPM) been? (Section
1.7)
� What other models—apart from the NPM—have been influential? (Section 1.8)
� What, in particular, are we to make of ‘networks’? (Section 1.9)
� And what is the significance of the so-called shift from government to ‘governance’?
(Section 1.10)
� What are the implications for public management reform of the global economic crisis
which began in the second half of 2008? (Section 1.11)
Finally, we also introduce some more epistemological or methodological issues:
� What kind of answers should we be looking for—models and menus? (Section 1.12)
� What kinds of methods are used in comparative research? (Section 1.13)
� Reflections and conclusions: management reforms caught between ‘is’ and ‘ought’?
(Section 1.14)
Most of these issues are closely interconnected, so one section leads into the next. All these
issues will—as indicated earlier—reappear at various levels of detail as you move through
the later chapters of the book.
1.4 Why has public management reformbecome a much more prominent issue than itwas in the 1950s or 1960s?
Back in the 1950s, public management reform was different in two particular but funda-
mental ways. First, it was generally treated as a technical or legal, rather than a political or
economic matter—it was usually a question of rather dull organizational and procedural
changes. It was not normally something that party leaders or the mass media made much
public fuss about. There was nothing like the stream of reform white papers and glossy
brochures which we have become accustomed to more recently in many European
COMPARATIVE PUBLIC MANAGEMENT REFORM: THE KEY DEBATES 5
countries and in North America. Second, it was an essentially national or even sectoral
matter. Germans made their reforms in the light of German circumstances and history, as
did the French, the British, the Americans, and so on. There was little international debate
about such issues, and the usual assumption was that each country ploughed its own
furrow. This attitude was reinforced—in many countries—by the important role constitu-
tional and administrative law played in administrative reform. The relevant framework of
law was very different in France from that in the UK, and in the USA it was different
again—therefore the reforms themselves were likely to be different. International fora such
as the OECD Public Management Committee or the United Nations Public Administration
Network (UNPAN)—which subsequently became influential talking shops for public man-
agement reform—did not then exist. Neither did the multi-national management con-
sultancies which, since the late 1980s, have come to play such an influential role in the
reforms of many countries. The enormous subsequent growth of institutionalized, inter-
national management networks had not yet taken place (Sahlin-Andersson and Engwall,
2002; Saint-Martin, 2005). Similarly, in the academic world, we know of no group of
scholars who at that time made comparative public administration (as it would then have
been called) a consistent focus for debate, research, and publication. As far as the devel-
oped world was concerned, there were a few isolated works, frequently of a predominantly
legal/constitutional nature, and that was all (Pollitt, 2011). There was, however, a consid-
erable body of comparative ‘development’ administration pertaining mainly to the devel-
oping world, and frequently setting up Western models as the ideal towards which
developing countries should aspire.
With the advantage of hindsight, we can see that this began to change in some countries
in the late 1960s and early 1970s, and then began to affect manymore from the late 1970s/
early 1980s. The first wave—which was principally concerned with more rational strategic
policymaking and evaluation—took place mainly in the USA, the UK, and France (Pre-
mchand, 1983; Pollitt, 1984; Wildavsky, 1979). It coincided with, and was part of, a period
of ‘high modernism’ when rapid advances in science and technology, combined with a
huge growth in the university-based study of the social sciences, seemed to hold out the
promise of a more rational ‘designed’ set of public policies and institutions (see, e.g. Dror,
1971 or The reorganization of central government, Cmnd 4506, 1970).
The secondwave seems tohavebeenconnected to the global economicdisturbancesof the
1970s, and the spreading belief that governments hadbecome ‘overloaded’ and thatWestern
welfare states had become unaffordable, ineffective, and overly constraining on employers
and citizens alike (e.g. King, 1976; Held, 1984; O’Connor, 1973). One might say that the
modernist optimism of the 1960s had been replaced as a spur to reform by the dismal
prospect of fiscal crisis and governmental over-reach. At any event, there arose a fast-spread-
ing desire to make government more businesslike—to save money, increase efficiency, and
simultaneously oblige public bureaucracies to act more responsively towards their citizen-
users (e.g. Boston et al., 1996; Pollitt, 1990). This time the trend wasmore widely felt so that,
for example, among our selected countries, Australia, Canada, the Netherlands, New Zeal-
and, Sweden, the UK, and the USA all launched major programmes of central government
reformduring the 1980s. It later becameknownas theNewPublicManagement (NPM). It is a
termwhich has (rather confusingly) come to be used to cover a very wide range of reforms in
an equally broad spread of countries.
6 COMPARATIVE PUBLIC MANAGEMENT REFORM: THE KEY DEBATES
This second wave began during times of global economic downturn, but continued
through the subsequent upturn. The drive for greater efficiency and improved service
quality spread to more and more countries and lasted through the 1980s and well into the
1990s. (Its character is elaborated in the following section.) But, as the 1990s progressed, its
‘personality’ began to change. Reforms stayed high on many political agendas, but the talk
turned to ‘governance’, ‘partnerships’, ‘joined-up government’/‘whole of government’, and
then to ‘trust’ and ‘transparency’. In other words, the agenda seemed to shift. This was a
complex process, proceeding faster and further in some countries than in others (as had the
earlier reformwaves). Efficiency and quality did not disappear from view—both remained as
persistent concerns—but they tended to be overshadowed by these newer totems. Precisely
why the agenda changed in this way is not yet entirely clear. To some extent there was a
reaction against some of the unwanted or unpopular effects of the earlier, second wave of
reform. The reforms of the 1980s and early 1990s had tended to fragment public sector
organizations, producing fewer large, multi-purpose forms and more single- or few-purpose
organizations, each pursuing more explicitly defined sets of goals and targets (Bouckaert et
al., 2010). What is more, these new agencies were often deliberately positioned at arm’s
length from ministers, partly in order to give the managers greater freedom to manage
(Pollitt et al., 2004). But as more and more such organizations came into existence govern-
ments began to realize that there were both coordination problems (getting many different
public sector organizations cooperatively to pursue the same overall policy objective) and
problems of political accountability (the arm’s length agencies were harder for ministers to
control, but in most cases, if they did unpopular things, it was still ministers who got the
blame from the media and the public). For these reasons, therefore, ‘strategy’, ‘joining up’,
and ‘inter-service coordination’ all rose up political agendas.
Another slogan that achieved very wide circulation was ‘e-government’. There was no
shortage of ideas about how the rapidly developing information technologies could
revolutionize public sector productivity, provide citizens with faster, better information
and access to services, and even usher in a new wave of participatory democracy. Govern-
ments inmany countries made large investments in new computer systems andweb-based
communications systems. Sometimes these did indeed bring substantial benefits, but
there were also many cases of spiralling costs and systems which under-performed or
failed to work altogether (Committee of Public Accounts, 2000; Dunleavy et al., 2006a;
OECD, 2005a). Whilst we will mention some of these projects as we go through the book,
and while there is no question but that developments in Information and Communica-
tions Technologies (ICTs) have been very important for governments, the point to make
here is that e-government is not a model in itself. Neither does it line up exclusively with
any one of the models mentioned in this chapter (NPM, networks, governance etc). In
effect, there are many versions of e-government: an e-government that reinforces tradi-
tional bureaucratic hierarchies, an e-government that facilitates the NPM, an e-govern-
ment that is designed to promote networking and wider concepts of governance. A great
deal depends on the particular context in which a given e-technology is introduced, with
what purposes, and so on (Bekkers and Homburg, 2005).
It is hard to know whether this shifting agenda—governance, partnerships, e-govern-
ment, and so on—constituted a ‘third wave’, or, if it did, quite how to characterize that
wave. (Indeed, it should be emphasized that writing in terms of ‘waves’ is no more than a
COMPARATIVE PUBLIC MANAGEMENT REFORM: THE KEY DEBATES 7
general heuristic—the detail of public sector reforms often turns out to be more like
geological sedimentation, where new layers overlie but do not replace or completely
wash away the previous layer.) Since the late 1990s, different commentators have favoured
very different emphases—some have given pride of place to ‘governance’, some to ‘net-
works and partnerships’, some to ‘transparency’ and ‘participation’, some use the general
term ‘post NPM’, and some just refer to ‘globalization’. Here we will simply make a very
brief note of some of these ‘big ideas’, continuing to a more detailed treatment of them
later in the book.
In addition to strategy and ‘joining up’, the late 1990s and early 2000s brought a rising
political awareness that governments appeared to be losing public trust. To some extent
politicians themselves exacerbated this by exploiting the ‘politics of fear’—playing on the
fear of terrorism, but also the fear of the collapse of the pensions system or the health care
system or some other key state system. The idea that this apparent loss of trust could be
restored by offering the public more transparent and responsive services began to appear
in speeches and official documents (although, as we shall see later, it is not clear at all that
trust in the political system can be restored by such an approach—Van de Walle et al.,
2008). Parallel to this—and related to it—this was also a time when many countries
adopted new freedom of information legislation. In 1986 only eleven countries had
freedom of information legislation, but by 2004 the number was fifty-nine (OECD,
2005b; Roberts, 2006).
Perhaps even more important, this was a period when ‘globalization’ became a subject
for widespread political and media discussion. This seemed to have major implications for
public administrations, for at least two reasons. First, governments needed to develop the
capacity to represent themselves effectively in the ever-expanding international networks
of international institutions (Held, 2004). The ‘Little Englander’ (or ‘Little German’ or
‘Little Australian’) option of just looking after one’s own domestic business and ignoring
international organizations and networks began to look more and more costly and unre-
alistic, even if some populist political fringe groups could still win attention by aspiring
to withdraw from the EU or the United Nations or whatever. Second, on the eco-
nomic front, governments, through their own efficiency or inefficiency, and through a
variety of regulatory arrangements, helped sustain—or handicap—national economic
competitiveness.
These different pressures each appeared to point towards reform in the basic machinery
of the state. Onemight even say that, as national governments became less dominant, and
less authoritative actors in their own territories (because of, inter alia, globalization,
decentralization, the rise of an active citizenry, and a more aggressive mass media), so
the spotlight fell even more harshly upon public management. Public management
became one of the most politically popular answers to a range of these challenges—here,
at least, was something ministers in national governments seemingly could fashion and
control—their own organizations and staff. When, in 2008, the world was suddenly
engulfed in a global financial and economic crisis, sure enough, public management was
soon to the fore. Politicians and other commentators in various countries demanded new
systems of national and international regulation for financial institutions. Ministers, who
had radically unbalanced public finances by using huge sums of public money to prop up
failing banks and commercial firms, were soon to be found promising that yet more
8 COMPARATIVE PUBLIC MANAGEMENT REFORM: THE KEY DEBATES
reforms would ensure that the now-necessary public spending cuts would focus on ‘waste’
and would not lead to real quality reductions in basic services such as education and
health care. Instead, even more ‘productivity’ would be squeezed out of services that, in
some cases, had already officially been raising productivity for the past quarter century.
After some months of this kind of rhetoric, however, it became increasingly clear that
‘waste-bashing’ and productivity improvement alone would not do the trick. These were
important components, but the sheer scale of expenditure reductions that were needed
meant that ‘real’ cuts in ‘real’ services were unavoidable (Pollitt, 2010a). By the autumn of
2010 there were large-scale demonstrations against public service cuts all over Europe.
Thus public management reform has come far from the dusty, technical, and legalistic
days of the 1950s. It has become a key element in many party manifestos, in many
countries. It has internationalized. It has acquired a body of doctrine, and a set of compet-
ing models and approaches. In short, it has ‘arrived’.
1.5 What has been the main direction of reform?
As indicated above, the period from the mid 1960s to the late 1970s is frequently regarded
as the golden age of planning. But our book begins its review from 1980, and by that time
the planners were already well in retreat. Neither Mrs Thatcher, the then British Prime
Minister 1979–89, nor Ronald Reagan, the US President 1980–8 were any friends of
planning. They, and many of their advisers, favoured a more ‘business-like’ approach.
Gradually, partly through doctrine and partly through trial and error, this general attitude
crystallized into a more specific set of recipes for public sector reform. By the early 1990s, a
number of influential commentators appeared to believe that there was one clear direc-
tion—at least in the anglophone world. This general direction was soon labelled as the
New Public Management (NPM) or (in the USA) Re-inventing Government (a seminal
article here was Hood, 1991). A pair of American management consultants, who wrote a
best-seller entitled Reinventing Government and then became advisers to the US vice presi-
dent on a major reform programme, were convinced that the changes they saw were part
of a global trend. They claimed that ‘entrepreneurial government’ (as they called it) was
both worldwide and ‘inevitable’ (Osborne and Gaebler, 1992, pp. 325–8). At about the
same time the financial secretary of the UK Treasury (a junior minister) made a speech
claiming that the UK was in the forefront of a global movement:
All around the world governments are recognising the opportunity to improve the quality and
effectiveness of the public sector. Privatisation, market testing and private finance are being used in
almost every developing country. Its not difficult to see why. (Dorrell, 1993)
The increasingly influential Public Management Committee of the OECD came out with a
series of publications that seemed to suggest that most of the developed world, at least,
was travelling along roughly the same road. This direction involved developing perfor-
mance management, introducing more competition to the public sector, offering quality
and choice to citizens, and strengthening the strategic, as opposed to the operational role
of the centre (see, e.g. OECD, 1995).
COMPARATIVE PUBLIC MANAGEMENT REFORM: THE KEY DEBATES 9
There have beenmany definitional disputes and ambiguities about exactly what the key
elements of this general direction were supposed to be: ‘There is now a substantial branch
industry in defining how NPM should be conceptualized and how NPM has changed’
(Dunleavy et al., 2006a, p. 96; see also Hood and Peters, 2004). For the purposes of this
book we will assume that the NPM is a two-level phenomenon. At the higher level, it is a
general theory or doctrine that the public sector can be improved by the importation of
business concepts, techniques, and values. This was very clearly seen, for example, when
the then US vice president personally endorsed a popular booklet entitled Businesslike
Government: Lessons Learned from America’s Best Companies (Gore, 1997). Then, at the more
mundane level, NPM is a bundle of specific concepts and practices, including:
� greater emphasis on ‘performance’, especially through the measurement of outputs
� a preference for lean, flat, small, specialized (disaggregated) organizational forms over
large, multi-functional forms
� a widespread substitution of contracts for hierarchical relations as the principal coordi-
nating device
� a widespread injection of market-type mechanisms (MTMs) including competitive ten-
dering, public sector league tables, and performance-related pay
� an emphasis on treating service users as ‘customers’ and on the application of generic
quality improvement techniques such as Total Quality Management (TQM) (see Pollitt,
2003a, chapter 2)
Dunleavy et al. have usefully summarized this as ‘disaggregation + competition + incenti-
vization’ (Dunleavy et al., 2006a). However, it would be wrong to assume that this formula
was necessarily internally consistent. As a number of commentators have noted, there is
some tension between the different intellectual streams that feed into the NPM, particu-
larly between the economistic, principal-and-agent way of thinking, which is essentially
low trust, and the more managerial way of thinking which is more concerned with
leadership and innovation—and more trusting of the inherent creativity of staff, if only
they are properly led and motivated (Pollitt, 2003a, pp. 31–2). The former stream empha-
sizes the construction of rational systems of incentives and penalties to ‘make themanagers
manage’. The latter emphasizes the need to ‘let the managers manage’ by facilitating
creative leadership, entrepreneurship, and cultural change. Other writers have drawn a
distinction between ‘hard’ and ‘soft’ versions of NPM (Ferlie andGeraghty, 2005). The hard
version emphasizes control through measurement, rewards, and punishment, while the
soft prioritizes customer-orientation and quality, although nevertheless incorporating a
shift of control away from service professionals and towards managers. This seems to map
quite closely onto the low-trust/high-trust tensions mentioned above.
Consistent or not, the NPM was soon controversial. To begin with, it was perceived as
having cultural, ethical, and political features which did not ‘fit’ certain countries (partic-
ularly France, Germany, and the Mediterranean states). In France and in the European
Commission, for example, it was commonplace to hear NPM concepts disparagingly
referred to as ‘Anglo-Saxon ideas’. Furthermore, by the late 1990s it was coming under
increasing attack, even in those countries where it had started earliest and gone furthest
10 COMPARATIVE PUBLIC MANAGEMENT REFORM: THE KEY DEBATES
(i.e. Australia, New Zealand, the UK, and the USA). This did not mean that it suddenly
‘stopped’—not at all. Indeed NPM-type reforms are still going forward in quite a few
countries, even as this third edition is being written. But it did mean that other mod-
els—alternatives—were frequently being advocated and discussed, and that NPM reforms
themselves were no longer seen as the solution to a wide range of public sector problems.
As noted above, there was a ‘third wave’ of ideas, which embraced the concepts of
globalization, governance, networks, partnerships, transparency, and trust.
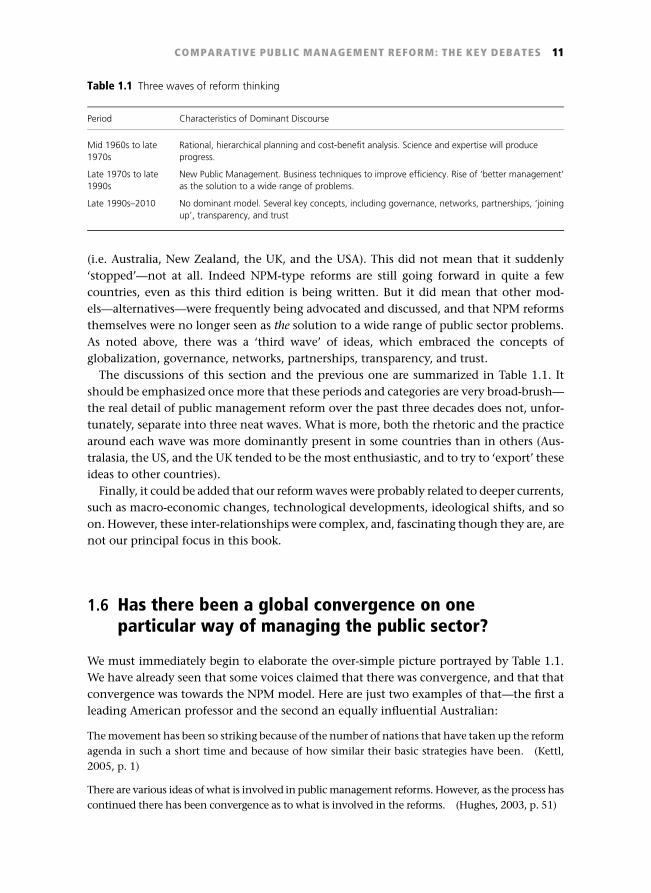
The discussions of this section and the previous one are summarized in Table 1.1. It
should be emphasized once more that these periods and categories are very broad-brush—
the real detail of public management reform over the past three decades does not, unfor-
tunately, separate into three neat waves. What is more, both the rhetoric and the practice
around each wave was more dominantly present in some countries than in others (Aus-
tralasia, the US, and the UK tended to be the most enthusiastic, and to try to ‘export’ these
ideas to other countries).
Finally, it could be added that our reformwaves were probably related to deeper currents,
such as macro-economic changes, technological developments, ideological shifts, and so
on. However, these inter-relationships were complex, and, fascinating though they are, are
not our principal focus in this book.
1.6 Has there been a global convergence on oneparticular way of managing the public sector?
We must immediately begin to elaborate the over-simple picture portrayed by Table 1.1.
We have already seen that some voices claimed that there was convergence, and that that
convergence was towards the NPM model. Here are just two examples of that—the first a
leading American professor and the second an equally influential Australian:
Themovement has been so striking because of the number of nations that have taken up the reform
agenda in such a short time and because of how similar their basic strategies have been. (Kettl,
2005, p. 1)
There are various ideas of what is involved in publicmanagement reforms. However, as the process has
continued there has been convergence as to what is involved in the reforms. (Hughes, 2003, p. 51)
Table 1.1 Three waves of reform thinking
Period Characteristics of Dominant Discourse
Mid 1960s to late
1970s
Rational, hierarchical planning and cost-benefit analysis. Science and expertise will produce
progress.
Late 1970s to late
1990s
New Public Management. Business techniques to improve efficiency. Rise of ‘better management’
as the solution to a wide range of problems.
Late 1990s–2010 No dominant model. Several key concepts, including governance, networks, partnerships, ‘joining
up’, transparency, and trust
COMPARATIVE PUBLIC MANAGEMENT REFORM: THE KEY DEBATES 11
Yet this was far from a universal view. One group argued that NPM had not delivered what
it promised, and they will be dealt with in the next subsection. More pertinently here,
another group brought forward a more subtle argument—that the ‘reach’ and penetration
of NPM ideas had been greatly exaggerated, especially by the early enthusiasts such as
Osborne and Gaebler. This developed into quite an extensive scholarly argument about
what was the real degree of ‘convergence’ in public management reforms, internationally.
Were all countries heading in the same direction and, if not, was there some other sort of
pattern? We (Pollitt and Bouckaert) cannot claim to be neutral bystanders in this debate
because, both in previous editions of this book and in other works, we have argued that
there has been an undue focus on NPM, and this has missed a lot of other reforms and
combinations of reforms that have been launched. In the Mediterranean countries, for
example, while there have been some NPM elements, a focus on them alone gives a very
distorted picture of what has been going on over the last quarter century (see Ongaro,
2009). A plausible case can also be made for the idea that the countries with strong
Napoleonic traditions were busy with other kinds of reform and attempted reform, and
only followed the NPM in limited and selective ways (Kickert, 2007). In Germany, while
some NPM-type reforms certainly took place in subnational governments, the federal
government has never adopted NPM on a large scale (Bach et al., 2010; Jann et al., 2006;
Wollmann, 2001). And even right next door to the UK, in Belgium, the NPM ‘flavour’ has
been quite weak (Brans and Hondeghem, 2005; Broucker et al., 2010; Pollitt and Bouck-
aert, 2009). In short, national histories and characteristic national patterns of institutions
have had a tremendous influence (Lynn, 2006). We will see muchmore of this variety later
in the book.
Another important point—and another one that adds to the complexity of the picture—
is that even where a particular newmodel is adopted, it is rather unlikely that it will simply
replace all previous ideas and practices. In public management reform, new brooms hardly
ever sweep entirely clean. Rather they shift some of the dust away but then deposit new
dust on top of remaining traces of the old. Overall:
Defining periods in the evolution of any complex system, such as public management systems in
advanced industrial countries, is a tricky task. New developments accrete and accumulate while
older trends are still playing out and apparently flourishing. (Dunleavy et al., 2006b, p. 468)
However, even if we accept that the true picture is far more varied than the convergence
enthusiasts suggest, we are left with the question of how and whymany leading academics
and politicians came to believe that ‘a similar process is underway throughout the devel-
oped world’ (Osborne and Gaebler, 1992, p. 325). We suggest there are several reasons, and
they are worth rehearsing here because they also function as general warnings about the
generic difficulties of international comparisons.
First, there is a language issue. All the leading NPM countries are predominantly anglo-
phone (Australia, New Zealand, the UK, and the USA). Much of the NPM literature has
been anglophone. Many politicians and academics from these countries listen and read
predominantly or exclusively anglophone sources. So it is easy to get an exaggerated
impression of how prevalent these types of reform are elsewhere in the world. (One
healthy development over the past decade or so is that the academic community discuss-
ing these issues has broadened so that we are hearing more and more from scholars in
12 COMPARATIVE PUBLIC MANAGEMENT REFORM: THE KEY DEBATES
countries such as Brazil, China, Italy, Japan, Korea, Mexico, or Spain—who can speak
English even if the mother-tongue anglophones can only occasionally speak their
languages.)
Second, individuals from these same anglophone countries seem to have been able to
colonize key positions in the main international agencies that ‘spread the word’ about
what was going on—especially the OECD and the World Bank. The influence of these
agencies was wide: it was not just the ‘Anglo-Saxon’ states where they got a favourable
hearing, but, eventually, such initially resistant administrations as France (Bezes, 2010)
and Norway (Christensen et al., 2007, pp. 28–30).
Third, there is a major issue about the types of evidence employed in the debate. As we
will see in the next section (and throughout the book) there aremany gaps, diversions, and
outright failures that stand between the announcement of a reform policy and the success-
ful implementation of that policy. In fact in the public management field it is very common
for officially announced reforms only partly to reach their objectives, or to fade away
altogether. Some scholars have even shown a pattern where essentially the same rational-
istic, performance-oriented reform is introduced over and over again, despite the fact that
it never seems to work remotely as originally hoped and declared (Brunsson, 2006;
Sundstr€om, 2006). However, if we quickly scan the web or the newspapers, most of the
information we find is about reforms which are being debated or which have recently been
adopted and announced. There is much less information in these sources to tell us exactly
how the reforms have been implemented—how widely and with what degrees of
measured success. (Chapter 5 deals at length with this whole problem of defining and
assessing ‘results’.) One of us has written about this (Pollitt, 2002), suggesting that the life
of a reform can be divided into stages, and that at each stage the challenge of research is
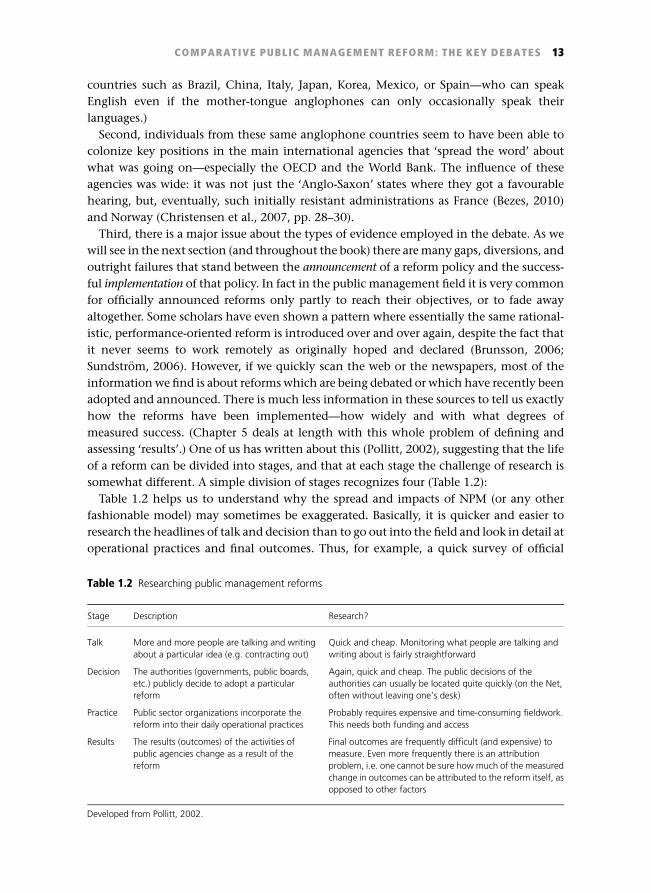
somewhat different. A simple division of stages recognizes four (Table 1.2):
Table 1.2 helps us to understand why the spread and impacts of NPM (or any other
fashionable model) may sometimes be exaggerated. Basically, it is quicker and easier to
research the headlines of talk and decision than to go out into the field and look in detail at
operational practices and final outcomes. Thus, for example, a quick survey of official
Table 1.2 Researching public management reforms
Stage Description Research?
Talk More and more people are talking and writing
about a particular idea (e.g. contracting out)
Quick and cheap. Monitoring what people are talking and
writing about is fairly straightforward
Decision The authorities (governments, public boards,
etc.) publicly decide to adopt a particular
reform
Again, quick and cheap. The public decisions of the
authorities can usually be located quite quickly (on the Net,
often without leaving one’s desk)
Practice Public sector organizations incorporate the
reform into their daily operational practices
Probably requires expensive and time-consuming fieldwork.
This needs both funding and access
Results The results (outcomes) of the activities of
public agencies change as a result of the
reform
Final outcomes are frequently difficult (and expensive) to
measure. Even more frequently there is an attribution
problem, i.e. one cannot be sure howmuch of the measured
change in outcomes can be attributed to the reform itself, as
opposed to other factors
Developed from Pollitt, 2002.
COMPARATIVE PUBLIC MANAGEMENT REFORM: THE KEY DEBATES 13
documentation shows that executive agencies in the UK, Sweden, Finland, and the
Netherlands all have performance indicator systems. This could be seen as an example
of convergence, with a strong NPM flavour (performance measurement and results-ori-
entedmanagement are central planks in the NPMmodel). What detailed fieldwork reveals,
however, is that these indicators are used in very different ways and with different con-
sequences in the four countries (Pollitt et al., 2004). Before leaving this point we should
note that the Talk-Decision-Practice-Results framework has several implications for com-
parative analysis. Inter alia it suggests that we should try to compare like with like
(decisions with decisions, or results with results). Comparing (say) talk and decisions in
country A with practice in country B is potentially misleading (and unfair).
Fourth, there has almost certainly been a kind of ‘multiplier’ effect. That is, as attention
has focused on business-derived NPM reforms, a community has grown up in whose
interests it is to create new ideas and techniques, and therefore further reform. There is
nothing necessarily sinister about this, even if it can often be construed as a form of self-
interest. It is simply that more and more people take up public sector roles after some
training in ‘management’, and more and more consultancies depend on winning and
subsequently sustaining contracts to facilitate reform. For example, the UK public sector
spent approximately ₤2.8 billion on consultants in 2005–6, a 33 per cent increase on what
the level had been only two years previously—in fact central government spent more on
consultants per employee than did comparator private sector firms! (National Audit Office,
2006, pp. 5 and 15).
Furthermore, individuals increasingly move between different management roles—
as practising managers, as consultants, as academics, or as contributors to the now-
extensive specialist media concerned with communicating management ideas (Sahlin-
Andersson and Engwall, 2002, pp. 14–19). More andmore governments have set up one or
more specialist management reform units, such as the Prime Minister’s Public Service
Delivery Unit (UK), the Public Management Department of the Finnish Ministry of
Finance, the French Directorate General for State Modernization, the Norwegian Ministry
of Government Administration and Reform, and so on. Members of these organizations
may themselves have consultancy experience or they may become consultants afterwards,
trading on their experience gained near the heart of government reforms. More pro-
foundly, these units and departments help to institutionalize ‘modernization’ and
‘reform’, continually putting forward programmes and targets, drawing attention to new
management ideas and techniques and generally keeping the rest of central government
‘on its toes’ (for a vivid account of how intrusive this can become, see Barber, 2007). As we
said at the beginning of this chapter, a real community has emerged, complete with its
own terminology, doctrines, procedures, and networks. And, more often than not, these
‘communities of discourse’ have been heavily influenced by NPM ideas (again, see Barber,
2007, where the Head of the Prime Minister’s Delivery Unit strongly criticizes the tradi-
tional public service professions, but praises inspirational, generic business-school texts
such as John Kotter’s Leading Change (Kotter, 1996)).
For all these reasons, therefore, there has been a tendency to over-concentrate on the
NPM. This is not an attempt to argue that NPM is not important—clearly NPM ideas have
achieved a very wide international spread, and have directly inspired many reforms in
many countries. But they have not been universal—the idea of a global trend, at least in
14 COMPARATIVE PUBLIC MANAGEMENT REFORM: THE KEY DEBATES
its strong form, is something of a mirage—and neither has the NPM been the only kind of
reform that was going on (even in those countries that were NPM-intensive, like New
Zealand and the UK, but especially in those countries that only borrowed from the NPM
toolkit cautiously and selectively, like Finland, France, or Japan).
1.7 Internationally, how successful has theNew Public Management (NPM) been?
Elements of the NPM have been widespread, but have they worked? There is no straight-
forward ‘yes’ or ‘no’ answer to this, partly because many policymakers (and some scholars)
start from a strong normative commitment either pro- or anti-NPM, and they are never
likely to agree with each other. However, that is far from being the only reason. It is also the
case that it is very difficult systematically to evaluate large-scale public management
reforms (and in quite a few cases the governments concerned have not been all that
interested in scientific evaluation anyway) (Pollitt, 1995; Wollmann, 2003; Pollitt, 2009).
We will spend a little time briefly summarizing why this is so difficult, before moving on to
look at what ‘results’ have nevertheless been observed.
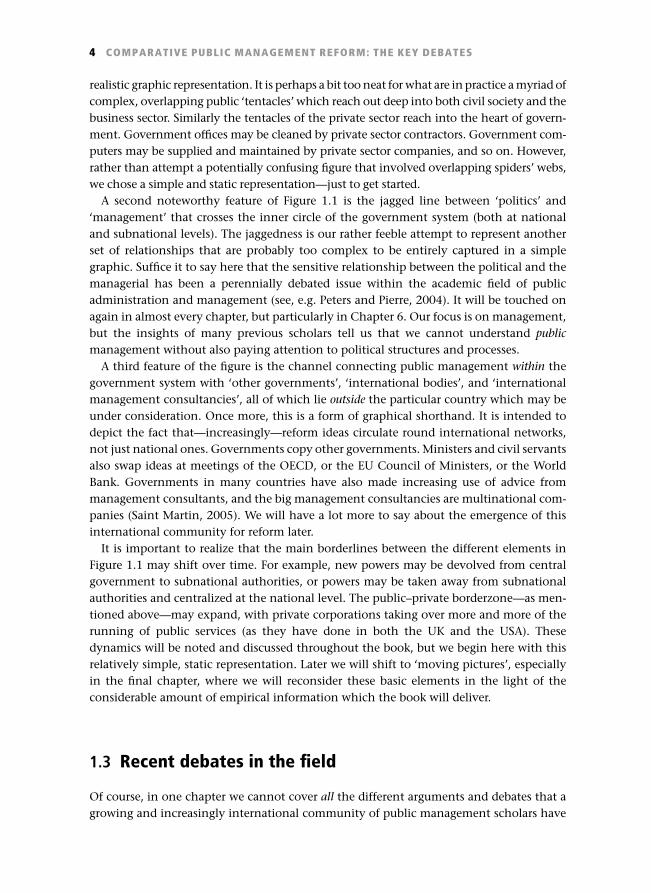
To examine reforms and their results, we first need some kind of conceptual framework.
Therefore we detour from our main story here in order to introduce a fairly orthodox
framework within which to discuss ‘performance’—see Figure 1.2.
In the figure, terms such as ‘efficiency’ and ‘effectiveness’ are given fairly specific mean-
ings, whereas readers should be warned that in ‘real-life’ reform talk they are frequently
used in loose, vague, and/or inconsistent ways. Thus, for us, efficiency is the ratio between
inputs and outputs, whereas effectiveness is the degree to which the desired outcomes
result from the outputs. For example, if lessons are delivered (outputs), do the students
actually learn (outcomes)? Note that it is therefore perfectly possible for a given policy to
increase efficiency while decreasing effectiveness, or vice versa. For example, a new
approach to managing hospital operating theatres may increase the rate at which a partic-
ular surgical procedure is carried out (greater efficiency) but in doing so lead to more
mistakes being made by doctors and nurses, so that the effectiveness of the operations
falls (the clinical outcomes deteriorate). Or, more commonly perhaps, there may be an
improvement in efficiency (police check more alcohol licences per month), but no change
in the outcomes (levels of teenage drunkenness remain the same). An example of increas-
ing effectiveness whilst decreasing efficiency would be if a university replaced a retiring
group of run-of-the-mill professors with highly paid top rank international ‘stars’. Students
might learn more, and research outcomes might improve (both measures of outcome) but
the cost per student would go up (and therefore efficiency would go down) because of the
higher salaries demanded by the new super-professors.
Some would object to this framework on the grounds that it is over-rationalistic.
It assumes, for example, that socio-economic problems are addressed by distinct
programmes which have discernible objectives (against which effectiveness can subse-
quently be measured). But sometimes, such critics might point out, policies exist
COMPARATIVE PUBLIC MANAGEMENT REFORM: THE KEY DEBATES 15
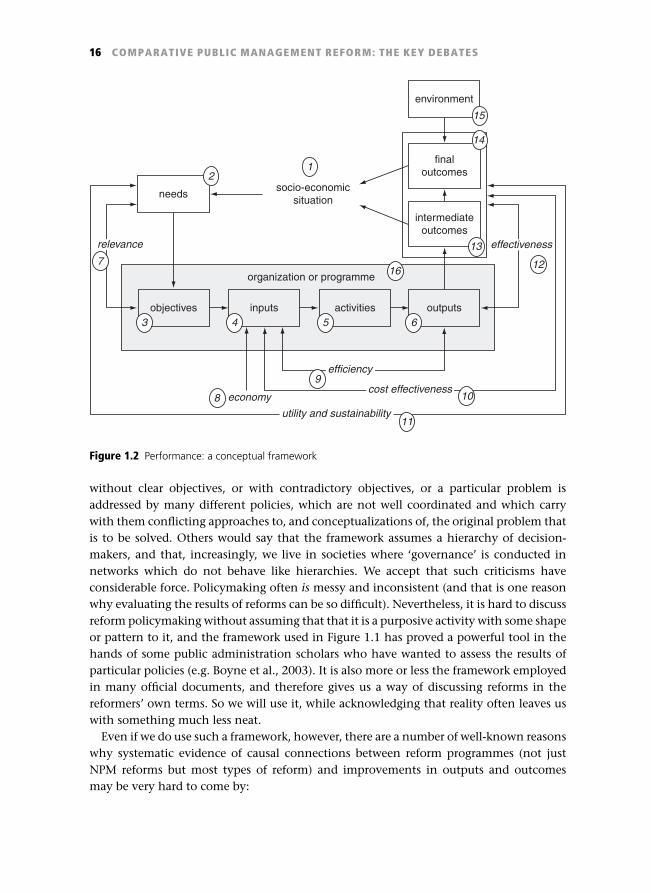
without clear objectives, or with contradictory objectives, or a particular problem is
addressed by many different policies, which are not well coordinated and which carry
with them conflicting approaches to, and conceptualizations of, the original problem that
is to be solved. Others would say that the framework assumes a hierarchy of decision-
makers, and that, increasingly, we live in societies where ‘governance’ is conducted in
networks which do not behave like hierarchies. We accept that such criticisms have
considerable force. Policymaking often is messy and inconsistent (and that is one reason
why evaluating the results of reforms can be so difficult). Nevertheless, it is hard to discuss
reform policymaking without assuming that that it is a purposive activity with some shape
or pattern to it, and the framework used in Figure 1.1 has proved a powerful tool in the
hands of some public administration scholars who have wanted to assess the results of
particular policies (e.g. Boyne et al., 2003). It is also more or less the framework employed
in many official documents, and therefore gives us a way of discussing reforms in the
reformers’ own terms. So we will use it, while acknowledging that reality often leaves us
with something much less neat.
Even if we do use such a framework, however, there are a number of well-known reasons
why systematic evidence of causal connections between reform programmes (not just
NPM reforms but most types of reform) and improvements in outputs and outcomes
may be very hard to come by:
21
7
3 4 5 6
9
8
11
10
12
13
15
14
16
needs
objectives inputs outputs
environment
finaloutcomes
intermediateoutcomes
activities
organization or programme
socio-economicsituation
relevance
economy
efficiency
cost effectiveness
utility and sustainability
effectiveness
Figure 1.2 Performance: a conceptual framework
16 COMPARATIVE PUBLIC MANAGEMENT REFORM: THE KEY DEBATES
� Changes in organizational structures are frequently a central feature of public manage-
ment reforms, but usually such changes are connected to outputs and outcomes only by
quite long causal chains. For example, a function is taken out of a department andmade
into an executive agency. A new topmanagement is introduced. Performance targets are
set up. Management appraisals are geared to the achievement of these targets. New
working methods are introduced. Staff are reassigned. New training is conducted.
Measured performance improves. But would that have happened anyway, even if the
first and/or second steps in this process had been absent? What is it among all these
changes which is actually producing the improved results—all these things or only one
or two of them? Reforms themselves are thus typically multi-faceted, so that there is
always a question of which elements are working and which are not.
� Different stakeholders may take very different views of both the justifications and
meanings of the reforms, and even of their results (see, e.g. Hartley et al., 2008).
Even in an ideal world—where policymakers had a strong commitment to feedback and
evaluation—the two aforesaid difficulties would apply. But in the real world such a
commitment is quite rare, and there are therefore other issues which prevent the observer
getting a clear picture of the precise results of particular reforms. For example:
� There may be no evaluations at all, because the new reform is politically sensitive and its
promoters want to drive forward, minimizing the possibility of critical comment, and
resulting doubts, distractions, and delays. When Mrs Thatcher’s administration intro-
ducedaninternalmarket totheNationalHealthService (NHS) from1989, thegovernment
was initially opposed to any official evaluation of this huge reform (although someuseful
academic evaluationsweremountedpost hoc). Similarly,whenPresidentGeorgeW.Bush
created the vast newDepartment of Homeland Security, no official evaluation was put in
place. Indeed, theUSCongresshasa longrecordof launchingreorganizations for symbolic
reasons and then quickly losing interest in the operational consequences (Kettl, 2009).
� In bothpractical andpolitical terms a reversal of a reorganization is just not feasible, so any
idea that a negative summative evaluation will result in a change back to what was there
before is unrealistic. The reorganization has already created a de facto new reality, which
lessens the room formanoeuvre for the evaluators. Themost theymay be able to do is offer
a formative-type evaluation which helps the existing management cope better.
� Evaluations are often put into place too late, so that they can have no clear view of the
baseline performance, prior to the reform (as was the case with the academic evaluations
of the UK National Health Service internal-market reform).
� An evaluation is set up, but before it can be completed, policy has moved on again—
policymakers can’t wait for the full set of results (Walker, 2001).
Finally, it is important to note that virtually all the constraints and barriers noted above
apply not just to NPM-type reforms, but to large-scale reforms in general. We will see later
that evidence for the success of ‘network’ and ‘governance’-type reforms is just as hard—or
harder—to interpret as that pertaining to the NPM.
This has been quite a lengthy—and gloomy—detour into the problems of evaluating
management reform. Fortunately, despite these difficulties we do know something about
COMPARATIVE PUBLIC MANAGEMENT REFORM: THE KEY DEBATES 17
the results of reform. There have been a number of reasonably rigorous studies which have
identified attributable changes in outputs and outcomes. Most of these have concerned
specific reforms rather than broad programmes of reform, and some of have identified
clear improvements—for example, studies of US federal public procurement (Kelman,
2005) or human resource management (Thompson and Rainey, 2003) or British educa-
tional programmes for pre-school children from socially disadvantaged localities (BBK
NESS site, 2009). Then there are a few studies which have tried to get a bigger picture,
such as the series of studies by Boyne and his partners at Cardiff. In one of these, the
conclusion was reached that the NPM reforms of the 1980s and 1990s in UK education,
health care, and housing had a) raised efficiency, b) improved responsiveness to service
users, but c) reduced equity (Boyne et al., 2003). Exactly why these impacts followed from
the reforms was less clear—understandably there tends to be something of a trade-off
between the breadth of evaluations (Boynes’ was wide) and the degree to which the
researcher is able to trace the precise processes and mechanisms that have produced the
apparent outcomes. We will revisit some of these tricky issues in Chapter 5, which directly
addresses the question of the results of reform.
Themultiple difficulties in pinning down the effects of publicmanagement reforms do not
seem to have deterred both practitioners and academics from trying to come up with indices
of success. On the contrary—the period since the late 1990s has seen a veritable explosion of
comparative, international indicators of ‘good governance’, ‘bureaucratic quality’, ‘transpar-
ency’, ‘e-government’, and other aspects of modernization (see, e.g. Accenture, 2008; Advi-
sory Group on Reform of Australian Government Administration, 2009). This has begun to
attract a good deal of academic attention—for example, in 2008 the International Public
Management Journal ran a special theme issue on ‘ranking and rating public services’, and
other publications have also begun to appear (Dixon et al., 2008; see also Pollitt, 2010b). For
themomentwewill simply note that these international league tables have in some instances
become quite influential (governments are embarrassed when their government sinks down
the table, and implement programmes to raise their scores), and that they provide useful
examplesofwhat is involved, conceptually, empiricallyandpractically in trying to summarize
the ‘success’ or ‘failure’ of whole governments.Wewill return to international league tables at
various points in the book, but especially in Chapter 5 (‘Results’).
1.8 What other models—apart from theNPM—have been influential?
There has been no shortage of models. From governments we have heard of various
national formulations—the ‘New Zealand model’ (Boston et al., 1996), the Canadian ‘La
Releve’ (Bourgon, 1998), the Belgian ‘Copernicus’ model (Hondeghem and Depr�e, 2005),
and the German ‘slim state’ (Sachverst€andigenrat ‘Schlanker Staat’, 1997). We need not—
indeed cannot—go into all these here, but it is worth noting that governments seem to like
to have their own variant, both internally, to show their domestic originality and
18 COMPARATIVE PUBLIC MANAGEMENT REFORM: THE KEY DEBATES
uniqueness, and sometimes externally, as a ‘product’ to be marketed on the international
marketplace for public management reforms.
Alongside governments, academics have also been fruitful in their invention of new
models. We have publications which discuss the Napoleonic model (Ongaro, 2009), the
Neo-Weberian State (NWS—Drechsler and Kattel, 2008; Lynn, 2008), the French model
(Bartoli, 2008), and theNordicmodel (Veggeland, 2007). TheNordicmodel, for example, is
said to put ‘heavy weight on government and public solutions and interventionist mea-
sures. Universal welfare and social security arrangements with high public expenses are
basic welfare principles, and tariffs and a high degree of job security dominate labormarket
relations’ (Veggeland, 2007, pp. 121–2). Most of these models have established themselves
in the anglophone literature by first distinguishing themselves from what they take to be
the ‘Anglo-Saxon model’, which is itself usually a version of the NPM. Veggeland, for
instance, characterizes the Anglo-Saxon model (in contrast to his favoured Nordic one) as
putting weight on market solutions, low public expenses, and limited government. More
general models offered by academics searching for ‘the next big thing’ include Digital-Era
Governance (DEG) (Dunleavy et al., 2006b) and the New Public Governance (NPG—
Osborne, 2010). Our own suggestion, in the previous edition of this book, was of the
Neo-Weberian state (NWS). In essence, this was an attempt to modernize traditional
bureaucracy by making it more professional, efficient, and citizen-friendly. It was particu-
larly characteristic of the stable, prosperous, Western European democracies which had
sizeable welfare states—including Germany, France, and the Nordic group. It was therefore
not a universal model, but one limited to particular kinds of state. It reflected a more
optimistic and trusting attitude towards the state apparatus than the NPM. The NWS will
be one of the three high-level models we refer to throughout the book, the other two being
the NPM and the NPG. These three models are helpful in organizing large quantities of
empirical material, and we will come back to them shortly (sections 1.9 and 1.10).
The attempt to establish reformmodels and trends has overlapped with scholarly efforts
to identify administrative ‘traditions’, and to showhow these have influenced reforms (and
sometimes absorbed or defeated them). One recent work identified, inter alia, Anglo-
American, Napoleonic, Germanic, and Scandinavian traditions (Painter and Peters,
2010). These traditions are, in a sense, another kind of big model—they are the models of
the past, still built into institutional structures, procedures, and ways of thinking.
We do not have the space to go into each of these national or regional models, or
traditions, here (although we will refer to some of their features when dealing with specific
countries in later chapters). We do, however, need to take a closer look at some of the
broader academic models which have been advanced—models which describe, not partic-
ular countries, but larger features of the organizational ensemble which constitutes the
public sector. Two of these have been especially popular—networks and governance. The
next two sections introduce them.
COMPARATIVE PUBLIC MANAGEMENT REFORM: THE KEY DEBATES 19
1.9 Networks
Since the early 1990s a huge literature on ‘networks’ has sprung up. It stretches far beyond
our field of public management, but within that field has spawnedmany new publications
and debates (for overviews, see Klijn, 2005 and Agranoff, 2007; for a much-cited applica-
tion see Milward and Provan, 2000). A father figure in this is the social theorist Manuel
Castells who in 1996 published a hugely influential book entitled The Rise of the Network
Society (for an updated edition, see Castells, 2010).
Again, this is not the place to go into the (endless) details of the academic discourse on
networks in public administration, but it is important to see how, in general terms, this
upsurge of scholarship relates to the arguments over the NPM and convergence. Most
commonly, network theorists present the network form as something which is growing,
because it is flexible and fits well with the increased complexity (as they see it) of the
modern world. Networks are said to have properties which make them superior to both
hierarchies and markets (the other two major organizational forms). Therefore networks
are an alternative to the NPM, which is itself a mixture of hierarchies (the political and
managerial leaders declare strategies and set targets) and markets (units performing public
sector tasks are supposed to compete with one another, and individual staff compete for
performance pay bonuses). Indeed, in many network texts the replacement of hierarchies
by networks is made to sound almost inevitable:
Problems cannot be solved by organizations on their own. Hence, hierarchy as an organizing
principle has lost much of its meaning. The model of the ‘lonely organization’ that determines its
policy in isolation is obsolete. ( . . . ) Equally obsolete is the image of government at the apex of
societal pyramid. ( . . . ) Horizontal networks replace hierarchies. (Koppenjan and Klijn 2004: p. 3)
It would be wrong, however, to leave any impression that the ‘network model’ is novel,
clear, cut and dried. On the contrary, there are a range of definitions, some of them
conflicting (Pollitt and Hupe, 2011). Some claim that networks have to be self-organizing,
while others point out that, in reality, many networks are organized by one or two domi-
nant members. Others say that networks are essentially voluntary, yet some others argue
that membership of certain networks may be a practical necessity, if one’s organization is
going to survive. Many commentators suggest that networks are ‘horizontal’ and may
therefore be contrasted with bureaucratic hierarchies, but specific case studies have found
that there may be a strong ‘pecking order’ in some networks, with one player (often the
government) de facto ‘on top’ and calling the shots. Those with a sense of history point out
that networks, both formal and informal, are certainly not new (Pemberton, 2000). Gov-
ernments have often operated through networks, and it is not entirely clear whether the
growth of analysis of, and talk about, networks noted here represents a real underlying
growth of the form, or just an increase in interest in something that has been there for a
long time. The debate about networks is far from concluded.
20 COMPARATIVE PUBLIC MANAGEMENT REFORM: THE KEY DEBATES
1.10 What is the significance of the so-called shift fromgovernment to ‘governance’?
Since the late 1990s ‘governance’ has become an immensely popular term, with both
academics and practitioners. It appears in almost as many versions as there are authors
writing about it. A standard governance text (Pierre, 2000) opens with two experts offer-
ing, respectively, five and seven different meanings of the term (see Hirst 2000 and Rhodes
2000). Other authors speak of ‘hybrid governance’ (Hupe and Meijs 2000), and ‘opera-
tional governance’ (Hill and Hupe 2009), and ‘public sector governance’ (Australian Public
Service Commission, 2007), and ‘New Public Governance’ (Osborne, 2010). There are
many other varieties, including one that stresses the significance of changes in relation-
ships within government, and between governments and their citizens which are facili-
tated by contemporary ICTs—this one is termed ‘Digital-Era Governance’ by its inventors,
Dunleavy et al. (2006b). It is therefore understandable that Bovaird and L€offler (2003: 316)
describe the attempts to ‘fix’ the concept as like trying to ‘nail a pudding on the wall’. To be
charitable, there may be a rough common core residing in the notion that steering society
or making policy increasingly requires the active participation of a range of actors in
addition to government itself. This broad thought alone, however, is far from being
entirely new, and does not adequately explain the recent attractiveness of the term.
The concept of governance draws strength from its claim to represent a wider, more
inclusive concept than ‘government’ alone. Yet it is not an alternative to government,
because government remains as one of its principal constituent elements. From a gover-
nance standpoint, one ‘sees government as only one institution among many in a free
market society’ (Stivers 2009: 1095). The danger here is that the concept of governance is
made to appear to transcend previous tensions and contradictions, such as public versus
private, or bureaucracy versus market. Similarly, it may mask traditional social science
concerns with conflicting interests and logics. In a good deal of the writing about gover-
nance these conflicts are largely assumed away.
Good governance is said to entail the steering of society through networks and partner-
ships between governments, business corporations, and civil society associations. Thus it
is closely linked to the network model described in the previous section—indeed, one of
the foremost network theorists has more recently taken to writing about ‘governance
networks’ (Klijn, 2008). And the NPG model referred to in section 1.8 above is explicitly
connected to network theory (Osborne, 2010, p. 9). Thus it would be wrong to think of
‘governance’ as a model which has superseded and displaced the networkmodel—rather it
is a wider model which as to some extent absorbed the earlier—and continuing—work on
networks. A typical definition is the following:
Governance entails a move away from traditional hierarchical forms of organization and the
adoption of network forms. It also entails a revision of the relationship between the state and
civil society in a more participatory direction. Governance is finally said to be responsible
for shifting the emphasis away from statute law to more flexible forms of regulation and implemen-
tation. The state is thus claimed to be superseded by a ‘networked polity’ where authority is
COMPARATIVE PUBLIC MANAGEMENT REFORM: THE KEY DEBATES 21
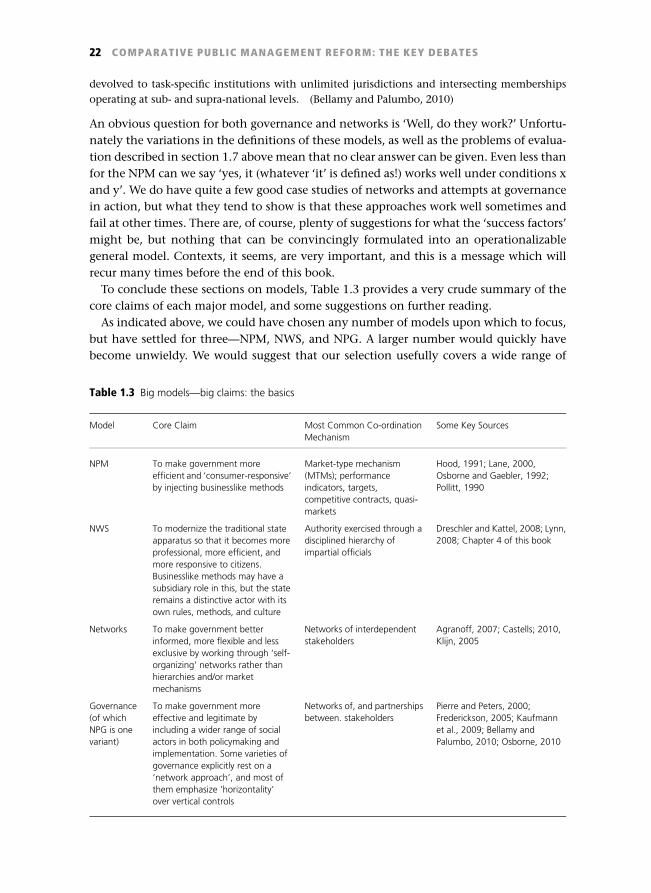
devolved to task-specific institutions with unlimited jurisdictions and intersecting memberships
operating at sub- and supra-national levels. (Bellamy and Palumbo, 2010)
An obvious question for both governance and networks is ‘Well, do they work?’ Unfortu-
nately the variations in the definitions of these models, as well as the problems of evalua-
tion described in section 1.7 above mean that no clear answer can be given. Even less than
for the NPM can we say ‘yes, it (whatever ‘it’ is defined as!) works well under conditions x
and y’. We do have quite a few good case studies of networks and attempts at governance
in action, but what they tend to show is that these approaches work well sometimes and
fail at other times. There are, of course, plenty of suggestions for what the ‘success factors’
might be, but nothing that can be convincingly formulated into an operationalizable
general model. Contexts, it seems, are very important, and this is a message which will
recur many times before the end of this book.
To conclude these sections on models, Table 1.3 provides a very crude summary of the
core claims of each major model, and some suggestions on further reading.
As indicated above, we could have chosen any number of models upon which to focus,
but have settled for three—NPM, NWS, and NPG. A larger number would quickly have
become unwieldy. We would suggest that our selection usefully covers a wide range of
Table 1.3 Big models—big claims: the basics
Model Core Claim Most Common Co-ordination
Mechanism
Some Key Sources
NPM To make government more
efficient and ‘consumer-responsive’
by injecting businesslike methods
Market-type mechanism
(MTMs); performance
indicators, targets,
competitive contracts, quasi-
markets
Hood, 1991; Lane, 2000,
Osborne and Gaebler, 1992;
Pollitt, 1990
NWS To modernize the traditional state
apparatus so that it becomes more
professional, more efficient, and
more responsive to citizens.
Businesslike methods may have a
subsidiary role in this, but the state
remains a distinctive actor with its
own rules, methods, and culture
Authority exercised through a
disciplined hierarchy of
impartial officials
Dreschler and Kattel, 2008; Lynn,
2008; Chapter 4 of this book
Networks To make government better
informed, more flexible and less
exclusive by working through ‘self-
organizing’ networks rather than
hierarchies and/or market
mechanisms
Networks of interdependent
stakeholders
Agranoff, 2007; Castells; 2010,
Klijn, 2005
Governance
(of which
NPG is one
variant)
To make government more
effective and legitimate by
including a wider range of social
actors in both policymaking and
implementation. Some varieties of
governance explicitly rest on a
‘network approach’, and most of
them emphasize ‘horizontality’
over vertical controls
Networks of, and partnerships
between. stakeholders
Pierre and Peters, 2000;
Frederickson, 2005; Kaufmann
et al., 2009; Bellamy and
Palumbo, 2010; Osborne, 2010
22 COMPARATIVE PUBLIC MANAGEMENT REFORM: THE KEY DEBATES
reform paradigms. In the NPM we have the original reaction against traditional bureau-
cracy and ‘big government’. The new model was to be business. Management was the key
skill. Markets and incentives were the key mechanisms. In the NWS we have a different
emphasis. Yes, the state apparatus requires modernization, but no, the world of business
does not hold all the answers. Traditional bureaucracy has virtues which should be
preserved (clear accountability, probity, predictability, continuity, close attention to the
law). The key is to find ways to combine these with more efficient procedures and a more
flexible and responsive stance towards the needs of an increasingly diverse citizenry.
Subsequently, the NPG attempted to move beyond the old arguments between the state
and business, and to show that complex modern societies could only be effectively
governed through complex networks of actors, drawn from government itself, the market
sector, and civil society. The emphasis was on networks, partnerships, and negotiated but
ultimately voluntary cooperation, not on competition (like the NPM) or enlightened and
professional hierarchies (like the NWS).
1.11 What kind of answers should we be lookingfor—models and menus?
Up to this point we have written as though the best way of describing and classifying what
has been going on internationally in public management reform is in terms of big, general
models—NPM, NWS, NPG, and so on. And it is true that many of the contributions to the
literature proceed in this way—they focus on how far NPM has gone in Norway compared
with New Zealand (Christensen and Lægried, 2001), or in Italy versus Flanders (Verschuere
and Barbieri, 2009), or they examine the compatibility of NPM reforms with the basic
assumptions and practices underying ‘Napoleonic’ types of regime (Ongaro, 2009). From a
comparative perspective this approach has a number of advantages, but it also carries risks.
One risk is that it may lead scholars to try to force the local details in country X into a pre-
set frame (more or less NPM, more or fewer Public–Private Partnerships—PPPs), whereas
perhaps the main significance of the changes in X is their relationship to something else,
perhaps something that has gone on before in that country or sector, and which is unique
to that country or sector. It may be that these big models are pitched at such a high level of
generality that they miss much of the significant detail and difference. If so, deeper
understanding of particular reforms may come from viewing them within a more specific,
detailed story within a specific country or small group of countries. Better explanations
may be generated by looking at particular contextual factors (the balance between political
parties; the state of the budget; the nature of local cultural norms, and so on), than by
positing big international models driven by equally generic global trends.
The problem with local detail, of course, is that, however illuminating by itself, it is just
local detail. International comparison is not possible or meaningful unless some features
can be identified which are sufficiently common to be compared across boundaries.
There are various ways of doing this, but one way is to think in terms of specific
COMPARATIVE PUBLIC MANAGEMENT REFORM: THE KEY DEBATES 23
management tools or instruments. For example, one could think of the set of tools which
promote competitive behaviour in the public sector—such as contracting out, perfor-
mance-related pay, and indicator systems that produce public ‘league tables’ of schools
or hospitals or freedom of information legislation. (Notice that these are not real tools—
you can’t pick them up and bang them on the table—they are ideas, portable assemblies of
concepts, formalized practices, and assumptions about how to do things. Nevertheless,
they appear to be more specific and operationally definable than the big models of NPM,
etc.) Or one could consider the set of tools which are supposed to enhance public service
quality, such as TQM, the Common Assessment Framework (CAF), or minimum standard
setting in health care or education (accident and emergency patients will all be seen within
thirty minutes; each child in class will spend so many minutes per week reading aloud to
the teacher, and so on). Looking at specific tools and techniques like this clearly leads to
analysis at a ‘lower’ (more detailed and specific) level than focusing exclusively on the big
models. Yet it can still be used in a comparative way—we can ask what percentage of public
sector organizations in a given country or sector use a given technique, or group of
techniques, and we can also go deeper and try to find out exactly how they are used. We
might term this a ‘menu’ approach, in the sense that we are asking what the menu of
reforms is in a particular country or jurisdiction or sector, and how and why menus differ
in different times and places. In this vocabulary the particular tools are individual dishes/
plats, while the menu is an overall list of what is on the table. Notice that, like a menu in a
restaurant, there are different reasons why a dish may delight, or fail to satisfy. It could be
that the recipe itself is flawed. Or it could be that the chef is incompetent in putting
together the ingredients. Or it could even be that the dish is perfect, but the customer
comes from a different culinary culture, and just doesn’t like ‘that kind of thing’ (as when
the English throw up their hands at the idea of the French eating snails, or vegetarians
recoil from a traditional working-class dish of pig’s trotters). Furthermore, wemay imagine
that menus may be more or less coherent, in the sense that, for a given palate, some dishes
go better with others and some clash. Thus, a particular management tool may fit well
with others, or it may in some way contradict them or lessen their impact. Thus, for
example, a coherent NPM menu might include disaggregation of large, multi-purpose
organizations, competitive contracting out, performance measurement, performance-
related pay, business-style accruals accounting, and so on. Introducing, say, statutory
lifetime secure tenure for senior civil servants to this menu would create a tension because
it belongs to a different kind of model.
An important qualification here would be to say that, although particular management
tools do often belong to similar families (or coherentmenus) it should not be assumed that
each individual tool is exclusively associated with one model, and cannot be fitted into any
other. The connection is often looser than that. Thus, for example, performance measure-
ment may feature within an NPM approach, but it can also function—in a somewhat
different way—within a modernizing, NWS approach (e.g. Pollitt, 2006a). Figure 1.3
shows a selection of tools/dishes, and indicates that many of them do not have a one-to-
one relationship with one model/menu.
Thus Public–Private Partnerships (PPPs) feature in both the NPM and the NPG para-
digms. And contracting out is a main dish on the NPMmenu but can also be used as a side
dish (dotted line) within both the NWS and the NPG models. Performance measurement
24 COMPARATIVE PUBLIC MANAGEMENT REFORM: THE KEY DEBATES
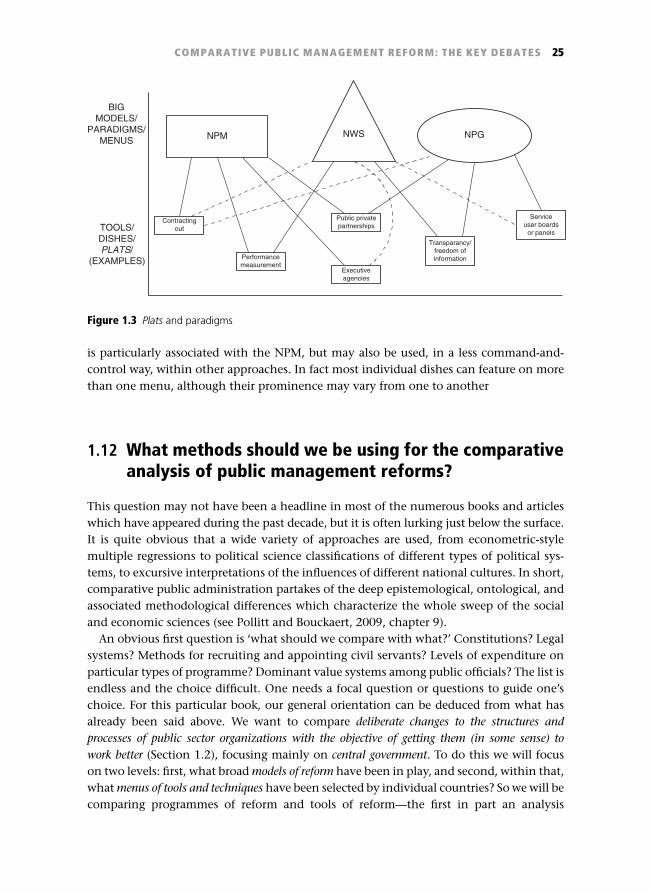
is particularly associated with the NPM, but may also be used, in a less command-and-
control way, within other approaches. In fact most individual dishes can feature on more
than one menu, although their prominence may vary from one to another
1.12 What methods should we be using for the comparativeanalysis of public management reforms?
This question may not have been a headline in most of the numerous books and articles
which have appeared during the past decade, but it is often lurking just below the surface.
It is quite obvious that a wide variety of approaches are used, from econometric-style
multiple regressions to political science classifications of different types of political sys-
tems, to excursive interpretations of the influences of different national cultures. In short,
comparative public administration partakes of the deep epistemological, ontological, and
associated methodological differences which characterize the whole sweep of the social
and economic sciences (see Pollitt and Bouckaert, 2009, chapter 9).
An obvious first question is ‘what should we compare with what?’ Constitutions? Legal
systems? Methods for recruiting and appointing civil servants? Levels of expenditure on
particular types of programme? Dominant value systems among public officials? The list is
endless and the choice difficult. One needs a focal question or questions to guide one’s
choice. For this particular book, our general orientation can be deduced from what has
already been said above. We want to compare deliberate changes to the structures and
processes of public sector organizations with the objective of getting them (in some sense) to
work better (Section 1.2), focusing mainly on central government. To do this we will focus
on two levels: first, what broadmodels of reform have been in play, and second, within that,
whatmenus of tools and techniques have been selected by individual countries? So we will be
comparing programmes of reform and tools of reform—the first in part an analysis
NPM NWS NPG
Contractingout
Performancemeasurement
Public privatepartnerships
Executiveagencies
Transparancy/freedom ofinformation
Serviceuser boards
or panels
BIGMODELS/
PARADIGMS/MENUS
TOOLS/DISHES/PLATS/
(EXAMPLES)
Figure 1.3 Plats and paradigms
COMPARATIVE PUBLIC MANAGEMENT REFORM: THE KEY DEBATES 25
of rhetoric (talk and decisions—see Table 1.2), the second an analysis of decisions and
practices (again see Table 1.2). On both levels we will look for patterns (groupings of
similarities or dissimilarities between countries). Can we see regional, or cultural, or
ideological groupings? We will also trace how these patterns may have changed over the
three decades which we study. (Cross sectional comparisons—snapshots at a single time—
although common, have considerable limitations for the study of public policy and
management, where big changes usually take years rather than weeks—Pollitt, 2008.)
Are there international trends, cycles, pendulum swings? One interesting question under-
lying this will be whether broad models, dominant in a particular country, can be
changed? Are the differences between (say) France and the UK fundamentally the same
as they were thirty years ago, or do we have cases where countries have been able to make
deep, planned changes to their ways of managing their public sectors? To read all the
books and articles on ‘transformation’, one might think that revolutions and break-
throughs were commonplace. General McChrystal (see the quotation at the head of this
chapter) may think that new systems of government can be rolled out in ‘in a box’, but
examples of the successful implementation of such schemes appear to be exceedingly rare.
The story we will tell shows things are usually rather more complicated than that.
However, this is not primarily a ‘theory and methods’ book: it is a book about what has
happened and why. Our strategy, therefore, has been to push on with the story/ies of
reformwhile occasionally bracketing issues of theory or method, so that readers can follow
them up if they need to. Theories and methods thus feature as a kind of intermittent
subtext (as has already been exemplified, for example, in the discussion of different views
of convergence in Section 1.7). More substantively, if the reader wishes to consult a brief
note on comparative methods as related to public management reform, s/he should look
at the first section of the Appendix.
1.13 What is the significance for public managementreform of the global economic crisis whichbegan in the second half of 2008?
The global economic downturn has plunged most of our twelve countries and their
governments into a new era—one of public-spending cutbacks and austerity. This con-
trasts with what were for many (but not all) the boom years of 1995–2007. Yet at the same
time the pressures for reform and improvement are no less than they were before—indeed,
these pressures may become even more intense.
Historically, the connection between public management reforms and episodes of
financial austerity has been a variable one. Over the past thirty years we can find several
episodes of financial austerity and many waves of public management reform, but the two
are not necessarily closely connected. Sometimes major reforms occur without any
precipitating financial crisis (as with the US National Performance Review under
President Clinton, or the reforms of the second term of the Blair administration in the
UK). But sometimes they clearly originate in such crises (as did the famous New Zealand
26 COMPARATIVE PUBLIC MANAGEMENT REFORM: THE KEY DEBATES
reforms of 1984–90). And sometimes financial crises are managed with straight ‘cutback
management’, but no fundamental system reforms.
In fact, the implications of financial austerity for management reform are ambiguous.
On the one hand, austerity makes reform more difficult, because reforms cannot be
lubricated with new money, and objectors and recalcitrants cannot be ‘bought off’. But
on the other hand, a sense of crisis can make it easier to consider radical options and more
fundamental changes than would otherwise get onto the agenda of feasibility.
Further, making sustained, aggregate savings in public spending is extremely hard to
achieve. The UK, for example, has undergone many, many rounds of ‘cuts’, but a scholarly
study indicated that only one—the so-called ‘Geddes Axe’ in the 1920s—seems to have
actually resulted in a sustained reduction in the level of public spending. Mrs Thatcher was
famous for the severity of her spending cuts, yet after six years in power her central
government current spending was higher than it had been a decade previously (Dunsire
and Hood, 1989). The current situation is one in which fiscal and political considerations
are in serious tension. The fiscal logic is tomake large cuts. The political logic is that cuts on
this scale are both profoundly unpopular (vote losers) and possibly beyond the limits of
political feasibility, especially for fragile regimes. At the time of writing we can see quite
large-scale public resistance—including public demonstrations—against the cuts in public
services which the international community is demanding from Greece as the price of a
large financial loan. It remains to be seen, in each country, which logic will win out.
Making cuts can be approached in different ways. One distinction is between cheese-
slicing approaches (‘everyone must cut back by 5%’) and more prioritized approaches (‘we
will reduce programmes X and Y because they are not very effective, but increase
programme Z because it is effective and is a high political priority’). Both can lead to
management reforms, but in different ways. With cheese slicing, operational managers
and professional-service deliverers are obliged to findways of reducing their budgets by the
3 per cent or 5 per cent, or whatever the decrement is determined to be. But these reform
adoptions are somewhat decentralized, and the central authorities are not themselves
choosing either which services are going to be winners and which losers, or exactly what
types of reform are to be implemented.
Cheese-slicing approaches are common, but have been relatively little researched. One
recent interesting piece of work suggests that—faced with a sudden percentage budget
reduction—local managers can be rather adaptable in protecting core activities and top
priorities through a variety of tactics (Meier and O’Toole, 2009). The authors stress,
however, that their research only applies to the short run, and that some of the actions
taken would become more damaging/less sustainable if (as seems to be the case now) the
cuts continue over a number of years.
In between the two poles of cheese slicing and strategic prioritization come strategies
that attempt to make efficiency savings. Each approach has its own advantages and
disadvantages; see, for example, Table 1.4.
In practice it is often possible to fashion strategies which combine features of all three
approaches. For example, ministers can decide that certain high-priority programmes
will be protected, but that outside those sectors cheese slicing should be imposed. Or
ministers may first decide to go for cheese slicing, then efficiency savings, and only later,
when the first two have not yielded enough, move on to the more ambitious setting of
COMPARATIVE PUBLIC MANAGEMENT REFORM: THE KEY DEBATES 27
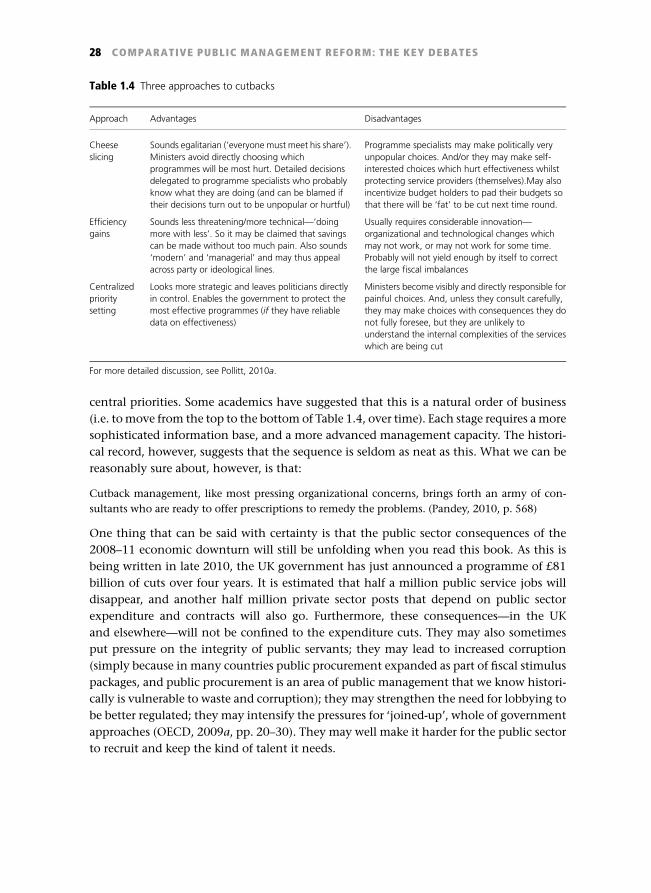
central priorities. Some academics have suggested that this is a natural order of business
(i.e. tomove from the top to the bottom of Table 1.4, over time). Each stage requires amore
sophisticated information base, and a more advanced management capacity. The histori-
cal record, however, suggests that the sequence is seldom as neat as this. What we can be
reasonably sure about, however, is that:
Cutback management, like most pressing organizational concerns, brings forth an army of con-
sultants who are ready to offer prescriptions to remedy the problems. (Pandey, 2010, p. 568)
One thing that can be said with certainty is that the public sector consequences of the
2008–11 economic downturn will still be unfolding when you read this book. As this is
being written in late 2010, the UK government has just announced a programme of £81
billion of cuts over four years. It is estimated that half a million public service jobs will
disappear, and another half million private sector posts that depend on public sector
expenditure and contracts will also go. Furthermore, these consequences—in the UK
and elsewhere—will not be confined to the expenditure cuts. They may also sometimes
put pressure on the integrity of public servants; they may lead to increased corruption
(simply because in many countries public procurement expanded as part of fiscal stimulus
packages, and public procurement is an area of public management that we know histori-
cally is vulnerable to waste and corruption); they may strengthen the need for lobbying to
be better regulated; they may intensify the pressures for ‘joined-up’, whole of government
approaches (OECD, 2009a, pp. 20–30). They may well make it harder for the public sector
to recruit and keep the kind of talent it needs.
Table 1.4 Three approaches to cutbacks
Approach Advantages Disadvantages
Cheese
slicing
Sounds egalitarian (‘everyone must meet his share’).
Ministers avoid directly choosing which
programmes will be most hurt. Detailed decisions
delegated to programme specialists who probably
know what they are doing (and can be blamed if
their decisions turn out to be unpopular or hurtful)
Programme specialists may make politically very
unpopular choices. And/or they may make self-
interested choices which hurt effectiveness whilst
protecting service providers (themselves).May also
incentivize budget holders to pad their budgets so
that there will be ‘fat’ to be cut next time round.
Efficiency
gains
Sounds less threatening/more technical—‘doing
more with less’. So it may be claimed that savings
can be made without too much pain. Also sounds
‘modern’ and ‘managerial’ and may thus appeal
across party or ideological lines.
Usually requires considerable innovation—
organizational and technological changes which
may not work, or may not work for some time.
Probably will not yield enough by itself to correct
the large fiscal imbalances
Centralized
priority
setting
Looks more strategic and leaves politicians directly
in control. Enables the government to protect the
most effective programmes (if they have reliable
data on effectiveness)
Ministers become visibly and directly responsible for
painful choices. And, unless they consult carefully,
they may make choices with consequences they do
not fully foresee, but they are unlikely to
understand the internal complexities of the services
which are being cut
For more detailed discussion, see Pollitt, 2010a.
28 COMPARATIVE PUBLIC MANAGEMENT REFORM: THE KEY DEBATES
1.14 Reflections and conclusions: managementreform caught between ‘is’ and ‘ought’
The debates referred to above have taken place in a mixed, increasingly multinational
community, consisting of academics, public servants, management consultants, and po-
liticians. It is therefore unsurprising that the reasons for becoming engaged with these
arguments have differed. Some participants want to find the best way forward—reforms
that will work to solve some real (or imagined) problems. Some want to justify a recent
choice of a new direction—to defend a new policy against attacks from the political
opposition or criticism from the media. Some wish to package and sell sets of ideas (‘best
practice’, ‘the reinvention model’, ‘World Governance Indicators’ etc.). Management
consultants, ‘experts’, and governments all do this (e.g. Federal Ministry of the Interior,
2006; Kaufmann et al., 2007; Osborne and Gaebler, 1992; Prime Minister and Minister for
the Cabinet Office, 1999). Some hope to sound progressive and look good at an election.
And some—mainly the academics—simply want accurately to describe and explain what
is happening or has happened in the world of reform.
This mixture of motives means that the dividing line between descriptive and analytical
(‘is’) statements and normative (‘ought’) statements is frequently hard to find. The desire
to understand and explain is often tangled up with the desire to promote and support a
particular kind of reform. Those reading the literature (which obviously includes those of
you who are reading this book) need to be especially sensitive to the likely interests of the
author(s), to unspoken assumptions, to the strength of evidence in relation to the size of
the claims being made, and so on. This is what used to be called ‘source criticism’, and it is
a vital technique for those who wish to investigate the literature on public management
reform. For example, a student who researched public management reform solely by
visiting government websites would be likely to come up with a picture of what was
going on that was both over-simple and over-optimistic. Even texts produced by aca-
demics cannot be assumed to be ‘neutral’, partly because many public management
academics also work in consultancy and advice roles, but also because the academic
world is itself divided between competing theoretical and methodological camps (Pollitt
and Bouckaert, 2009, chapter 9).
We can advocate source criticism and we can comment on the contested nature of the
literature, but of course we cannot ourselves entirely escape from this ongoing contest.
On the one hand we can assure readers that this book is not written to promote any
particular reform or to satisfy any particular ‘customer’. We have striven to be impartial,
and to look for good quality evidence from wherever we can find it. (This has meant, inter
alia, that in some places we have used evidence and ideas sourced from others in the
academic world with whom we differ over a range of issues. Nevertheless, if they have
interesting findings or insights, we gladly adopt them, even if there remain other the-
oretical or normative disagreements between us.) Our general stance is sceptical but (we
hope) appreciative of the sheer complexity and difficulty which reformers themselves
routinely face—and which academics who wish to understand what is going must also
grapple with. Yet despite these good intentions and despite our academic independence,
COMPARATIVE PUBLIC MANAGEMENT REFORM: THE KEY DEBATES 29
we cannot claim to sit atop Mt Olympus and offer a God’s-eye view of what has been
happening. To make any sense at all we have to employ some theories and conceptual
frameworks and methods and, as soon as we do that, we necessarily import particular
sorting devices that screen out some elements and screen in others. This process has
already begun—as we warned, our conceptual framework for assessing results (Figure
1.1, above) would be regarded as unduly rationalistic by some.
Thus, both material interests and theoretical perspectives greatly influence the kinds of
knowledge that are formed concerning public management reform. This is not a cause for
despair: it is simply a sign that this branch of knowledge is heavily engaged with the real
world, warts and all. After all, in most countries public management reform affects the
daily lives of most of the population. In many ways it is more important than
the ephemeral thrills and spills of ‘high politics’, because it may have direct impacts
on the enduring basics—education, health, crime, safety—things whose effects last far
longer than the transient personalities and slogans that so often occupy the headlines. In
this spirit, we welcome you to our attempt to make sense of the last thirty years of reform.
30 COMPARATIVE PUBLIC MANAGEMENT REFORM: THE KEY DEBATES
2 Problems and responses:a model of publicmanagement reform
Reform means change in a direction advocated by some groups or individuals. It does
not necessarily mean improvement.
(Rubin, 1992)
2.1 Why has there been so much reform?
Over the last three decades there appears to have been a huge amount of public manage-
ment reform. It is difficult to be certain—there are no readily available, common, and
commensurable units in which we can count and compare what has been happening. Yet
the present authors share, with many other commentators (e.g. Kettl, 2000; Christensen
and Lægreid, 2001; OECD, 2005b; Lynn, 2006), an impression of a wave of reforms across
many countries. Of course, there was also reform in earlier periods (see, e.g. K€onig, 1996,
pp. 44–5; Pollitt, 1984; Savoie, 1994; Bouckaert, 1994). However, the changes since 1980
have—in many countries—been distinguished by an international character and a degree
of political salience whichmark them out from themore parochial or technical changes of
the preceding quarter century. In some countries there have been deliberate attempts to
remodel the state. In many countries reform has been accompanied by large claims from
politicians to the effect that wholesale change, with sharp improvements in performance,
was both desirable and achievable. As we explained in the first chapter, there has been
more ‘hype’ about administrative change, in more countries, more or less simultaneously,
than ever before.
If this impression is even approximately correct, then one question must be ‘why?’
What are the forces driving the reformers?Why is it that, on the one hand,many countries
have participated in the stampede to remodel their public sectors while, on the other,
some have been much more cautious? How can we explain both the similarities and the
differences between what has happened in this country as compared with that? Chapter 1
offered a first, very brief, overview of these questions, but that was only to scratch the
surface. The development of more systematic answers will occupy much of this book. A
useful first step is to develop a general model of the process of management reform, and
that is the task we address in this chapter.
It is important tonote that this is a different kindofmodel from thosewe introduced in the
previous chapter (NPM, NWS, NPG, etc.). They are usually presented either as normative
models of desired states (objectives to be achieved) or as models of reform processes that are
under way (thus, many commentators have claimed that actual reform paths are shifting
fromNPM toNPG). Themodel we are about to outline here is not of that type. It is a general
model of how and why public management reform takes place. It is entirely agnostic as to
what current trends are or where things should be going. It simply models the forces and
influences affecting reformers, be they believers in NPM, NPG, or a flat Earth.
2.2 A model of public management reform
The model we will propose is intended as a first approximation. Its purpose is to provide a
framework for subsequent discussion by depicting the broad forces which have been at
work in both driving and restraining change. A model such as this is a conceptual map, a
diagram of forces, and a heuristic device. From it and within it we can develop more
detailed sets of typologies and more specific theories which will classify and explain
specific patterns and trends, both within individual countries and across groups of
countries. The model is therefore a way of learning—as anyone attempting to draw even
a simple diagram of the influences on reform will quickly discover for themselves. It will
also serve to structure a lot of the empirical material which we subsequently introduce (e.g.
in the country cases in Appendix B).
Figure 2.1 shows ourmodel. It represents an inductive synthesis of what we have learned
about the process of reform in many countries. It is as simple as we could make it without
doing injustice to the real complexity of the processes we are endeavouring to identify and
assess. Even so, it is complex enough to require some explication.
2.3 The forces at work
Let us first consider the broad architecture of the model, since this embodies a number of
our key assumptions and concepts. A first, and very important point is that the model
takes the government of a single country as its framework. This is already something of an
over-simplification, because, as we noted in Chapter 1, and will continue to discuss later in
the book, international organizations and networks frequently play important parts in
such reforms (see, e.g. Mahon and McBride, 2009). Nevertheless, the key reform decisions
are usually formally taken by national governments, even if they proceed under the
influence of wider networks or international organizations like the OECD or the World
Bank. So that is where we begin.
At the centre of the figure lies the process of elite decision-making. That is no accident,
since one of our theories is that most of the changes we are concerned with have been
predominantly ‘top-down’, at least in the sense of having been conceived and executed by
executive politicians and/or senior civil servants. Of course (as the diagram explicitly
32 PROBLEMS AND RESPONSES: A MODEL OF PUBLIC MANAGEMENT REFORM
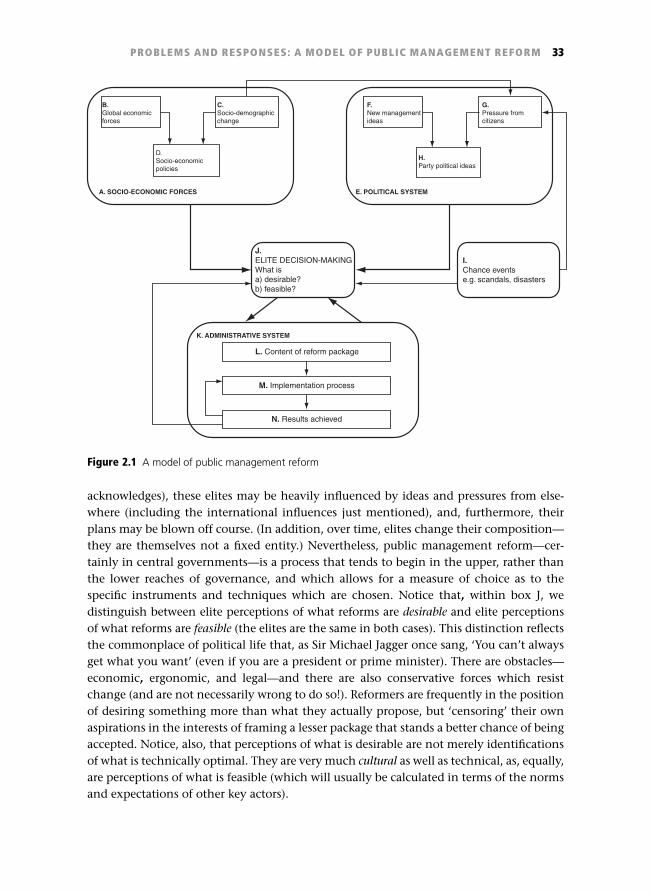
acknowledges), these elites may be heavily influenced by ideas and pressures from else-
where (including the international influences just mentioned), and, furthermore, their
plans may be blown off course. (In addition, over time, elites change their composition—
they are themselves not a fixed entity.) Nevertheless, public management reform—cer-
tainly in central governments—is a process that tends to begin in the upper, rather than
the lower reaches of governance, and which allows for a measure of choice as to the
specific instruments and techniques which are chosen. Notice that, within box J, we
distinguish between elite perceptions of what reforms are desirable and elite perceptions
of what reforms are feasible (the elites are the same in both cases). This distinction reflects
the commonplace of political life that, as Sir Michael Jagger once sang, ‘You can’t always
get what you want’ (even if you are a president or prime minister). There are obstacles—
economic, ergonomic, and legal—and there are also conservative forces which resist
change (and are not necessarily wrong to do so!). Reformers are frequently in the position
of desiring something more than what they actually propose, but ‘censoring’ their own
aspirations in the interests of framing a lesser package that stands a better chance of being
accepted. Notice, also, that perceptions of what is desirable are not merely identifications
of what is technically optimal. They are very much cultural as well as technical, as, equally,
are perceptions of what is feasible (which will usually be calculated in terms of the norms
and expectations of other key actors).
B.Global economicforces
C.Socio-demographicchange
D.Socio-economicpolicies
A. SOCIO-ECONOMIC FORCES
F.New managementideas
G.Pressure fromcitizens
H.Party political ideas
I.Chance eventse.g. scandals, disasters
J.ELITE DECISION-MAKINGWhat isa) desirable?b) feasible?
K. ADMINISTRATIVE SYSTEM
L. Content of reform package
M. Implementation process
N. Results achieved
E. POLITICAL SYSTEM
Figure 2.1 A model of public management reform
PROBLEMS AND RESPONSES: A MODEL OF PUBLIC MANAGEMENT REFORM 33
There are three other general points to be made about the centrality of elite decision-
making in themodel. First, it is the exception rather than the rule for reform schemes to be
comprehensive, even in intent. Reformers try to improve this or that institution or
programme, or sometimes a whole sector (health, education), but they seldom attempt
to remodel the entire sweep of public sector institutions in one go. Goodin (1996, p. 28)
expresses this point well: ‘Typically, there is no single design or designer. There are just lots
of localized attempts at partial design cutting across one another, and any sensible scheme
for institutional design has to take account of that fact.’ Even the reforms in New Zealand
between 1984 and 1993, which were unusual for the extent to which they formed a
coherent whole and were (initially at least) driven by one small group, evolved over time
and were significantly affected by a host of practical considerations which blunted the
purity of the theories which lay behind them (Boston et al., 1996, pp. 81–6).
The second general point is that it is easy to exaggerate the degree of intentionality in
many reforms. The final results of reform efforts (box N in the diagram) may bear only a
loose relationship to the intentions embodied in the elite’s original manifesto for change
(box L). Again, Goodin makes the point: ‘Institutions are often the product of intentional
activities gone wrong—unintended by-products, the products of various intentional ac-
tions cutting across one another, misdirected intentions or just plain mistakes’ (Goodin,
1996, p. 28). Thus, although we locate elite decision-making at the centre of the process of
reform, and although we would maintain that intentional acts of institutional redesign
have been crucial to the story we have to tell, this should not be read as an elevation of
organizational elites into God-like designers who are routinely able to realize bold and
broad schemes of improvement. On the contrary, we envisage their schemes as frequently
vulnerable to cognitive limitations, cross-cutting actions, politico-administrative road-
blocks, and unforeseen developments of a wide variety of kinds (see March and Olsen,
1995, chapter 6, for an extended account of the pitfalls, both cognitive and motivational,
and Hammond, 1996, for a brilliantly argued demonstration of why having more of one
kind of desired result often inevitably means having more of another kind of problem as
well). The most prominent of these complicating factors are discussed further later in this
chapter, and subsequently.
The third general point is that—as this explication of the model will hopefully make
clear—public management reform does not usually consist of a few elite persons coming
along with a bright idea. Neither the persons nor the ideas appear out of a vacuum. The
elite usually has quite distinctive channels of recruitment. The ideas nearly always come
from somewhere—a management consultancy, an academic, a neighbouring government,
the OECD, or whatever. The whole point of ourmodel is to see the elite decision-making in
the centre as a process that is powerfully shaped by a much wider context.
Surrounding the elite decision-making at the heart of Figure 2.1 there are, therefore,
three large groups of elements. In the top left there is a group of economic and socio-
demographic factors (A, including B, C, D). In the top right there is a group of political and
intellectual factors (E, including F, G, H). In the bottom half of the figure there is a group of
administrative factors (K, including L, M, N). It is from the interplay between these
principal elements that management changes emerge.
We will now proceed to examine each of these influences in rather more detail,
beginning with the socio-economic factors (box A). (Those wishing to see how these
34 PROBLEMS AND RESPONSES: A MODEL OF PUBLIC MANAGEMENT REFORM
factors interact in specific cases should go to the individual country files in Appendix B,
where developments in each country are set out using exactly these same categories.) Box
A itself represents the general set of these factors, which is both broad and diverse. Some
such factors can be thought of as structural, in the sense that they are deep-rooted and
long-lasting. The population structure would be one example. We may not immediately
think that population changes would have much effect on public management reform,
but that would be a mistake. For example, two of the reform-prompting problems which
many governments face at the moment are the increasing costs and complexity of the
welfare state (which have a lot to do with the presence of a larger percentage of elderly
people in our populations), and the difficulty of adequately staffing the public service,
because the big cohorts that were born in the 1940s and 1950s, and which joined the
public service in the 1960s and 1970s, are now retiring, all within a short space of time (e.g.
Management Advisory Committee, 2003). Others may be more ephemeral, such as short-
term economic cycles of upturn and downturn. Certain of these are likely to have a
definite and discernible impact on state administrations, and it is these which are identi-
fied in boxes B, C, and D.
Box B represents the influence of global economic forces. Some commentators ascribe a
large and dominating influence to these (for thoughtful critiques of such arguments see
Held, 1998 and Scholte, 2000). It is often said that the globalization of capital markets and
the growth of multinational corporations and international trade have weakened the
control national governments are able to exert over ‘their’ economic policies. It is there-
fore no longer possible for a government to sustain for very long a level of public spending
that global money markets deem to be imprudent. The intensification of international
competition has also obliged governments to give greater attention than ever before to the
competitiveness of ‘their’ firms. Firms are unlikely to compete effectively if they are
weighed down by either high taxes (to finance high public spending) or by tedious and
heavy bureaucracy.What is more, national and local governments aremore restricted than
they used to be in their ability to address costly and painful social problems such as
unemployment.
As a consequence of increased capital mobility and tax competition, the power of all
national governments to tax capital assets and capital incomes has been reduced. By the
same token, national monetary policy can no longer reduce interest rates below the
international level in order to stimulate productive investment, and higher rates of tax
mean that running fiscal deficits to expand aggregate demand has become more expen-
sive. National governments have thus largely lost their ability to avert rising unemploy-
ment through the strategies of macro-economic management that were still relatively
effective in the 1960s and 1970s. Hence, the more social policy systems were implicitly
premised on continuing full employment, the more they have come under stress (OECD,
1997c, p. 211). More recently, we have seen how problems in the finance sector can
quickly spread from finance to the ‘real economy’, and from country to country, until
they amount to a global economic crisis (GEC). Governments then felt obliged to ‘rescue’
banks by huge expenditures which, in turn, unbalanced public budgets so that severe cuts
in public-spending programmes become inevitable. Reforms are then de rigueur, as govern-
ments try to ‘do more with less’ so as to preserve popular front-line public services even
while budgets are being slashed.
PROBLEMS AND RESPONSES: A MODEL OF PUBLIC MANAGEMENT REFORM 35
Thus we have one set of reasons for widespread public sector reforms—to restrain public
spending, lighten the bureaucratic burden, and reshape social policies that can no longer
be afforded.
These are powerful arguments. They are widely rehearsed and believed. However, it is
important not to exaggerate their explanatory power. Whilst it seems entirely probable
that global economic forces have been a vital background factor in prompting consider-
ation of administrative reform, they do not usually determine the precise form or timing or
degree of that reform. Some of the detail necessary to support this contention will be
presented later, but it can immediately be pointed out that the pattern of management
change has differed considerably from country to country, suggesting that the effects of
global markets are not uniform. Furthermore, the timing of particular reforms in particular
countries frequently does not correlate at all to economic crises. Even when the 2008 GEC
had made it obvious that large public-expenditure cuts were necessary in the UK, the
political parties repeatedly postponed defining the precise targets and full extent of these
(very unpopular) cuts while they struggled for electoral advantage.
Finally, it should be noted that economic pressures do not themselves translate directly
into some particular type of management reform. Reformers need ideas—models or pat-
terns or plans or visions of how the public sector could be better organized. Markets may
provide the pressure to do something, but they do not supply the ideas of exactly what to
do.
In practice, a further problem with those commentators who present ‘globalization’ as a
dominant and determining influence on institutional changes is that the concept itself is
frequently deployed in a vague or even contradictory manner. For a satisfactory analysis
one would need, at a minimum, to distinguish the different mechanisms and modalities
involved in the increasing interconnectedness of world financial markets, extensions to
free trade, technological standardization and internationalization (e.g. the global spread of
certain brands of computer software or hardware), and what one might term cultural
globalization (McDonalds, certain films, fashions, sporting events, etc.). Too often these
rather different processes are all lumped together in a single, utopian or dystopian fashion.
In short, economic forms of globalization do seem to have been a major influence on
institutional change, but one which has acted through a number of other, intervening
variables. These other variables have been crucial in determining the precise shape and
timing of the reforms in particular countries.
Socio-demographic change (box C) is a second background pressure of considerable
importance. By this we refer to the pressures arising from changes in the pattern of life for
millions of citizens in each of our countries. They are too numerous to list in their
entirety here, but include, most notably, increased life expectancy, changes in the
patterns of family life (especially a higher incidence of single-parent and single-person
households), and a considerable rise in the average level of unemployment as compared
with the boom years of 1950–73. Some data on these trends is given in Appendix A. The
basic effect of many of these social changes has been to increase the demand falling upon
state-provided or state-financed services—particularly health care, social care, and social
security. For example, in the early 1990s the average amount of health care resources
consumed by the average British or American person over the age of 75 was calculated as
36 PROBLEMS AND RESPONSES: A MODEL OF PUBLIC MANAGEMENT REFORM
being between six and ten times the amount consumed by a middle-aged person. Thus, to
have an increasing proportion of elderly people in a population implies a considerable
growth in welfare expenditure. In most modern states, social security (pensions, unem-
ployment benefits, and other benefits in cash and kind) is the largest single item in the
state budget, and health care is frequently the second largest. Broad changes in the levels
of demand for these services therefore translate into significant public expenditure in-
creases—just as global economic pressures are pushing in the other direction. In some
countries commentators have painted frightening scenarios of state finances collapsing
under unsupportable welfare burdens, with millions of citizens being deprived of their
expected rights and benefits.
How does all this affect public management reform? Again, as with the globalization of
capital and trade flows, the impacts are indirect. An increase in the number of pensioners or
of the unemployed does not by itself produce a particular type of organizational change.
But what it does do is provide powerful incentives for politicians and civil servants to look
for ways of easing the strain on the system. Thesemay include lowering the rates of increase
in benefits (e.g. by de-indexing them from wages and salaries), narrowing the categories of
eligibility (so as to concentrate on the ‘most needy’), or increasing charges and co-pay-
ments by the beneficiaries. But they have also tended to include changes which have more
obvious impacts on the ways in which such services are organized and managed. For
example, streamlining may be implemented with a view to reducing administrative over-
heads; commercial and voluntary sector participation in the process of provision may be
encouraged and/or there may be wholesale restructurings of the relevant departments and
agencies in an attempt to build in stronger incentives to economy and efficiency (see, e.g.
for the US, Petersen, 2000 or, for Sweden, Micheletti, 2000).
These background pressures therefore reflect themselves in foreground socio-economic
policies which may oscillate quite rapidly over time (box D). For example, in pursuit of
social-security savings, many European governments have raised the minimum age for
entitlement to a state pension. Or, in the economic field in the mid and late 1990s, EU
member states struggled tomeet theMaastricht ‘convergence criteria’ which would qualify
them to join the European single currency. This put downward pressure on public spend-
ing and public debt, and may well have somewhat increased the numbers of unemployed,
at least in the short term. It was, therefore, a policy with considerable and diverse effects on
the administrative apparatuses of those states concerned. It was of particular interest as a
supranational initiative.
We can nowmove to the second cluster of influential factors—those concerned with the
political system. To begin with we need to take into account the general, structural features
of this system, which are represented in Figure 2.1 by box E. These features may make
management reform more or less straightforward. For example, in Germany a strict
constitutional law makes it difficult, if not impossible for major restructurings to take
place at the federal level, whereas in the UK the process of changing the machinery of
government has long been remarkably easy, usually involving only secondary legislation
that can easily be passed through the legislature by the executive (Pollitt, 1984, 2007).
Note here the important role that the law can play in facilitating, shaping, or sometimes
restraining public management reform. Moving to another aspect of the political system,
it may be observed that, in countries such as Finland or Belgium, which are characterized
PROBLEMS AND RESPONSES: A MODEL OF PUBLIC MANAGEMENT REFORM 37
by consensual political systems and coalition governments, the process of management
reform is likely to be less harsh and combative than in countries such as Australia or the
UK, where the political systems are more adversarial. A final example would be the high
degree of protection which the constitutions of Germany and the Nordic countries
afford to regional/local/municipal government. This usually means that central govern-
ments in these countries find it relatively difficult to extend the reforming process to the
local level—unless and until there is a reasonable coalition of political support for reform
at that level itself. Contrast this with Mrs Thatcher’s ability, in the UK during the 1980s,
actually to abolish the Greater London Council and the six metropolitan county author-
ities when she found herself in disagreement with their politics and policies. These
contrasting features of different political systems are to some extent structural—as in
the electoral system and the corresponding pattern of political parties—and to some
extent cultural—as with the heavy emphasis on relatively ‘polite’ collective discussion
and agreement which characterizes systems such as those of the Netherlands and
Sweden.
In contrast with the constraints and restraints which often flow from the deep structures
of political systems, there are also, within those same systems, dynamic elements. One
such that is of particular importance for our theme is the influx of newmanagement ideas
into the public sector (box F). Over the last two decades this has generated a rich flux of
ideas about how to manage almost anything, from a corner shop to ‘Great Britain, plc’.
These ideas have echoed around business schools, corporate boardrooms, government
seminars, and even airport bookstands (see Pollitt, 2003a, chapter 7). There has been
considerable inter-country borrowing, facilitated by international bodies such as the
Public Management Service of the OECD (PUMA) and the World Bank. There can be no
doubt that the selling of management ideas was one of the growth industries of the 1980s
and 1990s (Sahlin-Andersson and Engwall, 2002). Equally there can be little doubt that the
writings of the gurus and the presentations of the management consultants have influ-
enced political and civil service leaders in a number of the countries examined in this
book. Perhaps the most celebrated case was the intellectual line of descent which ran from
generic management writers such as Peter Drucker and Tom Peters through the authors of
the American best-seller Re-inventing Government (Osborne and Gaebler, 1992) to themajor
US federal government report Creating a Government that Works Better and Costs Less: Report
of the National Performance Review (Gore, 1993).
Of course, management ideas, however fashionable, very seldom get translated in a
pure form directly into specific reforms. Rather they flow into a larger pool of ideas,
drawn from a variety of sources, which are made use of by political and administrative
elites (box J). Nevertheless, generic management ideas have been prominent on the face
of public sector reforms, perhaps especially in Australasia, North America, and the UK,
but also, more recently to some extent even in France (Bezes, 2007; Eymeri-Douzans,
2009). In these countries (and, to a lesser extent, others) generic approaches and tech-
niques such as Management by Objectives (MbO), Total Quality Management (TQM),
benchmarking, outsourcing, and Business Process Re-engineering (BPR) have been
widely adopted within the public sector (Lane, 2000; Pollitt and Bouckaert, 1995;
Thompson, 2000). These are the individual dishes or plats we referred to in Chapter 1,
items which can be combined to make more or less coherent models/menus. Alongside
38 PROBLEMS AND RESPONSES: A MODEL OF PUBLIC MANAGEMENT REFORM
these specific management techniques, and often interwoven with them, organizational
design principles based on micro-economic theories have also been extensively used. In
New Zealand, for example, public choice theory, agency theory, and transaction cost
economics were all influential (Boston et al., 1996, chapter 2).
In Chapter 1 we stressed the growing internationalization of public management.
Certainly this has become increasingly true for management ideas, both those generated
by gurus and business schools and those which derive from micro-economic theory.
Departments and units charged with administrative reform have their own international
networks, both bilateral and multilateral. The Public Management Service of the OECD
was an influential nodal point in these networks from the late 1980s onwards (see, e.g.
OECD 1995, 2005; Halligan, 1996a and Premfors, 1998). Other networks have also
emerged, such as the ‘Reinventing Government’ conferences that came from the Clin-
ton/Gore reforms in the USA, but were then marketed internationally as ‘Global Forums’,
or the World Bank’s promotion of a specific set of ideas about what constitutes ‘good
governance’ (Arndt, 2008).
Box G in Figure 2.1 represents pressure from citizens. It should immediately be acknowl-
edged that management reform is not usually at the top of the citizenry’s list of priorities.
Neither is it a topic upon which most men and women in the street have very specific
suggestions to offer. If we define reform as deliberate changes to governmental structures
and functions, then we must immediately concede that most citizens know very little
about these structures and functions, except at the top surface, or ‘sharp end’, of a
government website or service counter or police cordon. It would be simply unrealistic
to expect citizens to generate detailed proposals for reforming an inner machinery of
which they know not much, and about which they have only very limited incentives to
learn. However, although lay citizens are unlikely to be brimming with concrete proposals
for better management, they can and, on occasion, do exert pressure for change. If, for
example, citizens become used to very rapid and customer-friendly transactions in banks,
building societies, and shops they may become progressively more andmore discontented
with post offices or benefits payment agencies which are slow, inflexible, and inhospitable.
Such discontent with low standards of service in state institutions may then be expressed
to political representatives, or the media, who then communicate them onwards to the
elites (box J). More dramatically, if it is widely believed that civil servants are corrupt, or
that a particular service is being delivered in a seriously inequitable way, then public
opinion may mobilize to create pressure for reform. Thus, while the views of citizens
seldom seem to be the driving or shaping force for particular reforms, there can be
circumstances in which they constitute an important background influence. For example,
the fatal explosion of a firework store in the Dutch city of Enschede in 2001 crystallized a
major debate in that country concerning alleged laxity and ‘cosiness’ in regimes of public
regulation.
Box H identifies party-political ideas as a further influence on public management
change. Political parties acquire ideas about how they would like to govern, and these
include issues of structure, style, and process. For example, a party may decide that it
wishes to ‘reduce bureaucracy’ or to ‘decentralize and put power closer to the people’. Or it
may adopt more specific proposals such as creating a special ministry or agency for the
environment, the regions, the family, gender mainstreaming, inland security, or any
PROBLEMS AND RESPONSES: A MODEL OF PUBLIC MANAGEMENT REFORM 39
other topic which happens to be prominent or fashionable. Party-political ideas may be
more or less ideologically charged. One doctrine that was influential in a number of
countries during the 1980s and 1990s was that of privatization. When construed as a
consistent preference for private over public provision, this doctrine had a very obvious
and immediate impact on the public sector—it reduced its size. Australia, New Zealand,
and the UK all pursued vigorous privatization programmes of this type, and the doctrine
was also applied, albeit in a less unremitting way, in Canada, France, the Netherlands,
Sweden, and the USA. More recently a number of political leaders have proclaimed the
need for more ‘joined-up’ government, with greater integration between hitherto separate
policies or services (see, e.g. Bogdanor, 2005; Kernaghan, 2009; OECD, 2002; Pollitt,
2003b).
Party-political ideas are sometimes internally generated and derived from a specifically
political agenda that party activists are developing (box H). On other occasions the ideas
may come from outside, from popular movements among the electorate (box G) or from
the worlds of business or academia (box F). It is clear, for example, that in relation to
public management issues, the ideas of the 1980s Conservative governments in the UK,
and of the 1984–90 Labour governments in New Zealand, were extensively influenced by
the theories of public choice-school economists (Boston et al., 1996; Pollitt, 1993).
Equally, the Republican administration of President Reagan was heavily populated
with business advisers, while its Democratic successors during the mid 1990s also
made deliberate use of what it called ‘Lessons learned from America’s best companies’
(Gore, 1997).
It should be noted, en passant, that all these flows of ideas can be greatly strengthened by
amplification in the mass media. Political systems have become more and more closely
attuned to, and bound in with, the mass media, and if a reform idea can achieve exposure
on national TV or in the main newspapers it will be virtually guaranteed at least some
serious political attention. While the detailed technicalities of reform (e.g. accruals
accounting versus cash-based accounting) are unlikely to catch the attention of TV pun-
dits or mass-circulation daily newspapers, more general ideas (that the railways are a mess
and need re-organizing, or that too many people are defrauding the welfare system) do
receive wide media exposure, and help to increase pressure for management reform. We
have not devoted a specific box to the media in Figure 2.1, but one can perhaps think of
the TV and the press as a general influence that can (sometimes quite suddenly) ‘heat up’ a
particular part of the diagram, amplifying the volume and force of communications and
discussions of particular issues.
Summing up the play of ideas, one scholar wrote:
Public sector reform is in fashion and no self-respecting government can afford to ignore it. How a
fashion is established is one of the most intriguing questions of public policy. Part of the answer lies
in policy diffusion brought about by the activities of international officials (whose zeal for adminis-
trative reformmysteriously stops short at the door of their ownorganizations), bymeetings of public
administrators, academics and the so-called policy entrepreneurs. (Wright, 1997, p. 8).
There is one influence which operates outside the main groupings of socio-economic
forces, political system factors, and elements of the administrative system. Box I
represents the effect of chance events such as scandals, natural or man-made disasters,
40 PROBLEMS AND RESPONSES: A MODEL OF PUBLIC MANAGEMENT REFORM
accidents, and unpredictable tragedies such as shootings or epidemics. Whilst these can
clearly partake of socio-economic or political factors (trains can collide because of lack of
public investment in maintenance or signalling equipment; a crazed gunman may bear a
grudge against the government), their most obvious features are their newsworthiness and
their unpredictability. The effect of such events on reform programmes may not be
obvious, but occasionally it is significant. For example, the Cave Creek disaster in New
Zealand (when an observation platform collapsed in a public reservation) sharply focused
media attention on the issue of public accountability in a newly decentralized system
(Gregory, 1998). The explosion at Enschede, mentioned above, had a similar effect in the
Netherlands. In the USA the disaster that destroyed the ‘Challenger’ space shuttle led to a
major overhaul of the National Aeronautics and Space Administration (NASA), one of the
largest federal agencies. Thus, physical accidents have a tendency to transmute into
organizational or even institutional crises. At a more personal level, senior ministers are
prone to a variety of ‘accidents’ (including ethical misdemeanours, sexual indiscretions, or
simple illnesses), and occasionally individuals with strong reforming ideas may arrive or
depart for reasons quite unconnected with their management priorities.
Accidents and disasters come in many different forms and sizes, and the examples given
in the previous paragraph far from exhaust the catalogue. We also need to remember that
disasters can be global in reach and that, except for a few unlistened-to prophets, the
global economic collapse of 2008 came as a quite unexpected and sudden tidal wave. Its
impacts on public administration were vast and various, and at the time of writing we are
still seeing new ones crop up almost every week.
Taking a broad view, therefore, the upsurge of reforms in the last twenty years or so can
be attributed to an intensification of a number of factors, but perhaps particularly global
economic forces, socio-economic change, and the supply of newmanagement ideas (B, C,
and F). However, these pressures do not enjoy free play over a smooth surface. On the
contrary, they soon wash up against countervailing forces—not only the recalcitrance of
those groups with a vested interest in the status quo, but also less animated sources of
resistance. Existing ways of doing things may be entrenched in laws or regulations or
cultural norms which take time or political majorities (or both) to change. At the strong
end, a particular kind of management change may require an adjustment to a country’s
constitution—or, in the case of EU institutions—to the founding treaties. Furthermore,
even if the majority are agreed that the existing administrative structures or procedures are
inadequate, it may be hard to agree on what to do instead (especially if, as is often the case,
reform in one direction raises risks in another). Or it may simply be that to manage in a
new and desired way may require a considerable investment in new information technol-
ogy, new accounting systems, and/or new training programmes for the staff concerned,
before it can be put into practice. All these factors represent the costs of change and they
also help determine the timescale of change (Pollitt, 2008). Often reformers underestimate
the extent of these until they get close to them (as they approach or get into implementa-
tion—box M).
Many of the costs of change can be thought of as being associated with the dismantling
of existing political and administrative systems in order to ‘make room’ for the new. In
every country, much history andmany political bargains—and therefore somewisdom—is
built into existing systems. Such systems are archaeological maps of past struggles and
PROBLEMS AND RESPONSES: A MODEL OF PUBLIC MANAGEMENT REFORM 41
settlements (March and Olsenn, 1995, p. 205). Economists and political scientists increas-
ingly employ notions of ‘path dependency’ to show how certain laws, rules, and institu-
tions can create heavy disincentives for change, because so much is already invested in the
existing ways of doing things (Pierson, 2000; Pollitt, 2008; Pollitt and Bouckaert, 2009).
Consider the business of the UK driving on the right, while most of Europe drives on the
left. At first sight it seems a pointless and occasionally irritating, or even dangerous
anomaly—why not just pass a law that requires all countries to drive on the same side of
the road? But then think of all the previous investments in the UK in favour of driving on
the right—car plants which make right-hand-drive cars, road markings, road signs, driving
tests, andmany other things that would have be (expensively) changed. Then there would
have to be a huge campaign to retrain every driver, and complex and possibly disruptive
arrangements for the day when the changes would actually be made. All in all, the
disincentives against change are considerable, even without allowing for the fuss about
‘surrendering to the Brussels’ bureaucracy’ which the nationalist media would presumably
make.
Similarly, with management reform, staff are obliged to relinquish old ways and learn
new. Well-oiled networks of information and influence are disturbed and new, less certain
ones put in their place. Politicians who were used to one configuration of authority within
those state agencies that most interested them now have to get used to a new pattern, and
possibly one which will be more difficult for them to influence or communicate through.
And so on. We have already discussed the restraining effects of political structures (box E),
and we will nowmove on to look at the corresponding structures of administrative systems.
The two act jointly to temper the ardour of the reformers with the sober difficulties of
shifting the status quo. Thus we depict them as enclosing and surrounding the more
specific and dynamic pressures of the moment.
Administrative systems (box K) are often difficult to change in more-than-incremental
ways. For example, the UK civil service is built around a core of generalists, whereas many
continental civil services, including the French and German, consist mainly of staff
trained in law. A cultural and disciplinary difference of this type cannot be eliminated
overnight—it influences the way in which officials conceptualize and approach a wide
variety of issues. Structural differences can also be significant: in Sweden and Finland
central government for long consisted of a group ofmodest-sizedministries surrounded by
a circle of relatively independent administrative agencies which had responsibility for
most operational issues. This was a more decentralized system than that which obtained
(until recently, at least) in France or the UK. Many of the issues for which local or
municipal authorities in the UK would deal directly with a central ministry, would be
taken care of by agencies in Finland or Sweden. For the Nordic countries, to change
required new legislation and a reconsideration of the highly political issue of relations
between central government and municipalities. It could be done (and to some extent has
been), but not quickly or lightly. A third example would be personnel regulations.
These are clearly necessary to ensure that public servants behave with propriety and
consistency. Yet they tend to develop a momentum of their own. Over the years huge
manuals are built up, with each unusual occurrence leading to more paragraphs or pages
being added to themagnum opus. It can be very difficult fundamentally to reduce or revise
this tangle of interlocking rules and regulations. When, in 1993, the American vice
42 PROBLEMS AND RESPONSES: A MODEL OF PUBLIC MANAGEMENT REFORM
president launched the National Performance Review, the federal personnel manual was
presented as a symbol of traditional, over-complex bureaucratic rule-making, and a copy
was ceremonially burned on the lawn of the White House. The reality was less impressive
than this publicity stunt—a huge civil service could not really throw away all its internal
rules, and most agencies seem to have continued to apply most of the rules as before. As
one American colleague put it to us, ‘The copy that was burned cannot have been the only
one’. Personnel regulations have become notable constraints on reform in a number of
countries—perhaps especially Belgium, France, and Italy—and also for the European
Commission.
At a more pedestrian level, administrative systems can still be hard to budge. Consider a
straightforward benefits-claiming system. Claimants come to a social security office and
fill in a form. The form is then checked by counter staff who, if the claim is in order, make
the appropriate payment. Let us suppose that a decision is made to reform this system by
introducing computerized technology. In theory the new procedures will be quicker and
less staff-intensive. Large efficiency gains are predicted. In practice even this simple-
sounding reform can involve extensive complications. Hundreds, if not thousands of
staff will need training to use the new computer technology. The educational qualifica-
tions needed for counter staff may need to be increased. Public service unions are likely to
be concerned about any such changes, and are even more likely to resist attempts to reap
efficiency gains which take the form of staff reductions. The purchase of the necessary
computer software may be less than straightforward (Bellamy and Taylor, 1998, pp. 41–51;
Hudson, 1999; Margetts, 1998; Dunleavy et al., 2006a). Questions about linking the data
held on the new system to other computerized government data banks and about the
security of personal details held on file may also arise, and these are likely to have legal
implications. And so on. To manage the change well will take considerable forethought,
planning, and time. To announce the reform is the easy part; to carry it through requires
patience and resolve. During the 1980s and 1990s the UK Department of Social Security
struggled hard to implement a huge computerization project called the ‘Operational
Strategy’, but in the end the results fell well short of what had been forecast (National
Audit Office, 1999, p. 25).
Despite these potentially formidable obstacles to radical or rapid change, reform pro-
grammes are launched, and frequently domake an impact. In Figure 2.1 boxes L, M, and N
represent this more dynamic aspect of the administrative system. These activities—
announcing reform packages, implementing changes, and achieving results—are the
main focus of the remainder of our book, and their treatment here will be correspondingly
brief.
The content of reform packages (L) are the product of the interaction between the
desirable and the feasible, mentioned above. When announced, such packages fre-
quently display a considerable rhetorical dimension, playing harmonies on the styles
and ideas of the moment. They attempt to establish, or reinforce, discourses which
support the particular institutional changes under consideration. Here is an example
from the USA:
PROBLEMS AND RESPONSES: A MODEL OF PUBLIC MANAGEMENT REFORM 43
If somebody had said in 1993 that within 10 years the federal government would be smaller,
customer-driven, worker-friendly, and run like America’s best companies, they would have
drawn . . . jeers.
But that was the challenge that President Clinton handed down four years ago when he askedme
to reinvent the federal government—to put the wheels back on. We agreed right then that we
needed to bring a revolution to the federal government: we call it reinventing government. (Vice
President Gore, 1997, p. 1).
Or this, from the Minister of Finance in a new, right-wing Danish government in the
autumn of 2002:
The public sector must learn to think, act and be managed on the same terms as the private sector.
The old bureaucrats must be smoked out! (Pederson, 2002, p. 2)
Reform announcements are therefore as much texts to be interpreted as they are blue-
prints for administrative action. Some reform announcements come to rather little, so it is
always advisable to check how far the initial promises have been realized in the medium
term. In this they are no different frommost other political manifestos. It is also important
to recognize that announcing reforms and making recommendations may become activities
with a value of their own, without any necessary follow-through. Politicians, consultants,
and academics can make quite decent livings out of producing statements and reports,
even if little else happens in the longer run. Many countries can show at least some
examples of political and managerial rhetoric outrunning measured achievement (for a
long-term Swedish example, see Sundstr€om, 2006).
The process of implementation (M) is a particularly important stage of the reform process.
The ‘science’ of administration is hardly exact. Much is learned during the attempt to put
reform ideas into practice, and some of that learning frequently translates into departures
from the original design. During the 1970s an Anglo-American academic literature focus-
ing on this stage appeared, and much of it was fairly pessimistic about the chances of
reform packages actually unfolding according to plan. One particularly influential work
was subtitled ‘How Great Expectations in Washington are Dashed in Oakland’ (Pressman
and Wildavsky, 1973). It explained how top-down reforms were implemented through
long chains of decisions and many levels of administration, and the chances of success
were no better than the strength of the weakest link. Although subsequent scholarship has
suggested that this mainly linear model of the implementation process is too simple, the
basic point about the complexity of the process running from ideas to actual accomplish-
ments stands firm (Hill and Hupe, 2002).
Indeed, the complexity of implementation processes may well be on the increase. More
and more programmes are delivered through networks of organizations rather than by a
single implementor (Kickert et al., 1997; Osborne, 2000; Rosenau, 2000). These networks
may include different levels of government, independent public corporations, public/
private hybrid bodies, commercial firms, and voluntary, non-profit associations. The
NPM doctrines referred to in Chapter 1 have amplified this kind of fragmentation (Bouck-
aert et al., 2010). Furthermore, implementation networks increasingly need to be interna-
tional—most obviously for policies in fields such as telecommunications, transport,
the environment, or communicable diseases. The implications of all this for manage-
mentreform are complex. If such reforms are to be effective it seems they will often have
44 PROBLEMS AND RESPONSES: A MODEL OF PUBLIC MANAGEMENT REFORM
to take the whole of a network as their ‘unit of analysis’, rather than just a single organiza-
tion. However, both the available theories and the available authority could easily be
inadequate for such a task. Ideas about how to design or redesign networks of different
types of organization are in short supply. And the authority to carry through integrated
reform of a whole network may not exist—each member of the network being its own
master in the matter of management change.
Another problem that can arise during implementation is that individual reforms,
though they may make good sense in themselves, may contradict or detract from other
reforms which are being carried through at the same time. For example, the Assistant
Auditor General of Canada, commenting on the slow progress made by various public
service quality improvement initiatives during the early 1990s, observed:
Our review of relevant documents and our discussions with service managers indicated that they
had many reasons for not having made more progress toward the government’s repeated commit-
ments. The reasons included the public service strike of 1991, government reorganisation in 1992,
the change of government in 1993 and the subsequent Program Review and associated cutbacks,
as well as re-engineering exercises carried out by individual departments. (Auditor General of
Canada, 1997, para 14.65)
Implementation is also a crucial stage in the sense that it can directly feed back to the elite
decision-makers’ ideas about what to do next—whether to continue along a given path or
change tack. For example, in New Zealand, a particularly elaborate and sophisticated
performance-management system was put in place from the mid 1980s onwards. By the
mid 1990s, as this systemmatured, it was recognized that there were dangers in too tight a
focus onmeasurable outputs. The ultimate objectives of programmes (to educate children,
lower unemployment, etc.) could be displaced by an intense concentration on how well
lessons were delivered, how many unemployment training courses had been held, and a
host of other measures of process and output.With this concern inmind, the New Zealand
Senior Public Managers Conference for 1997 had the title and theme ‘Raising our game:
from outputs to outcomes’.
Finally we come to the end of this long and complicated road—the achievements that
eventually accrue from the process of reform (box N). These might, or might not, bear a
close resemblance to the original aspirations of the politico-administrative elite. Whether
they do or not, like the implementation phase, these ‘results’ are likely to feed back into
earlier stages of the process—particularly to elite perceptions of what types of change are
desirable and feasible (J). In practice—as we shall see in Chapter 5—the ‘final results’ of
reform are frequently difficult to identify and/or attribute with any confidence (National
Audit Office, 2010). Rhetoric and reality can be very hard to disentangle. Indeed, ulti-
mately ‘the final reality’ cannot be wholly separated out, because it is so thoroughly
impregnated with the competing discourses through which it is constituted. Furthermore,
although new administrative structures and processes may unmistakably exist, it is often a
problem to know just how far they can be attributed to some preceding reform (Pollitt,
1995; Pollitt and Bouckaert, 2001). In interviews, practitioners very often trace specific
impacts back to a variety of influences, of which a particular reform is only one. In short,
the process is usually messy rather than neat.
PROBLEMS AND RESPONSES: A MODEL OF PUBLIC MANAGEMENT REFORM 45
2.4 Concluding remarks
We have now presented our model of the ‘why’ and ‘how’ of public management reform.
It depicts the process as multifaceted and liable to modification at a number of different
stages. It embodies interactions between background socio-economic influences, political
pressures, specific ideas that are in current circulation, and features of the administrative
system itself. It identifies both pressures for change and sources of resistance against
change. It reserves a role for the unintentional and the accidental. It already hints at,
and allows for, considerable variation between countries, not least because they enter into
the process of change from different starting points, in the sense that each country has its
own distinctive political and administrative system (E and K). It incorporates several
important feedback loops, as reformers learn from the process of implementation (and
with the internationalization of the ‘market’ in management ideas, governments fre-
quently look for lessons from the experiences of other countries, not just their own).
Yet themodel is limited in various significant ways. Presented as it is in Figure 2.1 there is
a danger that it will be interpreted or used in a static manner (‘just fill in the boxes’). But
the boxes each represent sets of processes, and further processes then ensue between the
boxes. It is important to realize, therefore, that it is the interactions within and between
the boxes that bring real reforms to life. These interactions may be very short term (an
earthquake, an election result), or medium term (setting up a new agency), or long term
(weeding out corruption, or adjusting the pension and health care systems to deal with a
population containing a much higher percentage of elderly people). The temporal aspect
of reform is often crucial (Pollitt, 2008), but is not apparent from Figure 2.1.
There is therefore still a lot to be ‘filled in’. In particular, to breathe life into themodel we
need more detailed accounts of what goes on inside some of the key boxes—particularly
typologies of different types of political (E) and administrative (K) regimes. Once we have
those in place it should be possible further to develop the dynamic features of the model,
by relating particular regime types to specific trends in reforms. At that point, the sche-
matic and heuristic model that is Figure 2.1 can begin to accommodate specific explana-
tory theories. For the moment it is simply a starting point—a logical model, certainly not a
unified theory. It can accommodate within its ‘boxes’ quite a wide variety of more specific
theories—more, in fact, than we will have room to introduce within this book. We will,
however, make a start. The socio-economic forces of box A, though important, will be
treated primarily as background factors, and are analysed comparatively in Appendix A,
and for individual states in the country files of Appendix B. In the next chapter we
therefore focus on boxes E and K—the political system and the administrative system.
Here, we will argue, one is able to see quite a strong set of explanatory connections
between, on the one hand, the types of national structures and processes and, on the
other, particular patterns of management reform.
46 PROBLEMS AND RESPONSES: A MODEL OF PUBLIC MANAGEMENT REFORM
3 Many houses: types ofpolitico-administrativeregime
Every house has many builders, and is never finished.
(Paavo Haavikko, in Lomas, 1991)
3.1 The starting point for management reforms
The model of public management reform developed in the previous chapter laid consider-
able stress on the characteristics of the existing political and administrative systems as
shaping influences over processes of management change (boxes E and K in Figure 2.1).
These systems provide, as it were, the existing terrain—the topography over which refor-
mers must travel. To continue the analogy, it is obvious that different countries display
different topographical features, and therefore different challenges to those who wish to
carry through reform. For example, a US president must get his/her reforms through an
independent-minded and powerful Congress, whereas a British prime minister with a
majority can much more easily push reforms through the British parliament. In this
chapter we will offer relevant classifications for such differences, and will then use these
to examine and locate the twelve countries which fall within our scope. We will also
attempt to use the strategy on the other entity in our study—the European Commission—
although its application in that unique case is less straightforward (Section 3.8).
Some accounts of public management reform say little or nothing of contextual differ-
ences of the kind to which the discussion of this chapter is devoted. They concentrate
entirely on the characteristics of the reform tools themselves—strategic planning, perfor-
mance budgeting, Total Quality Management or whatever —the ‘dishes’ in Figure 1.2. In
our view such accounts are seriously incomplete. Their attention is, in effect, confined to
the intervention alone, with minimal analysis of variations in the contexts in which the
intervention takes place. Yet there is ample evidence from many studies of public admin-
istration that context can make a huge difference to the effects yielded by a particular
model or tool of management change (e.g. Bouckaert et al., 2008; Lynn, 2006; Pollitt, Van
Thiel, and Homburg, 2007; Savoie, 1994; Wilson, 1989). Conceptually identical, or at least
similar, reforms develop differently in one national (or sectoral or local) context as com-
pared with another.
On the other hand, it would be misleading to think of politico-administrative systems as
some kind of unchanging bedrock, to which every reform must adapt itself or fail. In our
model of the process of change (Figure 2.1) every element is subject to change, though at
different speeds. Thus even the fundamentals of political systems (e.g. constitutions) and
administrative systems (e.g. the educational and cultural characteristics of the higher civil
service) can anddo change over time. TheUK is famous for its one-party governments and its
‘first-past-the-post’ majoritarian voting system. Yet at the time of writing it has a Conserva-
tive/Liberal Democrat coalition government and has recently carried out a referendum to
consult the public on electoral reform. Some commentators are doubtingwhether it will ever
return to simple majoritarian government, which would make a fascinating case study if
anyone is revising this book in another ten years’ time. Equally, both Belgium and the
Netherlands have long been known for their stable, consensus-based systems, but that may
now be changing. In both countries, over the past decade or so, the party system itself has
evolved, throwing up new, populist parties which have been able to gain influence very fast.
These newcomers have not by anymeans wanted to join in the old consensual game on the
old consensual terms, so there has been a certain volatility that was not previously apparent.
The phrase fromPaavoHaaviko’s poemwhich introduced this chapter sums up the situation
well—the house is never entirely stable and complete. However, these kinds of systemic
features usually tend to change only gradually—or at least infrequently—andmay therefore
be regarded as muchmore stable/less dynamic features of the reformer’s environment than,
say, the play of economic forces or the changing fashions in management ideas (Lijphart,
1999, p. 254; Pollitt, 2008, pp. 16–20).
Towards the end of the chapter (Section 3.9) we comment on another type of regime—
the ancien r�egime, or ‘traditional bureaucracy’, which recent reforms are often said to be
departures—or escapes—from. We raise some questions about the accuracy of this picture
of the past, and about the value shifts which are both explicit and implicit in the
contemporary debate over ‘bureaucracy’.
3.2 Politico-administrative systems: the key features
From the very beginning, comparative approaches to the study of politics and public
administration have been intimately concerned with the question of what features to
select as the most sensible and illuminating basis for comparing one state, or subnational
jurisdiction, with another. It makes sense here to concentrate on features which, prima
facie, seem likely to affect the process of management reform. In the relevant academic
literature, there is no shortage of suggestions as to what these might be. We have borrowed
heavily from this corpus of comparative work. Typically, the key features identified by
leading authors include structural, cultural, and functional elements (see De Jong et al.,
2002, for a useful overview). Those we have chosen are as follows:
1. The state structure (including the constitution)—this is clearly a structural feature.
2. The nature of executive government at the central level—this is a mixture of
structural and functional elements. This includes the nature of the political system —in
48 MANY HOUSES: TYPES OF POLITICO-ADMINISTRATIVE REGIME
particular whether it operates according to majoritarian or a consensus-oriented princi-
ples (Lijphart, 1984, 1999).
3. The way relationships work between political executives (ministers) and top civil
servants (‘mandarins’)—a functional element, but heavily conditioned by cultural values
and assumptions. One way to think of this is to regard it as a bargain between the two elites
(Hood and Lodge, 2006). For example, top civil servants may be treated as an independent
group of ‘trustees’ (or ‘magistrates’ or ‘technocrats’), or theymay be regarded as ‘agents’ for
the politicians—‘battle troops for political masters to command and redeploy’ (Hood,
2002, p. 319). As trustees, top officials receive a generous share of discretionary authority
and ahigh social status. As agents of the politicians theymay receive operational autonomy
and the pleasures of being trusted confidants, closely protected by the politicians, but only
for as long as the latter are in power. The German (Hegelian) idea of a civil service probably
comes closer to the former (trustee) model, while most top American officials are more of
the ‘battle troops’. The career paths of the two elitesmay be largely separate (as in theUK) or
extensively intertwined, as in France, where, for example, the Prime Ministers Jospin and
Jupp�e and the PresidentsMitterand andChirac had all attended the famous training school
for top civil servants, the Ecole Nationale d’Administration (ENA).
4. The dominant administrative culture. We here take administrative culture to refer to
the expectations the staff of an organization have about what is ‘normal’ and ‘acceptable’
in that organization—‘the way we do things around here’. It therefore provides the
context for ethical relations within the public sector. Such beliefs and attitudes manifest
themselves in numerous different ways, including the symbols and rituals of the organi-
zation, and its stories, jokes, and myths (Geertz, 1973; Handy, 1993; Hofstede, 2001).
Cultures will vary from country to country and, indeed, from one organization to another
(Demmke and Moilanen, 2010; Lalenis et al., 2002, pp. 18–41; Schedler and Proeller,
2007). Yet at the same time there are factors encouraging some elements of international
cultural convergence—not least the Internet and global media, but also including specific
organizations within the field of publicmanagement such as theWorld Bank or the OECD.
5. The degree of diversity among the main channels through which the ideas come that
fuel public management reform—this reflects both cultural and functional elements.
Thus in some countries advice on management reform may come mainly from a small
and relatively homogenous elite while in others it may come from several competing
sources.
These five key features are depicted in tabular form in Table 3.1. In the following sections
we discuss each feature in turn.
3.3 The basic structure of the state
Here there are two basic dimensions. The first refers to the degree of vertical dispersion of
authority—that is, how far authority is shared between different levels of government.
MANY HOUSES: TYPES OF POLITICO-ADMINISTRATIVE REGIME 49
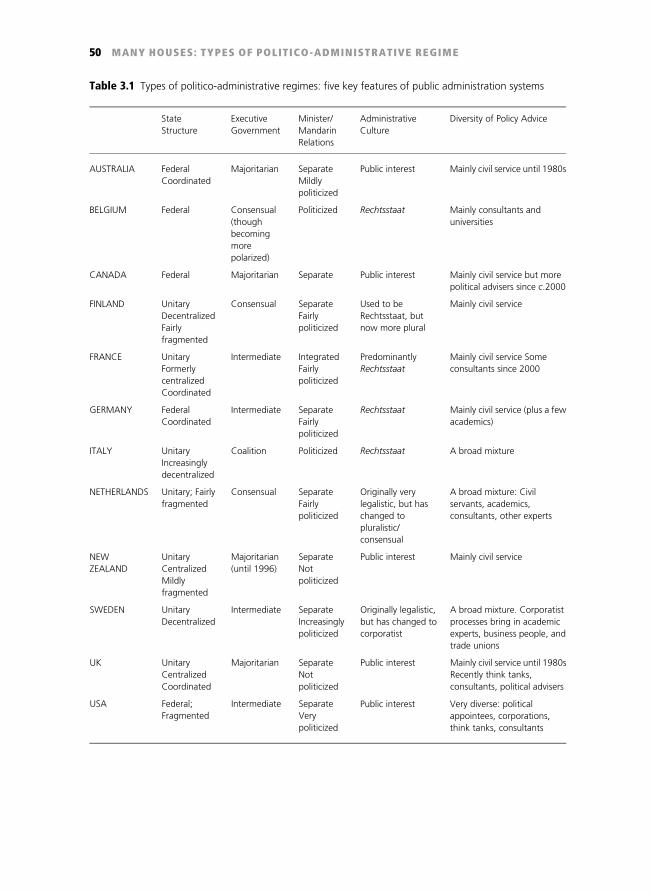
Table 3.1 Types of politico-administrative regimes: five key features of public administration systems
State
Structure
Executive
Government
Minister/
Mandarin
Relations
Administrative
Culture
Diversity of Policy Advice
AUSTRALIA Federal
Coordinated
Majoritarian Separate
Mildly
politicized
Public interest Mainly civil service until 1980s
BELGIUM Federal Consensual
(though
becoming
more
polarized)
Politicized Rechtsstaat Mainly consultants and
universities
CANADA Federal Majoritarian Separate Public interest Mainly civil service but more
political advisers since c.2000
FINLAND Unitary
Decentralized
Fairly
fragmented
Consensual Separate
Fairly
politicized
Used to be
Rechtsstaat, but
now more plural
Mainly civil service
FRANCE Unitary
Formerly
centralized
Coordinated
Intermediate Integrated
Fairly
politicized
Predominantly
Rechtsstaat
Mainly civil service Some
consultants since 2000
GERMANY Federal
Coordinated
Intermediate Separate
Fairly
politicized
Rechtsstaat Mainly civil service (plus a few
academics)
ITALY Unitary
Increasingly
decentralized
Coalition Politicized Rechtsstaat A broad mixture
NETHERLANDS Unitary; Fairly
fragmented
Consensual Separate
Fairly
politicized
Originally very
legalistic, but has
changed to
pluralistic/
consensual
A broad mixture: Civil
servants, academics,
consultants, other experts
NEW
ZEALAND
Unitary
Centralized
Mildly
fragmented
Majoritarian
(until 1996)
Separate
Not
politicized
Public interest Mainly civil service
SWEDEN Unitary
Decentralized
Intermediate Separate
Increasingly
politicized
Originally legalistic,
but has changed to
corporatist
A broad mixture. Corporatist
processes bring in academic
experts, business people, and
trade unions
UK Unitary
Centralized
Coordinated
Majoritarian Separate
Not
politicized
Public interest Mainly civil service until 1980s
Recently think tanks,
consultants, political advisers
USA Federal;
Fragmented
Intermediate Separate
Very
politicized
Public interest Very diverse: political
appointees, corporations,
think tanks, consultants
50 MANY HOUSES: TYPES OF POLITICO-ADMINISTRATIVE REGIME
Some states are highly centralized, with all significant decisions concentrated at the top
level, some much more decentralized. The second dimension concerns the degree of
horizontal coordination at central government level—that is, how far central executives
are able to ‘get their acts together’ by ensuring that all ministries pull together in the same
direction. This dimension ranges from the pole of ‘highly coordinated’ to ‘highly frag-
mented’. As we stressed in the previous section, these basic features can change (for
example, a number of countries have recently declared that they are pursuing better
horizontal coordination—see 6, 2004; Bogdanor, 2005; Bouckaert et al., 2010; Christensen
and Lægreid, 2007b; Kernaghan, 2009b), but on the whole such change is quite slow.
In terms of the first dimension, the vertical dispersion of authority tends to be greatest
within federal constitutions and least within the constitutions of unitary and centralized
states. In a unitary state there is no constitutionally entrenched division of state power.
Central government retains ultimate sovereignty, even if particular authority is delegated
to subnational tiers of government. In a federal state, the constitution itself prescribes
some division of sovereignty between different bodies—for example in the USA between
the federal government and the state governments or, in Germany, between the federal
government and the L€ander. Of the countries included in this study, Australia, Belgium,
Canada, Germany, and the USA are federal states.
However, we wish to distinguish further within the category of ‘unitary’ states. Some of
these may be highly centralized (e.g. France, at least until the 1980s’ decentralization
reforms; New Zealand; the UK), whilst others are extensively decentralized (e.g. the Nordic
states, where many powers have been delegated from ministries to agencies, and where
local governments (counties, municipalities, etc.) have statutorily well-protected indepen-
dence from central government). In such circumstances the degree of de facto decentrali-
zation in a unified state can equal, or even exceed, the decentralization of a federal state
(incidentally, the concept of decentralization is notoriously complex and we are only
skating over the surface here—see Pollitt, 2005). In Sweden, for example, the reforms of
the 1980s and 1990s further decentralized an already decentralized state, expanding the
‘local state’ at the expense of an increasingly anorexic group of central ministries (Miche-
letti, 2000; Molander, Nilsson, and Schick, 2002).
What are the consequences of these distinctions for public management reform? All
other things being equal, reforms in highly decentralized states (whether they be unitary
or federal) are likely to be less broad in scope and less uniform in practice than in
centralized states. In decentralized states, different entities are likely to want, and to be
able, to go in different directions, or at least not all in the same direction at the same time.
The federal governments in Washington DC or Brussels or Canberra simply cannot order
the subnational governments to reform themselves in particular ways. In Germany, the
L€ander have tended to grow in strength (even aspiring to separate representation at
European Community level), and different L€ander have adopted varying stances towards
administrative reform (Schr€oter and Wollmann, 1997). Indeed, it is often argued that
federal states have the advantage that they form ‘natural laboratories’, where one
approach can be tried in one state or at one level, while another is tried elsewhere. Even
if external pressures are similar, states within a federation may adopt quite widely
varying trajectories for management reform (see Halligan and Power, 1992, for Australia;
see Vancoppenolle and Legrain, 2003, for Belgium). By contrast, one may refer to the
MANY HOUSES: TYPES OF POLITICO-ADMINISTRATIVE REGIME 51
actions of Mrs Thatcher’s administration in the unitary UK when, in 1986, irritated with
certain local authorities for a mixture of doctrinal and administrative reasons, central
government simply abolished the Greater London Council and the six largest metropoli-
tan county councils.
Another possible contrast between a highly centralized state and a highly decentralized
state concerns the focus of management reforms. Central governments in centralized
states tend to be more heavily involved in the business of service delivery (education,
health care, etc.) than do the central governments of decentralized states (where these
functions tend to be taken care of by lower tiers of government). It has been suggested that
this may lead reformers in such centralized states towards a narrower focus on service-
specific outputs and results (as in New Zealand during the late 1980s and early 1990s),
rather than towards a more strategic concern with policy impacts and overall outcomes (as
in Australia during the same period—see Holmes and Shand, 1995). Behind this concern
one may often detect budgetary preoccupations—if central government is responsible for
runningmajor welfare state services such as social security, health care, or education, these
are likely to dominate its overall spending profile. When pressures to restrain public
spending mount it is to these services that ministries of finance are obliged to turn their
attention, as we are currently witnessing in the aftermath of the 2008 global economic
crisis. Of course, even where local governments provide such services, central government
may to a considerable extent be paying for them. In such circumstances, central govern-
ment may seek to offload cuts onto local authorities, sometimes icing the cake by
promising local authorities greater freedom to shift spending within a block budget—but
making the total size of the block smaller than previously. Something like this happened,
for example, in the Netherlands in the 1980s, in Finland during the mid 1990s, and in the
UK in the aftermath of the 2008 GEC.
Among our unitary states, Finland and Sweden have been rather decentralized through-
out the period under consideration. New Zealand and the UK have remained highly
centralized throughout the same period (although in the UK case one must qualify
this to the extent that powers have been devolved to Scotland, Wales, and Northern
Ireland). New Zealand and the UK are also the countries which have carried through the
most vigorous, broad-scope management reforms among the twelve states under consid-
eration (which therefore fits with our analysis). France is an interesting case because,
having been famously highly centralized until the early 1980s, it then embarked upon a
series of structural decentralizations, the full effects of which have been profound. The
impacts of these changes appear to have included a modest decline in central govern-
ment’s share of both total public expenditure and total taxation.
Table 3.2 shows two indicators of centralization—and reveals truly impressive differ-
ences among our twelve countries. Clearly some countries are much more ‘centre-heavy’
than others. The expenditure column shows New Zealand with an astonishingly high
central government presence (almost 90 per cent of general government spending)
followed by the UK at 71.6 per cent and the USA at 56.3 per cent. Meanwhile Belgium,
Canada, Finland, and the Netherlands each record less than 30 per cent, with Germany
claiming the lowest share of all—19.1 per cent. The employment column shows that
both Italy and the UK have more than 50 per cent of their public service labour force in
central government (the figures for New Zealand were not available, but would probably
52 MANY HOUSES: TYPES OF POLITICO-ADMINISTRATIVE REGIME
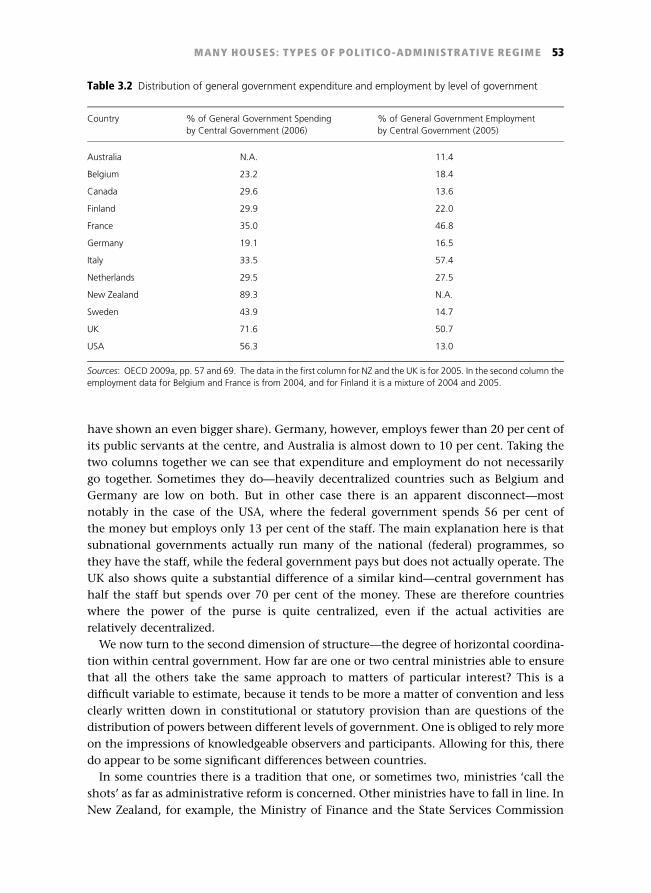
have shown an even bigger share). Germany, however, employs fewer than 20 per cent of
its public servants at the centre, and Australia is almost down to 10 per cent. Taking the
two columns together we can see that expenditure and employment do not necessarily
go together. Sometimes they do—heavily decentralized countries such as Belgium and
Germany are low on both. But in other case there is an apparent disconnect—most
notably in the case of the USA, where the federal government spends 56 per cent of
the money but employs only 13 per cent of the staff. The main explanation here is that
subnational governments actually run many of the national (federal) programmes, so
they have the staff, while the federal government pays but does not actually operate. The
UK also shows quite a substantial difference of a similar kind—central government has
half the staff but spends over 70 per cent of the money. These are therefore countries
where the power of the purse is quite centralized, even if the actual activities are
relatively decentralized.
We now turn to the second dimension of structure—the degree of horizontal coordina-
tion within central government. How far are one or two central ministries able to ensure
that all the others take the same approach to matters of particular interest? This is a
difficult variable to estimate, because it tends to be more a matter of convention and less
clearly written down in constitutional or statutory provision than are questions of the
distribution of powers between different levels of government. One is obliged to rely more
on the impressions of knowledgeable observers and participants. Allowing for this, there
do appear to be some significant differences between countries.
In some countries there is a tradition that one, or sometimes two, ministries ‘call the
shots’ as far as administrative reform is concerned. Other ministries have to fall in line. In
New Zealand, for example, the Ministry of Finance and the State Services Commission
Table 3.2 Distribution of general government expenditure and employment by level of government
Country % of General Government Spending
by Central Government (2006)
% of General Government Employment
by Central Government (2005)
Australia N.A. 11.4
Belgium 23.2 18.4
Canada 29.6 13.6
Finland 29.9 22.0
France 35.0 46.8
Germany 19.1 16.5
Italy 33.5 57.4
Netherlands 29.5 27.5
New Zealand 89.3 N.A.
Sweden 43.9 14.7
UK 71.6 50.7
USA 56.3 13.0
Sources: OECD 2009a, pp. 57 and 69. The data in the first column for NZ and the UK is for 2005. In the second column the
employment data for Belgium and France is from 2004, and for Finland it is a mixture of 2004 and 2005.
MANY HOUSES: TYPES OF POLITICO-ADMINISTRATIVE REGIME 53
were able to drive through the huge changes of the ten-year period after 1984 (Boston et al.,
1996). In the UK, the Treasury is usually able to get its way, especially when it is in agreement
with theCabinetOffice. In several states, one effect of theGEChas been, at least temporarily,
to strengthen the role of ministries of finance. Other countries, however, are more fragmen-
ted in this regard. In theNetherlands, noministry enjoys the degree of pre-eminence held by
the New Zealand Ministry of Finance or the UK Treasury. In the USA, the picture is compli-
cated by the unusual strength of the legislature. The strong direct links between, on the one
hand, the Senate and the House of Representatives and, on the other, the individual depart-
ments and agencies, and Congress’s ability to ‘micro-manage’ federal organizations, some-
times cut across the intentionsof the President and the executive leadership (seeAppendixB:
USA, country file, and Peters, 1995). In France, although the grands corps form a strong ‘glue’
at the top of the system, the state as awhole has for some timebeen regarded as a ‘fragmented
machine’ and ‘Ministerial structures are always in turmoil’ (Rouban, 1995, pp. 42, 45).
Nevertheless, we must again enter the caveat that changes do sometimes occur. In 2005
the creation of a Directorate General for State Modernization (within the Ministry of
Finance) marked a lessening of the fragmentation in public management reform (Bezes,
2007). Germany is more fragmented still: ‘Instead of having one single powerful actor or
agency, possibly at the national level, that would take the lead, and have the say in public
sector reform issues, the German politico-administrative system has a multitude of such
arenas and actors’ (Schr€oter and Wollmann, 1997, p. 187; see also Bach and Jann, 2010).
3.4 The nature of executive government
Whatever the scope of central government might be, what goes on within that scope will
be shaped by the working habits and conventions of that particular executive. Compara-
tivist political scientists have developed a useful typology of these conventions, the basic
features of which are as follows:
Single-party or minimal-winning or bare majority: where one party holds more than 50 per
cent of the seats in the legislature;
Minimal-winning coalitions: where two or more parties hold more than 50 per cent of the
legislative seats;
Minority cabinets: where the party or parties composing the executive hold less than 50 per
cent of the legislative seats;
Oversized executives or grand coalitions: where additional parties are included in the execu-
tive beyond the number required for a minimal winning coalition (Lijphart, 1984; see also
a slightly changed but fundamentally equivalent classification in the later Lijphart, 1999,
pp. 90–1).
The importance of these types is that each tends to generate a different set of governing
conventions. Of course, following elections, the executive of a given country can change
from one of these types to another, but in practice such shifts are comparatively rare
54 MANY HOUSES: TYPES OF POLITICO-ADMINISTRATIVE REGIME
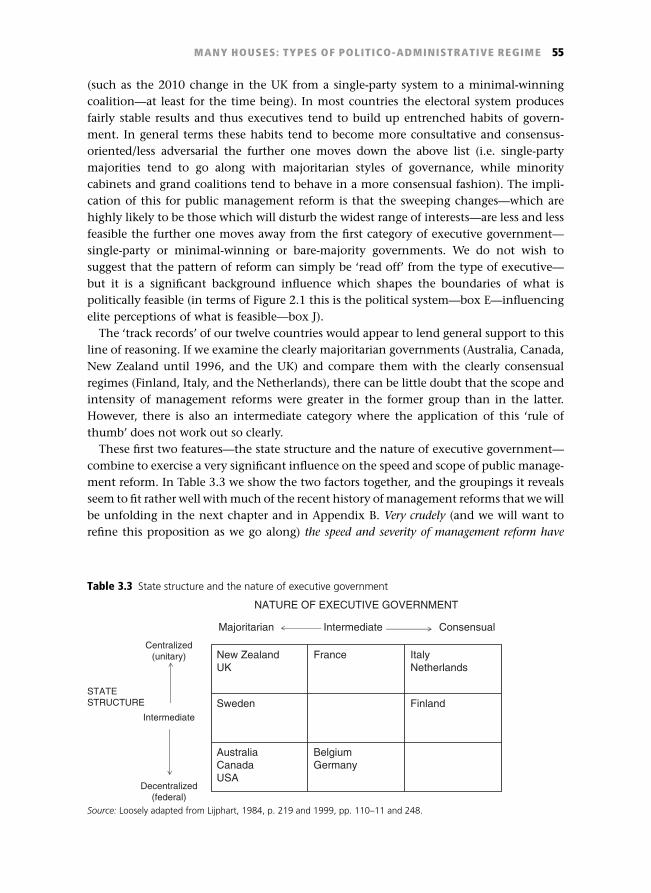
(such as the 2010 change in the UK from a single-party system to a minimal-winning
coalition—at least for the time being). In most countries the electoral system produces
fairly stable results and thus executives tend to build up entrenched habits of govern-
ment. In general terms these habits tend to become more consultative and consensus-
oriented/less adversarial the further one moves down the above list (i.e. single-party
majorities tend to go along with majoritarian styles of governance, while minority
cabinets and grand coalitions tend to behave in a more consensual fashion). The impli-
cation of this for public management reform is that the sweeping changes—which are
highly likely to be those which will disturb the widest range of interests—are less and less
feasible the further one moves away from the first category of executive government—
single-party or minimal-winning or bare-majority governments. We do not wish to
suggest that the pattern of reform can simply be ‘read off’ from the type of executive—
but it is a significant background influence which shapes the boundaries of what is
politically feasible (in terms of Figure 2.1 this is the political system—box E—influencing
elite perceptions of what is feasible—box J).
The ‘track records’ of our twelve countries would appear to lend general support to this
line of reasoning. If we examine the clearly majoritarian governments (Australia, Canada,
New Zealand until 1996, and the UK) and compare them with the clearly consensual
regimes (Finland, Italy, and the Netherlands), there can be little doubt that the scope and
intensity of management reforms were greater in the former group than in the latter.
However, there is also an intermediate category where the application of this ‘rule of
thumb’ does not work out so clearly.
These first two features—the state structure and the nature of executive government—
combine to exercise a very significant influence on the speed and scope of public manage-
ment reform. In Table 3.3 we show the two factors together, and the groupings it reveals
seem to fit rather well withmuch of the recent history ofmanagement reforms that we will
be unfolding in the next chapter and in Appendix B. Very crudely (and we will want to
refine this proposition as we go along) the speed and severity of management reform have
Table 3.3 State structure and the nature of executive government
Majoritarian Intermediate
NATURE OF EXECUTIVE GOVERNMENT
Consensual
New Zealand UK
France ItalyNetherlands
Sweden Finland
AustraliaCanadaUSA
BelgiumGermany
Centralized(unitary)
Intermediate
Decentralized(federal)
STATESTRUCTURE
Source: Loosely adapted from Lijphart, 1984, p. 219 and 1999, pp. 110–11 and 248.
MANY HOUSES: TYPES OF POLITICO-ADMINISTRATIVE REGIME 55
declined as one moves from the left to right, and the scope of reform (the amount of the public
sector any one reform programme affects) has declined as one moves from top to bottom.
This kind of analysis rests on a whole set of definitions and approximations, and it is
important to examine these carefully. That having been said, such a scheme leads to two
important propositions. First, deep and rapid structural reforms to the administrative
apparatus tend to be less difficult in majoritarian regimes than in consensual ones. The
general reason for this is that such changes usually create ‘winners’ and ‘losers’, and the
more consensual the regime, the more likely it is that the losing interests will be directly
represented in the executive, and will seek to prevent, delay, or dilute the envisaged
changes. Thus, consensual regimes are less inclined to, and, in terms of political feasibility,
less capable of dramatic, radical reforms than are strongly majoritarian executives. The
latter can force through their own schemes even against opposition from a range of other
interests. In case this sounds like a ‘plug’ for majoritarian regimes, let it also be said that
these same qualities mean that majoritarian governments may be more prone to disrup-
tive policy reversals. In the UK, for example, during the period of ‘New Labour’ govern-
ment from 1997 to 2010, many commentators noted that the rapidity of departmental
and other reorganizations was leading to confusion, cynicism, and some short-term loss of
performance (Pollitt, 2007; White and Dunleavy, 2010). A long-term comparison with
Belgium showed a much more modest rate of structural change in the more consensual,
federal state (Pollitt and Bouckaert, 2009). (We should note, however, that towards the end
of our period Belgium was becoming less and less consensual, as the struggle between
Flanders and Wallonia intensified).
As a footnote to this section of the argument, we should note that Yesilkagit andDe Vries
(2004) challenged the notion that consensus democracies are unable to match majoritar-
ian regimes in the radicalness of their reforms. They argued that reforms in the (consen-
sual) Netherlands were as far reaching as those in (majoritarian) New Zealand. We find
their argument unconvincing, for several reasons. First, the idea that the Netherlands has
ever carried through reforms as radical as those in New Zealand between 1984 and 1993
strikes us as a misreading of the record (compare the country files in Appendix B). Second,
they argue that studies have not looked closely enough at the implementation phase,
where consensus democracies may have some advantages. We think this is wrong on both
counts. First, there have been studies of implementation (e.g. Pollitt et al., 2004; Pollitt and
Bouckaert, 2009) which do show a ‘softer’ approach in consensual regimes. Second, our
argument has never been that consensus democracies are poorer at implementation. On
the contrary, we acknowledge that a consensually conceived reform may even have a
better chance of surviving the implementation phase (and less chance of being thrown
aside when a government changes—Pollitt 2007). ‘Softer’ is by no means necessarily
‘weaker’. Finally, Yesilkagit and De Vries suggest that the institutions of majoritarianism
will not by themselves explain reform outcomes. But that has never been our argument: as
Figure 2.1 and the sequence of this chapter make clear, our argument is that having a
majoritarian regime and culture is one (important, but not all powerful) factor that seems,
looking at twelve countries over thirty years, to be an important part of the explanation for
the patterns and partial patterns which we see.
The second proposition is that more centralized countries find it less difficult to carry
out sweeping, synoptic reforms than more decentralized ones. This is one reason why, for
56 MANY HOUSES: TYPES OF POLITICO-ADMINISTRATIVE REGIME
example, we will find that management reforms in New Zealand and the UK have been
deeper and wider than in Canada and the USA (both federal, decentralized states), despite
the fact that all four of these countries are usually majoritarian rather than consensual
democracies.
The form of the political executive can thus affect change at several stages in the process
of reform. First, it influences the degree of leverage that can be created to launch a
programme of reform. Second, it may affect the stability of reforms, once carried through
(consensually based innovations are hypothesized to have a higher life expectancy than
single-party-based innovations, which are more likely to be overturned when a rival party
gets back into power). Third, there may also be an impact on the sense of ‘ownership’ of
reformmeasures. Insofar as these are seen to have emerged from a broadly based consensus
of political opinion, they may assume a legitimacy among the public servants who have to
carry them out. If, however, specific reforms are perceived as the doctrinaire instruments of
a single party or group, then public servants may resist taking any ‘ownership’, regarding
them with resentment, as alien impositions which may be delayed or diluted as much as
possible. This kind of resistance may be even more likely where senior civil servants are
independent, high-status ‘trustees’ rather than politically patronized ‘agents’ (Hood and
Lodge, 2006). In terms of Figure 2.1 the nature of executive government (E) may thus
affect not only perceptions of desirability and feasibility (J) but also the contents of reform
packages (L), the implementation process (M), and the extent of reform eventually
achieved (N).
We have looked at the clearest-cut cases—the extremes of majoritarianism and consen-
sualism. Now let us examine some more ‘mixed’ examples. France is in an intermediate
position—it has a multi-party system, but possesses a very strong executive figure in the
shape of the president. When the president is of a party which is also a major party in the
government, France has quite a majoritarian ‘tinge’. During these periods (e.g. 1982–4,
1988–92, and 2002– ), extensive public management reforms have been carried out (see
entry for France in Appendix B). However, at other times, the president has had to work
with a prime minister who is not of the same party (cohabitation) and during these
interludes policymaking is likely to be more cautious. Overall, France may be said to
have an intermediate regime, and to be a ‘middling’ player in terms of the extent and
intensiveness of its management reforms. Thus the hypothesized connection still stands.
Italy is a second ‘mixed’ case. During the 1990s it experienced deep political crisis, and
moved from a proportional/coalition system towards a more majoritarian system, and
from a highly centralized system towards a system with strong regions, provinces,
and municipalities. The executive continues to be a coalition, but usually now with a
dominant party. These shifts have been accompanied by a wave of administrative reforms
(Ongaro, 2009). From the perspective of our model, it would be convenient to claim that
the upsurge in administrative reform was linked to the move towards a more majoritarian
system. In truth, however, what we have witnessed during the past fifteen years has been
a confusion of initiatives, heading in several different directions. The grip of the central-
ized bureaucracy certainly seems to have weakened, and the concept of ‘consumer service’
has gained some ground, but the smoke has not yet cleared from the various political
and administrative battles, and Italy is hard to classify with much confidence. This
is partly because some of the factors which are most stable in other countries—such
MANY HOUSES: TYPES OF POLITICO-ADMINISTRATIVE REGIME 57
as the party system or the balance between national and subnational levels of govern-
ment—have been in prolonged flux in Italy (Ongaro, 2009). It is also because the ‘imple-
mentation gap’—the chasm between official reform pronouncements and achieved
organizational change ‘on the ground’—may well be larger in Italy than in countries
such as Canada, Finland, Sweden, or the UK (Ongaro and Valotti, 2008).
A third case would be Finland, again an intermediate case, but further towards the consen-
sual end of the spectrum than France or Italy. Here the state structure is unitary, and oversized
coalitions are common. The political culture is one of consensual caution andmutual accom-
modation. Inter-party disputes certainly occur, but their tone is seldom as fierce as is common
in France or Italy or the UK. In the Finnish case we find a history of substantial but non-
doctrinaire reforms which have been implemented calmly and continuously over a period of
two decades and which have traversed the periods of office of a number of coalition govern-
ments of varying mixtures of parties (see Appendix B and Pollitt et al., 1997).
Before concluding this section it is worth examining two further cases, Germany and the
USA. In the German case the structure of the state is federal and extensively decentralized
(the ‘subsidiarity principle’), while the form of executive government has usually, but not
always, been that of a minimal-winning coalition (for 71 per cent of the time between
1945 and 1996—Lijphart, 1999, p. 110). The effects of the state structure have been
profound:
Lacking a single, possibly centrally-located powerful protagonist and trend-setter in public sector
reform matters and, instead, disposing of a multitude of such arenas and actors each interacting in
its own right, it almost follows from the ‘logic’ of the German federal system that public sector
reform activities are bound to proceed in a disjointed and incrementalist rather than a comprehen-
sive and ‘wholesale’ manner. (Schr€oter and Wollmann, 1997, p. 188)
The effect of the nature of the executive government has been less clear. In theory the
minimum-winning coalition provides a strong Chancellor with good possibilities for
carrying through reforms. In the specific case of public administration, however, this
possibility tends to be outweighed by the structural factors referred to above. Most public
servants are not employed by, and most public programmes are not administered at, the
central (federal) level. Also, the federal government’s freedom of manoeuvre is restricted
by the Federal Civil Service Framework Law. Considerable change has, however, taken
place at the level of the L€ander, and in particular cities.
Finally, the USA is a fascinating example of an executive with mixed characteristics. On
the one hand, in relation to the nature of executive government it is quite strongly
majoritarian (one-party cabinets for 89 per cent of the period 1945–96). This would lead
one to hypothesize the possibility of vigorous, broad-scope management reforms—
at least during those periods when the president is of the same party as holds the majority
in Congress (at other times there may be an American parallel with the French cohabita-
tion, although one in which the legislature is relatively much more powerful than it is in
France). However, state structure pushes in quite a different direction. The USA is a
decentralized, federal state, with a somewhat rigid constitution. One further element
needs to be taken into account. The US legislature (House of Representatives plus Senate)
is unusually strong relative to the executive, and, furthermore, the executive does not
wield the same control over same-party members in the legislature as is enjoyed by, say,
58 MANY HOUSES: TYPES OF POLITICO-ADMINISTRATIVE REGIME
the British Cabinet. These factors further qualify the picture of majoritarian strength, and
change the hypothesis in the direction of a more cautious assessment of the executive’s
reform capacity. When one comes to examine the track record of reform, it is a mixture.
From time to time presidents have loudly proclaimed their intentions fundamentally to
reform the management of federal departments and agencies, but actual achievements
have lagged far behind (Ingraham, 1997; Pollitt, 1993; Mihm, 2001; Radin, 1998, 2000;
Schick, 2001; GAO, 2001). White and Dunleavy (2010, p. 23) describe the situation as
follows:
All US departmental reorganizations have to be approved by Congress, and changes are generally
opposed because of their inevitably disruptive effects on the existing structure of congressional
committees and sub-committees, many of whose powerful incumbents often stand to lose out from
any reorganization.
This ‘more mouth than muscle’ picture closely corresponds with the two dimensions
depicted in Table 3.3.
Of course, although state structure and the nature of executive government do seem to
be important determinants of change, they usually act in combination with other factors.
They permit, but do not, of themselves, ‘drive’. That requires the intervention of some
dynamic agency, such as a flow of new ideas allied to determined leadership. Rhodes
(1997, p. 44) reviewed the UK experience and came to this answer:
[W]hy was the pace of change in Britain greater than elsewhere in Western Europe? Three factors
were of overriding importance. First, Margaret Thatcher pushed through reform of the civil service.
The phrase political will is commonly used to explain the government’s determination. Strong,
directive and above all persistent, executive leadership is longer but more accurate.
Second, there are few constitutional constraints on that leadership, especially when the govern-
ment has a majority in Parliament . . . Central administrative reform in Britain does not require a
statute, only the exercise of Crown Prerogative, or executive powers.
Finally, the government evolved a clear ideological strategy to justify and sell its various
reform packages. It attacked big government and waste, used markets to create more
individual choice and campaigned for the consumer.
3.5 Mandarin/minister relations
In all countries, major public management reforms usually involve both executive politi-
cians and senior public servants. Together they usually constitute themain part of the elite
which makes the crucial decisions about reform (box J in Figure 2.1).
However, the relationships between these two elite groups vary considerably from one
country to another, and over time. This is the question of what kind of ‘bargain’ or deal
exists between top politicians and top civil servants (Hood and Lodge, 2006).What do they
expect from each other? For example, are political careers separate from, or integratedwith,
the careers of ‘mandarins’? (Pierre, 1995). Are senior civil service positions themselves
politicized, in the sense that most of their occupants are known to have (and have been
MANY HOUSES: TYPES OF POLITICO-ADMINISTRATIVE REGIME 59
chosen partly because they have) specific party political sympathies?Mandarins can still be
politicized in this sense even if their careers are separate from those of politicians (as often
happens in Germany). Or again, how secure are senior civil service jobs? Do mandarins
enjoy strong tenure, remaining in post as different governments come and go? Security of
tenure actually seems to have been declining in a number of our selected countries,
including Australia, Canada, France, Italy, and New Zealand—see also Demmke and Moi-
lanen, 2010, pp. 96–103. Or are their fortunes tied to party political patronage, so that they
face some form of exile—of ‘being put out to grass’ if the party in power changes? Or are
they employed on performance-related contracts, so that they can survive changes of
government, but not a repeated failure to reach their performance targets?
Unfortunately, scholars have as yet failed to agree on a single, robust way of classifying
these important differences. The Hood and Lodge scheme (2006—we will come back to it
in the next chapter) is a good start, but its originators themselves recognize that its
categories are neither mutually exclusive nor jointly exhaustive. We are therefore left
with a slightly messy situation, in which we are reasonably convinced that the type of
bargain is likely to affect the direction and speed of public management reform, but where
we can as yet describe that connection only in a fairly ad hoc, descriptive way.
The effects of different ‘bargains’ on management reforms may be quite subtle. They
concern, in particular, ‘ownership’ of reforms at different levels within the administrative
system. Thus, where ministerial and mandarin careers are integrated, one might imagine
that the ownership of reforms at the highest levels would be more easily achieved than in
systems where the two career paths are entirely distinct. So in a system such as that of the
grands corps in France, where many ministers would share closely intertwined careers with
the senior civil servants, the shaping of reform packages can rely upon shared perspectives
and a common professional socialization to an extent that would not usually be the case
in, say, Canada or the UK. However, in a French-type system of integrated careers the
problem of ownership may reappear lower down the hierarchy, where rank-and-file public
officials feel little kinship or identification with the politicized high-flyers of the grands
corps. In terms of Figure 2.1 the French problem may be with the implementation process
(box M) more than with the original shaping of the ‘package’ (box L)—as does indeed
sometimes seem to have been the case.
Another one of the variables mentioned above—that of the politicization of top
posts—adds its influence in roughly the same direction. It creates a bigger gap between
the mandarins and the rank and file than would otherwise exist, and may lower the
legitimacy of the former in the eyes of the latter. However, in its extreme form—where
the occupancy of top civil service positions changes on a large scale following the
election of a new political executive—the effect may be one of creating instability in
the reform process. This would particularly dog administrative reform because reshaping
organizations and standard operating procedures tends to take several years to carry
through (Pollitt, 2008). We can illustrate this with several examples. Germany (G€otz,
1997) and Finland (Tiihonen, 1996) offer cases of moderate politicization where the party
political affiliations of senior officials have been important but where a change of
government did not result in the wholesale ‘slaughter’ and replacement of the manda-
rinate. In the Finnish case, the governments were coalitions and the style was consensual,
and these factors enabled considerable continuity and stability to be achieved in public
60 MANY HOUSES: TYPES OF POLITICO-ADMINISTRATIVE REGIME
management reform. In the German case, the effects were masked by the long tenure of
the Kohl-led conservative–liberal coalition, and, in any case, when German governments
change there are opportunities for mandarins who are unsympathetic towards the new
regime to take study leave or be moved to a variety of less politically sensitive roles (G€otz,
1997). The American example is more extreme. The ‘spoils system’ results in an incoming
president rapidly replacing a large number of senior officials in Washington, producing
an odd situation which one American academic has memorably described as a ‘govern-
ment of strangers’ (Heclo, 1977). The number of political appointees grew from 451 in
1960 to 2,393 in 1992 (Kettl et al.,1996, p. 82) and has grown further since. Change on
this scale certainly disturbs continuity. As we will see later, the reform programme of the
National Performance Review, which had been given great prominence by Democratic
President Clinton and Vice President Gore during the mid and late 1990s, almost
instantly disappeared when Republican George W. Bush came to power in 2000. One
group of American scholars describe the general problem as follows:
It is one thing to rely on political appointees to set basic agency policy. It is quite another to appoint
so many political appointees that they extend deeply into an agency’s middle management. These
extra layers increase the distance from the government’s top to its bottom and can frustrate the
ability of top leaders to give voice to their policies. The layers complicate the flow of information in
both directions. They hinder the always difficult job of translating broad goals into specific goals
and manageable objectives. They create an artificially low ceiling on the career paths for the
bureaucracy’s long term officials and, therefore, impose additional frustrations on the federal
government’s career work force. (Kettl et al., 1996, p. 83)
This state of affairs may be contrasted with what passes for normalcy in Canada, New
Zealand, or the UK. In these countries few overtly party-political appointments are made to
the upper reaches of the public service, and ‘mandarins’ can normally expect to serve out all
or most of their working lives within the upper reaches of the state machine. This brings, in
equalmeasure, the benefits of continuity and accumulated knowledge, and the drawbacks of
conservatism (‘seen it all before’) and limited breadth of experience. In these countries the
career patterns of ministers and mandarins are largely separate. Even here, however, an
important qualificationmust be entered. Inmost of these countries the category of ‘political
advisers’—individuals who are neither politicians nor career civil servants, but who are
doctrinally sympathetic to the party in power—has grown in numbers and influence since
the mid 1990s ( Aucoin and Savoie, 2009; Peters and Pierre, 2004)
3.6 The philosophy and culture of governance
Having considered the ‘normal habits’ or ‘traditions’ of government (consensualism,
majoritarianism, and their variants) and the relations between ministers and mandarins,
we can now begin to examine the ‘normal beliefs’ of administration. Can distinctive
administrative cultures be identified, each with its own characteristic pattern of values
and assumptions and, if so, how do these affect the process of administrative reform?
MANY HOUSES: TYPES OF POLITICO-ADMINISTRATIVE REGIME 61
A number of writers have argued for the existence of two particularly strong models:
‘Most public administrative systems seem to be guided either by the Rechtsstaat model or
by the Anglo Saxon notion of the “public interest”; very few systems fall between these
two models, which appear to be inherently inconsistent and irreconcilable’ (Pierre, 1995,
p. 8). In this connection, the ‘Napoleonic’ states (including France and Italy) constitute an
important sub-family within the Rechtsstaat model (Ongaro, 2009, pp. 252–63).
From the Rechtsstaat perspective, the state is a central integrating force within society,
and its focal concerns are with the preparation, promulgation, and enforcement of laws. It
follows from this that most senior civil servants will be trained in the law and, indeed, that
a large and separate body of specifically administrative law will have been created. In such a
culture, the instinctive bureaucratic stance will tend to be one of rule-following and
precedent, and the actions of both individual public servant and individual citizen will
be set in this context of correctness and legal control. The oversight of such a system will
require a hierarchy of administrative courts, such as the Conseil d’Etat in France and
Belgium or the Bundesverwaltungsgericht in Germany. The typical values of this approach
will include respect for the authority of the law as a socially necessary and integrating
force, attention to precedent, and a concern with equity, at least in the sense of equality
before the law. All in all:
[I]t has become sufficiently clear now that, in countries like France and Germany, the issue of New
Public Management in the civil service meets with cultural premises that differ from those in Anglo-
Saxon countries. (K€onig, 1997, p. 222; see also Bouckaert, 2007 and Ongaro, 2009, p. 223)
By contrast, the ‘public interest’ model accords the state a less extensive or dominant role
within society (indeed, use of the phrase ‘the state’ is rare within originally ‘Anglo-Saxon’
states such as Australia, New Zealand, and the UK). ‘Government’ (rather than ‘the state’)
is regarded as something of a necessary evil, whose powers are to be no more than are
absolutely necessary, and whose ministers and officials must constantly be held to public
account by elected parliaments and through other means. Of course, the law is an essential
component of governance, but its particular perspectives and procedures are not as
dominant as within the Rechtsstaatmodel. All citizens are under the law, but law is usually
in the background rather than the foreground, and many senior civil servants have no
special training in its mysteries (as in the UK case, where the majority of senior officials are
‘generalists’). Civil servants are regarded as simply citizens who work for government
organizations, not some kind of special caste or cadre with a higher mission to represent
‘the state’. The process of government is seen as one of seeking to obtain the public’s
consent for (or, at least, acquiescence in) measures devised in the public (general, national)
interest. It is recognized that different social interest groups compete with one another,
sometimes in fiercely adversarial ways. In this context, government’s job is to play the part
of a fair and trusted referee, and not to get drawn in on one side or another. Fairness and
independence of the play of sectional interests are therefore key values, with pragmatism
and flexibility as qualities which may be prized above technical expertise (or even above
strict legality).
What are the implications of each of these approaches for public management reform?
In general terms we might expect that Rechtsstaat systems would be ‘stickier’ and slower to
reform than public interest regimes. This is because management change would always
62 MANY HOUSES: TYPES OF POLITICO-ADMINISTRATIVE REGIME
require changes in the law and, culturally, because senior civil servants who are highly
trained in administrative law may find it more difficult than generalists to shift to a
‘managerial’ or ‘performance-oriented’ perspective. There is at least some circumstantial
evidence to support this interpretation. For example, French and German civil servants
often found it surprising that the UK executive agency programme could, within a decade,
have transferred more than two-thirds of non-industrial civil servants out of ministerial
departments and into a new form of organization without much new legislation being
required (see Appendix B: UK country file). By contrast, the small amount of restructuring
that has taken place in the federal German government has sometimes been explained as
partly a result of the constraining nature of the basic framework laws in that country
(Schr€oter and Wollmann, 1997).
However, Pierre’s categorization into two distinct camps is now fifteen years old, and is
beginning to look a bit dated. More recent work argues that the polar classification of
Rechtsstaat versus public interest is too crude, and that nowadays not a few, but most, civil-
service systems are mixtures (Demmke and Moilanen, 2010, p. 9; Hood and Lodge, 2006).
In a number of the countries under consideration there has been a considerable shift away
from a highly legalistic state form, but towards something other than a straightforward
public interest model. The Netherlands, Finland, and Sweden all fall into this mixed
category. The Netherlands went through a period of ‘dejuridification’ after the Second
WorldWar, and its administrative culture now appears as a complex mixture, with a rather
open attitude that brings a range of experts and representative groups into the policy-
making process. There are also remnants of the old ‘pillarization’ mind-set, insofar as it can
still be considered important to ensure that the administrative decision-making process
balances representation from each of the major social groups. It is an essentially consen-
sual approach, very different from the more closed and juridical purity of a full Rechtsstaat
philosophy. In both Finland and Sweden a training in law has in the past been normal for
higher public officials, but, as with the Netherlands, this juristic dominance has been
considerably diluted over the past forty or fifty years. In both countries, civil servants now
come from a wide variety of disciplinary backgrounds, and the culture of upper civil
service could be said to have as much to do with satisfying the demands for ‘coordination’,
‘partnership’, ‘responsiveness’, and ‘leadership’ as with a strict application of law. In both
countries, also, there is a sense of the weight, centrality, and continuity of the state—senior
public servants are not quite the anxious, harassed breed one often finds in Washington,
DC or sometimes in Whitehall.
There is therefore muchmore to administrative culture than just a bipolar scale running
from Rechtsstaat to public interest—as the expansion of writing about organizational
cultures and traditions over the past two decades testifies (see, e.g. Hood, 1998, Painter
and Peters, 2010; Schedler and Proeller, 2007). To summarize all that literature is beyond
us, but it may be worth selecting one particular approach, so as to illustrate the additional
insights that a cultural perspective can afford. Hofstede’s Culture’s Consequences (2001)
examines variations in values and organizational norms across fifty countries. It is based
on a quarter century of research and a wide range of studies and surveys—but is not
specifically focused on the public sector. It is relatively unusual in that it actually attempts
to quantify certain dimensions of culture. It produces measures for what Hofstede argues
are five critical cultural elements:
MANY HOUSES: TYPES OF POLITICO-ADMINISTRATIVE REGIME 63
� Power distance: the difference between the extent to which a boss can determine the
behaviour of a subordinate, and the extent to which the subordinate can determine the
behaviour of the boss. This is closely connected with the norms which exist in a given
culture about equality and inequality. A high power distance implies a high tolerance for
the existence and manifestation of inequality. For example, Hofstede tells a story of
seeing a Dutch prime minister holidaying at an ordinary Portugese camp site, and
suggests that, while this was not unusual in the Dutch culture (power distance index
38), it would be much less likely to be the choice of a French prime minister (power
distance index 65).
� Uncertainty avoidance: the extent to which the members of a culture feel threatened by
uncertain or unknown situations. Here one might compare, say, Belgium (index 94)
with Sweden (index 29).
� Individualism versus collectivism: ‘individualism stands for a society in which the ties
between individuals are loose: everyone is expected to look after him/herself and his/her
immediate family only. Collectivism stands for a society in which people from birth
onwards are integrated into strong, cohesive in-groups, which throughout people’s
lifetime continue to protect them in exchange for unquestioning loyalty’ (Hofstede,
2001, p. 225) The USA, a famously individualistic society, scores 91 on the individual-
ism/collectivism index, while Finland scores only 63.
� Masculinity versus femininity: ‘Masculinity stands for a society in which gender roles
are clearly distinct: men are supposed to be tough, assertive, and focused on material
success; women are supposed to be more modest, tender, and concerned with the
quality of life. Femininity stands for a society in which social gender roles overlap:
both men and women are supposed to be modest, tender, and concerned with the
quality of life’ (Hofstede, 2001, p. 297). On this dimension the scores of Germany (66)
and Italy (70) can be contrasted with the lower masculinity/higher femininity scores of
Sweden (5) and the Netherlands (14).
� Long-term versus short-term orientation: ‘Long term orientation stands for the fostering
of virtues oriented towards future rewards, in particular, perseverance and thrift. Its
opposite pole, short term orientation, stands for the fostering of virtues related to the
past and present, in particular, respect for tradition, preservation of “face” and fulfilling
social obligations’ (Hofstede, 2001, p. 359). Here the variation between ‘our’ countries
does not appear to be so great, but there is nevertheless a significant difference between,
on the one hand, Canada (23) and the USA (29) and the more long-term orientation of
Finland (41) and the Netherlands (44).
Table 3.4 sets out Hofstede’s findings for the twelve countries covered in our book.
What, the reader may well ask, does all this have to do with public management reform?
Quite a lot, wewould suggest. AlthoughHofstede’smeasures are usually taken from general
surveys, and are not focused specifically on civil servants or politicians, they presumably
reflect the broad cultural climates in which management reforms will have to be
announced, interpreted, promoted, and resisted in each particular country (Bouckaert,
2007). As a major recent comparative study of the civil services in twenty-seven EU states
puts it: ‘we agree that there is a connection between the culture of a nation or region, the
64 MANY HOUSES: TYPES OF POLITICO-ADMINISTRATIVE REGIME
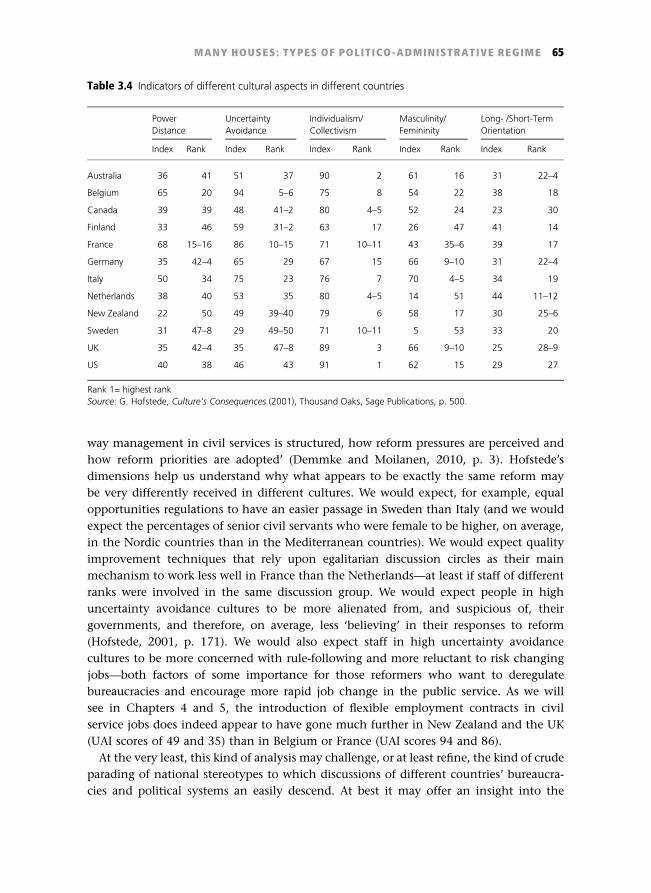
way management in civil services is structured, how reform pressures are perceived and
how reform priorities are adopted’ (Demmke and Moilanen, 2010, p. 3). Hofstede’s
dimensions help us understand why what appears to be exactly the same reform may
be very differently received in different cultures. We would expect, for example, equal
opportunities regulations to have an easier passage in Sweden than Italy (and we would
expect the percentages of senior civil servants who were female to be higher, on average,
in the Nordic countries than in the Mediterranean countries). We would expect quality
improvement techniques that rely upon egalitarian discussion circles as their main
mechanism to work less well in France than the Netherlands—at least if staff of different
ranks were involved in the same discussion group. We would expect people in high
uncertainty avoidance cultures to be more alienated from, and suspicious of, their
governments, and therefore, on average, less ‘believing’ in their responses to reform
(Hofstede, 2001, p. 171). We would also expect staff in high uncertainty avoidance
cultures to be more concerned with rule-following and more reluctant to risk changing
jobs—both factors of some importance for those reformers who want to deregulate
bureaucracies and encourage more rapid job change in the public service. As we will
see in Chapters 4 and 5, the introduction of flexible employment contracts in civil
service jobs does indeed appear to have gone much further in New Zealand and the UK
(UAI scores of 49 and 35) than in Belgium or France (UAI scores 94 and 86).
At the very least, this kind of analysis may challenge, or at least refine, the kind of crude
parading of national stereotypes to which discussions of different countries’ bureaucra-
cies and political systems an easily descend. At best it may offer an insight into the
Table 3.4 Indicators of different cultural aspects in different countries
Power
Distance
Uncertainty
Avoidance
Individualism/
Collectivism
Masculinity/
Femininity
Long- /Short-Term
Orientation
Index Rank Index Rank Index Rank Index Rank Index Rank
Australia 36 41 51 37 90 2 61 16 31 22–4
Belgium 65 20 94 5–6 75 8 54 22 38 18
Canada 39 39 48 41–2 80 4–5 52 24 23 30
Finland 33 46 59 31–2 63 17 26 47 41 14
France 68 15–16 86 10–15 71 10–11 43 35–6 39 17
Germany 35 42–4 65 29 67 15 66 9–10 31 22–4
Italy 50 34 75 23 76 7 70 4–5 34 19
Netherlands 38 40 53 35 80 4–5 14 51 44 11–12
New Zealand 22 50 49 39–40 79 6 58 17 30 25–6
Sweden 31 47–8 29 49–50 71 10–11 5 53 33 20
UK 35 42–4 35 47–8 89 3 66 9–10 25 28–9
US 40 38 46 43 91 1 62 15 29 27
Rank 1= highest rank
Source: G. Hofstede, Culture’s Consequences (2001), Thousand Oaks, Sage Publications, p. 500.
MANY HOUSES: TYPES OF POLITICO-ADMINISTRATIVE REGIME 65
specific ways in which particular reforms are extensively ‘translated’ as they move from
one country to another (Czarniawska and Sevon, 1996; Smullen, 2010).
3.7 Sources of policy advice
The final aspect of the administrative system which we wish to suggest is of significance is
the diversity of the key sources of advice to ministers on reform issues. (We are here
referring exclusively to advice on management reform issues. Advice on other types of
policy innovation, such as defence policy or economic policy, may be taken from different
networks.) In principle, political executives could take management advice from a wide
range of sources—from their own political parties, from their mandarins, from manage-
ment consultants, from academic specialists, from business corporations, or from political
or policy think tanks. Since about 1990 international bodies have also played a growing
role in advice-giving. For our twelve countries the OECD has been particularly active and
influential (see, e.g. OECD, 1995, 2005, 2009a). In Eastern Europe and the developing
world, the World Bank and the European Commission have been important (see, e.g.
Demmke and Moilanen, 2010; Kaufmann et al., 2007). The basic proposition here is that
the wider the range of customary sources of advice, the more likely it is that new ideas—
especially those from outside the public sector—will reach ministers’ ears in persuasive
and influential forms. Thus, for example, newmanagement ideas (box F in Figure 2.1) will
have an earlier and better chance of getting a sympathetic hearing from executive
politicians.
One particular trend which has affected many (but not all) of our twelve countries has
been the increasing politicization of advice to ministers. The specific form which this has
taken has varied from one country to another, but over the past two or three decades the
prominence of ‘political advisers’ or politically flavoured senior civil service appointments
has grown in Australia, Belgium, Canada, Germany, the UK, and the USA (see, e.g. Aucoin
and Savoie, 2009; Peters and Pierre, 2004). Alongside, and sometimes overlapping with
this trend has been another one—that of the increasing role played by management
consultants, even at the highest levels (National Audit Office, 2006; Sahlin-Andersson
and Engwall, 2002; Saint Martin, 2005). Both these trends represent a broadening of the
stream of advice on management reforms, and both are also controversial. It is not self-
evident that corporate management consultants or party political ‘fixers’ are necessarily
better placed to give advice on how to reshape ministries and major public services than
the civil and public services themselves.
Beyond this, the source of a particular reform idea may influence its perceived legiti-
macy and ‘ownership’ (a point already made in the section on minister/mandarin rela-
tions). Rank-and-file civil servants may be more suspicious of innovations that are
believed to come from one particular political party or from ‘whizz kids’ in a fashionable
think tank. Achieving ‘ownership’ of reform right down the hierarchy may be less
difficult if it is perceived as having a significant ‘home-grown’ element, that is, if the
innovation is seen to be based on accumulated experience within the civil service itself,
rather than being a forced ‘import’. Of course, these reactions will themselves be
66 MANY HOUSES: TYPES OF POLITICO-ADMINISTRATIVE REGIME
influenced by the administrative culture. Ideas from big business may be accorded greater
face legitimacy in a pro-business, anti-government culture such as prevails in the USA,
than in a strong, proud state-centred culture such as has existed for some time in France.
Contrasts are not hard to find. Consider the differences between France and the UK
during the 1980s. In France, reform policies emerged from within the ‘usual networks’ of
members of the grands corps—mandarins and politicians with shared ENA backgrounds
and intertwined careers. In the UK, Mrs Thatcher was well known for her suspicions of the
civil service and went out to right-wing think tanks for many of her reform ideas. Or again,
we may note a similar contrast between Germany and the USA. In Germany most reform
projects have been hatched within the public service itself, sometimes helped by advice
from specialist academics (Schr€oter and Wollmann, 1997). In the USA, President Reagan
called in teams of businessmen to propose changes in the federal administration, most
infamously the Grace Commission and its 2,000 businessmen (Pollitt, 1993, pp. 91–5). In
1984 Grace delivered 2,478 recommendations for improving efficiency and cutting ‘waste’,
but the implementation of many of these ideas seems to have been lost track of within a
fragmented, sceptical, and probably resentful federal bureaucracy. In Canada, too, Prime
Minister Mulroney exhibited considerable suspicions of the career bureaucrats, and made a
virtue of seeking business advice (Savoie, 1994).
Finland, the Netherlands, and Sweden are each different again. The major Finnish
public management reforms of the early 1990s owed most to the thinking of senior
public servants. External participation from business people or consultants was the
exception rather than the rule (though one or two of the civil servants themselves had
some business experience). By contrast, Dutch reforms emerged from a procession of
committees and enquiries which featured not only civil servants but also academics,
auditors, and individuals from the business world—there was a fairly open market place
of advice and ideas. Sweden probably fell some way between Finland and the Nether-
lands—there was some ‘external’ debate and participation, but senior public servants
kept a firm grip on the helm, and were never in the position of US or British or Canadian
civil servants in being obliged to implement a reform agenda that had been substantially
set by business advisers to the government, external think tanks, or management
consultants.
3.8 The European Commission: a special case
The European Commission is obviously a special case, because it is not a sovereign nation
state. Furthermore, as a supranational authority, much of its business is conducted with
nation states, and thus cannot be considered in the same breath as relations between
a national government and its own subnational tiers of government. We agree with the
many commentators who have warned against simple comparisons between EU institu-
tions and national governments. However, despite these sui generis aspects, much of
the analysis which we have applied above to the twelve countries in our set can also be
applied to the Commission.Wewould argue that the third, fourth, and fifth features of our
general analysis see Sections 3.5, 3.6, and 3.7 above) can be related to the Commission
MANY HOUSES: TYPES OF POLITICO-ADMINISTRATIVE REGIME 67
without too much difficulty, and that the main differences arise with the first and sec-
ond—state structure and the style of executive government. So we will tackle these two
more problematic features first.
In terms of the vertical dispersion of authority we cannot neatly label the Commission
as either federal or unitary. Certainly it is not federal in the sense of having inferior tiers of
authority below it, sharing powers in a way that is defined by a single constitution. Yet
there are some resemblances: the Commission very much operates within the framework
of treaties (Rome, Maastricht, Nice, Lisbon, etc.) and these define the relationships which
are supposed to obtain between the Commission, other EU institutions, and member
states themselves. In this sense one might speak of the Commission working within a
quasi-federal, treaty-framed environment, although one in which the other ‘levels’ are not
at all ‘inferior’. One obvious difference, for example, has been that, whereas the national
level in most federal states retains responsibility for foreign and defence policies, within
the EU, member states have fiercely guarded their independence in these respects, and
moves towards developing common approaches in these areas, though significant, remain
limited and fragile.
On the other hand, the definition of ‘unified’ does not seem to fit very well either,
because, although the Commission is itself a unified body, so much of its work depends on
arriving at cooperative agreements with member states, each of which is an independent
sovereign power in its own right. In this sense, therefore, only the most extreme Euro-
phobes would liken the Commission to a powerful unitary state on the model of France or
the UK.
Furthermore in the last fifteen years or so we have seen a growth in the number of
agencies which have been spun off from the Commission to perform a variety of tasks.
This growing complexity has been enough to prompt the EU institutions to launch a large-
scale evaluation of their agency systems (Rambøll/Eur�eval/Matrix, 2009).
Moving onto the question of horizontal coordination, wemay immediately observe that
the Commission has strong vertical divisions and is often difficult to coordinate (Mid-
dlemass, 1995; Page, 1997). Each Directorate General (DG) is to a significant extent a law
unto itself. The most powerful horizontal controls have traditionally emanated from the
budget and personnel DGs (although current reforms are lessening these in certain re-
spects—see Appendix B). In short, however, the Commission is vertically a quite fragmen-
ted body.
Given these structural characteristics, what might one deduce about management
reform? Perhaps simply that broad-scope, radical reform of the kind carried through in
unified, centralized states such as New Zealand and the UK would be difficult. The
historical record would seem to bear this out. There has been a tortuous history of partial,
incremental reforms (and failed reforms—Spierenberg, 1979). Until the mid 1990s there
was no general restructuring or reorientation towards modern styles of management—
indeed, ‘management’ itself was not seen as particularly important by most senior Euro-
crats (Stevens and Stevens, 2001, p. 148). The Commission was, for the most part, an old-
fashioned bureaucracy. In the late 1990s and early 2000s there was a major management
upheaval, centred around what became known as the ‘Kinnock reforms’ (see EU Com-
mission file in Appendix B), but since then the pace of change appears to have slowed
once more. Recently the EU machinery has been focused on larger problems of public
68 MANY HOUSES: TYPES OF POLITICO-ADMINISTRATIVE REGIME
legitimacy (the initially failed attempt to introduce a new ‘constitution’), enlargement,
and the economic/currency crisis.
The second ‘key feature’ in our analysis is the nature of executive government—the
habits or style of governance. In the Commission’s case this is muchmore consensual than
majoritarian, although political parties play only a very subdued role. The Commission
itself (i.e. the body of Commissioners) is an expressly collegial body, where it is vital for
proposers of reform to gain common assent (sometimes through complicated trade-offs
between apparently unrelated issues), or at least to secure reluctant acquiescence. It is
composed of people with executive political experience (typically ex-ministers from the
member states), but they must deal with what is, in effect, a rival, and in some ways more
powerful political executive in the shape of the Council of Ministers. The Commission is
also accountable to the European Parliament. The latter used not to be a particularly strong
political force, but since the late 1990s it has acquired new powers and has begun to flex its
muscles.
Moving on to what in Table 3.1 is termed ‘minister/mandarin relations’ we may say that
the Commission is unique, and uniquely complex. To begin with, it has what in terms of
most nation states would be regarded as an ‘extra’ political layer. The ‘mandarins’ are the
Directors General, the permanent heads of the Commission’s services. Above them floats
the first political layer—the Commissioners, who, although appointed, are generally
politicians by background (see previous paragraph). However, beyond the Commissioners
lies another powerful body of executive politicians, the Council of Ministers from the
member states. Just to make matters more complicated still, each Commisioner has a
cabinet of personally appointed officials, who offer policy advice and (not infrequently)
clash with the Directors General. Finally, we may note that, while cabinet positions are
temporary (they do not last beyond the tenure of the individual Commissioner) both they
and the career Directors General, and the two grades immediately below them (‘A2s’ and
‘A3s’), are politically influenced appointments (Page, 1997). The upshot of all this is a very
complex set of relations between senior career officials and ‘their’ Commissioners. Their
careers are not usually intertwined after the French fashion, but the mandarin ranks are
certainly politicized, and there is a large group of politicized temporary officials in the
cabinets. Yet for most of the permanent officials the ‘bargain’ seems to be more of ‘trustees’
or ‘technocrats’ than ‘agents’ for a particular political regime (the terms are again borrowed
from Hood and Lodge, 2006). They enjoy extremely strong tenure and have only recently
begun to be subject to any organized form of individual appraisal (Levy, 2004). Many of
them serve most of their careers in Brussels, where they enjoy high salaries and a variety of
privileges.
As for the administrative culture of the Commission, it still bears distinct traces of the
predominant French influence during its formative years. Many French practices and titles
continue, including the existence of strong separate hierarchies (in the DGs) and the
predominantly regulatory and legalistic cast of mind. Although there is considerable
internal variation (as one might expect in an organization whose staffing policies deliber-
ately mixed officials from such a diverse range of national backgrounds), the predominant
impression is of a hierarchy that would score quite highly on both Hofstede’s power-
distance index and his index of uncertainty avoidance (see Section 3.6, above). ‘Playing
it safe’, not challenging one’s superiors, addressing problems by making and then
MANY HOUSES: TYPES OF POLITICO-ADMINISTRATIVE REGIME 69
following very detailed procedural rules—these are familiar cultural ‘norms’ within the
Commission to this day. The Commission is thus more Rechtsstaat than public interest,
and can seem a strange place for new arrivals from countries such as Sweden or the UK,
which have somewhat different traditions. Cultural change is, however, an almost inevi-
table consequence of the successive enlargements of EU membership. New fonctionnaires
from the Central and Eastern European states, combined with the influx from the 1995
enlargement, are gradually making their impact on the Commission’s atmosphere and
style (Ban, 2010b).
With respect to policy advice, that which reaches Commissionersmay be said to be fairly
diverse. In addition to advice from the DGs, Commissioners take the views of their own
cabinets, and, not unusually, may tap sources within the administration of their own
member state. They are also bombarded with evidence and demands from the multiplicity
of pressure groups which have set up in Brussels. Whilst this is an exceedingly complex
system it is not a closed one; indeed the channels are almost certainly more diverse than in
some member states.
In sum, therefore, one could say that, within the Commission, the feasibility threshold
over which management reforms must pass is rather high. The Commission is a collegial,
consensual body, and its operative Directorates General are vertically strongly divided
from each other. No single source of power and authority is therefore strong enough to
drive through across-the-board changes against significant resistance. The pressure of
public opinion is weak and indirect: this is because of the intervening ‘layer’ of member
states, because of the relative feebleness of the European Parliament (whose own legiti-
macy, as indicated by electoral turn-outs, is not high) and because the Commission
anyway does not itself provide the kinds of public services which would bring it into
direct contact with the public. Other ‘difficult to change’ factors should also be men-
tioned. The Commission mandarins have separate and secure careers—they do not need
constantly to ‘show results’ in order to keep their jobs (Page, 1997, p. 87). The top three
grades in the hierarchy are fairly politicized, but in a way which tends to focus the
occupants on sexy political topics and on what can be achieved within the four-year
term of a Commission, rather than on longer-term structural change. The administrative
culture carries significant elements of Rechtsstaat, and the resort to legal rules and standard
procedures is, if anything, intensified by the difficulties of running such a multi-lingual,
multicultural organization. All these features combine to make the life of the would-be
management reformer difficult.
Yet, despite all this, broader political pressures and external currents of management
ideas have at least placed large-scale administrative modernization on the Commission’s
agenda. When a new Commission took office in 1995 it launched a Sound and Efficient
Management Initiative (SEM 2000). This was quickly followed by MAP 2000 (Moderniz-
ing Administrative and Personnel Policy) which focused on internal reforms to the
Commission’s own machinery. However, this (Santer) Commission collapsed in disgrace
and an unprecedented mass resignation in 1999. The circumstances of the fall of
M. Santer and his fellow commissioners guaranteed that reform would be high on the
agenda of the new leadership (the Prodi Commission), and, under the leadership of Vice-
President Kinnock significant reforms in audit, financial management, and human
resource management were proclaimed (European Commission, 2001). It appears that
70 MANY HOUSES: TYPES OF POLITICO-ADMINISTRATIVE REGIME
real changes have been made, but that progress is quite slow, and that the main emphasis
of the reforms has become—in path dependent fashion—centralizing and regulatory
(Levy, 2003; Stevens and Stevens, 2001—see Appendix B for further details). In some
particular respects, however, more radical changes have occurred—perhaps most notice-
ably in recruitment procedures (Ban, 2010a).
3.9 Traditional bureaucracy: the ancien regime?
A good deal of the rhetoric associated with public management reform vividly contrasts
the new (= good) with the old (= bad). The name given to the old—that against which the
modern, reformed public sector organization stands out as superior—is usually something
like ‘traditional bureaucracy’ (e.g. Hughes, 1998, chapter 2). The big models first intro-
duced in Chapter 1—NPM, NWS, and NPG—are all, in different ways, reactions to this
grand old model from the past. Politicians, in particular, never seem to tire of ‘bashing
bureaucracy’ and portraying it as both restrictive and wasteful (although as soon as
something goes wrong the same politicians often demand new oversight bodies and
new regulations). The global economic crisis provoked a new round of rhetoric as leading
politicians in several countries claimed (however improbably) that huge savings could be
achieved by cutting out ‘bureaucratic waste’, while leaving front-line public services
unharmed.
Before concluding this review of regime types it is therefore necessary to explore a little
further this ancien regime—to understand what was supposed to be wrong with it and to
clarify its relationships with the various dimensions of the politico-administrative world
which have been discussed in sections 3.2 to 3.8 above.
Osborne and Gaebler (1992, pp. 11–12) are fairly typical of at least the Anglo-American-
Australasian critique of traditional bureaucracy:
Our thesis is simple. The kind of governments that developed during the industrial era, with their
sluggish, centralised bureaucracies, their preoccupation with rules and regulations, and their hier-
archical chains of command, no longer work very well. They accomplished great things in their
time, but somewhere along the line they got away from us. They became bloated, wasteful, ineffec-
tive. And when the world began to change, they failed to change with it. Hierarchical, centralised
bureaucracies designed in the 1930s or 1940s simply do not function well in the rapidly-changing,
information-rich, knowledge-intensive society and economy of the 1990s.
This traditional model is commonly linked with the ideal-type rational/legal bureaucracy
proposed and analysed in the writings of MaxWeber (Weber, 1947). This type of organiza-
tion was characterized by:
� fixed spheres of competence;
� a defined hierarchy of offices;
� a clear distinction between the public and private roles (and property) of the officials;
� specialization and expertise as the basis for action;
� full-time, career appointments for officials;
MANY HOUSES: TYPES OF POLITICO-ADMINISTRATIVE REGIME 71
� management by the application of a developing set of rules, knowledge of whichwas the
special technical competence of the officials concerned.
This, then, is the type of regime which is said to be in need of replacement by more
flexible, fast-moving, performance-oriented forms of modern organization. Of the various
types of administrative culture which have been discussed earlier in this chapter, it is fairly
clear which one is closest to the traditional model—it is the Rechtsstaat. The culture is one
of high power-distance and high uncertainty avoidance—indeed, the reduction of uncer-
tainty and the increase in predictability are claimed to be among its chief virtues. The
critique favoured by Osborne and Gaebler, Hughes (and many others) therefore leads
towards the conclusion that countries like Germany are ‘behind’ and need to take up
‘reinvention’ or the ‘New Public Management’ more vigorously—to follow the ‘leaders’
such as New Zealand, the UK, or the USA.
Unfortunately, however, what one might term the ‘NPM story’ is misleadingly neat and
over-simple. There are many detailed criticisms which could be made of it—see Pollitt,
2003a, chapter 2—but here we will confine ourselves to just three general points. First, it is
dazzlingly clear that there has not been just one type of administrative regime in existence,
but several (Demmke and Moilanen, 2010; Lynn, 2006; Ongaro, 2009). So to reduce the
past to a single system is to do a considerable injustice to the variety of history. Second (by
way of extension to the first point), even if some parts of some public sectors ‘fitted’ the
image of the traditional bureaucracy, others definitely did not. Thus in the UK (as in most
other Western European states), the most expensive and labour intensive sectors of state
administration—health care and education—were never legalistic bureaucracies. On the
contrary, they were heavily professionalized organizations in which individual professions
were able to exercise a great deal of discretion, sometimes in a rather collegial, rather than
hierarchical manner. Clarke and Newman (1997) call this ‘bureau-professionalism’, to
distinguish it from pure bureaucracy. Third, the accounts of traditional bureaucracy
given by the NPM ‘school’ tend to be rather one-sided. They emphasize the negatives
(‘rigidity’, ‘centralization’, etc.) but ignore or underplay the positives, such as continuity,
honesty, and a high commitment to equity in dealing with the citizen/public. In his
seminal article on the NPM, Hood terms these ‘theta-type core values’, and comments
that, even if NPM reforms do increase frugality and efficiency, these gains could be ‘bought
at the expense of guarantees of honesty and fair dealing and of security and resilience’
(Hood, 1991, p. 16—see also, for a sophisticated defence of bureaucratic characteristics, Du
Gay, 2000).
Our conclusion is not that the negative features of the ‘traditional model’ are fantasies,
with no basis in reality. Every reader can probably vouchsafe some personal experience
testifying to the capacity of public (and private) bureaucracies to work in infuriatingly slow
and inefficient ways. However, it is a long—and unjustified—leap from there to the
idea that the governments of the industrialized world previously operated their public
sectors as Weberian-style traditional bureaucracies, and are now able to move, without
significant loss, to a new, modern type of organization which avoids all the problems
of the past. As this book will continue to demonstrate, public sectors have not all come
from the same place and are not all headed in the same direction. Modernization often
involves losses as well as gains (Chapter 7 is particularly concerned with this theme).
72 MANY HOUSES: TYPES OF POLITICO-ADMINISTRATIVE REGIME
Each country is different (though there are some groups and patterns), and within each
public domain, individual sectors have distinctive organizational cultures of their own.
The idea of ‘bureaucracy’ as a single, and now totally obsolete, ancien r�egime is as implausi-
ble as the suggestion that there is now a global recipe which will reliably deliver ‘rein-
vented’ governments.
3.10 Concluding remarks
The main points of this chapter can be straightforwardly summarized. Features of the
existing politico-administrative regime are likely to exert a significant influence over both
the choice of reforms to be adopted and the feasibility of implementing certain types of
reform. State structures, the nature of central executive government, relationships
between ministers and mandarins, the prevailing administrative culture, and the diversity
of channels of advice all have effects on which ideas get taken up, and how vigorously and
widely these are subsequently implemented. Thus, certain regimes look as though they are
much more open to the ‘performance-driven’, market-favouring ideas of the NPM than
others: particularly the ‘Anglo-Saxon’ countries, Australia, Canada, New Zealand, the UK,
and the USA. Other countries—especially the continental European states of Belgium,
France, Finland, Germany, and Italy—have been structurally and culturally less hospitable
to such ideas, but have responded to pressures by developing a different reform mix of
their own, sometimes selecting from and transforming NPM tools as they do so. However,
whatever type of reform may be desired, not every country has an equal capacity to
implement new arrangements in a coherent, broad-scope way. For structural reasons,
executive power is less centralized and focused in, say, Belgium, or the USA, than in New
Zealand or the UK.
Continental Europe is significantly different. It is dominated by Germany and France,
each with its own strong administrative tradition. Of the two, France finds it less difficult
to make broad changes, to the extent that it remains fairly centralized and is governed by a
president with strong powers. In federal Germany some of the constraints on change are
entrenched in constitutional law, so one might expect change to be difficult at the federal
level, though more in evidence at the lower levels of L€ander and municipalities. Belgium is
federal, and therefore structurally closer to Germany, but carries an inheritance of admin-
istrative arrangements which is predominantly in the French style. Unsurprisingly with
this background, compounded by the linguistic and political divide between the Flemings
and the Walloons, change has hitherto been slow (see, e.g. Pollitt and Bouckaert, 2009).
Italy is in transition, but has clearly launched somemajor reforms, even if implementation
has been highly uneven. Finally, there are the three north-western European states—
Finland, the Netherlands, and Sweden. These differ among themselves in a variety of
ways, but share a general disposition towards consensual, often meso-corporatist styles
of governance. This tends to blunt the sharper corners of the NPM, leading to less outright
criticism of the state bureaucracy, a cautious rather than a wildly enthusiastic approach to
MTMs and to privatization, and a less rapid (some would say less ruthless) style of
implementation than prevailed in New Zealand and the UK.
MANY HOUSES: TYPES OF POLITICO-ADMINISTRATIVE REGIME 73

The above remarks are a brief foretaste of what is to come. In the next chapter, and
in Appendix B, there will be more detailed accounts of the reform trajectories in each
of the twelve countries, and of the EU Commission. These will therefore provide a test
for the predictive powers of the politico-administrative variables here identified
and discussed.
74 MANY HOUSES: TYPES OF POLITICO-ADMINISTRATIVE REGIME
4 Trajectories ofmodernizationand reform
4.1 From regimes to trajectories
In the previous chapters we examined the relatively enduring—yet nevertheless evol-
ving—politico-administrative regimes of twelve countries, plus the European Commis-
sion. Now we shift focus to more rapid and short-term forms of change: the reforms
themselves. How far can it be said that everyone has been following more or less the
same route, albeit from different starting points in terms of their politico-administrative
regimes? Are there clear patterns, and if so, of what kind, or is the story really one of ad
hockery dressed up as strategy?
Our first step was to use the model of change advanced in Chapter 2 to organize the
elements of what seemed to be the ‘basics’ of each country’s experience into some sensible
categories. The results of that exercise may be seen in tabular form in Appendix B, where
there is a summary for each country, and chronological tables of key events. Appendix B
should be used as an adjunct to the whole book, but especially to this chapter. Here in
Chapter 4 we adopt a broad comparative perspective, looking for patterns of similarity and
difference. We do this by employing the concept of trajectories to help us sort out the data.
4.2 Trajectories and scenarios: a conceptual preliminary
A trajectory, as defined here, is more than a trend. A trend is simply some pattern in the
data (e.g. if the rainfall goes up every year for ten years, that is a trend). A trajectory, by
contrast, is an intentional pattern—a route that someone is trying to take. It leads from a
starting point (an alpha) to some desired place or state of affairs in the future (an omega).
Thus a scenario consists of three basic elements: an initial state, a trajectory, and a future
state (see Figure 4.1).
Scenarios may exist at various levels of specificity. They may amount to little more than
a set of vague ideas and orientations. Or they may be developed into a strategic plan, with
specified actions, timescales, and objectives. Scenarios are not always complete, in the
sense that one or more of the three basic elements may be missing. For example, if there is
only an omega—a vision of the desired future—but no clear specification of alpha or of
trajectory, one might speak of a utopia or perhaps a paradigm. Thus one could consider the
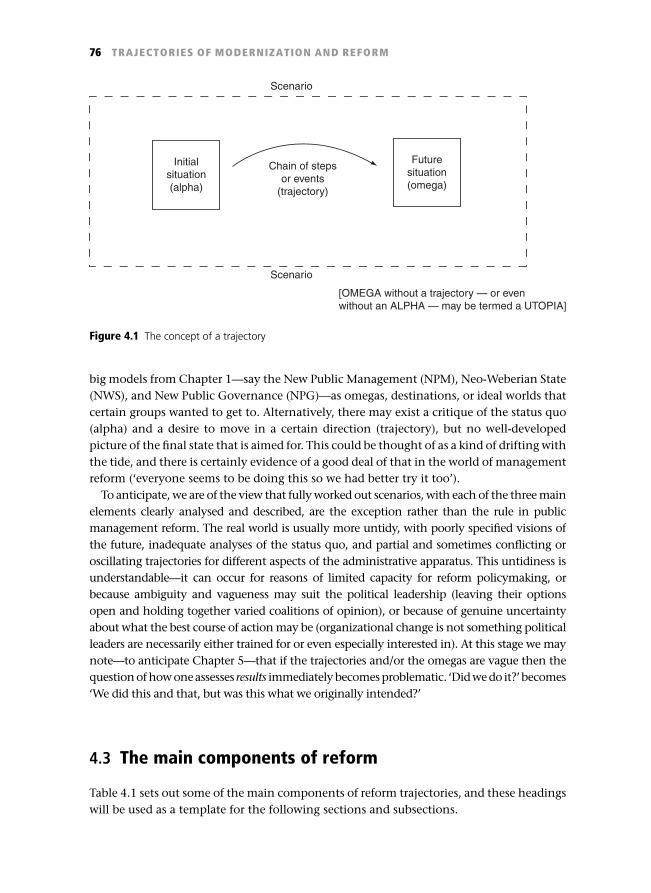
big models from Chapter 1—say the New Public Management (NPM), Neo-Weberian State
(NWS), and New Public Governance (NPG)—as omegas, destinations, or ideal worlds that
certain groups wanted to get to. Alternatively, there may exist a critique of the status quo
(alpha) and a desire to move in a certain direction (trajectory), but no well-developed
picture of the final state that is aimed for. This could be thought of as a kind of drifting with
the tide, and there is certainly evidence of a good deal of that in the world of management
reform (‘everyone seems to be doing this so we had better try it too’).
To anticipate, we are of the view that fullyworked out scenarios, with each of the threemain
elements clearly analysed and described, are the exception rather than the rule in public
management reform. The real world is usually more untidy, with poorly specified visions of
the future, inadequate analyses of the status quo, and partial and sometimes conflicting or
oscillating trajectories for different aspects of the administrative apparatus. This untidiness is
understandable—it can occur for reasons of limited capacity for reform policymaking, or
because ambiguity and vagueness may suit the political leadership (leaving their options
open and holding together varied coalitions of opinion), or because of genuine uncertainty
about what the best course of actionmay be (organizational change is not something political
leaders are necessarily either trained for or even especially interested in). At this stage we may
note—to anticipate Chapter 5—that if the trajectories and/or the omegas are vague then the
questionofhowoneassesses results immediatelybecomesproblematic. ‘Didwedo it?’ becomes
‘We did this and that, but was this what we originally intended?’
4.3 The main components of reform
Table 4.1 sets out some of the main components of reform trajectories, and these headings
will be used as a template for the following sections and subsections.
Scenario
Scenario
[OMEGA without a trajectory — or evenwithout an ALPHA — may be termed a UTOPIA]
Initialsituation(alpha)
Futuresituation(omega)
Chain of stepsor events
(trajectory)
Figure 4.1 The concept of a trajectory
76 TRAJECTORIES OF MODERNIZATION AND REFORM
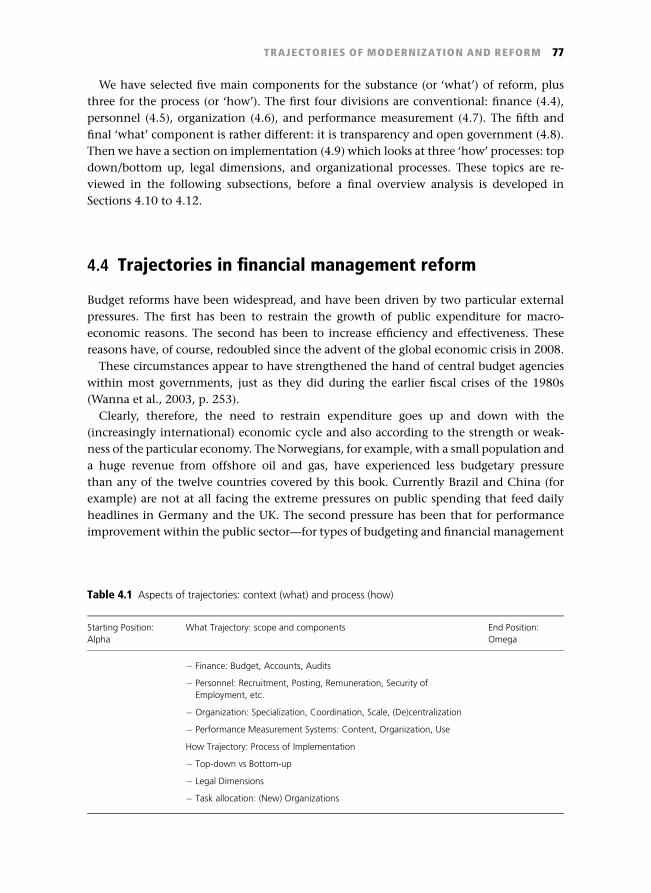
We have selected five main components for the substance (or ‘what’) of reform, plus
three for the process (or ‘how’). The first four divisions are conventional: finance (4.4),
personnel (4.5), organization (4.6), and performance measurement (4.7). The fifth and
final ‘what’ component is rather different: it is transparency and open government (4.8).
Then we have a section on implementation (4.9) which looks at three ‘how’ processes: top
down/bottom up, legal dimensions, and organizational processes. These topics are re-
viewed in the following subsections, before a final overview analysis is developed in
Sections 4.10 to 4.12.
4.4 Trajectories in financial management reform
Budget reforms have been widespread, and have been driven by two particular external
pressures. The first has been to restrain the growth of public expenditure for macro-
economic reasons. The second has been to increase efficiency and effectiveness. These
reasons have, of course, redoubled since the advent of the global economic crisis in 2008.
These circumstances appear to have strengthened the hand of central budget agencies
within most governments, just as they did during the earlier fiscal crises of the 1980s
(Wanna et al., 2003, p. 253).
Clearly, therefore, the need to restrain expenditure goes up and down with the
(increasingly international) economic cycle and also according to the strength or weak-
ness of the particular economy. The Norwegians, for example, with a small population and
a huge revenue from offshore oil and gas, have experienced less budgetary pressure
than any of the twelve countries covered by this book. Currently Brazil and China (for
example) are not at all facing the extreme pressures on public spending that feed daily
headlines in Germany and the UK. The second pressure has been that for performance
improvement within the public sector—for types of budgeting and financial management
Table 4.1 Aspects of trajectories: context (what) and process (how)
Starting Position:
Alpha
What Trajectory: scope and components End Position:
Omega
� Finance: Budget, Accounts, Audits
� Personnel: Recruitment, Posting, Remuneration, Security of
Employment, etc.
� Organization: Specialization, Coordination, Scale, (De)centralization
� Performance Measurement Systems: Content, Organization, Use
How Trajectory: Process of Implementation
� Top-down vs Bottom-up
� Legal Dimensions
� Task allocation: (New) Organizations
TRAJECTORIES OF MODERNIZATION AND REFORM 77
which will stimulate greater efficiency or effectiveness, or higher quality, or some mixture
of the three.
Taken together, these pressures have led to what in effect has been an expansion in the
scope or purpose of budgeting. Instead of the former situation, in which budgets were
mainly a process by which annual financial allocations were incrementally adjusted,
legalized, and made accountable to legislatures, budgeting has become more intimately
linked with other processes—planning, operational management, and performance mea-
surement. Greater integration of these different systems has been a stated objective in
many countries (OECD, 2009a, pp. 92–4). Long ago Caiden (1988) described this broad-
ening and complexifying of the budget agenda as the emergence of ‘super budgeting’.
More recently, the OECD observed that ‘Since the early 1990s almost all OECD member
countries have been working to improve the quality of their public expenditure by
implementing a focus on results to their management and budgeting systems’ (OECD,
2002b, p. 2). In parallel, financial management, which often used to be the preserve of
financial management specialists, has now become an element in the training and profes-
sional socialization of many, if not most, middle managers and professionals (see Zifcak,
1994 on early initiatives in Australia and the UK). All of this can be seen as a shift towards
an NPM model, where the emphasis is on results and efficiency, and budgeting becomes
the business of many managers, not just specialist finance officers.
The reforms which have served the savings objective have not always fitted well with the
reforms that would be required to encourage performance improvement. For example, the
first reaction of some governments to expenditure pressures was to ‘cheese slice’, that is, to
strengthen the hand of central finance ministries to cut back programmes from the top
down.
The depth and incidence of the cuts depended on the political opportunities (some
targets are politically ‘harder’ than others—e.g. it may be easier to cut new weapons
systems than to cut pensions) and on the severity of the macro-economic position (e.g.
New Zealand in 1984 and Finland in 1992 were in more severe circumstances than either
country was in 1998). In general, however, this kind of approach sits uneasily with
performance improvement. This is because opportunistic cheese-slicing generates a highly
unpredictable and negative environment for operational managers, in which they may
suddenly find they have lost part of their budget for no good performance-related reason.
Managers may come to see themselves as the victims of particularistic interventions from
seemingly all-powerful central finance departments. On the other hand across the board
percentage cuts (e.g. everyone loses 3%) can be delegated to managers to make final
decisions, thus ‘distancing’ the actual selection of cuts from executive politicians and
leaving them in the hands of those people who presumably know more about the actual
practical details of the programmes than anyone else (Pollitt, 2010a). In the 1980s and
1990s, for example, UK health authorities were subject to annual ‘efficiency savings’ of a
fixed percentage, but were left to themselves to decide how these should be achieved.
A second route to savings is perhaps more compatible with performance improvement
(though no programmemanager enjoys budget reductions, however they are executed). It
is to adopt or increase the use of frame- or block-budgeting, as was done by a number of
countries, including Finland, Sweden, the USA, Belgium, and Italy, as part of its decentra-
mento (decentralization) reforms. Here the central ministry sets and polices broad ceilings
78 TRAJECTORIES OF MODERNIZATION AND REFORM
(frames), but within those delegates responsibility for allocation to particular services,
programmes, or projects to local politicians and/or managers. In Finland, for example,
the introduction of frame-budgeting in 1994 meant a change from a system in which
central agencies had been heavily involved in regulating and controlling individual local
services to a new relationship in which central government fixed a formula-determined
total for each municipality and left local politicians to decide how to distribute that total
between the various activities (see Appendix B: Finland country file). This approach does
permit the local determination of priorities. However, as many commentators have
pointed out, it also neatly delegates the unpopular business of making painful choices
between competing priorities—in Italy, for example, the process of decentralization has
been accompanied by vocal concerns from the provinces and regions that they are being
delegated new tasks from the centre without adequate resources to carry them out
(‘unfunded mandates’ has long also been a regular complaint from the states in the US
federal system, where subnational governments are responsible for delivering many of the
federal government’s programmes). Frame-budgeting also required some redesign of bud-
getary procedures, in that there needed to be clear and separate phases to the budgetary
discussion—first, the determination of aggregate financial frames (and therefore a debate
about what the most appropriate formulae should be) and then, second, a detailed local
discussion of what allocations there should be to specific programmes (and how the
performance of those programmes should bemeasured). In a study of budgetary behaviour
in Australia, Canada, Germany, Japan, Mexico, and the UK, the US General Accounting
Office concluded that: ‘[A]ll six governments departed from previous budgeting ap-
proaches and imposed ‘‘top down’’ overall limits on government spending . . . Despite . . .
variation, each represented a multi-year approach that sought to reduce overall real
spending’ (General Accounting Office, 1994, p. 6). A later study of Australia, Canada,
Denmark, the Netherlands, New Zealand, Sweden, the UK, and the USA concluded that
central budget agencies ‘have essentially attempted to force the various policy actors to
operate within control frameworks with longer horizons, rather than themore immediate,
one-off deals and bilateral arrangements of past eras of public budgeting’ (Wanna et al.,
2003, p. 259).
A third approach is to make cuts strategically—for executive politicians to say, in effect,
‘Programmes A and B are our top priorities, so cuts must fall on C and D’. There are not
many examples of this being successfully accomplished (Pollitt, 2010a) but the Canadian
Program Review of 1994 is often advanced as one good case (see Canada country file,
Appendix B). At the time of writing, the Cameron administration in the UK is undertaking
a programme of deep cuts in public spending, but has claimed it will ring-fence (protect)
the National Health Service (very popular with voters) and the defence budget (the armed
services are currently fighting in Afghanistan and are in receipt of enormous
public sympathy for the desperate job they are being asked to do). This is clearly a sort
of strategic prioritization, although in practice it is very difficult fully to protect the ‘front
line’, and governments frequently lack the precision control tools to enable them to do so
effectively.
Turning to those aspects of financial management reform which are more related to
performance than to savings, one finds a number of partial trajectories. A first step is
sometimes simply to publish some performance information alongside the annual budget
TRAJECTORIES OF MODERNIZATION AND REFORM 79
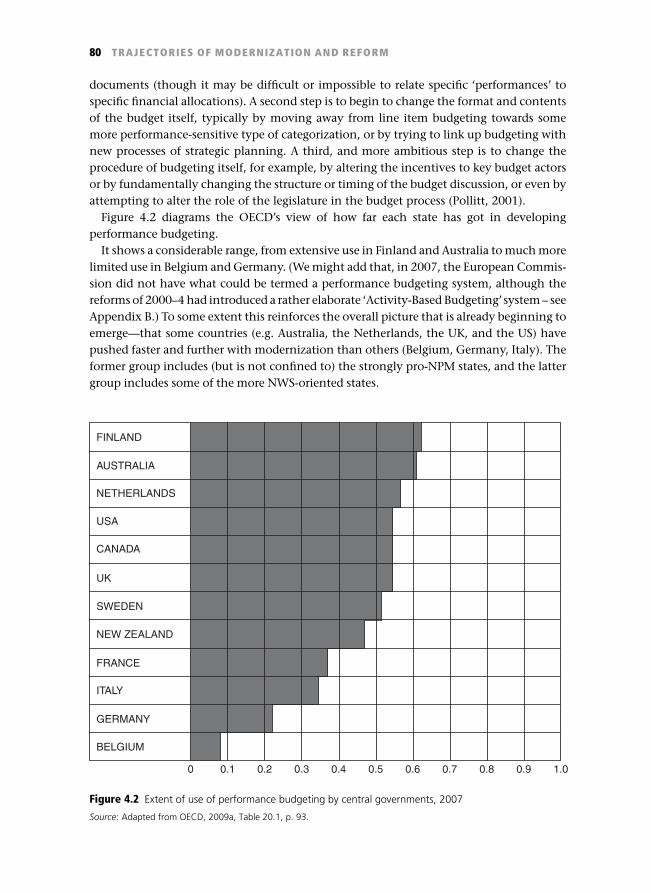
documents (though it may be difficult or impossible to relate specific ‘performances’ to
specific financial allocations). A second step is to begin to change the format and contents
of the budget itself, typically by moving away from line item budgeting towards some
more performance-sensitive type of categorization, or by trying to link up budgeting with
new processes of strategic planning. A third, and more ambitious step is to change the
procedure of budgeting itself, for example, by altering the incentives to key budget actors
or by fundamentally changing the structure or timing of the budget discussion, or even by
attempting to alter the role of the legislature in the budget process (Pollitt, 2001).
Figure 4.2 diagrams the OECD’s view of how far each state has got in developing
performance budgeting.
It shows a considerable range, from extensive use in Finland and Australia tomuchmore
limited use in Belgium andGermany. (Wemight add that, in 2007, the European Commis-
sion did not have what could be termed a performance budgeting system, although the
reforms of 2000–4 had introduced a rather elaborate ‘Activity-Based Budgeting’ system – see
Appendix B.) To some extent this reinforces the overall picture that is already beginning to
emerge—that some countries (e.g. Australia, the Netherlands, the UK, and the US) have
pushed faster and further with modernization than others (Belgium, Germany, Italy). The
former group includes (but is not confined to) the strongly pro-NPM states, and the latter
group includes some of the more NWS-oriented states.
FINLAND
AUSTRALIA
NETHERLANDS
USA
CANADA
UK
SWEDEN
NEW ZEALAND
FRANCE
ITALY
GERMANY
BELGIUM
0 0.1 0.2 0.3 0.4 0.5 0.6 0.7 0.8 0.9 1.0
Figure 4.2 Extent of use of performance budgeting by central governments, 2007
Source: Adapted from OECD, 2009a, Table 20.1, p. 93.
80 TRAJECTORIES OF MODERNIZATION AND REFORM
Yet some of the details do not quite fit this rather-too-simple ‘big picture’. New
Zealand, for example, appears halfway down the chart, despite being a trail-blazer in
financial management reform between 1984 and 1993. And some NWS-oriented states
appear much higher up than others—if there is a pattern it is a ragged one, with much
variation. But before we over-interpret this chart we should note that the OECD itself
provides a cautionary footnote: ‘This index examines the degree to which the OECD
countries have put a performance budgeting system in place. However, it does not
measure how successfully these systems operate in practice’ (OECD, 2009a, p. 93). As
we noted in Chapter 1 (section 1.6, especially Table 1.2) there can be a big gap between a
formal decision to ‘have’ a particular reform (benchmarking, performance budgeting)
and the day-to-day practice of government agencies. Furthermore, as the OECD explains,
the index of use shown here was put together on the basis of a survey of central budget
officials (where 0 = no use of performance budgeting and 1.0 = the existence of a
comprehensive performance budgeting system). We should note, however, that central
budget officials are hardly a neutral audience for these questions. They are by the very
nature of their jobs heavily involved in budget reform, and may well have opinions as to
what the ‘right answer’ to questions put to them should be. Even if they answer in a
totally impartial, clinical way they may simply not know what actually goes on inside all
the line departments and agencies when they compose their budget bids (it is not in the
least unusual—or surprising—to find senior officials in the core executive who are not
fully aware of actual practices in the ministries and agencies). We are perhaps rather
labouring all these qualifications, but for a good reason. Similar caveats will apply to
much, if not most, of the data exhibited in this chapter (and equally to some of the
results data introduced in the following chapter). The plain fact is that doing good
international comparisons is complex and difficult work (Pollitt, 2011). Public manage-
ment scholars always need to be cautious when confronting apparently clear and decisive
tables showing that country X ‘scores’ 0.7 and country Y only 0.4.
Canada provides a good illustration of the aforesaid difficulty of ‘reading’ budget
reforms. In the early 1980s the federal government introduced a range of budget-
modernizing measures—a Policy and Expenditure Management System (PEMS), a
Multi-Year Operational Plan (MYOP) and an Operational Framework Plan (OFP). On
paper this system sounded highly rational. In practice, however, under the Mulroney
administrations from 1983, the PEMS system singularly failed to persuade or enable
ministers to achieve their expenditure targets. It was partially replaced in 1989 and
then in 1995 completely superseded by a new Expenditure Management System (EMS).
EMS managed to deliver the first balanced budget for more than a decade, but even then
the relationship between budget allocations and performance was debatable. Indeed, this
is far from being just a technical issue. A decade later, after a series of scandals, the
Canadians adopted a Federal Accountability Act (2006—see Canada country file). This
established a parliamentary budget office, extended the authority of the Auditor General,
and introduced a four-year cycle of departmental spending reviews, accompanied by
systematic evaluation.
During almost half a century many countries have experienced considerable and
persistent difficulties in trying to establish close links between the performance of pro-
grammes and their budget allocations (General Accounting Office, 1997; Pollitt, 2001).
TRAJECTORIES OF MODERNIZATION AND REFORM 81
There is no particular reason to believe that the latest generation of budget reforms will
enjoy more than marginally greater success than previous efforts.
This leads directly to a more general point. Budgeting is an intensely political process,
and actual behaviours can be very difficult to change—even when formal procedures are
modified. Even when budgetary reform is implemented successfully, it may take years for
all the various organizations concerned to become comfortable with and fully practice the
new procedures. Finally, the process of budget reform is continuous, so it is inevitable that
by the time this book is in print, further initiatives, not recorded here, will have been
launched.
Bearing these caveats in mind, one can discern a broad pattern in budget reform. Since
1980major changes to enhance the performance focus of budgeting have been implemen-
ted in the majority of our twelve countries (see, e.g. Wanna et al., 2003), and some modest
moves in that direction have taken place even in the more reluctant countries, such as
Belgium andGermany. Thus, for example, theDutch andUS governments have taken steps
to change the format of budget documents, and to display much more performance
information (either in the basic budget document or alongside it) than would have been
usual twenty, or even ten, years ago. In 2001 the French government made a major shift to
programme budgeting, which one book described as ‘une v�eritable r�eforme de l’Etat’ (see Loi
Organique relative aux Lois de Finances (LOLF), in the France country file in Appendix B).
However, this still left the French some way short of the intensity of performance-linkage
which had been achieved in New Zealand nearly a decade earlier (Trosa, 2002—the quota-
tion comes from the back cover). One way to categorize the modernization of budgeting is
to break it down into a number of steps (whereas the OECD index of performance budget-
ing aggregates these different steps into a single index). One begins with a traditional
budget—line item and cash-based. The first step is simply to add on some performance
information to this budget, without changing the basics. All our countries have done this—
to some degree at least. The second step is to change the format of the budget, for example
by aggregating line items into programmes, or by formally attaching performance infor-
mation to most or all the line items. This can tell you how much it costs to maintain a
military presence in Afghanistan, rather than just knowing from a line item budget how
much was spent on boots, ammunition, fuel, etc. The third step is to alter the timing and
sequence of the budget procedures, so as to try to ensure that the new information in the
budget gets properly considered (e.g. by introducing a preliminary, more ‘strategic’ or
‘whole of government’ stage to the discussion before the debate moves on to which
department or programme gets what). A fourth step is to alter the very basis of the budget
by shifting from a cash base to accruals accounting (as discussed in more detail in the next
section). We can say that a number of our countries have now reached that fourth stage—
Australia, Canada, Finland, the Netherlands, New Zealand, Sweden, and the UK. Thus the
fit with ourmodels—NPMandNWS—is not at all a neat one. It should be remembered that
budgetary reform can appear within both anNPM- and aNWS-inspired approach. For NPM
enthusiasts, it is about performance, results, and efficiency. For NWS advocates it is more
about modernizing financial control systems so as to be able to express broad political and
strategic priorities more clearly in resource allocation.
Also, just making a budget is not the same as implementing it. Thus, alongside the
reforms in budget preparation, many countries have witnessed parallel attempts by
82 TRAJECTORIES OF MODERNIZATION AND REFORM
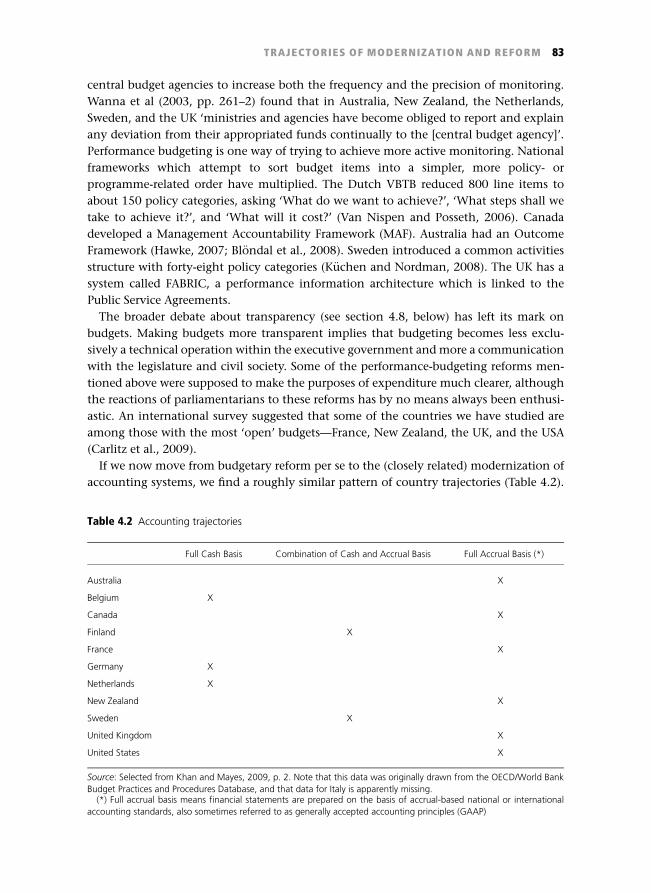
central budget agencies to increase both the frequency and the precision of monitoring.
Wanna et al (2003, pp. 261–2) found that in Australia, New Zealand, the Netherlands,
Sweden, and the UK ‘ministries and agencies have become obliged to report and explain
any deviation from their appropriated funds continually to the [central budget agency]’.
Performance budgeting is one way of trying to achieve more active monitoring. National
frameworks which attempt to sort budget items into a simpler, more policy- or
programme-related order have multiplied. The Dutch VBTB reduced 800 line items to
about 150 policy categories, asking ‘What do we want to achieve?’, ‘What steps shall we
take to achieve it?’, and ‘What will it cost?’ (Van Nispen and Posseth, 2006). Canada
developed a Management Accountability Framework (MAF). Australia had an Outcome
Framework (Hawke, 2007; Bl€ondal et al., 2008). Sweden introduced a common activities
structure with forty-eight policy categories (K€uchen and Nordman, 2008). The UK has a
system called FABRIC, a performance information architecture which is linked to the
Public Service Agreements.
The broader debate about transparency (see section 4.8, below) has left its mark on
budgets. Making budgets more transparent implies that budgeting becomes less exclu-
sively a technical operation within the executive government and more a communication
with the legislature and civil society. Some of the performance-budgeting reforms men-
tioned above were supposed to make the purposes of expenditure much clearer, although
the reactions of parliamentarians to these reforms has by no means always been enthusi-
astic. An international survey suggested that some of the countries we have studied are
among those with the most ‘open’ budgets—France, New Zealand, the UK, and the USA
(Carlitz et al., 2009).
If we now move from budgetary reform per se to the (closely related) modernization of
accounting systems, we find a roughly similar pattern of country trajectories (Table 4.2).
Table 4.2 Accounting trajectories
Full Cash Basis Combination of Cash and Accrual Basis Full Accrual Basis (*)
Australia X
Belgium X
Canada X
Finland X
France X
Germany X
Netherlands X
New Zealand X
Sweden X
United Kingdom X
United States X
Source: Selected from Khan and Mayes, 2009, p. 2. Note that this data was originally drawn from the OECD/World Bank
Budget Practices and Procedures Database, and that data for Italy is apparently missing.(*) Full accrual basis means financial statements are prepared on the basis of accrual-based national or international
accounting standards, also sometimes referred to as generally accepted accounting principles (GAAP)
TRAJECTORIES OF MODERNIZATION AND REFORM 83
Again, Australia, New Zealand, and the UK are among the countries which appear to
have made the most far-reaching changes, with Finland, Sweden, and the USA having
moved, but not quite so far, the least change being visible in Belgium, Germany, Italy,
and the EU Commission. This is the pattern which seems to appear if one defines three
broad positions, beginning with a traditional, cash-based accounting system, then a
shift to double-entry bookkeeping, possibly with elements of cost analysis, modified
cash or modified accrual and, finally, the development of full accrual accounts with a
focus on providing performance-related information. Internationally, budget and man-
agement reforms have increasingly converged within a variety of shared performance
architectures.
This is not a place for a full exposition of the different bases for keeping public
accounts. There is space only to point to the very basics of our threefold classification.
In pure cash accounting, a public sector entity is given a budget, calculated in cash
terms, and proceeds to spend the money, keeping records of each cash disbursement
(and incoming payment) so as to ensure neither an overspend (which may actually be
illegal) or an underspend (which is likely to act as an invitation to the political level to
arrive at the conclusion that not so much money is needed, and that the budget can
therefore be cut in the following year). In the EU Commission, for example, an
elaborate cash system used to operate until recently in which each piece of expenditure
had to be approved by three separate officials, as, first, legal, then, second, in accor-
dance with the programme, then, third, as affordable (there is sufficient cash to pay it).
A problem with this type of system is that, by itself, it gives few incentives for effi-
ciency, or even economy. The name of the game easily becomes that of simply spend-
ing the money allocated, within the financial year. EU officials, for example, seemed to
worry about ‘absorption’ (i.e. their ability to spend all the money allocated) at least as
much as they did about efficiency and effectiveness of expenditure. Even after the
reforms of 2001–2, the EU budgetary system contains few incentives to ‘save’. The
money in the budget is there, it cannot be saved or switched for use elsewhere, and
therefore it has to be spent.
The shift to double-entry bookkeeping marks a significant change from this position.
It brings public accounts closer to the private sector model. Every transaction is entered
on the accounts twice—once as a credit and once as a debit. If wages are paid, for
example, the sum involved can be shown as a credit to the organization’s central cash
account and, simultaneously, a debit to the wages account. This approach is founded on
the perspective that the organization is a separate business, in which its total assets
must, by definition, remain equal to its capital plus its liabilities. It can be used to raise
consciousness of a wider range of management issues than is usually provoked by cash-
based accounting. In particular, if double-entry bookkeeping includes capital assets
(land, buildings) it can stimulate managers to make more efficient use of these re-
sources, rather than treating them as a ‘free good’, as often occurs in cash-based
systems. On the other hand, much depends on the organizational level at which the
books are balanced, and on the extent to which links to performance are made explicit.
If double-entry systems are confined to a high level, and accounting itself is performed
as a very centralized function, far from ‘street level’ management, then the impact on
most managers may be limited.
84 TRAJECTORIES OF MODERNIZATION AND REFORM
Our third stage, accruals accounting, brings the public sector on to as near as possible a
comparative basis to the private sector (lowering ‘grid’ in anthropological terms—Hood,
1998). It means that government organizations report commitments when they are
incurred (rather than when the cash is actually disbursed), allow for the valuation and
depreciation of all capital assets, and present annual ‘balance sheet-type’ financial state-
ments (Likierman, 1998; Khan and Mayes, 2009). When coupled with a system of decen-
tralized financial management it can form the basis for a close link between resource
allocation and performance management at the level of individual agencies and pro-
grammes. At the time of writing, full accruals accounts for public sector entities were
being produced by Australia, Canada, France, New Zealand, the UK, and the USA.
The significance of these shifts in accounting practices for management is considerable.
So long as a cash-based system prevails, without double-entry bookkeeping or accruals
accounting, it is hard to make either global or specific links between expenditure and cost,
and between cost and performance. Managers are not faced with the full costs of their use
of assets, and performance measurement, if it exists, tends to be a separate system from
financial management. On the other hand, the application of accruals systems is not
equally straightforward for all different types of service and circumstance, and reform
can create perverse incentives as well as advantages (Pollitt, 2000b; Straw, 1998; Newberry
and Pallot, 2006). It can also be less immediately understandable than cash accounts for
lay persons—including citizens and members of parliament. In both New Zealand and
Sweden there was some evidence that expenditure figures on the new accruals accounting
basis caused misunderstandings among parliamentarians.
When reform takes place it has frequently been a step-by-step process, moving from
pilot projects to larger scale roll-outs, or from one part of the public sector to others (which
means that distortions can arise during the sometimes long transitional periods, when one
part of the public sector is operating according to one set of accounting principles and
another is following a different set). For example, in the UK, accruals accounting was
introduced in the National Health Service before it was adopted for central government,
and in the Netherlands double-entry bookkeeping was required for some agencies but not
for their parent ministries. Furthermore, our three broad ‘stages’ of accountancy are
inevitably a somewhat over-neat classification of detailed practice. In the real world,
governments blur these categories considerably, by adding performance elements to basi-
cally cash-based systemsor by introducingpartial accruals accountingwith lots of exceptions
and special features (see HM Treasury, 1998, pp. 132–54).
Themost recent major trend in public sector accounting has been the interest inWhole-
of-Government Accounting (WGA—see Grossi and Newberry, 2009). This parallels the
interest in ‘joined-up government’/‘integrated public governance’ that we will deal with in
Section 4.6 on organizational changes. Like joined-up government, it seeks to see the big
picture, to bring all the various public sector actors within one framework. It has an
obvious logic—to hold a government to account one needs to see the whole of what is
going on—not just departmental expenditures but also agency expenditures as well as
previously ‘off books’ expenditures and liabilities such as those located in Public–Private
Partnerships (PPPs). All these should be brought together in a single account. It is a
logic which has come to seem all the more forceful in those countries where public
services have been fragmented into many organizations, and where much has been
TRAJECTORIES OF MODERNIZATION AND REFORM 85
contracted out or ‘partnerized’ (again, see Section 4.6). One can see in it some trace of NPG
ideas—that we need to see the big picture, including all the different actors, both public
and private, that may contribute to the delivery of a policy. The new OECD database,
Government at a Glance, explicitly refers to the need for a broader concept of governance
(OECD, 2009a) Yet there are also echoes of NPM—perhaps a kind of Mark 2 NPM where
the fragmentation of Mark 1 is overcome by fitting all agencies into one set of accounts, so
that the government can have one financial picture, even if there continue to be autono-
mous management and specialization in operational matters. WGA could even be said to
be compatible with NWS ideas, in that NWS reasserts the unity of the state, and the need
for modern methods of coordinating public actions.
There is often ambiguity about how far theWGA envelope is supposed to spread (is it all
central government, or central and local, or all bodies that spend public money and own
public assets?). The wider, more ambitious definitions of WGA imply a challenging degree
of centralization in accounting practice, and do not seem to have been fully implemented
anywhere. Furthermore it does not seem to be clear what the balance is between objectives
of macro-economic steering and micro-economic management (Grossi and Newberry,
2009). Finally, neither is it clear who is demanding WGA—who will really use it, and for
what? Despite these questions, WGA projects are going forward in several countries, albeit
often with delays and setbacks. It is noticeable, however, that the biggest efforts seem to be
being made by the core NPM states—Australia, New Zealand, and the UK. Developments
in continental Europe are far more limited and cautious, and are less firmly wedded to
business models.
Completing the financial circle, we now turn briefly to reforms in public sector auditing.
Again, we distinguish three stages (and again, these should be regarded as no more than
rough approximations to the complexities of detailed practice within each country and
sector). The first stage is that of traditional financial and compliance auditing. Here the basic
concern of the auditor is with legality and procedural correctness. Has the money been
spent on duly approved objects, through the correct procedures? Is there evidence of
unauthorized expenditure or corruption? The second stage is to add investigations of some
performance issues but still staying close to financial issues. For example, auditors may be
empowered to search for waste—items which have been purchased at unnecessary
expense, or items which have been perfectly legally purchased but which are not being
used very much (the school purchases a computer but no teacher can use it, so it sits in the
storeroom). Another extension of traditional audit is to extend it into a deeper questioning
of data quality (‘validation’). The figures presented to Parliament or Audit Office may add
up, but how reliable are they? Have all transactions been recorded, and recorded
accurately? This is, in effect, an audit of the performance of the organization’s internal
auditing system. The third stage is the development of full-blown performance auditing as
a distinct activity, often with a separate unit or section of the national audit office to
develop performance auditing expertise. Full-blown performance auditing may still be
concerned with financial issues (economy and efficiency) but it may also move on to look
at non-financial performance, for example are visitors satisfied with the national
museums, does the national weather bureau forecast the weather accurately? The devel-
opment of performance auditing over the last quarter century has been considerable, but
86 TRAJECTORIES OF MODERNIZATION AND REFORM
it has been takenmuch further in some countries than others (National Audit Office, 2005;
Pollitt et al., 1999).
Performance auditing now exists in most of our twelve countries, but it is carried out on a
larger scale and in a more ambitious way in some than in others (OECD, 2005, p. 95).
Australia, Canada, Finland, the Netherlands, New Zealand, Sweden, the UK, and the USA
are the countries where it is furthest developed. In some of these—especially Sweden, theUK,
and the US—the Supreme Audit Institutions (SAIs) have examined the scope for borrowing
techniques and concepts from evaluation, but have not created separate units to carry out
evaluations per se. Elsewhere, however, the place of performance audit is not so developed or
clear cut. In France there is no doubt that the magistrates of the Cour des Comptes can, and
oftendo, analyseperformance aspects, but theperformance audit functionhasbeen separated
from more traditional, compliance-oriented forms of audit only slowly and partly, and the
general culture is still highly legalistic. InGermany themain emphasis of the Bundesrechnung-
shof has been on compliance and financial auditing, though some performance elements are
also covered. The European Court of Auditors has a definite capacity for performance audit
but, in practice, seems to findmost of its staff resources drawn into the identification of fraud
and the provision, since 1994, of an annual statement of assurance (DAS) to the European
Parliament (National Audit Office, 2005; Pollitt et al., 1999).
Thus far the discussion of audit has been exclusively in terms of external audit by
independent audit offices. In practice, the work of external audit organizations is made
either much easier or much more time-consuming and difficult according to the state of
sophistication of internal audit within public sector organizations. In short, reform of
auditing usually entails more than just remandating, retraining, and reskilling the
national audit offices. It also requires matching changes in internal audit services. We
are not aware of substantial comparative research in this area, but in general, internal audit
and control practices seem to have developed considerably since the mid 1990s (OECD,
2005, pp. 90–3). For example, the crisis that led to the fall of the Santer Commission in
1999 helped to ensure that the introduction of an internal audit service would be a high
priority for the next leaders of the Commission (European Commission, 2000). Similarly,
in Belgium, the Copernicus reform announced in 2000 that henceforth each federal
ministry would have an internal audit service. Probably internal audit has become one
of the boom professions within the public sector (Put and Bouckaert, 2010).
4.5 Trajectories in personnel management/HRM
[T]he often prevailing perception that civil services are reform resistant is clearly wrong (Demmke and Moilanen,
2010, p. 4)
4.5.1 The volume and direction of reform
As Chapter 3 made clear, different countries entered the 1980s with contrasting legal and
cultural assumptions about the nature of public service (even the words are treacherous
TRAJECTORIES OF MODERNIZATION AND REFORM 87
here—‘public service’ already suggests an Anglo-American-Australasian perspective, by
contrast to continental countries in the Rechtsstaat tradition, which might rather regard
civil servants as ‘state officials’, or some such term). Yet despite differences of ‘starting line’
most countries suffered similar pressures, and were obliged to find some response. Cer-
tainly there has been no shortage of activity (the following list is selective, not
comprehensive):
� Australia: 1983 Amendment of the Public Service Act; 1987, 1993, 1995 Guidelines on
Official Conduct of Commonwealth Public Servants; 1990 Guidelines on Appraisal of
Performance of Senior Executive Service; 1999 Public Service Act.
� Belgium: 1994 new civil service statute; 1997 introduction of a personnel appraisal
system; 2000 Copernicus reform plan, including many aspects of personnel
management.
� Canada: 1989 new Personnel Management Manual; Public Service 2000 initiative;
Public Service white paper; 1992 Public Service Reform Act.
� European Commission: 1997 Modernization of Administrative and Personnel 2000
programme; 2003 creation of European Personnel Selection Office, and major reform
of recruitment system.
� Finland: 1994 State Civil Servants Act; 2005 pensions for state employees brought closer
to system for private sector pensions.
� France: 1989 Prime Ministerial circular on public service renewal included some person-
nel reforms. In the mid 1990s proposed personnel reforms helped provoke extensive
public sector strikes. In 2007 the new President, Sarkozy, launched a series of reforms
designed to ensure, inter alia, that only 50 per cent of those civil servants who were
retiring would be replaced.
� Germany: 1989 law amending working provisions for civil servants; 1994 Public Service
Reform Act; 1996 amendments to the law relating to federal civil servants.
� Italy: reforms of public employment law in 1993 and 1997; 1998 decree allows political
bodies to make top official appointments; 2009 tightening of rules to enforce annual
performance rankings.
� Netherlands: 1993 delegation of detailed negotiations on labour conditions from Min-
istry of Home Affairs to eight sectors (state, judiciary, municipalities, etc.); 1998 exten-
sion of Senior Public Service terms to all 1,500 top management positions.
� New Zealand: 1988 State Sector Act; 1991 Employment Contracts Act. By 2005 93 per
cent of staff were on open-term contracts (OECD, 2005, p. 172).
� Sweden: 1990 modification of Public Employment Act. Lifelong employment has been
replaced by employment on permanent contract for more than 75 per cent of govern-
ment staff (OECD, 2005, p. 172); 1991 public sector pensions made more like private
sector pensions.
� UK: 1992 Civil Service (Management Functions) Act; 1993 Civil Service Management
Code; White Papers The Civil Service: Continuity and Change (1994) and The Civil Service:
Taking Forward Continuity and Change (1995).
88 TRAJECTORIES OF MODERNIZATION AND REFORM
� USA: 1978Civil Service ReformAct (including creation of a Senior Executive Service); 1994
Federal Personnel Manual abandoned (with ceremonial burning of a copy on the White
House lawn, as part of National Performance Review (NPR)); 1994 Federal Workforce
Restructuring Act. After 2001 President G. W. Bush introduced new, more private sector
forms of employment for staff in the Departments of Homeland Security and Defense.
The Global Economic Crisis of 2008 ushered in hard times for many civil servants in many
states. Salaries were frozen or cut in most of our twelve countries, numbers were drastically
reduced in several, and pension rights were reduced in various ways (higher retiring age, less
generous pensions for those whowere not yet near retirement).Most of thesemeasures were
characterized by the same broad orientation (Farnham et al., 1996; Balk, 1996; Horton et al.,
2002; Hondeghem and Nelen, 2002). Politicians wanted civil services which were more
flexible and responsive, more focused on getting results, more skilful and, if possible, less
numerous (and therefore less expensive in total). After the GEC the downward pressure on
numbers became acute. Civil servants, meanwhile, while not averse to some of these
demands, also sought to retain existing privileges and protections. They obviously did not
want drastic downsizings with compulsory redundancies, and neither did they want salary
freezes or other arrangements which would further erode their material rewards in compari-
son with the private sector. In some places (France, the EU Commission) they had strongly
entrenchedunions and fought long andhard to stave off erosions of their basic conditions of
service (Howard, 1998). Nevertheless in the crisis atmosphere of 2008–10 many protections
and privileges were scaled back—even in the EuropeanCommission. Occasionally, constitu-
tional protectionswere so formidable that it was almost impossible for governments to effect
radical change (as for German federal civil servants). In other cases, resistance was either less
well organized or less embedded in legal rights, and fundamental changes were driven
through. For example, security of tenurewas significantly reduced inAustralia,NewZealand,
and the UK. Substantial downsizings were carried through in Australia, France, Finland,New
Zealand, the UK, and the USA (though one has to be careful in interpreting the statistics
because in some cases staff were transferred to other parts of the public sector).
Personnel changes seldom came first on the reform agenda. It was much more common
for them to follow—sometimes at a considerable distance—innovations in financial man-
agement, organizational structures, and management techniques. In this respect Australia
was not unusual (at least not for the Anglo-Saxon countries):
Financial management dominated the reform programme of the 1980s. In the latter half of the
decade, the limitations of this emphasis were increasingly acknowledged and pressures to broaden
the directions being taken and to reduce the subservience of management processes to financial
questions. Other forms of management were increasingly being advocated, human resource man-
agement assuming a prominence from the end of the 1980s. (Halligan, 1996b, pp. 102–3)
However, this positioning of Human Resource Management (HRM) reform as ‘last in the
line’ certainly changed with the GEC, when HRM reform itself became a way of achieving
desperately needed economies.
As far as the member states of the European Union are concerned, a recent comparative
analysis suggested that there had been a number of fairly widespread trajectories (Demmke
and Moilanen, 2010, pp. 3–4):
TRAJECTORIES OF MODERNIZATION AND REFORM 89
� a transition from centralized to decentralized determination of employment conditions
� a shift from statutory to contractual or managerial governance
� a development from career systems to post-bureaucratic (position systems)
� a delegation of responsibilities to managers
� an alignment of pay levels with private sector practices
� a change to special retirement schemes.
In this respect, therefore, there does seem to be a degree of convergence. It should not,
however, be exaggerated. As we know fromChapter 3, different countries started from very
different positions. As with budgetary reforms, some have moved further and faster than
others, and the gap between the formal system and the way operational decisions are
made in practice may in some cases be rather large. Demmke and Moilanen themselves,
having identified these widespread and important trends, nevertheless arrive at the con-
clusion that ‘the emergence of a new European-wide organizational model in the national
civil services cannot be identified’ (2010, p. 95).
It is perhaps easiest to understand these trajectories of change in respect of a ‘base case’.
This base case is very general, and applies to both the Rechtsstaat and the public interest
countries (Chapter 3, Section 6). In it, a typical civil servant is assumed to be:
� a tenured, career appointment—not dependent on the whims of transient politicians or
on one’s civil service superior (although dismissable, with difficulty, in cases of extreme
dereliction of duty or of criminal actions);
� promoted principally in relation to qualifications and seniority;
� part of a unified civil service, within a distinct and particular national framework of
terms and conditions (including national pay scales).
These are all features which made being a civil servant different from most private sector
jobs (and increasingly different during the 1970s and 1980s, as the nature of private sector
employment itself became more precarious). They are also features which, at least in the
core NPM countries, came to be seen as inhibiting the greater responsiveness and effi-
ciency which it had become fashionable for politicians and public alike to demand. In
Australia the Public Service Commissioner, explaining the main thrust of the 1999 Public
Service Act, said:
As public servants we need to walk the same fields and gaze the same blue skies that inspire
innovation in the private sector. Central to that is the need to bring our employment arrangements
more into line with the wider Australian community. Does anyone really believe that, protected by a
monopoly status and inadequate scrutiny, we can defend an approach to management that we now
know is at least twice as expensive as best practice? (Shergold, 1997, p. 33)
Note the elements in this quotation—the setting up of the private sector as the standard to
be attained, the emphasis on cost saving, and the suggestion that the public service is
over-protected and ‘feather-bedded’. One should beware of accepting all this at face
value. For example, it is easy to exaggerate the prevalence and influence of the three
distinctive features mentioned (e.g. many categories of civil servant in the UK never
had particularly strong tenure, low pay was common, and there had long been many
90 TRAJECTORIES OF MODERNIZATION AND REFORM
non-career and part-time appointments, especially in the clerical grades). Studies which do
show high average pay in some parts of the public sector often overlook the fact that those
staff are, on average, significantly more highly qualified than the private sector compari-
son group. Nevertheless, the popular stereotype of a tea-drinking, probably not very
efficient, yet secure and well-pensioned civil servant was never far from media reporting
and political characterization, especially by neo-conservatives. In the UK and the USA this
trend has been amplified by the GEC, to the point where it seems as if the hunt is on for
any public servant paid more than a modest amount. Even in France, a country with a
proud tradition of a powerful and talented civil service, there was a period when ‘[F]rom a
model of social success, the civil servant became an awful figure, the pure representation of
waste and incompetence’ (Rouban, 1997, p. 150). In the Netherlands, generally a more
consensual and incremental politico-administrative system than Australia or New Zeal-
and, the early 1990s saw steps being taken to ‘normalize’ the status of government
employees, and in 1992 it was agreed that the general pension fund for public employees
would be privatized. In Italy a 1993 reform contractualized the basis of most civil servants’
employment, and as a result these staff were subsequently governed mainly by private
labour laws (Demmke and Moilanen, 2010, p. 74). Even in Belgium, steps were taken to
lessen the differences between public sector and private sector employment (Brans and
Hondeghem, 1999; Hondeghem, 2000; Hondeghem and Vermeulen, 2000). In the Euro-
pean Commission the reforms at the beginning of the twenty-first century saw the
introduction of regular individual appraisals, and of large-scale management training.
Furthermore the Commission’s recruitment system was fundamentally overhauled, and
replaced with one that includes assessment centres and competency tests for the most
promising candidates (Ban, 2010a).
The three indicated characteristics therefore became easy foci for reform. We will now
look at each of the three features in turn.
4.5.2 A tenured career
The directions of change here were to make careers less secure, and to encourage larger
inflows and outflows of staff so that a smaller and smaller proportion of civil servants
were ‘lifers’ and a larger and larger proportion had experience of other ways of doing
things. A typical development in NPM countries was the appointment of top officials
(especially agency chief executives, but also, in some cases, the heads of ministries) on
two-, or three-, or five-year performance-related contracts. The most extreme case is again
New Zealand. There, all members of the Senior Executive Service (see 4.5.3) have to
reapply for their own jobs after five years, except for the heads of ministries (called Chief
Executives), who enjoy a provision which permits their contracts to be extended (Boston
et al., 1996, pp. 117–20).
Elsewhere, there has been less change. In Belgium, Canada, Finland, France, Germany,
and Sweden most top civil servants are career ‘mandarins’ with long experience and well-
established personal networks (see, e.g. Bourgault and Carroll, 1997). France is perhaps
rather different from the other countries in this group, to the extent that the members of
the grands corps frequently move in and out of jobs in the business world, and therefore
TRAJECTORIES OF MODERNIZATION AND REFORM 91
could not be accused of being monkishly bureaucratic. Indeed, one problem is that, with
falling civil service prestige, increasing numbers of these mandarins have been leaving for
the better-paid positions in the private sector (Rouban, 1997, p. 147). In the European
Commission the permanent A-grades continue to enjoy great security of tenure, although
since the Kinnock reforms their performance has now come under more systematic formal
appraisal than in the past (see European Commission file, Appendix B). The USA is different
again: here members of the Senior Executive Service have tended to be narrowly specialist
and, in any case, are obliged to work within a system where so many of their colleagues are
short-termpolitical appointees (Kettl et al., 1996, p. 56; on the ‘spoils system’seeAppendixB:
USA, country file).
4.5.3 Promotion by seniority and qualifications
Here the shift was to link promotion more to results and responsiveness, often by
embodying the required results in an annual agreement or quasi-contract, containing
specified individual targets and priorities. Usually the change was only partial—seniority
and qualifications were still elements in the overall calculation—but the intention of
making civil servants more sharply focused on specific and usually short-term objectives
was quite clear. This new emphasis was frequently reinforced by linking pay as well as
promotion to ‘track record’ in achieving results (see 4.5.4).
A further important development in a number of countries was the creation of some
form of Senior Executive Service (SES) (Australia, Canada, New Zealand, the UK, and the
USA—see Ban and Ingraham, 1984; Boston et al., 1996, pp. 117–20; Halligan, 1996b, pp.
86–7). This kind of grouping was supposed to bring a variety of benefits (‘supposed’
because in every case there were significant difficulties in achieving the originally pro-
claimed goals). Basically an SES was intended (with slightly different emphases in each
country) to create a more mobile, flexible, responsive, and managerially competent group
at the top of the public service. An SES would be more mobile because provisions would
allow the easier recruitment of competent executives from outside the normal career
ladder of the civil service, and because the terms and conditions would explicitly include
horizontal movement within the politico-administrative machine (‘horses for courses’). It
would be more responsive partly because the right (wo)man could be moved into the right
place at the right time, but also because promotion was intended to be for the ‘can do’
individuals with track records of achievement, rather than by seniority and precedence. As
the UK Conservative government put it:
Entry to the SeniorCivil Service fromwithin a department or agencywould bemarked for the individual
concerned by leaving negotiated group pay arrangements andmoving to individually-determined pay,
and by acceptance of a written contract of service. (Prime Minister et al., 1994, p. 37)
This type of system was usually backed up by some form of Performance-Related Pay (PRP)
(in both Australia and the USA this was also intended to be a way of circumventing general
civil service pay restrictions so as to be able to retain ‘high flyers’). Experiments with
performance pay have been implemented in most of our twelve countries, and elsewhere,
but often with mixed or downright disappointing results (Gaertner and Gaertner, 1985;
OECD, 1993b; Perry and Pearce, 1985; Perry et al., 2009). Again, the pattern is of the
92 TRAJECTORIES OF MODERNIZATION AND REFORM
widest use coming in the core NPM countries (and, on this score, the USA), with more
cautious and limited projects in the Nordic countries and France. It is perhaps typical of
the more sceptical approach of the continental European countries that, in Finland and
Sweden, while PRP is legally possible, many public departments and agencies decline to
avail themselves of it, arguing that it would be divisive and unhelpful. Additionally,
managerial competence can be increased by bringing in outsiders with managerial back-
grounds as well as by the provision of intensive high-level management training pro-
grammes (Op de Beeck and Pollitt, 2010). The advantages of this trajectory are thus
obvious, but it has potential disadvantages too. Concerns about the dangers of increasing
the number of short-term fixers and ‘yes-men’ (and ‘yes-women’), and endangering the
promotability and security of those who give ‘frank and fearless’ advice, have been
expressed in several countries, including Australia, Belgium, Canada, and the UK.
4.5.4 Part of a unified national service
In this case the thrust in quite a few countries was towards decentralization of personnel
authority, initially for the day-to-day management of individuals, but increasingly also in
terms of a widening range of terms and conditions, so that, ultimately, line managers could
hire and fire on terms they set according to local conditions, and the concept of a unified
public service was for all practical purposes abandoned. This direction of change had many
ramifications. Pay, hours of work, required qualifications, disciplinary and dismissal proce-
dures—all these andmoremight cease to bematters of national negotiation bymanagement
and union leaders and be decentralized by organization, region, or occupational group. The
new philosophy was succinctly enunciated in a UKWhite Paper in 1994:
No two civil service organisations are identical, any more than two organisations elsewhere in the
public or private sectors. It is right that pay and grading systems, like other management arrange-
ments, should be attuned to individual circumstances and relevant labour markets. (Prime Minis-
ter et al., 1994, p. 26)
In Australia, as in the UK, the outline shell of a unified public service was retained but, with
the 1999 Public Service Act:
It is departmental secretaries and agency heads who will determine the remuneration, conditions
and terms of employment. No longer will the legislation distinguish between public servants on the
basis of whether they are permanent or fixed-term. It is secretaries who will decide how they will
employ public servants and on what conditions of engagement. It is they whowill assign duties and
delegate responsibility. (Shergold, 1997, p. 34)
InNewZealand the governmentmoved away altogether fromthe concept of a single, unified
service. The 1988 State Services Act established departments, under their Chief Executives, as
the employers of their own staff. TheAnnualGeneral Adjustment (of pay) andpublic service-
wide negotiation of non-pay conditions of service were abolished (Boston et al., 1996,
chapter 10). The public sector came under the provisions of the Labour Relations Act,
which had previously been meant for the private sector. By the early 2000s, however, the
New Zealand government was seeing the need to find other ways to re-emphasize the unity
of the senior civil service (see New Zealand country file, Appendix B).
TRAJECTORIES OF MODERNIZATION AND REFORM 93
This kind of ‘normalizing’ trajectory, where the civil service is ‘deprivileged’ and increas-
ingly treated on the same fragmented and locally varying terms as private sector employ-
ment, has certainly not been followed by all countries. France, Germany, and the
European Commission are notable and weighty exceptions. In Italy the terms of civil
service employment have been brought somewhat closer to those prevailing in the private
sector, but there are still significant differences, especially for more senior grades. TheMAP
2000 initiative by the European Commission was proclaimed as a major decentralization
in personnel management, and this tendency was taken further by the Kinnock reforms
(see European Commission file in Appendix B). Nevertheless, by comparison with what
had already been implemented by the core NPM countries, it was quite timid and conven-
tional (European Commission, 1997b, 2000). In Belgium, Germany, and France, the state
servant remains a very distinct category—legally, culturally, and politically. As we saw to be
the case with financial management reforms, the northern European states have followed
a path somewhere between the NPM enthusiasts, and the more conservative Rechtsstaat
regimes. Finland and Sweden have made provisions for performance-related pay, and for
more decentralized and results-oriented styles of personnel management. Yet these
countries have not more than marginally dismantled the essential unity of the civil
service. The same could be said of the Canadian federal civil service (Bourgault and Carroll,
1997, but for more recent concerns see Aucoin and Savoie, 2009). In the Netherlands,
career management of top civil servants was actually centralized during the mid 1990s
(Mazel, 1998).
The USA is once more a unique case. In theory a scrupulously fair and impersonal merit
system provides a national framework for recruitment and job classification:
However, the federal government’s uniformmerit system today is neither uniform,merit-based, nor
a system. It now covers barely more than half—56%—of the federal government’s workers. Only
15% of the federal government’s new career employees enter through the system’s standard testing-
and-placement process. (Kettl et al., 1996, p. 1)
Despite much debate during the 1980s and 1990s, no comprehensive reformwas agreed or
implemented (so in this respect the USA was unlike Australia and New Zealand). The
problem, in the complex and fragmented US political system, is that:
Civil service reform is on everyone’s list of jobs that must be done—but it is high on virtually no
one’s list. It has too little sex appeal to excite political interest; and though everyone agrees on the
need for change, the consequences of not reforming the civil service never seem great enough to
force it onto the policy agenda. (Kettl et al., 1996, p. 2)
Instead of head-on reform, what has tended to happen in recent years is that the executive
has, so to speak, worked around the edges of the merit system, circumnavigating it rather
than conquering it. Thus President G. W. Bush, for example, was able to introduce new,
more private-sector-like HRM procedures in the new Department of Home Security and in
the Department of Defense. And the process of contracting out federal work to the private
and non-profit sectors (see USA country file, Appendix B) also tends to diminish the
importance of the rump of the traditional civil service. In short, the USA, while far from
the European Rechtsstaat model in political temperament and rhetoric, was nevertheless
home to an often rigid and unreformed (or perhaps one should say partially and incoher-
ently reformed) core civil service.
94 TRAJECTORIES OF MODERNIZATION AND REFORM
4.5.5 Interpreting the big picture on HRM
Here it may be useful to return to the idea of ‘public service bargains’ which was intro-
duced in the previous chapter (Section 3.5). Figure 4.3 shows the basic schema developed
by Hood and Lodge (2006). We should remember that these bargain categories are usually
applied to senior civil servants—those who actually interact with political leaders—
whereas much of the legislation and reform previously referred to covers the majority of
public servants, at all levels.
In general, we can say that there are strong (but not universal) trends towards ‘de-privile-
gization’ and away from trusteeship. In a number of countries, bargains of types B1a and/or
B1b are becoming less usual, and bargains of type B2a are becomingmore common. Further-
more, the growth in thenumbers and influenceofpolitical advisers in countries likeBelgium,
Canada, the UK, and the USA mean that in those states the category of B2b bargains has
gained prominence—especially subtype B2b2. Yet there are also cases where the bargain
between politicians and mandarins remains one in which senior civil servants are treated as
an independent group of technocrats ormagistrates (B1b). The French grands corps still fall in
this category, as domost seniorGermancivil servants. Andwemust remember that in almost
every system there are particular groups which are exempted from themore general trends—
such as the exemption of Italian judges, prosecutors, prefects, and diplomats from the 1993
reformwhich contractualizedmost other civil service appointments (for a general treatment
of these many differences and details, see Demmke and Moilanen, 2010). So there is more
than oneomega, andmore than one trajectory, but the dominant direction of travel is that of
reducing the distinctiveness of the rules governingmany public service jobs, from the top to
the bottom of the hierarchy.
Finally, we can ask how all this relates to the three big models—NPM, NWS, and NPG.
Clearly, many of the developments we have cited in this section possess an NPM-ish flavour,
especiallymoving towards private sector types of employment contract and the introduction
of performance-related pay. Yet at the same time we have noted the reluctance of some
states—Germany, for example, and to a lesser extent France and the Nordic states—to go
very far down this road. In those cases the vision has seemed to be more NWS-ish: that it is
important to keep the public service somewhat distinct fromprivate sector employment, and
to continue to endow at least some parts of it with special status and protections. In this
particular context the significance of NPG thinking is hard to assess. Presumably its advocates
would urge that civil servants be trained to network and collaborate with a range of other
stakeholders. If so, there is some evidence that these ideas are indeed beginning to infiltrate
training programmes for top civil servants (Op de Beeck and Pollitt, 2010). But what the
implications might be for civil service recruitment, pay, and conditions are not clear.
4.6 Organizational trajectories
The restructuring of organizations is a ubiquitous feature of public sector management
reforms (for details on the twelve countries, see Appendix B). Of the many different
TRAJECTORIES OF MODERNIZATION AND REFORM 95
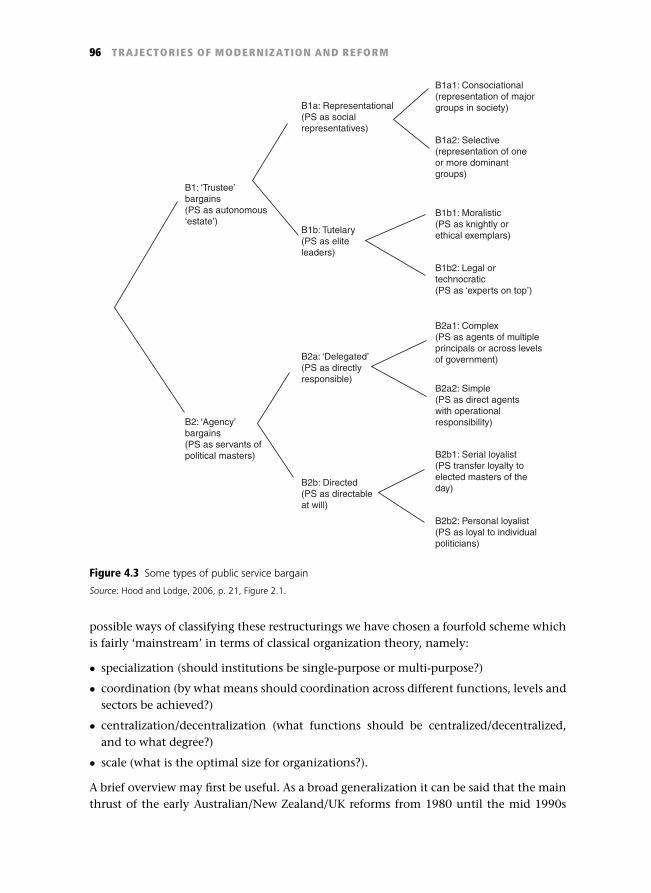
possible ways of classifying these restructurings we have chosen a fourfold scheme which
is fairly ‘mainstream’ in terms of classical organization theory, namely:
� specialization (should institutions be single-purpose or multi-purpose?)
� coordination (by what means should coordination across different functions, levels and
sectors be achieved?)
� centralization/decentralization (what functions should be centralized/decentralized,
and to what degree?)
� scale (what is the optimal size for organizations?).
A brief overview may first be useful. As a broad generalization it can be said that the main
thrust of the early Australian/New Zealand/UK reforms from 1980 until the mid 1990s
B1: ‘Trustee’bargains(PS as autonomous‘estate’)
B2: ‘Agency’bargains(PS as servants ofpolitical masters)
B2a: ‘Delegated’(PS as directlyresponsible)
B2b: Directed(PS as directableat will)
B1b: Tutelary(PS as eliteleaders)
B1a: Representational(PS as socialrepresentatives)
B1a1: Consociational(representation of majorgroups in society)
B1a2: Selective(representation of oneor more dominantgroups)
B1b1: Moralistic(PS as knightly orethical exemplars)
B1b2: Legal ortechnocratic(PS as ‘experts on top’)
B2a1: Complex(PS as agents of multiple principals or across levelsof government)
B2a2: Simple(PS as direct agentswith operationalresponsibility)
B2b1: Serial loyalist(PS transfer loyalty toelected masters of theday)
B2b2: Personal loyalist(PS as loyal to individualpoliticians)
Figure 4.3 Some types of public service bargain
Source: Hood and Lodge, 2006, p. 21, Figure 2.1.
96 TRAJECTORIES OF MODERNIZATION AND REFORM
was towards organizations which were more specialized; towards coordination by means
of market mechanisms and contractual and quasi-contractual relationships, instead of
through hierarchies of authority; towards decentralization of authority from the centre
towards the periphery (in both hierarchical and geographical terms); and towards decreas-
ing the size of public organizations by breaking up and downsizing large bureaucratic
organizations (Boston et al., 1996; O’Toole and Jordan, 1995; Peters and Savoie, 1998).
Trends towards specialization and fragmentation have also been discernible in Canada,
France, and the Netherlands (though to a lesser degree than in the core NPM countries),
but are much less marked in Belgium, Finland, Germany, and Sweden, each of which has
retained its central ministerial or directorate structure with only limited fragmentation,
downsizing, or ‘hiving off’. The EU Commission has also acquired a growing penumbra of
agencies (Rambøll/Eur�eval/Matrix, 2009). Of course some of these systems—the German
and the Swedish for example—were already highly decentralized, so it can be argued that
they had less ‘need’ of reforms of this type. The USA sported a fairly fragmented and
specialized administrative system from the start (see Appendix B: USA country file) and has
been concerned to try to develop overall systems which will permit greater coherence (e.g.
common accounting procedures, common reporting procedures through the Government
Performance and Review Act). As for decentralization, almost everyone seems to believe in
it, though, as we shall see, it takes on a different personality in different contexts (Pollitt,
2005).
During the twenty-first century, however, a new trend has appeared. Especially in those
countries which had undergone the most radical fragmentation (Netherlands, New Zeal-
and, UK) the tide turned towards better coordination. This has taken a variety of forms
(although nowhere has it become the reconstruction of traditional, large, multi-functional
departments) but it has been a discernible trend nonetheless. Strengthened coordina-
tion—both vertically and horizontally—is also much facilitated by the intelligent applica-
tion of modern information and communications technologies. One promising
interpretation is that the earlier, specializing and fragmenting reforms unintentionally
produced difficulties for policymakers, who could no longer control all the autonomous
‘bits’ as they wished, and so started to look for devices that would enable them to be more
coordinated, ‘joined-up’, or strategic (Bogdanor, 2005; Bouckaert et al., 2010). A further
development of this is the idea that the reaction against fragmentation merged with
pressure to use new ICTs so that a model of ‘Digital-Era Governance’ has now emerged
(Dunleavy et al., 2006b). Two of the key themes of this new model are said to be ‘reinte-
gration’ (putting back together what NPM had put apart) and ‘needs-based holism’ (sim-
plifying the entire relationship between the citizen and the state, so that the former only
has to go to one website or place to get all his/her requirements dealt with).
The signs of attempts at improved coordination are clear to see. One popular initiative
has been to develop some form of strategic planning. This has been tried (in different
ways) by Australia, Canada, Finland, New Zealand, and the UK. The New Zealand system
of Strategic Results Areas (SRAs) and Key Results Areas (KRAs) is probably the best known
(Boston et al., 1996, pp. 282–3; Matheson, Scanlan, and Tanner, 1997). In Canada, the
1994 Program Review exercise was intended to put an end to the fragmented and volatile
policymaking which was seen as a characteristic of the preceding Mulroney administra-
tions (Aucoin and Savoie, 1998). In Finland, a ‘Strategy Portfolio’ was developed and the
TRAJECTORIES OF MODERNIZATION AND REFORM 97
government tried to take a strategic overview of government organization (High Quality
Services, Good Governance and a Responsible Civic Society, 1998a, especially pp. 19–22, and
the later consultancy report, Bouckaert, Ormond, and Peters, 2000). In the UK, following a
period of distaste for central planning and coordination under Mrs Thatcher, the Blair
Labour government committed itself to better ‘joined-up’, horizontally coordinated
policymaking. It set up cross-departmental reviews in areas such as criminal justice and
services for young children, and conducted a comprehensive review of all government
spending (Chancellor of the Exchequer, 1998, especially pp. 33–41; Pollitt, 2003b). The
four dimensions will now be examined in more detail, in sequence.
Specialization. Alternation between a preference for broad-scope, multi-purpose organ-
izations and, by contrast, a predeliction for tight-focus, specialized organizations has been
one of the salient features of the history of administrative thought. The idea that speciali-
zation is the basis of good administration can trace its supporters back through Adam
Smith and Jeremy Bentham. The opposite doctrine—that consolidation is good—has been
advanced by, inter alia, Sir Edwin Chadwick and Karl Marx (Hood and Jackson, 1991, pp.
114–16). The pendulum may swing twice within a single generation, witness the shift in
UK central government from a preference for large, omnibus central ministries (favoured
by both Labour and Conservatives in the late 1960s and early 1970s) to the 1990s’ model
of downsized and relatively focused ministries surrounded by shoals of specialized execu-
tive agencies (Pollitt, 1984; O’Toole and Jordan, 1995) and then back to ideas of ‘joined-up
government’ (Bogdanor, 2005; Office of Public Services Reform, 2002; Prime Minister and
Minister for the Cabinet Office, 1999).
During the 1980s the international swing was towards more specialization, most clearly
in those countries which were the most influenced by the application of micro-economic
reasoning to questions of institutional design. This took place at all levels—micro, meso,
and macro. Thus in New Zealand ‘the preference for single-purpose organisations and the
separation of potentially conflicting functions has led in some cases to a plethora of
functionally distinct, but nonetheless quite interdependent, organisations’ (Boston et
al., 1996, p. 88). But by the late 1990s there was much discussion in New Zealand
government circles of the drawbacks of having such a large number of ministries to deal
with such a small population. In 2001 a Review of the Centre initiative was launched
aimed at strengthening strategic capacity and encouraging a ‘whole of government’
approach (Bouckaert et al., 2010, pp. 108–13; Gregory, 2006).
New Zealand is probably the clearest, but is not the only case. In the UK the Next Steps
programme, launched in 1988, led within ten years to the creation of more than 140
specialized executive agencies (Chancellor of the Duchy of Lancaster, 1997). In France
more than 200 centres de responsabilit�e (CDRs) were set up after 1989. In the Netherlands
many Zelfstandige Bestuursorganen (ZBOs) were created during the 1980s, and since 1991
more than twenty specialized agencies have also appeared (Ministerie van Financi€en, 1998)).
The Canadians moved more cautiously, but there, too, some ‘Special Operating Agencies’
(SOAs) were carved out of the federal ministries (the first five appeared in 1989—see Appen-
dix B: Canada country file). In Italy legislative decree number 3,000 of 1999 led to the setting
up of a number of agenzie, some with their own legal personalities and some as units
within ministries. Germany, however, is generally an exception to the trend. There,
the main ‘receiving positions’ for the flow of decentralized functions has been not specialist
98 TRAJECTORIES OF MODERNIZATION AND REFORM
agencies (though a few of these have been set up) but rather multi-functional local author-
ities (Wollmann, 2001). Indeed, the number of federal agencies, which had increased since
the 1960s, actually began to decline during the 1990s (Bach and Jann, 2010).
In sum, one might say that the use of specialized administrative and managerial bodies
appears to have grown in at least ten of our twelve countries—at least up to the early 2000s. It
has also taken place in the EUCommission, although there themain growth perhaps came a
little later (Rambøll/Eur�eval/Matrix, 2009). The creation of agencies was particularly popular
(Pollitt et al., 2004; Pollitt and Talbot, 2004; Peters and Bouckaert, 2003).
Coordination. In a traditional hierarchy, coordination is ensured by the exercise of
authority from the top. Coherent and consistent orders are passed down the line. Central
staff units, supporting the top administrators, check lower-level proposals to ensure that
they all fit the strategy, that precedents are observed, and that division X does not set out
along a line that contradicts what is being done at division Y. Regulations are issued from
the centre which all must observe. When new situations occur, new regulations are
formulated to deal with them, and these are fitted into the existing body of law and
procedure which guides every part of the organization. Such exercise of hierarchical
authority is, however, not the only way of achieving coordination (Thompson et al.,
1991). Coordination can also be achieved less formally, by voluntary cooperation within
a network. This form of ‘solidarity’ tends to be more easily achieved where objectives are
widely shared among all network members, communications are easy and full, and the
scale of operations is modest (Pollitt, 2003a, chapter 3). A third mode of coordination is
the market mechanism. The miracle of the market is that a price mechanism enables the
activities of many producers/sellers and consumers/buyers to be coordinated without any
central authority ordering it so. The ‘hidden hand’ of supply and demand does the work,
and with the assistance of modern communications and information technologies, that
work can be accomplished with great speed (think of e-Bay). As we saw in Chapter 1, each
of these three different primary modes of coordination tends to ‘lead’ one of our three big
models of reform—market mechanisms for the NPM, hierarchy for the NWS, and net-
works for the NPG (Table 1.3). Note, however, the significant complication that the
purposes of coordination are not necessarily the same in all instances. Amarket mechanism
may be a brilliant way to coordinate the buyers and sellers of a defined product, but less
good at coordinating, say, food inspectors and food retailers, or sick people and
health care.
Although it is conceded that under certain conditions—most influentially specified in
theoretical terms by Williamson, 1975—hierarchies may be preferable to markets, the
main weight of NPM arguments has been that there are many hitherto unseen opportu-
nities to ‘marketize’ relationships within the public sector. Indeed, just as certain words
such as ‘decentralization’ and ‘empowerment’ have become unassailably positive in their
connotations, ‘hierarchy’ and ‘hierarchical’ have become invariably negative—within the
NPM discourse, but also among those who advocate more network-type coordination
(NPG). Even where an indisputably hierarchical relationship remains, there may be an
attempt to package it into a quasi-contract, where the ‘agent’ (‘subordinate’, in old-
fashioned hierarchical terms) agrees to supply the ‘principal’ (superior, boss) with a
defined set of outputs within a fixed time period and at a predetermined cost. In the
countries which were most enthusiastic about NPM there was therefore a wide-scale
TRAJECTORIES OF MODERNIZATION AND REFORM 99
substitution of market and quasi-market coordination and contractualization for hierar-
chical coordination (Lane, 2000, elaborates the theoretical underpinning for this ten-
dency). In New Zealand, for example, the chief executives who run ministries agreed an
annual quasi-contract with their minister, promising to deliver specified outputs which
were then supposed to lead to the outcomes at which the minister and his/her govern-
ment were aiming. In most countries contractualization did not infiltrate so high up the
chain of minister/mandarin command. Slightly lower down, however, contractualization
andmarketization have spread widely in Australia, New Zealand, the UK, and the USA, and
to a lesser extent in Canada, the Netherlands, and Sweden. It has gone hand-in-hand with
many of the measures of specialization referred to in the previous subsection. Thus, for
example, where a pre-1991 District Health Authority in the UK might have given an
instruction to a local hospital, in the post-1991 ‘provider market’ it contracted for defined
services with a legally independent corporation—the NHS trust which the previously
‘directly managed’ hospital had become. The two parts of the previously hierarchical
National Health Service had specialized into a purchaser and a provider, joined by con-
tract. The example of the Canadian Special Operating Agencies provides a further illustra-
tion of the general logic:
The SOA is based on the same theoretical models as organisational forms being adopted by other
governments and large corporations. The models are more contractual than hierarchical; provide
greater autonomy to individual units of the whole; and rely more on market mechanisms then
central decisions to allocate resources. (Auditor General of Canada, 1994, p. 2)
This spread of contractual and quasi-contractual relationships provoked a certain amount
of academic concern, both by legal theorists worried about the inadequacies of the
relevant areas of administrative law (Harden, 1992; Bouckaert, 2002a) and by public
administrationists who pointed to the difficulties of writing ‘complete’ contracts in con-
ditions where the providers of services have much more information than the purchasers
and/or users (Le Grand and Bartlett, 1993).
Not all countries have been as enthusiastic about the potential of market-type mechan-
isms (MTMs) and contractualism as New Zealand, the UK, and the US. Such devices have
been used more sparingly in Germany, France, and even the Nordic countries (see, e.g.
Wollmann, 2001). Here limited local experiments have been more characteristic than
sweeping marketizations of entire sectors.
Merging departments has for long been one way of improving coordination. Of course,
this route rather contradicts the trend to specialization, noted above, but it is a device that
has been used by some countries. While New Zealand was allowing the number of its
ministries to proliferate, its neighbour, Australia, was reducing its population of depart-
ments from twenty-eight to eighteen (1987—see Appendix B). In 1993 Canada followed
suit, reducing the number of federal departments from thirty-two to twenty-four (see
Appendix B). These initiatives were reminiscent of much earlier (1960s’ and early
1970s’) attempts by UK governments to rationalize the pattern of ministries by creating
large, ‘strategic’ departments (Pollitt, 1984). In Italy in 2000 a population of more than
twentyministries weremerged and slimmed to just a dozen. In the UK the 2000s brought a
number of departmental mergers (e.g. the tax department with the customs and excise
department) but the overall number of ministries did not change much (White and
100 TRAJECTORIES OF MODERNIZATION AND REFORM
Dunleavy, 2010). There was not much change of this kind in the US (where it is anyway
more difficult to do), except for the 2002 creation of a huge Department of Homeland
Security (see US country file, Appendix B). In France, 2008 witnessed quite large-scale
mergers, with the Ministry of Finance merging with the Ministry of Employment and
Public Servants to produce a Ministry of the Budget, Public Accounts, and Civil Adminis-
tration (see France country file, Appendix B).
Another feature in a number of central governments has been an attempt by politicians
themselves to exert greater control over the bureaucracy (Peters and Pierre, 2004). This
phenomenon will be discussed in more detail in Chapter 6, but it should be noted here as,
in effect, another species of coordination effort. It has been particularly noticeable in
Australia, New Zealand, the UK, and the USA, but softer echoes have also been heard in
Belgium, Finland, the Netherlands, and Sweden. In all these countries the numbers of
temporary appointments and political advisers has grown—although the absolute number
varies enormously from just a handful to large numbers. Australia offers perhaps the
clearest case. As Halligan puts it (1996b, p. 82): ‘Reform programs [during the Labor
governments of 1983–93] were driven by a foremost concern of Labor—political con-
trol—which had come to be regarded both as an end in itself and ameans to implementing
party policy. To achieve this required a redistribution of power between the bureaucracy
and the politicians.’ To achieve this, the capacity of the PrimeMinister’s office and cabinet
were enhanced, the pattern of ministries was radically altered (1987), ministers mademore
active use than hitherto of their right to influence senior bureaucratic appointments, and
muchgreater usewasmade of specially recruitedministerial advisers. This trendwas further
amplified during the later Howard administration (1996–2007).
To conclude this review of coordination, it should be remarked that, even where
traditional hierarchies remained in place, the instruments of hierarchical coordination
tended to change. In particular there was a shift from control and coordination by
rationing inputs and regulating procedures to a greater emphasis on coordination by
targets and output standards. The majority of the twelve countries became active in
developing indicator sets for the performance of almost every imaginable public service
(for Australia see Department of Finance, 1996; Department of Finance and Administra-
tion, 1998a and b; Development Team, 1998; for Canada, seeMayne, 1996; Treasury Board
of Canada, 1996; for the Netherlands, see Leeuw, 1995; Mol, 1995; for the UK, see Carter
et al., 1992; Chancellor of the Duchy of Lancaster, 1997; Likierman, 1995; Pollitt, 1986,
1990; for the USA, see Radin, 1998). Some, however, are still at a fairly undeveloped stage.
In Germany there has been much more reform at local and provincial (Lander) level than
in the federal government. Large parts of the Belgian and Italian public sectors appear to
have little in the way of output or outcome targets. Equally, the key Kinnock reform
documents from the European Commission (2000, 2001) stop well short of providing a
set of quantitative criteria by which the success of individual reforms and programmes
might later be judged.
Decentralization. Decentralization, ministers and mandarins have said, makes possible
more responsive and speedy public services, better attuned to local and/or individual
needs. It facilitates ‘downsizing’ by leading to the elimination of unnecessary layers of
middle management. It even produces more contented and stimulated staff, whose jobs
have been ‘enriched’ by taking on devolved responsibilities for financial and personnel
TRAJECTORIES OF MODERNIZATION AND REFORM 101
management, and by escaping from the overburden of centralized regulation. Given all
these benefits it is little wonder that almost every country (and the European Commission)
seems to be officially in favour of decentralization (Pollitt, 2005). Like virtue, however,
decentralization is differently construed by different parties, and is far easier to preach and
praise than to practise. If we are to describe the actual trajectories in a way that carries some
real meaning then we have to distinguish between different aspects of decentralization—
different alphas—as well as between rhetoric and reality.
One way of deconstructing the concept of decentralization is to recognize that it is a
process which contains at least three strategic choices. These are depicted in Table 4.3.
The first choice is therefore between political decentralization, where the decentralized
authority is transferred to elected political representatives (e.g. when central government
decentralizes a power to local government) and administrative decentralization, where
authority is passed to an appointed body such as a UK Urban Development Corporation
or a Swedish agency. The second choice is between transferring authority to another body
which is selected by competitive means (e.g. through competitive tendering for a local
authority refuse collection service), and transferring authority by non-competitive means
(e.g. where a UK Health Authority transferred some of its authority to an NHS provider
trust). A third choice is between internal decentralization (where the act of transfer takes
place ‘within the walls’ of an existing organization) and external decentralization, where
the authority is transferred to a separate, external body (which might be an existing one or
a new, specially created one). When authority to spend up to $X without seeking permis-
sion is delegated from the Principal Finance Officer to senior linemanagers, that is internal
decentralization. When authority was transferred from a UK local education authority to a
grant-maintained school under Mr Major’s Conservative government, that was external
delegation (Pollitt, Birchall, and Putman, 1998).
The balance between these different forms of decentralization has been rather differ-
ent in different countries. Once more, different countries have started from very different
positions. Thus, for example, central governments in France, Sweden, Finland, and
the UK, have each praised the virtues of decentralization, but in the early 1980s, France
and the UK were relatively centralized countries, while the two Nordic states were both
already extensively decentralized (see Chapter 3 and Appendix B). Germany had
been very decentralized since the Second World War, at least by Franco-British stan-
dards (Schr€oter and Wollmann, 1997; Wollmann, 2001). Taking this into account, we
can say that administrative decentralization has been the preferred form in New
Zealand, while political decentralization has been the dominant type in Belgium, Fin-
land, Germany, France, and Sweden. Few new powers have been given to local govern-
ments in New Zealand and the UK. In each case decentralization has transferred
authority to a range of specialized administrative bodies. However, the UK did experi-
ence a very significant act of political decentralization when the Blair administration
created elected assemblies for Scotland and Wales (see UK country file, Appendix B). In
France probably the most significant single reform of the last three decades was the
decentralization to local and regional elected authorities carried out by the Mitterand
Presidency and the socialist government from 1982 (see Appendix B, France, and de Mon-
tricher, 1996), though various forms of administrative decentralization have continued to
be announced ever since. In Germany, it is local governments which have probably gained
102 TRAJECTORIES OF MODERNIZATION AND REFORM
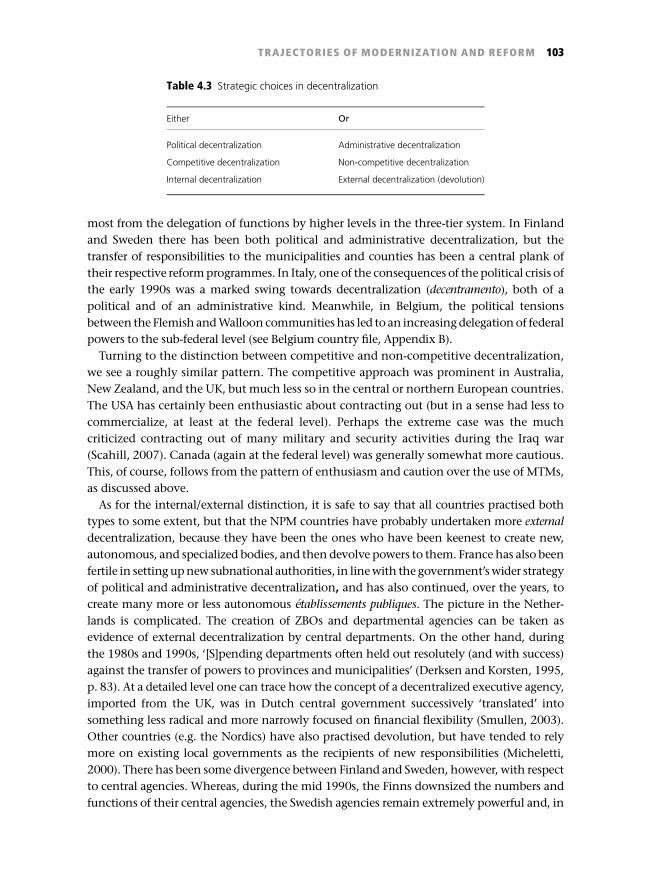
most from the delegation of functions by higher levels in the three-tier system. In Finland
and Sweden there has been both political and administrative decentralization, but the
transfer of responsibilities to the municipalities and counties has been a central plank of
their respective reformprogrammes. In Italy, one of the consequences of the political crisis of
the early 1990s was a marked swing towards decentralization (decentramento), both of a
political and of an administrative kind. Meanwhile, in Belgium, the political tensions
between the Flemish andWalloon communities has led to an increasingdelegationof federal
powers to the sub-federal level (see Belgium country file, Appendix B).
Turning to the distinction between competitive and non-competitive decentralization,
we see a roughly similar pattern. The competitive approach was prominent in Australia,
New Zealand, and the UK, but much less so in the central or northern European countries.
The USA has certainly been enthusiastic about contracting out (but in a sense had less to
commercialize, at least at the federal level). Perhaps the extreme case was the much
criticized contracting out of many military and security activities during the Iraq war
(Scahill, 2007). Canada (again at the federal level) was generally somewhat more cautious.
This, of course, follows from the pattern of enthusiasm and caution over the use of MTMs,
as discussed above.
As for the internal/external distinction, it is safe to say that all countries practised both
types to some extent, but that the NPM countries have probably undertaken more external
decentralization, because they have been the ones who have been keenest to create new,
autonomous, and specialized bodies, and then devolve powers to them. France has also been
fertile in setting upnew subnational authorities, in linewith the government’swider strategy
of political and administrative decentralization, and has also continued, over the years, to
create many more or less autonomous �etablissements publiques. The picture in the Nether-
lands is complicated. The creation of ZBOs and departmental agencies can be taken as
evidence of external decentralization by central departments. On the other hand, during
the 1980s and 1990s, ‘[S]pending departments often held out resolutely (and with success)
against the transfer of powers to provinces and municipalities’ (Derksen and Korsten, 1995,
p. 83). At a detailed level one can trace how the concept of a decentralized executive agency,
imported from the UK, was in Dutch central government successively ‘translated’ into
something less radical and more narrowly focused on financial flexibility (Smullen, 2003).
Other countries (e.g. the Nordics) have also practised devolution, but have tended to rely
more on existing local governments as the recipients of new responsibilities (Micheletti,
2000). There has been some divergence between Finland and Sweden, however, with respect
to central agencies. Whereas, during the mid 1990s, the Finns downsized the numbers and
functions of their central agencies, the Swedish agencies remain extremely powerful and, in
Table 4.3 Strategic choices in decentralization
Either Or
Political decentralization Administrative decentralization
Competitive decentralization Non-competitive decentralization
Internal decentralization External decentralization (devolution)
TRAJECTORIES OF MODERNIZATION AND REFORM 103
many cases, have received even greater devolved power from their ministries than hitherto
(OECD, 1998; Molander, Nilson, and Schick 2002).
It would, however, be quite misleading to suggest that there was a global rush towards
decentralization, with the only differences between countries being which types of
decentralization they prefer and how far they have gone. Centralization is also part of
the picture: as some authority has been decentralized, simultaneously there have been
significant instances of a tightening of central control and oversight. One fairly promi-
nent case has been the way in which pressures on public spending have strengthened the
hands of treasuries and central finance ministries in a number of countries. For example,
there is a general perception among officials that economic constraints have reinforced
the dominance over other ministries of the Finnish Ministry of Finance and the New
Zealand and UK Treasuries. Certainly since the advent of the 2008 GEC, finance minis-
tries have gained influence in many countries. Furthermore, centralization has not been
exclusively a matter of finance. There are countless instances, especially perhaps in the
NPM countries, of central authorities using performance indicator systems or standard
setting, to reassert control over lower tiers or local units. In the UK, central government
forced national ‘league tables’ on every school and hospital, and from 1988 for the first
time imposed an (increasingly detailed) national educational curriculum on all state
schools. Under Mr Blair’s New Labour administration the intensity of central target-
setting and monitoring actually increased (Barber, 2007). In the EU there have been
examples where the ‘harmonization’ of some product or rule or procedure across Europe
has resulted in a de facto centralization on the Commission in Brussels. Furthermore the
administrative reforms of the Prodi Commission in some ways decentralized ‘horizontal’
functions to the Directorates General, only to re-articulate them in a particularly cen-
tralized and bureaucratic fashion within each individual DG. Thus the idea that every-
thing is travelling in the direction of decentralization (still more ‘freedom’) is, to say the
least, over-simple.
Scale. Obviously, scale is intimately connected with some of the other dimensions of
organization discussed above. In addition to the general pressure for ‘downsizing’ which
arrives from the savings objective, the trends towards specialization and decentralization
also indicate reductions in the average size of many public sector organizations. The ideal
public sector agency, as envisaged by the enthusiasts and visionaries of the NPM and
reinventing government movements, will be ‘flat’, flexible, specialized (‘focused’), and
decentralized, and therefore very probably quite small. These approaches to reform
include a deep doctrinal suspicion of large central bureaucracies. Such organizations
represent (as we will see in subsequent chapters) the ‘old world’ from which many NPM
reformers were determined to escape. The US Vice President put it like this:
Big headquarters and big rule books never have kept the government from making big mistakes. In
fact, they often kept front-line workers from doing things right. So we asked agencies to cut layers of
supervisors, headquarters staff, and other management control jobs by 50%. (Gore, 1996, p. 16)
However, the ‘small-is-beautiful’ vision is evidently not universally shared—indeed the
recent trend of re-asserting coordination (noted at the beginning of Section 4.6, above)
has led to a number of mergers and re-absorbtions of arms-length bodies into central
departments. For example, while central ministries have been considerably reduced in size
104 TRAJECTORIES OF MODERNIZATION AND REFORM
in New Zealand and the UK (Boston et al., 1996; HM Treasury, 1994), in Finland the
reforms of the 1990s actually led to slight growth in the size of central ministries, as
they absorbed some of the functions previously performed by central agencies (Ministry
of Finance, 1997). In 2001 the Blair administration merged elements of social security, and
employment advice and placements, and work benefits into a giant new Department of
Work and Pensions (White and Dunleavy, 2010, pp. 53–9). Faced with the 9/11 terrorist
onslaught President G. W. Bush merged twenty-two different organizations into one
Department of Homeland Security. In France President Sarkozy also launched ministry
mergers.
In general the continental European countries have been less enthusiastic about ‘down-
sizing’ as an overall goal. The EU Commission itself has grown considerably. Between 1977
and 1997 the number of Commission staff grew by 104 per cent, with an increase of 150
per cent in the policymaking ‘A’ grades. However, it should be noted that the EU budget
grew by 206 per cent in real terms over the same period, and, since it is widely acknowl-
edged that the tasks of the Commission expanded rapidly during the 1980s, it can be
argued that the extra staff were needed to cope with new responsibilities. Nevertheless, the
organizational development of the Commission has certainly not followed the NPM
trend: it has specialized only to a limited extent, created only weak forms of horizontal
coordination, did not begin to decentralize in any significant way until right at the end of
the 1990s, and has grown in size.
Some of these trends in organizational structures can easily be related to one or more of
our three models of reform, but others are more ambiguous in this respect. As indicated
above, much of the downsizing and administrative decentralization (and fragmentation)
of the 1980s and 1990s was associated with reformers of an NPM persuasion. However, as a
knock-on effect, some of the re-centralization and mergers of the 2000s—in those same
core NPM countries—have clearly also been in reaction to unwanted consequences from
the earlier fragmentation. Overall, therefore, NPM thinking has had a big effect on
organizational structures in many countries. NWS thinking probably also had effects,
but they were less obvious, at least for Anglophone audiences. This was partly because
they lay more in defending existing structures rather than proposing new ones, and also
because such activities of preservation and cautious modernization seemed to require less
trumpeting than did the self-conscious paradigm-breakers of the core NPM states. Thus
NWS states such as Germany or Sweden already enjoyed quite decentralized systems, and
were more hesitant and selective about putting basic public services at arms length from
democratic local government through either managerial autonomizations or contracting
out. Further decentralization certainly occurred, especially in Sweden, but it was mainly
within the framework of regional/county/local authorities and not by ejection to new
autonomous agencies or to private sector contractors—or certainly not to the same extent
as in the UK or the USA. Finally, we may ask whether NPG thinking appears to have
influenced trends in organizational restructuring. This is hard to say. To begin with,
NPG thinking has only been popular for a decade or so, so we cannot expect to find
evidence of its effects in the 1980s or early 1990s. Then there is the point that the precise
structural implications of NPG are not terribly clear. That we should expect more net-
working and partnerships, and more bodies to ensure consultation and participation—all
that is obvious. But what specific changes should we expect in the machinery of central
TRAJECTORIES OF MODERNIZATION AND REFORM 105
government? The NPG theorists seem to have had little to say about this as yet. One
observation would be that the recentmoves to amalgamate central ministries and agencies
which we have seen, in different ways, in France, New Zealand, the UK, and the USA,
probably would not be seen as very NPG-ish. On the contrary, it seems to signal a return to
hierarchical control byministers and their top officials. Some of themoves towards joined-
up government also have this top-down quality, but others are more bottom-up andmight
command more enthusiasm from NPG advocates (6, 2004; Christensen and Lægried,
2007b). To be a little harsh, one might say that no clear trend towards NPG structures is
yet widely observable, not least because, theoretically speaking, it is not yet obvious what
such structures would actually look like. The NPG ‘movement’, thus far, has had more to
say about what the external relations of government should look like than its internal
structures.
4.7 The measurement of performance
It is clear from the previous subsections that increased measurement of performance has
been a central feature of public management reform in many countries. These accounts of
financial and personnel management, and organizational restructuring, have already partly
dealtwithperformancemeasurement, so this section canbe correspondingly brief. There are,
however, some generic measurement issues which it makes sense to address here.
Performance measurement certainly is not new. Indeed, it is as old as public administra-
tion itself. In the latter part of the nineteenth century there were already schemes in place
in the UK and the USA for measuring the performance of teachers in state schools.
Woodrow Wilson was writing about the need to design an administrative system that
would perform well against efficiency criteria, and F. W. Taylor was advocating a generic
approach towards measuring the efficiency of workers (Dunsire, 1973). Acknowledging all
this, however, does not prevent one from recognizing that interest in measuring public
sector activities has blossomed over the last quarter century (Bouckaert and Halligan,
2008; Boyne et al., 2006; Kettl and Kelman, 2007; Moynihan, 2008; Pollitt et al., 2010;
Talbot, 2010; Van Dooren et al., 2010). ‘Performance remains the mainstream focus of
international public management’ (Bouckaert and Halligan, 2008, p. 196), and the GEC is
likely to make this even more true in the near future. The performance ‘movement’ has
developed along several dimensions:
Measurement is becoming more extensive. More levels . . . and more fields . . . are included. Perfor-
mance measurement is becoming more intensive because more management functions are included
(not just monitoring but also decision-making, controlling and even providing accountability).
Finally, performance measurement becomes more external. Its use is not just internal, but also for
the members of legislative bodies, and even for the public. (Bouckaert, 1996, p. 234)
It may be useful to look at each of these dimensions in turn. The growing extent of
performance measurement was best exemplified in the NPM countries, although signifi-
cant measurement initiatives were also to be found in Canada, France, the Netherlands,
106 TRAJECTORIES OF MODERNIZATION AND REFORM
the Nordic states, and the USA. We therefore turn to the UK for an assessment of the full
extent of the trajectory:
No public sector employee has escaped the ever-extending reach of performance evaluation
schemes. The pressure to meet targets or performance standards, whether hospital waiting lists,
school exam results, crime clear-up rates or university research ratings—has introduced profound
changes in public organisations. As PIs [performance indicators] have become increasingly linked to
resource allocation and individual financial rewards, so organisational cultures and individual
behaviours have been transformed. (Carter, 1998, p. 177. This wave of measurement went on to
reach even greater heights under the Blair and Brown administrations of 1997–2010—see, e.g.
Barber, 2007)
Examples of the spread of performance measurement to new fields can be found in
many countries. Often they have been tied in with developments in information
technology (e.g. Bellamy and Taylor, 1998, pp. 68–70). In the USA the 1993 Govern-
ment Performance and Results Act effectively mandated PIs for every federal agency
(Radin, 1998). Subsequently, performance measurement seemed to expand in every
direction, generating debates in which some American experts saw performance man-
agement as the wave of the future (Kettl and Kelman, 2007), and others found it
critically flawed and liable to lead to perversions (Radin, 2006). In Australia perfor-
mance measures were widely introduced during the 1980s and the systems were tight-
ened and toughened by the neo-conservative Howard government after 1996
(Department of Finance and Administration, 1998a, b). In New Zealand the system of
Strategic Results Areas and Key Results Areas (mentioned above) required wide-scope PI
systems. In the Netherlands during the 1990s a strategy of progressively integrating
performance measurement with the budget process has been pursued (Sorber, 1996),
and this took a further twist with the introduction of the VBTB budgeting system from
1999. In several countries, initiatives to raise the quality of public services have led
directly to a wider scope for performance measurement (e.g. the UK Citizen’s Charter
from 1991; the French Public Service Charter from 1993; the 1994 Declaration of
Service Quality and 1995 Quality of Service Initiative in Canada).
One might suppose that the extension of PI systems would proceed in a rational
fashion, with relatively straightforward, tangible services (e.g. refuse collection, the
mail) being measured first, and then more individually variable, less concrete services
such as health care and education, and finally, perhaps, non-tangible, non-routine
services with a high subjective content such as the provision of policy advice or the
coordination of different agencies in the pursuit of some general policy goal (Bouckaert
and Ulens, 1998). In practice, however, any such logic is hard to find. In the UK, for
example, one of the earliest national PI schemes (from 1983) was for the National Health
Service (Pollitt, 1986). What is perhaps a clearer pattern is that the powerful have been
better able to postpone or deflect the tide of measurement than other groups. Thus,
within health services, the activities of nurses and receptionists have been measured far
more intensively and openly than the quality of clinical decision-making by doctors,
although in a few countries, gradually, the medical citadel is crumbling (Pollitt et al.,
2010). In the core NPM countries, at least, the public can read plenty of reports contain-
ing measures of the performance of teachers, police, social workers, social security clerks,
TRAJECTORIES OF MODERNIZATION AND REFORM 107
and specialist agencies, but few, if any, measuring the performance of MPs or ministers
(the USA may offer a rare exception to this generalization, at least in respect of the voting
and attendance habits of members of Congress and Senate).
Extending PI systems is not only a matter of finding hitherto unmeasured sectors or
organizations and subjecting them to ‘the treatment’. It is also a question of
broadening the scope of measurement in a more analytical sense—of beginning to
measure efficiency and effectiveness, not just inputs, processes, and compliance (see
Figure 1.2 for a diagrammatic representation of these distinctions). The desire to
measure outcomes as well as outputs has been a common theme of debates since
the late 1990s, at least in the core NPM countries (Bouckaert and Halligan, 2008). As
noted elsewhere, many national audit offices have extended their work beyond ques-
tions of regularity and legality, beyond even the hunting-down of waste, to embrace
more sophisticated concepts of efficiency, effectiveness, and service quality (Pollitt et
al., 1999). This shift of measurement systems beyond the relatively mundane issues of
input and process, towards the more politically sensitive and methodologically chal-
lenging problems of assessing effectiveness has proved both difficult and controver-
sial. For example, consider the words of a New Zealand minister, reflecting upon the
way in which, with what was then one of the world’s most sophisticated performance
measurement systems, New Zealand public servants nevertheless tended to over-
concentrate on outputs (e.g. cases completed) at the expense of the final outcomes
(e.g. satisfied clients):
One [danger is that] risky, unattractive, but nevertheless important functions might start to fall
between the cracks, or that absurd demarcation disputes might arise, of the kind that used to be
endemic in the cloth-cap trade unions of old. If ‘output fixation’ distracts departments from
outcomes, and ‘contract fixation’ encourages them to ignore everything that isn’t actually specified,
aren’t these things very likely to happen? (East, 1997)
Thesemore ambitious uses of PIs—to assess impacts, guide programmes, or help decide the
fate of policies—are perhaps less difficult for the public service cultures of the ‘public
interest’ administrative systems to absorb than for the Rechtsstaat systems. The latter are
more used to trying to guide administrative behaviour by the formulation of precise laws
and regulations, than by giving more discretion and then measuring results (Bouckaert,
1996, pp. 228–9). In general, performance management, although definitely present, has
gone less far in countries like France and Germany than it has in Australia, New Zealand,
the UK, and the US (Bouckaert and Halligan, 2008).
Thus the NPM countries have been at the forefront of the more intensive use of PIs.
Over the last twenty years one may discern a trajectory which runs from the use of PIs
principally as supplementary or background information towards their use for a variety
of management purposes—to inform specific decisions, to compare different organiza-
tions or functions (benchmarking), to determine budget allocations, and even as a major
input to decisions concerning motivation, career development, and promotion of indi-
viduals. An example would be the research quality ratings given to UK university depart-
ments on the basis of their published output, research grants, and honours won, PhDs
awarded, and other factors. This elaborate national exercise, which has been conducted
roughly every four years since the 1980s, now directly and formulaically produces each
108 TRAJECTORIES OF MODERNIZATION AND REFORM
department’s allocation of baseline research funding. Planning to achieve a ‘high score’
in this assessment has become a core component of the management of most university
departments. Similarly, the use of PIs in the UK National Health Service has evolved from
unsystemic internal use by health authorities to published national league tables which
have serious immediate consequences for low-scoring organizations (Pollitt et al., 2010).
In short, the use of PIs, having once been an ‘extra’ or novelty, has been progressively
integrated with other aspects of management. This can significantly sharpen the man-
agement of public services and the orientation of those services to their users. On the
other hand it can also lead to various pathologies where the activity of measurement
itself distorts the administrative process in undesirable ways (Bevan and Hood, 2006;
Bouckaert, 1995b; de Bruijn, 2002; Pollitt, 2003a, chapter 2).
Finally, we turn to the external use of performance measurement—not exclusively for
internal management purposes, but to inform legislatures, taxpayers, service users, and a
variety of other stakeholders. For those who know where to look (and, more importantly,
for those who are interested in looking) the official publications of the 2000s contain far
more performance information than was available in 1980. Gradually these data sets are
being refined so as to reduce the weaknesses and poor presentation of some of their early
versions. In the case of the NHS, for example, the first national sets of PIs were unwieldy
and unwelcoming, and overwhelmingly concerned process issues such as average lengths
of hospital stay. Over the years, however, the presentation and explanation of this infor-
mation has improved enormously, and, though there are still many possible improve-
ments that can be discussed, at least a number of indicators or proxies for clinical
outcomes are now included in the package. In some cases, performance information is
given considerable publicity by themassmedia (the ‘league tables’ of English state schools,
for example), although in others the ‘take-up’ of such data by politicians has been
disappointing (Bouckaert and Halligan, 2008, p. 201; Johnson and Talbot, 2007; Pollitt,
2006b). Some governments and parliaments have begun to take special steps to improve
the relevance and accessibility of PI data for politicians (e.g. in the Canadian case, Duha-
mel, 1996). Finally, it should be noted that during the past decade international perfor-
mance league tables have become a major growth industry, and several of these attract
significant publicity in the mass media (e.g. Arndt, 2008; Dixon et al., 2008; Grek, 2008).
Examples of this new trend will be discussed in the next chapter.
In the terms of Chapter 1, performance measurement is a tool or dish, not a big model.
In fact it connects to more than one of our three mainmodels (see Figure 1.4). It has been a
central plank of NPM reforms. But it is also associated with NWS-style modernization
efforts. Certainly there are no shortage of PIs in countries like the Netherlands and Sweden
(Pollitt, 2006a) or France and Italy (Bezes, 2007; Ongaro, 2009). (However, theymay not be
used in quite the same ‘command and control’ ways that became prevalent in the UK
during the late 1990s and early 2000s—Pollitt, 2006a.) A modern professional manager in
the NWS mould would expect to use PIs, inter alia, to check that the services the state was
delivering were timely and efficient, and that they were generating good levels of satisfac-
tion among the citizens who used them. The role of performance measurement within
NPG is less clear. Whilst it is certainly not ruled out, some of the main texts within this
stream of thinking scarcely mention it (Klijn and Koppenjan, 1997; Teisman et al., 2009;
Osborne, 2010). One sometimes has the impression that the advocates ofNPG are reluctant
TRAJECTORIES OF MODERNIZATION AND REFORM 109
to discuss performance measurement, for at least two reasons. First, they associate it with
the enemy—NPM. Second, they do not yet appear to have a strong answer to the difficult
question of ‘how are we to measure the performance of a network?’
4.8 Transparency and open government
One widespread and noticeable tendency has been the embrace by many countries of
concepts of ‘transparency’ and ‘open government’. In 1980 only a few states had Freedom
of Information (FoI) legislation—most notably Sweden (since the eighteenth century) and
the USA (since 1966). But by 2005, fifty-nine countries had adopted laws of this kind
(Roberts, 2006, pp. 14–15). Among them were Australia (1982), Canada (1982), Germany
(2005), New Zealand (1982), and the UK (2002). The underlying idea seems to have been
that citizens were entitled to see both what their governments had decided and how they
were deciding it—that transparency was a fundamental feature of a democracy. This line of
reasoning constituted a development of an older, more limited, debate about accountability
(Pollitt and Hupe, 2011).
Although the rhetoric around transparency and openness may seem to have been princi-
pally concerned with rendering politiciansmore visible and accountable, it also held consid-
erable implications for public managers. Traditional bureaucracies have long been associated
with secrecy, and with the idea that the possession of information is a form of power.
Therefore to expect bureaucrats suddenly to become ‘transparent’ and ‘open’ was quite a
leap. Further, ‘An attempt to remove restrictions on access to information is [ . . . ] a challenge
to social hierarchy within public agencies’ (Roberts, 2006, p. 49). Additionally, the develop-
ment of ICTs meant that public access to documents took on a more immediate and
comprehensive form. Were citizens to be allowed to peer into the internal email traffic of a
ministry?How fastwas this access supposed tobe—could Joe Public read today’s submissions
to the Minister and, if not, why not (Roberts, 2006, pp. 199–230)?
Unsurprisingly, in practice, governments drew new defensive lines to protect their
most sensitive forms of decision-making (Roberts, 2006). Certain categories were
excluded from most freedom of information provisions (e.g. defence and security).
Privacy considerations also pointed to the need for some restrictions (it would be
wrong, for example, for the opening up of public records to lead to the personal details
of citizens’ health or financial circumstances becoming publicly available). Procedures for
applying for documents were made more or less elaborate, and this itself prevented
instant access. Fees were applied to discourage frivolous requests. Politicians and their
officials found new ways (or rediscovered old ways) of having discussions off the official
record—without leaving a documentary trail. Privatized and contracted-out services were
often deemed to be beyond the reach of FoI legislation. And so on. Furthermore, the pro-
transparency effects of more sophisticated ICT systems seem, in some instances at least,
to have been offset by a slackening of the traditional bureaucratic punctiliousness in
record-keeping—especially in the more fragmented, high NPM regimes (Pollitt, 2009a;
Weller, 2002). The new Public–Private Partnerships sometimes found themselves working
more to the confidentiality norms of their private, corporate partners than to the higher
110 TRAJECTORIES OF MODERNIZATION AND REFORM
standards of public accountability. Yet despite all these qualifications, the ‘transparency
movement’ has made a real change to the daily lives of many public officials. Even the
‘Eurocrats’ have to reckon with the fact that, sooner or later, what they write or say at
meetings may well become ‘public’ (Regulation, 2001). We may also note that the most
intensive use of FoI provisions nearly always comes not from individual citizens, hero-
ically holding their public authorities to account, but from corporate interests (looking
for technical or commercial information), or from lobby groups and journalists, looking
for a story. Humble citizens, on the whole, made little use of FoI, so its proponents’
claims that it would increase citizen participation and trust have thus far found little
evidence to support them (Worthy, 2010).
Interestingly, transparency is not something which seems to fit neatly into some of the
groupings which we have found are important for other aspects of reform. Thus we cannot
say, for example, that the core NPM states were way ahead (or behind) in the transparency
stakes. In fact the leading countries come from rather different categories—Sweden and
the USA. The UK FoI legislation was rather late in coming and turned out to be quite
restricted in practice, whereas the consensual Dutch, for example, were more open. It
could be argued that transparency should be something especially associated with the
NPG. After all, the ideal from an NPG perspective might be a horizontal network of
mutually interdependent actors, freely exchanging information, open to new members,
and informing and consulting each other on all important moves. It sounds much more
open than a traditional, secretive, bureaucratic hierarchy. Yet it is evident that there are
often considerable practical difficulties standing in the way of any such vision being
realized. One is that partnerships with private sector companies often mean that different
actors in networks operate to different standards of transparency—the private companies
claim large areas as ‘commercial-in-confidence’. Even non-profit organizations from the
civil society sector may not relish being asked to meet the same standards of disclosure as a
government ministry or public agency.
4.9 Modes of implementation
In this subsection we move from the ‘what’ of reform to the ‘how’. This poses an immedi-
ate problem. It is usually harder for academics to obtain systematic information about how
reforms are being put into practice than about what the reforms are. Governments are
frequently keen to announce what they are going to do but are understandably less
energetic in offering a blow-by-blow account of how things are going. Some aspects of
implementation are particularly hard to research and write about: it is only rarely that we
get scientific accounts of the strengths and weaknesses of individual leaders andmanagers,
of the resentments and conflicts which reforms so easily stimulate, of the compromises
and threats by which these are often settled, and so on (though journalistic treatments are
more common). There is plenty of circumstantial evidence to indicate that such factors
can be influential in determining the success or failure of some innovations, but these
things can rarely be subject to rigorous testing (although see Kelman, 2005).
TRAJECTORIES OF MODERNIZATION AND REFORM 111
What can be seen from the outside is the broad direction and energy of implementation
that seems to be characteristic of a particular government during a particular period. Even
this is partly impressionistic, but, pending more systematic comparative evidence, is
worth recording nonetheless. Here we will quickly review three aspects:
� the extent to which reform has been a top-down or bottom-up exercise
� the extent to which new organizations and structures have been created specifically to
advance reform (the alternative being the pursuit of reform through existing structures)
� the intensity of reform, that is, have governments barged ahead, trampling opposition
underfoot, or have they tiptoed delicately, consulting and cooperating with the other
stakeholders (such as public service unions) as they go?
The distinction between top-down and bottom-up reforms has itself to be used with
some caution. These are not two separate categories but poles on a spectrum which
passes through ‘top-down-guided bottom-up’ and even ‘middle outwards’. So there are
more intermediate cases than pure polar examples. Furthermore, since our focus is
principally on central governments, it must be acknowledged that what constitutes
the ‘bottom’ of central government (let alone the EU Commission) may still be far from
the street.
Bearing these caveats in mind, we can go straight to a major generalization about
implementation. It is that all three aspects have in practice gone hand in hand, that is, those
countries which have employed more top-down strategies also tend to have created more
new institutions and to have pushed on with reform at a more intense pace. Furthermore
the core NPM countries again stand out as a separate group—it is they, more thanGermany and
France, more than the consensual Dutch and the Nordics, more even than the voluble
Americans or the somewhat quieter Canadians, who have driven reforms from the top,
with relentless speed, throwing up all manner of new organizations—and new types of
organization—as they have rushed onward. The range of implementation styles therefore
matches very well the characteristics of politico-administrative regimes which were iden-
tified in the previous chapter.
There is space here only to offer brief illustrations of these generalizations, although
evidence for them continues to accumulate throughout the remainder of the book. One
way of doing this would be to compare the reform process in, say, Finland, Germany, and
the UK (i.e. an active modernizer of a roughly NWS-ish character, a country that has been
fairly conservative with respect to management reform, and an ‘NPM-enthusiast’)
In Finland, considerable reforms have been implemented, and the numbers of civil
servants has been markedly reduced, but this has been done in a low-key way and at a
relatively leisurely pace. Furthermore, high levels of continuity have been maintained
despite the existence of five different coalition governments over the relevant period. The
reform programme that was launched in 1987/8 was still being ‘rolled out’ twelve years
later (although by then there were naturally new items on the agenda as well). It was
conceived and coordinatedmainly by theMinistry of Finance and, in that sense, was fairly
‘top down’. It was of broad scope, affecting all or most of the central government, but
could not directly apply to the municipalities, which enjoyed the constitutional
autonomy which allowed them to decide on their own reforms. A good example of a
112 TRAJECTORIES OF MODERNIZATION AND REFORM
central government reform would be results-oriented budgeting, one key element of the
broader programme. It began with a small number of voluntary pilot projects from
1988, and then developed into a government decision to extend the system to all
ministries and their agencies. The target was to have the system fully in place by the
beginning of 1995—seven years after the launch. On the organizational dimension,
new forms of state-owned company were a significant innovation, and the system of
central agencies was extensively remodelled during the mid 1990s, but the ministries
themselves remained largely undisturbed. Personnel reforms were placed on the statute
book, but came into use only slowly and on a limited scale. The Finns paid close
attention to reforms throughout the OECD world, and were active members of PUMA
and other international bodies, but they imported reform ideas cautiously and selec-
tively, adapting them to fit the Finnish politico-administrative system. Privatization
and quasi-market mechanisms were elements of the NPM package that the Finns
treated with considerable reserve. There was no ‘rush to the market’, and no large
political constituency for the idea that the market was automatically superior to the
‘nanny state’ (Ministry of Finance, 1997; Pollitt et al., 1997). The shift from a Social
Democrat-led coalition (1995–2003) to a Centre Party-led coalition (2003 onwards) did
not mean any great change in modes of implementation.
The federal German government was more conservative than its Finnish counterpart.
There was no broad programme of management reform at the federal level (though there
was considerable activity in a number of municipalities—see Appendix B). The main laws
governing the civil service were not changed. No flocks of new organizations were created.
There was no drastic downsizing. German activity at PUMA and in other international fora
was modest in terms of active participation in the global debate about management
reform. Many of the leading German academics appeared to be lukewarm or actively
hostile to NPM thinking (K€onig, 1996; Derlien, 1998). When faced with the huge admin-
istrative challenge of reunification, the government decided not to innovate, but to
transplant virtually the whole of the existing system in West Germany to the former
East Germany—to create what was, in effect, a new Weberian state out of a defunct
Communist one. Overall there was plenty of modernization in Germany, but it took
place mainly at local and provincial levels, and it proceeded in an incremental fashion,
with many local variations (K€onig and Siedentopf, 2001; Wollmann, 2001). Implementa-
tion at federal level tends to proceed by way of pilots or programmes within one or two
ministries, rather than by ‘fanfare’ changes right across the federal government (Bach and
Jann, 2010).
The implementation process in the UK was more hectic, harsh, and sweeping than in
either Finland or Germany (and it began in 1979, almost a decade earlier than in Fin-
land). Wave after wave of broad-scope reform followed each other, often to the accompa-
niment of assertively doctrinaire statements by ministers. Most change was decidedly
top-down. In central government Rayner Scrutinies (1979) were followed by the Financial
Management Initiative (1982), the Next Steps Programme (1988), the Citizen’s Charter
(1991), the Private Finance Initiative, the downsizing of a number of ministries
(1994–7), the introduction of accruals accounting right across central government, and
various other new systems. Extensive personnel reforms led to wider application of
individual contracts for senior public officials, extensive use of performance-related pay
TRAJECTORIES OF MODERNIZATION AND REFORM 113
and the decentralization of most personnel authorities to individual ministries and
agencies. Central government also drove radical reforms in subnational and local gov-
ernment, often in a directive manner that would have been impossible in either Finland
or Germany. MTMs were imposed on the National Health Service, education, and com-
munity care. Many new types of organization were created, including urban development
corporations, city technology colleges, grant-maintained schools, an Audit Commission,
NHS trusts, various types of public housing agency, and so on. Nor did the advent, after
eighteen years in opposition, of a Labour government (1997) lead to any slackening of
the pace of change. On the contrary, if anything the catalogue of restructurings, realign-
ments, and re-badgings intensified (Office of Public Services Reform, 2002; Pollitt, 2007;
Prime Minister and Minister for the Cabinet Office, 1999). Furthermore, the mood of this
was often combative. A good flavour of the Blair reform process can be had from the book
Instruction to Deliver, an account by the head of the Prime Minister’s Delivery Unit (Barber,
2007). He refers to ‘the danger of underestimating the extraordinary deadweight force of
institutional inertia’ (p. 72), to the fact that ‘the plans that were returned to us from the
departments . . . varied from the barely adequate to the absolutely dreadful’ (p. 85), and
asserts that ‘Bold, sustained leadership is a prerequisite for transformation; professions,
left to themselves rarely advocate more than incremental change’ (p. 144). Barber makes
it clear that his favourite reading consisted of upbeat generic management texts by
American business school professors.
This sense of urgency and top-down pressure was not confined to the New Labour
government of 1997–2010. It characterized a wide range of sectoral reform polices over a
long period. Thus, for example, a recent comparative study of policymaking in the police
and hospital sectors, in England and Belgium, 1965–2005, found a consistent difference in
terms of the speed and scope of management reforms (Pollitt and Bouckaert, 2009).
Throughout these four decades there had been more change, and more radical change in
England. An American scholar summed matters up well when he wrote ‘the kind of
changes brought about by Mrs Thatcher and Mr Blair. . . are unthinkable in the United
States. They are, as well, unthinkable on the Continent’ (Lynn, 2006, p. 120).
At first sight our three big models—NPM, NWS, and NPG—may appear to be about
content/substance rather than modes of implementation. However, a little further
thought shows that they have, at the very least, some implications for implementation.
That is because each (Table 1.3) adopts a particular dominant (though not exclusive) mode
of coordination. Logically, therefore, one might suppose that these modes of coordination
would also be the prime ways in which supporters of these models would try to get their
distinctive types of reform put into action. In which case we could expect to see NPM
reforms implemented through market-type mechanisms, NWS reforms implemented
through hierarchies, and NPG reforms being negotiated through networks. Unfortunately,
the historical record suggests that there has been no such neat correspondence. Some of
the biggest NPM reforms (such as the introduction of a quasi market within the UK
National Health Service from 1989) were implemented by a fierce use of hierarchical
authority, beating down opposition and criticism. Hierarchical authority has also often
been used to make NPG partnerships or NPM contracting out mandatory. Major reforms
such as the French LOLF or the US NPR or the radical New Zealand changes of
the 1980s have all been founded on statutory authority, with new laws being pushed
114 TRAJECTORIES OF MODERNIZATION AND REFORM
through parliaments by executive governments. Indeed, it seems that few of the most
significant reforms covered by this book have been implemented without at least a dose
of hierarchical authority to speed them on their way. (One is reminded of Adam Smith
here—it is sometimes forgotten that he saw quite clearly that competitive markets
required active maintenance by government authority if they were to survive and not
degenerate into cartels.) So, although we may profitably discuss alternative coordinating
mechanisms for the day-to-day management of public services, we should also remember
that our chosen field—structural and procedural changes in central government—lies
close to political and legislative power. This means that it is frequently conflictual and
that, in consequence, the implementation of reforms very often requires a measure of
power and authority to get them off the ground. Insofar as any of the three models fails
to allow for that, they will remain inadequate or incomplete guides to the actual business
of reform.
4.10 Summary: multiple omegas, multiple trajectories,and unforeseen developments?
In Chapter 1 the questions was first posed as to whether all twelve states were following
one, basically similar route (first mapped out by the Anglo-American countries), or
whether, at the other extreme, there was no discernible pattern to the multiplicity of
reforms—just a national and international game of reform ad hockery? On the basis of the
evidence developed above—and set out at greater length in Appendix B—what can now be
said in response to this question?
A first, perhaps rather obvious, observation is that the story as told here lies somewhere
between the two extremes. There is more than one route but, on the other hand, the
picture is not chaotic. Some trends and partial patterns seem to stand out rather clearly.
The points of departure (alphas) were, as the previous chapter made clear, very different
from each other (Lynn, 2006).
A second point is that trajectories would be much more likely to converge if every
government in every country shared the same omega—the same vision of the desired
future arrangements that the reforms were intended to propel that jurisdiction towards.
However, it does not seem that there is such a universally shared vision. Some seem to
have had the relatively modest ambition of ‘lightening’ the existing bureaucracy, through
deregulation and streamlining, and simultaneously saving money by tightening up on
budgets and financial management. For most of the 1980s Germany fell into this cate-
gory—at the federal level, though not locally. So did Italy, as well as the European
Commission. One might think of this as an essentially conservative strategy of maintain-
ing as much as possible of the status quo by taking steps to make current structures and
practices work better—tightening up rather than fundamentally restructuring.
Other states (or the same states at different periods) have been somewhat more adven-
turous. They have acknowledged the need for fairly fundamental changes in the way the
administrative system was organized. Such changes typically included budget reforms
TRAJECTORIES OF MODERNIZATION AND REFORM 115
which move towards some form of results or performance budgeting, some loosening of
personnel rigidities (but not necessarily the abandonment of the concept of a distinctive
career public service), extensive decentralization and devolution of authority from central
ministries and agencies, and a strengthened commitment to improving the quality and
responsiveness of public services to citizens. Within this group of modernizers there are
different emphases as betweenmanagerial modernization (concentrating onmanagement
systems, tools, and techniques) and participatory modernization (giving greater salience
to devolution of authority to subnational governments, and to developing user-respon-
sive, high-quality services, and forms of public participation). We might term the two
emphases Modernizing (managerial) and Modernizing (participatory). Both fall within the
broad model of NWS, first outlined in Chapter 1 (and about which we will be saying
more in a moment). The two strands are not directly opposed, or mutually wholly
exclusive, but in practice each country in each period seems to be stressing the one side
rather than the other. Broadly (and this is very broad) one might see something of a north–
south difference in continental Europe, with the participatory modernizers tending to be
more in the north (Finland, Netherlands, Sweden) and the managerial modernizers being
a bit further south (France and, later on, Belgium and Italy).
Further, onemight link these shades of difference with deeper cultural orientations—the
northerners being more open and egalitarian, the central and southern Europeans more
hierarchical and technocratic (Bouckaert, 2007). Within both sub-groups of modernizers,
moves to privatize state-owned commercial organizations have been selective and gradual,
with intermediate forms such as state-owned enterprises or companies being extensively
resorted to before, or instead of, outright privatization. In a way Germany belongs to this
group also—as is clear from the many subnational reforms which took place from the mid
1980s onwards. In Germany, however, there was also a striking increase in participation
(again at the subnational levels), mainly through the introduction of locally binding
referenda, from the early 1990s onwards (Wollmann, 2001). However, our main focus
here is on central governments and, at that level, a serious move towards modernization
came very late (at the end of Chancellor Kohl’s third term) and even then did not make
much headway. Thus, for example, the basic official document describing the federal
public service in 2009 remained heavily concerned with legal categories and rules, and
said remarkably little about specific reforms, other than in the relatively innocuous area of
e-government (Federal Ministry of the Interior, 2009).
A third group also wanted to make substantial—sometimes fundamental—reforms, but
held a particular view of what the most successful kind of change was likely to be, namely,
the introduction of more competition and MTMs and business-like methods within the
public sector. They were the core NPM states. These countries favoured quasi-markets,
large-scale contracting out andmarket-testing, contractual appointments and performance
pay for civil servants, more people brought in from outside the traditional career
pattern and a general reduction of the distinctiveness of the public sector vis-�a-vis the
private. They were also the most enthusiastic about importing private sector techniques
such as accruals accounting, Business Process Re-engineering (BPR), benchmarking, and
franchising into the public sector. Australia, NewZealand, and theUK all fit this category, at
least for considerable parts of the period under scrutiny. Occasionally the Netherlands,
116 TRAJECTORIES OF MODERNIZATION AND REFORM
Finland, and Sweden (the ‘northern Europeans’) have ventured into this territory, but only
selectively, remaining more usually among the modernizers of the previous group.
Finally there is also the omega or possibility of a minimal state, where everything that
could possibly be privatized is privatized, leaving only a ‘nightwatchman’ administrative
apparatus, performing core functions that the private sector is quite unable or unwilling to
perform. Massive privatization and wholesale downsizing of public sector organizations
would be key features of this approach. None of our twelve countries has consistently
adopted this minimizing position, which has existed in full-blown form only in the tracts
of right-wing politicians and theorists. Rhetorical empathy for such minimalism had been
found on the lips of President Reagan, but there the gap between practice and vision was
particularly wide. More generally, the USA remains difficult to classify: there have been
strong elements of modernization, but also a considerable thrust towards marketization. It
is certainly not Weberian, but at the same time it is, in part, highly legalistic and some-
times very bureaucratic.
Canada is also rather an ‘awkward customer’ from the point of view of our typologies,
since during the 1980s and early 1990s it shared much of the marketizing rhetoric of
Thatcher and Reagan, but did not in fact go far in implementing those ideas. Whilst the
culture is not of a strong central state like France, it has clung to the tradition of a fairly
stable and neutral senior civil service, unlike the American ‘spoils’ system. One might say
that it was in the NPM camp as far as its openness to Anglophone marketizing ideas was
concerned, but that its federal divisions, and the continuing anchor of a non-partisan
central civil service have helped tomoderate the scope and pace of change, and to preserve
considerable elements of modernization.
Thus there is, in our view, a pattern. Wemight say that there are two obvious groupings,
and then a few ‘hybrid’ or ‘hard-to-classify’ cases (although these are important excep-
tions). The first, and best-known grouping is that of the NPM marketizers—Australia,
New Zealand, the UK and, in words if not always in deeds, the USA (though in that case
we should repeat that more radical examples of NPM can easily be found at the subna-
tional level rather than the federal level). We call this the core NPM group—they all see a
large role for private sector forms and techniques in the process of restructuring the public
sector. The second grouping are the continental European modernizers—Finland, France,
the Netherlands, Italy, and Sweden (and Belgium and Germany, if one goes below the
federal level). They continue to place greater emphasis on the state as the irreplaceable
integrative force in society, with a legal personality and operative value system that cannot
be reduced to the private sector discourse of efficiency, competitiveness, and consumer
satisfaction. They thus continue, in modern form, their nineteenth- and twentieth-cen-
tury traditions of strong statehood and a high status for the top, career civil servants. Of
course, the pace and precise mixture of change has differed between members of
this modernizing group. Reform has come later and more gradually to the ‘central
Europeans’—Belgium and Germany—than to the ‘northern Europeans’—Finland, the
Netherlands and Sweden. France has matched the pace of the northern group, but for
long was more resistant to marketizing ideas, and to much of the Anglophone rhetoric
around NPM. Since 2000, however, and particularly since Sarkozy took on the Presidency
in 2007, it looks as though NPM-type ideas are gaining a somewhat firmer foothold at
the heart of the French administration (see France country file, Appendix B). Italy has
TRAJECTORIES OF MODERNIZATION AND REFORM 117
been quite volatile on the surface—especially in the mid 1990s—but simultaneously
exhibits some deeper cultural and organizational continuities.
A further distinction is that the ‘northerners’ have given their modernization efforts a
stronger citizen-oriented, participatory flavour than the central Europeans. Nevertheless,
when compared with the core NPM group, we can say that the continental Europeans as a
group—north and south—have shared a more positive attitude towards the future role of
the state and a less sweepingly enthusiastic attitude towards the potential contribution of
the private sector within the public realm (Lynn, 2006; Ongaro, 2009; Pollitt et al., 2007).
4.11 Back to the models: the Neo-Weberian State (NWS)
The NPM group of states are well known in the Anglophone literature, and there is a huge
literature discussing the NPM model (e.g. Boston et al., 1996; Christensen and Lægreid,
2001; Hood, 1996; Kettl, 2000; Lane, 2000; Pollitt, 1995, 2003a). The second group—the
continental modernizers—are much less well advertised, and are sometimes portrayed
simply as laggards or faint-hearts, who have been slow to climb aboard the NPM train.
There is something of this to Gualmini’s interesting account of reforms in Europe and the
USA (we would take issue with some of her distinctions and explanations, but her basic
‘ranking’ is not dissimilar to our own—Gualmini, 2008). Our interpretation, however, is
much more positive. We believe that what we see in the continental European states is a
distinctive reformmodel, one which we decided to call the Neo-Weberian State (NWS). This
was briefly introduced inChapter 1, but nowwehave looked at some of the trajectories and
examples, it may be time to spell out this model in rather more detail. Compared with its
much better-known cousin, the NPM, we see the NWS as bearing the following emphases:
‘weberian ’ elements
� Reaffirmation of the role of the state as the main facilitator of solutions to the new
problems of globalization, technological change, shifting demographics, and environ-
mental threat
� Reaffirmation of the role of representative democracy (central, regional, and local) as the
legitimating element within the state apparatus
� Reaffirmation of the role of administrative law—suitablymodernized—in preserving the
basic principles pertaining to the citizen–state relationship, including equality before
the law, privacy, legal security, and the availability of specialized legal scrutiny of state
actions
� Preservation of the idea of a public service with a distinctive status, culture, and—to
some extent, though perhaps not as much as in the past—terms and conditions
‘neo ’ elements
� Shift from an internal orientation towards bureaucratic rule-following towards an
external orientation towards meeting citizens’ needs and wishes. The primary route
118 TRAJECTORIES OF MODERNIZATION AND REFORM
to achieving this is not the employment of market mechanisms (although they may
occasionally come in handy) but the creation of a professional culture of quality and
service
� Supplementation (not replacement) of the role of representative democracy by a range
of devices for consultation with, and the direct representation of, citizens’ views (this
aspect beingmore visible in the northern European states and Germany at the local level
than in Belgium, France, or Italy)
� In the management of resources within government, a modernization of the relevant
laws to encourage a greater orientation on the achievement of results, rather than
merely the correct following of procedure. This is expressed partly in a shift in the
balance from ex-ante to ex-post controls, but not a complete abandonment of the
former. It may also take the form of a degree of performance management (see Section
4.4, above)
� A professionalization of the public service, so that the ‘bureaucrat’ becomes not simply
an expert in the law relevant to his or her sphere of activity, but also a professional
manager, oriented to meeting the needs of his/her citizen/users.
When we introduced this NWS model in the previous edition of this book, it created a
small academic stir. All sorts of extensions and interpretations of the concept began to be
aired (see, e.g. the special issue of The NISPAcee Journal of Public Administration and Policy,
2008). For example, Eastern European scholars began to debate how far the NWS could
serve as a model for the reconstruction of their post-Communist administrations. Regret-
tably, we cannot pursue all these interesting directions here. What we can do, however, is
to try to clarify what we mean and what we don’t mean in our deployment of the NWS
model. It arose as a way of trying to identify some rather general common denominators
that we thought we saw in the reform records of the six continental European states
covered by this book, as compared with the core NPM states of Australia, New Zealand,
the UK, and the USA. So it was originally intended primarily as a summary description, not
a theory, and not a normative vision or goal either. However, some other commentators
have subsequently used it as a normative vision, and so in this third edition we too have
allowed it something of that quality. In this mode, like NPM and NPG, NWS serves as an
omega. It is a vision of a modernized, efficient, citizen-friendly state apparatus. Further, it
is not correct to identify NWS (as one or two commentators have done) as ‘Weber plus
NPM’. Careful reading of the ‘neo’ elements will show that they do not add up to the
familiar NPM recipe of disaggregation plus competition plus incentivization (Dunleavy et
al., 2006a, pp. 97–102).
Subsequently Lynn (2008), among others, has pointed out that, before it can do much
more explanatory work, the NWS classification needs to be connected with some kind of
theoretical framework. Were its elements (as spelled out above) dependent or indepen-
dent variables? If NWS was an approximately accurate portrayal of differences between
certain continental European states and the core NPM states, then why did these differ-
ences arise? These are excellent points, but, again, we cannot go far with them here. We
hope it will suffice if we offer a general indication of the line of our response. It would be
that the NWS—insofar as it captures a set of real differences—represents a particular
TRAJECTORIES OF MODERNIZATION AND REFORM 119
instance of path dependency. In this case the path is one where the image of a strong
state that is well placed to help its citizens can still be used to generate positive political
returns (legitimacy). One could say, therefore, that the general idea of an NWS had been
constructed as part of a political strategy responding to globalization and party political
de-alignment. In this sense it could be seen as a defensive strategy by previously corpor-
atist regimes (Germany, France, the Netherlands, Sweden) to try to protect the ‘European
social model’ and the ‘European administrative space’ from the depradations of globa-
lized neo-liberalism. ‘Trust us, we can modernize and become both efficient and citizen-
friendly’ might be the message.
We are also aware that the label itself, ‘Neo-Weberian State’, may surprise some conti-
nental experts. Among German scholars, for example, the modernizers have sometimes
characterized themselves as anti-Weberian or, at least, as moving away from the Welt von
MaxWeber. We would not disagree with their contention that many of their reforms could
be seen as diluting or adding new features to the original Weberian ideal type. Nor would
we deny that the conservatives who opposed these modernizers could be seen as wanting
to hang on to the old systems and the old values—as defenders of the Weberian heritage.
Yet, looked at from the outside, what is striking—in comparison with the core NPM states—
is how far the underlying assumptions of a positive state, a distinctive public service, and a
particular legal order survived as the foundations beneath the various national packages of
modernizing reforms. What was going on, it seems, was the modernization of the Webe-
rian tradition, not its outright rejection: a process of addition, not demolition (even if
some of the additions fitted on the foundations rather awkwardly). Consider the following
summary of French reforms:
In France, the importance of administrative law, the successful experience of nationalized, monop-
oly, public service providers in the post war period, and the idea of a ‘general interest’, represented at
local level by the prefect, explain many of the distinctive features of the hybrid modernization
reforms. (Guyomarch, 1999, p. 171)
Finally, the radical marketizers and anti-state minimizers, who were quite common in
the UK, New Zealand, and the USA, never commanded the same degree of political
voice in either the central European states or even the northern group. Their omegas
(Figure 4.1) were different. The prophets of the core NPM states envisaged an entrepre-
neurial, market-oriented society, with a light icing of government on top. The northern
variant of the NWS foresaw a citizens’ state, with extensive participation facilitated by a
modernized system of public law that would guarantee rights and duties. Proponents of
the central European variant of the NWS favoured a professional state—modern, effi-
cient and flexible, yet still uniquely identified with the ‘higher purposes’ of the general
interest.
However, the precision of the NWS model—or the NPM or the NPG for that matter—
must not be exaggerated. As we said at the beginning of the chapter, omegas are frequently
vague, or incomplete, or both. So the pattern is very rough and approximate, for both
political and organizational reasons. Politically, governments change and may hold differ-
ent visions of the future, so that, following elections, certain types of reform are
de-emphasized and other types given greater salience. Thus, in the US, the arrival in
power of the Clinton Democrats resulted in an end to the neglect and sometimes scorn
120 TRAJECTORIES OF MODERNIZATION AND REFORM
which the federal civil service had suffered between 1980 and 1992. At least in rhetorical
terms, it shifted reform away from amixture of minimalism (especially under Reagan) and
marketization and towards modernization as the dominant motif. The election of Presi-
dent George W. Bush inaugurated a swing back to marketizing and contracting out,
although 9/11 meant that in some areas (the new Department of Homeland Security)
state provision and intervention actually increased.
A second set of political reasons for ‘untidiness’ is to be found among the pressures
represented by external socio-economic forces (Figure 2.1, box A) and by political de-
mands (box E). These can blow chosen trajectories off course. Consider, for example, the
balance between three basic types of reform objective. First there is the objective of
reducing public expenditure, or, at least, restraining its rate of growth. Second, there is
the laudable desire to design better-performing public services—higher quality, greater
efficiency, and so on. Third, there is the aim of sharpening accountability and transpar-
ency, and thereby—hopefully—enhancing the legitimacy of the administration in the
eyes of the public. These three objectives—all of them widely held and proclaimed among
our twelve countries—exist in some tension with each other. Trouble for governments
may blow up on any of these three fronts at quite short notice. An economic crisis (the
GEC of 2008) heightens the need for economies and cuts. Revelations of low standards in,
say, nursing homes or public transport, may lead to strident and popular calls for some-
thing to be done. The discovery of cases of corruption or gross waste or concealment of
important decisions may fuel calls for greater transparency and stricter accountability
procedures (as happened with the European Commission crisis in 1999). When one or
more such events occur political leaders and their senior officials have, temporarily at least,
to alter the balance of their efforts. ‘Firefighting’ may lead to some neglect of longer-term
visions. Progress along a particular trajectory, or towards a particular omega, wobbles or
halts. In particular, the GEC has clearly led to major reform ‘detours’ in a number of
countries: ‘Cutback management . . . brings to the fore the trade-off between short-term
goals and long-term goals’ (Pandey, 2010, p. 568).
Organizational factors may also intrude to spoil the possibility of any truly neat pattern.
There are frequently implementation difficulties, and these can persuade governments to
change instruments, or to ‘soft pedal’ on types of reform about which they were previously
very enthusiastic. Mr Major’s UK Conservative government soon retreated from the
rhetoric of vigorous competition with respect to the NHS provider market, and took
steps to see that it was closely managed, in an effort to avoid volatility (Pollitt, Birchall,
and Putman, 1998). Following criticism, the Dutch government of the mid 1990s became
more cautious about creating highly autonomous ZBOs and tended to favour more con-
trollable departmental agencies instead. In the 1990s M. Jospin’s government in France
retreated from some of its public service reform proposals when faced with large-scale
strikes by resistant trade unions.
More fundamentally, different governments have different capacities for reform, accord-
ing to regime type (as explained in Chapter 3). During the 1980s, for example, the gap
between rhetoric and actual implementation was perhaps particularly wide in Canada and
the USA. Between 1998 and 2006, a number of reforms were announced in Germany. but
in 2008 the view of at least one German scholar was that ‘So far, most of the reform
programmes consist of rhetoric’ (Reichard, 2008, p. 47). During the 1990s one may
TRAJECTORIES OF MODERNIZATION AND REFORM 121
question the extent of actual reform achievements within the European Commission,
despite the impressive-sounding rhetoric of SEM 2000 and MAP 2000 (The Evaluation
Partnership, 1999; see also the European Commission file in Appendix B).
4.12 Back to the models: the New PublicGovernance (NPG)
A final, but important qualification concerning the ‘big picture’ we are attempting to paint
in this chapter is that we do not see the history as simply a clash between NPM and NWS.
That is both far too simple and much too static. To begin with, there have been many
routine reforms in most of our countries that do not particularly fit into any of the three
big models introduced in Chapter 1—improving emergency answering services, for exam-
ple, or putting tax forms or birth certificates online. Cumulatively such ‘routine’ and
unremarkable reforms can be very significant, but one of the drawbacks of taking an
approach which is structured by big models or theories is that these sorts of changes too
easily fall out of the picture.
Additionally, as we remarked in Chapter 1, there are plenty of other suggested models in
circulation, any of which can be used as a lens through which to categorize the reforms of
the last three decades. More particularly, there is a widespread and somewhat chaotic
theoretical debate about what (if anything) has ‘succeeded’ NPM as a dominant model for
the immediate future. We mentioned this in Chapter 1 (Sections 1.8 to 1.10) and we now
turn to the idea that could probably be described as the ‘leading candidate’ to succeed
NPM, namely governance. In this book we have followed the NPG (Osborne, 2010) as one
of our three big models, but it is far from being the only version of governance (Pollitt and
Hupe, 2011). So in the remainder of this section we will explore rather further both NPG
and another governance model, ‘Digital Era Governance’ (Dunleavy et al., 2006b).
The NPG is presented as ‘the shadow of the future’—the next stage after, first, traditional
public administration and, then, NPM (Osborne, 2010, p. 6). The NPG paradigm (sic) is
said to be rooted within network theory. It is worth quoting at length how one of its most
vocal advocates defines it:
It posits both a plural state, where multiple interdependent actors contribute to the delivery of
public services, and a pluralist state, where multiple processes inform the policymaking system.
Drawing upon open natural systems theory, it is concerned with the institutional and external
environmental pressures that enable and constrain public policy implementation and the delivery
of public services within such a plural and pluralist system. (Osborne, 2010, p. 9 – original italics)
For its part, Digital-Era Governance (DEG) is said to be ‘now the most general, pervasive,
and structurally distinctive influence on how governance arrangements are changing in
advanced industrial states’ (Dunleavy et al., 2006b, p. 479). Whilst any technological
determinism is denied, its proponents nevertheless envisage a ‘strong, underlying, upward
momentum’ (p. 490). The key features of DEG are:
122 TRAJECTORIES OF MODERNIZATION AND REFORM
� Reintegration: digital technologies facilitate the joining-up of fragmented government
(left behind by NPM) and siloed government (left behind by traditional bureaucracies)
� Needs-based holism: radically to simplify the relationship between agencies and their
clients, using digital technologies and re-engineering processes to strip out unnecessary
steps, repetitions, and duplications
� Digitization: electronic channels replace traditional ones. The agency becomes its website.
(Dunleavy et al., 2006b, p. 481)
How far can these two governance models be related to the kinds of evidence we have
introduced in this chapter, and to the interpretations of it we have presented? Our
assessment is: only to a very limited extent, for reasons we will now explain. First, neither
NPG nor DEG has been set up as a model to use in comparative analysis. On the contrary, as
was earlier the case with the NPM (but is not the case for the NWS), they are both basically
presented as ‘global waves’. There is nevertheless a difference between the two models on
this score. Whereas Osborne’s book on NPGmakes very little reference to the possibility of
systematic differences between countries, Dunleavy et al.’s treatment of DEG most cer-
tainly does. They see the actual incidence of DEG as being mediated by ‘a wide range of
cognitive, behavioural, organizational, political, and cultural changes’ (2006b, p. 468).
Thus, although the literature has yet to develop this aspect, the door is open to an
examination of how different political systems, institutional structures, cultures, etc.,
amend, adapt, or delay the DEG trajectory. Perhaps in a few years it will be possible to
write a book like this one, examining how far the DEGmodel has got in different countries
and why it has gone further in some than in others. Certainly Dunleavy et al. already
envisage a range of possible trajectories, not just one highroad. Furthermore their own
analysis of e-government schemes in seven countries already draws out some interesting
hypotheses. Among these is the idea that a high NPM orientation towards organizational
fragmentation and contracting out, combined with weak government handling of power-
ful international IT corporations, produces the worst results (as, for example, in the UK),
whereas a much more cautious approach to NPM, plus retention of a strong government
in-house capacity to deal with IT companies leads to far better outcomes (as in the Nether-
lands—see Dunleavy et al., 2006a). However, at this point in time it is not possible
comparatively to apply the DEG model across the broader horizon of public management
reform as a whole—it is just too early, and the necessary data has not been assembled.
Dunleavy et al. themselves acknowledge that ‘Like any other ‘‘over the horizon’’ projection,
our predictions may partly misfire’ (p. 489).
The NPG shares with DEG the use of the term ‘governance’, to denote the inclusion
within the governing process of other social actors apart from governments themselves.
But for our purposes it is different in almost every other way. To begin with, as you can
see from the definition given above, NPG is an extremely broad and abstract model.
Although it specifies certain features (e.g. resource allocation is to be made through
‘networks and relational contracts’), it is largely descriptive and lacking any theoretical
‘motor’. It can be hard to decide what is not NPG. Indeed, its status as a model is itself
ambiguous: ‘it is being presented both as a conceptual tool with the potential to assist
our understanding of the complexity [of twenty-first-century policy implementation and
TRAJECTORIES OF MODERNIZATION AND REFORM 123
service delivery] and as a reflection of the reality of the working lives of public managers
today’ (Osborne, 2010, p. 6). Yet within a page it is also being claimed that ‘from being an
element within the PA and NPM regimes . . . public governance has become a distinctive
regime in its own right’ (p. 7). Many conceptual schemes are offered, but not much
empirical evidence. NPG is therefore still a long way from being an adequate theoretical
vehicle for a comparative, empirical analysis such as this one. It is too broad and too
general, and gives little clue on why, how, and when specific things are likely to happen.
For the moment, at least, it does not add much to the conceptual weaponry we already
have in the shape of the analysis of different types of national ‘house’ in Chapter 3.
(Thus, if we wish, we can already discuss better coordination, ‘joining-up’, contracting,
and so on (see 4.6 above) without needing to posit a whole new ‘regime’ or paradigm.)
Nevertheless, there is a great deal of debate around governance at the moment, so we will
continue to make references to the NPG as one of our three ‘red threads’ running
through the remaining chapters of the book. Whilst the NPG model may at present
appear to be rather vague and idealistic, it is nevertheless focused on some core contem-
porary features of politics and society (governments sharing power with other social
actors in a range of informal ways). It may yet be developed into something more
theoretically precise and operational.
4.13 In conclusion
Overall, therefore, our interpretation is that, whilst there has undoubtedly been great
diversity, and while many trajectories turn out to be partial or interrupted, there is a
rough but discernible longer-term pattern beneath the welter of detail. Whilst this
pattern certainly does not mean that each individual reform instrument (performance
budgets, contracting out, etc.) can be ascribed exclusively to one single trajectory (still
less to one group of countries and not to others) it does suggest that there are some
usually continuing broad differences between different groups of countries. The trajec-
tories and rhetorics of reform were significantly different as between, first, the Anglo-
Australasian-American core NPM enthusiasts; second, the early and participatory mod-
ernizers in northern Europe (NWS—modernizing/participatory) and, third, the some-
what later, more managerially oriented modernizers in central Europe and the EU
Commission (NWS—modernizers/managerial). It also seems likely that these differences
are indeed related to the types of politico-administrative regimes which were analysed in
the previous chapter. In terms of trajectories or strategies, not every country has played
the NPM game, and certainly not many are doing so now. There is a kind of path
dependency, but there is more than one path, and the specific mechanisms that reinforce
certain actions and punish others (i.e. the mechanisms which reinforce the path) differ
somewhat between majoritarian states and consensual states, between centralized sys-
tems and decentralized systems, and between different cultures (Pollitt, 2008, pp. 40–51).
The mechanisms are procedural, structural, and cultural—would-be reformers can be
rewarded or frustrated by procedural rules, institutional structures, or cultural norms
(Pollitt and Bouckaert, 2009, pp. 153–8). They can tackle these with greater or lesser
124 TRAJECTORIES OF MODERNIZATION AND REFORM

skill, and greater or lesser willpower, but they cannot wish them away. That is why the
actual content of the reform (the specifically proposed actions and techniques) is never
more than half the story.
There is, of course, another, uncomfortably sharp question, which has been waiting in
the wings throughout this chapter. It is whether any or all of these trajectories actually
work? Can any of these many reformers in many countries realistically claim that their
omega has been reached? That is, what have been the results of the many efforts at reform?
The next chapter wrestles with this by no means straightforward issue.
TRAJECTORIES OF MODERNIZATION AND REFORM 125
5 Results: through aglass darkly
You have to have a long-term strategy but unless it delivers short-term results no
one will believe you.
(Michael Barber, former Head of Prime Minister Blair’s Delivery Unit, 2007)
The performance of public organizations cannot be reduced to a single dimension,
and is inescapably contestable.
(Boyne et al., 2006)
5.1 Results: a slippery concept
The question of what has resulted from all the many reforms is obviously an absolutely
fundamental one. Yet it is not at all simple. The label ‘result’ can be applied tomanydifferent
aspects, and may incorporate a variety of concepts. Talk and decisions and even cultural
shifts, as well as actual actions, may be considered as important types of ‘result’ (Brunsson,
1989). Changes in citizen attitudes are another possible result. But if, in opinion surveys,
citizens are shown to ‘feel’ that some service has got better, or worse, is that the final word on
thematter, or dare we risk being branded as ‘anti-democratic’ by suggesting that citizens can
sometimes be mistaken? Perhaps instead of popular opinion, we should place our faith in
expert evaluations. Yet much seems to depend on who is evaluating what, for whom, and
why. The top experts may be able to discriminate between the scientifically first-rate profes-
sional evaluation and the only upper-second division evaluation, but most citizens and
politicians would be struggling to be sure of the difference. Even if you simply ask the top
officials in an organization what they think about a reform they have just been through,
these knowledgeable ‘insiders’ frequently express widely varying opinions of whether it was
a success or not (for the case of the Kinnock reforms in the EU Commission, see Ellinas and
Suleiman, 2008). A full discussion of ‘results’, therefore, embraces the wider questions of
‘results for whom, defined by whom, against what criteria, and in pursuit of which objec-
tives?’ It would be all so much easier if the popular question of ‘And what were the actual
results?’ could just be given a straightforward, concrete answer, but in public management
reform, frustratingly perhaps, such straightforwardness is the exception rather than the rule.
It should also be noted that ‘results’ are closely tied to the concept of ‘performance’, and
performance became one of the core concerns of those advocating the NPM. Performance
also outgrew and outlived the NPM, and today remains a central concern for many theorists
and practitioners, whether they be sympathetic to, or opposed to, NPM ideas (see, e.g.
Bouckaert and Halligan, 2008; Boyne et al., 2006; Kelman and Kettl, 2007; Moynihan, 2008;
Talbot, 2010; Van Dooren and Van deWalle, 2008). Advocates of NWS and NPG trajectories
also believe that their models will bring, in some sense, better-performing governance.
The remainder of the chapter is divided into sevenmain sections, each with a number of
subsections:
5.2 The big picture: comparing the performance of governments internationally
5.3 Types of result and challenges to assessing them
5.4 Saving money—economies
5.5 Improving efficiency
5.6 Increasing effectiveness
5.7 Enhancing citizen satisfaction and trust
5.8 Beyond the production model for performance: systems, capacities, orientations, visions
5.9 Conclusions and reflections
We begin with two sections that engage with some of the conceptual and practical
problems of assessing results. Thus in Section 5.2 we plunge straight into a particularly
striking kind of result—the internationally comparative indicators of ‘good governance’
which have multiplied in number and increased in prominence over the past decade or so.
We look at these both because of their intrinsic interest and because of the ways in which
they prompt methodological questions over measurement and interpretation. That leads
us straight into a section (5.3) where we enumerate some of the key challenges in defining,
measuring, and assessing results. Inter alia this involves distinguishing between a number
of different levels at which results can be defined and assessed, and between a number of
different dimensions or aspects of performance.
In the following four sections we look at evidence concerning some typical categories of
results—saving money (5.4), improving efficiency (5.5), increasing effectiveness (5.6), and
enhancing citizen satisfaction and trust (5.7). These are related to the performance frame-
work which was introduced in Chapter 1 (Figure 1.2). After this (5.8) we look at some other
conceptions of improvement, which are less related to the idea of government as a
producer of goods and services. Finally (5.9) we reflect on what is known and what is
not about the results of public management reform.
This is thus a long chapter.We think this is justified because of the centrality of the ‘results’
issue for most public managers and their governments. One might say that the more
educated, sophisticated, and aware citizens become, the less they are likely to be satisfied
with their governors offering stirring visions and vague promises of a better tomorrow, and
the more likely they are to ask the question, ‘Yes, but where are the results?’
5.2 The big picture: comparing the performanceof governments internationally
Each year since the late 1990s the World Bank has published a collection of ‘Worldwide
Governance Indicators’ (WGIs), which apparently measure each country’s achievements
in governing themselves. The WGIs are organized into six main indicators/scores:
RESULTS: THROUGH A GLASS DARKLY 127
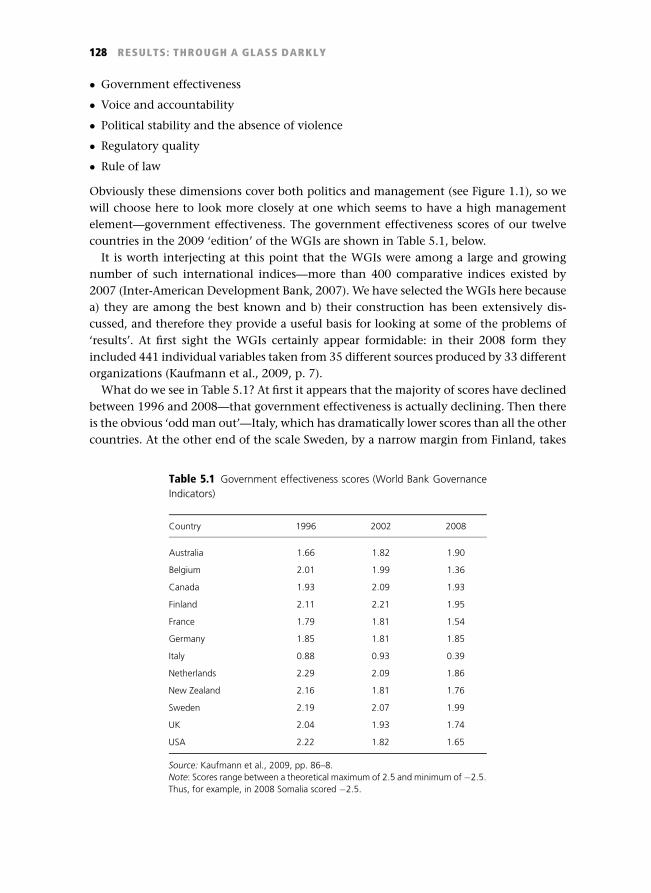
� Government effectiveness
� Voice and accountability
� Political stability and the absence of violence
� Regulatory quality
� Rule of law
Obviously these dimensions cover both politics and management (see Figure 1.1), so we
will choose here to look more closely at one which seems to have a high management
element—government effectiveness. The government effectiveness scores of our twelve
countries in the 2009 ‘edition’ of the WGIs are shown in Table 5.1, below.
It is worth interjecting at this point that the WGIs were among a large and growing
number of such international indices—more than 400 comparative indices existed by
2007 (Inter-American Development Bank, 2007). We have selected the WGIs here because
a) they are among the best known and b) their construction has been extensively dis-
cussed, and therefore they provide a useful basis for looking at some of the problems of
‘results’. At first sight the WGIs certainly appear formidable: in their 2008 form they
included 441 individual variables taken from 35 different sources produced by 33 different
organizations (Kaufmann et al., 2009, p. 7).
What do we see in Table 5.1? At first it appears that the majority of scores have declined
between 1996 and 2008—that government effectiveness is actually declining. Then there
is the obvious ‘odd man out’—Italy, which has dramatically lower scores than all the other
countries. At the other end of the scale Sweden, by a narrow margin from Finland, takes
Table 5.1 Government effectiveness scores (World Bank Governance
Indicators)
Country 1996 2002 2008
Australia 1.66 1.82 1.90
Belgium 2.01 1.99 1.36
Canada 1.93 2.09 1.93
Finland 2.11 2.21 1.95
France 1.79 1.81 1.54
Germany 1.85 1.81 1.85
Italy 0.88 0.93 0.39
Netherlands 2.29 2.09 1.86
New Zealand 2.16 1.81 1.76
Sweden 2.19 2.07 1.99
UK 2.04 1.93 1.74
USA 2.22 1.82 1.65
Source: Kaufmann et al., 2009, pp. 86–8.
Note: Scores range between a theoretical maximum of 2.5 and minimum of�2.5.
Thus, for example, in 2008 Somalia scored �2.5.
128 RESULTS: THROUGH A GLASS DARKLY
the prize as the most effectively governed state among our dozen. Exactly where a country
ranks in tables like this tends to make the headlines—newspapers and the media like to
portray such ‘results’ as ‘rising’ or ‘falling’, and to blame or praise the governments
concerned. For example, an analysis of media coverage of the Programme for International
Student Assessment (PISA) (another international table, this one concerned with educa-
tional performance) concluded that ‘most of the [British] media focused on where the UK
education system ranked internationally and tended to concentrate on the negative
results using populist and catchy sporting equivalences—being ‘‘beaten’’, ‘‘slump in the
world league’’, and ‘‘failed’’’ (Grek, 2008, p. 1).
One message from this chapter is that ‘results’ are very seldom as simple as this.
Aggregate indices such as the WGIs in Table 5.1 conceal a multitude of methodological
decisions and uncertainties, and are actually rather difficult to interpret. And the media’s
favoured language of winners and losers is usually unhelpful, and not infrequently ac-
tively misleading.
In support of these cautionary words, consider the following issues in relation to the
World Bank’s government effectiveness scores (Arndt, 2008; Pollitt, 2010b):
1. The measures are not linked to any underlying theory of effectiveness. ‘A framework is
needed before we measure government effectiveness or propose specific models of what
government should look like. Given the evidence of multiple states of development, the
idea of a one-best way model actually seems very problematic’ (Andrews, 2008, p. 379).
2. TheWorld Bank’s operational definition of ‘government effectiveness’ (and evenmore of
‘good governance’) is woolly and very general. They say it is ‘capturing perceptions of
the quality of public services and the degree of its independence from political pressures,
the quality of policy formulation and implementation, and the credibility of the gov-
ernment’s commitment to such policies’ (Kaufmann et al., 2009, p. 6). This definition
raises as many questions as it answers, for example whose perceptions? What do they
mean by quality (a notoriously slippery term)? How can they measure the average
‘credibility’, when some believe passionately in what a government is trying to do and
others are highly sceptical or cynical? In fact the World Bank does not measure these
perceptions themselves at all—they take a whole series of measures from a number of
other organizations and aggregate them together to form the index.
3. The actual measureswhich go tomake the aggregate score are a tremendousmixture with
no obvious coherence or logic. They include ‘the quality of bureaucracy’, ‘the quality of
public schools’, ‘the quality of personnel’, time spent by senior business managers
dealing with government officials, public satisfaction with roads and highways, and a
number of other items.
4. The aggregation procedure for scaling and weighting all these very different measures so
that a single number comes out at the end is complex and debatable.
5. Changes over time are not at all easy to interpret. The sources used to compose the
aggregate indicators vary somewhat from year to year. A change between, say, 2002
and 2008 may mean that there has been an actual change in effectiveness, but it could
also mean a) that there has been a change in perceptions by the people monitored, but
that this is a false indicator because there has been no underlying real change or b) that
RESULTS: THROUGH A GLASS DARKLY 129
the ratings of other countries have changed (WGIs are designed so that the global
average and standard deviation remain the same, so a change in one country’s ratings
usually changes all the other countries’ ratings) or c) that there has been a change in the
number and/or composition of the sources from which the World Bank draws its data.
This is one reason why we cannot assume, from Table 5.1, that actual effectiveness has
declined in most of the countries shown. Even the World Bank itself recognizes these
difficulties (World Bank, 2008, p. 3).
There are other problems. Even if one accepts the government effectiveness indicators
at face value, it turns out that the most effective governments exhibit very different
patterns of institutions, processes, and practices. When Andrews (2010) examined the
high-scoring countries of Australia, Belgium, Canada, Germany, Denmark, Hong Kong,
the Netherlands, Singapore, Sweden, the UK, and the USA, he found that ‘good govern-
ments can look very different’ (p. 11) and that, in the area of public financial management
at least, several of the key ‘best practices’ were no more likely to be adopted
by governments scoring highly on effectiveness than by governments scoring much
further down.
However, even if all these criticisms of the WGIs are accepted as having force, that
should not be read as a general rejection of all international performance comparisons.
The WGIs are unusual in several respects. First, they are extremely ambitious, aiming to
sum up the whole universe of ‘good governance’ in just six aggregate scores. Second, they
are similarly ambitious in the breadth of their coverage—212 countries, including the
richest and the poorest, liberal democracies and corrupt dictatorships. Third, they are
based on an aggregation of many different data sources, not on data gathered by the
World Bank itself for this specific purpose. Many of the other international comparisons
are less grandiose/more focused in their aims and methods. One example at the other
end of the spectrum might be the OECD’s PISA project, an attempt to measure educa-
tional proficiency at age 15 across sixty-five countries (OECD, 2007). Here the exercise is
confined to a somewhat smaller group (sixty-five) of (mainly) developed countries, and
the measures are derived from specially constructed tests, administered in a similar way
in each country. The result is a series of performance measures which are highly re-
spected by many (though not all) educational professionals, and which have certainly
had effects on educational policy-making in several countries, including Finland
and Germany (see Hautam€aki et al., 2008). Table 5.2 gives some idea of what these
‘results’ look like.
Yet even these carefully collected numbers from carefully administered tests have their
limitations (see, e.g. Goldstein, 2004). For example, they are frequently treated as though
they are a comparative test of the effectiveness of national educational systems. But they
are not really well fitted to do that job. First, they are cross-sectional rather than
longitudinal and so do not offer an analysis of development over time. Thus a country
that started with a very low performance but made huge strides forward would still
appear lower down than a country that had initially had an excellent education system
but which was gently declining. Furthermore, PISA involves testing students against a
test, not against what might happen to be the educational objectives of that particular
school system.
130 RESULTS: THROUGH A GLASS DARKLY
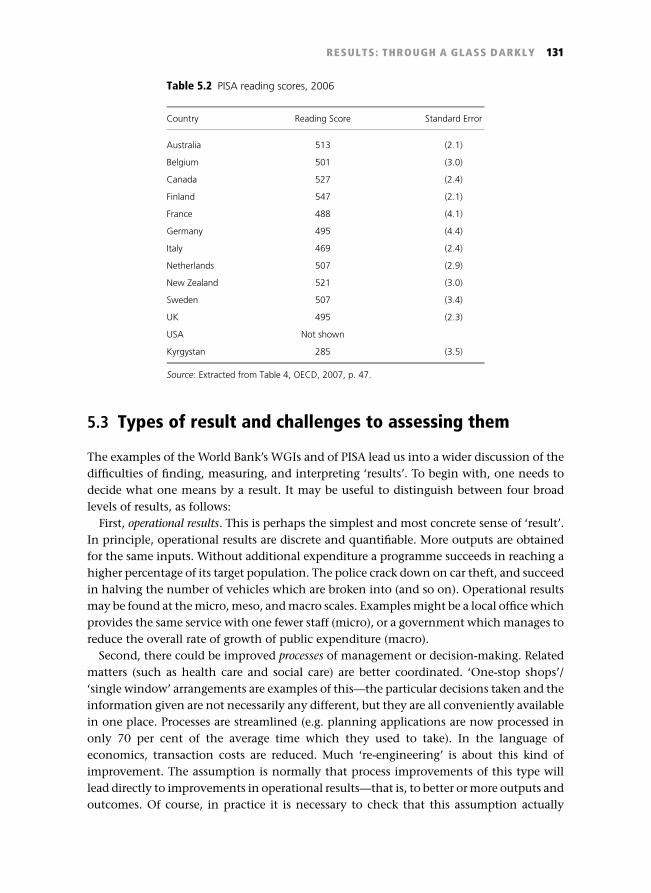
5.3 Types of result and challenges to assessing them
The examples of the World Bank’s WGIs and of PISA lead us into a wider discussion of the
difficulties of finding, measuring, and interpreting ‘results’. To begin with, one needs to
decide what one means by a result. It may be useful to distinguish between four broad
levels of results, as follows:
First, operational results. This is perhaps the simplest and most concrete sense of ‘result’.
In principle, operational results are discrete and quantifiable. More outputs are obtained
for the same inputs. Without additional expenditure a programme succeeds in reaching a
higher percentage of its target population. The police crack down on car theft, and succeed
in halving the number of vehicles which are broken into (and so on). Operational results
may be found at themicro,meso, andmacro scales. Examplesmight be a local office which
provides the same service with one fewer staff (micro), or a government which manages to
reduce the overall rate of growth of public expenditure (macro).
Second, there could be improved processes of management or decision-making. Related
matters (such as health care and social care) are better coordinated. ‘One-stop shops’/
‘single window’ arrangements are examples of this—the particular decisions taken and the
information given are not necessarily any different, but they are all conveniently available
in one place. Processes are streamlined (e.g. planning applications are now processed in
only 70 per cent of the average time which they used to take). In the language of
economics, transaction costs are reduced. Much ‘re-engineering’ is about this kind of
improvement. The assumption is normally that process improvements of this type will
lead directly to improvements in operational results—that is, to better ormore outputs and
outcomes. Of course, in practice it is necessary to check that this assumption actually
Table 5.2 PISA reading scores, 2006
Country Reading Score Standard Error
Australia 513 (2.1)
Belgium 501 (3.0)
Canada 527 (2.4)
Finland 547 (2.1)
France 488 (4.1)
Germany 495 (4.4)
Italy 469 (2.4)
Netherlands 507 (2.9)
New Zealand 521 (3.0)
Sweden 507 (3.4)
UK 495 (2.3)
USA Not shown
Kyrgystan 285 (3.5)
Source: Extracted from Table 4, OECD, 2007, p. 47.
RESULTS: THROUGH A GLASS DARKLY 131
holds—public sector re-engineering projects, for example, do not always produce identifi-
able effects on final outcomes, or even on outputs.
Changes in process are frequently intended to signal a shift in administrative cultures—
indeed they are often made with a definite consciousness of their symbolic impact. A
status report on the US National Performance Review (NPR) lists ten pieces of evidence
that government is starting to work better:
� Over 90 per cent of National Performance Review recommendations are under way.
� The President has signed twenty-two directives, as well as performance agreements with
seven agency heads.
� Over 100 agencies are publishing customer service standards.
� Nine agencies have started major streamlining initiatives.
� Agencies are forming labor-management partnerships with their unions.
� Agencies are slashing red tape.
� The government is buying fewer ‘designer’ products and doing more common-sense
commercial buying.
� Throughout the federal government 135 ‘re-invention laboratories’ are fostering
innovation.
� The government is shifting billions of dollars in benefits to electronic payments.
� The federal government is changing the way it interacts with state and local govern-
ments (National Performance Review, 1994, p. 5).
It is noticeable that these were all process improvements.
Third, a ‘result’ may take the form of some broad change in the overall capacity of the
political or administrative system. The pattern of institutionsmay be redesigned so as to be
more flexible, with the intention that this will make the system more resilient in dealing
with pressures which are expected to arise in the future. For example, it may be decided
that all senior civil service appointments will be competitive and open to any applicant,
rather than being confined to those already in the civil service and at the relevant level in
the hierarchy. In a way, capacity changes are process improvement writ large. They mean
that government organizations are now able to do more things within a given period of
time, or can do things better—in a more evidence-based or flexible way.
Fourth, and finally, ‘results’ may be assessed relative to the degree to which the system
has shifted towards some desired or ideal state—in the language of Chapter 4, an omega.
This is perhaps the most strategic sense of result. It is also the most obviously doctrinal or
ideological. If the ideal is very small, ‘light’ state apparatus, with most activities under-
taken within the private, market-oriented sector (as seems implicitly to be the case with
some international measures—Van de Walle, 2006), then public management reforms
may be judged in terms of how far they have moved the system in the direction of this
vision.
It is immediately apparent that the first and second levels are more precise and
concrete and—potentially at least—quantifiable, than the third and fourth. The third
and fourth are both ‘systems-level’ kinds of results, and both involve somewhat abstract
132 RESULTS: THROUGH A GLASS DARKLY
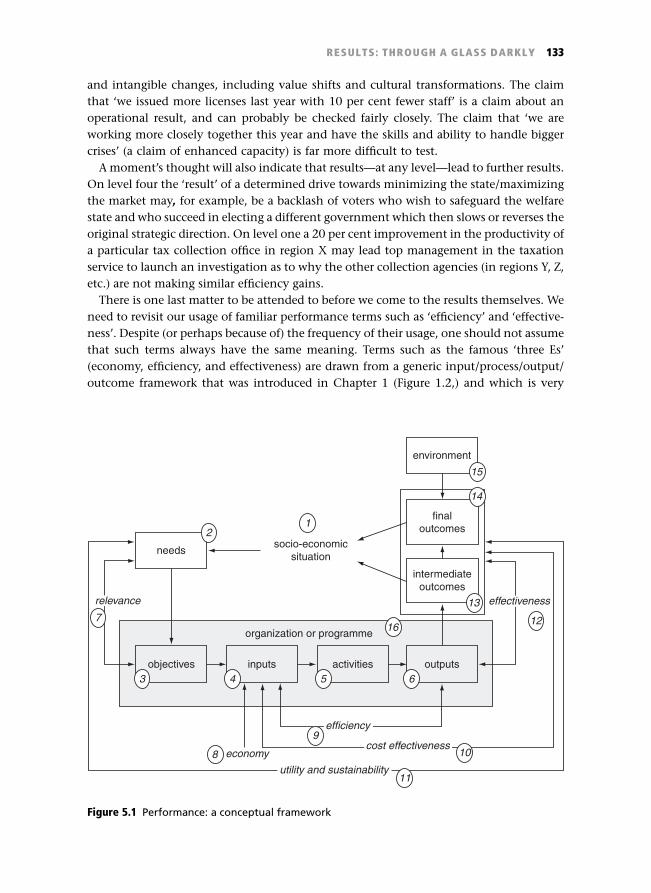
and intangible changes, including value shifts and cultural transformations. The claim
that ‘we issued more licenses last year with 10 per cent fewer staff’ is a claim about an
operational result, and can probably be checked fairly closely. The claim that ‘we are
working more closely together this year and have the skills and ability to handle bigger
crises’ (a claim of enhanced capacity) is far more difficult to test.
A moment’s thought will also indicate that results—at any level—lead to further results.
On level four the ‘result’ of a determined drive towards minimizing the state/maximizing
the market may, for example, be a backlash of voters who wish to safeguard the welfare
state and who succeed in electing a different government which then slows or reverses the
original strategic direction. On level one a 20 per cent improvement in the productivity of
a particular tax collection office in region X may lead top management in the taxation
service to launch an investigation as to why the other collection agencies (in regions Y, Z,
etc.) are not making similar efficiency gains.
There is one last matter to be attended to before we come to the results themselves. We
need to revisit our usage of familiar performance terms such as ‘efficiency’ and ‘effective-
ness’. Despite (or perhaps because of) the frequency of their usage, one should not assume
that such terms always have the same meaning. Terms such as the famous ‘three Es’
(economy, efficiency, and effectiveness) are drawn from a generic input/process/output/
outcome framework that was introduced in Chapter 1 (Figure 1.2,) and which is very
21
7
3 4 5 6
9
8
11
10
12
13
15
14
16
needs
objectives inputs outputs
environment
finaloutcomes
intermediateoutcomes
activities
organization or programme
socio-economicsituation
relevance
economy
efficiency
cost effectiveness
utility and sustainability
effectiveness
Figure 5.1 Performance: a conceptual framework
RESULTS: THROUGH A GLASS DARKLY 133
widely used in both the study and practice of public management. For convenience, we
reproduce it here as Figure 5.1.
This model mainly concerns the first two levels of result discussed above—operational
results and process results. The model can itself be applied on various different scales. For
example, it can be deployed at the macro scale, taking the entire apparatus of public
administration as the unit of analysis—the ‘thing’ that produces the output. More com-
monly, however, the input/output model is applied at a meso scale—to programmes (e.g.
health care, job creation, road construction) or to individual institutions or organizations
(a tax collection agency, a police force). In each of the sections which follow we will try to
look at ‘results’ first at the level of whole countries, then at the level of reform programmes,
and finally at the level of individual organizations.
The model assumes that institutions and/or programmes are set up to address some
specific socio-economic need(s). They establish objectives concerned with these needs, and
acquire inputs (staff, buildings, resources) with which to conduct activities in pursuit of
those objectives. Processes are then those activities which take place inside institutions, in
order to generate outputs. Processes would thus include, for example, teaching in a school,
or recording and labelling within a warehouse. The outputs are the products of these
processes—what the institution ‘delivers’ to the outside world (academic qualifications,
school reports or, in the warehouse case, issued stock). The outputs then interact with the
environment (especially with those individuals and groups at whom they are specifically
aimed) leading to intermediate and then final outcomes (e.g. students getting jobs and
achieving competence within them, or stock items being used by their purchasers).
Ultimately the value of both the processes and the outputs rest on the outcomes. Finally,
the production model of performance can also be used on a micro scale. Parts or all of it
can be applied to the work of individuals, teams, or small groups. In this book, however,
we will operate mainly at the macro and meso scales.
Having thus clarified the conceptual vocabulary of results and performance we can
quickly point to some very common challenges in identifying results and the reasons for
results. These include the following:
1. Policy objectives are expressed in very vague or even contradictory terms, meaning that
it is hard to know when outputs and/or outcomes match the intentions. This has been a
standard observation in policy studies for forty years or more.
2. Efficiency is improved but outcomes do not change—or, to put it another way, efficiency
improves but effectiveness does not. For example, perhaps we write this book more
quickly than our previous one, and the publishers are able to publish it more cheaply—
yet the number of people buying, reading or citing the new, more efficiently produced
book does not increase.
3. A particular performance target is hit, but at the cost of other (usually unmeasured)
activities being quietly downgraded and/or neglected (Bevan and Hood, 2006). It is
often said that what is measured gets attention, but the supply or organizational
attention is limited, so choosing what to measure becomes a critical task.
4. Outcomes improve (or deteriorate) but it is not clear that this change is the result of the
organization or programme. This is known as the ‘attribution problem’, meaning that
134 RESULTS: THROUGH A GLASS DARKLY
changes in outcomes may be attributed to the programme/organization, whereas in fact
they are caused by something else. A classic case is when the public employment service
is blamed because it fills fewer jobs than it did last year. But the fall may be due to
worsening macro-economic conditions, over which the public employment service has
no control (and for which it has no responsibility). Or there may even be a misunder-
standing about the direction of the ‘arrow of causation’. Some Swedish studies seemed
to show that, whereas some had claimed that certain reforms had led to expenditure
savings, it actually seemed more probable that forced expenditure reductions had led to
reform (Murray, 1998).
5. There are changes in the way the programme is organized or the results are measured (or
both) which means that it becomes impossible precisely to compare the outputs and/or
outcomes before the programme started with those after the programme has had time to
take effect. For example, a study of twelve UK schools, hospitals, and public housing
organizations which had been given greater decentralized management autonomy was
unable to say whether this had produced better results because ‘there is little systematic
before and after data’ (Pollitt et al., 1998, p. 164).
In conclusion, it may be worth emphasizing the point that these multiple difficulties in
assessing ‘results’ mean both that failures or weak performances may be missed and that
successes or significant improvements may go unsung. We should not assume that what
we cannot see clearly must be either all bad or all good.
5.4 Saving money—economies
One apparently easily understood result is economy (see Figure 5.1 above)—the saving of
inputs (which could be actual cash, or materials used, or staff needed—all of which can be
translated into monetary terms). We say ‘apparently’ because ‘savings’ is itself a term
which is used in a variety of ways. As any experienced budget official knows, a ‘saving’
may mean any one or more of the following:
1. a reduction of the financial inputs compared with the previous year using the current
price basis in each year (i.e. not allowing for inflation);
2. a reduction of the financial inputs compared with the previous year, using the same
price base for both years (so that, for example, if the nominal/current cash spend in the
previous year was 100 and the nominal/current cash spend this year is 105, but general
inflation has been 10 per cent, then this will be counted as a saving, despite the fact that
the nominal spend is higher);
3. a reduction in the financial input for year X compared with the previous forecast input
for year X (such reductions may still leave the inputs higher than they were in the
previous year);
4. a reduction in inputs with no reduction of the services provided/activities conducted
(i.e. an efficiency gain in terms of Figure 5.1);
RESULTS: THROUGH A GLASS DARKLY 135
5. a reduction in inputs which leads to a reduction in the services provided/activities
conducted (which may even mean an efficiency loss, depending what the relative
proportions of the reductions in inputs and outputs turn out to be);
6. a reduction in unit costs (e.g. the cost per application processed). If activity volumes
increase then perfectly genuine savings in unit costs may nevertheless be accompanied
by an increase in the budget (because the latter is determined by unit cost� quantity, so
the increase in quantity may outweigh the reduction in unit costs);
7. the transfer of an activity from one part of the state to another (e.g. from central
government to local government) so that one jurisdiction can show what appears to
be a ‘saving’, though the system as a whole has made no saving;
8. the transfer of an activity out of the state sector altogether (privatization). In this case the
government ‘saves’ money (at least in terms of gross public spending) and also wins a
one-off receipt in the form of the sale price. The citizen may or may not benefit. Taxes
may go down, or not; the citizenmay nowhave to buy the same service from the private
sector at the same or even a higher price; or may benefit from lower prices and higher
efficiency—these outcomes all depend on situationally specific factors of markets, regu-
latory regimes, management skills, and other variables;
9. a purely hypothetical future event (as in ‘if we make these changes to our working
patterns now then in two years’ time we should be able to reduce our overheads by 15
per cent’).
Claims that savings have been made should therefore always be subject to further ques-
tioning and scrutiny, in order to determine precisely what is meant and what the implica-
tions may be for outputs and outcomes. With that caveat in mind we will now look at
some of the broad evidence concerning ‘savings’.
Despite (or perhaps because of) all the alternative versions of what it means, saving
money has certainly been a salient objective for many countries, and a major influence on
public management reform—especially since the global economic crisis of 2008, but also
long before that. One might remember, for example, the EU’s Maastricht ‘convergence
criteria’, which included the standard that public sector deficits must be held below 3 per
cent of GDP. These were a major spur to reform in Italy and several other EU member
states—and something of a spur to ‘creative accountancy’ also.
In this and subsequent sections we will begin at the country level, then go to the level of
reform programmes, and finally address examples at the level of individual organizations
or units.
Table 5.3 shows changes in the ratio of government spending to GDP in the twelve
countries between 1980 and 2006. It is immediately apparent that, although the shares go
up and down somewhat, the rank order between countries has remained fairly stable over
the quarter century covered. There remains, for example, a huge difference between the
‘small state’ US (consistently below 40 per cent of GDP) and the ‘big state’ Sweden (usually
above 60 per cent, though recently down to 54 per cent). Similarly there is a consistent
contrast between ‘small state’ Australia and ‘big state’ France.
136 RESULTS: THROUGH A GLASS DARKLY

However, here we are looking for evidence of economies. During the most recent period
(1995 to 2006) the GDP share has fallen in eleven of our twelve countries—paradoxically
rising only in the intensively and repetitively reformed UK! Particularly large falls are
visible in Canada, Finland, Germany, the Netherlands, and Sweden. Before jumping to
the conclusion that this means public management reforms have been successful in
producing savings, however, several qualifications must be made.
First, the pattern between countries does not always fit what one might expect from a
crude reading of the record of management reform. For example, Finland and the Nether-
lands—both consensual, cautiously reforming regimes—achieved large reductions while
the UK—a self-styled ‘world leader’ in reform—was the only country whose public share
went up. So there may well be something else behind these aggregates.
Second, the figures tell us little about what kind of ‘savings’ may have been involved
here. In particular they give no clue as to whether reductions in the share of GDP taken
by public spending have been achieved with no losses in efficiency, effectiveness, and
quality, small losses, or severe deterioration in the overall standards and scope of public
services. Neither do they tell us to what extent the ‘results’ have been gained by transfer-
ring large sets of activities to the private sector. In fact there are no good international,
comparative data sets to show what in these senses has been the ‘price that has been
paid’ for ‘savings’. Indeed, the methodological problems in constructing such a data set
are enormous.
A third qualification is that much depends on the state of the economy at the time the
measurement is taken. If the economy is depressed, various kinds of social protection
expenditures rise and tax revenues fall. The public sector tends to loom large while the
private sector contracts or ceases to grow so rapidly—as has happened in 2008–10, after the
OECD measurements in Table 5.3 were taken—hence the big deficits with which so
Table 5.3 General government expenditures as a percentage of GDP (all figures percentages)
Country 1980 1985 1990 1995 2006*
Australia 33.8 38.7 34.8 37.4 34.9
Belgium 59.0 62.5 55.2 52.1 48.4
Canada 40.5 47.1 46.9 48.5 39.3
Finland 36.6 41.6 41.2 61.6 48.9
France 46.1 52.2 49.9 54.4 52.7
Germany 48.5 47.6 46.0 54.8 45.3
Italy 41.7 50.9 53.0 52.5 49.9
Netherlands 57.5 59.7 55.6 56.4 45.6
New Zealand n.a. n.a. n.a. 41.4 39.9
Sweden 61.6 64.7 61.4 65.1 54.3
UK 44.8 46.2 42.1 43.9 44.2
USA 33.7 36.7 36.1 37.0 36.4
Note: The figures for 1980, 1985, and 1990 come from OECD (1992), OECD Economic Outlook: Historical Statistics, 1960–
1990, Paris, OECD, but the figures for 1995 and 2006 are on a somewhat different basis and come from OECD (2009),
Government at a Glance 2009, p. 53.
RESULTS: THROUGH A GLASS DARKLY 137
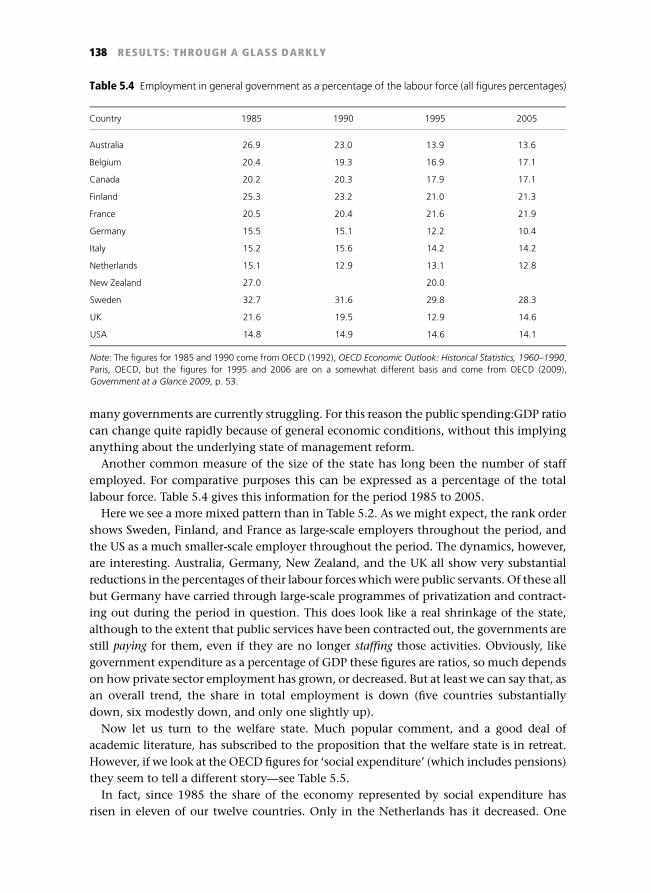
many governments are currently struggling. For this reason the public spending:GDP ratio
can change quite rapidly because of general economic conditions, without this implying
anything about the underlying state of management reform.
Another common measure of the size of the state has long been the number of staff
employed. For comparative purposes this can be expressed as a percentage of the total
labour force. Table 5.4 gives this information for the period 1985 to 2005.
Here we see a more mixed pattern than in Table 5.2. As we might expect, the rank order
shows Sweden, Finland, and France as large-scale employers throughout the period, and
the US as a much smaller-scale employer throughout the period. The dynamics, however,
are interesting. Australia, Germany, New Zealand, and the UK all show very substantial
reductions in the percentages of their labour forces which were public servants. Of these all
but Germany have carried through large-scale programmes of privatization and contract-
ing out during the period in question. This does look like a real shrinkage of the state,
although to the extent that public services have been contracted out, the governments are
still paying for them, even if they are no longer staffing those activities. Obviously, like
government expenditure as a percentage of GDP these figures are ratios, so much depends
on how private sector employment has grown, or decreased. But at least we can say that, as
an overall trend, the share in total employment is down (five countries substantially
down, six modestly down, and only one slightly up).
Now let us turn to the welfare state. Much popular comment, and a good deal of
academic literature, has subscribed to the proposition that the welfare state is in retreat.
However, if we look at the OECD figures for ‘social expenditure’ (which includes pensions)
they seem to tell a different story—see Table 5.5.
In fact, since 1985 the share of the economy represented by social expenditure has
risen in eleven of our twelve countries. Only in the Netherlands has it decreased. One
Table 5.4 Employment in general government as a percentage of the labour force (all figures percentages)
Country 1985 1990 1995 2005
Australia 26.9 23.0 13.9 13.6
Belgium 20.4 19.3 16.9 17.1
Canada 20.2 20.3 17.9 17.1
Finland 25.3 23.2 21.0 21.3
France 20.5 20.4 21.6 21.9
Germany 15.5 15.1 12.2 10.4
Italy 15.2 15.6 14.2 14.2
Netherlands 15.1 12.9 13.1 12.8
New Zealand 27.0 20.0
Sweden 32.7 31.6 29.8 28.3
UK 21.6 19.5 12.9 14.6
USA 14.8 14.9 14.6 14.1
Note: The figures for 1985 and 1990 come from OECD (1992), OECD Economic Outlook: Historical Statistics, 1960–1990,
Paris, OECD, but the figures for 1995 and 2006 are on a somewhat different basis and come from OECD (2009),
Government at a Glance 2009, p. 53.
138 RESULTS: THROUGH A GLASS DARKLY
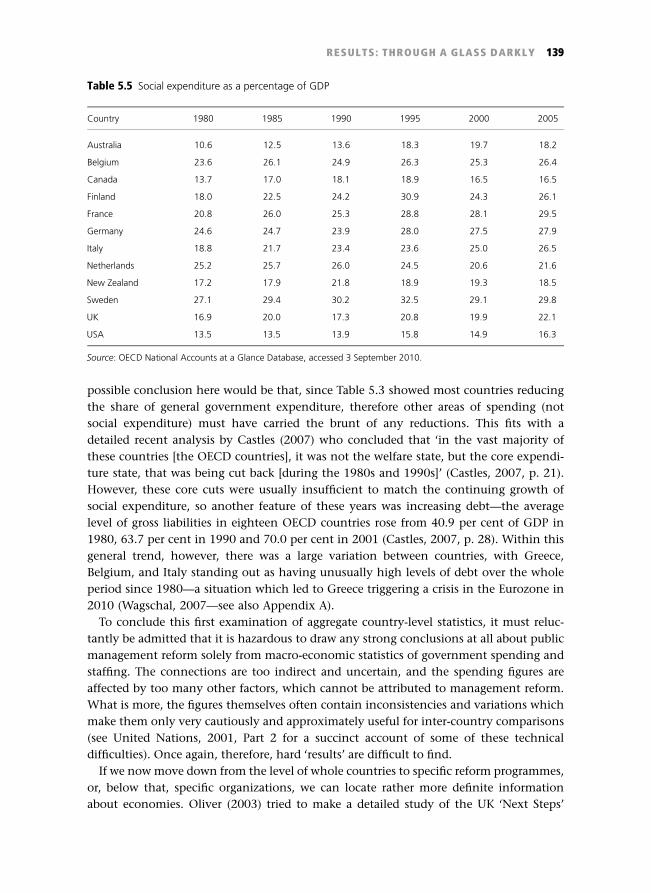
possible conclusion here would be that, since Table 5.3 showed most countries reducing
the share of general government expenditure, therefore other areas of spending (not
social expenditure) must have carried the brunt of any reductions. This fits with a
detailed recent analysis by Castles (2007) who concluded that ‘in the vast majority of
these countries [the OECD countries], it was not the welfare state, but the core expendi-
ture state, that was being cut back [during the 1980s and 1990s]’ (Castles, 2007, p. 21).
However, these core cuts were usually insufficient to match the continuing growth of
social expenditure, so another feature of these years was increasing debt—the average
level of gross liabilities in eighteen OECD countries rose from 40.9 per cent of GDP in
1980, 63.7 per cent in 1990 and 70.0 per cent in 2001 (Castles, 2007, p. 28). Within this
general trend, however, there was a large variation between countries, with Greece,
Belgium, and Italy standing out as having unusually high levels of debt over the whole
period since 1980—a situation which led to Greece triggering a crisis in the Eurozone in
2010 (Wagschal, 2007—see also Appendix A).
To conclude this first examination of aggregate country-level statistics, it must reluc-
tantly be admitted that it is hazardous to draw any strong conclusions at all about public
management reform solely from macro-economic statistics of government spending and
staffing. The connections are too indirect and uncertain, and the spending figures are
affected by too many other factors, which cannot be attributed to management reform.
What is more, the figures themselves often contain inconsistencies and variations which
make them only very cautiously and approximately useful for inter-country comparisons
(see United Nations, 2001, Part 2 for a succinct account of some of these technical
difficulties). Once again, therefore, hard ‘results’ are difficult to find.
If we now move down from the level of whole countries to specific reform programmes,
or, below that, specific organizations, we can locate rather more definite information
about economies. Oliver (2003) tried to make a detailed study of the UK ‘Next Steps’
Table 5.5 Social expenditure as a percentage of GDP
Country 1980 1985 1990 1995 2000 2005
Australia 10.6 12.5 13.6 18.3 19.7 18.2
Belgium 23.6 26.1 24.9 26.3 25.3 26.4
Canada 13.7 17.0 18.1 18.9 16.5 16.5
Finland 18.0 22.5 24.2 30.9 24.3 26.1
France 20.8 26.0 25.3 28.8 28.1 29.5
Germany 24.6 24.7 23.9 28.0 27.5 27.9
Italy 18.8 21.7 23.4 23.6 25.0 26.5
Netherlands 25.2 25.7 26.0 24.5 20.6 21.6
New Zealand 17.2 17.9 21.8 18.9 19.3 18.5
Sweden 27.1 29.4 30.2 32.5 29.1 29.8
UK 16.9 20.0 17.3 20.8 19.9 22.1
USA 13.5 13.5 13.9 15.8 14.9 16.3
Source: OECD National Accounts at a Glance Database, accessed 3 September 2010.
RESULTS: THROUGH A GLASS DARKLY 139
reform, a process whereby a series of executive agencies were created to take over work
previously done by ministries or other central government bodies. The first three agencies
were set up in 1988, and by 2001, 126 agencies existed, employing 57 per cent of all civil
servants. This was therefore a large-scale reform. The broad idea of the policy was that
agencies would be focused on performance targets set for them by ministers, that they
would be professionally managed, and that they would achieve greater economy whilst
also increasing efficiency and effectiveness. On the economy front, however, James found
that in the ten years following the reforms, expenditure in real terms rose by 19 per cent,
which was actually more than the 13 per cent rise which had characterized the ten years
before the reform (James, 2003, p. 110).
At the level of individual organizations, very clear examples of economizing can fre-
quently be found. For example, re-organizing an organization’s purchasing so as to buy in
bulk and ‘off-the-shelf’ can often lead to large savings. Onmany occasions, re-engineering
administrative processes so as to cut out redundant steps has saved money (and time).
Reducing staff sick leave by reducing stress and providing early warning and better support
has on a number of occasions led to overall economies because temporary staff are needed
less often, and so on. These items are not ‘high policy’ or flagship reforms, but they are the
stuff of everyday good management.
5.5 Improving efficiency
An efficiency increase (or productivity gain) is usually defined as an improvement in the
ratio of outputs to inputs (see Figure 5.1). As such it may come about via a variety of quite
different circumstances:
� where resources (inputs) decrease and outputs increase;
� where resources remain the same and outputs increase;
� where resources increase but outputs increase by an even larger amount;
� where outputs remains static but resources decrease;
� where outputs decrease but inputs decrease by an even larger amount.
It is important to know which of these situations one is dealing with. For example, in the
1970s and 1980s both British Steel and British Coal considerably increased their average
productivity. This sounds fine until one realizes that both corporations were contracting
fast—closing downplants and throwingmany people out of work. Productivity rose as fewer
and fewer steel plants/coal mines—the most modern and productive ones—were left.
Improving efficiency has attracted an enormous amount of management attention in
every public sector covered by this book. Yet the available evidence of efficiency gains is
patchy and incomplete. There are a number of comparative international tables of gov-
ernment efficiency, but most of them are poor measures of input/output ratios as we
defined them in Figure 5.1 (Van de Walle, 2006 offers a good critical overview). Take, for
example, a 2008 Working Paper of the International Monetary Fund, bearing the
promising title Determinants of Government Efficiency (Hauner and Kyobe, 2008). It comes
140 RESULTS: THROUGH A GLASS DARKLY
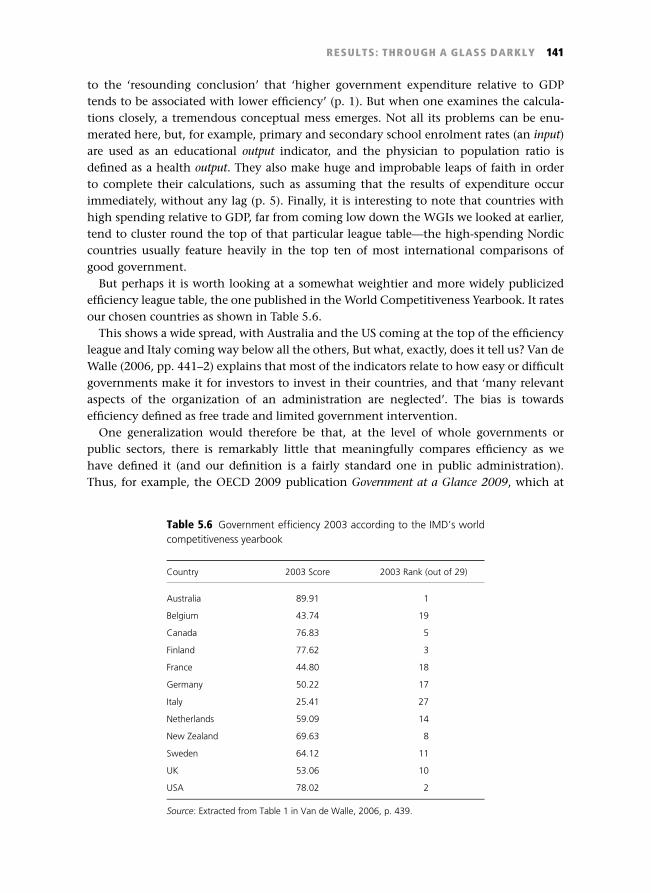
to the ‘resounding conclusion’ that ‘higher government expenditure relative to GDP
tends to be associated with lower efficiency’ (p. 1). But when one examines the calcula-
tions closely, a tremendous conceptual mess emerges. Not all its problems can be enu-
merated here, but, for example, primary and secondary school enrolment rates (an input)
are used as an educational output indicator, and the physician to population ratio is
defined as a health output. They also make huge and improbable leaps of faith in order
to complete their calculations, such as assuming that the results of expenditure occur
immediately, without any lag (p. 5). Finally, it is interesting to note that countries with
high spending relative to GDP, far from coming low down the WGIs we looked at earlier,
tend to cluster round the top of that particular league table—the high-spending Nordic
countries usually feature heavily in the top ten of most international comparisons of
good government.
But perhaps it is worth looking at a somewhat weightier and more widely publicized
efficiency league table, the one published in the World Competitiveness Yearbook. It rates
our chosen countries as shown in Table 5.6.
This shows a wide spread, with Australia and the US coming at the top of the efficiency
league and Italy coming way below all the others, But what, exactly, does it tell us? Van de
Walle (2006, pp. 441–2) explains that most of the indicators relate to how easy or difficult
governments make it for investors to invest in their countries, and that ‘many relevant
aspects of the organization of an administration are neglected’. The bias is towards
efficiency defined as free trade and limited government intervention.
One generalization would therefore be that, at the level of whole governments or
public sectors, there is remarkably little that meaningfully compares efficiency as we
have defined it (and our definition is a fairly standard one in public administration).
Thus, for example, the OECD 2009 publication Government at a Glance 2009, which at
Table 5.6 Government efficiency 2003 according to the IMD’s world
competitiveness yearbook
Country 2003 Score 2003 Rank (out of 29)
Australia 89.91 1
Belgium 43.74 19
Canada 76.83 5
Finland 77.62 3
France 44.80 18
Germany 50.22 17
Italy 25.41 27
Netherlands 59.09 14
New Zealand 69.63 8
Sweden 64.12 11
UK 53.06 10
USA 78.02 2
Source: Extracted from Table 1 in Van de Walle, 2006, p. 439.
RESULTS: THROUGH A GLASS DARKLY 141
the time of writing is probably the most comprehensive and careful comparative attempt
to measure government activities, contains virtually no measures directly comparing
inputs and outputs.
As we move from the country level to the programme level, and even more to the level
of individual organizations or activities, the picture improves. Sweden, for example, was a
pioneer in developing productivity studies. In a series of studies their Ministry of Finance
concluded that there had been:
a huge plunge in productivity starting in 1960 and continuing up to 1980, [then . . . ] a continued
productivity decrease 1980–90 in the public sector as a whole but at a much more modest rate—0.3
percent per year. In the central government sector there was in fact an increase in productivity of 0.6
per cent per year. (Budget Department, 1997, p. 7)
Within these general trends, however, the investigations found big differences between
particular agencies and services. For example, over the period 1980/1 to 1991/2, the
Companies Department of the Patent and Registration Office increased its productivity
by 84 per cent, but the productivity of the main Patent Department in the same organiza-
tion fell by 29 per cent (p. 63). This report should alert us to the fact that, even where
robust aggregate efficiency measures can be found for a country, they are likely to conceal
big variations between individual organizations, and that those who wish to reproduce
successful reforms would be well advised closely to investigate the reasons for those
variations.
Turning to the micro level, let us now, for illustrative purposes, examine one of the
relatively rare high-quality, independent scholarly studies of a measured improvement in
efficiency. Kelman and Friedman (2009) focused on the attempt within the UK National
Health Service to reduce waiting times in hospital accident and emergency (A&E) depart-
ments. They were especially concerned to see whether the apparent improvements
brought about by a vigorous targeting regime had also led to dysfunctional ‘side’ effects.
The specific target they investigated (one amongmany—see Pollitt et al., 2010) was that in
A&E departments 98 per cent of all patients would be treated within four hours of arrival.
Surveying 155 hospital trusts they found that the percentage achieving this target was 1.24
per cent in the third quarter of 2002 but had risen to 59.4 per cent by the third quarter of
2007. This very marked improvement was attributed to the government campaign, com-
mencing at the beginning of 2003, which featured the target as part of an overall system
for publicly rating hospitals as having three, two, one, or zero ‘stars’, and which later
offered hospitals cash incentives for meeting the target. No evidence of any dysfunctional
effects were found.
This was a particularly sophisticated, detailed, and careful study. It demonstrated,
beyond reasonable doubt, that waiting times were dramatically reduced, and that certain
kinds of possible dysfunctions did not appear to take place. Yet even here, there is room for
controversy—the contestability referred to in the second of the quotations which opened
this chapter has not entirely vanished. To begin with—as Kelman and Friedman them-
selves footnote—‘both budgets and staffing for the NHS, including A&E departments,
increased significantly during this period . . . and we do not claim that all the overall
improvement reflected in performance was due to attention to the target’ (p. 929). So
perhaps this was not wholly or even mainly an efficiency improvement, because better
142 RESULTS: THROUGH A GLASS DARKLY
outputs were partly or wholly explained by more inputs. More seriously though, close to
the time that the Kelman and Friedman article was published, so was the report of an
inquiry into events at Mid Staffordshire NHS Foundation Trust (Healthcare Commission,
2009). This trust hospital had come into the news because of extraordinarily high
mortality rates, and evidence of widespread dissatisfaction among patients. The Health-
care Commission concluded, inter alia, that ‘there were deficiencies at virtually every
stage of the pathway of emergency care’, and that ‘Doctors were moved from treating
seriously ill patients to deal with those with more minor ailments in order to avoid
breaching the four-hour target’ (Healthcare Commission, 2009, p. 129). Over a three-year
period Mid Staffordshire had suffered between 400 and 1,200 more patient deaths than
would have normally been expected. So we seem to have two studies, each thorough,
pointing in different directions. On the one hand, an academic statistical analysis of 155
hospital trusts finds ‘no evidence for any of the dysfunctional effects that have been
hypothesized in connection with this target’ (Kelman and Friedman, 2009, p. 917), while
on the other hand, a detailed official review, based on extended investigation ‘on the
ground’ (300 interviews and 1,000 documents) finds plenty of evidence of just such
distortions and dysfunctions. Of course, one could say that Mid Staffordshire was only
one hospital trust out of 155, and was quite exceptional. One could also point out that
the big improvement in national average waiting times in A&E had presumably saved an
unquantified number of lives. On the other hand, 400–1,200 excess deaths is rather a
large exception and, at the very least, points to the limitations of a purely statistical
approach to organizational analysis. A later detailed inquiry into Mid Staffordshire con-
cluded that ‘there can no longer be any excuse for denying the enormity of what has
occurred’, and that ‘a high priority was placed on the achievement of targets, and in
particular the A&E waiting time target. The pressure to meet this generated a fear,
whether justified or not, that failure to meet targets could lead to the sack’ (Francis,
2010, pp. 3 and 16). Mid Staffordshire seems to have been an unusually tragic example
of—in our terms—true effectiveness being abandoned in the pursuit of a particular kind
of measured efficiency.
Other examples of efficiency gains are less complicated—and much less consequential.
So, for example, the UK Social Security Child Support Agency reduced its cost per cleared
application by 37 per cent between 1993/4 and 1994/5. Over the same period the UK
Employment Service reduced its cost per placed unemployed person by 7.2 per cent (see
Chancellor of the Duchy of Lancaster, 1997, respectively pp. 128 and 65). Under the
impact of the Kinnock reforms, the European Commission reduced the average number
of days it took to make payments from 54 in 1999 to 42.9 in 2003 (Ellinas and Suleiman,
2008, p. 713). And so on. These are the kind of unsung but cumulatively significant
efficiency gains which public management reforms are delivering all the time.
5.6 Increasing effectiveness
If good aggregate measures of efficiency are rare at the level of a whole country (section
5.5, above) then measures of country effectiveness are an endangered species. New
RESULTS: THROUGH A GLASS DARKLY 143
Zealand is a case in point. Certain outcomes—both positive and negative—were observ-
able in the period of the great management reforms of 1986–92 (see Appendix B: New
Zealand, country file). Unemployment reached new heights and then, in the early 1990s,
dropped. Inflation also rose and fell. Crime and youth suicides rose. And so on. But were
these the results of management reforms, or policy changes, or changes in external
circumstances (the continuing dynamic of the global economy), or some mixture of all
three? As it happens, New Zealand was a country that built up an unusually sophisticated
system of performance measures for its public services. Yet most of these measures were
of outputs, not outcomes.
Attribution problems of this kind are present in almost every country. In Australia, for
example, the 1992 evaluation ofmanagement reforms concluded that ‘the new framework
has strong support and is seen, overall, to have increased the cost effectiveness of the APS
(Australian Public Service) including outcomes for clients’ (Task Force on Management
Improvement, 1992, p. 52). However, closer inspection shows that the causal link sug-
gested here was far from proven, and, in another part of the very same report, a rather
different emphasis is given:
since the reforms took place at a time of rapid social and economic change, there is no definitive
way of separating the impact on cost, agency performance and clients (among other things) of these
broader changes and the government changes which accompanied them. (Task Force on Manage-
ment Improvement, 1992, p. 8)
Real and substantial gains in effectiveness are often associated with innovations in man-
agement approach. Donahue (2008) reports on a successful reform in the Maine office of
the US Occupational Safety and Health Administration (OSHA). The State of Maine had
rather a poor safety record, and ‘continued downward pressure on its budget and work-
force’ meant that by the mid 1990s ‘OSHA and its state affiliates had fewer than 2,000
inspectors to enforce job safety and health regulations at more than 6 million workplaces’
(Donahue, 2008, p. 96). At this point the Maine office devised a new strategy, which
offered companies a choice. Either companies remained subject to a conventional inspec-
tion, as before, with violations commonly being found and fines being levied, or they
chose a new regime. In the new regime companies were to develop their own comprehen-
sive safety plans—in consultation with OSHA and with their own workers. Out of 200
Maine companies, 184 chose this new option. Spending by the companies to reduce
hazards went up (including in areas where OSHA would not have had jurisdiction to
require changes), and most participating companies experienced reduced rates of work-
place injury and illness.
5.7 Enhancing citizen satisfaction and trust
Another way of conceiving ‘results’ or impacts is to use citizens as final arbiters, and to ask
them to say how good or bad particular services are. Many public services now routinely
sample their users’ views of the services they have received. One particularly interesting
exercise has taken place in Canada, where in 1998 a mail survey of 2,900 Canadian
144 RESULTS: THROUGH A GLASS DARKLY
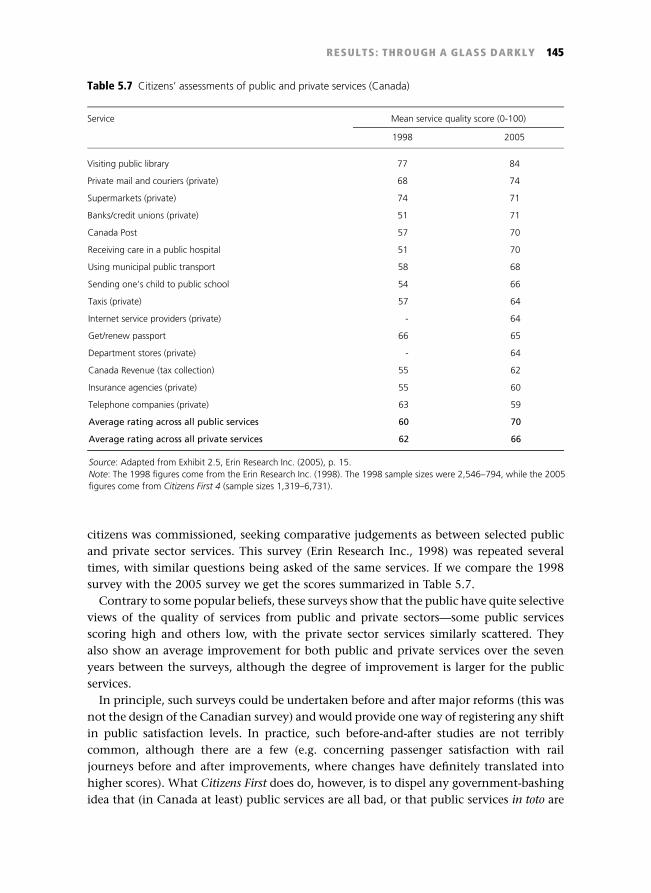
citizens was commissioned, seeking comparative judgements as between selected public
and private sector services. This survey (Erin Research Inc., 1998) was repeated several
times, with similar questions being asked of the same services. If we compare the 1998
survey with the 2005 survey we get the scores summarized in Table 5.7.
Contrary to some popular beliefs, these surveys show that the public have quite selective
views of the quality of services from public and private sectors—some public services
scoring high and others low, with the private sector services similarly scattered. They
also show an average improvement for both public and private services over the seven
years between the surveys, although the degree of improvement is larger for the public
services.
In principle, such surveys could be undertaken before and after major reforms (this was
not the design of the Canadian survey) and would provide one way of registering any shift
in public satisfaction levels. In practice, such before-and-after studies are not terribly
common, although there are a few (e.g. concerning passenger satisfaction with rail
journeys before and after improvements, where changes have definitely translated into
higher scores). What Citizens First does do, however, is to dispel any government-bashing
idea that (in Canada at least) public services are all bad, or that public services in toto are
Table 5.7 Citizens’ assessments of public and private services (Canada)
Service Mean service quality score (0-100)
1998 2005
Visiting public library 77 84
Private mail and couriers (private) 68 74
Supermarkets (private) 74 71
Banks/credit unions (private) 51 71
Canada Post 57 70
Receiving care in a public hospital 51 70
Using municipal public transport 58 68
Sending one’s child to public school 54 66
Taxis (private) 57 64
Internet service providers (private) - 64
Get/renew passport 66 65
Department stores (private) - 64
Canada Revenue (tax collection) 55 62
Insurance agencies (private) 55 60
Telephone companies (private) 63 59
Average rating across all public services 60 70
Average rating across all private services 62 66
Source: Adapted from Exhibit 2.5, Erin Research Inc. (2005), p. 15.
Note: The 1998 figures come from the Erin Research Inc. (1998). The 1998 sample sizes were 2,546–794, while the 2005
figures come from Citizens First 4 (sample sizes 1,319–6,731).
RESULTS: THROUGH A GLASS DARKLY 145
getting worse. Citizens First is notmethodologically perfect (in particular the response rates
are low—see Bruning, 2010)) but it has the great advantage of being longitudinal as well as
cross-sectional and, overall, is one of the best sources we are aware of for citizens’ assess-
ments of public services.
Elsewhere we have suggested that the relevant variables for service user satisfaction are
quite complex (Pollitt and Bouckaert, 1995). Much depends on the expectations of the
various parties concerned, and satisfaction levels may go up and down as much because
expectations vary as because the underlying ‘producer quality’ of the service changes.
Indeed, one strategy for a cynical government that is determined to raise satisfaction
scores might be to attempt to lower public expectations (which may almost have been
the case with some governments in certain instances—for state pensions for example).
Thus the measurement of perceived quality in public services is by no means just a
technical issue. It has political and psychological elements, and these make ‘satisfaction’
a moving target, something which may jump to a new position as soon as, or even before,
it is achieved.
Over the past few years, academic and practitioner interest in citizens’ views have
expanded from a (relatively) straightforward concern with how satisfied they were with
this or that service, to a more complex concern with issues of trust. ‘Trust’ has become a
focus for debate and rhetoric. It is widely assumed (and often explicitly claimed) that
citizen trust in government has been falling, and that something should be done about it.
Trust is thus treated like a result that needs to be improved, and reforming public services is
frequently said to be one important way of achieving this. If only there was more citizen
choice and participation, andmore responsiveness and flexibility on the part of the service
providers (the argument runs) then citizens would bemore inclined to trust the authorities
and believe that their taxes were being well spent. And if these better results were
measured and published, even those citizens who did not use a particular service would
be reassured that their taxes were not going to waste and that the public sector could be
relied upon.
Scholarly analysis casts several doubts on this version of events. Thomas (2009) offers a
deft summary of why ‘trust’ has become such a slippery term. One can distinguish
between ‘local trust’ (e.g. interpersonal trust) and ‘global trust’(e.g. trust in government).
One can distinguish between trust and confidence (although some researchers and survey
questions assume they are the same). Trust can be broken down into different compo-
nents—emotional/affective, cognitive (calculative), intentional, and behavioural. The
Harvard Business Review defines three types—strategic, personal, and organizational (Gal-
ford and Drapeau, 2003). Trust fluctuates over time—it is not fixed. Some scholars think
that ‘real trust’ always takes time to build up, whereas others think it can be created quite
quickly. Psychologists suggest that different individuals with different backgrounds have
different capacities for trusting. Some studies list more than fifty factors which are believed
to promote trust (Thomas, 2009, p. 223).
It is also worth mentioning that the popular assumption that trust levels have been
falling dramatically throughout the Western world may simply not be true. Such evidence
as is available does not seem to support such an assertion (Van de Walle et al., 2008). If we
look at Tables 5.8 and 5.9 we can see data from the World Values Survey and the
Eurobarometer.
146 RESULTS: THROUGH A GLASS DARKLY
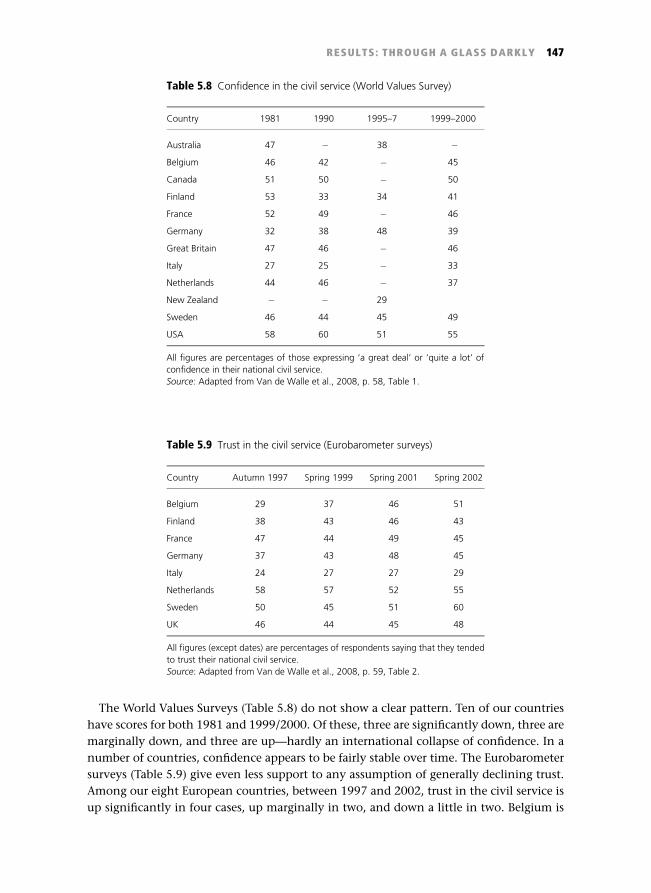
The World Values Surveys (Table 5.8) do not show a clear pattern. Ten of our countries
have scores for both 1981 and 1999/2000. Of these, three are significantly down, three are
marginally down, and three are up—hardly an international collapse of confidence. In a
number of countries, confidence appears to be fairly stable over time. The Eurobarometer
surveys (Table 5.9) give even less support to any assumption of generally declining trust.
Among our eight European countries, between 1997 and 2002, trust in the civil service is
up significantly in four cases, up marginally in two, and down a little in two. Belgium is
Table 5.8 Confidence in the civil service (World Values Survey)
Country 1981 1990 1995–7 1999–2000
Australia 47 � 38 �Belgium 46 42 � 45
Canada 51 50 � 50
Finland 53 33 34 41
France 52 49 � 46
Germany 32 38 48 39
Great Britain 47 46 � 46
Italy 27 25 � 33
Netherlands 44 46 � 37
New Zealand � � 29
Sweden 46 44 45 49
USA 58 60 51 55
All figures are percentages of those expressing ‘a great deal’ or ‘quite a lot’ of
confidence in their national civil service.
Source: Adapted from Van de Walle et al., 2008, p. 58, Table 1.
Table 5.9 Trust in the civil service (Eurobarometer surveys)
Country Autumn 1997 Spring 1999 Spring 2001 Spring 2002
Belgium 29 37 46 51
Finland 38 43 46 43
France 47 44 49 45
Germany 37 43 48 45
Italy 24 27 27 29
Netherlands 58 57 52 55
Sweden 50 45 51 60
UK 46 44 45 48
All figures (except dates) are percentages of respondents saying that they tended
to trust their national civil service.
Source: Adapted from Van de Walle et al., 2008, p. 59, Table 2.
RESULTS: THROUGH A GLASS DARKLY 147
interesting as a country that has risen enormously, but the first, 1997, measure was taken
during the national trauma over the failure of the police and judicial services to deal with
the paedophile, Marc Dutroux.
However, to return to our previous point, one political claim has been that it will be
possible to increase trust by displaying good performance (results)—irrespective of whether
trust was previously static, falling, or even increasing. Why is this claim doubtful? Con-
sider, for a moment, the conditions that would have to be fulfilled before this could be the
case. These conditions include the following:
1. The performance information would have to reach the citizen.
2. The performance information would have to be paid attention to by the citizen.
3. The performance information in question would need to show a good performance,
not a weak one. (Or, to be more precise, it would have to show a performance equal to,
or higher than, the public’s expectations—a highly variable and subjective standard.)
4. The performance information would have to be understood by the citizen.
5. The performance information would have to be trusted by the citizen.
Taken together, this is a very demanding set of conditions. The information we have
about how the public use performance information is very patchy, but that which there
is does not suggest that any of these stages is likely to be particularly easy. More
positively, we can say that actual, concrete experiences are often influential, whereas
the wider idea that, in the absence of personal experience, many citizens will read and
believe published official data (such as the Canadian Citizens First reports referred to
earlier in this section) is highly suspect. Citizens First 5 claimed that ‘service impact’
(citizens’ actual experiences of public services) had a strong impact on ‘confidence in the
public service’, and that, both directly and indirectly, it also influenced ‘confidence in
government’ (Erin Research, 2008, pp. 5–12). However, the authors of that report also
acknowledged the complexity of the subject (and note that they are here talking about
confidence, rather than trust):
confidence is based on experiences that accumulate in individuals over years anddecades. In general,
confidence measures change rather slowly. It is probably more difficult to build confidence than to
lose it—a single critical event can do considerable damage. (Citizens First 5, 2008, p. 9)
5.8 Beyond the production framework for performance:systems, capacities, orientations, visions
As we indicated earlier, the performance framework encapsulated in Figure 5.1 is cer-
tainly not the only way to think about results. Figure 5.1 envisages results as produced on
a kind of assembly line, but one can also see improvements in public management in
broader, possibly less mechanical, and sometimes more explicitly normative terms. The
aim becomes not higher measured efficiency or satisfaction but the creation of a particu-
lar type of relationship between state and society—a small state, for example, or an
148 RESULTS: THROUGH A GLASS DARKLY
administrative machine which is open and flexible instead of bureaucratic, or a public
administration whose culture is consistently to focus on the individual citizen’s needs.
Sometimes management reforms are ad hoc and functional. Sometimes they are emer-
gency measures, designed to stave off a crisis, real or anticipated. But there are also
occasions when management reforms are carried through with the aim of realizing some
larger vision of how things should be in some imagined future world. (And certainly there
are occasions when reforms, although they may also be driven by functional pressures, are
announced and clothed in terms of one of these ‘big ideas’—‘good governance’ or ‘ the big
society’, or whatever.) These imagined futures may be framed in very general terms, or in
more specific ways, but they serve a useful function as rallying points and guidance for the
faithful and as siren calls to the as-yet agnostic. In terms of the trajectories discussed in
Chapter 4 they are highly normative omegas, which may or may not be accompanied by
plans for how to get from here to there. They are a desired result, but in a much larger and
more diffuse sense than the outputs and outcomes we have mainly been discussing up
until now.
There was certainly something of this visionary element to Mrs Thatcher’s reforms,
encapsulated in the phrase from her 1979 election manifesto, ‘Rolling back the state’.
There was a similarly vivid (and almost certainlymore coherent) vision informing the New
Zealand reforms of 1984–94 (Boston et al., 1996, pp. 3–6). No one could accuse Vice
President Gore of being without a vision for the NPR—many publications elaborate on
the theme of reinventing government so that it ‘works better and costs less’.
In other countries the vision was perhaps less strongly enunciated, less combative
towards the status quo ante, but there were nonetheless elements of idealism and futuristic
imagery. The Finnish government recommitted itself to a combination of democracy and
egalitarianism (High Quality Services, Good Governance and a Responsible Civic Society,
1998a). The new 1994 ‘purple coalition’ in the Netherlands committed itself to the
‘primacy of politics’, and the reining-in of unaccountable quangos (Roberts, 1997). In
Germany one might say that there was at first a conscious rejection of ‘fashions and fads’
in favour of the virtues of the existing system (Derlien, 1998), and then, at the end of the
long Chancellorship of Helmut Kohl, a brief flirtation with the vision of a ‘lean state’
(though in practical terms it did not come to much). In Belgium, the new ‘purple–green’
coalition from 2000 launched a modernization process, called ‘Copernicus’, referring to a
fundamental change based on a vision.
Of course, academics adore ideal models and utopian visions. They (we) take an intense
interest at the merest whiff of a new ‘paradigm’, and tend to react by polishing, system-
atizing, and elaborating the fragmentary visions proclaimed by political leaders, so as to be
able to analyse them—and subsequently often to damn or praise them. Politicians, on the
other hand, usually have the street-wisdom to cast their references to the desired future in
rather more vague, malleable, and ambiguous terms. The purposes and skills of the two
groups are different. Since we are academics rather than politicians it will come as no
surprise when we say that the ‘teasing out’ of visions can be a useful and illuminating
exercise. This is not the place to do justice to all the various schemata which have been
offered (though we have already introduced the NPM and the NWS) but it may be helpful
to pause long enough to look at one example.
RESULTS: THROUGH A GLASS DARKLY 149
Peters (1996b) suggests that four main visions may be identified within the national and
international rhetorics of public management reform:
� The market model, which holds out the prospect of extensive privatization and therefore
of a much smaller public sector—and one that will itself be infused with market-type
mechanisms. Citizens become consumers and taxpayers, the machinery of government
shrinks to a policymaking, lightly regulatory, and contract-letting core. This corresponds
to the ‘NPM group’—those countries which we identified as having a marketizing
trajectory in the concluding section of Chapter 4.
� The participatory state, which lays great emphasis on the empowerment and participa-
tion of citizens in the running of ‘their’ administration. Like the market model, it
envisages radical decentralization and a sharp move away from bureaucratic hierar-
chies. Unlike the market model, it is suspicious of the divisive and inegalitarian
features of competitive markets and confident of citizens’ ability and willingness to
play a more creative part in their own governance. We would see this model as
corresponding with the ‘northern Europeans’—the NWS modernizers of Finland, Swe-
den, and the Netherlands.
� Flexible government, which is opposed to the rigidities and conservatism attributed to
permanent organizational structures and individuals with permanent, highly secure
careers. The remedy is a ‘temporary state’, with shifting squadrons of adaptable and re-
adaptable organizations, each purpose-built to address the most salient issues in the
current, but rapidly changing environment. Advanced information technology is fre-
quently seen as a major force in this new state of affairs, which can be represented as less
‘doctrinaire’ or ‘ideological’ than either the market model or the vision of participatory
government (Bellamy and Taylor, 1998; Hudson, 1998). The temporary state is likely to
be an extensively contract-based phenomenon. There is no one group of countries
which we would suggest as exemplars of this particular vision. Rather it appears as a
subsidiary element in many reform programmes, but probably more so in the NPM
group of countries than the NWS group (and least so among the ‘central Europeans’—
Belgium, France, and Germany).
� Deregulated government. This vision is built on the assumption that the public service and
its organizations are full of creative ideas, relevant experience, and well-motivated
people—if only they can be released from the heavy constraints of bureaucratic regula-
tions. This vision is perhaps the least widespread of the four, being mainly confined to
those—such as public service unions and professional groups—who share its optimism
about the character and motivation of civil servants. It is essentially a version of the
modernized state, but rather different from the participatory state described above.
Again, it is seldom the sole or dominant element in reform programmes, but can play
an important subsidiary role, perhaps especially in the more heavily bureaucratized
countries of continental Europe.
As Peters makes clear, each of these visions has aspects of silence or even incoherence,
lying quietly alongside its ‘headline’ messages. That none of the four has been implemen-
ted in a pure way will come as no surprise, given the constraints on radical change
identified in Chapters 2 and 3. Nevertheless, in certain countries the ‘flavour’ of one
150 RESULTS: THROUGH A GLASS DARKLY
dominant model can be tasted in the key speeches and documents of reform. Thus the
New Zealand reforms clearly owed much to micro-economic thinking that favoured a
market model (see Appendix B: New Zealand, country file). The Finnish reform documents
lean more towards the participatory model: ‘earlier administrative reforms have been
experienced to have increased the bureaucracy of administration. The government
wants to ensure the democratic development of the policy of governance’ (High Quality
Services, Good Governance and a Responsible Civic Society, 1998a, p. 8). The Belgian Coperni-
cus programme placed great emphasis onmodernizing personnel management and releas-
ing civil servants from the shackles of outdated bureaucratic procedures (Appendix B,
Belgium country file).
Let us take a moment to look more closely at two examples of these popular visions—
first, the idea of a new,more participatory, citizen-friendly administration and, second, the
idea of ‘joined-up government’. First, then, the notion of putting clients, customers, users,
patients, passengers (or whatever) first has been given tremendous rhetorical emphasis in
many jurisdictions and inmany countries. The NPR in the USA, the Citizen’s Charter in the
UK, the 1994 French programme Annee de l’accueil dans les services publiques, the Belgian,
Italian, Portuguese, and Finnish service charters, and more—all claim to increase client
orientation. Furthermore, modern quality-improvement techniques such as TQM are
founded on the centrality of customer requirements, and have been introduced in parts
of the Australian, Belgian, Canadian, Dutch, Finnish, French, New Zealand, Swedish, UK,
and US public sectors, as well as being promoted by some parts of the European
Commission.
However, achieving a client orientation is not straightforward. While the UK Citi-
zen’s Charter, which was strongly driven from the centre of government, made some
impact, its Italian equivalent quickly faded out (Schiavo, 2000). Or consider the case
of the reforms to the Australian Public Service (APS). A 1992 survey of Australian
citizens indicated that 73 per cent of those who had had prior contact with a given
agency thought its quality of service had remained the same, and 26 per cent thought
it had changed (about three-quarters of whom thought it had changed for the better).
At the same time members of the Australian Senior Executive Service (SES) were
asked whether they thought that the reforms had led to an increased client focus,
and 77 per cent said they thought it had. Only 51 per cent of lower grade staff were of
the same view. This—and other evidence within the same report—shows a compli-
cated picture in which perceptions of client emphasis and of quality improvements
depend to some extent on where the respondent sits. The senior staff appear to
be more optimistic than more junior staff, while only a minority of citizens notice
much difference.
Much depends on the expectations of the various parties concerned, and satisfaction
levels may go up and down as much because expectations vary as because the underlying
‘producer quality’ of the service changes. Thus the measurement of perceived quality in
public services is by no means just a technical issue. It has political and psychological
elements, and these make ‘satisfaction’ a moving target, something which may jump to a
new position as soon as, or even before, it is achieved.
RESULTS: THROUGH A GLASS DARKLY 151
Our second ‘vision’ is that of joined-up government, or ‘integrated public governance’
(6, 2004; Bogdanor, 2005; Kernaghan, 2009b). The basic idea here sounds quite simple, but
its practical manifestations can easily become rather complicated. The vision is that in an
‘integrated’ or ‘joined-up’ system, on the ‘demand’ side citizens will be able to go to one
place to access a wide range of public services, and on the ‘supply side’ different agencies of
government—at all levels—will work together so that policies and programmes do not
contradict or duplicate each other. Gaps between different programmes (e.g. between
hospital care for episodes of acute illness and the subsequent social care provided to
discharged but still frail patients at their homes) will be managed away. In its most
ambitious form joined-up governance also includes non-profit and commercial organiza-
tions that are involved in delivering public services, so that the whole ensemble moves
sweetly and smoothly together, without ‘turf wars’ between different department—or
between central and local government—and without citizens having to give the same
information to different parts of government more than once, or needing to go to more
than one website or office. Furthermore, the whole process can be facilitated and speeded
up by the wonders of modern ICTs. They enable managers to practise ‘disintermedia-
tion’—the stripping out or radical simplification of the sometimes long chains of inter-
mediaries involved in delivering public services (Dunleavy, 2010).
Who could possibly be against such a sensible and convenient-sounding approach? It
is no surprise that echoes of the integration vision have been heard in many of our
countries—particularly Australia, Canada, Finland, New Zealand, and the UK, but also in
France, the Netherlands, and Sweden. Many specific changes have been made to try to
realize this vision (the Centrelink agency in Australia and Service Canada are two
prominent examples—see respective country files in Appendix B). Yet not all has been
plain sailing. As Bouckaert et al. (2010, pp. 25–32) note, the vision of integrating/joining-
up is but the latest manifestation of an age-old issue in public administration—coordina-
tion. And there are a number of common reasons why attempts at coordination may not
work:
1. Simple lack of interest by the agencies concerned—they continue to ‘plough their own
furrows’ and have no incentive to spend extra energy on joining-up.
2. Partisan politics, as when one agency is under the authority of a politician of one party
and the other is under the authority of another, e.g. Labour local authorities in the UK
which, during the 1980s did their best to slow down or undermine policies coming
down from Mrs Thatcher’s government in London.
3. Genuine differences of view between different professions and their agencies as to what
is the best way of tackling specific types of problem, e.g. teachers do not always agree
with social workers as to what is best for problem pupils.
4. Conflicting time scales or routines, so that agencies which are supposed to be making
joint commitments to cooperate find they have different budgeting or planning cycles,
or elections at different times, or other time-related procedures which make it hard to
enter into commitments at the same moment.
5. Different procedures and even different concepts of accountability. Some of those
involved may see their primary accountability as being direct to elected
152 RESULTS: THROUGH A GLASS DARKLY
representatives, while others are accountable to management boards, and others still to
professional associations and standards. The question of who is accountable when a
joined-up service involving several different agencies goes wrong can be both complex
and contentious.
Ultimately, therefore, there are a number of major difficulties in assessing visions and
systems improvements. First, there is a need to separate out the substance from the rhetoric,
a distinction which is often far from straightforward. Many government documents and
speeches, in several countries, have claimed a ‘system transformation’ of one kind or
another, only for closer empirical study to show that there has actually been high continu-
ity between the old and the new (e.g. Ingraham, 1997 on the US NPR; Pollitt, Birchall, and
Putman, 1998 on the British Conservative government’s decentralization reforms of the
late 1980s and early 1990s; more generally see Pollitt, 2002).
Thus, for example, the empirical basis for conclusions about cultural change at the
systems level is usually slender. The number of studies where researchers have been able
to measure broad shifts in attitudes and beliefs over time (essential to a full identification
of cultural shifts) is small indeed. Most of the limited number of works that do exist
measure at a single point in time and then hypothesize what the results imply for cultural
change (Rouban, 1995; Talbot, 1994). Nevertheless, such fragments as we have help to cast
some light on the claims that management reform has produced cultural change. A survey
of French civil servants, carried out in 1989, drew an interesting distinction between
professional values and broader social values. It then concluded that:
Professional values depend closely on the nature of the job and the strategic position within
ministerial circles. They can therefore evolve and can be improved with training. However, the
transformation of these values cannot be so great as to modify the global conception that civil
servants have of the relationship between public administration and political spheres, or the
ranking of social values which determine their professional success. One cannot change civil
servants’ social values through administrative reform. Such a change requires extra-professional
resources. (Rouban, 1995, p. 51)
This line of interpretation may help to explain why, in a number of jurisdictions, it has
seemed possible to change—for example—civil servants’ attitudes towards the ‘customer’,
butmuch less so other attitudes, such as a distrust of politicians or a scepticism towards the
benefits of MTMs within the public service. Rouban went on to argue that the perceived
legitimacy of administrative reforms varied up and down the hierarchy, usually being
highest with senior civil servants, but only so long as they could continue to control the
process of change itself. This finding of a variable adhesion to reforms, correlated with
rank and position, has been replicated in other countries also. A large survey of staff carried
out in conjunction with an Australian 1992 evaluation of the management reforms of the
previous decade found evidence that public servants at different levels exhibited signifi-
cantly different degrees of belief in the usefulness and impact of the reforms (Task Force on
Management Improvement, 1992). US federal staff exhibited significant levels of scepti-
cism towards the NPR and Government Performance and Result Act (GPRA) reforms of the
1990s (General Accounting Office, 2001).
There is an evenmore stubborn difficulty in assessing the claim that a systemhas acquired
greater flexibility, capacity, integration, and so on. How are these claims to be tested?
RESULTS: THROUGH A GLASS DARKLY 153
Presumably the counterfactual is the way that the old (previous) system would have tackled
the new circumstances and pressures. But that is a very difficult criterion to apply: who can
say exactly how the old system would have performed? Nor does it help that the most
prominent voices saying that the new system is better/worse are frequently insiders with
strong and obvious interests in conveying a picture of either progress or decline.
One of themost sophisticated attempts to improve capacity was the series of departmen-
tal Capability Reviews launched by the UK Cabinet Office from 2005. Within eighteen
months all seventeen major departments were reviewed using an advanced model of
capability that had ten elements, including several each in the areas of leadership, delivery,
and strategy. The direct costs to the Cabinet Office of conducting this major exercise were
£5.5M. Intensive follow-up procedures tracked departmental responses to aspects of their
work which had been found wanting, and significant improvements were recorded.
Undoubtedly, many beneficial changes resulted from this programme. Yet, when the
National Audit Office came to review it, they found that ‘Departments cannot yet show
any clear impact on outcomes’ (p. 8); that departments found it difficult to separate the
influences of the Capability Reviews from all the other changes going on at the same time;
and that there was a divergence between measured capability and departmental perfor-
mances as measured by the (separate) system of Public Service Agreements (National Audit
Office, 2009)
All in all, the category of transformatory vision and systems improvements, while
appealing in theory, is very hard to pin down in empirical practice. The dangers of
hindsight are considerable, and the risks of perceptions being distorted by a few salient
incidents or episodes are high. There is also a temptation to see change in an over-coherent
way—to presume that all the changes one sees were intentional, rather than forced or
accidental, and, further, to assume that they were related to each other within some overall
‘systems approach’ (this common bias is challenged at length in the intriguing book, The
Reforming Organization, Brunsson and March, 1993). It is also misleading to assume that
there are singular entities called ‘the public service culture’, or ‘public opinion about
reform’. As indicated above, such research as has been carried out conveys a more frag-
mented and variegated picture. Organizational cultures seem to depend to some signifi-
cant extent on role and rank, and they shift more quickly along some dimensions than
others, with some basic elements of social values which may be beyond the power of
reformers to change. As Hofstede (2001) indicates, the basic patterns of national cultures
probably change only very slowly – over generations rather than between elections. Public
opinion is also a complex issue, with no easy or straightforward link between the success of
reforms and the perceived legitimacy of the politico-administrative system. As for percep-
tions of better integration/joining-up, there seems to be little if any empirical work at the
level of whole systems. Some local studies indicate measurable improvements, but the big
picture remains obscure.
The most, perhaps, that one can say is that the politico-administrative system in some
countries appears to have undergone deeper change than in others. As is clear from
Chapters 3 and 4, high-change countries (in management terms) would include New
Zealand and the UK, and low-change countries would include Belgium and Germany
(although both underwent considerable change at subnational levels). The other
countries considered in this book are stretched out somewhere in between. Whether
154 RESULTS: THROUGH A GLASS DARKLY
the many innovations in the high-change countries are all to be considered as improve-
ments, however, is another question altogether. Some commentators, for example, clearly
believe that sticking with a strong existing system is better than playing around with
flawed and ephemeral fashions in management reform (Derlien, 1998; Pollitt, 2007).
To conclude this section, it might be said that, while visions play an important role in
shaping the rhetorical dimension of reform, it is hard to use them as a means of assessing
the results of the reform process. For the zealots, the ever-closer approximation of reality to
the vision is the abiding concern, but the zealots are usually few in number. Even the most
powerful spokespersons for a particular view are obliged to compromise and exercise
patience. Mrs Thatcher left the level of UK public spending only marginally different
from that which she had found in 1979. President Reagan bequeathed a huge public sector
deficit and a federal civil service little altered in size by his eight years at the helm.
President G. W. Bush, also an advocate of fiscal prudence and small government, presided
over the transformation of a federal surplus into a big deficit, and left an enlarged federal
workforce. The enthusiastic privatizers in the newDutch government of 1982 and the new
Swedish government of 1991 found that they could not transfer to private ownership
anything like as much of their respective public sectors as they had at first envisaged. For
the reasons developed in chapter 3 (and to be elaborated in chapter 7) purity of vision
must almost always be tempered with an understanding of political, economic, and
functional constraints and trade-offs. Therefore, even those who are advocates of a partic-
ular vision, and who wish to assess ‘results’ in terms of that vision, must make allowances
for the strength of the forces of tradition, inertia, and recalcitrance—for path dependency.
Sometimes the new vision looks surprisingly like some previous vision, but with a new
label. In such cases a longer historical view makes reforms look more like waves or cycles
around certain persisting ideas rather than new directions (Pollitt, 2008, pp. 59–74). Talk,
decisions, and actions frequently diverge. Our argument has been that the strength of
these forces depends to a considerable extent on the nature of the politico-administrative
regime in question, and the extent to which the new vision which is proposed cuts across,
or goes along with its grain.
5.9 Conclusions and reflections
5.9.1 Initial overview
This has been a long chapter but the conclusions may be briefly stated. First (Sections 5.1 to
5.3) ‘results’ may be looked for in different ways, in different places, and on different levels
and scales. Overall, one might say that at the time of writing the ‘results’ wineglass is half
empty—and half full. It is half empty because so often, following a reform, we still lack
details about confidently attributable outcomes, or about efficiency, or even just about
outputs. In some countries the ‘results and performance’ mindset is still little developed in
practice (e.g. Belgium or Italy) but in others it has reached high levels of intensity and
sophistication (e.g. Australia or the UK). Fifteen years ago one of us pointed out how patchy
the evaluation of NPM reforms then were internationally (Pollitt, 1995), and in 2010 it
RESULTS: THROUGH A GLASS DARKLY 155
remains the case that many major reforms—even in the ‘performance-minded’ countries—
are launched with little or no attention to evaluation (e.g. White and Dunleavy, 2010).
On the other hand the glass could be seen as half full. Certainly there is much more
performance data around than fifteen or twenty years ago, and more of it is in the public
domain. Whilst much of this is case-specific there is also rapidly increasing attention to
international comparisons. Some of these may be conceptually or methodologically weak
(see our earlier discussion of the World Bank’s WGIs) but others are more sophisticated
(e.g. the PISA educational scores—see Hautam€aki et al., 2008) or just more cautious and
detailed (e.g. the OECD’s Government at a Glance 2009).
For some commentators the most significant evidence lies in the ‘changed climate’, the
existence of new ‘talk’, and the promulgation of visions of privatization, marketization,
participation, deregulation, and flexibility. In short, the crucial evidence is the growth of a
new community of discourse, with its main production centres usually located in the
‘Anglo-Saxon’ countries and certain international organizations such as the OECD, the
IMF, the Commonwealth Secretariat, and the World Bank. For others the focus is the
record of decisions—the publication of White Papers and national review documents,
the enunciation of programmes such as citizens’ charters or Public Service 2000, and the
passing of laws decreeing administrative reform. Others, however, look for ‘hard’ evidence
in the form of actions and impacts. Most—though not all—of this chapter has been
devoted to that kind of search. It is itself a large domain, within which one may look for
macro-level effects or local impacts, for concrete outputs or longer-term outcomes, and so
on. One’s judgements on the achievements of reform are likely to vary considerably
according to which of these various types of result—and corresponding species of evidence
is given the greatest weight (Pollitt, 2002).
Where one looks is, in turn, influenced by where one sits. The three most obvious sitting
positions tend to generate rather different ‘vibrations’ about management reform. The
state apparatus itself, and particularly the political heads of department, tend to report
steady progress—everything is in hand and remaining issues are being vigorously ad-
dressed (e.g. Chancellor of the Duchy of Lancaster, 1997; Commonwealth Secretariat,
1993; Gore, 1996; Cabinet Office, 2008). Management consultants tend to focus more
on the future, on the potential of new techniques and systems to solve the perceived
problems of today. They do issue warnings, but these are usually about the constraints
which may inhibit progress rather than about the nature of that progress itself. This may
be considered understandable for a group the existence of which depends partly on the
membership being able to sell innovatory concepts and techniques. Academics are
undoubtedly the least optimistic of the three groups, worrying about what may be lost
as well as what is gained, expressing caution about long-term effects, and generally
hedging achievement claims with qualifications and critique (e.g. Boyne et al., 2003;
Derlien, 1998; Dunleavy and Hood, 1994; Ingraham, 1997; Pollitt and Bouckaert, 2003;
Radin, 1998, 2000).
There are also differences within each group. The differences among members of the
state elite itself are perhaps the most interesting, since this is the group that one might
suppose would be most likely to speak with one voice. One obvious divide is between
legislatures and executives. Another is between executives and independent audit offices
(with the latter, as is their role, being more critical). A third is within the executive itself,
156 RESULTS: THROUGH A GLASS DARKLY
between central finance departments (on the one hand) and operational departments (on
the other). One brief example may illustrate these differences of perspective.
In 1996 the President of the Canadian Treasury Board made an annual report to the
legislature, entitled Getting Government Right: Improving Results Measurement and Account-
ability (Treasury Board of Canada, 1996). The minister claimed that:
We have already achieved tangible results in this area. For example, modernizing the financial
management system, better reporting to Parliament, improving how we use information technol-
ogies, and adopting alternative ways of delivering government services. (Foreword)
However, when the Auditor General’s Office reviewed these documents they made a
number of strong criticisms, including:
[ . . . ] The President’s report does not distinguish evaluation from other forms of review [ . . . ] The
President’s report presents an overly optimistic picture of progress for an activity which is undergoing
major change and dealing with many important challenges [ . . . ] The Treasury Board should ensure
that its report to Parliament credibly represents the performance of review and includes specific
measures on evaluation. (Auditor General of Canada, 1997, sections 3.80, 3.83, 3.85, and 3.86)
At the same time a Parliamentary Working Group was considering the same documenta-
tion. In their own report they also expressed critical views:
One of the perceived shortcomings of these documents, as expressed by MPs, was the lack of
objectivity in the reporting. Many respondents suggested that it was inappropriate for departments
to be reporting on their own performance—the perceived result of which was ‘feel good’ documents
that said little about the true performance of the department. (Duhamel, 1996, p. 14)
To complete the circle, we might add that parliaments themselves—including the Cana-
dian one—have been less than exemplary in making use of performance data, even when
this has been supplied to them (Johnson and Talbot, 2007; Pollitt, 2006a). There has
perhaps been a tendency to succumb to the temptation of grabbing a few headlines by
highlighting unusual or extreme statistics, but not to work through, or try to understand,
the broad picture which is presented to them.
As for internal differences of perspective within executives, the European Commission
offers many examples of tensions between different Directorates General, some of which
involve management issues (e.g. Middlemas, 1995, pp. 247–55). The SEM 2000 and MAP
2000 initiatives, for example, were seen as coming mainly from the ‘horizontal’ parts of
the Commission—DGIX (personnel), DGXIX (budgets), DGXX (internal control), and the
Secretariat General. As such, aspects of the reforms were regarded with suspicion and were
slow-pedalled by certain ‘operational’ (‘vertical’) DGs, which regarded them as belonging
to someone else’s agenda, and potentially burdensome. Evidently, views of the Kinnock
reforms of 2002–6 also vary considerably among the Eurocrats (Ellinas and Suleiman,
2008).
Finally, we come to the academic community which is, of course, famous for its ability to
argue over how many angels may dance on the head of a pin. Views of reforms are no
exception. As indicated above, many academics are both critical and sceptical, perhaps
especially of NPM-type reforms. But others, more supportive of particular reforms, attack
RESULTS: THROUGH A GLASS DARKLY 157
these critics and accuse them of various crimes, such as lacking theoretical rigour, using
‘primitive’ methods, or even displaying ‘cranky skepticism’ (e.g. Kelman, 2007, 2008).
5.9.2 Data, criteria, attribution
The foregoing sections have been peppered with references to the incomplete, ambigu-
ous, or downright inadequate state of the available data. It is also clear that data
availability varies sharply according to how one defines ‘results’. To return to the distinc-
tions we made in Chapter 1 (see Table 1.2) the records of results talk are voluminous, and
the analyst’s problems are mainly to do with information overload. The records of
decisions concerning results (target-setting, the creation of performance management
procedures) are also very extensive. The situation with the practice of results-based
management is more complex. The available information on inputs, savings, process
improvements, and outputs is vast. There can be little doubt that, in many public sector
organizations in many countries, the work process has intensified: more measured out-
puts are being generated per pound spent or per member of staff employed. Not all of this
information may be entirely reliable, but it would take a giant dose of cynicism to arrive
at the conclusion that nothing had changed, and that the productivity of specific
organizations had remained static.
Where the information begins to get thin is at the two next stages. First, what have been
the costs of the many measured improvements in productivity, in terms of other activities
foregone, stress, and reduced loyalty or commitment among the public sector workforce,
loss (or gain) of trust by the public, and so on? In most cases there are few answers here:
these hidden costs could be very high or very low, and there could also be hidden benefits,
which the bald statistics of productivity fail to capture.
More importantly, however, information about what may be regarded as the final
stage—the ultimate outcomes of all the reform talk, decision-making, and action on
society at large—is both sparse and ambiguous. As we said earlier, results lead to more
results, and it is the search for the final, end results in this chain—the ‘final outcomes’ as
they are sometimes referred to in the literature—that is most difficult. This is partly
because most governments do not seem to have looked very vigorously for this type of
information, but partly also because such information is difficult and expensive to collect,
and then hard to interpret.
There is therefore something of a paradox at the heart of the international movement
in favour of performance-oriented management reform. The reformers insist that public
sector organizations must reorient and reorganize themselves in order to focus more
vigorously on their results. They must count costs, measure outputs, assess outcomes,
and use all this information in a systematic process of feedback and continuous
improvement. Yet this philosophy has clearly not been applied to many of the reforms
themselves, which thus far have been evaluated only occasionally, and usually in ways
that have some serious methodological limitations (Pollitt, 1995; Pollitt and Bouckaert,
2003).
Finally, it may be observed that information itself means little until it is combined with
some criterion. An increase of 5 per cent may be good if the criterion for success is an
158 RESULTS: THROUGH A GLASS DARKLY
average increase elsewhere of 2 per cent, but poor if the average elsewhere is 8 per cent.
Contracting out refuse collection may be deemed a success if the criterion to be applied is
cost per bag collected but thought to be a problem if the criterion is promoting equal
opportunity of employment. The main point here is that there is often room for debate
about which criteria are the most appropriate and, in any case, there seem to be fashions
for particular criteria or measures, which come and go. Indeed, there is quite a persuasive
theory that suggests that this kind of change over time is necessary, to prevent particular
performance indicators getting ‘worn out’ and becoming the target for excessive gaming
and manipulation (Meyer and Gupta, 1994):
a number of factors, especially the tendency of performance measures to run down or to lose the
capacity to discriminate good from bad performance, trigger ongoing creation of new performance
measures different from and therefore weakly correlated with existing measures. (Meyer and
Gupta, 1994, p. 309; see also de Bruijn, 2002)
5.9.3 Who needs results?
Onemildly controversial conclusion can be drawn from the foregoing. It is that, if ‘results’
are defined in a narrow way as scientifically tested data describing the final outcomes of
changes, then the international management reform movement has not needed results to fuel its
onward march. This will come as no surprise to analysts who stress the symbolic and
rhetorical dimensions of politics and institutional life (Brunsson, 1989; Brunsson and
Olsen, 1993; Hood, 1998, 2005; March and Olsen, 1995; Power, 1997). Nevertheless it
does represent what might politely be termed a discontinuity within some of the para-
digms used by the proponents of reform themselves—particularly the hard-edged, perfor-
mance-driven visions of core NPM enthusiasts and, more recently, the ‘doing more with
less’ rhetoric of politicians and officials faced with implementing large, recession-induced
public-spending cuts.
Equally, ‘results’ of another kind are needed to maintain the momentum of reform. A
continuing high level of production of talk and decision-making is probably essential.
Until now, the flow of White Papers, charters, and ‘new initiatives’ has been unceasing
since the early 1980s. Every country has to have a reform programme of some sort, or at
least to be seen to be discussing one. One may ask whether this procession of talk and
decision is now a permanent feature of governance, or whether it is conceivable that the
flood tidemay begin to ebb? If public management reform did fall from fashion that would
not imply that institutions would cease to change. It would simply mean that reforms
were no longer so newsworthy—they would resume the status of technical adjustments,
which is what they were mainly seen as during some periods in the past.
5.9.4 Regimes, trajectories, and results
Finally, we should askwhat are the connections between the politico-administrative regimes
described in Chapter 3, the reform trajectories chosen by different jurisdictions and com-
mented upon in Chapter 4, and the picture of ‘results’ put together here in Chapter 5?
RESULTS: THROUGH A GLASS DARKLY 159
In an ideal world the regime types would influence the reform trajectories, and evidence
would show that given trajectories led to specified but different mixtures of results. The
connectingmechanisms or processes (whatworks andwhat doesn’t)would also be clear, and
the would-be reformer could thus inspect the local regime and then choose a reform trajec-
tory which would generate the mix of benefits and costs which s/he most desired.
Unfortunately neither we nor anyone else can ‘fill in’ all the spaces in this ideal model.
Chapter 4 did show that some broad connections could be established between types of
politico-administrative regime and the choice of reform trajectories. Even those links were
subject to exceptions and deviations, temporary or otherwise. However, there is then a
considerable ‘disconnect’ between trajectories and results. The record does not permit
confident and specific statements to be made concerning the different mixtures of results
that will be harvested from each main trajectory. On the contrary, there are conflicting
claims, with advocates advancing the respectivemerits of different models and approaches
(Derlien, 1998). These arguments are only occasionally backed up by results data, and,
when they are, the attribution of effects is usually disputable.
On the other hand, it would be wholly mistaken to draw the conclusion that public
management reform was a meaningless charade, played only by the cynical or the stupid.
On the contrary, it is absolutely clear that many of the changes made have carried definite
‘payoffs’ for particular groups and individuals, even if longer-term outcomes remain
comparatively obscure. To explore these issues further requires, first, a disaggregation of
the ‘players’, and, in particular, a further examination of the role of management reform at
the interface between politics and management. This will be undertaken in the next
chapter. It also requires the development of a closer analysis of some of the trade-offs
and paradoxes which have come to light in Chapters 4 and 5. They will be the subject of
Chapter 7. Finally, in Chapter 8, it will be possible to return to the overarching question of
the likely connections between different reform strategies and their consequences for
relations between politicians, public servants, and the rest of society.
160 RESULTS: THROUGH A GLASS DARKLY
6 Politics and management
The dividing line between the political and the apolitical has been shifting in the
direction of the political, and more positions that once would have been off limits
for political tampering are now clearly subject to political pressures and appointments.
We may well debate the desirability and efficacy of this change, but it does appear to
have become a reality of modern government.
(Peters and Pierre, 2004)
6.1 Forwards to the past?
At this point we shift gear. In Chapters 2, 3, 4, and 5 we have been engaged in building a
model of the process of management reform, classifying key contextual features which
differentiate one country’s regime from another, identifying alternative trajectories for
change and examining the evidence as to the results of this change. Each of these chapters
has therefore been intended to help build up a general picture of what has been happen-
ing—in word and in deed—in the world of public management reform. In the remainder
of the book, however, we stand back from this picture in order to reflect upon and interpret
some of its broader features. We shift mood from construction towards deconstruction,
from creating an accurate and convincing depiction towards exploring its contradictions
and acknowledging its limitations.
From the outset we have argued that public management cannot be adequately com-
prehended without reference to the crucial relationships which exist between administra-
tion and politics, and between administrators and politicians. In making this point we are
just one more member of a large chorus (e.g. Flynn and Strehl, 1996; G€otz, 1997, p. 753;
Lynn, Heinrich, and Hill, 2001; Hood and Lodge, 2006; Peters and Pierre, 2004). However,
while there is wide agreement that this frontier is an important one, there appear to be
varying opinions as to what is taking place along the borderlines. Some have seen ‘man-
agement’ (in the sense of modernized public administration plus privatization) invading
politics and taking over slices of political territory (e.g. Clarke and Newman, 1997; Pollitt,
1993, chapter 1; Stewart, 1994). Others, in apparent contrast, suggest that management
reform has been a vehicle by which executive politicians have gained a tighter grip of their
officials (Halligan, 1997; Peters and Pierre, 2004).
At this point it may be useful to examinemore closely the concept of a ‘frontier’ between
management and politics. This frontier is related to, but by no means necessarily identical
with, the boundary between civil servants and politicians. According to most contempo-
rary definitions, ‘politics’ is not limited to certain persons (elected politicians) or
to specialized arenas in which an action takes place (Parliament, ministerial offices,
‘smoke-filled rooms’, etc.). More commonly, politics is defined by the processes involved.
In particular, political activity is that which involves the exercise of power, especially the
mobilization of various kinds of resources in order to achieve a chosen set of ends in a
situation where the interests of the various parties concerned potentially or actually
conflict (Leftwich, 1984). Thus, even public servants in Westminster-type systems,
though they may remain ‘neutral’ and scrupulously avoid ‘party politics’, nevertheless
frequently engage in ‘political’ processes, in the sense that they bargain and negotiate
and deploy resources of money, information, and presentational skills in order to
improve the chances of success for policies and programmes with which they are
associated. For example, a senior civil servant charged with implementing his or her
minister’s policy of privatizing a public utility, will negotiate with the various parties
involved and attempt, on the minister’s behalf, to make the policy work. Similarly, the
chief executive of a hospital may negotiate with the local trade unions over redundancies
or terms and conditions and the head of a government regional office will bargain with
other powerful local figures (local government officers, local business leaders, and so on)
to try to promote regional development. In these senses, then, many public servants are
involved in ‘politics’, even if they stay scrupulously clear of ‘party politics’. Indeed, the
more ‘networking’ and ‘partnering’ a government attempts (i.e. the more the New Public
Governance or similar models become reality), the more likely it is that officials will be
involved in bargaining and persuading roles. To the popular definition of politics as the
process which determines ‘who gets what, when, and how’ we would therefore add the
thought that, albeit within legal frameworks and (possibly) under explicit guidance from
elected politicians, the person making such determinations will often be an appointed
official.
From such a perspective some interesting interpretive possibilities open up. The appar-
ently contrasting views referred to above (between those who believe that the domain of
management is increasing and those who argue that political scrutiny is increasing)
become more understandable and—to a degree, if not entirely—mutually reconcilable.
For example, it could be simultaneously true that politicians are intervening more in
public administration and that the sphere of public management has begun to encompass
more and more issues which used to be mainly the preserve of politicians. These are, then,
crucial, boundary issues for public management, and they deserve more detailed consid-
eration here. We will focus on four key questions:
1. Has public management reform shifted the borderline between politics and adminis-
tration, and, if so, in what way?
2. What are the main implications of the new trajectories and models of public manage-
ment for elected politicians (in both executive and legislative roles)?
3. How far does the notion of ‘public service bargains’ enable us to understand changes to
the borderlines?
4. What is the relationship between public management reform and public attitudes
towards politicians and civil servants?
Our answers to all four of these questions—perhaps particularly to the final one—are
tentative. As usual, the available evidence is less than complete, and different directions
162 POLITICS AND MANAGEMENT
are visible in different places and periods.Wemay also note that one feature of the rhetoric
surrounding a good deal of management reform (perhaps especially in the core NPM group
of countries) has been that it has drawn attention away from these overtly political
issues—the emphasis has tended to be placed on saving money or improving the public
services received by citizens rather than on the effects of all this upon basic political and
constitutional relationships. The implication has seemed to be that management can be a
professional and technical exercise, relatively free of ‘politics’. Typical of this dominant
emphasis was Vice President Gore’s characterization of the US National Performance
Review exercise as one aiming at a government which ‘works better and costs less’. Typical
also was Mrs Thatcher’s bold assertion that moving 70 per cent of the civil service out of
conventional departments and into a new type of executive agency had no constitutional
significance:
The government does not envisage that setting up executive agencies within departments will result
in changes to existing constitutional relationships. (Prime Minister, 1988, p. 9)
However, after two decades of intensive change across many countries, we are far from
alone in suggesting that the ‘three Es’ and improved ‘customer service’ are only one
dimension of the picture: the relations between politics and administration have changed
too.
Having addressed the four questions listed above, the chapter concludes with some
synthesizing comments on the extent to which ‘politics’ may represent a structural limit
to the effectiveness and reach of management reform.
6.2 Has public management reform shifted the borderlinebetween politics and administration?
There have, in any case, been significant changes in the nature of politics in many OECD
countries, quite apart from the impacts of management reforms. Specifically, there has
been an erosion of the perceived legitimacy of government and an increase in the
volatility (decrease in the party loyalty) of most electorates. More sectors of politics—
including management reform—have developed through international rather than
purely national networks (Halligan, 1996a; Held et al., 1998; Kettl, 2000; Manning,
2001). Finally, economic pressures have meant that in most OECD countries, the era
where ministers made their reputations by introducing big new programmes has long
passed. We have moved into an era of largely ‘technical politics’ rather than the welfare
state construction of 1945–75. Executive politicians are now usually engaged in stream-
lining, repackaging, marginally modifying, or actually downsizing (‘decrementing’) ex-
isting programmes, rather than any heroic new efforts. Publics tend to be vigilant against
reductions in popular and basic welfare state services (health care, education, pensions),
yet more sceptical and more demanding (in terms of service standards) than in the past
and, at the same time, more resistant to tax increases. Furthermore, in most countries the
mass media have become more aggressive and sceptical, no longer accepting the ‘official
POLITICS AND MANAGEMENT 163
line’ or deferring to the minister’s authority or access to expertise. To put it bluntly, it is
even more difficult being a minister than it used to be, partly because the kinds of things
a minister gets to do today are inherently less popular than those that were being done
during the boom years of the 1950s and 1960s, and partly because the public audience
out there are more sceptical, less deferential and less trusting. One should add that it is
also more difficult being a ‘mandarin’. Rouban (1997, p. 148) is referring specifically to
developments in France, but his words apply to most of our other countries as well:
The time is over when civil servants, representing an all-mighty State, could steer most actors of the
social life and could impose their choice without too much difficulty. Moreover, the classic political
game has been changed. Controversies are no longer built along the lines of ideological frontiers but
involve technical arguments that often cross the political parties boundaries.
Within this context, management reform ministers have been caught in the dilemma
captured by the Peters and Pierre quotation at the beginning of this chapter: on the one
hand they have sought greater control over the bureaucracy and its programmes, but on
the other they have seen advantages in decentralizing responsibility and trying to sit
‘above’ the dangerous cauldron of day-to-day operational failures and achievements.
Generally speaking, it might be said that NPM in the Anglo-Australasian style contains
contradictory ideas (or, at least, ideas which exist in some tension with each other). NPM
doctrine holds that decentralization is good, and letting/making managers manage is
good, but also that political control and accountability need to be strengthened and that
consumer power should be strengthened. This conundrum—which will be explored
further in the next chapter—looks rather like an ‘eternal triangle’. The grass in the other
two corners is always greener. Nor have continental European states—which, as we have
seen, have not embraced NPM to anything like the same extent—been able to avoid
problems. In France:
Many civil servants have perceived modernisation as a means to put them in charge of political
choice that had not been decided upstream, as a tricky game whose winners are always the
politicians who can get rid of embarrassing responsibilities in a time of budget cuts and, simulta-
neously, of high defensive corporatism. (Rouban, 1997, p. 155)
Decentralizing devices such as frame budgeting (Sweden, Finland) or delegation to
provincial or regional tiers of government (Belgium, Canada, Italy, USA) have clearly
been used partly in order to transfer the political pain of sharp prioritizations and
downsizings from the national to subnational levels of government (from one set of
elected politicians to another—although within each jurisdictional level there may also
be some passing on of ‘hot potatoes’ to officials). However, at least in these cases the
arguments have taken place within the political sphere, between different strata of elected
representatives.
The precise ways in which these tensions play themselves out are therefore shaped by
the type of regime in which they occur (see Chapter 3). In the ‘Anglo-Saxon’ regimes
(Australasia, UK, USA) where politics and government in general tend to be held in lower
esteem, it has been less difficult for politicians to retreat from responsibility for the
management of public services (indeed, easier for them to pursue outright privatization).
Thus, many developments have seemed to signal a shift of the borderline in favour of
164 POLITICS AND MANAGEMENT
management, so that its empire (both private and public) has grown, while the empire of
politics appears to have shrunk. This has been done in the name of efficiency and
consumer responsiveness. Yet executive politicians have also been cunning. They have,
in effect, reasserted the distinction between politics and administration (though now calling
the latter ‘management’), makingmanagers responsible for achieving targets, but at the same
time theyhave frequently retained powers of intervention so that, if things go badlywrong in
the public eye, then the politicians can appear to ride to the rescue with inquiries, inspection
teams, restructurings, and all the other paraphernalia of crisis management. This generaliza-
tion would apply, for example, to UK executive agencies, grant-maintained schools and NHS
trust hospitals, and to the Belgian Commission on theDutroux (child abuse) scandal and the
Dutch inquiry into the firework explosion at Enschede.
Beneath the surface, the process of letting—or making—public sector managers manage
has not been so simple. There have been countervailing currents and considerable central-
ization, partly through the establishment of ever more sophisticated performance indicator
and target regimes, underpinned by rapidly advancing information technologies. In the UK,
a general shrinkage of the public sector has been accompanied by an extraordinary growthof
central auditing, inspecting, and monitoring bodies (Hood et al., 1999; Power, 1997). As we
have seen, executive politicians have transferred their focus for control from inputs to out-
puts, via processes. This may account for the somewhat ambiguous responses from public
servicemanagers themselves—they have experienced greater freedom to deploy their inputs
(e.g. switchingmoney from staff to equipment, or vice versa) but at the same time they have
felt themselves under closer scrutiny than ever before as far as their results are concerned.
Even where an activity has been fully privatized—as with the UK public utilities such as gas,
water, electricity, and telecommunications—politicians have gradually been obliged to give
more attention to arrangements for the public regulation of the resultant private corpora-
tions (Foster, 1992).
What is clear is that, in the UK, but also in other Westminster-influenced systems, the
additional pressures which NPM reforms have put on traditional concepts of public
accountability have not been met with any clear and coherent new doctrine to cope
with the new circumstances. The problems are increasingly widely recognized, but most
politicians have shrunk from the task of articulating a ‘new model’ (Barberis, 1998; Behn,
2001; Pollitt, 2003a, chapter 4; Stone, 1995).
In an interesting analysis of reforms in two strong NPM countries (Australia, New
Zealand) and two modernizers from the ‘northern European’ group (Norway, Sweden), a
pair of Norwegian scholars paid particular attention to the effects of the implementation
of NPM practices on politicians. Their conclusions are worth citing.
The distance between political leaders, on the one hand, and the actors, institutions and levels to be
controlled, on the other, is increasing, and autonomy from political leaders is more evident. The
new administrative and institutional actors are less loyal than in the traditional system, more
instrumental and individually oriented, and less preoccupied with collective interests, public
accountability and ethos. (Christensen and Lægreid, 2001, p. 304)
Note the emphasis here on a changing culture among the new administrative elites.
Christensen and Lægreid go on to note the additional complexity these changes bring
for accountability systems before finally delivering a sober verdict:
POLITICS AND MANAGEMENT 165
Our conclusion is that these changes may in fact undermine political control. Managerialism may
allow executives to exercise greater control over state agencies, but it is greater control over less . . .
The changes also create ambiguity concerning the role of managers, because they are caught in
cross-pressure between politicians and customers. (Christensen and Lægreid, 2001, p. 309)
In the more consensualist and decentralized regimes (the northern European group iden-
tified in Chapter 4) the ‘anti-government’ theme has not been as strong as in the core NPM
group. Instead, the rhetoric has stressed modernization, with the political elites largely
holding to their usual role of directing a substantial state apparatus, and the mandarins
continuing to play a strategic role with relatively little challenge to their status and
competence. Considerable decentralization has taken place (Sweden, Finland) but this
has been more political decentralization (to subnational elected authorities) rather than
managerial decentralization on the New Zealand/UK model. One should remember, how-
ever, that these countries were already administratively more decentralized than the UK,
with both Sweden and Finland having strong traditions of national boards and agencies
and Sweden, in particular, possessing only quite small central ministries (see Sweden
country file, Appendix B). In general change in the Nordic countries, although often
flavoured with NPM ideas, was more incremental and cautious than in Australia or New
Zealand (Christensen and Lægreid, 2001). In the Netherlands the trajectory was slightly
different, with a significant growth in appointed quangos (ZBOs) during the 1980s.
However, this trend soon attracted political criticism (including some accusations that
the ZBOs were being used to create well-paid jobs for sympathizers of the ruling Christian
Democrat party), and in 1994 an incoming left-right ‘purple coalition’ made restoring ‘the
primacy of politics’ one of its leading slogans. Departmental agencies with more sharply
defined accountability became the preferred vehicle for decentralization of central gov-
ernment tasks, rather than ZBOs, and the national audit office made a series of well-
publicized reports aimed at improving the public accountability of autonomous bodies
(e.g. Algemene Rekenkamer, 1995, 2002)
In sum, neither in the Nordic states nor in the Netherlands has the borderline between
management and politics moved much, one way or the other. On the other hand, these
regimes have shared in the shift to systems of output rather than input controls, even if
this move has not been as vigorously reinforced by personnel reforms (performance
appraisals, annual results targets for individual public servants) as in the most pro-NPM
countries.
In Germany and France the politics/administration frontier has not shifted very
much either. Neither has significantly dismantled central civil service controls; neither
has created flocks of powerful new quangos to take over functions formerly under direct
political oversight (Germany already possessed a large and significant set of para-statal,
corporatist organizations with responsibilities for carrying out public functions). France
has implemented a significant privatization programme, but cautiously, and nowhere
near as sweepingly as the UK or NZ. Germany was already extensively decentralized and
France has carried through a major decentralization programme since 1985 but, as in
the case of the Nordics, these have been primarily acts of political decentralization (to
local and regional elected bodies) not pure managerial decentralization. Administrative
decentralization has certainly taken place, but not on the same scale as in the UK or
166 POLITICS AND MANAGEMENT
New Zealand (Guyomarch, 1999; Trosa, 1995; cf. Pollitt et al., 1998). In short, political
and civil service elites (which, significantly, in both countries are intermingled rather
than separate—especially in France) have retained their grip. The politically led state,
even if leaking legitimacy, is still seen as a major, socially integrating force to be
reckoned with. There have been significant attempts to begin to shift large, rule-
following bureaucracies towards a more performance-oriented approach, but this has
been both patchy and a largely internal matter. It has not been accompanied (as in
Australia/NZ/ UK/USA) by general rhetoric about how ‘political influences’ have to be
removed/minimized and professional management/business-like approaches substi-
tuted. On the contrary, while the first edition of this book was being written a promi-
nent German scholar expressed himself thus:
Not only would it be undesirable to once again in German history have senior civil servants conceal
their functionally politicized role, it is also hardly imaginable how to turn them into a-political
managers. Possibly, the formal neutrality of civil servants in the UK and the absence of the safety
valve of temporary retirement could be reasons for the easy adoption [in the UK] of a managerialist
role understanding. (Derlien, 1998, pp. 23–4)
Nor have the German or French publics been copiously supplied with ‘league tables’ of
‘results’ as has been the fashion in the UK and, to a lesser extent, the USA and New
Zealand. The Anglo-American-Canadian rhetoric of citizen ‘empowerment’ has been far
more muted in Rechtsstaat regimes, where the dominant legal perspective and the distinc-
tiveness of the state sphere make such concepts more difficult to conceive or fill with any
sensible meaning. Citizen justice and citizen rights, Conseil d’Etat style is very different
from consumer choice in the style of John Major’s Citizen’s Charter, as the 1992 Chartes des
Services Publics illustrated.
Among the central European group of states, Belgium and Italy remain to be commen-
ted upon. Both have witnessed extensive political decentralization (see country files in
Appendix B), but it is not clear that this has much altered the borderline between politics
and administration or, at least, not in any lasting way. In Belgium the federal civil service
has, if anything, probably lost some status, alongside politicians, amid the public anger at
the Dutroux affair and other administrative and political scandals of the 1990s. On the
other hand the politicians have responded by considerably expanding their political
patronage—the number of discretionary contract appointments has grown (OECD,
2007) and proposals to reduce the size of the (politicized) ministerial cabinets were the
first casuality of the Copernicus reform (see Belgium country file, Appendix B). In Italy,
confidence in the political system fell to very low levels in the late 1980s and early 1990s,
and there were even two ‘non-political’, technocratic governments in the mid 1990s.
However, there too, there is little evidence that the civil service has been the beneficiary
of the loss of confidence in politicians. Rather it, too, has a low status in the eyes of the
public. Table 5.9 showed 2002 levels of 29 per cent for Italian trust in the civil service, as
against 51 per cent for Belgium, 45 per cent for France, 48 per cent for the UK, 43 per cent
for Finland and 60 per cent for Sweden. Italy was the only country below the 40 per cent
level. So, although both countries have begun real reforms, it is hard to see that these have
yet led to any restoration of the status and authority of national civil servants.
Neither does the available evidence show any sustained reversal of the fall in the standing
POLITICS AND MANAGEMENT 167
of politicians. Direct evidence of a shifting borderline between political and managerial
power is not plentiful—either in Belgium or in Italy—but we can at least say that there
is little to indicate a major accretion of authority to either ministers or mandarins
(even though the Belgian ‘purple-green’ coalition made the ‘primacy of politics’ a key
programme issue).
6.3 What are the main implications of the newtrajectories and models of public managementfor elected politicians?
Here we face the same problem that arose in Chapters 1 and 4—how many of the various
models which have been put forward should we select for attention? Our choice is to
follow the main lines discussed towards the end of Chapter 4: that is, to look at the NPM,
then the Neo-Weberian State (NWS), and finally ‘New Public Governance’ (NPG).
Looked at by and large, these three models have rather different versions of the roles of
politicians and officials. Most of the early NPM writings said very little about politicians—
the debate was all about how to give more authority to managers, although within a
performance framework that ensured that their performance would be measured and
would be aligned with the strategic goals that were handed down from the politicians.
The correct framework of incentives would ensure that these managers performed in the
public interest. Politicians were left with a strategic role—setting broad goals but keeping
their hands off the day-to-day business of running the machine, which should be dele-
gated to professional managers. They were to act as chief executives, or even chairmen of
the board, not ‘fixers’.
The NWS, by contrast, was closer to the traditional pattern. Officials were there to
implement communally decided and politically defined policies, and they were to do
this professionally and using high technical skills, but without any presumption that
they required large increments of extra autonomy or discretion in order to work effec-
tively. They were still very much servants/representatives of the state, and as such were not
conceived of as autonomous managers, and certainly not as ‘entrepreneurs’ (cf. Osborne
and Gaebler, 1992). Politicians were very much part of the picture, and were not assumed
to be confined to a strategic role—if they chose to intervene in detail, then civil servants
had to accommodate themselves to that—politicians could legitimately be interested in
the minutiae as well as the strategy.
The NPG complicates the whole picture by taking a ‘network’ approach, and position-
ing both politicians and public servants as no more than rather special players in a larger
game. In this game all sorts of other ‘stakeholders’ also carry both legitimacy and
influence—companies, non-profits, and civil society associations of many kinds. Instead
of being final and authoritative decision-makers, politicians, in this scenario, become
joiners-up, deal-makers, people who seek to build and maintain the networks from which
agreed policies will emerge, as well as the networks of organizations (partnerships,
collaborations) that will implement those policies. Civil servants are also drawn into
168 POLITICS AND MANAGEMENT
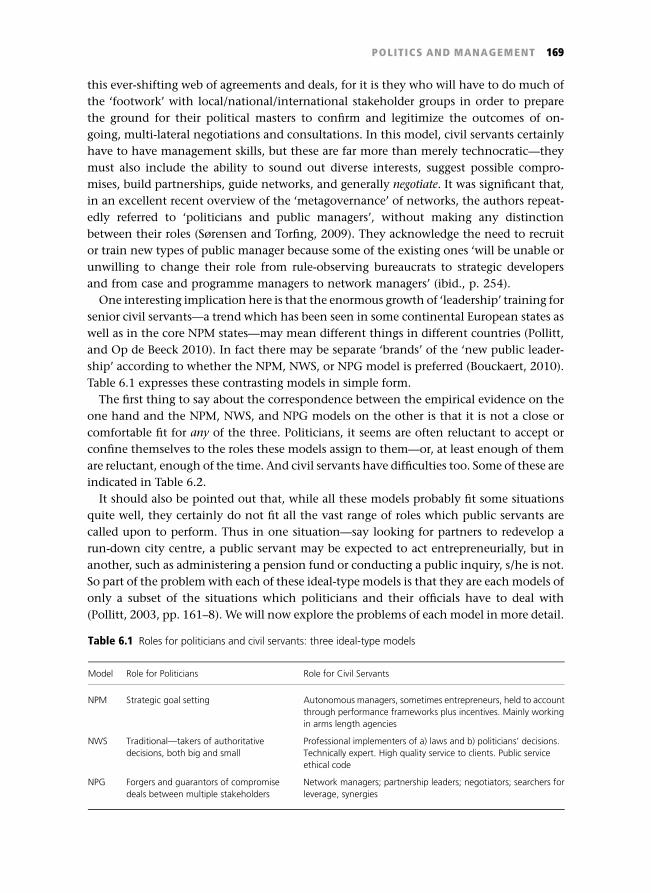
this ever-shifting web of agreements and deals, for it is they who will have to do much of
the ‘footwork’ with local/national/international stakeholder groups in order to prepare
the ground for their political masters to confirm and legitimize the outcomes of on-
going, multi-lateral negotiations and consultations. In this model, civil servants certainly
have to have management skills, but these are far more than merely technocratic—they
must also include the ability to sound out diverse interests, suggest possible compro-
mises, build partnerships, guide networks, and generally negotiate. It was significant that,
in an excellent recent overview of the ‘metagovernance’ of networks, the authors repeat-
edly referred to ‘politicians and public managers’, without making any distinction
between their roles (Sørensen and Torfing, 2009). They acknowledge the need to recruit
or train new types of public manager because some of the existing ones ‘will be unable or
unwilling to change their role from rule-observing bureaucrats to strategic developers
and from case and programme managers to network managers’ (ibid., p. 254).
One interesting implication here is that the enormous growth of ‘leadership’ training for
senior civil servants—a trend which has been seen in some continental European states as
well as in the core NPM states—may mean different things in different countries (Pollitt,
and Op de Beeck 2010). In fact there may be separate ‘brands’ of the ‘new public leader-
ship’ according to whether the NPM, NWS, or NPG model is preferred (Bouckaert, 2010).
Table 6.1 expresses these contrasting models in simple form.
The first thing to say about the correspondence between the empirical evidence on the
one hand and the NPM, NWS, and NPG models on the other is that it is not a close or
comfortable fit for any of the three. Politicians, it seems are often reluctant to accept or
confine themselves to the roles these models assign to them—or, at least enough of them
are reluctant, enough of the time. And civil servants have difficulties too. Some of these are
indicated in Table 6.2.
It should also be pointed out that, while all these models probably fit some situations
quite well, they certainly do not fit all the vast range of roles which public servants are
called upon to perform. Thus in one situation—say looking for partners to redevelop a
run-down city centre, a public servant may be expected to act entrepreneurially, but in
another, such as administering a pension fund or conducting a public inquiry, s/he is not.
So part of the problem with each of these ideal-type models is that they are each models of
only a subset of the situations which politicians and their officials have to deal with
(Pollitt, 2003, pp. 161–8). We will now explore the problems of each model in more detail.
Table 6.1 Roles for politicians and civil servants: three ideal-type models
Model Role for Politicians Role for Civil Servants
NPM Strategic goal setting Autonomous managers, sometimes entrepreneurs, held to account
through performance frameworks plus incentives. Mainly working
in arms length agencies
NWS Traditional—takers of authoritative
decisions, both big and small
Professional implementers of a) laws and b) politicians’ decisions.
Technically expert. High quality service to clients. Public service
ethical code
NPG Forgers and guarantors of compromise
deals between multiple stakeholders
Network managers; partnership leaders; negotiators; searchers for
leverage, synergies
POLITICS AND MANAGEMENT 169
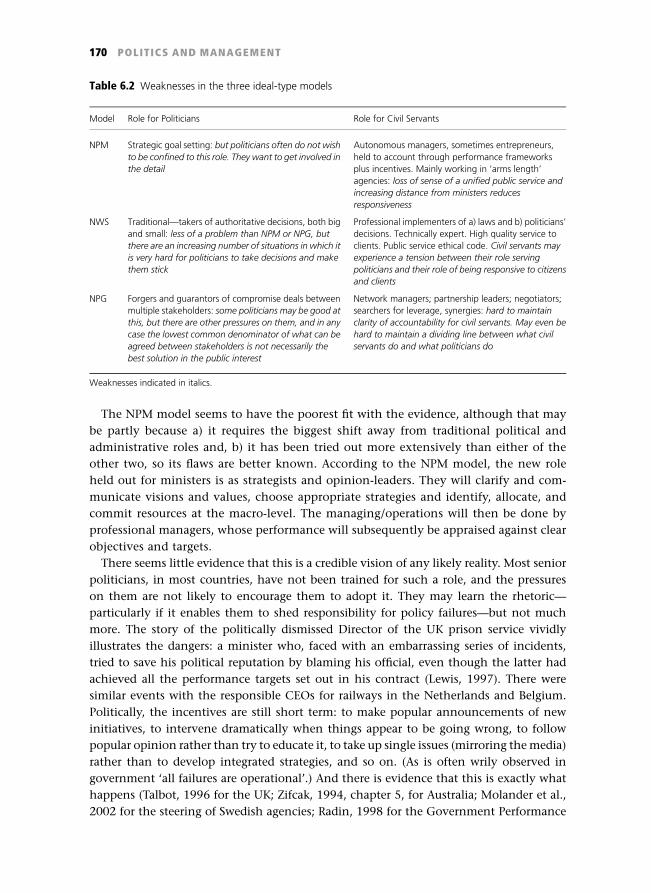
The NPM model seems to have the poorest fit with the evidence, although that may
be partly because a) it requires the biggest shift away from traditional political and
administrative roles and, b) it has been tried out more extensively than either of the
other two, so its flaws are better known. According to the NPM model, the new role
held out for ministers is as strategists and opinion-leaders. They will clarify and com-
municate visions and values, choose appropriate strategies and identify, allocate, and
commit resources at the macro-level. The managing/operations will then be done by
professional managers, whose performance will subsequently be appraised against clear
objectives and targets.
There seems little evidence that this is a credible vision of any likely reality. Most senior
politicians, in most countries, have not been trained for such a role, and the pressures
on them are not likely to encourage them to adopt it. They may learn the rhetoric—
particularly if it enables them to shed responsibility for policy failures—but not much
more. The story of the politically dismissed Director of the UK prison service vividly
illustrates the dangers: a minister who, faced with an embarrassing series of incidents,
tried to save his political reputation by blaming his official, even though the latter had
achieved all the performance targets set out in his contract (Lewis, 1997). There were
similar events with the responsible CEOs for railways in the Netherlands and Belgium.
Politically, the incentives are still short term: to make popular announcements of new
initiatives, to intervene dramatically when things appear to be going wrong, to follow
popular opinion rather than try to educate it, to take up single issues (mirroring themedia)
rather than to develop integrated strategies, and so on. (As is often wrily observed in
government ‘all failures are operational’.) And there is evidence that this is exactly what
happens (Talbot, 1996 for the UK; Zifcak, 1994, chapter 5, for Australia; Molander et al.,
2002 for the steering of Swedish agencies; Radin, 1998 for the Government Performance
Table 6.2 Weaknesses in the three ideal-type models
Model Role for Politicians Role for Civil Servants
NPM Strategic goal setting: but politicians often do not wish
to be confined to this role. They want to get involved in
the detail
Autonomous managers, sometimes entrepreneurs,
held to account through performance frameworks
plus incentives. Mainly working in ‘arms length’
agencies: loss of sense of a unified public service and
increasing distance from ministers reduces
responsiveness
NWS Traditional—takers of authoritative decisions, both big
and small: less of a problem than NPM or NPG, but
there are an increasing number of situations in which it
is very hard for politicians to take decisions and make
them stick
Professional implementers of a) laws and b) politicians’
decisions. Technically expert. High quality service to
clients. Public service ethical code. Civil servants may
experience a tension between their role serving
politicians and their role of being responsive to citizens
and clients
NPG Forgers and guarantors of compromise deals between
multiple stakeholders: some politicians may be good at
this, but there are other pressures on them, and in any
case the lowest common denominator of what can be
agreed between stakeholders is not necessarily the
best solution in the public interest
Network managers; partnership leaders; negotiators;
searchers for leverage, synergies: hard to maintain
clarity of accountability for civil servants. May even be
hard to maintain a dividing line between what civil
servants do and what politicians do
Weaknesses indicated in italics.
170 POLITICS AND MANAGEMENT
and Results Act in the USA). ‘While the intellectual exercise involved in defining goals and
measures of success has its own rigor, it does not fit comfortably into the fragmented
decision-making process in both theWhite House and the Congress’ (Radin, 1998, p. 313).
In consensualist political systems the attraction of the NPM vision of ministers as
strategists seems even less than in the majoritarian systems of Australia, Canada, New
Zealand, and the UK. In Belgium, the Nordic states, and the Netherlands ministers are not
far-sighted strategists—their political success and survival depends upon their skills and
creativity in putting together coalitions of support to steer through particular pro-
grammes. This is even more true for EU institutions. In these environments clear state-
ments of strategies and priorities may actually prove counter-productive: the ability to be
all things to all (wo)men is much more useful. Lists of objectives will typically be either a)
very long and inclusive or b) shorter but so general and capaciously phrased as to exclude
very little. In neither case will the list of objectives be very useful operationally but, more
importantly to the politicians, in neither case will potential allies be needlessly alienated.
Nothing in the NPM can change this political dynamic, which has been recognized by
numerous public administration scholars over more than half a century.
Again, as far as the substantive content of management reform is concerned, nothing
has happened to alter the diagnosis made by many previous writers on public sector
organizational reform, namely that such reforms have little interest for most ministers, as
they are not ‘vote-catchers’, and because they yield results only over long periods of time,
if at all. Announcing reforms may be mildly rewarding (e.g. Gore, Thatcher, Lange,
Howard, Blair), but following them through and checking to see if they worked are not
high-priority tasks for most politicians. As the OECD—a leading influence in NPM-type
reforms for a decade or more—put it in 2002: ‘There are political advantages in launching
reform initiatives, and political disadvantages in carrying them through. Hence the
prevalence of reform initiatives abandoned before the critical mass-point of cultural
change’ (OECD, 2002, p. 8; Pollitt, 2009). Of course, when organizational boundaries
are changed, politicians take an interest, either to protect their ‘patch’ or to try to gain
‘territory’, but this is hardly the perspective of the strategic figure implied in much of the
NPM literature.
The analysis in the previous paragraph is even more true for the second group of
politicians—those in the legislatures. Their careers are hardly ever shaped by organiza-
tional reforms, their constituents are seldom interested in them or knowledgeable about
them, and there is little incentive to get involved in such matters, except in the most
superficial ways, or as constituency advocates in particular cases when things go wrong
(‘crippled widow denied disability benefit’, etc.). Legislatures have been very slow to
make constructive use of the increase in performance information available to them
( Johnson and Talbot, 2007; Pollitt, 2006). Most MPs simply don’t have the time or
inclination to get involved in the details of management. Describing the US Congress’
reaction to the National Performance Review Kettl (1994, p. 49) vividly crystallized the
problem:
Congress, by practice and the Constitution, attacks problems by passing laws. The NPR seeks to
solve problems by improving performance. Congress as an institution works on the input side. The
NPR focuses on the output side. Congress has little incentive to worry about results and, in fact, has
POLITICS AND MANAGEMENT 171
long indulged itself in a separation-of-powers fantasy that absolves it from any complicity in the
executive branch’s performance problems.
Turning to the NWS, we should first acknowledge that, of the three, this model represents
the smallest movement away from a traditional system, and therefore it might be expected
to cause fewer ‘waves’. Nevertheless, it is not problem-free. While politicians are not
assumed to have to change their behaviour very much, new aspects have been stitched
on to the role of civil servants. They are supposed to have become more professional
managers, and they are supposed to have learned to behave more responsively to the
individual clients of public services. Whilst these are both laudable objectives, there is
always the possibility that one or both of them may come into tension with what the
directing politicians want. Thus, for example, civil servants as professional managers work
out a rational, justifiable scheme for decentralizing and relocating government offices to
areas where they will be cheaper and will bring maximum benefit to the local economies,
but the politicians have other ideas. They want some of the relocations to be directed to
areas which are politically marginal constituencies, or which are loyal to the party in
power. Or again, civil servants, attempting to respond to citizens’ wishes, carry out
opinion surveys and organize focus groups to determine how hospital services should be
reorganized within a particular region, but ministers are persuaded by the representatives
of the medical profession and the big construction firms that what should actually go
ahead is a big new hospital that will involve the closure or run-down of many existing
local services. Civil servants are then left looking manipulative or untrustworthy to the
local residents who put energy into developing a plan of their own. In the English
expression, they are ‘hung out to dry’ by their political bosses.
The ‘professionalism’ of the NWSmanager is therefore a particularly circumscribed kind
of professionalism. It is a professionalism that can only rarely assert the necessity of
following its own standard and procedures. Quite often these procedures must bend or
even break before the superior force of a political imperative. The best hope for the NWS
manager may be in a system such as the Danish or Finnish or Swedish, where there is deep
mutual trust and long-established stability, so that politicians are prepared to allow their
managers considerable discretion to act ‘professionally’, and the managers, in their turn,
are unquestioningly obedient once a political imperative is declared to them (see, e.g. Kettl
et al., 2004). The problem for reformers, of course, is that these Nordic states achieved this
condition, not through some particular reform package, but historically, over decades or
even centuries of evolution.
It is hard to assess the NPG model because it is often formulated in such a vague and
general way (Osborne, 2010). However, it is reasonably clear that it would involve civil
servants in extensive ‘networking’ activities, dealing with a range of groups from the
market sector and civil society. In these instances the public officials would not be simply
‘messengers’, handing down what their ministers had told them they wanted. On the
contrary, they would have constructive and creative roles, looking for synergies between
different stakeholders, encouraging innovatory solutions, and so on. Rather like the
‘entrepreneurial’ public officials in the NPM model, this can leave civil servants rather
out on a limb. Furthermore, this model tends to assume that, if one gets all the stake-
holders around the table with one or more skilled ‘network facilitators’, then an agreed
172 POLITICS AND MANAGEMENT
compromise solution will be found. Unfortunately, this does not always happen, either in
practice or even in theory.
The NPG model is still evolving, and has the support of many academics who see it as
the answer to problems of governability in complex, cosmopolitan societies. However, it is
also widely acknowledged that it has weaknesses and ‘silences’. One of these is how one
measures the effectiveness of networks, since the somewhat hierarchical ‘production
model of performance’ (see Figure 5.1) is held not to apply to NPG (Sørensen and Torfing,
2009, pp. 239–43). A second is the role of politicians. Network theorists see the need for a
new interpretation of ‘political primacy’:
This primacy is not so much based on the right to define the substance of government policy based
on an ex ante interpretation of the general interest, but on the capacity to initiate and guide societal
discourses aimed at the exploration of interests, the creation of solutions, and thus the gradual
discovery of the common interest. (Klijn and Koppenjan, 2000, p. 385—original italics)
This leaves open the question of whether politicians themselves are, on the whole, likely
to want to give up their previous form of ‘primacy’ for this new version. It seems from
quite a few case studies of networks that many politicians (understandably) wish to reserve
to themselves the right at any point to back out and claim a unique and higher legitimacy
as elected representatives. In the case studies analysed by Klijn and Koppenjan, the
politicians emerge (to use their words) as ‘spoilsports’ as often as they do ‘playmakers’
(ibid., see also Pollitt, 2003, pp. 57–67).
A third problem, which also directly concerns us here, is the issue of democratic
accountability. One advantage of traditional hierarchies is that accountability leads up
from one level to the next in a nice straight line. It may not always work like that in
practice, but in principle it is understandable and clear. By contrast, in the myriad, plastic
networks of NPG, how can we see who is responsible for what? Although supporters of
network governance, Sørensen and Torfing put the issue with admirable candour:
on the basis of the liberal norms of representative democracy, governancenetworks appear to be rather
undemocratic. There is no equal participation of citizens within a given territory, since only the
relevant and affected groups have access to a particular governance network. There is no free and
open competition among different political elites to represent the relevant and affected citizens, as the
participating stakeholder organizations often possess amonopoly in representing particular function-
ally defined groups of people. Finally, democratic control and accountability is weak due to the fact
that network participants are not elected, but rather (self) appointed. (2009, p. 243)
Thus both politicians and public managers may be able to use networks to edge away from
the usual constraints and transparencies on their activities. The answer to this problem
proffered by Sørensen and Torfing is quite a complex and demanding list of principles and
tools for ‘network metagovernance’ (p. 248). Perhaps the proposal which is most relevant
to our frontier between politicians and public managers is the following:
The relevant political authorities and public agencies must assign responsibility for strategic gover-
nance of particular networks to the politicians and public managers who are directly or indirectly
involved in the networked governance processes and, therefore, have the required knowledge of the
organizational and political landscape to act as metagovernors. (p. 254)
POLITICS AND MANAGEMENT 173
It has to be said that this is not an entirely convincing proposal—in several respects. First,
it seems to assume that ‘the relevant political authorities’ can just arrange the meta-
governance of networks (although much of the network literature stresses how networks
cannot be ruled or directed). Second, it further assumes that the ‘relevant political autho-
rities’ will act in a long-sighted, strategic, and principled manner—but it is precisely the
fact that they don’t always do this that causes the problem in the first place! Third, we again
have here an instance of NPG writing in which no distinction is made between the roles of
politicians and managers. They are all in it together, not only collaborating and negotiat-
ing and developing new relationships, but also, now, acting as ‘metagovernors’. One must
ask whether public managers are either trained or suited to such a role—and, indeed, what
politicians (or the citizenry) would think if their officials began to behave in that way?
Neither is it only academics who proclaim such bold but problematic futures for ‘gover-
nance’. Consider the following extract from a particularly gushing recent UK Treasury
report about taking a ‘whole area’ (spatially integrated) approach to public services, an
approach which the report refers to as ‘Total Place’:
The challenges identified by Total Place will require all public leaders to take a broader view of the
leadership task in public services. Future leaders will not only be people who can work across
organizations on behalf of their places, but people who engage effectively with peers, communities,
the third sector and with local democratic representatives. They might be political leaders, chief
executives, and chief constables; equally they might be programme managers, frontline staff or
members of the public. (HM Treasury, 2010, p. 59)
To conclude this section, we may remark that any model which assigns a new role to
politicians is at risk of being embarrassed by their lack of cooperation. It is as well to
remember an observation which was originally applied to attempts to establish profes-
sional, career public services, independent of political influence, but which could also,
perhaps be applied to all three ideal models—NPM, NWS, and NPG:
in government, politics is still trumps and if political leaders have the desire to impose their will over
the public sector it is very likely that they will win; they may win by covert strategies, but they will
win. (Peters and Pierre, 2004, pp. 288–9)
6.4 How far does the notion of public service bargainshelp us to understand changes at the borderlinebetween politicians and civil servants?
The three ideal types we examined in the previous section (NPM, NWS, NPG) are all broad-
scope models of how the whole of the public sector can be run. Whilst they do—as we
have just seen—have considerable implications for the borderline(s) between politicians
and officials, it may be that the concept of public service bargains (PSBs) may help even
more. After all, the PSB concept is specifically built for, and focused on, the frontier
between politics and administration.
174 POLITICS AND MANAGEMENT
The main types of PSB were set out in Figure 4.3. The discussion of trajectories in
Chapter 4, Section 5, suggested that, although there were significant exceptions, a
general tendency could be discerned in which civil services moved away from trustee
type bargains and towards agency type bargains. This, though, is no more than a useful
summary description. It does not yet tell us what the reason or reasons for such a change
may have been. That, perhaps, is most cogently summarized in the title of Peters and
Pierre’s 2004 book, Politicization of the Civil Service in Comparative Perspective: The Quest for
Control. The hypothesis is that, faced with more complex, rapidly changing societies,
with faster-moving, more aggressive media, and with dwindling popular loyalty to
specific political parties, executive politicians have reached for any tools that appear
likely to offer them more protection. One such device is to surround themselves with
cohorts of politically loyal, media-savvy and, if possible, substantively expert ‘advisers’.
An empirical review of the New Zealand experience with advisers put the matter very
clearly:
there is a sense among our respondents that policy-making is simply more difficult these days than it
oncewas. Intractablepolicyproblems, amore intrusivemedia that operates in real time . . . exponential
increases in the amountof informationpolicy-makersmust absorb andmaster, and amoredemanding
and discerning public are among the characteristics of a contemporary policy environment which
places ministers under increasing pressure. (Eichbaum and Shaw, 2007, p. 465)
In PSB terms, such advisers are agents, not trustees. Most of them will be brought in on
term contracts, although a few may be career civil servants who turn out to have the
requisite sympathies and skills. We have seen a growth in the numbers of this sort of
operative in Australia, Belgium, Canada, France, the Netherlands, New Zealand, the UK,
and the US—although starting from very different previous levels, and appointed in a
variety of ways. Somemay be agents subject to short-term direction (B2b in terms of Figure
4.3), while some may be given delegated authority and allowed to go off and do their
master’s work at a distance (B2a). Some may have only one master (B2b2), while others
may have several (B2a1).
This is an important development ‘on the borderline’. It could be said that it means that
the ‘border’ itself has been getting wider—the importance of this zone in between pure
politician and pure career trustee has been growing. However, it has clearly not been a
particularly simple or uniform process. Indeed, the original book by Hood and Lodge
acknowledges that PSBs are usually informal rather than formal, and that they do not
come in a single form but vary over time and place—Hood and Lodge, 2006, p. 24. The
book also describes an almost endless series of ways in which one PSB can morph into
another—and back again. So the taxonomy itself becomes rather complex.
Empirical work is only just beginning to come in, and thus far it suggests that we are
not witnessing a simple transition from one type of PSB to another. Thus the PSB for
Danish permanent secretaries has not become particularly managerial, despite some
reforms which might seem to point in that direction. The PSB for top Dutch officials
has acquired a slightly more managerial flavour, but still has consociational/trustee
elements and might be best described as a hybrid. In Belgium, what was previously a
B1a1 trustee/consociationalist type of bargain with agency/serial loyalist overtones
(B2b1) has moved towards a complex delegated agency type (B2a1). As Eichenbaum
POLITICS AND MANAGEMENT 175
and Shaw (2007) make clear, the effects of a growth of political advisers may be positive
or negative for both politicians and career bureaucrats. Expert advisers may screen out
certain proposals from the career civil service as politically too sensitive—thus restricting
the range of options open to ministers. Alternatively, they may raise the quality of policy
proposals coming from the civil service by constructively challenging them at an early
stage, and making them more politically manageable. They may be doctrinaire and short
term, or they may work in partnership with top civil servants to encourage innovatory
but rigorous thinking. The games played in the borderlands between politicians, political
advisers, and ‘trustee’ civil servants are not necessarily zero-sum, but they are by no
means necessarily ‘win-win’ either.
Taken together, these findings confirm a very general direction of change in most
countries, but not much more. We would also have to acknowledge that there have been
some moves back towards re-emphasizing a unified, career public service—especially in
those countries where the NPM-style fragmentation had gone furthest—Australia, New
Zealand, and the UK (Advisory Group on Reform of Australian Government Administra-
tion, 2010; Whitcombe and Gregory, 2008). Overall, therefore, the PSB framework is
helpful but itself quite slippery. It tends to confirm the trajectories we have already
described in Chapter 4, and to reinforce the perception that there have been significant
differences between core NPM countries and NWS countries.
6.5 What is the relationship between publicmanagement reform and public attitudestowards politicians and civil servants?
On the face of it the question ‘What do the citizens think about public management
reform?’ may seem both fundamental and straightforward. Surely, in a liberal democ-
racy, this is the ultimate test of any government action or programme? Such assump-
tions are further supported by both political rhetoric around the issue of rebuilding
citizens’ trust in government and by a widespread debate concerning the apparent loss
of legitimacy by governments throughout the Western (and Australasian) world. The
academic fascination with this began a long time ago, and has embraced academics of
very different theoretical persuasions (see, e.g. Habermas, 1976; Nevitte, 1996; Nye et
al., 1997). Some write of a loss of legitimacy, others of a decline in deference, others still
of a loss of trust, or of confidence. There are interesting differences between these
concepts (legitimacy/deference/trust/confidence), but from the point of view of man-
agement reform they all point towards a more critical and possibly recalcitrant audi-
ence for attempts to remodel at least those public sector organizations which deal
directly with the citizenry.
Unfortunately, the question itself is packed with doubtful assumptions. For example, do
most citizens know anything about the many reforms which have been proclaimed and
implemented by OECD governments? They are seldom the stuff of TV news or newspaper
headlines. Even if they may have encountered some references to reforms, are most
176 POLITICS AND MANAGEMENT
citizens sufficiently interested to pay any attention? If we take one of the most extensively
(and expensively) promoted reforms, the UK Citizen’s Charter, one survey indicated that 71
per cent of citizens had heard of it (ICM, 1993), but other research indicated that very few
people possessed any accurate knowledge of what was in it (Beale and Pollitt, 1994). This
ignorance of actual mechanisms and substance survived despite a government campaign that
had mailed a glossy leaflet to every household in the land. Six years later, a Labour govern-
ment printed 100,000 copies of its annual performance report and made them available at
£2.99 in the supermarkets. Only 12,000 were purchased, and under the terms of the contract
many thousands had to be bought back by the government (BBC News, 1999, 2000). In Italy,
the proud launch of their own citizen’s charter escaped the attention of most Italians
(Schiavo, 2000). In Belgium the citizen’s charter was professionally published in the State
Monitor, as royal and ministerial decrees, and therefore remained at the administrative level
(Bouckaert et al., 2003). One imagines that more technical reforms—such as the ‘reinvention
labs’ in the US NPR, or results-oriented budgeting in Finland and Sweden—would remain
completely unknown to the vast majority of the populations of the countries in question.
Yet lack of knowledge may not be the most serious barrier. Equally distorting can be the
possession of false information or serious conceptual misconceptions. Take, for example,
the average American’s view of the efficiency of federal programmes. Surveys show that
most Americans believe that more than 50 per cent of the expenditure in social security
programmes goes in overheads. The true figure is less than 2 per cent (Bok, 1997, p. 56).
Surveys in the UK in the 1960s were said simultaneously to reveal majorities against
‘nationalization’ but in favour of ‘public ownership’.
However, let us set the (major) problems of citizen ignorance and indifference on one
side for a moment, and concentrate on those issues where citizens do, it seems, hold
definite opinions. After all, surveys in a number of countries have been carried out with
questions such as ‘How do you rate the overall performance of government?’ or ‘Do you
have no confidence/some confidence/a great deal of confidence in politicians/civil ser-
vants/bank managers/doctors?’ and there has been no difficulty in obtaining responses
and adding them up to percentage ‘answers’. It is on the basis of time series of surveys of
this genre that some political scientists have identified a problem of declining legitimacy
and trust in many liberal democracies (for summaries, see Nye et al., 1997; the Pew
Research Centre, 1998). This is certainly interesting data, but the problems of interpreta-
tion are considerable. For example, two important questions are what are respondents
thinking of when they declare their opinions on the overall performance of government,
or their level of trust? What they read in the newspaper last week? A recent TV appearance
by the PrimeMinister? The government’s decision not to increase the state pension by the
full rate of inflation? The poor service the respondent received in the post office that
morning? Furthermore there is the question of the rationale behind the opinion. Why
does the respondent think that state pension decisions/macro-economic policy/counter
service at the post office is good or bad? What expectations did s/he bring to the question,
and how were those expectations formed? Unfortunately, only a few surveys can offer any
help with these sorts of questions—we may know what the average citizen thinks, but
seldom why they think it.
Quite apart from what may lie behind the percentages in the survey reports, it seems
that the gloomy picture of falling confidence may itself result from a narrow reading of
POLITICS AND MANAGEMENT 177
too few sources. In a careful examination of international figures on trust in government,
Van de Walle et al. (2008) arrive at the conclusion that
The findings contradict the political and the popular discourse. Empirically, there is little evidence
of an overall long-term decline in trust in government, although there are institutions that have
suffered from a loss in trust. (p. 61)
This ushers us into a more complicated landscape. First, opinions as to overall governmen-
tal performance, or levels of trust, do not necessarily correlate closely with opinions on
much more concrete and specific issues (e.g. how adequate is the postal service?). It seems
quite possible for citizens to maintain a generalized cynicism or mistrust of ‘government’
whilst simultaneously being reasonably satisfied with many of the specific public services
they actually make use of (Canadian Centre for Management Development, 1998a and b).
The level of this generalized dissatisfaction with government is ‘strongly connected to
how people feel about the overall state of the nation’ (Pew Research Centre, 1998, p. 1).
Meanwhile, as we saw in Chapter 5, citizen opinions of specific public services may go up
(Table 5.7 showed a general improvement in mean service quality scores for specified
Canadian public services—and a bigger average increase for public services than for
private). In the UK too, the 1993 ICM survey found that the public’s perceptions of
improvements in services by no means put private sector services consistently above
those provided by the public sector—for example, NHS doctors and state postal services
were placed somewhat above building societies and far above banks (ICM, 1993, p. 16).
Certainly, there is no firm ground for the assertion that the public would like the welfare
state to be ‘rolled back’ and replaced by private modes of provision. For example, a 1993
attitudinal survey of New Zealanders showed
strong endorsement for the notion of a universalist rather than a residualist welfare state, including
support for more taxes (although not necessarily a willingness to paymore tax personally), as well as
an underlying conviction that politicians are out of touch and unworthy of the government’s
trust. (Vowles et al., 1995, p. 97)
Similarly,more recently, the 2002 Swedish election results could be interpreted as a vote for
public services rather than tax reductions. Even in the USA, supposedly the stronghold of
anti-government, pro-private sector sentiments, it has been shown that: ‘Fully 72% of
Americans believe that government should see to it that no one is without food, shelter
or clothing . . . as many as felt that way in the 1960s’ (Pew Research Centre, 1998, p. 7).
Respondents are frequently able to distinguish between different groups of actors in the
process of governance. Most commonly they extend a tolerable degree of trust towards
civil servants, but a considerably lower (and falling) degree towards political leaders. For
example:
surveys suggest that the public’s frustration is directed more at politicians who lead government
than at civil servants who administer it. By a margin of 67% to 16% the public has more trust in
federal workers than in their elected officials to do the right thing. In that vein 69% now say that
they have a favorable opinion of government workers—an improvement from the 55% that held
that view in a 1981 Los Angeles Times national opinion survey. (Pew Research Centre, 1998, p. 2)
178 POLITICS AND MANAGEMENT
Thus, if President Reagan was right in saying that the federal government was part of the
problem rather than part of the solution, it was the politicians rather than the bureaucrats
he should have been aiming to reform! Furthermore—for the USA at least—it is not so
much failures in the efficiency of elected politicians that provokes public distrust, as the
perception that such leaders are failing to uphold high moral standards (Pew Research
Centre, 1998). This is extremely interesting material, as it carries the implication that
public management reform is unlikely to contribute much to enhancing the legitimacy of
a particular, current government, for two solid reasons. First, the public do distinguish
between political leaders and civil servants, and the bulk of their distrust is directed at the
former. Second, the deepest roots of discontent with the political leadership do not grow
out of perceptions of their incapacity to manage affairs, but rather from their (perceived)
untrustworthiness or low moral standards. Finally—just to complicate matters further—
the public may well also draw distinctions between different types of politician. They may
trust local politicians more than national politicians. Or they may respond more favour-
ably to a question about how far they trust ‘parliament’ than to one about how far they
trust ‘government’. All in all, it looks as though publics may be quite discriminating and
sophisticated in their judgements, and as though sweeping generalizations about a loss of
public confidence in (by implication) all government in all countries are inaccurate and
misleading.
Third, citizen responses can be highly context-specific, and need to be interpreted in the
light of that. For example:
it appears that fire services are always rated highly by citizens while municipal planning services are
rated much lower. This may reflect the nature of the services: one is an essential service; while the
other is a regulatory function that may impact on some citizens negatively, in order to ensure
fairness in protecting other citizens, such as in zoning regulations. Thus a rating of 7.0 would be a poor
score for a fire service, but an excellent score for a planning service. (Canadian Centre for Management
Development, 1998b, p. 6, italics as in the original)
Thus, ideally, analysis of citizen opinion needs to be topic specific (some services are
inherently more popular than others) and person specific (politicians are distrusted
more than civil servants). One also needs to know something about the citizens’ own
experiences (are responses coming from those who have little knowledge and no experi-
ence to be counted as equally valid as those from other citizens who are regular, indeed,
‘expert’ users of the particular service in question?). The question of ‘trust in government’
turns out to be as complex as government itself.
Indeed, the concept of legitimacy itself is far from simple. To say that one accepts the
current government, or the current system of public administration, as legitimate is a
statement which may conceal a range of states of knowledge and a variety of attitudes.
Attitudes may range from reluctant acquiescence (‘I suppose there isn’t any alternative’)
through lukewarm acceptance to enthusiastic approbation.
In sum, we may conclude that the public’s attitude to management reform in particular,
and to public administration in general, is both complex and as yet only lightly re-
searched. Most of the public probably know little about most specific reforms. Most of
them are also capable of simultaneously maintaining a spectrum of attitudes towards the
state apparatus, distinguishing between different groups of actors, different services, and
POLITICS AND MANAGEMENT 179
questions of greater generality or specificity. Some of their attitudes may be deeply
founded and hard to shift (for example, the widespread apparent support, in many
countries, for the continuance of the basic fabric of the welfare state), while other opinions
may be quite volatile, easily altered by new information or experiences. Thus bold asser-
tions that the public have lost confidence in public services, or that they ‘want’ less
bureaucracy, or that they are demanding higher quality, frequently turn out to be frag-
ile—and therefore inadequate as platforms upon which to erect specific programmes of
reform.
6.6 Politics and management: an overview
The relationship between politics, public management, and public opinion is a conten-
tious area, and one in which systematic data is at best patchy. Having made these caveats,
we will attempt to draw out a few broad propositions from the arguments and evidence
advanced above.
First, public management reforms have altered the relationships between elected and
appointed officials, in a number of countries and a number of ways. In this sense, at least,
they are not ‘neutral’. It seems likely that these changes have been greatest in the core
NPM countries, somewhat less in the northern group of European countries, and smallest
in the central European group. Second, there is an absence of convincing evidence
concerning the willingness or ability of executive politicians to fulfil the mandates they
are given within each of our three ideal models—but particularly the parts they are given
to play within the NPM and NPG frameworks. The kindest thing that could be said about
reform models which cast politicians in such roles would be that they are unproven and
seem to fly in the face of known incentives to behave in a more traditional ‘political’
fashion. Third, managers do appear to have gained extra authority in a number of ways,
but at the same time political control has been vigorously reasserted inmany of the twelve
countries. There is no necessary contradiction between these two developments—the
public sector is large and diverse enough for both to be happening at the same time. In
specific cases, however, there may be a quite definite tension. In some of these cases, this
has taken the form of difficulties between career civil servants and the enlarged ring of
political advisers who surround and attempt to protect ministers. In others, civil service
managers, granted greater autonomy, have behaved too entrepreneurially, and have taken
risks or made decisions which have brought embarrassment to their political bosses.
Fourth, any suggestion that public management can be radically depoliticized (in the
sense of ‘political’ outlined above) is either a misunderstanding or is contradicted by
evidence from many countries. The allocation of, say, health care resources or decisions
about educational standards or major public infrastructure projects are all inherently
‘political’ decisions, whether they are taken by powerful politicians or tough public
managers (or, indeed, medical doctors or teachers). The public will often see the political
authority as ultimately responsible—or, at least, sharing responsibility—however much
ministers may protest that these are technical or professional decisions which have been
taken by the appropriate officials. Fifth, there is a certain ambiguity in much of the
180 POLITICS AND MANAGEMENT
rhetoric around strengthening accountability and increasing transparency, insofar as
some executive politicians have used the new politics/administration split to redefine
policy weaknesses as managerial (‘operational’) failures. This enables political leaders to
shuffle off direct responsibilities for things going wrong—or, at least, to try to. Further-
more, it appears that legislatures have been slow to take up and use the increased flow of
performance data which greater transparency and the contemporary emphasis on outputs
and outcomes affords. With Chapter 5 in mind, one might say that even when a ‘real
result’ manages to climb over the conceptual, methodological, and political barriers, and
escape into the wider public world, it is often left wandering around looking for an
audience. Sixth, any simple picture of public opinion as being ‘for’ or ‘against’ ‘big
government’ is misleading. Such evidence as is available shows that, however limited
the public’s knowledge may be of the specifics of reform, popular attitudes towards
government are multi-faceted and, in some respects, quite sophisticated.
One further conclusion that might be drawn is that there is a strong need for a more
realistic model of the role politicians can and should play in the running of the state
apparatus. Neither the representative democracy/public-interest model of the Anglo-
Saxon countries nor the continental Rechtsstaat model seems sufficient to cope with the
new forms and practices which have emerged. It is not so much that these traditional
models are wrong, more that they are, by themselves, inadequate to present-day circum-
stances. More controversially, one might suggest that any rethinking of these matters
ought to focus at least as much on the induction and training of politicians, and on the
framework of incentives and penalties surrounding them, as on reforming the public
service or yet again reshuffling its organizations. Why is it usually assumed that it is the
civil servants who are in need of reform, but not ministers or the other politicians who
may hope to becomeministers in due course? This is not to advocate somemodern version
of Platonic guardians and neither, certainly, is it a plea for MPs to be forced to take MBAs.
However, it is to suggest that the preparation of politicians for high office has, in many
countries, been a ‘no-go’ area for reformers for too long. If it is in fact the politicians
themselves who are most widely and deeply distrusted, then perhaps there are sound
democratic reasons for bringing their readiness for the tasks they are confronted with to
the fore as an item on the agenda for public debate.
POLITICS AND MANAGEMENT 181
7 Trade-offs, balances,limits, dilemmas,contradictions, andparadoxes
[T]he major paradoxes, with their unpalatable medium term and long term
implications, appear to be general and permanent in character and seem to be rooted
in misunderstanding, in the policy contradictions which characterise the reforms
and in the naivete of the reformers themselves.
(Wright, 1997, 12)
7.1 Reform optimism/memory loss
A prominent, but frequently unremarked feature of the public sector reforms of the last
twenty years has been a large optimism about the potential of management itself (Pollitt,
1993, pp. 1–5). Few boundaries seem to be envisaged for the exercise of this set of dynamic
and purportedly generic skills. At the beginning of the most intensive period of reform a
British cabinet minister expressed himself thus: ‘Efficient management is the key to the
[national] revival . . . and themanagement ethosmust run right through our national life—
private and public companies, civil service, nationalized industries, local government, the
National Health Service’ (Heseltine, 1980). Such optimism stands in contrast to an older
tradition of speaking andwriting about the running of public sector organizations, one that
sees these activities as subject to a number of widespread, ‘built-in’, and possibly inevitable
limitations and trades-off. In traditional, permanent bureaucracies, cautionary wisdom
about such administrative constraints was built up, case by case and over time, and used
by seasoned career officials to warn politicians of the likely limitations of their proposed
innovations (which, in administrative form, were seldom as novel as the politicians may
have supposed). Since the 1970s, however, in the most radically reforming countries, this
kind of cautious mandarin has gone out of cultural fashion in favour of the ‘can-do’ chief
executive (see Pollitt, 2003a, chapter 7 for an analysis of management gurus and the
representation of managers as heroes and visionaries, and Peters and Pierre, 2004 for an
account of the politicization of the higher civil service). Furthermore, in these same
countries, a combination of downsizing, the spread of term contracts for senior officials
and higher rates of turnover of various categories of staff has operated to shorten
institutionalmemories, so that fewer and fewer in the organization are likely to knowof the
precedents of ten or twenty years ago, or to wish to bring these inconveniences to the
attention of their political masters (Pollitt, 2000, 2008).
The grip of the ‘lessons of history’ has been further weakened by the popularity of the
notion that, catalysed by rapid economic and technological change, the business of
management is constantly confronting new challenges, and therefore, by implication at
least, rapidly leaving old concerns far behind. Best-selling texts with titles such as Thriving
on Chaos: A Handbook for a Management Revolution (Peters, 1987) or Re-engineering the
Corporation (Hammer and Champy, 1995) have encouraged the belief that the past is
irrelevant. Consider the following advice from the founding fathers of re-engineering:
Re-engineering is about beginning again with a clean sheet of paper. It is about rejecting the
conventional wisdom and received assumptions of the past. Re-engineering is about inventing
new approaches to process structures that bear little or no resemblance to those of previous
eras. (Hammer and Champy, 1995, p. 49)
It might be objected that the cited sources are concerned with the private sector. In fact the
management ‘gurus’ in question insist that their insights apply to all organizations (see,
e.g. Hammer and Champy, 1995, pp. 218–19), and their work has certainly been taken up
and noticed by governments in a number of countries. Furthermore, there is a parallel
stream of rhetoric specifically focused on government. Probably the most read and talked-
about English language text on government reform of the last decade is replete with
declarations such as the following:
the bureaucratic model developed in very different conditions from those we experience
today. . . Today all that has been swept away. We live in an era of breathtaking change . . . Today’s
environment demands institutions that are extremely flexible and adaptable . . . It demands
institutions that empower citizens rather than simply serving them. (Osborne and Gaebler, 1992,
Reinventing Government, p. 15)
Without wishing to deny the evident truth of changing conditions for government, we do
wish to register some scepticism concerning what one might term the ‘history is dead,
everything is new’ school of management thought. On the contrary, as governments have
geared up to tackle the problems of the late twentieth century, the record (as we read it)
shows many examples of old constraints and trades-off reappearing in new clothes.
In this chapter, therefore, we wish to take seriously the concept of there being intrinsic
constraints and limits to administrative reform. This is hardly revolutionary. It has been
espoused, in different ways, by a number of the most distinguished academic writers on
public administration and management. For example, just after the Second World War,
Herbert Simon famously noted that the ‘principles’ of public administration were more
like proverbs and, like proverbs, tended to come in contradictory pairs (Simon, 1946).
Charles Perrow envisaged bureaucratic processes as being inherently beset with dilem-
mas, in which to organize in one way was inevitably to pay a serious price in another
(Perrow, 1972). Christopher Hood developed an extended typology of ‘limits’ to admin-
istration, in which administrative dilemmas and non-linearities commonly conspired to
distort the process of implementation in the direction of inefficiency, corruption, or even
counter-intentional effects (Hood, 1976). Hood and Jackson, following in the footsteps of
TRADE-OFFS, BALANCES, LIMITS, DILEMMAS, CONTRADICTIONS 183
Herbert Simon, later drew attention to the way in which administrative arguments often
come in matching pairs, with advantages and disadvantages trading off as one moves
from one polar principle to its opposite (Hood and Jackson, 1991). More recently, Hood
has articulated an even more elaborate scheme of constraints, using grid/group cultural
theory in an attempt to demonstrate that each administrative philosophy carries not
only intrinsic limitations but, beyond that, the seeds of its own decay (Hood, 1998; see
also 6, 2004). One of us has traced the way in which administrative fashions have swung
between centralization and decentralization (Pollitt, 2005). Many other writers have
noted a tendency for organizations’ reforms to move in cycles or waves (e.g. Davis
et al., 1999; Light, 1995; Talbot and Johnstone, 2007). Recently one group of scholars
produced a whole book about the ‘paradoxes of modernization’, subtitled Unintended
Consequences of Public Policy reform (Margetts et al., 2010).
Whilst we do not follow any of these authors exactly, we do believe that their shared
perception that the administration of public programmes commonly exhibits deep-
seated and recurring types of dilemmas and contradictions—and therefore limits and
cycles—is accurate. The substitution in Anglophone environments of the magical word
‘management’ for the unfashionable ‘administration’ does little to change the types of
limits with which these analysts were concerned (though it may lead to an increase in
the proportion of certain types of problem in relation to other types). Obtaining reliable
information about tax-evasion behaviours or coordinating a variety of agencies which are
all delivering services to the unemployed are activities which pose fundamentally similar
organizational problems whether the public officials concerned deem themselves to be
rule-following bureaucrats or performance-chasing managers. Neither do the wonders of
information technology dissolve the need to balance, choose, and recognize limits.
Vastly improved capacities for data processing and rapid communication certainly
make possible styles of governance, coordination, and (not least) supervision which
were difficult or unachievable previously. However, ICTs cannot resolve logical contra-
dictions, bruised motivations, ergonomic constraints, or problems of competing and
divergent values (Hudson, 1998). They may, however, help decision-makers to muster a
clearer or more detailed picture of the options before them—whether this clarity is
welcome or not.
To further investigate these limits and contradictions we will take three steps. First (7.2),
we will attempt to define the various kinds of problem concept a little more precisely.
Second (7.3), we will list some contemporary candidates for trade-offs, limits, etc. Third
(7.4–7.11), we will examine each of these candidates in more detail, relating them to the
empirical material offered elsewhere in this book, and also to the three main models of
reform that we introduced in Chapter 1. We end with a short, reflective summary.
7.2 The vocabulary of balance and contradiction
Thus far we have referred to ‘constraints’, ‘limits’, ‘trades-off’, and ‘problems’. In an
attempt to be slightly more precise we will henceforth distinguish between:
Trade-offs: where having more of one desideratum, or lessening one problem, inevitably
diminishes some other wished-for quality or increases a different problem. This is
184 TRADE-OFFS, BALANCES, LIMITS, DILEMMAS, CONTRADICTIONS
therefore a situation where decision-makers are obliged to balance between different things
which they want, but cannot feasibly have more of all at the same time—indeed, where to
have more of one entails having less of another. An example that Hood (1976) gives is that
of appointing long-serving local officials, which is likely to increase local knowledge and
continuity but simultaneously to increase the number of instances where the local officials
‘go native’ or succumb to the temptations of corruption. On the other hand one can send
in mobile officials whose allegiances are to the centre and who know they will soon be
posted on elsewhere. Choosing this second route reduces corruption and the dangers of
the official developing excessive sympathy for the perceived difficulties faced by the
administered local population, but it also reduces the local knowledge available to the
administering organization, and thereby increases the chances that the local population
are managing to evade or pervert the intended system of controls. Trade-offs can easily
lead to cycling, as going one way eventually produces drawbacks (corruption among long-
serving locals) so that the alternative begins to look more attractive, until, that is, the
drawbacks of the other course also become manifest—in the above case the lack of local
knowledge on the part of the loyal, but short-term incumbents posted from the centre.
Then the return swing begins.
Limits: we will use the dictionary definition of a limit as ‘a point, degree or amount beyond
which something does not or may not pass’ (Harrap’s Chambers Encyclopedic English Dic-
tionary, 1994, p. 741). Can there be limits of this kind to reforms? Yes: for example, more
efficientmanagement of hospital in-patients can reduce the average lengthof stay for certain
surgical procedures by 20 per cent, or 30 per cent, or evenmore. This frees up bedspace for a
higher patient throughput, shorter waiting times, and so on. However, the length of stay for,
say, an artificial hip replacement cannot be reduced to zero. At any given state of medical
knowledge and technology there will be limits of this kind. Similarly, the cost of identifying
and fining a speeding motorist can be greatly reduced by the installation of automatic
cameras and computerized billing of fines, but some cost will remain. One danger for
management is to believe that a particular process of reform that yielded X per cent savings
or a Y per cent speed-up last year can be made to do the same thing this year and next year.
Another type of limit which frequently occurs in public administration is the error rate.
Errors occur in classifying things and people, inmaking payments, in recording observations
and measurements, and so on. Good management may well be able to reduce these rates
from, say, 10per cent to2per cent, but theyoften cannot reduce themfrom2per cent to zero,
and to try to do so can result in a great deal of wasted effort.
Dilemmas: situations in which the manager is faced with a choice of two or more unsatis-
factory alternatives, that is, in which the available decisions about a given problem cannot
be made in such a way as to solve the problem, but only to substitute one set of undesirable
features for another. A dilemma is thus the limiting case of a trade-off, in that it is a trade-off
in which the situation remains negative whichever option is chosen. Sometimes rooting
out public service corruption and/or incompetence may take on the characteristics of a
dilemma. To publicize the problem lowers the standing of that part of the public service,
undermines public trust, and may even encourage increased citizen recalcitrance (‘why
should I pay my taxes if they are putting them in their own pockets?’). On the other hand,
TRADE-OFFS, BALANCES, LIMITS, DILEMMAS, CONTRADICTIONS 185
not to publicize the problem may allow it to continue and can prevent the formation of a
sufficient coalition of support to ensure that real action is taken.
Another concept to which we will resort is the paradox. Paradoxes are seeming contra-
dictions: statements which appear self-contradictory and false, and yet may contain a
particular kind of truth. The dictionary example is often ‘More haste, less speed’. Some
commentators have found a whole string of paradoxes entwined in the rhetoric and
practice of contemporary administrative reform (Wright, 1997). Some of these are pitched
at the level of whole countries or systems, others at the level of specific institutions or
practices. Wright begins his account with a striking example of a macro-paradox:
The first major policy paradox is that the most radical reform programmes appear to have been
introduced in countries with the most efficient administrations, in other words, in those countries
with the least need! (Wright, 1997, pp. 9–10)
Earlier chapters in this book have contained some possible reasons for this curious state
of affairs. Perhaps (chapter 3) it has been the countries which are constitutionally and
politically most able to make big changes to their administrative arrangements that have
done so. Yet these are also probably the countries which had already made significant
modernizations of their public sector organizations in the past (for the same reason). However,
our account here will mainly address more specific propositions within the portfolio of
current reform ideas. One might argue, for example, that the statements which have been
made in a number of countries to the effect that public management reforms will make
public servants more accountable to political leaders and simultaneously more accountable to
the citizens who use public services, though appealing, are paradoxical. How can public
officials serve two masters, masters who are quite unlikely to have identical needs or
preferences? Further examples occur when policymakers say that they intend to empower
middle managers in the public service whilst at the same time radically downsizing the
numbers of that group who will continue in public employment. Perhaps these apparent
dissonances can be harmoniously reconciled, but it is not immediately obvious how.
It must be allowed that sometimes, at least, what sounds to be an incompatibility is an
incompatibility, and cannot be reconciled. In such cases we may speak of straightforward
contradictions. Guy B. Peters is one comparativist who has suggested that, while the contem-
porary nostrums of public management reform appear to contain a number of contradic-
tions, some at least of these can be resolved into a question of finding an appropriate balance
rather thanaquestionof choosing betweenwholly incompatible alternatives (Peters, 1998a).
In effect he is saying that some contradictions are really trade-offs rather than absolute
contradictions. Thus one may think of a contradiction as a case of a very steep-sided trade-
off—that is, as a situation in which having more of one benefit immediately and sharply
reduces another benefit. Now we turn to more specific cases.
7.3 Public management reform: some candidatecontradictions and trade-offs
As noted in Section 7.1, many writers have noticed apparent contradictions or tensions
within the body of contemporary management prescriptions. We will draw on these to
186 TRADE-OFFS, BALANCES, LIMITS, DILEMMAS, CONTRADICTIONS
compile our own shortlist of ‘candidate contradictions’—sets of prescriptions which at
first sight appear incompatible, or at least unstable, and which therefore merit further
discussion and investigation. The shortlist does not pretend to be exhaustive. It is nomore
than a selection of issues where there is some empirical evidence that problems have
indeed occurred—illustrative but not comprehensive.
Our list includes some (seemingly) incompatible paired statements and some more
complicated/less obvious combinations. Each will be explained in the sections that follow.
The shortlist is set out below:
1. Increase political control of the bureaucracy/free managers to manage/empower service
consumers.
2. Give priority to making savings/improve public service quality.
3. Promote flexibility and innovation/increase citizen trust and therefore governmental
legitimacy.
4. Motivate staff and promote cultural change/weaken tenure and downsize.
5. Reduce burden of internal scrutiny and associated paperwork/sharpen managerial
accountability.
6. Develop more partnerships and contracting out/improve horizontal coordination
(‘joined-up government’; ‘integrated service provision’).
7. Increase effectiveness/sharpen managerial accountability.
8. Promote open government and transparency/protect privacy.
7.4 Increase political control of the bureaucracy/freemanagers to manage/empower service consumers
Each of these three prescriptions features regularly in the rhetoric of public management
reform. There is no doubt that reform leaders such as (among others) Thatcher, Reagan,
and Mulroney wished to reassert (as they saw it) political control over the bureaucratic
machine (Savoie, 1994). It was part of the NPM formula. It was also an intention among
the French political leadership (Rouban, 1997), at least some elements among Swedish
politicians (Pierre, 1995), and the Australian Labor governments of the 1980s (Halligan,
1997). Equally, there is no doubt that increasing the freedom managers have to manage
has been a recurrent theme in countless texts and speeches—though more so for those
favouring an NPM approach than those who prefer NWS or NPG. For example, a key line
in the report which led to the UK’s creation of 130 plus executive agencies, employing
more than two-thirds of the non-industrial civil service, was: ‘At present the freedom of an
individual manager to manage effectively and responsibly in the civil service is extremely
circumscribed’ (Efficiency Unit, 1988, p. 5).
Finally, the empowerment of customers is a theme which has been repeatedly on the
lips of politicians bent on reform, especially in the Anglo-Saxon countries. One US
National Performance Review document puts it like this: ‘Once President Clinton signed
TRADE-OFFS, BALANCES, LIMITS, DILEMMAS, CONTRADICTIONS 187
the Government Performance and Results Act in August 1993, strategic planning and
listening to the ‘‘voice of the customer’’ was no longer just a good idea—it was the law’
(National Performance Review, 1997b, p. 6). However, this theme is by no means con-
fined to those of an NPM-ish tendency. Both NWS and NPG have their own versions of
customer empowerment. Within the NWS it is a question of improving official consulta-
tion with citizens before new policies and projects go ahead. The modernized bureau-
cracy is to be a ‘listening organization’: the state is to be a friend and partner, not a stern
schoolmaster. For NPG it is a matter of government working through networks that
include representative groups of citizens, be they residents (for planning issues), patients
and carers (for health care issues) or drivers and passengers (for public transport issues).
Optimal polices will emerge (or be ‘co-produced’) from horizontal networks of participat-
ing stakeholders. Thus the empowerment/participation theme appears in all three of our
models, and has many different aspects and angles (Pollitt, 2003a, pp. 83–111).
The problem with these superficially attractive formulations can be encompassed in the
question ‘How is it possible to give managers greater freedom and yet at the same time
place them more under the control of ministers and oblige them to be more responsive to
newly empowered consumers?’ Is it conceivable that all three corners of this triangle can
be strengthened simultaneously (minister power, manager power, consumer power), or is
this simply a contradiction? As Hood (1998, p. 208) puts it: ‘Since not everyone can be
‘‘empowered’’ at the same time, who exactly is to be empowered against whom, and how, is
a key test of cultural bias in visions of modernization.’
If it is assumed that the appropriate concept of power and authority in this case is zero-
sum (i.e. power is a fixed quantum, so that a gain here must be balanced by a loss
somewhere else), then this particular NPM ‘recipe’ is a three-way contradiction. However,
it is possible, on the basis of a different assumption, to interpret these claims in a more
sympathetic (or at least paradoxical) light. Such a sympathetic reading might run along
the following lines:
1. Managers can have greater freedom over the marshalling of their resources (combin-
ing inputs and processes in different and perhaps innovative ways) while at the same
time ministers are offered a clearer picture of what is achieved—the outputs and
outcomes of all the newly unencumbered management activity. So both politicians
and managers can increase their control—though of somewhat different things. The
clearest expression of this philosophy has been the New Zealand system in which
ministers are deemed responsible for objectives and outcomes, and they then contract
with the heads of departments (chief executives) for packages of measured outputs
that are calculated to produce the desired outcomes (Boston et al., 1996; Halligan,
1997).
2. Similarly, empowered consumers (or citizens) may have access to better information
about the performance of a service, and may enjoy improved means of complaint/
more efficient redress if things are not to their liking, and may participate in planning
and prioritizing the service through a variety of mechanisms (these empowerments
manifesting themselves in the shape of charters, better complaints systems, user
panels, etc.—though whether the majority of citizens actually want to spend more
time doing these things is an open question). At the same time, managers can gain
188 TRADE-OFFS, BALANCES, LIMITS, DILEMMAS, CONTRADICTIONS
new freedoms to arrange their resources in ways that are calculated to maximize
consumer satisfaction. There is no necessary contradiction between these two separate
but complementary spheres of autonomy.
3. Thus, all three groups—politicians, public service managers, and public service users—
can gain greater control, each in their own corner. Power is not zero-sum but rather
variable: everyone can be a winner.
Is this a convincing defence against the charge of contradiction? Perhaps, but only if some
rather demanding conditions are met. Three deserve particular mention. First, politicians
must refrain from interfering in the management sphere (the allocation, manipulation,
and combination of different kinds of resource; the motivation of staff; the establishment
and maintenance of suitable organizational structures, systems, and processes) and con-
fine themselves to setting strategies, scrutinizing ‘results’, and taking action if the results
are short of target. Second, the priorities and targets handed out by the political leaders
must be both clear and reasonably congruent with the demands and expectations of
consumers (otherwise managers will be being asked to dance simultaneously to two
discordant tunes). Third, where there are different organizations and levels involved in
service delivery (as there very frequentlywill be), allmustworkwithin the same, shared set of
objectives, targets, values, and—to some extent at least—procedures. Otherwise there is the
likelihood that managers will receive conflicting messages from above and consumers will
encounter different priorities, standards, and attitudes in different parts of the ‘shop’. If one
ormore of these conditions is transgressed, the likelihood of the triangle being squared (so to
speak) will be reduced.
The question of how often the above conditions actually are met (and how often they
are not) is an empirical one, and the rate may vary with regime type, organizational
culture, political ideology, and so on. Insofar as governments attempt to pursue the
different visions of NPM, NWS, and NPG, one might expect different rates of different
types of failure. Under NPM, in practice, politicians seem to want more control rather than
less—which threatens managerial autonomy rather than enhancing it. Certainly, in a
number of our countries, doctors, headteachers, social work managers, and many civil
servants would see themselves as more closely measured and monitored than, say, thirty
years ago. And the NPM doctrine that big multi-purpose bureaucracies should be broken
up into smaller, more nimble, single-purpose agencies is likely to make joined-up service
delivery more, rather than less difficult to achieve. Within an NWS perspective achieving
overall coherence across services and sectors may be a slightly less formidable challenge,
but the problems of reconciling popular citizen demands received through participative
channels with political directives coming down from ministers are just as tricky as within
an NPM model. As for giving managers more autonomy, that has (rhetorically at least)
been less of a priority within continental European states than in the core NPM states.
Insofar as managers become more professional, it may be possible for them to have more
autonomy from direct political control, but only as long as they operate within clear
professional guidelines and standards. Coming to NPG, its more disaggregated and fluid
vision of governance makes the achievement of common standards and joined-up deliv-
ery even more problematic than under NPM. There is also an implication that managerial
autonomy will not be a high priority—instead managers will be expected to perform
TRADE-OFFS, BALANCES, LIMITS, DILEMMAS, CONTRADICTIONS 189
‘boundary-spanning’ roles, liaising between different stakeholder groups in an endless
search for (shifting) consensus and network legitimacy. More importantly, perhaps, in a
network model the elected politicians lose some of their specialness—they are no longer
the unique bearers and arbiters of the general interest, so, far from reasserting control, they
are supposed to be sharing it (Pollitt, 2003, p. 65).
Empirically, it is clear that there have been many occasions in many countries when the
vision of mutual, three-cornered empowerment has been announced but not achieved.
Some have been recounted earlier in this book. Particularly in welfare state services such as
health care, education, personal social services, and social security the figure of the
empowered service user has in practice been hard to find (e.g. Clarke and Newman,
1997, chapter 6; Evers et al., 1997; Fl€osser and Otto, 1998; Harrison and Pollitt, 1994,
pp. 125–34). ‘Shop front’ public service staff may have had customer service training and
been enjoined to deal more flexibly with individual service users, but meanwhile man-
agers seem often to have extended their domain without conceding any substantial space
for ‘consumer power’. In other cases, managers have been pulled in different directions by
irreconcilable demands from political bosses and service users (see Pollitt, 2003a, chapter 4
for an extended analysis of these issues).
Nor is the evidence on the second side of the triangle especially encouraging. As we saw
in the previous chapter, politicians have not been spectacularly willing to relinquish their
former habits of detailed intervention. In some research, managers have recorded more
political ‘interference’, not less (Halligan, 2002; Talbot, 1994). In a number of countries,
ministers have appointed extra political advisers and taken other steps to tighten, not
loosen, their grip on what their officials are saying and doing (Peters and Pierre, 2004;
Chapter 4, Sec. 4.6, above). Nor have ministers necessarily been prepared to spell out their
values in a sufficiently precise manner to give managers a clear set of priorities to work to
(and therefore, by derivation, a clear set of targets to aim at).
As for the achievement of coordination between different levels and types of organiza-
tion (the third condition), there can be no doubt that ‘partnership’ and ‘networking’ have
become extremely fashionable in most of our ten countries and with the EU Commission
(e.g. Chancellor of the Exchequer, 1998; Osborne, 2000, 2010; Rosenau, 2000). Being in
fashion and being well understood are, however, not at all the same thing. A now
substantial literature demonstrates that most governments are still on the steep part of
the learning curve as far as these pluriform approaches to service delivery are concerned
(e.g. Davies, 2009; Christensen and Lægreid, 2007b; Lowndes and Skelcher, 1998; Peters,
1998b). The available ‘technologies’ for ensuring ‘seamless’ service are therefore still
experimental and uncertain, so it would be reasonable to conclude that the third condi-
tion cannot be satisfied regularly and with certainty.
To sum up: first, the reformers’ claims to empower consumers, free managers, and
strengthen political control are not always and not necessarily contradictory. Unfortu-
nately, however, the conditions for their simultaneous achievement are difficult to culti-
vate, so that, in practice, these three aims often do collide or, perhaps less dramatically, one
or more of them is simply sidelined or forgotten. In a perfect world the three objectives
might be compatible. In the real world public managers usually find themselves facing
trade-offs or even downright contradictions. In the post GEC circumstances of severely
reduced expenditure (in some countries) the perfect world may be further away than ever.
190 TRADE-OFFS, BALANCES, LIMITS, DILEMMAS, CONTRADICTIONS
7.5 Give priority to making savings/improvingpublic sector quality
At the time of writing this is a particularly prominent issue. In many countries politicians,
faced with the need to cut public expenditure in the aftermath of the GEC, are claiming
that cuts can be made—or most of them can be made—without reducing the quality of
basic public services. Indeed, some of them are claiming that the quality of services can
continue to improve while major financial savings are nevertheless harvested. Such claims
have evoked widespread scepticism among expert commentators as well as among public
servants themselves.
Yet to suppose that expenditure reduction and improvement were always diametric
opposites—irreducible contradictions—would be highly simplistic. Tighter control of
public expenditure has figured as one of the most frequent and most powerful motives
for public management reform—in almost every country we have surveyed. Some of these
reforms have been widely beneficial, and some have undoubtedly achieved the twin
desiderata of ‘working better and costing less’. New technologies and new organizational
processes have both played their parts in such successes. For example, sharing buildings
and computer systems between different agencies can simultaneously reduce costs and
make access simpler for citizens (HM Treasury, 2010).
We should also note that it is sometimes possible to sidestep the apparent contradiction—
at least on the level of concepts and rhetoric. In the field of social security in the UK, for
example,much effort has been concentrated on improving the process of claiming—training
counter staff to bemore friendly, smartening up premises, speeding up processing activities,
and so on. Not unreasonably, this is often referred to as ‘quality improvement’. Meanwhile,
however, the actual benefit levels have been tightly controlled, and, in the cases of a number
of benefits, eligibility categories have been narrowed. Thus is the paradox ‘resolved’—expen-
diture (substance) is reined in, but ‘quality’ (process) is improved. The benefit claimant loses
some purchasing power, but the process of getting the money becomes quicker and more
civilized.
A further step is to see that the apparent contradiction between cuts and quality
actually has a paradox folded within it. This ‘nested’ paradox is that the apparent
contradiction is more likely to become a real one in those jurisdictions which are already
most efficient in service delivery. This is because the ability to make savings and at the same
time improve service seems to be closely connected with the amount of spare capacity in
the system (Murray, 1998), and the most efficient jurisdictions are those which are
carrying the least spare capacity. In jurisdictions which are already super-efficient there
is no ‘fat’ left to cut, and enforced economies are bound to carve into the bone of real
services. For politicians, ‘waste’ is a wonderful thing—so long as one can claim to find
more of it, one can also promise to cut relatively painlessly. And since ‘waste’ is a concept
that is hard to define and operationalize, there is always room to argue that there is more
waste ‘in there’ to be found. Popular anti-bureaucratic rhetoric encourages the belief that
waste is widespread and can be readily identified and punished. However, a more sophisti-
cated view, proposed by a long line of organization theorists and public administration
TRADE-OFFS, BALANCES, LIMITS, DILEMMAS, CONTRADICTIONS 191
scholars, would be that a certain amount of ‘redundancy’ or ‘slack’ in an organization is
essential to facilitate innovation, flexibility, and positive workforce attitudes (Berg, 2010).
Yet another step is to acknowledge that technological advance will sometimes be able to
‘solve’ the apparent contradiction. A technological leap forward may enable managers of a
public service simultaneously to save money and to push up quality and productivity (see,
e.g. some of the examples in National Audit Office, 1999). There is an empirical question as
to how often such technological breakthroughs occur, and there is a further empirical
question about how well new technologies are implemented (Margetts et al., 2010; Hud-
son, 1998; Dunleavy et al., 2006a). Nevertheless, new ICTs will sometimes be able to
resolve the contradiction, which is no doubt one reason why they are such a universal
favourite as an ingredient of the rhetoric of public management reform.
We are left, then, with a context-dependent view of the apparent contradiction between
improved performance and expenditure savings. In contexts where a system is already fairly
efficient, and where there is no technological breakthrough to hand, the contradiction may
be real—cuts will diminish quality. The argument in favour of ‘slack’ or ‘redundancy’ is an
argument for a modest margin, not for a large slice (which would then become genuine
‘waste’). Therefore in much less efficient systems, the contradiction can be circumnavigated
by removing excess spare capacity/waste. In systemswhere technological change is rapid, the
contradictionmay sometimes be solved by technological innovation, assuming it is compe-
tently implemented. There is a final, important point. Sizematters. Preserving or enhancing
quality is likely to bemuch less difficult if the size of the cut is 3–5 per cent rather than 20–30
per cent. One of the reasons why much of the independent commentary on the UK Labour
and Conservative governments in 2009 and 2010 was so sceptical was that they were
promising that the ‘front line’ of public services would be preserved despite the fact that
very large cuts were clearly coming down the pipeline.
Do these conclusions apply equally to all our three main models? In the broadest sense,
probably yes. However, the types of contexts most frequently faced are likely to differ as
between the three visions, and in that sense one could say that NPM, NWS, and NPG refract
the cuts and quality problem in different ways. From within an NPM perspective, cuts versus
quality resolves itself into a question of efficiency andmanagement. If waste can be reduced—
often by the application of market-type mechanisms—then quality can be preserved while
economies are secured. Quality standards are written into formal contracts (with external
providers) or quasi-contracts (with government agencies) to ensure that the achievement of
budgetary targets is not at the expense of service quality. If the provider substantially fails to
achieve either thebudgetaryor thequality targets, thenanother,more efficient provider canbe
brought in. Quality is, in effect, packaged up into an annually re-defined set of indicators.
The cuts and quality problem is seen somewhat differently from within an NWS perspec-
tive. Here quality is more a matter of publically motivated professionalism—of constantly
supporting and re-inforcing a sense of bureaucratic pride and commitment to continuous
improvement. If cuts have to be made, then they will need to be carefully prioritized in
terms of overall government policy, and subsequently every step must be taken to support
public organizations to make the necessary economies with the minimum damage to
motivation, trust, and longer-term organizational capability. These values and capacities
are seen as the underpinnings of real, professionally led quality, a quality that does not have
to be beaten into service organizations by targets and penalties, because it is already deeply
192 TRADE-OFFS, BALANCES, LIMITS, DILEMMAS, CONTRADICTIONS
embedded in the public service culture. The public will trust these organizations (it is hoped)
because they represent continuity and reliability, not something which is contracted out
and ‘performed’ in order to fulfil a temporary contract. Greater efficiency is, of course, very
important, and modern professionals will possess the management skills to seek it out. But
they will do this not so much because it is a target in their annual appraisal as because to
improve efficiency is part of a larger, internalized, self-image and organizational culture of
modernized, citizen-oriented service provision.
The NWS and NPM visions are both too narrow for advocates of the NPG. In this model
cuts and quality are not matters for the government alone or even (as in NPM) for
government and its contractors. Both budgets and quality standards are things which
will have to be negotiated through networks of stakeholders. No central authority can
‘impose’ them on everyone else. Solutions may be diverse: in one sector, stakeholders may
be prepared to tolerate some lowering of standards in order to save money, whilst in
another sector citizen groups or civil society associations may decide to pay more (fees
or taxes) in order to prop up the standards of some particularly valued service.
The problems with each of these ‘solutions’ are fairly obvious. What if the NPM man-
agers cannot find the necessary efficiencies? Or what if contractors talk of efficiencies but
actually implement hidden quality reductions in complex services (such as health care or
education) where quality is hard to pin down and define in a contract? What if the faith
the NWS advocates place in right-thinking public service professionals proves misplaced,
and these individuals prove to be self-interested first and citizen-oriented only second? Or
what if the public service managers are simply not very good managers, and, too cosy in
their secure jobs, are low on innovation and unimaginative in hunting down new ways of
improving efficiency? What if the networks of NPG just fail to agree on a way of dealing
with a painful budget situation, with different stakeholders ‘passing the buck’ to others?
Or what if different parts of different networks agree to different kinds of solution,
generating a patchwork of measures that are neither equitable nor egalitarian from the
overall perspective of citizens? All of these risks are real, and any of them may result in
unfair, inequitable cuts or unfair, inequitable losses of quality.
7.6 Promote flexibility and innovation/promotecitizen trust and increase legitimacy
The possible contradiction between these two appealing propositions is not necessarily
obvious. The tension arises in those situations where continuity, trust, and predictability
are likely to be the qualities most sought after by the majority of service users. In such
circumstances the excitements of constant change and innovation become counter-
productive. Confusion and mistrust may grow. Take, for example, the issue of local
post offices, which have been a focus for debate in a number of our countries, including
Finland and the UK. Many small, (often rural) post offices are uneconomic to maintain.
Therefore efficiency-promoting innovations are proposed (remote electronic means of
conducting the same transactions; the relocation of the postal services in local shops
TRADE-OFFS, BALANCES, LIMITS, DILEMMAS, CONTRADICTIONS 193
rather than separate premises, closures). However, the public reacts against these ‘im-
provements’. At least one section of the public values the cultural and social aspects of
the local post office—they want stability and continuity. In Finland it seems that some
persons trust a post office with their personal business but do not wish to reveal details of
the same to their local shopkeeper (an interesting example of the public servant being
perceived as more trustworthy than the business person). In the UK, the post office is
sometimes claimed to be the last social centre or meeting place in small rural settlements
(Business and Enterprise Committee, 2009).
Part of the problem with innovation is that it frequently requires users as well as service
providers to learn new tricks. This tends to be far more difficult for some sections of society
than for others, and innovations thus, unintentionally, acquire inegalitarian aspects. One
could see this in the post office example mentioned above: citizens in rural areas lose their
post offices and may have to learn to use remote systems; citizens in big cities get to keep
them. More generally one can consider the extensive academic debate around the ‘digital
divide’—the ever-widening chasm between those citizens who can and do use computers
and those who can’t or won’t (Castells, 2001; Fountain, 2001; Norris, 2001). As more and
more public services go on-line the social and political handicap of not being able to use
electronic channels becomes more profound. Optimists believe this divide is becoming
less important as the older, non-computerized generation dies out, and in a number of
countries governments have attacked the problem (with some success) by subsidizing the
extension of broadband Internet connections. Even if this is true, however, the digital
divide is only one of a series of divides that will constantly appear in a highly technological
society subject to rapid change. If it is not Internet access then it will be mobile phones or
access to advanced medical technologies or an inability to use some other new and
sophisticated device.
A case which affects many millions of citizens in a number of countries is that of
pensions. Governments have, in several instances, come to realize that their previous
planning of pensions has been inadequate, and that they are unlikely to be able to afford
all the demands thatwill fall on them in the future, as the elderly increase as a proportion of
the total population. Legislation is therefore introduced to change national pension sys-
tems—sometimes restricting eligibility (usually by increasing the retirement age), some-
times changing terms, sometimes incentivizing citizens to take up private occupational or
personal pension schemes rather than rely on the state pension. Many innovations in
pension provision are attempted: some with very good intentions, some to save money.
The outcomes are mixed. One outcome has been that stability and predictability has been
lost in an area where stability and predictability over long time periods are of the essence.
Citizens have lost trust in the ability of the state to provide for their old age—there has been
considerable anxiety, and some commercial pension companies have taken advantage of
the confusion to advertise their wares (Marmor et al., 1990). In some cases, commercial
schemes have been perfectly satisfactory. In other cases there have been well-publicized
examples of schemes being very poor value for money, or of companies failing, or of
schemes being sold to citizenswhodidnot really need them, thus adding to public disquiet.
Thus attempts to innovate—at least some of them well intentioned—have ended up
damaging citizen trust and amplifying confusion and anxiety.
194 TRADE-OFFS, BALANCES, LIMITS, DILEMMAS, CONTRADICTIONS
Our overall analysis would be that there is no fundamental or universal contradiction
between innovation on the one hand and stability and continuity on the other. Indeed,
there are occasions when innovation is required in order to maintain continuity—such as
when back-of-office automation allows the same service to be delivered to a larger number
of users without unacceptable increases in cost. This having been said, however, there are
also specific contexts in which public managers do face at least a trade-off between innova-
tion and one or more of the values of stability, continuity, predictability, trust, and (as we
saw in some of the above examples) egalitarianism. Such contexts confront public service
managers with difficult problems of balancing divergent desiderata, and possibly disad-
vantaging certain sections of the community, even if an improved service is supplied to
other sections of a community. Given the pervasive cost pressures and the prominence
given to innovation within current reform ideology, it is likely that trade-off problems of
this kind occur quite often. It is not our impression that the literature on management
reform—either academic or professional—fully reflects this. Furthermore we should be
cautious in equating citizen trust of a particular service with citizen perceptions of the
legitimacy of governments or politicians (Chapter 5, Sec. 5.7, above; Van de Walle et al.,
2008). There are good reasons to doubt whether the two would usually be closely
connected, so even if successful innovations rapidly attract citizen support and trust, this
may well not translate into improved legitimation scores for the government.
Our threemodels could be said to give different emphases to the two sides of this equation.
Whilst, in the abstract, everyone is in favour of flexibility and innovation, and everyone is also
in favour of increasing trust and legitimacy, NPM, NWS, and NPM tend to focus most
intensely on different aspects. NPM has an efficiency focus, and innovation is seen as a
major way of cutting costs and increasing productivity. Trust and legitimacy have been
much less prominent concepts within the NPMdiscourse. Trust and legitimacy are, however,
more to the fore in theNWSmodel,where the credibility of representativedemocraticpolitics,
coupled with the professionalism and trustworthiness of the bureaucracy are prime foci.
Flexibility and innovation do have a place withinNWS, but mainly as adjuncts to the central
idea of a modernized, professional public service. Meanwhile NPG sees the involvement of
a wider range of stakeholders as the key to both more innovation and greater citizen trust.
A network approach is said to bemuchmore flexible than a traditional bureaucratic hierarchy
(though, in practice, networks can often turn out to be clumsy and slow-moving). It is also
claimed that wider participation will bring greater trust in its train.
7.7 Motivate staff and promote culturalchange/weaken tenure and downsize
A whole chapter of the US National Performance Review booklet Businesslike Government
was given over to ‘Creative License: Unleashing the Creative Power of Government Em-
ployees’ (Gore, 1997, p. 25). In many countries—particularly those where the civil service
was most harshly criticized during the 1980s—the mid and late 1990s saw attempts to ‘re-
vision’ and ‘re-motivate’ public servants. ‘The Public Service of Canada requires a
TRADE-OFFS, BALANCES, LIMITS, DILEMMAS, CONTRADICTIONS 195
transformation in its people, its culture and its leadership’, and ‘The Public Service of
Canada needs champions and leaders’ (Bourgon, 1998, pp. 21, 23). ‘We must restore faith
in the public service ethos, and convey the message that we can only deliver better
government if we harness and use the talents of the civil service and other public servants’
(Clark—the minister with civil service responsibilities in the new Blair government in the
UK—1997, p. 3). And so on. The contradiction here is with the threat to public service jobs,
security, and pay posed by expenditure cutbacks and management reforms. To tell public
servants that they are highly valued at the same time that many of them are being ‘let go’
may strike many public servants as ironic, or worse. Even the most sympathetic official
statements often contain a sting in the tail: ‘Absolute job security is not something that any
employee . . . can expect in the competitive modern world. But we do want to look at ways
of reducing insecurity, so as to minimize distractions from policy goals’ (Clark, 1997, p. 20).
Can this apparent contradiction be resolved? We find it hard to see how it could be.
Indeed, there have been obvious instances where the contradiction has been seen only too
clearly by the staff concerned (e.g. in New Zealand—Boston et al., 1996, pp. 211–24; in the
USA with respect to the NPR’s downsizing targets—Kettl, 1994, pp. 13–21; or during the
public service strikes in France in the mid 1990s). Phrases such as ‘expecting the turkeys to
vote for Christmas’ (UK) and ‘from rowing to steering to abandoning ship’ (USA) came our
way from public servants as we researched this topic.
That said, the contradictionmay be livedwith—even softened somewhat. Certain factors
promise to assist in this. To begin with, there is the brutal fact that the public servants who
matter most will be the ones who survive downsizing. It is possible to envisage—NPM
style—a smaller, less bureaucratic, more highly skilled, perhaps even better-remunerated
public service, within which morale could be restored and a new performance-oriented
culture solidly entrenched. Thosewho lose their jobs frequently also lose their voices—they
are now ‘outsiders’, at best an embarrassment to the survivors. Note, however, that this
vision depends on the perception that a new phase of relative stability has been attained.
Continuing, repeated downsizings (like those which have taken place in Europe and the
USA in industries such as coalmining or shipbuilding) destroy any basis for confidence and
commitment. They replace the proposition of ‘pain today, jam tomorrow’ with the unat-
tractive ‘pain today, more tomorrow’. They also undermine institutional memory, reduce
the chances of survival for any ‘public service ethic’, and lead to a ‘hollowed out’ and
ultimately less competent form of government (Perry and Hondeghem, 2008; Pollitt,
2008). In the aftermath of the 2008 GEC, the danger is precisely that downsizings will be
so deep and so prolonged that the confidence even of the survivors will be badly shaken. In
such cases the basic contradiction is left naked for all to see, and employing institutions
must expect many of their remaining staff to become cautious and defensive, and perhaps
to lose some of their public service motivation.
How do our three models accommodate this potential contradiction? In a nutshell one
might say that NPM prioritizes downsizing over motivation (to achieve efficiency), NWS
prioritizes motivation over downsizing (to preserve a high quality public service), and NPG
does not seem to have much distinctive to say about this particular issue, unless it is that
downsizing is something that needs to be negotiated with all the key stakeholders (which
sounds nice but does not domuch to change the underlying reality). None seems to offer a
way of resolving what is often a harsh and painful choice.
196 TRADE-OFFS, BALANCES, LIMITS, DILEMMAS, CONTRADICTIONS
7.8 Reduce burden of internal scrutiny and associatedpaperwork/sharpen managerial accountability
The evidence seems to indicate that this particular tension is more a question of balance
than of outright contradiction—although in practice it is easy for the balance to be lost.
The tension between the two arises because to sharpen managerial accountability so often
involves operational managers having to make new returns to the top of the organization,
to provide data for new performance indicators systems, quality improvement schemes, or
performance audit scrutinies. Although what is being asked of operational managers is (in
principle at least) a different kind of information—output and outcome oriented rather
than input data—it can still become an onerous burden, perhaps even exceeding in
volume and complexity what was required under the status quo ante. It has sometimes
been referred to as a kind of ‘re-bureaucratization’.
Radin (1998) shows how easy it is for a series of individually well-intentioned reform
measures to produce a heavy weight of requirements upon public managers. In the USA,
the Paperwork Reduction Act of 1995 was aimed at eliminating unnecessary paperwork
and reducing the burden on form-filling for citizens and firms. Introducing the bill,
President Clinton spoke of the need to ‘conquer the mountain of paperwork’. This in
itself appeared an unexceptional objective, although, as Radin points out, it also placed
limits on the collection of the kind of performance data that would be required to fulfil the
aspirations of the 1993 Government Performance and Results Act. Meanwhile, however,
federal managers groaned under a series of new measures, including:
� The Federal Managers’ Financial Integrity Act, 1982—which requires annual assurance
of the adequacy of controls.
� The Chief Financial Officers’ Act, 1990—which requires annual accountability reports.
� The Government Management Reform Act, 1994—which requires annual financial
statements to the Office of Management and Budget.
� The Information Technology Management Reform Act, 1996—which also requires
annual reports, this time showing how information technology is being used to help
programmes achieve their objectives.
� The Federal Financial Management Improvement Act, 1996—which requires reports on
financial systems compliance by agency heads, inspectors general, and the head of the
Office of Management and Budget (OMB).
� REGO 111 of the National Performance Review, 1996—which requires annual reports
from agencies on how they are responding to the principles of the NPR.
The above is by no means a complete listing of all the new information demands, let
alone the ongoing ones.
This is not just a tale of some particularly American exuberance or excess. Parallels can
be found in a number of other countries where reform has been given a high profile. After
documenting an ‘audit explosion’ closely linked to new styles of management, Power
(1997, p. 142) comments that: ‘it is clear that in the UK and elsewhere during the 1980s
and the early 1990s auditing acquired an institutional momentum which insulated it
TRADE-OFFS, BALANCES, LIMITS, DILEMMAS, CONTRADICTIONS 197
from systemic enquiry’. New processes of audit or quasi-audit were devised and applied in
almost every main branch of the UK public sector (Hood et al., 1999). By 2008, the UK
Cabinet Office was issuing reform documents which clearly acknowledged that central
government had overloaded public service delivery organizations with targets and meas-
ures and controls (Cabinet Office, 2008; see also Barber, 2007).
We said at the beginning of this section that we considered the tension between reduced
paperwork and increased performancemonitoring to be a question of balance, rather thanof
inherent contradiction. The above examples indicate that balance is not automatically
guaranteed—it is a trade-off which has to be consciously constructed and then actively
maintained. The paperwork/electronic form-filling burden on middle management can be
reduced, if the performance monitoring regime is carefully designed, focused and regularly
reviewed so as to prune ‘excess growth’. This is the optimistic view. A less sanguine perspec-
tive would be to see the whole process as a cyclic one in which monitoring and auditing
systems possessed in-built tendencies to ‘put on weight’, but these were, from time to time,
corrected by bursts of ‘dieting’ (reforms). This would perhaps explain why, in several
countries, clear-outs of regulations and paperwork requirements seem to be hardy perennials
rather than ‘one-off’ reforms. It would also allow for the fact that there is some evidence of
performance indicator systems cycling between a smaller number of key indicators and a
larger number of detailed indicators (Pollitt, 1990; Pollitt et al, 2010c; Bouckaert and
Hallingan 2008, see Chapter 8). What one is seeing here is therefore a trade-off rather than
a contradiction: the trade is between, on the one hand, simple, light monitoring controls
which permit subtleties and complexities and ‘gaming’ to squeeze round or through them
and, on the other, detailed, heavy systems which capture more of the complexities and
ploys, but which are burdensome and expensive to operate (de Bruijn, 2001). Over time the
grass on the other side of the trade-off often looks greener, hence the cycle.
In principle this particular trade-off could appear within any of our three main models.
However, in practice, it is most closely associated with the NPM. It is in the core NPM states
where the phenomenon has been most clearly visible. One might add, though, that a sort
of parallel may be emerging within NPG. In this case, however, what happens is that
governments make increasing use of partnerships and networks to try to get their business
done, but then attempt to steer these relationships by developing more and more elabo-
rate procedural rules for them (Huxham and Vangen, 2000). As for NWS, this model is
hardly immune from such problems, not least because it is the one of the three which has
moved the least distance from the traditional, rule-bound bureaucracy.
7.9 Develop more partnerships and contracting out/improvehorizontal coordination (joined-up government;integrated service provision)
The difficulty with this pair of proposals is that, ceteris paribus, partnerships and contract-
ing out increases the difficulty of coordination (Bouckaert et al., 2010; Huxham and
Vangen, 2000). This is because relationships become multiple and horizontal instead of
198 TRADE-OFFS, BALANCES, LIMITS, DILEMMAS, CONTRADICTIONS
two dimensional and vertical, and because coordination can no longer be ordered (as in a
hierarchy), but must be negotiated. Agentification can have some of the same effects—as
Rhodes (1997, p. 53) puts it of the Next Steps reforms in Whitehall: ‘the most obvious
result of the new system is institutional fragmentation’. There is some evidence that
‘agentification’ has exacerbated coordination problems in at least New Zealand (Boston
et al., 1996, p. 88) and the UK (Office of Public Services Reform, 2002).
None of this is to say that partnerships and contractual relationships cannot also carry
benefits. They may stimulate innovation and policy learning; they may introduce new
expertise; they may increase flexibility. Such benefits are, of course, not automatic: there is
always the danger that poor management will fail to grasp the opportunities that are
presented to them. But the existence of benefits is not the point here: the point is that
there is a tension between the harvesting of these benefits and the simultaneous arrival of
certain penalties in the form of loss of coordination at a higher level (Bovaird and Tizzard,
2009). To be even-handed between both sides of the equation, it must also be acknow-
ledged that the potential for coordination that exists under more centralized systems is by
no means always taken advantage of. What we suspect, therefore, is that there probably is
a trade-off (not a contradiction) here, and that in practise significantly increased resort to
partnerships and/or contracting out are frequently purchased by some loss of policy or
programme coordination (L€offler, 1999). It is for politicians and public to say whether any
given trade-off is acceptable, but so long as the rhetoritcians of reform insist that nothing
is lost, the trade-off issue cannot be properly investigated, weighed, and debated.
Partnerships are, of course, a key element in the NPGmodel, and are also widely used in
NPM approaches. Contracting out has been a mainstay of NPM, and is also used, perhaps
rather less vigorously, within NPG (and, selectively, within NWS). This is therefore a trade-
off that may be faced within all our three models, but which is likely to be more frequently
occurring in NPM and NPG. A study of the UK civil service reform programme from 1999
to 2005 noted that:
[T]he emphasis on ‘internal markets’ and the separation of ‘purchaser and provider’ were, by 2002,
being seen as potentially damaging to the delivery of corporate and cross-cutting priorities and to
the achievement of key governance principles such as transparency, stakeholder engagement,
diversity and fair and honest behaviour. (Bovaird and Russell, 2007, p. 326)
7.10 Increase effectiveness/sharpen managementaccountability
It may not be immediately apparent why there should be any tension between these two
objectives. Are they not both perfectly sensible and compatible? If we consider the
observations of the Canadian Auditor General, reporting on performance management
reforms, we can see that this is not necessarily so:
Outputs are results that managers can control, while the outcomes managers are trying to accom-
plish are influenced by factors outside their programs. (Auditor General of Canada, 1997, pp. 5–8)
TRADE-OFFS, BALANCES, LIMITS, DILEMMAS, CONTRADICTIONS 199
A glance back at Figure 5.1 will show that effectiveness is a question of securing the
intended outcomes, while efficiency is a matter of optimizing the input/output ratio. A
good deal of evidence, spread over many years and from a number of countries, indicates
two, alternating difficulties:
1. When managers are enjoined to concentrate on concrete outputs (licences issued,
grants given, training courses completed) they tend to lose sight of outcomes and,
therefore, to stress efficiency rather than effectiveness.
2. When, alternatively, managers are asked to concentrate on outcomes and effectiveness,
it is hard to hold them responsible and accountable, for several reasons. This is because
the attribution of outcomes to the actions of individual units or organizations is
frequently obscure or doubtful, and also because, for many public programmes, mea-
surable outcomes manifest themselves over such extended time periods that they
cannot provide a sensible basis for annual accountability exercises anyway (Pollitt,
1995; Pollitt and Bouckaert, 2003). A teacher may be held responsible for his/her
students’ test scores but can s/he also be held to account for the jobs they subsequently
get, and how well they perform them?
There appears to be a dilemma, or at least a trade-off, here. Go for outputs and you are
likely to lose sight of effectiveness; go for effectiveness (outcomes) and you lose the chance
of clear accountability for individual managers and their units. The easy answer is to say
‘go for both simultaneously’ (de Bruijn, 2001, p. 17). Unfortunately that is more easily said
than done. Accountability systems are likely to slide towards outputs, as more quickly
measurable, more easily attributable, and much less costly to monitor. At a 1997 confer-
ence for senior New Zealand public managers the then minister for the civil service made
‘output fixation’ and the neglect of outcomes one of his chief themes (East, 1997). This
theme was also echoed in parts of the UK government’s 1999 White Paper Modernising
Government (Prime Minister and Minister for the Cabinet Office, 1999).
There is an even more controversial aspect to the effectiveness/accountability relation-
ship. This is pungently expressed by Wright (1997, p. 11):
A great deal of public policy is about rationing, about the distribution of scarce resources, about
zero-sum games and opportunity costs. For rationing to work over any length of time it must either
be ignored, obfuscated or it must be legitimised. It is an intrinsically difficult exercise to undertake
by a democratic society in peacetime and in periods of stagnation or depression . . .
However, some of the current reforms, driven by good intentions, seem designed to undermine
those three essential props: ignorance is being replaced by defined rights and obfuscation by
transparency. Even more significant is the delegitimation of the process: decisions about rationing
are being removed from politicians and self-regulating professions like teachers and doctors and
they are being transferred to managers and to entrepreneurs, who quite simply lack the essential
legitimacy to spread the essential misery [original emphasis].
In the light of these considerations, what can be said about the relationship between the
drive for greater effectiveness and the drive for sharper management accountability?
First, we are definitely not arguing that this is a sharp contradiction, with a steep-sided
collapse of an effectiveness-orientation the moment the authorities begin to try to build
management accountability, or vice versa. Second, there does, however, seem to be a
200 TRADE-OFFS, BALANCES, LIMITS, DILEMMAS, CONTRADICTIONS
tension between a focus on outputs and a focus on outcomes, with most of the cards
(measurability, timeliness, attributability, cost) being stacked in favour of outputs. This is
not so much a trade-off as a balance which is difficult to hold against the slide towards
‘output fixation’. Third, Wright opens up a deeper and more obviously political dilemma:
that, for services which are rationed, the process of clarifying accountability and shifting it
more to managers and away from public service professionals, may result in a loss of
legitimacy and an increase in litigation and dispute.
How does this balance relate to our three models? Rather obviously, it cuts across
them all. Both outputs and outcomes are, in principle, important in all three. The kind
of slide towards outputs we have mentioned here could occur within a state aspiring to
NPM, NWS, or NPG. If any distinction can be drawn between the three models (which is
doubtful) it might be that NPM (with its intense focus on managerial efficiency) could
be more likely to overconcentrate on outputs, while NWS (with a longer-term perspec-
tive and an orientation towards social solidarity and improvement) might lean more
towards outcomes. On the other hand, NWS-type reforms may easily become more
process-oriented (meet standards, follow guidelines), and in this case outcomes may
drift away over the horizon. NPG advocates seem to be slightly uncomfortable with
both elements. Network theorists have for some time worried about how outcomes
might be evaluated and what accountability in networks might mean (e.g. Klijn, 2005,
pp. 272–7). We must admit, however, that the whole of our discussion in this paragraph
is quite speculative, and we know of little direct evidence that would resolve these
musings one way or another.
7.11 Promote open government andtransparency/protect privacy
In this case the tension is fairly obvious. Governments deal daily with millions of individ-
ual citizens. So if the call for open government means that governments should tell their
citizens exactly what they are doing, and should open all their communications for public
scrutiny, then an enormous amount of personal data is going to be open to those who are
curious, unscrupulous, or commercially exploitative (or all of these things). Making all
these documents anonymous may be technically possible, but may also be prohibitively
time-consuming and expensive. (There is also the issue of when and how far political
decision-makers themselves should be entitled to privacy, or secrecy. Some of the most
sensitive political deals—the Northern Ireland peace process, the Oslo agreement between
Israel and the Palestinians—can only be achieved in private. This is a large and complex
subject which cannot be dealt with here—but see Roberts, 2006).
By way of illustration, let us quickly look at two cases. Over the past two decades DNA
analysis has developed as (among other things) one of the most useful diagnostic tools
available to the police. Most Western countries now have national DNA databases of one
sort or another. There is no doubt that they help in the solution of many crimes.
However, they also throw up a range of issues about privacy. First of all, under what
TRADE-OFFS, BALANCES, LIMITS, DILEMMAS, CONTRADICTIONS 201
circumstances are the police allowed to ‘invade your privacy’ and demand that you submit
to a DNA swab? (This varies from country to country, in some cases according to the
seriousness of the crime.) Second, how and how long should that record be stored? Third,
who should have access to it—just the police, or also your defence lawyers, or other
government agencies, such as social service departments or tax inspectors or the secret
service? Fourth, how far should the organization operating the DNA database be allowed
to exchange information with similar databases in other countries (countries which may
have different privacy laws or different standards of implementation of such laws)? At
each stage there is clearly a balance to be struck between effectiveness in fighting crime
and the protection of personal data. Different balances are chosen by different countries,
so that, for example, the UK and neighbouring Belgium have very different databases. The
British one is very large and includes (at the time of writing) all sort of records, even for
individuals who have never been charged with a crime. The Belgian one is quite small, and
basically one has to be convicted of a very serious crime before one’s record is kept.
A second example would be the 2001 EU regulation that says that any EU citizen can
demand copies of emails or memoranda exchanged between EU officials on a particular
topic, and must be supplied with them within fifteen working days (Regulation, 2001).
Transparency in action one might say—a good thing. But now consider some of the
practical consequences. Environmental pressure groups, or companies worried about a
possible new regulation, ask the EU Commission for all the emails exchanged on topic X
between 21 April and 14 May 2010 (the evidence is that, in most countries where freedom
of information is legislated, the main users are journalists, companies, and pressure
groups, not individual citizens). To begin with, this is a huge task. Officials will have to
go through hundreds or thousands of emails before handing them over. This will be time
taken away from actually getting on with their policy work. Major discussions may be
required when something sensitive appears in this flow. It will also show up in detail the
exact positions taken by individual, named officials and politicians in internal negotia-
tions. It will reveal any colourful phrase or expression of frustration by any party to these
communications. So what will be the likely result? Most obviously, an elaborate internal
machine for vetting information releases (Roberts, 2006, pp. 86–106). Next, a reluctance
on the part of policy-makers to record their most critical and sensitive thoughts on paper
or email, so that the official record becomes more bland and informal, unminuted discus-
sions in the corridor or the office become more frequent and important. Third, govern-
ments may find themselves working under a self-imposed handicap when dealing with
private sector corporations, which now enjoy far greater scope for concealing their
thoughts and actions than do the governments themselves (Roberts, 2006, pp. 150–70).
The implication of this brief discussion is that there often is a trade-off between open-
ness/transparency on the one hand and privacy on the other. Roberts (2006, p. 226) puts it
succinctly:
Indeed, it would be ironic if transparency laws that are justified in the name of human rights had
the effect, in practice, of compromising civil liberties. And it is far from clear that a radically
heightened capacity for monitoring governmental activity is necessarily in the public interest.
202 TRADE-OFFS, BALANCES, LIMITS, DILEMMAS, CONTRADICTIONS
There is, of course, a huge variation from one sector to another. In some, the trade-off may
be gentle or uncontroversial. But in others—crime, health, and finance for example—
strong arguments may arise as to where the balance should be struck.
These problems affect all three of our main models. Whether the regime is NPM, NWS,
or NPG, a balance must be found. The NPGmodel perhaps poses the issue in a particularly
challenging and complex way because of its stress on the participation of a variety of
stakeholders in policymaking and management/delivery. Are all these stakeholders going
to be equally open and accountable, or is it acceptable for, say, private companies to be able
to operate with greater confidentiality than the governments for whom they are working
and by whom they are paid?
7.12 Reflections: balances, limits, dilemmas, and paradoxes
Looking across the various ‘candidate contradictions’ reviewed above, one can allow that
not all are insurmountable. Some can be avoided—they are implementation dangers
rather than fundamental logical contradictions. Others are more apparent than real
(paradoxes), and in other cases still, there may be a deep-lying tension, but the edge can
be taken off it by skilled leadership and implementation. A considerable residue, however,
remains. The various components of what has become the vision of a modernized public
sector do not add up to an integrated and harmonious whole:
Tensions such as the conflict between ‘career service’ and ‘spot hiring’ approaches to organising top
public servants, legalist and managerial visions of organisational process, competition-centred and
oversight-centred approaches to control over public services, are not likely to disappear through
some ultimate ‘modern’ resolution. (Hood, 1998, p. 221)
The scope of our investigation has in some ways been narrower than Hood’s—he seems to
be attempting to establish a set of timeless and universal trade-offs, pictured in a group/grid
matrix of administrative cultures in which both his four ‘pure’ administrative philosophies
and attempts at hybrid combinations are fundamentally unstable. We have focused more
specifically upon selected elements (dishes/plats in the language of Chapter 1) that are
importantwithin out threemainmodels—NPM,NWS, andNPG.We aremore interested in
the extent to which these elements can be reconciled in logic and also confirmed as
mutually compatible by empirical observations. Our focus is therefore less on an explora-
tion of the explanatory value of any one overarching taxonomy. Thus, while we entirely
concur with Hood’s proposition that certain tensions cannot be ‘disappeared’ by contem-
porarymodels of management reform, we also want to discriminate between themore and
the less ‘do-able’. In the preceding sections we have therefore reached towards a set of
conclusions concerning our eight ‘candidate contradictions’. We conclude the chapter by
briefly recapitulating these tentative ‘findings’.
1. Increase political control of the bureaucracy/free managers to manage/empower service con-
sumers: in a perfect world these could just about be compatible. In the real world there
TRADE-OFFS, BALANCES, LIMITS, DILEMMAS, CONTRADICTIONS 203
is frequently a trade-off between one or more of the three corners of this triangle. In
some contexts the trade-off becomes so sharp as to merit the title of a contradiction.
2. Give priority to making savings/give priority to improving public service quality: there is no
general contradiction: much depends on the specific circumstances, especially whether
the organization(s) in question has/have spare capacity (‘slack’), and/or whether tech-
nological advances offer the possibility of productivity gains. With complex services,
the picture may be complicated because quality may have many aspects and/or be
difficult directly to observe. This opens up the danger that service providers will conceal
reductions of quality, or will emphasize quality gains on one aspect while obscuring
reductions on other, less visible dimensions.
3. Promote flexibility and innovation/increase citizen trust and therefore governmental legiti-
macy: there is no fundamental contradiction here. However, there are specific contexts
in which politicians and/or managers are obliged to trade off between, on the one
hand, innovation and, on the other, values such as stability, predictability, continuity,
and trust. Not infrequently management innovations can relatively disadvantage cer-
tain sections of the community. Also the equation of citizen trust in a particular public
service with the same citizens’ attitudes towards the government as a whole is often
misleading. Citizens are fully capable of forming one judgement about a particular
service and quite another about the overall legitimacy of the political leadership.
4. Motivate staff and promote cultural change/weaken tenure and downsize: this appears to be
the most obvious and inescapable contradiction. It can be softened by sensitive man-
agement and, of course, it can be rhetorically papered over. But it is not clear whymany
public service staff should be reassured. There is therefore a price to pay for the
contradiction in terms of loss of morale, loyalty, the attractiveness of a public service
career, and possibly, therefore, effectiveness.
5. Reduce burden of internal scrutiny and associated paperwork/sharpen managerial accountabil-
ity: this seems to be principally a question of balance. However, while it may not be a
contradiction, intelligent and determined implementation is required if the balance is
to be first constructed and then, subsequently, maintained. Some core NPM countries
have suffered ‘audit explosions’, ‘initiativitis’, and ‘target overload’.
7. Develop more partnerships and contracting out/improve policy and programme coordination:
we suggest that there is an underlying trade-off here. The slope may be sharp or gentle,
depending on context. Sometimes the benefits will clearly outweigh the losses, but
sometimes they will not. The literature on partnerships is now huge, and some scholars
have begun the task of identifying the general conditions which are likely to influence
this trade-off (see, e.g. Bovaird and Tizzard, 2009).
8. Increase effectiveness/sharpen managerial accountability: whilst this does not appear to
be a direct contradiction, there does seem to be some tension between these two
objectives, and there is evidence that the balance is hard to hold in practice. There
may also be an underlying dilemma—for rationed services—between transparency
and legitimacy.
9. Promote open government/transparency/protect privacy: there are real trade-offs here and,
at the poles, contradictions. Many states have needed to adjust their privacy
204 TRADE-OFFS, BALANCES, LIMITS, DILEMMAS, CONTRADICTIONS
legislation in relation to new technological developments such as mobile phones, DNA
analysis, and electronic banking. This will no doubt continue. Most of these new laws
and regulations are clearly balancing between openness and privacy, and the balance
has been struck somewhat differently in different countries. There is also an underlying
question about the impact of very high levels of transparency on the ability of officials
and politicians to arrive at compromises and do deals.
All our three big models have problems with these trade-offs and contradictions. Some
dilemmas and trade-offs may show up more obviously within one model than another (as
suggested above), but others cut across all the models. Indeed, somemay even be relatively
timeless, in the sense that, historically, they pop up time and time again, in different
contexts and slightly varying forms, constituting true limits (or at least hard choices) in
public administration (Hood, 1976).
TRADE-OFFS, BALANCES, LIMITS, DILEMMAS, CONTRADICTIONS 205
8 Reflections
The art of government is in procrastination and in silence and in delay;
blazing bonfires left to burn will soon consume themselves away.
Of evils choose the least: great foes will tumble down in time, or wither, one by one.
He that rules must hear and see what’s openly or darkly done.
All that is not enough: there comes a moment when to rule is to be swift and bold;
know at last the time to strike—it may be when the iron is cold!
Sir Robert Cecil to Queen Elizabeth I from Benjamin Britten’s opera Gloriana.
Libretto by William Plomer
8.1 Introduction
This is where we return to the beginning—to the key debates which were introduced in
Chapter 1. Between there and here we have introduced a small mountain of evidence,
referred to hundreds of research studies, and summarized dozens of theoretical approaches
or conceptual frameworks. So where does that leave us with respect to the questions we
started out with? And what seem to be the implications for future research in public
management—research that we hope many of the readers of this book will be engaged
with, in one way or another?
Amalgamating some of the bullet points on the question list we originally introduced in
Section 1.3 (p. 5) we arrive at a set of four fundamental questions about what has been
happening—and what is likely to happen in future. These are:
� What have been the main trajectories of reform, 1980–2010?
� What have been the results of these reforms?
� What are the implications of this experience for the future?
And last, but not least:
� What kind of answers are we looking for, and what kind of answers can we reasonably
expect to get?
Sharp-eyed readers will notice that this list does not contain any ‘why?’ questions—the ques-
tions are all of the ‘what?’ variety. This may trouble those who argue that it is ‘why?’ ques-
tions—questionswhere a theory is used to explainwhy something has or has not happened—
which are the high ground of academic life. So let us say quickly that in no way do we seek to
demote explanatory issues. Indeed, we see a whole host of ‘why?’ questions standing immedi-
ately behind our ‘what?’ questions. In fact we have been discussing those throughout most of
the book (for example, the model of the reform process in Chapter 3 and the ‘many houses’
discussion inChapter4wereverymuchconcernedwith reasonswhy this reformor that reform
took place, or that particular approach was not adopted in a given country). Nevertheless here
we give the headline to the ‘what?’ questions, for several reasons.
First, gooddescriptionsare importantbecausewebelieve thatagoodpartof the international
discussion of reform trends is seriously oversimplified and resorts to stereotypes, and that it is
therefore important to try to establish just exactly what has happened, before launching into
conclusionsandprescriptions.Although thisbookgives amoredetailedaccount thanmost,we
are still conscious that it contains a number of lacunae and quite a lot of ‘thin ice’. Even so, it is
considerablymorenuanced anddetailed thanmanyofficial reports, consultancy publications,
and even academic analyses.One canunderstandwhy—the simplemodel and thememorable
sound bite (‘banish bureaucracy!’, ‘steering not rowing!’, ‘the network society!’) are attention-
grabbers. They increase the chances of getting your story onto crowded political or academic
agendas. Second, theory-building and theory-testing—which we fully accept is central to the
social science project—are themselves in part dependent on the availability of good descrip-
tions. In the empirical social sciences it is notmuchuse having a beautiful abstract theorywith
only partial and unreliable data to feed into it. In fact the sheer number and variety of public
management models (which we noted back in Chapter 1) may to some degree reflect an
unsatisfactory database on reforms. If we had better, more systematic and comparable descrip-
tions ofwhathas beenhappening indifferent countries, someof thesemodelswould probably
fall, because they would be seen to be seriously incomplete, or to explain what happened in
jurisdiction X but not at all what happened in jurisdiction Y. Third, this book is as it is because
we have found, both among our own students and among those of a number of our colleagues
at other universities, a real demand for just knowing what has happened. Intelligent students
know that they cannot always trust governmentWhite Papers to tell thewhole story. They also
know that confining themselves to documents operating only at very high levels of aggrega-
tion (such as are found in theWorld Bank’sWorld Governance Indicators (Chapter 5) or even
manyOECDpublications) is not enough. They canfindnumerous case studies,many of them
excellent, but it ismoredifficult tofind reformstories frommanycountries brought together in
one place and in an explicitly comparative format. Hence the satisfaction of this need is one of
our objectives in writing this third edition.
REFLECTIONS 207
8.2 What have been the main trajectoriesof reform, 1980–2010?
There is no doubt that NPM reforms were a major international trend during the 1980s and
1990s. Beginning in themid 1980s in New Zealand and the UK they spread rapidly tomany
other countries and, by the early 1990s had become the ‘new norm’ in the many publica-
tions and discussions of the influential PUMA group at the OECD (e.g. OECD, 1995). Even
countrieswhichwere culturally resistant to theNPMpackage as awhole (suchasFranceor the
Nordic countries) tended nonetheless to adopt or experiment with specific tools such as
results budgeting or contracting out. In the language of Chapter 1, they selected certain
dishes from the menu, even if they did not want the whole NPM cuisine. Finally, we
beg leave to differ from those who have pronounced that the NPM is now ‘dead’
(e.g. Dunleavy et al., 2006b). At the time of writing, individual NPM- type reforms continue
in a number of countries. The global economic crisis has in some ways even revived those
parts of theNPMmenuthat claimtoyield short-termsavings—suchas large-scale contracting
out. Indeed, a detailed reading of Dunleavy et al. shows that they themselves do not really
mean ‘dead’, because they freely acknowledge that some elements continue to spread. Terms
such as ‘decline’ or ‘decay’ might carry a more accurate connotation than ‘dead’.
Yet (as we argued in Chapter 1) it would be a dangerous oversimplification to claim that
public management reform during the 1980–2000 period consisted of a global (or even an
OECD) convergence on theNPMmodel.Many important reformswerenot at all part ofNPM
packages—such as the French decentralization reforms of the early 1980s, or the amalgam-
ation of Australianministries in themid 1980s, or the agency reforms in Finland in the early
1990s, or the somewhat chaotic Italian changes following the political crisis in 1994. They
were responses to perceived domestic problems, principally addressed to those problems and
not—or not much—derived from the international NPM agenda. There was a generalized
cautiousness towards NPM from a number of continental European states, and the develop-
ment of an alternative trajectory which, in Chapter 4, we characterized as the NWS.
Now we can return to the question raised in Chapter 1: the question of how best to
characterize what has been happening since the NPM tide began to stall or recede—since,
say, 2000 inmostof our twelvecountries. Throughout thisbook, andespecially inChapters4,
5, and6wehaveperiodically referred to three ideal typemodels—NPMitself,NWS, andNPG.
As we said at the outset, these are far from the only models we could have explored, but, on
theotherhand, theyare allmodelswhichhavebeen, and still are being, extensivelydiscussed
within the academic community that studies public management. They express different
principles of coordination—NPM favours market mechanisms designed and guided to yield
outcomes which are in the public interest; NWS displays a professionalized and consultative
form of hierarchy; NPG is based on a network approach, yielding an inclusive view of the
wide range of organizations that needs to be involved in the governance of complex,
pluralistic societies (Bouckaert et al., 2010). Furthermore, they have penetrated—at least to
some extent—thevocabulary of reformers themselves. Practitioners in a number of countries
have referred to specific themes which are clearly related to these academic models, such as
the need for a more businesslike approach (NPM), the importance of preserving the
208 REFLECTIONS
‘European social model’ and modernizing the state (NWS), or the desirability of more
partnership working and networking (NPG). Collectively the three models represent, in a
sense, the first and second generations of reform: first, NPM, as a cleanbreakwith traditional,
hierarchical bureaucracy, and then NWS as an emerging alternative to NPM, and NPG as a
broader approach which many academics have argued has succeeded—or is succeeding—
NPM, and which is, to some extent, a conscious reaction to NPM’s limitations.
So the three models are useful in a variety of ways. They express different principles of
organization and different views of the preferable relationship between the state, themarket
sector, and civil society. As such they can serve as guiding heuristics or, beyond that, as
visions. They can stimulate debates and provide frameworks for the analysis of specific
reforms. What it is evident they do not do, however, is to provide a neat empirical map of
where our twelve countries have come from, are now, or appear to be going to. The empirical
map, in fact, is a prettymessyone, and shows every signof remaining so.One cannotpoint to
a single country and say, ‘There we can see an example of NPM/NWS/NPG in full working
order.’ Even the famous NPM reforms in New Zealand between 1984 and 1993—radical
though they undoubtedly were—were not ‘pure’. There were many departures from the
model and the doctrine (Boston et al., 1996), and within a decade elements of the reform
were being dismantled or significantlymodified (Duncan and Chapman, 2010). Equally, the
numerous reforms in most European countries that have been proclaimed as promoting
networking, partnership, and public participation have invariably co-existed with areas in
which governments have still exercised the right to act decisively and hierarchically. When
we examine a specific reform in a particular subset of organizations, wemay sometimes find
(touse the languageofChapter 1) coherentmenus,with a series ofmutually supporting tools
being deployed in an attempt to realize a particular trajectory and vision. But when we look
across the whole of any given public sector, the menu is always mixed—different tools are
being used for different purposes in different parts of the operation.
As we have tried out the three models on our empirical evidence, another limitation has
gradually become apparent. It is that eachmodel attends to some aspects of public administra-
tion—the aspects it wants to give importance to—but tends to ignore or omit others. Thus the
NPM, for example, says little directly about politics and seems, implicitly at least, to use an
overrational and rather unrealistic set of assumptions about what politicians can, andwant, to
do (Chapter6). It also tends to focuson the innerworkingsof individualorganizations, andpay
less attention to the ‘big picture’—the shape of the network, the history of a given sector, the
particular provisions of a specific constitution, and so on. The NWS vision, by contrast, has its
strength in reminding us what states can do and how important democratic politics is as a
guiding andmonitoring force. It accepts that there are particular contextswhere the statemust
coerce its citizens, where public order must be sustained, even at some price in terms of
individual liberties. It places the public service ethic closer to the centre of attention and avoids
the simplistic assumption that everyone is a self-interested utility maximizer. On the other
hand, theNWSperspective ismuch less clear about how the state should dealwith someof the
other powerful players in the policy process—big corporations, intergovernmental organiza-
tions, and international non-governmental organizations. Furthermore, it tends to assume
that public officials will, either always or usually, prove pliable to sensible, modernizing re-
forms. It perhaps needs to paymore attention towhat is to be donewhen reformers encounter
extreme inertia or recalcitrance among the affected staff—as does sometimes occur. The NPG
REFLECTIONS 209
approach is probably better at dealing with the ‘external’ parts of the picture than either the
NPM or the NWS, because it is essentially outward-looking. But it remains largely silent about
how, internally, the coreof the state shouldbeorganized andwhat issues, if any, the stateneeds
to reserve to itself. It also struggles to explainhow traditional values of democratic accountabil-
ity and transparency will be maintained in complex networks of partnerships and collabora-
tions. ‘[I]n someways the growthof partnershipshas tended to add to institutional complexity
in the public sector rather than necessarily to simplify it . . . The ‘‘organic’’ nature of different
partnerships, and their variability from one area to another, also add to difficulties in attribut-
ing policies and understanding how theymight be changed, not only for citizens, but also for
public sector decision-makers themselves’ (Dunleavy, 2010, p. 14).
The big models, then are less than comprehensive. And, meanwhile, the empirical map is
composed of many partial trajectories, and some reversals or shifts in course. In the UK, as in
New Zealand, the 2000s witnessed a partial (but only partial) retreat from the market-type
mechanismswhich had been introduced at the height of theNPMera. Actual reformpackages
have frequently includedelementsdrawn frommore thanoneofourmodels—for example the
Blair government (1997–2008) praised partnerships and networking, yet simultaneously
imposed one of the most detailed, top-down systems of performance measurement the
world has yet seen. One may also notice a certain tendency towards alternations or cycles in
reform (Pollitt, 2008, pp. 51–9). As remarked in Chapter 7, it has long been observed in public
administration that there is a tendency for policy prescriptions to be packaged up in contradic-
tory or opposing principles—now decentralization is the answer, now centralization (Pollitt,
2005), ornowspecialize tasks, nowconsolidate them(Hoodand Jackson, 1991; see also Simon,
1946). Each prescription at first seems tomake sense in itself, but after it has been applied for a
while its disadvantages becomemore apparent, and eventually there is a movement to go the
otherwaybecause it is perceived thatnowwehave toomuchofwhatwas formerly thought tobe
a good thing (toomuch autonomy, toomuch audit, toomany performance indicators, and so
on). We have perhaps seen this most clearly in the rapidly reforming countries—thus British
governments swung fromorganizationaldisaggregationand thenback toaggregationbetween
1988 and 2005 (Talbot and Johnston, 2007). More widely, Davis et al. found some tendency
towards cyclingbetweenaggregationanddisaggregation inAustralia, Canada, and theUKover
the longer period of 1950–97 (Davis et al., 1999) and Light found ‘tides of reform’, ebbing and
flowing, in theUSAbetween1945and1995 (Light,1997).Theexistenceof suchcyclesdoesnot
rule out trajectories: one can have a trajectory that lasts for a decade or more and then the
fashion changes—the previous trajectory is seen to have gone too far, and a new trajectory
begins, not returning to the point of origin, but at least somewhat abandoning elements in the
previousdirectionof travel. But to see thesepatternsoneusuallyneeds to look atdevelopments
over quite a substantial period of time—probably decades. Short-term examinations of the
latest reform will not pick up the larger, longer-term patterns (Pollitt, 2008; Pollitt and Bouck-
aert, 2009). In the language of geological and evolutionary time ‘arrows’ (trajectories) can co-
exist with ‘cycles’—indeed, in order to make sense of evolution we need to understand the
interaction between the two (Gould, 1988).
Now let us return to our models. Even if a particular government were able to craft and
implement a somehow ‘model pure’ reform, that would not mean that that public sector
then became an equally pure example of NPM or NWS or NPG. That is because no reform
could conceivably simultaneously touch every nook and corner, every aspect of the
210 REFLECTIONS
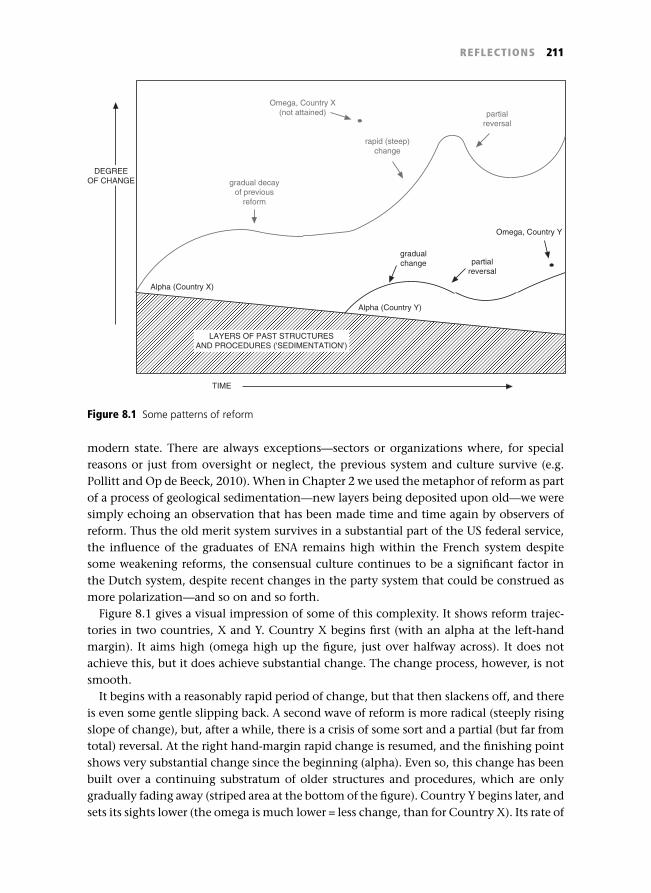
modern state. There are always exceptions—sectors or organizations where, for special
reasons or just from oversight or neglect, the previous system and culture survive (e.g.
Pollitt and Op de Beeck, 2010). When in Chapter 2 we used the metaphor of reform as part
of a process of geological sedimentation—new layers being deposited upon old—we were
simply echoing an observation that has been made time and time again by observers of
reform. Thus the old merit system survives in a substantial part of the US federal service,
the influence of the graduates of ENA remains high within the French system despite
some weakening reforms, the consensual culture continues to be a significant factor in
the Dutch system, despite recent changes in the party system that could be construed as
more polarization—and so on and so forth.
Figure 8.1 gives a visual impression of some of this complexity. It shows reform trajec-
tories in two countries, X and Y. Country X begins first (with an alpha at the left-hand
margin). It aims high (omega high up the figure, just over halfway across). It does not
achieve this, but it does achieve substantial change. The change process, however, is not
smooth.
It begins with a reasonably rapid period of change, but that then slackens off, and there
is even some gentle slipping back. A second wave of reform is more radical (steeply rising
slope of change), but, after a while, there is a crisis of some sort and a partial (but far from
total) reversal. At the right hand-margin rapid change is resumed, and the finishing point
shows very substantial change since the beginning (alpha). Even so, this change has been
built over a continuing substratum of older structures and procedures, which are only
gradually fading away (striped area at the bottom of the figure). Country Y begins later, and
sets its sights lower (the omega is much lower = less change, than for Country X). Its rate of
gradual decayof previous
reform
rapid (steep)change
partialreversal
gradualchange partial
reversal
Alpha (Country X)
Alpha (Country Y)
TIME
DEGREEOF CHANGE
LAYERS OF PAST STRUCTURESAND PROCEDURES ('SEDIMENTATION')
Omega, Country X(not attained)
Omega, Country Y
Figure 8.1 Some patterns of reform
REFLECTIONS 211
change is also lower (slopes less steep). Like country X, it has a period of partial reversal,
but ends up quite near its (more modest) omega. Country Y has achieved less change than
Country X, but has come closer to its goals. One might think of Country X as a radical
NPM reformer and Country Y as a more cautious NWS reformer, although they do not
have to be this—they are no more than abstract, illustrative examples of the kind of
complexity which our historical approach has revealed, over and over again.
Nevertheless, despite this ‘messiness’, and all these necessary qualifications, the story
we have told has not been one of chaos or randomness, without shape or direction. Just as
the period 1980–2000 was characterized by a widespread interest in NPM, so certain
themes have grown in prominence internationally since the turn of the century. These
include:
� The development of integrated services/joined-up government/‘whole of government’
approaches. These apply both to the ‘production’ of policies (developing integrated
analyses of cross-sectoral or ‘wicked’ problems) and to the delivery of services (one-
stop shops, single portals for all government services, etc.). Attempts to integrate at the
service(operational) level seem to have been almost universal, but efforts to develop
whole-of-government strategies have been confined to a more limited subset of
countries.
� The promotion of e-government as a solution to many problems, and as a major
facilitator of the integration sought in the first bullet point, above. Again, virtually
every country has had some sort of programme here.
� More networking and partnership with other social partners/stakeholders. Almost all
our governments have adopted this, at least on the level of rhetoric.
� Improved transparency and more open government. Transparency has become an
international buzzword (and like all such, means many different things in different
contexts). But no one can be against transparency.
� Strengthening the political support and protection for ministers (by more political
advisers, more professional media offices/‘spin doctors’, more opportunity for political
executives to remove and replace their top civil servants if they are found to be unsym-
pathetic to the government’s specific policies). There has been something of this in all our
twelve countries, but the amount of it varies enormously, from the addition of a handful
of political advisers to a spoils system that embraces the whole of the upper reaches of
the administration.
Do these elements, taken together, constitute a new model, to which we can give a name?
Our interpretation would be no, or, at least, not quite—only in an indirect and partial way.
Certainly it could be said that a number of these themes are consonant with the NPG
model (integration/holism, e-government, networking, and partnerships). Yet not all of
them are. Strengthening the control of executive politicians could even be said to be a
move against the tide of governance, and back towards a more hierarchical, representative
politics. However, there is a deeper point. It is that a number of these themes can be
formulated and reformulated to fit in with different management paradigms. In terms of
the ‘menus and dishes’ discussion in chapter 1 (See Figure 1.3, pp. 25), these are dishes
which can be presented within different menus, some more and some less coherent.
212 REFLECTIONS
Consider the first two—integrated services and e-government. Each of these can be
approached from within more than one of our three main models (NPM, NWS, and
NPG). Thus integrated services can comfortably feature on either an NWS or an NPG
trajectory. Within the former, one might expect the emphasis to be on better bureau-
cratic coordination—health care and social care authorities are reorganized so as to work
more closely together, or local authority services are coordinated more closely with
central government services (multi-level government). Within NPG, however, the same
theme takes on a somewhat different hue. A holistic approach becomes a more ambitious
affair, with the focus being on the coordination of government and non-government
actors through networks and partnerships. Similarly with e-government—Dunleavy et
al. (2006a) have shown that different governments have approached this in very different
ways. In some, almost everything has been contracted out, NPM style, to private compa-
nies—even the business of designing the contracts themselves. Government has retained
little capacity or expertise of its own. In others, however, government has preserved a
strong central capacity and has used this to ensure that, where private companies have
been involved, there has been real competition and a stronger, more informed assessment
of their proposals—one might think of this as a more NWS approach to e-government
(although Dunleavy et al. do not themselves refer to that model). Within an NPG
approach, one might expect that the emphasis would be different again—perhaps accent-
uating the joint design, commissioning, and use of computer systems between public
authorities and their partners in the market sector and civil society. In a four-country
comparative study of ICT policies, Homburg comes to the conclusion that these policies
tend to follow pre-existing institutional patterns and cultural attitudes, and that, in
consequence, they are significantly different in the Denmark, the Netherlands, the UK,
and the US (Homburg, 2008).
Therefore, although we can see a pattern of sorts in reforms since 2000—certain themes
and tools that are internationally echoed and reproduced—these do not amount to a
single new model or menu. Rather, as suggested in Chapter 1, we have a menu of dishes
(tools), and different customers are selecting different combinations, and flavouring the
same dish with different paradigmatic sauces. In an interesting recent study of public
financial management in Australia, Belgium, Canada, Germany, the Netherlands, Sweden,
the UK, and the US, Andrews arrived at the following conclusion:
Conceptualising governance constructs as menu items, to be chosen, rather than essential elements
of a one-best-way model, is, I believe, an important step to better understanding why good
government looks different in different settings. (Andrews, 2010, p. 30)
Within all this there are certainly elements of path dependency—the differences between
the different ‘houses’ which we set out in Chapter 3 have not vanished. There is still a
spectrum running from stronger state solutions to stronger market solutions, and there is
still a difference between heavily centralized and majoritarian polities like New Zealand
and the UK, and strongly decentralized and more consensual polities like Germany and
Sweden. The internationalization of public management thinking may well have reduced
the strength of these national differences, but it has by no means eliminated them.
Furthermore, according to our reading of the evidence, these differences become more
marked the further one moves down the sequence from talk to decision to practice and
REFLECTIONS 213
finally to results (Table 1.2, p. 13). To put it another way, the impression that ‘everyone is
doing NPM’ (or governance, or transparency) is strongest if one confines oneself to reading
policy statements and plans. As onemoves through to practice (not to speak of results) one
finds that, for instance, Belgium ‘does’ transparency very differently from the UK (Pollitt
and Bouckaert, 2009), and Canada and the Netherlands ‘do’ e-government very differently
from Australia and the UK (Dunleavy et al., 2006a, pp. 83–134). The structural and cultural
substrata of public administration are often more durable than the latest reform.
8.3 What have been the results of these reforms?
Results are often the ‘elephant in the room’ for management reforms. As Chapter 5
showed, they can be remarkably difficult to pin down, even (perhaps especially) for the
biggest, most loudly trumpeted reforms. Of course there may be masses of ‘evidence’, but
on closer inspection (in the language of the performance framework from Chapter 5),
most of it turns out to be about changes in activities and procedures rather than about
actual outcomes. To an extent, therefore, public management reform has been more a
matter of faith than science (Pollitt, 1995). We can think of public management as ‘a social
and perhaps a quasi-religious movement, arguably part of a broader ‘‘managerial’’ move-
ment’ (Hood, 2005, p. 13). Many reforms have been launched on the basis of a vision, an
omega, rather than on the basis of anything that could be regarded as hard scientific
evidence. Afterwards—sometimes many years afterwards—it is usually hard to collect the
evidence of what worked and what didn’t, and why. Supporters of the particular reform
attribute anything good that happened to the reform, and critics similarly attribute almost
anything bad that happened to the same reform, but both sides have difficulty in proving
their attributions.
Yet it would be wrong to exaggerate this problem. It is a big problem at the level of whole
reform programmes—the NPR in the USA or the 1980s Hawke administration reforms in
Australia or the ‘joined-up government’ reforms of the Blair administration in the UK—
but it is less difficult at a more local and specific level. Thus we may not know whether the
NPR or Mrs Thatcher’s ‘Next Steps’ programme ‘worked’, but it is easier to see whether
changes to emergency call handling in the Sussex Police Force have improved public
opinion ratings of the service, or whether reforms to the New Zealand health care system
have reduced waiting lists for the hospital treatment of specified conditions. In Chapter 5,
for example, we referred to clear evidence that a determined performance management
reform by the UK government had radically reduced average waiting times in hospital
accident and emergency departments (Kelman and Friedman, 2009). We also know that
new data-matching procedures by the UK Department of Work and Pensions helped to
halve benefit fraud in the years following 2000/1 (Chief Secretary to the Treasury, 2009,
p. 29). We are told that by pooling budgets across several different government agencies a
programme called Wraparound Milwaukee has reduced the need for residential treatment
for seriously disturbed children in that city, and has halved the cost per child of that
treatment (Chief Secretary to the Treasury, 2009, p. 39). During the Clinton/Gore National
Performance Review, a new, simpler way for employees to make small purchases by using
214 REFLECTIONS
Visa cards was extended across the federal government resulting in claimed savings of
more than $12 billion (Gore, 1997, p. 49). There are many, many such examples and,
while some of themmay be oversimplified or exaggerated or ephemeral, it is hard to doubt
that positive results are frequently achieved, and that sometimes they are successfully
embedded, and last over the longer term.
The overall conclusions, therefore, are threefold. First, it is very difficult to be sure what
is the net spectrum of results from large, complex programmes of public management
reform. To some extent these big reforms are undertaken as matters of faith rather than
proven ‘science’, and this is a feature that has not changed noticeably over the whole
period of our study (cf. Pollitt, 1984 with White and Dunleavy, 2010). Second, this
difficulty is frequently compounded and amplified by the fact that government them-
selves do not put credible evaluation procedures in place—or certainly not early enough. It
is hard to avoid the conclusion that the politicians launching management innovations
do not always see the careful, independent assessment of their long-term costs and
benefits as a particularly important aspect of the reform process. Third, the methodologi-
cal challenges of accurately assessing results are somewhat less (although still tough
enough) if the focus is on a single, specific reform in a single, specific location or organiza-
tion, or limited set of locations and/or organizations. Thus, someof ourmost convincing and
‘hard’ evidence comes from these more focused and disaggregated studies, where one can
trace the complex actions and reactions as the reform unfolds (for a positive example, see
Kelman, 2005; for a less encouraging case, see Sundstr€om, 2006).
8.4 What are the implications of thisexperience for the future?
The story as we have told it seems to have a number of implications for those conducting
research—or even simply studying—public management reform.
First, and most positively, international comparison can be seen to be a powerfully
enlightening and informative exercise. It may be difficult to do well, but it frequently
brings forth contrasts and alternatives which are so strong that they seem robust—that is
to say that it is hard to believe that they could be merely artefacts of the way the data has
been collected or some other bias. For example, reform has been consistently wider,
deeper, faster, and more rigorously implemented in the UK than in Belgium (Pollitt and
Bouckaert, 2009). It has been accomplished with less overt party political warfare and
accusatory stereotyping in the Nordic countries than in Australia or New Zealand. It has
resulted in far deeper changes to the procedures and culture of the top civil service in
Australia, New Zealand, and the UK than in Germany or France. It has ‘hollowed out’ the
French or Swedish (or even Canadian) public services much less than the American federal
service. All this, taken over a thirty-year period, tells us that the strength of the big models
of reform is less than overwhelming. Certainly there are international currents, and
certainly particular models and, at a more detailed level, specific tools (dishes) become
fashionable and attract a lot of interest. But they have never been strong enough,
REFLECTIONS 215
compelling enough, to push all our twelve states down the same road. There is, to put it
positively, a good deal of room for choice and interpretation. There is room for strategies
and political preferences and different balances between the state sector, themarket sector,
and civil society. Even now, post GEC, governments may ‘have to’ save money, but there is
almost always more than one way of doing it. Governments may ‘have to’ address
changing demographics, or climate change, or the digital revolution, or any number of
other challenges, but for each there is more than one way of organizing and managing the
government’s response. In short, there is something worth arguing about.
Furthermore—to extend this first point—comparison opens up a treasure chest of
examples of adaptation. As we have seen, it is not only that different countries have
inclined more to one model than another, it is also that they have taken specific tools
(performance-related pay, benchmarking, public–private partnerships) and used them in
contrasting ways. It seems that management tools are made of bendy plastic, not rigid
metal, and it seems they are used by different craftspeople for somewhat different jobs.
Again, there is plenty of space for discussion and choice, for creating new menus by
combining particular dishes in new ways. And there are also some warnings—negative,
perhaps, but still very useful to have. These tend to be about the use of particular tools in
particular contexts. Thus, for example, the aggressive implementation of individualistic
performance-related pay in team- or consensus-based organizational cultures is likely to
create rather high counter-waves. Or the attempt to use precisely specified (‘complete’)
contracts in situations where it is hard to define the precise level and quality of outputs
one wants—or perhaps will want in the future—may lead to the organization letting the
contract finding itself locked in to a set of increasingly inappropriate incentives. Or the
wholesale contracting out of complex technological functions runs the risk that public
authorities may not be able to retain sufficient in-house expertise to monitor and evaluate
the contractors who are providing the actual service.
Second, an overview of the evidence thus far encourages a certain scepticism concerning
reformers’ incessant claims to be on the verge of ‘transforming’ this or that, or becoming
(to use a phrase that was popular in the late Blair and Brown administrations in the UK)
‘world class’ at almost any aspect of public service provision you care to name. The deep,
sedimented structures of most of our twelve public sectors are hard to shift in such
fundamental ways. At the end of 2009 the UK public expenditure minister issued a
White Paper in which he said:
[R]eform must accelerate through making full use of the new strengths we now have: more
empowered citizens, the knowledge and commitment of our public servants, especially those at
the frontline, and our vibrant communities. It will require a premium on transparency, innovation
and flexibility. (Chief Secretary to the Treasury, 2009, pp. 15–16)
This picture was unrealistic to the point of romanticism. It was a White Paper issued by
a deeply unpopular government which knew it had to make huge cuts in public
spending, but was putting off discussing them in any detail until after the imminent
election (which it lost). Would most citizens, if surveyed, have declared themselves
‘empowered’? Unlikely. Would most frontline public servants, ground down by reform
after reform, and burdened by unprecedented levels of central control, have recognized
this buoyant picture? Probably not. Were these ‘vibrant communities’ the same as those
216 REFLECTIONS
being described at exactly the same time as ‘the broken society’ by the Leader of the
Opposition?
Unfortunately, this is far from being the only example of hyperbole in official publica-
tions. Something else which has changed in the thirty years since 1980 has been the
vocabulary and style of public administration reform documents. In many of our
countries (Australia, France, the Netherlands, New Zealand, the UK, and the USA), the
sober reports of the 1970s have given way to ‘designer’ documents replete with sound-
bite phrases, up-beat photos and diagrams, and managerial buzz words. They claim that
the machinery of government is on the verge of ‘transformation’, ‘smarter’ government,
citizen empowerment—that the authorities are about to achieve all manner of radical
change. Yet within a short time these texts are largely forgotten. How many people now
remember the official documents of the late 1980s and 1990s which, in some cases were
promising things which sound suspiciously similar to what is still being held out as just
round the corner today? These included: citizen-focused government (e.g. Prime Minister,
1991), a government that ‘works so much better and costs so much less’ (Gore, 1997, p. 2),
benchmarking (Department of Finance, 1996), quality through market competition (HM
Treasury, 1991), and more joining up and integration of services (Prime Minister and
Minister for the Cabinet Office, 1999).
More importantly, we can see that many of our (admittedly imperfect) indicators show
the rank order of different countries to be remarkably similar to what it was many years
ago. The ‘high trust’ countries (especially the Nordic group) remain relatively high trust
and the low trust countries (e.g. Italy) remain low. The big spenders (Sweden) remain big
spenders, the middling big spenders (France, Germany) remain middling big spenders,
and the lean states (USA) remain lean. The law-oriented culture may have diminished, but
relatively speaking it remains much more prominent in Belgium, Germany, and France
than in the UK. Of course all these countries have moved—they have carried out real
reforms and made real changes. But they seldom if ever turn out to be as transformational
as the rhetoric, and the relativities between countries do not change at anything like the
same speed as the announcements of new reforms.
This leads to a third observation. It is that the timescale for effectivemanagement reform
is often far longer than a) the timescale of media attention and b) the timescale of strong
political interest. The application ofmany of the tools mentioned in this book takes twelve
to thirty-sixmonths before the reform is fully bedded-in and one can see thewhole range of
effects—positive and negative, expected and unexpected. Serious efforts to get close to a
new model or paradigm (e.g. NPG or the ‘Digital state’) take much longer, probably a
minimum of five years and sometimes double that. Thus stability of purpose and continu-
ity of practice are important ingredients in successful reform (Pollitt, 2008). Yet stability
and continuity are increasingly hard to come by in today’s high-speed world. However,
some systems seem better able to support complex, longer-term reforms than others. If we
return to the ‘many houses’ of Chapter 3 we can see that the relative ease or difficulty with
which management reforms can be carried through may well have some bearing here. At
one extreme we have some rather slow-moving systems where reform has difficulty in
achieving the kind of momentum which it needs in order to build its identity and attract
sufficient support. The German federal government seems to be one such environment.
Belgium, for somewhat different reasons, is also a candidate, at least in the sense that an
REFLECTIONS 217
increasingly fragmented and fractious political system currently has difficulty in agreeing
on any fundamental machinery reforms. At the other extreme it can be so easy to
promulgate reform—the checks and balances are so flimsy—that governments may be
tempted to pile one political initiative on top of another, creating a merry-go-round of
reforms which soon induce reform fatigue among the officials concerned—and possibly
cynicism among the on-looking citizens. At times the UK seems to have belonged in this
category (Pollitt, 2007). It is the countries in between—where reforms require hard work
over time to construct the necessary political consensus, but which then have a good
chance of long-term survival in a less adversarial system—that may have the best hope of
sticking to agreed trajectories and eventually firmly embedding reforms. Finland, Sweden,
and, to a lesser extent the Netherlands, typify this kind of system.
Finally, fourth, we might suggest that our thirty-year view lends some support to the
idea that a proportion (not all) of the most fundamental choices in public management
involve trades-off or balancing acts between different underlying values or principles (as
discussed in Chapter 7). Do we want continuity and stability or ever-increasing choice and
innovation? Efficiency or equity? Effectiveness or efficiency? Expertise or diversity? As
already mentioned, over the past fifty years a number of notable academics have char-
acterized public administration knowledge as often having a proverbial or contradictory
character (Hood and Jackson, 1991; Simon, 1946). Of course we want all these things, but
the pursuit of one value (efficiency, say) is gradually realized to have a deleterious effect on
another (equity, say). At which point the currents of reform rhetoric may swing round and
stress the other value or values. But if they are vigorously pursued for a while, it will be
eventually realized that things are quietly becoming less efficient, and the tide will turn
once more. This is not to argue that the story of reform is one of an unending swing
between fixed poles (the values). Rather what seems to happen is that the level to which we
realize each value (or, at least, aspire to realize it) shifts upwards. Furthermore the value
itself may be redefined to fit new circumstances (du Gay, 2005). Thus the efficiency with
which we issue driving licences or pay pensions has climbed over the years, and our
notions of equity may have become more inclusive, but still the reform ball bounces
between them, and balance can be lost, even if it is a balance set at a higher or more
ambitious level. Thus (for example) in many countries we have attained levels of transpar-
ency and accountability undreamed of thirty years ago, and yet we still demand more of
these attributes. We have more choice than ever before, but we read in countless reform
documents that we need yet more. In some countries efficiency drives have been a fairly
constant presence for a quarter of a century, and yet we are told we must make more
efficiency gains.
8.5 What kind of answers are we looking for, and whatkind of answers can we reasonably expect to get?
This is rather a fundamental question and one which, logically, it could be argued should
have come at the beginning of the book rather than the end. Our priority, however, was to
218 REFLECTIONS
get to the facts (and alleged facts) about reforms first—to ‘get our hands dirty’—so we have
left the more metaphysical question until now. So, what kind of answers might we expect
from a study of management reforms? There is a spectrum that runs something like this:
1. Clear identification of certain models or forms or techniques that work well in most
places, times, and circumstances. These could be big models/paradigms like NWS or
NPG, or they could be individual tools such as single-purpose, contractually framed
executive agencies, or contracting out or performance-related pay. These would there-
fore function as generic solutions, based on law-like generalizations—serving within a
classic nomothetic approach to knowledge (Kay, 2006).
2. More limited and conditional generalizations, usually of the form ‘this usually works in
this way under these conditions and in these circumstances’. Thus, for example, we
might say ‘performance-related pay works best when tasks are simple and easily mea-
surable, and when staff can control the circumstances of their own productivity, and
where the general culture is fairly individualistic’. These are thus conditional and
probabilistic hypotheses (and may thus be rather complex/less than elegant). They
are explicitly contextualized. Nevertheless, they may be generalizable across quite
broad territories—for example, our proposition that centralized executives within
majoritarian systems have the capacity to make more radical management reforms
and formulate and decide them more quickly than decentralized executives within
consensual systems. (Notice that this does not mean that centralized, majoritarian
regimes necessarily or automatically will carry through radical reforms. It means they
can, but this potential will only be realized if there are competent—and sometimes
lucky—leaders who have ideas and actually want to use up political capital in trying to
put these ideas into effect.)
3. No big, generic laws or generalizations—not even those hedged about with probabil-
ities and conditions—but a shopping basket full of assorted insights and rules of thumb
that seem to have some transferability from one place to another. Thus we may observe
that the tighter performance measures are linked to explicit penalties and incentives,
the more impact they will have on behaviour and the more gaming and cheating is
likely to arise, or that crises often offer a window of opportunity for would-be reformers.
Such insightsmay encourage us to build bits of explanatory theory (it is not too difficult
to see why strong penalties and incentives may tempt more people to indulge in
gaming), but they do not ‘add up’ to any general theory that categorizes (still less
explains) patterns of public management reform. Although they can stimulate the-
ory-building they are more usually a type of ‘craft knowledge’ or practitioner’s wisdom,
rather than formal academic theory. In this sense category 3 type answers are different
from category 2 type answers, but there is also a degree of overlap between the two
categories—the boundary between them is not sharp.
4. No workable generalizations. Every situation is unique. The world is too complex and
uncertain for us to predict anything with much confidence. All we can do is to
describe, with hindsight and in narrative form, what seems to have worked and
what seems to have failed in a series of distinctive and highly chance-influenced
circumstances. This is the polar, pure type of the idiographic approach to knowledge
REFLECTIONS 219
(Kay, 2006). And in the hands of some writers it is pushed even further because of
their insistence that there is no one version of the story which is better than the
others, but only a range of alternative stories. The conclusion is then arrived at that
a range of ‘decentered narratives’ are about as much as we can hope for (Bevir and
Rhodes, 2006).
We are not the only interpreters of the material we have selected and shaped for inclusion
in this book. Any reader has the opportunity to draw their own conclusions. But, for what
it is worth, our own view is that answers at the two extremes (1 and 4 above) are either
unlikely (type 1) or unambitious (type 4). Readers are invited to search for type 1 generic
‘laws’—we find it hard to think of any that, under inspection, do not quickly dissolve into
qualifications and conditions and exceptions. Thus, for example, a detailed study of
Lijphart’s (1999, p. 301) general proposition that consensus democracies outperform
majoritarian democracies with regard to the kindness and gentleness of their public policy
orientations finds that it does not seem to apply very well to Belgium and the UK (Pollitt
and Bouckaert, 2009, pp. 158–67). Similarly, the generic hypothesis in Osborne and
Gaebler’s best selling Re-inventing Government (1992) that all governments would soon be
obliged to follow the road of the ‘entrepreneurial spirit’ has been shown by repeated
studies not to apply in all sorts of places (e.g. Bouckaert et al., 2008; Ongaro, 2009; Pollitt
et al., 2007). As far as the other pole is concerned—type 4—we acknowledge both that
highly idiographic studies can be quite fascinating and convincing, and that there may be
certain topics or issues where we cannot get any further than type 4. But to claim that type
4 answers are the only robust ones available seems a considerable exaggeration. There are
many type 2 and type 3 generalizations that work pretty well most of the time, and which,
at the very least, give researchers and reformers an illuminating way into particular
situations, even if these generalizations may require a certain amount of refinement and
qualification as one goes along. If evidence of this is needed, the reader need go no further
than Sections 8.2 and 8.3 above, both of which include a number of type 2 and 3 general-
izations which we believe are robust and which approximately conform with the volumi-
nous evidence we have reviewed elsewhere in this book.
The implications of this analysis for further research are fairly clear. In a nutshell, most
public management researchers should be aiming at generating knowledge of types 2 and
3, rather than 1 or 4. They should be looking at the way specific tools behave (and are
adapted) in specific contexts rather than trying to build models of global governance or—
at the other pole—lovingly recording, blow-by-blow, the evolution of the multiple view-
points of different stakeholders concerning the organization of the municipal refuse
collection service in Pudsea. They should also be tracing and analysing the way specific
ideas and concepts are spread and sold and move from one arena to another. It is therefore
in categories 2 and 3 that the modest hopes for some sort of cumulative knowledge about
public management reform mainly lie. The big models are stimulating, and will surely
keep on coming (it is actually quite easy to invent a new one, or, at least a new variation on
an existing one). Yet they do not take one very far, either in analysing actual reforms or in
prescribing what might be done in future. Worse, they can grievously mislead their users
into thinking that they really knowwhat is happening in country X or Y, or that it is just an
example of NPM or NPG, or whatever.
220 REFLECTIONS
Public management reform, we have suggested, is not a science, not a piece of manage-
rial technology, and certainly not a predetermined and inevitable outcome of ‘globaliza-
tion’ (or some other supposed universal imperative). It is a partly political, partly
organizational, partly economic, and partly technological process with quite uncertain
outcomes. It is informed by an assorted, untidy accumulation of knowledge which is
sometimes sufficient, but not infrequently incomplete, faulty or misapplied. Yet reform
is inevitable—one only has to try to imagine a world in which there would be no public
management reform to see how extremely improbable such a state of affairs must be. We
give the last word to Machiavelli:
[N]o government should ever imagine that it can adopt a safe course; rather it should regard all
possible courses of action as risky. This is the way things are: whenever one tries to escape one
danger one runs into another. Prudence consists in being able to assess the nature of the particular
threat and accepting the lesser evil. (Machiavelli, 2003, p. 73 [original, c.1516]).
REFLECTIONS 221
n APPEND IX A
The Socio-Economic Context
A.1 The scope and purpose of AppendicesA and B
Chapter 2 introduced the model of public manage-
ment reformwhich we have referred to throughout
the rest of the book (see Figure 2.1). In that model,
socio-economic forces (box A in Figure 2.1) are
given an important, though not finally determina-
tive role, in setting the climate for management
reform. Here in Appendix Awe offer a brief descrip-
tive summary of what that climate has been like
during the past twenty-five years. Then, in Appen-
dix B we move on to the specifics in each country,
and offer a brief ‘file’ summarizing the history of
reform in that state.
The two appendices together provide some basic
facts about the twelve countries covered in the
main text. Unlike many other multi-country stud-
ies, this book is not organized into single-country
chapters. It is deliberately and, we hope, advanta-
geously, organized by model and theme—thus per-
mitting a more integrated, less sequential form of
inter-country comparison. However, one price that
is paid for this type of integration is that the reader
is not offered neat little summaries of each coun-
try’s recent history and arrangements. Left thus,
readers who were not already familiar with the
relevant aspects of a particular country’s constitu-
tion, policies, and so on, would be at a considerable
disadvantage. To offset this possible handicap, Ap-
pendices A and B offer this type of information in a
conveniently packaged form. The contents of the
package are closely patterned on the model of pub-
lic management reform introduced in Chapter 2.
The sequence is therefore as follows:
APPENDIX A
� some information onmajor economic indicators
for each country (i.e. data which helps to ‘fill in’
the larger box ‘A’ in Figure 2.1);
� some information on key sociodemographic in-
dicators for each country (i.e. data which helps
fill in box ‘C’ in Figure 2.1).
APPENDIX B
� a set of ‘country files’ which give snapshots of
each country, organized in exactly the same cat-
egories as Chapter 2 and including, inter alia,
details of the major management reforms since
1980. Each ‘file’ concludes with a table summar-
izing key events.
A.2 Major economic indicators
As the model in Chapter 2 proposes, macro-eco-
nomic features influence public management re-
forms. Writing at a time when the GEC is directly
causing cutbacks, public service wage freezes, and
urgent reforms to try to maintain quality in the
face of reduced inputs, it should not be difficult to
persuade readers of this connection. However, it is
not only in the aftermath of crises that the eco-
nomic situation exerts an influence. Rather it is a
constant presence. When the economy is doing
well, tax revenues rise and social expenditure falls
(because there are fewer unemployed).When a gov-
ernment bears a heavy load of debt a considerable
slice of its expenditure must be devoted to paying
interest, and/or repaying the principal, and is there-
fore not available for spending on public services.
And so on.
In the following pages we look at some signifi-
cant macro-economic indicators. Most of the sta-
tistics have been extracted from the OECD’s
admirable Factbook 2010. We look at GDP growth,
and, as a rough proxy for the exposure of govern-
ments to international economic cycles, we exam-
ine the share that international trade represents of
GDP.
Then we go to government spending and gov-
ernment debt.
Three major limitations to this data should,
however, be acknowledged at the outset. First, it is
seldom, if ever, possible to read off conclusions
about a country’s economic health from a single
indicator. Second, some of these indicators are
‘snapshots’—indicators of the state of a variable
at a particular point in time or, at best, over a
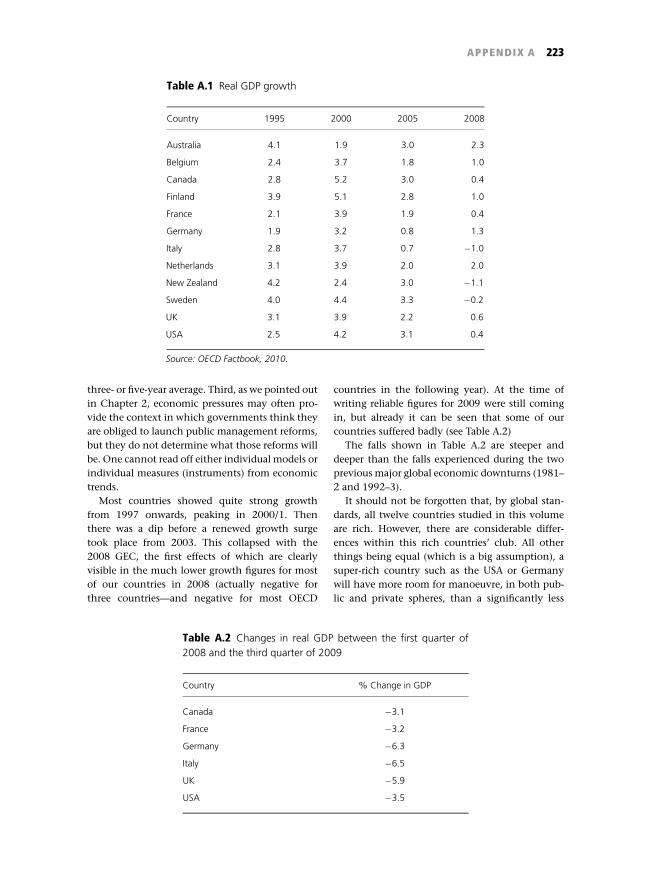
three- or five-year average. Third, as we pointed out
in Chapter 2, economic pressures may often pro-
vide the context in which governments think they
are obliged to launch public management reforms,
but they do not determine what those reforms will
be. One cannot read off either individual models or
individual measures (instruments) from economic
trends.
Most countries showed quite strong growth
from 1997 onwards, peaking in 2000/1. Then
there was a dip before a renewed growth surge
took place from 2003. This collapsed with the
2008 GEC, the first effects of which are clearly
visible in the much lower growth figures for most
of our countries in 2008 (actually negative for
three countries—and negative for most OECD
countries in the following year). At the time of
writing reliable figures for 2009 were still coming
in, but already it can be seen that some of our
countries suffered badly (see Table A.2)
The falls shown in Table A.2 are steeper and
deeper than the falls experienced during the two
previous major global economic downturns (1981–
2 and 1992–3).
It should not be forgotten that, by global stan-
dards, all twelve countries studied in this volume
are rich. However, there are considerable differ-
ences within this rich countries’ club. All other
things being equal (which is a big assumption), a
super-rich country such as the USA or Germany
will have more room for manoeuvre, in both pub-
lic and private spheres, than a significantly less
Table A.2 Changes in real GDP between the first quarter of
2008 and the third quarter of 2009
Country % Change in GDP
Canada �3.1
France �3.2
Germany �6.3
Italy �6.5
UK �5.9
USA �3.5
Table A.1 Real GDP growth
Country 1995 2000 2005 2008
Australia 4.1 1.9 3.0 2.3
Belgium 2.4 3.7 1.8 1.0
Canada 2.8 5.2 3.0 0.4
Finland 3.9 5.1 2.8 1.0
France 2.1 3.9 1.9 0.4
Germany 1.9 3.2 0.8 1.3
Italy 2.8 3.7 0.7 �1.0
Netherlands 3.1 3.9 2.0 2.0
New Zealand 4.2 2.4 3.0 �1.1
Sweden 4.0 4.4 3.3 �0.2
UK 3.1 3.9 2.2 0.6
USA 2.5 4.2 3.1 0.4
Source: OECD Factbook, 2010.
APPENDIX A 223
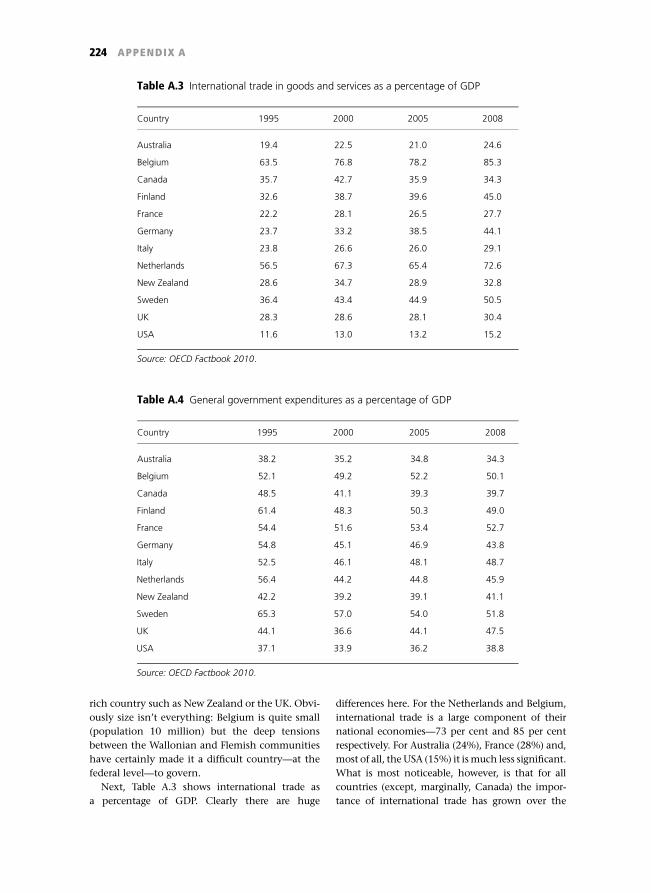
rich country such as New Zealand or the UK. Obvi-
ously size isn’t everything: Belgium is quite small
(population 10 million) but the deep tensions
between the Wallonian and Flemish communities
have certainly made it a difficult country—at the
federal level—to govern.
Next, Table A.3 shows international trade as
a percentage of GDP. Clearly there are huge
differences here. For the Netherlands and Belgium,
international trade is a large component of their
national economies—73 per cent and 85 per cent
respectively. For Australia (24%), France (28%) and,
most of all, the USA (15%) it ismuch less significant.
What is most noticeable, however, is that for all
countries (except, marginally, Canada) the impor-
tance of international trade has grown over the
Table A.3 International trade in goods and services as a percentage of GDP
Country 1995 2000 2005 2008
Australia 19.4 22.5 21.0 24.6
Belgium 63.5 76.8 78.2 85.3
Canada 35.7 42.7 35.9 34.3
Finland 32.6 38.7 39.6 45.0
France 22.2 28.1 26.5 27.7
Germany 23.7 33.2 38.5 44.1
Italy 23.8 26.6 26.0 29.1
Netherlands 56.5 67.3 65.4 72.6
New Zealand 28.6 34.7 28.9 32.8
Sweden 36.4 43.4 44.9 50.5
UK 28.3 28.6 28.1 30.4
USA 11.6 13.0 13.2 15.2
Source: OECD Factbook 2010.
Table A.4 General government expenditures as a percentage of GDP
Country 1995 2000 2005 2008
Australia 38.2 35.2 34.8 34.3
Belgium 52.1 49.2 52.2 50.1
Canada 48.5 41.1 39.3 39.7
Finland 61.4 48.3 50.3 49.0
France 54.4 51.6 53.4 52.7
Germany 54.8 45.1 46.9 43.8
Italy 52.5 46.1 48.1 48.7
Netherlands 56.4 44.2 44.8 45.9
New Zealand 42.2 39.2 39.1 41.1
Sweden 65.3 57.0 54.0 51.8
UK 44.1 36.6 44.1 47.5
USA 37.1 33.9 36.2 38.8
Source: OECD Factbook 2010.
224 APPENDIX A
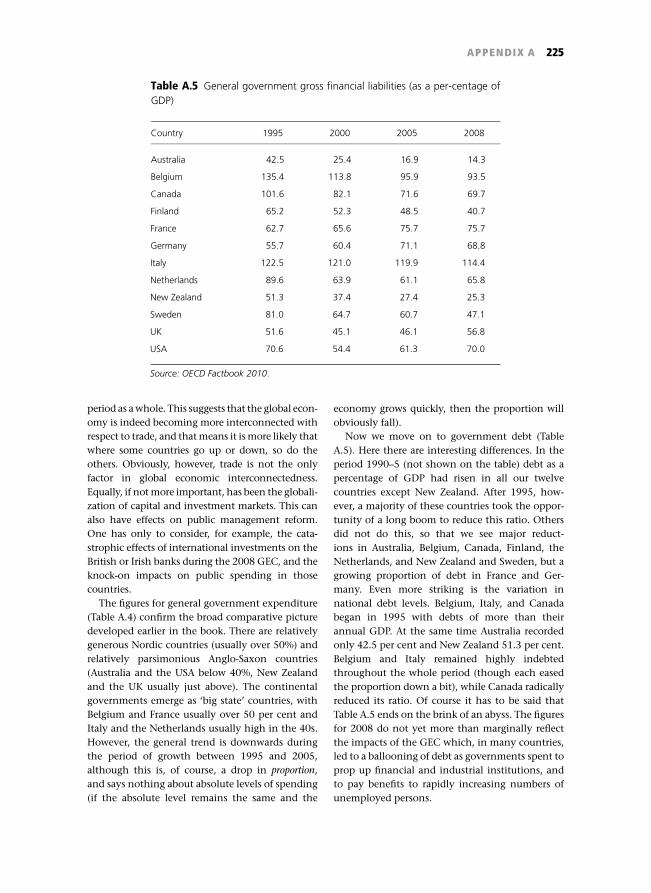
period as awhole. This suggests that the global econ-
omy is indeed becoming more interconnected with
respect to trade, and thatmeans it ismore likely that
where some countries go up or down, so do the
others. Obviously, however, trade is not the only
factor in global economic interconnectedness.
Equally, if notmore important, has been the globali-
zation of capital and investment markets. This can
also have effects on public management reform.
One has only to consider, for example, the cata-
strophic effects of international investments on the
British or Irish banks during the 2008 GEC, and the
knock-on impacts on public spending in those
countries.
The figures for general government expenditure
(Table A.4) confirm the broad comparative picture
developed earlier in the book. There are relatively
generous Nordic countries (usually over 50%) and
relatively parsimonious Anglo-Saxon countries
(Australia and the USA below 40%, New Zealand
and the UK usually just above). The continental
governments emerge as ‘big state’ countries, with
Belgium and France usually over 50 per cent and
Italy and the Netherlands usually high in the 40s.
However, the general trend is downwards during
the period of growth between 1995 and 2005,
although this is, of course, a drop in proportion,
and says nothing about absolute levels of spending
(if the absolute level remains the same and the
economy grows quickly, then the proportion will
obviously fall).
Now we move on to government debt (Table
A.5). Here there are interesting differences. In the
period 1990–5 (not shown on the table) debt as a
percentage of GDP had risen in all our twelve
countries except New Zealand. After 1995, how-
ever, a majority of these countries took the oppor-
tunity of a long boom to reduce this ratio. Others
did not do this, so that we see major reduct-
ions in Australia, Belgium, Canada, Finland, the
Netherlands, and New Zealand and Sweden, but a
growing proportion of debt in France and Ger-
many. Even more striking is the variation in
national debt levels. Belgium, Italy, and Canada
began in 1995 with debts of more than their
annual GDP. At the same time Australia recorded
only 42.5 per cent and New Zealand 51.3 per cent.
Belgium and Italy remained highly indebted
throughout the whole period (though each eased
the proportion down a bit), while Canada radically
reduced its ratio. Of course it has to be said that
Table A.5 ends on the brink of an abyss. The figures
for 2008 do not yet more than marginally reflect
the impacts of the GEC which, in many countries,
led to a ballooning of debt as governments spent to
prop up financial and industrial institutions, and
to pay benefits to rapidly increasing numbers of
unemployed persons.
Table A.5 General government gross financial liabilities (as a per-centage of
GDP)
Country 1995 2000 2005 2008
Australia 42.5 25.4 16.9 14.3
Belgium 135.4 113.8 95.9 93.5
Canada 101.6 82.1 71.6 69.7
Finland 65.2 52.3 48.5 40.7
France 62.7 65.6 75.7 75.7
Germany 55.7 60.4 71.1 68.8
Italy 122.5 121.0 119.9 114.4
Netherlands 89.6 63.9 61.1 65.8
New Zealand 51.3 37.4 27.4 25.3
Sweden 81.0 64.7 60.7 47.1
UK 51.6 45.1 46.1 56.8
USA 70.6 54.4 61.3 70.0
Source: OECD Factbook 2010.
APPENDIX A 225
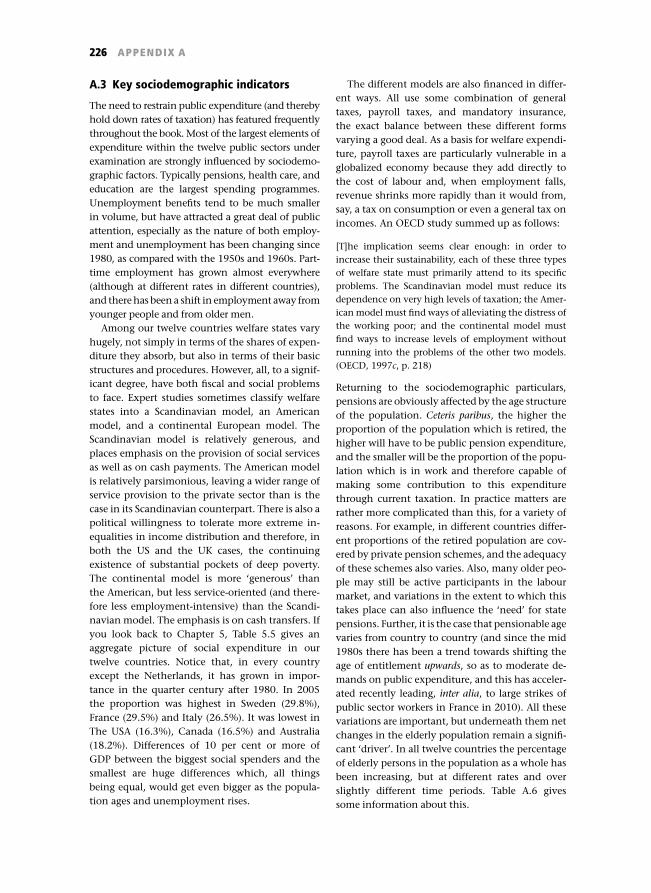
A.3 Key sociodemographic indicators
The need to restrain public expenditure (and thereby
hold down rates of taxation) has featured frequently
throughout the book. Most of the largest elements of
expenditure within the twelve public sectors under
examination are strongly influenced by sociodemo-
graphic factors. Typically pensions, health care, and
education are the largest spending programmes.
Unemployment benefits tend to be much smaller
in volume, but have attracted a great deal of public
attention, especially as the nature of both employ-
ment and unemployment has been changing since
1980, as compared with the 1950s and 1960s. Part-
time employment has grown almost everywhere
(although at different rates in different countries),
and therehas beena shift in employment away from
younger people and from older men.
Among our twelve countries welfare states vary
hugely, not simply in terms of the shares of expen-
diture they absorb, but also in terms of their basic
structures and procedures. However, all, to a signif-
icant degree, have both fiscal and social problems
to face. Expert studies sometimes classify welfare
states into a Scandinavian model, an American
model, and a continental European model. The
Scandinavian model is relatively generous, and
places emphasis on the provision of social services
as well as on cash payments. The American model
is relatively parsimonious, leaving a wider range of
service provision to the private sector than is the
case in its Scandinavian counterpart. There is also a
political willingness to tolerate more extreme in-
equalities in income distribution and therefore, in
both the US and the UK cases, the continuing
existence of substantial pockets of deep poverty.
The continental model is more ‘generous’ than
the American, but less service-oriented (and there-
fore less employment-intensive) than the Scandi-
navian model. The emphasis is on cash transfers. If
you look back to Chapter 5, Table 5.5 gives an
aggregate picture of social expenditure in our
twelve countries. Notice that, in every country
except the Netherlands, it has grown in impor-
tance in the quarter century after 1980. In 2005
the proportion was highest in Sweden (29.8%),
France (29.5%) and Italy (26.5%). It was lowest in
The USA (16.3%), Canada (16.5%) and Australia
(18.2%). Differences of 10 per cent or more of
GDP between the biggest social spenders and the
smallest are huge differences which, all things
being equal, would get even bigger as the popula-
tion ages and unemployment rises.
The different models are also financed in differ-
ent ways. All use some combination of general
taxes, payroll taxes, and mandatory insurance,
the exact balance between these different forms
varying a good deal. As a basis for welfare expendi-
ture, payroll taxes are particularly vulnerable in a
globalized economy because they add directly to
the cost of labour and, when employment falls,
revenue shrinks more rapidly than it would from,
say, a tax on consumption or even a general tax on
incomes. An OECD study summed up as follows:
[T]he implication seems clear enough: in order to
increase their sustainability, each of these three types
of welfare state must primarily attend to its specific
problems. The Scandinavian model must reduce its
dependence on very high levels of taxation; the Amer-
ican model must find ways of alleviating the distress of
the working poor; and the continental model must
find ways to increase levels of employment without
running into the problems of the other two models.
(OECD, 1997c, p. 218)
Returning to the sociodemographic particulars,
pensions are obviously affected by the age structure
of the population. Ceteris paribus, the higher the
proportion of the population which is retired, the
higher will have to be public pension expenditure,
and the smaller will be the proportion of the popu-
lation which is in work and therefore capable of
making some contribution to this expenditure
through current taxation. In practice matters are
rather more complicated than this, for a variety of
reasons. For example, in different countries differ-
ent proportions of the retired population are cov-
ered by private pension schemes, and the adequacy
of these schemes also varies. Also, many older peo-
ple may still be active participants in the labour
market, and variations in the extent to which this
takes place can also influence the ‘need’ for state
pensions. Further, it is the case that pensionable age
varies from country to country (and since the mid
1980s there has been a trend towards shifting the
age of entitlement upwards, so as to moderate de-
mands on public expenditure, and this has acceler-
ated recently leading, inter alia, to large strikes of
public sector workers in France in 2010). All these
variations are important, but underneath them net
changes in the elderly population remain a signifi-
cant ‘driver’. In all twelve countries the percentage
of elderly persons in the population as a whole has
been increasing, but at different rates and over
slightly different time periods. Table A.6 gives
some information about this.
226 APPENDIX A
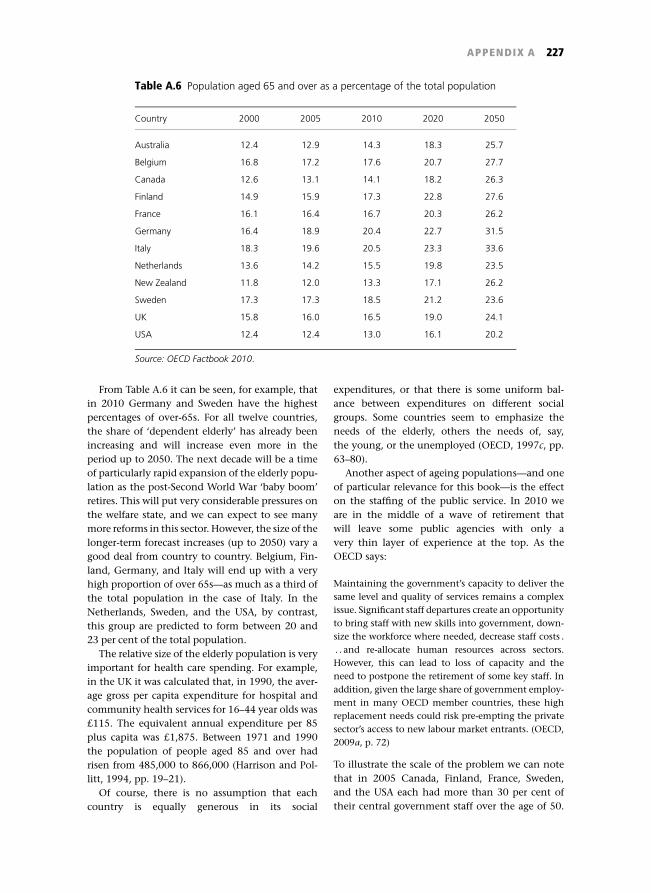
From Table A.6 it can be seen, for example, that
in 2010 Germany and Sweden have the highest
percentages of over-65s. For all twelve countries,
the share of ‘dependent elderly’ has already been
increasing and will increase even more in the
period up to 2050. The next decade will be a time
of particularly rapid expansion of the elderly popu-
lation as the post-Second World War ‘baby boom’
retires. This will put very considerable pressures on
the welfare state, and we can expect to see many
more reforms in this sector. However, the size of the
longer-term forecast increases (up to 2050) vary a
good deal from country to country. Belgium, Fin-
land, Germany, and Italy will end up with a very
high proportion of over 65s—as much as a third of
the total population in the case of Italy. In the
Netherlands, Sweden, and the USA, by contrast,
this group are predicted to form between 20 and
23 per cent of the total population.
The relative size of the elderly population is very
important for health care spending. For example,
in the UK it was calculated that, in 1990, the aver-
age gross per capita expenditure for hospital and
community health services for 16–44 year olds was
£115. The equivalent annual expenditure per 85
plus capita was £1,875. Between 1971 and 1990
the population of people aged 85 and over had
risen from 485,000 to 866,000 (Harrison and Pol-
litt, 1994, pp. 19–21).
Of course, there is no assumption that each
country is equally generous in its social
expenditures, or that there is some uniform bal-
ance between expenditures on different social
groups. Some countries seem to emphasize the
needs of the elderly, others the needs of, say,
the young, or the unemployed (OECD, 1997c, pp.
63–80).
Another aspect of ageing populations—and one
of particular relevance for this book—is the effect
on the staffing of the public service. In 2010 we
are in the middle of a wave of retirement that
will leave some public agencies with only a
very thin layer of experience at the top. As the
OECD says:
Maintaining the government’s capacity to deliver the
same level and quality of services remains a complex
issue. Significant staff departures create an opportunity
to bring staff with new skills into government, down-
size the workforce where needed, decrease staff costs .
. . and re-allocate human resources across sectors.
However, this can lead to loss of capacity and the
need to postpone the retirement of some key staff. In
addition, given the large share of government employ-
ment in many OECD member countries, these high
replacement needs could risk pre-empting the private
sector’s access to new labour market entrants. (OECD,
2009a, p. 72)
To illustrate the scale of the problem we can note
that in 2005 Canada, Finland, France, Sweden,
and the USA each had more than 30 per cent of
their central government staff over the age of 50.
Table A.6 Population aged 65 and over as a percentage of the total population
Country 2000 2005 2010 2020 2050
Australia 12.4 12.9 14.3 18.3 25.7
Belgium 16.8 17.2 17.6 20.7 27.7
Canada 12.6 13.1 14.1 18.2 26.3
Finland 14.9 15.9 17.3 22.8 27.6
France 16.1 16.4 16.7 20.3 26.2
Germany 16.4 18.9 20.4 22.7 31.5
Italy 18.3 19.6 20.5 23.3 33.6
Netherlands 13.6 14.2 15.5 19.8 23.5
New Zealand 11.8 12.0 13.3 17.1 26.2
Sweden 17.3 17.3 18.5 21.2 23.6
UK 15.8 16.0 16.5 19.0 24.1
USA 12.4 12.4 13.0 16.1 20.2
Source: OECD Factbook 2010.
APPENDIX A 227
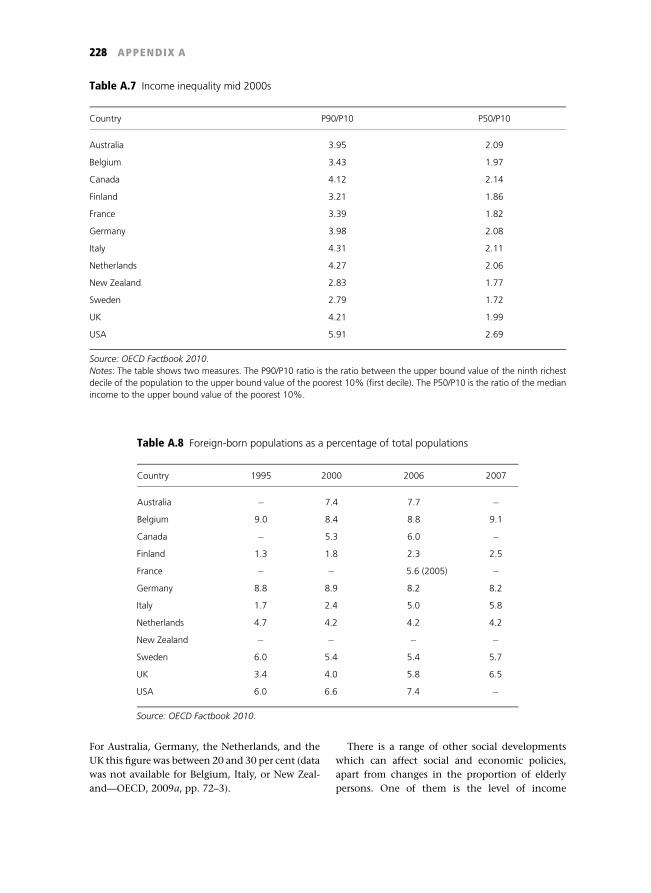
For Australia, Germany, the Netherlands, and the
UK this figure was between 20 and 30 per cent (data
was not available for Belgium, Italy, or New Zeal-
and—OECD, 2009a, pp. 72–3).
There is a range of other social developments
which can affect social and economic policies,
apart from changes in the proportion of elderly
persons. One of them is the level of income
Table A.7 Income inequality mid 2000s
Country P90/P10 P50/P10
Australia 3.95 2.09
Belgium 3.43 1.97
Canada 4.12 2.14
Finland 3.21 1.86
France 3.39 1.82
Germany 3.98 2.08
Italy 4.31 2.11
Netherlands 4.27 2.06
New Zealand 2.83 1.77
Sweden 2.79 1.72
UK 4.21 1.99
USA 5.91 2.69
Source: OECD Factbook 2010.
Notes: The table shows two measures. The P90/P10 ratio is the ratio between the upper bound value of the ninth richest
decile of the population to the upper bound value of the poorest 10% (first decile). The P50/P10 is the ratio of the median
income to the upper bound value of the poorest 10%.
Table A.8 Foreign-born populations as a percentage of total populations
Country 1995 2000 2006 2007
Australia � 7.4 7.7 �Belgium 9.0 8.4 8.8 9.1
Canada � 5.3 6.0 �Finland 1.3 1.8 2.3 2.5
France � � 5.6 (2005) �Germany 8.8 8.9 8.2 8.2
Italy 1.7 2.4 5.0 5.8
Netherlands 4.7 4.2 4.2 4.2
New Zealand � � � �Sweden 6.0 5.4 5.4 5.7
UK 3.4 4.0 5.8 6.5
USA 6.0 6.6 7.4 �
Source: OECD Factbook 2010.
228 APPENDIX A
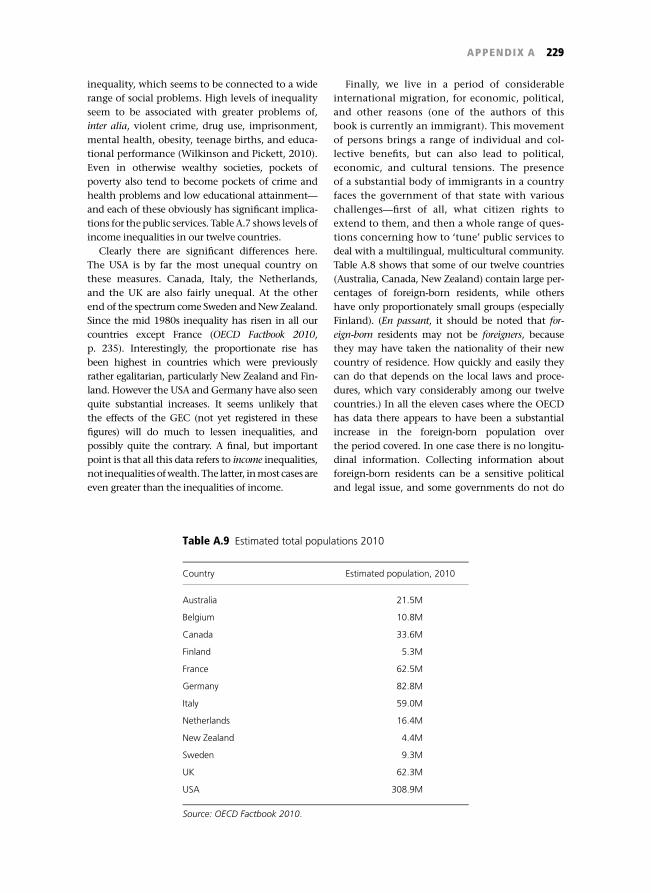
inequality, which seems to be connected to a wide
range of social problems. High levels of inequality
seem to be associated with greater problems of,
inter alia, violent crime, drug use, imprisonment,
mental health, obesity, teenage births, and educa-
tional performance (Wilkinson and Pickett, 2010).
Even in otherwise wealthy societies, pockets of
poverty also tend to become pockets of crime and
health problems and low educational attainment—
and each of these obviously has significant implica-
tions for the public services. Table A.7 shows levels of
income inequalities in our twelve countries.
Clearly there are significant differences here.
The USA is by far the most unequal country on
these measures. Canada, Italy, the Netherlands,
and the UK are also fairly unequal. At the other
end of the spectrum come Sweden andNew Zealand.
Since the mid 1980s inequality has risen in all our
countries except France (OECD Factbook 2010,
p. 235). Interestingly, the proportionate rise has
been highest in countries which were previously
rather egalitarian, particularly New Zealand and Fin-
land. However the USA and Germany have also seen
quite substantial increases. It seems unlikely that
the effects of the GEC (not yet registered in these
figures) will do much to lessen inequalities, and
possibly quite the contrary. A final, but important
point is that all this data refers to income inequalities,
not inequalities ofwealth. The latter, inmost cases are
even greater than the inequalities of income.
Finally, we live in a period of considerable
international migration, for economic, political,
and other reasons (one of the authors of this
book is currently an immigrant). This movement
of persons brings a range of individual and col-
lective benefits, but can also lead to political,
economic, and cultural tensions. The presence
of a substantial body of immigrants in a country
faces the government of that state with various
challenges—first of all, what citizen rights to
extend to them, and then a whole range of ques-
tions concerning how to ‘tune’ public services to
deal with a multilingual, multicultural community.
Table A.8 shows that some of our twelve countries
(Australia, Canada, New Zealand) contain large per-
centages of foreign-born residents, while others
have only proportionately small groups (especially
Finland). (En passant, it should be noted that for-
eign-born residents may not be foreigners, because
they may have taken the nationality of their new
country of residence. How quickly and easily they
can do that depends on the local laws and proce-
dures, which vary considerably among our twelve
countries.) In all the eleven cases where the OECD
has data there appears to have been a substantial
increase in the foreign-born population over
the period covered. In one case there is no longitu-
dinal information. Collecting information about
foreign-born residents can be a sensitive political
and legal issue, and some governments do not do
Table A.9 Estimated total populations 2010
Country Estimated population, 2010
Australia 21.5M
Belgium 10.8M
Canada 33.6M
Finland 5.3M
France 62.5M
Germany 82.8M
Italy 59.0M
Netherlands 16.4M
New Zealand 4.4M
Sweden 9.3M
UK 62.3M
USA 308.9M
Source: OECD Factbook 2010.
APPENDIX A 229

it, or only do it very occasionally. The general
trend, aided by economic liberalization, has been
for greater international movement.
Finally, it may be worthwhile to remind
ourselves that sheer size matters, and that we
are dealing with very differently sized countries in
respect of population. These range from quite small
and fairly socially homogenous countries like Fin-
land and New Zealand, to large countries with very
substantial foreign-born populations, such as the
USA and Germany. Table A.9 shows estimated total
populations in 2010.
230 APPENDIX A
n APPEND IX B
Country Files and Tables of Events
AUSTRALIA
A. Socio-economic forces: general
Australia is a very large country,with a relativelymod-
est population of 21.5 Million (2010). For key eco-
nomic and socio-demographic data see Appendix A.
B. Global economic forces
Like New Zealand, Australia relinquished most of
its protectionist policies of the 1950–75 period as
no longer viable. Unsurprisingly, therefore, com-
petitiveness has become a major issue for govern-
ments of all political colours. International trade
represents a somewhat more modest proportion of
the Australian economy than for the majority of
our twelve countries (see Table A.3).
C. Sociodemographic change
Two features of the 1970s and 1980s which tended
to dilute the previous assumptions of Australia as
an overwhelmingly white, post-colonial society
were, first, an influx of Asian immigrants and, sec-
ond, an increasingly strong demand for political
(including territorial) rights by the aboriginal
peoples. By the early twenty-first century immigra-
tion was a major political issue with the Howard
government attempting to make political capital
out of its tough stance with respect to asylum see-
kers and refugees. However, the pressures of an
ageing society have thus far been somewhat less
than those experienced by most Western European
states (4th lowest proportion out of twelve
countries in 2010—see Table A.6). Nevertheless,
the passing into retirement of the ‘baby-boomer’
generation is currently imposing considerable
strain on the Australian Public Service (see Austra-
lian Public Service Commission, 2004).
D. National socio-economic policies
Australia and New Zealand were both obliged,
during the 1980s, to move away from previous
protectionist policies which had involved a high
degree of state regulation and intervention in the
economy. ‘Increasingly both countries turned to
the private sector and the use of market principles
within the public sector, which have been linked to
broader programmes of economic reform’
(Halligan, 1997, p. 17). Also like New Zealand,
one component in the shift of economic strategy
was a recognition that a higher proportion of both
imports and exports were now coming from Asia,
rather than from Europe (Castles et al., 1996,
pp. 24–6).
The Hawke Labor government increased public
spending as a percentage of GDP. However, the
terms of trade deteriorated sharply in 1985/6
and the second half of the 1980s witnessed an
intensified effort at expenditure reduction. This,
in turn, focused efforts to increase public sector
efficiency and streamline government. By the mid
1990s the Australian economy was performing bet-
ter, and has generally recorded an above-OECD
average record for a number of years.
It might be said that the transition to new
macro-economic and micro-economic policies
was both sharper and more painful in New Zealand
than Australia. During the 1985–92 period Australia
enjoyedmuch better economic growth and employ-
ment growth than New Zealand (Castles et al.,
1996). Micro-economic reforms were mediated
through corporatist negotiationswith theAustralian
trade unions, whereas the New Zealand reforms had
a more ‘imposed’ quality.
The effects of the 2008 GEC were somewhat
muted by a healthy surplus and the continuing
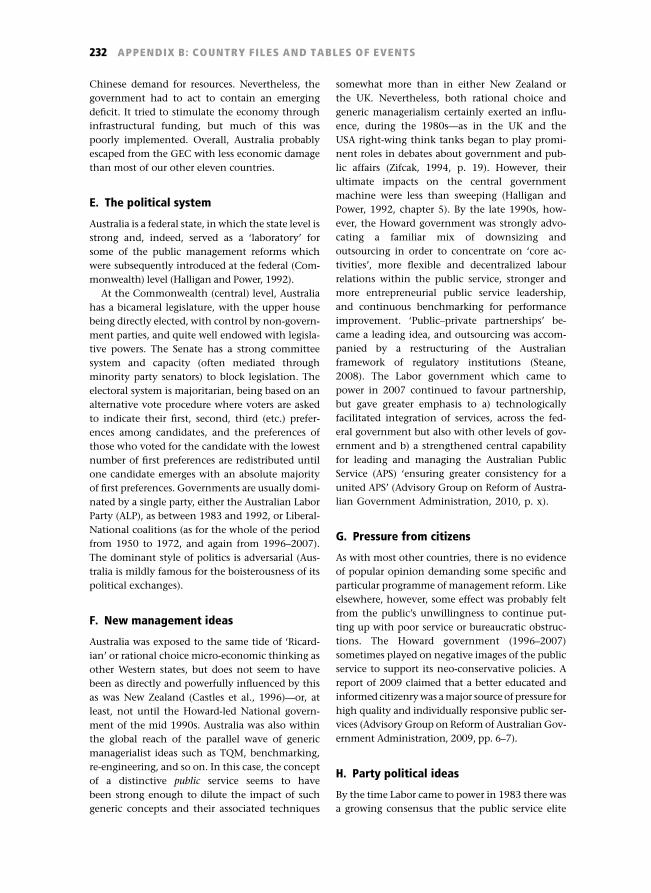
Chinese demand for resources. Nevertheless, the
government had to act to contain an emerging
deficit. It tried to stimulate the economy through
infrastructural funding, but much of this was
poorly implemented. Overall, Australia probably
escaped from the GEC with less economic damage
than most of our other eleven countries.
E. The political system
Australia is a federal state, in which the state level is
strong and, indeed, served as a ‘laboratory’ for
some of the public management reforms which
were subsequently introduced at the federal (Com-
monwealth) level (Halligan and Power, 1992).
At the Commonwealth (central) level, Australia
has a bicameral legislature, with the upper house
being directly elected, with control by non-govern-
ment parties, and quite well endowed with legisla-
tive powers. The Senate has a strong committee
system and capacity (often mediated through
minority party senators) to block legislation. The
electoral system is majoritarian, being based on an
alternative vote procedure where voters are asked
to indicate their first, second, third (etc.) prefer-
ences among candidates, and the preferences of
those who voted for the candidate with the lowest
number of first preferences are redistributed until
one candidate emerges with an absolute majority
of first preferences. Governments are usually domi-
nated by a single party, either the Australian Labor
Party (ALP), as between 1983 and 1992, or Liberal-
National coalitions (as for the whole of the period
from 1950 to 1972, and again from 1996–2007).
The dominant style of politics is adversarial (Aus-
tralia is mildly famous for the boisterousness of its
political exchanges).
F. New management ideas
Australia was exposed to the same tide of ‘Ricard-
ian’ or rational choice micro-economic thinking as
other Western states, but does not seem to have
been as directly and powerfully influenced by this
as was New Zealand (Castles et al., 1996)—or, at
least, not until the Howard-led National govern-
ment of the mid 1990s. Australia was also within
the global reach of the parallel wave of generic
managerialist ideas such as TQM, benchmarking,
re-engineering, and so on. In this case, the concept
of a distinctive public service seems to have
been strong enough to dilute the impact of such
generic concepts and their associated techniques
somewhat more than in either New Zealand or
the UK. Nevertheless, both rational choice and
generic managerialism certainly exerted an influ-
ence, during the 1980s—as in the UK and the
USA right-wing think tanks began to play promi-
nent roles in debates about government and pub-
lic affairs (Zifcak, 1994, p. 19). However, their
ultimate impacts on the central government
machine were less than sweeping (Halligan and
Power, 1992, chapter 5). By the late 1990s, how-
ever, the Howard government was strongly advo-
cating a familiar mix of downsizing and
outsourcing in order to concentrate on ‘core ac-
tivities’, more flexible and decentralized labour
relations within the public service, stronger and
more entrepreneurial public service leadership,
and continuous benchmarking for performance
improvement. ‘Public–private partnerships’ be-
came a leading idea, and outsourcing was accom-
panied by a restructuring of the Australian
framework of regulatory institutions (Steane,
2008). The Labor government which came to
power in 2007 continued to favour partnership,
but gave greater emphasis to a) technologically
facilitated integration of services, across the fed-
eral government but also with other levels of gov-
ernment and b) a strengthened central capability
for leading and managing the Australian Public
Service (APS) ‘ensuring greater consistency for a
united APS’ (Advisory Group on Reform of Austra-
lian Government Administration, 2010, p. x).
G. Pressure from citizens
As with most other countries, there is no evidence
of popular opinion demanding some specific and
particular programme of management reform. Like
elsewhere, however, some effect was probably felt
from the public’s unwillingness to continue put-
ting up with poor service or bureaucratic obstruc-
tions. The Howard government (1996–2007)
sometimes played on negative images of the public
service to support its neo-conservative policies. A
report of 2009 claimed that a better educated and
informed citizenrywas amajor source of pressure for
high quality and individually responsive public ser-
vices (Advisory Group on Reform of Australian Gov-
ernment Administration, 2009, pp. 6–7).
H. Party political ideas
By the time Labor came to power in 1983 there was
a growing consensus that the public service elite
232 APPENDIX B: COUNTRY FILES AND TABLES OF EVENTS
had become too much of a ‘law unto themselves’,
and there was an appetite for a reassertion of polit-
ical direction. This generalized sense that the pub-
lic service required reform was clearly illustrated in
the incoming government’s White Paper on the
public service (Commonwealth, 1983) and the
1984 Public Service Reform Act.
When, after a narrow victory in 1993, Labor’s
run of office finally came to an end in 1996, their
National Party successors brought with them an at
least equal suspicion of self-interested behaviour
by the public service, combined with a stronger
enthusiasm for privatization and the institution
of market-type mechanisms within the public sec-
tor. As a departmental secretary in the Howard
administration put it in 1997: ‘It is important
that the APS [Australian Public Service] takes
what practices and experiences it usefully can
from the private sector. We have often lagged
behind private sector efficiencies, largely because
we have lacked the edge of competition and the
reality of meaningful performance targets’ (Hawke,
1997, pp. 40–1). The 2007 victory of the Labor
party brought back a less anti-civil service attitude,
but also continued the later Howard period’s ten-
dency to want to increase ministerial (central) con-
trol of policy implementation.
I. Chance events
None of great significance for public management
reform. However, the ‘children overboard’ incident
during the 2001 general election became very con-
troversial, and led to a number of subsequent inquir-
ies and commentaries, most ofwhich suggested that
decision-making and record-keeping practices at
high levels had become both highly informal and
rather slack (e.g. Weller, 2002, p. 89).
J. Elite decision-making
From 1983 onwards there was a consistent desire
by the Labor governments (1983–96) and their
National successors to assert full political control
over the Australian public service (Halligan, 2001).
During the 1980s ‘Managerialismofferedboth anew
approach for directing the public service and a ratio-
nalization for exerting greater political control’ (Hal-
ligan, 1996b, p. 77). On the other hand, while the
Labor politicians knew the direction in which they
wanted to travel, they were not devotees of one
particular model of reform: ‘Australia has followed
a more pragmatic mixture of principles and practice
in contrast to the theory-driven reform in New
Zealand’ (Halligan, 1996b, p. 79). The long period
inoffice after 1983meant that Labor politicianswere
able to build up confidence and knowledge in their
reform efforts. Thus, for example, important new
reforms were launched in 1987, after ministers had
had some opportunity to observe what worked and
what didn’t in Canberra.
The Howard government, from 1996, was per-
haps more ‘pure’ in its doctrines, and vigorously
espoused the neo-conservative ideas of downsizing,
contracting out, and privatizing. However, it
claimed to stick to the principle of an apolitical pub-
lic service, albeit one with much less of a monopoly
of policy advice than formerly (Halligan, 2001).
Despite this, controversies arose about senior ap-
pointments and the removal of a number of senior
officials from their positions. From 2008 the Rudd
government said that it would avoid this kind of
behaviour, and would seek to embrace evidence-
based policymaking (Rudd, 2008).
K. The administrative system
At the beginning of our period (1980) the Austra-
lian Public Service remained in the classic ‘West-
minster’ mode—separate political and mandarin
careers, a strictly party-politically neutral, perma-
nent career service, a near monopoly of policy
advice to ministers, and strongly hierarchical,
high levels of unionization. This ‘Westminster
model’ was extensively changed during the two
following decades. Tenure was now less secure;
the presence of partisan advisers within the system
was much more extensive; levels of unionization—
and the role of the unions—was reduced; user-charg-
ing, quasi or actual contracts, and outsourcing
extensively replaced administrative hierarchies.
The size of the APS declined through most of the
last twenty years, falling especially steeply between
1994 and 1999 (from more than 160,000 to fewer
than 120,000—Advisory Group on Reform of Aus-
tralian Government Administration, 2009, p. 2). It
grew after 2005, fairly much regaining its absolute
1994 level by 2008. However, because the Australian
labour force as awholehad grownduring this period
the 2008 APS represented only 1.5 per cent of the
total workforce, as compared with 1.8 per cent in
1994.
Furthermore, the Howard government pushed
through a good deal of privatization and contracting
out of services. Public–private partnerships were fa-
voured for what had been mainly purely public
AUSTRALIA 233
tasks. For the civil service this meant a greater
emphasis on skills connected with contracting,
quality monitoring, and general regulation—that
is, arm’s-length rather than hands-on activities.
L. Contents of the reform package
In 1983 the first priority of the new Labor govern-
ment was ‘to re-establish ministerial control and
greater responsiveness to government policies
and priorities’ (Halligan, 1997, p. 31). This meant
reform of the Australian public service so as to shift
the balance of power between bureaucrats and po-
liticians more in favour of the latter. Actions
included a number of components which were de-
signed to reduce the permanency of public ser-
vants, diversify sources of policy advice to
ministers, and increase both managerial compe-
tence and the responsiveness of public servants to
the government’s political priorities. A central
vehicle for this was the creation of a Senior Execu-
tive Service (SES) as part of the 1984 Public Service
Reform Act. The effects of this were not particularly
radical to begin with, but when combined with the
1987 restructuring (see below) led to much more
mobility and diversity in the upper reaches of the
service.
The key developments during the long Labor
term of office from 1983 to 1996 included the
following:
� 1983: Launch of the Financial Management
Improvement Program (FMIP), including strong
elements of corporate management and
programme budgeting, plus mandatory evalua-
tion to ‘close the loop’ for a new system of re-
sults-oriented management (see Zifcak, 1994).
� 1984: Public Service Reform Act—creation of a
Senior Executive Service. One aim was to make
recruitment to senior public service appoint-
ments more open and competitive.
� 1987: Major restructuring of central depart-
ments. Twenty-eight portfolio ministries were
merged to produce sixteen large departments.
In particular, ‘mega’ departments emerged with
responsibility for Foreign Affairs and Trade, Edu-
cation, Employment and Training, and Trans-
port and Communications. These changes
forced a considerable reshuffling of senior posts.
A Department of Administrative Services (DAS)
was formed, which subsequently became asso-
ciated with a strong drive to increase competi-
tion. Greater emphasis was also placed on
creating a tighter regime for the Government
Business Enterprises (GBEs)—the growing num-
ber of public sector units and activities which
had been ‘corporatized’. (Subsequently many of
these were privatized—see below.)
� Late 1980s: Beginnings of a sequence of signifi-
cant sales of public sector assets, for example, De-
fence Service Homes Corporation (1988–90),
Qantas airline (1992–5), and Commonwealth
Bank (1994) (for more detail, see Halligan, 1996b,
p. 34).
� 1993: Publication of the Hilmer Report, National
Competition Policy, recommendations from which
were subsequently embodied in an intergovern-
mental agreement to seek competitive neutrality
(a ‘level playing field’) as between public and pri-
vate sectors.
The Howard administration from 1996 conti-
nued and intensified the processes of privatization
and contracting out. Other key developments
included the 1999 Public Service Act, which signif-
icantly ‘deprivileged’ the senior public service,
although it did include a statutory list of APS ‘va-
lues’. It also included a full devolution of personnel
management powers to agency heads, leading
some commentators to argue that the unity of the
APS was under threat. Certainly the Australian Pub-
lic Service Commissioner did not seem to be left
withmany executive powers (Australian Public Ser-
vice Commission, 2004) The Howard government
also carried through further contracting out, and
there was a shift to accruals accounting, and an
intensification of the existing performance mea-
surement regime. Changes initiated in 1999/2000
introduced a system of accruals-based output and
outcome measurement. It was part of a ‘long term,
iterative process’ (Hawke, 2007, p. 13). Whilst
many observers believe that this has involved con-
siderable sharpening of the performance focus, and
also improved transparency, there have also been
recurring disappointments concerning the quality
of performance information and the limited
use that is made of it for budgetary decision-
making (Hawke, 2007, p. 14). There was also a
major drive to restrain government regulation—a
‘meta-regulatory regime’—carried out under the
Competition Principles Agreement (see Morgan,
1999).
In 2004 the Management Advisory Committee
published Connecting Government: Whole of Govern-
ment Responses to Australia’s Priority Challenges. This
signalled a recognition that agencification, strict
234 APPENDIX B: COUNTRY FILES AND TABLES OF EVENTS
performance targets by agency, contracting out,
and other aspects of recent policy were producing
unwanted effects of fragmentation and loss of coor-
dination. Reintegration through whole-of-govern-
ment approaches was called for (see also Bouckaert
and Halligan, 2008, appendix V).
A further important document was the 2007
Australian Public Service Commission Building Bet-
ter Governance. It declared the principles of good
governance to be:
1. Accountability
2. Transparency/openness
3. Integrity
4. Stewardship
5. Efficiency
6. Leadership
The Rudd administration (from 2007) declared that
it had no in-built preference for public or private
sector provision, but would base decisions ‘on the
available evidence on how to deliver services effi-
ciently and effectively’ (Rudd, 2008, p. 5). It said it
would reinvigorate the tradition of an independent
public service, build the capacity for strategic pol-
icymaking, strengthen integrity and accountability,
increase participation, and develop evidence-based
decision-making.
One of the first major structural changes was the
December 2009 announcement that Human Ser-
vices agencies (including Centrelink andMedicare)
would be increasingly co-located and the Chief
Executive Officers of these agencies would be
drawn back into the Ministry. The aim was better
coordination across services and closer integration
of policymaking and implementation (Bowden,
2009). A later report (Ahead of the Game, Advisory
Group on Reform of Australian Government
Administration, 2010) reinforced this commit-
ment to ‘joined-up’ government, both across the
federal government and vertically, with states and
local authorities. It also emphasized the need for a
more integrated and strategic approach to the
management of the APS, recommending the crea-
tion of a new Australian Public Service Commis-
sion, with enhanced powers. It was accepted by the
new PrimeMinister, Rudd. Themain recommenda-
tions of the report were:
1. More integrated, citizen-centred services
2. More open government
3. Enhanced policy capability
4. Reinvigorated strategic leadership
5. A new Australian Public Service Commission
6. Align employment conditions across the APS,
and strengthen workforce planning
7. Regular reviews of agency effectiveness and
efficiency
M. The implementation process
Compared with countries such as the Netherlands
or even the United States, the implementation of
public management reforms in Australia looks to
have been a fairly centralized process. Prime Min-
isters and the former Department of Administra-
tive Services (later Finance and Administration,
and then Finance and Deregulation) have gener-
ally been able to get their way—although all such
observations need to be taken in a context where
the focus is principally on the Commonwealth
government and not on the (independent) State
level. Sometimes the style of implementation has
been gradual and incremental (as with much of
Finacial Management Improvement Programe
(FMIP), sometimes rapid and sweeping (as with
the 1987 restructuring of departments). During the
Howard/National government of 1996–2007 the
implementation process sometimes appeared sud-
den and harsh. This, in turn, generated unusually
virulent opposition.
N. Reforms actually achieved
As indicated above, Australian governments not
only carried through a series of significant public
management reforms, they also committed them-
selves to a more extensive application of evalua-
tion than did most of the other countries covered
in this book. Thus, for example, the FMIP was
subject to a series of evaluations, both internal
and independent (Halligan, 1996b; Zifcak, 1994,
pp. 96–9), and in 1992 the whole sweep of reforms
was reviewed in an expensive and large-scale study
(Task Force on Management Improvement, 1992).
The picture revealed by these and other studies is
a mixed one. Real change has undoubtedly been
achieved: the ‘culture’ of the public service has
shifted; substantial state assets have been priva-
tized; certain techniques such as user-charging,
outsourcing, and benchmarking have been widely
applied; and cost-consciousness and financial
management skills have been considerably sharp-
ened. The total size of the public service fell from
180,893 in 1986 (the peak year) to 143,305 in
1996, (Halligan, 1997, p. 39). By 2001 the number
was down to 118,644 after which it began to rise
AUSTRALIA 235
again, reaching 155,482 by 2008 (Halligan, 2008,
p. 14).
On the other hand, implementation has often
been significantly slower than had been envisaged,
and the costs of change have been high. For exam-
ple, central finance divisions within departments
were often reluctant to permit the degree of inter-
nal delegation of financial authority implied by the
spirit of the FMIP, or ‘corporate planning floun-
dered as a technique designed to enhance political
and departmental strategy’ (Zifcak, 1994, p. 110).
The big 1992 evaluation by the Task Force on Man-
agement Improvement found that enthusiasm
for many aspects of the reforms was much more
pronounced at senior levels in the hierarchy than
lower down, where considerable scepticism ap-
pears to have existed. By the late 1990s the
downsizings and perceived anti-public service atti-
tudes of the Howard government seemed to be
generating disruption and severe morale problems.
However, by 2001 this drive was somewhat mod-
erated, partly because it was realized that imposi-
tion from the top could be counter-productive (e.g.
problems with ICT outsourcing).
The 2007 reforms (following Prime Minister
Rudd’s acceptance of the Ahead of the Game report
(Advisory Group on Reform of Australian Govern-
ment Administration, 2010) were vigorously pro-
moted by both the Secretary to the Prime Minister
and Cabinet Department, Moran, and the Public
Service Commissioner, Sedgewick. Both toured the
country explaining and recommending the reform
to public-service and general audiences.
236 APPENDIX B: COUNTRY FILES AND TABLES OF EVENTS
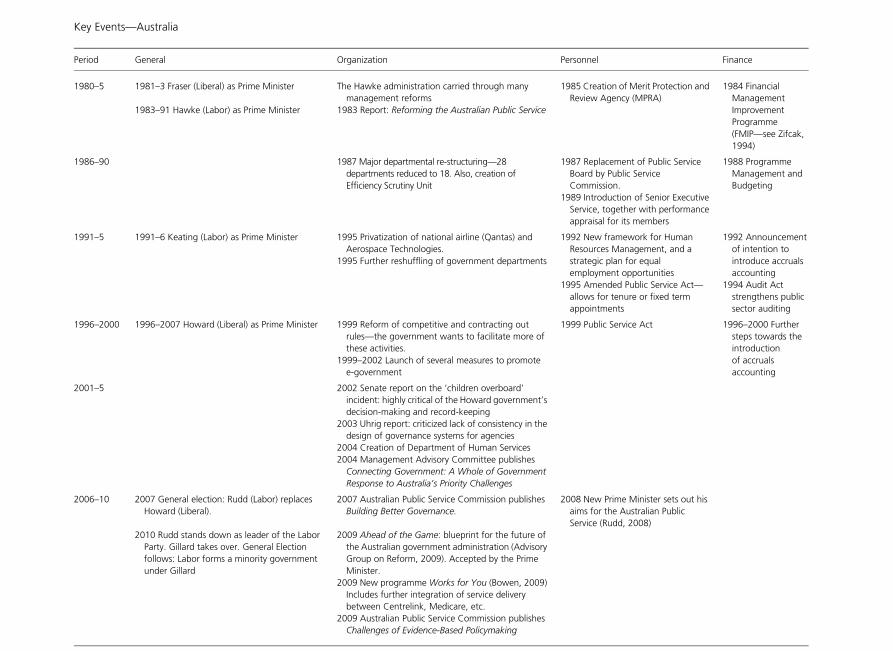
Key Events—Australia
Period General Organization Personnel Finance
1980–5 1981–3 Fraser (Liberal) as Prime Minister The Hawke administration carried through many
management reforms
1985 Creation of Merit Protection and
Review Agency (MPRA)
1984 Financial
Management
1983–91 Hawke (Labor) as Prime Minister 1983 Report: Reforming the Australian Public Service Improvement
Programme
(FMIP—see Zifcak,
1994)
1986–90 1987 Major departmental re-structuring—28
departments reduced to 18. Also, creation of
Efficiency Scrutiny Unit
1987 Replacement of Public Service
Board by Public Service
Commission.
1988 Programme
Management and
Budgeting
1989 Introduction of Senior Executive
Service, together with performance
appraisal for its members
1991–5 1991–6 Keating (Labor) as Prime Minister 1995 Privatization of national airline (Qantas) and
Aerospace Technologies.
1995 Further reshuffling of government departments
1992 New framework for Human
Resources Management, and a
strategic plan for equal
employment opportunities
1992 Announcement
of intention to
introduce accruals
accounting
1995 Amended Public Service Act—
allows for tenure or fixed term
appointments
1994 Audit Act
strengthens public
sector auditing
1996–2000 1996–2007 Howard (Liberal) as Prime Minister 1999 Reform of competitive and contracting out
rules—the government wants to facilitate more of
these activities.
1999 Public Service Act 1996–2000 Further
steps towards the
introduction
1999–2002 Launch of several measures to promote
e-government
of accruals
accounting
2001–5 2002 Senate report on the ‘children overboard’
incident: highly critical of the Howard government’s
decision-making and record-keeping
2003 Uhrig report: criticized lack of consistency in the
design of governance systems for agencies
2004 Creation of Department of Human Services
2004 Management Advisory Committee publishes
Connecting Government: A Whole of Government
Response to Australia’s Priority Challenges
2006–10 2007 General election: Rudd (Labor) replaces
Howard (Liberal).
2007 Australian Public Service Commission publishes
Building Better Governance.
2008 New Prime Minister sets out his
aims for the Australian Public
Service (Rudd, 2008)
2010 Rudd stands down as leader of the Labor
Party. Gillard takes over. General Election
follows: Labor forms a minority government
under Gillard
2009 Ahead of the Game: blueprint for the future of
the Australian government administration (Advisory
Group on Reform, 2009). Accepted by the Prime
Minister.
2009 New programme Works for You (Bowen, 2009)
Includes further integration of service delivery
between Centrelink, Medicare, etc.
2009 Australian Public Service Commission publishes
Challenges of Evidence-Based Policymaking

BELGIUM
A. Socio-economic forces: general
Belgium is a rather small country (32.500 km2 ),
with a relatively modest population (10.8 million
in 2010). For specific key economic and socio-
demographic data we refer to section A2 and A3
in Appendix A,including Tables A.1 to A.5.
B. Global economic forces
Belgium is a particularly open economy with im-
ports and exports representing the highest percent-
age of GDP of the countries studied in this book
(85%) (see Table A.3). Facing the convergence cri-
teria for accessing the EMU in 1992, Belgium was
confronted with the problem of its consolidated
gross public debt which rose to 135.4 per cent of
GDP in 1995. Due to the restriction policy pursued
by the government, public debt could be reduced
to 93.5 per cent of GDP in 2008, but mounted
again to 100 per cent in 2010.
C. Sociodemographic change
Belgium is situated at the junction between the
Latin and Germanic languages (Dutch, French,
and German) and cultures. For many years these
different cultures have been trying to find a fragile
balance, leading to the creation of a federal state in
1993, after significant steps at the end of the 1980s
and the beginning of the 1990s (a process that is
still continuing and is explained more broadly in
section E below).
Since the late 1970s and the early 1980s the classi-
cal welfare state, together with the social security
system, have been subject to great pressure from the
economic climate (increasing unemployment) and
the ageing society. The social welfare system is
advanced, though not as elaborate as that in Sweden.
D. National socio-economic policies
Faced with the problems of public debt and the
increasing public sector expenditures, central
government launched a strong programme of bud-
getary reform and restraint under the Dehaene
government (1992). Thanks to this policy, Belgium
was able to fulfil the Maastricht ‘convergence
criteria’ for the EU monetary union (though only
partially). The focus was one of downsizing the
public sector and coping with the economic crisis
by working more efficiently and effectively. The
governments of the late 1990s enjoyed an easier
position on public spending than their predeces-
sors. The financial and economic crisis, the need to
support and even save several banks, and the
demographic evolutions are currently pushing the
political elite to takemeasures, which are, however,
being postponed because of the political impasse at
the federal level.
E. The political system
Belgium is a federal state. In recent years, the coun-
try has evolved rapidly, via five stages of constitu-
tional reforms (in 1970 (‘cultural communities’
and three regions), 1980 (‘communities’), 1988–9
(Brussels Capital Region, and further strengthening
of regions and communities), 1993 (constitutional
recognition of a federal state), and 2001 (Lamber-
mont Agreements including fiscal power and fur-
ther devolution). The decision-making power in
Belgium is no longer exclusively in the hands of the
federal government and the federal parliament, but
falls to communities on the onehand and regions on
the other, which exercise their competences inde-
pendently in different fields.
The redistribution followed two broad lines. The
first concerns linguistics and, more broadly, every-
thing relating to culture. It gave rise to the commu-
nities. Belgium has three communities, based on
language: the Flemish, the French, and the Ger-
man. The second main line of the state reform is
historically inspired by economic concerns, ex-
pressed by regions who wanted to have more
autonomous power. This gave rise to the founding
of three regions: the Flemish, the Brussels Capital,
and the Walloon. To some extent Belgian regions
are similar to the American States or the German
‘Lander’, except that legislation decreed by regions
and communities are at the same level as federal
legislation.
All these communities and regions have separate
governments and parliaments. The federal state re-
tains important areas of competence including
238 APPENDIX B: COUNTRY FILES AND TABLES OF EVENTS
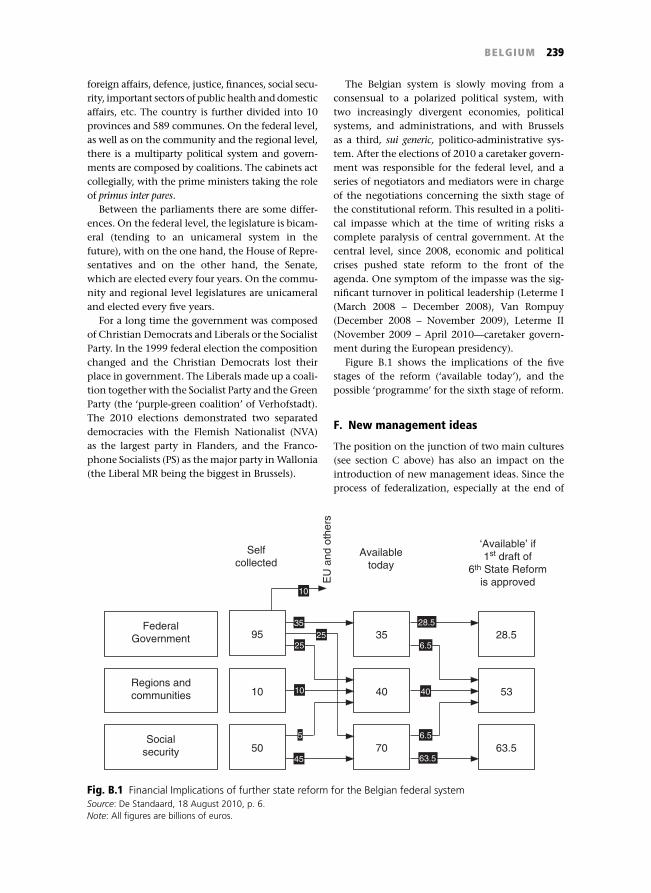
foreign affairs, defence, justice, finances, social secu-
rity, important sectors of public health and domestic
affairs, etc. The country is further divided into 10
provinces and 589 communes. On the federal level,
as well as on the community and the regional level,
there is a multiparty political system and govern-
ments are composed by coalitions. The cabinets act
collegially, with the prime ministers taking the role
of primus inter pares.
Between the parliaments there are some differ-
ences. On the federal level, the legislature is bicam-
eral (tending to an unicameral system in the
future), with on the one hand, the House of Repre-
sentatives and on the other hand, the Senate,
which are elected every four years. On the commu-
nity and regional level legislatures are unicameral
and elected every five years.
For a long time the government was composed
of Christian Democrats and Liberals or the Socialist
Party. In the 1999 federal election the composition
changed and the Christian Democrats lost their
place in government. The Liberals made up a coali-
tion together with the Socialist Party and the Green
Party (the ‘purple-green coalition’ of Verhofstadt).
The 2010 elections demonstrated two separated
democracies with the Flemish Nationalist (NVA)
as the largest party in Flanders, and the Franco-
phone Socialists (PS) as themajor party inWallonia
(the Liberal MR being the biggest in Brussels).
The Belgian system is slowly moving from a
consensual to a polarized political system, with
two increasingly divergent economies, political
systems, and administrations, and with Brussels
as a third, sui generic, politico-administrative sys-
tem. After the elections of 2010 a caretaker govern-
ment was responsible for the federal level, and a
series of negotiators and mediators were in charge
of the negotiations concerning the sixth stage of
the constitutional reform. This resulted in a politi-
cal impasse which at the time of writing risks a
complete paralysis of central government. At the
central level, since 2008, economic and political
crises pushed state reform to the front of the
agenda. One symptom of the impasse was the sig-
nificant turnover in political leadership (Leterme I
(March 2008 – December 2008), Van Rompuy
(December 2008 – November 2009), Leterme II
(November 2009 – April 2010—caretaker govern-
ment during the European presidency).
Figure B.1 shows the implications of the five
stages of the reform (‘available today’), and the
possible ‘programme’ for the sixth stage of reform.
F. New management ideas
The position on the junction of two main cultures
(see section C above) has also an impact on the
introduction of new management ideas. Since the
process of federalization, especially at the end of
FederalGovernment
Regions andcommunities
Socialsecurity
95
10
50
35
40
70
28.5
53
63.5
Selfcollected
Availabletoday
‘Available’ if1st draft of
6th State Reformis approvedE
U a
nd o
ther
s
10
3525
25
10
5
45
28.5
6.5
40
6.5
63.5
Fig. B.1 Financial Implications of further state reform for the Belgian federal system
Source: De Standaard, 18 August 2010, p. 6.
Note: All figures are billions of euros.
BELGIUM 239
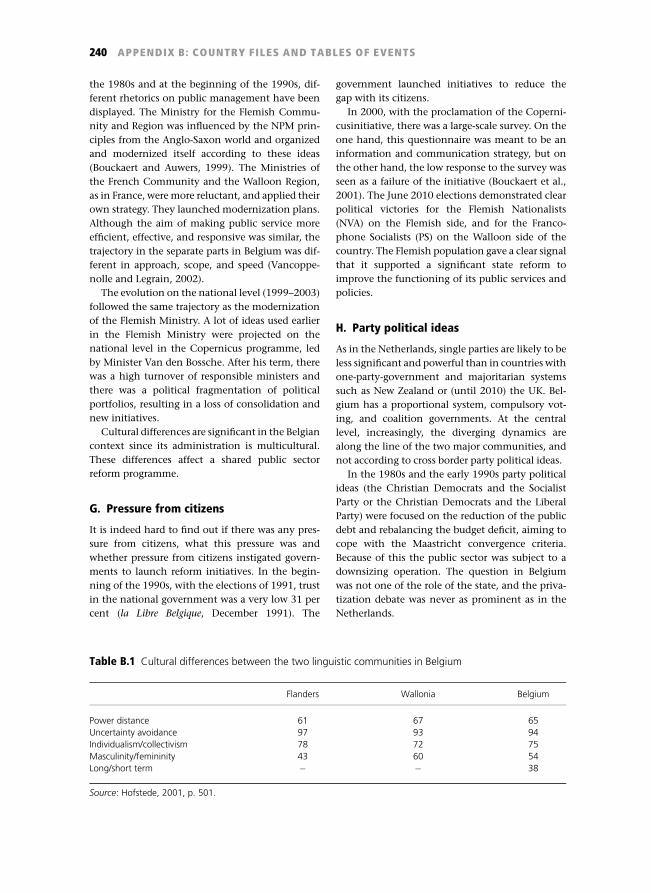
the 1980s and at the beginning of the 1990s, dif-
ferent rhetorics on public management have been
displayed. The Ministry for the Flemish Commu-
nity and Region was influenced by the NPM prin-
ciples from the Anglo-Saxon world and organized
and modernized itself according to these ideas
(Bouckaert and Auwers, 1999). The Ministries of
the French Community and the Walloon Region,
as in France, were more reluctant, and applied their
own strategy. They launched modernization plans.
Although the aim of making public service more
efficient, effective, and responsive was similar, the
trajectory in the separate parts in Belgium was dif-
ferent in approach, scope, and speed (Vancoppe-
nolle and Legrain, 2002).
The evolution on the national level (1999–2003)
followed the same trajectory as the modernization
of the Flemish Ministry. A lot of ideas used earlier
in the Flemish Ministry were projected on the
national level in the Copernicus programme, led
by Minister Van den Bossche. After his term, there
was a high turnover of responsible ministers and
there was a political fragmentation of political
portfolios, resulting in a loss of consolidation and
new initiatives.
Cultural differences are significant in the Belgian
context since its administration is multicultural.
These differences affect a shared public sector
reform programme.
G. Pressure from citizens
It is indeed hard to find out if there was any pres-
sure from citizens, what this pressure was and
whether pressure from citizens instigated govern-
ments to launch reform initiatives. In the begin-
ning of the 1990s, with the elections of 1991, trust
in the national government was a very low 31 per
cent (la Libre Belgique, December 1991). The
government launched initiatives to reduce the
gap with its citizens.
In 2000, with the proclamation of the Coperni-
cusinitiative, there was a large-scale survey. On the
one hand, this questionnaire was meant to be an
information and communication strategy, but on
the other hand, the low response to the survey was
seen as a failure of the initiative (Bouckaert et al.,
2001). The June 2010 elections demonstrated clear
political victories for the Flemish Nationalists
(NVA) on the Flemish side, and for the Franco-
phone Socialists (PS) on the Walloon side of the
country. The Flemish population gave a clear signal
that it supported a significant state reform to
improve the functioning of its public services and
policies.
H. Party political ideas
As in the Netherlands, single parties are likely to be
less significant and powerful than in countries with
one-party-government and majoritarian systems
such as New Zealand or (until 2010) the UK. Bel-
gium has a proportional system, compulsory vot-
ing, and coalition governments. At the central
level, increasingly, the diverging dynamics are
along the line of the two major communities, and
not according to cross border party political ideas.
In the 1980s and the early 1990s party political
ideas (the Christian Democrats and the Socialist
Party or the Christian Democrats and the Liberal
Party) were focused on the reduction of the public
debt and rebalancing the budget deficit, aiming to
cope with the Maastricht convergence criteria.
Because of this the public sector was subject to a
downsizing operation. The question in Belgium
was not one of the role of the state, and the priva-
tization debate was never as prominent as in the
Netherlands.
Table B.1 Cultural differences between the two linguistic communities in Belgium
Flanders Wallonia Belgium
Power distance 61 67 65
Uncertainty avoidance 97 93 94
Individualism/collectivism 78 72 75
Masculinity/femininity 43 60 54
Long/short term � � 38
Source: Hofstede, 2001, p. 501.
240 APPENDIX B: COUNTRY FILES AND TABLES OF EVENTS
After the elections of 1991 (and also in 1995)
and the rise of the extreme right party, government
policy was focused on the relation with the citi-
zens, and the amount of (dis)trust in politics and
the public sector. Therefore policies aimed at clos-
ing these gaps and making the public sector more
responsive to the needs of citizens/users (e.g. Char-
ter of the User of Public Services, 1992).
From 1999 till 2003 the purple-green govern-
ment launched a broad scope and big objectives
reform initiative for the federal public service (the
Copernicus initiative). This programme was in-
itiated by the federal (Flemish socialist) minister
of public services, Van den Bossche, based on his
experiences in the 1990s in the Flemish adminis-
tration. The new (Francophone socialist) minister
Arena (2003–4) announced after one month in
office that the Copernicus project had ended
(Hondeghem and Depr�e, 2005: 425–6). As a con-
sequence, reforms lost their coherent framework
and hence their momentum. Low profile, and
incremental initiatives took over. In the period
2004–7 Minister Dupont (Francophone socialist)
shared responsibilities with a state secretary for
administrative reforms and a state secretary for
IT. The subsequent turnover (Vervotte, 2007–8;
Vanackere, 2008–9; Vervotte, 2009– ), combined
with the economic problems and the political
mounting impasse, with its significant periods of
caretaker governments, resulted in a limited and
internal set of measures such as refinement of
training, IT, tendering, internal mandates and
contracts, and career pattern development. Even
the much needed reforms in the judicial branch
(which has been under pressure for at least a
decade) were not realized to any significant degree
(Hondeghem et al., 2010).
I. Elite perceptions of what managementreforms were desirable and feasible
Most elite attention was focused on the federal
process and on budgetary problems during the
1980s and the 1990s (Section D above). Manage-
ment reforms therefore emphasized the economy—
and input side of the public service.
Next to the budgetary focus, the gap between
the government and the citizen was seen as a rea-
son for the launch of initiatives to make the public
service more accountable and responsive, follow-
ing the elections of 1991.
In the late 1990s, when the budgetary restraints
were fewer, government found an opportunity to
launch a major reform initiative (see Section L
below). The Copernicus reform programme
(1999–2003) remained, with a small elite around
the responsible minister. Its ownership could not
be broadened to the civil servants or the trade
unions, partly because it was very consultant
driven. Between 2004 and 2008 there was an
absence of elite decisions in the field of public
sector reform, and since 2008 the political elite
has been absorbed by the debates about a sixth
stage of state reform, to the detriment of solving
the economic and financial crisis.
J. Chance events
In the 1991 national elections, the rise of an
extreme right party was marked. Politicians and
social scientists saw this as a sign of the low legiti-
macy of the political culture and the widening
of the gap between citizens and politicians
(Maesschalck et al., 2002).
In 1996 Belgium was startled by a paedophilia
scandal (the Dutroux affair). The judicial system
and the police forces were intensely criticized
(Pollitt and Bouckaert, 2009). The authorities
were shaken by ‘The White March’—250,000 to
300,000 demonstrators in Brussels. Again this was
a decline in trust in the institutions and politics
in general.
In 1999 the dioxin food crisis had an impact on
the elections and pushed the reform agenda and
the creation of the Federal Food Agency. The 2009
Fortisgate, in which top magistrates were said
to have violated confidential information on the
Fortis bank, and the way the 2010 operations
concerning the paedophilia cases in the Catholic
church were conducted still did not produce signif-
icant reforms in the judicial branch.
It is debatable whether the effects of the 2008
GEC can be termed ‘chance events’, but certainly,
for Belgium, a banking crisis, requiring strong gov-
ernment actions, was part of this period.
K. The administrative system
The original administrative structure of the Bel-
gian state as established by the 1831 Constitution
was quite simple. It was made up of three govern-
ment levels: the central level and two subnational
levels, provinces, and municipalities. This struc-
ture remained intact until 1970. Four revisions of
the constitution made Belgium a federal state
from 1993 (see Section E above). The federal civil
BELGIUM 241
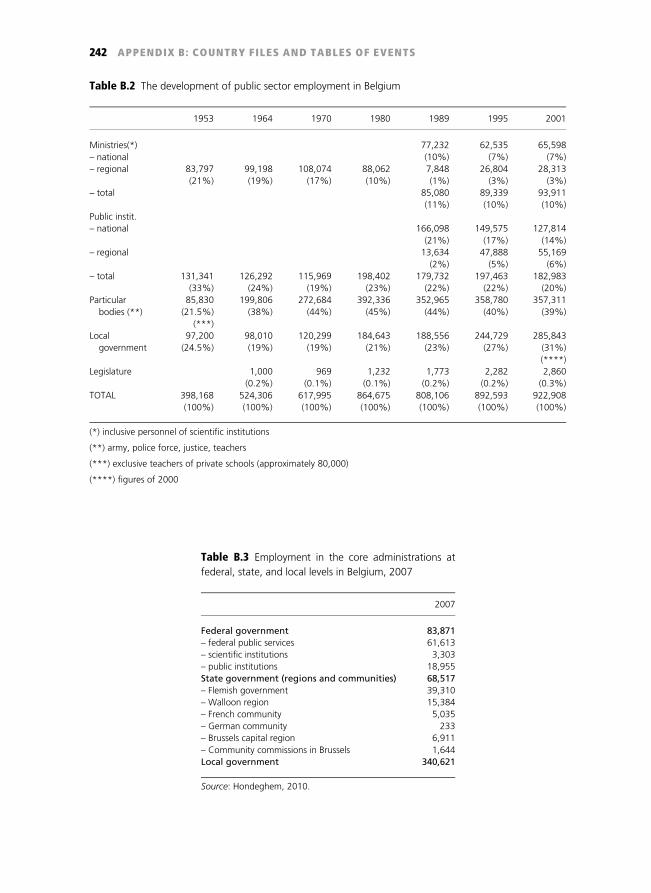
Table B.2 The development of public sector employment in Belgium
1953 1964 1970 1980 1989 1995 2001
Ministries(*)
– national
77,232
(10%)
62,535
(7%)
65,598
(7%)
– regional 83,797
(21%)
99,198
(19%)
108,074
(17%)
88,062
(10%)
7,848
(1%)
26,804
(3%)
28,313
(3%)
– total 85,080
(11%)
89,339
(10%)
93,911
(10%)
Public instit.
– national 166,098
(21%)
149,575
(17%)
127,814
(14%)
– regional 13,634
(2%)
47,888
(5%)
55,169
(6%)
– total 131,341
(33%)
126,292
(24%)
115,969
(19%)
198,402
(23%)
179,732
(22%)
197,463
(22%)
182,983
(20%)
Particular
bodies (**)
85,830
(21.5%)
(***)
199,806
(38%)
272,684
(44%)
392,336
(45%)
352,965
(44%)
358,780
(40%)
357,311
(39%)
Local
government
97,200
(24.5%)
98,010
(19%)
120,299
(19%)
184,643
(21%)
188,556
(23%)
244,729
(27%)
285,843
(31%)
(****)
Legislature 1,000
(0.2%)
969
(0.1%)
1,232
(0.1%)
1,773
(0.2%)
2,282
(0.2%)
2,860
(0.3%)
TOTAL 398,168
(100%)
524,306
(100%)
617,995
(100%)
864,675
(100%)
808,106
(100%)
892,593
(100%)
922,908
(100%)
(*) inclusive personnel of scientific institutions
(**) army, police force, justice, teachers
(***) exclusive teachers of private schools (approximately 80,000)
(****) figures of 2000
Table B.3 Employment in the core administrations at
federal, state, and local levels in Belgium, 2007
2007
Federal government 83,871
– federal public services 61,613
– scientific institutions 3,303
– public institutions 18,955
State government (regions and communities) 68,517
– Flemish government 39,310
– Walloon region 15,384
– French community 5,035
– German community 233
– Brussels capital region 6,911
– Community commissions in Brussels 1,644
Local government 340,621
Source: Hondeghem, 2010.
242 APPENDIX B: COUNTRY FILES AND TABLES OF EVENTS
service has been severely reduced as a result of the
different state reforms (see TablesB.2 andB.3, below).
In terms of public employment the national level
now represents only 17 per cent of the personnel in
the public sector. In addition, many functions have
been transferred to autonomous public institutions
(Brans and Hondeghem, 1999, pp. 122–4).
The Belgian civil service is facing two main chal-
lenges. The first is associated with the legitimacy
crisis of political institutions as a whole (see Sec-
tions I and J above). The second is related to the
budgetary pressures and the ascendancy of the new
managerial paradigm in the public sector. Civil
Service reform has arrived on the agenda, albeit
somewhat behind many other nations. There are,
however, strong internal constraints on which re-
forms are likely to be implemented. These con-
straints are linked to the strong position of the
civil service unions and the preoccupation of polit-
ical actors with maintaining a balance of party-
political power within the administrative system
(Brans and Hondeghem, 1999, p. 121; Hondeghem
and Depr�e, 2005).
The federal civil service is a modest administra-
tion, playing only a marginal role in the policy-
making process. With the loss of important func-
tions and powers to the new state levels, the federal
level is now a laggard. Evenmajor initiatives such as
the Copernicus reforms have not fundamentally
changed that pattern (see Section L below). The dri-
vers for change are external: Europe, economic and
financial crises, and the reform of the state.
L. Contents of reform package
Since the 1980s several different initiatives have
taken place. In the 1980s most of these initiatives
occurred against the background of stringent cut-
backs of public expenditures and the diminution of
the general public debt (see Sections D and G
above). In the first half of the 1980s, under the
fifth and sixth cabinet of Prime Minister Martens,
the modernization of the civil service was inspired
by these cutbacks (Bouckaert and Francois, 1999, p.
12). This modernization of the civil service never
led to a rethinking of the role and the scale of the
state. In many other OECD countries the privatiza-
tion debate was more prominent at that time than
it was in Belgium.
Between 1981 and 1989 several initiatives were
launched to modernize the civil service:
� 1985: Appointment of a state secretary for mod-
ernizing the public service, attached to the prime
minister
� 1987: Creation of modernization cells in the dif-
ferent ministries
� 1987: Creation of a secretariat of modernization
� 1989 Creation of the College of Secretaries-Gen-
eral (the highest civil servants of the ministries),
and the enlargement of the power of this college
in 1993
After 1991 the focus of the modernization process
shifted. Macro-economic policy was still a priority.
Instead of integrating the personnel management
in this macro-economic policy, the focus moved to
the rewarding and motivation of civil servants. Re-
forms at the Ministry of the Flemish Community
triggered initiatives at the central level:
� 1991: First edition of the General Principles
Royal Decree (KBAP) stated the overall principles
for civil servants (and replaced the old statute
Camu that went back to 1937). The KBAP was
finally approved in 1994
� 1993: The creation of the Office for Moderniza-
tion and Organization (ABC)
� 1995: The creation of a ministry of the civil
service
The modernization of the civil service was more
than just an attempt to improve efficiency and
effectiveness. It was also used to try to close the
gap between the citizen and the government (see
Sections G and H above). Thus, after 1991, many
citizen-related initiatives were started (Bouckaert
and Francois, 1999, p. 30):
� 1991: Law on the motivation on administrative
actions
� 1993: Charter of the User of Public Services
� 1994: Law on access to information
� 1995: Appointment of the federal ombudsmen
Most of the initiatives were launched on an ad hoc
basis and lacked an overall strategy. Therefore there
was little coherence between the different initia-
tives. However, with the establishment of the Cab-
inet in 1999 a major reform initiative was
launched. The Copernicus reform (1999–2003), in-
itiated and sponsored by the minister of reform,
was a modernization plan covering many fields of
the federal civil service. The initiative was built on
four main trajectories:
BELGIUM 243
� A modern HRM: In each new ministry HR ex-
perts were appointed and HR cells were created.
The top managers were selected by assessment
centres and interviews, and they received man-
dates for six years. For all civil servants the eval-
uation system changed and the renumeration—
and career-planning systems were to be
reformed. Education and training were a priority.
� A restructuring of the ministries: The former
ministries were to be restructured and reformed.
There were ten vertical, four horizontal minis-
tries, and several programmatorial ministries
(working on social themes crossing the entire
policy field). The new internal structure of the
ministries aimed to equip them to fulfil an
important role in policy design, implementa-
tion, and evaluation.
� A new budget and control system: The new min-
istries were to have a large degree of autonomy in
developing a policy strategy and in spending the
budget. For this reason eachministry was to have
its own internal audit, to monitor its economy
and efficiency.
� improved communication, including both inter-
nal communication among civil servants and,
on the other hand, externally with citizens.
Between 2004 and 2008, there was a continuation
of process redesign, mandate systems, and internal
contracts (with social security agencies). Also, there
were some initiatives to install internal audits.
After 2008, the degrees of freedom to launch a
major public sector reform initiative were restricted
by economic and political crises.
M. The implementation process
Past initiatives were not always coherent and often
lacked an overall strategy. In 1989 a minister of the
civil servicewas appointed (before that a secretary of
state was attached to the prime minister). For a long
time reform initiatives were a matter for the prime
minister. In 1995 a separate ministry of the civil
service was created and many reforms have been
launched and sponsored by this ministry.
In the past initiatives were ad hoc and fragmen-
ted. Many separate ministries launched their own
programmes and took individual initiatives. The
modernization pressure came from the lower levels
of government (communities and regions), espe-
cially the Flemish community.
The reforms started in 1999, under the leadership
of Minister Luc Van den Bossche, were often per-
ceived as fundamental and drastic. These reforms
were coherent and inspired by an overall strategy,
but initiated in a top-down way, which evoked some
resistance during its implementation, especially from
trade unions. The post-Copernicus period could be
described as low profile, internal, and incremental.
N. Reforms actually achieved
In Belgium, policy and programme evaluations are
not widespread. It is only since 1998 that the role
of the National Court of Audit (Rekenhof) has
changed and moved to performance auditing as
well as traditional financial and compliance audits.
The only broad-scope evaluations of manage-
ment reforms have been academic rather than
internal (Hondeghem and Depr�e, 2005; Honde-
ghem et al., 2010; Bouckaer et al., 2010, see Chapter
10). Management reforms were introduced on an
ad hoc basis and many individual initiatives have
taken place in the separate ministries. Overall in-
itiatives launched in the early and mid 1990s are
still effective tools (access to information law,moti-
vation law). Other initiatives have slowly faded out
(e.g. the users’ charter).
The most important goal for the Copernicus
reform was to install a different culture within the
civil service. Between 1999 and 2003 many initia-
tives took place such as the restructuring of themin-
istries, the appointment of the new top managers
and leading officials, implementation of Business
Process Re-engineering, and development of an
HRM policy. The basic structure of the public sector
still remains, as well as the major principles of its
functioning (mandates, internal contracts, some
audit functions). However, after 2004 no further
major steps forward could be taken.
244 APPENDIX B: COUNTRY FILES AND TABLES OF EVENTS
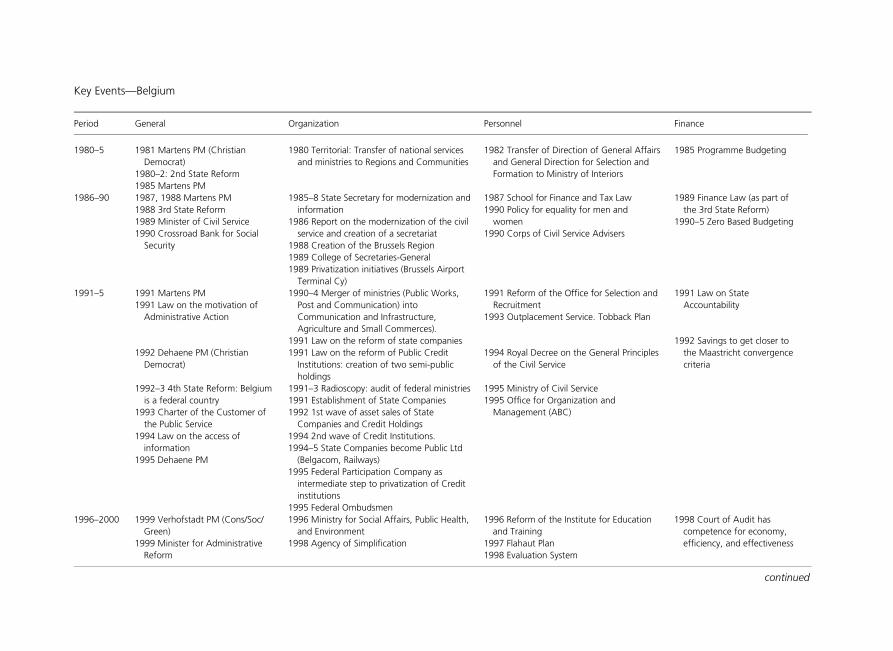
Key Events—Belgium
Period General Organization Personnel Finance
1980–5 1981 Martens PM (Christian
Democrat)
1980 Territorial: Transfer of national services
and ministries to Regions and Communities
1982 Transfer of Direction of General Affairs
and General Direction for Selection and
Formation to Ministry of Interiors
1985 Programme Budgeting
1980–2: 2nd State Reform
1985 Martens PM
1986–90 1987, 1988 Martens PM
1988 3rd State Reform
1985–8 State Secretary for modernization and
information
1987 School for Finance and Tax Law
1990 Policy for equality for men and
1989 Finance Law (as part of
the 3rd State Reform)
1989 Minister of Civil Service
1990 Crossroad Bank for Social
1986 Report on the modernization of the civil
service and creation of a secretariat
women
1990 Corps of Civil Service Advisers
1990–5 Zero Based Budgeting
Security 1988 Creation of the Brussels Region
1989 College of Secretaries-General
1989 Privatization initiatives (Brussels Airport
Terminal Cy)
1991–5 1991 Martens PM
1991 Law on the motivation of
Administrative Action
1990–4 Merger of ministries (Public Works,
Post and Communication) into
Communication and Infrastructure,
Agriculture and Small Commerces).
1991 Reform of the Office for Selection and
Recruitment
1993 Outplacement Service. Tobback Plan
1991 Law on State
Accountability
1991 Law on the reform of state companies 1992 Savings to get closer to
1992 Dehaene PM (Christian
Democrat)
1991 Law on the reform of Public Credit
Institutions: creation of two semi-public
holdings
1994 Royal Decree on the General Principles
of the Civil Service
the Maastricht convergence
criteria
1992–3 4th State Reform: Belgium
is a federal country
1991–3 Radioscopy: audit of federal ministries
1991 Establishment of State Companies
1995 Ministry of Civil Service
1995 Office for Organization and
1993 Charter of the Customer of
the Public Service
1992 1st wave of asset sales of State
Companies and Credit Holdings
Management (ABC)
1994 Law on the access of
information
1994 2nd wave of Credit Institutions.
1994–5 State Companies become Public Ltd
1995 Dehaene PM (Belgacom, Railways)
1995 Federal Participation Company as
intermediate step to privatization of Credit
institutions
1995 Federal Ombudsmen
1996–2000 1999 Verhofstadt PM (Cons/Soc/
Green)
1999 Minister for Administrative
Reform
1996 Ministry for Social Affairs, Public Health,
and Environment
1998 Agency of Simplification
1996 Reform of the Institute for Education
and Training
1997 Flahaut Plan
1998 Evaluation System
1998 Court of Audit has
competence for economy,
efficiency, and effectiveness
continued
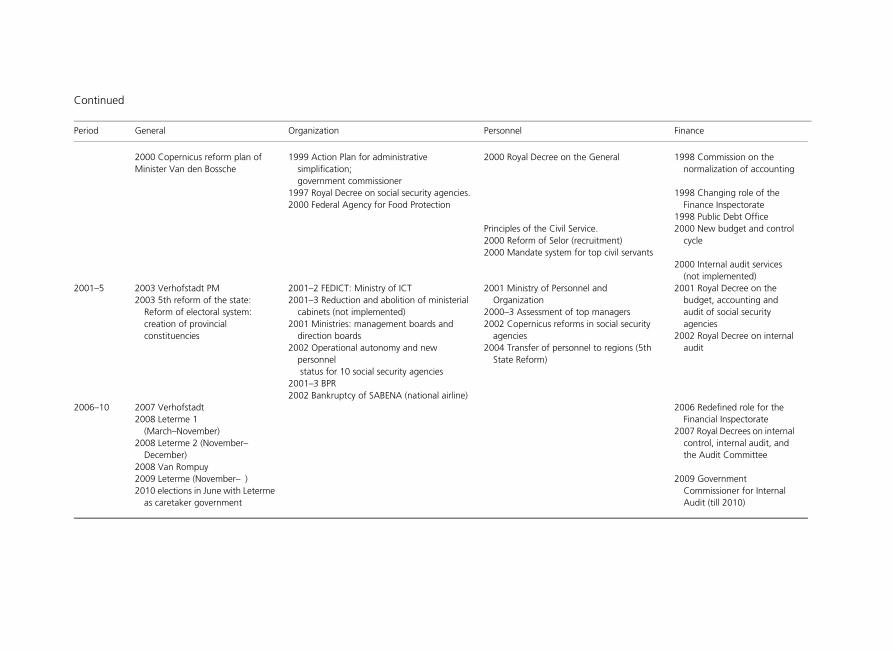
Continued
Period General Organization Personnel Finance
2000 Copernicus reform plan of
Minister Van den Bossche
1999 Action Plan for administrative
simplification;
government commissioner
2000 Royal Decree on the General 1998 Commission on the
normalization of accounting
1997 Royal Decree on social security agencies.
2000 Federal Agency for Food Protection
1998 Changing role of the
Finance Inspectorate
1998 Public Debt Office
Principles of the Civil Service.
2000 Reform of Selor (recruitment)
2000 Mandate system for top civil servants
2000 New budget and control
cycle
2000 Internal audit services
(not implemented)
2001–5 2003 Verhofstadt PM 2001–2 FEDICT: Ministry of ICT 2001 Ministry of Personnel and 2001 Royal Decree on the
2003 5th reform of the state:
Reform of electoral system:
creation of provincial
constituencies
2001–3 Reduction and abolition of ministerial
cabinets (not implemented)
2001 Ministries: management boards and
direction boards
2002 Operational autonomy and new
personnel
Organization
2000–3 Assessment of top managers
2002 Copernicus reforms in social security
agencies
2004 Transfer of personnel to regions (5th
State Reform)
budget, accounting and
audit of social security
agencies
2002 Royal Decree on internal
audit
status for 10 social security agencies
2001–3 BPR
2002 Bankruptcy of SABENA (national airline)
2006–10 2007 Verhofstadt
2008 Leterme 1
2006 Redefined role for the
Financial Inspectorate
(March–November)
2008 Leterme 2 (November–
December)
2008 Van Rompuy
2007 Royal Decrees on internal
control, internal audit, and
the Audit Committee
2009 Leterme (November– )
2010 elections in June with Leterme
as caretaker government
2009 Government
Commissioner for Internal
Audit (till 2010)
CANADA
A. Socio-economic forces: general
Canada is a very large country, but relatively thinly
populated (33.6 million population in 2010). Like
the USA, it is an ethnically diverse community,
having been built up from successive waves of
immigration from Europe and elsewhere.
B. Global economic forces
Again, see Appendix A. In 2008 Canada ranked 6th
out of our twelve states in terms of the percentage
of GDP represented by international trade.
C. Socio-demographic issues
For the general picture, see Appendix A. Canada has
become a multi-ethnic and multicultural society—
partly through immigration. By 2009 the number of
Canadians whose first language was neither French
nor English reached more than 6 million (out of a
population of 33.5 million). More than 1 million
had Chinese as their mother-tongue, and 455,00
had Italian; 626,000 defined themselves as belong-
ing to one of the three recognized aboriginal groups
(in addition to the official languages of English and
French there are half a dozen ‘recognized languages’
spoken by the aboriginal groups). Canada, like other
advanced industrial economies, is also getting older.
Between 1961 and 1991 the number of citizens aged
65 and over increased 128 per cent, to 3.2 million
(see Table A.6). Canada also has a relatively high
divorce rate (2.8 per 1,000 population in 1992) and
60 per cent of female-headed single-parent families
fell below the official low income cut-off (Statistics
Canada, 1995).
D. National socio-economic policies
Relative to OECD averages, Canada suffered a dis-
appointing economic performance during the
1980s. Control of public spending was a particular
weakness. During the Mulroney administration
(1984–93) public spending targets were repeatedly
set and then missed. Between 1984 and 1993 the
net public debt increased from $C168 billion
to $C508 billion (Harder and Lindquist, 1997,
pp. 80–1). However, the Chr�etien administration
(1993–2003) largely met its expenditure reduction
targets, and in 1997/8 achieved the first balanced
budget for thirty years. Growth in the first eight
years of the twenty-first century was respectable.
E. The political system
Canada, like Australia, is a federal state with a
‘Westminster’ system (i.e. a first past the post elec-
toral system, disciplined parties, and (usually)
strong, majoritarian governments). However, a
simple picture of single-minded centralism would
be inaccurate:
In a country consisting of two ‘founding’ linguistic
groups, four or five distinct regions, and the usual
cleavages between classes and other divisions charac-
teristic of all modern societies, a governing party must
try to accommodate a representation of as many inter-
ests as possible. Aboriginals, historically marginalised
in the political process, are also becoming contenders
in the system. (Mallory, 1997, p. 16)
During the nineteenth and early twentieth cen-
tury, central government appeared to dominate
most of the significant governmental functions,
but the growth of the welfare state shifted the
balance in favour of provincial and local govern-
ments. Agreements between federal and provincial
governments became more and more essential for
policy progress on many items.
Although in many ways a more ‘state-centred’
and even ‘state-trusting’ society than its US neigh-
bour, there is also a widespread popular suspicion
of the Ottawa political elite. The underpinnings of
federal authority have been eroded from several
directions:
the whole system of government in Canada is beset by
a number of forces which tend to undermine it. These
include a pervasive anti-elitism and populism which
undermines the authority of government and thus its
will to deal with issues, a pervasive and exaggerated
fear of mounting public debt and public bankruptcy,
and a threat to the survival of the system by the danger
of Quebec separation accompanied by serious regional
discontent which could of itself lead to the dissolution
of the union. All these threats to survival have
occurred in the past, and have been successfully
CANADA 247
surmounted. This time they seem to have all come
together. But one should not underestimate the enor-
mous inertia of the system, as well as its flexibility,
which may well ensure its survival and its capacity to
adjust. (Mallory, 1997, p. 23)
In the twenty-first century, popular opinion has
been further depressed by the ‘sponsorship scan-
dal’ and other events (see Key Events at end of this
country case). While it would probably be an exag-
geration to say that the Canadian system was fac-
ing a crisis of trust, it was a moment for reflection
and for attempts to rebuild lost confidence (for a
subtle Canadian analysis of the difficult concept of
trust, see Thomas, 2009; for an analysis of the ‘crit-
ical moment’, see Lindquist, 2006).
F. New management ideas
It is clear that Canadian ministers and senior offi-
cials were well aware of the currents of new man-
agement thinking which were flowing through the
Anglophone world from the late 1970s onwards.
Mulroney’s administration (1984–93) made exten-
sive use of business people and also ‘borrowed’—at
least in part—a number of public management
reform ideas from the USA and the UK. Mulroney’s
own rhetoric mirrored the anti-bureaucratic, pro-
private sector tone of Thatcher and Reagan (Savoie,
1994).
Just two examples will have to suffice. First, the
Nielsen task force set up in 1984 took about half
its members from the business community, and
Nielsen himself was conscious of borrowing from
Raynerism (UK) and the Grace Commission (USA)
(Savoie, 1994, pp. 127–30). Second, the creation of
politically sympathetic chiefs of staff in each
department drew something from the US ‘spoils
system’, and more specifically from President
Reagan’s expansion of that system during the
early 1980s. The basic idea was to give ministers
greater assistance in the task of getting the perma-
nent bureaucracy to do their bidding.
Under the Liberal administration from 1993 the
public service regained some of its self-confidence,
and by 1998 the clerk to the Privy Council (themost
senior civil servant) felt able to proclaim a ‘Canadian
model’ of public management reform. This included
a rejection of the proposal that minimizing govern-
ment was always a good thing and an embracing of
experiment and diversity in organizational forms
(Bourgon, 1998; Gow, 2004).
As the 1990s unfolded—and even more after
the turn of the century—issues of coordinated
service delivery came more and more to the fore.
Canada established something of an international
reputation as a leader in forms of ‘integrated public
governance’ (see Kernaghan, 2009a, b). Another
growing concern was with Human Resource Man-
agement, and the need to address the loss of organ-
izational memory and talent that could ensue as a
very large percentage of senior civil servants (the
‘baby boomers’) retiredwithin a short space of time.
After the sponsorship scandal broke in 2004, specif-
ically public sector notions of accountability and
transparency featured heavily in political discus-
sion (and informed the 2006 Federal Accountability
Act).
G. Pressure from citizens
As elsewhere, citizens in Canada did not rush for-
ward with specific proposals for management
reform. However, a perceived dissatisfaction with
government, and alleged citizendemands for greater
accountability, were certainly a factormentioned by
executive politicians and senior officials as one rea-
son for publicmanagement reform (e.g. Foreword to
President of the Treasury Board, 1997).
It is important to disentangle the various
strands and dimensions of citizen opinion, for
example, by distinguishing the satisfaction levels
of service users with a particular service from
more general citizen views of the competence or
trustworthiness of government at large (Canadian
Centre for Management Development, 1998a).
Much of the expressed distrust of government in
general appears to have been focused on politi-
cians and on government in general, with public
servants being regarded with greater confidence.
Furthermore, when due allowance for differences
was made, user satisfaction levels with many pub-
lic services were not systematically worse than
with private sector services (Canadian Centre for
Management Development, 1998b; Erin Research
Inc., 2005, p. 15).
H. Party political ideas
The decisive shift towards public management
reform came (as in the UK and the USA) when a
right-wing government was elected in place of a
somewhat ‘worn out’ centre-left government (in the
Canadian case, Trudeau’s Liberal government). Mul-
roney’s Progressive Conservative administration was
imbued with anti-bureaucratic rhetoric and carried
with it a general suspicion of the established
248 APPENDIX B: COUNTRY FILES AND TABLES OF EVENTS
bureaucracyand its seemingly closeprevious relation-
ships with long-standing Liberal governments. How-
ever, although the incoming administration had
plenty of generalized prejudices against bureaucracy
and in favour of private sector dynamism, there is no
evidence that it had any well-worked-out scheme for
public management reform, or any coherent set of
operationalized ideas on which to base such a plan.
The popularity of private sector management
concepts faded somewhat during the long life of
the Mulroney government, and were certainly less
to the fore during the succeeding, more ‘state-
friendly’ Liberal government. It is not clear that
Chr�etien’s regime had any distinct plan of concep-
tion for management reform per se, but it was
determined to bring expenditure under control
and to try to link that to a more positive agenda
of modernization and developing alternative
modes of public service delivery. Most of the spe-
cific ideas, however, seem to have come from the
senior bureaucrats themselves.
From 1993 to 2006 there was a long period of
Liberal rule. This began in an atmosphere that was
more ‘public service friendly’ than had obtained
under Mulroney, but that did not prevent the
Chr�etien government from making deep cuts in
public expenditure. The Harper administration
after 2006 was again rather cool towards ‘public
sector solutions’.
I. Chance events
Several chance events appear to have had some
influence over the trajectory of management
reform. One was the dropping of Erik Nielsen
from the Mulroney cabinet in mid 1986—for rea-
sons unconnected with his leadership of the
programme review task force. This cannot have
helped the implementation of the still-new report,
which afterwards largely faded away. A second coin-
cidence, of rather larger impact, was the Mexican
currency crisis of late 1994, which by all accounts
helped significantly strengthen the determination of
the Chr�etien cabinet to push ahead with the down-
sizings and programme adjustments of the Program
Review exercise, in case Canada became the next
state to suffer currency ‘meltdown’ (Aucoin and Sa-
voie, 1998).
Although it would be possible to argue that the
2004–6 sponsorship scandal—which certainly had
many consequences—was a chance event, such an
interpretation is not favoured here. The corruption
was planned,widespread, and long-lasting, and even
if the emergence of some of the evidence may have
been accidental or unintended, the scandal as a
whole cannot really be classified as a ‘chance event’.
J. Elite decision-making
See Section G, above. The Mulroney administra-
tion developed a series of specific initiatives on
the basis of some generalized attitudes and preju-
dices, but there does not seem to have been any
coherent overall plan. Even the specific initiatives
that were launched frequently encountered imple-
mentation difficulties (see Sections L and M
below).
After the fall of the Progressive Conservative
administration in 1993 there was a shift in minis-
terial preferences. More emphasis was now placed
on finding creative forms of ‘Alternative Service
Delivery’, on partnership operations with the pro-
vinces, on shrewd use of advanced information
technology and on more transparent accounting
to Parliament for results (Aucoin and Savoie,
1998; President of the Treasury Board, 1997).
Throughout,Canadianministers andofficialshad
to temper their enthusiasm for particular directions
of reform with a recognition of the complex, multi-
level, sectoralized nature of the political and admin-
istrative systems. They did not enjoy the powers of
(say) New Zealand or UK prime ministers to drive
through major reforms even against significant
opposition. The picture of the ‘Canadian model’
drawn by the Secretary to the Privy Council (Bour-
gon, 1998) is essentially incremental and anti-doc-
trinal. It speaks of reform being carried out ‘calmly,
competently, without much fanfare’ (ibid., p. 1).
Considerable stress is laid on sharing and coopera-
tion with the provinces.
Ten years later, Bourgon’s model does not look to
be such an accurate portrayal. Government deci-
sion-making has become more politicized and
more centralized on the prime minister (Aucoin
and Savoie, 2009). Furthermore, certain manage-
ment reforms—especially the 2006 Federal Account-
ability Act, but also theManagement Accountability
Framework (MAF)—have been given considerable
fanfares.
K. The administrative system
In February 2008 there were twenty-five depart-
ments, more than thirty crown corporations and
roughly fifty other service organizations responsible
to federal ministers. A strong form of ministerial
CANADA 249
responsibility prevails (ministers responsible for all
the actions of their ‘portfolio’ of departments, crown
corporations, service agencies, tribunals, etc., no
‘accounting officers’ along UK lines). A number of
commentators have observed a movement towards
centralization of power around the prime minister
and his political advisers since the late 1990s (Au-
coin and Savoie, 2009). On the other hand, it must
be remembered that the proportion of public
employment in central, as opposed to sub-central
government in Canada is one of the lowest in the
OECD (OECD, 2009a, p. 69).
The central agencies have remained relatively
prominent—indeed they have probably increased
their influence. Themain ones are the Privy Coun-
cil Office (approximately 300 staff), the Treasury
Board Secretariat (800), theDepartment of Finance
(700), the Prime Minister’s Office (80), and the
Public Service Commission (2,000) (Savoie,
1997). Management reforms tend to be led by the
Privy Council Office and the Treasury Board
Secretariat.
The public service itself is non-partisan, and
deputy ministers (the chief officials in the depart-
ments) usually remain in place when the govern-
ment changes. Nearly all deputy ministers are
career civil servants. There is quite a strong ‘man-
darin culture’, with considerable horizontal com-
munication between senior civil servants in
different departments (Bourgault and Carroll,
1997, p. 97). However, in the past decade or so
the influence of political appointees and consul-
tants has grown. Furthermore the ‘churn’ rates of
deputy ministers and ministers has increased, so
that the opportunities to form longer-term trusting
relationships have probably diminished: ‘There is
increasing evidence to suggest that senior public
servants have becomemore responsive to the polit-
ical wishes of the prime minister’s court’ (Aucoin
and Savoie, 2009, p. 110).
For those who want more detail, Dunn (2002)
offers a comprehensive analysis of the Canadian
system. Lindquist (2006) gives a detailed review of
the HRM aspects.
L. Contents of reform
From a bird’s-eye view, some of the history of man-
agement reforms in the Canadian federal adminis-
tration appears as a bewildering series of
overlapping and only loosely coordinated initia-
tives, many of which seem to fade away or lose
momentum after a relatively short time. Several
commentators confirm that—certainly under the
Mulroney administrations of 1984–93—the politi-
cal leadership lacked any ‘grand design’ and gave
management issues only intermittent attention
(documented in Savoie, 1994).
Mulroney came to power following a campaign
which had been sharply critical of ‘big govern-
ment’ in Ottawa, and which had promised greater
‘frugality’ and radical changes in the bureaucracy.
He was re-elected in 1988 and finally lost office in
1993. During his period in power he launched a
number of initiatives, including:
� A 1984 review, under Deputy Prime Minister
Erik Nielsen, of existing government pro-
grammes, to make them ‘simple, more under-
standable andmore accessible to their clientele’,
as well as to decentralize them and cut out pro-
grammes for which there was not a demonstra-
ble need.
� The creation, in each ministry, of a politically
appointed chief-of-staff position at assistant dep-
uty minister level (i.e. the second highest civil
service grade).
� A target of a 15,000 downsizing of the civil ser-
vice within six years.
� The 1985 Increased Ministerial Authority and
Accountability initiative (IMAA). This was
designed to give individual ministers and
departmental managers greater flexibility in allo-
cating and reallocating resources within their
departments.
� From 1986, a ‘make or buy’ policy to encourage
competitive tendering for public services.
� Also from 1986, the establishment of a privatiza-
tion office.
� The 1988 establishment of the Canadian Centre
for Management Development (CCMD), to
strengthen management training for the Cana-
dian public service.
� It was decided that deputy ministers (the most
senior civil servants) could henceforth be called
before parliamentary committees for question-
ing (Bourgault and Carroll, 1997, p. 3).
� The effective scrapping of the previous Policy
and Expenditure Management System (PEMS)
and its replacement, from 1989, with a new sys-
tem of cabinet committees, centred upon an
Expenditure Review Committee (ERC).
� A high-profile, broad-scope exercise entitled Pub-
lic Service 2000 (PS 2000), which was to
empower civil servants, cut red tape and
improve service to the public. PS 2000 was
250 APPENDIX B: COUNTRY FILES AND TABLES OF EVENTS
announced in December 1989. In 1990 a White
Paper The Renewal of the Public Service in Canada
was published.
� The creation of a new type of decentralized
agency, the Special Operating Agency (SOA),
which was to enjoy greater managerial flexibility,
whilst remaining within the framework of min-
isterial departments. The first five SOAs were
announced in December 1989. Others followed,
and from the late 1990s major efforts were made
to provide integrated (or ‘joined up’) services
through SOAs such as Service Canada
(Kernaghan, 2008, 2009a, b).
� Further reforms followed the fall of the Progres-
sive Conservative administration inMarch 1993.
Some of the more significant were:
∘ 1993: Service Standards Initiative, to encour-
age departments and agencies to develop and
publish service standards. By 1995 two-thirds
of departments were said to be well advanced
in this exercise.
∘ June 1993: A radical restructuring of the
machinery of central government by Mul-
roney’s Progressive Conservative successor,
Kim Campbell. The size of the Cabinet was
reduced from thirty-five to twenty-three and
a number of departments were merged or
eliminated.
∘ Campbell’s government was short-lived. In
October 1993 the Liberals, under Jean
Chr�etien, returned to power.
∘ February 1994: A process of Program Review
was launched. Unlike some previous expendi-
ture reduction exercises this one was able to
mobilize considerable collective support
within Cabinet, and was carried through to
implementation in the 1995 and subsequent
budgets. It went beyond simple cost-cutting
and entailed a broad reconsideration and pri-
oritization of the role of the federal govern-
ment in Canadian society (Aucoin and
Savoie, 1998).
∘ February 1995: A new Expenditure Manage-
ment System (EMS) was introduced which
considerably tightened the previous approach
to the use of budgetary reserves. Under EMS it
is assumed that all new programmes and
programme increases will have to be financed
by reallocations within departments’ budget-
ary envelopes. The government also com-
mitted itself to the introduction of full
accruals accounting.
∘ June 1995: A Quality Services Initiative
approved by Cabinet. Aimed at increasing
measured client satisfaction.
∘ 1996: Introduction of Improved Reporting to
Parliament system (IRPP) with the aim of
enhancing the accountability of ministers
and departments to Parliament.
∘ 1996: Secretary to the Privy Council launched
an initiative named La Releve designed to
tackle what was said to be a ‘quiet crisis’ in
the Canadian public service: ‘This was the
result of years of downsizing and pay freezes,
criticism, insufficient recruitment, and the
premature departure of experienced public ser-
vants’ (Bourgon, 1998, p. 18). Initiatives were
invited from departments to revitalize the
public service.
∘ 1997: Publication of Accounting for Results
(President of the Treasury Board, 1997) which
for the first time brought together results state-
ments for all departments.
∘ 2000: Introduction of Results-based Manage-
ment and Accountability Frameworks
(RMAFs) to support the regular evaluation of
transfer payments programmes.
∘ 2001: Launch of the Public Service Moderniza-
tion initiative, focusing on HRM and aiming
to reduce detailed central control and intro-
duce more flexibility.
∘ 2003: Full implementation of accruals account-
ing in the federal government. (The original
decision to introduce it had been taken in
1995—see Baker and Rennie, 2006.)
∘ 2003: Treasury Board Secretariat introduced
the Management Accountability Framework,
which is used for appraising the performance
of top civil servants.
∘ 2004: Auditor General’s report on what be-
came known as the ‘sponsorship scandal’ in-
itiated an intense political crisis, lasting for
more than a year and signficantly contribut-
ing to the loss of popularity of the Liberal
government of Prime Minister Martin, and its
eventual electoral defeat in 2006 (Auditor
General, 2004). A 1996–2004 federal sponsor-
ship programme in the province of Quebec
turned out to have been riddled with corrup-
tion. The programme was intended to raise
awareness within Quebec of the federal gov-
ernment’s contributions to the Quebec econ-
omy. The Auditor General’s report revealed,
inter alia, that up to $C 100 million of the
$C 250 million programme had been paid to
CANADA 251
Liberal Party-friendly advertising firms and
crown corporations who had performed little
or no work. Eventually the scandal tarnished
both political and civil service reputations,
and lowered public trust. Guit�e, the official in
charge of the programme, was tried and con-
victed on five counts of fraud.
∘ 2004–5: The Liberal government (now in a
minority), defending itself against sponsor-
ship scandal criticisms, introduced a whole
series of reforms, including the creation of a
Comptrollership General of Canada (Thomas,
2009, p. 241).
∘ 2005: Launch of Service Canada, a hybrid
agency offering a single window for the deliv-
ery of awide range of public services (including
employment insurance and pensions) for thir-
teen departments and agencies. Operates
through a) Internet, b) telephone, c) conven-
tional mail, and d) a network of local offices:
22,000 employees. Citizen-centred busi-
ness model (Kernaghan, 2008). Reports to
Minister for Human Resources and Skills
Development.
∘ 2006: General election. The Conservative party
defeats the Liberals (after thirteen years in
power). Harper becomes PM.
∘ 2006: Federal Accountability Act made deputy
ministers accountable to parliamentary com-
mittees, established a parliamentary budget-
ary office, extended the power of the Auditor
General, and introduced a systematic evalua-
tion of the government’s grant and contribu-
tions programmes (McCormack, 2007).
∘ 2006: New government website introduced
Tools and Resources for Parliamentarians:
(www.tbs-sct.gc.ca/tbs-sct/audience-auditoire/
parliamentarian-parlementaire-eng.asp, acces-
sed 15 April 2010). Intended to provide MPs
with a simplified way of finding many govern-
ment reports and plans.
∘ 2008: General election. Harper Conservative
government retains power, but as a minority.
M. The implementation process
During the 1980s the implementation process
in Canada appears to have been a somewhat uncer-
tain one, at least in the sense that a number of
the initiatives petered out after a relatively
short period. Examples of such disappointments
include:
� ‘Notwithstanding its early support, the Mulron-
ey government did not follow through on the
great majority of the Nielsen recommendations .
. . Indeed, the great majority of programs re-
viewed are still in place and virtually intact’ (Sa-
voie, 1994, p. 130).
� The ‘make-or-buy’ policy of 1986 did not make
much progress beyond the pilot project phase,
and was abandoned in 1990.
� Despite the early development of a privatization
plan, substantive progress on this policy had
dwindled by 1987. The Department of Finance
insisted that revenues from privatization sales
should go into the Consolidated Revenue Fund,
and departmental ministers became increasingly
resistant to ‘losing’ ‘their’ crown corporations or
subsidiaries.
� The success of IMAA was limited. Six years after
its introduction only about one third of depart-
ments had agreed to sign an MOU with the Trea-
sury Board, and those that did sometimes
complained of a mass of paperwork for only lim-
ited real autonomy.
� ‘Even its most ardent supporter admits that PS
2000 is not living up to expectations’ (Savoie,
1994, p. 241). The expectation that central agen-
cies would be cut back was not fulfilled. There
was a widespread perception that PS 2000 re-
mained a top-down exercise which produced
more reports than action.
� Mulroney’s programme for downsizing the civil
service produced a reduction of only 15,000 and
about half these positions were actually trans-
ferred to provincial governments or other parts
of the public sector (Savoie, 1994, pp. 266–7).
� ‘Although the experiences with SOAs have been
positive, it is not clear whether they are suffi-
ciently different from traditional departments
to support flexible and innovative service deliv-
ery’ (OECD, 1997, p. 44).
� During the 1980s ‘governments became increas-
ingly pre-occupied with the deficit and the debt,
but were unable to come to grips with it. The
period was characterized by unachievable deficit
reduction targets and regular across-the-board
cuts, primarily targeted at operations’ (Harder
and Lindquist, 1997, p. 80). Net public debt
increased from $C168 billion in 1984 to $C508
billion in 1993.
After 1994, conditions for implementation eased.
The Canadian economy began to improve, and a
very experienced prime minister (Chr�etien) was
252 APPENDIX B: COUNTRY FILES AND TABLES OF EVENTS
able to establish a relatively disciplined Cabinet.
The 1994 Program Review exercise and the 1995
budget were generally regarded as successful exer-
cises. However, there remained a doubt about the
connections between the higher levels of the federal
government—especially the central agencies—and
‘middle management’ in the operational agencies
and the departments. Reforms might have achieved
agreement at the top, but to what extent was imple-
mentation ‘owned’ by those outside Ottawa?
This tension continued into the twenty-first cen-
tury, as the federal government became increasingly
centralized, but at the same time the complexity of
implementing ‘integrated public governance’ in
cooperation with the provinces increased.
N. Reforms actually achieved
There has been no systematic evaluation of public
management reform in Canada during this period,
although there have been a number of specific re-
views or assessments of particular initiatives. Not-
able among these have been the sometimes sharply
critical reports of the Auditor General (e.g. Auditor
General of Canada, 1993, 1997, 2004).
As indicated above (M), it appears that Canada
suffers (or, at least, suffered) from a significant
‘implementation gap’, with many initiatives fail-
ing to meet anything like their full expectations.
The 1994 Program Review exercise, thanks to a
favourable set of political circumstances surround-
ing its launch, appears to be an important excep-
tion to this, but it would have been optimistic to
expect such circumstances to continue indefinitely
(Aucoin and Savoie, 1998). There are signs, for
example, that implementation of elements of the
2006 Federal Accountability Act has been weak
(e.g. some retreat on access to government infor-
mation; an underfunded and tightly controlled
parliamentary budget officer) (See also Bouckaert
and Halligan, 2008, appendix V).
Some particular studies shed light on aspects of
the reforms. For example, Bilodou et al. (2007)
examined the productivity of five federal Special
Operating Agencies before and after corporatiza-
tion (there were twenty SOAs in all at the
time they undertook their research). They found
statistically significant increases in outputs for a
majority of their cases, but other measures (cost
efficiency) were less clear, and in any case there
was great variation between individual agencies,
with some indicating performance declines. Nei-
ther did this study include measurement of service
quality or user satisfaction, so, overall, it cannot be
interpreted as more than a mild endorsement of
the idea that autonomization can sometimes
increase technical efficiency.
At the time of writing we are awaiting the five
year post-implementation review of the Public Ser-
vice Modernization programme.
CANADA 253
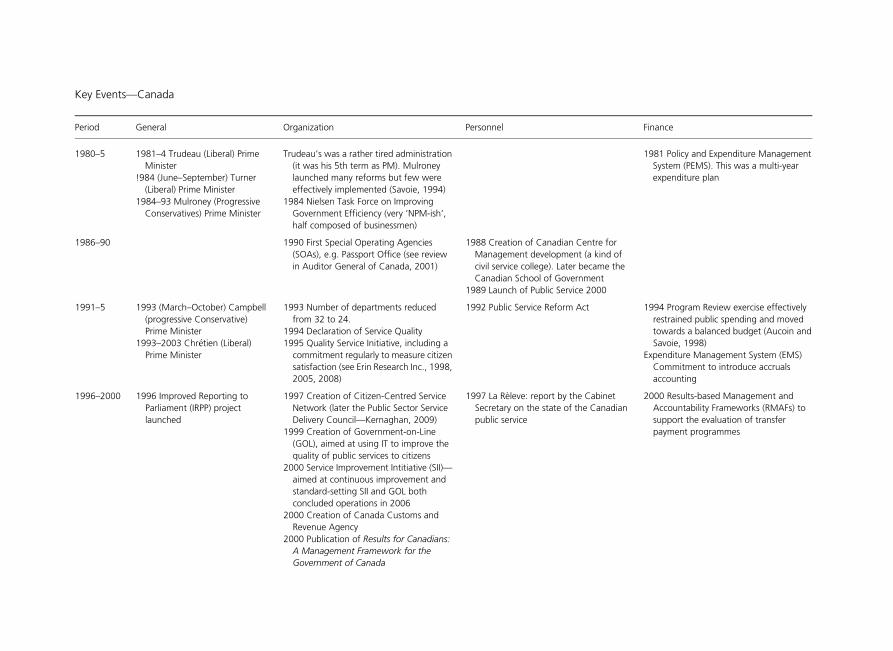
Key Events—Canada
Period General Organization Personnel Finance
1980–5 1981–4 Trudeau (Liberal) Prime
Minister
!984 (June–September) Turner
(Liberal) Prime Minister
1984–93 Mulroney (Progressive
Conservatives) Prime Minister
Trudeau’s was a rather tired administration
(it was his 5th term as PM). Mulroney
launched many reforms but few were
effectively implemented (Savoie, 1994)
1984 Nielsen Task Force on Improving
Government Efficiency (very ‘NPM-ish’,
half composed of businessmen)
1981 Policy and Expenditure Management
System (PEMS). This was a multi-year
expenditure plan
1986–90 1990 First Special Operating Agencies
(SOAs), e.g. Passport Office (see review
in Auditor General of Canada, 2001)
1988 Creation of Canadian Centre for
Management development (a kind of
civil service college). Later became the
Canadian School of Government
1989 Launch of Public Service 2000
1991–5 1993 (March–October) Campbell
(progressive Conservative)
Prime Minister
1993–2003 Chr�etien (Liberal)
Prime Minister
1993 Number of departments reduced
from 32 to 24.
1994 Declaration of Service Quality
1995 Quality Service Initiative, including a
commitment regularly to measure citizen
satisfaction (see Erin Research Inc., 1998,
2005, 2008)
1992 Public Service Reform Act 1994 Program Review exercise effectively
restrained public spending and moved
towards a balanced budget (Aucoin and
Savoie, 1998)
Expenditure Management System (EMS)
Commitment to introduce accruals
accounting
1996–2000 1996 Improved Reporting to
Parliament (IRPP) project
launched
1997 Creation of Citizen-Centred Service
Network (later the Public Sector Service
Delivery Council—Kernaghan, 2009)
1999 Creation of Government-on-Line
(GOL), aimed at using IT to improve the
quality of public services to citizens
2000 Service Improvement Intitiative (SII)—
aimed at continuous improvement and
standard-setting SII and GOL both
concluded operations in 2006
2000 Creation of Canada Customs and
Revenue Agency
2000 Publication of Results for Canadians:
A Management Framework for the
Government of Canada
1997 La Releve: report by the Cabinet
Secretary on the state of the Canadian
public service
2000 Results-based Management and
Accountability Frameworks (RMAFs) to
support the evaluation of transfer
payment programmes
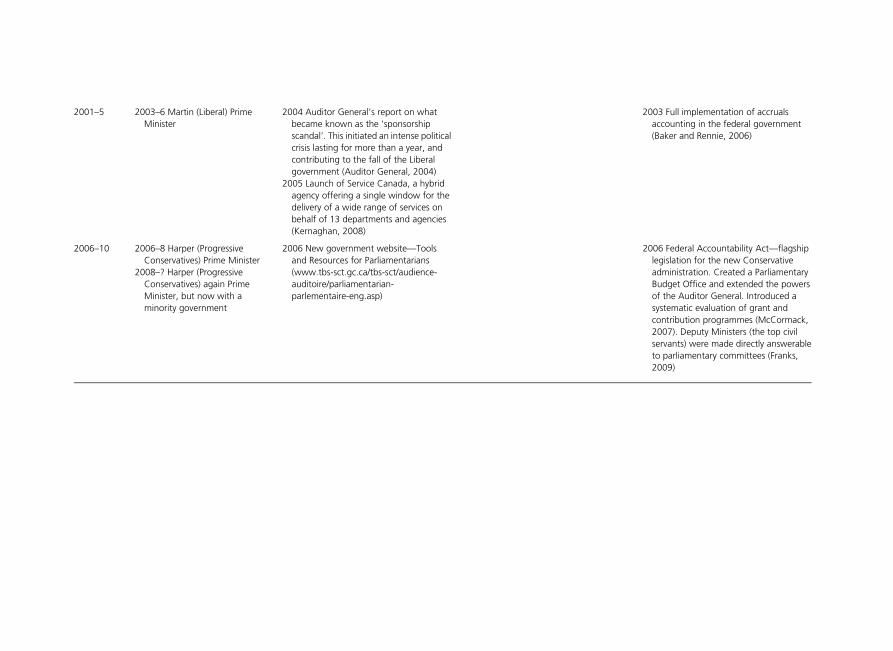
2001–5 2003–6 Martin (Liberal) Prime
Minister
2004 Auditor General’s report on what
became known as the ‘sponsorship
scandal’. This initiated an intense political
crisis lasting for more than a year, and
contributing to the fall of the Liberal
government (Auditor General, 2004)
2005 Launch of Service Canada, a hybrid
agency offering a single window for the
delivery of a wide range of services on
behalf of 13 departments and agencies
(Kernaghan, 2008)
2003 Full implementation of accruals
accounting in the federal government
(Baker and Rennie, 2006)
2006–10 2006–8 Harper (Progressive
Conservatives) Prime Minister
2008–? Harper (Progressive
Conservatives) again Prime
Minister, but now with a
minority government
2006 New government website—Tools
and Resources for Parliamentarians
(www.tbs-sct.gc.ca/tbs-sct/audience-
auditoire/parliamentarian-
parlementaire-eng.asp)
2006 Federal Accountability Act—flagship
legislation for the new Conservative
administration. Created a Parliamentary
Budget Office and extended the powers
of the Auditor General. Introduced a
systematic evaluation of grant and
contribution programmes (McCormack,
2007). Deputy Ministers (the top civil
servants) were made directly answerable
to parliamentary committees (Franks,
2009)
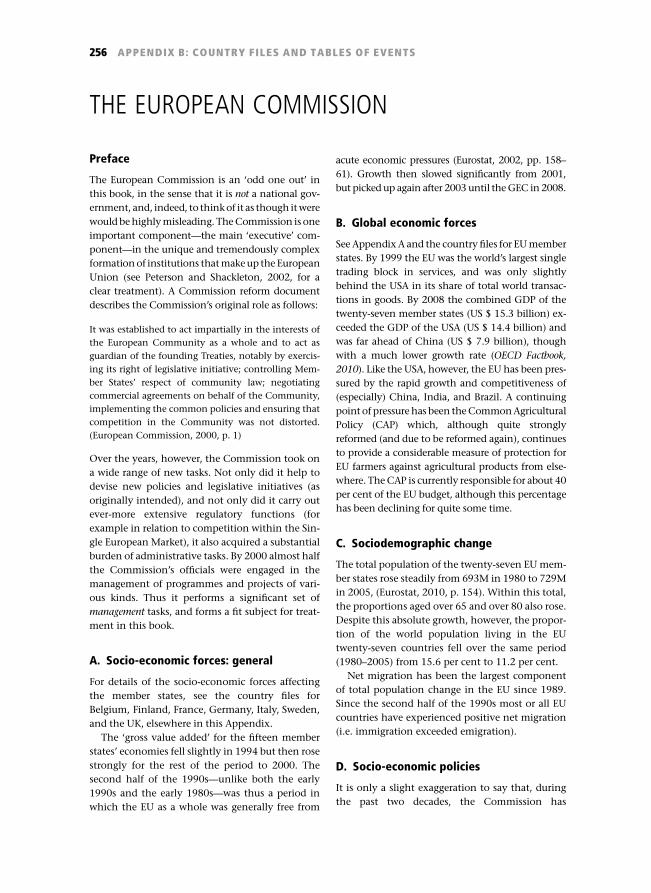
THE EUROPEAN COMMISSION
Preface
The European Commission is an ‘odd one out’ in
this book, in the sense that it is not a national gov-
ernment, and, indeed, to thinkof it as though itwere
would behighlymisleading. TheCommission is one
important component—the main ‘executive’ com-
ponent—in the unique and tremendously complex
formationof institutions thatmakeup the European
Union (see Peterson and Shackleton, 2002, for a
clear treatment). A Commission reform document
describes the Commission’s original role as follows:
It was established to act impartially in the interests of
the European Community as a whole and to act as
guardian of the founding Treaties, notably by exercis-
ing its right of legislative initiative; controlling Mem-
ber States’ respect of community law; negotiating
commercial agreements on behalf of the Community,
implementing the common policies and ensuring that
competition in the Community was not distorted.
(European Commission, 2000, p. 1)
Over the years, however, the Commission took on
a wide range of new tasks. Not only did it help to
devise new policies and legislative initiatives (as
originally intended), and not only did it carry out
ever-more extensive regulatory functions (for
example in relation to competition within the Sin-
gle European Market), it also acquired a substantial
burden of administrative tasks. By 2000 almost half
the Commission’s officials were engaged in the
management of programmes and projects of vari-
ous kinds. Thus it performs a significant set of
management tasks, and forms a fit subject for treat-
ment in this book.
A. Socio-economic forces: general
For details of the socio-economic forces affecting
the member states, see the country files for
Belgium, Finland, France, Germany, Italy, Sweden,
and the UK, elsewhere in this Appendix.
The ‘gross value added’ for the fifteen member
states’ economies fell slightly in 1994 but then rose
strongly for the rest of the period to 2000. The
second half of the 1990s—unlike both the early
1990s and the early 1980s—was thus a period in
which the EU as a whole was generally free from
acute economic pressures (Eurostat, 2002, pp. 158–
61). Growth then slowed significantly from 2001,
but picked up again after 2003 until theGEC in 2008.
B. Global economic forces
See AppendixA and the country files for EUmember
states. By 1999 the EU was the world’s largest single
trading block in services, and was only slightly
behind the USA in its share of total world transac-
tions in goods. By 2008 the combined GDP of the
twenty-seven member states (US $ 15.3 billion) ex-
ceeded the GDP of the USA (US $ 14.4 billion) and
was far ahead of China (US $ 7.9 billion), though
with a much lower growth rate (OECD Factbook,
2010). Like the USA, however, the EU has been pres-
sured by the rapid growth and competitiveness of
(especially) China, India, and Brazil. A continuing
point of pressurehas been theCommonAgricultural
Policy (CAP) which, although quite strongly
reformed (and due to be reformed again), continues
to provide a considerable measure of protection for
EU farmers against agricultural products from else-
where. TheCAP is currently responsible for about 40
per cent of the EU budget, although this percentage
has been declining for quite some time.
C. Sociodemographic change
The total population of the twenty-seven EUmem-
ber states rose steadily from 693M in 1980 to 729M
in 2005, (Eurostat, 2010, p. 154). Within this total,
the proportions aged over 65 and over 80 also rose.
Despite this absolute growth, however, the propor-
tion of the world population living in the EU
twenty-seven countries fell over the same period
(1980–2005) from 15.6 per cent to 11.2 per cent.
Net migration has been the largest component
of total population change in the EU since 1989.
Since the second half of the 1990s most or all EU
countries have experienced positive net migration
(i.e. immigration exceeded emigration).
D. Socio-economic policies
It is only a slight exaggeration to say that, during
the past two decades, the Commission has
256 APPENDIX B: COUNTRY FILES AND TABLES OF EVENTS
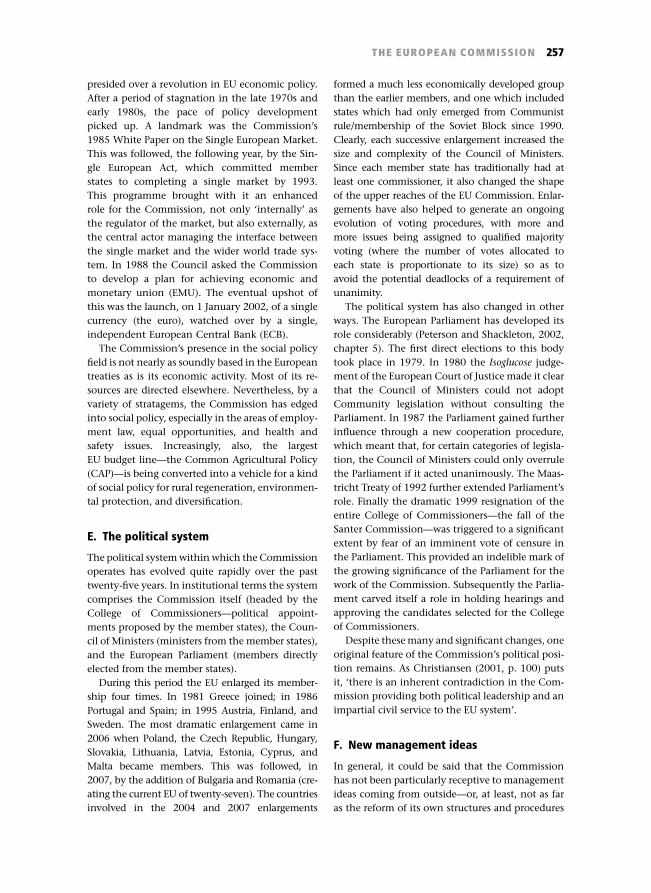
presided over a revolution in EU economic policy.
After a period of stagnation in the late 1970s and
early 1980s, the pace of policy development
picked up. A landmark was the Commission’s
1985 White Paper on the Single European Market.
This was followed, the following year, by the Sin-
gle European Act, which committed member
states to completing a single market by 1993.
This programme brought with it an enhanced
role for the Commission, not only ‘internally’ as
the regulator of the market, but also externally, as
the central actor managing the interface between
the single market and the wider world trade sys-
tem. In 1988 the Council asked the Commission
to develop a plan for achieving economic and
monetary union (EMU). The eventual upshot of
this was the launch, on 1 January 2002, of a single
currency (the euro), watched over by a single,
independent European Central Bank (ECB).
The Commission’s presence in the social policy
field is not nearly as soundly based in the European
treaties as is its economic activity. Most of its re-
sources are directed elsewhere. Nevertheless, by a
variety of stratagems, the Commission has edged
into social policy, especially in the areas of employ-
ment law, equal opportunities, and health and
safety issues. Increasingly, also, the largest
EU budget line—the Common Agricultural Policy
(CAP)—is being converted into a vehicle for a kind
of social policy for rural regeneration, environmen-
tal protection, and diversification.
E. The political system
The political systemwithin which the Commission
operates has evolved quite rapidly over the past
twenty-five years. In institutional terms the system
comprises the Commission itself (headed by the
College of Commissioners—political appoint-
ments proposed by the member states), the Coun-
cil of Ministers (ministers from the member states),
and the European Parliament (members directly
elected from the member states).
During this period the EU enlarged its member-
ship four times. In 1981 Greece joined; in 1986
Portugal and Spain; in 1995 Austria, Finland, and
Sweden. The most dramatic enlargement came in
2006 when Poland, the Czech Republic, Hungary,
Slovakia, Lithuania, Latvia, Estonia, Cyprus, and
Malta became members. This was followed, in
2007, by the addition of Bulgaria and Romania (cre-
ating the current EU of twenty-seven). The countries
involved in the 2004 and 2007 enlargements
formed a much less economically developed group
than the earlier members, and one which included
states which had only emerged from Communist
rule/membership of the Soviet Block since 1990.
Clearly, each successive enlargement increased the
size and complexity of the Council of Ministers.
Since each member state has traditionally had at
least one commissioner, it also changed the shape
of the upper reaches of the EU Commission. Enlar-
gements have also helped to generate an ongoing
evolution of voting procedures, with more and
more issues being assigned to qualified majority
voting (where the number of votes allocated to
each state is proportionate to its size) so as to
avoid the potential deadlocks of a requirement of
unanimity.
The political system has also changed in other
ways. The European Parliament has developed its
role considerably (Peterson and Shackleton, 2002,
chapter 5). The first direct elections to this body
took place in 1979. In 1980 the Isoglucose judge-
ment of the European Court of Justice made it clear
that the Council of Ministers could not adopt
Community legislation without consulting the
Parliament. In 1987 the Parliament gained further
influence through a new cooperation procedure,
which meant that, for certain categories of legisla-
tion, the Council of Ministers could only overrule
the Parliament if it acted unanimously. The Maas-
tricht Treaty of 1992 further extended Parliament’s
role. Finally the dramatic 1999 resignation of the
entire College of Commissioners—the fall of the
Santer Commission—was triggered to a significant
extent by fear of an imminent vote of censure in
the Parliament. This provided an indelible mark of
the growing significance of the Parliament for the
work of the Commission. Subsequently the Parlia-
ment carved itself a role in holding hearings and
approving the candidates selected for the College
of Commissioners.
Despite these many and significant changes, one
original feature of the Commission’s political posi-
tion remains. As Christiansen (2001, p. 100) puts
it, ‘there is an inherent contradiction in the Com-
mission providing both political leadership and an
impartial civil service to the EU system’.
F. New management ideas
In general, it could be said that the Commission
has not been particularly receptive to management
ideas coming from outside—or, at least, not as far
as the reform of its own structures and procedures
THE EUROPEAN COMMISSION 257
have been concerned. It is self-consciously ‘differ-
ent’—unique—and has never been as open to pri-
vate sector management ideas as, say, the
governments of USA or the UK. The reforms since
the mid 1990s (for details see below) have been very
much ‘home grown’ and not directly modelled on
those of any guru or school of thought such as NPM
(Levy, 2004), even if they have shared some of the
rhetoric (‘decentralization’, ‘performance’). Since
the 1999 collapse of the Santer Commission (see
below), ideas of strategy and transparencyhave gained
significant footholds within the Commission, and
both these are obviously drawn from thewider inter-
national stream of public management ideas.
The Commission has also acted to facilitate the
spread of certain management ideas among the
member states. It has helped to promote TQM, and
has supported the development of a simplified
version of the European Foundation for Quality
Management model of excellence, known as the
Common Assessment Framework (CAF). For the
main part, however, these activities have constituted
the promotion of certain techniques for use elsewhere
(in member states or in EU programmes which are
administered on a decentralized basis) rather than
within the core of the Commission itself.
G. Pressure from citizens
It is hard for citizens to exert any direct pressure on
the Commission. On the whole it has few direct
contacts with citizens—most EU programmes are
administered by member states, with the Commis-
sion acting at a distance to formulate the objectives
and rules, to supply some or all of the finance, and
to regulate ormonitor the activities ‘on the ground’.
The Commission does not itself provide extensive
public services, as do national and local authorities.
Nevertheless, in a more general way the
Commission—together with the Council and
the Parliament—is certainly concerned at the gen-
eral problem of falling trust in EU institutions and
declining voter turnout at European elections (Pe-
terson and Shackleton, 2002, pp. 8–9). This con-
cern may well have been one motive behind the
theme of ‘transparency’ which was embraced in
the 2000 White Paper, Reforming the Commission
(European Commission, 2000).
H. Party political ideas
The reform of the Commission does not seem to
have been much affected by party political ideas.
The Commission is not ‘run’ by one or two parties,
like most national governments. There is no direct
channel by which the ideas of a particular political
party could come to dominate the reform discus-
sion within the Commission. This is not to say, of
course, that politics do not have any influence.
Changes in the upper reaches of the Commission
are usually a focus for intensive ‘bureau-politics’,
but that is a different kind of politics, not usually
conducted along party lines.
I. Chance events
One may debate whether it was ‘chance’ or ‘an
accident waiting to happen’, but the series of scan-
dals and inefficiencies which gradually engulfed
the Santer Commission (1995–9) certainly left
their mark on the ongoing process of reform. The
eventual resignation of that Commission made a
fresh reform effort virtually inevitable. Arguably,
however, it also biased attention towards an
agenda of control (tightening procedures and
audit) and away from the agenda of efficiency and
performance (see, e.g. Committee of Independent
Experts, 1999). The ensuing reforms embraced
both themes, but some evidence suggests that the
former, rather than the latter, has been more vigor-
ously implemented.
J. Elite decision-making
Whilst there is certainly an ‘elite’ within the Com-
mission, it is quite a diverse one. As far as reform is
concerned the key actors are probably the commis-
sioners themselves plus the directors-general
(heads of the main vertical divisions within the
Commission). These two groups come from all
the member states, and therefore from a wide
range of political and administrative cultures
(Ban, 2010b). Even when they can agree that a
particular reform may be desirable, they face a
number of powerful constraints. In practice,
major reforms would have to be acceptable to the
Council of Ministers, and ‘saleable’ to the Euro-
pean Parliament. Last, but by no means least, the
Commission is home to strong trade unions
(‘syndicates’), which have long practice in defend-
ing their members’ strong tenure and not inconsid-
erable privileges.
The elite is advised by personal cabinets of offi-
cials (often quite young) and by ad hoc teams and
task forces. The selection of members of these
influential teams and cabinets is commonly quite
258 APPENDIX B: COUNTRY FILES AND TABLES OF EVENTS
personalized—this is not a transparent process
based on qualifications and merit, but rather a
commissioner picking (from those who are willing
and available) individuals s/he thinks will be effec-
tive and loyal helpers in the process of forming and
negotiating a set of feasible reform proposals.
Two of the stronger internal rules within the
Commission are that the commissioners decide
on proposals collegially, not individually, and that
proposals which come up from within the Com-
mission must be cleared and agreed horizontally
with all the directorates who have a legitimate
interest in the issue at hand. Both these rules help
to ensure that the proposals of a single individual,
or doctrinally committed group, are unlikely to be
acceptable unless considerable compromises are
made.
K. The administrative system
A popular image in the Britishmassmedia is that of
a ‘bloated Brussels bureaucracy’. In reality, while
the Commission certainly possesses many of the
classic characteristics of a bureaucracy (strict hier-
archy, lots of ‘red tape’), it is not at all large, relative
to the long list of responsibilities attributed to it.
The total number of Commission staff in 2007 was
about 23,000 plus 9,000 ‘external’ staff (detached,
or temporary). These numbers included more than
2,000 translators and interpreters (to handle the
need to translate the many documents and
speeches into all the Community languages). The
number of A-grade staff (the policy and manage-
ment group) was just over 6,000.
At the top sits the College of Commissioners
itself. These twenty-seven (one for each member
state) are mainly ex-politicians, and are supposed
to work on a collegial basis, not as individual min-
isters, each with their own unique sphere of
authority (Christiansen, 2001).
The work is divided into more than twenty Dir-
ectorates General (DGs) and a number of other
services (most importantly, the Legal Service and
the Secretariat General). The DGs (whose exact
number varies over time, with mergers and new
creations) are functionally defined (e.g. Agricul-
ture, Budget, Energy, and Transport, etc.—see
Peterson and Shackleton, 2002, p. 145). Most are
sectoral (‘vertical’—e.g. energy), but a few are hori-
zontal, cutting across the sectors (e.g. budget). Tra-
ditionally DGs are fairly hierarchical, and the
divisions between them are quite deep. In other
words, the directors-general are powerfully placed
at the top of strong vertical ladders of authority,
and horizontal coordination between these
twenty-plus ‘commands’ is weak. For long the
administrative culture of the Commission repre-
sented a blend of the hierarchical and legalisti-
cally-oriented French and German traditions. The
‘Kinnock reforms’ of 2000–4 aimed to improve
strategic coordination but it is debatable how suc-
cessful they were (see below).
The most senior official in the Commission is
the Secretary General. All permanent staff enjoy
high security of tenure. The nationalities of the A-
grades in any particular part of the organization are
deliberately mixed up so as to try to prevent the
formation of ‘national groups’ which could influ-
ence a given programme or project (i.e. if you are
an A-grade German, you are unlikely to have
another German as your boss). There is an unoffi-
cial national quota system for the top three grades
(A1 to A3). (Details of how all this works are spelled
out in Page, 1997, but it should be noted that the
Kinnock reforms since 2000 have had as one of
their aims the reduction of the ‘flags on posts’, or
quota system for top positions.)
The DGs report to the commissioner responsible
for their particular function. The precise definition
of functions, and the exact portfolios of individual
commissioners change constantly over time, in
roughly the same way as frequent re-allocations
or definitions of function take place in many
national governments. Commissioners are sup-
posed to assume full political responsibility for
the Commission’s actions, with DGs being respon-
sible for sound implementation. In practice the
line between policy and implementation in the
EU is probably even harder to draw than in
national governments.
L. Content of the reform package
Between 1980 and the mid 1990s there were few
attempts to reform the management of the Com-
mission. During this period its tasks and size grew
considerably, and in particular it took on more
executive functions—running projects and pro-
grammes. The famous French President of the
Commission between 1985 and 1995, Jacques
Delors, was keen to expand the range of Commis-
sion activities, but seems to have been little inter-
ested in issues of efficiency or performance
management. Expert observers refer to ‘the ineffi-
ciencies and immobilisme that plagued the services’
(Peterson and Shackleton, 2002, p. 156).
THE EUROPEAN COMMISSION 259
In 1995 the Santer Commission launched a
programme entitled Sound and Effective Manage-
ment 2000 (SEM 2000), quickly followed, in
1997, by a further development called Moderniza-
tion of Administration and Personnel Policy (MAP
2000). SEM 2000 was aimed at updating financial
management practices and creating a system
whereby EU programmes would be subject to reg-
ular, independent evaluation (European Commis-
sion, 1997a, 1998). MAP 2000 was aimed at
decentralizing and simplifying the Byzantine sys-
tem of personnel and administrative procedures
(European Commission, 1997b). The Santer Com-
mission also launched an exercise called DECODE
(1997–9), which aimed at inventorizing staff and
their functions. It was perhaps significant that
such an elaborate and time-consuming exercise
was needed simply so that the Commission
could accurately see what its own staff were
spending their time doing. SEM 2000, MAP
2000, and DECODE each got quite a long way
before the end of the Santer Commission (1999),
although none were entirely complete. A brief
assessment of them is given in Section N below.
After the fall of the Santer Commission, the
incoming Prodi Commission was obliged to make
major reforms. It built upon these previous at-
tempts at reform, and gave their own effort a high
profile. It quickly published a White Paper on Re-
forming the Commission (European Commission,
2000). The major changes envisaged were:
� Strategic priority setting and resource allocation
(particularly a system of Activity-Based Manage-
ment, or ABM, plus a policy of ‘externalizing’
operational tasks and activities so as to be able
to re-focus on policy priorities—see European
Commission, 2000 and 2001a).
� Human resource management (decentralizing
responsibility for staff management, and simpli-
fying and clarifying procedures; introducing bet-
ter training and career planning).
� Financial management (setting up a proper
internal audit service and better ‘fraud-proofing’
of legislation; decentralizing financial controls to
individual DGs).
Although there has been nothing since the Kin-
nock reforms which has matched them for com-
prehensiveness or public attention, there have
been various moves to modernize different aspects
of the Commission’s working. Transparency has
become a major issue (see, e.g. Regulation (EC)
no.1049/2001). The theme of simplifying and
reducing the regulatory burden has been a hardy
perennial. One important innovation here has
been the use of Regulatory Impact Assessment
(RIA) to test the economic, social, and environ-
mental impacts of new EU regulations—on this
and most other reforms, see the Europa website
(<http://ec.europa.eu>) for details. Last, but by no
means least, the prospect of having to hire 4,600
new staff as the 2004 enlargement approached gal-
vanized a big change in recruitment procedures
(Ban, 2010a). A European Personnel Selection
Office was set up in 2002 and has introduced a
much more modern-looking system, including
assessment centres and competency testing.
M. Implementation process
Implementation of the SEM 2000 and MAP 2000
reforms conspicuously lacked a central focus and
leadership, and were eventually overtaken by the
collapse of the Santer Commission.
The Kinnock White Paper had a clearer Action
Plan (European Commission, 2000, Part 2), with
many of the important actions falling to the Secre-
tary General, a man who had previously been chief
adviser (chef de cabinet) to Mr Prodi, the new presi-
dent. Nevertheless, a quick persual of this docu-
ment should suffice to convince the reader of the
complexity of the implementation process for a
reform of this type. It was also noticeable how,
during implementation, the human resource
management elements came to take up a larger
and larger share of effort (Mr Kinnock himself
felt obliged to attend many dozens of meetings
with the syndicates) and the performance-oriented
elements of the reforms seemed to take secondplace.
Furthermore the rhetorical flourishes concerning
decentralization seem to have lost out to a strong
bureaucratic logic of further centralization in the
name of tighter control (Levy, 2004).
The ongoing reform of recruitment procedures
appeared to be accomplished with surprising ease,
but a detailed analysis indicates that the imple-
mentation of these changes hold a number of
potential pitfalls, and that their final impact is
likely to be less than revolutionary (Ban, 2010a).
N. Results achieved
This is hard to say, not least because many ele-
ments within the recent reforms have been ex-
pressed in very general terms and/or are hard to
measure. The reform package announced by Vice
260 APPENDIX B: COUNTRY FILES AND TABLES OF EVENTS
President Kinnock in March 2000 included an
action plan and, in 2003, the Commission pub-
lished a progress review, in which it was claimed
that real advances had been made with eighty-
seven of the ninety-four recommended actions
(European Commission, 2003). Further analysis in-
dicates a somewhat less rosy picture, in that the
majority of the ‘actions’ were preliminary or interme-
diate rather than final, and even some of the ‘suc-
cesses’—such as Activity-Based Management—may
have fallen far short of what might be supposed
from the management textbooks (Levy, 2004).
There have certainly been important changes in pro-
cedure, such as the introduction of Activity-Based
Management and the creation of an internal audit
service. Financial procedures have changed—though
whether they have becomemore efficient or effective
in somemore fundamental sense canbedebated. The
new emphasis on the individual responsibility of
DGs, coupled with new promotion and grading pro-
cedures and annual activity plans could begin to shift
the management culture, but at the time of writing
there is little hard evidence that this has been
achieved. As for the new commitment to strategy,
there has been no shortage of annual and five-year
strategy documents (see Europewebsite) but, again, it
is not clear how far these gobeyondpaper exercises to
paint a post hoc coherence over what remains under-
neath a fairly opportunistic collection of policies and
programmes. Specific indicators or measures are rare
(Ellinas and Suleiman, 2008, p. 713).
Turning to the growth of EU agencies, a recent
evaluation suggested that there is plenty still to do
if they are going to be firmly steered and effectively
evaluated by the Commission (Rambøll/Eur�eval/
Matrix, 2009). Finally, it should be mentioned
that the Regulatory Impact Assessment process
was recently given a fairly clean bill of health by
the European Court of Auditors, a body that has
often been quite critical of the Commission in the
past (European Court of Auditors, 2010).
Whether there has been any basic shift in the
bureaucratic and hierarchical culture of the Com-
mission therefore remains doubtful. There is a sense
inwhich the reforms have themselves been bureau-
cratized during implementation, so that the origi-
nal rhetorical emphasis on a more performance-
oriented approach has somewhat evaporated
under the welter of new rules about financial
procedure, internal audit, and personnel manage-
ment (Ellinas and Suleiman, 2008). However,
longer-term changes in the Commission’s culture
may comemore from the influx of ‘newblood’ with
different backgrounds, coming from the more
recent member states, than from specific reform
instruments (Ban, 2010b).
There was a formal evaluation of the earlier
(1995–9) SEM 2000 reform programme. The eva-
luators found that some significant progress had
been made in setting up financial units within
each DG, and in embedding evaluation as a regu-
lar practice. However, they were of the opinion
that the effectiveness of the implementation of
SEM 2000 is being undermined by some basic
problems which inhibit effective change (The
Evaluation Partnership, 1999, p. 4). These pro-
blems included a lack of ownership and leader-
ship, and a certain incoherence to the reform
programme itself. It might also be said that in
their original conception SEM 2000 and MAP
2000 were quite cautious and modest, if measured
against the standards of major public manage-
ment reforms in, say, New Zealand and the UK,
or even France, Sweden, or the USA. This may not,
however, be a fair yardstick. As this case file makes
clear, the Commission is in several crucial respects
quite unlike a national government.
It remains the case that the Commission is an
exceptionally complex organization, and one in
which it is extraordinarily difficult to formulate
and execute fundamental reform. It does not pro-
vide many services direct to citizens, being mainly
concerned with transferring funds to other bodies,
and with regulation and legislative initiatives.
Much of its work is carried on within tight legisla-
tive frameworks, which permit little discretion
to individual managers. The basic rules for setting
six-year budget totals through the Council
of Ministers (the ‘Financial Perspective’) create a
situation in which incentives for ‘savings’ and
‘efficiency’ have much less force than in some
national systems (the European Parliament has fre-
quently criticized the Commission for failing to
spend up to the hilt). Its multiculturalism and col-
legiate principles further militate against imple-
mentation of the kind of fast, single-track reforms
which have been possible in some of the NPM
countries.
THE EUROPEAN COMMISSION 261
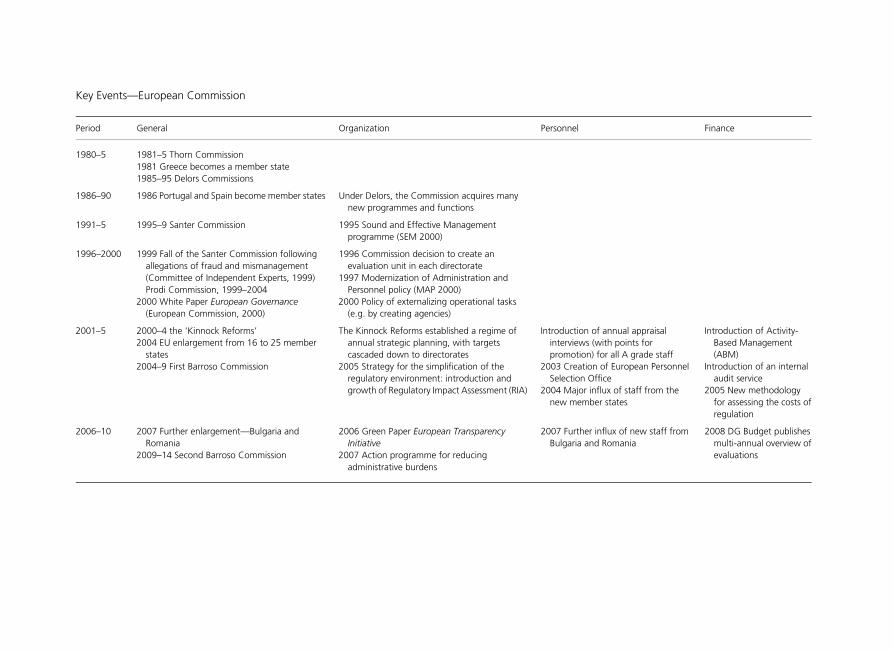
Key Events—European Commission
Period General Organization Personnel Finance
1980–5 1981–5 Thorn Commission
1981 Greece becomes a member state
1985–95 Delors Commissions
1986–90 1986 Portugal and Spain become member states Under Delors, the Commission acquires many
new programmes and functions
1991–5 1995–9 Santer Commission 1995 Sound and Effective Management
programme (SEM 2000)
1996–2000 1999 Fall of the Santer Commission following
allegations of fraud and mismanagement
(Committee of Independent Experts, 1999)
Prodi Commission, 1999–2004
2000 White Paper European Governance
(European Commission, 2000)
1996 Commission decision to create an
evaluation unit in each directorate
1997 Modernization of Administration and
Personnel policy (MAP 2000)
2000 Policy of externalizing operational tasks
(e.g. by creating agencies)
2001–5 2000–4 the ‘Kinnock Reforms’
2004 EU enlargement from 16 to 25 member
states
2004–9 First Barroso Commission
The Kinnock Reforms established a regime of
annual strategic planning, with targets
cascaded down to directorates
2005 Strategy for the simplification of the
regulatory environment: introduction and
growth of Regulatory Impact Assessment (RIA)
Introduction of annual appraisal
interviews (with points for
promotion) for all A grade staff
2003 Creation of European Personnel
Selection Office
2004 Major influx of staff from the
new member states
Introduction of Activity-
Based Management
(ABM)
Introduction of an internal
audit service
2005 New methodology
for assessing the costs of
regulation
2006–10 2007 Further enlargement—Bulgaria and
Romania
2009–14 Second Barroso Commission
2006 Green Paper European Transparency
Initiative
2007 Action programme for reducing
administrative burdens
2007 Further influx of new staff from
Bulgaria and Romania
2008 DG Budget publishes
multi-annual overview of
evaluations
FINLAND
A. Socio-economic forces: general
See Appendix A. Finland is a small country with a
relatively homogenous population and a fairly egal-
itarian culture. It has created an innovative, success-
ful economy, but its size and position (the extreme
north-eastern corner of Europe, with a long com-
mon border with Russia) make it highly vulnerable
to major downturns among its trading partners.
B. Global economic forces
See Table A.1 and discussion in Appendix A
(above). Although Finland entered the GEC in a
relatively strong position, it nevertheless suffered
a sharp contraction in the economy, and public
debt rose from 40.6 per cent of GDP in 2008 to
52.4 per cent in 2010.
C. Sociodemographic issues
See Appendix A. Finland faces the problems of an
ageing population which are present in the rest of
Western Europe, but to amore than average degree.
Between 2010 and 2050 the working-age popula-
tion is forecast to decline by 260,000 at the same
time as the population over 65 will grow by more
than 700,000. The government estimates that the
multiplication of the elderly will translate into a
need for 4,000 extra staff annually in municipal
health and social care services (OECD, 2010, p. 7).
Generally speaking Finnish society is relatively
homogenous and peaceful. There is a different eth-
nic group (the Saami people) in the far north (Lap-
land) but their numbers are small, and their
significance for a study of the reform of central gov-
ernment limited. In the last decade inward immigra-
tion from Russia has increased, and organized crime
seems to have begun to seep in.
D. National socio-economic policies
Finland enjoyed a good growth rate and relatively
low unemployment through most of the 1980s.
From 1991, however, the sudden collapse of trade
with its neighbour, the then Soviet Union, together
with the more general recession in the West,
sparked a severe economic crisis. Trade fell, banks
got into great difficulties, unemployment soared to
unprecedented heights (18.4 per cent in 1994).
Between 1990 and 1993 GDP volume fell by 12
per cent. Faced with these problems, central govern-
ment launched a strong programme of budgetary
reform and restraint. By 1997 growth had returned,
budgetary discipline was maintained, and Finland
was able fully to satisfy the Maastricht ‘convergence
criteria’ for EU monetary union. By the late 1990s
economic growth was once again healthy, although
there was some concern at the high reliance of the
economy on one firm—the mobile phone giant,
Nokia. The GEC hit Finland quite hard, but previ-
ous prudence had put the government in a position
where it ‘will have relatively more room for discre-
tionary fiscal stimulus in response to the pressures
of the economic and financial crisis compared to
most OECD countries’ (OECD, 2010, p. 6).
E. The political system
Finland is a unitary state, though with a strong
tradition of relatively autonomous municipal
government, protected by the constitution (like
Sweden). The basic pieces of legislation are the
Constitution Act (1919) and the Parliament Act
(1928). There is a multiparty political system and
governments are usually quite stable coalitions.
The Cabinet acts collegially, with the prime minis-
ter having less personal prominence than in the
‘Westminster’ systems of the UK and New Zealand.
Formally the power of execution lies with a Coun-
cil of State, consisting of governmentministers and
the Chancellor of Justice. There is a president, who
is elected every six years, retains some responsibil-
ity for foreign policy and is commander-in-chief of
the armed forces. In general it might be said that
the Finnish president, while considerably more
active and politically powerful than his/her Ger-
man counterpart, is also nothing like as dominant
as the French president. During the last fifteen
years or so it is the Prime Minister’s Office that
has tended to gain new responsibilities and
powers, while the President’s Office has not (see
Bouckaert, Ormond, and Peters, 2000).
The legislature (Eduskunta) is unicameral, with
200 seats. Eighty per cent of MPs tend also to be
FINLAND 263
municipal politicians—so the interests of the mu-
nicipalities are strongly represented at the centre.
The three big parties in recent years have been the
Social Democrats, the National Coalition (conser-
vatives), and the Centre Party (originally an agrar-
ian party). The reforming coalitions since the late
1980s have been led by the National Coalition
(Holkeri, 1987–91), the Centre Party (Aho, 1991–5),
and the Social Democrats (Lipponen’s ‘Rainbow
Coalition’, 1995–2003). From 2003 to 2010 (and
continuing) the Centre Party led the governing coa-
litions. TheCommunist Partywas a significant polit-
ical force during the 1960s and 1970s, but has since
lost most of its strength.
F. New management ideas
Finland has been an active member of many inter-
national organizations, both governmental and
academic (e.g. PUMA, European Group for Public
Administration). In that sense it has been open to,
and acquainted with, the full range of contem-
porary management concepts and techniques as
applied to the public sector (indeed, it prides itself
on this—see Ministry of Finance, 2010, p. 7). How-
ever, it has not slavishly followed fashions, but
rather carefully selected and piloted those ideas
considered suitable for Finnish needs. To take two
examples, TQM and ISO 9000 approaches to ser-
vice quality improvement were widely adopted in
Finnish local government and, in central govern-
ment, accruals accounting practices in other
countries were closely studied but then only partly
adopted. Finnish central government has not
made intensive use of management consultants
to implement reform (in the way that occurred in,
say, the UK). Consultants have been used to gather
information, and a number of foreign academics
have been used as advisers, but actual implementa-
tion has remained, for the most part, firmly in the
hands of career civil servants.
G. Pressure from citizens
We are not aware of any evidence pointing to
sustained pressure for specific reforms from the
Finnish public—or, indeed, for reversal of any of
the changes which have been implemented. Dur-
ing the 1980s and 1990s public attitudes towards
the state appear to have been mixed. On the one
hand, ‘Finns are a people very loyal to the state,
who see change as a governmental process rather
than a grass root level reform of the society’
(Centre for Finnish Business and Policy Studies,
1996, p. 2). The radically anti-state attitudes
which are common in the USA are rare in the
Nordic countries. On the other hand, there have
been a limited number of instances where popular
discontent has been manifested over specific as-
pects of the changes—for example, over the
closure of some small rural post offices and the
substitution of postal counters in local shops.
Senior officials are aware of the dangers of loss of
legitimacy (Holkeri andNurmi, 2002), and some of
them believe that administrative modernization,
including improvements in the quality of services,
openness to greater citizen participation, and visi-
ble efficiency will help contribute to sustaining
political stability and trust (see, e.g. High Quality
Services, Good Governance and a Responsible Civic
Society).
H. Party political ideas
Party political ideas per se have not had a big influ-
ence on public management reform in Finland. On
the contrary, reformshavebeenmainly theworkof a
fairly small elite of senior civil servants and a few
politicians. Media interest in the reforms has not
been particularly strong either (Ministry of Finance,
1997, pp. 73 and 81). Finland did not experience
strongly ideological governments with strong views
about changing the role of the state in the way that
theUSA did under President Reagan or theUKunder
Prime Minister Thatcher.
I. Chance events
The collapse of the Soviet Union at the beginning of
the 1990s had a significant, if indirect influence on
public management reform. By triggering economic
crisis it strengthened the hand of reformers, particu-
larly with respect to budgetary reform (e.g. the rapid
implementation of frame budgeting was seen as a
vital part of regaining control of public spending).
Butmost of the reforms (e.g. results-orientedbudget-
ing) were already firmly on the agenda, before the
economic downturn. The effects of GEC of 2008
could well be similar—to accelerate the implemen-
tation of ideas already in currency.
J. Elite decision-making
The process by which the first major Finnish re-
forms came into being from the late 1980s was
quite long drawn-out and cautious. It was not a
264 APPENDIX B: COUNTRY FILES AND TABLES OF EVENTS
matter of a few individuals passionately advocat-
ing specific ‘solutions’ (which would be unusual
anyway within the Finnish politico-administrative
culture), but rather the gradual, consensual
formation of a set of proposals for streamlining
the state apparatus and, after 1991, for restraining
expenditures in response to the sudden economic
downturn. Within this process some central
themes were the lightening of the bureaucratic
‘weight’ of central government (especially by re-
forming the national-level agencies), a shift from
input budgeting to a stronger focus on results, a
parallel shift to frame (block) budgeting for central
transfers to municipalities, and a commitment to
service quality improvement and some measure of
decentralization.
From the late 1990s there was discussion among
senior civil servants about the possibility of a second
wave of reform. This would involve a fairly compre-
hensive restructuring of central government into dif-
ferent relational categories (e.g. organizations where
the government was principally exercising the inter-
ests of an owner, organizations where the govern-
ment’s interest was as a direct service provider, and
so on). This then became coupled to a wider agenda,
embracing improved steering by ministries, e-gover-
nance, and strengthened citizen participation. Under
the second Lipponen administration (1999–2003)
ministers again became more directly and actively
interested in management reform, especially the
strengthening of the Prime Minister’s Office and the
improvement of horizontal coordination between
ministries. This theme of horizontal coordination
and the development of a stronger strategic (‘whole-
of-government’) capability continuedunder theCen-
tre Party governments of 2003–10.
K. The administrative system
For many years Finland, like Sweden, had an
administrative system consisting of ministries,
national-level boards (agencies) with considerable
powers of rule-making and detailed intervention,
and a municipal level. However, in the mid 1990s
the agency level was subject to reform, shrinking
its size and numbers and reorienting its role away
from detailed regulation (Ministry of Finance,
1995, pp. 1–2—see also Section L below). It should
be noted that, although this account is focused
principally on the central state, local (municipal)
government employs roughly three-quarters of the
public sector workforce.
The population of central ministries has been
fairly stable over the past two decades. In the
1990s there were twelve ministries and the Prime
Minister’s Office, which itself has the status of a
ministry (Prime Minister’s Office and Ministries,
1995). In 2008 the Ministries of Trade and Industry
and Labour were merged to create a Ministry of
Employment and the Economy (MEE). The Minis-
tries of Finance and the Interior are the two with
the most important responsibilities for administra-
tive reform. In 2008 sections of the Ministry of the
Interior with responsibility for regional and local
administration and municipal IT were transferred
to the Ministry of Finance. The latter has a budget
side and a governance side.
Traditionally, each ministry has independent
responsibility for implementation and control of
laws and policies within their own sphere so,
although the Ministry of Finance may be, in some
general sense, the most powerful ministry, it usu-
ally cannot impose its own programmes on other
ministries to the degree that has occasionally been
possible inmore centralized systems such as that in
France, New Zealand, or the UK. However, by
the beginning of the new century concern about
this relative lack of coordination was growing,
and a major report drew attention to the need for
better integration across government (Bouckaert,
Ormond, and Peters, 2000). A strengthening of
the Prime Minister’s Office, especially but not
exclusively with respect to EU coordination, was
one consequence of this debate. The theme of a
need for greater ‘horizontality’ continued through
to the time of writing, although the 2010 OECD
report on Finland indicated that the ministerial
‘silos’ were still strong.
There is a career civil service, and political and
‘mandarin’ careers are usually separate. However,
some of the top three levels of civil service
appointment used to go to known sympathizers
with particular political parties, according to a
kind of informal ‘quota’ system (Tiihonen, 1996,
p. 40). Since 2005 there have also been a number
of ‘political state secretaries’ who were appointed
only for the same duration as the minister, and
who helped him or her in policy preparation. The
permanent secretaries, however, remained the
administrative heads of the ministries. Not all
ministers had political state secretaries (9 out of
18 in 2005).
In the past, senior Finnish civil servants were
mainly lawyers, but this balance has shifted over
the past generation, with more people with a
FINLAND 265
training in economics or the social sciences being
recruited into senior posts. Public management
reform has been mainly an ‘insider’ process, with
senior civil servants playing a crucial role. External
consultants, although used for certain purposes,
have not been as influential as in, say, the UK or
the USA (Ministry of Finance, 1997, p. 74).
L. The contents of the reform package
There was much internal discussion of reform dur-
ing the early and mid 1980s, but the first major
initiatives came with the arrival in office of the
Holkeri government in 1987. The subsequent
decade was then a busy one, with several main
lines of reform unfolding simultaneously or in
sequence. The three changes of government
(1991, 1995, and 1999) did not appear to make
any dramatic difference to the general thrust of
the reforms, although possibly it could be said
that the level of political interest in management
reform (never overwhelmingly high among the
majority of politicians) declined somewhat after
1994, but then revived from the beginning of the
second Lipponen administration in 1999.
Themain lines of the first wave of reformwere as
follows (See the pamphlet Government Decision in
Principle on Reforms in Central and Regional Govern-
ment, 1993):
� Results-oriented budgeting was piloted from
1987 and rolled out to the whole government
from 1994. This required a number of potentially
important changes, including the definition of
results indicators for agencies (to enable their
performance to be assessed more explicitly by
their ‘parent’ ministries) and the creation of uni-
fied running costs budgets for ministries and
agencies. The pilot projects appeared to show
that significant running cost savings could be
achieved, but that some ministries were slow to
take up the challenge of using indicators as an
active form of performance management
(Summa, 1995).
� An Administrative Development Agency (later
retitled the Finnish Institute of Public Manage-
ment) was set up in 1987 to provide training and
consultancy to support reform. The Agency/
Institute has been obliged to operate along
increasingly commercial/self-financing lines. An
attempt to sell it off during the late 1990s/early
2000s failed, and at the time of writing it con-
tinues as a state-owned company.
� The transformation of a number of agencies with
commercial functions into, first, State Enter-
prises (twelve were created 1989–97) and then,
subsequently and in some cases, State-Owned
Companies. The law enabling the creation of
State Enterprises was passed in 1988. The further
transformation to state-owned joint stock com-
panies included Post and Telecommunications
and Railways.
� The introduction from 1993 of a framework bud-
geting system to control central government aid
to municipalities. This was partly a decentraliza-
tion measure, aimed at reducing the amount of
detailed central intervention in municipal deci-
sion-making, but it was also a way of gaining
firm control of the totals of municipal spending
at a time of great budgetary pressure, and of
delegating painful decisions about spending
priorities down to municipal leaders. The total
aid going to a givenmunicipality was henceforth
calculated as a lump sum based on the values
taken by certain indicators, such as the number
and age structure of the population. Later, frame-
work management was developed into ‘a central
procedure steering the preparation of the State
budget by the government’ (High Quality Services,
Good Governance and a Responsible Civic Society,
1998a, p. 10).
� A restructuring of the central agencies. This was
also a decentralization measure. The agencies
with commercial functions were turned into
State Enterprises (see above). Others were
merged or downsized, and their role was
changed from that of regulation to one of
providing research and development and evalu-
ation to the ministries. Their internal gover-
nance structures were also changed—usually
away from collegial forms towards more mana-
gerial and/or monocratic arrangements.
� Government data collection was streamlined
and barriers to data transfer between different
parts of the state were reduced.
� Regional state administration unified and light-
ened. The offices of different ministries at
regional level were combined.
� HumanResourceManagement reforms, including
provision for performance-related pay and for
more decentralized management of staff. The
main decisions and announcements here were
made during the Aho administration (1991–5)
but subsequent implementation was very slow.
� In 1998 it was announced that ‘The quality as
well as the citizen- and customer-orientation of
266 APPENDIX B: COUNTRY FILES AND TABLES OF EVENTS
the services will be developed by means of a new
type of Service Charters to be given to the custo-
mers’ [sic] (High Quality Services, Good Governance
and a Responsible Civic Society, 1998a, p. 15).
Thus the balance of the reforms leant towardsdecen-
tralization, simplification, and tighter control of
spending (Ministry of Finance, 1993; Puoskari,
1996). There was no great enthusiasm for wide-
spread privatization, although the Finnish govern-
ments were quite prepared to privatize selectively,
when it seemed tomake sense on its own terms (e.g.
the government printing company).
In the late 1990s a second wave of reform began.
Considerable emphasis was placed on improving
the quality of public services, and on encouraging
citizen participation (Holkeri and Nurmi, 2002). To
support this and other goals, a sophisticated
national electronic portal on the public sector was
developed and opened in 2002 (Romakkaniemi,
2001). There was also an attempt to tidy up some
of the ‘unfinished business’ from the first wave of
reforms, particularly the slowness of ministries to
engage in active, performance-oriented steering of
their agencies (Joustie, 2001). This had become a
hardy perennial—some ministries gave little prior-
ity to performance measures, and there seemed to
be no incentives for many managers to take them
seriously. For example, in 2003 an audit indicated
that only 9 per cent of agencies had approved pro-
ductivity targets (Ministry of Finance, 2006, p. 22).
A budget decree in 2004 emphasized the require-
ment of target setting and performance account-
ing, but it is not clear how fundamental the
changes flowing from this were. In 2010 the
OECD review still found a significant disconnect
between budgeting and strategy, as did the Finnish
National Audit Office (OECD, 2010; Poysti, 2010).
A new variant of this old problem has gained prom-
inence because of the need to set targets for ‘hori-
zontal’, joined-up programmes (see next
paragraph).
A strongly emerging theme from the early
2000s was the need for better horizontal coordina-
tion, and for a ‘whole-of-government approach’.
The strategy-forming machinery in the Prime
Minister’s department was reinforced, and a num-
ber of studies of future challenges (population
change, new technologies etc.) were carried out.
(Finland began producing an annual Government
Foresight Report for parliament as early as 1993.)
Yet all this forecasting and planning and reporting
evidently did not translate easily into action. In
2010 the OECD review concluded that: ‘The gov-
ernment’s whole-of-government vision is not
being realized at the operational level’ (OECD,
2010, p. 15). The Auditor General put it more
bluntly: ‘The Government’s Strategy Document is
not a genuine strategy’ (Poysti, 2010, p. 3).
M. The implementation process
Overall, the implementation process has been
gradual and deliberate, with pilot projects and
extensive training programmes to ensure the
smoothest possible implementation. One does
not get the sense of the hectic pace and urgency
which prevailed during, say, 1986–92 in New Zeal-
and or 1987–92 in the UK. Consider, for example,
the introduction of performance-related pay. Le-
gislation made this possible from the mid 1990s,
but by 2004 only a minority of civil servants were
in a PRP system (Ministry of Finance, 2006, p. 106).
By 2010 PRP was theoretically in place for 100 per
cent of government agencies, but there seems to be
little information about its effects in practice.
Unless there is slack in the budget (less and less
likely since the GEC) it is hard to offer significant
bonuses. And, in any case, the PRP has been intro-
duced by separate collective bargaining at each
agency, so the details of the schemes vary from
one organization to the next.
At the highest level, the coordination of the
reform programme was ensured by the creation of a
ministerial committee on which all the main politi-
cal parties in governmentwere represented (Ministry
of Finance, 1997, p. 69). Stability was also enhanced
by the long-term participation of a small number of
senior civil servants fromtheMinistry of Finance and
theMinistry of the Interior. One Finnish commenta-
tor went so far as to term the Finnish approach ‘tech-
nocratic’ (Puoskari, 1996, p. 105).
The shift from a Social Democratic-led coalition
(1995–2003) to a Centre Party–led coalition (2003–
present) did not fundamentally alter the way in
which public management reforms were shaped
and implemented. The process remained, by, say,
UK or French standards, a collective and relatively
gentle one.
N. Reforms actually achieved
The reforms mentioned above (Section L) were all
‘achieved’, in the sense that relevant legislation
was passed and new procedures were put in
place. What is harder to determine is how
FINLAND 267
vigorously the originally announced aims of the
reforms were pursued, and how far they were
eventually realized. In some cases (e.g. corporati-
zation of former agencies into enterprises and
then state-owned companies), change was unde-
niable and quite rapid. In others (e.g. the intro-
duction of a new personnel regime into the public
service), legislation has been passed, but the
implementation seems to have been fairly slow.
For example, a new system of job classification
and payment by results was first introduced in
the mid 1980s, but by 1997 covered only about
5 per cent of state employees (Ministry of
Finance, 1997, p. 78). It is also clear that persuad-
ingministries and agencies to adopt the spirit aswell
as the letter of results-oriented steering has been a
fairly long drawn-out business and that, more
recently, whole-of-government strategy-making
has not penetrated far down the line into opera-
tional matters.
The number of personnel financed directly
through the state budget fell by about 40 per cent
(from 213,000 to 130,000) between 1989 and 1995
(thanks partly to the creation of off-budget state
enterprises and companies, which accounted for
about 54,000 of the reductions). Since 1995 it has
continued at the lower level, and plans for the
future are to replace only one in every two civil
servants who retire.
At an early stage, the Finnish government sup-
ported a programme of evaluations of its reforms
(Holkeri and Summa, 1996). It is not clear that
these evaluations (for an example, see Pollitt et
al., 1997 and Ministry of Finance, 1997) have had
any clear and direct effect on subsequent decisions,
but the evaluation function has now been firmly
established in Finland as an ongoing component of
modern public management (see, e.g. Ministry of
Finance, 2006, pp. 115–29).
An interesting reflection on the major reforms of
the 1987–97 period appeared in the 1998 Govern-
ment Resolution High Quality Services, Good Gover-
nance and a Responsible Civic Society (1998a):
earlier administrative reforms have been experienced
to have increased the bureaucracy of administration.
The Government wants to ensure the democratic
development of the policy of governance . . . On all
administrative levels, the real possibilities of the citi-
zen to influence matters as well as openness and trans-
parency of administration will be increased. (p. 8)
In subsequent years this theme was intensified,
and became one of the main dimensions of
reform (Holkeri and Nurmi, 2002; Romakkaniemi,
2001).
Finally, we should mention the major OECD
assessment of Finland’s system of governance, pub-
lished in 2010 (OECD, 2010). This acknowledged
that Finland was basically a very well-governed
country—one which frequently came at or near
the top of international league tables for education,
health care, e-government, and so on. At the same
time, however, the OECD concluded that there
were rigidities in the system that could hamper
Finland in tackling the future challenges of demo-
graphic change, globalization, etc. In particular,
the OECD was of the view that:
While the government has put much effort into
strategic planning, its ability for collective commit-
ment to a shared vision is hampered by a lack of
horizontal collaboration in the development and
translation of strategic priorities. (OECD, 2010,
p.15)
268 APPENDIX B: COUNTRY FILES AND TABLES OF EVENTS
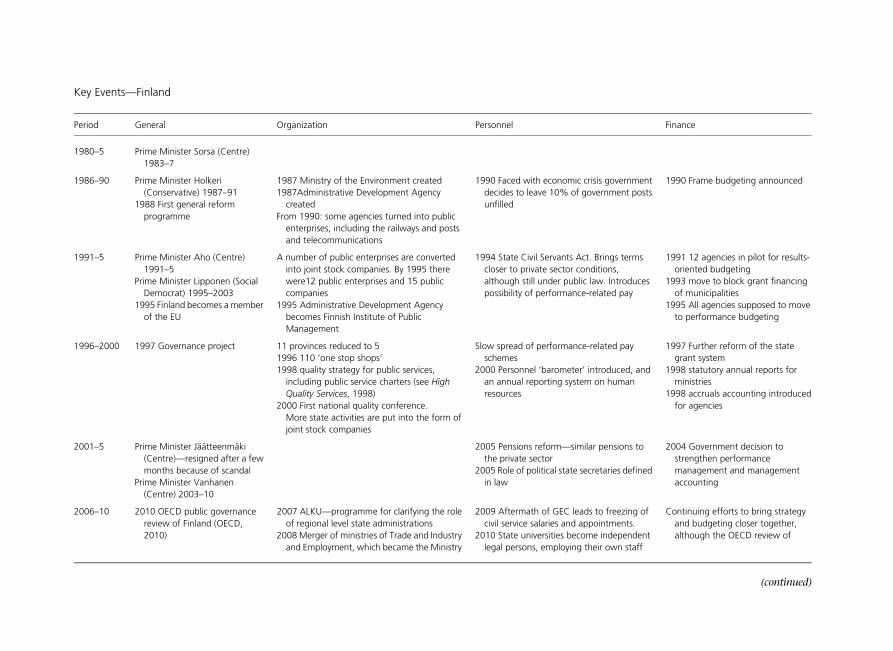
Key Events—Finland
Period General Organization Personnel Finance
1980–5 Prime Minister Sorsa (Centre)
1983–7
1986–90 Prime Minister Holkeri
(Conservative) 1987–91
1988 First general reform
programme
1987 Ministry of the Environment created
1987Administrative Development Agency
created
From 1990: some agencies turned into public
enterprises, including the railways and posts
and telecommunications
1990 Faced with economic crisis government
decides to leave 10% of government posts
unfilled
1990 Frame budgeting announced
1991–5 Prime Minister Aho (Centre)
1991–5
Prime Minister Lipponen (Social
Democrat) 1995–2003
1995 Finland becomes a member
of the EU
A number of public enterprises are converted
into joint stock companies. By 1995 there
were12 public enterprises and 15 public
companies
1995 Administrative Development Agency
becomes Finnish Institute of Public
Management
1994 State Civil Servants Act. Brings terms
closer to private sector conditions,
although still under public law. Introduces
possibility of performance-related pay
1991 12 agencies in pilot for results-
oriented budgeting
1993 move to block grant financing
of municipalities
1995 All agencies supposed to move
to performance budgeting
1996–2000 1997 Governance project 11 provinces reduced to 5
1996 110 ‘one stop shops’
1998 quality strategy for public services,
including public service charters (see High
Quality Services, 1998)
2000 First national quality conference.
More state activities are put into the form of
joint stock companies
Slow spread of performance-related pay
schemes
2000 Personnel ‘barometer’ introduced, and
an annual reporting system on human
resources
1997 Further reform of the state
grant system
1998 statutory annual reports for
ministries
1998 accruals accounting introduced
for agencies
2001–5 Prime Minister Jaatteenmaki
(Centre)—resigned after a few
months because of scandal
Prime Minister Vanhanen
(Centre) 2003–10
2005 Pensions reform—similar pensions to
the private sector
2005 Role of political state secretaries defined
in law
2004 Government decision to
strengthen performance
management and management
accounting
2006–10 2010 OECD public governance
review of Finland (OECD,
2010)
2007 ALKU—programme for clarifying the role
of regional level state administrations
2008 Merger of ministries of Trade and Industry
and Employment, which became the Ministry
2009 Aftermath of GEC leads to freezing of
civil service salaries and appointments.
2010 State universities become independent
legal persons, employing their own staff
Continuing efforts to bring strategy
and budgeting closer together,
although the OECD review of
(continued)
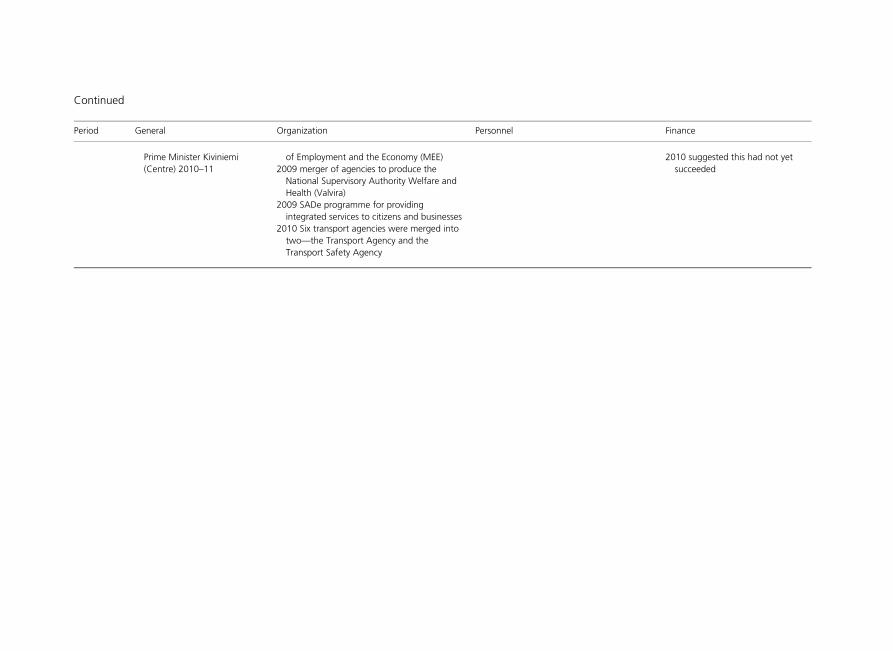
Continued
Period General Organization Personnel Finance
Prime Minister Kiviniemi
(Centre) 2010–11
of Employment and the Economy (MEE)
2009 merger of agencies to produce the
National Supervisory Authority Welfare and
Health (Valvira)
2009 SADe programme for providing
integrated services to citizens and businesses
2010 Six transport agencies were merged into
two—the Transport Agency and the
Transport Safety Agency
2010 suggested this had not yet
succeeded
FRANCE
A. Socio-economic forces: general
For general background, see Appendix A. France is
a large country (population 62.8 million in 2010)
in a central position in the most economically
advanced part of Europe.
B. Global economic forces
Again, see Appendix A for background.
Economic globalization brought increasing pres-
sure upon the previous system of state-directed ‘sec-
toral corporatism’ (Jobert and Muller, 1987). In
consequence there has been ‘a more general loss of
centrality of the state in social mediation and public
policy’ (Clark, 1998, p. 101). However, even if a
number of major state companies have been priva-
tized, the French state keeps significant minority
shareholdings in Renault, SNECMA, Air France-
KLM, EADS, and France Telecom. It also exercises
substantial continuing state control in EDF
(Electricit�e de France) andGDF (Gaz de France). Suc-
cessive governments have been seen to have had
very limited success in solving the problem of high
unemployment (well over 10% for most of the
1990s, and back to that figure in 2010).
C. Sociodemographic change
See Appendix A.
D. National socio-economic policies
Traditionally France has sought a somewhat greater
degree of state control over its economy than either
Germany or the UK. This stance has come under
increasing strain as the forces of economic globaliza-
tion appear to have favoured more open, competi-
tive economies, and as the EU has promulgated
common fiscal rules for members of the eurozone
(Jobert and Mueller, 1987). The continued failure to
‘solve’ France’s fiscal deficit was an important factor
behind the most important management reform of
the 2000s—LOLF (see below).
E. The political system
The French political system is distinctive, belong-
ing fully neither to the ‘majoritarian’ camp with
the UK and Australasia nor to the consensual
systems which prevail in the Netherlands and the
Nordic countries (see Chapter 3). Elections are ac-
cording to plurality and cabinets are usually one-
party or a minimal coalition, but these majoritar-
ian features are offset by the existence of a multi-
party system and a strong, directly elected
presidency.
During the period since 1980 there has been a
fairly frequent alternation of the parties in office,
with these sometimes matching the party identifi-
cation of the president but sometimes not (the
periods of cohabitation, as with the Chirac govern-
ment under President Mitterand, 1986–8, the Bala-
dur government, also under Mitterand, 1993–5
and the Jospin government under President
Chirac, 1997–2002). Obviously, all things being
equal, a President is stronger when his own party
also forms the government (e.g. under President
Chirac, 2002–7). Under Sarkozy (2007– ), the pre-
sidentiality of the French political system seems to
have become even stronger.
F. New management ideas
France has often been regarded as a country that
has been quite resistant to the NPM ideas which
emerged from the UK, the USA, and Australasia
from the early 1980s. France has continued its
own, distinctive thinking and rhetoric about
administrative reform, centred on the themes of
modernization and decentralization. However,
during the 1980s there was a shift towards neo-
liberal ideas within the elite at the Ministry of
Finance, albeit in the form of favouring the mod-
ernization of the public sector through private
sector methods, rather than maximum privatiza-
tion or the ‘hollowing out’ of the state (Clark,
1998, p. 103). The contractualization of public
services, stressed as a key component of Prime
Minister Jupp�e’s 1995 circular Reforme de l’Etat
et des services publics, was a reflection of this ten-
dency. From the beginning of the twenty-first cen-
tury ‘managerialist’ flavours strengthened further,
first as Chirac escaped from cohabitation in 2002,
and later even more, when the self-proclaimed
‘modernizer’, Sarkozy, became president in 2007.
Meanwhile, quietly and incrementally, NPM-type
ideas had gained ground within the Ministry of
Finance and some other departments (Bezes,
FRANCE 271
2010). Two significant indicators demonstrate a
shift towards new sources of ideas—first, that the
position and the numbers of the elite ‘corps’ have
decreased, and, second that the visibility of con-
sultancy firms has increased.
G. Pressure from citizens
Most political scientists have regarded France as
traditionally a state-centred system, where the
intensity and variety of pressure-group activity
has tended to be moderate in comparison with,
say, the USA or the UK. The system has tended to
sectoral corporatism rather than active pluralism,
that is, governments have done deals with a smal-
ler number of peak associations (big employers,
big unions), rather than being particularly perme-
able to a wider range of interest or issue groups.
Such deals have been facilitated by the frequency
with which members of the grands corps move
between government and business positions (pan-
touflage). Certainly, in respect of public manage-
ment reform, the pressures from the citizenry in
general appear to have been limited. Nevertheless,
there has been a general decline in public confi-
dence in the French system, and some popular
critiques of the rigidity of some public services
and of the corruption and remoteness of some of
the state elite.
Societal tensions on, for example, safety, urban
development, and migration resulted in a signifi-
cant protest vote for a far-right candidate during
the first round of the presidential elections in 2002.
The 2010 pension reform (which shifted the actual
pension age from 60 to 62 and the legal one from
65 to 67) is only the most recent reform attempt
that has been resisted by large-scale demonstra-
tions and strikes.
H. Party political ideas
In France neo-liberalism has been embraced by the
right (especially when Chirac was prime minister,
1986–8) but has been interpreted in a managerial
rather than a doctrinaire, anti-state fashion. This
has meant that the ‘modernization’ theme was also
acceptable (with some changes in the ‘filling’) by
governments of the left. The public service
‘renewal’ programme of 1989–93 was negotiated
with, and broadly supported by, the public service
unions. However, left and right parted company
over the desirability of reforms to social security
and central personnel regulation, where the
right’s attempts to push through changes sparked
major public service strikes during 1995 (Howard,
1998). Also education reform was high on the
agenda, causing major strikes in 2002. In the
later stages of Chirac’s presidency (2002–7) and
under Sarkozy (2007– ) market-favouring ideas
steadily gained ground. However, once the global
economic crisis broke in 2008, Sarkozy’s rhetoric
shifted to reaffirm the importance of the state,
and the dangers of allowing markets to be
deregulated.
I. Change events
On one view, the emergence of various cases of
corruption could be viewed as chance events
which have contributed to a crisis of confidence
in ‘an elite that had discredited itself’ (Howard,
1998, p. 201). From another perspective, however,
these cases are not so much one-off, chance events
as ‘business as usual’ within a system in which
certain forms of corruption and ‘croneyism’ had
become endemic.
J. Elite decision-making
This general loss of perceived legitimacy has been a
factor in encouraging the elite to launch such in-
itiatives as the public service charter (Ministere de
la Function Publique et des R�eformes Administra-
tives, 1992) and the L’ann�ee de l’accueil dans les
service publics (Ministere de la Fonction Publique,
1994). During the French presidency of the EU
(2000) there was an explicit focus on ‘the public
service: the social dialogue as a contribution to
improvement’.
The limited move towards neo-liberal ideas as a
basis for modernization has been mentioned
above. There has been a widely shared desire to
rehabilitate the reputation of the state apparatus,
but differences as to how this might best be done.
One line of tension is between the central politico-
administrative elite (Inspections des Finances, Cour
des Comptes, Conseil d’Etat) and the growing auton-
omy of the field services of ministries and the
regional and local authorities.
The division of opinion here is perhaps between
those who still believe that technocratic reforms,
imposed by the centre, can ultimately succeed, and
those who argue for a new andmore inclusive form
of political action. One view is that:
272 APPENDIX B: COUNTRY FILES AND TABLES OF EVENTS
The strikes of 1995 made clear what should have been
evident: France cannot be reformed by decree. Techno-
cratic solutions, however well conceived, are not possi-
ble in modern, individualist democracies. (Howard,
1998, p. 216)
What has been noticeable, however, is not only
that ‘Anglo-Saxon’ NPM ideas have been exten-
sively remodelled and relabelled for use in France,
but that the power struggles and debates over these
‘new’ ideas have played out very much within the
usual elite networks (Bezes, 2007; Eymeri-Dou-
zans, 2009). After 2002, however, private sector con-
sultants begin to form an increasing presence in
reform debates and reform planning. It is not yet
clear whether, in the longer term, they will become
a major player in state reform.
K. Administrative system
France has possessed a strong administrative tradi-
tion since at least Napoleonic times. Five main
features of the system as it existed in the late
1970s may be noted (Clark, 1998, pp. 98–100):
� A tradition of state direction of the economy and
society (dirigisme). As indicated above, this has
weakened, but is still more salient than in, say,
Germany or the UK.
� Centralized direction of the state apparatus by
two sets of grands corps. The first set are adminis-
trative and comprise the Inspection des Finances (a
kind of financial inspectorate), the Conseil d’Etat
(the Council of State—a supreme administrative
court) and the Cour des Comptes (the national
audit office). This group recruit their members
(Enarques) from the prestigious Ecole Nationale
d’Administration (ENA). The second set are tech-
nical (e.g. Ponts et Chauss�ees) and recruit from the
Ecole Polytechnique via various Grandes Ecoles.
Members of the grands corps enjoy highly mobile
careers and frequently take up top executive po-
sitions in the private sector or, indeed, in politics.
For example, up to 1993, eight of the previous
eleven prime ministers had been civil servants.
And between 1997 and 2002 the president, the
prime minister, and the ministers for finance and
economic growth, foreign affairs, defence and the
interior, justice, social affairs and employment,
and the civil service were all Enarques! This elite
group has long had ‘low permeability’ to ‘outsi-
ders’ (Bezes, 2010).
� A strong central presence subnationally through
the presence of a prefet (prefect) and many local
units of central ministries (deconcentrated State
services) in each departement and region. The
prefect coordinates the deconcentrated State ser-
vices and also has, since 1982, a steering author-
ity. He/she is the representative of central
government and used to hold a direct supervi-
sory authority (tutelle) on the budgets of the local
authorities. In 1982, prefects lost the direct
supervisory authority over local administrative
decisions. Since then regional and local author-
ities have gained a good deal of independence,
although prefects have alsomoved to try tomake
the deconcentrated services they control techni-
cally indispensable to local authorities. The
authority and determining position of the
Regional Prefectures over the Departmental Pre-
fectures was confirmed by a decree in February
2010. Since the regional prefects are (according
to the LOLF) also regional budget holders, poten-
tially they become strongholds for the reform of
the territorial state.
� Division of the civil service into a large number
of corps (1,800 at the end of the 1980s) each with
its own educational entry requirements and its
own set of hierarchically arranged posts, defined
by a general civil service law, and its own profes-
sional esprit. This feature of the French admin-
istrative system has proved a source of
considerable rigidity and resistance in the con-
text of management reform. By 2010, however,
the political and administrative position of the
‘corps’ seems to be in decline.
� The importance of a special body of administra-
tive law in regulating administrative procedures
and appointments. The French system ‘is a “legal
model” in the sense that it is regulated by legal
rules which conceive the state administration as
inhabiting an autonomous domain apart from
civil society’ (Clark, 1998, p. 100). The ‘weight
of legal entrenchment’ (Bezes, 2010, p. 160) has
usually acted as a break on management reform.
Each of these five features has come under strain
during the last twenty years, but the moderniza-
tion process thus far has probably made greater
impact on the first and third than the other three.
L. Contents of the reform package
Initially, there was no one, single package that
lasted for very long, but rather a series of separate
initiatives by different governments which could,
at best, be said to be grouped around certain broad
FRANCE 273
themes. The two most prominent were, first,
decentralization and deconcentration and, second,
modernization. The strategic shift towards decen-
tralization came in the mid 1980s, when the social-
ist government under President Mitterand
removed the prefects’ tutelle and created local col-
lectivities as autonomous authorities. Direct elec-
tions were established for regional councils, and
legislation during 1982 gave local collectivities sig-
nificant new taxing and budget-making powers.
The ripples spreading out from this deep change
have continued through to the present (de Mon-
tricher, 1996), and have been amplified by the ef-
fects of EU regional policies: ‘Decentralization
seems to be a never-ending story in the French
context’ (Bezes, 2010, p. 166). The ‘deconcentra-
tion charter’ of 1992 marked a further step in shift-
ing authority from the centre to the periphery. In
the French context:
decentralisation means transfer of authority from the
central state to regional and local governments.
Deconcentration means devolution of competence
and managerial authority to the local administrative
units of central government . . . as well as the agencies.
(OECD, 1997, p. 67)
Autonomy in personnel management, in budget
management, and for administrative decisions
has been transferred to the deconcentrated states
services and the prefects. The main purpose was
the promotion of a better policy coordination at
the deconcentrated level (Albertini, 1998, pp. 145–
56). Initiatives have been taken and new policy
instruments have been introduced for a better in-
terminist�erialite: extension of the coordination’s
mission of the prefects (1999), creation of a college
of the chefs de service (directors of a deconcentrated
state service), creation of discussion platforms
between deconcentrated state services (poles de
competences), introduction of a strategic approach
at the regional level (1999), etc. In 1997, manage-
ment autonomy was given to several national
management support services by the creation of a
new kind of internal agency: the Services of
National Scope.
The second theme—modernization—came to
prominence under Prime Minister Rocard in
1989, although earlier discussions and initiatives
had occurred throughout the 1980s. In February
1989 Rocard issued an important circular entitled
Renouveau du service publicwhich contained a series
of initiatives: the creation of responsibility centres
(Centres de responsabilite—CDRs) within ministries,
personnel reforms, greater emphasis on decen-
tralized management of field services and res-
ponsiveness to public service users, and the
institutionalization of policy evaluation across
many sectors of government. Renewal—or
modernization—continued under the succeeding
Cresson and B�er�egovoy governments. In 1995
Prime Minister Jupp�e issued a circular, Reforme de
l’Etat et des services publics, which proposed the
reorganization of certain field services and an
experiment in contractualizing the relationship
between central ministries and their field services.
The Jospin government set up several objectives on
the second step of the Reforme de l’Etat (1997–
2002): permanent evaluation of public policy,
modernization of the deconcentrated level, mod-
ernization of the prefect’s tasks, introduction of the
strategic management, better transparency in pub-
lic administration, better responsiveness to
citizens’ wishes and demands, and e-government.
Thus ‘the successive phases of “administrative
modernization” have been characterized by a
broad continuity of policy, rather than by partisan
differences between governments of the Left and
the Right’ (Clark, 1998, pp. 106–7; Cole and Jones,
2005).
A third theme—one characterized by much
greater divergence between the parties which
held power—was that of privatization. During the
period of the socialist government of 1981–6
extensive nationalizations were carried though
(exactly the opposite of the trend which was
beginning to develop in the UK). However, the
neo-liberal government of Chirac (1986–8)
reversed this, listing sixty-five companies that
were to be sold off. During a relatively short period
in office nearly 300,000 industrial workers and
100,000 bank staff were ‘privatized’ (Wright,
1989, p. 105). This flurry came to an end with
the return of left governments in 1988, but when
the right regained power in 1993, significant pri-
vatization resumed (e.g. steel in 1995). Despite,
the left-wing label, the Jospin government sold
assets of public companies (e.g. Credit Lyonnais
and France Telecom) to the private sector. However,
the critics inside the socialist party after the presi-
dential election in 2002 showed that a majority of
the left political world remained opposed to fur-
ther privatizations. In 2005 Electricit�e de France,
said to be the world’s largest utility company, was
partially floated on the stock exchange. However,
the state retained more than 80 per cent of the
shares. Overall, the period since 1980 has seen a
274 APPENDIX B: COUNTRY FILES AND TABLES OF EVENTS
significant fall in the public sector’s share of the
French labour force.
In 2001 the Loi Organique relative aux Lois de
Finances (LOLF) introduced programme budgeting
and a connected system of performance indicators
(the whole package was supposed to be implemen-
ted by 2006). Initially the budget was divided into
34 missions and 168 programmes. LOLF was a
framework law or constitutional by-law, the pas-
sage of which required extensive agreement
between legislature, executive, and presidency dur-
ing a period of cohabitation, and was widely
regarded as something of a miracle (Corbett,
2010). It ‘triggered a process of managerialization’
(Ongaro, 2009, p. 204). It also represented a sys-
tematization or ‘roll out’ of various reform tenden-
cies that had been emerging since the early 1990s
(Bezes, 2007). LOLF was initially focused on
improving the executive’s budgetary accountabil-
ity to the legislature, but in practice it also became a
vehicle for internal changes which devolved bud-
getary responsibility within a strengthened mana-
gerial hierarchy (Bezes, 2010).
From about 2000 on, three reform movements,
initially disconnected, seem to have developed in a
converging and mutually strengthening direction
(see also Bouckaert et al., 2010, Chapter 9). First,
came the LOLF (2001), which revamped the finan-
cial steering, control, and potential evaluation
from a vast number of single line items to a limited
number of missions and programmes. Second, was
the RGPP (2007) which combined a presidentially
guided policy review agenda with tough savings,
and ultimately also a ministerial restructuring
focused on efficiency and productivity. Third, has
come the territorial reform of the French state,
where regions were created and the regional prefect
has the leading and coordinating capacity for de-
concentrated, regional, and departmental activ-
ities. Decrees from 1964 and 1982 were replaced
by the decree of 2004 and the crucial one of 2010.
This resulted in reshuffled regional prefectures that
establish strategic plans, but also in one-stop-shops
and multitasking administrations. Ultimately, the
LOLF (missions/programmes and budget holders)
facilitates the horizontal and vertical logic of restruc-
turing organizations (merging ministries and
regional prefectural departments) and their activ-
ities, which are then reviewed by the RGPP.
M. Implementation process
The French reforms have been implemented in a
fairly piecemeal way, with different initiatives
coming from different ministries at different
times, and a good deal of successive ‘re-packaging’
of some basically similar ideas (e.g. about being
more responsive to citizen-users). For example,
CDRs were pushed much further in some minis-
tries than in others (Trosa, 1995). However, the
grands corps appear to have remained in control of
most of the changes (at least until very recently—
see Eymeri-Douzans, 2009), and their central roles
have not been seriously undermined (Corbett,
2010; Rouban, 1996, pp. 154–5).
Prime ministers have often played a leading role
in reforms, especially Chirac, Rocard, Jupp�e, and
Jospin. The procedural device of the circular has
beenmuch resorted to. Theministries most heavily
involved have been the Ministry of Public Service
(which has undergone several changes of name),
the Ministry of Finance, and the Ministry of the
Interior (patron ministry for the prefects, and
heavily involved in decentralizatiuon and decon-
centration reforms). From 2008 the merged and
enlarged Ministry of Budget, Public Accounts, and
Civil Administration, and the mega Ministry
MEEDDAT (Environment, Energy, Sustainable
Development, and Planning), have clearly become
dominant forces.
In practice it seems that reform implementation
has often moved more smoothly and quickly in
technical ministries and field services than else-
where (Cole and Jones, 2005).
N. Reforms actually achieved
Despite the construction, after 1989, of an elab-
orate network of evaluation institutions (Duran,
Monnier, and Smith, 1995), there seems to have
been no across-the-board systematic evaluation
of French management reforms. There have,
however, been some assessments of particular as-
pects, for example the 1996 Cour des Comptes
report on CDRs, the 2002 Ministry of Public Ser-
vice report on the Public Establishments (exter-
nal agencies), and the 2002 Interministerial
Delegation on the Reform of the State report
on the contractualization, and the 2003 Court
of Audit report on administrative deconcentra-
tion and the reform of the state (Cour des Comp-
tes, 2003).
Less formal assessments have been made by
some academics (e.g. Bezes, 2010; Clark, 1998; de
Montricher, 1996; Flynn and Strehl, 1996; Rou-
ban, 1996) and by some officials (Trosa, 1995,
1996). In general, it might be said that outcome
data is hard to come by, but that, thematically,
FRANCE 275

French governments have held more closely to the
values of a strong administrative state committed
to some form of strategic planning than has
Australia, New Zealand, or the UK. Significant
modernization has taken place, and the decentral-
ization reforms of 1982 seem to have been a gen-
uine political and managerial watershed. The 2002
LOLF reforms aimed at bringing budgeting,
accounting, and performance measurement
within a single, programmatic framework were
also undoubtedly an important step (Bezes, 2010;
Corbett, 2010; Trosa, 2002—see below for details).
However, much of the machinery of a centralized
civil service remains fundamentally unaltered. In
particular, centralized control of personnel still
survives. Partly because of these constraints, the
experiments with organizational diversity and
user-responsiveness, though certainly substantial,
have been somewhat less pervasive than in Aus-
tralasia or the UK.
276 APPENDIX B: COUNTRY FILES AND TABLES OF EVENTS
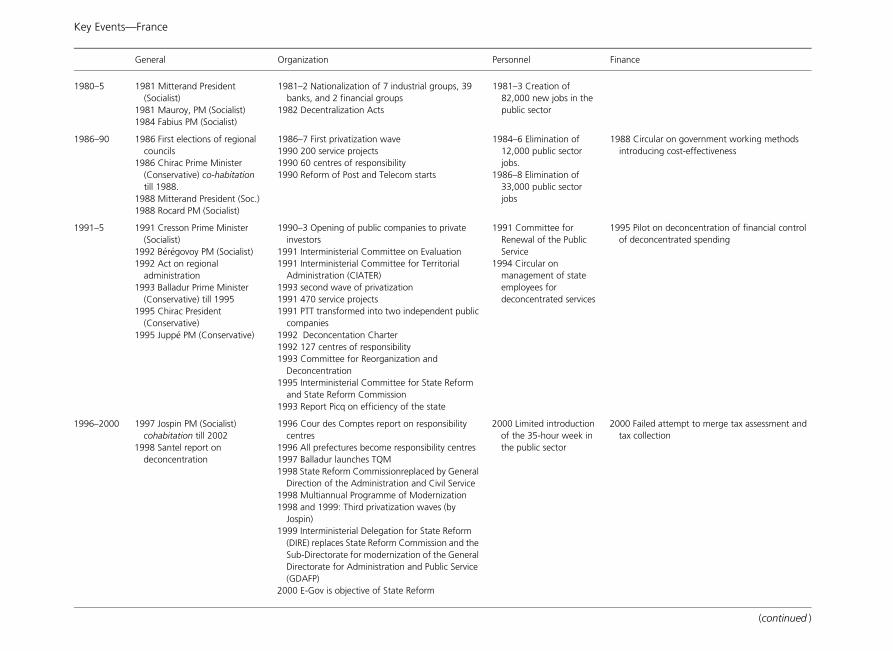
Key Events—France
General Organization Personnel Finance
1980–5 1981 Mitterand President
(Socialist)
1981 Mauroy, PM (Socialist)
1984 Fabius PM (Socialist)
1981–2 Nationalization of 7 industrial groups, 39
banks, and 2 financial groups
1982 Decentralization Acts
1981–3 Creation of
82,000 new jobs in the
public sector
1986–90 1986 First elections of regional
councils
1986 Chirac Prime Minister
(Conservative) co-habitation
till 1988.
1988 Mitterand President (Soc.)
1988 Rocard PM (Socialist)
1986–7 First privatization wave
1990 200 service projects
1990 60 centres of responsibility
1990 Reform of Post and Telecom starts
1984–6 Elimination of
12,000 public sector
jobs.
1986–8 Elimination of
33,000 public sector
jobs
1988 Circular on government working methods
introducing cost-effectiveness
1991–5 1991 Cresson Prime Minister
(Socialist)
1992 B�er�egovoy PM (Socialist)
1992 Act on regional
administration
1993 Balladur Prime Minister
(Conservative) till 1995
1995 Chirac President
(Conservative)
1995 Jupp�e PM (Conservative)
1990–3 Opening of public companies to private
investors
1991 Interministerial Committee on Evaluation
1991 Interministerial Committee for Territorial
Administration (CIATER)
1993 second wave of privatization
1991 470 service projects
1991 PTT transformed into two independent public
companies
1992 Deconcentation Charter
1992 127 centres of responsibility
1993 Committee for Reorganization and
Deconcentration
1995 Interministerial Committee for State Reform
and State Reform Commission
1993 Report Picq on efficiency of the state
1991 Committee for
Renewal of the Public
Service
1994 Circular on
management of state
employees for
deconcentrated services
1995 Pilot on deconcentration of financial control
of deconcentrated spending
1996–2000 1997 Jospin PM (Socialist)
cohabitation till 2002
1998 Santel report on
deconcentration
1996 Cour des Comptes report on responsibility
centres
1996 All prefectures become responsibility centres
1997 Balladur launches TQM
1998 State Reform Commissionreplaced by General
Direction of the Administration and Civil Service
1998 Multiannual Programme of Modernization
1998 and 1999: Third privatization waves (by
Jospin)
1999 Interministerial Delegation for State Reform
(DIRE) replaces State Reform Commission and the
Sub-Directorate for modernization of the General
Directorate for Administration and Public Service
(GDAFP)
2000 E-Gov is objective of State Reform
2000 Limited introduction
of the 35-hour week in
the public sector
2000 Failed attempt to merge tax assessment and
tax collection
(continued )
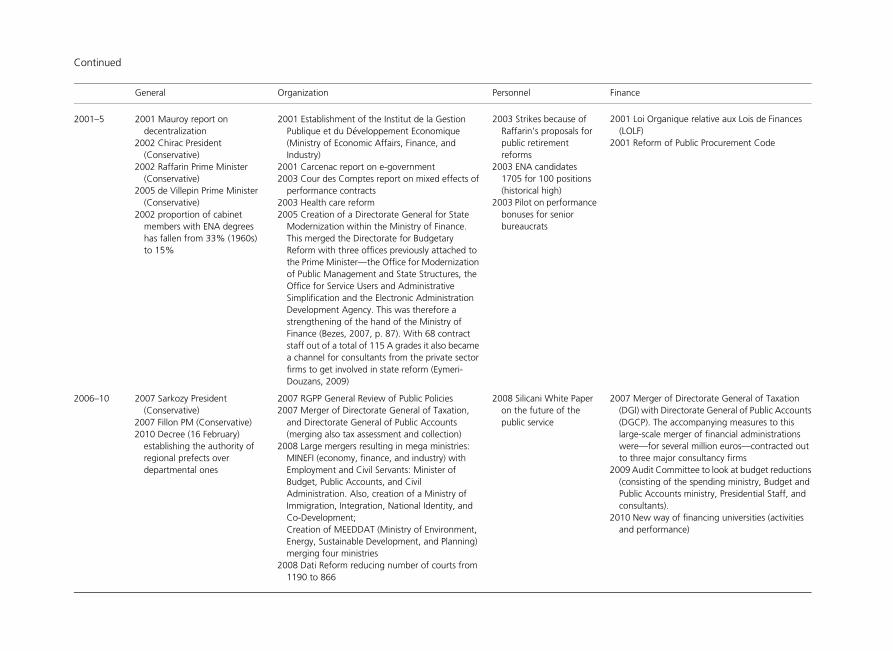
Continued
General Organization Personnel Finance
2001–5 2001 Mauroy report on
decentralization
2002 Chirac President
(Conservative)
2002 Raffarin Prime Minister
(Conservative)
2005 de Villepin Prime Minister
(Conservative)
2002 proportion of cabinet
members with ENA degrees
has fallen from 33% (1960s)
to 15%
2001 Establishment of the Institut de la Gestion
Publique et du D�eveloppement Economique
(Ministry of Economic Affairs, Finance, and
Industry)
2001 Carcenac report on e-government
2003 Cour des Comptes report on mixed effects of
performance contracts
2003 Health care reform
2005 Creation of a Directorate General for State
Modernization within the Ministry of Finance.
This merged the Directorate for Budgetary
Reform with three offices previously attached to
the Prime Minister—the Office for Modernization
of Public Management and State Structures, the
Office for Service Users and Administrative
Simplification and the Electronic Administration
Development Agency. This was therefore a
strengthening of the hand of the Ministry of
Finance (Bezes, 2007, p. 87). With 68 contract
staff out of a total of 115 A grades it also became
a channel for consultants from the private sector
firms to get involved in state reform (Eymeri-
Douzans, 2009)
2003 Strikes because of
Raffarin’s proposals for
public retirement
reforms
2003 ENA candidates
1705 for 100 positions
(historical high)
2003 Pilot on performance
bonuses for senior
bureaucrats
2001 Loi Organique relative aux Lois de Finances
(LOLF)
2001 Reform of Public Procurement Code
2006–10 2007 Sarkozy President
(Conservative)
2007 Fillon PM (Conservative)
2010 Decree (16 February)
establishing the authority of
regional prefects over
departmental ones
2007 RGPP General Review of Public Policies
2007 Merger of Directorate General of Taxation,
and Directorate General of Public Accounts
(merging also tax assessment and collection)
2008 Large mergers resulting in mega ministries:
MINEFI (economy, finance, and industry) with
Employment and Civil Servants: Minister of
Budget, Public Accounts, and Civil
Administration. Also, creation of a Ministry of
Immigration, Integration, National Identity, and
Co-Development;
Creation of MEEDDAT (Ministry of Environment,
Energy, Sustainable Development, and Planning)
merging four ministries
2008 Dati Reform reducing number of courts from
1190 to 866
2008 Silicani White Paper
on the future of the
public service
2007 Merger of Directorate General of Taxation
(DGI) with Directorate General of Public Accounts
(DGCP). The accompanying measures to this
large-scale merger of financial administrations
were—for several million euros—contracted out
to three major consultancy firms
2009 Audit Committee to look at budget reductions
(consisting of the spending ministry, Budget and
Public Accounts ministry, Presidential Staff, and
consultants).
2010 New way of financing universities (activities
and performance)
GERMANY
A. Socio-economic forces: general
Germany is by far the biggest and most populous,
as well as one of the richest, of the eight European
states in this book. See Appendix A.
B. Global economic forces
Again, see Appendix A. Germany is heavily
engaged in international trade and is almost alone
in Europe in maintaining a large export sector in
manufactured goods. It was one of the hardest hit
in the early stages of the GEC (see Table A.2) but
was subsequently one of the EU economies to
recover most rapidly (2009–10).
C. Sociodemographic forces
Although there were some pressures which
affected all three levels of German administration
(e.g. the huge challenge of integration with the
former German Democratic Republic from 1990),
many social problems are dealt with mainly by
local authorities. These include high rates of
unemployment with more people depending on
social welfare benefits which are provided by local
authorities. Citizens have also become more
demanding and more self-confident in their rela-
tionship with public services, many of which are
provided by local authorities. Local government is
therefore under much greater pressure to intro-
duce improved services for citizens. Furthermore,
due to increasing competition for production
facilities, local authorities are involved in policies
of regional economic development, and have to
provide new services for business communities
(R€ober, 1996, p. 175).
One problem for government at all levels has
been the high rate of immigration and asylum
seeking which Germany has experienced. This
has led to racial tensions, especially in some parts
of the east. Table A.8 shows that Germany has one
of the highest percentages of foreign-born resi-
dents in our set of twelve countries.
D. National socio-economic policies
Compared to the EU norm, Germany still has a large
manufacturing sector. This results in significant
competition with the USA and the Asian countries.
Prior to the introduction of the euro in 2001, the
German currency, the DM, had been one of the
strongest in the world. Monetary policy had been
directed by the Bundesbankwhich developed its pol-
icy independently from the political executive, and
which served as a model for the new European Cen-
tral Bank.Germany is a countrywith a strong corpor-
atist tradition, in which firms and banks and trade
unions have tended to work closely together. How-
ever, Germany’s poor economic performance since
2000 brought these arrangements into question. At
the time of writing Germany appears to have made
the strongest recovery from the GEC in the EU, but
some analysts question whether this can be sus-
tained—in which case the pressure for fundamental
labour market reforms is likely to return.
E. The political system
The German system is a chancellor model (Kanz-
lerdemokratie), which means that the chancellor is
above other ministers and is more than the primus
inter pares. The president has a primarily symbolic
function, unlike the French or even (to a lesser
extent) the Finnish president.
At the federal level there are two major parties,
the Christian Democratic Union of Germany
(CDU/Christian Social Union CSU) and the Social
Democratic Party (SPD). Except for the big coali-
tion between CDU/CSU and the SPD from 1966 till
1969, federal politics were dominated by coalitions
of CDU/CSU with the small free liberal party (FDP)
from 1946 until 1966, and again from 1982 till
1998. There was also a coalition of the SPD with
the FDP from 1969 until 1982. At the L€ander level
the SPD and the Greens have formed coalition
governments, and in 1998 for the first time they
became part of a federal coalition.
The smaller parties are:
� The FDP (Free Democratic Party) which never
went beyond 10 per cent of the national vote but
has always been important as a coalition partner
for either the CDU or the SPD. After the unifica-
tion of Germany its relative share of votes
decreased, because of a lack of programme and
leadership.
GERMANY 279
� The Greens started as a movement and turned
into a political party. As a consequence they still
have twomajor tendencies, ‘fundamentalists’ and
‘realists’. Themore it becomes feasible to join gov-
ernments, the more influence the ‘realos’ seem to
have. The Greens are part of some L€ander and of
the post-1998 federal governments.
� The former communists, the Party of Democratic
Socialism PDS (former SED) has gained momen-
tum, especially in former East Germany.
To get into the federal Parliament (Bundestag) polit-
ical parties have to have a minimum of 5 per cent
of the votes. This eliminates the smaller parties and
sometimes posed problems for the FDP and the
Greens. The voting system is mixed. The first vote
(Erststimme) is majoritarian, and the second vote
(Zweitstimme) is proportional.
F. New management ideas
The German changes could be characterized more
by administrative tightening up and moderniza-
tion than by marketization or minimization
(Derlien, 1998). The German trajectory has also
beenmarked more by incrementalism (‘permanent
flexibility of institutional frameworks’) than by
fundamental change (Benz and G€otz, 1996, p. 5),
and more by improvement of the existing system
than an import of other systems (K€onig, 1997;
Bach and Jann, 2010).
At the local level, where most management re-
forms have taken place, new management ideas
were promoted by the Local Management Co-op or
the ‘Joint Local Government Agency for the Sim-
plification of Administrative Procedures’ (Kommun-
ale Gemeinschaftstelle f€ur Verwaltungsvereinfachung,
KGSt). The KGSt is an independent consultancy
agency organized by a voluntary membership of
municipalities, counties, and local authorities with
more than 10,000 inhabitants.
Following the Tilburg model from the Nether-
lands, the KGSt propagated a modern system of
local government, which was labelled the ‘New
Steering Model’ (Das Neues Steuerungsmodell). The
main characteristics of this model are ‘clear-cut
responsibilities between politics and administra-
tion, a system of contract management, integrated
departmental structures and an emphasis on out-
put control’ (R€ober, 1996, p. 176; see also Klages
and L€offler, 1996, p. 135). Elements of this ‘New
Steering Model’ have been applied in a growing
number of big cities and counties, and during the
1990s a variety of participatory innovations were
also made at local levels, especially the use of local
referenda (Wollmann, 2001).
On the whole, therefore, changes in Germany
have been informed by ideas developed within the
public sector, rather than by private sector man-
agers or ‘gurus’. One partial exception to this is the
field of quality improvement, where TQM ideas
have exerted a significant influence.
G. Pressure from citizens
The focus on democracy and citizen participation
was always very present in Germany and was
labelled as Ausserparlamentarische Opposition
(APO—citizen opposition outside parliament).
The fact that the CDU/CSU was in power for
almost twenty years encouraged leftist intellec-
tuals to organize themselves to fight government
policies and to protect democracy outside the leg-
islature. Since the SPD joined government, first as
part of the Big Coalition, then as the ruling party
in the 1970s, the APO was weakened. In the 1970s
the pressure from citizens resulted in Citizen In-
itiatives (B€urgerinitiativen), where citizens gathered
and tried to approach political parties, administra-
tions, and institutions in a more positive way.
Thousands of initiatives were taken in the fields
of public infrastructures, environmental matters,
housing, transport, or education. In the 1990s
there was the important new development of
local referenda, which became widely used
(Wollmann, 2001). However, the vast majority of
these initiatives have been pitched at a local level,
and it has to be remembered that Germany is a
highly decentralized country, in which most pub-
lic services are provided by subnational authorities
(see Table 3.2).
H. Party political ideas
There is little radical challenge to the Rechtsstaat
and the basic functioning of the system. The con-
cept of modernization does not embrace the kinds
of radical reforms which have been attempted in
New Zealand and the UK. It is usually the product
of agreements made betweenmanagement and the
trade unions (R€ober and L€offler, 1999). The talk of a
‘slim state’, which was popular at the end of the
Kohl Chancellorship, did not in fact result in any
major changes at the federal level (Sachverst€andi-
genrat ‘Schlanker Staat’, 1997).
280 APPENDIX B: COUNTRY FILES AND TABLES OF EVENTS
In 1992 the then candidate Chancellor Engholm
(SPD) released a managerialist public sector reform
paper. In 1993 there was a similar party paper by the
ruling Christian Democrats. In general, specifically
party political ‘lines’ on administration seem to be
absent. Party political ideas are not developed at the
federal level but basically at the state and local levels
since the electoral process is focused at these levels.
This results in sometimes diverging visions and prac-
tices according to specific situations, which are then
not translated in a common federal party line.
I. Chance events
At the end of the 1970s the Baader-Meinhof Group
(Red Army Faction, RAF) carried out terrorist acts
against representatives of the political, industrial,
and administrative establishment. This resulted in
a discussion on the presence and the removal of
‘extremists’ in the public service (Berufsverbot). This
included a concern to neutralize civil servants who
had been Nazis, or Communists, as well as sym-
pathizers with the terrorist RAF.
From 1990 German unification caused serious
pressure at all levels and aspects of society (though
whether this can really be deemed a ‘chance event’
is debatable). Financially, there was the political
decision to equate the eastern and western Deutsch
Mark. The ‘Treuhandanstalt’ organized the privati-
zation of most of the East Germany economy and
the resulting unemployment had to be absorbed by
the social security system. The former DDR admin-
istrative systemwas reformed according to the BRD
system, and even the location of the capital
changed from Bonn to Berlin. The transformation
of local government in East Germany was ‘between
imposed and innovative institutionalization’
(Wollmann, 1997). However, the main thrust of
unification was not to experiment with new
forms of administration but was rather to extend
the West German system to the East.
J. Elite decision-making
At present, the perspective of the state as a provider of
services remains predominant inGermany.However,
the 1993 federal plan for the elderly of 1993 was a
first indication that the German state may increas-
ingly act as facilitator rather than as a direct provider,
and there have been a number of further moves in
this direction. Nevertheless, the idea of local au-
thorities as multifunctional providers has probably
remained more closely intact than in most other
western European countries – certainly more than,
for example, in the UK or the Netherlands.
The legal status of the civil service has always
been a political issue of administrative reforms.
The constitutionally guaranteed status of civil ser-
vants remains untouched and is unlikely to change
fundamentally (partly because so many German
MPs are themselves civil servants):
[T]he question whether to impose a national adminis-
trative reform program from above or whether to leave
freedom for local and sectoral initiatives is only a theo-
retical one in the Federal Republic of Germany, where
federal structure and tradition by nature forbid a centra-
lized approach to administrative reforms.
(Klages and L€offler, 1996, p. 143)
K. The administrative system
The ‘legal state’ or Rechtsstaat is a key idea in the
German system:
While the Rechtsstaat and federal principles constitute
the essential formal parameters for policy making and
public-sector change, the market economy and the
welfare state establish substantial norms which de-
lineate functions and responsibilities of the state . . .
These complex arrangements between state and mar-
ket economy, based on neo-corporatist linkages and
intermediary organizations, allow the co-existence of
market ideals such as free enterprise, individualism
and subsidiarity, with a positive evaluation of the wel-
fare state. (Benz and G€otz, 1996, p. 17)
Within this setting, the Federal Republic of
Germany has sixteen L€ander, of which three are
city states (Berlin, Bremen, and Hamburg), plus
hundreds of local governments. The size of the
L€ander varies from 17.7 million inhabitants
(North Rhine-Westphalia) to 700,000 (Bremen), or
from 70,000 km2 (Bavaria) to 400 km2 (Bremen).
Local government consists of 329 counties (Kreise),
115 non-county municipalities (Kreisefreie St€adte),
and 14,915 municipalities (Gemeinde) which are
governed according to different models.
The administrative structure in the Federal
Republic of Germany is moulded by three princi-
ples. The first principle is ‘separation of powers’,
which distributes legislative, executive, and judi-
cial powers among separate institutions. A second
principle is federalism, which defines L€ander as
‘members of the Federation yet retaining a sover-
eign state power of their own’ (R€ober, 1996,
GERMANY 281
p. 170). Local government is the last founding
principle. Local government in Germany mainly
operates on two levels, that of the local authorities
and of the counties (R€ober, 1996, p. 170). Local
self-government has a long tradition in Germany.
The Basic Law and all Land constitutions guarantee
the right of every community to govern local af-
fairs under its own responsibility (OECD country
profiles, 1992, p. 126; OECD, 1997d).
The development of public management in Ger-
many has not been uniform because German
administration is extremely varied and complex.
Central government only plays a modest part in
the direct administration of public services. Many
public duties, such as education and police, are
administered by the states (L€ander) which have
considerable political and administrative power,
whilst other public duties (e.g. social services) are
administered by local authorities. As a conse-
quence the impact of public management and pub-
lic managers varies throughout Germany and at
different levels of public administration (R€ober,
1996, p. 169–70; Wollmann, 2001).
The role of federal administration is mainly lim-
ited to law-making and is not concerned with ser-
vice delivery as such, which therefore reduces the
need for administrative reform at that level. The
concept of Rechtsstaat and the principle of legality
are embedded in a negotiating and contracting
state (Sommerman, 1998). The German system of
public administration is characterized by the clas-
sical bureaucratic model with strong emphasis on
legality and proper fulfilment of regulatory func-
tions (Ordnungsaufgaben). This model is based on
the Weberian ideal type of bureaucracy with a tall
hierarchy of positions, functional specialization,
strict rules, impersonal relationships, and a high
degree of formalization (R€ober, 1996, p. 170). How-
ever, the upper levels of the federal civil service are
extensively politicized. It is common for many
such senior officials to change jobs or take study
leave when the political colour of the government
changes (G€otz, 1997). The federal ministries do,
however, have a penumbra of agencies. The num-
ber of these increased from the 1950s until the
1990s, and then declined slightly into the 2000s
(just when agencies were being increased in the UK
and the Netherlands). The development of this
agency system has been ‘neither comprehensive
nor planned; they are much more evolutionary
than revolutionary, driven by sectoral policies and
not by any overall agency policy’ (Bach and Jann,
2010, p. 443).
L. Contents of the reform package
The modernization of public administration in
Germany has to be understood in ‘terms of a “bot-
tom-up” revolution: there are few reform initia-
tives at the federal level, at least some German
L€ander show up as modernization pioneers, but
the truly new entrepeneurs in the field of moderni-
zation are the local governments’ (Klages and
L€offler, 1996, p. 134).
The elements of the ‘New Steering Model’ that
local governments and some L€ander put into prac-
tice included:
� result-oriented budgeting;
� cost calculation of administrative products;
� introduction of commercial bookkeeping;
� decentralized resource accountability;
� definition of indicators for quality standards;
� customer orientation;
� outsourcing, contracting-out, and privatization;
� openness to ‘competition’.
Faced with budgetary problems, some hospitals
also adopted variants of the New Steering Model.
Klages and L€offler (1996, pp. 137–41) argue that
there was an east-west division in the moderniza-
tion approach of local government, due to the
specific problems facing public administration in
East Germany. The restructuring of the East Ger-
man public sector was dramatic. The transforma-
tion encompassed changes in governmental
competencies (from holistic planning authority
to a balancing function, typical for a market econ-
omy), in the civil service (from political cadre
administration to a civil service based on profes-
sional qualifications), in organization (from unity
of powers to horizontal and vertical separation of
powers), and in procedures (from the guidance
principle of the party to legalistic administrative
behaviour). Territorial restructuring of local autho-
rities was necessary in the face of the enormous
financial problems the local authorities faced. In
the eastern part of Germany, the Weberian model
was put in place, while, by contrast, the western
part experimented with the New Steering Model
and other innovations.
Major reforms at the federal level have been few
and far between. There has been plenty of discus-
sion and speech-making (e.g. over the idea of a
‘slim state’ in the late 1990s) but there has often
been little tangible result. From 1999 the Modern
State: Modern Administration programme focused
on the idea of an ‘enabling state’, based on
282 APPENDIX B: COUNTRY FILES AND TABLES OF EVENTS
modern management, elimination of bureaucracy,
and e-government. However, implementation was
not easy, and the ‘red–green’ coalition ended up
resuming some of the reform ideas of its CDU
predecessor (Bach and Jann, 2010; Jann, 2003;
Schr€oter, 2007). Certain themes appear repeatedly
in reform documents—especially reducing unnec-
essary bureaucracy (which has featured three or
four times since 1980) and ‘modernization’
(which can mean a variety of things in different
contexts). Since 2000, recurrent themes have
included integrated service delivery (shared ser-
vice centres have been an ongoing project since
2005), e-government (Ministry of the Interior
2006a), and innovation (Ministry of the Interior,
2006b).
M. The implementation process
The initiation and implementation of changes in
Germany is through pilot projects rather than by a
comprehensive approach. At the federal level re-
forms are frequently tried out by one or a few
ministries rather than (UK style) being imposed
by the core executive on the whole of the govern-
ment. This has advantages, but can also create pro-
blems of dual structures and isolated islands of
reforms. The modernization pressure comes from
the lower levels of government and is pushing
through the L€ander up to the federal level. The
usual tempo of reform is a gradual one, with exten-
sive consultation and a measured approach over a
number of years.
One huge exception to this generalization was
the unification with East Germany, which was def-
initely a top-down process, and was necessarily
carried out quickly.
N. Reforms actually achieved
There are no recognizable official evaluations of
the outcomes of federal reforms. There are surveys
and academic analyses of the implementation of
the New Steering Model, but these lie largely out-
side our focus on the federal level. Some academic
treatments of the federal reforms go some way
towards evaluating them (e.g. Schr€oter, 2007;
Wollmann, 2001).
GERMANY 283
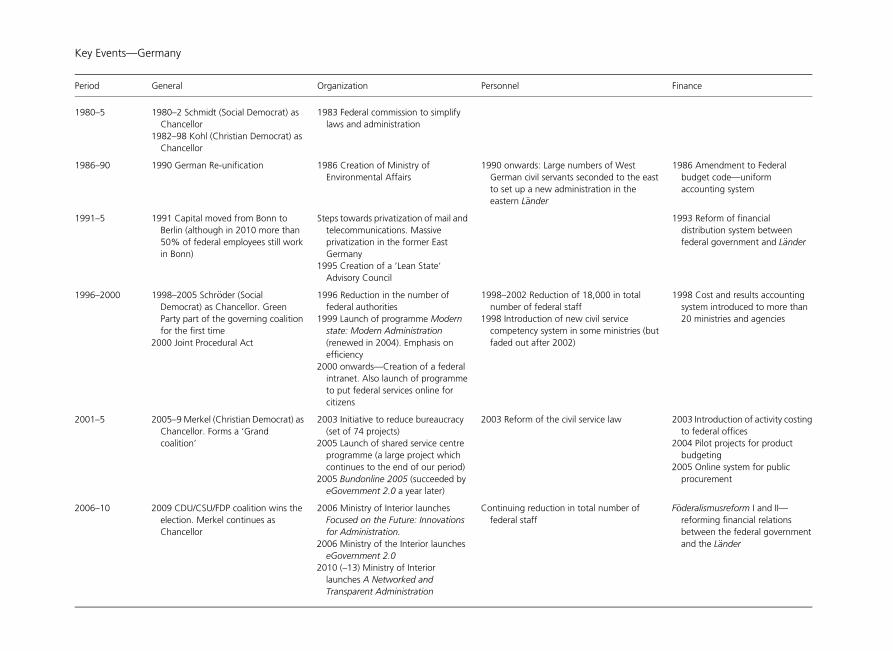
Key Events—Germany
Period General Organization Personnel Finance
1980–5 1980–2 Schmidt (Social Democrat) as
Chancellor
1982–98 Kohl (Christian Democrat) as
Chancellor
1983 Federal commission to simplify
laws and administration
1986–90 1990 German Re-unification 1986 Creation of Ministry of
Environmental Affairs
1990 onwards: Large numbers of West
German civil servants seconded to the east
to set up a new administration in the
eastern L€ander
1986 Amendment to Federal
budget code—uniform
accounting system
1991–5 1991 Capital moved from Bonn to
Berlin (although in 2010 more than
50% of federal employees still work
in Bonn)
Steps towards privatization of mail and
telecommunications. Massive
privatization in the former East
Germany
1995 Creation of a ‘Lean State’
Advisory Council
1993 Reform of financial
distribution system between
federal government and L€ander
1996–2000 1998–2005 Schr€oder (Social
Democrat) as Chancellor. Green
Party part of the governing coalition
for the first time
2000 Joint Procedural Act
1996 Reduction in the number of
federal authorities
1999 Launch of programme Modern
state: Modern Administration
(renewed in 2004). Emphasis on
efficiency
2000 onwards—Creation of a federal
intranet. Also launch of programme
to put federal services online for
citizens
1998–2002 Reduction of 18,000 in total
number of federal staff
1998 Introduction of new civil service
competency system in some ministries (but
faded out after 2002)
1998 Cost and results accounting
system introduced to more than
20 ministries and agencies
2001–5 2005–9Merkel (Christian Democrat) as
Chancellor. Forms a ‘Grand
coalition’
2003 Initiative to reduce bureaucracy
(set of 74 projects)
2005 Launch of shared service centre
programme (a large project which
continues to the end of our period)
2005 Bundonline 2005 (succeeded by
eGovernment 2.0 a year later)
2003 Reform of the civil service law 2003 Introduction of activity costing
to federal offices
2004 Pilot projects for product
budgeting
2005 Online system for public
procurement
2006–10 2009 CDU/CSU/FDP coalition wins the
election. Merkel continues as
Chancellor
2006 Ministry of Interior launches
Focused on the Future: Innovations
for Administration.
2006 Ministry of the Interior launches
eGovernment 2.0
2010 (–13) Ministry of Interior
launches A Networked and
Transparent Administration
Continuing reduction in total number of
federal staff
F€oderalismusreform I and II—
reforming financial relations
between the federal government
and the L€ander
ITALY
A. Socio-economic forces: general
With a population of 60 million Italy is, together
with Germany, France, and the UK, one of the big
states of western Europe. See Appendix A.
B. Global economic forces
See Appendix A. Italy has a lower level of imports
and exports as a percentage of GDP than Belgium,
Germany, or the Netherlands, but a higher level
than Australia or the USA.
C. Sociodemographic issues
Italy is experiencing the same growth in the elderly
population as other EU and North American
countries and, despite the stereotypical Italian
image of the strong, extended family, this is put-
ting significant strains on the social and health care
services (see Appendix A, Figure A.1). Culturally
(and politically) Italy exhibits strong contrasts
between a poor and ‘backward’ south and an eco-
nomically and socially more dynamic north. Italy
has also been subject to sudden upsurges in the
numbers of asylum seekers, in a country which
has hitherto had quite a low percentage of for-
eign-born residents.
D. National socio-economic policies
There is a tradition of extensive state direction over
the economy, including state ownership of banking
and insurance, as well as industrial companies. Fur-
thermore, industrial policy was traditionally ori-
ented towards the support of the big Italian private
firms. However, globalization and the opening of
national markets within the EU have put strong
pressures on this situation. There was widespread
privatization of state firms during the 1990s.
During the 1990s the EU’s ‘convergence criteria’
obliged governments to address the very high level
of national debt, and propelled ‘savings’ to the top
of the political agenda. This, in turn, impacted
upon welfare state policies.
An important feature of the Italian economic
and political situation is the long-standing
contrast between the rich, industrialized and
urbanized north and the much poorer, more rural
south.
E. The political system
Until the political crisis of 1993–4 there were two
main parties, the Christian Democrats (with vote
shares of 33–40% during the 1980s) and the Com-
munist Party (with around 30%). There was also a
Socialist Party, and various other smaller parties of
the right and left. Governments changed fre-
quently and were often of the grand coalition
type. The same individuals from the political elite
tended to be in power for long periods. In the early
and mid 1990s, however, a political and economic
crisis (political bribery and other illegal activities,
the need for large public expenditure cuts) led to
changes in both the electoral system (from propor-
tional towards more majoritarian arrangements)
and the pattern of parties (the effective collapse of
both the Christian Democrats and the Commu-
nists and their replacement by a shifting coterie
of new parties).
After 1994 the Italian political system looked
more majoritarian, but still displayed fragmented
coalitions, anti-system parties (e.g. the Northern
League, the refounded, smaller Communist Party)
and parties identified principally with charismatic
leaders (e.g. Prime Minister Berlusconi’s Forza Ita-
lia, Di Pietro’s Italy of Values Party). During these
upheavals the position of the President of the
Republic (previously a largely symbolic role) be-
came somewhat more influential.
There was also a period where many senior civil
servants began to be appointed to political posi-
tions, indeed, there were two ‘technical’ govern-
ments—the Ciampi administration of 1993 and
the Dini administration of 1995—which were
headed by former central bank executives.
There has also been a move away from centrali-
zation and towards federalism, with major consti-
tutional reforms in 2001. However, the detailed
implementation of this strategy has been quite
slow. At the local level the influence of party
machines has declined and there has been a
trend towards elected mayors and provincial
presidents.
ITALY 285
F. New management ideas
In the 1980s there was a fashion for promoting a
corporate, managerial culture in bodies such as
regional and local authorities and hospitals and
health care units. During the 1990s there was a
strange melange of traditional, French-derived
administrative doctrines and NPM ideas. The EU
also had a distinct influence, particularly because
of the reform of the structural funds from the late
1980s, which helped introduce new ideas about
financial management, planning, and evaluation
(mandatory evaluations became a feature of the
reformed structural funds system). The Treasury
was an important channel for these influences.
However, the strong legal and cultural features of
Italian administration have often meant that ideas
from outside (e.g. performance-related pay) have
been heavily adapted during implementation, so
that their originally intended effects were lost (On-
garo and Valotti, 2008). As Italy moved into the
twenty-first century, the intensification of interna-
tional networking at regional and local levels facili-
tated the introduction of new ideas from the
‘bottom-up’.
G. Pressures from citizens
Trust in the civil service is not high in Italy (in
Table 5.7 it remained the lowest of the eight Euro-
pean countries). However, it did appear to increase
somewhat between 1997 and 2002 (see Table 5.7).
Trust in politicians tends to be very low. In general
it might be said that there has been strong, if dif-
fuse, public pressure for reform—a growing aware-
ness (fuelled by the greater international traffic in
ideas) that inefficiency and even corruption are not
just ‘part of the way things are’, but are problems
which can be tackled.
H. Party political ideas
The fragmentation and volatility of the party sys-
tem during the recent period makes it hard to iden-
tify consistently ‘leading’ ideas. Rather, there have
been certain groups of (sometimes contradictory)
themes, for example:
� privatization (under pressure from EU
institutions)
� downsizing and contracting out
� some ‘governance’ ideas, including, most
obviously, decentralization and federalization,
but sometimes also an enhanced emphasis on
public participation and third-sector partner-
ship in service provision
� emphasis on the primacy of political control
(often entailing a tightening of traditional, hier-
archical controls, plus the introduction of a
‘spoils system’ in the mid 1990s)
� the continuing fight against corruption (onmost
measures a bigger problem in Italy than in any of
our other eleven countries).
I. Chance events
Bribery is not a chance event, but its discovery,
perhaps, may be so regarded! The ‘clean hands’
enquiry, which began in the winter of 1992, was
something of a watershed. It discredited a large part
of the political and business elite, and provided a
catalyst for deep changes in the party system and
the whole political class.
The monetary crisis of summer 1992 made a
major impact. It led to a new approach to the
national deficit and to tremendous pressure on
public organizations to find savings. The later
GEC (2008) also made an impact. Italy was seen
as one of the weaker members of the eurozone, and
was obliged to take strong budgetary measures dur-
ing 2010—including, for example, a move to freeze
civil service salaries for the next three years.
J. Elite decision-making
The crises of 1992–4 made it politically very impor-
tant to be seen as a ‘reformer’, and provided a
background to many proposals and ideas. Propo-
sals to distance administrative responsibility from
the political leadership (while leaving them with
steering instruments) were understandably popu-
lar, and offered nodes for consensus. Privatization
was one example of this, and one which also
helped provide cash during a period of budgetary
restraint. Decentralization was another rallying
cry, expressed with particular vigour by the North-
ern League. The relative public popularity of the EU
made it less difficult for politicians to carry through
policies of privatization and downsizing, since
these could be represented as being essential re-
sponses to EU convergence criteria. Public manage-
ment reforms have probably been somewhat lower
on the political agenda since the turn of the cen-
tury (Ongaro, 2009, p. 77).
More recently the Minister for the Civil Service
and Innovation, Brunetta, has conducted some-
thing of a populist campaign against ‘loungers’
286 APPENDIX B: COUNTRY FILES AND TABLES OF EVENTS
in the civil service who, it is implied, are one
reason why the Berlusconi government has not
been able to make some of its policies work. The
remedies, it is said, are more transparency in pub-
lic service pay and a tighter regime of evaluation
and performance pay.
K. The administrative system
The Italian administrative system is related to its
French cousin, and has sometimes been described
as ‘Napoleonic’. Significant elements include:
� a tradition of state direction of the economy and
society;
� the presence of an elite state cadre, including the
Consiglio di Stato (Council of State), the Corte dei
Conti (national audit office) and the Ispettorato
Generale (a financial inspectorate);
� the strong presence of the central state at
regional level, personified in the person of the
prefetto (prefect);
� the importance of a special body of administra-
tive law, based on the concept that the state
occupies an autonomous domain (see discussion
of the Rechtsstaat in Chapter 3). A public service
culture which is hence strongly juridical;
� a four-tier system—state, region, province, muni-
cipality, with large central ministries that until
recently managed many functions. Until the
1990s the provinces had only limited functions;
� strong regional and cultural differences, despite
the detailed framework of national rules and reg-
ulations (Ongaro and Valotti, 2008).
Overall, the image is of a slow-moving and rather
inefficient administration, although with great var-
iation, including pockets of much more modern
and innovative practice. Tables 5.1 and 5.4 show
Italy as having by far the lowest score among our
twelve countries on the World Governance Indica-
tors, and also by far the lowest position on the
IMD’s government efficiency index.
L. Contents of the reform package
There was no single, defining ‘package’. During
the 1980s there was a good deal of innovation at
local levels and in the health service, much of
which was aimed at strengthening management
and modernizing budgeting and planning proce-
dures. However, it was not until the 1990s that
major national reforms got under way. At the
beginning of that decade local authorities were
given greater autonomy to organize their services
in different ways, and an important law on trans-
parency in public administration was introduced.
Then, during the crisis of 1992–4 various reform
packages took shape:
� privatization and liberalization of banking and
insurance; the dismantling of the state industrial
conglomerate IRI; the partial liberalization of the
mobile phone sector;
� changes to the basis of public employment, in an
attempt to introduce more decentralized collec-
tive bargaining and more private-sector-like
disciplines;
� clearer lines being drawn between the roles of
elected officials and public managers, particu-
larly at the local level. In practice this demarca-
tion between setting priorities (political) and
managing resources (managerial) proved very
hard to implement;
� financial management reforms: more recourse to
block budgeting (giving lower tier authorities
greater discretion to sub-allocate) but simulta-
neously a tightening of cash management;
� introduction of a citizens’ charter (Schiavo, 2000)
and of ‘offices for relations with the public’;
� reform of the national audit office, reducing its
administrative power and partly re-orienting it
from ex ante controls towards ex post controls and
performance audit.
A second wave of reform took place in 1997–9:
� major decentralization: invoking the principle of
‘subsiduarity’, many functions were transferred
to the regional and local levels. This was rein-
forced by a new constitutional law in 2001;
� further employment reform: strengthening pri-
vate sector disciplines and introducing perfor-
mance-related pay;
� a broad package of administrative simplification,
including the widespread introduction of ‘one
stop shops’ for businesses (Ongaro, 2004);
� restructuring of central government, including
mergers of ministries and the creation of execu-
tive agencies that were supposed to operate
through performance contracts;
� reform of the general system of controls, distin-
guishing between administrative controls, man-
agement controls, and strategic controls;
� accounting reform, aggregating expenditures
into larger ‘units’;
� increased autonomy given to schools, universi-
ties, and chambers of commerce.
ITALY 287
Since 2000 there has been no single, consistent,
prominent focus. However, the following elements
have, from time to time, been highlighted:
� greater customer focus in public services, partly
through e-government. Also (2009) citizens are
to be given enhanced rights to take failing
administrative authorities to the administrative
courts;
� continuing budget reforms;
� continuing adjustment and readjustment of civil
service personnel regulations;
� following the 2008 GEC, the need to make sub-
stantial cuts in public spending.
M. The implementation process
Those reforms that were directly driven by the
financial pressures of the economic crisis in the
early 1990s tended to be implemented relatively
quickly. The intensity of implementation of other
reforms was very varied, with long delays and
‘dilutions’ being quite common. There is a wide-
spread perception that Italy is weak on imple-
mentation, and there are a variety of theories
about why that should be so (Ongaro and
Valotti, 2008; Ongaro, 2009, p. 126). ‘The gap
between the principles underlying the design of
reforms and the actual utilisation of management
tools seems to be especially wide in the area of
personnel management’ (Ongaro and Valotti,
2008, p. 186).
There has been a considerable debate within
Italy as to whether the reforms of the 1990s were
mainly ‘top-down’ or ‘bottom-up’. The answer
seems to be ‘both’. Some reforms were clearly
driven by national laws. But, on the other hand,
the autonomization and decentralization processes
released many innovatory experiments in munici-
palities and local hospitals. The spread of ‘city
managers’ was also a largely bottom-up
phenomenon.
N. Results achieved
No general evaluation is available. It is clear that
considerable structural change has taken place, and
it seems likely that, in many instances, the client-
orientation has also increased. In the mid 1990s
considerable reductions in public spending were
achieved, although it may be debated how far this
was due to any managerial skill. Some particular
evaluations have been made of specific reforms, for
example Pessina and Cantu, (2000—for health
care) or Valotti (2000—for local government). On-
garo’s academic overview concludes that real forces
for change were released during the 1990s, but that
public management reform became politically
somewhat less prominent after 2001 (Ongaro,
2009, pp. 179–89).
288 APPENDIX B: COUNTRY FILES AND TABLES OF EVENTS
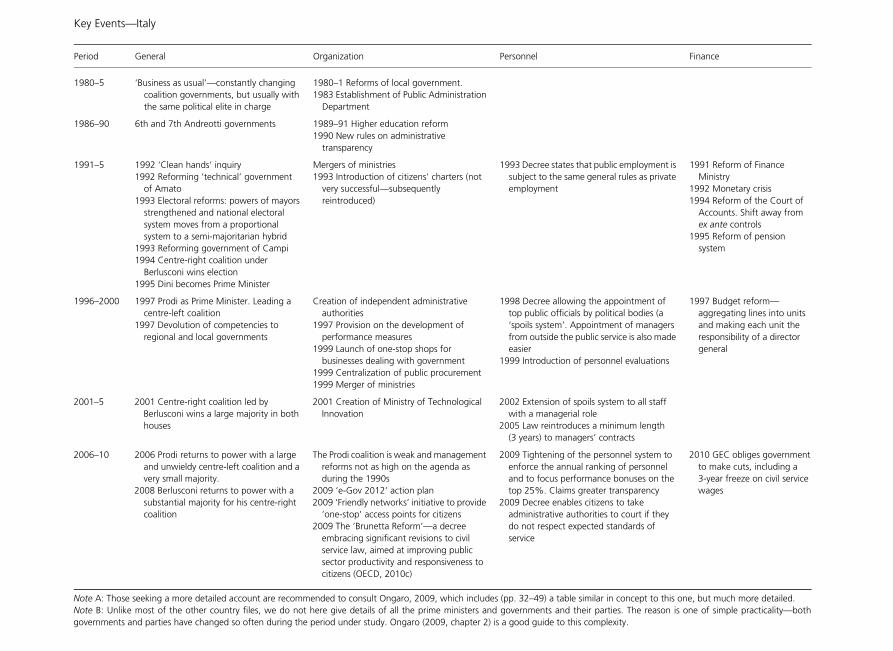
Key Events—Italy
Period General Organization Personnel Finance
1980–5 ‘Business as usual’—constantly changing
coalition governments, but usually with
the same political elite in charge
1980–1 Reforms of local government.
1983 Establishment of Public Administration
Department
1986–90 6th and 7th Andreotti governments 1989–91 Higher education reform
1990 New rules on administrative
transparency
1991–5 1992 ‘Clean hands’ inquiry
1992 Reforming ‘technical’ government
of Amato
1993 Electoral reforms: powers of mayors
strengthened and national electoral
system moves from a proportional
system to a semi-majoritarian hybrid
1993 Reforming government of Campi
1994 Centre-right coalition under
Berlusconi wins election
1995 Dini becomes Prime Minister
Mergers of ministries
1993 Introduction of citizens’ charters (not
very successful—subsequently
reintroduced)
1993 Decree states that public employment is
subject to the same general rules as private
employment
1991 Reform of Finance
Ministry
1992 Monetary crisis
1994 Reform of the Court of
Accounts. Shift away from
ex ante controls
1995 Reform of pension
system
1996–2000 1997 Prodi as Prime Minister. Leading a
centre-left coalition
1997 Devolution of competencies to
regional and local governments
Creation of independent administrative
authorities
1997 Provision on the development of
performance measures
1999 Launch of one-stop shops for
businesses dealing with government
1999 Centralization of public procurement
1999 Merger of ministries
1998 Decree allowing the appointment of
top public officials by political bodies (a
‘spoils system’. Appointment of managers
from outside the public service is also made
easier
1999 Introduction of personnel evaluations
1997 Budget reform—
aggregating lines into units
and making each unit the
responsibility of a director
general
2001–5 2001 Centre-right coalition led by
Berlusconi wins a large majority in both
houses
2001 Creation of Ministry of Technological
Innovation
2002 Extension of spoils system to all staff
with a managerial role
2005 Law reintroduces a minimum length
(3 years) to managers’ contracts
2006–10 2006 Prodi returns to power with a large
and unwieldy centre-left coalition and a
very small majority.
2008 Berlusconi returns to power with a
substantial majority for his centre-right
coalition
The Prodi coalition is weak and management
reforms not as high on the agenda as
during the 1990s
2009 ‘e-Gov 2012’ action plan
2009 ‘Friendly networks’ initiative to provide
‘one-stop’ access points for citizens
2009 The ‘Brunetta Reform’—a decree
embracing significant revisions to civil
service law, aimed at improving public
sector productivity and responsiveness to
citizens (OECD, 2010c)
2009 Tightening of the personnel system to
enforce the annual ranking of personnel
and to focus performance bonuses on the
top 25%. Claims greater transparency
2009 Decree enables citizens to take
administrative authorities to court if they
do not respect expected standards of
service
2010 GEC obliges government
to make cuts, including a
3-year freeze on civil service
wages
Note A: Those seeking a more detailed account are recommended to consult Ongaro, 2009, which includes (pp. 32–49) a table similar in concept to this one, but much more detailed.
Note B: Unlike most of the other country files, we do not here give details of all the prime ministers and governments and their parties. The reason is one of simple practicality—both
governments and parties have changed so often during the period under study. Ongaro (2009, chapter 2) is a good guide to this complexity.
THE NETHERLANDS
A. Socio-economic forces: general
The Netherlands has a population of 16.6 million
citizens (2010). Demographically:
Population aging will reduce economic growth and
increase resource transfers to the elderly. This will put
pressure on the retirement-income and healthcare,
insurance systems. The Netherlands is better placed
than most OECD countries to meet these pressures
because it has a large, funded occupational pension
system. Even so, the government budget balance is
projected to deteriorate when the baby boom genera-
tion passes into retirement. (OECD, 2002b, p. 3)
To safeguard the current position following the
2008 GEC, the new government (Rutte 1) will
implement a savings programme of Euro 18 billion,
which is about 6 per cent of total expenditure.
B. Global economic forces
The Netherlands is particularly exposed to interna-
tional trading conditions, having one of the largest
international trade sectors among our twelve
countries (Table A.3).
Even though the Netherlands retains a strong
economy under fiscal pressure, raising taxes is not
on the agenda for the Rutte 1 government. Since
additional expenditure for education, public secur-
ity, infrastructure, and services for elderly are a
priority, substantial savings may have to come
from social expenditure.
C. Sociodemographic issues
Since the 1980s and even at the beginning of
the 1990s the Netherlands were second only to
Sweden (among the twelve countries reviewed),
in respect of the high proportion of GDP devoted
to social expenditure. During the 1990s and espe-
cially in the late 1990s the proportion stabilized
and even decreased, relative to other countries
(e.g. Sweden, Finland, France)
Even with a relatively low foreign population
(4.2% of the total population), the Netherlands
have a significant foreign-born population (10.7%
of the total population in 2007) (see also Table A.8).
This has resulted in the Rutte 1 government
planning to restrict and limit access for foreign
populations to the Netherlands. Over the past
decade immigration has become a ‘hot topic’ in
Dutch politics. The population aged 65 and over
is currently 15.5 per cent of the total population
and is predicted to increase to 23.5 per cent in
2050, placing the Netherlands in the middle of
our twelve countries in this respect (see Table A.6).
D. National socio-economic policies
Until the recession of the 1970s the post-war his-
tory of the Dutch public sector had been one of
more or less continuous expansion. Then,
between 1974 and 1982 the budget situation
deteriorated from surplus to a large deficit. Unsur-
prisingly, the 1980s were a period of sharp cut-
backs in the public sector, combined with a series
of measures to develop tighter control over state
expenditures. Since 1989 the Dutch economy has
performed better, although it shared in the inter-
national slowdown of the early 1990s. Employ-
ment growth since 1994 has been ahead of many
other EU member states. Although the govern-
ments of the mid and late 1990s have enjoyed a
less threatening position on public spending than
their 1980s predecessors, the economic circum-
stances are changing:
These are undoubtedly testing times for the Nether-
lands, with the economy moving away from sustained
non-inflationary growth, which had been the hall-
mark of the Dutch model for nearly two decades.
(OECD, 2002b, p. 1)
The 2008 GEC forced the Dutch government to
intervene in the banking system. Since the pension
system relies on a capitalization system, substantial
losses were taken. However, the Dutch system has
the capacity to cut budgets drastically if necessary.
The resignation of the Balkenende administration
ushered in the current Rutte-Verhagen govern-
ment (2010– ), which is reducing total spending
by 6 per cent.
E. The political system
The Netherlands are a unitary, but decentralized
state: ‘traditionally, the Dutch state . . . has always
resisted centralisation of state authority’ (Kickert
and In ‘t Veld 1995, p. 45). The political system
is consociational, consensual, multi-party, and
290 APPENDIX B: COUNTRY FILES AND TABLES OF EVENTS
corporatist (Lijphart, 1984). Elections take place
according to a system of proportional representa-
tion. During the 1980–2000 period the main
parties were Christian Democrat (a 1980s’ merger
of previously separate Christian parties), a Liberal
Party (conservative), a Progressive Liberal Party,
and a Social-Democrat party. The Christian parties
were continuously in government from the First
World War until 1994, allied to varying groupings
of other parties. Through the 1970s the governing
coalitions were centre left, in the 1980s centre
right. Unusually, in 1994 and 1998, a ‘purple’
(left–right) coalition was formed without Christian
Democrat participation. After the elections of May
2002 and January 2003, the Christian Democrats
returned to government.
In the Netherlands almost every sector of government
policy consists of a myriad of consultative and advi-
sory councils, which are deeply intertwined with
government and form an ‘iron ring’ around the
ministerial departments . . . Deliberation, consultation,
and pursuit of compromise and consensus form the
deeply rooted basic traits of Dutch political culture.
(Kickert and In ‘t Veld 1995, p. 53)
The Socialist-led purple coalition (Kok, 1994–
1998–2002) was succeeded by the Christian
Democrat-led Balkenende governments (2002–3
and 2006–10).
The 2002 elections were affected by the murder
of Fortuyn. He was a populist politician who
gained a significant number of seats (17% of the
votes) for his ‘Lijst Pim Fortuyn’ protest party
and—as if from nowhere—became the second larg-
est party in the Second Chamber. The three tradi-
tional parties represented almost 60 per cent of the
votes. The political tensions resulted in new elec-
tions in 2003 where the Fortuyn listed seats
dropped substantially (to 5.6% of the votes). It
became clear that, without their charismatic leader,
the party was composed of contradictory interests
and attitudes. This period traumatized the political
elite of the Netherlands. Whereas the three main
political families once more represented almost 75
per cent of the votes in the 2003 elections, further
fragmentation of the party-political system
followed.
In the 2006 elections the three traditional
parties (CDA, VVD, and PvdA) dropped back to
about 60 per cent. Each party acquired a mirror-
ing, radical fringe party that split the vote (reli-
gious, conservative, and left). The 2010 elections
clearly demonstrated this. The three traditional
parties represented only 53.7 per cent of the
vote, while the combined radical fringe parties
gained 43.7 per cent of the votes, of which 15.4
per cent was for the far-right movement PVV of
Wilders. This fragmentation of the political sys-
tem, and the support of the far-right party of
Wilders resulted in very difficult coalition negotia-
tions for a conservative (Christian Democrats and
conservatives) minority government (52 seats)
with the support of the far-right movement (24
seats) to give them a 76/150 majority.
As a consequence, the Dutch political system is
less consociational and consensual than it was in
the 1990s. This has implications for its public pol-
icies and its public sector reform programmes.
F. New management ideas
Formerly, the system of consultative and advisory
councils (see E, above) afforded many channels for
both business-based and academic ideas to enter
public administration:
the Dutch ministries are relatively open organisations.
They are not only populated by career civil servants,
but also by many external consultants and scientists
who contribute enthusiastically to policy making in
general. (Kickert and In ’t Veld, 1995, p. 56)
In this respect, therefore, the Netherlands has been
dissimilar to more closed, Rechsstaat-type regimes
such as Germany or France. Following the Second
World War there was a notieable ‘de-juridification’
of public administration. During the 1980s specific
reform ideas came from a number of other
countries, especially Sweden, the UK, and the USA
(Roberts, 1997, p. 101).
As in many other countries, during the 1980s
notions of comprehensive planning were in rapid
retreat, and business-origin management ideas
increasingly penetrated the public sector. However,
in the Netherlands, the drive for efficiency and
savings did not carry the same anti-government
ideological edge as it did, for example, in the UK
under Thatcher or in the USA under Reagan.
It should also be noted that the Netherlands,
relative to its size, has one of the largest commu-
nities of public administration academics in West-
ern Europe. Many professors played some part in
advising government on administrative reform.
During the 1980s open systems approaches and
network theories provided alternative perspectives
to business management approaches and, during
the 1990s, the Dutch academic community played
THE NETHERLANDS 291
an important part in developing the ‘new steering
model’ of governance (Kickert and In ‘t Veld 1995,
pp. 59–60; Kickert, 2000, 2008).
A typical procedure for generating new manage-
ment ideas in the Netherlands is to establish com-
missions which produce a report for debate in the
Cabinet and in Parliament, and major evaluations
which suggest corrective actions. The commissions
consist of executive politicians, MPs, academics, or
stakeholders. These commissions report on a range
of issues varying from, for example, structures of
government (Van Veen, Vonhoff, Wiegel, Schel-
tema), coordination (De Grave), responsibility
(Scheltema), or communication (Wallage, Doctors
van Leeuwen). Since about 2000, however, the aca-
demic channel has probably lost importance, and
international sources (OECD, consultants, etc.)
have gained.
Evaluations are also a key source for new man-
agement ideas. The 2004 VBTB evaluation on
financial performance management resulted in
a policy shift (Bouckaert and Halligan, 2008,
p. 288), and the 2003 Programme Different Public
Sector (Een Andere Overheid) was effectively aban-
doned (Luts et al., 2009).
From about 2005 on, there has been a shift
towards a pragmatic approach to public sector
reform. The 2007 Renewal of the Central Government
focused on better policy, good implementation,
fewer administrative burdens, better control, and
more efficiency (Ministerie Binnenlandse Zaken,
2007, 2008; see also: Tweede Kamer der Staten
Generaal, 2007). Increasingly there was also an
awareness that the benefits of focusing on perfor-
mance also have a cost. As a result two new themes
to guide public sector reform seem to have
emerged: ‘Comply or explain’ and ‘trust’. Since
the 2008 GEC the saving strategy obviously has
also come to dominate the debate.
‘Comply or explain’ means that a degree of free-
dom has been created where it is possible not to
comply if one can explain why it is not possible or
desirable to provide performance information for
strategic plans and budgets, or monitoring, or re-
porting. Also, and in the same line of thinking,
‘trust’ has become an increasing topic of debate in
managing relationships within the public sector,
for example between the Ministry of Interior and
local government, even if there are official doubts
(Ministerie van Binnenlandse Zaken, 2009b, p. 7).
‘Comply or explain’ and ‘trust’ also fit well into a
strategy of cutting costs of public sector bureau-
cracies, and reducing administrative burdens.
G. Party political ideas
Whilst political parties undoubtedly developed
broad notions about how Dutch government
should be reformed it is necessary to remember
that the significance of the ideas of any one party
for practical action is likely to be less in a consen-
sual, multiparty system than in the kind of one-
party dominance which has usually characterized
government in New Zealand and the UK. That hav-
ing been said, one may note a number of party
political themes which gained some salience.
First, it is clear that the first Lubbers govern-
ment, which came to power as a centre-right co-
alition in 1982, was influenced by the right-wing
Anglo-American neo-liberal governments of the
time. It adopted a rhetoric which was pro-privati-
zation and in favour of slimming the central state.
Over time this emphasis became somewhat
diluted, especially when the third Lubbers’ admin-
istration (1989–94) included the Social Democrats
as major partners (instead of the Liberals, as in the
first and second Lubbers’ governments). Simulta-
neously, however, the Social Democrats muted
their previous ideological resistance to various
forms of business-like practices being (selectively)
introduced to the public sector. Additionally, the
pressures to cut back public spending receded dur-
ing the 1990s, so that the context for debate was
less acute.
Later, during the 1990s, there was a certain dis-
enchantment with some of the reforms. Following
some critical analyses (e.g. Algemene Rekenkamer,
1995) of the many ZBOs (autonomous administra-
tive bodies) created during the 1980s, the new
‘purple coalition’ government of the mid 1990s
declared its intention of restoring the ‘primacy of
politics’, meaning a greater measure of public
accountability and transparency for non-ministerial
public bodies (Roberts, 1997).
In general, there is a shift of solution strategies
from coordination and solving the stovepipes sys-
tem, to a debate on what the core business is and
how to make (autonomous) administrations more
responsible for results, costs, and quality (Minist-
erie van Binnenlandse Zaken, 2009a, 2009b). From
there, debate has started on how not to lose control
over these autonomous administrations, to recon-
nect the public sector and its policies to what citi-
zens and society want, especially since the
traditional parties were so successfully challenged
electorally by radical fringe parties and movements
that appealed to the electorate.
292 APPENDIX B: COUNTRY FILES AND TABLES OF EVENTS
H. Pressure from citizens
Whilst there is a popular suspicion that ‘the
bureaucracy’ is inefficient, and while public service
seems to have become a less attractive career for
young people, Dutch public opinion does not seem
to support the strongly anti-government attitudes
which have been quite popular in the USA and, to a
lesser extent, in Australia, New Zealand, and the
UK. But also in comparison to other European
countries public opinion in the Netherlands has a
positive attitude towards the government. Dutch
public opinion also places a high value on institut-
ions such as Parliament, social security, health care,
and education. With specific reference to the civil
service, it comes out as the second most trusting
country after Sweden (Table 5.7).
I. Elite perceptions of what managementreforms are desirable and feasible
Much elite attention has been focused on budget-
ary problems. The development of performance
indicators, contractualization, and output budget-
ing were all seen as desirable and feasible. More
recently, however, the Cost Benefit Analysis of per-
formance information itself has become an issue.
The concern to cut expenses was ever-present and
frequently dominant. During the 1980s and early
1990s the political elite was most interested in
strategies for achieving cutbacks. One can see
from Table 5.5 that this seems to have had some
effect—in 1980 the Netherlands had been one of
the countries with the highest proportion of social
expenditure in GDP, whereas by 2005 on this mea-
sure it was ranked seventh out of twelve.
Top officials, however, were also enthusiastic
about the possibilities of management reforms per
se. During the election campaign in May 2002, the
populist candidate Fortuyn emphasized the mal-
functioning of administrations and certain public
policies. In 2010 the populist Wilders also empha-
sized maladministration. It could be said that the
Dutch public administration elite are now on the
defensive.
J. Chance events
Confidence in the administrative and political sys-
tem has been under pressure. There was a fire-
works factory that exploded in Enschede in 2000
(23 people killed, about 950 wounded). There was
a heavy fire in Volendam in 2003 (14 people killed
and 180 wounded). In 2005 there was a fire in the
Schiphol ‘prison’ for illegal detainees (eleven peo-
ple killed). With so many people killed and
injured, questions on procedures related to per-
mits and inspections were raised, and resulted in
review and evaluation of inspection services. In-
vestigations indicated a culture of ‘cosiness’ and
slackness between the regulators and the
regulatees.
Then there was the murder of Pim Fortuyn
(2002) which led to a parliamentary commission
to look for responsibilities and levels of account-
ability among the different administrative and
political actors involved. Further, there was also
the Theo Van Gogh murder (2004) which put pres-
sure on the image of a pluralist, multicultural, and
tolerant society, and the role of public policies in
achieving this.
Finally, there was a large-scale public works fraud
which raised the issue of ethical standards in the
public sector.
The 2008 financial crisis certainly had effects on
the public sector, but here, as elsewhere, we choose
not to regard that as a ‘chance event’.
K. The administrative system
‘Ministerial responsibility is the cornerstone of our
system’ (Kickert and In ‘t Veld, 1995, p. 46). Min-
isters are responsible politically, in criminal and in
civil law. Collective decision-making takes place in
the weekly council of ministers. The prime minister
is not as strong a coordinating and centralizing force
as in the UK system—indeed, various attempts dur-
ing the 1980s and 1990s to strengthen the prime
minister’s office have been rejected or dropped.
S/he remains primus inter pares.
In the mid 1990s there were fourteen ministries
(the number has varied over time, e.g. in 1982 the
new government abolished the Ministry of Public
Health and Environment and transferred its func-
tions to two newministries). The Rutte 1 cabinet has
eleven ministries. There is a one-to-one relationship
between ministers and ministries, except for the
Ministry of the Interior where there is an additional
minister for immigration and asylum. Because of the
absence of a strong central power each has consider-
able autonomy—more so than would be the case in
either New Zealand or the UK. The highest civil
servant in each ministry is the secretary general,
andministries are generally divided into directorates
general. In 1995 the ABD (Algemene Bestuursdienst)
was created (Senior Executive Service) which
included at the end of 2010 about 800 civil servants.
THE NETHERLANDS 293
The civil service is not partisan, and civil service
and political careers are separate. Ministries are
fairly open organizations, at least in the sense
that they frequently bring outside experts into
the processes of policy deliberation (see F above).
The provincial and municipal levels are highly
significant in terms of services, expenditure, and per-
sonnel. The number of municipalities evolved from
1.121 in 1900 to 483 in 2004 and to 430 currently
(2010). There are twelve provinces, of which the last
one, Flevoland,was added in 1986 as it was reclaimed
from the sea. These subnational tiers are responsible
for most of the expensive, labour-intensive welfare
state services (municipalities account for roughly
one-third of public expenditure, though much of
this is financed by central government). Many of
the cutbacksof the1980sweredirectedat these levels.
L. Contents of the reform package
The contents of the reform package developed over
time, with shifts in the coalition government, and
with changes in the fortunes of the Dutch economy.
In general terms it might be said that a more radical
package appeared in the early part of our period,
especially under the ‘Lubbers 1’ centre-right coalition
of 1982–6. Privatizationwas a prominent theme, but
the scope for returning state bodies to private owner-
ship was less than in theUK or New Zealand, because
the extent of pre-existing state ownership was more
modest. Nevertheless the Postbank (10,500 staff),
Posts and Telecommunications (95,000 staff), the
Royal Mint, and the Fishery Port Authority—the
fourmain state companies—were either corporatized
or wholly or partly sold off.
Alongside privatization, the ‘Lubbers 1’ admin-
istration announced a series of ‘great operations’.
These comprised measures to trim central govern-
ment spending, decentralize activities to lower
levels of government, and simplify legal and
bureaucratic procedures.
The 1980s was also a period in which many new
ZBOs (autonomous (semi) public organizations)
were created. A survey showed that, by 1992, 18
per cent of total state expenditure passed through
these semi-autonomous bodies. Some were long-
established (e.g De Nederlandse Bank) but more
than 40 per cent dated from after 1980 (Algemene
Rekenkamer, 1995). In 2005 one count numbered
the population of ZBOs at well over 600 (see also
Bouckaert et al., 2010, Chapter 10).
In the 1990s the departmental agency, rather
than the ZBO, became the fashionable format for
decentralizing administrative authority. These
included (for example) agencies for Meteorology,
Immigration and Naturalization, Defence Tele-
matics, and the Government Buildings Service.
In HRM/personnel management there was a
gradual shift towards the ‘normalization’ of the
terms of public service, that is, bringing them more
in line with private sector labour conditions. The
Netherlands, along with most other countries in
this study, experienced a tension between the desire
to use HRM to build a more skilled and highly moti-
vated workforce, and the desire to shed jobs and
economize (Korsten and der Krogt, 1995). In 1995
a senior civil service (De Algemeen Bestuursdienst) was
introduced.
Throughout the period there was a trend to
develop and refine performance indicators for a wid-
ening range of public services. Initially there was a
firm policy to have a high performance indicator
coverage of the budget (VBTB), including efficiency
and effectiveness, and to have developedmonitoring
systems, also for benchmarking purposes (De Kool,
2008), plus a rich cost-accounting system. This policy
has been weakened by the ‘comply or explain’ and
‘trust’ guidelines which have a) reduced the indicator
coverage in key documents, b) led to the redefinition
of cost information as non-financial information
which does not need to be audited, and c) empha-
sized trust-driven relationships for control, including
municipalities (though how far this is rhetoric rather
than reality is hard to tell).
Since the 1970s the Dutch government has been
interested in performance-oriented budgeting and
policy analysis. During the 1980s the need for
stringent financial control dominated the perfor-
mance agenda. As the government finances were
again under control in the early 1990s, results-ori-
ented budgeting and management regained atten-
tion. In 1991 internal agencies were set up within
the departments. These internal agencies have an
accrual budget and are managed by a results ori-
ented steering model (Smullen, 2010). In the
1990s there was also an increasing trend to inte-
grate performance measures into the budget docu-
ments. Finally, in 2001, performance budgeting
was legally implemented (VBTB): the format of
the budget bill became outcome-oriented and pol-
icy objectives and performance measures were
integrated in the explanatory memorandum.
Departmental accounting offices were transformed
into departmental audit offices (2002) which were
merged into the Central Audit Directorate (2008).
This is part of a concern to reduce the
294 APPENDIX B: COUNTRY FILES AND TABLES OF EVENTS
administrative overload of inspection, checking,
and auditing. Reducing the ‘control tower’ became
a concern stemming from the doctrine that the
benefits of measurement and regulation should be
significantly more substantial than the costs (see
also Bouckaert and Halligau, 2008, appendix V).
M. The implementation process
In many, perhaps most countries, the rhetoric of
public management reform outdistances the actual
changes in practice. This has certainly been true for
the Netherlands. The implementation of decentral-
ization is a good example:
the decentralisation process in the 1980s and 1990s
became largely a power struggle. Spending depart-
ments often held out resolutely (and with success)
against the transfer of power to provinces and munici-
palities. Decentralisation only began to asume any
importance when spending cuts and decentralisation
were brought together in a single context: municipal-
ities were permitted to take over certain tasks if they
were prepared to accept 90% funding; the 10% con-
traction was (without much evidence) justified as ‘effi-
ciency gains’. (Derksen and Korsten, 1995, p. 83)
More generally, implementation has been an incre-
mental and selective process—much less of a series
of dramatic ‘waves’ as in the UK or New Zealand.
This is perhaps only to be expected of a politico-
administrative system that prides itself on its con-
sensual character. However, this is not to suggest
that implementation has always been smooth.
Waves of savings have affected implementation,
and waves of political pressure by radical and popu-
list parties have shifted the policy contents.
N. Reforms actually achieved
The Netherlands is a country where programme
and policy evaluation has been fairly widely prac-
tised (even as early as 1991 a survey recorded 300
evaluations being undertaken across 14 minis-
tries) but for a considerable time, relatively little
of this effort has focused upon management re-
forms per se. For example, many ZBOs were cre-
ated during the 1980s, but, writing in the mid
1990s, one Dutch expert considered that their
performance was a blind spot (Leeuw, 1995). Cer-
tainly there does not seem to have been any
overall evaluation of the reforms, such as the
‘great operations’ of the Lubbers 1 and 2 adminis-
trations. There have, however, been a few aca-
demic assessments (e.g. Ministerie van
Binnenlandse Zaken, 2009a). There have also
been partial evaluations by the administration,
for example on VBTB, on quality in the public
sector (Ministerie van Binnenlandse Zaken,
2009c), and by the Court of Audit (Algemene Re-
kenkamer), for example on the functionality of
the agencies. In particular, the Algemene Rekenka-
mer published a 1995 report which was highly
critical of the lack of public accountability of
some ZBOs. The report indicated that only 22
per cent of the ZBOs surveyed produced perfor-
mance indicator data for their parent ministries.
Financial control procedures were often weak,
and in some cases the legal basis for certain
tasks was not clear (Algemene Rekenkamer, 1995).
The Court of Audit has from time to time
continued to produce critical reports of a number
of the key public management reforms (see www.
rekenkamer.nl).
THE NETHERLANDS 295
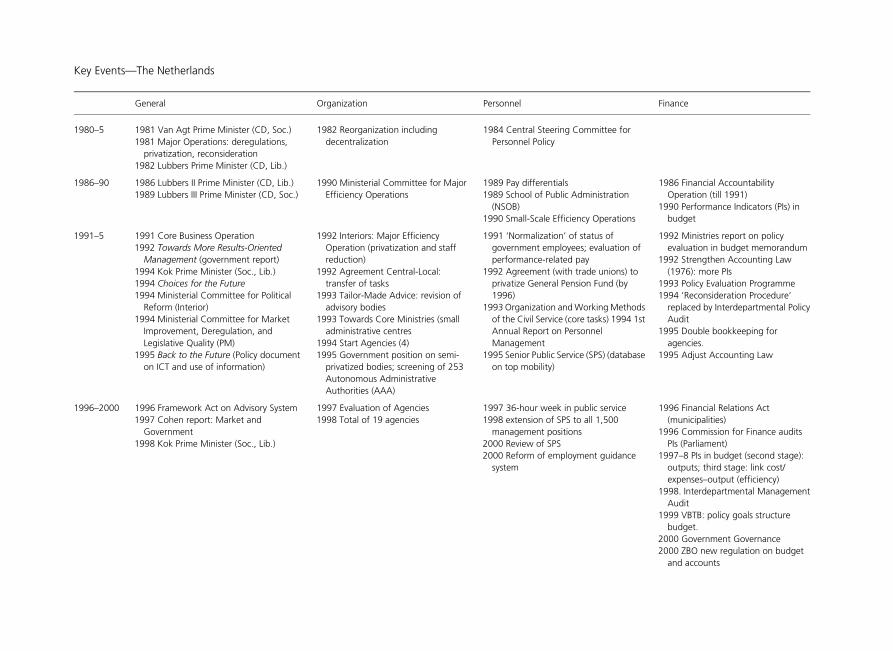
Key Events—The Netherlands
General Organization Personnel Finance
1980–5 1981 Van Agt Prime Minister (CD, Soc.)
1981 Major Operations: deregulations,
privatization, reconsideration
1982 Lubbers Prime Minister (CD, Lib.)
1982 Reorganization including
decentralization
1984 Central Steering Committee for
Personnel Policy
1986–90 1986 Lubbers II Prime Minister (CD, Lib.)
1989 Lubbers III Prime Minister (CD, Soc.)
1990 Ministerial Committee for Major
Efficiency Operations
1989 Pay differentials
1989 School of Public Administration
(NSOB)
1990 Small-Scale Efficiency Operations
1986 Financial Accountability
Operation (till 1991)
1990 Performance Indicators (PIs) in
budget
1991–5 1991 Core Business Operation
1992 Towards More Results-Oriented
Management (government report)
1994 Kok Prime Minister (Soc., Lib.)
1994 Choices for the Future
1994 Ministerial Committee for Political
Reform (Interior)
1994 Ministerial Committee for Market
Improvement, Deregulation, and
Legislative Quality (PM)
1995 Back to the Future (Policy document
on ICT and use of information)
1992 Interiors: Major Efficiency
Operation (privatization and staff
reduction)
1992 Agreement Central-Local:
transfer of tasks
1993 Tailor-Made Advice: revision of
advisory bodies
1993 Towards Core Ministries (small
administrative centres
1994 Start Agencies (4)
1995 Government position on semi-
privatized bodies; screening of 253
Autonomous Administrative
Authorities (AAA)
1991 ‘Normalization’ of status of
government employees; evaluation of
performance-related pay
1992 Agreement (with trade unions) to
privatize General Pension Fund (by
1996)
1993 Organization andWorkingMethods
of the Civil Service (core tasks) 1994 1st
Annual Report on Personnel
Management
1995 Senior Public Service (SPS) (database
on top mobility)
1992 Ministries report on policy
evaluation in budget memorandum
1992 Strengthen Accounting Law
(1976): more PIs
1993 Policy Evaluation Programme
1994 ‘Reconsideration Procedure’
replaced by Interdepartmental Policy
Audit
1995 Double bookkeeping for
agencies.
1995 Adjust Accounting Law
1996–2000 1996 Framework Act on Advisory System
1997 Cohen report: Market and
Government
1998 Kok Prime Minister (Soc., Lib.)
1997 Evaluation of Agencies
1998 Total of 19 agencies
1997 36-hour week in public service
1998 extension of SPS to all 1,500
management positions
2000 Review of SPS
2000 Reform of employment guidance
system
1996 Financial Relations Act
(municipalities)
1996 Commission for Finance audits
PIs (Parliament)
1997–8 PIs in budget (second stage):
outputs; third stage: link cost/
expenses–output (efficiency)
1998. Interdepartmental Management
Audit
1999 VBTB: policy goals structure
budget.
2000 Government Governance
2000 ZBO new regulation on budget
and accounts
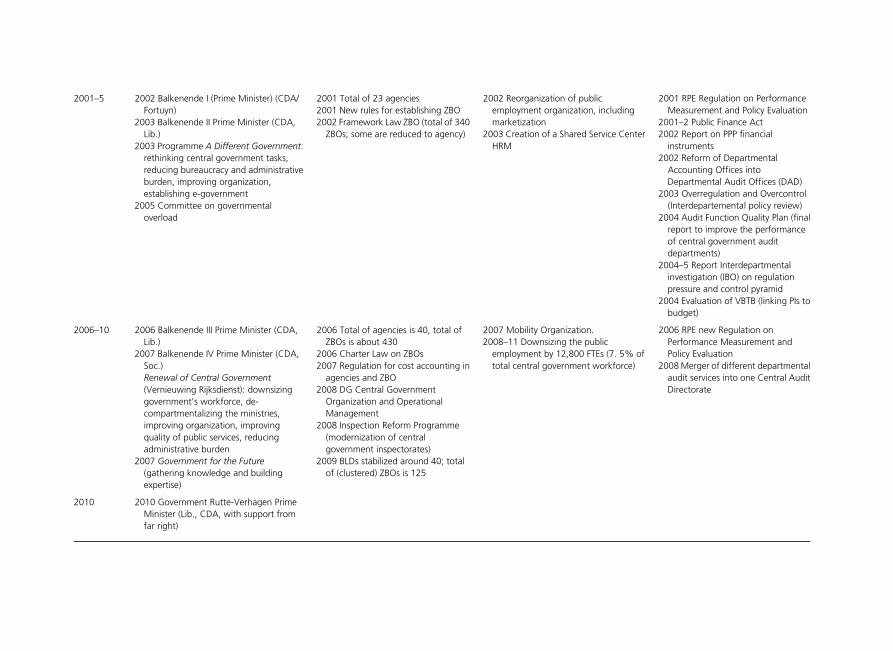
2001–5 2002 Balkenende I (Prime Minister) (CDA/
Fortuyn)
2003 Balkenende II Prime Minister (CDA,
Lib.)
2003 Programme A Different Government:
rethinking central government tasks,
reducing bureaucracy and administrative
burden, improving organization,
establishing e-government
2005 Committee on governmental
overload
2001 Total of 23 agencies
2001 New rules for establishing ZBO
2002 Framework Law ZBO (total of 340
ZBOs; some are reduced to agency)
2002 Reorganization of public
employment organization, including
marketization
2003 Creation of a Shared Service Center
HRM
2001 RPE Regulation on Performance
Measurement and Policy Evaluation
2001–2 Public Finance Act
2002 Report on PPP financial
instruments
2002 Reform of Departmental
Accounting Offices into
Departmental Audit Offices (DAD)
2003 Overregulation and Overcontrol
(Interdepartemental policy review)
2004 Audit Function Quality Plan (final
report to improve the performance
of central government audit
departments)
2004–5 Report Interdepartmental
investigation (IBO) on regulation
pressure and control pyramid
2004 Evaluation of VBTB (linking PIs to
budget)
2006–10 2006 Balkenende III Prime Minister (CDA,
Lib.)
2007 Balkenende IV Prime Minister (CDA,
Soc.)
Renewal of Central Government
(Vernieuwing Rijksdienst): downsizing
government’s workforce, de-
compartmentalizing the ministries,
improving organization, improving
quality of public services, reducing
administrative burden
2007 Government for the Future
(gathering knowledge and building
expertise)
2006 Total of agencies is 40, total of
ZBOs is about 430
2006 Charter Law on ZBOs
2007 Regulation for cost accounting in
agencies and ZBO
2008 DG Central Government
Organization and Operational
Management
2008 Inspection Reform Programme
(modernization of central
government inspectorates)
2009 BLDs stabilized around 40; total
of (clustered) ZBOs is 125
2007 Mobility Organization.
2008–11 Downsizing the public
employment by 12,800 FTEs (7. 5% of
total central government workforce)
2006 RPE new Regulation on
Performance Measurement and
Policy Evaluation
2008Merger of different departmental
audit services into one Central Audit
Directorate
2010 2010 Government Rutte-Verhagen Prime
Minister (Lib., CDA, with support from
far right)
NEW ZEALAND
A. Socio-economic forces: general
New Zealand is a small country (estimated popula-
tion 4.4million in2010) in a peripheral geographical
location (2,000 km from Australia). GNP per capita
fell from 90 in 1985 to 76 in 1992 (where OECD
average = 100). In 2007 it remained the lowest of
our twelve countries (see Appendix A). There used
to be very close economic and cultural ties to the UK,
but these began to dwindle after the UK joined the
European Community in 1973, and the favoured
arrangements for NZ agricultural exports to the UK
marketwere dismantled. There are twomain popula-
tion groups—whites and Maoris. The latter (12% of
the population) have been increasingly politically
active in insisting on their rights and pointing to
inequalities—aprocess sometimesdescribed as ‘inter-
nal decolonization’ (Castles et al., 1996, chapter 7).
See Appendix A for details of New Zealand’s
comparative position.
B. Global economic forces
The system of protectionism which had been in
place since the Second World War was close to the
point of collapse by the early 1980s. In 1952, 65 per
cent of exports had gone to the UK and only 1.7 per
cent to Asia. By 1982 the first figure had fallen to
14.7 per cent and the second had risen to 31.8 per
cent (Castles et al., 1996, p. 25).
When the new Labour government led by David
Lange came to power in July 1984 the economywas
stagnant and the national debt was large. The NZ
Reserve Bank suspended trading in the NZ dollar
and a 20 per cent devaluation quickly followed. The
government’s first priorities were tax reform, finan-
cial deregulation, and privatization. The compre-
hensive (and subsequently world-famous) public
management reforms of 1984–90 flowed directly
from this financial and economic crisis. There are
alternative interpretations concerning the extent
towhich the exchange rate crisis was also the symp-
tomof a deeper economic crisis—critics say the new
government exploited the situation to push
through its radical agenda.
Restructuring the economy was undertaken at
high speed, but the beneficial impacts took more
than five years to show through. The interim
period was very tough. In 1985 inflation reached
13 per cent. Overseas firms were prominent bene-
ficiaries of the privatization programme, being
mainly responsible for the purchase of the rail-
ways, the telephone system, and (thanks to finan-
cial deregulation) most of the major banks.
Between 1985 and 1992 the economy actually
shrank by 1 per cent. Between 1995 and 2008,
however, respectable growth rates returned (see
Table A.1).
C. Sociodemographic change
Prior to 1984 unemployment had usually been low
(less than 5 per cent) in NZ. It rose rapidly between
1985 and the early 1990s, reaching more than 10
per cent in 1992/3. The social effects of this were
widespread and harsh. This was partly because
many social benefits were linked to employment
status but also because from 1990 the National
Government initiated the rapid dismantling of
much of the previous welfare state system.
Speaking of the 1980s, Castles et al. (1996, p. 101)
refer to:
a very substantial decline in real wages over the latter
half of the period was accompanied by distributional
effects . . . These included an increased incidence of low
pay for men, a decline in the share of real gross income
of wage and salary earners accruing to each of the
bottom three quintiles and a marked increase in the
share of the top quintile.
As might be expected, women and ethnic minor-
ities were particularly hard hit by the simultaneous
worsening of employment conditions and slim-
ming down of welfare provision.
During the twenty-first century New Zealand
faces the same problems of ageing populations as
all our other countries. At the moment it enjoys a
somewhat younger population than most, but it is
projected to experience a big growth in the elderly
share after 2020 (Table A.6). In income terms it is a
relatively egalitarian country (Table A.7).
D. National socio-economic policies
After 1984 there was a very clear commitment to a
comprehensive economic restructuring (see above):
tax reform (to lower the tax burdens on business);
298 APPENDIX B: COUNTRY FILES AND TABLES OF EVENTS
financial deregulation (to attract foreign capital);
and privatization (to promote efficiency and relieve
pressures onpublic spending). The generousNZwel-
fare state was left largely intact at first, but major
reforms aimedat reducingwelfare and social security
expenditure were instituted by the incoming
National Party government of 1990. An Employ-
ment Equity Act introduced by the Labour Govern-
ment in 1990 was soon repealed by its National
successor. The Employment Contracts Act signifi-
cantly deregulated the labour market. Since the
mid 1990s, and the return of economic growth, gov-
ernments have been able somewhat to soften their
mix of economic policies.
E. The political system
The political executive is drawn exclusively from a
small legislature, organized onWestminster princi-
ples. There is no upper house. There is no single
written constitutional document nor any other
major constraint on the government in power.
Until 1996 the electoral system was based on a
single-constituency-member, ‘first-past-the-post’
system, which usually delivered a single party to
power. Once in power: ‘Public servants and their
managers have long operated in a context in which
the Prime Minister and cabinet could, if they
wished, ride roughshod over any opposition’ (Bos-
ton et al., 1996, p. 68). However, following a con-
stitutional referendum in 1993 the electoral system
was changed (1996) to one based on mixed mem-
ber proportional representation (MMP). Subse-
quently, coalition governments have become the
norm, and there has been considerable re-arrange-
ment of the political parties.
Unlike other small countries in our set (Finland,
the Netherlands), New Zealand has traditionally
been fairly centralized. There has been: ‘A prefer-
ence for retaining key governmental powers and
responsibilities at the central government level,
with only limited devolution to sub-national gov-
ernment, despite considerable rhetoric about devo-
lution in the 1980s’ (Boston et al., 1996, p. 5).
F. New management ideas
The public management reforms in NZ were
unusual both in their comprehensiveness and in
the relatively high degree to which they were
based on explicitly theoretical ideas about manage-
ment. The then Central Financial Controller to the
Treasury wrote: ‘A number of literatures contribu-
ted . . . The sources included public choice theory,
managerialism, transaction cost economics, public
policy, public sector financial management and
accounting’ (Ball, 1993, p. 5).
There was a shared intellectual background
within the quite small group of key ministers,
senior civil servants, and businessmen who drove
through the reforms: ‘there were a series of quite
close relationships set up, from about 1982 on, by a
group that encompassed the corporate business
sector, the senior Labour parliamentary group’
(Canadian Broadcasting Corporation, 1994, p. 3).
The highly theoretical character of much of this
thinking was novel:
Like their British counterparts, senior New Zealand
public servants had not been known in the past for
their interest in theory. The emphasis on using theory
to guide policy was, therefore, a novelty. It seems to
have been due, at least in part, to the growing influ-
ence of economists and the particular kind of higher
education which many of these economists, especially
those in the Treasury, received. (Boston, 1995,
p. 168)
The content of this thinking, in institutional
terms, may be expressed as follows (borrowing
from Boston et al., 1996, pp. 81–2):
� prefer private sector over state sector organiza-
tions wherever possible, especially for commer-
cial functions;
� prefer non-departmental organizations over
ministerial departments, especially for policy
implementation;
� prefer small to large organizations;
� prefer single-purpose tomulti-purpose organizations;
� allow pluriform administrative structures rather
than seeking uniformity (‘horses for courses’);
� separate policy from operations;
� separate funding from purchasing and purchas-
ing from providing;
� separate operations from regulation;
� separate provision from review and audit;
� prefer multi-source to single-source supply;
� place like with like (primarily on the basis of the
purpose or the type of activity);
� aim for short (‘flat’) rather than long hierarchies;
� aim for ‘straight-line’ accountability/avoid ‘multi-
ple principals’;
� decentralize wherever possible.
Since the late 1990s a rather different set of ideas
has gained circulation. Drawing on international
debates, but adapting them to the particular
national circumstances, governments have
stressed the potential of e-government, the need
NEW ZEALAND 299
for ‘joining-up’, and the value of a unified, ethi-
cally committed public service.
G. Pressure from citizens
The rush of reforms from 1984 to 1994 could not be
described as a response to direct pressure from citi-
zens, in fact at first they were controversial and
widely unpopular. They were a package pushed
through quickly by an elite which took the window
of opportunity for radical reform (Aberbach and
Christensen, 2001). Since the 1996 shift to a system
of proportional representation, such untrammelled
elite actions have been rathermore difficult, and the
pace and scope of reform has been reduced.
H. Party political ideas
Until the advent of proportional representation in
1996 the main electoral competition had taken
place between the Labour Party (broadly social
democratic) and the National Party (broadly con-
servative). It is noticeable that the NZ Labour and
Australian Labor governments were the only
Labor/Social Democrat executives in the OECD to
respond to the global economic pressures of the
1980s by actively embracing market-oriented re-
forms (Castles et al., 1996, p. 2). Labour had been
in power from 1935 until 1949, and during that
time had established what was arguably the world’s
first comprehensive welfare state. After this, how-
ever, Labour enjoyed only brief periods in power
(1957–60 and 1972–5) before their coming to office
in 1984.
Specifically party political ideas do not appear to
have had much influence on the NZ reforms of
1984–90. The policies which were put in place were
developed rapidly and without much external con-
sultation by the governing elite (Castles et al., 1996).
Unlike the Australian Labor Party, the NZ Party did
not have particularly close linkswith the trade union
movement, and its relatively unrestrained constitu-
tional position allowed it to choose its policies with
fewmajor constraints. The ideaswhich have become
more prominent since the late 1990s (see Section F
above) do not seem to be strongly party-related:
rather they have been drawn from thewider interna-
tional circulation of ideas.
I. Chance events
It is not obvious that any chance events had a
major and direct influence on the course and
content of the public management reforms. How-
ever, it might be said that the Cave Creek disaster
(in which, in 1993, fourteen young people died
when an observation platform collapsed in a
Department of Conservation nature reserve)
provided a focus for much public unease about
the changes which had been implemented over
the previous decade. One theme in the media treat-
ment of the Cave Creek tragedy was the lack of
individual responsibility in the decentralized pub-
lic service (Gregory, 1998).
J. Elite decision-making
The small, elite group of Labour Party ministers
and civil servants who drove the NZ reforms from
1984 to 1990 were, in the main, enthusiasts for the
new management ideas spelled out in Section F
above. When the National Party returned to
power in 1990 there was no great change to this
‘menu’, other, perhaps, than a willingness to apply
these concepts even more vigorously than before
to the social protection system. Nevertheless, it
would be mistaken to see the NZ example as the
pure and undiluted application of a set of tightly
knit theoretical ideas. To begin with, the ideas do
not all fit together perfectly—sometimes different
principles or guidelines seem to point in different
directions. Furthermore, many detailed, practical
compromises had to be made (Boston et al., 1996,
pp. 82–6). For example:
despite the substantial privatisation programme dur-
ing the late 1980s, a number of important commercial
organisations remain in public ownership, and there
has been little public or political support for privatisa-
tion in areas like education, health care, and scientific
research. (Boston et al., 1996, p. 82)
By the turn of the century the mood had shifted
somewhat and, without favouring any fundamen-
tal reversal of the great changes of 1984–94, gov-
ernments became more concerned with issues of
better institutional coordination, restoring morale
and leadership within the public service, and more
community involvement in policymaking and ser-
vice design and delivery (Chapman and
Duncan, 2007; State Services Commission, 2001,
2002)
K. The administrative system
At the outset of the reforms the NZ public service
was a unified, non-party political, career service.
300 APPENDIX B: COUNTRY FILES AND TABLES OF EVENTS
Senior public servants ‘tended to take a broad
service-wide perspective at least as much as a nar-
row departmental focus’ (Boston et al., 1996,
p. 56). It was heavily rule-bound (especially in
matters of personnel and industrial relations),
and by the early 1980s was widely regarded as
inefficient.
Much of this was changed by the 1988 State
Sector Act (see below) and other reforms. Person-
nel powers were decentralized and senior civil ser-
vants were henceforth employed on performance-
related contracts. Large departmental structures
were broken up into a larger number of smaller
agencies, each with a more closely defined set of
objectives and targets. The turnover of chief ex-
ecutives was quite rapid—over 80 per cent of those
initially appointed had gone by 1995. Neverthe-
less, the State Services Commission has retained
effective control of senior appointments—the sys-
tem has not become as politicized as in Australia
(Halligan, 2002). Furthermore, although more
fragmented than formerly, it remains a highly
centralized system in comparison with countries
such as Finland, Germany, Sweden, or the USA
(see Table 3.2).
When concerns arose concerning the fragmen-
tation and loss of esprit de corp induced by the re-
forms the role of the State Services Commission
(SSC) was revived somewhat. The 2004 State Sector
Amendment Act enhanced its authority, and it
subsequently promulgated a set of key state service
development goals, which were themselves revised
in 2007. The SSC also supported improved coordi-
nation between agencies (State Services Commis-
sion, 2008; Bouckaert et al., 2010, Chapter 5).
L. The contents of the reform package
The key management changes from the period of
radical reform were embodied in four pieces of
legislation:
� The State Owned Enterprises Act, 1986. This
provided the basis for converting the old trading
departments and corporations into businesses
along private sector lines.
� The State Sector Act, 1988. Chief executives
became fully accountable for managing their
departments efficiently and effectively. The
role of the State Services Commissioner shifted
from that of employer and manager of the pub-
lic service to that of employer of the chief ex-
ecutives and adviser to the government on
general management and personnel issues.
Chief executives became the managers of their
own departmental staff.
� The Public Finance Act, 1989. Introduced accruals
accounting and insisted on a focus on outputs
and outcomes rather than inputs and activities.
� The Fiscal Responsibility Act, 1994. Obliged the
government to set out its fiscal objectives and
explain how these were related to stated princi-
ples of responsible fiscal management.
After 1994 the pace of reform slowed. There were
(understandably) signs of ‘reform fatigue’, and
there were modest retreats and readjustments
where the purity of the original doctrines seemed
to have led to obviously negative consequences.
Significantly, a major report in 2001 (the Review of
the Centre, see State Services Commission, 2001
2002) emphasized the following problems:
� the need for better co-ordination in what had
become a fragmented system of state sector
organizations;
� the need to concentrate more on the formula-
tion and pursuit of desired outcomes, rather than
simply mechanically pursuing outputs;
� the need to involve citizens and communities
more with policymaking, service design, and ser-
vice delivery;
� the need to strengthen the public service culture,
encourage the public service ethos, and invest in
public service leadership.
In addition to these issues (each of which provoked
certain particular reforms, such as strengthening
the State Services Commission—see Table of Key
Events), there were also (as inmost other countries)
a series of initiatives to develop and extend e-
government.
M. The implementation process
The implementation process was vigorous—at times
harsh—and fairly continuous for the eight years fol-
lowing the 1984 election. The key civil servants at
the Treasury and the State Services Commission
played central roles. Much use was also made of
management consultants and other experts brought
in from outside. The human relations climate was
often poor—formally a fairly humanist model of
Human Resource Management was adopted during
the 1980s, but inpractice thereweremany job losses,
large restructurings, great pressures, and many up-
heavals (Boston et al., 1996, p. 213).
NEW ZEALAND 301
By the early twenty-first century it seemed that
one of the longer-term results of the reforms—
especially the budget and financial management
reforms—had been a serious running down of the
capability of government departments (Newberry,
2002). Resource starvation and short-termism ap-
pears to have been built in (intentionally or other-
wise) to the procedures through which the Fiscal
Responsibility Act and the Public Finance Act have
been implemented.
The new issues and themes that arose from the
late 1990s (see Section L above) brought with them
a softer and less doctrinally charged manner of
implementation than had obtained 1984–94.
N. Reforms actually achieved
The NZ government achieved what was probably
the most comprehensive and radical set of public
management reforms of any OECD country. For
example, between 1988 and 1994 employment in
the public service declined from 88,000 to 37,000
(though this includes civil servants who were
transferred ‘off books’ to Crown Entities or State
Owned Enterprises).
Unlike many other countries, New Zealand gov-
ernments have commissioned at least two broad-
scope evaluations of the reforms (Steering Group,
1991; Schick, 1996). Both came to positive conclu-
sions, while identifying some areas of continuing
concern. The Steering Group believed that: ‘In the
view of most people we spoke to or heard from,
the framework is sound and substantial benefits
are being realized’ (Steering Group, 1991, p. 11).
Allen Schick, the American expert, concluded that
‘the reforms have lived up to most of the lofty
expectations held for them’ (Schick, 1996, Execu-
tive Summary). Major productivity and quality im-
provements have been won in the state trading
sector. The range of policy advice to ministers
seems to have broadened. There is much greater
flexibility of employment, and operational man-
agers wield genuinely decentralized powers. There
is much more performance information in the
public domain (Boston et al., 1996, pp. 359–61).
Less positive results included:
� The costs of reform have not been closely esti-
mated but seem very likely to have been high.
These include extensive disruption, loss of conti-
nuity and of ‘institutional memory’.
� A greater focus on outputs has been achieved,
but sometimes at the expense of some loss of
attention to outcomes (see State Services Commis-
sion, 2001, 2002).
� The accountability and monitoring arrange-
ments for the somewhat diverse ‘crown entity’
category of institutions are unclear.
� It seems that there has been a gradual erosion of
both the financial and the human resources of
government departments (Whitcombe and
Gregory, 2008; Newberry, 2002). However,
although the size of the NZ public service was
at first radically reduced (88,000 in 1984, fewer
than 35,000 in 1995), it thereafter grew again,
and by 2007 had reached 44,300.
302 APPENDIX B: COUNTRY FILES AND TABLES OF EVENTS
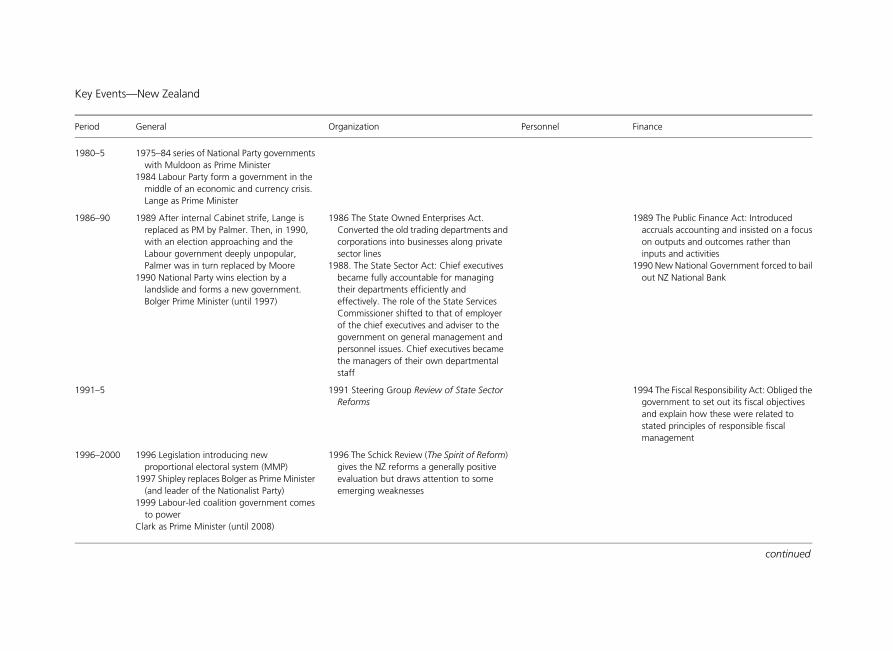
Key Events—New Zealand
Period General Organization Personnel Finance
1980–5 1975–84 series of National Party governments
with Muldoon as Prime Minister
1984 Labour Party form a government in the
middle of an economic and currency crisis.
Lange as Prime Minister
1986–90 1989 After internal Cabinet strife, Lange is
replaced as PM by Palmer. Then, in 1990,
with an election approaching and the
Labour government deeply unpopular,
Palmer was in turn replaced by Moore
1990 National Party wins election by a
landslide and forms a new government.
Bolger Prime Minister (until 1997)
1986 The State Owned Enterprises Act.
Converted the old trading departments and
corporations into businesses along private
sector lines
1988. The State Sector Act: Chief executives
became fully accountable for managing
their departments efficiently and
effectively. The role of the State Services
Commissioner shifted to that of employer
of the chief executives and adviser to the
government on general management and
personnel issues. Chief executives became
the managers of their own departmental
staff
1989 The Public Finance Act: Introduced
accruals accounting and insisted on a focus
on outputs and outcomes rather than
inputs and activities
1990 New National Government forced to bail
out NZ National Bank
1991–5 1991 Steering Group Review of State Sector
Reforms
1994 The Fiscal Responsibility Act: Obliged the
government to set out its fiscal objectives
and explain how these were related to
stated principles of responsible fiscal
management
1996–2000 1996 Legislation introducing new
proportional electoral system (MMP)
1997 Shipley replaces Bolger as Prime Minister
(and leader of the Nationalist Party)
1999 Labour-led coalition government comes
to power
Clark as Prime Minister (until 2008)
1996 The Schick Review (The Spirit of Reform)
gives the NZ reforms a generally positive
evaluation but draws attention to some
emerging weaknesses
continued
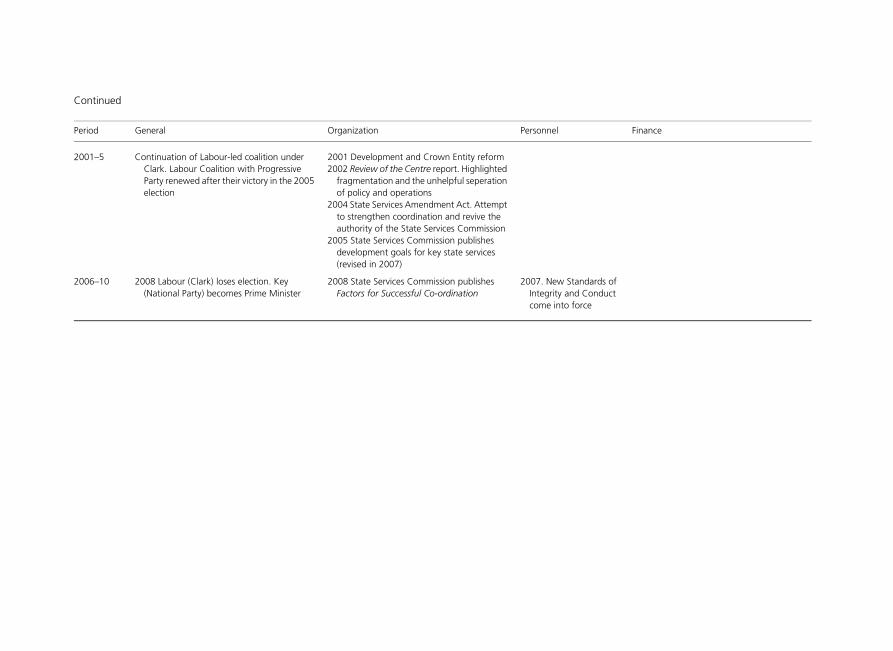
Continued
Period General Organization Personnel Finance
2001–5 Continuation of Labour-led coalition under
Clark. Labour Coalition with Progressive
Party renewed after their victory in the 2005
election
2001 Development and Crown Entity reform
2002 Review of the Centre report. Highlighted
fragmentation and the unhelpful seperation
of policy and operations
2004 State Services Amendment Act. Attempt
to strengthen coordination and revive the
authority of the State Services Commission
2005 State Services Commission publishes
development goals for key state services
(revised in 2007)
2006–10 2008 Labour (Clark) loses election. Key
(National Party) becomes Prime Minister
2008 State Services Commission publishes
Factors for Successful Co-ordination
2007. New Standards of
Integrity and Conduct
come into force
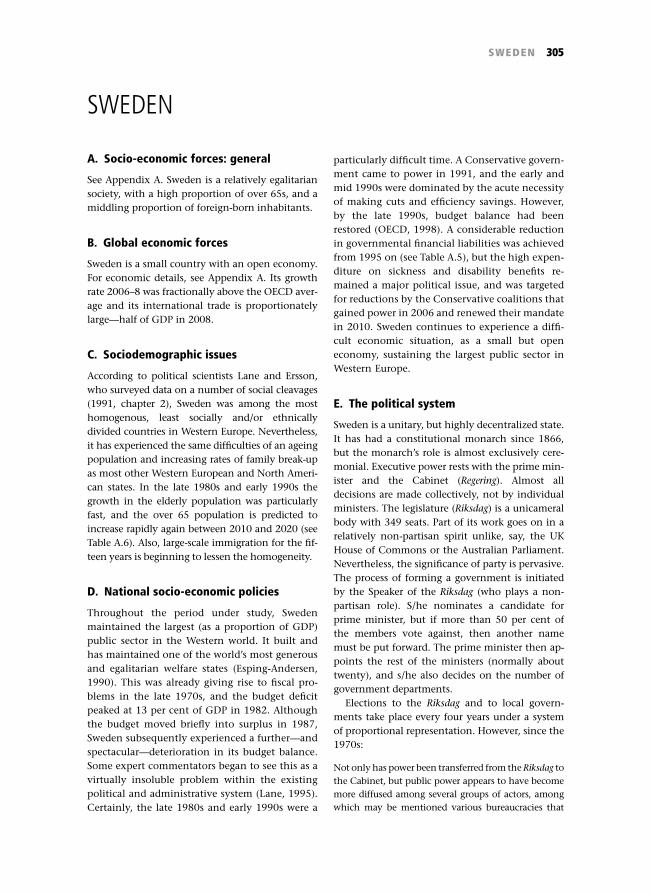
SWEDEN
A. Socio-economic forces: general
See Appendix A. Sweden is a relatively egalitarian
society, with a high proportion of over 65s, and a
middling proportion of foreign-born inhabitants.
B. Global economic forces
Sweden is a small country with an open economy.
For economic details, see Appendix A. Its growth
rate 2006–8 was fractionally above the OECD aver-
age and its international trade is proportionately
large—half of GDP in 2008.
C. Sociodemographic issues
According to political scientists Lane and Ersson,
who surveyed data on a number of social cleavages
(1991, chapter 2), Sweden was among the most
homogenous, least socially and/or ethnically
divided countries in Western Europe. Nevertheless,
it has experienced the same difficulties of an ageing
population and increasing rates of family break-up
as most other Western European and North Ameri-
can states. In the late 1980s and early 1990s the
growth in the elderly population was particularly
fast, and the over 65 population is predicted to
increase rapidly again between 2010 and 2020 (see
Table A.6). Also, large-scale immigration for the fif-
teen years is beginning to lessen the homogeneity.
D. National socio-economic policies
Throughout the period under study, Sweden
maintained the largest (as a proportion of GDP)
public sector in the Western world. It built and
has maintained one of the world’s most generous
and egalitarian welfare states (Esping-Andersen,
1990). This was already giving rise to fiscal pro-
blems in the late 1970s, and the budget deficit
peaked at 13 per cent of GDP in 1982. Although
the budget moved briefly into surplus in 1987,
Sweden subsequently experienced a further—and
spectacular—deterioration in its budget balance.
Some expert commentators began to see this as a
virtually insoluble problem within the existing
political and administrative system (Lane, 1995).
Certainly, the late 1980s and early 1990s were a
particularly difficult time. A Conservative govern-
ment came to power in 1991, and the early and
mid 1990s were dominated by the acute necessity
of making cuts and efficiency savings. However,
by the late 1990s, budget balance had been
restored (OECD, 1998). A considerable reduction
in governmental financial liabilities was achieved
from 1995 on (see Table A.5), but the high expen-
diture on sickness and disability benefits re-
mained a major political issue, and was targeted
for reductions by the Conservative coalitions that
gained power in 2006 and renewed their mandate
in 2010. Sweden continues to experience a diffi-
cult economic situation, as a small but open
economy, sustaining the largest public sector in
Western Europe.
E. The political system
Sweden is a unitary, but highly decentralized state.
It has had a constitutional monarch since 1866,
but the monarch’s role is almost exclusively cere-
monial. Executive power rests with the prime min-
ister and the Cabinet (Regering). Almost all
decisions are made collectively, not by individual
ministers. The legislature (Riksdag) is a unicameral
body with 349 seats. Part of its work goes on in a
relatively non-partisan spirit unlike, say, the UK
House of Commons or the Australian Parliament.
Nevertheless, the significance of party is pervasive.
The process of forming a government is initiated
by the Speaker of the Riksdag (who plays a non-
partisan role). S/he nominates a candidate for
prime minister, but if more than 50 per cent of
the members vote against, then another name
must be put forward. The prime minister then ap-
points the rest of the ministers (normally about
twenty), and s/he also decides on the number of
government departments.
Elections to the Riksdag and to local govern-
ments take place every four years under a system
of proportional representation. However, since the
1970s:
Not only has power been transferred from theRiksdag to
the Cabinet, but public power appears to have become
more diffused among several groups of actors, among
which may be mentioned various bureaucracies that
SWEDEN 305
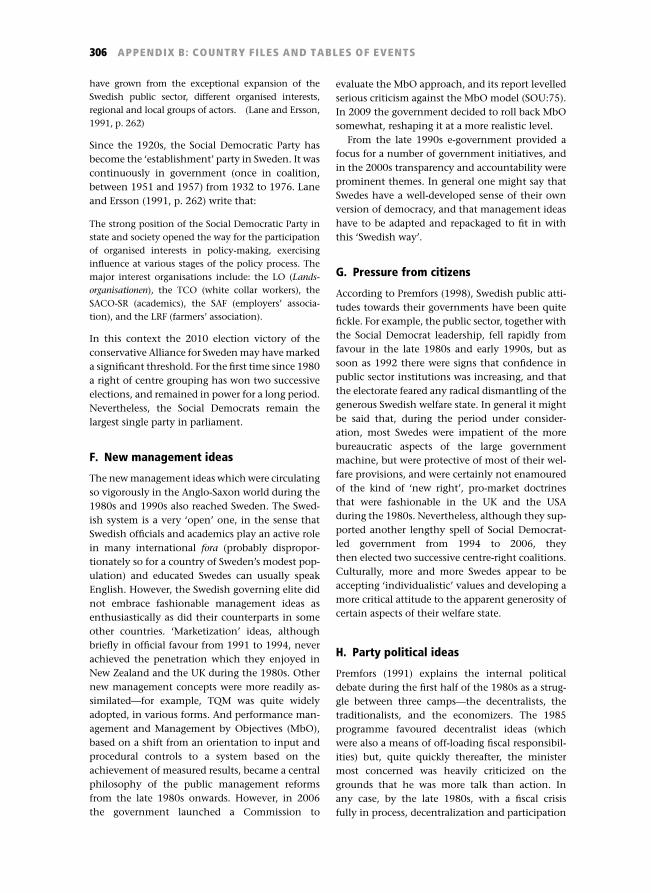
have grown from the exceptional expansion of the
Swedish public sector, different organised interests,
regional and local groups of actors. (Lane and Ersson,
1991, p. 262)
Since the 1920s, the Social Democratic Party has
become the ‘establishment’ party in Sweden. It was
continuously in government (once in coalition,
between 1951 and 1957) from 1932 to 1976. Lane
and Ersson (1991, p. 262) write that:
The strong position of the Social Democratic Party in
state and society opened the way for the participation
of organised interests in policy-making, exercising
influence at various stages of the policy process. The
major interest organisations include: the LO (Lands-
organisationen), the TCO (white collar workers), the
SACO-SR (academics), the SAF (employers’ associa-
tion), and the LRF (farmers’ association).
In this context the 2010 election victory of the
conservative Alliance for Swedenmay havemarked
a significant threshold. For the first time since 1980
a right of centre grouping has won two successive
elections, and remained in power for a long period.
Nevertheless, the Social Democrats remain the
largest single party in parliament.
F. New management ideas
The newmanagement ideas which were circulating
so vigorously in the Anglo-Saxon world during the
1980s and 1990s also reached Sweden. The Swed-
ish system is a very ‘open’ one, in the sense that
Swedish officials and academics play an active role
in many international fora (probably dispropor-
tionately so for a country of Sweden’s modest pop-
ulation) and educated Swedes can usually speak
English. However, the Swedish governing elite did
not embrace fashionable management ideas as
enthusiastically as did their counterparts in some
other countries. ‘Marketization’ ideas, although
briefly in official favour from 1991 to 1994, never
achieved the penetration which they enjoyed in
New Zealand and the UK during the 1980s. Other
new management concepts were more readily as-
similated—for example, TQM was quite widely
adopted, in various forms. And performance man-
agement and Management by Objectives (MbO),
based on a shift from an orientation to input and
procedural controls to a system based on the
achievement of measured results, became a central
philosophy of the public management reforms
from the late 1980s onwards. However, in 2006
the government launched a Commission to
evaluate the MbO approach, and its report levelled
serious criticism against the MbO model (SOU:75).
In 2009 the government decided to roll back MbO
somewhat, reshaping it at a more realistic level.
From the late 1990s e-government provided a
focus for a number of government initiatives, and
in the 2000s transparency and accountability were
prominent themes. In general one might say that
Swedes have a well-developed sense of their own
version of democracy, and that management ideas
have to be adapted and repackaged to fit in with
this ‘Swedish way’.
G. Pressure from citizens
According to Premfors (1998), Swedish public atti-
tudes towards their governments have been quite
fickle. For example, the public sector, together with
the Social Democrat leadership, fell rapidly from
favour in the late 1980s and early 1990s, but as
soon as 1992 there were signs that confidence in
public sector institutions was increasing, and that
the electorate feared any radical dismantling of the
generous Swedish welfare state. In general it might
be said that, during the period under consider-
ation, most Swedes were impatient of the more
bureaucratic aspects of the large government
machine, but were protective of most of their wel-
fare provisions, and were certainly not enamoured
of the kind of ‘new right’, pro-market doctrines
that were fashionable in the UK and the USA
during the 1980s. Nevertheless, although they sup-
ported another lengthy spell of Social Democrat-
led government from 1994 to 2006, they
then elected two successive centre-right coalitions.
Culturally, more and more Swedes appear to be
accepting ‘individualistic’ values and developing a
more critical attitude to the apparent generosity of
certain aspects of their welfare state.
H. Party political ideas
Premfors (1991) explains the internal political
debate during the first half of the 1980s as a strug-
gle between three camps—the decentralists, the
traditionalists, and the economizers. The 1985
programme favoured decentralist ideas (which
were also a means of off-loading fiscal responsibil-
ities) but, quite quickly thereafter, the minister
most concerned was heavily criticized on the
grounds that he was more talk than action. In
any case, by the late 1980s, with a fiscal crisis
fully in process, decentralization and participation
306 APPENDIX B: COUNTRY FILES AND TABLES OF EVENTS
tended to seem less pressing than cutting expendi-
tures. The economizers took over as the dominant
group. Management by results became one of the
most salient themes in administrative reform.
At the 1991 elections Sweden acquired its first
Conservative Prime Minister since 1930. Neo-lib-
eral ideas such as privatization and market testing,
extensively borrowed from New Zealand and the
UK, had been introduced by the Social Democrat
government in 1989, but now became even more
in favour among the political elite (Premfors, 1998,
pp. 151–2). However, this was a relatively brief
phase, and when the Social Democrats were voted
back into power in September 1994 the ‘reform
talk’ soon lost its high emphasis on the power of
markets to solve problems. Nevertheless, the Social
Democrat government did not introduce a new
public management policy—they continued with
elements of the previous one. The stress on econ-
omy and efficiency continued—and still con-
tinues—as budget problems are too deep to be
solved overnight. After 2006 Reinfeldt’s centre-
right coalition focused on tightening eligibility
for welfare benefits and on liberalizing the labour
market so as to try to reduce unemployment. It
would be a mistake, however, to see this as
Thatcher or Reagan-style neo-liberalism: rather it
is an incremental adjustment to what will still be
an unusually comprehensive welfare system.
I. Chance events
None of particular prominence.
J. Elite decision-making
Policymaking is typically an open process, with
extensive participation by experts and interested
groups. Commissions play an important role in
preparing new policies. Freedom of information
legislation gives the public access to almost all offi-
cial papers, even including most of the prime min-
ister’s correspondence.
One Swedish expert has suggested that, during
the period covered by this study, there were three
main schools of thought and opinion as to how
the Swedish government should respond to its
problems (Premfors, 1991—see Section H above).
Decentralizers wanted to relax the detailed grip of
the central state, and push out both operational
management decisions and some increasingly
uncomfortable resource allocation decisions to
other levels of government, and even down to
individual institutions, such as schools and hospi-
tals. Economizers were mainly concerned with the
looming deficit, and the inbuilt tendencies for
welfare expenditures to expand. They sought to
weaken the ‘distributional coalitions’ in Swedish
policymaking. Traditionalists concentrated on pre-
serving as much as they could of both the sub-
stance and the process of the Swedish state, as it
had existed during its ‘golden age’ in the 1960s
and early 1970s. From the late 1980s the econo-
mizers appeared to gain the upper hand, but Pre-
mfors (1998) suggests that, by the late 1990s, the
decentralizers were once more gaining ground.
Issues of feasibility have tended to be determined
partly by the strongly entrenched process by which
governmentdecisionswereusually arrived at in Swe-
den. Typically, agencies planned with the aid of
boards on which trade unions, employers associa-
tions, and other interest groups were strongly repre-
sented. Thus, feasibility questions were soon aired
with those who would have to ‘live’ with any pro-
posed reform, unlike the policymaking systems in,
for example, the UK and New Zealand (where some
reforms were conceived and promulgated by quite
small groups of politicians and senior officials). The
consensualist and corporatist ways of doing things
remain strong in Sweden, even if the advent of cen-
tre-right administrations since 2006 has probably
seen some shift in favour of organized business in-
terests as opposed to organized labour. In 2007 the
government decided to abolish the boards across a
range of agencies. Nowadays agencies tend to have
moredecentralized and informal networks than, say,
twenty years ago.
K. The administrative system
In 2009 only about 18 per cent of public servants
worked for central government (one of the four
lowest among our twelve countries—see Table
3.2). This reflects the importance of the county
and municipal levels in the Swedish administrative
system. There are 20 counties and 290 municipali-
ties. The counties are responsible for most health
care and are entitled to raise an income tax. Muni-
cipalities are responsible for housing, education,
and social welfare.
Central government is also very decentralized by
international standards (again, see Table 3.2). Swed-
ish central government agencies have their opera-
tional autonomy protected by the constitution, and
are responsible to the Cabinet collectively, not to
individualministers. In 2009 there were around 400
SWEDEN 307
of them, and they employed over 234,500 staff
(compared to the ministries, which employed
around 4,800, of which 1,300 were within the min-
istry of Foreign Affairs); 61 per cent were women
and 31 per cent men. Thus the ministries them-
selves tend to be small and largely devoted to policy
advice and the preparation of legislation. Doubts
have frequently been expressed concerning their
capacity to guide or control the agencies (Molander
et al., 2002; OECD, 1997a, p. 94, 1998 (Wilks,
1996)). However, recent scholarship on how gov-
ernments steer the agencies gives a somewhat more
positive picture (Jacobsson and Sundstr€om, 2009).
The Swedish civil service is non-partisan, and
minister/mandarin career paths are normally sepa-
rate (see Table 3.1). The culture has been one of
meritocracy and neutral competence. The top
three officials in ministries are the state secretary,
the director general for administrative affairs
and the director general for legal affairs. Of these
only the state secretary is a political appointment
(although the minister will also appoint a political
adviser and press secretary). It is also said that senior
appointments to the powerful agencies (which are
responsible for most implementation activities)
have tended to become more party political in
recent years (Molander et al., 2002). However,
when the right-wing government came to power
in 2006, they reformed the recruitment process in
the direction of making it less party political.
L. Contents of the reform package
Following its 1976 ousting from government, the
Social Democratic Party rethought its policies.
One factor in their defeat appeared to be the way
in which many people associated it, as the ‘estab-
lishment’ party, with bureaucratic inertia. When
the Social Democrats returned to power in 1982
they were therefore determined to change their
image in this respect, and to make the state
machine more responsive and accessible to the
ordinary citizen. They created a Ministry of Public
Administration as a symbol of their reforming
intent. In 1985 a Government Modernization
Programme laid considerable stress on decentrali-
zation from the centre to counties and munici-
palities. Increased choice and user responsiveness
were also emphasized. Deregulation and de-
bureaucratization were further themes. Personnel
authority was decentralized, so that agencies could
now hire their own staff and set their own salary
ranges, within national frameworks.
At that stage, privatization was not favoured. As
one senior civil servant put it in 1987: ‘The Swedish
government in principle rejects privatisation as a
means of solving the problems of the [public] sector.
Themain objection is that this would lead to distrib-
utive injustices’ (Gustafsson, 1987, p. 180).
In the late 1980s a second phase of reform began,
overshadowed by the growing fiscal crisis. The need
to make efficiency gains and savings was para-
mount. In 1990 an Administration Programme was
announced which aimed to generate a 10 per cent
reduction in the size of the public sector. This was
supposed to be achieved through a combination of
measures: abolishing ormerging agencies, increased
delegation, and various productivity improvement
initiatives. The focus on economy intensified with
the arrival of a conservative (Bildt) government in
1991. At this point there was considerable rhetoric
in favour of privatization, but inpractice the govern-
ment soon had to compromise on its original (and
quite extensive) privatization schemes. In any case,
the Social Democrats returned to power in 1994,
though by that time they had abandoned their
opposition in principle to privatization, and were
prepared to accept it on a selective and pragmatic
basis. Between 1990 and 1996 thirteen agencies did
become public companies (the Swedes, like the
Finns, tended to prefer a combination of the corpo-
rate format with state ownership rather than out-
right privatization like New Zealand and the UK).
During the 1990s there was a good deal of thinking
about what principles should govern each of the
differentmain types of organizations in the Swedish
public sector—legal and regulatory agencies, agen-
cies providing public services, state enterprises, state
companies, and so on.
From 1988 to 1993 a series of strong financial
management reforms were implemented, includ-
ing results-oriented budgeting, frame appropria-
tions, and accruals accounting. Results-oriented
management was officially adopted for all state
organizations from 1988. The rise of this form of
output- and outcome-oriented approach was ac-
companied by a parallel decline in the previously
formidable machinery of Swedish planning
(Wilks, 1996). Since 1993 each agency has been
required to publish an annual report which in-
cludes performance data, an income statement, a
balance sheet, an appropriation account, and a
financial analysis (OECD, 1997a, p. 90). In 1996
the budget process itself was reformed, with a bet-
ter defined first stage to the process in which firm
ceilings to overall expenditure were fixed (OECD,
308 APPENDIX B: COUNTRY FILES AND TABLES OF EVENTS
1998). On into the twenty-first century, further
budget modernization remained a central plank
of Swedish reform efforts. Proposals emerging
from the VESTA workgroup aimed at putting cen-
tral government and the national accounts on the
same performance-oriented, accruals-accounted
basis as the agencies (Gustafsson, 2000). A new
management philosophy, which is being gradually
phased in as a replacement to management by
results, is management focused on activities or
verksamhetsstyrning. The new model draws on a
huge number of performance indicators and
could thus be seen as a path-dependent continua-
tion of previous management reforms.
Limiting public expenditure was never off the
agenda. In 1993 a new system of central govern-
ment grants to the municipalities strengthened the
latter’s autonomy (fewer detailed regulations from
the centre) but also permitted central government
to fix tight frame budgets and leave the local autho-
rities to sort out how they would divide their cir-
cumscribed allocations.
Over the whole period from the mid 1980s, a
variety of service quality improvement schemes
were adopted, often based on TQM or ISO 9000
principles. These were implemented at all levels of
government but there was no central plan or
framework equivalent to, say, the UK Citizen’s
Charter (OECD, 1997a, p. 91). There was, however,
a Swedish Institute for Quality (SIQ) model which
has been quite widely adopted in the public sector,
and the EFQM model has also been used.
During the 2000s, themes coming to the fore have
included e-government as a means for strengthening
a citizen-focus and offering 24/7 public services, and
greater transparency, especially in the management
of agencies (although it has to be said that Sweden
alreadypossessedoneof themostopensystems in the
world). The Reinfeldt government has stressed the
principle that activities that can be handled by the
private market should not be provided by the state,
yet it would also be fair to say that the period since
2000 has not been one marked by any high-profile,
large-scale programmes for public management
reform (see also Bouckaert et al., 2010, chapter 7;
Bouckaert and Halligan, 2008, appendix).
M. The implementation process
Sweden has tended to avoid the sometimes stri-
dent or harsh styles of implementation favoured
by Mrs Thatcher’s administration in the UK,
Mr Lange’s in New Zealand, or Mr Howard’s in
Australia. The traditional Swedish processes of
intensive, corporatist discussions between the
main interested parties prior to action has, with a
few exceptions, persisted. However, the employ-
ers’ association, SAF, walked out of the agency
boards in the early 1990s, which has meant a
significant blow to the corporatist arrangements.
Informal discussions are important, not only in
the evolution of new policies, but also in the con-
tinuous steering of agencies (Pierre, 2003). As in
Finland, extensive use has been made of pilot
projects to test out key innovations (e.g. results-
oriented budgeting) before they were ‘rolled out’
to the government more generally. An example
would be the 1984 ‘Free municipalities’ experi-
ment, in which nine municipalities and three
county councils piloted a system of greater free-
dom from central state regulation. Strenuous ef-
forts were also made to minimize compulsory
redundancies among public servants.
N. Reforms actually achieved
There is no doubt that substantial decentraliza-
tion of powers to counties and municipalities was
achieved during the 1980s and 1990s (and that
this contributed to subsequent coordination pro-
blems). It is also clear that budgeting systems
have been extensively modernized, and that a
much more output-oriented set of arrangements
has been firmly put in place since the late 1980s.
Productivity studies, after showing a large overall
deterioration in public sector productivity during
the 1970s, and a smaller one even during the
1980s, indicated a productivity gain for the
early 1990s.
While a superficial reading of Swedish reform
documents might lead one to suppose that there
had been steady progress with certain themes (e.g.
performance management, agency accountability)
over a long time period, some academic analysis is
more sceptical. In a study of forty years of Swedish
performance management Sundstr€om (2006) con-
cluded that there were systematic and serious pro-
blems with the approach, but that these were never
openly recognized and confronted.
Sweden has developed a strong interest in eval-
uation, and a variety of evaluation bodies. The
National Audit Office (Riksrevisionsverket, later
Riksrevisionen) has long had an extensive role in
evaluation and performance auditing, and has
taken an interest in a number of public manage-
ment reforms (Pollitt et al., 1999). There is also an
SWEDEN 309

Expert Group on Public Finance, which has con-
ducted large-scale studies of public productivity,
and a Swedish Agency for Administrative Develop-
ment. Yet, despite the existence of these units, no
overall evaluation of the main reforms appears to
have been undertaken.
Against these substantial achievements must be
set the continuing concern that the central
ministries lack the capability to set a really well-
informed yet demanding set of performance tar-
gets for the agencies (Molander et al., 2002;
OECD, 1997a, 1998). Furthermore, it is by no
means clear that the members of the Riksdag are
overwhelmingly interested in making use of the
increased flow of performance data that is now
available.
310 APPENDIX B: COUNTRY FILES AND TABLES OF EVENTS
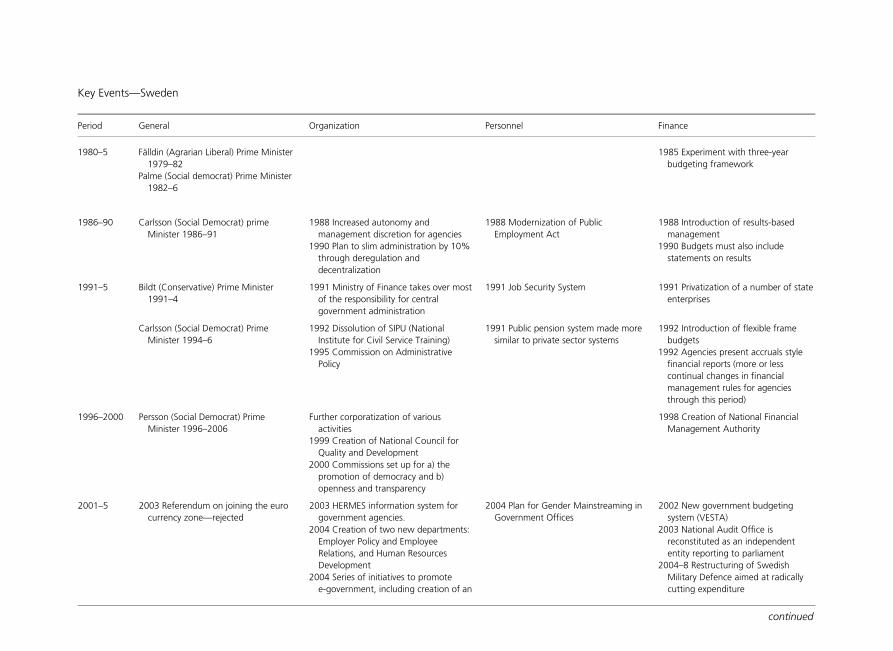
Key Events—Sweden
Period General Organization Personnel Finance
1980–5 Falldin (Agrarian Liberal) Prime Minister
1979–82
Palme (Social democrat) Prime Minister
1982–6
1985 Experiment with three-year
budgeting framework
1986–90 Carlsson (Social Democrat) prime
Minister 1986–91
1988 Increased autonomy and
management discretion for agencies
1990 Plan to slim administration by 10%
through deregulation and
decentralization
1988 Modernization of Public
Employment Act
1988 Introduction of results-based
management
1990 Budgets must also include
statements on results
1991–5 Bildt (Conservative) Prime Minister
1991–4
1991 Ministry of Finance takes over most
of the responsibility for central
government administration
1991 Job Security System 1991 Privatization of a number of state
enterprises
Carlsson (Social Democrat) Prime
Minister 1994–6
1992 Dissolution of SIPU (National
Institute for Civil Service Training)
1995 Commission on Administrative
Policy
1991 Public pension system made more
similar to private sector systems
1992 Introduction of flexible frame
budgets
1992 Agencies present accruals style
financial reports (more or less
continual changes in financial
management rules for agencies
through this period)
1996–2000 Persson (Social Democrat) Prime
Minister 1996–2006
Further corporatization of various
activities
1999 Creation of National Council for
Quality and Development
2000 Commissions set up for a) the
promotion of democracy and b)
openness and transparency
1998 Creation of National Financial
Management Authority
2001–5 2003 Referendum on joining the euro
currency zone—rejected
2003 HERMES information system for
government agencies.
2004 Creation of two new departments:
Employer Policy and Employee
Relations, and Human Resources
Development
2004 Series of initiatives to promote
e-government, including creation of an
2004 Plan for Gender Mainstreaming in
Government Offices
2002 New government budgeting
system (VESTA)
2003 National Audit Office is
reconstituted as an independent
entity reporting to parliament
2004–8 Restructuring of Swedish
Military Defence aimed at radically
cutting expenditure
continued
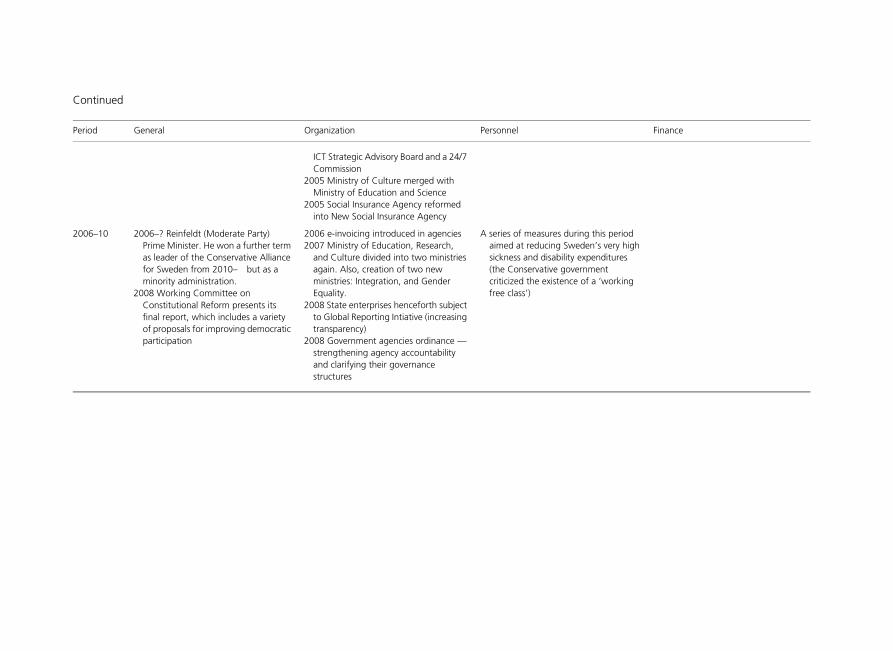
Continued
Period General Organization Personnel Finance
ICT Strategic Advisory Board and a 24/7
Commission
2005 Ministry of Culture merged with
Ministry of Education and Science
2005 Social Insurance Agency reformed
into New Social Insurance Agency
2006–10 2006–? Reinfeldt (Moderate Party)
Prime Minister. He won a further term
as leader of the Conservative Alliance
for Sweden from 2010– but as a
minority administration.
2008 Working Committee on
Constitutional Reform presents its
final report, which includes a variety
of proposals for improving democratic
participation
2006 e-invoicing introduced in agencies
2007 Ministry of Education, Research,
and Culture divided into two ministries
again. Also, creation of two new
ministries: Integration, and Gender
Equality.
2008 State enterprises henceforth subject
to Global Reporting Intiative (increasing
transparency)
2008 Government agencies ordinance —
strengthening agency accountability
and clarifying their governance
structures
A series of measures during this period
aimed at reducing Sweden’s very high
sickness and disability expenditures
(the Conservative government
criticized the existence of a ‘working
free class’)
UNITED KINGDOM
A. Socio-economic forces: general
See Appendix A.2 (above). The UK was one of the
countries hardest hit by the 2008 GEC, mainly
because the two most affected sectors—finance
and housing—are both proportionately large in
the UK economy. The end result was that the Con-
servative/Liberal Democrat government which
came to power in 2010 felt obliged to make very
large cuts in public spending (see more details
below).
B. Global economic forces
See Appendix A. Although Table A.3 shows that
the UK’s international trade as a percentage of
GDP is below the halfway point in our group of
twelve countries, the UK is far more exposed to
global forces than that figure alone would suggest,
not least because of the enormous importance of
the City of London as a global financial centre.
Over the past thirty years Europe has gradually
replaced the old British empire as the principal
trading partner (the UK became a member of the
EU in 1973).
C. Sociodemographic issues
See Appendix A. The UK has quite a high propor-
tion of foreign-born residents (Table A.8), and
experienced rapid immigration during the long
boom from the mid 1990s to 2008. Its elderly pop-
ulation is (2010) about halfway down the ‘league
table’ of our twelve countries but, as everywhere
else, is increasing (Table A.6).
D. National socio-economic policies
The advent of Mrs Thatcher’s Conservative govern-
ment in 1979 marked the final abandonment of
Keynesian policies of macro-economic manage-
ment and the beginning of an era of vigorous mon-
etarism. The general view was that the Public
Sector Borrowing Requirement (PSBR) was a key
variable that a responsible government should
seek to minimize. This, in turn, implied a tight
fiscal policy. So did the government’s continuing
determination to control inflation (which had
reached frighteningly high levels during the
1970s and which was still running faster than
that of most of the UK’s main economic compe-
titors). Thus the Conservative governments were
committed to reducing the proportion of GDP
that was represented by public spending. In prac-
tice, however, they were not tremendously suc-
cessful at first (see Thain and Wright, 1995 for the
details). Public sector borrowing fluctuated
widely during the period of Conservative rule.
At the beginning it had been 5 per cent of GDP.
In 1987/8 it had fallen to –0.5 per cent (i.e. there
was a surplus), but by 1993/4 it was up to 7.3
per cent.
The incoming 1997 Labour government inher-
ited a fairly healthy economic situation, but
committed itself to maintaining the previous
government’s tough spending plans for at least
two years. However, it introduced important new
principles and procedures for public expenditure
planning and control, including periodic ‘compre-
hensive spending reviews’ (the first of these came
in 1998, the second in 2000—see Chancellor of
the Exchequer, 1998). The 2000 review resulted in
substantial increases in spending on health care
and education. An important innovation that
came with the spending reviews was a system of
Public Service Agreements (PSAs) where each
department was obliged to make an agreement
with the Treasury to the effect that, for a given
level of funding, it would pursue a defined set of
objectives, each of which had one or more targets
attached. The increased spending seemed sustain-
able so long as the economy continued to grow,
but when the GEC arrived in 2008—and initially
vastly increased spending (to rescue banks etc.)—
large public deficits soon ensued. By 2009 it was
obvious that substantial spending cuts were all but
inevitable, and the arguments between the main
political parties were mainly about where and
when rather than about the required direction,
which almost all were forced, reluctantly, to
acknowledge. In October 2010 the new coalition
government finally introduced a harsh spending
review which projected very large cuts in public
spending over the following four years. It was
UNITED KINGDOM 313
estimated that these would cause roughly 0.5 mil-
lion job losses in the public sector, plus a further
0.5 milion in that part of the private sector that
relies on the public sector for work and income.
E. The political system
The UK is a unitary and highly centralized state.
The political system is majoritarian and adversar-
ial, with a first-past-the-post electoral basis. There
are two major parties (Conservative, Labour) and a
number of minor parties, the most important of
which is the Liberal Democrat party. All govern-
ments after the Second World War were Labour or
Conservative until the formal Conservative/Lib-
eral Democrat coalition created after the inconclu-
sive 2010 general election. The Cabinet is mainly
concerned with enforcing collective responsibility
among ministers and with endorsing new policies.
Most policies, however, are developed outside
Cabinet, in departments or cabinet committees.
The executive is powerful, reinforced by tight
party discipline in the lower house of the legisla-
ture (the Commons). In normal times it can
almost always get its legislation through. The
upper house, for most of the period a mixture of
a heriditary aristocracy, bishops, and appointed
‘life peers’, underwent major reform in 1999 to
remove most of the hereditary element (only 92
out of the 740 or so peers were henceforth heredi-
tary). The upper house basically only has the
power to delay, not to reject, government
legislation.
Another important constitutional change has
been the creation of separate parliaments/assem-
blies for Scotland and Wales. The significance of
these for public administration is still unfolding
but there are certainly some effects—for example,
some executive agencies being broken up into
separate English, Scottish, and Welsh bodies. At
first all three countries had the same party in
power (Labour), but after the 2010 general elec-
tion this was no longer the case, so new tensions
may arise.
F. New management ideas
The UK has been very much part of the Anglo-
phone, US-dominated world of managerialism,
management consultants, and management
gurus (Pollitt, 1993; Saint Martin, 2005). The Con-
servative governments of 1979–97 were particu-
larly open to generic management thinking, and
to ideas injected into government by the private
sector. Mrs Thatcher’s first efficiency adviser,
Derek Rayner, was a businessman, and many
other managers were subsequently brought into
government in various advisory capacities (Met-
calfe and Richards, 1990). The succeeding Labour
administration continued to use high-profile busi-
ness people for important public roles, as did the
Conservative/Liberal Democrat coalition from
2010. Government spending on management con-
sultancy rose to very high levels (National Audit
Office, 2006). Top government advisers usually
seemed to favour generic management theory (see,
e.g. Barber, 2007).
G. Pressure from citizens
There was no single, citizen-inspiredmovement for
reform. Management changes came from political,
business, and administrative elites. Nevertheless,
public opinion played a part. The popularity of
early measures of privatization (selling public
housing to the tenants, issuing shares for British
Telecom) helped convince the government that
this was a policy that could be pursued much fur-
ther. The public was also receptive to the govern-
ment’s message that the quality of public services
should be raised although, ironically, the 1991 Ci-
tizen’s Charter was launched very much as a top-
down exercise, with little consultation of public
opinion (Prime Minister, 1991). The general
‘decline of deference’ was also a significant back-
ground influence on a number of user-oriented
reforms.
During the New Labour administrations after
1997, public opinion tended to focus on the per-
formance of the major welfare state services,
health care, and education. The government
made these its top domestic priorities, and sub-
stantially increased expenditure in both sectors.
Much use was made of focus groups and public
opinion surveys. Results, however, were slow in
coming, and the government failed to achieve
some of its (many) targets, whilst fulfilling others.
Even where they had success, however, there was
the question of whether the public would believe
that services really were improved. The vast major-
ity of citizens were not aware of the detailed per-
formance information that was available, or, even
if they were aware of it, did not necessarily trust it.
At the beginning of the Conservative/Liberal
Democrat government a majority of the public
accepted that there needed to be substantial cuts
314 APPENDIX B: COUNTRY FILES AND TABLES OF EVENTS
in public spending, but that did not mean that
they accepted the particular cuts that were actu-
ally made.
H. Party political ideas
The decisive shift towards managerialism came in
1979, when a neo-conservative government was
elected in place of a centre-left administration (see
also Canada and the USA—but note that manage-
rialist reforms in Australia and New Zealand were
launched principally by centre-left parties—Castles
et al., 1996). However, that is not to say that, at the
beginning, Conservative politicians necessarily
had very precise ideas about management reform.
Rather it was a case of certain broad beliefs and
doctrines which inclined the government in a par-
ticular direction. Among these were beliefs that the
private sector was inherently more efficient than
the public sector, that the civil service was too
privileged and complacent, and that the state was
too big and too interventionist (Pollitt, 1993).
However, more detailed ideas evolved during the
long period in office.
The New Labour government which took over
from 1997 contained many traditional supporters
of public services. Party policy stressed ‘partner-
ships’, ‘modernization’, and (later) ‘joined-
up government’ rather than private sector solu-
tions. The internal market mechanisms in the
National Health Service were much disliked,
and were partly dismantled, as was the compulsori-
ness of contracting out local services. Never-theless,
behind these surface shifts away from market-
ization, many elements of NPM thinking
continued—not least performance measurement,
which was further intensified. More generally, the
Blair government’s early identification with a ‘third
way’ in politics, translated into a ‘third way’ in pub-
lic administration also—more public–private part-
nerships, extension of the Private Finance
Initiative, more benchmarking, and so on. From
about 2003 there came a strong emphasis on
‘choice’, which frequently implied MTMs of one
kind or another. When Cameron became prime
minister in 2010 he strongly promoted the idea of
a ‘big society’ rather than a ’big government’. The
precise implications of this were far from clear, but
the general direction seemed to be towards decen-
tralizing services and seeking to enlist both commer-
cial companies and civil society associations to take
over, or at least share in, activities previously per-
formed by public authorities.
I. Chance events
There is only one which stands out as having a
large and direct effect on management reform,
and that was the GEC of 2008 (unless one counts
the Falklands War as a chance, with its tonic effect
on the Conservative government’s electoral ratings
and subsequent success in the 1983 general elec-
tion—though even this would have to be seen as
an indirect influence).
On the other hand, there have been particular
events in particular organizations or sectors
which have had significant local influences. Ex-
amples would include a series of tragic failures in
child protection (which obliged governments to
address the reform of social services departments),
and the behaviour of certain left-wing local coun-
cils which provided central government (under
Mrs Thatcher) with one of its pretexts for abolish-
ing certain large, urban councils and instituting
various additional controls on the remainder.
Under New Labour a series of fatal train accidents
led directly to a reconsideration of the organiza-
tional arrangements for the privatized railway sys-
tem, and some strengthening of the public
presence on the regulating body. The National
Health Service continued under Labour, as under
the Conservatives, to supply the media with a
steady trickle of tragic and unfortunate episodes
which were inevitably used as political ammuni-
tion in the ongoing struggle to reform that huge
and complex set of organizations (e.g. Francis,
2010; Healthcare Commission, 2009).
J. Elite decision-making
The boldness of Mrs Thatcher’s Conservative gov-
ernment grew as its political confidence was
boosted by the election victories of 1983 and
1987. By the late 1980s some members of the
Cabinet, including Mrs Thatcher herself, advo-
cated the return of many hitherto public functions
and activities to the private sector, combined with
the introduction of market-type mechanisms to
much of the remaining, ‘rump’ public sector.
This general orientation continued into the
Major administration (1990–7), as evidenced by
the further privatizations of the railways and Brit-
ish Coal, the selling-off of some Next Steps execu-
tive agencies and the expansion of the Private
Finance Initiative. The aspirations of the incom-
ing Labour government of 1997 were different,
but not enormously so. The urge to privatize
UNITED KINGDOM 315
disappeared, but there was no countervailing desire
to take organizations or functions back into public
ownership. The Private Finance Initiative was re-
tained and expanded. Even if the tone was more
sympathetic to public sector staff, the general
belief in the scope for using business ideas to
improve public management and to provide more
efficient and high quality services persisted.
The unusual dominance of a single party form
of executive within the British system gives gov-
ernments an equally unusual ability to realize
their reform desires, even when these are contro-
versial in Parliament or unpopular in the country
(e.g. the 1989 reform of the National Health Ser-
vice was hugely unpopular, both among NHS staff
and the wider public, but the ‘provider market’
was forced through all the same, see Pollitt, Birch-
all, and Putman, 1998). It is clear that, since 1979,
governments of both major parties have regarded
continuing and deep administrative change as
perfectly feasible. In the UK the barriers to (and
political costs of) this kind of reform are consider-
ably lower than in many other countries. How-
ever, while reforms can be forced through again
and again, the consequences for those who run
public services can easily become negative. By the
time New Labour won its second election in 2001,
there were signs of ‘reform fatigue’ and ‘measure-
ment fatigue’ in several major public services. By
the end of the Brown administration (2010) the
unceasing flood of reports, reforms, and initiatives
was widely perceived as one of the government’s
weaknesses rather than as a strength (Pollitt,
2007).
K. The administrative system
The permanent civil service is still the main source
of advice and support for ministers, though it is
almost certainly less dominant in this role than it
was thirty years ago, and the use of substantial
numbers of partisan political advisers is now
firmly entrenched (Peters and Pierre, 2004). The
civil service is neutral in party political terms, right
up to the most senior level (permanent secretary).
The culture of the upper civil service is generalist
(and non-legalist). The single most important
constitutional doctrine for senior civil servants
remains that of ‘ministerial responsibility’ which
means (roughly) that ministers must answer to the
House of Commons for all the doings of their
ministries, and that civil servants normally remain
anonymous but have a prime duty to support and
protect ‘their’ minister. Therefore civil servants
are not held to have any higher duty towards ‘the
state’ (not a concept much in use), the legislature,
or the citizenry.
Central government is organized into depart-
ments, most of which are headed by a Cabinet
minister. The majority of civil servants now work
in semi-autonomous executive agencies, which are
still, constitutionally, part of their ‘parent’
departments ( Pollitt et al., 2004).
Local government is less protected from central
government interventions than in most other
European states. The period of Conservative
government from 1979 to 1997 was one of consi-
derable tension between the centre and local
authorities. Central government both passed
many new pieces of legislation restricting the dis-
cretion of local authorities (especially in relation to
finance) and gave many functions to local quangos
and other non-elected bodies (Cochrane, 1993;
Painter et al., 1996; Stoker, 1988). Relations
between central and local government were easier
after the New Labour government came to power
in 1997, but the habit of close central regulation
and supervision of local authorities has continued.
Thus from the late 1990s local authorities were
enmeshed in an elaborate, if regularly changing
system of performance measurement devised by
central government (Boyne and Law, 2005). The
Cameron coalition government came to power
promising greater freedom for local authorities,
but it also made very large cuts in their levels of
financial support. At the time of writing it remains
to be seen how these alleged new freedoms will
work out.
L. The contents of the reform package
With the advantage of hindsight, the period of
Conservative government could be said to have
three broad phases of development in respect to
management reform. From 1979 until 1982–3
there was a fierce drive for economies and the
elimination of waste. Civil service numbers were
cut, first by 14 per cent and then, subsequently, by
a further 6 per cent. Rayner scrutinies (see Metcalfe
and Richards, 1990) sought to find more efficient
ways of undertaking tasks, and usually concluded
that staffing reductions were possible.
In the early 1980s, however, the emphasis
shifted to improving financial and general man-
agement, and increasing efficiency. The Financial
Management Initiative was launched in 1982 and
316 APPENDIX B: COUNTRY FILES AND TABLES OF EVENTS
embraced the whole of central government with
its philosophy of more decentralized manage-
ment, more decentralized budgets, more targets,
and more professionalism (Zifcak, 1994). The
National Audit Office and Audit Commission
were brought into being (the relevant legislation
being passed in 1983 and 1982, respectively),
and each was given a mandate that stressed the
‘3Es’—economy, efficiency, and effectiveness. In
the National Health Service central government
insisted on the introduction of general managers
to every health authority (Harrison et al., 1992).
Performance indicator systems began to sprout
for most public services, central and local (Pollitt,
1986).
During the mid 1980s the privatization pro-
gramme gathered momentum, with the sales of
British Telecom (1984), British Gas (1986), the Brit-
ish Airports Authority (1987), and water supply
and sewerage (1989). Between 1979 and 1990
about 800,000 employees were transferred from
the public sector to the private.
The third phase of Conservative reform was the
most radical. Following their convincing victory in
the 1987 election, Mrs Thatcher’s administration
launched a series of fundamental restructurings.
Market-type mechanisms were introduced on a
large scale—in health care, community care, and
education. The ‘purchaser/provider split’ was
imposed by central government as a basic model
for most locally provided services (Pollitt, Birchall,
and Putman, 1998). Performance measurement
systems were sharpened, and the annual pub-
lication of national league tables for schools and
hospitals became significant media events. Privati-
zation continued (electricity, 1990–3; railways
1994). In central government the Next Steps report
of 1988 led to the creation, within ten years, of
more than 140 executive agencies which employed
in excess of 70 per cent of the non-industrial civil
service (Chancellor of the Duchy of Lancaster,
1997; O’Toole and Jordan, 1995). During the mid
1990s a number of central ministries were signifi-
cantly downsized, following a programme of man-
agement reviews (e.g. HM Treasury, 1994). In 1991
both the Citizen’s Charter (Prime Minister, 1991)
and ambitious programmes of contracting out
and market-testing were launched (Competing for
Quality—HMTreasury, 1991). These two well repre-
sented the main tendencies of the 1990s: a huge
emphasis on ‘customer service’ (Clarke and New-
man, 1997) and an equally intense concern to keep
up the pace of contracting out and marketization.
The new Labour government of 1997 reversed
very little of what had gone before. Although
ideologically more sympathetic to the public sec-
tor they did not reverse the privatizations or the
purchaser/provider splits, although they took
some steps to ameliorate the least popular conse-
quences of the latter. If anything, they intensified
the ‘league table’ system still further, and ‘re-
branded’ the Citizen’s Charter programme as the
‘Service First’ initiative. Many of their proposals
shared the underlying assumptions about the
transformatory capacity of better, more profes-
sional public management which had been char-
acteristic of their Conservative predecessors (e.g.
the idea of a benchmarked Procurement Excel-
lence model or the ‘Best value’ initiative in local
government—see Chancellor of the Exchequer,
1998). In 1999 the prime minister issued a
White Paper, Modernizing Government, which
offered a slightly curious mixture of old themes
(e.g. greater responsiveness and quality) with
faintly millenarial visions of the government’s
role in the ‘Information Age’ (Prime Minister
and the Minister for the Cabinet Office, 1999).
Subsequently the increases in public spending,
particularly in health care and education, were
accompanied by further intensification of central
target-setting and performance measurement,
continuing the trend towards ‘re-regulation’ of
the public sector which had begun under the
Conservatives (Hood et al., 1999). As Mr Blair
famously said, his second term of office came to
be about ‘delivery, delivery, delivery’ (see Barber,
2007).
It is hard to summarize developments between
the Modernizing Government White Paper (1999)
and the end of the New Labour administration
just over a decade later, partly because there were so
many of them! New initiatives, reports, and reorga-
nizations flooded out from Whitehall. Major public
services such as health care, education, and the
police were repeatedly reorganized and required to
adopt new central government initiatives (Pollitt,
2007; Pollitt and Bouckaert, 2009). Recurrent themes
included a continuing emphasis on performance
measurement, multiple attempts at ‘joined-up gov-
ernment’, great rhetorical stress on partnerships, and
much talk of increasing citizens’ ‘choice’ of public
services (see, e.g. Cabinet Office, 2000, 2008;
HM Government, 2009; HM Treasury, 2010;
National Audit Office, 2009, 2010). On the financial
side, the whole of central government moved to
accruals accounting. These reform themes involved
UNITED KINGDOM 317
various potentially conflicting instruments. Thus,
the Blair and Brown governments both continued
to develop a massive, top-down architecture
of performance measurement, often—but not
always—linked to the Treasury’s Public Service Agree-
ments (PSAs). This embraced local as well as central
government. Yet at the same time there was much
talk (and action) around partnership and decentrali-
zation. The latter themes were also in some tension
with the parallel calls for greater joining-up. Cer-
tainly market-type mechanisms continued to be
widely used, alongside strong hierarchical instruc-
tions. During the Brown administration (2008–10)
there were signs that the government was retreating
from some of its centralized command-and-control
activities (Cabinet Office, 2008; HM Government,
2009), but this retreat (if that is what is was) had
not gone very far before Labour fell from power in
the 2010 election (see also Bouckaert and Halligan,
2008, appendix and Bouckaert et al., 2010 chapter 6)
It is too soon to say much about the Cameron’s
Conservative/Liberal Democrat coalition govern-
ment. At the level of rhetoric it strongly empha-
sizes decentralization and ‘returning’ power and
initiative to local communities and, wherever pos-
sible, to civil society and the private sector. At the
same time it needs to make major cuts in public
expenditure. The first real clues as to how this
might work came with the Comprehensive Spend-
ing Review decisions announced in October 2010:
£83 billion of cuts were announced, including
reductions of 20 per cent in police spending, 8 per
cent in defence, 7 per cent in local government
funding and 25 per cent in the Department of
Justice. Health care and education were given pri-
ority, but, in the former case, the tiny increase
(0.1% per year over four years) will be swamped
by demographic and technological changes. Edu-
cation was cut by only 1 per cent, but nevertheless
spending on school building was reduced by
almost two-thirds, and funding for university tuti-
tion virtually disappeared (students instead faced a
big rise in fees). It will be interesting to see how and
how far these plans are implemented—the past
historical record suggests that the government is
likely to encounter severe practical and political
problems in carrying these plans through (Pollitt,
2010a).
The government also announced the disman-
tling of several elements of the New Labour man-
agement architecture. There was to be a ‘bonfire of
targets’, including the system of Departmental
Strategic Objectives which had been introduced
in 2007, and the pivotal Public Service Agreements
which had formed the basis of the system since
1998. Some key indicators will be kept, but, again,
the detail is not clear at the time of writing.
M. The implementation process
In the UK, reform has been continual, often
intense, and sometimes harsh. Public sector em-
ployees have become accustomed to constant re-
structurings, downsizings and new ‘initiatives’.
Much of the change has been strongly driven
from the top. The Treasury and the Cabinet Office
have been the main actors, though most depart-
ments have been heavily involved, especially
Health (for the NHS), Environment (for local gov-
ernment), Education (the reform of schools, col-
leges, and universities) and Social Security. Under
New Labour No. 10 Downing Street itself became a
significant reform ‘player’, housing, inter alia, the
Strategy Unit, the Prime Minister’s Delivery Unit
(Barber, 2007), and the Office of Public Services
Reform.
N. Reforms actually achieved
As noted above, British central government is rela-
tively unfettered in its ability tomake administrative
changes (Pollitt, 2007). So when it determines to
carry something through, it usually can. As Section
L made clear, many large-scale reforms have been
put in place. That is not to say that all have achieved
the results forecast or claimed for them. Sometimes
one can ‘take a horse to water but not make him
drink’ (see Pollitt, Birchall, and Putman, 1998, for
an assessment of this factor in health care, educa-
tion, and housing reforms).
The Conservative governments of 1979–97 were
not enthusiastic about mounting large-scale eva-
luations of their management reforms. Ministers
tended to take the line that reform was essential,
and self-evidently desirable, and that formal, pub-
lic evaluation might prove a delay and distraction.
Internal management reviews weremore common.
The 1997–2010 Labour governments were more
committed to formal evaluation, but often found
it politically expedient to move on to new reforms
before the full evaluations of their previous efforts
were available (Walker, 2001).
There have, however, been a number of specific
evaluations of particular initiatives, and some of
these were made available within the public
domain. For example, there was a useful series of
318 APPENDIX B: COUNTRY FILES AND TABLES OF EVENTS
assessments of the Next Steps programme, which
were basically positive in tone (e.g. Trosa, 1994)
although acknowledging the danger of fragmenta-
tion and loss of departmental control (Office of
Public Services Reform, 2002). There has also been
a series of very useful performance audits, ad-
dressed to different reforms, from the National
Audit Office (e.g. National Audit Office, 1999,
2006, 2009, 2010). For example, as reported in
Chapter 5, one study found that the departmental
Capability Review programme had apparently led
to improvements in capacity and leadership, but
that these could not be connected either to PSA
performance achievements or to outcomes
(National Audit Office, 2009).
Someacademic evaluationshavebegun to appear.
One of the most thorough of these suggests that
there have probably been substantial, though not
spectacular efficiency gains, increased responsive-
ness to service users, but significant loss of equity
(Boyne et al., 2003). Another has concluded that the
programme for reforming the civil service, while
falling well short of its claims for ‘transformation’
and radical step-change, has nevertheless achieved
more incremental/less spectacular continuous
improvement (Bovaird and Russell, 2007).
UNITED KINGDOM 319
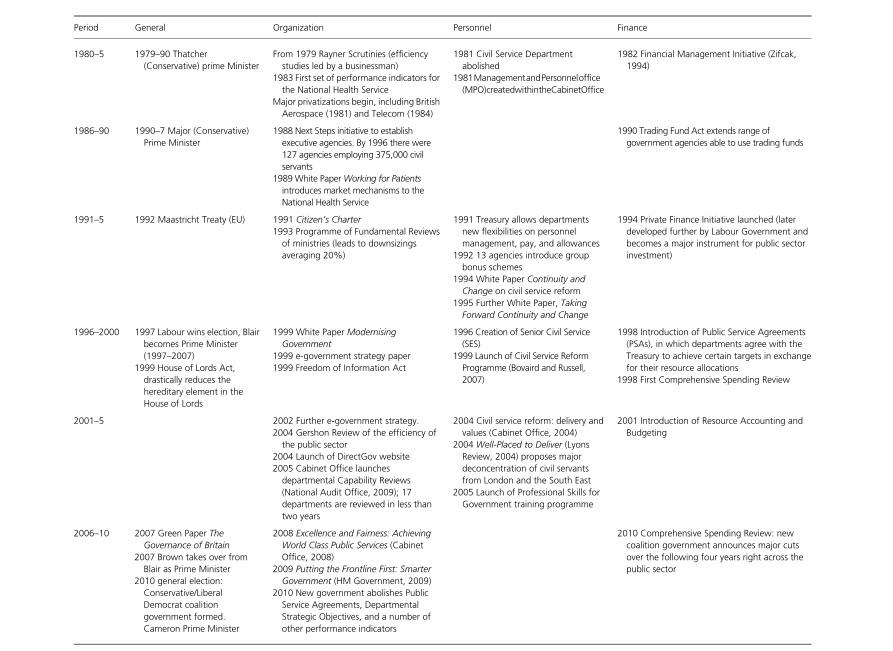
Period General Organization Personnel Finance
1980–5 1979–90 Thatcher
(Conservative) prime Minister
From 1979 Rayner Scrutinies (efficiency
studies led by a businessman)
1983 First set of performance indicators for
the National Health Service
Major privatizations begin, including British
Aerospace (1981) and Telecom (1984)
1981 Civil Service Department
abolished
1981ManagementandPersonneloffice
(MPO)createdwithintheCabinetOffice
1982 Financial Management Initiative (Zifcak,
1994)
1986–90 1990–7 Major (Conservative)
Prime Minister
1988 Next Steps initiative to establish
executive agencies. By 1996 there were
127 agencies employing 375,000 civil
servants
1989 White PaperWorking for Patients
introduces market mechanisms to the
National Health Service
1990 Trading Fund Act extends range of
government agencies able to use trading funds
1991–5 1992 Maastricht Treaty (EU) 1991 Citizen’s Charter
1993 Programme of Fundamental Reviews
of ministries (leads to downsizings
averaging 20%)
1991 Treasury allows departments
new flexibilities on personnel
management, pay, and allowances
1992 13 agencies introduce group
bonus schemes
1994 White Paper Continuity and
Change on civil service reform
1995 Further White Paper, Taking
Forward Continuity and Change
1994 Private Finance Initiative launched (later
developed further by Labour Government and
becomes a major instrument for public sector
investment)
1996–2000 1997 Labour wins election, Blair
becomes Prime Minister
(1997–2007)
1999 House of Lords Act,
drastically reduces the
hereditary element in the
House of Lords
1999 White Paper Modernising
Government
1999 e-government strategy paper
1999 Freedom of Information Act
1996 Creation of Senior Civil Service
(SES)
1999 Launch of Civil Service Reform
Programme (Bovaird and Russell,
2007)
1998 Introduction of Public Service Agreements
(PSAs), in which departments agree with the
Treasury to achieve certain targets in exchange
for their resource allocations
1998 First Comprehensive Spending Review
2001–5 2002 Further e-government strategy.
2004 Gershon Review of the efficiency of
the public sector
2004 Launch of DirectGov website
2005 Cabinet Office launches
departmental Capability Reviews
(National Audit Office, 2009); 17
departments are reviewed in less than
two years
2004 Civil service reform: delivery and
values (Cabinet Office, 2004)
2004 Well-Placed to Deliver (Lyons
Review, 2004) proposes major
deconcentration of civil servants
from London and the South East
2005 Launch of Professional Skills for
Government training programme
2001 Introduction of Resource Accounting and
Budgeting
2006–10 2007 Green Paper The
Governance of Britain
2007 Brown takes over from
Blair as Prime Minister
2010 general election:
Conservative/Liberal
Democrat coalition
government formed.
Cameron Prime Minister
2008 Excellence and Fairness: Achieving
World Class Public Services (Cabinet
Office, 2008)
2009 Putting the Frontline First: Smarter
Government (HM Government, 2009)
2010 New government abolishes Public
Service Agreements, Departmental
Strategic Objectives, and a number of
other performance indicators
2010 Comprehensive Spending Review: new
coalition government announces major cuts
over the following four years right across the
public sector
UNITED STATES OF AMERICA
A. Socio-economic forces: general
The USA is unique among the twelve countries in
this study in its status as a military and economic
‘superpower’. It is rich and powerful (see Table A.1).
Thus it is probably in a better position than other
states to influence the course of global trends. Nev-
ertheless, there are limits to its power, and it, too, is
subject to the challenges of an ageing society,
changing social values and norms, and mass immi-
gration—plus the growing economic rivalry with
China.
B. Global economic forces
Imports and exports form a considerably smaller
proportion of the US economy than for any of the
other eleven countries reviewed in this book. Yet,
as with social trends, the US is far from immune to
international economic trends. See Appendix A for
key statistics.
C. Sociodemographic issues
Although rich on the basis of average per capita in-
comes (Table A.1) theUSA spends a surprisingly small
amount of governmentmoney on social expenditure
(Table A.2). By comparison with most European
countries it has only a ‘thin’ welfare state.
D. National socio-economic policies
The 1980s was a period during which political and
popular awareness of the federal deficit grew—
alongside the growth of the deficit itself. High le-
vels of defence spending under the Reagan admin-
istration, together with its failure to cut back on
social programmes as sharply as had originally
been intended, contributed to this problem (Stock-
man, 1986). These increases dwarfed the savings
and cuts that flowed from managerial efficiency
improvements (see Section M below). Under Clin-
ton, from 1992, however, more effective measures
were taken to control the deficit, and at the same
time the economy entered a long boom. In 1997
President Clinton and the Republican dominated
Congress agreed a five-year plan to balance the
budget, and by the time President Clinton made
his 1999 State of the Union address, a political
debate was building up on the question of what
to do with the anticipated budget surpluses.
George W. Bush inherited a rapidly changing eco-
nomic situation, and after the 11 September, 2001
terrorist attacks, it became abundantly clear that
the US economy was slowing down. By back-
ground and conviction, the new President was
fiscally conservative, pro-big business and pro-
market, but (like Reagan) his increased military
and security spending, along with a series of tax
cuts, soon threatened the federal fiscal balance.
‘Ironically, despite Bush’s campaign rhetoric
about smaller government and more efficient
management, his tactical decisions to pursue an
unpopular war, cut domestic programmes, and
increase the size of the bureaucracy, have created
the largest public debit in history’ (Milakovitch,
2006, p. 476). Towards the end of the 2000–8 Bush
Presidency the renewed deficit was further ampli-
fied by the impacts of the global economic crisis of
2008–9. Famously, soon after assuming office, Pres-
ident Obama launched a $787 billion dollar spend-
ing package designed to prop up a reeling
American economy—the American Recovery and
Reinvestment Act. The long-run deficit picture re-
mains grim as the generation of children born
shortly after the Second World War (the ‘baby
boomers’) enter retirement, leading to increased
consumption of federal retirement and medical
services.
E. The political system
The USA possesses a unique political system among
our twelve countries. It is a federal state, with a
constitutionally entrenched division of powers
between the executive, legislature, and judiciary.
From the ‘founding fathers’ on, there has been an
ideological commitment to maintain a system of
‘checks and balances’ to ensure that no one of the
three main branches of government can dominate.
There is a two-party system (Republican and
Democrat) but the parties are each ‘broad
churches’, and, by European standards, there is
little party discipline within the legislature, each
Congressman/woman or Senator being free to
UNITED STATES OF AMERICA 321
vote and act according to his/her own dictates,
though in recent decades party discipline has
increased (Hetherington, 2009). Individual com-
mittees within the legislature also enjoy high inde-
pendence, and the chairs of the senior committees
are major political figures in their own right. Spe-
cific constituency interests have a strong influence
on voting patterns. There is no equivalent to the
Christian Democrat, Social Democrat or Socialist
Parties which are such a familiar presence in West-
ern European politics. The president is directly
elected every four years and cannot serve more
than two successive terms.
The legislature is bicameral and, relative to the
executive, unusually powerful by European stan-
dards. The president and the executive cannot
rely on getting their way—certainly not in matters
of administrative reform. The agencies of the exec-
utive may be partly or wholly ‘captured’ by interest
groups represented within the legislature. Many
expert commentators have remarked on the legis-
lature’s predilection for ‘micro-managing’ the
federal bureaucracy and its lack of interest in man-
agement reform (e.g. Kettl, 2009). ‘No recent presi-
dent has been able to garner much interest or
support from Congress for his management initia-
tives’ (Breul and Kamensky, 2008, p. 1023).
Washington politics is also characterized by a
‘spoils system’, in which an incoming administra-
tion hands out large numbers of senior administra-
tive posts to political sympathizers (nowadays up
to 4,000, including many posts which in most of
our other countries would go to career civil ser-
vants—Peters, 2010). These (often short-term)
political appointees then work alongside career
civil servants (Heclo, 1977—he memorably called
it a ‘government of strangers’). The spoils system
has grown in size since 1980, and the ‘intensity of
politicization has been increasing markedly, espe-
cially in the second Bush administration’ (Peters,
2010, p. 119). Finally, it should be remembered
that the American legislature frequently indulges
in ‘pork barrel’ politics—where the benefits of pub-
lic programmes are carefully calculated to appeal to
particular constituencies and regions. Contracting
out—which has grown significantly over the past
three decades—is one example of this: ‘the allure to
members of Congress of bringing contracts and
jobs back to their districts is insatiable’ (Durant et
al., 2009, p. 214).
Finally, it must not be forgotten that, although
the main focus of this book is on national-level
governments, the USA has an extensively
decentralized and democratized system of gover-
nance. Of approximately 22 million public ser-
vants holding office in 2006, only about 2.7
million were at the federal level, and only about
15 per cent of those employees are based in Wa-
shington DC. Of this 2.7 million, 800,000 were in
the postal service, 700,000 in the Department of
Defense and 250,000 in the Veterans Administra-
tion, leaving fewer than 1 million staffing the
whole of the remainder of the federal machine.
‘Most of the service delivery, including that for
many federal programs, is done by state and local
governments’ (Peters, 2010, p. 118). The contract-
ing out of public services also contributes to this
relatively small centre—by 2002 contract employ-
ees represented 62 per cent of the combined total
of contractees, the civil service, and military posi-
tions (Durant et al., 2009, p. 208).
F. New management ideas
The USA is characterized by a ‘business-oriented’,
‘free enterprise’ culture. Its system of government is
also very open and fragmented. These factors have
meant that it has been very easy for private sector
management concepts to enter the public sector.
At various times the federal administration has
expressed enthusiasm towards most of the contem-
porary management techniques and approaches,
including management by objectives, downsizing,
TQM, benchmarking, and re-engineering.
A historical perspective indicates that there is
nothing particularly new in this openness to busi-
ness techniques. For example, in the 1960s the
federal government famously adopted a Planning,
Programming, and Budgeting System (PPBS), and
in the 1970s other techniques with private sector
conceptual origins, such as Zero-Based Budgeting
(ZBB) and organizational development, were also
enthusiastically embraced. As far back as the start
of the twentieth century, progressive reformers
were looking to the private sector for models of
efficient management.
The second Bush administrations from 2001 to
2009 were exceptionally favourable to approaches
of private sector origin. A month after his inaugura-
tion, the President made a speech in which he said
that reforms must be a) citizen-centred, b) results-
centred and c) market-based (Breul and Kamnesky,
2008, p. 1015). His administration aggressively pur-
used both a new performance pay system and mas-
sive contracting out. Most notoriously, it contracted
out so much of the war effort in Iraq that by the end
322 APPENDIX B: COUNTRY FILES AND TABLES OF EVENTS
of 2006 there were almost 100,000 private contract-
ors in the country—almost asmany as there were US
combat troops (Scahill, 2007). Two major new per-
formance pay systems were introduced—in the
Departments of Homeland Security and Defense
(Perry et al., 2009).
G. Pressure from citizens
Since the 1970s, US public opinion has tended to
become increasingly critical of both the motives
and the competence of federal government (Bok,
1997; Kaufman, 1981). Most Americans believe
that the federal bureaucracy wastes huge sums of
money. However, the accuracy of popular percep-
tions of its federal government can be questioned;
for example, while a majority believed that the
administrative overheads ate up more than 50 per
cent of the social security programme, the true
figure was actually less than 2 per cent (Bok, 1997,
p. 56). Nevertheless, US presidents and their collea-
gues have to operate against a background in
which the proportion of Americans who believe
that public officials don’t care what people think
has grew from 36 per cent in 1964 to 66 per cent in
1996, and the proportion who thought that quite a
few people in government are crooked has rose
(over the same period) from 29 per cent to 51 per
cent (Orren, 1997). This set of attitudes does not so
much point towards specific management reforms
as it handicaps all reformers, insofar as their efforts
and motives are likely to be regarded with wide-
spread scepticism by the public. It is one manifes-
tation of the strong populist (Jeffersonian) theme
in American politics, with its mixture of fear
of and suspicion for any kind of technocratic,
Washington-based elite (Peters, 2010, pp. 118–19).
At the same time, however, citizen approval of
particular services co-exists with their generalized
mistrust of ‘the feds’. Major institutions such as the
Social Security Administration, the Internal Rev-
enue Service and the Postal Service regularly score
highly on customer satisfaction, and at least equal
private sector satisfaction scores. A contemporary
example is the ‘tea-party’ movement that has been
sharply critical of the scope of government, but at
the same time is largely supportive of social security
programmes (Moynihan and Ingraham, 2010).
H. Party political ideas
These, too, were influenced by the general ‘free
enterprise’ culture, and by the absence of a Social
Democratic or Socialist Party of any size or
salience. Thus a majority of both Republicans
and Democrats have been willing to sign up to
notions of more ‘businesslike’ government. Since
the late 1970s, however, a substantial group of
right-wing Republicans have taken a more radical
stance. Deeply sceptical of the efficacy of federal
actions, they have argued for fundamental down-
sizing of the civil service and a general reduction
in ‘government interference’. At the time of
writing, the anti-federal bureaucracy theme is
being propounded as vigorously as ever, despite
the fact that an activist, Democratic presidency is
installed in the White House. One example of this
would be the way that the Obama administra-
tion’s idea of having a government-run health
insurance scheme to run alongside private
schemes (one part of the health reform bill) led
straight to the bitterest ideological attacks, includ-
ing the (to Europeans laughable) suggestion that
President Obama was some kind of socialist, or
even communist.
I. Chance events
Some events had an impact on specific aspects or
sectors of the federal administration. Two exam-
ples would be the 1986 Challenger space shuttle
explosion (which had a big impact on the National
Aeronautics and Space Administration, one of the
largest federal agencies) and the 1994 Oklahoma
City bombing, which starkly illustrated the depths
of hatred for the federal authorities felt by some
groups on the radical right of the American politi-
cal spectrum.
However, the clearest example of event-driven
policymaking was the range of measures adopted
following the Al Quaeda terrorist attacks of 11
September, 2001. These led directly to a major
federal reorganization, with the creation of
the Department of Homeland Security as its cen-
trepiece. Other reorganizations stemmed from
the huge damage caused in 2005 by Hurricane
Katrina, when it came ashore close to New Or-
leans. This was a national disaster, but also a pub-
lic relations disaster for the Bush presidency,
which therefore led to considerable reorganiza-
tion of federal emergency services (Sylves, 2006;
Waugh, 2006). At the time of writing the Obama
administration has been struggling to address the
huge oil spill following an explosion of a BP dril-
ling rig in the Gulf of Mexico. It seems likely that,
as with previous natural and technological
UNITED STATES OF AMERICA 323
disasters, this will lead to reforms of various kinds,
including new regulatory powers being given to
public authorities, and reorganization within the
Interior Department.
J. Elite decision-making
It is less appropriate to speak of a (singular) elite
perception in the USA than in some more central-
ized and homogenous European countries. Tradi-
tionally, in the USA, executive perceptions of what
was needed tended to be somewhat at variance
with the perceptions of leading groups within the
legislature. Whilst it may have been relatively easy
to secure consensus on the proposition that the
federal government needs to be more flexible, effi-
cient, customer-friendly, and coordinated, it has
beenmuchmore difficult to build a broad coalition
of support for a package of specific and concrete
measures to achieve this. As George W. Bush’s Pre-
sident’s Management Agenda document put it, ‘All
too often, Congress is part of the government’s
managerial problems’ (Office of Management and
Budget, 2001, p. 6).
As indicated above, reformers had to contend
with a general loss of trust in the federal machine,
a tendency which was frequently encouraged by
presidents themselves. Since Lyndon Johnson, all
successful presidential candidates (with the partial
exception of the George H. W. Bush) have pre-
sented themselves as outside critics determined to
fix the problems of the federal government. From
the 1930s to the 1980s presidents frequently pur-
sued ambitious reorganizations of government, as
Congress was largely content to delegate such
powers to the executive. However, a combination
of a Supreme Court decision that such le-
gislative deference was excessive, and a growing
reluctance on the part of Congress to cede such
powers has seen less attention to reorganization.
Instead of moving boxes around, presidents
turned to changes in technique—budgetary and
accounting systems, privatization, customer ser-
vice systems, performance management—have
been regarded as more feasible/less politically con-
troversial than wholesale redesign of the govern-
ment’s other aspects of public management. More
ambitious reforms that sought to make personnel
policies more flexible, sometimes by reducing civil
service protections, failed to win legislative support
amidst strong lobbying by public sector unions
(e.g. Reagan’s 1986 Civil Service Simplification Act,
Clinton’s Personnel System Reinvention and
Omnibus Civil Service ReformActs, and Bush’s Free-
dom to Manage Act).
The most notable exception to these trends was
the passage of the 2002 Homeland Security Act,
which created the Department of Homeland Se-
curity. The Act allowed President Bush to move
twenty-two agencies from across government into
a single department, while giving the Secretary of
the Department significant new personnel author-
ity. But the unusual politics of the Act—in the
aftermath of 9/11 an enormously popular Presi-
dent Bush was able to link management issues to
national security—emphasizes the difficulties of
pursuing large-scale reform (Moynihan, 2005),
and President Obama has shown little intent to
pursue reform via legislation. Nevertheless, one
ongoing clear dividing line between the parties
has been a Republican desire to eliminate many
traditional civil service protections, and future pol-
icy windows may be exploited for this purpose.
By the end of the 1980s there were signs of a real
collapse ofmorale within the federal service (Volcker,
1989). This was in hardly anyone’s interest, and
provided the incoming Clinton administration with
a base onwhich to build support for a new attempt at
reform. This took the form of the National Perfor-
mance Review and the Government Performance
and Results Act (see Section N below). The George
W. Bush Presidency, from 2000, declared three aims
for the federal machine, ‘actively pro-
moting . . . innovation through competition’, being
‘citizen-centered’, and ‘results-oriented’ (Office of
Management and Budget, 2001, p. 4). The Obama
administration maintained some of the same priori-
ties—continuing to emphasize performance and citi-
zen engagement for example—but interpreted these
terms somewhat differently.
K. The administrative system
The US administrative system is quite fragmented
and highly permeable to influences from outside
the executive itself. Unlike many European
countries, the USA never developed a unified and
powerful central state apparatus. It democratized
before it industrialized, and industrialized before
the main era of state-building (Amenta and Skoc-
pol, 1989). During the twentieth century a patch-
work of departments and agencies grew up, which
successive attempts at reform (especially the
Brownlow Committee of 1936 and the Hoover
Commissions of 1949 and 1955) only partly suc-
ceeded in rationalizing (Savoie, 1994).
324 APPENDIX B: COUNTRY FILES AND TABLES OF EVENTS
By the mid 1990s the federal machine consisted
of a wide variety of organizational forms (Peters,
1995). These included fourteen cabinet depart-
ments, a large number of independent executive
organizations (e.g. the National Aeronautics and
Space Administration), independent regulatory
commissions (e.g. the Federal Trade Commission),
and public corporations (e.g. the Tenessee Valley
Authority, the Federal Deposit Insurance Corpora-
tion). There are also organizations within the
sphere of the legislature which are important
players in financial and management issues—espe-
cially the Congressional Budget Office (CBO) and
the General Accounting Office (GAO).
While a modest employer in terms of its propor-
tion of the total labour force (2.4%) or of the total
public labour force (only 15%), the federal govern-
ment is still a big employer in absolute terms.
In summary, the American public bureaucracy is a
mixture of a highly professionalized and depoliticized
civil service at its lowest levels, and a highly politicized
and transient set of officials at the top of public orga-
nizations. (Peters, 2010, p. 120)
L. Contents of the reform package
Of the twelve countries in this study the USA is
probably the one which has been home to the
strongest anti-government rhetoric, and the lowest
public trust of government (it is not clear which is
the cart and which the horse). Five of the last six
presidents (Carter in 1976, Reagan in 1980 and
Clinton and Bush Snr in 1992, Bush Jnr in 2000)
felt it politically advantageous to include criticism
of the federal bureaucracy as a significant element
in their electoral campaigns. In practice, however,
their actions have varied from attempts at sympa-
thetic modernization of the federal departments
and agencies (Carter and Clinton) to attacks on
alleged bureaucratic ‘waste’ and duplication, com-
bined with the introduction of more and more
political appointees (Reagan, G. W. Bush). Ever-
expanding contracting out seems to have been a
feature of administrations of both political colours.
This has grown steadily from the (always existing)
contracting out for products (computers, military
hardware), through contracting for general services
(office cleaning, prison management) to contract-
ing for what many would regard as core govern-
ment functions (including policy-making and
monitoring contracts), and contracting for HRM
functions such as recruitment and workforce
planning (Durant et al., 2009).
One reform which took place just before the
period covered by this book, but which needs to
be mentioned, was President Carter’s 1978 Civil
Service Reform Act (CSRA—see Ban and Ingraham,
1984). This created a Senior Executive Service (SES)
of about 8,000, and introduced performance
appraisal and merit pay. The SES provision had
been designed partly to cater for growing public/
private pay differentials (in favour of the latter),
but Congress soon cut the share of SES positions
that were eligible for bonuses from 50 per cent to
20 per cent. One rueful contemporary comment
on the implementation of the CSRA was that Con-
gressional support for it was ‘a mile wide but an
inch deep’. President Reagan was subsequently
able to make good use of the 1978 Act to dominate
personnel administration to a greater extent
than his predecessors had been able to. A quarter
of a century later George W. Bush was promising
to ‘establish a meaningful system to measure
performance. Create awards for employees who
surpass expectations’, as though this were a new
idea (Office of Management and Budget, 2001,
p. 11).
The Reagan administration introduced a welter
of reforms, many of them designed to bring ‘busi-
ness disciplines’ to the federal civil service. It was
also systematic in exploiting the Presidency’s huge
power of patronage to appoint Conservatives to
key positions throughout Washington. Some of
the principal initiatives were:
� Appointing Donald Devine, an arch-conserva-
tive and virulent critic of the federal bureaucracy,
to be head of the Office of Personnel Manage-
ment (OPM). ‘Career officials were shocked and
demoralized by Devine’s hostility to them’ (Sa-
voie, 1994, p. 222).
� The President’s Council on Integrity and Effi-
ciency (founded 1981). ‘It questioned many prac-
tices, identified billions of savings as a result of
audits, launched civil and criminal actions, and
introduced many sanctions against government
agencies or employees’ (Savoie, 1994, p. 189).
� Reform 88 (launched in 1982). This was a broad-
scope programme, somewhat lacking in focus.
Actions under its umbrella included upgrading
computer systems and improving financial man-
agement and accountability.
� The Council onManagement and Administration
(1982).
� The President’s Private Sector Survey on Cost
Control (PPSSCC, better known as the ‘Grace
Commission’, 1982).
UNITED STATES OF AMERICA 325
� The Council on Management Improvement
(1984). This was a council of assistant secretaries
from across federal departments and agencies,
tasked to develop long-range management
improvement plans and reinforce the implemen-
tation of Reform 88.
� The President’s Productivity Program (from
1985). This was aimed at increasing the produc-
tivity of government agencies by 20 per cent by
1992. Measures included the widespread adop-
tion of TQM.
� ‘Although not nearly as successful as he would
have liked, Reagan promoted privatisation, con-
tracting out, and user fees at every opportunity’
(Savoie, 1994, p. 215).
The Grace Commission was one of the most pub-
licized of these initiatives, and in some ways typi-
fied the Reagan administration’s approach. It
involved bringing in large numbers of business
people (2,000, supported by 859 companies) with
a brief to identify bureaucratic ‘waste’. Over a
two-year period it generated forty-seven reports
containing 2,478 recommendations. It claimed
potential savings of $298 billion, though a General
Accounting Office analysis suggested that the true
figure was more like $98 billion. Some of its recom-
mendations were partly or wholly implemented,
but many were not (Pollitt, 1993, pp. 91–5). In
proportion to the size of the effort (and of the
fanfare—see Grace, 1984) it left only a small trace.
The much less widely publicized Council on Integ-
rity and Efficiency probably had a considerably
greater impact.
President Bush (1988–92) was less overtly anti-
bureaucrat than Reagan—possibly because he had
a lifetime of public service behind him. He presided
over a growing crisis in the morale of the federal
service, but was seemingly unable to take any par-
ticularly strong action to counter it. In 1989 a task
force identified serious weaknesses in the public
service (including pay, performance appraisal, and
career development systems and morale—Volcker,
1989). In 1990 a General Accounting Office study
came to broadly similar conclusions (US General
Accounting Office, 1990). Yet no major reforms
were undertaken. As one observer wrote at the
time: ‘America’s flame of managerial reform seems
to have died down to a glowing ember’ (Hede,
1991, pp. 507–8). President Bush’s main interests
seem to have lain with high policy issues rather
than management reform.
By contrast, the incoming Clinton administra-
tion of 1992 was keen to restore status to the fed-
eral machine, and to do so by pursuing a high-
profile reform which would lead to a government
that ‘works better and costs less’. The centrepiece of
their programme, entrusted to Vice President Gore,
was the National Performance Review (NPR—see
Gore, 1996, 1997; National Performance Review,
1997; and countless other publications). This pack-
age included proposals for savings (promises of
$108 billion worth) and downsizing (by 252,000,
subsequently raised by Congress to 272,900), as
well as for ‘empowerment’ and ‘reinvention’. Dif-
ferent stakeholders have stressed different aspects,
and from the start it was clear that there were ten-
sions between, for example, the ‘savings and
downsizing’ theme and the ‘empowerment and
reinvention’ theme. ‘In practice NPR has been a
messy and sometimes disorganised multi-front
war against the government’s performance pro-
blems’ (Kettl, 1994, p. 5).
A second major management reform proceeded
alongside the NPR. The 1993 Government Perfor-
mance and Results Act (GPRA) mandated the
development of strategic planning and perfor-
mance measurement throughout the federal
government (National Academy of Public Admin-
istration, 1994). Its origins went back to draft Con-
gressional legislation from the Bush era (Radin,
1998, p. 308). Three years of pilot projects were
planned before the reporting requirements were
‘rolled out’ to the rest of the federal government
in 1997.
After 2000, the approach of George W. Bush in
some ways echoed that of Reagan. He placed great
emphasis on competitive outsourcing and the ad-
vantages of competition. He ‘re-invented’ the idea
of performance budgeting, and made a results ori-
entation one of his central themes. He also re-
invented performance-related pay, and installed it
in two major federal departments (Perry et al.,
2009). Like almost every other Western govern-
ment, he lauded the potential of e-government.
Without referring to the Clinton–Gore NPR
(which, in rhetorical terms at least, quickly disap-
peared from view), he discovered that federal man-
agers lacked discretion, and headlined ‘freedom to
manage’ as a goal (Office of Management and
Budget, 2001, p. 5). However, in the aftermath of
9/11 he also set up a Department of Homeland
Security, and used this as a vehicle for achieving
greater managerial flexibility and freedom from
326 APPENDIX B: COUNTRY FILES AND TABLES OF EVENTS
Congressional control (see also Bouckaert et al.,
2010, chapter 11).
In contrast with his two immediate predeces-
sors, President Obama’s tenure has not been
marked by high-profile reform packages designed
to garner political attention. There is no equivalent
to the National Performance Review, or the Presi-
dents Management Agenda. Nevertheless, the
Office of Management and Budget (OMB) and the
OPM have quietly pursued reforms, largely using
executive authority, that they hope will have a
significant impact on public management. Since
there is no central reform blueprint, understanding
the specific goals of the Obama White House re-
quires looking to statements of White House offi-
cials before Congress, budget documents, or
internal memorandum. A 2010 memo from the
OMB to Senior Executive Service officials offers
perhaps the best summary of Obama’s goals:
1. Driving agency top priorities: As part of the
budget process, agency heads were asked to
identify three to eight performance goals
that they will be held publicly accountable
for. Legislation in Congress has proposed to
make this process permanent. The White
House also has pushed agencies that interact
with the public to develop transparent ser-
vice standards that can be used as dash-
boards to summarize citizen experience of
government.
2. Cutting waste: The Obama White House has
sought to cut programmes deemed as duplica-
tive, out-of-date, or underperforming.
3. Reforming contracting: In a marked contrast
with previous administrations, the Obama
administration sought to limit, and in some
cases reverse, contracting out.
4. Closing the IT gap: As with Bush and Clinton,
the Obama White House argues that technol-
ogy can significantly improve performance,
but poor implementation of IT projects has
limited that potential.
5. Promoting accountability and innovation
through open government: Obama promised
to clearly communicate how well they were
doing, in the hope that it would improve pub-
lic understanding of government, but also pro-
vide a spur to better performance by agencies.
Performancemetrics andgoalshavebeenmade
publicly available, and the White House has
sought to emphasize transparency in both
programmes and special initiatives, creating
websites that track spending of stimulus
funds, for example. The White House also
promised to create ‘problem-solving networks’
that capture the input of citizens and practi-
tioners inside and outside of government.
6. Attracting and motivating top talent: The
Office of Personnel Management was directed
by the President to find ways of using execu-
tive authority to make government attractive
to younger people, and to make simpler the
confusing and slow recruitment process.
M. The implementation process
Implementing management reform has always
been difficult for US presidents. As noted above,
the powers of Congress to intervene in organiza-
tional restructurings are as extensive as its powers
to reshape budgets. Nor are the agencies them-
selves under such clear and unequivocal hierarchi-
cal authority as would be usual in the case of, say, a
British or French agency. Many exist as one corner
in an ‘iron triangle’, with Congress as a second
corner, and one or more major interest groups as
a third (e.g. farmers, or the oil companies, or the
defence industries). These links can give agencies
the capacity to resist unwelcome changes through
political channels.
Furthermore, implementation of some impor-
tant reforms has been entrusted mainly to political
appointees (rather than career civil servants). For
example, the ‘reinvention’ teams established under
the NPR were usually led by Clinton appointees.
Sometimes this helps give impetus, but at other
times it produces oscillations and discontinuities,
as political appointees find their attentions are
drawn away to other issues of current political
salience, or, indeed, they themselves leave their
posts (the turnover among political appointees
can be brisk).
A further complication is the highly legalistic
nature of much US management reform. Even
when a president gets a reform through Congress
s/he must then see what the courts make of it. An
interesting case is the way the process of contract-
ing out has become a vehicle for extending the
reach of legislative and judicial values deep into
the ‘contract state’. For example, legal obligations
for transparency can be placed on any body that
uses government funds. ‘Due to the growth and
persistence of the contract state, Congress and the
UNITED STATES OF AMERICA 327
U.S. Supreme Court have begun to extend the
reach of the American state into the private and
nonprofit sectors in an effort to maintain the
constitutional character of the polity’ (Bumgarner
and Newswander, 2009, p. 203). De-regulating
federal human resource management (an objec-
tive of the second Bush administration) was
another area in which legal advice and legal
capacity seems to have been crucial (Riccucci
and Thompson, 2008).
Unsurprisingly, therefore, the record of imple-
mentation of reforms has been patchy. Organiza-
tionally the key player in management changes
would normally be the OMB. In practice, however,
this has not always been a substantial force for
management reform. Within OMB the emphasis
on management has varied, and for considerable
periods the bulk of their effort has been directed to
short-term budgetary issues, with management
improvement taking a poor second place (see
Savoie, 1994, for an account of the changing role
of OMB under Reagan). Under Clinton, OMB took
a lead role in implementing the GPRA, but, by
contrast, made only limited inputs to the NPR rein-
vention activities. Even with the GPRA, however,
the nature of the US governmental system led to
implementation difficulties:
Although the aims of GPRA suggest that the informa-
tion produced under the Act will support more ra-
tional decisionmaking, both the structure of the US
government and current developments in other areas
make this extremely difficult. The structure creates a
disconnect between budget functions, agency organi-
sation, and the jurisdictions of appropriations com-
mittees. The fragmented nature of decisionmaking,
including budget decisionmaking, limits the ability of
any institution of government in either the executive
or the legislative branch to look at crosscutting issues
and the government as a whole. (Radin, 1998, p. 311)
Under G. W. Bush the OMB played a crucial role in
administering the Program Assessment Rating Tool
(PART) and, more generally, in regularly checking
departments and agencies’ progress in implement-
ing the President’s Management Agenda (Breul and
Kamensky, 2008). This was a break with the Clin-
ton and Reagan era reliance on special commis-
sions to lead reform efforts, and restored the
institutional primacy of the OMB. PART, in partic-
ular, gave a mechanism by which the OMB could
not only evaluate the performance of agencies, but
redirect their goals where it found them wanting
(Moynihan 2008).
Thus far, President Obama has maintained a
strong emphasis on performance management
(Moynihan 2009). Obama fulfilled a campaign
promise by appointing a Chief Performance Offi-
cer, who is also the Deputy Director for the OMB,
and the most visible representative of the Presi-
dent’s reform agenda. In terms of tone, Obama
appointees want to project a style distinct from
previous presidencies. Obama officials suggested
that Clinton and Gore’s Reinventing Government
was too decentralized (‘let a thousand flowers
bloom’), while the Bush OMB was overly
controlling in its interaction with agencies, result-
ing in a good deal of agency resistance. ‘By con-
trast, the Obama OMB declares that it wants to
create a ‘‘focused collaboration’’ with agencies,
characterized by principles of prioritization, trans-
parency, engagement, and rapid results’ (Moyni-
han, 2009, p. 6; see also Bouckaert and Halligan,
2008, appendix).
N. Reforms actually achieved
Despite the existence of a flourishing evaluation
culture in the US public sector, it is extremely diffi-
cult to come to any sure assessment of the impact
of the reforms since 1980. At a micro-level there
have clearly been many examples and cases of effi-
ciency gains, modernization of systems, and
increased attention to customer responsiveness.
Some of the NPR publications are spattered with
up-beat examples of such performance improve-
ments (e.g. Gore, 1997). However, broad-scope eva-
luations seem thin on the ground. An academic
review of NPR reinvention laboratories identifies
some successes (especially where there has been
‘stubborn’ leadership) but also some failures and
continuing problems (Ingraham, Thompson, and
Sanders, 1998). Certainly most of the reforms of
the Reagan administration were not subject to sci-
entific evaluation—the mood of the times was
somewhat against evaluation, as being itself a fur-
ther symptom of bureaucratic empire-building and
obfuscation. Assessments of GPRA by the GAO
indicate a mixed picture, with some performance
plans following well short of what the act seems to
require (e.g. General Accounting Office, 1998,
2001). As for the NPR, one authoritative academic
assessment is mixed—in the main, federal agencies
technically complied with NPR, but effectively
dampened much of its intended force. Cultural
change has been patchy (Thompson, 2000). Subse-
quently, in his incoming management agenda,
328 APPENDIX B: COUNTRY FILES AND TABLES OF EVENTS
George W. Bush laid great stress on the fact that
‘What matters in the end is completion. Perfor-
mance. Results.’ (Office of Management and Bud-
get, 2001, p. 1). However, although setting targets
for most of its initiatives, the President’s agenda
was largely silent about arrangements for evalua-
tion and accountability. Perhaps, this is ‘business
as usual’, since, as the Agenda itself notes:
Congress, the Executive Branch, and the media have
all shown far greater interest in the launch of new
initiatives than in following up to see if anything use-
ful ever occurred. (Office of Management and
Budget, 2001, p. 3)
Most academic commentaries on the success or
otherwise of the G. W. Bush management reforms
seem to give them a mixed bill of health. Perfor-
mance budgeting and performance pay have both
been problematic (Gilmour and Lewis, 2006; Perry
et al., 2009; Riccucci and Thompson, 2008), and
the structural innovation of the Department of
Homeland Security is itself exceptionally difficult
to evaluate in terms of ‘results’. The Bush-era PART
process consumed enormous amounts of time
and attention as almost every federal programme
was assessed. But outside of the executive branch,
it had limited influence, and did not seem to alter
appropriations decisions in Congress (Moynihan
2008). Efforts to institutionalize PART via legisla-
tion also drew little support, and the Obama
administration has shown little inclination to con-
tinue with the tool, preferring instead to invite
agencies to compete for funds for evaluations that
promise a clear impact. Obama officials criticized
PART as too broad in its focus, failing to pay close
enough attention to important programmes. Oba-
ma’s first Chief Performance Officer also criticized
the Bush administration for generating a great deal
of performance information, but rarely using it,
promising that the Obama White House would
actively use data to manage agencies, and encour-
age agency leaders to learn from data.
It is relatively early to assess the Obama adminis-
tration, although the President’s emphasis on
transparency and publicly available metrics may
make such assessments easier (and are, in them-
selves, evidence of implementation of the transpar-
ency goal). At the same time, the reliance on limited
and specific reform goals has kept muted expecta-
tions, so that any progress may be regarded as a
success. In cutting waste, the White House has
pointed to initial success, claiming that 60 per
cent of proposed cuts were accepted by Congress,
which is about three times the rate of success of
previous administrations. In the area of perfor-
mance management, the long-run test will be
whether agency heads, andCongress, take seriously
the performance goals they promise to achieve.
UNITED STATES OF AMERICA 329
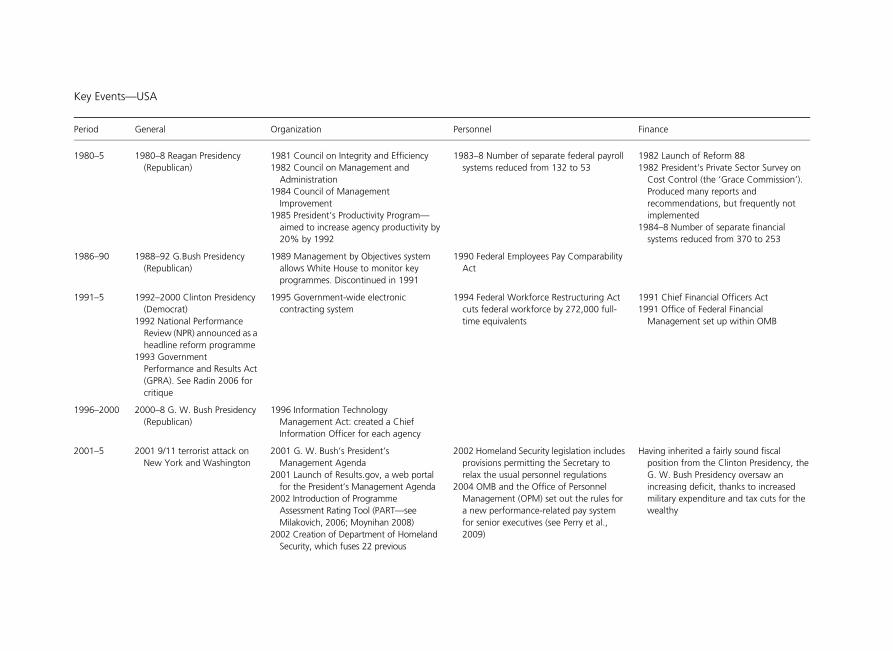
Key Events—USA
Period General Organization Personnel Finance
1980–5 1980–8 Reagan Presidency
(Republican)
1981 Council on Integrity and Efficiency
1982 Council on Management and
Administration
1984 Council of Management
Improvement
1985 President’s Productivity Program—
aimed to increase agency productivity by
20% by 1992
1983–8 Number of separate federal payroll
systems reduced from 132 to 53
1982 Launch of Reform 88
1982 President’s Private Sector Survey on
Cost Control (the ‘Grace Commission’).
Produced many reports and
recommendations, but frequently not
implemented
1984–8 Number of separate financial
systems reduced from 370 to 253
1986–90 1988–92 G.Bush Presidency
(Republican)
1989 Management by Objectives system
allows White House to monitor key
programmes. Discontinued in 1991
1990 Federal Employees Pay Comparability
Act
1991–5 1992–2000 Clinton Presidency
(Democrat)
1992 National Performance
Review (NPR) announced as a
headline reform programme
1993 Government
Performance and Results Act
(GPRA). See Radin 2006 for
critique
1995 Government-wide electronic
contracting system
1994 Federal Workforce Restructuring Act
cuts federal workforce by 272,000 full-
time equivalents
1991 Chief Financial Officers Act
1991 Office of Federal Financial
Management set up within OMB
1996–2000 2000–8 G. W. Bush Presidency
(Republican)
1996 Information Technology
Management Act: created a Chief
Information Officer for each agency
2001–5 2001 9/11 terrorist attack on
New York and Washington
2001 G. W. Bush’s President’s
Management Agenda
2001 Launch of Results.gov, a web portal
for the President’s Management Agenda
2002 Introduction of Programme
Assessment Rating Tool (PART—see
Milakovich, 2006; Moynihan 2008)
2002 Creation of Department of Homeland
Security, which fuses 22 previous
2002 Homeland Security legislation includes
provisions permitting the Secretary to
relax the usual personnel regulations
2004 OMB and the Office of Personnel
Management (OPM) set out the rules for
a new performance-related pay system
for senior executives (see Perry et al.,
2009)
Having inherited a fairly sound fiscal
position from the Clinton Presidency, the
G. W. Bush Presidency oversaw an
increasing deficit, thanks to increased
military expenditure and tax cuts for the
wealthy
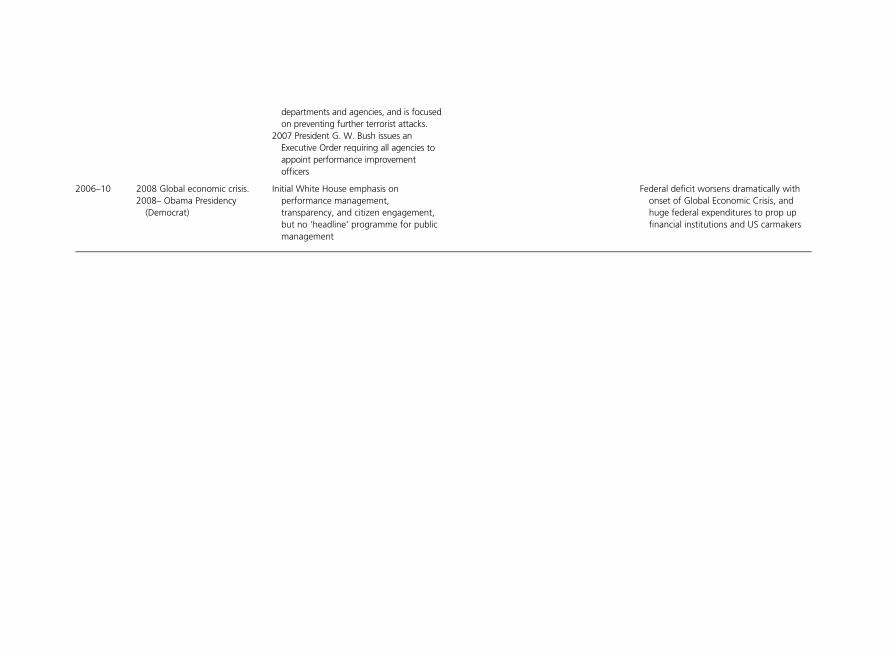
departments and agencies, and is focused
on preventing further terrorist attacks.
2007 President G. W. Bush issues an
Executive Order requiring all agencies to
appoint performance improvement
officers
2006–10 2008 Global economic crisis.
2008– Obama Presidency
(Democrat)
Initial White House emphasis on
performance management,
transparency, and citizen engagement,
but no ‘headline’ programme for public
management
Federal deficit worsens dramatically with
onset of Global Economic Crisis, and
huge federal expenditures to prop up
financial institutions and US carmakers
n B IBL IOGRAPHY
6, P. (2004) ‘Joined-Up Government in theWestern
World in Comparative Perspective: A Preliminary
Literature Review and Exploration’, Journal of
Public Administration Research and Theory, 14:1,
pp. 103–38.
Aberbach, J. and Christensen, T. (2001) ‘Radical
Reform in New Zealand: Crisis, Windows of
Opportunity, and Rational Actors’, Public
Administration, 79:2, pp. 403–22.
Accenture (2008) An International Comparison of the
United Kingdom’s Public Administration, London,
Accenture.
Advisory Group on Reform of Australian
Government Administration (2009) The Reform of
Australian Government Administration: Building the
World’s Best Public Service, Canberra,
Commonwealth of Australia, October.
—— (2010) Ahead of the Game: Blueprint for the
Reform of the Australian Government
Administration, Canberra, Commonwealth of
Australia, October.
Agranoff, R. (2007) Managing within Networks:
Adding Value to Public Organizations, Washington
DC, Georgetown University Press.
—— and McGuire, M. (2001) ‘Big Questions in
Public NetworkManagement Research’, Journal of
Public Administration Research and Theory, 11:3,
pp. 295–326.
Albertini, J.-B. (1998) Contribution a une th�eorie de
l’Etat d�econcentr�e, Bruxelles, Bruylant.
Alford, J. (2009) Engaging Public Sector Clients: From
Service-Delivery to Co-Production, Basingstoke and
New York, Palgrave/Macmillan.
Algemene Rekenkamer (1995) Tweede Kamer,
1994/5, 24120, no. 3.
—— (2002) Verantwoording en toezicht bij
rechtspersonen met een wettelijke taak deel 3,
‘s-Gravenhage, Sdu Uitgevers.
Andrews, M. (2008) ‘The Good Governance
Agenda: Beyond Indicators without Theory’,
Oxford Development Studies, 36:4, pp. 379–407.
—— (2010) ‘Good Government Means Different
Things in Different Countries’, Governance, 23:1,
pp. 7–35.
Arndt, C. (2008) ‘The Politics of Governance
Ratings’, International Public Management Journal,
11:3, pp. 275–97.
Aucoin, P. and Savoie, D. (1998) Program Review:
Lessons for Strategic Change in Governance,
Ottawa, Canadian Centre for Management
Development.
—— ——(2009) ‘The Politics–Administration
Dichotomy: Democracy Versus Bureaucracy?’,
pp. 97–117 in O. Dwivendi, T. Mau, and
B. Sheldrick (eds.) The Evolving Physiology of
Government: Canadian Public Administration
in Transition, Ottawa, University of Ottawa.
Auditor General of Canada (1993) ‘Canada’s
Public Service Reform, and Lessons Learned from
Selective Jurisdictions’, Report, 1993, chapter 6,
Ottawa, Auditor General of Canada.
—— (1997) Annual report, Ottawa, Auditor General
of Canada.
—— (2001) Reflections on a Decade of Serving
Parliament, February, Ottawa, Office of the
Auditor General.
Australian Public Service Commission (2004) A
History in Three Acts: Evolution of the Public Service
Act 1999, Canberra, Commonwealth of
Australia.
—— (2007) Building Better Governance, Canberra,
ACT, Commonwealth of Australia.
—— (2009) Challenges of Evidence-Based
Policymaking, Canberra, ACT, Commonwealth of
Australia.
Bach, T., Fleischer, J., and Hustedt, T. (2010)
Organisation und steuerung zentralstaatlicher
beh€orden, Berlin, Edition Sigma.
Bach, T. and Jann, W. (2010) ‘Animals in the
Administrative Zoo: Organizational Change and
Administrative Autonomy in Germany’,
International Review of Administrative Sciences,
76:3, pp. 443–68.
Baker, R. and Rennie, M. (2006) ‘Forces leading to
the Adoption of Accrual Accounting by the
Canadian Federal Government: An Institutional
Perspective’, Canadian Accounting Perspectives,
5:1, pp. 83–112.
Balk, W. (1996) Managerial Reform and Professional
Empowerment in the Public Service, Westport,
Quorum Books.
Ball, I. (1993) ‘New Zealand Public Sector
Management’, paper presented to the 1993
National Accountants in Government
Convention, Hobart, 26–8 May.
Ban, C. (2010a) ‘Reforming the Staffing Process in
the European Union Institutions: Moving the
Sacred Cow out of the Road’, International Review
of Administrative Sciences, 76:1, pp. 5–24.
—— (2010b) ‘Int�egrer la “maison” communautaire:
L’arriv�e au sein de la Commission des directeurs
issus des nouveaux Etats membres’, Revue francaise
d’administration publique.
—— and Ingraham, P. (1984) Legislating
Bureaucratic Change: The Civil Service Reform Act of
1978, New York, SUNY Press.
Barber, J. (2007) Instruction to Deliver: Tony Blair,
Public Services and the Challenge of Achieving
Targets, London, Politicos.
Barberis, P. (1998) ‘The New Public Management
and a New Accountability’, Public Administration,
76:3, pp. 451–70, Autumn.
Barbier, J.-C. and Simonin, B. (1997) ‘European
Social Programmes: Can Evaluation of
Implementation Increase the Appropriateness
of Findings?’, Evaluation, 3:4, October,
pp. 391–407.
Bartoli, A. (2008) ‘The Study of Public Management
in France: La sp�ecificit�e du mod�ele francais
d’administration’, pp. 14–41 in W. Kickert (ed.)
The Study of Public Management in Europe and the
US: A Comparative Analysis of National
Distinctiveness, Abingdon, Routledge.
Barzelay, M. and Gallego, R. (2010a) ‘The
Comparative Historical Analyses of Public
Management Policy Cycles in France, Italy and
Spain: Symposium Introduction’, Governance,
23:2, pp. 297–307.
—— —— (2010b) ‘The Comparative Historical
Analyses of Public Management Policy Cycles in
France, Italy and Spain: Symposium Conclusion’,
Governance, 23:2, pp. 209–23.
Batley, R. and Larbi, G. (2004) The Changing Role of
Government: The Reform of Public Services in
Developing Countries, Basingstoke, Palgrave/
Macmillan.
BBC News (1999) ‘UK Politics: Government Puts a
Gloss on its Goals’, 26 July <http://bbc.co.uk/1/
hi/uk_politics/403993.stm>, accessed 13
October 2004).
—— ‘Annual Report: A Hostage to Fortune?’, 13
July <http://bbc.co.uk/1/hi/uk_politics/831585.
stm>, accessed 13 October 2004).
BBK NESS Site (2009) National Evaluation of Sure
Start <http://www.ness.bbk.ac.uk>, accessed
18 May.
Beale, V. and Pollitt, C. (1994) ‘Charters at the
Grass Roots: A First Report’, Local Government
Studies, 20:2, Summer, pp. 202–25.
Behn, R. (2001) Re-Thinking Democratic
Accountability, Washington, DC, Brookings
Institution.
Bekkers, V. And Homburg, V. (2005)
‘E-Government as an Information Ecology:
Background and Concepts’, pp. 1–19 in V.
Bekkers, and V. Homburg (eds.) The Information
Ecology of E-Government, Amsterdam, IOS Press.
Bellamy, C. and Taylor, J. (1998) Governing in the
Information Age, Buckingham, Open University
Press.
Bellamy, R. and Palumbo, R. (2010) From
Government to Governance, London, Ashgate.
Benz, A. and G€otz, K. (1996) ‘The German Public
Sector: National Priorities and the International
Reform Agenda’, pp. 1–26 in A. Benz and K. G€otz
(eds.) A New German Public Sector? Reform,
Adaptation and Stability, Aldershot, Dartmouth.
Berg, A.-M. (2010) ‘Lean And Mean or Fat And
Nice? On The Importance Of Organizational
Redundancies and Diversity’, paper presented to
the annual conference of the European group for
Public Administration, Toulouse, September.
Bevan, G. and Hood, C. (2006) ‘What’s Measured is
WhatMatters: Targets and Gaming in the English
Public Healthcare System’, Public Administration,
84:3, pp. 517–38.
Bevir, M. and Rhodes, R. (2006) Governance Stories,
London, Routledge.
Bezes, P. (2007) ‘The “Steering State” Model: The
Emergence of a New Organizational Form in the
French Public Administration’, Sociologie du
Travail, 49S, e67–e89.
—— (2010) ‘Path Dependent and Path-Breaking
Changes in the French Administrative System:
The Weight of Legacy Explanations’ pp. 158–73
in M. Painter and G. B. Peters (eds.) Tradition and
Public Administration, Basingstoke, Palgrave/
Macmillan.
BIBLIOGRAPHY 333
Bilodeau, N., Laurin, C., and Vining, A. (2007)
‘“Choice of Organizational Form Makes a Real
Difference”: The Impact of Corporatization on
Government Agencies in Canada’, Journal of
Public Administration Research and Theory, 17,
pp. 119–47.
Bl€ondal, J. et al. (2008) ‘Budgeting in Australia’,
OECD Journal on Budgeting, 8:2, pp. 1–64.
Bogdanor, V. (ed.) (2005) Joined-Up Government,
Oxford, Oxford University Press.
Boje, D., Gephart, R., and Thatchenkey, T. (eds.)
(1996) Postmodern Management and Organization
Theory, London, Sage.
Bok, D. (1997) ‘Measuring the Performance of
Government’, pp. 55–76 in J. Nye, P. Zelikow, and
D. King (eds.) Why People Don’t Trust Government,
Cambridge, Mass., Harvard University Press.
Boorsma, P. and Mol, N. (1995) ‘The Dutch Public
Financial Revolution’, pp. 219–32 in W. Kickert
and F. van Vught (eds.) Public Policy and
Administration Sciences in the Netherlands,
London, Prentice Hall/Harvester Wheatsheaf.
Borins, S. (1995) ‘Public Sector Innovation: The
Implications of New Forms of Organisation and
Work’, pp. 260–87 in G. Peters and D. Savoie
(eds.) Governance in a Changing Environment,
Montreal and Kingston, Canadian Centre for
Management Development and McGill-Queen’s
University Press.
—— (ed.) (2008) Innovations in Government:
Research, Recognition and Replication, Washington,
DC, Brookings Institute.
Boston, J. (1995) ‘Lessons from the Antipodes’, pp.
161–77, in B. O’Toole and G. Jordan (eds.) Next
Steps: Improving Management in Government?,
Aldershot, Dartmouth.
—— et al. (1996) Public Management: The New
Zealand Model, Auckland, Oxford University
Press.
Bouckaert, G. (1995a) ‘Charters as Frameworks for
Awarding Quality: The Belgian, British and French
Experience’, pp. 185–200, in H. Hill and H. Klages
(eds.) Trends in Public Sector Renewal: Recent
Developments and Concepts of Awarding Excellence,
Europ€aischer Verlag der Wissenschaften, Beitr€age
zur Politikwissenschaft, Band 58, Frankfurt am
Main, Peter Lang.
—— (1995b) ‘Improving Performance
Measurement’, pp. 379–412, in A. Halachmi and
G. Bouckaert (eds.) The Enduring Challenges of
Public Management: Surviving and Excelling in a
Changing World, San Francisco, Jossey-Bass.
—— (1996a) ‘Informing the Clients: The Role of
Public Service Standards Statements’, pp. 109–116,
in OECD, Responsive Government, Service Quality
Initiatives, Paris, OECD, PUMA.
—— (1996b) ‘Measurement of Public Sector
Performance: Some European Perspectives’, pp.
223–37 in A. Halachmi and G. Bouckaert (eds.)
Organisational Performance and Measurement in the
Public Sector, London, Quorum Books.
—— (2000) ‘Techniques de modernisation et
modernisation des techniques: Evaluer la
modernisation de la gestion publique’, pp.
107–28, in L. Rouban (ed.) Le Service Public en
Devenir, Paris, L’Harmattan.
—— (2001) ‘Pride and Performance in Public
Service: Some Patterns of Analysis’, International
Review of Administrative Sciences, 67, pp. 9–20.
—— (2002a) ‘Modernising the Rechtsstaat:
Paradoxes of the Management Agenda’, pp.
71–83, in K-P. Sommermann and J. Ziekow (eds.)
Perspectiven der Verwaltungsforschung, Berlin,
Duncker & Humblot.
—— (2002b) ‘Administrative Convergence in the
EU: Some Conclusions for CEEC’s’, pp. 59–68, in
F. Van den Berg, G. Jenei, and L. T. LeLoup (eds.)
East-West Co-Operation in Public Sector Reform:
Cases and Results in Central and Eastern Europe,
Amsterdam, International Institute of
Administrative Sciences Monographs (Vol. 18),
IOS Press.
—— (2002c) ‘Reform of Budgetary Systems in the
Public Sector’, pp. 17–42, in M. H€ogye (ed.) Local
Government Budgeting, Budapest, OSI/LGI, Open
Society Institute (Local Government and Public
Service Reform Initiative).
—— (2007) ‘Cultural Characteristics from Public
Management Reforms Worldwide’, pp. 29–64, in
K. Schedler and I. Proeller (eds.) Cultural Aspects of
Public Management Reform, Amsterdam, Elsvier.
—— (2010) ‘New Public Leadership for Public
Service Reform’, pp. 51–67, in J. Pierre and P.
Ingraham (eds.) Comparative Administrative
Change and Reform: Lessons Learned, Montreal and
Kingston, McGill-Queen’s University Press.
—— and Ulens, W. (1998) Mesure de la performance
dans le service public: exemples e trangers pour les
pouvoirs publics Belges, Bruxelles, Service
F�edereaux des Affaires Scientifiques, Techniques
et Culturelles.
334 BIBLIOGRAPHY
—— and Francois A. (1999) Modernisation de
l’administration les questions de recherche,
Bruxelles, SSTC.
—— and Verhoest, K. (1999) ‘A Comparative
Perspective on Decentralisation as a Context for
Contracting in the Public Sector, Practice and
Theory’, pp. 199–239 in Y. Fortin (ed.) La
Contractualisation dans le Secteur Public dans des
Pays Industrialis�es depuis 1980, Paris,
L’Harmattan.
—— Ormond, D., and Peters, G. (2000) A Potential
Governance Agenda for Finland, Research Report
No. 8, Helsinki, Ministry of Finance.
—— and Peters, B. G. (2002) ‘Performance
Measurement andManagement: The Achilles’ Heel
in AdministrativeModernization’, Public
Performance & Management Review, London, Sage,
25:4, pp. 359–62.
—— et al. (2002) ‘Trajectories for Modernizing
Local Governance, Revisiting the Flanders Case’,
Public Management Review: An International
Journal of Research and Theory, Routledge, 4:3,
pp. 309–42.
—— and Thijs, N. (2003) Kwaliteit in de publieke
sector: Een handboek voor kwaliteitsmanagement in
de publieke sector o.b.v. een internationaal
comparatieve studie, Gent, Academia Press.
—— and Halligan, J. (2008) Managing Performance:
International Comparisons, London, Routledge/
Taylor and Francis.
—— et al. (eds.) (2008) Public Management Reforms
in Central and Eastern Europe, Bratislava, NISPAcee
Press.
—— Peters, G. B., and Verhoest, K. (2010) The Co-
ordination of Public Sector Organizations: Shifting
Patterns of Public Management, Basingstoke,
Palgrave/Macmillan.
Bourgault, J. and Carroll, B. (1997) ‘The
Canadian Senior Public Service: The Last
Vestiges of the Whitehall Model?’, pp. 91–100,
in J. Bougault, M. Demers, and C. Williams
(eds.) Public Administration and Public
Management in Canada, Quebec, Les
Publications du Quebec.
—— Dion, S., and Lemay, M. (1993) ‘Creating
Corporate Culture: Lessons from the Canadian
Federal Government’, Public Administration
Review, 53:1, pp. 73–80.
—— and Savoie, D. (1998) ‘Managing at the Top’,
paper for the authors’ roundtable, Revitalising
the Public Service, Ottawa, Canadian Centre for
Management Development, 12–14 November.
Bourgon, J. (1998) Fifth Annual Report to the Prime
Minister on the Public Service of Canada, Ottawa,
Privy Council Office.
Bovaird, T. and L€offler, E. (2003) ‘Evaluating the
Quality of Public Governance: Indicators, Models
and Methodologies’, International Review of
Administrative Sciences, 69:3, pp. 313–28.
—— and Russell, K. (2007) ‘Civil Service Reform in
the UK, 1999–2005: Revolutionary Failure or
Evolutionary Success?’, Public Administration,
85:2, pp. 301–28.
—— and Tizzard, J. (2009) ‘Partnership Working
in the Public Domain’, pp. 233–47 in T. Bovaird
and E. L€offler (eds.) Public Management and
Governance (2nd edn.), London and New York,
Routledge.
Bovens, M. (1998) The Quest for Responsibility:
Accountability and Citizenship in Complex
Organizations, Cambridge, Cambridge University
Press.
—— and Zouridis, S. (2002) ‘From Street-Level to
System-Level Bureaucracies: How Information
and Communication Technology is
Transforming Administrative Discretion and
Constitutional Control’, Public Administration
Review, 62:2, pp. 174–84.
Bowen, C. (2009) ‘Service Delivery Reform:
Designing a System that Works for You’, Address
to the National Press Club, Canberra, 16
December.
Boyne, G. (1998) ‘Bureaucratic Theory Meets
Reality: Public Choice and Service Contracting
in US Local Government’, Public Administration
Review, 58:6, November/December.
—— et al. (2003) Evaluating Public Management
Reforms, Buckingham, Open University Press.
—— et al. (eds.) (2006) Public Service
Performance: Perspectives on Measurement and
Management, Cambridge, Cambridge University
Press.
Brans, M. and Hondeghem, A. (1999), ‘The Senior
Civil Service in Belgium’ pp. 121–46, in E. C. Page
and V. Wright (ed.), Bureaucratic Elites in Western
European States, London, Oxford University Press.
—— —— (2005) ‘Competency Frameworks in
Belgian Governments: Causes, Construction
and Content’, Public Administration, 83:4,
pp. 823–37.
BIBLIOGRAPHY 335
Breul, J. and Kamensky, J. (2008) ‘Federal
Government Reform: Lessons from Clinton’s
“Reinventing Government” and Bush’s
“Management Agenda” Initiatives’, Public
Administration Review, November/December,
pp. 1009–26.
Broucker, B., Depr�e, R., and Hondeghem, A. (2010)
‘Les propositions de r�eformes’, La Revue Nouvelle,
65:1, pp. 31–9.
Bruijn, H. de (2002) Managing Performance in the
Public Sector, London, Routledge.
Bruning, E. (2010) ‘A Methodological Assessment
of Ten Years of Canada’s Citizens First Satisfaction
Survey Research’, International Review of
Administrative Sciences, 76:1, pp. 85–91.
Brunsson, N. (1989) The Organisation of Hypocrisy:
Talk, Decisions and Actions in Organisations,
Chichester, John Wiley.
—— (2006) Mechanisms Of Hope: Maintaining the
Dream of the Rational Organization, Copenhagen,
Copenhagen Business School Press.
—— and Olsen, J. (1993) The Reforming
Organization, London and New York, Routledge.
Budget Department (1997) Public Sector Productivity
in Sweden, Stockholm, Swedish Ministry of
Finance.
Bumgarner, J. and Newswander, C. (2009) ‘The
Irony of NPM: the Inevitable Extension of the
Role of the American State’, American Review of
Public Administration, 39:2, pp. 189–207.
Bureau of Transport and Communications (1995)
Evaluation of the Black Spot Program, Canberra,
Australia Government Publishing Service.
Burrell, G. (1997) Pandemonium: Towards a Retro-
Organization Theory, London, Sage.
Business and Enterprise Committee (2009) Eighth
Report, Session 2008–09: Post Offices—Securing
their Future, 23 June. <http://www.publications.
parliament.uk/pa/cm200809/cmberr/371/
37102.htm>, accessed 11 September, 2009.
Cabinet Office (2008) Excellence and Fairness:
Achieving World Class Public Services, London,
HMSO.
Caiden, N. (1988) ‘Shaping Things to Come’, pp.
43–58, in I. Rubin (ed.) New Directions in Budget
Theory, Albany, SUNY Press.
Cameron, D. and Simeon, R. (1998)
‘Intergovernmental Relations and Democratic
Citizenship’, paper presented to the authors’
roundtable, Revitalising the Public Service,
Ottawa, Canadian Centre for Management
Development, 12–14 November.
Canadian Broadcasting Corporation (1994) The
Remaking of New Zealand, Toronto, CBC Radio
Works.
Canadian Centre for Management Development
(1998a) Citizen/Client Surveys: Dispelling Myths
and Redrawing Maps, Ottawa, CCMD.
—— (1998b) Government at your Service: A Progress
Report from the Citizen-Centred Service Network,
Ottawa, CCMD.
Carlitz, R. et al. (2009) ‘Budget Transparency
Around the World: Results from the 2008 Open
Budget Survey’, OECD Journal on Budgeting, 9:2,
pp. 1–17.
Carter, N. (1998) ‘On the Performance of
Performance Indicators’, pp. 177–94, in M-C.
Kesler, P. Lascoumbes, M. Setbon, and J.-C.
Thoenig (eds.) Evaluation des politiques publiques,
Paris, L’Harmattan.
Castells, M. (2001) The Internet Galaxy: Reflections
on the Internet, Business, and Society, Oxford,
Oxford University Press.
—— (2010) The Rise of the Network Society
(2nd edn.), Chichester, West Sussex, Wiley-
Blackwell.
Castles, F. (ed.) (2007) The Disappearing State:
Retrenchment Realities in an Age of Globalisation,
Cheltenham, Edward Elgar.
—— Gerritsen, R., and Vowles, J. (eds.) (1996) The
Great Experiment: Labour Parties and Public Policy
Transformation in Australia and New Zealand,
St Leonards, NSW, Allen and Unwin.
Centre for Finnish Business and Policy Studies
(1996)Not Revolution But Re-Evaluation: A Report of
Political Decision-Making in Finland, April,
Helsinki (translated by the Public Management
Department, Ministry of Finance).
Chancellor of the Duchy of Lancaster (1997) Next
Steps: Agencies in Government: Review, 1996,
Cm3579, London, The Stationery Office.
Chancellor of the Exchequer (1998) Modern Public
Services For Britain: Investing In Reform, Cm4011,
London, The Stationery Office.
Chapman, G. and Duncan, J. (2010) ‘New
Millennium, New Public Management and the
New Zealand Model’, Australian Journal of Public
Administration, 69:3, pp. 301–13.
336 BIBLIOGRAPHY
Chapman, R. (1998) ‘Problems of Ethics in Public
Sector Management’, Public Money and
Management, 18:1, January/March, pp. 9–13.
Christensen, T. and Lægreid, P. (eds.) (2001) New
Public Management: The Transformation of Ideas
and Practice, Aldershot, Ashgate.
—— —— (eds.) (2007a) Transcending New Public
Management: The Transformations of Public Sector
Reforms, Aldershot and Burlington VA, Ashgate.
—— —— (2007b) ‘The Whole of Government
Approach to Public Sector Reforms’, Public
Administration Review, November/December,
pp. 1059–66.
—— Lie, A., and Lægreid, P. (2007) ‘Still
Fragmented Government or Reassertion of the
Centre?’, pp. 17–41, in T. Christensen and P.
Lægreid (eds.) Transcending New Public
Management: The Transformations of Public Sector
Reforms, Aldershot and Burlington, VA, Ashgate.
Christiaens, J., Reyniers, B., and Roll�e, C. (2010)
‘Impact of IPSAS on Reforming Governmental
Financial Information Systems: A Comparative
Study’, International Review of Administrative
Sciences, 76:3, pp. 537–54.
Christiansen, T. (2001) ‘The European
Commission: Administration in Turbulent
Times’, pp. 95–114 in J. Richardson (ed.) European
Union: Power and Policy-making (2nd edn.)
London, Routledge.
Clark, D. (1997) ‘The Civil Service and New
Government’, speech by the Rt. Hon. Dr David
Clark, MP, Chancellor of the Duchy of Lancaster,
QE11 Centre, London, 17 June.
—— (1998) ‘TheModernization of the French Civil
Service: Crisis, Change and Continuity’, Public
Administration, 76:1, Spring, pp. 97–115.
Clarke, J. and Newman, J. (1997) The Managerial
State, London, Sage.
Cole, A. and Jones, G. (2005) ‘Reshaping the State:
Administrative Reform and New Public
Management In France’, Governance, 18:4,
pp. 567–88.
—— and Eymeri-Douzans, J-M. (2010)
‘Introduction: Administrative Reforms and
Mergers in Europe—Research Questions and
Empirical Challenges’, International Review of
Administrative Sciences, 76:3, pp. 395–406.
Committee of Independent Experts (1999) First
Report on Allegations Regrading Fraud,
Mismanagement and Nepotism in The European
Commission, Brussels, 15 March.
Committee of Public Accounts (2000) Improving the
Delivery of Government IT Projects, 1st Report,
Session 1999–2000, London, House of
Commons.
Commonwealth (1983) RAPS/Reforming the
Australian Public Service: A Statement of the
Government’s Intentions, Canberra, AGPS.
Commonwealth Secretariat (1993) Administrative
and Managerial Reform: A Commonwealth Portfolio
of Current Good Practice, London, Management
Development Programme, Commonwealth
Secretariat.
Corbett, A. (2010) ‘Public Management
Policymaking in France: Legislating the Organic
Law on Laws of Finance (LOLF), 1998–2001’,
Governance, 23:2, pp. 225–49.
Cour des Comptes (2003) La deconcentration des
administrations et la reforme de l’Etat, special
public report, Paris, Cour des Comptes,
November.
Crosby, P. (1979) Quality is Free, New York, McGraw
Hill.
Curristine, T. (2005) ‘Performance Information in
the Budget Process: Results of the OECD 2005
Questionnaire’ OECD Journal on Budgeting, 2,
pp. 87–131
Czarniawska, B. and Sevon, G. (eds.) (1996)
Translating Organizational Change, de Gruyter,
New York.
Davies, J. (2009) ’The Limits of Joined-Up
Government: Towards a Political Analysis’, Public
Administration, 87:1, pp. 80–96.
Davis, G. et al. (1999) ‘What Drives the Machinery
of Government Change? Australia, Canada and
the United Kingdom, 1950–1997’, Public
Administration, 77:1, pp. 7–50.
De Jong, M., Lalenis, K., and Mamadouh, V.
(eds.) (2002) The Theory and Practice of
Institutional Transplantation: Experience with
the Transfer of Policy Institutions, Dordrecht,
Kluwer.
De Kool, Denis (2008) Inventarisatie Rijksmonitors
2008 en administratieve lasten, Center for Public
Innovation, July 2008.
Demmke, C. and Moilanen, T. (2010) Civil Services
in the EU of 27: Reform Outcomes and the Future of
the Civil Service, Bern, Peter Lang.
Denham, A. and Garnett, M. (1998) British Think-
Tanks and the Climate of Opinion, London, UCL
Press.
BIBLIOGRAPHY 337
Department of Finance (1996) Measuring up: A
Primer for Benchmarking in the Australian Public
Service, Discussion Paper No. 4, Canberra,
Resource Management Improvement Branch.
—— (1998a) The Performance Improvement Cycle:
Guidance for Managers, Canberra, Department of
Finance and Administration.
——(1998b) Lessons Learned from Others:
International Experience on the Identification and
Monitoring of Outputs and Outcomes, Discussion
Paper 2, Canberra, Department of
Administration and Finance.
Derksen, W. and Kortsen, A. (1995) ‘Local
Government: A Survey’, pp. 63–86, in W.
Kickert and F. van Vught (eds.) Public Policy
and Administration Sciences in The Netherlands,
London, Prentice Hall/Harvester Wheatsheaf.
Derlien, H.-U. (1998) From Administrative Reform to
Administrative Modernization, Bamberg,
Verwaltungswissenschaftliche Beitrage 33.
Development Team (1998) International Experience
on the Identification and Monitoring of Outputs and
Outcomes, Canberra, Department of Finance and
Administration, March.
Dixon, R., Hood, C., and Jones, L. (2008)
‘Ratings and Rankings of Public Service
Performance: Special Issue Introduction’,
International Public Management Journal, 11:3,
pp. 253–5.
Donahue, J. (2008) ‘The Unaccustomed
Inventiveness of the Labor Department’
pp. 93–112, in S. Borins (ed.) Innovations in
Government: Research, Recognition and
Replication, Washington, DC, Brookings
Institute.
Dorrell, S. (1993) Public Sector Change is AWorld-
Wide Movement, speech by the Financial Secretary
to the Treasury, Stephen Dorrell, to the Chartered
Institute of Public Finance and Accountancy,
London, 23 September.
Drechsler, W. and Kattel, R. (2008) ‘Towards the
Neo-Weberian State? Perhaps, but Certainly,
Adieu, NPM!’, NISPAcee Journal of Public
Administration and Policy, Special issue: ‘A
Distinctive European Model? The Neo-Weberian
State, 1:2, pp. 95–9.
Driscoll, A. and Morris, J. (2001) ‘Stepping Out:
Rhetorical Devices and Culture Change in
Management in the UK Civil Service’, Public
Administration, 79:4, pp. 803–24.
Dror, Y. (1971) Design for Policy Sciences, New York,
Elsvier.
Dryzek, J. (1996) ‘The Informal Logic of
Institutional Design’, pp. 103–25, in R. Goodin
(ed.) The Theory of Institutional Design,
Cambridge, Cambridge University Press.
Du Gay, P. (2000) In Praise of Bureaucracy, London,
Sage.
——(ed.) The Values of Bureaucracy, Oxford, Oxford
University Press.
Duhamel, R. (1996) Evaluation Report: Improved
Reporting to Parliament Project on Performance
Indicators, A Report of the ParliamentaryWorking
Group, Ottawa, December.
Dunleavy, P. (1991) Democracy, Bureaucracy and
Public Choice: Economic Explanations in Political
Science, HemelHempstead,Harvester/Wheatsheaf.
——(1994) ‘The Globalisation of Public Service
Production: Can Government be the “Best in the
World’’?’, Public Policy and Administration, 9:2,
Summer, pp. 36–65.
—— (2010) The Future of Joined-Up Public Services,
London, 2020 Public Services Trust.
—— and Hood, C. (1994) ‘From Old Public
Administration To New Public Management’,
Public Money and Management, 14:3, July/
September, pp. 9–16.
—— et al. (2006a) Digital Era Governance: IT
Corporations, the State and E-Government, Oxford,
Oxford University Press.
—— et al. (2006b) ‘New Public Management is
Dead—Long Live Digital-Era Governance’,
Journal of Public Administration Research and
Theory, 16:3, pp. 467–94.
Dunn, C. (ed.) (2002) The Handbook of Canadian
Public Administration, Don Mills, Ontario, Oxford
University Press.
Dunn, W. (1993) ‘Policy Reforms as Arguments’,
pp. 254–90 in F. Fischer and J. Forester (eds.) The
Argumentative Turn in Policy Analysis and Planning,
London, UCL Press.
Dunsire, A. (1973) Administration: The Word and
The Science, London, Martin Robertson.
—— (1993) ‘Modes of governance’, pp. 21–34, in
J. Kooiman (ed.) Modern Governance: New
Government–Society Interactions, London, Sage.
—— and Hood, C. (1989) Cutback Management in
Public Bureaucracies, Cambridge, Cambridge
University Press.
338 BIBLIOGRAPHY
Duran, P., Monnier, E., and Smith, A. (1995)
‘Evaluation a la francaise’, Evaluation, 1:1, July,
pp. 45–63.
Durant, R., Girth, A., and Johnston, J. (2009)
‘American Exceptionalism, Human
Resource Management and the Contract State’,
Review of Public Personnel Administration, 29:3,
pp. 207–29.
Dwivendi, O., Mau, T., and Sheldrick, B. (eds.)
(2009) The Evolving Physiology of Government:
Canadian Public Administration in Transition,
Ottawa, University of Ottawa Press.
East, P. (1997) ‘Opening Address to Public Service
Senior Management Conference’, Wellington,
NZ, 9 October.
Efficiency Unit (1988) Improving Management in
Government: The Next Steps, London, HMSO.
Eichenbaum, C. and Shaw, R. (2007) ‘Ministerial
Advisers and the Politics of Policy-Making:
Bureaucratic Permanence and Popular Control’,
Australian Journal of Public Administration, 66:4,
pp. 453–67.
Ellinas, A. and Suleiman, E. (2008) ‘Reforming the
Commission: Between Modernization and
Bureaucratization’, Journal of European Public
Policy, 15:5, pp. 708–25.
Erin Research Inc. (1998) Citizens First, Ottawa,
Canadian Centre for Management Development.
—— (2005) Citizens First 4 Toronto, Institute for
Citizen Centred Service and the Institute of
Public Administration of Canada.
—— (2008) Citizens First 5 Toronto, Institute for
Citizen Centred Service.
Esping-Andersen, G. (1990) The Three Worlds of
Welfare Capitalism, Cambridge, Polity.
EuropeanCommission (1995) Eurobarometer: Trends,
1974–94, Brussels, European Commission.
—— (1997a) Evaluating EU Expenditure Programmes:
A Guide (1st edn.), Brussels, DGXIX/02, European
Commission.
—— (1997b) MAP 2000: Modernisation of
Administration and Personnel Policy for the Year
2000 (draft memorandum from Mr Liikanen in
agreement with the President: doc.IX/486/97),
Brussels, DGIX.
—— (1998) SEM 2000: Implementation by the
Services: Information Note from the President, Mrs
Gradin and Mr Liikanen, SEC(98)760 final,
Brussels, Secretariat General, 14 May.
—— (2000)ReformingTheCommission: AWhite Paper
(Parts 1 And 2): Communication from Mr Kinnock,
in Agreement with the President and Mrs Schreyer,
Brussels, European Commission, 1 March.
—— (2001a) European Governance: AWhite Paper,
COM2001/408, Brussels, European Commission.
——(2001b) Implementing Activity Based
Management in the Commission: Communication
from the President in Agreement with Mr Kinnock
and Mrs Schreyer to the Commission, SEC92001
1197/6&7, Brussels, European Commission.
—— (2003) European Commission—Progress Review
of Reform (COM(2003) 40 final/2), Brussels,
European Commission.
European Court of Auditors (2010) Impact
Assessments in the EU Institutions: Do They Support
Decision-Making?, Special Report 3/2010,
Luxembourg, European Court of Auditors.
European Foundation for Quality Management
(1996) Self-Assessment, 1997: Guidelines for the
Public Sector, Brussels, EFQM.
Eurostat (2010) Eurostat Yearbook 2010: Europe in
Figures, Luxembourg, Eurostat/European
Commission.
Evaluation Partnership (1999) Evaluation of the
Implementation and Results of SEM2000 and its
Contribution to the Overall Management Reform
of the Commission, Brussels, European
Commission.
Evers, A. et al. (1997) Developing Quality in Personal
Social Services: Concepts, Cases and Comments,
Aldershot, Ashgate.
Executive Office of the President of the United
States (1995) Budget of the United States
Government, Fiscal Year 1995, Washington, DC.
Eymeri-Douzans, J.-M. (2009) ‘French
Administrative “Co-Governors” as a Policymaking
Elite: Permanence and Changes’, paper presented
at the European Consortium for Political Research
Conference, Potsdam, September.
Farnham, D., Horton, S., Barlow, J., and
Hondeghem, A. (eds.) (1996)New Public Managers
in Europe: Public Servants in Transition,
Basingstoke, Macmillan.
Federal Ministry of the Interior (2006) Focused on
the Future: Innovations for Administration, Berlin:
Federal Ministry of the Interior.
Federal Ministry of the Interior (2009) The Federal
Public Service, Berlin, Federal Ministry of the
Interior <http://www.bmi.bund.de>.
BIBLIOGRAPHY 339
Ferlie, E. and Geraghty, J. (2005) ‘Professionals in
Public Service Organizations: Implications for
Public Sector Reforming’, pp. 422–5, in E. Ferlie,
L. Lynn Jnr, and C. Pollitt (eds.) The Oxford
Handbook of Public Management, Oxford, Oxford
University Press.
Fischer, F. and Forester, J. (eds.) (1993) The
Argumentative Turn in Policy Analysis and Planning,
London, UCL Press.
Flynn, N. and Strehl, F. (eds.) (1996) Public Sector
Management in Europe, London, Prentice Hall/
Harvester Wheatsheaf.
Foster, C. (1992) Privatization, Public Ownership and
the Regulation of Natural Monopolies, Oxford,
Blackwell.
—— and Plowden, F. (1996) The State Under Stress,
Buckingham, Open University Press.
Francis, R. (2010) Independent Inquiry into Care
Provided by Mid Staffordshire NHS Foundation Trust,
January 2005–March 2009, HC375-1, London,
The Stationery Office.
Franks, C. (2009) ‘The Unfortunate Experience of
Dueling Protocols: A Chapter in the Continuing
Quest for Responsible Government in
Canada’, pp. 118–50 in O. Dwivendi, T. Mau, and
B. Sheldrick (eds.) The Evolving
Physiology of Government: Canadian Public
Administration in Transition,Ottawa, University of
Ottawa Press.
Fountain, J. (2001) Building the Virtual State:
Information Technology and Institutional Change,
Washington, DC, Brookings Institution.
Gaertner, K. and Gaertner, G. (1985) ‘Performance-
Contingent Pay for Federal Managers’,
Administration and Society, 17:1, pp. 7–20.
Geertz, C. (1973) The Interpretation of Culture,
London, Hutchinson.
General Accounting Office (1990)Why and How the
GAO is Reviewing Federal College Recruiting,
Washington, DC, US House of Representatives.
—— (1994) Deficit Reduction: Experiences of Other
Nations, Washington, DC, GAO/ AIMD–95–30,
December.
—— (1995)Managing for Results: Experiences Abroad
Suggest Insights for Federal Management Reforms,
Washington, DC, GAO/GGD-95–120.
—— (1997) Performance Budgeting: Past Initiatives
Offer Insight For GPRA Implementation,
Washington, DC, GAO/AIMD-97–46, March.
—— (1998) The Results Act: Observations on the
Department of State’s Fiscal Year 1999 Annual
Performance Plan, Washington, DC, GAO/NSIAD-
98-210R, June.
—— (2001) Managing for Results: Federal Managers’
Views On Key Management Issues Vary Widely
Across Agencies, Washington, DC, GAO-01-592
Giddens, A. (1990) The Consequences of Modernity,
Cambridge, Polity Press.
Gilmour, J. and Lewis, D. (2006) ‘Does Performance
Budgeting Work? An Examination of the Office
of Management and Budget’s PART Scores’, Public
Administration Review, September/October, pp.
742–52.
Goldstein, H. (2004) ‘International Comparisons
of Student Attainment: Some Issues Arising from
the PISA Study’, Assessment in Education, 11:3, pp.
319–30.
Good, D. (2007) The Politics of Public Money:
Spenders, Guardians, Priority Setters, and
Financial Watchdogs inside the Canadian
Government, Toronto, University of Toronto
Press.
Goodin, R. (1996) The Theory of Institutional Design,
Cambridge, Cambridge University Press.
Gore, A. (1993) From Red Tape to Results: Creating a
Government that Works Better and Costs Less:
Report of the National Performance Review,
Washington, DC, US Government Printing
Office.
—— (1996) The Best-Kept Secrets in Government: A
Report to President Bill Clinton, Washington, DC,
US Government Printing Office, National
Performance Review.
——(1997) Businesslike Government: Lessons Learned
from America’s Best Companies, Washington, DC,
National Performance Review.
G€otz, K. (1997) ‘Acquiring Political Craft: Training
Grounds for Top Officials in the German Core
Executive’, Public Administration, 75:4, Winter,
pp. 753–75.
Gould, S. (1988) Time’s Arrow, Time’s Cycle,
Harmondsworth, Penguin Books.
Government Decision in Principle on Reforms in
Central and Regional Government (1993) Helsinki,
Council of State.
Gow, I. (2004) A Canadian Model of Public
Administration? Ottawa, Canada School of Public
Administration.
340 BIBLIOGRAPHY
Grace, P. (1984) Burning Money: The Waste of Your
Tax Dollars, New York, Macmillan.
Green-Pederson, C. (2002) ‘New Public
Management Reforms of the Danish and Swedish
Welfare States: The Role of Different Social
Democratic Responses’ Governance, 15:2,
pp. 271–84.
Gregory, R. (1998) ‘Political Responsibility For
Bureaucratic Incompetence: Tragedy at Cave
Creek’, Public Administration, 76:3, Autumn,
pp. 519–38.
——(2006) ‘Theoretical Faith and Practical Works:
De-Autonomising and Joining-Up in the
New Zealand State Sector’, pp. 137–61, in
T. Christensen and P. Lægreid (eds.) Autonomy
and Regulation: Coping with Agencies in the Modern
State, Cheltenham, Edward Elgar.
Grek, S. (2008) PISA in the British Media: Leaning
Tower or Robust Testing Tool?, Centre
for Educational Sociology, University of
Edinburgh.
Greve, C., Flinders, M., and van Thiel, S. (1999)
‘Quangos—What’s in a Name: Defining Quangos
fromaComparative Perspective’,Governance, 12:1.
Grossi, G. and Newberry, S. (2009) ‘Theme: Whole
of Government Accounting—International
Trends’, Public Money and Management, 29:4,
pp. 209–13.
Gualmini, E. (2008) ‘Restructuring Weberian
Bureaucracy: Comparing Managerial Reforms in
Europe and the United States’, Public
Administration, 86:1, pp. 75–94.
Gustafsson, A. (2000) Performance Budgeting In
Sweden: Outline of a Reform Programme, paper
presented to an International Symposium
on Accruals Accounting and Budgeting, Paris,
13/14 November, Stockholm, Ministry of
Finance.
Gustafsson, L. (1987) ‘Renewal of thePublic Sector in
Sweden’, Public Administration, 65:2, pp. 179–92.
Guyomarch, A. (1999) ‘Public Service, Public
Management and the Modernization of French
Public Administration’, Public Administration,
77:1, pp. 171–93.
Habermas, J. (1976) Legitimation Crisis, London,
Heinemann.
Hacque, S. (2001) ‘The Diminishing Publicness of
Public Service under the Current Mode of
Governance’, Public Administration Review, 61:1,
January/February, pp. 65–82.
Halachmi, A. and Bouckaert, G. (1995) The
Enduring Challenges of Public Management, San
Francisco, Jossey-Bass.
Halligan, J. (1996a) ‘The Diffusion of Civil Service
Reform’, pp. 288–317, in H. Bekke, J. Perry, and T.
Toonen (eds.) Civil Service Systems In Comparative
Perspective, Bloomington and Indiana, Indiana
University Press.
—— (1996b) ‘Australia: Balancing Principles and
Pragmatism’, pp. 71–112, in J. Olsen and B. Peters
(eds.) Lessons from Experience: Experiential Learning
in Administrative Reforms in Eight Democracies,
Oslo, Scandinavian University Press.
—— (1997) ‘New Public Sector Models: Reform in
Australia and New Zealand’, pp. 17–46 in J.-E.
Lane (ed.) Public Sector Reform: Rationale, Trends
and Problems, London, Sage.
—— (2002) ‘Politicians, Bureaucrats and Public
Sector Reform in Australia and New Zealand’,
pp. 157–168 in G. Peters and J. Pierre (eds.)
Politicians, Bureaucrats and Administrative Reform,
London, Routledge.
—— (2008) ‘Australian Public service: Combining
the Search for Balance and Effectiveness with
Deviations on Fundamentals’, pp. 13–30, in
C. Aulich and R. Wettenhall (eds.) Howard’s
Fourth Government, Sydney, University of New
South Wales Press.
—— and Power, J. (1992) Political Management in
the 1990s, Melbourne, Oxford University Press.
Hammer,M. andChampy, J. (1995) Reengineering the
Corporation: A Manifesto for a Business Revolution
(rev. edn.), London, Nicholas Brealey.
Hammond, K. (1996) Human Judgement and Social
Policy: Irreducible Uncertainty, Inevitable Error,
Unavoidable Injustice, New York, Oxford
University Press.
Handy, C. (1993) Understanding Organizations,
Harmondsworth, Penguin.
Harden, I. (1992) The Contracting State,
Buckingham, Open University Press.
Harder, P. and Lindquist, E. (1997) ‘Expenditure
Management and Reporting in the Government
of Canada: Recent Development and
Backgrounds’, pp. 71–89, in J. Bougault,
M. Demers, and C. Williams (eds.) Public
Administration and Public Management: Experiences
in Canada, Qu�ebec, Les Publications de Qu�ebec.
Harrison, S. and Pollitt, C. (1994) Controlling
Health Professionals: The Future of Work and
BIBLIOGRAPHY 341
Organisation in the NHS, Buckingham, Open
University Press.
Harrison, S., Hunter, D. J., and Pollitt, C. (1990) The
Dynamics Of British Health Policy, London, Unwin
Hyman.
—— Marnoch, G., and Pollitt, C. (1992) Just
Managing: Power and Culture in the National Health
Service, Basingstoke, Macmillan.
Hartley, J. (1983) ‘Ideology and Organizational
Behaviour’, International Studies of Management
and Organization, 13:3.
—— et al. (eds.) (2008) Managing to Improve Public
Services, Cambridge, Cambridge University Press.
Hauner, D. and Kyobe, A. (2008) Determinants of
Government Efficiency, IMFWorking Paper 08/228,
Washington, DC, International Monetary Fund.
Hautam€aki, J. et al. (2008) PISA06 Finland: Analyses,
Reflections, Explanations, Helsinki, Ministry of
Education.
Hawke, L. (2007) ‘Performance Budgeting in
Australia’,OECD Journal on Budgeting, 7:3, pp. 1–15.
—— (2008) ‘The Politics of Public Money:
Spenders, Guardians, Priority Setters, and
Financial Watchdogs inside the Canadian
Government’, Australian Journal of Public
Administration, 67:3, pp. 373–4.
Healthcare Commission (2009) Investigation into
Mid Staffordshire NHS Foundation Trust, London,
Healthcare Commission, March.
Hetherington, M. (2009) ‘Putting Polarization in
Perspective’, British Journal of Political Science,
39:2, pp. 413–48.
Heclo, H. (1977) A Government of Strangers,
Washington, DC, Brookings Institution.
Heintzman, R. (1997) ‘Canada and Public
Administration’, pp. 1–12, in J. Bourgault,
M. Demers, and C. Williams (eds.) Public
Administration and Public Management: Experiences
in Canada, Qu�ebec, Les Publications du Qu�ebec.
Held, D. (1984) ‘Power and Legitimacy in
Contemporary Britain’, pp. 299–369, in
G. McLennan, D. Held, and S. Hall (eds.) State and
Society in Contemporary Britain: A Critical
Introduction, Cambridge, Polity.
—— et al. (1998) Global Transformation,
Cambridge, Polity Press.
—— (2004) ‘Political Globalization’, pp. 73–88 in
D. Held, Global Covenant: The Social Democratic
Alternative to the Washington Consensus,
Cambridge, Polity Press.
Heseltine, M. (1980) ‘Ministers and Management
in Whitehall’, Management Services in
Government, 35.
High Quality Services, Good Governance and a
Responsible Civic Society (1998) The Government
Resolution, Helsinki, Oy Edita Ab.
Hill, H. and Klages, H. (1995) ‘Verbindung mit dem
Deutschen Landkreistag’ in H. Hill and H. Klages
(eds.) Kreisverwaltung der zukunft. Vergleichende
untersuchung aktueller modernisierungsans€atze in
ausgew€ahlten Kreisverwaltungen, Dusseldorf, Raabe
Fachverlag.
—— —— (eds.) (1993) Qualit€ats- und
erfolgsorientiertes verwaltungsmanagement. Aktuelle
tendenzen und entwurfe, Berlin, Duncker and
Humblot.
Hill, M. and Hupe, P. (2002) Implementing Public
Policy, London, Sage.
—— —— (2009) Implementing Public Policy: An
Introduction to the Study of Operational Governance
(2nd ed.), London: Sage.
Hirst, P. (2000) ‘Democracy and Governance’, in
J. Pierre (ed.) Debating Governance, Oxford:
Oxford University Press, pp. 13–35.
HM Government (2009) Putting the Frontline First:
Smarter Government, Cm7753, London, The
Stationery Office.
HM Treasury (1998) Whole of Government Accounts,
July, London, HM Treasury.
—— (2010) Total Place: AWhole Area Approach to
Public Services, March, London, HM Treasury
Hofstede, G. (2001) Culture’s Consequences:
Comparing Values, Behaviors, Institutions and
Organizations Across Nations, Thousand Oaks,
Calif., Sage.
Hojnacki, W. (1996) ‘Politicization as a Civil
Service Dilemma’, pp. 137–64, in H. Bekke,
J. Perry, and T. Toonen (eds.) Civil Service Systems
In Comparative Perspective, Bloomington and
Indiana, Indiana University Press.
Holkeri, K. and Summa, H. (1996) Contemporary
Developments in Performance Management:
Evaluation of Public Management Reforms in
Finland: from Ad Hoc Studies to a Programmatic
Approach, paper presented to PUMA/OECD, 4–5
November, Paris.
—— and Nurmi, J. (2002) ‘Quality, Satisfaction and
Trust in Government: The Finnish Case’, paper
presented to the Conference of the European
Group of Public Administration, 4–7 September,
Potsdam.
342 BIBLIOGRAPHY
Holmes, M. and Shand, D. (1995) ‘Management
Reform: Some Practitioner Perspectives on the
Past Ten Years’, Governance, 8:4, October,
pp. 551–78.
Homburg, V. (2008) ’Red Tape and Reforms:
Trajectories of Technological and Managerial
Reforms in Public Administration’, International
Journal of Public Administration, 31, pp. 749–70.
Hondeghem, A. (2000) ‘The National Civil Service
in Belgium’, pp. 120–8, in H. J. G. M. Bekke and
F. Van der Meer (eds.), Civil Service Systems in
Western Europe, Cheltenham Edward Elgar.
—— and Nelen, S. (2002) L’�egalit�e des sexes et la
politique du personnel dans le secteur public, Paris,
L’Harmattan.
—— and Depr�e, R. (2005) De Copernicushervorming
in perspectief: veranderingsmanagement in de
federale overhead, Vanden Broele, Brugge.
—— and Vandermeulen, F. (2000) ‘Competency
Management in the Flemish and Dutch Civil
Service’, International Journal of Public Sector
Management, 13:4, pp. 342–53.
—— (2010) ’The National Civil Service in Belgium’
in H. Bekke and F. Van DerMeer (eds.) Civil Service
Systems in Western Europe, Cheltenham, Edward
Elgar.
—— et al. (eds.) (2010) Een decennium justiti€ele
hervormingen in Belgi€e: Octopus Revisited, Vanden
Boele, Brugge.
Hood, C. (1976) The Limits of Administration,
London, Wiley.
—— (1991) ‘A Public Management for all Seasons’,
Public Administration, 69:1, Spring, pp. 3–19.
—— (1995) ‘Contemporary Public Management: A
New Global Paradigm?’, Public Policy and
Administration, 10:2, Summer, pp. 104–17.
—— (1996) ‘Exploring Variations in Public
Management Reform of the 1980s’, pp. 268–317,
in H. Bekke, J. Perry, and T. Toonen (eds.) Civil
Service Systems in Comparative Perspective,
Bloomington and Indianapolis, Indiana
University Press.
—— (1998) The Art of the State: Culture, Rhetoric and
Public Management, Oxford, Oxford University
Press.
—— (2002) ‘Control, Bargains, and Cheating: The
Politics of Public-Service Reform’, Journal of Public
Administration Research and Theory (J-Part), 12:3,
pp. 309–32.
—— (2005) ‘Public Management: The Word, the
Movement, the Science’, pp. 7–26 in E. Ferlie,
L. Lynn Jnr, and C. Pollitt (eds.) The Oxford
Handbook of Public Management, Oxford, Oxford
University Press.
—— and Jackson, M. (1991) Administrative
Argument, Aldershot, Dartmouth.
—— et al. (1999) Regulation Inside Government:
Waste Watchers, Quality Police and Sleaze-Busters,
Oxford, Oxford University Press.
—— and Peters, G. B. (2004) ‘The Middle Aging of
New Public Management: Into the Age of
Paradox?’, Journal of Public Administration
Research and Theory, 14:3, pp. 267–82.
—— and Lodge, M. (2006) The Politics of Public
Service Bargains, Oxford, Oxford University Press.
Horton, S., Hondeghem, A., and Farnham, D. (eds.)
(2002) Competency Management in the Public
Sector, IOS, IIAS.
Howard, D. (1998) ‘The French Strikes of 1995 and
their Political Aftermath’, Government and
Opposition, 33:2, Spring, pp. 199–220.
Hudson, J. (1999) ‘Informatization and the
Delivery of Government Services: A Political
Science Perspective’, Ph.D. thesis, Uxbridge,
Department of Government, Brunel University.
Hughes, O. (2003) Public Management and
Administration: An Introduction (3rd edn.)
Basingstoke, Palgrave/Macmillan.
Hupe, P. L. and Meijs, L. C. P. M. (2000) Hybrid
Governance: The Impact of the Nonprofit Sector in
The Netherlands. The Hague/Rotterdam/
Baltimore: Social and Cultural Planning Office/
Erasmus University/Johns Hopkins University.
Huxham, C. and Vangen, S. (2000) ‘What Makes
Partnerships Work?’ in S. Osborne (ed.) Public-
Private Partnerships, London, Routledge.
ICM (1993) Citizen’s Charter Customer Survey
(conducted for the Citizen’s Charter Unit),
London, ICM Research.
Immergut, E. (1992) Health Politics: Interests and
Institutions in Western Europe, Cambridge,
Cambridge University Press.
Ingraham, P. (1996) ‘The Reform Agenda for
National Civil Service Systems: External Stress
and Internal Strains’, pp. 247–67, in H. Bekke,
J. Perry, and T. Toonen (eds.) Civil Service Systems
in Comparative Perspective, Bloomington and
Indiana, Indiana University Press.
BIBLIOGRAPHY 343
Ingraham, P. (1997) ‘Play it Again Sam: It’s Still Not
Right: Searching for the Right Notes in
Administrative Reform’, Public Administration
Review, 57:4, July/August, pp. 325–31.
—— Peters, G. and Moynihan, D. (1998) Public
Employment and the Future of the Public Service,
paper presented to the authors’ roundtable,
Revitalising the Public Service, Ottawa, Canadian
Centre for Management Development, 12–14
November.
—— Thompson, J., and Sanders, P., (eds.) (1998)
Transforming Government: Lessons from the
Reinvention Laboratories, San Francisco, Josey-
Boss.
Innovative Public Services Group (2002) ‘Survey
Regarding Quality Activities in the Public
Administrations of the European Union Member
States’, Madrid, Subdireccion General de Gestion
de Calidad (unpublished).
Inter-American Development Bank (IADB) (2007)
Datagob: Governance Indicator Database <http://
www.iadb.org/datagob/> accessed 01/09/2008.
Jackson, P. (2001) “Public Sector Value-Added: Can
the Public Sector Deliver?’, Public Administration,
79:1, pp. 5–28.
Jacobsson, B. and Sundstr€om, G. (2009) ‘Between
Autonomy and Control: Transformation of the
Swedish Administrative Model’, pp. 103–26 in,
P. Roness and H. Saetren (eds.) Change and
Continuity in Public Sector Organizations, Bergen,
Fagbokforlaget.
James, O. (2003) The Executive Agency Revolution in
Whitehall: Public Interest Versus Bureau-Shaping
Perspectives, Basingstoke, Palgrave/Macmillan.
Jann, W. (2003) ‘State Administration and
Governance in Germany: Competing Traditions
and Dominant Narratives’, Public Administration,
81:1, pp. 95–118.
—— R€ober, M., and Wollmann, H. (2006) Public
Management: grundlagen, wirkungen und kritik,
Berlin, Edition Sigma.
Jauvin, N. (1997) ‘Government, Ministers, Macro-
Organisation Chart and Networks’, pp. 45–58, in
J. Bourgault, M. Demers, and C. Williams (eds.)
Public Administration and Public Management:
Experiences in Canada, Quebec, Les Publications
du Qu�ebec.
Jobert, B. and Muller, P. (1987) L’�Etat en action,
Paris, Presses Universitaires de France.
Johnson, C. and Talbot, C. (2007) ‘The UK
Parliament and Performance: Challenging or
Challenged?’ International Review of
Administrative Sciences, 73:1, pp. 113–31.
Johnson, J. (1998) ‘Strategy, Planning, Leadership
and the Financial Management Improvement
Plan: The Australian Public Service 1983 to 1996’,
Public Productivity and Management Review, 21:4,
June, pp. 352–68.
Joss, R. and Kogan, M. (1995) Advancing Quality:
Total Quality Management in the National Health
Service, Buckingham, Open University Press.
Joustie, H. (2001) ‘Performance Management in
Finnish State Administration’, pp. 18–19, in
Public Management in Finland, Helsinki, Ministry
of Finance.
Kaufman, H. (1981) ‘Fear of Bureaucracy: A Raging
Pandemic’, Public Administration Review, 41:1,
January/February, pp. 1–9.
Kaufmann, F., Majone, G., and Ostrom, V. (eds.)
(1986) Guidance, Control and Evaluation in the
Public Sector, Berlin, de Gruyter.
Kaufmann, D., Kraay, A., and Mastruzzi, M. (2007)
Governance Matters VI: Governance Indicators for
1996–2006, World Bank Policy ResearchWorking
Paper 4280.
—— —— ——(2009) Governance Matters VIII:
Governance Indicators for 1996-2008, World Bank
Policy Research Working Paper 4978.
Keeling, D. (1972) Management in Government,
London, Allen and Unwin.
Kelman, S. (2005) Unleashing Change: A Study of
Organizational Renewal in Government,
Washington, DC, Brookings Institution
—— (2007) ‘Public Administration and
Organizational Studies’, Academy of Management
Annals, 1:1, pp. 225–67.
—— (2008) ‘The “Kennedy School School” of
Research on Innovation in Government’, pp. 28–
51, in S. Borins (ed.) Innovations in Government:
Research, Recognition and Replication, Washington,
DC, Brookings Institute.
—— and Friedman, J. (2009) ‘Performance
Improvement and Performance Dysfunction: An
Empirical Examination of the Distortionary
Impacts of the Emergency Room Wait-Time
Target in the English National Health Service’,
Journal of Public Administration Research and
Theory, 19, pp. 917–46.
Keohane, R. and Nye, J. (eds.) (2001) Governance in
a Globalization World, Washington, DC,
Brookings Institution.
344 BIBLIOGRAPHY
Kernaghan, K. (1997) ‘Values, Ethics and Public
Service’, pp. 101–11, in J. Bourgault, M. Demers,
and C. Williams (eds.) Public Administration and
Public Management: Experiences in Canada,
Qu�ebec, Les Publications du Qu�ebec.
—— (2009a) ‘Moving towards Integrated Public
Governance: Improving Service Delivery through
Community Engagement’, International Review of
Administrative Sciences, 75:2, pp. 239–54.
—— (2009b) ‘Putting Citizens First: Service
Delivery and Integrated Public Governance’, pp.
249–69, in O. Dwivendi, T. Mau, and B. Sheldrick,
(eds.) The Evolving Physiology of Government:
Canadian Public Administration in Transition,
Ottawa, University of Ottawa.
Kettl, D. (1994) Reinventing Government? Appraising
the National Performance Review, Washington, DC,
The Brookings Institution.
—— (2000) The Global Public Management
Revolution: A Report on the Transformation Of
Governance, Washington, DC, The Brookings
Institution.
—— (2005) The Global Public Management
Revolution (2nd edn.), Washington, DC, The
Brookings Institution.
—— (2009) The Next Government of the United
States: Why Our Institutions Fail Us and How to Fix
Them, New York and London: W. W. Norton.
—— et al. (1996) Civil Service Reform: Building a
Government that Works, Washington, DC, The
Brookings Institution.
—— Pollitt, C., and Svara, J. (2004) Towards a
Danish Concept Of Public Governance: An
International Perspective, Forum for Offetlig
Topeldelse, Copenhagen.
—— and Kelman, S. (2007) Reflections on 21st
Century Government Management, Washington,
DC, IBM Center for the Business of Government.
Khan, A. and Mayes, S. (2009) Transition to Accrual
Accounting, Washington, DC, International
Monetary Fund.
Kickert, W. (ed.) (1997) Public Management and
Administrative Reform in Western Europe,
Cheltenham, Edward Elgar.
—— (2000) Public Management Reforms in the
Netherlands: Social Reconstruction of Reform Ideas
and Underlying Frames of Reference, Delft, Eburon.
—— (2007) ‘Public Management Reforms in
Countries with a Napoleonic State Model’,
pp. 26–51, in C. Pollitt, S. van Thiel, and
V. Homberg (eds.) New Public Management in
Europe: Adaptation and Alternatives, Basingstoke,
Palgrave/Macmillan.
—— (ed.) (2008) The Study Of Public Management in
Europe and the US, London and New York,
Routledge and Taylor Francis.
—— and In ‘t Veld, R. (1995) ‘National
Government, Governance and Administration’,
pp. 45–62, in W. Kickert and F. van Vught (eds.)
Public Policy and Administration Sciences in the
Netherlands, London, Prentice Hall/Harvester
Wheatsheaf.
—— Klijn, E.H., and Koppenjan, J. (eds.) (1997)
Managing Complex Networks: Strategies for the
Public Sector, London, Sage.
King, A. (1976) Why is Britain Becoming Harder to
Govern?, London, BBC.
King, G., Keohane, R. and Verber, S. (1994)
Designing Social Enquiry: Scientific Inference in
Qualitative Research, New Jersey, Princeton
University Press.
Klages, H. (1998) ‘New Public Management in
Germany: The Implementation Process of the
New Steering Model’, International Review of
Administrative Sciences, 64, pp. 41–54.
—— and L€offler, E. (1996) ‘Public Sector
Modernisation in Germany: Recent Trends and
Emerging Strategies’, pp. 132–45, in N. Flynn
and F. Strehl (eds.) Public Sector Management in
Europe, London, Prentice Hall/Harvester
Wheatsheaf.
Klein, R. and Plowden, W. (2005) ‘JASP Meets JUG:
Lessons of the 1975 Joint Approach to Social
Policy for Joined-Up Government’, pp. 107–13,
in V. Bogdanor, (ed.) Joined-Up Government,
Oxford, Oxford University Press.
Klijn, E-H. (2005) ‘Networks and Inter-
Organizational Management: Challenging,
Steering, Evaluation and the Role of Public Actors
in Public Management’, pp. 257–81, in E. Ferlie,
L. E. Lynn Jr, and C. Pollitt (eds.) (2005) The
Oxford Handbook of Public Management, Oxford:
Oxford University Press.
——(2008) ‘Governance and Governance
Networks in Europe: an Assessment of Ten Years
of Research on the Theme’, Public Management
Review, 10:4, pp. 505–25.
Klijn, E.-H. and Koppenjan, J. (eds.) (1997)
Managing Complex Networks: Strategies for the
Public Sector, London, Sage.
BIBLIOGRAPHY 345
Klijn, E.-H. (2000) ‘Politicians and Inter-Active
Decision-Making: Institutional Spoilsprts or
Playmakers?’ Public Administration, 78:2, pp. 365–87.
Knill, C. and Balint, T. (2008) ‘Explaining Variation
in Organizational Change: The Reform of
Human Resource Management in the European
Commission and the OECD’, Journal of European
Public Policy, 15:5, pp. 669–90.
K€onig, K. (1996) On the Critique of New Public
Management, Speyer, 155, Speyer
Forschungsberichte.
—— (1997) ‘Entrepreneurial Management or
Executive Administration: The Perspective of
Classical Administration’,pp. 217–36, inW. Kickert
(ed.) Public Management and Administrative Reform
inWestern Europe, Cheltenham, Edward Elgar.
—— and Siedentopf, H. (eds.) (2001) Public
Administration in Germany, Baden-Baden, Nomos.
Koppenjan, J. and Klijn, E.-H. (2004) Managing
Uncertainties in Networks, London: Routledge.
Korsten, A. and van der Krogt, T. (1995) ‘Human
Resources Management’, pp. 233–48, in W.
Kickert and F. van Vught (eds.) Public Policy and
Administration Sciences in the Netherlands,
London, Prentice Hall/Harvester Wheatsheaf.
Kotter, J. (1996) Leading Change, Boston, Harvard
Business School.
Kuchen, T. and Nordman, P. (2008) ‘Performance
Budgeting in Sweden’,OECD Journal on Budgeting,
8:1, pp. 1–11.
Lane, J.-E. (1995) ‘The Decline of the Swedish
Model’, Governance, 8:4, pp. 579–90.
—— (ed.) (1997) Public Sector Reform: Rationale,
Trends and Problems, London, Sage.
—— (2000) New Public Management, London,
Routledge.
—— and Ersson, S. (2002) Culture and Politics:
A Comparative Approach, Aldershot, Ashgate.
Lawrence, R. (1997) ‘Is it Really the Economy,
Stupid?’, pp. 11–132, in J. Nye, P. Zelikow, and
D. King (eds.) Why People Don’t Trust Government,
Cambridge, Mass., Harvard University Press.
Leeuw, F. (1995) ‘The Dutch Perspective: Trends in
Performance Measurement’, paper presented at
the International Evaluation Conference,
Vancouver, 1–5 November.
Leftwich, A. (ed.) (1984) What is Politics? The
Activity and its Study, Oxford, Blackwell.
Le Grand, J. and Bartlett, W. (1993) Quasi Markets
and Social Policy, Basingstoke, Macmillan.
Lehtoranta, O. and Niemi, M. (1997) Measuring
Public Sector Productivity in Finland: Progress Report,
paper presented to OECD/UNECE/EUROSTAT
Meeting of National Accounts Experts, June,
Paris.
Leicht, K. et al. (2008) ‘New Public Management
and New Professionalism across Nations and
Contexts’, Current Sociology, 57:4, pp. 581–605.
Le Loup, L. (1988) ‘FromMicro-Budgeting to Macro-
Budgeting’, pp. 19–42, in I. Rubin (ed.) New
Directions in Budget Theory, Albany, SUNY Press.
Leon, L. de (1997) ‘Administrative Reform and
Democratic Accountability’, pp. 237–54, in
W. Kickert (ed.) Public Management and
Administrative Reform in Western Europe,
Cheltenham, Edward Elgar.
Levy, R. (2004) ‘Between Rhetoric and Reality:
Implementing Management Reform in the
European Commission’, International Journal of
Public Sector Management, 17:2, pp. 166–77.
Light, P. (1995) Thickening Government: Federal
Hierarchy and the Diffusion of Accountability,
Washington, DC, Brookings Institution.
—— (1997) The Tides of Reform: Making Government
Work 1945–1995, New Haven, Yale University
Press.
Lijphart, A. (1984) Democracies: Patterns of
Majoritarian and Consensus Government in Twenty-
One Countries, London, Yale University Press.
—— (1999) Patterns of Democracy: Governance Forms
and Performance in 36 Countries, New Haven, Yale
University Press.
Likierman, A. (1995) ‘Performance Indicators:
Twenty Lessons From Early Managerial Use’,
pp. 57–66, in P. Jackson (ed.) Measures for Success
in the Public Sector, London, Public Finance
Foundation/Chartered Institute of Public
Finance and Accountancy.
—— (1998a) ‘Resource Accounting and Budgeting:
Where are we Now?’, Public Money and
Management, 18:2, April/June, pp. 17–20.
Lindblom, C. (1959) ‘The Science of Muddling
Through’ Public Administration Review, 19:3,
pp. 79–88.
—— (1979) ‘Still Muddling, Not Yet Through’,
Public Administration Review, 39:6, pp. 517–26.
Lindquist, E. (2006) A Critical Moment: Capturing
and Conveying the Evolution of the Canadian Public
Service, Ottawa, Canadian School of Public
Service.
346 BIBLIOGRAPHY
Listhaug, O. and Wiberg, M. (1995) ‘Confidence in
Public and Private Institutions’, pp. 298–322, in
H.-D. Klingemann and D. Fuchs (eds.) Citizens
and the State: Beliefs in Government, vol. 1, Oxford,
Oxford University Press.
Lodge, M. (2010) ‘Public Service Bargains in British
Central Government: Multiplication,
Diversification and Reassertion?’, pp. 99–113, in
M. Painter andG.B.Peters (eds.)Tradition and Public
Administration, Basingstoke, Palgrave/Macmillan.
L€offler, E. (1995) The Modernisation of the Public
Sector in an International Perspective: Concepts and
Methods of Awarding and Assessing Quality in the
Public Sector in OECD Countries, Speyer
Forschungsberichte 151, Speyer,
Forschungsinstitut fur Offentliche Verwaltung.
—— (1999) Accountability Management in
Intergovernmental Partnerships, OECD.
—— and Vintar, M. (eds.) (2004) Improving the
Quality of East and West European Public Services,
Aldershot, Ashgate.
Lomas, K. (1991) Contemporary Finnish Poetry,
Newcastle-upon-Tyne, Bloodaxe Books.
Lowndes, V. and Skelcher, C. (1998) ‘The Dynamics
of Multi-Organisational Partnerships: An
Analysis of Changing Modes of
Governance’, Public Administration, 76:2,
Summer, pp. 313–33.
Luts, M., Hondeghem A., and Bouckaert, G.
(2009) De effici€ente overheid geanalyseerd. Naar
een kleinere en betere Nederlandse overheid,
Leuven, SBOV.
Lynn, L., Heinrich, C., and Hill, C. (2001)
Improving Governance: A New Logic for Empirical
Research, Washington, DC, Georgetown
University Press.
Lynn, L., Jnr (2006) Public Management: Old and
New, New York and London, Routledge/Taylor
and Francis.
—— (2008) ‘What is a Neo-Weberian State?
Reflections on a Concept and its Implications’,
NISPAcee Journal of Public Administration
and Policy, Special issue: ‘A distinctive
European model? The Neo-Weberian State’,
1:2, pp. 17–30.
Maas, G. and van Nispen, F. (1999) ‘The Quest for a
Leaner, Not a Meaner Government’, Research in
Public Administration, 5, pp. 63–86.
McCormack, L. (2007) ‘Performance budgeting in
Canada’, OECD Journal on Budgeting, 7:4,
pp. 49–66.
Machiavelli, N. (2005) [c.1516] The Prince, London,
Penguin.
Mahon, R. and McBride, S. (eds.) (2008) The OECD
and Transnational Governance, Vancouver,
University of British Columbia Press.
Majone, G. (1996) Regulating Europe, London,
Routledge.
Mallory, J. (1997) ‘Particularities and Systems of
Government’, pp. 15–23, in J. Bourgault,
M. Demers, and C. Williams (eds.) Public
Administration and Public Management: Experiences
in Canada, Qu�ebec, Les Publications du Qu�ebec.
Management Advisory Board (1993a)
Accountability in the Commonwealth Public Sector,
Canberra, MAB/MIAC, No. 11, June.
—— (1993b) Building a Better Public Service,
Canberra, MAB/MIAC No.12, June.
—— (1994) On-Going Reform in the Australian Public
Service: An Occasional Paper to the Prime Minister,
Canberra, MAB/MIAC No. 15, October.
—— (2003) Organizational Renewal, Canberra, ACT,
Commonwealth of Australia.
—— (2004) Connecting Government: Whole Of
Government Responses to Australia’s Priority
Challenges, Canberra, ACT, Commonwealth of
Australia.
Manning, N. (2001) ‘The Legacy of the New Public
Management in Developing Countries’,
International Review of Administrative Sciences,
76:2, pp. 297–312.
March, J. and Olsen, J. (1995) Democratic
Governance, New York, Free Press.
Margetts, H. (1998) Information Technology in
Government: Britain and America, London,
Routledge.
—— 6, P., and Hood, C. (2010) Paradoxes of
Modernization: Unintended Consequences of
Public Policy Reform, Oxford, Oxford University
Press.
Marmor, T., Mashaw, J., and Harvey, P. (1990)
America’s Misunderstood Welfare State, New York,
Basic Books.
Mayne, J. (1996) Implementing Results-Based
Management and Performance-Based Budgeting:
Lessons from the Literature, Discussion Paper No.
73, Ottawa, Office of the Auditor General of
Canada.
Mazel, V. (1998) ‘SupportingManagerial Growth of
Top Dutch Civil Servants’, Public Management
Forum, 4:6, November/December, pp. 4–5.
BIBLIOGRAPHY 347
Meier, K. and O’Toole, L. (2009) ‘The Dog That
Didn’t Bark: How Public Managers Handle
Environmental Shocks’, Public Administration
87:3, pp. 485–502.
Metcalfe, L. (1993) ‘Public Management: From
Imitation to Innovation’, pp. 173–89, in
J. Kooiman (ed.) Modern Governance: New
Government–Society Interactions, London, Sage.
—— (1996) ‘The European Commission as a
Network Organisation’, Journal of Federalism,
26:4, Fall, pp. 43–62.
—— and Richards, S. (1987) ‘Evolving Public
Management Cultures’, pp. 65–86 in J. Kooiman
and K. Eliassen (eds.) Managing Public
Organizations, London, Sage.
—— —— (1990) Improving Public Management
(enlarged edn.), London, Sage/European Institute
of Public Administration.
Meyer, J. and Rowan, B. (1991) ‘Institutionalised
Organisations: Formal Structure as Myth and
Ceremony’, in W. Powell and P. DiMaggio
(eds.) The New Institutionalism in
Organisational Analysis, Chicago, University
of Chicago Press.
—— and Gupta, V. (1994) ‘The Performance
Paradox’, Research in Organizational Behavior,
16, pp. 309–69.
Micheletti, M. (2000) ‘The End of Big Government:
Is it Happening in the Nordic Countries?’,
Governance, 13:2, pp. 265–78.
Middlemas, K. (1995) Orchestrating Europe: The
Informal Politics of European Union, 1973–1995,
London, Fontana.
Mihm, C. J. (2001) ‘Implementing GPRA: Progress
and Challenges’, pp. 101–12, in D. W. Forsythe,
Quicker, Better, Cheaper? Managing Performance in
American Government, New York, The Rockefeller
Institute Press.
Milakovitch, M. (2006) ‘Comparing Bush-
Cheney and Clinton-Gore Performance
Management Strategies: Are They More Alike
Than Different?’, Public Administration, 84:2,
pp. 461–478.
Milward, H. B. and Provan, K. (2000) ‘Governing
the Hollow State’ Journal of Public Administration
Research and Theory, 10:2, pp. 359–80.
Minist�ere de la Fonction Publique et des R�eformes
Administratives (1992) La charte des services
publiques, Paris, Minist�ere de la Fonction
Publique.
—— (1994a) L’accueil dans les services publiques,
Paris, Minist�ere de la Fonction Publique.
Ministerie van Financi€en (1998) Verder met resultat:
Het agentschapsmodel 1991–1997, Den Haag,
Dutch Ministry of Finance.
Ministerie van Binnenlandse Zaken en
Koninkrijksrelaties (2007) Nota Vernieuwing
Rijksdienst, Den Haag, BZK, September.
—— (2008) Eerste Voortgangsrapportage, Programma
Vernieuwing Rijksdienst, Den Haag, BZK, May.
—— (Van Twist, M., van der Steen M., Karr�e, P.,
Peeters, R., and Van Ostaijen, M.) (2009a)
Programma Vernieuwing Rijksdiesnt, Overheid voor
de Toekomst, Vernieuwende verandering: Continuıteit
en discontinuıteit van vernieuwing van de
Rijksdienst, Den Haag, BZK.
—— (2009b) Programma Vernieuwing Rijksdienst,
Overheid voor de Toekomst, Kwaliteitsontwikkelingen
van de Rijksoverheid, Den Haag, BZK.
—— (2009c) Programma Vernieuwing Rijksdienst,
Overheid voor de Toekomst, New Public Management
voorbij?, Den Haag, BZK.
Ministry of Finance (1993) Government Decision in
Principle on Reforms in Central and Regional
Government, Helsinki, Ministry of Finance.
—— (1995) The Public Sector in Finland, Helsinki
(document prepared for a meeting of EU
Directors General).
—— (1997) Public Management Reforms: Five
Country Studies, Helsinki, Ministry of Finance.
—— (2004) Values to be Part of the Daily Job,
Helsinki, Ministry of Finance.
—— (2010) Finnish Public Governance: A Background
Report, Helsinki, Ministry of Finance, March.
Modell, S., Jacobs, K., and Wiesel, F. (2007) ‘A
Process (Re)Turn? Path Dependencies,
Institutions and Performance Management in
Swedish Central Government’, Management
Accounting Research, 18, pp. 453–75.
Mol, N. (1995) ‘Quality Improvement in the Dutch
Department of Defence’, pp. 103–28, in C. Pollitt
and G. Bouckaert (eds.) Quality Improvement In
European Public Services: Concepts, Cases and
Commentary, London, Sage.
Molander, P., Nilsson, J-E. and Schick, A. (2002)
Does Anyone Govern? The Relationship between the
Government Office and the Agencies in Sweden,
report from the SNS Constitutional Project,
Stockholm, SNS.
348 BIBLIOGRAPHY
Montricher, N. de (1996) ‘France: in Search of
Relevant Changes’, pp. 243–71, in J. Olsen and
B. Peters (eds.) Lessons From Experience:
Experiential Learning in Administrative Reforms in
Eight Democracies, Oslo, Scandinavian University
Press.
—— (1998) ‘Public Sector Values and
Administrative Reforms’, pp. 108–36, in B. G.
Peters and D. Savoie (eds.) Taking Stock: Assessing
Public Sector Reforms, Montreal and Kingston,
McGill-Queen’s University Press and Canadian
Centre for Management Development.
Moore-Wilson, M. (1997) ‘Challenges Facing the
Australian Public Service’, Canberra Bulletin of
Public Administration, 85, August, pp. 38–47.
Morgan, B. (1999) ‘Regulating the Regulators:
Meta-Regulation as a Strategy for Re-Inventing
Government in Australia’, Public Management,
1:1, pp. 49–65.
Moynihan, Donald P. (2005) ‘Homeland Security
and the U.S. Public Management Policy Agenda’,
Governance, 18:2 171–96.
—— (2008) The Dynamics of Performance
Management, Washington, DC, Georgetown
University Press.
—— (2009) ‘The Politics Measurement Makes:
Performance Management in the Obama
Era’, The Forum, 7(4): article 7.
—— and Patricia W. Ingraham (2010) ‘The Suspect
Handmaiden: The Evolution of Politics and
Administration in the American State’, Public
Administration Review, 70:S1.
Murray, R. (1998) Productivity as a Tool for
Evaluation of Public Management Reform, paper
presented to the European Evaluation Society
Conference, October, 29–31 Rome.
National Academy of Public Administration (1994)
Towards Useful Performance Measurement: Lessons
Learned from Initial Pilot Performance Plans
Prepared under the Government Performance and
Results Act, November, Washington, DC,
National Academy of Public Administration.
National Audit Office (1995) The Meteorological
Office: Evaluation of Performance, HC693, 25
August, London, HMSO.
—— (1996) State Audit in the European Union,
London, National Audit Office.
—— (1997) Annual Report, 1997, London, National
Audit Office.
—— (1999)Government on theWeb, HC87, London,
The Stationery Office.
—— (2006) Central Government’s Use of Consultants,
HC 128, Session 2006–7, London, The Stationary
Office.
—— (2009) Assessment of the Capability Review
Programme, HC123, Session 2008–9, London,
National Audit Office.
—— (2010) Reorganising Central Government,
HC452, Session 2009–10, London, National
Audit Office, 18 March.
National Performance Review (1997a) Blair House
Papers, January, Washington, DC, National
Performance Review (see also NPR website,
<http://www.npr.gov>).
—— (1997b) Serving the American Publics: Best
Practices in Customer-Driven Strategic Planning,
Federal Benchmarking Consortium Study Report,
Washington, DC, National Performance Review.
Newberry, S. (2002) ‘New Zealand’s Public Sector
Financial Management System: Resource Erosion
in Government Departments’, Ph.D. thesis,
University of Canterbury, NZ.
—— and Pallot, J. (2006) ‘New Zealand’s Financial
Management System: Implications for
Democracy’, Public Money and Management, 26:4,
pp. 221–7.
Next Steps Team (1998) Towards Best Practice: An
Evaluation of the First Two Years of the Public Sector
Benchmarking Project, 1996–98, London,
Efficiency and Effectiveness Group, Cabinet
Office.
Niemi, M. (1998) ‘Measuring Public Sector
Productivity: Productivity Change between Years
1995 and 1996 in Central Government’,
Helsinki, Statistics Finland (unpublished paper).
The NISPAcee Journal of Public Administration and
Policy (2008), 1:2, Special issue: ‘A distinctive
European model? The Neo-Weberian State’.
Nispen, F. K. M. van and Possetth, J. (2006)
‘Performance Budgeting in the Netherlands:
Beyond Arithmetic’, OECD Journal on Budgeting,
6:4, pp. 37–62.
Nivette, N. (1996) The Decline of Deference,
Peterborough, Broadview Press.
Norris, P. (2001) Digital Divide: Civic Engagement,
Information Poverty, and the Internet Worldwide,
Cambridge, Cambridge University Press.
BIBLIOGRAPHY 349
Nye, J. Jnr, Zelikow, P., and King, D. (eds.) (1997)
Why People Don’t Trust Government, Cambridge,
Mass., Harvard University Press.
O’Connor, J. (1973) The Fiscal Crisis of the State,
New York, St Martin’s Press.
OECD (1992) OECD Country Profiles, Paris, OECD.
—— (1993a) Managing with Market-Type
Mechanisms, Paris, PUMA/OECD.
—— (1993b) Private Pay For Public Work:
Performance-Related Pay for Public Service Managers,
Paris, PUMA/OECD.
—— (1994) Public Management Developments:
Survey 1993, Paris, PUMA/OECD.
—— (1995) Governance in Transition: Public
Management Reforms in OECD Countries, Paris,
PUMA/OECD.
—— (1996) Responsive Government: Service Quality
Initiatives, Paris, PUMA/OECD.
—— (1997a) In Search of Results: Performance
Management Practices, Paris, PUMA/OECD.
—— (1997b) The Changing Role of the Central Budget
Office, OCDE/GD(97)109, Paris, PUMA/OECD.
—— (1997c) Family, Market and Community: Equity
and Efficiency in Social Policy, Social Policy Studies
No. 21, Paris, OECD.
—— (1997d) OECD Country Profiles, Paris, OECD.
—— (1998)Budgeting in Sweden, Paris, PUMA/OECD.
—— (2001) Managing Cross-Cutting Issues, Paris,
PUMA/OECD <http://www.oecd.org/puma/
strat/managing.htm>.
—— (2002a) Public Sector Modernisation: A New
Agenda, CCNM/GF/GOV/PUBG(2002)1, paper
presented at the OECD Global Forum on
Governance seminar at the London School of
Economics, 2–3 December, Paris, OECD.
—— (2002b) Economic Survey of the Netherlands,
Paris, OECD.
—— (2005a) E-government for a Better Government,
Paris, OECD.
—— (2005b) Modernising Government: The Way
Forward, Paris, OECD.
—— (2007) The Programme for International Student
Assessment (PISA): Executive Summary, Paris, OECD.
—— (2009a) Government at a Glance 2009, Paris,
OECD.
—— (2009b) Measuring Government Activity, Paris,
OECD.
—— (2010a) OECD Factbook 2010, Paris OECD.
—— (2010b) OECD Public Governance Reviews:
Finland: Working Together to Sustain Success:
Assessment and Recommendations, Paris, OECD.
—— (2010c) Modernizing the Public Administration:
A Study on Italy, Paris, OECD.
Office of Management and Budget (2002) The
President’s Management Agenda, Washington, DC,
Government Printing Office <http://www.
whitehouse.gov/omb/>.
Office of Public Services Reform (2002) Better
Government Services: Executive Agencies in the 21st
Century, London, Cabinet Office <http://www.
civilservice.gov.uk/agencies.
Office of the US President (1993) Budget Baselines,
Historical Data and Alternatives for the Future,
Washington, DC, January.
Olsen, J. and Peters, B. (eds.) (1996) Lessons from
Experience: Experiential Learning in Administrative
Reforms in Eight Democracies, Oslo, Scandinavian
University Press.
Ongaro, E. (2004) ‘Process Management in the
Public Sector: The Experience of One-Stop Shops
in Italy’, International Journal of Public
Administration, 17:1, pp. 81–107.
—— (2009) Public Management Reform and
Modernization: Trajectories of Administrative Change in
Italy, France, Greece, Portugal and Spain, Cheltenham
and Northampton, Mass, Edward Elgar.
—— and Valotti, G. (2008) ‘Public Management
Reform in Italy: Explaining the Implementation
Gap’, International Journal of Public Sector
Management, 21:2, pp. 174–204.
Osborne, D. and Gaebler, T. (1992) Reinventing
Government: How The Entrepreneurial Spirit is
Transforming the Public Sector, Reading, Mass.,
Adison Wesley.
Osborne, S. (ed.) (2000) Public–Private Partnerships:
Theory and Practice in International Perspective,
London, Routledge.
—— (ed.) (2010) The New Public Governance:
Emerging Perspectives on the Theory and Practice of
Public Governance, London and New York,
Routledge/Taylor and Francis.
O’Toole, B. and Jordan, G. (eds.) (1995) Next Steps:
Improving Management in Government,
Dartmouth, Aldershot.
Packwood, T., Pollitt, C., and Roberts, S. (1998)
‘Good Medicine? A Case Study of Business
350 BIBLIOGRAPHY
Re-Engineering in a Hospital’, Policy and Politics,
26:4, pp. 401–15.
Page, E. (1997) People Who Run Europe, Oxford,
Clarendon Press.
—— (2005) ‘Joined-Up Government and the Civil
Service’, pp. 139–55, in V. Bogdanor (ed.) Joined-
Up Government, Oxford, Oxford University Press.
Painter, M. and Peters, G. B. (eds.) (2010) Tradition
and Public Administration, Basingstoke, Palgrave/
Macmillan.
Pandey, S. (2010) ‘Cutback Management and the
Paradox of Publicness’, Public Administration
Review, July/August, pp. 564–71.
Parker, D. (1999) ‘Regulating Public Utilities: What
Other Countries Can Learn from the UK
Experience’, Public Management, 1:1, pp. 93–120.
——(ed.) (2000) Privatisation and Corporate
Performance, Cheltenham, Elgar.
Pawson, R. and Tilley, N. (1997) Realistic Evaluation,
London, Sage.
Pederson, T. (2002) ‘Consumer Power Will
Transform the Public Sector’, 2QConference
(newspaper of the 2nd Quality Conference for
Public Administrations in the EU, Copenhagen,
October), pp. 2–3.
Pemberton, H. (2000) ‘Policy Networks and Policy
Learning: UK Economic Policy in the 1960s and
1970s’, Public Administration, 78: 4 pp. 771–92.
Perrow, C. (1972) Complex Organisations, Glenview,
Scott Foreman.
Perry, J. and Kraemer, K. (eds.) (1983) Public
Management: Public and Private Perspectives,
California, Mayfield.
—— and Pearce, J. (1985) ‘Civil Service Reform and
the Politics of Performance Appraisal’, pp. 140–
60 in D. Rosenbloom (ed.) Public Personnel Policy:
The Politics of Civil Service, London, Associated
Faculty Press.
—— and Hondeghem, A. (eds.) (2008) Motivation
in Public Management: The Call of Public Service,
Oxford, Oxford University Press.
—— Engbers, T., and Jun, S. (2009) ‘Back to the
Future? Performance-Related Pay, Empirical
Research, and the Perils of Persistence’, Public
Administration Review, January/February,
pp. 39–51.
Peters, G. (1995) ‘Bureaucracy in a Divided Regime:
the United States’, pp. 18–38, in J. Pierre (ed.)
Bureaucracy in the Modern State: An Introduction to
Comparative Public Administration, Aldershot,
Edward Elgar.
—— (1996a) ‘Theory and Methodology’,
pp. 13–41, in H. Bekke, J. Perry, and T. Toonen
(eds.) Civil Service Systems in Comparative
Perspective, Bloomington and Indiana, Indiana
University Press.
—— (1996b) The Future of Governing: Four Emerging
Models, Kansas, University Press of Kansas.
—— (1997) ‘A North American Perspective on
Administrative Modernisation in Europe’,
pp. 255–70, inW. Kickert (ed.) Public Management
and Administrative Reform in Western Europe,
Cheltenham, Edward Elgar.
—— (1998a) ‘What Works? The Antiphons of
Administrative Reform’, pp. 78–107, in B. G.
Peters and D. Savoie (eds.) Taking Stock:
Assessing Public Sector Reforms, Montreal and
Kingston, Canadian Centre for Management
Development and McGill-Queen’s University
Press.
—— (1998b) ‘Managing Horizontal Government:
The Politics of Co-Ordination’, Public
Administration, 76:2, Summer, pp. 295–311.
—— (2010) ‘Public Administration in the United
States: Anglo-American, Just American, or Which
American?’ pp. 114–28 in M. Painter and
G. B. Peters (eds.) Tradition and Public
Administration, Basingstoke, Palgrave/Macmillan.
—— and Savoie, D. (1998) ‘Introduction’, pp.
3–19, in B. G. Peters and D. Savoie (eds.) Taking
Stock: Assessing Public Sector Reforms, Montreal
and Kingston, Canadian Centre for Management
Development and McGill-Queen’s University
Press.
—— and Pierre, J. (eds.) (2001) Politicians,
Bureaucrats and Administrative Reform, London,
Routledge.
—— andBouckaert, G. (2003) ‘What is Available and
what is Missing in the Study of Quangos?’, in
C. Pollitt, and C. Talbot, (eds.) Unbundled
Government, London, Taylor and Francis.
—— and Pierre, J. (eds.) 2004) Politicization of the
Civil Service in Comparative Perspective, London,
Routledge.
Peters, T. (1987) Thriving on Chaos: Handbook for a
Management Revolution, London, Pan.
Peterson, J. and Shackleton, M. (2002) The
Institutions of the European Union, Oxford, Oxford
University Press.
BIBLIOGRAPHY 351
Peterson, M. (2000) ‘The Fate of “Big Government”
in the United States: Not Over, But Undermined’,
Governance, 13:2, pp. 251–64.
Pew Research Centre (1998) Deconstructing Distrust:
How Americans View Government, <http://www.
people-press.org/trustrpt.htm>.
Pierre, J. (1998) Externalities and Relationships:
Rethinking the Boundaries of the Public Service,
paper for the authors’ roundtable, Revitalising
the Public Service, Ottawa, Canadian Centre for
Management Development, 12–14 November.
—— (ed.) (1995) Bureaucracy in the Modern State: An
Introduction to Comparative Public Administration,
Aldershot, Edward Elgar.
—— (ed.) (2000) Debating Governance, Oxford:
Oxford University Press.
—— (2003) ‘Central Agencies in Sweden: A Report
from Utopia’, in C. Pollitt and C. Talbot (eds.)
Unbundled Government, London, Taylor and
Francis.
—— (2010) ‘Administrative Reform in Sweden:
The Resilience of Administrative Tradition’, pp.
191–202, in M. Painter and G. B. Peters (eds.)
Tradition and Public Administration, Basingstoke,
Palgrave/Macmillan.
Pierson, P. (2000) ‘Increasing Returns, Path
Dependence and the Study of Politics’, American
Political Science Review, 94:2, pp. 251–67.
Pollitt, C. (1984) Manipulating the Machine:
Changing the Pattern of Ministerial Departments,
1960–83, London, Allen and Unwin.
—— (1986) ‘Beyond the Managerial Model: The
Case for Broadening Performance Assessment in
Government and the Public Services’, Financial
Accountability and Management, 2:3, Autumn,
pp. 155–70.
—— (1990) ‘Performance Indicators: Root And
Branch’, pp. 167–78, in M. Cave, M. Kogan, and
R. Smith (eds.) Output and Performance
Measurement in Government: The State of the Art,
London, Jessica Kingsley.
—— (1993) Managerialism and the Public Services
(2nd edn.), Oxford, Blackwell.
—— (1995) ‘Justification by Works or by Faith?
Evaluating the New Public Management’,
Evaluation, 1:2, October, pp. 133–54.
—— (1996a) ‘Anti-statist Reforms and New
Administrative Directions: Public Administration
in the United Kingdom’, Public Administration
Review, 56:1, January/February, pp. 81–7.
—— (1998) ‘Managerialism Revisited’, pp. 45–77
in B. G. Peters and D. Savoie (eds.) Taking Stock:
Assessing Public Sector Reforms, Montreal and
Kingston, McGill-Queen’s University Press and
Canadian Centre for Management Development.
—— (2000) ‘Institutional Amnesia: A Paradox
of the “Information Age”?’, Prometheus, 18:1,
pp. 5–16.
—— (2001a) ‘Integrating Financial and
Performance Management’, OECD Journal on
Budgeting, 1:2, pp. 7–37.
—— (2001b) ‘Integrating Financial Management
and Performance Management’ OECD Journal on
Budgeting, 1:2, pp. 7–38.
—— (2002) ‘Clarifying Convergence: Striking
Similarities and Durable Differences in Public
Management Reform’, Public Management Review,
4:1, pp. 471–92.
—— (2003a) The Essential Public Manager,
Buckingham, Open University Press/McGraw Hill.
—— (2003b) ‘Joined-Up Government: A Survey’,
Political Studies Review , 1:1, pp. 34–49.
—— (2005) ‘Decentralization: A Central Concept in
Contemporary Public Management’, pp. 371–97,
in E. Ferlie, L. E., Lyn Jnr, and C. Pollitt, (eds.) The
Oxford Handbook of Public Management, Oxford,
Oxford University Press.
—— (2006a) ‘Performance Management in
Practice: A Comparative Study of Executive
Agencies’, Journal of Public Administration Research
and Theory, 16:1, pp. 25–44.
—— (2006b) ‘Performance Information for
Democracy: The Missing Link?’, Evaluation, 12:1,
pp. 38–55.
—— (2007) ‘New Labour’s Re-Disorganization:
Hyper-Modernism and the Costs of Reform—A
Cautionary Tale’, Public Management Review, 9:4,
pp. 529–43.
—— (2008) Time, Policy, Management: Governing
with the Past, Oxford, Oxford University Press.
—— (2009) ‘Structural Change and Public Service
Performance’, Public Money and Management,
29:5, pp. 285–91.
—— (2010a) ‘Cuts and Reforms: Public Services as
We Move into a New Era’, Society and Economy,
32:1, pp. 17–31.
—— (2010b) ‘Simply the Best? The International
Benchmarking of Reform and Good
Governance’, pp. 91–113, in J. Pierre and P.
Ingraham (eds.) Comparative Administrative
352 BIBLIOGRAPHY
Change And Reform: Lessons Learned (Festschrift
for Guy B. Peters), Montreal and Kingston,
McGill-Queens University Press.
—— (2011) ‘Not Odious but Onerous?
Comparative Public Administration’, Public
Administration, 89:1, pp. 114–127.
—— and Bouckaert, G. (eds.) (1995) Quality
Improvement in European Public Services: Concepts,
Cases and Commentary, London, Sage.
—— et al. (1997) Trajectories And Options: An
International Perspective on the Implementation of
Finnish Public Management Reforms, Helsinki,
Ministry of Finance.
—— and Summa, H. (1997) ‘Reflexive Watchdogs?
How Supreme Audit Institutions Account for
Themselves’, Public Administration, 75:2,
Summer, pp. 313–36.
—— Birchall, J., and Putman, K. (1998)
Decentralising Public Service Management The
British Experience, Basingstoke, Macmillan.
—— et al. (1999) Performance or Compliance?
Performance Audit and Public Management in Five
Countries, Oxford, Clarendon Press.
—— et al. (2001) ‘Agency Fever? Analysis of an
International Fashion’, Journal of Comparative Policy
Analysis: Research and Practice, 3, pp. 271–90.
—— and Bouckaert, G. (2003) ‘Evaluating Public
Management Reforms: An International
Perspective’, in H. Wollman (ed.) Evaluating
Public Sector Reforms, Aldershot, Edward Elgar.
—— and Talbot, C. (eds.) (2004) Unbundled
Government: A Critical Analysis of the Global Trend to
Agencies, Quangos and Contractualisation, London
and New York, Routledge/Taylor and Francis.
—— et al. (2004) Agencies: How Governments Do
Things Through Semi-Autonomous Organizations,
Basingstoke, Palgrave/Macmillan.
—— Van Thiel, S., and Homburg, V. (eds.) (2007)
New Public Management in Europe: Adaptations and
Alternatives, Basingstoke, Palgrave/Macmillan.
—— and Bouckaert, G. (2009) Continuity and
Change in Public Policy and Management,
Cheltenham, Edward Elgar.
—— and Op de Beeck, L. (2010) Training Top Civil
Servants: A Comparative Analysis, Leuven, Public
Management Institute, Katholieke Universiteit
Leuven.
—— et al. (2010) ‘Performance Regimes in Health
Care: Institutions, Critical Junctures and the
Logic of Escalation in England and the
Netherlands’, Evaluation, 16:1, pp. 13–29.
—— and Hupe, P. (2011) ‘Talking about
Government: The Role ofMagic Concepts’, Public
Management Review, 89:1, pp. 114–27.
Power, M. (1997) The Audit Society: Rituals of
Verification, Oxford, Oxford University Press.
Premchand, A. (1983) Government Budgeting and
Expenditure Controls: Theory and Practice,
Washington, DC, International Monetary Fund.
Premfors, R. (1991) ‘The “Swedish Model” and
Public Sector Reform’, Western European Politics,
14:3, July.
—— (1998) ‘Reshaping the Democratic State:
Swedish Experiences in a Comparative
Perspective’, Public Administration, 76:1, Spring,
pp. 141–59.
President of the Treasury Board (1997) Accounting
for Results, 1997, Ottawa, Treasury Board
Secretariat.
Pressman, J. and Wildavsky, A. (1973)
Implementation, Berkeley, University of California
Press.
Prime Minister (1988) Civil Service Management
Reform: The Next Steps, Cm.542, London, HMSO.
——(1991) The Citizen’s Charter: Raising The
Standard, Cm.1599, London, HMSO.
—— Chancellor of the Exchequer, and Chancellor
of the Duchy of Lancaster (1994) The Civil Service:
Continuity and Change, Cm.2627, London, HMSO.
—— and the Minister for the Cabinet Office (1999)
Modernising Government, Cm.413, London, The
Stationery Office.
Puoskari, P. (1996) Transformation of the Public
Sector, Helsinki, Ministry of Finance.
P€oysti, T. (2010) OECD Public Governance Review of
Finland Gives a Good Basis for the Public
Management Agenda of the Next Electoral Period,
Helsinki, National Audit Office, 31 May.
Put, V. and Bouckaert, G. (2010) ‘Managing
Performance and Auditing Performance’, pp,
223–36 in T. Christensen and P. Lægreid (eds.)
The Ashgate Research Companion to New Public
Management, Farnham, Ashgate.
Radin, B. (1998) ‘The Government Performance
and Results Act (GPRA): Hydra-Headed Monster
or Flexible Management Tool?’, Public
Administration Review, 58:4, July/August,
pp. 307–16.
BIBLIOGRAPHY 353
Radin, B. (2000) ‘The Government Performance
and Results Act and the Tradition of Federal
Management Reform: Square Pegs in Round
Holes’, Journal of Public Administration and
Research Theory, 10:1, pp. 111–35.
—— (2006) Challenging the Performance Movement:
Accountability, Complexity and Democratic Values,
Washington, DC, Georgetown University Press.
—— (2009) ‘Overhead Agencies and Permanent
Government: The Office of Management and
Budget in the Obama Administration’, The
Forum, 7:4, article 8, pp. 1–15.
Rainey, H. and Steinbauer, P. (1999) ‘Galloping
Elephants: Developing Elements of a Theory of
Effective Government Organizations’, Journal of
Public Administration Research and Theory, J. Part,
9:1, pp. 1–32.
Rambøll/Eur�eval/Matrix (2009) Evaluation of the EU
De-Centralised Agencies, Copenhagen, Rambøll.
Regulation (EC) no 1049/2001 of the European
Parliament and of the Council of 30 May 2001
Regarding Public Access to European Parliament,
Council and Commission Documents, Official
Journal of the European Communities L145/43,
31 May 2001.
Reichard, C. (2008) ‘The Study of Public
Management in Germany: Poorly
Institutionalized and Fragmented’, pp. 42–69, in
W. Kickert (ed.) The Study of Public Management in
Europe and the US, London and New York,
Routledge and Taylor Francis.
The Reorganization of Central Government (1970)
Cmnd 4506, London, HMSO.
Rhodes, R. (1997) ‘Re-inventing Whitehall,
1979–1995’, pp. 43–60, in W. Kickert (ed.) Public
Management and Administrative Reform in Western
Europe, Cheltenham, Edward Elgar.
—— (2000) ‘Governance and Public
Administration’, in Pierre, J. (ed.) Debating
Governance, Oxford: Oxford University Press,
pp. 54–90.
Riccucci, N. and Thompson, F. (2008) ‘The New
Public Management, Homeland Security, and the
Politics of Civil Service Reform’, Public
Administration Review, September/October,
pp. 877–90.
Ridley, F. (1996) ‘The New Public Management in
Europe: Comparative Perspectives’, Public Policy
and Administration, 11:1, Spring, pp. 16–29.
R€ober, M. (1996) ‘Germany’, pp. 169–94, in D.
Farnham, S. Horton, J. Barlow, and A.
Hondeghem (eds.) New Public Managers in Europe,
Macmillan, Basingstoke.
—— and L€offler, E. (1999) ‘Flexibilities in the
German Civil Service’, in S. Horton and D.
Farnham (eds.) Human Resource Flexibilities in the
Public Services: International Comparisons,
Basingstoke, Macmillan.
Roberts, A. (2006) Blacked Out: Government Secrecy
in the Information Age, Cambridge, Cambridge
University Press.
—— (2010) The Limits of Discipline: Global
Capitalism and the Architecture of Government,
Oxford, Oxford University Press.
Rockman, B. (1998) ‘The Changing Role of the
State’, pp. 20–44, in B. G. Peters and D. Savoie
(eds.) Taking Stock: Assessing Public Sector Reforms,
Montreal and Kingston, Canadian Centre for
Management Development and McGill-Queen’s
University Press.
Romakkaniemi, P. (2001) ‘Access to Finnish Public
Sector Information and its Services’, pp. 4–7 in
Public Management in Finland, Helsinki, Ministry
of Finance.
Rosenau, P. (ed.) (2000) Public–Private Policy
Partnerships, Westwood, Mass., Massachusetts
Institute of Technology.
Rouban, L. (1995) ‘The Civil Service Culture and
Administrative Reform’, pp. 23–54 in B. G. Peters
and D. Savoie (eds.) Governance in a Changing
Environment, Montreal and Kingston, Canadian
Centre for Management Development and
McGill-Queen’s University Press.
—— (1997) ‘The Administrative Modernisation
Policy in France’, pp. 143–58, in W. Kickert (ed.)
Public Management and Administrative Reform in
Western Europe, Cheltenham, Edward Elgar.
—— (2007) ‘Public Management and Politics:
Senior Bureaucrats in France’, Public
Administration, 85:2, pp. 473–501.
Rubin, I. (1992) ‘Budgeting: Theory, Concepts,
Methods and Issues’, pp. 3–22, in J. Rabin (ed.)
Handbook of Public Budgeting, New York, Marcel
Dekker.
Rudd, K. (2008) Address to Heads of Agencies and
Members of the Senior Executive Service, Canberra,
30 April <http://www.apsc.gov.au/media/
rudd300408.htm>, accessed 5 May 2010.
Sachverst€andigenrat ‘Schlanker Staat’ (1997)
Abschlussbericht, Band 1, Bonn,
Sachverst€andigenrat Schlanker Staat im
Bundesministerium des Innern.
354 BIBLIOGRAPHY
Sahlin-Andersson, K. (2001) ‘National,
International and Transnational Constructions
of New Public Management’, pp. 43–72, in
T. Christensen and P. Lægreid (eds.) New Public
Management: The Transformation of Ideas and
Practice, Aldershot, Ashgate.
—— and Engwall, L. (eds.) (2002) The Expansion of
Management Knowledge: Carriers, Flows and Sources,
Stanford, Calif. Stanford Business Books.
Saint Martin, D. (2005) ‘Management Consultancy’,
pp. 671–94, in E. Ferlie, L. Lynn Jnr, and C. Pollitt
(eds.) The Oxford Handbook of Public Management,
Oxford, Oxford University Press.
Savoie, D. (1994) Thatcher, Reagan, Mulroney: In
Search of a New Bureaucracy, Toronto, University
of Toronto Press.
—— (1997) ‘Central Agencies: A Government of
Canada Perspective’, pp. 59–69, in J. Bourgault,
M. Demers, and C. Williams (eds.) Public
Administration and Public Management:
Experiences in Canada, Quebec, Les Publications
du Qu�ebec.
Scahill, J. (2007) Blackwater: The Rise of the World’s
Most Powerful Mercenary Army, London, Serpent’s
Tail.
Schedler, K. and Proeller, I. (eds.) (2007) Cultural
Aspects of Public Management Reform, Amsterdam,
Elsvier.
Schiavo, L. (2000) ‘Quality Standards in the Public
Sector: Differences between Italy and the UK in
the Citizen’s Charter Initiative’, Public
Administration, 78:3, pp. 679–98.
Schick, A. (1996) The Spirit of Reform: Managing the
New Zealand State Sector in a Time of Change,
Wellington, State Services Commission.
—— (2001) ‘Getting Performance Measures to
Measure Up’, pp. 39–60, in D. W. Forsythe
Quicker, Better, Cheaper? Managing Performance in
American Government, New York, The Rockefeller
Institute Press.
Scholte, J. (2000) Globalization: A Critical
Introduction, Basingstoke, Macmillan.
Schr€oter, E. (2007) ‘Reforming the Machinery of
Government: The Case of the German Federal
Bureaucracy’, pp. 251–71 in R. Koch and J. Dixon
(eds.) Public Governance and Leadership,
Wiesbaden, Universit€ats-Verlag.
andWollmann, H. (1997) ‘Public Sector Reforms in
Germany: Whence and Where? A Case of
Ambivalence’, Administrative Studies/Hallinnon
Tutkimus, 3, pp. 184–200.
Select Committee on a Certain Maritime Incident
(2002) Report, Canberra, Senate Printing unit,
October.
Shergold, P. (1997) ‘A New Public Service Act:
The End of the Westminster Tradition?’,
edited text of an address, Canberra Bulletin
of Public Administration, No. 85, August, pp. 32–7.
Simon, H. (1946) ‘The Proverbs of Administration’,
Public Administration Review, 6, pp. 53–67.
Smullen, A. (2010) Translating Agency Reforms:
Rhetoric and Culture in Comparative Perspective,
Basingstoke, Palgrave/Macmillan.
Sommerman, K.-P. (1998) ‘Autorit�e et contrat dans
l’administration moderne en Allemagne’,
Annuaire Europ�een d’Administration Publique, 20,
Aix-Marseilles.
Sorber, B. (1996) ‘Experiences with Performance
Measurement in the Central Government:
The Case of the Netherlands’, pp. 309–18,
in A. Halachmi and G. Bouckaert (eds.)
Organisational Performance and Measurement in
the Public Sector: Towards Service, Effort and
Accomplishment Reporting, Westport, Conn.,
Quorum Books.
Sørensen, E. and Torfing, J. (2009) ‘Making
Governance Networks Effective and Democratic
through Metagovernance’, Public Administration
87:2, pp. 234–58.
SOU 2007:75 (2007) Att styra staten: Regeringens
styring av sin f€orvaltning, Stockholm, Statens
Offentliga Utredningen.
Spierenberg, D. (1979) ‘Proposals for Reform of the
Commission of the European Communities and
its Services’, Brussels, Commission of the
European Communities.
State Services Commission (2001) Review of the
Centre, Wellington (NZ) <http://www.ssc.govt.
nz/roc.
—— (2002) Current Problems in Public Management,
Wellington (NZ) <http://www.ssc.govt.nz/
current-problems-public-management>.
Statistics Canada (1995)Canada: A Portrait, Ottawa,
Minister of Industry.
Steane, P. (2008) ‘Public Management Reforms in
Australia and New Zealand’, Public Management
Review, 10:4, pp. 453–65.
Steering Group (1991) Review of State Sector Reforms,
Auckland, State Service Commission.
Steunenberg, B. and Mol, N. (1997) ‘Fiscal and
Financial Decentralization: A Comparative
BIBLIOGRAPHY 355
Analysis of Six West European Countries’,
pp. 235–56, in J.-E. Lane (ed.) Public Sector Reform:
Rationale, Trends and Problems, London, Sage.
Stevens, A. and Stevens, H. (2001) Brussels
Bureaucracts? The Administration of the European
Union, Basingstoke, Palgrave.
Stewart, J. (1994) ‘The Rebuilding of Public
Accountability’, pp. 75–9, in N. Flynn (ed.)
Reader: Change in the Civil Service, London, Public
Finance Foundations.
Stivers, C. (2009) ‘The Ontology of Public Space:
Grounding Governance in Social Reality’,
American Behavioural Scientist, 52:7, 1095–108.
Stockman, D. (1986) The Triumph of Politics,
London, Bodley Head.
Stone, B. (1995) ‘Administrative Accountability
in the “Westminster” Democracies: Towards a
New Conceptual Framework’, Governance, 8:4,
pp. 505–26.
Stone, D. (1996) Capturing the Political Imagination:
Think Tanks and the Policy Process, London, Frank
Cass.
Straw, J. (1998) ‘Resource Accounting and NHS
Trusts’, Public Money andManagement, 18:2, April/
June, pp. 35–8.
Summa, H. (1995) ‘Old and New Techniques for
Productivity Promotion: From Cheese-Slicing to
a Quest for Quality’, pp. 155–65, in A. Halachmi
and G. Bouckaert (eds.) Public Productivity through
Quality and Strategic Management, Amsterdam,
IOS Press.
Sundstr€om, G. (2006) ‘Management by Results: Its
Origin and Development in the Case of the
Swedish State’ International Public Management
Journal, 9:4, pp. 399–427.
Swedish Ministry of Finance (1997) Public Sector
Productivity in Sweden, Stockholm, Budget
Department/Swedish Ministry of Finance.
Sylves, R. (2006) ‘President Bush and Hurricane
Katrina: A Presidential Leadership Study’, Annals
of the American Academy of Political and Social
Science, March 604, pp. 26–56.
Talbot, C. (1994) Re-Inventing Public Management: A
Survey of Public Sector Managers’ Reactions to
Change, Northants, Institute of Management.
—— (1996) Ministers and Agencies: Control,
Performance and Accountability, London, CIPFA.
—— (1997) ‘Public Performance: Towards a Public
Service Excellence Model’, Discussion Paper No.
1, Monmouthshire, Public Futures.
—— and Johnson, C. (2007) ‘Seasonal Cycles
in Public Management: Disaggregation and
Re-Aggregation’, Public Money and Management,
27:1, pp. 53–60.
Task Force on Management Improvement (1992)
The Australian Public Service Reformed: An
Evaluation of a Decade of Management Reform,
Canberra, Management Advisory Board, AGPS.
Thain, C. andWright, M. (1995) The Treasury and
Whitehall: The Planning and Control of Public
Expenditure, 1976–1993, Oxford, Clarendon Press.
Thiel, S. van (2001) Quangos: Trends, Causes and
Consequences, Aldershot, Ashgate
Thomas, P. (2009) ‘Trust, Leadership, and
Accountability in Canada’s Public Sector’,
pp. 215–48, in O. Dwivendi T. Mau and
B. Sheldrick, (eds.) The Evolving Physiology of
Government: Canadian Public Administration in
Transition, Ottawa, University of Ottawa.
Thompson, G. et al. (eds.) (1991) Markets,
Hierarchies and Networks: The Co-ordination of
Social Life, London, Sage.
Thompson, J. (2000) ‘Reinvention as Reform:
Assessing the National Performance Review’,
Public Administration Review, 60:6, November/
December, pp. 508–21.
Thompson, J. R. and Rainey, H. (2003) Modernizing
Human Resource Management in the Federal
Government: The IRS Model, Washington, DC, IBM
Endowment for the Business of Government.
Tiihonen, S. (1996) ‘The Administration of the
Summit in Finland’, unpublished conference
paper.
Toulemonde, J. (1997) ‘Europe and theMember
States: Cooperating and Competing on Evaluation
Grounds’, pp. 117–32 in O. Rieper and J.
Toulemonde (eds.) Politics and Practices of
Intergovernmental Evaluation, London, Transaction.
Treasury Board of Canada (1996) Getting
Government Right: Improving Results Measurement
and Accountability, Ottawa, Ministry of Public
Works and Government Services.
Trosa, S. (1994) Moving on: Next Steps, London,
Efficiency Unit, Cabinet Office.
—— (1995)Moderniser l’administration: Comment
font les autres?, Paris, Les �Editions d’Organisation.
—— (1996) ‘Quality Strategies in Three Countries:
France, the United Kingdom and Australia’,
pp. 265–97 in OECD, Responsive Government:
Service Quality Initiatives, Paris, PUMA/OECD.
356 BIBLIOGRAPHY
—— (1997) ‘Chairman’s summary’, pp. 5–9 inOECD,
Benchmarking, Evaluation and Strategic Management
in the Public Sector, Paris, PUMA/OECD.
—— (2002) Le guide de la gestion par programmes:
Vers une culture du r�esultat, Paris, �Editions
d’Organisation.
Tweede Kamer der Staten-Generaal (2007)
Trendnota Arbeidszaken Overheid 2008. Tweede
Kamer, vergaderjaar 2007–2008, 31201, nrs.1–2.
Sdu Uitgevers, ’s Gravenhage.
United Nations (2001) World Public Sector Report:
Globalization and the State, New York, Department
of Economic and Social Affairs, UN.
Vancoppenolle, D. and Legrain, A. (2003) ‘Le New
Public Management en Belgique: Comparaison
des r�eformes en Flandres et en Wallonie’,
Administration Publique.
Van de Walle, S (2006) ‘The State of the World’s
Bureaucracies’ Journal of Comparative Policy
Analysis 8:4, pp. 437–48.
—— Van Roosbroek, S., and Bouckaert, G. (2008)
‘Trust in the Public Sector: is there any Evidence
for a Long Term Decline?’, International Review of
Administrative Sciences, 74:1, pp. 47–64.
Van Dooren, W. and Van de Walle, S. (eds.) (2008)
Performance Information in the Public Sector: How it
is Used, London, Palgrave/Macmillan.
—— W., Bouckaert, G., and Halligan, J. (2010)
Performance Management in the Public Sector,
London and New York, Routledge/Taylor and
Francis.
Veggeland, N. (2007) Paths of Public Innovation in the
Global Age: Lessons from Scandinavia, Cheltenham
and Northampton, Mass., Edward Elgar.
Verschuere, B. and Barbieri, D. (2009)
‘Investigating the “NPM-ness” of Agencies in
Italy and Flanders: The Effects of Place, Age and
Task’, Public Management Review 11:3, pp. 345–73.
Volcker, P. (1989) ‘Leadership for America:
Rebuilding the Public Service’, task force report to
the National Commission on the Public Service,
Washington, DC, National Commission on the
Public Service.
Vowles, J. et al. (1995) Towards Consensus: The 1993
Election in New Zealand and the Transition to
Proportional Representation, Auckland, Auckland
University Press.
Wagschal, U. (2007) ‘A Mortgage on the Future?
Public Debt Expenditure and its Determinants,
1981–2001’, pp. 215–44, in F. Castles (ed.) The
Disappearing State: Retrenchment Realities in an Age
of Globalisation, Cheltenham, Edward Elgar.
Walker, R. (2001) ‘Great Expectations: Can Social
Science Evaluate New Labour’s Policies?’
Evaluation, 7:3, pp. 305–30.
Wanna, J.; Jensen, L., and De Vries, J. (eds.) (2003)
Controlling Public Expenditure: The Changing Roles
of Central Budget Agencies—Better Guardians?,
Cheltenham, Edward Elgar.
Waugh, W. (2006) ‘The Political Costs of Failure in
the Katrina and Rita Disasters’ Annals of the
American Academy of Political and Social Science,
March 604, pp. 10–25.
Weber, M. (1947) The Theory of Social and
Economic Organisation (translated by A. M.
Henderson and Talcott Parsons), Glencoe, Ill.,
The Free Press.
Weiss, C. (1992) Organisations for Policy Analysis:
Helping Government Think, London, Sage.
Whitcombe, J. and Gregory, R. (2008) ‘Assessing
the Quality of Government in Post-NPM New
Zealand: Mediating Social Science with Social
Criticism’, paper presented to the Structure and
Organization of Government (SOG) Conference,
Gothenburg, 13–15 November.
White, A. and Dunleavy, P. (2010) Making and
Breaking Whitehall Departments: A Guide to
Machinery of Government Changes, London,
Institute of Government/London School of
Economics.
Wildavsky, A. (1979) Speaking Truth to Power: The
Art and Craft of Policy Analysis, Boston, Little,
Brown and Co.
Wilkinson, R. and Pickett, K. (2010) The Spirit Level:
Why Equality is Better for Everyone, London,
Penguin.
Williams, D. (2000) ‘Reinventing the Proverbs of
Government’, Public Administration Review, 60:6,
November/December, pp. 522–34.
Williamson, O. (1975) Markets and Hierarchies:
Analysis and Anti-Trust Implications, New York,
Free Press.
Wilson, J. Q. (1989) Bureaucracy, New York, Basic
Books.
Wise, C. (1990) ‘Public Service Configurations and
Public Organizations: Public Organizational
Design in the Post-Privatization Era’, Public
Administration Review, 50:2, pp. 141–55.
Wollmann, H. (1997) ‘Modernization of the Public
Sector and Public Administration in the Federal
Republic of Germany: (Mostly) a Story of
Fragmented Incrementalism’, pp. 79–103, in M.
Muramatsu and F. Naschold (eds.) State and
Administration in Japan and Germany: A
BIBLIOGRAPHY 357
Comparative Perspective on Continuity and Change,
Berlin, de Gruyter.
Wollmann, H. (2001) ‘Germany’s Trajectory of
Public Sector Modernization: Continuities
and Discontinuities’, Policy and Politics, 29:2,
pp. 151–69.
—— (ed.) (2003) Evaluation of Public Sector Reform:
Concepts and Practice in International Perspective,
Cheltenham and Northampton, Mass., Edward
Elgar.
World Bank (Latin America and the Caribbean)
(2008) ‘Review of the Policy Utility of the
worldwide Governance Indicators for the
Central American Countries’, working
paper 0108, June 11, Washington DC, World
Bank.
Worthy, B. (2010) ‘More Open but Not More
Trusted? The Effect of the Freedom of
Information Act 2000 on the United Kingdom
Central Government’, Governance, 23:4,
pp. 561–82.
Wright, V. (1989) The Government and Politics
of France (3rd edn.), London, Unwin Hyman.
—— (1997) ‘The Paradoxes of Administrative
Reform’, pp. 7–13, in W. Kickert (ed.) Public
Management and Administrative Reform in Western
Europe, Cheltenham, Edward Elgar.
Yesilkagit, K. and De Vries, J. (2004) ‘Reform Styles
of Political and Administrative Elites in
Majoritarian and Consensus Democracies: Public
Management Reforms in New Zealand and
the Netherlands’, Public Administration, 82:4,
pp. 951–74.
Yin, R. (1994) Case Study Research: Design and
Methods (2nd edn.), London, Sage.
Younge, G. (2003) ‘Shades of Grey’ (an
interview with Hans Blix), Guardian G2, 28
March, pp. 2–3.
Zifcak, S. (1994) New Managerialism: Administrative
Reform in Whitehall and Canberra, Buckingham,
Open University Press.
358 BIBLIOGRAPHY
n I NDEX
Aaboriginal peoples 231, 247
accountability 7, 110, 180
management 197–8, 199–201,
204
politicians 168–74
accounting systems 83–6, 308–9
accruals 85, 317
cash 84, 85
double-entry book-keeping 84
FABRIC 83
Whole-of Government
Accounting (WGA) 85–6
see also auditing
administration:
development 6
vs management 184
see also bureaucracy; civil service;
management; political-
administrative systems
administrative factors 34
administrative systems:
resistance to change 42–3
see also European Commission;
individual countries
advice 107, 302, 308, 316, 328
Australia 233, 234
consultants 4, 6, 14, 29, 66, 156
European Commission 68, 70
source of 66–7
see also ideas
advisers, political 175–6, 212
Afghanistan 1
agencies 40–3, 132
central 77, 79, 81, 83, 103–6,
113, 116, 250, 252–3
created 99, 103, 261, 282, 287
executive 2, 14, 140, 163, 165,
187, 198, 218, 314–17, 322
international 13, 97
merged 308, 324
Anglo-Saxon-model 19
attribution problem 134–5, 144
auditing 156, 252, 273, 294–5
central 165
explosion of 204
internal 244, 260–1
performance 86–7, 197–8, 287,
309, 319
reforms 71, 86–7
see also accounting systems
Australia 210, 231–7
administrative system 55, 66,
233–4
centralization 53
citizen pressure 232
downsizing 232, 233, 236
economic growth 231
elite decision-making 233
elite relationships 60, 65–6, 171,
175–6, 187
Government Business
Enterprises 234
immigration 231
international trade 231
key events 237
new management ideas 232
Outcome Framework 83
party politics 232–3
personnel management 88, 91
policy advice 66
political system 55, 66, 232
population 231
privatization 234
public private partnerships 232
Public Service Act 90
Public Service (APS) 151
public spending 231
reform:
implementation 235
package 234–5
results 130, 136, 138, 152–3,
235–6
trajectory 80, 82, 84, 86–7, 89,
92–3, 96–7, 100–1, 103,
107–8, 110, 116–17
types of 6, 11, 12, 38, 40
socio-economic indicators 224,
225, 226, 228
socio-economic policies 231–2
state structure 51, 52
BBelgium 238–46
administrative system 48, 51,
56, 65, 66, 241–3
centralization 52–3
civil service 243
Conseil d’Etat 62
Copernicus Reforms 18, 88, 149,
151, 167, 240, 241, 243, 244
DNA database 202
downsizing 238, 240
elites 241–2
Flemish and Walloon
communities 103
international trade 238
key events 245–6
new management ideas 239–40
party politics 240–1
personnel management 88, 91
political system 48, 56, 65, 66,
238–9
population 238
public debt 238
public sector employment 242
reform:
implementation 244
package 243–4
results 130, 147–9, 151, 154,
244
trajectory 80, 82, 84, 93–4, 97,
101–2, 114, 116–17, 167–8,
170–1
types of 12, 37, 43
socio-economic indicators 224,
225, 227
socio-economic policies 238
welfare state 238
benchmarking 38, 81, 108, 117,
216, 217, 232, 235, 294,
315, 322
Brazil 13, 78
bribery 286
see also corruption
British Coal 140
British Steel 140
budget monitoring 83
budgetary restraint 286
budgeting 115–16
frame- or block- 79, 266
performance 80, 83, 116, 294,
326
a political process 82
programme 275
results-oriented 266
budgeting (cont.)
super 78
VBTB 107
zero-based 322
bureau-professionalism 72
bureaucracy:
downsizing 195–6
political control of 101, 187–90
traditional 48, 71–3
see also administration; civil
service; management;
personnel management;
political-administrative
systems
business model 23
CCanada 171, 247–55
administrative system 55, 61,
64, 66, 67, 249–50
advisers 175
centralization 52
citizen pressure 248
corruption 249, 251
downsizing 249, 250, 252
elite decision-making 249–50
elite relationships 60
Expenditure Management
System (EMS) 81, 251
Federal Accountability Act 81
immigration 247
Increased Ministerial Authority
and Accountability 250
key events 254–5
‘La Releve’ 18
Management Accountability
Framework (MAF) 83
migration 247
new management ideas 248
party politics 248–9
personnel management 88
political system 55, 61, 64, 66,
67, 171, 247–8
population 247
reform:
implementation 252–3
package 248, 250–2
results 130, 137, 144–5,
151–2, 253
trajectory 82, 87, 92–4, 97–8,
100, 103, 106, 110, 112,
117, 121
types of 6, 40, 45
socio-economic indicators 224,
225, 226, 227, 229
socio-economic policies 247
state structure 51
trade offs 195–6
Treasury 157
welfare state 247
capacity 132, 153, 154
capital mobility 35
centralization 52, 86, 96, 104, 165,
184, 210, 250, 261
see also decentralization
chance events 40–1
see also European Commission;
individual countries
China 13, 78, 256
citizens:
empowerment 167, 217
participation 267
pressure from 39
satisfaction 144–8
see also customers; European
Commission; individual
countries; public attitudes;
public opinion
citizens’ charters 2, 113, 151, 156,
159, 167, 177, 287, 314, 317
civil servants 62
difficult role 164
long-serving 185
motivation 195–6, 204
political activities 162
politicization 60–1
public attitude towards 162,
176–80
relationship with ministers 49,
59–61, 69
role 168–74, 180
tenure 89, 195–6, 204
typical 90–1
civil service:
Belgium 243
decentralized 93–4, 301
Finland 265–6
France 42, 153, 273
modernization 243–4
morale 324
Netherlands 294
performance-related pay 4,
92–3
promotion 92–3
senior executive service
(SES) 92, 151, 234, 325
staffing 227–8
Sweden 308
tenure 91–2
trust in 167–8
United Kingdom 316
USA 322
see also administration;
bureaucracy; management;
personnel management;
political-administrative
systems
civil society 3–4
collectivism 64
Commonwealth 156
competition 116
constitutional law 6, 37
consultants 6, 14, 29, 66, 156
context 41–3, 47
contracting out 2, 3, 198–9, 204,
233, 322, 325
contractualization 100, 271, 275,
292
contradictions 186–7
convergence, cultural 11–15, 49
cooperation, voluntary 23, 99
coordination 96–7, 99–101, 152,
208, 213
failure 153–4
horizontal 51, 53–4, 68, 97, 105,
187, 198–9, 204, 259, 265,
267
see also joined-up government
corruption 28, 46, 86, 121, 183,
185
Canada 249, 251
France 272
Italy 286
cost cutting see public expenditure
savings
culture 38, 48–9
administrative 49
convergence 11–15, 49
European Commission 69
elements of 64
governance 61–6
customers 10
empowerment 187–90, 203–4
see also citizens
Ddata:
need for 206–7
performance 157, 158
decentralization 96–7, 101–4, 116
Finland 266–7
France 52, 271, 274
Italy 79, 286, 287
and regime type 164
Sweden 308
see also centralization
360 INDEX
Denmark 44, 79, 130, 172
deregulation 150, 308
digital divide 194
Digital Era Governance (DEG) 19,
97, 122–3
DNA databases 201–2
downsizing 186, 196
Australia 232, 233, 236
Belgium 238, 240
of bureaucracies 89, 97, 101,
104–5, 182
Canada 249, 250, 252
Italy 286
UK 113, 318
USA 322, 323, 326
Ee-government 7, 212, 283, 306,
309, 326
economic factors 34–6
see also global economic crisis
(GEC)
economic growth 222–4, 231, 256
economic indicators 222–5
economies see public expenditure
saving
education 226, 229
Belgium 244
enrolment rates 141
Finland 268
France 272
Germany 280
Netherlands 290
New Zealand 299
UK 18, 102, 104, 114, 129, 135,
313, 314, 317, 318
universities 108
effectiveness 128
definition 15, 129, 133, 200
improvement in 143–4
measurement of 108
scores 129–30
versus accountability 199–201,
204
efficiency 7, 134, 316–17
definition 15, 133, 140, 200
improvement in 140–3
measurement of 108
elites 49, 59–61
decision-making 32–4, 45
see also civil servants; European
Commission; politicians;
individual countries
employment:
Belgium 242
government 138
public sector 242
empowerment 99, 150, 190, 326
citizens 167, 217
customers 187–9, 203–4
European administrative
space 120
European Commission (EC) 2,
67–71, 256–62
Activity-Based Management
(ABM) 260
administration system 259
agency system 68
chance events 258
citizen pressure 258
College of Commissioners 259
Common Agricultural Policy
(CAP) 257
coordination 68, 143
culture 69–70
Directors General 69, 259
economic forces 256
economic policy 257
elite decision-making 258–9
elite relationship 69
key events 262
Kinnock reforms 68, 92, 94,
101, 126, 143, 157, 259,
260
management reform 257–8,
259–60
migration 256
new management ideas 257–8
party politics 258
personnel management 88, 91
policy advice 66
political system 257
population 256
reform:
implementation 260
package 259–60
results 260–1
trajectory 84, 93, 97, 99, 101,
105, 115
types of 10, 43, 190
Santer Commission 70, 87, 257,
258, 260
SEM 2000 andMAP 2000 70, 94,
122, 157, 260, 261
social policy 257
transparency 202
vertical authority 68
European Council of Ministers 69,
258
European Court of Auditors 87,
261
European Foundation for Public
Administration 258
European Parliament 69, 87,
258
European social model 120
European Union:
convergence criteria 37, 136,
263, 285
downsizing 249, 250, 252
monetary union 238, 263
evaluation problems 15–17
evidence 13–14
expectations 146, 151
exports see international trade
Ffinancial management
trajectories 77–87
Finland 263–70
administrative system 55, 58,
64, 67, 265–6
centralization 52
citizen pressure 264
civil service 265–6
decentralization 266–7
economy 263
elite decision-making 264–5
elite relationships 60, 166–7,
172, 177
governance culture 63
immigration 263
key events 269–70
Ministry of Finance 104
new management ideas 264
party politics 264
personnel management 88
political system 55, 58, 64, 67,
263–4
population 263
post offices 193–4
public debt 263
Public Management
Department 14
reform:
implementation 267
package 266–7
results 128, 137, 149, 150–2,
267–8
trajectory 78, 80, 82, 84, 87,
89, 91, 93–4, 97–8, 101–5,
112–13, 116–17
type of 2, 14, 37
socio-economic indicators 225,
227, 229, 230
structural factors 42
INDEX 361
flexibility 132, 150, 153, 193–5,
204
France 187, 271–8
administrative system 51–2, 54,
57, 65, 166–7, 175, 273
citizen pressure 272
civil service 42, 153, 273
Conseil d’Etat 62
Directorate General for State
Modernization 14
elite decision-making 272–3
fiscal deficit 271
governance culture 63
grands corps 60, 67, 91–2, 95,
275
key events 277–8
new management ideas 271–2
party politics 272
personnel management 88, 91
political system 54, 65, 166–7,
175, 271
population 271
reform:
implementation 275
package 273–5
results 136, 150, 151, 275–6
trajectory 82–3, 89, 93–4, 98,
101–4, 106, 108–9, 112, 114,
116–17, 210
type of 6, 10, 13, 19, 38, 40, 43
socio-economic indicators 224,
226, 227
unemployment 271
freedom of information (FoI) 8,
110–11
function 48–9
GGermany 279–84
administrative system 54, 58,
64, 66–7, 72, 166–7, 281–2
Bundesverwaltungsgericht 62
centralization 52–3
citizen pressure 279, 280
civil service 42, 49
constitutional law 37
economy 279
elite decision-making 281
elite relationships 60, 61
governance culture 63
immigration 279
international trade 279
key events 284
legal system 281
local government 38
new management ideas 280
party politics 280–1
personnel management 88
political system 54, 58, 64, 66–7,
72, 166–7, 279–80
reform:
implementation 283
package 282–3
results 130, 137–8, 149–50,
283
trajectory 78, 80, 82, 84, 87,
91, 94–5, 97–103, 105, 108,
110, 112–13, 115–17, 121
type of 2, 12, 19
‘slim state’ 18
socio-economic indicators 223,
227, 228, 230
state structure 51
terrorism 281
unification 281
welfare state 281
global economic crisis (GEC) 8,
26–8, 77, 89, 104, 106, 121,
222, 231
Belgium 241
Finland 263, 267
France 91
Germany 279
post- 190, 191, 215
UK 54, 91, 313, 315
USA 91
globalization 8, 36, 271
governance 7
concept significance 21–3
culture 61–6
definition 21–2
digital era 97, 122–3
integrated public 152–3
networks 21
in NPG model 122–4
government:
central 2, 25–6
coalition 54
debt 225
employment 138
entrepreneurial 9
joined-up 7, 151, 152–3, 198–9,
204, 212, 235, 267, 317,
318
legitimacy 163, 177–9, 241, 243
local 2, 102, 105, 114, 136, 152,
162, 264, 279, 280–2, 292,
316–18
minority 54
nature of 48–9, 54–9
open 110–11
single-party 54
see also state
government effectiveness see
effectiveness
government expenditure 136–9,
224, 225
see also public expenditure
Greece 27
Hhealthcare 226–7
National Health Service
(NHS) 17, 78, 85, 100, 107,
109, 114, 121, 142–3, 315,
317
hierarchies 10, 16, 99
Hong Kong 130
human resource management
(HRM) see personnel
management
IICT 107, 184, 192
ideas, sources of 38, 39–40, 49
see also advice
immigration 228, 229–30
Australia 231
Canada 247
European Commission (EC) 256
Finland 263
Germany 279
Netherlands 290
Sweden 305
United Kingdom 313
implementation networks 44–5
imports see international trade
income inequality 228–9
inflation 144, 313
information, lack of 176–7
innovation 10, 113, 193–5, 204
Germany 283
Italy 287
United Kingdom 313
United States 324, 327, 329
see also outcomes
inputs and outputs 15, 101, 131,
134–6, 140–3, 165, 200, 222,
301
institutional memory loss 182–3
integration 153, 232
public governance 152–3
service provision 198–9, 204,
212
intellectual factors 34
362 INDEX
intentionality, degree of 34
internal scrutiny 197–8, 204
International Monetary Fund
(IMF) 156
Determinants of Government
Efficiency 140–1
international networks 4, 8, 163
international organizations 264
international trade 224–5
Australia 231
Belgium 238
Germany 279
Netherlands 290
Sweden 305
UK 313
USA 321
Italy 13, 43, 285–9
administrative system 55, 57–8,
64–5, 287
centralization 52
citizen pressure 286
citizen’s charter 177
downsizing 286
economy 285
elite decision-making 286–7
elite relationships 60
international trade 285
key events 289
new management ideas 286
party politics 286
personnel management 88, 91
political system 55, 57–8, 64–5,
285
population 285
reform:
implementation 288
package 287–8
results 128, 136, 151, 288
trajectory 79, 80, 84, 95,
100–1, 103, 109, 115–18
socio-economic indicators 226,
229
trust in civil service 167–8
welfare state 285
JJapan 13
joined-up government 198–9,
204, 212, 235, 267, 317, 318
see also cooperation
Kknowledge 30, 218–20, 233
bureaucratic 71–2, 185
citizens’ 177, 179, 181
Korea 13
Llaw 6, 37, 88
Belgium 243, 244
European Commission 256, 257
Finland 266
France 273, 275
Germany 73, 282
Italy 287
Netherlands 292
role of 6, 37, 217
training in 42, 62–3
leadership 10, 169
legitimacy 193–5, 204
local detail 23
Mmanagement:
autonomy 187–90, 203–4, 274
consultants 6, 14, 29, 66, 156
financial 77–87
macro-economic 35
and politics 4, 161–81
processes 131–2, 134
versus administration 184
see also administration;
bureaucracy; civil service;
personnel management;
political-administrative
systems
Management Accountability
Framework (MAF),
Canada 83
management reform see public
management reform (PMR)
managerialism 166, 232
market model 150, 151
market-type mechanisms
(MTMs) 10, 99, 114, 116
marketization 100, 117
mass media 5, 8, 40, 109, 163, 259
Mexico 13, 79, 249
micro-economic theories 39
ministers:
difficult role 164
relationship with mandarins 49,
59–61, 69
see also politicians
modernization 166, 271, 274, 280
Modernizing (managerial and
participatory) 116
monetarism 313
moral standards 178
multiplier effect 14
NNapoleonic model 19
Neo-Weberian State (NWS)
model 19, 114, 127, 150,
168, 212
choice of model 22–3, 76
customer empowerment 188
described 118–22
elements of 118–19
evidence fit 82, 169, 172
hierarchy 99
and HRM 95
as a normative vision 119
performance measures 109
pros and cons 208–10
trade-offs 196, 198–9, 201, 203
trust 195
Netherlands 211, 290–7
administrative system 48, 54–6,
64–5, 67, 293–4
citizen pressure 293
civil service 294
economy 290
elite decision-making 293
fires 293
fireworks explosion 39, 41
governance culture 63
immigration 290
international trade 290
key events 296–7
ministerial responsibility 293
new management ideas 291–2
party politics 292
personnel management 88, 91
political system 48, 54–6, 64–5,
67, 290–1
population 290
reform:
implementation 295
package 294–5
results 130, 137, 150–1, 155,
295
trajectory 79–80, 82–3, 87,
97–8, 100–1, 103, 106–7,
109, 111–12, 116–17, 121
type 6, 14, 38, 40
socio-economic indicators 224,
225, 226, 227, 228, 229
state structure 52
trade offs 170–1, 175
ZBOs 294
networking 162, 172–4, 190, 212
INDEX 363
networks:
governance 21
implementation 44–5
international 4, 8, 163
model 20, 99, 168–9
new management ideas see
European Commission;
ideas; individual countries
New Public Governance (NPG)
model 24, 95, 99, 109, 111,
127, 212
customer empowerment 188
evidence fit 105–6, 122–4, 169,
172–4
implementation 114
implications for politicians
168–74
model choice 22–3, 76
pros and cons 208–10
trade-offs 189, 192–3, 196,
198–9, 201, 203
New Public Management (NPM)
model 6, 24, 95, 99, 109,
117, 120, 166, 212–13
anglophone literature 12–13
definition 9–11
evaluation 15–18, 82, 105–6,
155, 169, 170–2
hard and soft versions 10
implementation 114
implication for politicians
168–74
methodology 25–6
model choice 22–3, 76
package 113
pros and cons 207–10
trade-offs 187, 189, 192–3, 196,
198–9, 201, 203
trust 195
New Public Management (NPM)
countries 91, 93, 103, 107,
108, 111, 112, 116, 150
New Zealand 40, 207, 209, 210,
298–304
administrative system 53–7, 65,
72, 300–1
Cave Creek 41, 300
citizen pressure 300
civil service, decentralized 301
economy 298–9
elite decision-making 300
elite relationships 60, 61
key events 303–4
Key Results Area (KRAs) 97, 107
new management ideas
299–300
party politics 300
personnel management 88, 91
political system 53–7, 65, 72,
299
politics/administration
border 165–6, 171, 175–6,
178
population 298
reform:
implementation 301–2
package 301
results 138, 143–4, 151–2,
154, 301–2
trajectory 78–9, 81–7, 89, 92,
96–8, 100–3, 105–8, 110,
114, 116–17
type 2, 6, 11–12, 34, 39–40
Senior Public Managers
Conference 45
socio-economic indicators 224,
225, 229, 230
State Services Act 93
state structure 51–2
Treasury 104
unemployment 298
welfare state 298, 299, 300
New Zealand model 18
non-governmental organizations
(NGOs) 2
Nordic model 19
Norway 13, 14, 77–8, 165
OOECD 222, 226, 227
on budgeting 78, 80–1
Government at a Glance 86,
141–2
influence of 13, 49, 66, 156, 171
PISA 129, 130–1
Public Management
Committee 6, 9
PUMA 38, 39, 113, 207
official publications 216–17
organization:
coordination 96–7, 99–101
decentralization 96–7, 101–4
departmental mergers 100
economizing 140
new 112
performance indictors 101
reform trajectories 95–106
scale 96–7, 104–5
specialization 96–7, 98–9, 100
organizational cultures 154
organizational forms 10
outcomes 13–15, 17, 18, 19–20
see also performance; public
management reform
outsourcing 38, 233
Pparadigm 75, 149
paradoxes 186, 191
participatory model 150, 151
partnerships 7, 162, 190, 198–9,
204, 212, 317
Public Private Partnerships 3,
24, 110, 232
party politics see European
Commission; individual
countries; politics
path dependency 42, 120, 124,
213
pensions 194, 226
performance 10
attribution 158–9
auditing 86–7, 197–8, 287, 309,
319
budgeting 80, 83, 116, 326
conceptual framework 133–4
data 157, 158
improvement 78, 121
indicators 18, 101, 165, 275,
294
information on 148
international comparisons 109,
127–30
measurement 106–10, 234, 267,
317, 318
and results 126–7
target 134, 317, 318
personnel management 151
reform trajectories 87–95
see also civil service
personnel regulation 42–3
planning, strategic 97
policies, conflicting objectives
15–16
policy advice see advice
political advisers 175–6, 212
political control 101, 187–90,
203–4
arm’s length 7
political factors 34
political-administrative
systems 37–8, 47–74
borderline shift 162, 163–8
existing 41–3, 47, 71–3
features 48–9
see also administration;
364 INDEX
administrative systems;
bureaucracy; civil service;
European Commission;
individual countries
politicians:
public attitude towards 162,
176–80
training 181
view of results 156–7
see also ministers
politics:
definition 162
and management 4, 161–81
party ideas 39–40
party loyalty 163
pork barrel 322
population:
age structure 226–7
see also European Commission;
individual countries
Portugal 151
poverty 226
power distance 64
priorities 2, 79, 189
privacy 201–3, 204–5
privatization 40, 117, 234, 314
productivity 219
Canada 253
Finland 267
France 275
improvement 9, 133, 140–3,
158
and innovation 195
New Zealand 302
Sweden 308–10
and technology 7, 192, 204
USA 326
see also efficiency
professionalism 172
public attitudes 162, 176–80
see also citizen pressure; public
opinion
public choice school 40
public debt 238
public expenditure 155
increases 37
priorities 27–8, 79–80
restrained 77
savings 9, 35–7
cheese slicing 27–8, 78–80
European Commission 261
Finland 267
France 275
Italy 286
meanings of 135–6
methodology 137
Netherlands 290, 295
scale 104
Sweden 305, 308
UK 313–14, 318
USA 321, 325, 326
versus quality 187, 191–3, 204
social 37, 138–9
see also government expenditure
public interest model 62–3, 181
public knowledge 176–7
public management reform
(PMR) 32–45
adaptation 216
announcing 13, 44
capacity 121
contradictory 45
costs 41–2
countervailing factors 41–2
the debate 1–30
defined 2
dilemmas 185–6
direction of 9–11
evaluation 309–10
focus of 52
future of 215–18
global convergence 11–15
increasing prominence 5–9
intensity 112
legalistic 327
limitations of 46, 183, 185
not a vote-catcher 171
objectives 132, 134
optimism about 182–3
politics/administration
borderline 162, 163–8
recommendations 44
timescale 41–2, 217–18
top-down or bottom-up 112,
113–14
public management reform (PMR)
implementation 3, 44–5,
111–15, 121
see also European Commission;
individual countries
public management reform (PMR)
packages:
content 43–4
piecemeal 34
see also European Commission;
individual countries
public management reform (PMR)
results 45, 76, 214–15
academics’ viewpoint 149, 156,
157–8
assessment problems 131–5
criteria for 158–9
economies 135–40
effectiveness 143–4
efficiency 140–3
management processes 131–2, 134
operational 131, 134
and performance 136–7
politicians’ viewpoint 156–7
value of 159
views of 155–8
see also European Commission;
individual countries
public management reform (PMR)
trajectories 75–125, 211–13
definition 75–6
financial management 77–87
implications for politicians 162,
168–74
organizational 95–106
performance
measurement 106–10
personnel management/
HRM 87–95
and regime type 159–60
transparency and open
government 110–11
see also European Commission;
individual countries
public opinion 70, 126, 154, 171,
181
see also citizen pressure; public
attitudes
public private partnerships
(PPPs) 3, 24, 110, 232
public service bargains 162, 174–6
public-private borderzone 3–4
Qquality 7, 204
versus saving 191–3
RRechtsstaat model 62, 72, 94, 108,
167
reform see public management
reform (PMR)
regime type, and reform
trajectories 159–60
reorganization reversal 17
research, future 218–21
Sscenario 75–6
Singapore 130
INDEX 365
socio-demographic factors 34, 36–7
see also European Commission;
individual countries
socio-demographic
indicators 226–30
socio-economic policies 37
see also European Commission;
individual countries
source criticism 29
Soviet Union 264
Spain 13
specialization 71, 86, 96, 97, 98,
100, 104
state:
federal 51, 232, 238, 247, 279, 313
hollow 3
minimal 117
participatory 150
unitary 51–3
see also government
state structure 49–54
centralization 51–3
horizontal 51, 68
vertical 49–51, 68
see also decentralization
structural factors 35, 38, 42
structure 2, 17, 48–9, 112
Sweden 187, 305–12
administrative system 64–5, 67,
307–8
citizen pressure 306
civil service 308
elite decision-making 307
governance culture 63
immigration 305
international trade 305
key events 311–12
new management ideas 306
party politics 306–7
personnel management 88
political system 64–5, 67, 305–6
political/administrative
border 165–6, 172, 177
population 305
reform:
implementation 309
package 308–9
results 128, 130, 136–7, 142,
150, 155, 309–10
trajectory 79, 82–4, 87, 91,
93–4, 97–8, 100–5, 109–11,
116–17
type of 6, 14, 38, 40
socio-economic indicators 226,
227, 229
state structure 51
structural factors 42
trust in civil service 167
welfare state 305, 306
TTalk-Decision-Practice-Results
framework 14
targets 134, 165, 189, 317, 318
see also performance
tax:
competition 35
payroll 226
technology 192, 232
digital divide 194
ICT 107, 184, 192
tools and techniques 25–6
trade unions 89, 93, 233
trade-offs 184–5, 186–205, 218
transparency 7, 83, 110–11,
201–5, 212, 234
trust 7, 10, 324, 325
in the civil service 167
decreasing 146–8, 177–8
promotion of 193–5, 204
public 8
Uunemployment 144, 271, 298
United Kingdom 207, 210, 216,
313–20
administrative system 47–8, 55,
57, 59, 65–7, 316
adversarial system 38
auditing 114, 154, 165
bureau-professionalism 72
Capability Reviews 154
centralization 53
chance events 315
citizen pressure 314–15
Citizen’s Charter 151, 167, 177,
314, 317
civil service 42, 316
consultants 14
Department of Social
Security 43
downsizing 113, 318
driving on the right 42
economy 313–14
education system 18, 102, 104,
114, 129, 135, 313, 314,
317, 318
efficiency gains 143
elite decision-making 315–16
elite relationships 61
executive agencies 187
FABRIC 83
Geddes Axe 27
governance culture 63
immigration 313
international trade 313
key events 320
National Audit Office 154, 317, 319
new management ideas 314
Next Steps 98, 113, 139–40, 199,
214, 315, 317, 319
NHS 17, 78, 85, 100, 107, 109,
114, 121, 142–3, 315, 317
party politics 315
personnel management 88, 90–1
political system 47–8, 55–7, 59,
65–7, 314, 316
political/administrative
border 170–1, 175–6
population 313
post offices 193–4
Prime Minister’s Public Service
Delivery Unit 14
public spending 28, 155
reform:
implementation 318
package 316–18
results 10, 137–8, 152, 318
trajectory 78–80, 82–4, 87,
92–3, 106, 108–14, 116–17,
98, 101–3
types 2, 6, 11, 12, 14, 38, 40
Rolling back the state 149
secondary legislation 37
social security 191
socio-economic indicators 224,
225, 226, 229
socio-economic policies 313–14
state structure 51–2
‘Total Place’ 174
trade offs 192, 197–8, 202
Treasury 104
trust in civil service 167
welfare state 314
Welsh and Scottish
assemblies 102
United Nations, Public
Administration Network
(UNPAN) 6
United States 175, 178, 197, 210,
214, 321–31
administrative system 51, 64,
72, 324–5
centralization 52–3
chance events 323–4
citizen pressure 323
366 INDEX
civil service 120–1, 322
Department of Homeland
Security 17
downsizing 322, 323, 326
economic growth 256
economic indicators 223
economy 321
elite decision-making 324
federal public procurement 18
General Accounting Office 79
Grace Commission 67
international trade 321
key events 330–1
NASA 41
National Performance Review
(NPR) 42–3, 61, 132, 149,
151, 177, 326, 328
new management ideas 322–3
Occupational Safety and Health
Administration (OSHA) 144
party politics 323
personnel management 89, 91
political system 64, 72, 321–2, 325
population 321
public spending 155
reform:
implementation 327–8
package 325–7
results 130, 136, 138, 328–9
trajectory 80, 82, 84, 89, 92–4,
97, 100–1, 103, 106–8,
110–12, 117, 121
type of 2, 6, 11–12, 40, 44, 47, 54
socio-economic indicators 224,
225, 226, 227, 229, 230
state structure 51, 58–9
trade offs 187–8, 195
welfare state 321
utopia 75
Vvisions 148–55
Wwaste 9, 121, 316, 326
Weber, Max 71
welfare service 190
welfare state 190, 226, 227
Belgium 238
benefits-claiming system 43
Canada 247
costs of 6, 35, 52, 138–9
Italy 285
New Zealand 298, 299, 300
public attitude towards 133,
163, 178
Sweden 305, 306
UK 314
USA 321
see also government
expenditure; public
expenditure
World Bank 13, 38, 49, 66, 156
Worldwide Governance
Indicators (WGIs)
127–30
World Competitiveness
Yearbook 141
INDEX 367
Related Documents