1 Public Health Child Fatality Review 2011 Annual Report Table of Contents 2011 EXECUTIVE SUMMARY Page 3 THE PUBLIC HEALTH CHILD FATALITY REVIEW PROCESS Page 6 THE 2009 KENTUCKY CHILD DEATH DATA Page 8 A. Deaths from Non-Injury Causes Page 9 Non-Injury Deaths in Infants (<1 year of age) Page 10 Non- Injury Deaths in Children aged 1- 17 years Page 12 B. Deaths from Injury Causes Page 13 Injury Deaths in Infants Page 14 Injury Deaths in Children aged 1- 17 years Page 15 PREVENTION PRIORITIES AND RECOMMENDATIONS Page 18 Safe Sleep Environments for Infants Page 18 Abusive Head Trauma (AHT) Page 19 Secondhand Smoke Exposure and Children Page 19 Child Passenger Safety Page 21 TOP 10 LEADING CAUSES OF CHILD DEATHS IN KENTUCKY Page 23 REFERENCES Page 24 List of Figures Page 25 List of Tables Page 26 Map Page 26 Ky Medical Examiner Policy on SUDI: Page 27 Sudden Unexplained Death in Infancy

Welcome message from author
This document is posted to help you gain knowledge. Please leave a comment to let me know what you think about it! Share it to your friends and learn new things together.
Transcript

1
Public Health Child Fatality Review 2011 Annual Report
Table of Contents 2011 EXECUTIVE SUMMARY Page 3
THE PUBLIC HEALTH CHILD FATALITY REVIEW PROCESS Page 6 THE 2009 KENTUCKY CHILD DEATH DATA Page 8
A. Deaths from Non-Injury Causes Page 9 Non-Injury Deaths in Infants (<1 year of age) Page 10
Non- Injury Deaths in Children aged 1- 17 years Page 12
B. Deaths from Injury Causes Page 13 Injury Deaths in Infants Page 14 Injury Deaths in Children aged 1- 17 years Page 15
PREVENTION PRIORITIES AND RECOMMENDATIONS Page 18 Safe Sleep Environments for Infants Page 18
Abusive Head Trauma (AHT) Page 19 Secondhand Smoke Exposure and Children Page 19 Child Passenger Safety Page 21 TOP 10 LEADING CAUSES OF CHILD DEATHS IN KENTUCKY Page 23 REFERENCES Page 24
List of Figures Page 25 List of Tables Page 26 Map Page 26
Ky Medical Examiner Policy on SUDI: Page 27 Sudden Unexplained Death in Infancy

2
3
KENTUCKY PUBLIC HEATLH CHILD FATALITY REVIEW SYSTEM 2011 ANNUAL REPORT
EXECUTIVE SUMMARY
The Kentucky Department for Public Health has administered the public health child fatality and
injury prevention program since it was enacted in 1996. The 2011 Child Fatality Review (CFR)
Annual Report presents information from vital statistics data on child deaths from the calendar
year 2009 (the most recent year with completed data from the Kentucky Vital Statistics
records).
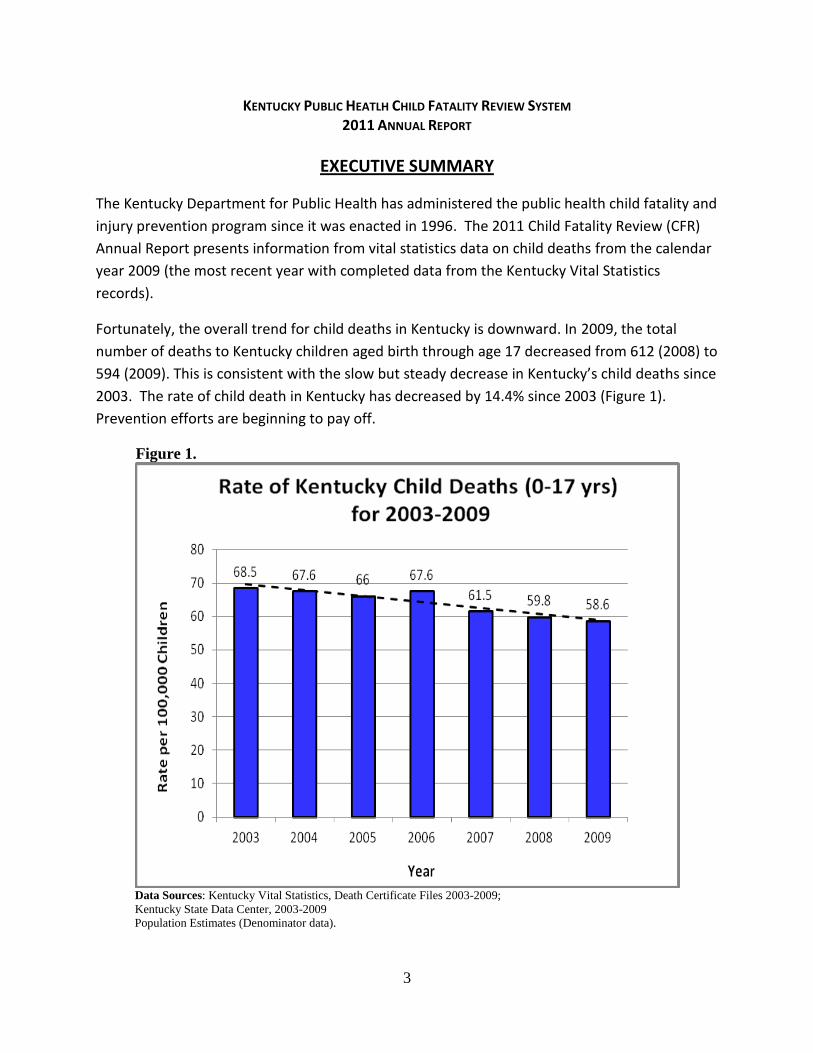
Fortunately, the overall trend for child deaths in Kentucky is downward. In 2009, the total
number of deaths to Kentucky children aged birth through age 17 decreased from 612 (2008) to
594 (2009). This is consistent with the slow but steady decrease in Kentucky’s child deaths since
2003. The rate of child death in Kentucky has decreased by 14.4% since 2003 (Figure 1).
Prevention efforts are beginning to pay off.
Figure 1.
Data Sources: Kentucky Vital Statistics, Death Certificate Files 2003-2009;
Kentucky State Data Center, 2003-2009
Population Estimates (Denominator data).

4
For purposes of analysis, there are two main categories for classifying deaths: Injury deaths and Non-Injury deaths. The non-injury deaths are typically from medical conditions such as premature birth, diseases, and infections. In Kentucky and nationally, over half of the total child deaths are non-injury deaths in infancy, or babies who die before they reach their first birthday. In the 2009 KY data, 55% of the child deaths were these non-injury (medical-related) deaths in infants. Many of these are the extremely premature infants who have little chance for survival. Thus efforts to prevent preterm birth will help lower infant deaths. On the other hand, infant deaths such as those associated with unsafe sleep practices, have a higher potential for prevention and have been demonstrated to decrease with education programs such as the “Back to Sleep” Campaign. For 2009, there were a total of 360 infant deaths in KY, this represents a stable trend in infant mortality in Kentucky since 2000, consistent with the stalled progress on infant mortality in the rest of the country. Injury deaths were 27% of all child deaths in Kentucky in 2009. While they are fewer in number than non-injury deaths, the potential for prevention is higher with these deaths. The injury deaths more commonly occur in children over 1 year of age. The most common cause of Injury death in Kentucky’s children is motor vehicle collisions. These deaths are also decreasing in Kentucky. In recent years, Kentucky has enacted a number of child restraint and safe driving laws which are now showing the desired effects. Figure 2.
Data Source: Kentucky Vital Statistics, Death Certificate Files 2009; Kentucky Vital Statistics
5
The multidisciplinary State Child Fatality Review Team, including Kentucky’s pediatric experts in injury prevention and child fatality, have reviewed the data in detail and identified four prevention priorities for those in Kentucky working on preventing child deaths:
Safe sleep – unsafe sleep environments have contributed too many of KY’s infant deaths.
Child Restraint use – booster seats can save children’s lives but only if used properly by following updated recommendations of child’s height, not age.
Abusive Head Trauma – children’s exposure can be minimized with education in the hospital.
Second hand smoke exposure – children’s exposure can be minimized with education targeting pregnant women and new mothers by informing them that second hand smoke exposure increases risk for sudden infant death.
The Child Fatality Review program has established working relationships with numerous organizations throughout the state to promote child health and safety. The Child Fatality Review Program will continue to make recommendations for prevention and share these recommendations with others in the community. Further information can be reviewed in entirety in the complete Child Fatality Review report.
6
KENTUCKY CHILD FATALITY REVIEW SYSTEM 2011 ANNUAL REPORT
THE PUBLIC HEALTH CHILD FATALITY REVIEW PROCESS
The goal of the Kentucky Public Health Child Fatality Review Program is ultimately to decrease child deaths through prevention efforts. This is done by monitoring data; identifying trends, injuries, and deaths that may be preventable in Kentucky; and reviewing and learning from the reported deaths. In collaboration with key partners, this learning is applied to developing recommendations and community interventions that may help prevent injuries and future child deaths. The Kentucky Department for Public Health established the State Child Fatality Review Team in 1996 in accordance with KRS 211.684. The State Team is a voluntary, multidisciplinary body that may assume certain duties. Those duties include:
Facilitate the development of local child fatality review teams that may include training opportunities and technical assistance.
Develop and distribute model protocols for local child fatality review teams that investigate child fatalities.
Review and approve local protocols prepared and submitted by local teams.
Analyze received data regarding child fatalities to identify trends, patterns and risk factors.
Evaluate the effectiveness of adopted prevention and intervention strategies.
Make recommendations regarding state programs, legislation, administrative regulations, policies, budgets, and treatment and service standards that may facilitate development of strategies for prevention and reduction of the number of child deaths.
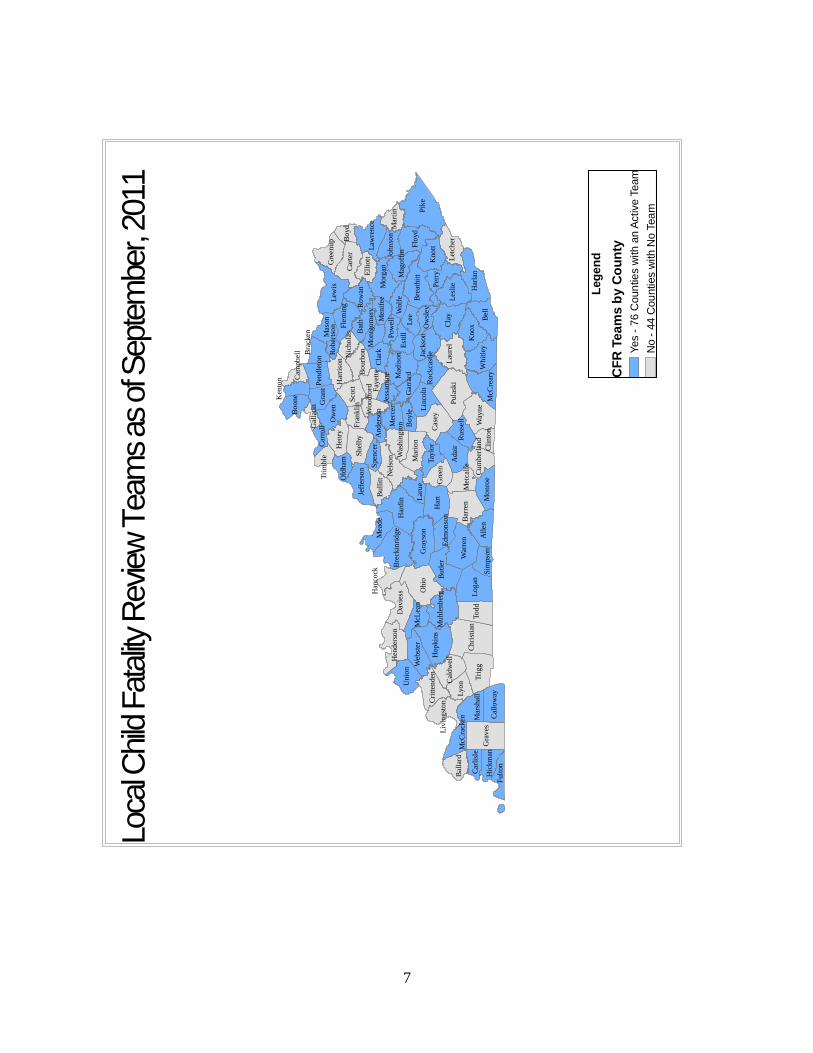
The State Child Fatality Review Program works with the state CFR team to assure a strong child fatality review and injury prevention system throughout Kentucky. Local development of child fatality review teams continues to be one of the most important infrastructure-building responsibilities of the State Team. According to KRS 211.686, local child fatality review team composition includes multidisciplinary representation from coroners, law enforcement, health departments, Department for Community Based Services, Commonwealth and county attorneys, medical professionals and other members whose participation the local team believes is important to carry out its purpose. The local team assists the coroner in gathering as much information as possible to determine the most accurate manner and cause of a child’s death. Team members have the opportunity to share information, discuss and prioritize child health and risk factors, and promote local education and community-based prevention programs. The goal of the program is to have local teams in every county so that local initiatives for injury prevention can be implemented. Currently, 76 counties have an active local child fatality review team (Map, 1), an increase of 20% in the last 3 years. The State Team reviews this information to identify trends happening in multiple communities and develop strategies that will help save the lives of children across the Commonwealth.
7
Pik
eO
hio
Cla
y
Har
t
Pula
ski
Har
din
Tri
gg
Lo
gan
Bel
l
Lew
is
Ch
rist
ian
Gra
ves
War
ren
To
dd
Bar
ren
Cas
ey
Adai
r
Way
ne
Kno
x
Bu
tler
Har
lan
Flo
yd
Lau
rel
Car
ter
Les
lie
Hop
kin
sP
erry
All
en
Kno
tt
Bat
h
Dav
iess
Gra
yso
n
Ow
en
Nel
son
Unio
nL
eeB
reat
hit
t
Sco
ttS
hel
by
Wh
itle
y
Mad
ison
Lyo
n
Mo
rgan
Est
ill
Hen
ry
Mar
ion
Bu
llit
t
Gre
en
Gra
nt
Cla
rk
Lar
ue
Let
cher
Jeff
erso
n
Lin
coln
Tay
lor
Cal
low
ayM
cCre
ary
Mo
nro
e
Fay
ette
Mar
shal
l
Ell
iott
Wolf
e
Mas
on
Mer
cer
Bo
yle
Sim
pso
n
Car
lisl
e
Mea
de
Bre
ckin
rid
ge
Jack
son
Hen
der
son
Law
ren
ce
Fle
min
g
Gre
enu
p
Web
ster
Ro
wan
Bo
on
e
Mu
hle
nb
erg
Cal
dw
ell
Ru
ssel
lB
alla
rd
Har
riso
n
Cri
tten
den
Mar
tin
Bo
urb
on
Mag
off
in
Met
calf
e
John
son
Liv
ing
sto
n
Fult
on
McL
ean
Bo
yd
Gar
rard
Ro
ckca
stle
Ed
mon
son
Pen
dle
ton
Hic
km
anC
lin
ton
Pow
ell
Ow
sley
Bra
cken
Was
hin
gto
nFra
nk
lin
Cu
mb
erla
nd
Men
ifee
Old
ham Spen
cer
McC
rack
en
Ken
ton
Han
cock
Nic
ho
las
And
erso
n
Tri
mb
leC
arro
ll
Woo
dfo
rd
Jess
amin
e
Cam
pb
ell
Mo
ntg
om
ery
Gal
lati
n
Ro
ber
tso
n
Leg
en
d
CF
R T
ea
ms b
y C
ou
nty
Yes -
76 C
oun
tie
s w
ith a
n A
ctive T
eam
No -
44 C
ou
nties w
ith
No
Tea
m
Loca
l Chi
ld F
atal
ity R
eview
Tea
ms
as o
f Sep
tem
ber,
2011
8
THE 2009 KENTUCKY CHILD DEATH DATA
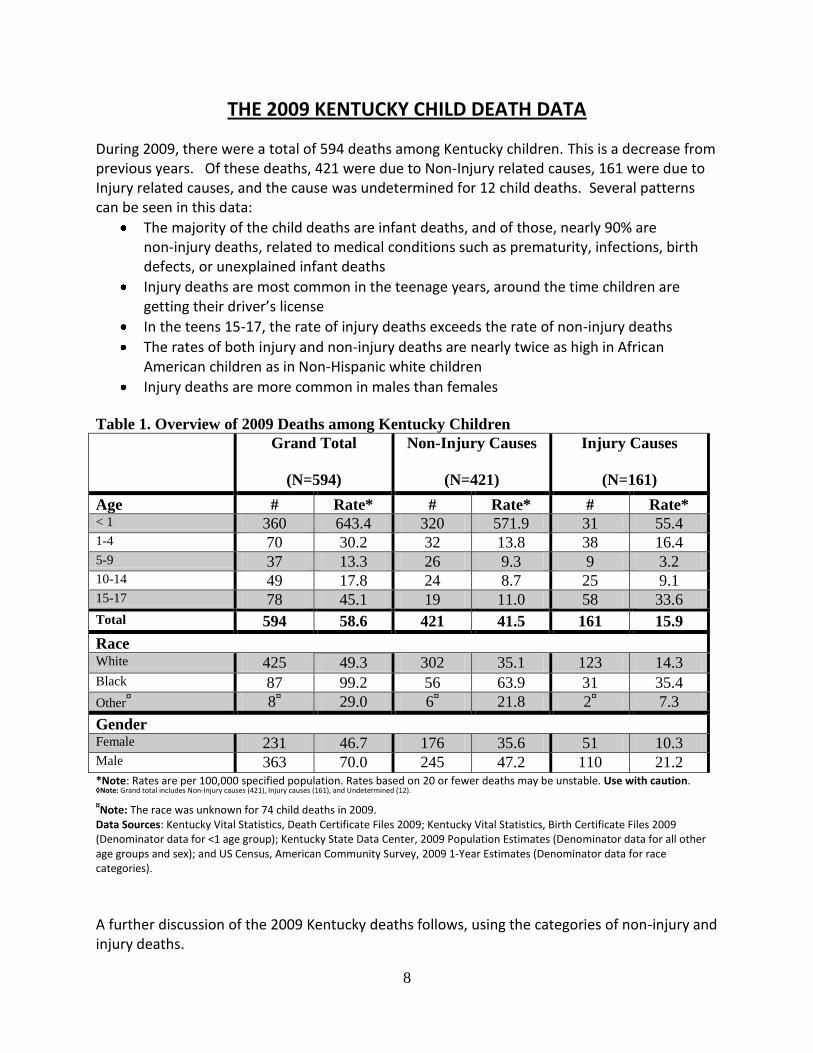
During 2009, there were a total of 594 deaths among Kentucky children. This is a decrease from previous years. Of these deaths, 421 were due to Non-Injury related causes, 161 were due to Injury related causes, and the cause was undetermined for 12 child deaths. Several patterns can be seen in this data:
The majority of the child deaths are infant deaths, and of those, nearly 90% are non-injury deaths, related to medical conditions such as prematurity, infections, birth defects, or unexplained infant deaths
Injury deaths are most common in the teenage years, around the time children are getting their driver’s license
In the teens 15-17, the rate of injury deaths exceeds the rate of non-injury deaths
The rates of both injury and non-injury deaths are nearly twice as high in African American children as in Non-Hispanic white children
Injury deaths are more common in males than females
Table 1. Overview of 2009 Deaths among Kentucky Children
Grand Total
(N=594)
Non-Injury Causes
(N=421)
Injury Causes
(N=161)
Age # Rate* # Rate* # Rate* < 1 360 643.4 320 571.9 31 55.4 1-4 70 30.2 32 13.8 38 16.4 5-9 37 13.3 26 9.3 9 3.2 10-14 49 17.8 24 8.7 25 9.1 15-17 78 45.1 19 11.0 58 33.6
Total 594 58.6 421 41.5 161 15.9
Race White 425 49.3 302 35.1 123 14.3 Black 87 99.2 56 63.9 31 35.4
Other¤ 8
¤ 29.0 6
¤ 21.8 2
¤ 7.3
Gender Female 231 46.7 176 35.6 51 10.3 Male 363 70.0 245 47.2 110 21.2 *Note: Rates are per 100,000 specified population. Rates based on 20 or fewer deaths may be unstable. Use with caution. ◊Note: Grand total includes Non-Injury causes (421), Injury causes (161), and Undetermined (12).
¤Note: The race was unknown for 74 child deaths in 2009.
Data Sources: Kentucky Vital Statistics, Death Certificate Files 2009; Kentucky Vital Statistics, Birth Certificate Files 2009 (Denominator data for <1 age group); Kentucky State Data Center, 2009 Population Estimates (Denominator data for all other age groups and sex); and US Census, American Community Survey, 2009 1-Year Estimates (Denominator data for race categories).
A further discussion of the 2009 Kentucky deaths follows, using the categories of non-injury and injury deaths.

9
Non-Injury Causes of Child Deaths, 2009
Child deaths by non-injury cause are the result of natural process such as disease, prematurity or congenital defect. A death due to a non-injury cause can result from one of many serious health conditions. Many of these conditions are not believed to be preventable in the same way unintentional injuries are preventable. However, with some illnesses such as asthma, infectious diseases and inherited metabolic disorders, under certain circumstances, fatalities may be prevented. Some conditions may be prevented through better education and preventive intervention during preconception such as folic acid preventing neural tube defects and smoking cessation reducing the risk of having a low birth weight baby. While some conditions cannot be prevented, early detection and prompt, appropriate treatment can often prevent death, such as we have seen with expanded newborn metabolic screening. Figure 3 below reveals:
There were a total of 421 non-injury deaths among Kentucky children aged 0-17 years for 2009.
Black children are nearly two times as likely to die from non-injury related causes.
The non-injury death rate in males was not significantly different than the non-injury death rate among females.
Figure 3.
¤Note: The race was unknown for 57 non-injury child deaths in 2009.
Data Sources: Kentucky Vital Statistics, Death Certificate Files 2009; Kentucky Vital Statistics, Birth Certificate Files 2009 (Denominator data for <1 age group); Kentucky State Data Center, 2009 Population Estimates (Denominator data for all other age groups and sex); and US Census, American Community Survey, 2009 1-Year Estimates (Denominator data for race categories).
10
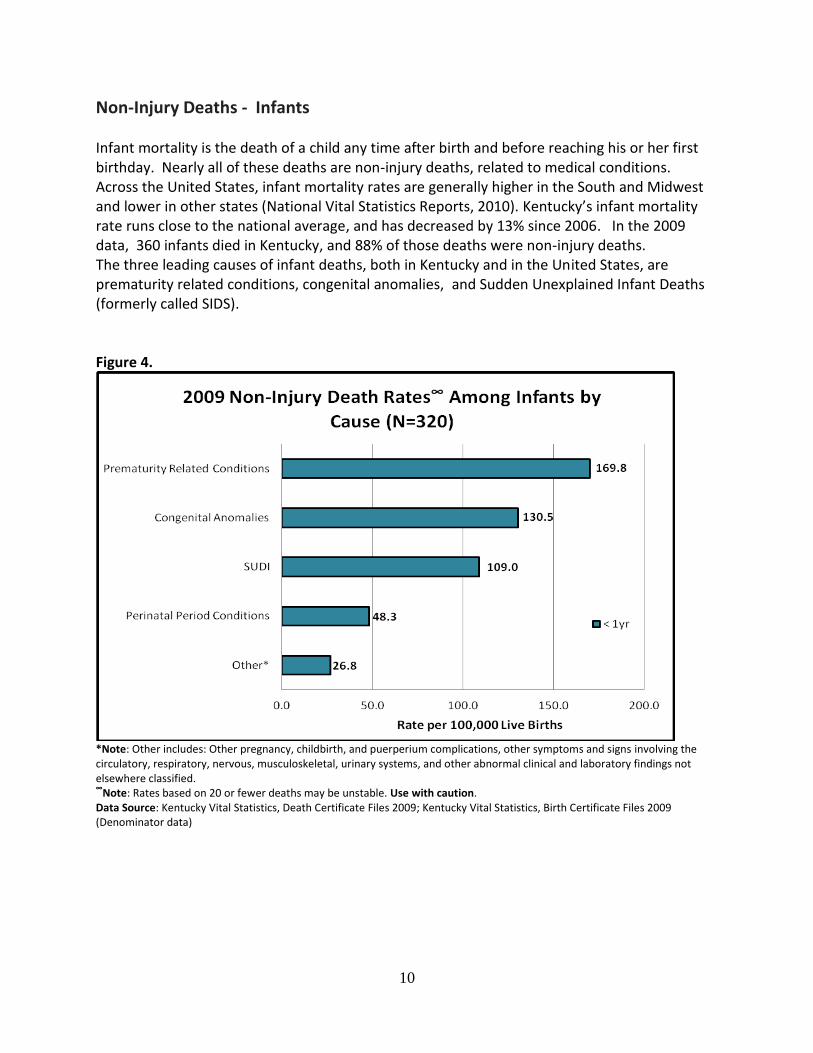
Non-Injury Deaths - Infants Infant mortality is the death of a child any time after birth and before reaching his or her first birthday. Nearly all of these deaths are non-injury deaths, related to medical conditions. Across the United States, infant mortality rates are generally higher in the South and Midwest and lower in other states (National Vital Statistics Reports, 2010). Kentucky’s infant mortality rate runs close to the national average, and has decreased by 13% since 2006. In the 2009 data, 360 infants died in Kentucky, and 88% of those deaths were non-injury deaths. The three leading causes of infant deaths, both in Kentucky and in the United States, are prematurity related conditions, congenital anomalies, and Sudden Unexplained Infant Deaths (formerly called SIDS). Figure 4.
*Note: Other includes: Other pregnancy, childbirth, and puerperium complications, other symptoms and signs involving the circulatory, respiratory, nervous, musculoskeletal, urinary systems, and other abnormal clinical and laboratory findings not elsewhere classified. ∞
Note: Rates based on 20 or fewer deaths may be unstable. Use with caution. Data Source: Kentucky Vital Statistics, Death Certificate Files 2009; Kentucky Vital Statistics, Birth Certificate Files 2009 (Denominator data)
11
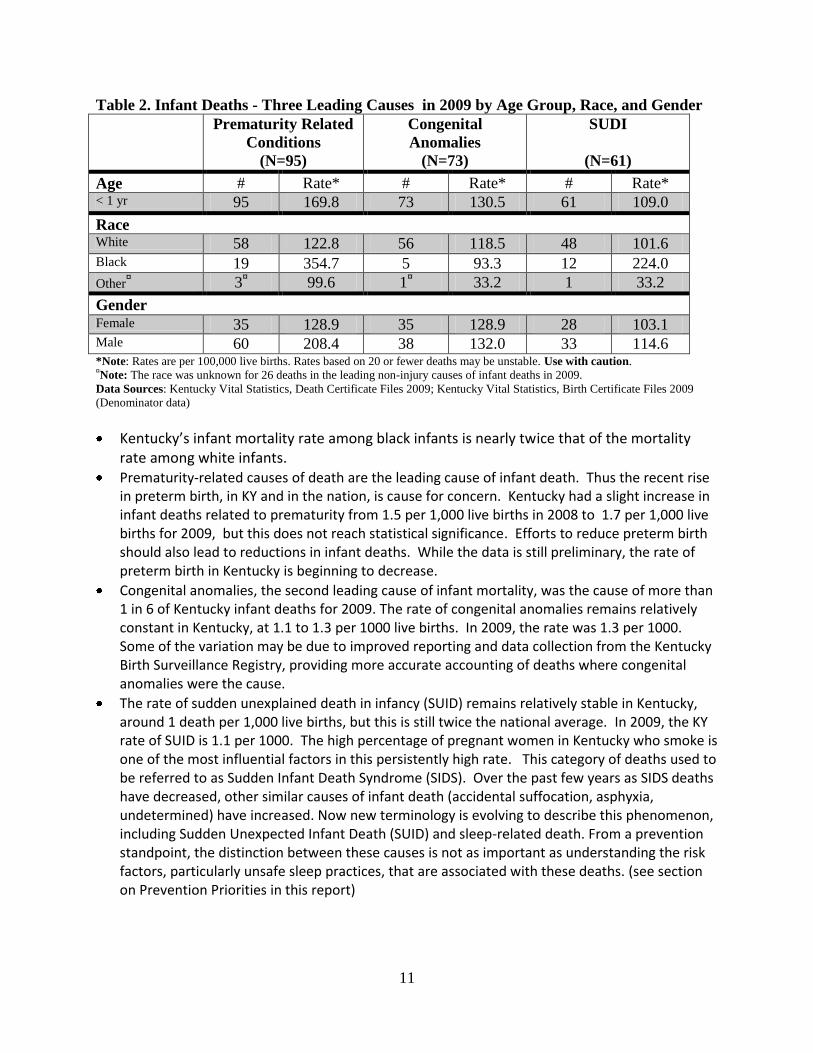
Table 2. Infant Deaths - Three Leading Causes in 2009 by Age Group, Race, and Gender
Prematurity Related
Conditions
(N=95)
Congenital
Anomalies
(N=73)
SUDI
(N=61)
Age # Rate* # Rate* # Rate* < 1 yr 95 169.8 73 130.5 61 109.0
Race White 58 122.8 56 118.5 48 101.6 Black 19 354.7 5 93.3 12 224.0
Other¤ 3
¤ 99.6 1
¤ 33.2 1 33.2
Gender Female 35 128.9 35 128.9 28 103.1 Male 60 208.4 38 132.0 33 114.6 *Note: Rates are per 100,000 live births. Rates based on 20 or fewer deaths may be unstable. Use with caution. ¤Note: The race was unknown for 26 deaths in the leading non-injury causes of infant deaths in 2009.
Data Sources: Kentucky Vital Statistics, Death Certificate Files 2009; Kentucky Vital Statistics, Birth Certificate Files 2009
(Denominator data)
Kentucky’s infant mortality rate among black infants is nearly twice that of the mortality rate among white infants.
Prematurity-related causes of death are the leading cause of infant death. Thus the recent rise in preterm birth, in KY and in the nation, is cause for concern. Kentucky had a slight increase in infant deaths related to prematurity from 1.5 per 1,000 live births in 2008 to 1.7 per 1,000 live births for 2009, but this does not reach statistical significance. Efforts to reduce preterm birth should also lead to reductions in infant deaths. While the data is still preliminary, the rate of preterm birth in Kentucky is beginning to decrease.
Congenital anomalies, the second leading cause of infant mortality, was the cause of more than 1 in 6 of Kentucky infant deaths for 2009. The rate of congenital anomalies remains relatively constant in Kentucky, at 1.1 to 1.3 per 1000 live births. In 2009, the rate was 1.3 per 1000. Some of the variation may be due to improved reporting and data collection from the Kentucky Birth Surveillance Registry, providing more accurate accounting of deaths where congenital anomalies were the cause.
The rate of sudden unexplained death in infancy (SUID) remains relatively stable in Kentucky, around 1 death per 1,000 live births, but this is still twice the national average. In 2009, the KY rate of SUID is 1.1 per 1000. The high percentage of pregnant women in Kentucky who smoke is one of the most influential factors in this persistently high rate. This category of deaths used to be referred to as Sudden Infant Death Syndrome (SIDS). Over the past few years as SIDS deaths have decreased, other similar causes of infant death (accidental suffocation, asphyxia, undetermined) have increased. Now new terminology is evolving to describe this phenomenon, including Sudden Unexpected Infant Death (SUID) and sleep-related death. From a prevention standpoint, the distinction between these causes is not as important as understanding the risk factors, particularly unsafe sleep practices, that are associated with these deaths. (see section on Prevention Priorities in this report)
12
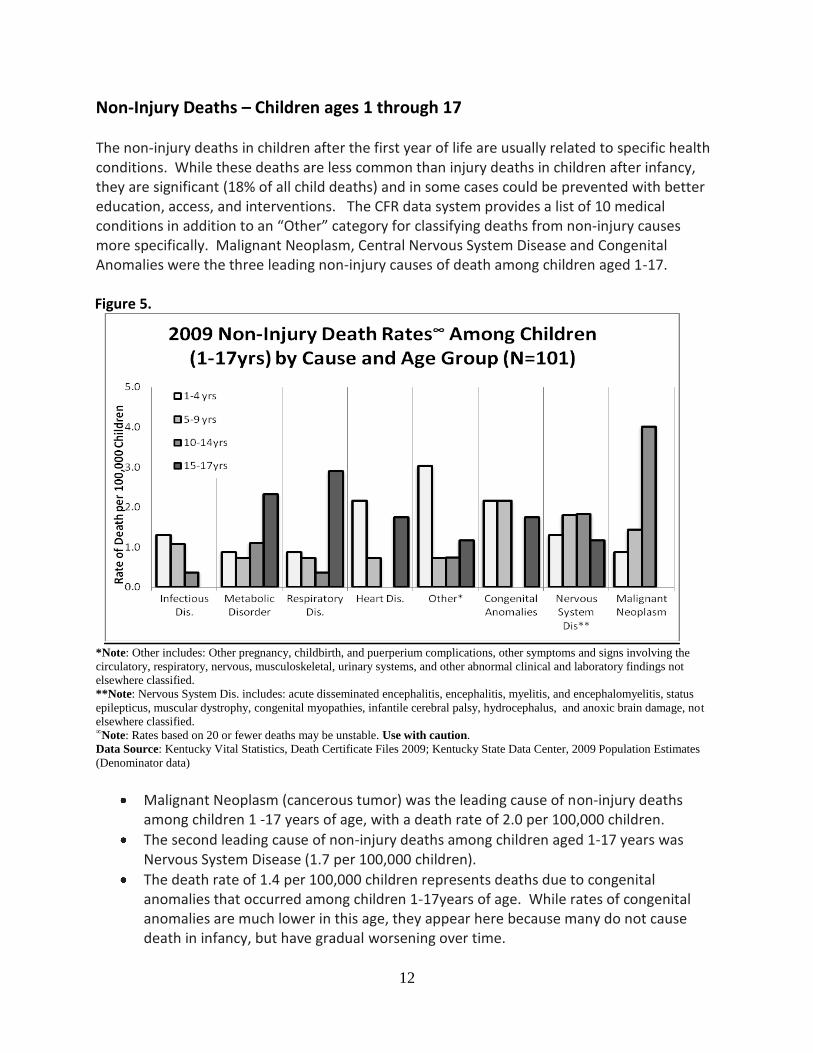
Non-Injury Deaths – Children ages 1 through 17 The non-injury deaths in children after the first year of life are usually related to specific health conditions. While these deaths are less common than injury deaths in children after infancy, they are significant (18% of all child deaths) and in some cases could be prevented with better education, access, and interventions. The CFR data system provides a list of 10 medical conditions in addition to an “Other” category for classifying deaths from non-injury causes more specifically. Malignant Neoplasm, Central Nervous System Disease and Congenital Anomalies were the three leading non-injury causes of death among children aged 1-17.
Figure 5.
*Note: Other includes: Other pregnancy, childbirth, and puerperium complications, other symptoms and signs involving the
circulatory, respiratory, nervous, musculoskeletal, urinary systems, and other abnormal clinical and laboratory findings not
elsewhere classified.
**Note: Nervous System Dis. includes: acute disseminated encephalitis, encephalitis, myelitis, and encephalomyelitis, status
epilepticus, muscular dystrophy, congenital myopathies, infantile cerebral palsy, hydrocephalus, and anoxic brain damage, not
elsewhere classified. ∞Note: Rates based on 20 or fewer deaths may be unstable. Use with caution.
Data Source: Kentucky Vital Statistics, Death Certificate Files 2009; Kentucky State Data Center, 2009 Population Estimates
(Denominator data)
Malignant Neoplasm (cancerous tumor) was the leading cause of non-injury deaths among children 1 -17 years of age, with a death rate of 2.0 per 100,000 children.
The second leading cause of non-injury deaths among children aged 1-17 years was Nervous System Disease (1.7 per 100,000 children).
The death rate of 1.4 per 100,000 children represents deaths due to congenital anomalies that occurred among children 1-17years of age. While rates of congenital anomalies are much lower in this age, they appear here because many do not cause death in infancy, but have gradual worsening over time.
13
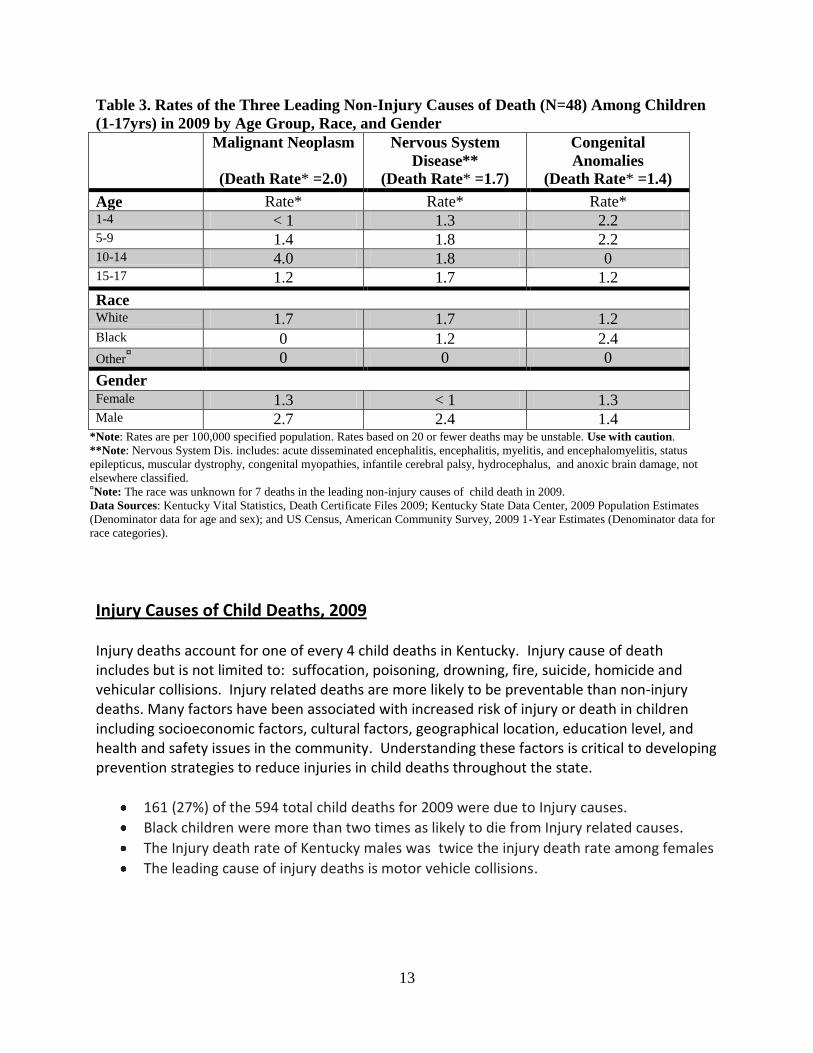
Table 3. Rates of the Three Leading Non-Injury Causes of Death (N=48) Among Children
(1-17yrs) in 2009 by Age Group, Race, and Gender
Malignant Neoplasm
(Death Rate* =2.0)
Nervous System
Disease**
(Death Rate* =1.7)
Congenital
Anomalies
(Death Rate* =1.4)
Age Rate* Rate* Rate* 1-4 < 1 1.3 2.2 5-9 1.4 1.8 2.2 10-14 4.0 1.8 0 15-17 1.2 1.7 1.2
Race White 1.7 1.7 1.2 Black 0 1.2 2.4
Other¤ 0 0 0
Gender Female 1.3 < 1 1.3 Male 2.7 2.4 1.4
*Note: Rates are per 100,000 specified population. Rates based on 20 or fewer deaths may be unstable. Use with caution.
**Note: Nervous System Dis. includes: acute disseminated encephalitis, encephalitis, myelitis, and encephalomyelitis, status
epilepticus, muscular dystrophy, congenital myopathies, infantile cerebral palsy, hydrocephalus, and anoxic brain damage, not
elsewhere classified. ¤Note: The race was unknown for 7 deaths in the leading non-injury causes of child death in 2009.
Data Sources: Kentucky Vital Statistics, Death Certificate Files 2009; Kentucky State Data Center, 2009 Population Estimates
(Denominator data for age and sex); and US Census, American Community Survey, 2009 1-Year Estimates (Denominator data for
race categories).
Injury Causes of Child Deaths, 2009 Injury deaths account for one of every 4 child deaths in Kentucky. Injury cause of death includes but is not limited to: suffocation, poisoning, drowning, fire, suicide, homicide and vehicular collisions. Injury related deaths are more likely to be preventable than non-injury deaths. Many factors have been associated with increased risk of injury or death in children including socioeconomic factors, cultural factors, geographical location, education level, and health and safety issues in the community. Understanding these factors is critical to developing prevention strategies to reduce injuries in child deaths throughout the state.
161 (27%) of the 594 total child deaths for 2009 were due to Injury causes.
Black children were more than two times as likely to die from Injury related causes.
The Injury death rate of Kentucky males was twice the injury death rate among females
The leading cause of injury deaths is motor vehicle collisions.
14
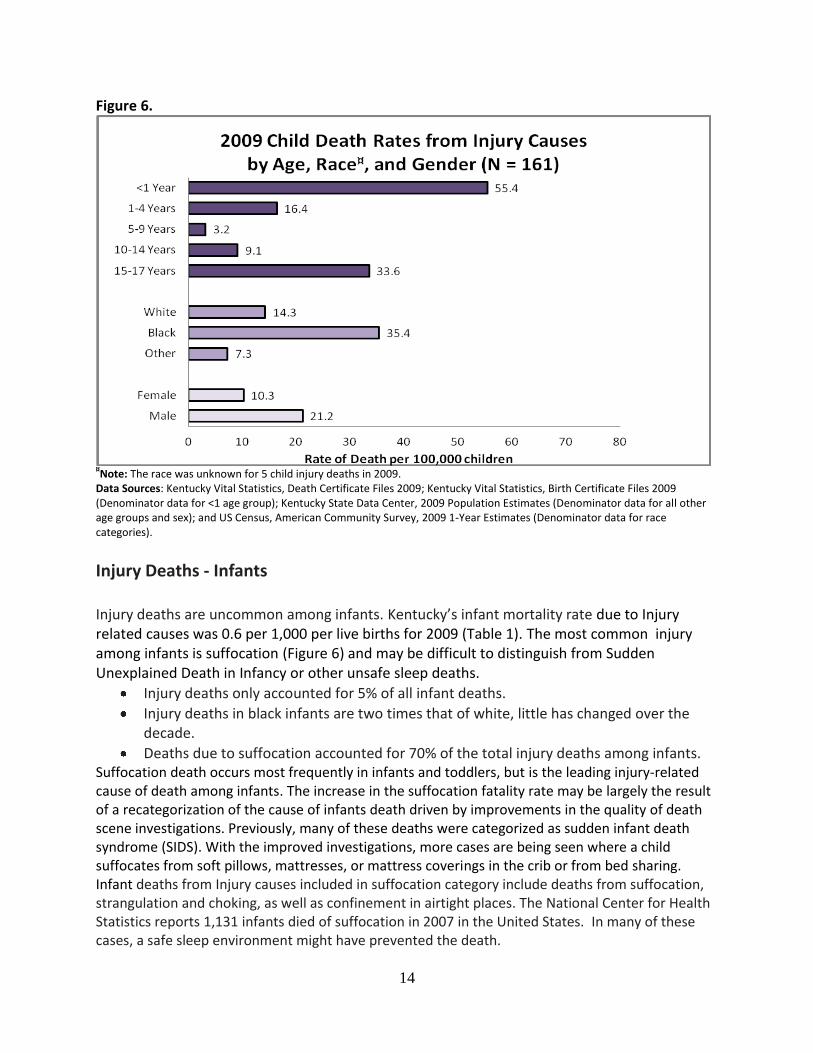
Figure 6.
¤Note: The race was unknown for 5 child injury deaths in 2009.
Data Sources: Kentucky Vital Statistics, Death Certificate Files 2009; Kentucky Vital Statistics, Birth Certificate Files 2009 (Denominator data for <1 age group); Kentucky State Data Center, 2009 Population Estimates (Denominator data for all other age groups and sex); and US Census, American Community Survey, 2009 1-Year Estimates (Denominator data for race categories).
Injury Deaths - Infants Injury deaths are uncommon among infants. Kentucky’s infant mortality rate due to Injury related causes was 0.6 per 1,000 per live births for 2009 (Table 1). The most common injury among infants is suffocation (Figure 6) and may be difficult to distinguish from Sudden Unexplained Death in Infancy or other unsafe sleep deaths.
Injury deaths only accounted for 5% of all infant deaths.
Injury deaths in black infants are two times that of white, little has changed over the decade.
Deaths due to suffocation accounted for 70% of the total injury deaths among infants. Suffocation death occurs most frequently in infants and toddlers, but is the leading injury-related cause of death among infants. The increase in the suffocation fatality rate may be largely the result of a recategorization of the cause of infants death driven by improvements in the quality of death scene investigations. Previously, many of these deaths were categorized as sudden infant death syndrome (SIDS). With the improved investigations, more cases are being seen where a child suffocates from soft pillows, mattresses, or mattress coverings in the crib or from bed sharing. Infant deaths from Injury causes included in suffocation category include deaths from suffocation, strangulation and choking, as well as confinement in airtight places. The National Center for Health Statistics reports 1,131 infants died of suffocation in 2007 in the United States. In many of these cases, a safe sleep environment might have prevented the death.
15
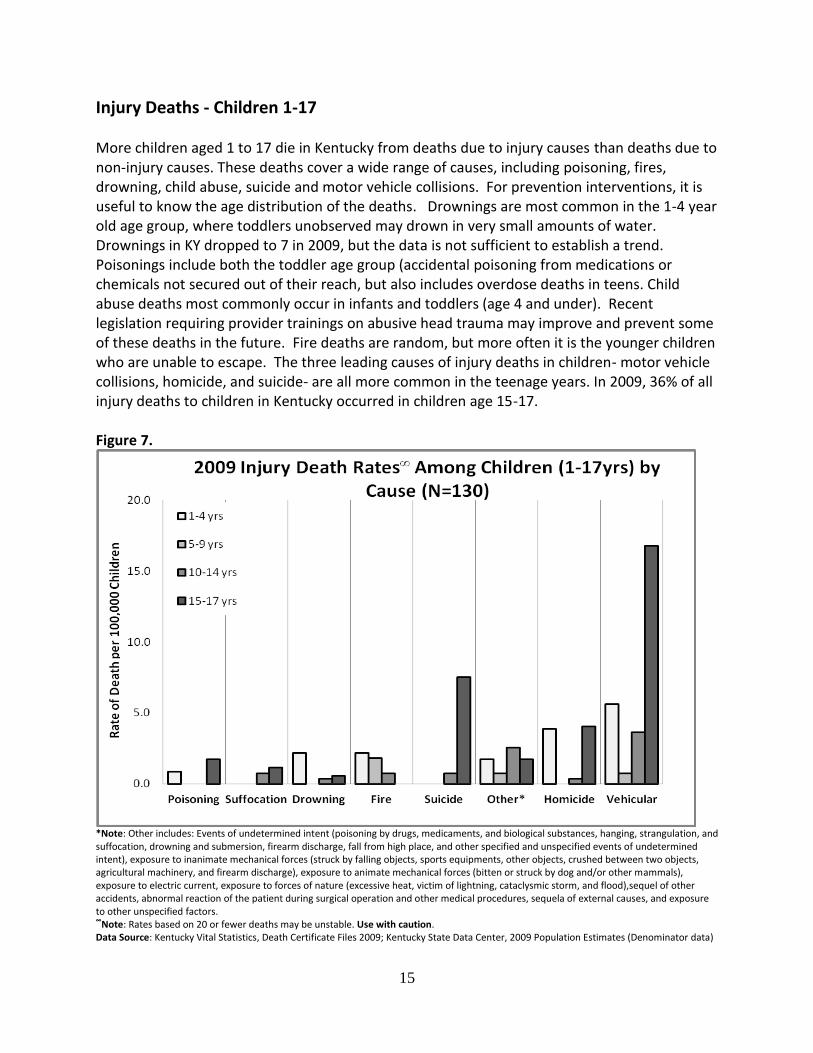
Injury Deaths - Children 1-17 More children aged 1 to 17 die in Kentucky from deaths due to injury causes than deaths due to non-injury causes. These deaths cover a wide range of causes, including poisoning, fires, drowning, child abuse, suicide and motor vehicle collisions. For prevention interventions, it is useful to know the age distribution of the deaths. Drownings are most common in the 1-4 year old age group, where toddlers unobserved may drown in very small amounts of water. Drownings in KY dropped to 7 in 2009, but the data is not sufficient to establish a trend. Poisonings include both the toddler age group (accidental poisoning from medications or chemicals not secured out of their reach, but also includes overdose deaths in teens. Child abuse deaths most commonly occur in infants and toddlers (age 4 and under). Recent legislation requiring provider trainings on abusive head trauma may improve and prevent some of these deaths in the future. Fire deaths are random, but more often it is the younger children who are unable to escape. The three leading causes of injury deaths in children- motor vehicle collisions, homicide, and suicide- are all more common in the teenage years. In 2009, 36% of all injury deaths to children in Kentucky occurred in children age 15-17. Figure 7.
*Note: Other includes: Events of undetermined intent (poisoning by drugs, medicaments, and biological substances, hanging, strangulation, and suffocation, drowning and submersion, firearm discharge, fall from high place, and other specified and unspecified events of undetermined intent), exposure to inanimate mechanical forces (struck by falling objects, sports equipments, other objects, crushed between two objects, agricultural machinery, and firearm discharge), exposure to animate mechanical forces (bitten or struck by dog and/or other mammals), exposure to electric current, exposure to forces of nature (excessive heat, victim of lightning, cataclysmic storm, and flood),sequel of other accidents, abnormal reaction of the patient during surgical operation and other medical procedures, sequela of external causes, and exposure to other unspecified factors. ∞Note: Rates based on 20 or fewer deaths may be unstable. Use with caution. Data Source: Kentucky Vital Statistics, Death Certificate Files 2009; Kentucky State Data Center, 2009 Population Estimates (Denominator data)
16
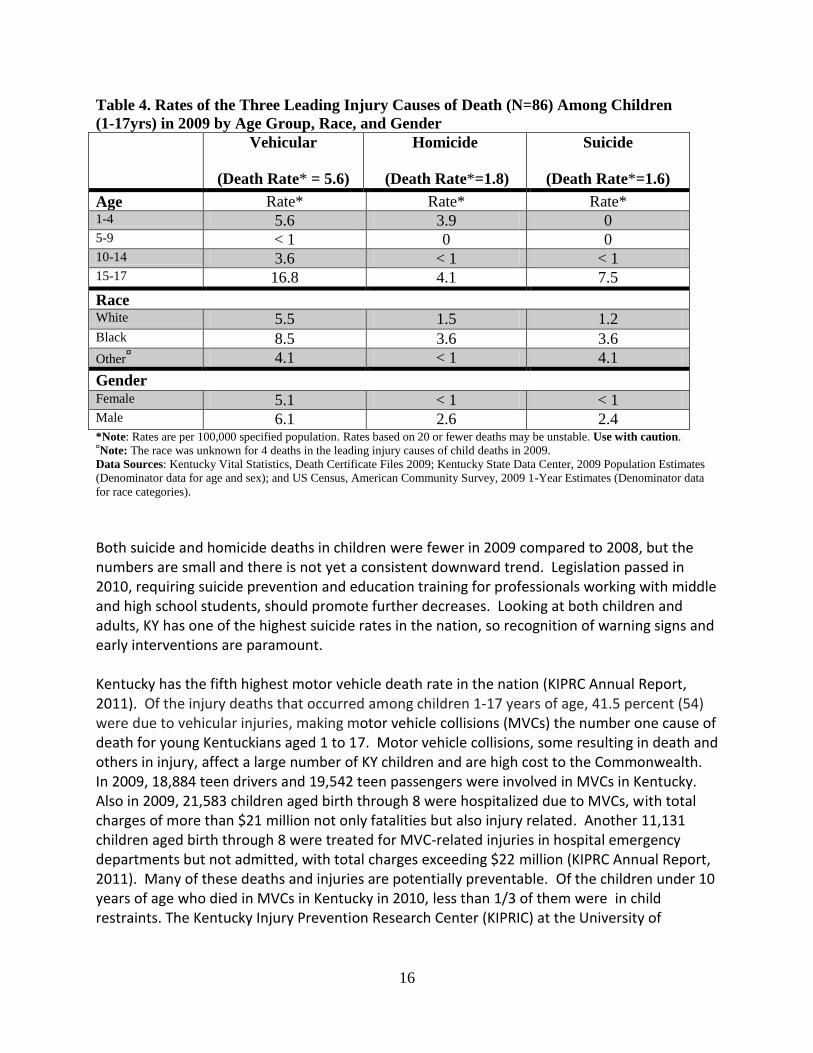
Table 4. Rates of the Three Leading Injury Causes of Death (N=86) Among Children
(1-17yrs) in 2009 by Age Group, Race, and Gender
Vehicular
(Death Rate* = 5.6)
Homicide
(Death Rate*=1.8)
Suicide
(Death Rate*=1.6)
Age Rate* Rate* Rate* 1-4 5.6 3.9 0 5-9 < 1 0 0 10-14 3.6 < 1 < 1 15-17 16.8 4.1 7.5
Race White 5.5 1.5 1.2 Black 8.5 3.6 3.6
Other¤ 4.1 < 1 4.1
Gender Female 5.1 < 1 < 1 Male 6.1 2.6 2.4 *Note: Rates are per 100,000 specified population. Rates based on 20 or fewer deaths may be unstable. Use with caution. ¤Note: The race was unknown for 4 deaths in the leading injury causes of child deaths in 2009.
Data Sources: Kentucky Vital Statistics, Death Certificate Files 2009; Kentucky State Data Center, 2009 Population Estimates
(Denominator data for age and sex); and US Census, American Community Survey, 2009 1-Year Estimates (Denominator data
for race categories).
Both suicide and homicide deaths in children were fewer in 2009 compared to 2008, but the numbers are small and there is not yet a consistent downward trend. Legislation passed in 2010, requiring suicide prevention and education training for professionals working with middle and high school students, should promote further decreases. Looking at both children and adults, KY has one of the highest suicide rates in the nation, so recognition of warning signs and early interventions are paramount. Kentucky has the fifth highest motor vehicle death rate in the nation (KIPRC Annual Report, 2011). Of the injury deaths that occurred among children 1-17 years of age, 41.5 percent (54) were due to vehicular injuries, making motor vehicle collisions (MVCs) the number one cause of death for young Kentuckians aged 1 to 17. Motor vehicle collisions, some resulting in death and others in injury, affect a large number of KY children and are high cost to the Commonwealth. In 2009, 18,884 teen drivers and 19,542 teen passengers were involved in MVCs in Kentucky. Also in 2009, 21,583 children aged birth through 8 were hospitalized due to MVCs, with total charges of more than $21 million not only fatalities but also injury related. Another 11,131 children aged birth through 8 were treated for MVC-related injuries in hospital emergency departments but not admitted, with total charges exceeding $22 million (KIPRC Annual Report, 2011). Many of these deaths and injuries are potentially preventable. Of the children under 10 years of age who died in MVCs in Kentucky in 2010, less than 1/3 of them were in child restraints. The Kentucky Injury Prevention Research Center (KIPRIC) at the University of

17
Kentucky, partners with the Public Health Child Fatality Review program in collecting this injury data and developing prevention strategies. Fortunately, Deaths due to motor vehicle collisions are declining among Kentucky’s children and youth. These declines coincide with the passage of several laws to protect children in vehicles, including primary enforcement for child passenger safety restraints (2006), Graduated Licensing law for teens (2006), legislation requiring booster seats (2008), More recent legislation prohibiting texting and driving and cell phone use for teens while driving will not be reflected in this data, but are likely to continue to move the trends downward. The positive trends in Kentucky include:
The death rate due to motor vehicle crashes among children aged 14 and younger declined 58% from 5.0/100,000 in 2005 to 2.1/100,000 in 2010.
The death rate due to motor vehicle crashes among youth aged 15-24 declined 51% from 37.5/100,000 in 2005 to 18.2/100,000 in 2010.
There has also been a decline in the rate of non-fatal injuries due to motor vehicle collisions over the same time period with a 10% reduction among children 14 and younger (22.5/100,000 vs. 20.1/100,000) and a 23% reduction among youth aged 15-24 (141.6/100,000 vs. 107.8/100,000).
18
PREVENTION PRIORITIES AND RECOMMENDATIONS Safe Sleep Environments for Infants Sudden unexpected deaths in infancy (SUDI) are deaths that occur in infants under one year of age that are unexpected and for which no cause of death is obvious prior to investigation. In the United States, an estimated 4,600 infants die each year from SUDI. After a thorough investigation, some SUDI cases have no identifiable cause (SIDS), while others may be explained by poisoning, metabolic disorders, hyper or hypothermia, neglect and homicide, and suffocation. SIDS, the SUDI subgroup with no known cause after investigation, is the leading cause of death nationally among infants aged one to twelve months. Accidental suffocation and strangulation in bed is another subgroup of SUDI, and it is a leading injury-related infant death. Accidental suffocation includes suffocation by bedding, overlaying or rolling on top of or against an infant while sleeping, and wedging or entrapment of an infant between objects (Shapiro-Mendoza, Kimball, Tomashek, Anderson, & Blanding, 2009). All of these deaths have potential for prevention through promoting safe sleep practices. In Kentucky, over 95% of cases of sudden unexpected death in infancy are sent for autopsy. These autopsies are done by forensic pathologists in the Kentucky Medical Examiner’s Office. Kentucky’s medical examiners are not only specially trained in forensics, but also have taken national leadership in the evolving definitions and classification of these deaths (see the KY Medical Examiner’s Office policy on Sudden Unexplained Death in Infancy in References) In 2009, a total of 360 infants died in Kentucky. An in-depth review of all these infant deaths from all data sources (death certificates, coroner’s reports and child fatality review team reports) was conducted to determine how many infant deaths (regardless of the assigned cause of death) had a risk factor associated with an unsafe sleep environment. This review identified 61 infants (16.9% of all infant deaths) with a documented risk factor related to sleep environment. The sleep environment is a modifiable risk factor and one that can be the target for prevention and health promotion activities in Kentucky in order to reduce infant deaths. The American Academy of Pediatrics (AAP) has promoted the “Back to Sleep” Campaign since
1994, and health care professionals, health educators, and injury prevention advocates have all
embraced the AAP recommendations. In October 2011, the AAP formally recommended that
the national campaign to reduce the risk of SIDS be expanded to include a major focus on the
safe sleep environment and ways to reduce the risk of all sleep-related infant deaths, including
SIDS, suffocation, and other accidental deaths. The Kentucky CFR and Injury Prevention team
have already recognized this need and have begun promoting this approach.

19
Abusive Head Trauma Nationally, Kentucky ranks 18th in the rate of children’s deaths involving child abuse or neglect, (Every Child Matters Education Fund, 2008). About 30 children in Kentucky die each year from child abuse, and abusive head trauma is one of the most common causes of death in these cases. Abusive Head Trauma is a condition suffered by infants or young children that have been violently shaken by a caregiver causing damage to the brain by the sudden movements of the baby’s head in all directions. Shaken baby syndrome is a term often used by physicians and the public to describe Abusive Head Trauma inflicted on infants and young children. Although the term shaken baby syndrome is well known and has been used for a number of decades, advances in the understanding of the mechanisms and clinical spectrum of injury associated with abusive head trauma compel us to modify our terminology to keep pace with our understanding of pathologic mechanisms. Shaking an infant has the potential to cause neurologic injury, blunt impact or a combination of shaking and blunt impact cause injury as well. Spinal cord injury and secondary hypoxic ischemic injury can contribute to poor outcomes of victims. The use of broad medical terminology that is inclusive of all mechanisms of injury, including shaking, is required. The American Academy of Pediatrics supports prevention efforts that reduce the frequency of Abusive Head Trauma and recognizes the utility of maintaining the use of the term "shaken baby syndrome" for prevention efforts. The American Academy of Pediatrics recommends that pediatricians develop skills in the recognition of signs and symptoms of abusive head injury, including those caused by both shaking and blunt impact, consult with pediatric subspecialists when necessary, and embrace a less mechanistic term, abusive head trauma, when describing an inflicted injury to the head and its contents. Kentucky has recently taken steps for prevention of Abusive Head Trauma by passing in 2011 House Bill 285, requiring continuing education about abusive head trauma and child abuse recognition for a number of professionals throughout the state who interface with children and their families. The next step for KY will be educating all families about abusive head trauma – beginning when their baby is born. An evidence-based program for that purpose has been developed by the World Health Organization which includes; parent education by a short video and a one page informational sheet, a commitment statement which nurses ask parents to sign stating they received the education materials and understood it, and a follow up survey conducted a few months after the newborn’s discharge from the hospital. Similar programs are being piloted in the US, including one in Louisville. The CFR State team will encourage all birthing hospitals in Kentucky to implement similar programs. Secondhand Smoke Exposure and Children Exposure to secondhand smoke can be harmful to children’s health, even before they are born. Infants of mothers who are non-smokers but exposed to second hand smoke show many of the same effects as those with mothers who smoked. The effects of secondhand smoke can be seen in Kentucky’s data on asthma, bronchitis, low birth weight, pneumonia, respiratory complications, and Sudden Infant Death Syndrome (SIDS) (KY Vital Stats, 2002-2009). The home
20
is the primary setting where children are exposed, and approximately 39.5% of Kentucky children live in a home where there is smoking tobacco (National Survey Children’s Health, 2007). Children who live in homes where smoking is allowed have higher levels of cotinine, a biological marker for secondhand smoke exposure, than children who live in homes where smoking is not allowed. Health effects of secondhand smoke include:
Low birth weight: Secondhand smoke is a cause of low birth weight, contributing to infant mortality and health complications into adulthood. Secondhand smoke exposure reduces the birth weight of infants of nonsmoking mothers and contributes to additional reductions in birth weight among babies of smoking mothers.
Respiratory Complications: Secondhand smoke exposure increases the risk of lower respiratory tract infections such as bronchitis and pneumonia. Infants whose mothers smoke are 50 percent more likely to be hospitalized with a respiratory infection during their first year when compared to infants with nonsmoking mothers.
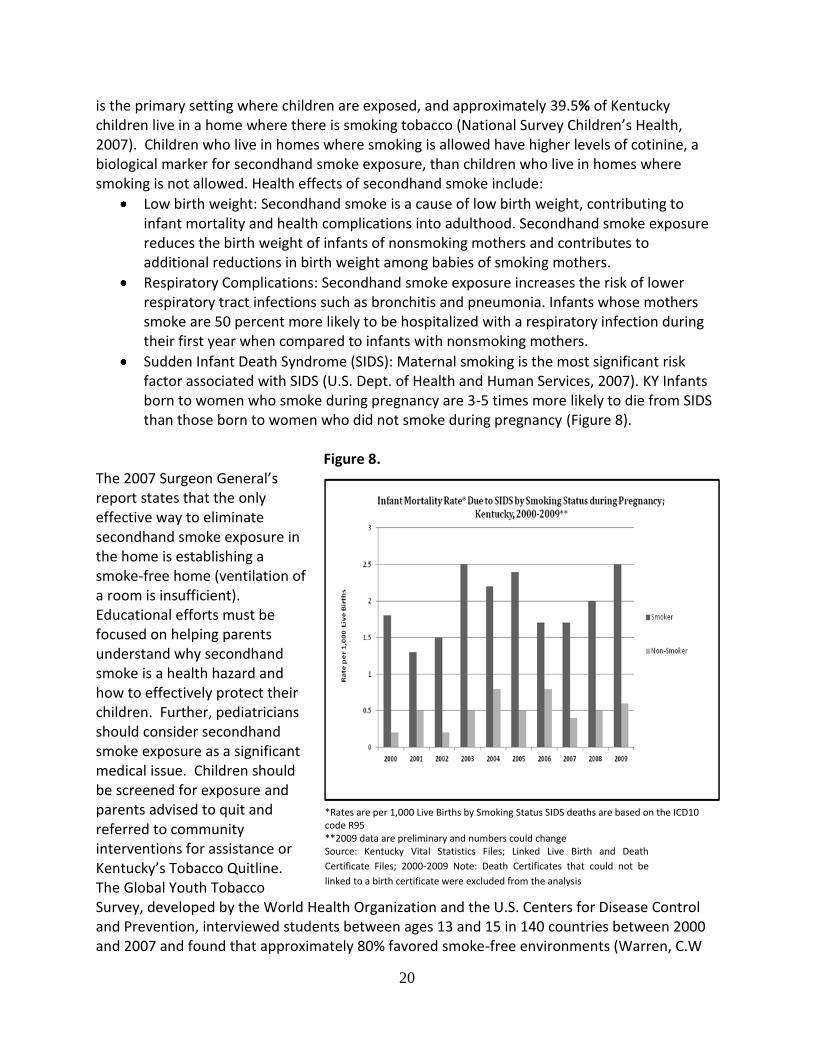
Sudden Infant Death Syndrome (SIDS): Maternal smoking is the most significant risk factor associated with SIDS (U.S. Dept. of Health and Human Services, 2007). KY Infants born to women who smoke during pregnancy are 3-5 times more likely to die from SIDS than those born to women who did not smoke during pregnancy (Figure 8).
Figure 8. The 2007 Surgeon General’s report states that the only effective way to eliminate secondhand smoke exposure in the home is establishing a smoke-free home (ventilation of a room is insufficient). Educational efforts must be focused on helping parents understand why secondhand smoke is a health hazard and how to effectively protect their children. Further, pediatricians should consider secondhand smoke exposure as a significant medical issue. Children should be screened for exposure and parents advised to quit and referred to community interventions for assistance or Kentucky’s Tobacco Quitline. The Global Youth Tobacco Survey, developed by the World Health Organization and the U.S. Centers for Disease Control and Prevention, interviewed students between ages 13 and 15 in 140 countries between 2000 and 2007 and found that approximately 80% favored smoke-free environments (Warren, C.W
*Rates are per 1,000 Live Births by Smoking Status SIDS deaths are based on the ICD10 code R95 **2009 data are preliminary and numbers could change Source: Kentucky Vital Statistics Files; Linked Live Birth and Death
Certificate Files; 2000-2009 Note: Death Certificates that could not be
linked to a birth certificate were excluded from the analysis
21
Jones, 2008). Twenty-six states have enacted smoke-free laws, and as of May 2011, 33.6% of Kentuckians are protected by comprehensive smoke-free workplace laws or regulations. In a 2006 report titled, The Health Consequences of Involuntary Exposure to Secondhand Smoke, the U.S. Surgeon General concluded that there is no safe level of exposure to secondhand smoke and that, on average, children are exposed to more secondhand smoke than adults (U.S. Dept of Health and Human Services, 2006).” Children receiving high doses of secondhand smoke, such as those with smoking mothers, run the greatest risk of damaging health effects, including Sudden Unexpected Infant Death. Policies to restrict smoking in public and indoor places are primarily motivated by the tremendous public health burden associated with secondhand smoke exposure. This burden not only translates into disease morbidity and premature mortality, but also exerts profound stress on healthcare resources and systems already struggling to address the related burden of active smoking.
Child Passenger Safety Kentucky has made efforts to protect children traveling in cars since the passage of legislation requiring use of infant car seats in 1982. In the last 5 years, significant additional legislation has passed, including the requirement for booster seats in young children and, targeting teens, graduated driver licensing and prohibiting texting while driving. Kentucky’s booster seat law currently requires that children less than seven years old and between forty and fifty inches tall must ride properly restrained in a federally approved booster seat. Booster seats “boost” a child up higher so that the car's seatbelt fits properly over the child to provide the desired protection from injury. However, since the KY legislation passed, both the American Academy of Pediatrics (AAP) and the National Highway Traffic Safety Administration have recommended that children to remain in booster seats until they reach 4-feet 9-inches tall (57 inches), when the seatbelt should fit properly across their chest and lap, regardless of the child’s age. The earlier recommendations based on age did not take into account that different children have different cycles of growth. The new recommendations stress the difference in child body sizes as more relevant than age. Next steps for Kentucky will be to update the current legislation to meet these new recommendations. The new booster seat recommendations will be promoted by health care providers and child safety advocates across the state. In addition, the State CFR team will be partnering with the Kentucky Injury Prevention Center’s Violence and Injury Prevention Program (KVIPP). Through a grant from the CDC, the KVIPP will focus on this threat to the children and youth of our Commonwealth through a motor vehicle / child injury prevention (MV/CIP) project. This project will bring together a diverse partnership of public and private organizations to examine and evaluate existing data, select critical target areas based upon the best available epidemiological evidence, create and implement policy and programmatic activities to reduce injuries related to those target areas, and evaluate the impact of the efforts. Evaluation results will be used to drive improvements in specific policy and intervention activities and in the project as a whole.

22
SUMMARY
Child fatalities in Kentucky are on the decrease. This is due to years of effort from many partners all across Kentucky. Still, nearly 600 Kentucky families in 2009 suffered the loss of a child. There remains much work to be done to prevent such deaths in the future. Priorities for the coming year will include promoting safe sleep practices for infants, education on abusive head trauma, promotion of smoke-free environments for children, and continued emphasis on child passenger safety.
23
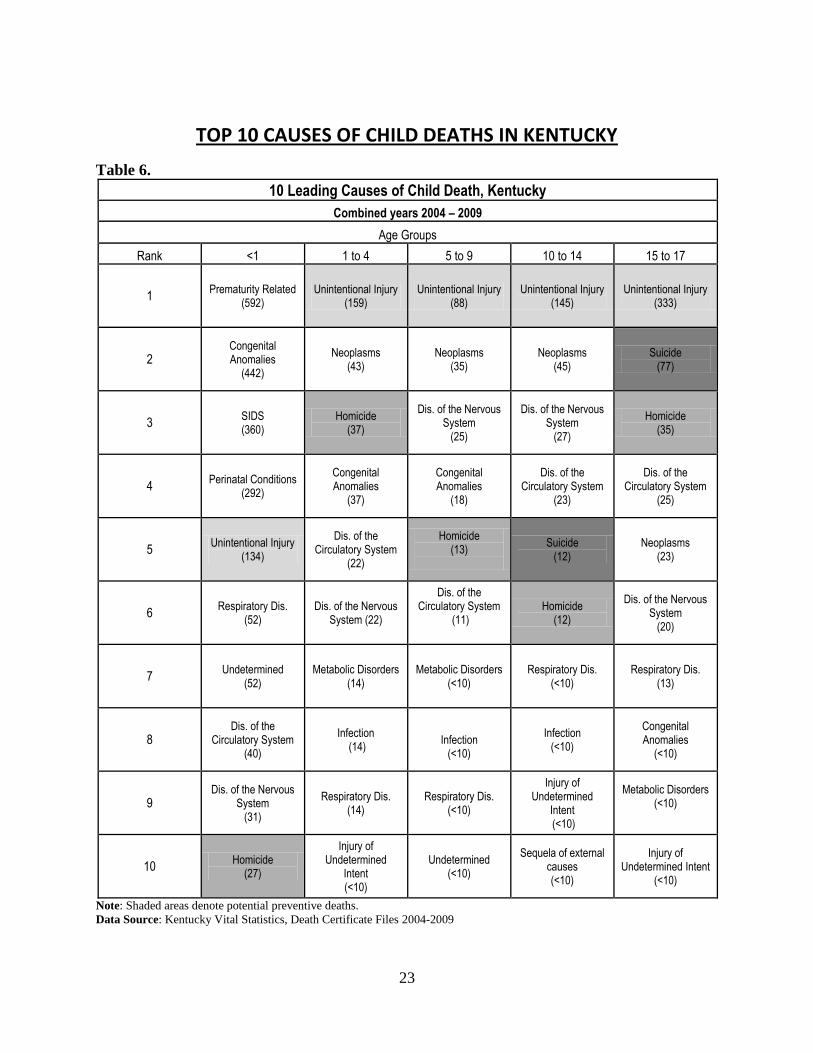
TOP 10 CAUSES OF CHILD DEATHS IN KENTUCKY
Table 6.
10 Leading Causes of Child Death, Kentucky
Combined years 2004 – 2009
Age Groups
Rank <1 1 to 4 5 to 9 10 to 14 15 to 17
1 Prematurity Related
(592) Unintentional Injury
(159) Unintentional Injury
(88) Unintentional Injury
(145) Unintentional Injury
(333)
2 Congenital Anomalies
(442)
Neoplasms (43)
Neoplasms (35)
Neoplasms (45)
Suicide (77)
3 SIDS (360)
Homicide (37)
Dis. of the Nervous System
(25)
Dis. of the Nervous System
(27)
Homicide (35)
4 Perinatal Conditions
(292)
Congenital Anomalies
(37)
Congenital Anomalies
(18)
Dis. of the Circulatory System
(23)
Dis. of the Circulatory System
(25)
5 Unintentional Injury
(134)
Dis. of the Circulatory System
(22)
Homicide (13)
Suicide (12)
Neoplasms (23)
6 Respiratory Dis.
(52) Dis. of the Nervous
System (22)
Dis. of the Circulatory System
(11)
Homicide (12)
Dis. of the Nervous System
(20)
7 Undetermined
(52) Metabolic Disorders
(14) Metabolic Disorders
(<10) Respiratory Dis.
(<10) Respiratory Dis.
(13)
8 Dis. of the
Circulatory System (40)
Infection (14)
Infection
(<10)
Infection (<10)
Congenital Anomalies
(<10)
9 Dis. of the Nervous
System (31)
Respiratory Dis. (14)
Respiratory Dis. (<10)
Injury of Undetermined
Intent (<10)
Metabolic Disorders (<10)
10 Homicide
(27)
Injury of Undetermined
Intent (<10)
Undetermined (<10)
Sequela of external causes (<10)
Injury of Undetermined Intent
(<10)
Note: Shaded areas denote potential preventive deaths.
Data Source: Kentucky Vital Statistics, Death Certificate Files 2004-2009
24
REFERENCES CDC. (2011). Health Disparities and Inequalities Report — United States, 2011. Morbidity and
Mortality Weekly Report, Vol. 60. Every Child Matters Education Fund, Kentucky. (2008). State Statistics. Retrieved September 20, 2011, from http://www.everychildmatters.org/kentucky. Fatality Analysis Reporting System. (2010). Fatalities and Fatality Rates, 1994 – 2008. Retrieved
September 14, 2010, from http://wwwfars.nhtsa.dot.gov/Trends/TrendsGeneral.aspx. Kentucky Department of Community Based Services. (2009). Child Abuse and Neglect Annual
Report of Child Fatalities and Near Fatalities State Fiscal Year 2009 (July 1, 2008 to June 30, 2009). Retrieved September 1, 2011 from http://chfs.ky.gov/dcbs/dpp/childsafety.htm.
Kentucky Injury Prevention and Research Center. (2011). Kentucky Injury Prevention and
Research Center (KIPRC) 2011 Annual Report on Activities and Impact. Retrieved http://www.kiprc.uky.edu/DocFiles/kiprcannualreport2011.pdf
Kentucky Vital Statistics. (2009). Death Certificate Files. Retrieved September 1, 2011. Kentucky Vital Statistics Files; Linked Live Birth and Death Certificate Files; 2002-2009. Knight, L. D., Hunsaker, D. M., & Corey, T. S. (2005). Cosleeping and sudden unexpected infant
deaths in Kentucky: a 10-year retrospective case review. Am J Forensic Med Pathol, 26(1), 28-32. doi: 00000433-200503000-00006 [pii]
National Center for Injury Prevention and Control. (2010). Web-based Injury Statistics Query
and Reporting System: 10 Leading Causes of Death, United States, 2007 [custom data query]. Retrieved September 1, 2010, from http://www.cdc.gov/injury/wisqars/index.html.
National Institute of Child Health and Human Development (NICHD).
http://www.nichd.nih.gov/sids/ (updated 8/10/2011).
National Survey of Children's Health. NSCH 2007. Data query from the Child and Adolescent Health Measurement Initiative, Data Resource Center for Child and Adolescent Health website. Retrieved October 31, 2011. www.childhealthdata.org.
National Vital Statistics Reports. Infant Mortality Statistics From the 2006 Period Linked Birth/Infant Death Data Set.
Volume 58, Number 17. (April 30, 2010). http://www.cdc.gov/nchs/data/nvsr/nvsr58/nvsr58_17.pdf

25
Shapiro-Mendoza, C. K., Kimball, M., Tomashek, K. M., Anderson, R. N., & Blanding, S. (2009). US infant mortality trends attributable to accidental suffocation and strangulation in bed from 1984 through 2004: are rates increasing? Pediatrics, 123(2), 533-539. doi: 123/2/533 [pii]10.1542/peds.2007-3746
American Academy of Pediatrics, Task Force on Sudden Infant Death Syndrome. (2011). SIDS
and other sleep-related infant deaths: expansion of recommendations for a safe infant sleeping environment. Pediatrics, 128(5), 1030-1039. doi: 10.1542/peds.2011-2284.
U.S. Department of Health and Human Services. Children and Secondhand Smoke Exposure: A
Report of the Surgeon General. U.S. Department of Health and Human Services, Centers for Disease Control and Prevention, National Center for Chronic Disease Prevention and Health Promotion, Office on Smoking Health, 2007.
U.S. Department of Health and Human Services. The Health Consequences of Involuntary
Exposure to Tobacco Smoke: A Report of the Surgeon General. U.S. Department of Health and Human Services, Centers for Disease Control and Prevention, National Center for Chronic Disease Prevention and Health Promotion, Office on Smoking and Health, 2006.
Warren, C.W., Jones, N.R., & Peruga, A. (2008). “Global youth tobacco surveillance,” Morbidity
and Mortality Weekly Report 57(SS01): 1-21. World Health Organization. Violence Prevention: The Investment That Saves Lives. Retrieved
October 14, 2011. http://www.who.int/violenceprevention/about/participants/Child_maltreatment.pdf
List of Figures Figure 1. Rate of Kentucky Child Deaths 0-17 years 2003-2009 Page 3 Figure 2. Percent of 2009 Non-Injury and Injury Deaths among Infants and Children Page 4
1-17 yrs. Figure 3. 2009 Child Death Rates from Non-Injury Causes by Age, Race and Gender Page 9 Figure 4. 2009 Non-Injury Death Rates Among Infants by Cause Page 10 Figure 5. 2009 Non-Injury Death Rates Among Children (1-17yrs) by Cause and Page 12
Age Group Figure 6. 2009 Child Death Rates from Injury Causes by Age, Race and Gender Page 14 Figure 7. 2009 Injury Death Rates Among Children (1-17yrs) by Cause Page 15 Figure 8. Infant Mortality Rate Due to SIDS by Smoking Status During Pregnancy Page 20

26
List of Tables Table 1. Overview of 2009 Deaths among Kentucky Children Page 8 Table 2. Infant Deaths- Three Leading Causes in 2009 by Age Group, Race, and Gender Page 11
Table 3. Rates of the Three Leading Non-Injury Causes of Death Among Children (1-17yrs) Page 13 in 2009 by Age Group, Race, and Gender
Table 4. Rates of the Three Leading Injury Causes of Death Children (1-17yrs) Page 14 in 2009 by Age Group, Race, and Gender
Table 5. 10 Leading Causes of Child Death, Kentucky combined years 2004-2009 Page 23 Map Local Child Fatality Review Teams as of September 2011 Page 7
27
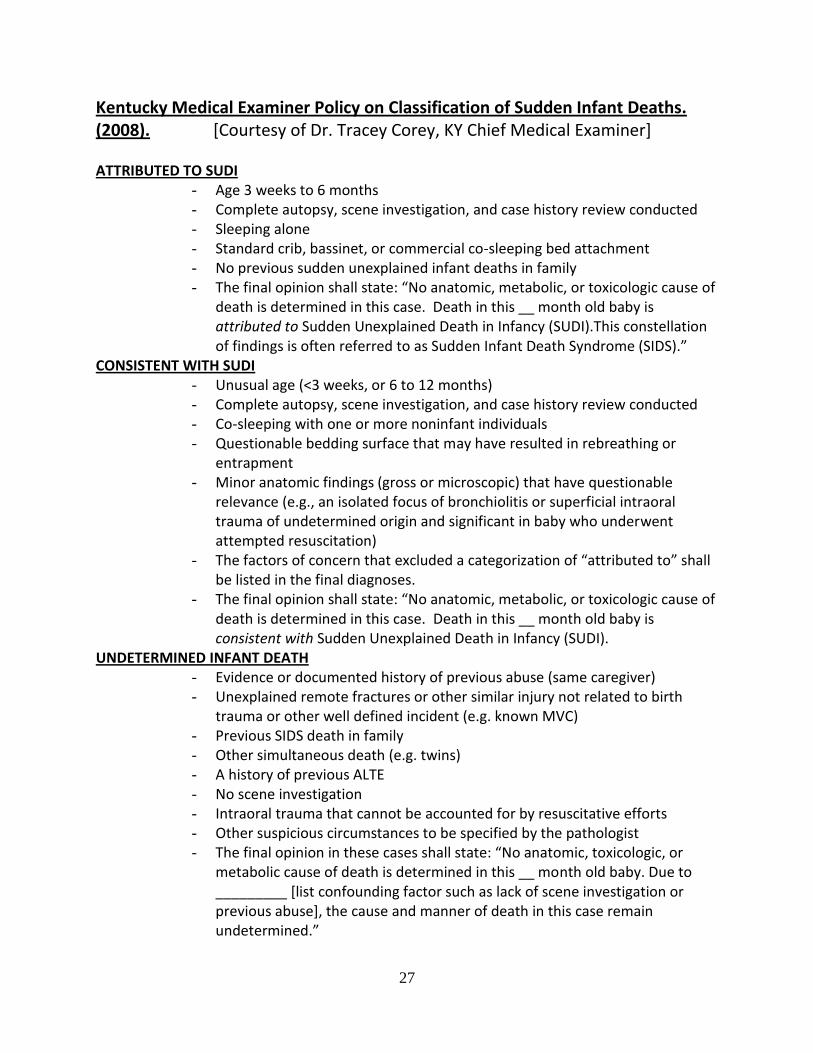
Kentucky Medical Examiner Policy on Classification of Sudden Infant Deaths. (2008). [Courtesy of Dr. Tracey Corey, KY Chief Medical Examiner]
ATTRIBUTED TO SUDI
- Age 3 weeks to 6 months - Complete autopsy, scene investigation, and case history review conducted - Sleeping alone - Standard crib, bassinet, or commercial co-sleeping bed attachment - No previous sudden unexplained infant deaths in family - The final opinion shall state: “No anatomic, metabolic, or toxicologic cause of
death is determined in this case. Death in this __ month old baby is attributed to Sudden Unexplained Death in Infancy (SUDI).This constellation of findings is often referred to as Sudden Infant Death Syndrome (SIDS).”
CONSISTENT WITH SUDI - Unusual age (<3 weeks, or 6 to 12 months) - Complete autopsy, scene investigation, and case history review conducted - Co-sleeping with one or more noninfant individuals - Questionable bedding surface that may have resulted in rebreathing or
entrapment - Minor anatomic findings (gross or microscopic) that have questionable
relevance (e.g., an isolated focus of bronchiolitis or superficial intraoral trauma of undetermined origin and significant in baby who underwent attempted resuscitation)
- The factors of concern that excluded a categorization of “attributed to” shall be listed in the final diagnoses.
- The final opinion shall state: “No anatomic, metabolic, or toxicologic cause of death is determined in this case. Death in this __ month old baby is consistent with Sudden Unexplained Death in Infancy (SUDI).
UNDETERMINED INFANT DEATH - Evidence or documented history of previous abuse (same caregiver) - Unexplained remote fractures or other similar injury not related to birth
trauma or other well defined incident (e.g. known MVC) - Previous SIDS death in family - Other simultaneous death (e.g. twins) - A history of previous ALTE - No scene investigation - Intraoral trauma that cannot be accounted for by resuscitative efforts - Other suspicious circumstances to be specified by the pathologist - The final opinion in these cases shall state: “No anatomic, toxicologic, or
metabolic cause of death is determined in this __ month old baby. Due to _________ [list confounding factor such as lack of scene investigation or previous abuse], the cause and manner of death in this case remain undetermined.”
Related Documents