Journal of Public Health and Epidemiology Volume 5 Number 9 September 2013 ISSN 2141-2316

Welcome message from author
This document is posted to help you gain knowledge. Please leave a comment to let me know what you think about it! Share it to your friends and learn new things together.
Transcript

Journal of
Public Health and
Epidemiology
Volume 5 Number 9 September 2013
ISSN 2141-2316
ABOUT JPHE The Journal of Public Health and Epidemiology (JPHE) is published monthly (one volume per year) by Academic Journals.
Journal of Public Health and Epidemiology (JPHE) is an open access journal that provides rapid publication (monthly) of articles in all areas of the subject such as health observatory, biostatistics, occupational health, behavioral medicine etc. The Journal welcomes the submission of manuscripts that meet the general criteria of significance and scientific excellence. Papers will be published shortly after acceptance. All articles published in JPHE are peer-reviewed.
Submission of Manuscript Submit manuscripts as e-mail attachment to the Editorial Office at: [email protected]. A manuscript number will be mailed to the corresponding author shortly after submission.
The Journal of Public Health and Epidemiology will only accept manuscripts submitted as e-mail attachments. Please read the Instructions for Authors before submitting your manuscript. The manuscript files should be given the last name of the first author.

Editors
Professor Mostafa A. Abolfotouh Professor of Family & Community Medicine Head of Medical Team - Biobanking Section. King Abdullah International Medical Research CEnter, King Saud Bin-Abdulaziz University for Health Sciences, National Guard Health Affairs, Saudi Arabia

Editorial Board Dr. Guolian Kang The University of Alabama at Birmingham/1665 University Blvd, Ryals 443 Guolian USA
Dr. Mohammed Danlami Salihu Public Health Department Faculty of Veterinary Medicine Usmanu Danfodiyo University, Sokoto. Nigeria. Prof. Jahanfar Jahanban Oral Pathology Dept.Dental faculty of Tehran Islamic Azad University/ Address:B 107 Pezeshkan-Farabi Build No 67 Javanshir St. Hosseinabad Pasdaran St.Tehran Iran
Okonko, Iheanyi Omezuruike University of Ibadan, Ibadan, Nigeria Nigeria
Dr. Afroditi K Boutou Respiratory Failure Unit, Aristotle University of Thessaloniki,"G. Papanikolaou", Hospital, 57010, Exohi. Greece Dr. Anil K. Philip Rajiv Academy for Pharmacy/ delhi-Mathura Highway, NH#2, Mathura-281001, Uttar Pradesh, India India
Dr. Bijan Mohammad hosseini Ayatollah Kashani Social Security Hospital P.O Box: 14515 - 799 Tehran - Iran Iran Dr. Brajadulal Chattopadhyay Department of Physics, Jadavpur University, Kolkata- 700032, India India
Dr. Carlos H Orces Laredo Medical Center, 1700 East Saunders, Laredo Texas 78041 USA
Mrs Iscah A. Moth Ministry of Public Health and Sanitation P.O. Box 1210-40100 Kisumu Kenya
Prof. Tariq Javed Department of Pathology, Faculty of Veterinary Science, University of Agriculture, Faisalabad-38040. Pakistan.
Dr. María Elena Dávila L Universidad Centroccidental “Lisandro Alvarado”. School of Medicine/ School of Health Science . Av. Andrés Bello C/ Av. Libertador. Barquisimeto, Lara, Venezuela, SA
Dr. Lay Ching Chai Centre of Excellence for Food Safety Research, Faculty of Food Science and Technology, Universiti Putra Malaysia, 43400 UPM Serdang, Selangor, Malaysia
Dr. Liting Song Appointment pending, Public Health Agency of Canada/Health Canada 809-50 Ruddington Drive, Toronto, ON M2K 2J8 Canada
Dr. Joaquim Xavier Sousa Jr Laboratory Immunodermatology of Clinics Hospital - Av Dr Eneas Carvalho Aguiar, 255 3th floor Room 3016 05403-000 Sao Paulo, Brazil Brazil
Dr. K.K.I.U. Arunakumara Institution/address - Dept. of Crop Science, Faculty of Agriculture, University of Ruhuna, Mapalana, Kamburupitiya, Sri Lanka Sri Lanka
Dr. Keya Chaudhuri Indian Institute of Chemical Biology Raja S C Mullick Road, Kolkata-700032, India India
Belchiolina Beatriz Fonseca Universidade Federal de Uberlândia, Rua Ceará s/n, bloco 2D. saça 43, Campus Umuarama, Uberlândia MG, Brazil. Brazil
Dr. Charles R. Doarn Associate Professor of Public Health and Biomedical Engineering Director, Telemedicine Program Department of Public Health Sciences University of Cincinnati USA
Instructions for Author Electronic submission of manuscripts is strongly encouraged, provided that the text, tables, and figures are included in a single Microsoft Word file (preferably in Arial font). The cover letter should include the corresponding author's full address and telephone/fax numbers and should be in an e-mail message sent to the Editor, with the file, whose name should begin with the first author's surname, as an attachment. Article Types Three types of manuscripts may be submitted: Regular articles: These should describe new and carefully confirmed findings, and experimental procedures should be given in sufficient detail for others to verify the work. The length of a full paper should be the minimum required to describe and interpret the work clearly. Short Communications: A Short Communication is suitable for recording the results of complete small investigations or giving details of new models or hypotheses, innovative methods, techniques or apparatus. The style of main sections need not conform to that of full-length papers. Short communications are 2 to 4 printed pages (about 6 to 12 manuscript pages) in length. Reviews: Submissions of reviews and perspectives covering topics of current interest are welcome and encouraged. Reviews should be concise and no longer than 4-6 printed pages (about 12 to 18 manuscript pages). Reviews are also peer-reviewed. Review Process All manuscripts are reviewed by an editor and members of the Editorial Board or qualified outside reviewers. Authors cannot nominate reviewers. Only reviewers randomly selected from our database with specialization in the subject area will be contacted to evaluate the manuscripts. The process will be blind review. Decisions will be made as rapidly as possible, and the journal strives to return reviewers’ comments to authors as fast as possible. The editorial board will re-review manuscripts that are accepted pending revision. It is the goal of the JPHE to publish manuscripts within weeks after submission.
Regular articles
All portions of the manuscript must be typed double- spaced and all pages numbered starting from the title page.
The Title should be a brief phrase describing the contents of the paper. The Title Page should include the authors' full names and affiliations, the name of the corresponding author along with phone, fax and E-mail information. Present addresses of authors should appear as a footnote.
The Abstract should be informative and completely self- explanatory, briefly present the topic, state the scope of the experiments, indicate significant data, and point out major findings and conclusions. The Abstract should be 100 to 200 words in length.. Complete sentences, active verbs, and the third person should be used, and the abstract should be written in the past tense. Standard nomenclature should be used and abbreviations should be avoided. No literature should be cited. Following the abstract, about 3 to 10 key words that will provide indexing references should be listed.
A list of non-standard Abbreviations should be added. In general, non-standard abbreviations should be used only when the full term is very long and used often. Each abbreviation should be spelled out and introduced in parentheses the first time it is used in the text. Only recommended SI units should be used. Authors should use the solidus presentation (mg/ml). Standard abbreviations (such as ATP and DNA) need not be defined.
The Introduction should provide a clear statement of the problem, the relevant literature on the subject, and the proposed approach or solution. It should be understandable to colleagues from a broad range of scientific disciplines.
Materials and methods should be complete enough to allow experiments to be reproduced. However, only truly new procedures should be described in detail; previously published procedures should be cited, and important modifications of published procedures should be mentioned briefly. Capitalize trade names and include the manufacturer's name and address. Subheadings should be used. Methods in general use need not be described in detail.

Results should be presented with clarity and precision. The results should be written in the past tense when describing findings in the authors' experiments. Previously published findings should be written in the present tense. Results should be explained, but largely without referring to the literature. Discussion, speculation and detailed interpretation of data should not be included in the Results but should be put into the Discussion section.
The Discussion should interpret the findings in view of the results obtained in this and in past studies on this topic. State the conclusions in a few sentences at the end of the paper. The Results and Discussion sections can include subheadings, and when appropriate, both sections can be combined. The Acknowledgments of people, grants, funds, etc should be brief.
Tables should be kept to a minimum and be designed to be as simple as possible. Tables are to be typed double- spaced throughout, including headings and footnotes. Each table should be on a separate page, numbered consecutively in Arabic numerals and supplied with a heading and a legend. Tables should be self-explanatory without reference to the text. The details of the methods used in the experiments should preferably be described in the legend instead of in the text. The same data should not be presented in both table and graph form or repeated in the text.
Figure legends should be typed in numerical order on a separate sheet. Graphics should be prepared using applications capable of generating high resolution GIF, TIFF, JPEG or Powerpoint before pasting in the Microsoft Word manuscript file. Tables should be prepared in Microsoft Word. Use Arabic numerals to designate figures and upper case letters for their parts (Figure 1). Begin each legend with a title and include sufficient description so that the figure is understandable without reading the text of the manuscript. Information given in legends should not be repeated in the text. References: In the text, a reference identified by means of an author‘s name should be followed by the date of the reference in parentheses. When there are more than two authors, only the first author‘s name should be mentioned, followed by ’et al‘. In the event that an author cited has had two or more works published during the same year, the reference, both in the text and in the reference list, should be identified by a lower case letter like ’a‘ and ’b‘ after the date to distinguish the works.
Examples:
Abayomi (2000), Agindotan et al. (2003), (Kelebeni,
1987a,b; Tijani, 1993,1995), (Kumasi et al., 2001) References should be listed at the end of the paper in alphabetical order. Articles in preparation or articles submitted for publication, unpublished observations, personal communications, etc. should not be included in the reference list but should only be mentioned in the article text (e.g., A. Kingori, University of Nairobi, Kenya, personal communication). Journal names are abbreviated according to Chemical Abstracts. Authors are fully responsible for the accuracy of the references.
Examples:
Chikere CB, Omoni VT and Chikere BO (2008). Distribution of potential nosocomial pathogens in a hospital environment. Afr. J. Biotechnol. 7: 3535- 3539.
Moran GJ, Amii RN, Abrahamian FM, Talan DA (2005). Methicillinresistant Staphylococcus aureus in community-acquired skin infections. Emerg. Infect. Dis. 11: 928-930.
Pitout JDD, Church DL, Gregson DB, Chow BL, McCracken M, Mulvey M, Laupland KB (2007). Molecular epidemiology of CTXM-producing Escherichia coli in the Calgary Health Region: emergence of CTX-M-15-producing isolates. Antimicrob. Agents Chemother. 51: 1281-1286.
Pelczar JR, Harley JP, Klein DA (1993). Microbiology: Concepts and Applications. McGraw-Hill Inc., New York, pp. 591-603.
Short Communications
Short Communications are limited to a maximum of two figures and one table. They should present a complete study that is more limited in scope than is found in full-length papers. The items of manuscript preparation listed above apply to Short Communications with the following differences: (1) Abstracts are limited to 100 words; (2) instead of a separate Materials and Methods section, experimental procedures may be incorporated into Figure Legends and Table footnotes; (3) Results and Discussion should be combined into a single section. Proofs and Reprints: Electronic proofs will be sent (e-mail attachment) to the corresponding author as a PDF file. Page proofs are considered to be the final version of the manuscript. With the exception of typographical or minor clerical errors, no changes will be made in the manuscript at the proof stage.

Fees and Charges: Authors are required to pay a $650 handling fee. Publication of an article in the Journal of Public Health and Epidemiology is not contingent upon the author's ability to pay the charges. Neither is acceptance to pay the handling fee a guarantee that the paper will be accepted for publication. Authors may still request (in advance) that the editorial office waive some of the handling fee under special circumstances.
Copyright: © 2013, Academic Journals. All rights Reserved. In accessing this journal, you agree that you will access the contents for your own personal use but not for any commercial use. Any use and or copies of this Journal in whole or in part must include the customary bibliographic citation, including author attribution, date and article title.
Submission of a manuscript implies: that the work described has not been published before (except in the form of an abstract or as part of a published lecture, or thesis) that it is not under consideration for publication elsewhere; that if and when the manuscript is accepted for publication, the authors agree to automatic transfer of the copyright to the publisher.
Disclaimer of Warranties In no event shall Academic Journals be liable for any special, incidental, indirect, or consequential damages of any kind arising out of or in connection with the use of the articles or other material derived from the JPHE, whether or not advised of the possibility of damage, and on any theory of liability. This publication is provided "as is" without warranty of any kind, either expressed or implied, including, but not limited to, the implied warranties of merchantability, fitness for a particular purpose, or non-infringement. Descriptions of, or references to, products or publications does not imply endorsement of that product or publication. While every effort is made by Academic Journals to see that no inaccurate or misleading data, opinion or statements appear in this publication, they wish to make it clear that the data and opinions appearing in the articles and advertisements herein are the responsibility of the contributor or advertiser concerned. Academic Journals makes no warranty of any kind, either express or implied, regarding the quality, accuracy, availability, or validity of the data or information in this publication or of any other publication to which it may be linked.
InternatiTabal Journal of Medicine and Medical Sciences
Journal of Public Health and Epidemiology
Table of Content: Volume 5 Number 9 September 2013
ARTICLES
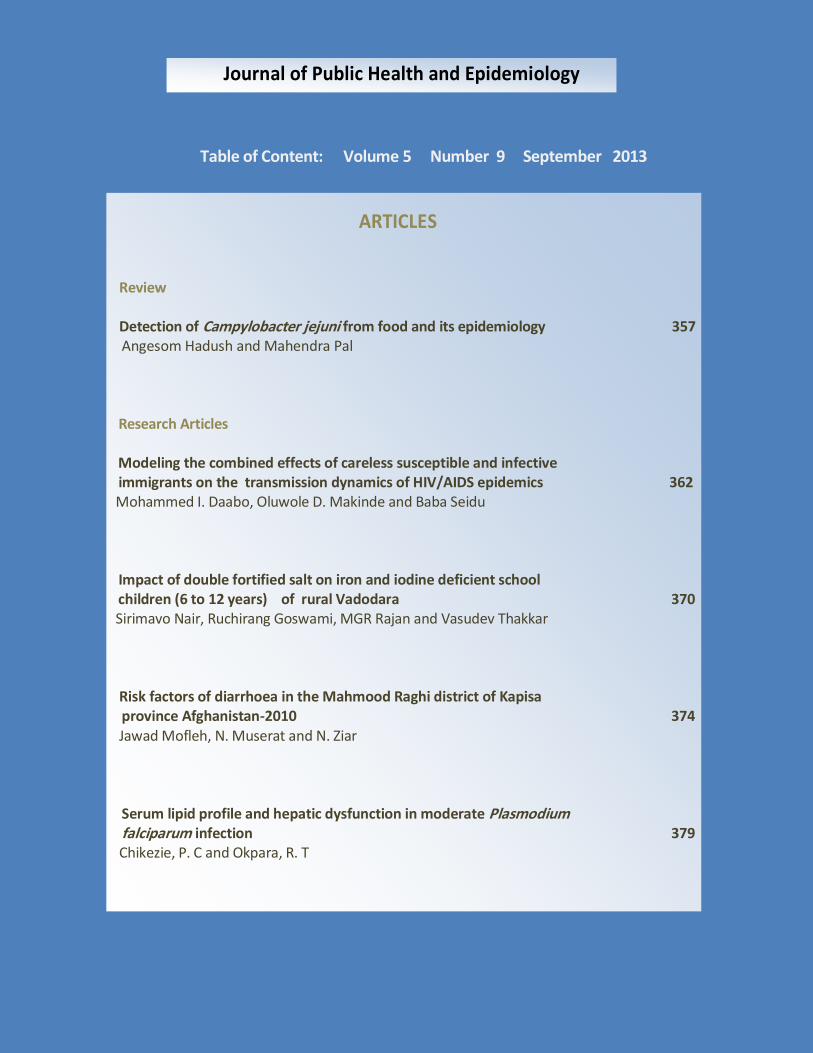
Review Detection of Campylobacter jejuni from food and its epidemiology 357 Angesom Hadush and Mahendra Pal Research Articles Modeling the combined effects of careless susceptible and infective immigrants on the transmission dynamics of HIV/AIDS epidemics 362 Mohammed I. Daabo, Oluwole D. Makinde and Baba Seidu Impact of double fortified salt on iron and iodine deficient school children (6 to 12 years) of rural Vadodara 370 Sirimavo Nair, Ruchirang Goswami, MGR Rajan and Vasudev Thakkar Risk factors of diarrhoea in the Mahmood Raghi district of Kapisa province Afghanistan-2010 374 Jawad Mofleh, N. Muserat and N. Ziar Serum lipid profile and hepatic dysfunction in moderate Plasmodium falciparum infection 379 Chikezie, P. C and Okpara, R. T
Journal of Public Health and Epidemiology
Table of Content: Volume 5 Number 9 September 2013
ARTICLES
Research Articles
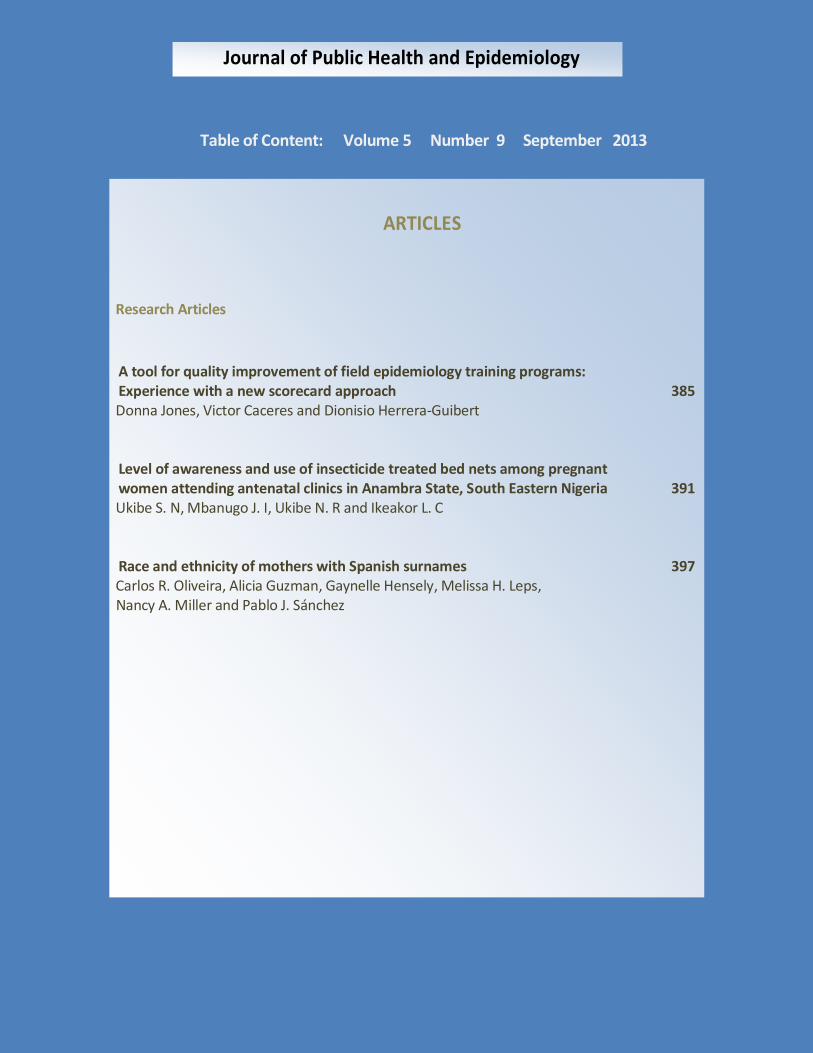
A tool for quality improvement of field epidemiology training programs: Experience with a new scorecard approach 385 Donna Jones, Victor Caceres and Dionisio Herrera-Guibert Level of awareness and use of insecticide treated bed nets among pregnant women attending antenatal clinics in Anambra State, South Eastern Nigeria 391 Ukibe S. N, Mbanugo J. I, Ukibe N. R and Ikeakor L. C Race and ethnicity of mothers with Spanish surnames 397 Carlos R. Oliveira, Alicia Guzman, Gaynelle Hensely, Melissa H. Leps, Nancy A. Miller and Pablo J. Sánchez

Vol. 5(9), pp. 357-361, September, 2013
DOI: 10.5897/JPHE2013.0537
ISSN 2141-2316 ©2013 Academic Journals
http://www.academicjournals.org/JPHE
Journal of Public Health and Epidemiology
Review
Detection of Campylobacter jejuni from food and its epidemiology
Angesom Hadush1,2* and Mahendra Pal1
1Department of Microbiology, Immunology, Epidemiology and Public Health, College of Veterinary Medicine and
Agriculture, Addis Ababa University, P.O.Box.34, Debre Zeit, Ethiopia. 2Samara University, Faculty of Veterinary Medicine, P.O. Box 132, Samara, Ethiopia.
Accepted 14 August, 2013
Food borne campylobacteriosis is distributed all over the world. Large outbreaks have been associated with consuming raw or inadequately pasteurized milk and contaminated water. Campylobacter jejuni is not an environmental organism rather zoonotic organism. It habituates intestinal tract of a wide range of warm blooded animals. The principal route by which C. jejuni contaminates the food is through fecal contamination by C. jejuni infected carriers. Raw meats and poultry become contaminated during processing when intestinal contents contact the meat surfaces. C. jejuni is one of the most common causes of bacterial diarrhoeal disease worldwide. As an alternative to growth on agar, there are a variety of technologies which may provide rapid diagnostic results such as immunoassay methods; molecular methods such as polymerase chain reaction (PCR)/nucleic acid techniques which reduce the time to result such as concentration using cell separation. Campylobacter impedes the public health problem and incurs severe economic losses in industries processing food of animal origin. Reinforcing hygienic practices at each link in the food chain from producer to consumers is critical in preventing the disease. Key words: Campylobacter jejuni, food, poultry, public health.
INTRODUCTION Awareness of the public health implications of Campylobacter infections has evolved over more than a century. In 1886, Escherich observed organisms resembling campylobacters in stool samples of children with diarrhea. In 1913, McFaydean and Stockman identified campylobacters called related Vibrio in fetal tissues of aborted sheep. In 1957, King described the isolation of related Vibrio from blood samples of children with diarrhea, and in 1972, clinical microbiologists in Belgium first isolated campylobacters from stool samples of patients with diarrhea. The development of selective
growth media in the 1970s permitted more laboratories to test stool specimens for Campylobacter. Soon, Campylobacter species were established as common human pathogens. Campylobacter jejuni infections are now the leading cause of bacterial gastroenteritis reported in the United States (Sean et al., 1999).
C. jejuni can colonize the intestinal tract of most mammals and birds and are the most frequently isolated Campylobacter species in humans with gastro-enteritis. Transmission from animals to humans is mainly through consumption and handling of contaminated animal food
*Corresponding author. E-mail: [email protected].
358 J. Public Health Epidemiol. products particularly poultry and improperly treated water but also direct contact with carrier animals may contribute to human campylobacteriosis (Sean et al., 1999).
C. jejuni does not cause clinical disease in adult animals except for sporadic cases of abortion in ruminants and very rare cases of hepatitis in ostriches. In humans, extra intestinal infections, including bacteraemia, can occur and some sequelae of infection, such as polyneuropathies, though rare, can be serious (Stern, 1992). The faecal contamination of meat, especially poultry meat, during processing is considered to be a major source of human food-borne disease. Hence the objective of this paper is to assess the detection methods of C. jejuni from food and its epidemiology. GLOBAL OCCURRENCE Food borne campylobacteriosis is distributed all over the world. Large outbreaks have been associated with consuming raw meat or inadequately pasteurized milk and contaminated water. The greatest incidence of C. jejuni infection is seen in infants, young adults and immune compromised groups. There is also a seasonal trend in incidence that is highest in spring/early summer (mid-June and mid-July) due to informal eating outside, such as barbecues, coupled with an increase in temperature and agricultural activities (Mandrell et al., 2006). Epidemiological studies showed that cross contaminations during defeathering/skinning and evisceration play important roles in the occurrence of campylobacteriosis in poultry (Pamuk and Akgun, 2009). Wild birds are considered to be an important reservoir of infection for domestic and food animals as well as poultry which is a natural host for Campylobacter. C. jejuni is not an environmental organism rather zoonotic organism. It habituates intestinal tract of a wide range of warm blooded animals like birds, cattle, sheep, pigs, goats and domestic pets, (especially puppies and kittens) (Doyle and Beuchat, 2007). Campylobacter species can also colonize the reproductive organs and oral cavities of animals and humans. Etiology C. jejuni is Gram negative, oxidase and catalase positive, non spore forming, spiral in shape, with corkscrew like darting motility. It possesses a single polar flagellum and belongs to the family Campylobacteriaceae (Rollins and Joseph, 2001). The genus Campylobacter consists of 16 species. The commonest human pathogens are C. jejuni, Campylobacter coli and Campylobacter lari. The most significant pathogens, C. jejuni and C. coli can only grow
at temperatures above 30°C and are called thermophilic with optimum growth temperature of 42 to 43°C. Campylobacter is microaerophilic and will grow best at an atmosphere of 10% carbon dioxide, 56% oxygen and some amount of hydrogen (Doyle and Beuchat, 2007). Transmission The principal route by which Campylobacter contaminates the food is through fecal contamination by Campylobacter infected carriers. Raw meats and poultry become contaminated during processing when intestinal contents contact the meat surfaces. Mostly human campylobacteriosis are associated with handling of raw poultry, undercooked contaminated meat, cross contamination of raw and cooked foods and poor hygiene (Suzuki and Yamamoto, 2009). Feco-oral person to person transmission of infection has been reported for C. jejuni. This uncommon type of transmission can occur when personal hygiene is poor. Humans act as vectors transferring the organism into poultry production area with contaminated clothing and foot wear (Doyle and Beuchat, 2007). Pathogenesis The pathogenesis of Campylobacteriosis is not fully understood. The diarrheal disease may be due to the production of a heat-liable toxin. The flagellum which has a coded flagellin gene (flaA) enables the bacterium to reach the attachment sites in the intestine. The pathogenesis involves host and pathogen specific factors, the health and age of the host and pathogen specific humoral immunity from previous exposure which influence clinical outcome after infection (Konkel et al., 2004). Several putative virulence factors have been identified in Campylobacter which contribute to the motility, intestinal adhesion, colonization, toxin production and invasion. Adhesion of the pathogen to the intestinal epithelium is important for colonization and to increase the secretion of bacterial toxins (Thakur et al., 2010). Clinical signs The illness caused by C. jejuni is not easily distinguished from other types of gastro intestinal disease (GIT). Clinical signs vary widely from mild to quite severe illness and usually last for 1 to 7 days, but sometimes for several weeks. Abdominal pain can persist for up to 7 days and recurrence of symptoms can occur. The illness may start with cramping abdomen, diarrhea, fever, chills, headache, myalgia and occasionally delirium, with typical

. more intense long lasting abdominal pain and occasionally blood or mucous in the stool (Doyle and Beuchat, 2007). Treatment The majority of Campylobacter infections are sporadic and self-limiting which makes difficulty to accurately determine the true incidence rate; due to this, antimicrobials are usually not recommended except in severe cases (Yates 2005). For treating Campylobacter infections, fluoroquinolones (e.g., ciprofloxacin) and macrolides (e.g., erythromycin) are the drugs of choice; however, treatment with erthryomycin does reduce the length of excretion. The frequency of resistance to these important classes of antimicrobials has reported to be on the rise in the United States and globally (Rozynek et al., 2008). PUBLIC HEALTH SIGNIFICANCE Thermophilic Campylobacter species have received considerable attention in recent years as a major cause of bacterial enteritis in man. Campylobacter enteritis is recognized as an important source of diarrheal illness worldwide. The pathogen is also an important causative agent of ‘traveler diarrhea’ accompanied by predisposing debilitating factors such as pregnancy, premature birth, chronic alcoholism, neoplasia and cardiovascular disease (Mandrell et al., 2006). Campylobacteriosis affects all age groups; however, infections are recognized with increas-ing frequencies in infants, children, aged individuals, and immune-compromised persons. According to the Centre for Disease Control (CDC) report, Campylobacter infections accounted for approximately one-third of laboratory confirmed food borne illness that occurred globally in food net surveillance areas (CDC, 2008). A serious consequence of diarrheal diseases in human is called Guillain-Barrè syndrome (GBS) which is characterized by polyneuritis of the peripheral nerves that may lead to either short term or lengthy paralysis. GBS, a demyelating disorder resulting in acute neuromuscular paralysis, is serious sequelae of Campylobacter infection (Shane, 2000). ECONOMIC SIGNIFICANCE Campylobacteriosis cause severe economic loses both in the public health and food industry sector. Campylobacteriosis has an enormous economic impact in terms of treatment costs, lost of production, and human welfare. In livestock, particularly sheep and cattle,
Hadush and Pal 359 Campylobacter species are the cause of important economic losses associated with infertility problems and abortion (Beatriz and Ana, 2011). Control and prevention C. jejuni grows easily if contaminated foods are left out at room temperature; however, the bacterium is sensitive to heat and sterilization methods like pasteurization of milk, cooking meat, and water chlorination. To prevent Campylobacter infection, make sure that any poultry products are cooked at 74°C and choose the coolest part of the car for transportation of meat and poultry as well as defrost meat and poultry in the refrigerator and never leave food at room temperature for over two hours, wash hands after contact with pets or farm animals (Doyle and Beuchat, 2007). Detection of C. jejuni from food C. jejuni is one of the most common causes of bacterial diarrhoeal disease worldwide. This significant zoonotic pathogen is reported to have a low infective dose with high pathogenicity. Poultry and poultry products have long been associated with campylobacter infection, though a variety of food materials and other vectors have been implicated in the transmission such as unpasteurized milk, and water (Bang et al., 2001). Evaluation of food samples for the presence of Campylobacter can be challenging. Isolation of the organism from highly-contaminated samples may require different media depending on the food type and with incubation under microaerobic conditions. They are not the fastest growing organisms in which it can take up to a week to obtain a final test result (Bang et al., 2001). DETECTION TECHNIQUES In food and feedstuffs, sample is added to selective enrichment broths which can be obtained as base powder to which supplements may be added or ready-to-use formats. These are incubated at 37°C for 4 h and then at 41.5°C for 44 h. Selective agars either in powder format or ready-to-use are inoculated from this enrichment and incubated for a further 48 h. Clinical samples are sub-cultured directly to selective agars. Incubation atmosphere is critical for recovery of Campylobacter, microaerophilic conditions must be provided. Several proprietary atmosphere systems are available for this purpose. During the broth enrichment, a 10 to 15% aerobic headspace is sufficient (Martin et al., 2002). As an alternative to growth on agar, there are a
360 J. Public Health Epidemiol. variety of technologies which may provide rapid results such as antibody/antigen interactions using immunoassay methods; molecular methods such as PCR/nucleic acid techniques which reduce the time to result such as concentration using cell separation. Sometimes combinations of these techniques are used to further enhance the speed to result. PCR can eliminate the need for identification in the event of a positive result and may also provide quantitative information. Quality control organisms are available to ensure that method performance is within standard criteria (Martin et al., 2002). Sample preparation and processing Samples are collected using sterile instruments, under aseptic condition. 25 g sample of food is put into a sterile stomacher bag, mixed with Bolton broth nine times the weight or volume. This is homogenized for 2 min to get homogenized sample (NSM, 2007). Surface rinse technique This is done by rinsing the surface of the sample then shaking or massaging it with 250 ml of nutrient broth (without agar) in a sterile plastic bag and filtering through two layers of cheese cloth and centrifuging the filtrate at 16,000 rps for 20 min. Finally, supernatant fluid is discarded and the pellet is suspended in a minimum (2 to 5 ml) cubic volume of pre-enrichment broth (NSM, 2007). Swab technique This is done by dipping a sterile swab into an enrichment broth and pressing the swab against the container wall to remove excess moisture. The carcass is then swabbed with the moist swab and the swab is put in pre-enrichment broth to incubate at 37°C for 4 to 6 h. There is no statistically significant difference in the isolation rates of Campylobacter species on carcass in different swabbing sites (Woldemariam et al., 2009). Recognition of colonies The plates should be examined as quickly as possible after removal from microaerobic environment for characterization. C. jejuni has gray/moist flat, glossy, effuse colony with a tendency to spread along the inoculation track having well spaced colonies resembling droplets of fluid and on moist agar a thin, spreading film and with continued incubation colonies become convex
often with a dull surface (NSM, 2007). Confirmatory tests For oxidase test, immerse a swab in freshly prepared oxidase reagent and touch lightly the surface of the colony to be tested, the immediate appearance (in 10 s) of a dark purple color at the point of contact denotes a positive reaction which confirms C. jejuni. For microaerobic growth test, subculture suspected colonies from Campylobacter selective agar into two blood agar plates, then incubate one plate in microaerobic condition and the other aerobically at 41.5 ± 1°C to 22 ± 1 h. The growth in micro-aerobically incubated plates and no growth in aerobic conditions in line with other tests confirm the test (Chaban et al., 2010). As optional, cell morphology and motility tests can also be used by preparing a wet preparation and using phase contrast microscope. If Campylobacter species are present, there will be highly motile, slender rods with curved morphology and a characteristic darting or corkscrew like movement. Agglutination under normal lighting conditions indicates that the test organism is C. jejuni (Chaban et al., 2010). CONCLUSION Campylobacter species are the common bacterial pathogens causing gastroenteritis in both human and animals throughout the world. Raw meat from food animals could serve as potential source of C. jejuni indicating possible risks of infection to people. Consumption of poultry meat is suspected to be the leading causes of illness followed by ruminants’ meat, unpasteurized milk, contaminated water and animal contact. In slaughter houses, contamination of carcasses occurs during dressing, skinning, evisceration and further meat processing steps. Campylobacter infection impedes the public health problem and incurs severe economic losses in industries processing food of animal origin. Reinforcing hygienic practices at each link in the food chain from producer to consumers is critical in preventing the disease. REFERENCES
Bang DD, Pedersen K and Madsen M (2001). Development of a PCR
assay suitable for Campylobacter species mass screening programs in broiler production. J. Rapid methods and automation in microbial. 9:97–113.
Beatriz O, Ana H (2011). Emerging Thermo Tolerant Campylobacter Species in Healthy Ruminants and Swine. Department of Animal Health, NEIKER-Instituto Vasco de Investigacio´n y Desarrollo Agrario, Derio, Bizkaia, Spain. Foodborne pathogenes and Disaeses 8:1-8.

CDC (2008). Preliminary Food net data on the incidence of infection
with pathogens transmitted commonly through food in 10 states, Centers for Disease Control and Prevention. Morbidity and Mortality Weekly Report 57:366–370.
Chaban B, Ngeleka M, Hill E (2010). Detection and quantification of 14 Campylobacter species in pet dogs reveals an increase in species richness in feces of diarrheic animals. BioMed. Central Microbiol. 10:73.
Doyle P, Beuchat R (2007). Food Microbiology. Fundamentals and Frontiers 3
rd Edition.Washington DC. ASM Press pp. 817-836.
Konkel E, Klena D, Rivera-Amill V, Monteville R (2004). Secretion of virulence proteins from Campylobacter jejuni is dependent on a functional flagellar export apparatus. J. Bacteriology 186:3296–3303.
Mandrell E, Miller G, Motarjemi Y, Adams C (2006). Campylobacter. In: Emerging foodborne pathogens. Woodhead Publishing Ltd pp. 476-521.
Martin KW, Mattick KL, Harrison M, Humphrey TJ (2002). Evaluation of selective media for Campylobacter isolation when cycloheximide is replaced with amphotericin B. Letters in Applied Microbiology 34:124–129.
NSM (2007). National Standard Methods, QSOP 49. Safe use of plastic bags for incubation of food samples, London. Health Protection Agency pp. 1-12.
Pamuk S, Akgun S (2009). Detection of thermophilic Campylobacter species in unpacked broiler carcasses in retail markets of Afyonkarahisar and confirmation C. jejuni isolates using PCR. J. Animal and Veterinary Advances 8:2063-2068.
Rollins M, Joseph W (2001). Campylobacter, the new leader in food-borne disease: Aetiology. Reviews on Med. Microbiol. 12:187-198.
Rozynek E, Dzierzanowska-Fangrat K, Korsak D (2008). Comparison of antimicrobial resistance of C. jejuni and C. coli isolated from humans and chicken carcasses in Poland. J. Food Protection 71:602–607.
Hadush and Pal 361 Sean F, Norman J, Patricia I, David L (1999). Campylobacter jejuni- an
emerging food borne pathogen. Virginia, USA. Emerging Infect. Dis. J. 5:28-33.
Shane M (2000). Campylobacter infection of commercial poultry. Review on Scientific Techniques 19:376–395.
Stern N (1992). Comparison of three methods for recovery of Campylobacter species from broiler carcasses. J. Food Protection 55:663-666.
Suzuki H, Yamamoto S (2009). Campylobacter contamination in retail poultry meats and by-products in Japan: A literature Survey of Food Control 20:531-537.
Thakur S, Zhao S, McDermott P, Harbottle H, Abbott J, English L, Wondwossen AG, White D (2010). Antimicrobial resistance, virulence, and genotypic profile comparison of C. jejuni and C. coli isolated from humans and retail meats. Mary Ann Liebert publishers 7:835-844.
Woldemariam T, Asrat D, Zewde G (2009). Prevalence of Thermophilic Campylobacter species in carcasses from sheep and goats in an abattoir in Debre Zeit area, Ethiopia. Ethiopian J. Health Development 23:229-233.
Yates J (2005). Traveler’s diarrhea. American Family Physician 71:2095–2100.

Vol. 5(9), pp. 362-369, September, 2013
DOI: 10.5897/JPHE12.092
ISSN 2141-2316 ©2013 Academic Journals
http://www.academicjournals.org/JPHE
Journal of Public Health and Epidemiology
Full Length Research Paper
Modeling the combined effects of careless susceptible and infective immigrants on the transmission dynamics
of HIV/AIDS epidemics
Mohammed I. Daabo1, Oluwole D. Makinde2 and Baba Seidu3*
1Wisconsin International University College, Accra, Ghana. 2Cape Peninsula University of Technology, South Africa.
3University for Development Studies, Navrongo, Ghana.
Accepted 14 August, 2013
In this paper, a non-linear mathematical model was proposed to study the combined effect of irresponsible infectives and irresponsible susceptible immigrants on the spread of human immunodeficiency virus/acquired immune deficiency syndrome (HIV/AIDS) in a variable size population. The paper discussed biological feasibility of the model and also presents the basic reproductive number of the model. Also, the equilibrium points of the model are found, and stability of the model around the equilibria was also studied. It is realized that at the disease free equilibrium, the model is stable when R0 < 0 and unstable otherwise. Also, the condition for asymptotical stability of the model near the endemic equilibrium is presented. Numerical simulations reveal that the presence of infective immigrants significantly affects the spread of the disease and that behavioral change of all classes of individuals should be considered in efforts aimed at controlling the spread of the disease. Key words: Acquired immune deficiency syndrome (AIDS) epidemic, vertical transmission, stability, infective immigrants, simulation.
INTRODUCTION One of the many diseases that have gained attention throughout the world today is the human immunodeficiency virus infection (HIV). It has attracted the attention of many individuals, corporate organizations and governments since its prevalence has greatly increased all over the world, especially Africa. HIV is transmitted through unsafe sexual contact with an infected individual, transfusion with contaminated blood, injection with an infected needle among others. HIV can lead to acquired immunodeficiency syndrome (AIDS) which renders the immune system defenseless to many opportunistic infections.
Mathematicians, among the groups that have taken much interest in the spread of the disease, have proposed many mathematical models that can help in the better understanding of the spread of the disease and the effects of various factors that affect the spread. Since the initial models of Anderson et al. (1986), many other models and their refinements have been proposed by mathematical modelers to study HIV/AIDS (De Arazoza and Lounes, 2002; Busenberg et al., 1995). In particular, Anderson et al., (1986) proposed a model to study the effects of some factors on patterns of AIDS. Naresh and Tripathi (2005) studied the spread of HIV infection in a
*Corresponding author. E-mail: [email protected].
population in the presence of tuberculosis. The effect of use of condoms on the transmission of HIV/AIDS was studied by Greenhalgh et al. (2001). The effect of screening of unaware infectives on the spread of HIV infection was studied by Tripathi et al. (2007). Karrakchou et al. (2006) presented an optimal methodology for administering ant-viral medication therapies to HIV infection. Baryarama et al. (2005) presented an HIV/AIDS model with variable force of infection for the adult population. Ying-Yen and Cooke (2000) studied a model on change of behavior and treatment of core groups and its effect on the spread of HIV/AIDS and found out that change of behavior can help in the control of the spread of the disease.
It is noteworthy here that the attitude towards sex and other modes of transmission of HIV can play a major role in spreading the disease. In the world today, many people, especially in Africa and Asia, are ignorant of their HIV status due to illiteracy despite the many campaigns that encourage people to do the test. These people and those who even though are aware they are infected but behave in ways that will increase the spread of the disease can be considered careless. These careless people can play a very important role in the spread of the disease. Not much research has been done to study the effect of people with different behaviors towards HIV/AIDS on the spread of the canker (Tripathi et al., 2007; Daabo and Baba, 2012; Daabo et al., 2012).
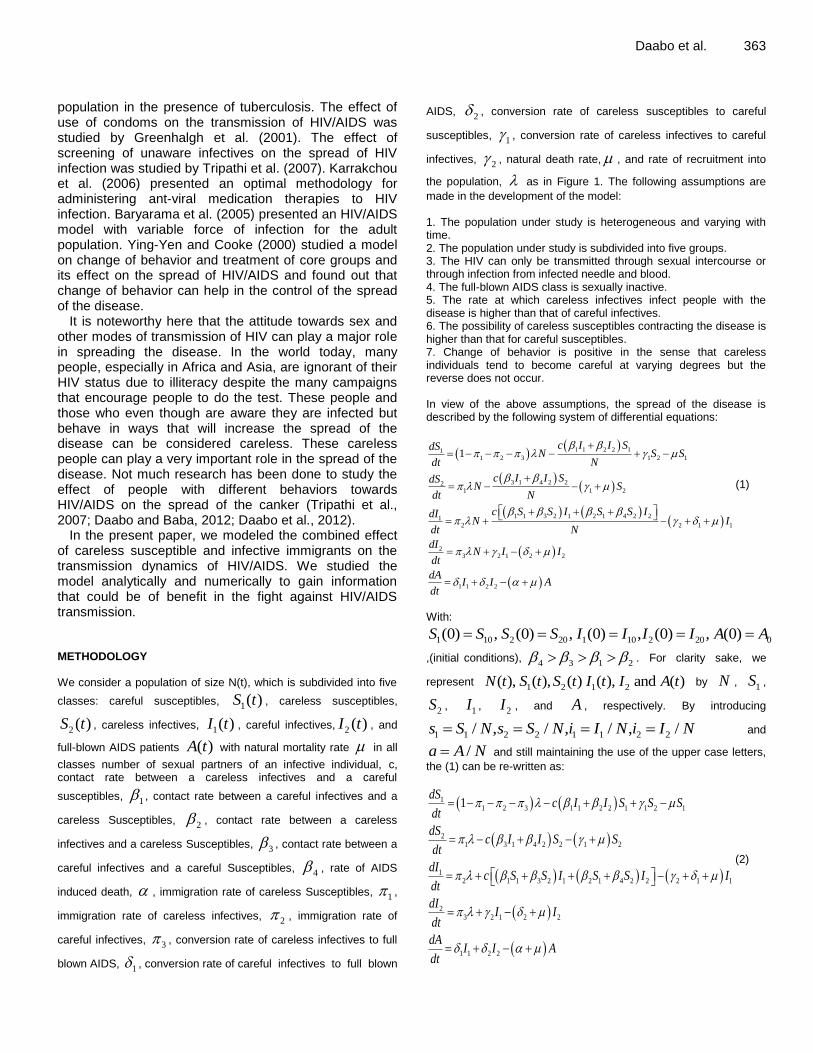
In the present paper, we modeled the combined effect of careless susceptible and infective immigrants on the transmission dynamics of HIV/AIDS. We studied the model analytically and numerically to gain information that could be of benefit in the fight against HIV/AIDS transmission. METHODOLOGY We consider a population of size N(t), which is subdivided into five
classes: careful susceptibles, 1( )S t , careless susceptibles,
2 ( )S t , careless infectives, 1( )I t , careful infectives, 2 ( )I t , and
full-blown AIDS patients ( )A t with natural mortality rate in all
classes number of sexual partners of an infective individual, c, contact rate between a careless infectives and a careful
susceptibles, 1 , contact rate between a careful infectives and a
careless Susceptibles, 2 , contact rate between a careless
infectives and a careless Susceptibles, 3 , contact rate between a
careful infectives and a careful Susceptibles, 4 , rate of AIDS
induced death, , immigration rate of careless Susceptibles, 1 ,
immigration rate of careless infectives, 2 , immigration rate of
careful infectives, 3 , conversion rate of careless infectives to full
blown AIDS, 1 , conversion rate of careful infectives to full blown
Daabo et al. 363
AIDS, 2 , conversion rate of careless susceptibles to careful
susceptibles, 1 , conversion rate of careless infectives to careful
infectives, 2 , natural death rate, , and rate of recruitment into
the population, as in Figure 1. The following assumptions are
made in the development of the model: 1. The population under study is heterogeneous and varying with time. 2. The population under study is subdivided into five groups. 3. The HIV can only be transmitted through sexual intercourse or through infection from infected needle and blood. 4. The full-blown AIDS class is sexually inactive. 5. The rate at which careless infectives infect people with the disease is higher than that of careful infectives. 6. The possibility of careless susceptibles contracting the disease is higher than that for careful susceptibles. 7. Change of behavior is positive in the sense that careless individuals tend to become careful at varying degrees but the reverse does not occur. In view of the above assumptions, the spread of the disease is described by the following system of differential equations:
1 1 2 2 111 2 3 1 2 1
3 1 4 2 221 1 2
1 1 3 2 1 2 1 4 2 212 2 1 1
23 2 1 2 2
1 1 2 2
1c I I SdS
N S Sdt N
c I I SdSN S
dt N
c S S I S S IdIN I
dt N
dIN I I
dt
dAI I A
dt
(1)
With:
1 10 2 20 1 10 2 20 0(0) , (0) , (0) , (0) , (0)S S S S I I I I A A
,(initial conditions), 4 3 1 2 . For clarity sake, we
represent 1 2 1 2( ), ( ), ( ) ( ), and ( )N t S t S t I t I A t by N , 1S ,
2S , 1I , 2I , and A , respectively. By introducing
1 1 2 2 1 1 2 2/ , / , / , /s S N s S N i I N i I N and
/a A N and still maintaining the use of the upper case letters,
the (1) can be re-written as:
11 2 3 1 1 2 2 1 1 2 1
21 3 1 4 2 2 1 2
12 1 1 3 2 1 2 1 4 2 2 2 1 1
23 2 1 2 2
1 1 2 2
1dS
c I I S S Sdt
dSc I I S S
dt
dIc S S I S S I I
dt
dII I
dt
dAI I A
dt
(2)

364 J. Public Health Epidemiol.
Theorem 1: If 1 2 1 2(0), (0), (0), (0)S S I I and (0)A are non-
negative, then so are 1 2 1 2( ), ( ), ( ), ( )S t S t I t I t and ( )A t for all
0t . Moreover, lim
( )SupN tt
, where
1 2 1 2( )N S S I I A . Furthermore, if (0)N
,
then ( ) , 0N t t
. In particular, the region;
5
1 2 1 2 1 2 1 2( , , , , ) :S S I I A S S I I A
R
is positively invariant. This theorem implies that the dynamics of the
model 1 can be sufficiently studied in , in which the model can be considered mathematically and epidemiologically well-posed Hethcote (2000).
The basic reproduction number, 0R
The basic reproduction is one (in fact it is arguably the most widely used) of the parameters used to study the prevalence of infectious diseases in mathematical modeling. It is used because it gives information about the fate of a typical infectious individual that is introduced into a population that is entirely of susceptibles. It is defined as “the average number of new case of an infection caused by one typical infected individual, in a population consisting of susceptibles only'' (Diekmann et al., 2010). It is so important
because if 0 1R it means, during its infective life-span, a typical
infectious individual infects more than one susceptible leading
persistence of the disease in the population. If, however, 0 1R it
means, during its infective life-span, a typical infectious individual infects less than one susceptible leading eradication of the disease
in the population. For a history of the evolution of 0R , a recipe for
its calculation is shown according to Heesterbeek (2002) and
Heffernan et al. (2005). For a typical epidemiological model, 0R is
normally the largest eigenvalue of the next-generation matrix (Diekmann et al., 2010). With this method we obtained:
1 2 1 1 1
0
1 2 1
( ) ( )cR
, where:
2 2
1 1
2
and
4 22 3
2
.
Equilibria of the model In the long-run, there are two scenarios of the model; either the disease is eradicated (then we have a disease-free equilibrium) or the disease remains prevalent in the system (then we have an endemic equilibrium). At the disease-free equilibrium, there are no
infectives (that is, 1 2 2 3 0I I A ) and the
equilibrium point is 0 0
0 1 2( , ,0,0,0)E S S ,
Where 0 1 11
1
[ (1 ) ]
( )S
0 12
1
S
The endemic equilibrium is of the form * * * * * *
1 2 1 2( , , , , )E S S I I A
Where
*
2 1 2 3 4 3 2 1 3 2 4 1 1 2*
1 *
1 2 2 2 1 2 3 1 2
1 c c IS
c I c
1 2*
2 *
1 2 4 3 3 2 2 4 1
Sc c I
,
** 3 2 12
2
II
,
*
2 3 1 2 2 2 1*
2
IA
and
*
1I is the
positive non-zero real solution of the cubic equation * * 3 * 2 *
1 3 1 1 1 1 1 0( ) ( ) ( ) ( ) 0P I I I I
Where:
2
3 1 2 2 1c
2 2 1 1 0 2 1 1 4 1 2c c c c
1 1 1 1 2 1 3 1 4 1 0 1 4 1 0 2 3c c c c c
2 1 3 4 1 2 1 4 1 2c c c c
0 1 3 1 4 3 4 1 0 3 2 3c c c
0 1 2 31 , 2 3
3
2
and
4 34
2

Local stability analysis of the model
To study the local stability of the system (2), we linearize it at the equilibrium points. The Jacobian that linearizes the model is given by:
Daabo et al. 365
11 1 1 1 2 1
22 3 2 4 2
1 1 2 2 3 1 4 2 33 2 1 4 2
2 2
1 2
0
0 0
0
0 0 0
0 0
J c S c S
J c S c S
c I I c I I J c S S
Where: 11 1 1 2 2J c I I , 22 3 1 4 2 1J c I I , and 33 1 1 3 2 2 1J c S S
Evaluating the Jacobian matrix at the disease-free equilibrium gives:
1 1 1 2 1 1
1
1 1
3 1 4 11
1 1
33 0 34 0
2 2
1 2
1 10
0 0
0 0 ( ) ( ) 0
0 0 0
0 0
c c
c c
J E J E
(3) Where
1 1 1 3 1
33 2 1
1
1(0)
cJ
2 1 1 4 1
34 0
1
1( )
cJ E
The characteristic equation of the Jacobian is given by:
1 2 33 0 2 34 0( ) ( )( )( ) ( )( ( ) ) ( )f J E J E
All the first three eigenvalues of the Jacobian matrix have negative real parts. The remaining eigenvalues are solutions to the quadratic
equation 2 0A B , where:
1 2 1 2 1 1 1 3 1
1
2 1cA
and
2 1 2 1 1 1 1 3 1 2 2 1 1 4 1
1 1
1 1c cB
If 0 1R , then we have:
1 2 2 2 1 1 3 2 2 4 11c c 1 2 2 1
2 1 1 1 3 1 2 2 1 1 4 1 1 2 2 1( ) ((1 ) ) ((1 ) )c c
2 1 2 1 1 1 1 3 1 2 2 1 1 4 1( ) ((1 ) ) ((1 ) ) 0c c .
This implies that 0 and similarly 0 . Thus, if 0 1R ,
then 0 and all eigenvalues of the Jacobian matrix evaluated
at the disease-free equilibrium have negative real parts, making the disease-free equilibrium locally asymptotically stable.
If 0 1R then the model is locally asymptotically stable at the
disease-free equilibrium, if 0 1R then the disease-free
equilibrium point is an unstable point and if 0 1R then the
disease-free equilibrium point is a saddle. The Jacobian matrix of the model (1.2) evaluated at the endemic equilibrium is given by:
11 13 14
22 23 24
31 32 33 34
2 2
1 2
0
0 0
0
0 0 0
0 0
m m m m
m m m
m m m m
Where:
11 31 0m m ,
366 J. Public Health Epidemiol.
*
13 1 1 0m c S , *
14 2 1 0m c S ,
22 32 1m m , *
23 3 2 0m c S , *
24 4 2 0m c S
31 1 1 2 2 0m c I I , 32 3 1 4 2 0m c I I
33 13 23 2 1m m m
34 14 24 0m m m
The characteristic equation of the Jacobian at the endemic equilibrium is given by:
5 4 3 2
1 2 3 4 5( )f a a a a a
Where:
1 22 33 11 22a m m m
2
2 2 34 2 2 22 33 11 2 11 22 11 33 22 33 32 23 31 132a m m m m m m m m m m m m m m
3 31 14 11 22 34 32 24 2( )a m m m m m m m + 2
22 33 11 2 2m m m
22 33 11 22 33 31 13 32 23 2 31 1 23 22 33 32 23 11 31 22 13( 2 )m m m m m m m m m m m m m m m m m m m
4 32 24 22 34 11 34 31 14 2a m m m m m m m m 31 1 24 22 34 32 24 11 31 22 14 2m m m m m m m m m m
2
22 33 11 32 23 22 33 31 13 22m m m m m m m m m
31 1 23 22 33 32 23 11 31 22 13 2( 2 )m m m m m m m m m m
5 31 1 24 22 34 32 24 11 31 22 14 2( )a m m m m m m m m m m
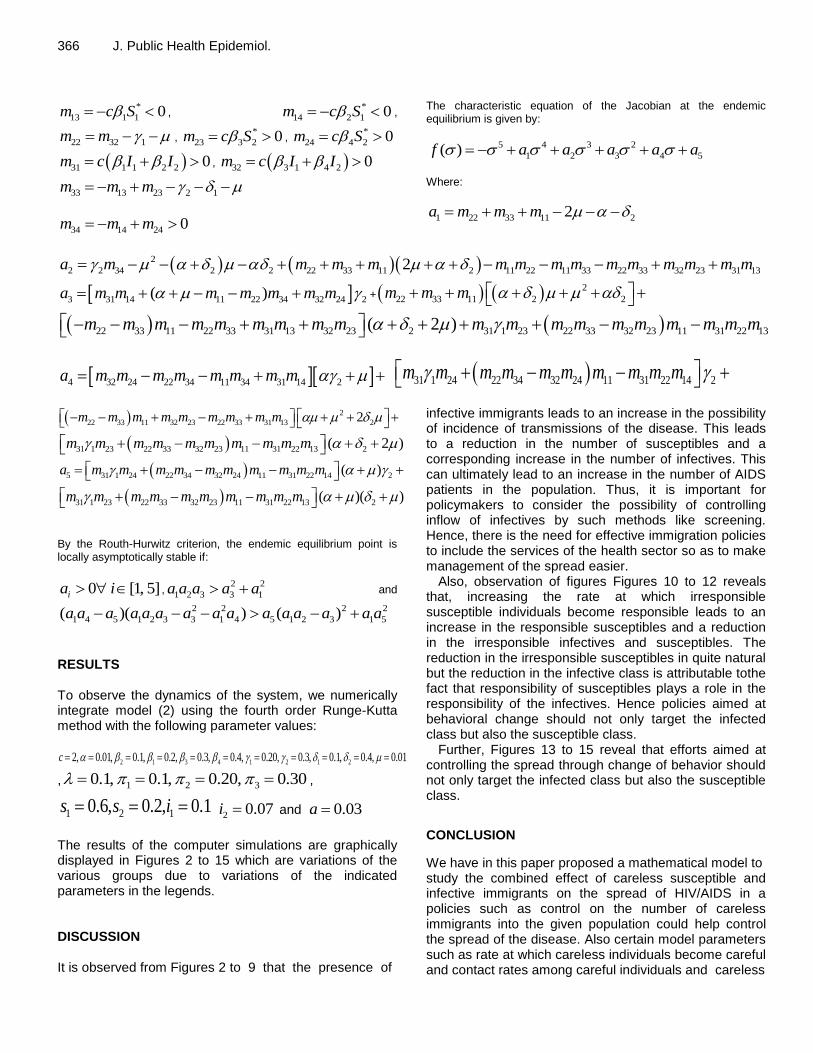
31 1 23 22 33 32 23 11 31 22 13 2( )( )m m m m m m m m m m By the Routh-Hurwitz criterion, the endemic equilibrium point is locally asymptotically stable if:
0 [1, 5]ia i ,2 2
1 2 3 3 1a a a a a and
2 2 2 2
1 4 5 1 2 3 3 1 4 5 1 2 3 1 5( )( ) ( )a a a a a a a a a a a a a a a
RESULTS To observe the dynamics of the system, we numerically integrate model (2) using the fourth order Runge-Kutta method with the following parameter values:
2 1 3 4 1 2 1 22, 0.01, 0.1, 0.2, 0.3, 0.4, 0.20, 0.3, 0.1, 0.4, 0.01c
, 1 2 30.1, 0.1, 0.20, 0.30 ,
1 2 10.6, 0.2, 0.1s s i 2 0.07i and 0.03a
The results of the computer simulations are graphically displayed in Figures 2 to 15 which are variations of the various groups due to variations of the indicated parameters in the legends. DISCUSSION It is observed from Figures 2 to 9 that the presence of
infective immigrants leads to an increase in the possibility of incidence of transmissions of the disease. This leads to a reduction in the number of susceptibles and a corresponding increase in the number of infectives. This can ultimately lead to an increase in the number of AIDS patients in the population. Thus, it is important for policymakers to consider the possibility of controlling inflow of infectives by such methods like screening. Hence, there is the need for effective immigration policies to include the services of the health sector so as to make management of the spread easier.
Also, observation of figures Figures 10 to 12 reveals that, increasing the rate at which irresponsible susceptible individuals become responsible leads to an increase in the responsible susceptibles and a reduction in the irresponsible infectives and susceptibles. The reduction in the irresponsible susceptibles in quite natural but the reduction in the infective class is attributable tothe fact that responsibility of susceptibles plays a role in the responsibility of the infectives. Hence policies aimed at behavioral change should not only target the infected class but also the susceptible class.
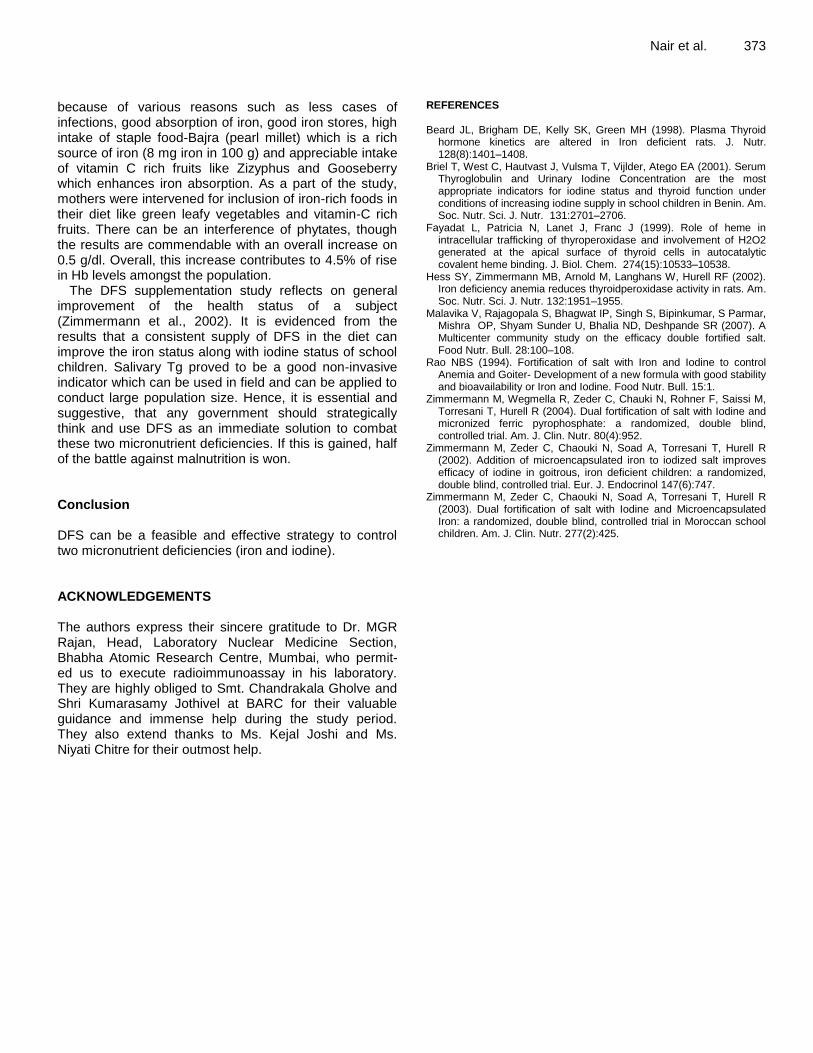
Further, Figures 13 to 15 reveal that efforts aimed at controlling the spread through change of behavior should not only target the infected class but also the susceptible class.
CONCLUSION
We have in this paper proposed a mathematical model to study the combined effect of careless susceptible and infective immigrants on the spread of HIV/AIDS in a policies such as control on the number of careless immigrants into the given population could help control the spread of the disease. Also certain model parameters such as rate at which careless individuals become careful and contact rates among careful individuals and careless

Figure 1. Flowchart of proposed model.
Figure 2. Variation of Population of Careful Susceptibles for
different values of 2
Figure 3. Variation of Population of Careless Susceptibles
for different values of 2
Daabo et al. 367
Figure 4. Variation of Population of Careless Infectives
for different values of 2
Figure 5. Variation of Population of Careful Infectives for
different values of 2
Figure 6. Variation of Population of Careful Susceptibles
for different values of 3
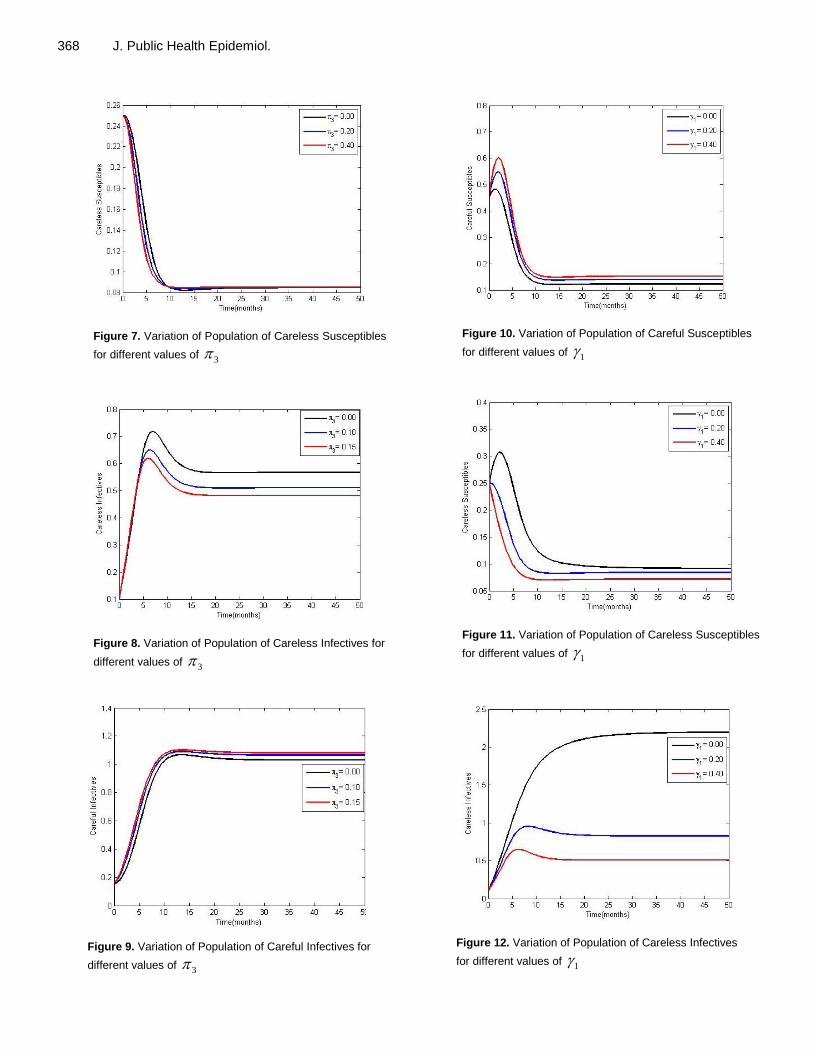
368 J. Public Health Epidemiol.
Figure 7. Variation of Population of Careless Susceptibles
for different values of 3
Figure 8. Variation of Population of Careless Infectives for
different values of 3
Figure 9. Variation of Population of Careful Infectives for
different values of 3
Figure 10. Variation of Population of Careful Susceptibles
for different values of 1
Figure 11. Variation of Population of Careless Susceptibles
for different values of 1
Figure 12. Variation of Population of Careless Infectives
for different values of 1
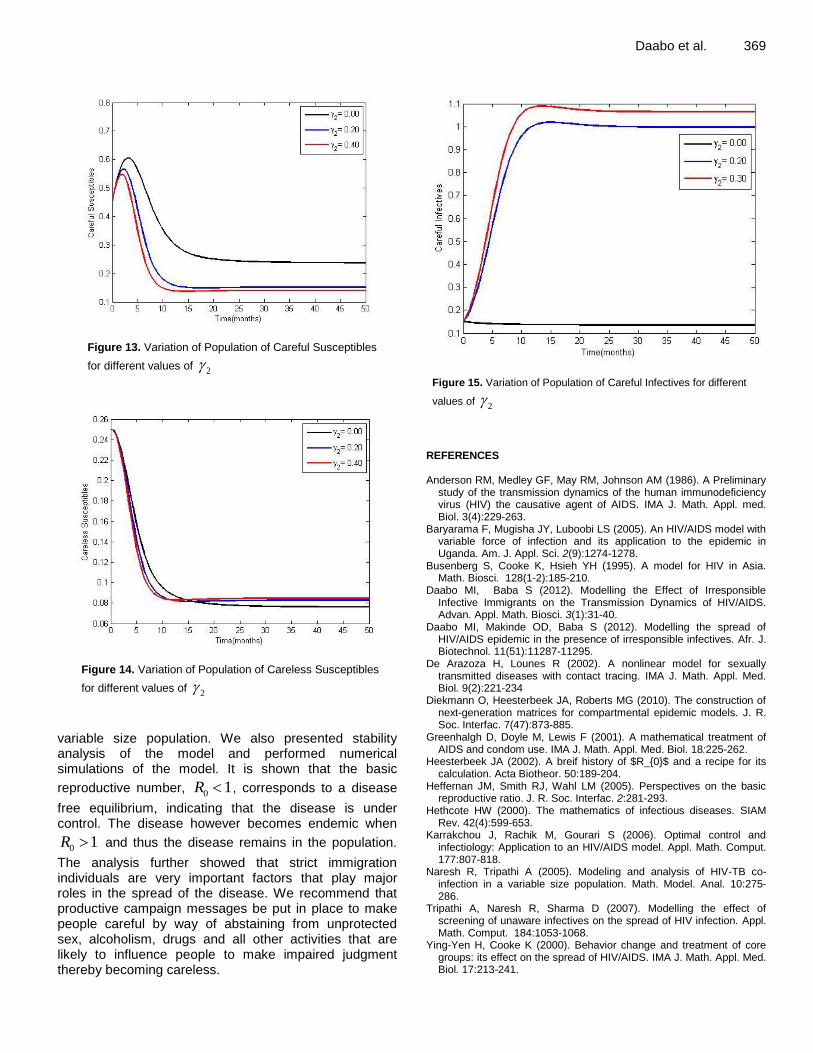
Figure 13. Variation of Population of Careful Susceptibles
for different values of 2
Figure 14. Variation of Population of Careless Susceptibles
for different values of 2
variable size population. We also presented stability analysis of the model and performed numerical simulations of the model. It is shown that the basic
reproductive number, 0 1R , corresponds to a disease
free equilibrium, indicating that the disease is under control. The disease however becomes endemic when
0 1R and thus the disease remains in the population.
The analysis further showed that strict immigration individuals are very important factors that play major roles in the spread of the disease. We recommend that productive campaign messages be put in place to make people careful by way of abstaining from unprotected sex, alcoholism, drugs and all other activities that are likely to influence people to make impaired judgment thereby becoming careless.
Daabo et al. 369
Figure 15. Variation of Population of Careful Infectives for different
values of 2
REFERENCES Anderson RM, Medley GF, May RM, Johnson AM (1986). A Preliminary
study of the transmission dynamics of the human immunodeficiency virus (HIV) the causative agent of AIDS. IMA J. Math. Appl. med. Biol. 3(4):229-263.
Baryarama F, Mugisha JY, Luboobi LS (2005). An HIV/AIDS model with variable force of infection and its application to the epidemic in Uganda. Am. J. Appl. Sci. 2(9):1274-1278.
Busenberg S, Cooke K, Hsieh YH (1995). A model for HIV in Asia. Math. Biosci. 128(1-2):185-210.
Daabo MI, Baba S (2012). Modelling the Effect of Irresponsible Infective Immigrants on the Transmission Dynamics of HIV/AIDS. Advan. Appl. Math. Biosci. 3(1):31-40.
Daabo MI, Makinde OD, Baba S (2012). Modelling the spread of HIV/AIDS epidemic in the presence of irresponsible infectives. Afr. J. Biotechnol. 11(51):11287-11295.
De Arazoza H, Lounes R (2002). A nonlinear model for sexually transmitted diseases with contact tracing. IMA J. Math. Appl. Med. Biol. 9(2):221-234
Diekmann O, Heesterbeek JA, Roberts MG (2010). The construction of next-generation matrices for compartmental epidemic models. J. R. Soc. Interfac. 7(47):873-885.
Greenhalgh D, Doyle M, Lewis F (2001). A mathematical treatment of AIDS and condom use. IMA J. Math. Appl. Med. Biol. 18:225-262.
Heesterbeek JA (2002). A breif history of $R_{0}$ and a recipe for its calculation. Acta Biotheor. 50:189-204.
Heffernan JM, Smith RJ, Wahl LM (2005). Perspectives on the basic reproductive ratio. J. R. Soc. Interfac. 2:281-293.
Hethcote HW (2000). The mathematics of infectious diseases. SIAM Rev. 42(4):599-653.
Karrakchou J, Rachik M, Gourari S (2006). Optimal control and infectiology: Application to an HIV/AIDS model. Appl. Math. Comput. 177:807-818.
Naresh R, Tripathi A (2005). Modeling and analysis of HIV-TB co-infection in a variable size population. Math. Model. Anal. 10:275-286.
Tripathi A, Naresh R, Sharma D (2007). Modelling the effect of screening of unaware infectives on the spread of HIV infection. Appl. Math. Comput. 184:1053-1068.
Ying-Yen H, Cooke K (2000). Behavior change and treatment of core groups: its effect on the spread of HIV/AIDS. IMA J. Math. Appl. Med. Biol. 17:213-241.

Vol. 5(9), pp. 370-373, September, 2013
DOI: 10.5897/JPHE11.145
ISSN 2141-2316 ©2013 Academic Journals
http://www.academicjournals.org/JPHE
Journal of Public Health and Epidemiology
Full Length Research Paper
Impact of double fortified salt on iron and iodine deficient school children (6 to 12 years) of rural
Vadodara
Sirimavo Nair1*, Ruchirang Goswami2, MGR Rajan3 and Vasudev Thakkar2
1Department of Foods and Nutrition, Faculty of Family and Community and Sciences, M.S. University of Baroda,
Vadodara, India. 2Department of Biosciences, Sardar Patel University, Vallabh Vidyanagar, India.
3Nuclear Medicine Section, Bhabha Atomic Research Centre, Tata Memorial Hospital- Annexe Building, Parel, Mumbai,
India.
Accepted 24 July, 2013
Iodine deficiency disorder (IDD) is a widespread health problem in developing countries. Double fortified salt (DFS) has been developed to combat two micronutrient deficiencies (iron and iodine) simultaneously; because, in many instances, these deficiencies co-exist. Iron component of the DFS helps to improve the hemoglobin (Hb) level. There is a simultaneous improvement in thyroperoxidase (TPO) activity and iodinated thyroglobulin (Tg) levels due to presence of iodine. The objective of this study was to assess the impact of DFS supplementation on salivary Tg and Hb levels in children of 6 to 12 years of age. The present study was conducted in rural areas of Vadodoara district. A total of 3125 children were screened for iodine deficiency by palpation and based on urinary iodine excretion (UIE). Their anthropometric measurements were recorded. The children (n= 54) with less UIE level (<100 µg/L UIE indicates iodine deficiency) were enrolled as subjects for the study, they were supplemented with DFS for two months. Biochemical estimations for salivary Tg, serum Tg, T4 and thyroid stimulating hormone (TSH) (by Radio Immuno Assay), Hb (by Drabkin’s Method) and UIE (by micropipette method using ELISA reader) were carried out before and after the supplementation. All the data were subject to statistical analysis using SPSS software version 13.0. Mean salivary Tg values were reduced significantly by 4.45 ng/dl. Mean Hb value in post data improved by 0.5 ng/dl. Mean serum Tg was found to be 12.4 ng/dl which was in normal range. Supplementation of DFS with iron and iodine can combat these deficiencies simultaneously. DFS supplementation improves Hb and Tg levels in the subjects. Hence, DFS can be a powerful weapon in eliminating two micronutrient deficiencies. Key words: Iron, iodine, thyroid, salivary thyroglobulin (Tg), double fortified salt (DFS), radio-immunoassay (RIA), urinary iodine excretion (UIE).
INTRODUCTION Childhood malnutrition is a massive crisis in developing countries. Inadequate micronutrients in the diet lead to micronutrient-deficiency. Double fortified salt (DFS) has been designed with iron and iodine to control at least these two micronutrient deficiencies (Rao, 1994). DFS,
when consumed regularly (for a minimum period of two months), improves the status of these two micronutrients in the human body (Malavika et al., 2007; Zimmermann et al., 2003, 2004). Iron present in DFS increases hemoglobin (Hb) level. Also, heme is prosthetic group of
*Corresponding author. E-mail: [email protected].

Figure 1. Schematic diagram of study design.
enzyme thyroperoxidase (TPO) which catalyzes iodina-tion of thyroglobulin (Tg) at tyrosyl residues (Beard et al., 1998; Fayadat et al., 1999). MATERIALS AND METHODS Study area The present study was carried out among the school children of ages 6 of 12 years in the rural Vadodara. Ten villages were randomly selected within and around Vadodara which were scattered in the East, West, North, South and Central zones. After an initial scanning by palpation method, 8 villages had the population which precipitated some form of goitre. These 8 villages were in 15 to 30 km of the radius. They were Channi, Karachiya, Mujpur, Padra, Mahuvad, Sokhada, Aajod, Goraj and Padra. Sample size Considering goitre prevalence of 10 and 95% confidence limit, 20%
Nair et al. 371 relative precision of estimate, the sample size required was calculated as follows: Anticipated prevalence of goitre (p): 0.1; Level of significance (z): 95% (1.96); Relative precision (e): 20%; Formula for sample size calculation = (Z)2 × (1 - p)/(p) × (e)2 Sample size (N) = (1.96)2 × (1-0.1)/(0.1) × (0.2)2 = 864 Children The children screened were 3125. A sub-sample was arrived based on various classes of goiter along with UIE deficiency, and these subjects were supplemented (n=54) with DFS which had iron (1000 ppm) and iodine (40 ppm) (Figure 1). The goiter precipitation was classified by WHO/ICCIDD (1994). Estimation of UIE UIE estimation was done by micropipette method using enzyme-linked immunosorbent assay (ELISA) reader. The cut off value for median UIE are as follows: 100 or <100 µg/L: normal; 50.0 to 99.9 µg/L: mild iodine deficiency; 20.0 to 49.9 µg/L: moderate iodine deficiency; < 20.0 µg/L: severe iodine deficiency. Estimation of haemoglobin in blood Collection of blood sample Venous blood was collected using an ethylenediaminetetraacetic acid (EDTA)-Vaccutainer for each subject and was analyzed by Cyanmet method. Measurement of salivary Tg Collection of saliva samples Glass vials with screw caps (5 ml) were provided for saliva. Children were asked to rinse their mouth thoroughly with water to remove any food particles and then transfer saliva. These samples, after initial processing in the laboratory were analyzed by Radio Immuno Assay (RIA). All these analysis were carried out after the approval of ethical committee (Institutional Ethical Committee, ME54/55 as per ICMR guidelines). Statistical analysis All results were analyzed using SPSS software version 13.0. RESULTS The subjects had mild (25.9%), moderate (57.4%) to severe (16.7%) levels of goiters (p<0.001). It was observed that the mean urinary iodine concentration was 44.4 µg/L which increased to 110.2 µg/L after DFS supplementation for 2 months (Figure 2). Thus, this indicates that there was a shift from moderate iodine deficiency to normal. Generally, all thyroid function tests hormonal assays were carried out. It was of our interest to use a non-invasive approach. Our study revealed significant difference in baseline and post-supplementation values of salivary Tg (p <0.001). Mean salivary Tg was reduced from 6.28 to 1.83 ng/dl.
Increase in Hb was observed at the end of supplementation period. Mean base line level was 11.1 g/dl which increased to 11.6 g/dl after supplementation (p < 0.001) (Figure 3). After supplementation period, serum Tg was analyzed. It was found that

372 J. Public Health Epidemiol.
Subject number
UIE
Figure 2. Distribution of UIE before and after DFS supplementation.
Subject number
Hb
(g
/dl)
Figure 3. Distribution of Hb before and after DFS supplementation.
100% subjects had normal values of serum Tg. DISCUSSION The aforementioned results clearly indicate that, intake of DFS singly can contribute to the overall improvement in the iron and iodine status of an individual.
Marked reduction in mean values of salivary Tg (difference 4.455 ng/dl) was a sign of improvement in subjects. The advantage of the non-invasive approach is that all types of population can be considered. We found that instead of collecting serum, this approach would be highly beneficial due to the fact that even a drop of blood could be considered as a boon to them. This change was
observed majorly due to impact of DFS. Iron presence in DFS improves the activity of enzyme TPO (because iron is a co-factor of the enzyme) (Hess et al., 2002).
Function of TPO is to enhance iodination of Tg polypeptide. Since iodine is available from DFS, iodination of Tg polypeptide occurs smoothly. Iodinated Tg polypeptide being precursor to thyroid hormones, is used up in the hormone formation, bringing T3 and T4
levels to normal. Hence, a decrease in salivary Tg value (p < 0.01) observed could be accounted for the same. The serum Tg value is an appropriate indicator for iodine status as reported by Breil et al. (2001). Thus, viewing the details, it is suggestive that an improvement in Hb level of 0.5 g/dl which was observed in our study though not anticipated in a short span of two months, could be
because of various reasons such as less cases of infections, good absorption of iron, good iron stores, high intake of staple food-Bajra (pearl millet) which is a rich source of iron (8 mg iron in 100 g) and appreciable intake of vitamin C rich fruits like Zizyphus and Gooseberry which enhances iron absorption. As a part of the study, mothers were intervened for inclusion of iron-rich foods in their diet like green leafy vegetables and vitamin-C rich fruits. There can be an interference of phytates, though the results are commendable with an overall increase on 0.5 g/dl. Overall, this increase contributes to 4.5% of rise in Hb levels amongst the population.
The DFS supplementation study reflects on general improvement of the health status of a subject (Zimmermann et al., 2002). It is evidenced from the results that a consistent supply of DFS in the diet can improve the iron status along with iodine status of school children. Salivary Tg proved to be a good non-invasive indicator which can be used in field and can be applied to conduct large population size. Hence, it is essential and suggestive, that any government should strategically think and use DFS as an immediate solution to combat these two micronutrient deficiencies. If this is gained, half of the battle against malnutrition is won. Conclusion DFS can be a feasible and effective strategy to control two micronutrient deficiencies (iron and iodine). ACKNOWLEDGEMENTS The authors express their sincere gratitude to Dr. MGR Rajan, Head, Laboratory Nuclear Medicine Section, Bhabha Atomic Research Centre, Mumbai, who permit-ed us to execute radioimmunoassay in his laboratory. They are highly obliged to Smt. Chandrakala Gholve and Shri Kumarasamy Jothivel at BARC for their valuable guidance and immense help during the study period. They also extend thanks to Ms. Kejal Joshi and Ms. Niyati Chitre for their outmost help.
Nair et al. 373 REFERENCES Beard JL, Brigham DE, Kelly SK, Green MH (1998). Plasma Thyroid
hormone kinetics are altered in Iron deficient rats. J. Nutr. 128(8):1401–1408.
Briel T, West C, Hautvast J, Vulsma T, Vijlder, Atego EA (2001). Serum Thyroglobulin and Urinary Iodine Concentration are the most appropriate indicators for iodine status and thyroid function under conditions of increasing iodine supply in school children in Benin. Am. Soc. Nutr. Sci. J. Nutr. 131:2701–2706.
Fayadat L, Patricia N, Lanet J, Franc J (1999). Role of heme in intracellular trafficking of thyroperoxidase and involvement of H2O2 generated at the apical surface of thyroid cells in autocatalytic covalent heme binding. J. Biol. Chem. 274(15):10533–10538.
Hess SY, Zimmermann MB, Arnold M, Langhans W, Hurell RF (2002). Iron deficiency anemia reduces thyroidperoxidase activity in rats. Am. Soc. Nutr. Sci. J. Nutr. 132:1951–1955.
Malavika V, Rajagopala S, Bhagwat IP, Singh S, Bipinkumar, S Parmar, Mishra OP, Shyam Sunder U, Bhalia ND, Deshpande SR (2007). A Multicenter community study on the efficacy double fortified salt. Food Nutr. Bull. 28:100–108.
Rao NBS (1994). Fortification of salt with Iron and Iodine to control Anemia and Goiter- Development of a new formula with good stability and bioavailability or Iron and Iodine. Food Nutr. Bull. 15:1.
Zimmermann M, Wegmella R, Zeder C, Chauki N, Rohner F, Saissi M, Torresani T, Hurell R (2004). Dual fortification of salt with Iodine and micronized ferric pyrophosphate: a randomized, double blind, controlled trial. Am. J. Clin. Nutr. 80(4):952.
Zimmermann M, Zeder C, Chaouki N, Soad A, Torresani T, Hurell R (2002). Addition of microencapsulated iron to iodized salt improves efficacy of iodine in goitrous, iron deficient children: a randomized, double blind, controlled trial. Eur. J. Endocrinol 147(6):747.
Zimmermann M, Zeder C, Chaouki N, Soad A, Torresani T, Hurell R (2003). Dual fortification of salt with Iodine and Microencapsulated Iron: a randomized, double blind, controlled trial in Moroccan school children. Am. J. Clin. Nutr. 277(2):425.
Vol. 5(9), pp. 374-378, September, 2013
DOI: 10.5897/JPHE12.090
ISSN 2141-2316 ©2013 Academic Journals
http://www.academicjournals.org/JPHE
Journal of Public Health and Epidemiology
Full Length Research Paper
Risk factors of diarrhoea in the Mahmood Raghi district of Kapisa province Afghanistan-2010
Jawad Mofleh1*, N. Muserat2 and N. Ziar3
1Eastern Mediterranean Public Health Network, Jordan.
2Central Region-ANPHI-MOPH, Afghanistan.
3DEWS- ANPHI-MOPH, Afghanistan.
Accepted 25 July, 2013
Surveillance data claimed the presence of a diarrhoea outbreak after a flash flood swept off some villages of Mahmood Raqi district in Kapisa province. The water sources were treated with chlorine to stop the outbreak, but still no significant decrease in the incidence of diarrhoeal cases was observed. A case control study was conducted to find the risk factors of diarrhoea in the affected villages, of which approximately 5000 people are living in the affected villages of Mahmood Raghi district of Kapisa province. This study randomly selected 50 cases and 50 control families and applied a structured questionnaire. The control was defined as families that did not have any diarrhoea case in the two weeks prior to the study. The study was conducted on 8 and 9 of August, 2010. In the case families, 93 out of 161 (58%) children of ages under five and 51/451 (11.3%) people of ages over five years complained of diarrhoea. Average family size was 12 and 9.6 among case and control families. Average numbers of children under 5 years were 3.22 and 2 in the case and control families, respectively. Dug well was the main source of drinking water in 32% of the cases and 18% controls. The researchers found that hand washing with clean water and soap after using the toilet and before feeding the children was strongly protective in the controls, odd ratio (OR) = 0.03 (P=0.0000) (uncorrected chi square = 44.1 (P=0.000) and 0.15 (P=0.00072)), respectively. Covering the water pots for kitchen use was strongly protective against diarrhoea (OR=0.06, P=0.000). Education of mother was another protecting factor for children, average years of mothers education was 0.45 year in the cases and 3.1 years in the controls. Poor hand washing practices, improper water storage in the households and types of latrine were associated with the outbreak of diarrhoea. Level of parents’ education is the key for prevention and control of diarrhoea in <5 years children. Health education session was conducted to control diarrhoea outbreak in the affected villages. Key words: Risk factors of diarrhoea, outbreak of diarrhoea, case control study, Afghanistan, DEWS.
INTRODUCTION At the global level, approximately 10.5 million children aged 0 to 59 months die each year (Black et al., 2003), and 70% of these deaths are due to five health problems; diarrhoea, pneumonia, measles, neonatal tetanus and malaria (World Health Organization, 2012a). World Health Organization estimated in 2007 that approximately 4 billion cases of acute diarrhoea occurs annually, of
which 88% are attribute to un-safe water, inadequate sanitation and hygiene and 1.8 million die of the same problem annually (World Health Organization, 2007).
Diarrhoea is one of the killers of children in Afghanistan. Over a million children under-five years of age Afghanistan were dying each year, mostly from diarrhoea diseases, acute respiratory infections and
*Corresponding author. E-mail: [email protected]. Tel: +962779691966.

measles (Management Science for Health, 2006). Multi Indicator Cluster Survey (MICS, 2003) showed that the prevalence of diarrhoea among children aged less than 5 years old is 30% (UNICEF, 1997, 2000, 2003). As per the World Health Statistic Report (2012b), the number of deaths due to diarrhoea in children under five years of age has decreased in Afghanistan from 17/1000 in 2000 to 16/1000 in 2010. For every one child that die due to diarrhoea in Iran, there are four children dying for the same reason in Afghanistan and for every two children dyeing due to diarrhoea in Pakistan, three are dying in Afghanistan.
Regional averages of death due to diarrhoea in Eastern Mediterranean (EMR), South East Asia (SEA) and African Regions of WHO (AFR) are 11/1000 children under five years in 2010, which is the highest at the global level. Hence, the average number of deaths in children aged five years and below in Afghanistan is higher than these regions. As earlier mentioned, Afghanistan does not only have the first position in the high mortality rate of diarrhoea in children under five years of age at the regional level, but lead the world with 16 deaths per 1000 children under five years, Somalia also have the same rate of under-five death due to diarrhoea (World Health Organization, 2012c). On the other hand, the number of deaths due to diarrhoea in Afghanistan reduced by 5.9% between the year 2000 and 2010, while this number is 15.4% in EMR, SEA and AFR.
The Disease Early Warning System (DEWS), which is a sentinel based surveillance system in Afghanistan, established in December 2006, by technical support of World Health Organization and financial support of USAID, reported higher rates of diarrhoea from its sentinel sites in affected district of Kapisa in 2010. DEWS reported that 35, 34 and 28% of consultations of all under five years of age children in the DEWS sentinel sites were due to diarrhoea in years 2008, 2009, and 2010, respectively (DEWS Ministry of Health Afghanistan, 2008, 2009; DEWS Ministry of Public Health Afghanistan, 2010).
Surveillance data revealed that higher number of diarrhoeal cases was reported after a flash flood swept off some villages of Mahmood Raqi district in Kapisa province. The water sources were treated with chlorine and still outbreak was not controlled, therefore a case control study was conducted to find the risk factors of diarrhoea in the affected areas.
The specific objective of this study was to find the risk factors associated with diarrhoea in the affected villages to stop the outbreak of diarrhoea. Specifically, this was very much important to find the risk factors associated with diarrhoea, because the Rapid Response Teams chlorinated the water sources in the affected area.
METHODOLOGY A case control study was designed and implemented to find risk
Mofleh et al. 375 factors of diarrhoea in Mahmmod Kheil, Haroki, Baloch khil and Najarah villages of Mahmood Raghi district in Kapisa province of Afghanistan. Mahmmod Raghi had a population of 48,835 and Kapisa has a population of 35,8240, in 2008 as per Central Statistics Office (CSO) of Afghanistan. Total population of these villages are about 5,000 people. Villages are located close to the centre of the district; people are mainly busy with agriculture, which is the main source of income for these villages. Villagers are all poor to middle class individuals. The villages do not have a basic health centre and attend health facilities of the centre of the district or closed by health centre which is almost an hour by walk from affected areas.
As most of the cases were among children under five years and because the researchers were unable to obtain required information from the children, the team decided to interview the families and care takers of the children. So, a case control study was designed and 50 families were selected as the case families and 50 families were selected as the control families in the affected villages. Case and control families were selected randomly. Families that have diarrhoeal cases at the time of the study were considered case families. Case families were those who had at least one case of diarrhoea who met the outbreak case definition of diarrhoea in the household at the time of the study. Families that did not have cases of diarrhoea at the time of the study and two weeks prior to the study were considered as control families.
Cases and controls were selected in a systematic random way. The teams entered to the villages from east of the villages and selected the first house randomly and every second house was interviewed till they reached to the 50 families for cases and controls. Number of families which was interviewed in the village is proportionate to the size of village population.
The investigation team developed an outbreak specific questionnaire and applied to case and controls during face to face interview.
The team used the standard WHO case definition (World Health Organization, 2012a) of the acute watery diarrhoea to detect acute watery diarrhoea cases in the villages. The case definition of acute watery diarrhoea which was used in this study are subsequently explained.
Acute watery diarrhoea is defined as three or more abnormally loose or fluid stools over the last 24 h. For the sake of this study, the team added component of place and time to the case definition to make sure that only cases from this outbreak is included in the study so the operational case definition was any case with an acute watery diarrhoea is defined as 3 or more abnormally loose or fluid stools over last 24 h, who is living in the affected village of Mahmood Raghi, two weeks prior to the study.
Free version of EpiInfo 3.4.1 which is availed by Centres for Diseases Control and Prevention (CDC) online was used for data entry and data analysis. The study was conducted in part by the outbreak investigation detection and control on 8 and 9 of August, 2010. RESULTS Fifty case families and fifty control families were inter-viewed. 612 people were living in the case families and 423 people were living in the control families. Median age in the case families were 15.7 years and in the control families were 17.1 years. 161 children under five years were living in the case families and 101 children under five years were living in the control families. 93 out of 161 children (58%) in the case families had diarrhoea and 51 (11.3%) people of age over five years of had diarrhoea
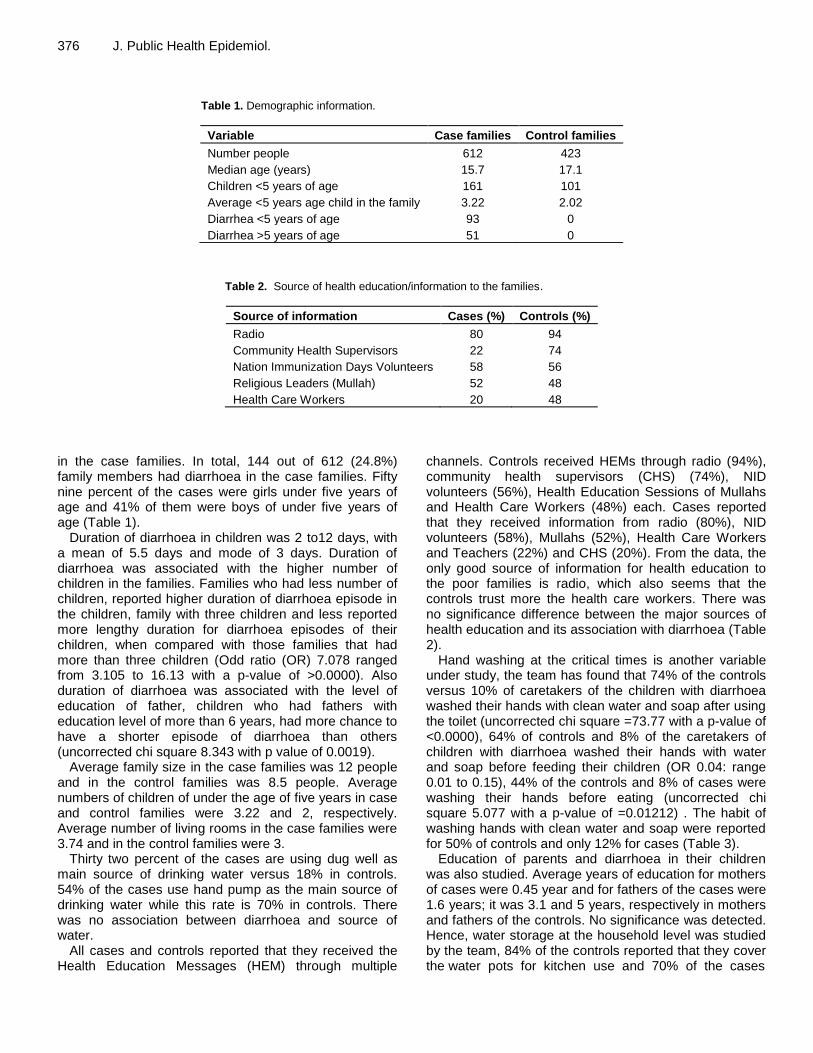
376 J. Public Health Epidemiol.
Table 1. Demographic information.
Variable Case families Control families
Number people 612 423
Median age (years) 15.7 17.1
Children <5 years of age 161 101
Average <5 years age child in the family 3.22 2.02
Diarrhea <5 years of age 93 0
Diarrhea >5 years of age 51 0
Table 2. Source of health education/information to the families.
Source of information Cases (%) Controls (%)
Radio 80 94
Community Health Supervisors 22 74
Nation Immunization Days Volunteers 58 56
Religious Leaders (Mullah) 52 48
Health Care Workers 20 48
in the case families. In total, 144 out of 612 (24.8%) family members had diarrhoea in the case families. Fifty nine percent of the cases were girls under five years of age and 41% of them were boys of under five years of age (Table 1).
Duration of diarrhoea in children was 2 to12 days, with a mean of 5.5 days and mode of 3 days. Duration of diarrhoea was associated with the higher number of children in the families. Families who had less number of children, reported higher duration of diarrhoea episode in the children, family with three children and less reported more lengthy duration for diarrhoea episodes of their children, when compared with those families that had more than three children (Odd ratio (OR) 7.078 ranged from 3.105 to 16.13 with a p-value of >0.0000). Also duration of diarrhoea was associated with the level of education of father, children who had fathers with education level of more than 6 years, had more chance to have a shorter episode of diarrhoea than others (uncorrected chi square 8.343 with p value of 0.0019).
Average family size in the case families was 12 people and in the control families was 8.5 people. Average numbers of children of under the age of five years in case and control families were 3.22 and 2, respectively. Average number of living rooms in the case families were 3.74 and in the control families were 3.
Thirty two percent of the cases are using dug well as main source of drinking water versus 18% in controls. 54% of the cases use hand pump as the main source of drinking water while this rate is 70% in controls. There was no association between diarrhoea and source of water.
All cases and controls reported that they received the Health Education Messages (HEM) through multiple
channels. Controls received HEMs through radio (94%), community health supervisors (CHS) (74%), NID volunteers (56%), Health Education Sessions of Mullahs and Health Care Workers (48%) each. Cases reported that they received information from radio (80%), NID volunteers (58%), Mullahs (52%), Health Care Workers and Teachers (22%) and CHS (20%). From the data, the only good source of information for health education to the poor families is radio, which also seems that the controls trust more the health care workers. There was no significance difference between the major sources of health education and its association with diarrhoea (Table 2).
Hand washing at the critical times is another variable under study, the team has found that 74% of the controls versus 10% of caretakers of the children with diarrhoea washed their hands with clean water and soap after using the toilet (uncorrected chi square =73.77 with a p-value of <0.0000), 64% of controls and 8% of the caretakers of children with diarrhoea washed their hands with water and soap before feeding their children (OR 0.04: range 0.01 to 0.15), 44% of the controls and 8% of cases were washing their hands before eating (uncorrected chi square 5.077 with a p-value of =0.01212) . The habit of washing hands with clean water and soap were reported for 50% of controls and only 12% for cases (Table 3).
Education of parents and diarrhoea in their children was also studied. Average years of education for mothers of cases were 0.45 year and for fathers of the cases were 1.6 years; it was 3.1 and 5 years, respectively in mothers and fathers of the controls. No significance was detected. Hence, water storage at the household level was studied by the team, 84% of the controls reported that they cover the water pots for kitchen use and 70% of the cases
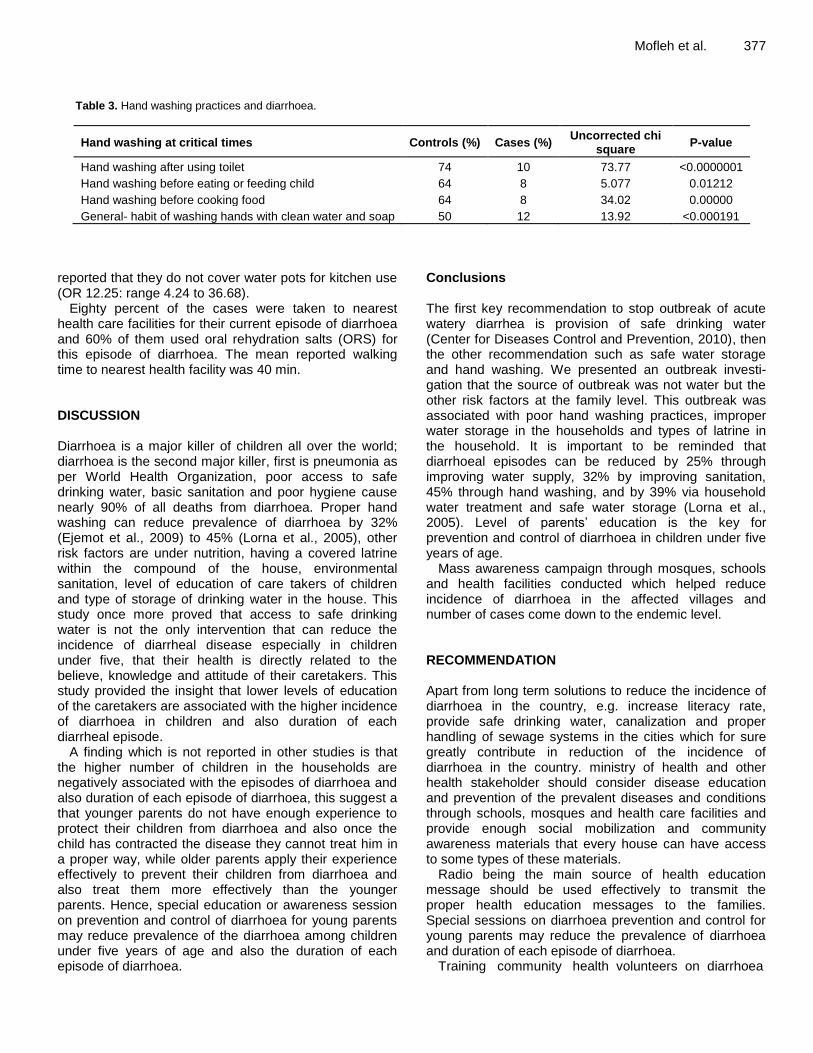
Mofleh et al. 377
Table 3. Hand washing practices and diarrhoea.
Hand washing at critical times Controls (%) Cases (%) Uncorrected chi
square P-value
Hand washing after using toilet 74 10 73.77 <0.0000001
Hand washing before eating or feeding child 64 8 5.077 0.01212
Hand washing before cooking food 64 8 34.02 0.00000
General- habit of washing hands with clean water and soap 50 12 13.92 <0.000191
reported that they do not cover water pots for kitchen use (OR 12.25: range 4.24 to 36.68).
Eighty percent of the cases were taken to nearest health care facilities for their current episode of diarrhoea and 60% of them used oral rehydration salts (ORS) for this episode of diarrhoea. The mean reported walking time to nearest health facility was 40 min. DISCUSSION Diarrhoea is a major killer of children all over the world; diarrhoea is the second major killer, first is pneumonia as per World Health Organization, poor access to safe drinking water, basic sanitation and poor hygiene cause nearly 90% of all deaths from diarrhoea. Proper hand washing can reduce prevalence of diarrhoea by 32% (Ejemot et al., 2009) to 45% (Lorna et al., 2005), other risk factors are under nutrition, having a covered latrine within the compound of the house, environmental sanitation, level of education of care takers of children and type of storage of drinking water in the house. This study once more proved that access to safe drinking water is not the only intervention that can reduce the incidence of diarrheal disease especially in children under five, that their health is directly related to the believe, knowledge and attitude of their caretakers. This study provided the insight that lower levels of education of the caretakers are associated with the higher incidence of diarrhoea in children and also duration of each diarrheal episode.
A finding which is not reported in other studies is that the higher number of children in the households are negatively associated with the episodes of diarrhoea and also duration of each episode of diarrhoea, this suggest a that younger parents do not have enough experience to protect their children from diarrhoea and also once the child has contracted the disease they cannot treat him in a proper way, while older parents apply their experience effectively to prevent their children from diarrhoea and also treat them more effectively than the younger parents. Hence, special education or awareness session on prevention and control of diarrhoea for young parents may reduce prevalence of the diarrhoea among children under five years of age and also the duration of each episode of diarrhoea.
Conclusions The first key recommendation to stop outbreak of acute watery diarrhea is provision of safe drinking water (Center for Diseases Control and Prevention, 2010), then the other recommendation such as safe water storage and hand washing. We presented an outbreak investi-gation that the source of outbreak was not water but the other risk factors at the family level. This outbreak was associated with poor hand washing practices, improper water storage in the households and types of latrine in the household. It is important to be reminded that diarrhoeal episodes can be reduced by 25% through improving water supply, 32% by improving sanitation, 45% through hand washing, and by 39% via household water treatment and safe water storage (Lorna et al., 2005). Level of parents’ education is the key for prevention and control of diarrhoea in children under five years of age.
Mass awareness campaign through mosques, schools and health facilities conducted which helped reduce incidence of diarrhoea in the affected villages and number of cases come down to the endemic level. RECOMMENDATION Apart from long term solutions to reduce the incidence of diarrhoea in the country, e.g. increase literacy rate, provide safe drinking water, canalization and proper handling of sewage systems in the cities which for sure greatly contribute in reduction of the incidence of diarrhoea in the country. ministry of health and other health stakeholder should consider disease education and prevention of the prevalent diseases and conditions through schools, mosques and health care facilities and provide enough social mobilization and community awareness materials that every house can have access to some types of these materials.
Radio being the main source of health education message should be used effectively to transmit the proper health education messages to the families. Special sessions on diarrhoea prevention and control for young parents may reduce the prevalence of diarrhoea and duration of each episode of diarrhoea.
Training community health volunteers on diarrhoea
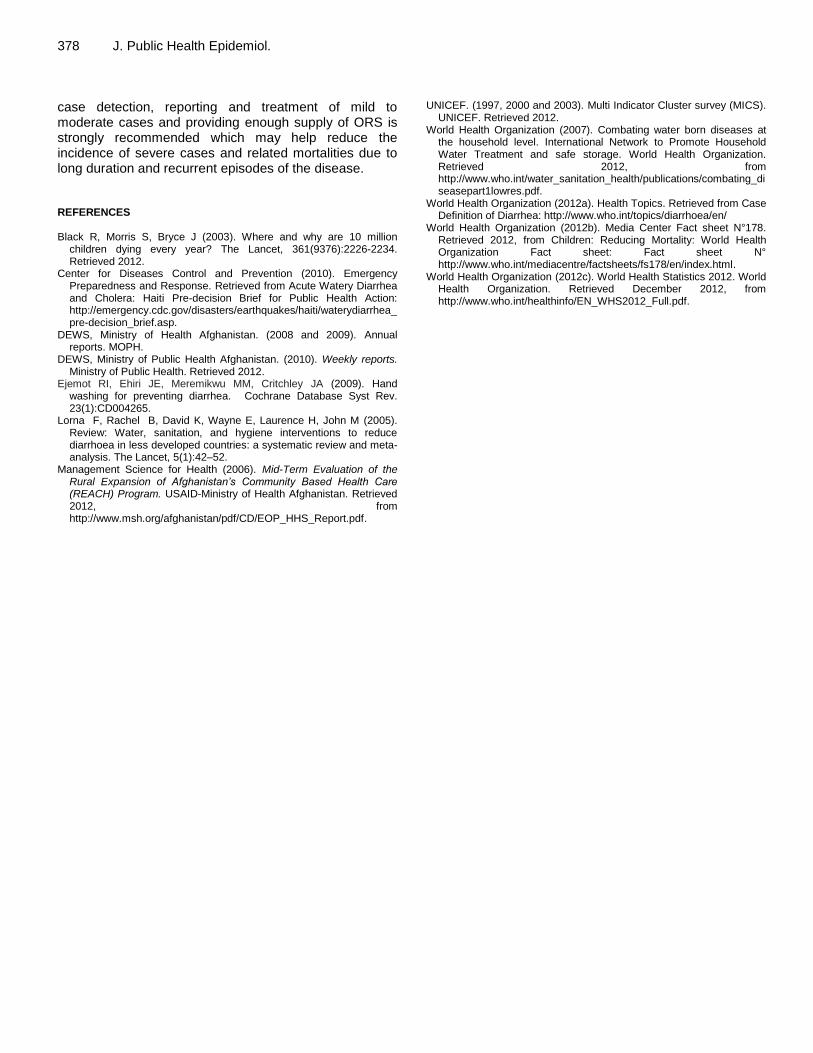
378 J. Public Health Epidemiol. case detection, reporting and treatment of mild to moderate cases and providing enough supply of ORS is strongly recommended which may help reduce the incidence of severe cases and related mortalities due to long duration and recurrent episodes of the disease. REFERENCES Black R, Morris S, Bryce J (2003). Where and why are 10 million
children dying every year? The Lancet, 361(9376):2226-2234. Retrieved 2012.
Center for Diseases Control and Prevention (2010). Emergency Preparedness and Response. Retrieved from Acute Watery Diarrhea and Cholera: Haiti Pre-decision Brief for Public Health Action: http://emergency.cdc.gov/disasters/earthquakes/haiti/waterydiarrhea_pre-decision_brief.asp.
DEWS, Ministry of Health Afghanistan. (2008 and 2009). Annual reports. MOPH.
DEWS, Ministry of Public Health Afghanistan. (2010). Weekly reports. Ministry of Public Health. Retrieved 2012.
Ejemot RI, Ehiri JE, Meremikwu MM, Critchley JA (2009). Hand washing for preventing diarrhea. Cochrane Database Syst Rev. 23(1):CD004265.
Lorna F, Rachel B, David K, Wayne E, Laurence H, John M (2005). Review: Water, sanitation, and hygiene interventions to reduce diarrhoea in less developed countries: a systematic review and meta-analysis. The Lancet, 5(1):42–52.
Management Science for Health (2006). Mid-Term Evaluation of the Rural Expansion of Afghanistan’s Community Based Health Care (REACH) Program. USAID-Ministry of Health Afghanistan. Retrieved 2012, from http://www.msh.org/afghanistan/pdf/CD/EOP_HHS_Report.pdf.
UNICEF. (1997, 2000 and 2003). Multi Indicator Cluster survey (MICS).
UNICEF. Retrieved 2012. World Health Organization (2007). Combating water born diseases at
the household level. International Network to Promote Household Water Treatment and safe storage. World Health Organization. Retrieved 2012, from http://www.who.int/water_sanitation_health/publications/combating_diseasepart1lowres.pdf.
World Health Organization (2012a). Health Topics. Retrieved from Case Definition of Diarrhea: http://www.who.int/topics/diarrhoea/en/
World Health Organization (2012b). Media Center Fact sheet N°178. Retrieved 2012, from Children: Reducing Mortality: World Health Organization Fact sheet: Fact sheet N° http://www.who.int/mediacentre/factsheets/fs178/en/index.html.
World Health Organization (2012c). World Health Statistics 2012. World Health Organization. Retrieved December 2012, from http://www.who.int/healthinfo/EN_WHS2012_Full.pdf.

Vol. 5(9), pp. 379-384, September, 2013
DOI: 10.5897/JPHE2013.0545
ISSN 2141-2316 ©2013 Academic Journals
http://www.academicjournals.org/JPHE
Journal of Public Health and Epidemiology
Full Length Research Paper
Serum lipid profile and hepatic dysfunction in moderate Plasmodium falciparum infection
Chikezie, P. C1* and Okpara, R. T2.
1Department of Biochemistry, Imo State University, Owerri, Nigeria.
2Department of Biochemistry, University of Port-Harcourt, Port-Harcourt, Nigeria.
Accepted 17 July, 2013
Plasmodium falciparum is one of four distinct species of the malaria parasite that afflict humans and pose a threat to public health. The present study seeks to ascertain the serum lipid profile and associated hepatic dysfunction of male subjects with moderate P. falciparum infection. The patients were adults (n = 11) of 21 to 31 years old and adolescent (n = 10) of 11 to 20 years old. Measurement of parasite density of peripheral blood smear was by Giemsa stained techniques. Serum lipid profile, bilirubin concentration, aspartate and alanine transferases activities were measured by spectrophotometric methods. Serum lipid profile of non-malarious and malarious subjects within the age brackets of 11 to 20 years showed no significant difference (p > 0.05); with exception of serum low density lipoprotein cholesterol (LDL-C) = 30.90 ± 7.10 mg/dl and high density lipoprotein cholesterol (HDL-C) = 31.10 ± 7.12 mg/dl (p < 0.05) of malarious subjects, which were below reference intervals. Specifically, for subjects within age brackets of 21 to 31 years, (aspartate aminotransferase, AST)non-
malarious = 15.32 ± 1.06 U/L, whereas, [AST]malarious = 15.34 ± 0.95 U/L; p > 0.05. Also, (alanine transaminase, ALT)non-malarious = 5.13 ± 1.88 U/L and [ALT]malarious = 5.87 ± 3.00 U/L; p > 0.05, in subjects within age brackets of 11 to 20 years. Serum conjugated bilirubin (CB) concentrations of non-malarious and malarious subjects were within the range of 0.17 ± 0.06 to 0.41 ± 0.06 mg/dl; reference interval = 0.1 to 0.4 mg/dl; p > 0.05. Contrary, serum TB concentrations of corresponding malarious subjects gave values above the reference intervals (p < 0.05). The present study showed moderate P. falciparum infection caused profound changes in serum HDL-C and LDL-C levels that was not dependent on the age brackets of the individuals and did not cause profound hepatic dysfunction in the various subjects. Similarly, the two categories of malarious subjects did not present biliary obstruction but had jaundice by virtue of their raised serum levels of TB. Key words: Serum, lipid profile, hepatic dysfunction, Plasmodium falciparum, malaria.
INTRODUCTION Parasitic protozoa are responsible for some of the most devastating and prevalent diseases of humans since time immemorial. Plasmodium falciparum is one of four distinct species of the malaria parasite that afflict humans and pose a threat to public health. According to World
Health Organization (WHO) (2008), approximately 350 to 500 million cases of malaria infections occur in Sub-Saharan Africa, along with 110 million cases of illness and 2 million deaths of which 25% leads to childhood deaths (Adekunle et al., 2007; Onyesom et al., 2010).
*Corresponding author. E-mail: [email protected]. Tel: +2348038935327.
380 J. Public Health Epidemiol. Malarial infection is associated with life threatening and debilitating conditions such as fever, chills, myalgia, headache, nausea, vomiting and diarrhea (WHO, 2008).
Lipoproteins such as chylomicrons, very low-density lipoproteins (VLDL), low-density lipoproteins (LDL), high-density lipoproteins (HDL) and free fatty acids (FFA) are major lipid components in plasma. Most plasma apolipoproteins, endogenous lipids and lipoproteins have their origin from the liver (Tietge et al., 1998; Jiang et al., 2006; Mayes and Botham, 2003), which depends on cellular integrity and functionality of the hepatocytes. Under normal physiological conditions, liver ensures homeostasis of lipid and lipoprotein metabolism (Jiang et al., 2006). Hepatocellular damage often associated with severe and acute P. falciparum infections impairs these processes, leading to alterations in plasma lipid and lipoprotein patterns (Faucher et al., 2002; Sibmooh et al., 2004). Likewise, hyperbilirubinemia, increased plasma levels of aspartate transferase (AST) and alanine transferase (ALT) activities are strong evidence of gross hepatocytic dysfunction in patients with P. falciparum infection (Kochar et al., 2003; Uzuegbu and Emeka, 2011; Onyesom and Onyemakonor, 2011).
Relationships between serum lipid profile and severity of P. falciparum and other parasitic infections in human has drawn the attention of various research authors (Bansal et al., 2005; Siagris et al., 2006; Maekawa et al., 2011; Ramcharran et al., 2011) and has been proposed as a basis for diagnosis and severity of the disease (Baptista et al., 1996). However, most reports available in literatures are concerned with severe and acute malarial infection (Sibmooh et al., 2004; Akanbi et al., 2012; Akanbi, 2013). Therefore, the present study seeks to investigate the serum lipid profile and associated hepatic dysfunction of male subjects with moderate P. falciparum infection. MATERIALS AND METHODS Selection of subjects Twenty-one (21) clinically confirmed malarious according to WHO (2008) and 12 h fasting male patients attending clinic at the University of Port Harcourt Teaching Hospital (UPTH), Port Harcourt, Nigeria and asymptomatic/non-malarious fasting male subjects {adolescent (n = 15); adult (n = 15)} enrolled for this study. The patients were in the following categories: adults (n = 11) of 21 to 31 years old and adolescent (n = 10) of 11 to 20 years old. The subjects were randomly selected between June and August, 2012. Exclusion criteria include; gastrointestinal tract infection, protein energy malnutrition, renal diseases, cirrhosis, hepatitis, obstructive jaundice, cancer, diabetes mellitus, hypertension, obesity, smoking, alcoholism, persons living with human immunodeficiency virus (HIV), patients taking anti-malaria drugs and vitamin supplements, patients who have treated malaria in the past 2 months (Onyesom and Onyemakonor, 2011; Idonije et al., 2011) and patients with low or high parasitemia.
Ethics The Ethical Committee of University of Port Harcourt, Port Harcourt, Nigeria, approved the study in compliance with the Declaration on the Right of the Patient (WMA, 2000). Before enrolment for the study, the patients/subjects involved signed an informed consent form. Collection and preparation of blood specimen Blood specimen was collected by venipuncture at the end of the fasting period from subjects using 5.0 ml capacity disposable syringes. Four milliliter (4.0 ml) of the blood samples were transferred into plain bottles to allow for coagulation, whereas the remaining 1.0 ml was transferred into ethylenediaminetetraacetic acid (EDTA) bottles for malaria parasite tests. The coagulated blood samples were centrifuged at 3000 rpm for 10 min, the serum transferred into Bijou bottle and stored frozen until required for biochemical analyses (Onyesom et al., 2010). Malaria parasite density test Measurement of parasite density of peripheral blood smear was by Giemsa stained techniques. The films were examined microsco-pically using × 100 objective under oil immersion (Cheesbrough, 1998). According to Idonije et al. (2011), level of parasitemia was graded as low+ (1 to 999/μl), moderate++ (1000 to 9999/μl) and severe+++ (> 10,000/μl).
Lipid profile assays Total cholesterol (TC), triacylglycerol (TG) and high-density lipoprotein cholesterol (HDL-C) were determined using commercial kits (Randox Laboratory Ltd., UK). LDL-C concentration was determined by difference according to the formula described by Friedewald et al. (1972), as reported by Oluba et al. (2012). Very low-density lipoprotein cholesterol (VLDL-C) concentrations were estimated using the methods of Burnstein and Sammaille (1960) where the value in mg/dl is based on the assumption that in fasting subjects, the VLDL-C to total plasma TG ratio is relatively fixed at 1:5 (Ibegbulem and Chikezie, 2012).
Enzyme assay Aspartate and alanine transaminases (AST and ALT) activities were measured by methods of Reitman and Frankel (1957) as reported by Onyesom (2012).
Bilirubin assay Serum bilirubin was measured by the method as described by Enemor et al. (2005). Statistical analyses The experiments were designed in a completely randomized method and data collected were analyzed by the analysis of variance procedure while treatment means were separated by the least significance difference (LSD) incorporated in the statistical

Chikezie and Okpara 381
Table 1. Serum lipid profile of non-malarious and malarious subjects.
Parameter
(mg/dL)
NM M Reference
Intervals* 11-20 years 21-31 years 11-20 years 21-31 years
TC 121.20±8.80a
144.68±6.35b
123.30±4.80a;c
155.02±8.00b;d
120-240
HDL-C 47.00±9.35a
61.02±2.64b
31.10±7.12a;c
52.14±5.42b;d
>40
LDL-C 67.80±6.80a
117.14±5.69b
30.90±7.10c
96.60±8.35b;d
60-160
VLDL-C 12.26±4.30a
22.93±6.76b
13.57±5.21a;c
24.39±5.31b;d
8-30
TG 61.30±5.40a
114.65±6.96b
67.89±7.20a;c
121.95±5.63b;d
40-150
*Liberopoulos et al. (2002). Means in the row with the same letter are not significantly different at p > 0.05 according to LSD. NM: Non-malarious; M: Malarious.
Table 2. Serum AST and ALT activities of non-malarious and malarious subjects.
Parameter (U/L) NM M Reference
interval* 11-20 years 21-31 years 11-20 years 21-31 years
AST 9.13±2.00a
15.32±1.06a,b
11.20±2.54a,b,c
15.34±0.95a,b,c,d
6-25
ALT 5.13±1.88a
7.67±0.63a,b
5.87±3.00a,b,c
9.40±0.80a,b,c,d
3-26
*Martin, (1983). Means in the row with the same letter are not significantly different at p > 0.05 according to LSD. NM: Non-malarious; M: Malarious.
analysis system (SAS) package of 9.1 version (2006). The correlation coefficients between the results were determined with Microsoft Office Excel, 2010 version.
RESULTS An overview of Table 1 showed that serum lipid profile of non-malarious subjects (control) between the age brackets of 11 to 20 and 21 to 31 years were generally within reference intervals. The lipid parameters were relatively higher in individuals within age brackets of 21 to 31 years (p < 0.05). Similarly, serum TC of malarious subjects (11 to 20 years) was within reference intervals and was not significantly different (p > 0.05) from non-malarious counterparts. Lipid parameters of non-malarious and P. falciparum infected individuals within the age brackets of 11 to 20 years showed no significant difference (p > 0.05); with exception of serum [LDL-C] = 30.90 ± 7.10 mg/dl and [HDL-C] = 31.10 ± 7.12 mg/dl (p < 0.05) of malarious subjects, which was below reference intervals. Likewise, serum lipid profile of malarious and non-malarious subjects within the age brackets of 21 to 31 years exhibited no significant difference (p > 0.05). Serum concentrations of HDL-C (p > 0.05) and LDL-C (p < 0.05) of the two age brackets of malarious subjects were lower than corresponding non-malarious individuals.
Table 2 showed that serum levels of AST and ALT of non-malarious and malarious subjects, irrespective of age categories, were not significantly different (p > 0.05). Although serum levels of the two enzymes were within
reference intervals, AST and ALT activities of non-malarious and malarious subjects (21 to 31 years) were higher (p > 0.05) than those of age brackets of 11 to 20 years. Specifically, for subjects within age brackets of 21 to 31 years, [AST]non-malarious = 15.32 ± 1.06 U/L, whereas, [AST]malarious = 15.34 ± 0.95 U/L; p > 0.05. Also, [ALT]non-
malarious = 5.13 ± 1.88 U/L and [ALT]malarious = 5.87 ± 3.00 U/L; p > 0.05, in subjects within age brackets of 11 to 20 years.
Serum CB concentrations of non-malarious and malarious was within the range of 0.17 ± 0.06 to 0.41 ± 0.06 mg/dl; reference interval = 0.1 to 0.4 mg/dl, p > 0.05 (Table 3). However, the range of serum TB concentra-tions of non-malarious subjects of the two age categories was within normal physiologic concentration. Contrary, serum TB concentrations of corresponding malarious subjects gave values above reference intervals (p < 0.05) (Table 3). Serum lipid profile of the various experimental groups showed strong positive correlations. The lowest correlation (r = 0.799637) was exhibited between age brackets of (21 to 31 years) non-malarious and (11 to 20 years) malarious subjects (Table 4). Alterations in serum lipid profile were irrespective of the age brackets of the patients.
DISCUSSION
Serum lipid profile of asymptomatic/non-malarious fasting male subjects corresponded with the reference intervals as reported by Liberopoulos et al. (2002) (Table 1). The

382 J. Public Health Epidemiol.
Table 3. Serum bilirubin concentrations of non-malarious and malarious subjects.
Parameter (mg/dl) NM M Reference
Interval* 11-20 years 21-31 years 11-20 years 21-31 years
CB 0.17±0.06a
0.36±0.89a,b
0.24±0.07a,b,c
0.41±0.06a,b,c,d
0.1-0.4
TB 0.23±0.03a
0.62±0.06a,b
2.17±0.17,c
3.12±0.11,c,d
< 1.0
*Martin, (1983). CB = conjugated bilirubin, TB = total bilirubin, Means in the row with the same letter are not significantly different at p > 0.05 according to LSD. NM: Non-malarious; M: Malarious.
Table 4. Correlations (r) of serum lipid profile of non-malarious and malarious subjects.
Age brackets
of Subjects (years) (11-20 years) NM (21-31 years) NM (11-20 years) M (21-31 years) M
(11-20) NM 1.000000 - - -
(21-31) NM 0.921394 1.000000 - -
(11-20) M 0.911751 0.799637 1.000000 -
(21-31) M 0.927869 0.97113 0.903284 1.000000
NM: Non-malarious; M: Malarious.
relatively higher serum lipid concentration in individuals within age brackets of 21 to 31 years (p < 0.05) was a reflection of age dependent adjustments in the pattern of lipid metabolism (Yoshida et al., 2007; Parini et al., 1999). According to Parini et al. (1999), elevated levels of plasma TC, particularly LDL-C, are associated with enhanced risk for atherosclerosis and coronary heart disease. However, the present study showed that the two categories of asymptomatic/non-malarious male subjects did not present hyperlipidemia.
Relationship between serum cholesterol levels in man/animals and parasitic infections has drawn the attention of several authors (Mohanty et al., 1992; Bansal et al., 2005; Adekunle et al., 2007; Liberopoulos et al., 2002; Durgut et al., 2012). Marginal increase in serum levels of TC in malarious subjects (p > 0.05) (Table 1), showed a departure from those previously reported in human with severe and acute malarial infection (Griffiths et al., 2001; Ogbodo et al., 2008), mice inoculated with Plasmodium yoelli (Adekunle et al., 2007), patient with Visceral leishmaniasis (Liberopoulos et al., 2002) and dogs with symptomatic V. leishmaniasis (Durgut et al., 2012) infections. Mohanty et al. (1992) had earlier posited that serum level of TC is reduced in low-level malarial infection, which is in concord with the present report.
In another report, Sibmooh et al. (2004) noted that serum levels of VLDL-C and HDL-C were significantly higher in malaria than in control subjects. They further noted that oxidized LDL-C from malarial patients increas-ed the endothelial expression of adhesion molecules. In contrast to the present findings, in moderate malaria
infection, serum levels of LDL-C and HDL-C were lower than in control subjects (Table 1). These observations suggest the critical role of oxidized lipoproteins, especially LDL-C on the pathogenesis of malaria. In addition, moderate malaria infection was associated with reduced serum levels of VLDL-C and HDL-C (Table 1) that was in conformity with previous report of Mohanty et al. (1992). From another report, the findings of the present study (Table 1) coincided with that of Faucher et al. (2002). They reported that malaria infection produces moderate changes in plasma lipid profile in man, with typical decline in HDL-C concentration. It is worthwhile to note that Ogbodo et al. (2008) posited that oxidative modification of HDL-C and reduced serum levels of this class of lipoprotein was associated with the patho-physiology of malaria.
According to Leonarduzzi et al. (2000), levels of oxidative modifications of the various lipoproteins showed a relationship with severity of malaria infection. Thus, fluxes in serum lipoprotein concentrations are pointer to the fact that severity of malarial infection dictated the pattern of serum lipoproteins (Baptista et al., 1996). These changes in lipid parameters are more pronounced in P. falciparum infection (Sibmooh et al., 2004). The marginal increases in serum TG concentrations in the various experimental subjects (p > 0.05) (Table 1) was consistent with the reports of individuals with low-level malarial infection (Mohanty et al., 1992), malarial infection in children (Ogbodo et al., 2008), parasitic protozoa infection (Vial et al., 2003) and in animal model infected with P. Yoelli (Adekunle et al., 2007).
Likewise, in agreement with the present findings, there
are reports on raised serum levels of TG in animals with V. leishmaniasis infection (Liberopoulos et al., 2002; Durgut et al., 2012) and Monkeys infected with Diplococcus pneumoniae and Salmonella typhimurium (Fiser et al., 1972). In contrast, Mohanty et al. (1992) noted that serum levels of TG were lower in patients than in the control group. However, the difference was significant only for those with severe malaria (p < 0.001). They further reported that the levels of all the other plasma lipids were significantly higher (p < 0.001) in those with severe malaria than in those with moderate malaria compared with the control group.
Over three decades ago, Beach et al. (1977) had previously proposed that there was no indication from their studies that increase in serum lipid was due to the lipid content of the parasite. The alterations in serum lipid profile of malarious subjects could be attributable to the level of haemolysis in malaria, which is proportional to severity of infection (Baptista et al., 1996). Since the erythrocyte membranes are predominantly lipid in composition, the liberation of membrane lipids following sustained haemolysis accounted for the observed alterations in the serum lipid profile of patients presenting this disease (Garba et al., 2004). Furthermore, parasi-tized parenchymal and Kupffer cells compromise lipid metabolism engendering distortions in lipoprotein particles synthesized by the liver with associated alterations in plasma lipid profile (Oluba et al., 2012).
Serum levels of AST and ALT as well as TB and CB gave insights into the integrity and functional status of hepatocytes. Serum levels of the two enzymes (AST and ALT) are non-specific test to ascertaining hepatic dysfunction because they have their origins from other extra-hepatic tissues. However, elevated serum level of ALT is more specific for hepatic dysfunction. Accordingly, serum levels of conjugated bilirubin (TB) and conjugated bilirubin (CB) was measured for confirmatory diagnosis. Serum levels of AST and ALT of the experimental subjects (Table 2) were within corresponding reference intervals according to Martin (1983). This was an indication that moderate malarial infection did not cause profound hepatic dysfunction. Similarly, the serum level of CB was not significantly (p > 0.05) raised in the two categories of malarious subjects (Table 3). Therefore, patients with moderate malarial infection did not present biliary obstruction (Murray, 2003). However, the patients had jaundice by virtue of their raised serum levels of TB (Kochar et al., 2003).
Hepatic dysfunction in P. falciparum malaria manifested in form of jaundice is one of the important features of malaria. The etiology of hepatic dysfunction in patients with P. falciparum malaria is multifarious and has been described elsewhere (Maegraith, 1981; Cassidy and Reynolds, 1994; Kochar et al., 2003; Garba and Ubom, 2005). The present study showed that moderate P.
Chikezie and Okpara 383 falciparum infection caused profound changes in serum HDL-C and LDL-C levels that was not dependent on the age brackets of the individuals and did not cause profound hepatic dysfunction in the various subjects. Similarly, the two categories of malarious subjects did not present biliary obstruction but had jaundice by virtue of their raised serum levels of TB.
REFERENCES Adekunle AS, Adekunle OC, Egbewale BE (2007). Serum status of
selected biochemical parameters in malaria: An animal model. Biomed. Res. 18(2):109-113.
Akanbi OM, Omonkhua AA, Cyril-Olutayo CM, Fasimoye RY (2012). The antiplasmodial activity of Anogeissus leiocarpus and its effect on oxidative stress and lipid profile in mice infected with Plasmodium bergheii. Parasitol. Res. 110:219-226.
Akanbi OM (2013). Effect of malaria infection on oxidative stress and lipid profile in pregnant women. J. Med. Med. Sci. 4(3):128-133.
Bansal D, Bhatti HS, Sehgal R (2005). Role of cholesterol in parasitic infections. Lipid. Health Dis. 4:10 doi: 10.1186/1476-511X-4-10.
Baptista JL, Vervoort T, Van der Stuyft P (1996). Changes in plasma lipid levels as a function of Plasmodium falciparum infection in São Tomé. Parasite. 3 (4):335-340.
Beach DH, Sherman IW, Holz GG (1977). Lipids of Plasmodium lophurae, and of erythrocytes and plasmas of normal and P. lophurae infected Pekin ducklings. J. Parasitol. 63(1):62–75.
Burnstein MA, Sammaille J (1960). A rapid determination of cholesterol bound to A and B-lipoprotein. Clin. Chem. Acta. 5:601-609.
Cassidy WM, Reynolds TB (1994). Serum lactic dehydrogenase in the differential diagnosis of acute hepatocellular injury. J. Clin. Gastroenterol. 19:118-21.
Cheesbrough M (1998). District laboratory practice in tropical countries. 2000; Cambridge University Press, Cambridge.
Durgut R, Dalkilinç D, Güze M (2012). Evaluation of the serum lipid profiles in dogs with symptomatic Visceral Leishmaniasis. Kafkas University of Vetinary Fak Derg. 18(4):585-588.
Enemor VHA, Anosike JC, Nwoke BEB, Chikezie PC (2005). Serum aminotransferases and bilirubin levels in malaria patients. Int. J. Nat. Appl. Sci. 1(2):85-89.
Faucher JF, Ngou-Milama E, Missinou MA, Ngomo R, Kombila M, Kremsner PG (2002). The impact of malaria on common lipid parameters. Parasitol. Res. 88:1040-1043.
Fiser RH, Denniston JC, Beisel WR (1972). Infection with Diplococcus pneumoniae and Salmonella typhimurium in Monkeys: Changes in plasma lipids and lipoproteins. J. Infect. Dis. 125 (1): 54-60. doi: 10.1093/infdis/125.1.54
Friedewald W, Levy R, Fredrickson D (1972). Estimation of concentration of low-density lipoprotein in plasma, without use of the preparative ultracentrifuge. Clin. Chem. 18:499-502.
Garba IH, Ubom GA, Adelola TD (2004). Changes in serum lipid profile in adult patients presenting with acute, uncomplicated Falciparum. J. Malaria Res. 1(3-4).
Garba IH, Ubom GA (2005). Total serum lactate dehydrogenase activity in acute Plasmodium falciparum malaria infection. Singapore Med. J. 46(11):632-634.
Griffiths MJ, Ndungu F, Baird KL, Muller DPR, Marsh K, Newton CRJC (2001). Oxidative stress and erythrocyte damage in Kenyan children with severe Plasmodium falciparum malaria. Brit. J. Haematol. 113: 486–491. doi: 10.1046/j.1365-2141.2001.02758.x.
Ibegbulem CO, Chikezie PC (2012). Serum lipid profile of rats (Rattus norvegicus) fed with palm oil and palm kernel oil-containing diets. Asian J. Biochem. 7(1): 46-53. doi: 10.3923/ajb.2012.46.53.
Idonije OB, Festus O, Okhiai O, Akpamu U (2011). Comparative study of the status of a biomarker of lipid peroxidation (malondialdehyde) in
384 J. Public Health Epidemiol.
patients with Plasmodium falciparum and Plasmodium vivax malaria infection. Asian J. Biol. Sci. 4:506-513.
Jiang J, Nilsson-Ehle P, Xu N (2006). Influence of liver cancer on lipid and lipoprotein metabolism. Lipids Health Dis. 5: 4 doi: 10.1186/1476-511X-5-4.
Kochar DK, Singh P, Agarwal P, Kochar SK, Pokharna R, Sareen PK (2003). Malarial hepatitis. J. Assoc. Phys. India.; 51:1069-1072.
Leonarduzzi G, Arkan MC, Basaga H, Chiarpotto E, Sevanian A, Poli G (2000). Lipid peroxidation products in cell signaling. Free Rad. Biol. Med. 28:1370-1378.
Liberopoulos E, Alexandridis G, Bairaktari E, Elisaf M (2002). Severe hypocholesterolemia with reduced serum lipoprotein (a) in a patient with Visceral leishmaniasis. Ann. Clin. Lab. Sci. 32(3): 305-308.
Maegraith B (1981). Aspects of the pathogenesis of malaria. South West Asian J. Trop. Med. Public Health 12:251-267.
Maekawa T, Takahashi N, Tabeta K, Aoki Y, Miyashita H, Miyauchi S, Miyazawa H, Nakajima T, Yamazaki K (2011). Chronic oral infection with Porphyromonas gingivalis accelerates atheroma formation by shifting the lipid profile. PLoS One 6(5):e20240. doi: 10.1371/journal.pone.0020240.
Martin DW (1983). Blood plasma and clotting. In: Martin DW, Mayes PA, Rodwell VW. editors. Harper’s Review of Biochemistry 9th ed. California: Lange. Medical Publications.
Mayes PA, Botham KM (2003). Lipid transport and storage. In: Murray RK, Granner DK, Mayes PA, Rodwell VW. editors. Harper’s Illustrated Biochemistry. 26th ed. California: Lange Medical Books/McGraw-Hill.
Mohanty S, Mishra SK, Das BS, Satpathy SK, Mohanty D, Patnaik JK, Bose TK (1992). Altered plasma lipid pattern in falciparum malaria. Ann. Trop. Med. Parasitol. 86(6):601-606.
Murray RK (2003). Porphyrins and Bile Pigments. In: Murray RK, Granner DK, Mayes PA, Rodwell VW. editors. Harper’s Illustrated Biochemistry. 26th ed. California: Lange Medical Books/McGraw-Hill.
Ogbodo SO, Ogah O, Obu HA, Shu EN, Afiukwa C (2008). Lipid and lipoprotein levels in children with malaria parasitaemia. Curr. Pediat. Res. 12(1&2):12-17.
Oluba OM, Olusola AO, Eidangbe GO, Babatola LJ, Onyeneke EC (2012). Modulation of lipoprotein cholesterol levels in Plasmodium berghei malarial infection by crude aqueous extract of Ganoderma lucidum. Cholesterol. Article ID 536396, 6 pages doi:10.1155/2012/536396.
Onyesom I, Ekeanyanwu RC, Achuka N (2010). Correlation between moderate Plasmodium falciparum malarial parasitaemia and antioxidant vitamins in serum of infected children in South Eastern Nigeria. Afri. J. Biochem. Res. 4(12):261-264,
Onyesom I, Onyemakonor N (2011). Levels of parasitaemia and changes in some liver enzymes among malarial infected patients in Edo-Delta Region of Nigeria. Curr. Res. J. Biol. Sci. 3(2):78-81.
Onyesom I (2012). Activities of some liver enzymes in serum of P.
falciparum malarial infected humans receiving artemisinin and non-artemisinin-based combination therapy. Ann. Biol. Res. 3(7): 3097-3100.
Parini P, Angelin B, Rudling M (1999). Cholesterol and lipoprotein metabolism in aging reversal of hypercholesterolemia by growth hormone treatment in old rats. Arteriosclerosis, Thrombosis, and Vascular Biol. 19: 832-839 doi: 10.1161/01.ATV.19.4.832.
Ramcharran D, Wahed AS, Conjeevaram HS, Evans RW, Wang T, Belle SH, Yee LJ (2011). Serum lipids and their associations with viral levels and liver disease severity in a treatment-naïve chronic hepatitis C type 1-infected cohort. J. Viral Hepatitis 18(4):e144-52. doi: 10.1111/j.1365-2893.2010.01394.x.
Reitman S, Frankel S (1957). A colorimetric method for the determination of serum glutamic oxaloacetate and glutamic pyruvic transaminases. Am. J. Clin. Pathol. 28:56-62.
Siagris D, Christofidou M, Theocharis GJ, Pagoni N, Papadimitriou C, Lekkou A, Thomopoulos K, Starakis I, Tsamandas AC, Labropoulou-Karatza C (2006). Serum lipid pattern in chronic hepatitis C: histological and virological correlations. J. Viral Hepatitis 13:56–61.
Sibmooh N, Yamanont P, Krudsood S, Leowattana W, Brittenham G, Looareesuwan S, Udomsangpetch R (2004). Increased fluidity and oxidation of malarial lipoproteins: relation with severity and induction of endothelial expression of adhesion molecules. Lipid. Health Dis. 3:15 doi: 10.1186/1476-511X-3-15.
Tietge UJ, Boker KH, Bahr MJ, Weinberg S, Pichlmayr R, Schmidt HH, Manns MP (1998). Lipid parameters predicting liver function in patients with cirrhosis and after liver transplantation. Hepatogastroenterol. 45(24):2255-2260.
Uzuegbu UE, Emeka CB (2011). Changes in liver function biomarkers among malaria infected patients in Ikeja Lagos State, Nigeria. Curr. Res. J. Biol. Sci. 3(3):172-174.
Vial HJ. Eldin P, Tielens AG, Vanhellmond JJ (2003). Phospholipids in parasitic protozoa. Mole. Biochem. Parasitol. 126:143-54.
WHO (2008). Severe P. falciparum malaria. Transac. Royal Soc. Trop. Med. Hyg. 94:51-59.
WMA (2000). World medical association declaration of Helsinki ethical principles for medical research involving human subjects. 52
nd WMA
General Assembly, Edinburgh, Scotland. Yoshida S, Shimada Y, Kondoh D (2007). Hemolytic C type lectin,
CELIII from sea cucumber expressed in transgenic mosquitoes impairs malaria parasite development. PLOS Pathogens 3(12):e192.
Vol. 5(9), pp. 385-390, September, 2013
DOI: 10.5897/JPHE2013.0538
ISSN 2141-2316 ©2013 Academic Journals
http://www.academicjournals.org/JPHE
Journal of Public Health and Epidemiology
Full Length Research Paper
A tool for quality improvement of field epidemiology training programs: Experience with a new
scorecard approach
Donna Jones1*, Victor Caceres1 and Dionisio Herrera-Guibert2
1Division of Public Health Systems and Workforce Development, Center for Global Health, Centers for Disease Control
and Prevention, Atlanta GA, USA. 2Training Programs in Epidemiology and Public Health Interventions Network (TEPHINET), Atlanta GA, USA.
Accepted 15 July, 2013
Field epidemiology training programs (FETP) are capacity building programs that provide applied epidemiology training to public health professionals for national public health systems, emphasizing evidence-based problem solving. FETP’s have been in existence for over 30 years and there are currently 55 programs covering 82 countries. We describe the use of a new tool that assists programs in the assessment of FETP implementation and performance in order to readily identify action steps for program improvement. The FETP facilitated self-assessment used a consensus approach between an external international team and national program staff to score the level of program attainment. The process incorporated a scorecard-like diagnostic tool to summarize a program’s status across five key categories (competency-based training, field activities, leadership development, management, and sustainability). Seven country programs participated including 4 from Latin America, 2 from Africa, and 1 from the Middle East. All assessments were completed in less than 5 days and provided a preliminary set of findings and recommendations on the final day. The assessment team was able to quickly identify program areas of strength and weakness and assist programs in developing plans focused on priority areas for improvement. The process of working with an external and international team enhanced political support for the recommendations and helped provide a common vision among programs of the characteristics of a successful FETP. Our approach demonstrated early success in assisting programs in planning and was well accepted perhaps because it was a focused effort, conducted in a short period, producing recommendations and a roadmap with timely final reports. We believe the scorecard approach is a program assessment and improvement process that could be considered for other public health capacity building programs. Key words: Field epidemiology, public health, training.
INTRODUCTION Field epidemiology training programs (FETP) are capacity building programs that train public health personnel in applied epidemiology for the public health system in the country, emphasizing evidence-based problem solving for issues of public health concern (Lopez and Caceres, 2008; Jones et al., 2009; Schneider
et al., 2012). The primary objective of FETP is to strengthen the ability of the public health system to respond to health threats and develop policies based on scientific evidence. FETPs are also considered as a part of the strategy for building the necessary public health workforce capacity for compliance with the International
*Corresponding author. E-mail: [email protected]. Tel: 404-639-4395. Fax: 404-639-7490.
386 J. Public Health Epidemiol. Health Regulations (IHR, 2005). FETP’s have been in existence for more than 30 years and now cover 82 countries and most continents (White et al., 2001; Lopez and Caceres, 2008; Nsubuga et al., 2008).
Despite the long existence of these programs and recent rapid expansion, standard approaches to determining success, quality, and sustainability have not been used or evaluated. The only multi-site evaluation of FETPs was in 1998 and despite several individual country evaluations, there has been a lack of consistent terminology and frameworks for evaluation or assessments (Betts, 1998). Recent work has been done by the FETP member organization, Training Programs in Epidemiology and Public Health Interventions Network (TEPHINET) and others to consider the key elements that are needed for success of a given program (TEPHINET, 2005; Kandun et al., 2010) but these have been rarely applied or used for program improvement. A recent review of capacity building efforts in public health has highlighted the need for indicators and evaluation criteria for capacity building (Management Sciences for Health, 2010). This review identified no tools used to strategically assess and build program implementation and quality (Management Sciences for Health, 2010).
This paper describes the development and use of a tool that assists programs in the assessment of FETP implementation and performance in order to readily identify the next steps needed for program improvement. The FETP facilitated self-assessment (FSA) uses a consensus approach between an external team and the national program staff to determine the level of attain-ment for key program areas to help guide improvement efforts. This process is guided by a diagnostic tool that uses a scorecard-like roadmap to summarize progress across key performance and management areas. This model may be useful to other public health capacity-building programs. METHODOLOGY
We modeled the diagnostic instrument on a scorecard approach that has been used by the Influenza Division at Center for Disease Control (CDC), that is using descriptive scenarios to describe the state of a program within a category along a continuum (http://www.cdc.gov/flu/pdf/professionals/national_inventory_of_core_capabilities.pdf) (Prevention, 2011). The selected domains and indicators were informed though review of TEPHINET Continuous Quality Improvement (CQI) guidelines and consensus discussions with a number of programs (TEPHINET, 2005). The tool includes five domains relevant to successful FETP implementation: training, field work, leadership development, management and sustainability. Each domain has from two to seven specific indicators in which program activities and processes are assessed. The indicators each address some dimension of the program and include four levels of implementation or function. Each level (1 to 4) is described by a scenario that indicates a specific level of achievement. Level 1 is limited functioning or not present and Level 4 represents advanced functioning Example in Table 1. Advancement to a subsequent level is intended to represent meaningful steps toward advanced functioning. Domains and the key questions associated
with each element are as follows: Domain 1: Competency-based training 1. What is the operational status of the curriculum? Is it competency-based? 2. What is the practice for resident/officer assessments? 3. What is the support for mentors/technical supervisors? 4. What is the status of mentors/technical supervisors’ assessments? What is the quality of the supervision? 5. What is the quality and availability for the course faculty? 6. What is the status of the field sites or work sites where the residents are assigned? 7. What is the status of program completion by participants?
Domain 2: Public health work/field activities 1. What is the role of the program and trainees in outbreak investigations? 2. What is the role of the program in surveillance? 3. What is the status of public health studies done by the trainees? 4. What is the status of scientific communications by the trainees? Domain 3: Public health leadership development 1. Have the program graduates moved into public health leadership positions? 2. What is the MOH retention of graduates?
Domain 4: Management 1. What is the status of the policies and procedures for the program? 2. What are the logistics for the program office? 3. What is the staffing for the program? 4. What is the functional status of the program office? 5. What is the functional status of the logistics for the course work? 6. What is the functional status of the logistics for the field work?
Domain 5: Sustainability 1. Does the MOH fully support and “own” the program? 2. Is there an implemented plan for sustainable leadership for the program? 3. What is the status of a graduate network for the program? 4. What is the status of developing and using a strategic plan and yearly work plan for the program? 5. What is the role and strength of partnerships in the program? 6. What is the status of an advisory board for the program? 7. What is the role and strength of advocacy in the program?
Pilot testing The tool and the process were pilot tested in an established FETP country program and the tool was revised based on the results of this pilot test.
Implementation of the tool and process
The assessment takes place over approximately 4 days. Prior to the visit, the country program will have made 2 major types of preparation: (1) Organizing the agenda, meetings and logistics support for the time in-country, and (2) preparing the documentation
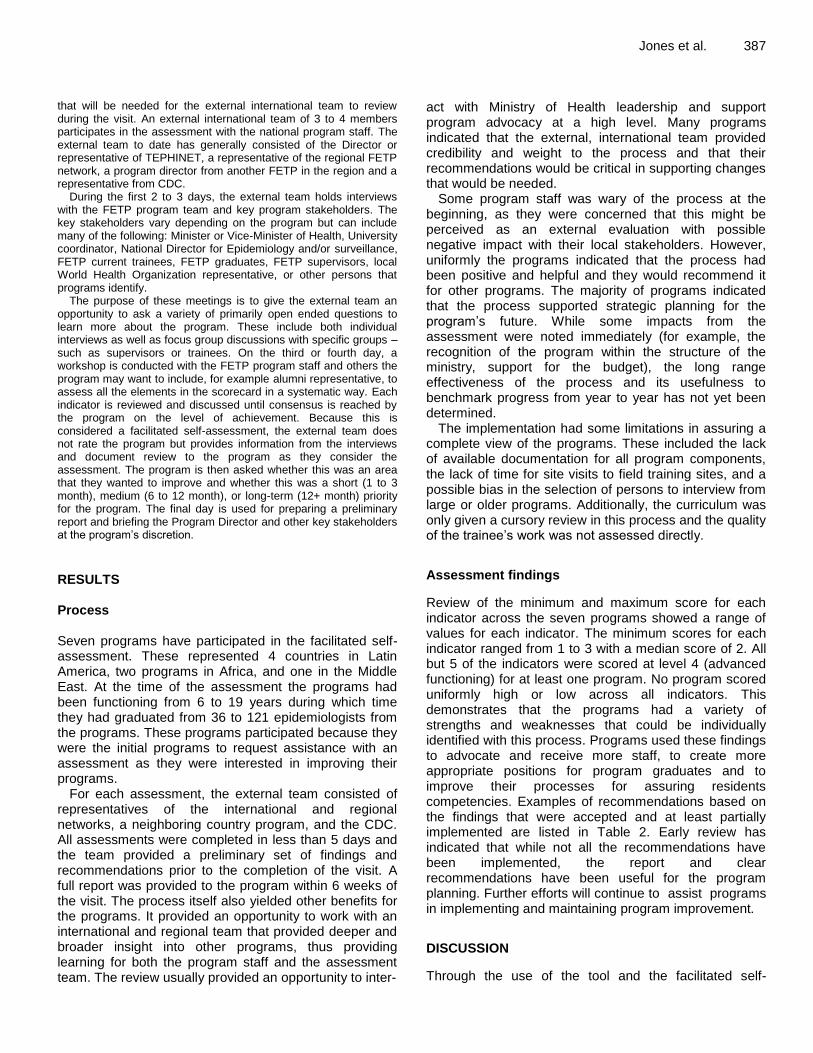
that will be needed for the external international team to review during the visit. An external international team of 3 to 4 members participates in the assessment with the national program staff. The external team to date has generally consisted of the Director or representative of TEPHINET, a representative of the regional FETP network, a program director from another FETP in the region and a representative from CDC.
During the first 2 to 3 days, the external team holds interviews with the FETP program team and key program stakeholders. The key stakeholders vary depending on the program but can include many of the following: Minister or Vice-Minister of Health, University coordinator, National Director for Epidemiology and/or surveillance, FETP current trainees, FETP graduates, FETP supervisors, local World Health Organization representative, or other persons that programs identify.
The purpose of these meetings is to give the external team an opportunity to ask a variety of primarily open ended questions to learn more about the program. These include both individual interviews as well as focus group discussions with specific groups – such as supervisors or trainees. On the third or fourth day, a workshop is conducted with the FETP program staff and others the program may want to include, for example alumni representative, to assess all the elements in the scorecard in a systematic way. Each indicator is reviewed and discussed until consensus is reached by the program on the level of achievement. Because this is considered a facilitated self-assessment, the external team does not rate the program but provides information from the interviews and document review to the program as they consider the assessment. The program is then asked whether this was an area that they wanted to improve and whether this was a short (1 to 3 month), medium (6 to 12 month), or long-term (12+ month) priority for the program. The final day is used for preparing a preliminary report and briefing the Program Director and other key stakeholders at the program’s discretion.
RESULTS Process Seven programs have participated in the facilitated self-assessment. These represented 4 countries in Latin America, two programs in Africa, and one in the Middle East. At the time of the assessment the programs had been functioning from 6 to 19 years during which time they had graduated from 36 to 121 epidemiologists from the programs. These programs participated because they were the initial programs to request assistance with an assessment as they were interested in improving their programs.
For each assessment, the external team consisted of representatives of the international and regional networks, a neighboring country program, and the CDC. All assessments were completed in less than 5 days and the team provided a preliminary set of findings and recommendations prior to the completion of the visit. A full report was provided to the program within 6 weeks of the visit. The process itself also yielded other benefits for the programs. It provided an opportunity to work with an international and regional team that provided deeper and broader insight into other programs, thus providing learning for both the program staff and the assessment team. The review usually provided an opportunity to inter-
Jones et al. 387 act with Ministry of Health leadership and support program advocacy at a high level. Many programs indicated that the external, international team provided credibility and weight to the process and that their recommendations would be critical in supporting changes that would be needed.
Some program staff was wary of the process at the beginning, as they were concerned that this might be perceived as an external evaluation with possible negative impact with their local stakeholders. However, uniformly the programs indicated that the process had been positive and helpful and they would recommend it for other programs. The majority of programs indicated that the process supported strategic planning for the program’s future. While some impacts from the assessment were noted immediately (for example, the recognition of the program within the structure of the ministry, support for the budget), the long range effectiveness of the process and its usefulness to benchmark progress from year to year has not yet been determined.
The implementation had some limitations in assuring a complete view of the programs. These included the lack of available documentation for all program components, the lack of time for site visits to field training sites, and a possible bias in the selection of persons to interview from large or older programs. Additionally, the curriculum was only given a cursory review in this process and the quality of the trainee’s work was not assessed directly.
Assessment findings
Review of the minimum and maximum score for each indicator across the seven programs showed a range of values for each indicator. The minimum scores for each indicator ranged from 1 to 3 with a median score of 2. All but 5 of the indicators were scored at level 4 (advanced functioning) for at least one program. No program scored uniformly high or low across all indicators. This demonstrates that the programs had a variety of strengths and weaknesses that could be individually identified with this process. Programs used these findings to advocate and receive more staff, to create more appropriate positions for program graduates and to improve their processes for assuring residents competencies. Examples of recommendations based on the findings that were accepted and at least partially implemented are listed in Table 2. Early review has indicated that while not all the recommendations have been implemented, the report and clear recommendations have been useful for the program planning. Further efforts will continue to assist programs in implementing and maintaining program improvement.
DISCUSSION
Through the use of the tool and the facilitated self-
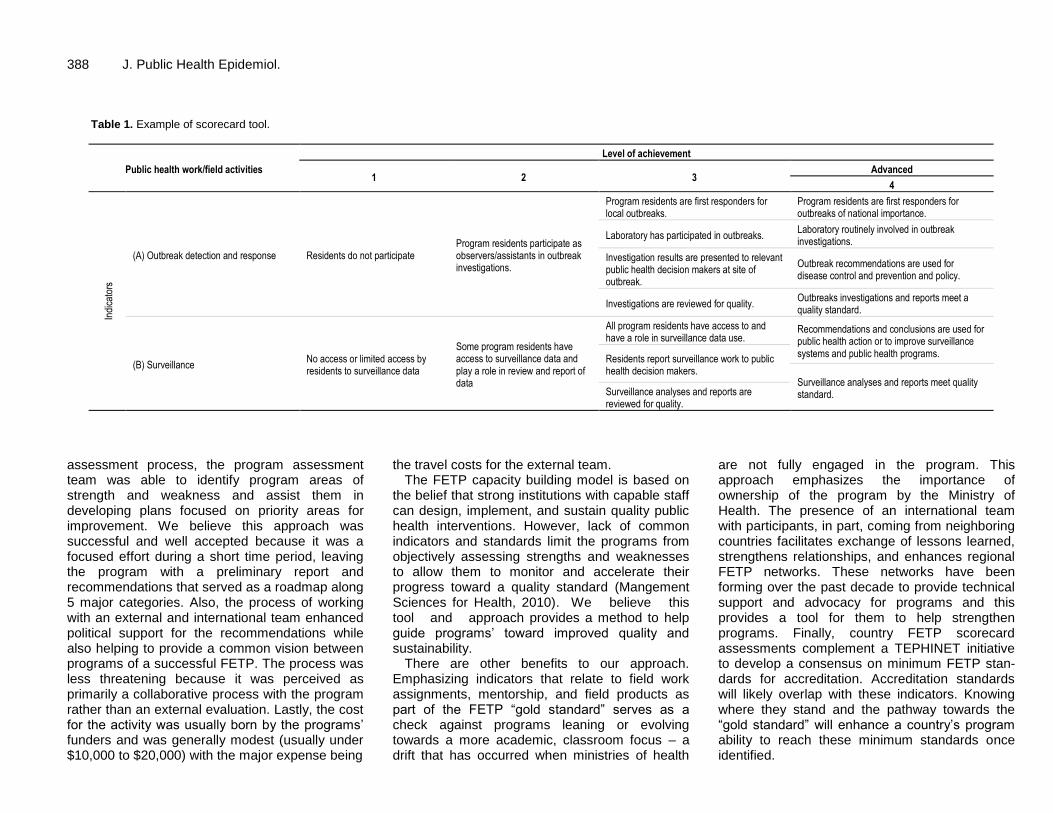
388 J. Public Health Epidemiol.
Table 1. Example of scorecard tool.
Public health work/field activities
Level of achievement
1 2 3 Advanced
4
Indi
cato
rs
(A) Outbreak detection and response Residents do not participate Program residents participate as observers/assistants in outbreak investigations.
Program residents are first responders for local outbreaks.
Program residents are first responders for outbreaks of national importance.
Laboratory has participated in outbreaks. Laboratory routinely involved in outbreak investigations.
Investigation results are presented to relevant public health decision makers at site of outbreak.
Outbreak recommendations are used for disease control and prevention and policy.
Investigations are reviewed for quality. Outbreaks investigations and reports meet a quality standard.
(B) Surveillance No access or limited access by residents to surveillance data
Some program residents have access to surveillance data and play a role in review and report of data
All program residents have access to and have a role in surveillance data use.
Recommendations and conclusions are used for public health action or to improve surveillance systems and public health programs.
Residents report surveillance work to public health decision makers.
Surveillance analyses and reports meet quality standard. Surveillance analyses and reports are
reviewed for quality.
assessment process, the program assessment team was able to identify program areas of strength and weakness and assist them in developing plans focused on priority areas for improvement. We believe this approach was successful and well accepted because it was a focused effort during a short time period, leaving the program with a preliminary report and recommendations that served as a roadmap along 5 major categories. Also, the process of working with an external and international team enhanced political support for the recommendations while also helping to provide a common vision between programs of a successful FETP. The process was less threatening because it was perceived as primarily a collaborative process with the program rather than an external evaluation. Lastly, the cost for the activity was usually born by the programs’ funders and was generally modest (usually under $10,000 to $20,000) with the major expense being
the travel costs for the external team. The FETP capacity building model is based on
the belief that strong institutions with capable staff can design, implement, and sustain quality public health interventions. However, lack of common indicators and standards limit the programs from objectively assessing strengths and weaknesses to allow them to monitor and accelerate their progress toward a quality standard (Mangement Sciences for Health, 2010). We believe this tool and approach provides a method to help guide programs’ toward improved quality and sustainability.
There are other benefits to our approach. Emphasizing indicators that relate to field work assignments, mentorship, and field products as part of the FETP “gold standard” serves as a check against programs leaning or evolving towards a more academic, classroom focus – a drift that has occurred when ministries of health
are not fully engaged in the program. This approach emphasizes the importance of ownership of the program by the Ministry of Health. The presence of an international team with participants, in part, coming from neighboring countries facilitates exchange of lessons learned, strengthens relationships, and enhances regional FETP networks. These networks have been forming over the past decade to provide technical support and advocacy for programs and this provides a tool for them to help strengthen programs. Finally, country FETP scorecard assessments complement a TEPHINET initiative to develop a consensus on minimum FETP stan-dards for accreditation. Accreditation standards will likely overlap with these indicators. Knowing where they stand and the pathway towards the “gold standard” will enhance a country’s program ability to reach these minimum standards once identified.

Jones et al. 389
Table 2. Use of the scorecard assessment results; examples of weaknesses, recommendations and actions taken.
Weakness identified by domain Recommendation Action taken
Competency-based training
Program does not have a systematic process to assure that all trainees complete all required activities.
Implement routine tracking of activity completion
The program has begun enforcement of the written record of all program deliverables. For the first time in the program’s history, all the completing trainees this year were required to submit copies of all their deliverables.
Public health work/field activities
While conducting outbreak investigations is an area of strength for the program, the program is not assuring the follow up, local presentation and use of findings.
Develop expectation that outbreak reports will be presented locally (district and/or provincial health teams) as well as find ways to do more to follow up on the use/implementation of outbreak recommendations.
Disseminations meetings now occur every month to report investigation findings to broad range of stakeholders.
Management
Program staffing inadequate and unstable
Increase numbers and stability of staffing
The scorecard assessment led to increased stability of the coordinating staff. One program created a new position in program for a graduate.
Assessment provided institutional visibility and status, which was a key factor in securing financial support for the program
Public health leadership development
Graduates not employed in appropriate positions in public health system
Develop appropriate positions for epidemiologists within the MOH system
Advocacy plan developed with Ministry of Health
Position of provincial epidemiologist developed.
Sustainability
Lack of strategic planning Develop strategic plan
The scorecard assessment was the basis for formulation of a strategic plan which included redesign of the curriculum based on the competencies and strengthening of program mentors.
Conclusion
This assessment method has been recently endorsed by leadership of TEPHINET and is recommended for consideration by further FETP programs as part of the quality improvement process for FETP. The tool also is considered valuable to CDC as a principal supporter of FETP development as it provides a standard approach to program improvement. We plan to expand this to other programs and to continue to review and improve the process. While preliminary, we believe this tool is an approach that could be helpful in a variety of other public health capacity building programs. Other types of programs will need to develop indicators and quality steps for their own circumstances. In doing so, they will provide the tools necessary for both baseline assessment and a roadmap for improvement. Our experience has shown these efforts to yield a high return on a modest
investment of time and energy. We believe the effort is worthwhile. ACKNOWLEDGEMENTS The authors would like to thank all the countries and individuals who participated in the initial piloting of the scorecard and subsequent country scorecard assessments. DISCLOSURE STATEMENT The findings and conclusions in this report are those of the author(s) and do not necessarily represent the official position of the Centers for Disease Control and Prevention.

390 J. Public Health Epidemiol. REFERENCES Betts CD (1998). Final report on evaluation of the field epidemiology
training program (FETP). Arlington, Va., Battelle. Centers for Disease Control and Prevention (2011).
"http://www.cdc.gov/flu/pdf/professionals/national_inventory_of_core_ca pabilities.pdf." Retrieved 6/20/2012.
Jones DS, Tshimanga M, Woelk G, Nsubuga P, Sunderland NL, Hader SL, St Louis ME (2009). Increasing leadership capacity for HIV/AIDS programmes by strengthening public health epidemiology and management training in Zimbabwe. Hum. Resour. Health 7:69.
Kandun IN, Samaan G, Santoso H, Kushadiwijaya H, Juwita R, Mohadir A, Aditama T (2010). Strengthening Indonesia's Field Epidemiology Training Programme to address International Health Regulations requirements. Bull. World Health Organ. 88(3):211-215.
Lopez A, Caceres VM (2008). Central America Field Epidemiology Training Program (CA FETP): a pathway to sustainable public health capacity development. Hum. Resour. Health 6:27.
Management Sciences for Health (2010). Challenges Encountered in Capacity Building:Review of Literature and Selected Tools. Position Paper, Managment Sciences for Health. p. 45.
Nsubuga P, White M, Fontaine R, Simone P (2008). Training
programmes for field epidemiology. Lancet 371(9613):630-631. Revision of the International Health Regulations Geneva: World Health
Organization; 2005. Available from: http://www.who.int/ihr/en/[accessed 10 July 2013].
Schneider D, Evering-Watley M, Walke H, Bloland P (2012). Training the Global Public Health Workforce Through Applied Epidemiology Training Programs: CDC's Experience, 1951-2011. Public Health Reviews 33(1):190-203.
TEPHINET (2005). Continuous Quality Improvement Handbook Version 1.0.
White ME, McDonnell SM, Werker DH, Cardenas VM, Thacker SB (2001). Partnerships in international applied epidemiology training and service, 1975-2001. Am. J. Epidemiol. 154:993-999.

Vol. 5(9), pp. 391-396, September, 2013
DOI: 10.5897/JPHE2013.0551
ISSN 2141-2316 ©2013 Academic Journals
http://www.academicjournals.org/JPHE
Journal of Public Health and
Epidemiology
Full Length Research Paper
Level of awareness and use of insecticide treated bed nets among pregnant women attending antenatal clinics in Anambra State, South Eastern Nigeria
Ukibe S. N1*, Mbanugo J. I.2, Ukibe N. R.3 and Ikeakor L. C.4
1Department of Prosthesis and Orthopaedic Technology, School of Health Technology, Federal University of
Technology, Owerri (FUTO) P.M.B 1526, Owerri, Imo State, Nigeria. 2Department of Parasitology and Entomology, Faculty of Biosciences, Nnamdi Azikiwe University, Awka, Anambra
State, Nigeria. 3Department of Human Biochemistry, Faculty of Health Sciences, Nnamdi Azikiwe University, Nnewi campus, PMB
5001, Nnewi, Nigeria. 4Department of Obstetrics and Gynaecology, Faculty of Health Sciences, Anambra State University Teaching Hospital,
Awka, Nigeria.
Accepted 25 July, 2013
This was a cross sectional study designed to assess the level of awareness, ownership and use of insecticide treated bed nets (ITNs) by pregnant women attending antenatal clinics in Anambra state, South Eastern Nigeria. A structured questionnaire was self administered to 700 volunteer pregnant women aged 17 to 45 years recruited during routine antenatal care in selected hospitals in the study area to capture information on use of ITNs. The information obtained was analyzed using simple ratios, percentages and charts. The result showed that 651 (93%) of the women were fully aware of the use of ITNs during pregnancy, 420 (60%) owned ITNs in their homes while only 308 (46%) used the nets partially or wholly, and 392 (56%) never used the nets. The level of awareness of pregnant women concerning the use of ITNs was high while actual ownership and use was low. Public health education needs to be intensified to create more awareness and increase ownership and use. Key words: Insecticide treated nets, pregnant women, Anambra State, South Eastern Nigeria.
INTRODUCTION Insecticide treated bed nets (ITNs) were introduced in Nigeria as an effective means of preventing mosquito bites and malaria transmission following the meeting of African Heads of States in Abuja, Nigeria in the year 2000 (RBM, 2010) . Pregnant women and children aged 0 to 5 years were the main target populations being the
people most affected by the malaria scorge (Richard et al., 2001; Okwa, 2004). Following this giant stride in preventive medicine, studies (Gamble et al., 2006; Adeyemi et al., 2007) have shown that ITN use in preg-nancy reduced the incidence of malaria in pregnancy and hence the incidence of pregnancy related complications
*Corresponding author. Email: [email protected]. Tel: 08035000346.

392 J. Public Health Epidemiol. such as premature deliveries, low birth weight babies, maternal anaemia and intra uterine foetal deaths.
Despite the concerted efforts made by the various health authorities to promote the use of ITNs by pregnant women, studies (Ganihu and Jimo, 2003; Isah and Nwobodo, 2009; Salaudeen and Jimoh, 2009; Musa et al., 2009; Iwu et al., 2010; Oche et al., 2011; Aina and Ayeni, 2011; Okoye and Isara, 2011; Aluko and Oluwatosin, 2012; Runsewe-Abiodu et al., 2012) have shown that the level of awareness, ownership, and actual use of ITNs by pregnant women has varied from one locality or zone to the other. Although the awareness level has improved over time, studies (Osero et al., 2005; Adeneye et al., 2007) have shown that a lot of factors still militate against actual ownership and correct use of ITNs. Insecticide treated nets (ITNs) provide effective barrier or shield between the user and mosquitoes or other biting insects thereby protecting against mosquito bites and malaria transmission. The increased prevalence of malaria in pregnancy as reported by some studies (Mbanugo and Okorudo, 2005; Aribodor et al., 2007) suggest that all is not well with the awareness or use of ITNs in Anambra state. The present study was therefore designed to assess the level of awareness, ownership and use of ITNs by pregnant women attending antenatal clinics in hospitals in Anambra State, South East of Nigeria. MATERIALS AND METHODS Study area Five different hospitals located in three major cities in Anambra state namely Awka, Onitsha, and Nnewi were chosen for the study. These hospitals include: 1. General Hospital/Anambra State University Teaching Hospital, Awka: This is the biggest state owned tertiary health institution located in the heart of the state capital Awka, with an estimated population of about 300,000 people (NPC, 2006). 2. Divine Hospital and Maternity, Awka: This is one of the busiest privately owned health institutions in the state patronized by a lot of pregnant women in the state capital and its environs. 3. Christ the King Hospital and Maternity, Awka: Like the above named hospital, this is a specialized health institution that caters for a large population of pregnant women in the state capital and its environs. 4. General Hospital Onitsha: Is the second largest state owned secondary care health institution catering for an estimated population of more than 300,000 people. 5. Life Specialist Hospital Nnewi: Is a specialist centre located in the centre of Nnewi, the third largest commercial city of the state. It is owned and managed by a Professor of reproductive health. Anambra State is located in the South Eastern part of Nigeria with a population of 4.9 million (NPC, 2006). The state is bounded to the east by Enugu state, to the West by Delta state, to the North by Kogi state and to the South by Imo state.
Study population 700 volunteer pregnant women aged 17 to 45 years were recruited for the study between January, 2012 and March, 2013. The age range represents the reproductive age. To arrive at the sample size, the annual 3% growth rate for the female population in Nigeria was determined as at 2004. The population of women of repro-ductive age which is 49% of all female population was determined. Pregnant women constitute 5% of women of reproductive age and this was also determined. The figures obtained were substituted in the formula for calculation of sample size. Informed consent was obtained from them and due permission was sought for and obtained from the Heads of the different hospitals used for the study. Questionnaire administration A structured questionnaire was self administered to the women to obtain information on biodata, awareness ownership and use of ITNs during pregnancy among other information. The questionnaire was composed of five sections A to E, with section C dwelling on use of ITNs. Statistical analysis The version 16 of statistical package for social sciences (SPSS) was used for statistical analysis. Analysis of variance (ANOVA) was used, and simple graphs and charts were used for data representation.
RESULTS A total of 700 respondents aged between 17 and 45 years participated in the study. Their educational background varied from no formal education 60 (8.6%), primary education 180 (25.7%), secondary education 350 (50%), and tertiary education 90 (12.9%). Six hundred and fifty one representing 93% Figure 1, were fully aware of the use of ITNs during pregnancy. 420 representing 60% Figure 2, owned ITNs in their homes while a total of 308 (44%) Figure 3, used the nets partly or wholly during pregnancy. A total of 392 pregnant women (56%) Figure 3, never used the nets. DISCUSSION The awareness level of 93% observed in the present study shows that most of the pregnant women attending antenatal clinics in Anambra state were adequately informed about the use of ITNs during pregnancy. This suggests that a lot of health education has actually taken place. Reports from previous studies in Nigeria and other African countries put the awareness level at between 36 and 91% (Ganihu and Jimo, 2003;
Gamble et al., 2006;
Aluko and Oluwatosin, 2012; Adeyemi et al., 2007;
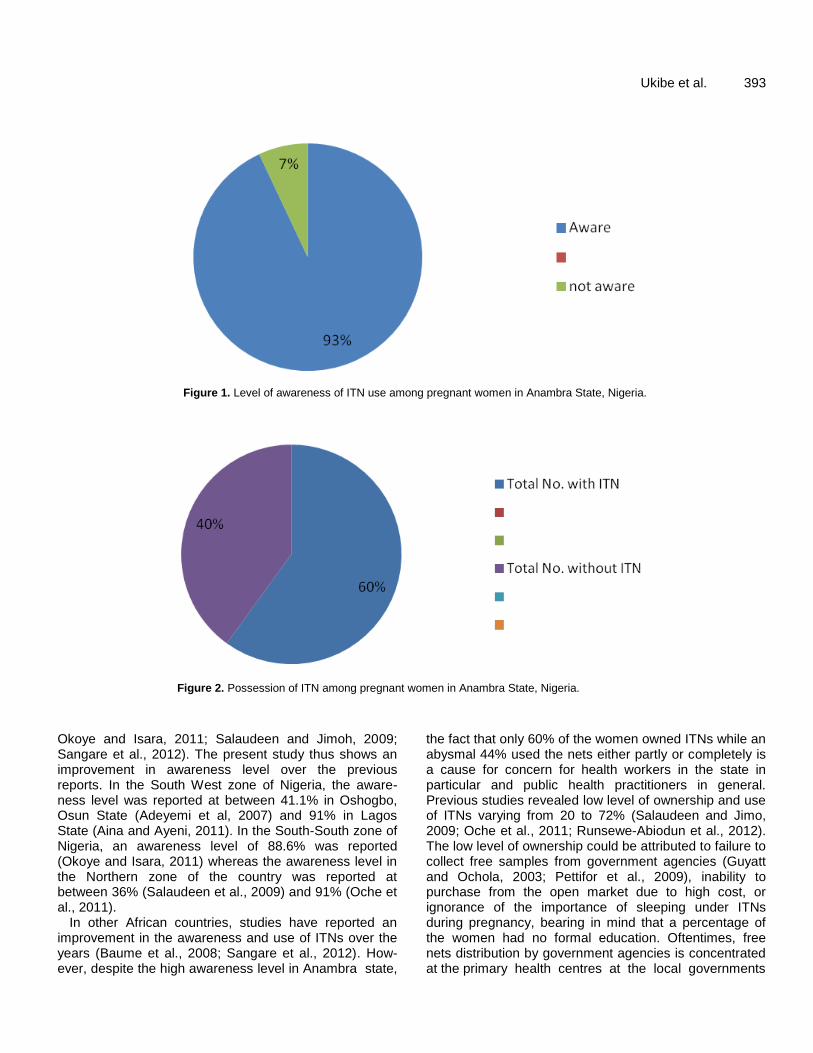
Ukibe et al. 393
Figure 1. Level of awareness of ITN use among pregnant women in Anambra State, Nigeria.
Figure 2. Possession of ITN among pregnant women in Anambra State, Nigeria.
Okoye and Isara, 2011; Salaudeen and Jimoh, 2009; Sangare et al., 2012). The present study thus shows an improvement in awareness level over the previous reports. In the South West zone of Nigeria, the aware-ness level was reported at between 41.1% in Oshogbo, Osun State (Adeyemi et al, 2007) and 91% in Lagos State (Aina and Ayeni, 2011). In the South-South zone of Nigeria, an awareness level of 88.6% was reported (Okoye and Isara, 2011) whereas the awareness level in the Northern zone of the country was reported at between 36% (Salaudeen et al., 2009) and 91% (Oche et al., 2011).
In other African countries, studies have reported an improvement in the awareness and use of ITNs over the years (Baume et al., 2008; Sangare et al., 2012). How-ever, despite the high awareness level in Anambra state,
the fact that only 60% of the women owned ITNs while an abysmal 44% used the nets either partly or completely is a cause for concern for health workers in the state in particular and public health practitioners in general. Previous studies revealed low level of ownership and use of ITNs varying from 20 to 72% (Salaudeen and Jimo, 2009; Oche et al., 2011; Runsewe-Abiodun et al., 2012). The low level of ownership could be attributed to failure to collect free samples from government agencies (Guyatt and Ochola, 2003; Pettifor et al., 2009), inability to purchase from the open market due to high cost, or ignorance of the importance of sleeping under ITNs during pregnancy, bearing in mind that a percentage of the women had no formal education. Oftentimes, free nets distribution by government agencies is concentrated at the primary health centres at the local governments
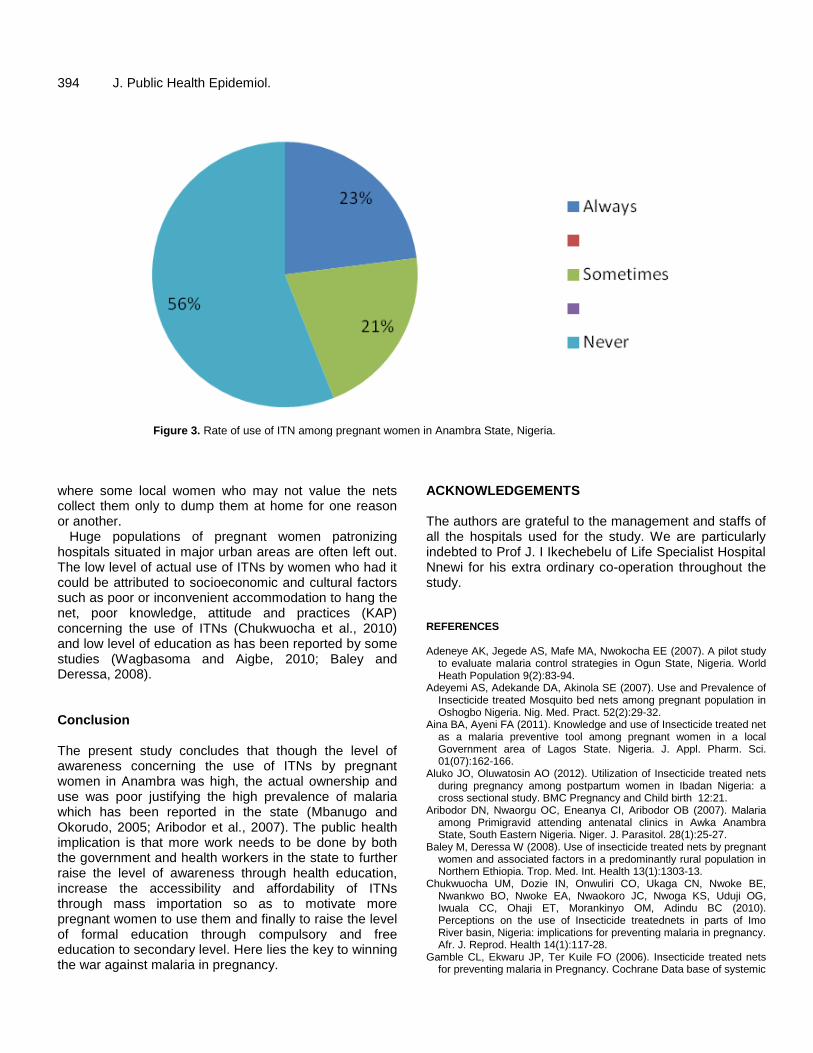
394 J. Public Health Epidemiol.
Figure 3. Rate of use of ITN among pregnant women in Anambra State, Nigeria.
where some local women who may not value the nets collect them only to dump them at home for one reason or another.
Huge populations of pregnant women patronizing hospitals situated in major urban areas are often left out. The low level of actual use of ITNs by women who had it could be attributed to socioeconomic and cultural factors such as poor or inconvenient accommodation to hang the net, poor knowledge, attitude and practices (KAP) concerning the use of ITNs (Chukwuocha et al., 2010) and low level of education as has been reported by some studies (Wagbasoma and Aigbe, 2010; Baley and Deressa, 2008). Conclusion The present study concludes that though the level of awareness concerning the use of ITNs by pregnant women in Anambra was high, the actual ownership and use was poor justifying the high prevalence of malaria which has been reported in the state (Mbanugo and Okorudo, 2005; Aribodor et al., 2007).
The public health
implication is that more work needs to be done by both the government and health workers in the state to further raise the level of awareness through health education, increase the accessibility and affordability of ITNs through mass importation so as to motivate more pregnant women to use them and finally to raise the level of formal education through compulsory and free education to secondary level. Here lies the key to winning the war against malaria in pregnancy.
ACKNOWLEDGEMENTS The authors are grateful to the management and staffs of all the hospitals used for the study. We are particularly indebted to Prof J. I Ikechebelu of Life Specialist Hospital Nnewi for his extra ordinary co-operation throughout the study. REFERENCES Adeneye AK, Jegede AS, Mafe MA, Nwokocha EE (2007). A pilot study
to evaluate malaria control strategies in Ogun State, Nigeria. World Heath Population 9(2):83-94.
Adeyemi AS, Adekande DA, Akinola SE (2007). Use and Prevalence of Insecticide treated Mosquito bed nets among pregnant population in Oshogbo Nigeria. Nig. Med. Pract. 52(2):29-32.
Aina BA, Ayeni FA (2011). Knowledge and use of Insecticide treated net as a malaria preventive tool among pregnant women in a local Government area of Lagos State. Nigeria. J. Appl. Pharm. Sci. 01(07):162-166.
Aluko JO, Oluwatosin AO (2012). Utilization of Insecticide treated nets during pregnancy among postpartum women in Ibadan Nigeria: a cross sectional study. BMC Pregnancy and Child birth 12:21.
Aribodor DN, Nwaorgu OC, Eneanya CI, Aribodor OB (2007). Malaria among Primigravid attending antenatal clinics in Awka Anambra State, South Eastern Nigeria. Niger. J. Parasitol. 28(1):25-27.
Baley M, Deressa W (2008). Use of insecticide treated nets by pregnant women and associated factors in a predominantly rural population in Northern Ethiopia. Trop. Med. Int. Health 13(1):1303-13.
Chukwuocha UM, Dozie IN, Onwuliri CO, Ukaga CN, Nwoke BE, Nwankwo BO, Nwoke EA, Nwaokoro JC, Nwoga KS, Uduji OG, Iwuala CC, Ohaji ET, Morankinyo OM, Adindu BC (2010). Perceptions on the use of Insecticide treatednets in parts of Imo River basin, Nigeria: implications for preventing malaria in pregnancy. Afr. J. Reprod. Health 14(1):117-28.
Gamble CL, Ekwaru JP, Ter Kuile FO (2006). Insecticide treated nets for preventing malaria in Pregnancy. Cochrane Data base of systemic
reviews, Accessed: http://www.cochrane.org/reviews/en. Ganihu AS, Jimo RO (2003). Awareness and Use of Insecticide treated
nets among women attending antenatal clinic in a Northern state of Nigeria. J. Pak. Med. Assoc. 6:4-9.
Guyatt H, Ochola S (2003). Use of bednets given free to pregnant women in Kenya. Lancet 62(9395):1549-1550.
Isah AY, Nwobodo (2009). Awareness and Utilization of Insecticide treated mosquito nets among pregnant mothers in a tertiary health institution in North- Western Nigeria. Niger J. Med. 18(2):175-178.
Iwu RU, Ijioma BC, Egeruoh AS, Awurum IN, Ohalete CN (2010). Awareness and use of Insecticide treated among pregnant women attending antenatal clinic at Federal Medical centre and General Hospital Owerri, Imo State. Report and Opinion 2(12):154-157.
Mbanugo JI, Okorudo O (2005). Prevalence of Plasmodium infections in Pregnant women in Aguata, Anambra state, South Eastern Nigeria. J. Environ. Health 2(2):64-68.
Musa OI, Salaudeen GA, Jimo RO (2009). Awareness and use of Insecticide treated nets among women attending antenatal clinic in a Northern state of Nigeria. J. Pak. Med. Assoc. 59(6):354-358.
National Population Commission (NPC), 2006. Oche MO, Ameh IG, Umar AS, Gana G, Njoku CH (2011). Awareness
and Use of Insecticide treated nets among pregnant women attending antenatal at Usman Dan Fodio University Teaching Hospital Sokoto. Niger. J. Parasitol. ISSN:1117-4145
Okoye CA, Isara AR (2011). Awareness on the use of Insecticide treated nets among women attending antenatal clinic in a tertiary heath facility in South- South Nigeria. Niger. Med. Pract. J. 52(2):67-70.
Okwa OO (2004). Preliminary investigations on malaria in sickle cell patients among pregnant women ang infants in Lagos, Nigeria. Niger. J. Parasitol. 25:81-85.
Osero JS, Otieno ME, Orago AS (2005). Maternal use of Insecticide treated nets in the prevention of malaria among children under 5 years in Nyamira district Kenya. East Afr. Med. J. 82(10):495-500.
Ukibe et al. 395 Pettifor A, Tailor E, Nku D, Duvail S, Tabala M, Mwandagarliwa K,
Meshnick S, Bechets E (2009). Free distribution of insecticide treated bed nets to pregnant women in Kinshasa: an effective way to achieve 80% use by women and their newborns. Trop. Med. Int. Health. 14(1):20-28.
Richard WS, Bernard L, Nah L, Mornica E, Parise, Clara M (2001). The burden of malaria in pregnancy in malaria endemic areas. Am. J. Trop. Med. Hyg. 64(12)S:28-35.
Roll Back Malaria (RBM) (2010) .Insecticide treated Mosquito nets WHO2001-2010.
Runsewe- Abiodun TI, Inyanwura AC, Sotimehin SA (2012). Awareness and knowledge about Insecticide treated nets amongst pregnant mothers in Ogun state, Western Nigeria: A descriptive cross sectional syudy. Educ. Res. J. 2(5):138-145.
Salaudeen GA, Jimoh (2009). Awareness and use of insecticide treated nets among women attending antenatal clinics in a Northern state of Nigeria. J. Pak. Med. Assoc. Accessed: http://www.jpma.org.pk.
Sangare IR, Weis NS, Brentlinger PE, Richardson BA, Staekete SG, Kiwuwa, MS, Stergachis A (2012). Determination of use of Insecticide treated nets for the prevention of malaria in pregnancy:Jinga Uganda. PLOS ONE 7(6):e39712doi101371/journal.003901.
Wagbasoma VA, Aigbe EE (2010). ITNs Utilization among pregnant women attending ANC in Etsako West LGA, Edo state. Niger J. Clin. Pract. 13(2):144-148.

396 J. Public Health Epidemiol. QUESTIONNAIRE Section A: Personal Data 1. Name-------------------------------------------------------------Optional 2. Age---------------------------------------------------------------------- 3. Educational Qualification: a) Primary b) Secondary c) Tertiary/university d) none 4. Occupation: a) Trader b) Civil servant c) Professional (Lawyer, doctor, engineer, accountant etc) d) Student e) Unemployed housewife f) artisan/handcraft 5. Nature of residential accommodation: a) one-room apartment b) 2-room apartment c) two-bed room flat d) 3-bed room flat e)Duplex /family house Section B: Obstetrics history: 6. Date of last menstrual cycle (LMP) ---------------------------------------------- 7. No of previous pregnancies: a) None (primip) b) one c) two d) three e) four or above 8. Duration of present pregnancy: 9. a)0-3months (1
st trimester) b) 4-6 months (2
nd trimester) c)7-9 months (3
rd trimester) d) >9 months
10. Time of registration for ANC: a) 0-3 months b) 4-6 months c) 7-9 months Section C: Use of Insecticide Treated bed Nets (ITNs): 11. Do you know that ITN should be used during pregnancy? 12. a) Yes b) No 13. Do you have ITN? 14. a) Yes b) No 15. If yes have you been sleeping regularly inside ITN during the present pregnancy? a) Yes sometimes b) yes always c)Never 16 If No, why have you not been using the nets regularly? a) It causes excessive heat b) Accommodation not convenient to hang it c) I can’t afford it d) I don’t like it e) Other reasons (state) Section D: Malaria history 16 Have you had any of the following problems since you became pregnant? a) Fever b)headache c) Chills/cold d) joint pains e) Tiredness f) loss of appetite g) others (state) 17 Has your doctor treated you of malaria since you became pregnant? a) Yes b) No 18 Are you on malaria preventive tablets? a) Yes b) No Section E: Pregnancy outcome (to be filled by researcher) a) Normal delivery b) Preterm delivery c) Intra-uterine foetal death (IUD) d) Baby’s birth weight-----------------------e) Mothers Hb level------------------------
Vol. 5(9), pp. 397-401, September, 2013
DOI: 10.5897/JPHE2013.0539
ISSN 2141-2316 ©2013 Academic Journals
http://www.academicjournals.org/JPHE
Journal of Public Health and Epidemiology
Full Length Research Paper
Race and ethnicity of mothers with Spanish surnames
Carlos R. Oliveira*, Alicia Guzman, Gaynelle Hensely, Melissa H. Leps, Nancy A. Miller and Pablo J. Sánchez
Department of Pediatrics, University of Texas Southwestern Medical Center, Dallas, TX, United States.
Accepted 19 July, 2013
The objective of this study was to assess how hospital designation of race/ethnicity based on Spanish surnames of mothers correlated with the self-report, and explores how these mothers identified their own race/ethnicity using the National Institutes of Health (NIH) categories. 235 mothers were enrolled prospectively and asked to report their race/ethnicity. Positive predictive value (PPV) of using surnames as a tool for assigning race/ethnicity was determined. The PPV of using surnames to identify ethnicity and race was 79 and 30%, respectively. 57% of mothers could not identify their race by the NIH categories. Although Spanish surnames more accurately reflected ethnicity than race, its use was associated with substantial discrepancies. Key words: Race, ethnicity, self-report, Latino.
INTRODUCTION Determination of the race and ethnicity of enrolled subjects in clinical studies is important, as these charac-teristics may be associated with disease prevalence, risk factors, and outcomes. However, investigators often interchange these terms and may even consider them as synonymous. Historically, race has been defined as groups of people who have differences and similarities in biological traits, while ethnicity refers to those with a shared cultural heritage. As our knowledge of evolutionary forces such as genetic drift, founder effect, and selection improve, the distinction between race and ethnicity becomes increasingly important.
Government agencies in the United States historically have been inconsistent with its classifications of race and ethnicity. Starting in 1870, the U.S. Bureau of Census recognized five races: “White, Black, Mulattoes, Chinese and Indian.” In 1950, the categories were narrowed down to three: “White, Black and Other”. Forty years later, the United States Census broadened the racial categories back to five: “White, Black, Asian, Pacific Islander/Native Hawaiian, and American Indian/Alaska Native.” In 1990, “Hispanic” was added to the Census as an ethnicity. Currently, the National Institutes of Health (NIH) requires
clinical investigators to classify a study population into two ethnic categories (Hispanic and Non-Hispanic) and six racial categories (American Indian/Alaskan Native, Asian, Black/African American, Native Hawaiian/Pacific Islander, White and other). Collecting race and ethnicity data for research purposes can be challenging as self-report is not always available. Surname lists were developed and are used by the United States Bureau of the Census as a method for identifying the Hispanic population. The use of surnames has since then been adopted by researchers and institutions in order to aid with classification of race and ethnicity. More information on the accuracy of such classification would be beneficial to researchers interested in ethnic and racial disparities.
As part of an observational study of very low birth weight (VLBW) infants admitted to the neonatal intensive care unit (NICU), mothers with Spanish surnames were asked about their ethnicity and race. The objective of this study was to assess whether the hospital assigned race and ethnicity based on Spanish surnames would match the self-reported race and ethnicity. Additionally, this study explored how mothers with Spanish surnames would identify their own race and ethnicity using the
*Corresponding author. E-mail: [email protected]. Tel: 214-202-7566. Fax: 1-888-353-0402.
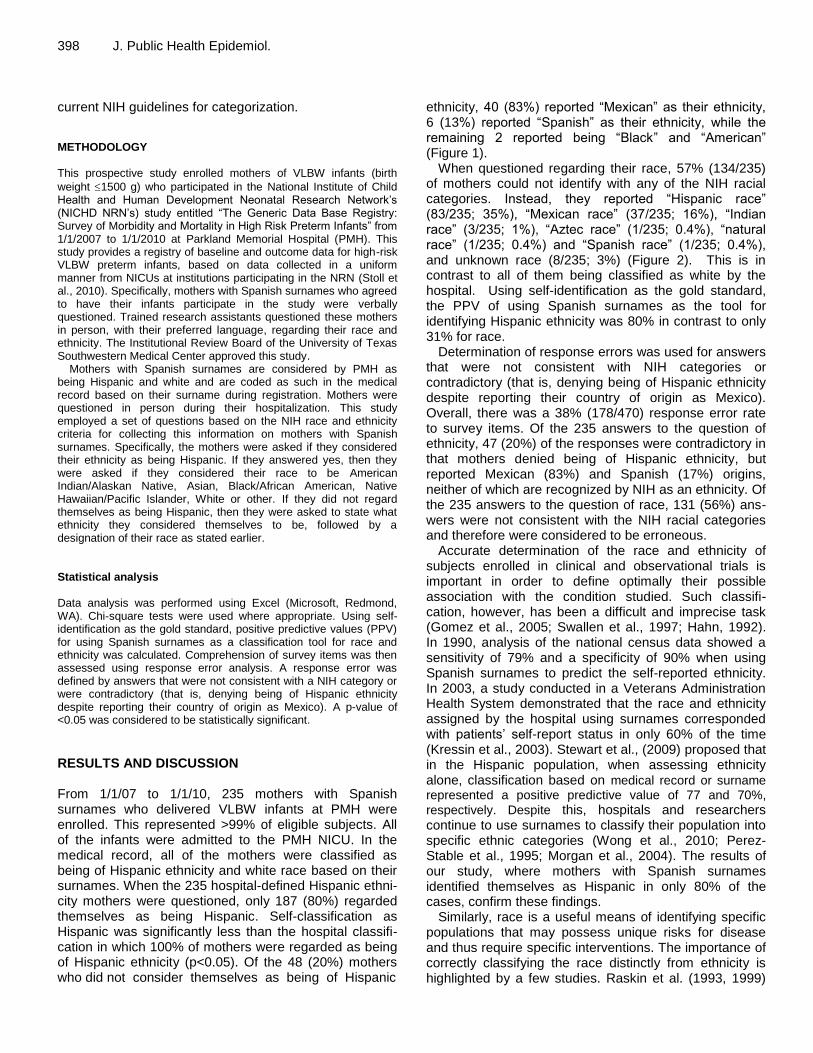
398 J. Public Health Epidemiol. current NIH guidelines for categorization. METHODOLOGY This prospective study enrolled mothers of VLBW infants (birth
weight 1500 g) who participated in the National Institute of Child Health and Human Development Neonatal Research Network’s (NICHD NRN’s) study entitled “The Generic Data Base Registry: Survey of Morbidity and Mortality in High Risk Preterm Infants” from 1/1/2007 to 1/1/2010 at Parkland Memorial Hospital (PMH). This study provides a registry of baseline and outcome data for high-risk VLBW preterm infants, based on data collected in a uniform manner from NICUs at institutions participating in the NRN (Stoll et al., 2010). Specifically, mothers with Spanish surnames who agreed to have their infants participate in the study were verbally questioned. Trained research assistants questioned these mothers in person, with their preferred language, regarding their race and ethnicity. The Institutional Review Board of the University of Texas Southwestern Medical Center approved this study.
Mothers with Spanish surnames are considered by PMH as being Hispanic and white and are coded as such in the medical record based on their surname during registration. Mothers were questioned in person during their hospitalization. This study employed a set of questions based on the NIH race and ethnicity criteria for collecting this information on mothers with Spanish surnames. Specifically, the mothers were asked if they considered their ethnicity as being Hispanic. If they answered yes, then they were asked if they considered their race to be American Indian/Alaskan Native, Asian, Black/African American, Native Hawaiian/Pacific Islander, White or other. If they did not regard themselves as being Hispanic, then they were asked to state what ethnicity they considered themselves to be, followed by a designation of their race as stated earlier. Statistical analysis Data analysis was performed using Excel (Microsoft, Redmond, WA). Chi-square tests were used where appropriate. Using self-identification as the gold standard, positive predictive values (PPV) for using Spanish surnames as a classification tool for race and ethnicity was calculated. Comprehension of survey items was then assessed using response error analysis. A response error was defined by answers that were not consistent with a NIH category or were contradictory (that is, denying being of Hispanic ethnicity despite reporting their country of origin as Mexico). A p-value of <0.05 was considered to be statistically significant.
RESULTS AND DISCUSSION From 1/1/07 to 1/1/10, 235 mothers with Spanish surnames who delivered VLBW infants at PMH were enrolled. This represented >99% of eligible subjects. All of the infants were admitted to the PMH NICU. In the medical record, all of the mothers were classified as being of Hispanic ethnicity and white race based on their surnames. When the 235 hospital-defined Hispanic ethni-city mothers were questioned, only 187 (80%) regarded themselves as being Hispanic. Self-classification as Hispanic was significantly less than the hospital classifi-cation in which 100% of mothers were regarded as being of Hispanic ethnicity (p<0.05). Of the 48 (20%) mothers who did not consider themselves as being of Hispanic
ethnicity, 40 (83%) reported “Mexican” as their ethnicity, 6 (13%) reported “Spanish” as their ethnicity, while the remaining 2 reported being “Black” and “American” (Figure 1).
When questioned regarding their race, 57% (134/235) of mothers could not identify with any of the NIH racial categories. Instead, they reported “Hispanic race” (83/235; 35%), “Mexican race” (37/235; 16%), “Indian race” (3/235; 1%), “Aztec race” (1/235; 0.4%), “natural race” (1/235; 0.4%) and “Spanish race” (1/235; 0.4%), and unknown race (8/235; 3%) (Figure 2). This is in contrast to all of them being classified as white by the hospital. Using self-identification as the gold standard, the PPV of using Spanish surnames as the tool for identifying Hispanic ethnicity was 80% in contrast to only 31% for race.
Determination of response errors was used for answers that were not consistent with NIH categories or contradictory (that is, denying being of Hispanic ethnicity despite reporting their country of origin as Mexico). Overall, there was a 38% (178/470) response error rate to survey items. Of the 235 answers to the question of ethnicity, 47 (20%) of the responses were contradictory in that mothers denied being of Hispanic ethnicity, but reported Mexican (83%) and Spanish (17%) origins, neither of which are recognized by NIH as an ethnicity. Of the 235 answers to the question of race, 131 (56%) ans-wers were not consistent with the NIH racial categories and therefore were considered to be erroneous.
Accurate determination of the race and ethnicity of subjects enrolled in clinical and observational trials is important in order to define optimally their possible association with the condition studied. Such classifi-cation, however, has been a difficult and imprecise task (Gomez et al., 2005; Swallen et al., 1997; Hahn, 1992). In 1990, analysis of the national census data showed a sensitivity of 79% and a specificity of 90% when using Spanish surnames to predict the self-reported ethnicity. In 2003, a study conducted in a Veterans Administration Health System demonstrated that the race and ethnicity assigned by the hospital using surnames corresponded with patients’ self-report status in only 60% of the time (Kressin et al., 2003). Stewart et al., (2009) proposed that in the Hispanic population, when assessing ethnicity alone, classification based on medical record or surname represented a positive predictive value of 77 and 70%,
respectively. Despite this, hospitals and researchers continue to use surnames to classify their population into specific ethnic categories (Wong et al., 2010; Perez-Stable et al., 1995; Morgan et al., 2004). The results of our study, where mothers with Spanish surnames identified themselves as Hispanic in only 80% of the cases, confirm these findings.
Similarly, race is a useful means of identifying specific populations that may possess unique risks for disease and thus require specific interventions. The importance of correctly classifying the race distinctly from ethnicity is highlighted by a few studies. Raskin et al. (1993, 1999)
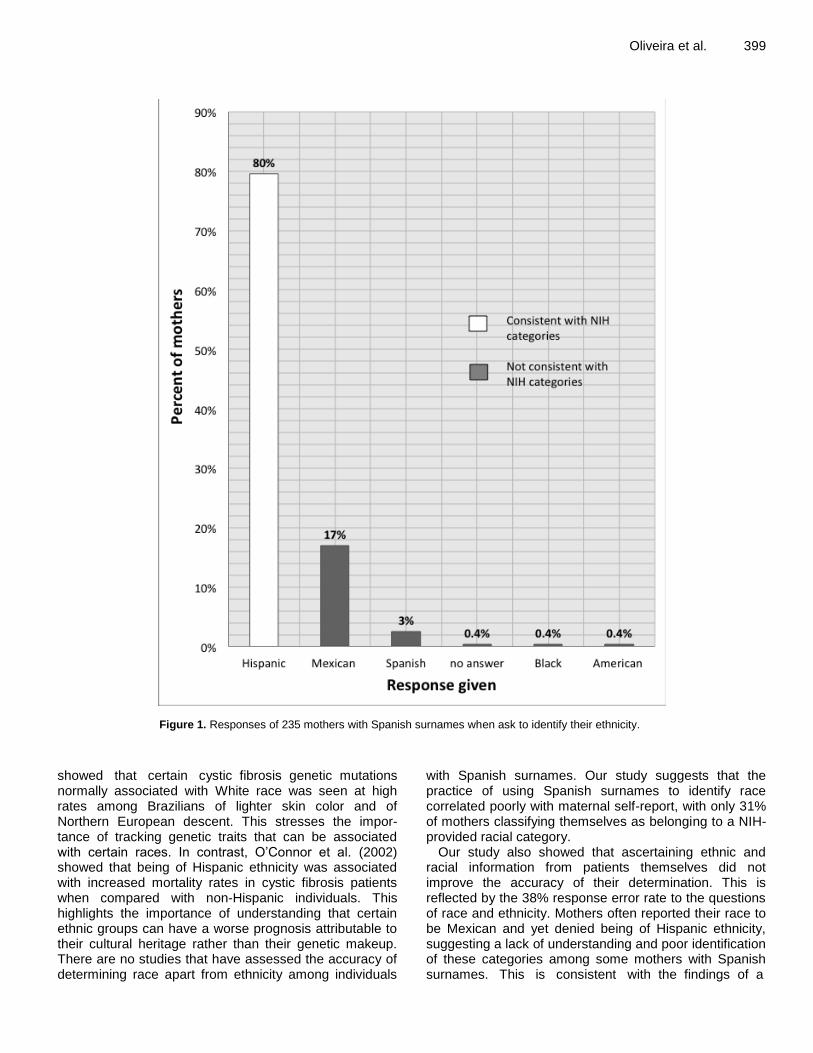
Oliveira et al. 399
Figure 1. Responses of 235 mothers with Spanish surnames when ask to identify their ethnicity.
showed that certain cystic fibrosis genetic mutations normally associated with White race was seen at high rates among Brazilians of lighter skin color and of Northern European descent. This stresses the impor-tance of tracking genetic traits that can be associated with certain races. In contrast, O’Connor et al. (2002) showed that being of Hispanic ethnicity was associated with increased mortality rates in cystic fibrosis patients when compared with non-Hispanic individuals. This highlights the importance of understanding that certain ethnic groups can have a worse prognosis attributable to their cultural heritage rather than their genetic makeup. There are no studies that have assessed the accuracy of determining race apart from ethnicity among individuals
with Spanish surnames. Our study suggests that the practice of using Spanish surnames to identify race correlated poorly with maternal self-report, with only 31% of mothers classifying themselves as belonging to a NIH-provided racial category.
Our study also showed that ascertaining ethnic and racial information from patients themselves did not improve the accuracy of their determination. This is reflected by the 38% response error rate to the questions of race and ethnicity. Mothers often reported their race to be Mexican and yet denied being of Hispanic ethnicity, suggesting a lack of understanding and poor identification of these categories among some mothers with Spanish surnames. This is consistent with the findings of a
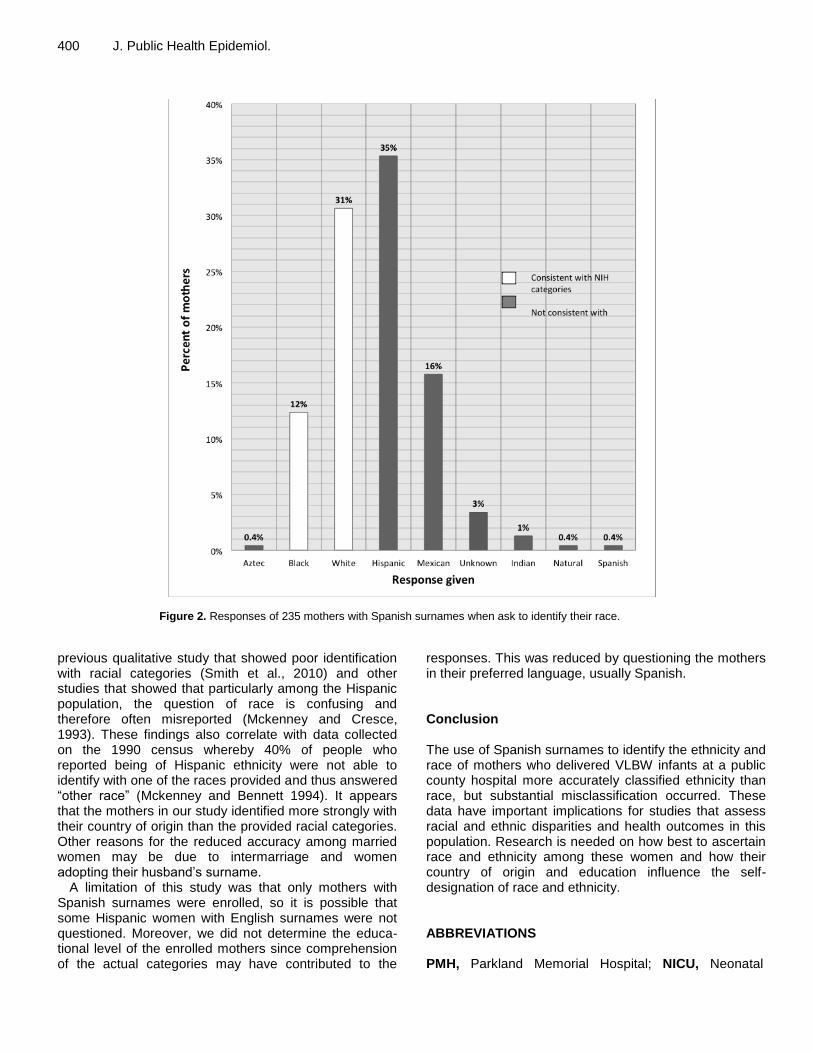
400 J. Public Health Epidemiol.
Figure 2. Responses of 235 mothers with Spanish surnames when ask to identify their race.
previous qualitative study that showed poor identification with racial categories (Smith et al., 2010) and other studies that showed that particularly among the Hispanic population, the question of race is confusing and therefore often misreported (Mckenney and Cresce, 1993). These findings also correlate with data collected on the 1990 census whereby 40% of people who reported being of Hispanic ethnicity were not able to identify with one of the races provided and thus answered “other race” (Mckenney and Bennett 1994). It appears that the mothers in our study identified more strongly with their country of origin than the provided racial categories. Other reasons for the reduced accuracy among married women may be due to intermarriage and women adopting their husband’s surname.
A limitation of this study was that only mothers with Spanish surnames were enrolled, so it is possible that some Hispanic women with English surnames were not questioned. Moreover, we did not determine the educa-tional level of the enrolled mothers since comprehension of the actual categories may have contributed to the
responses. This was reduced by questioning the mothers in their preferred language, usually Spanish. Conclusion The use of Spanish surnames to identify the ethnicity and race of mothers who delivered VLBW infants at a public county hospital more accurately classified ethnicity than race, but substantial misclassification occurred. These data have important implications for studies that assess racial and ethnic disparities and health outcomes in this population. Research is needed on how best to ascertain race and ethnicity among these women and how their country of origin and education influence the self-designation of race and ethnicity. ABBREVIATIONS PMH, Parkland Memorial Hospital; NICU, Neonatal
Intensive Care Unit; NIH, National Institutes of Health; PPV, positive predictive value; NICHD, National Institute of Child Health & Human Development; NRN, neonatal research network; VLBW, very low birth weight. REFERENCES Gomez SL, Kelsey JL, Glaser SL, Lee MM, Sidney S (2005).
Inconsistencies between self-reported ethnicity and ethnicity recorded in a health maintenance organization. Ann. Epidemiol. 1:71–9.
Hahn RA (1992). The state of federal health statistics on racial and ethnic groups. JAMA. 2:268–71.
Kressin NR, Chang B-H, Hendricks A, Kazis LE (2003). Agreement between administrative data and patients’ self-reports of race/ethnicity. Am. J. Public Health. 10:1734–9.
McKenney NR, Cresce AR (1993). Measurement of ethnicity in the United States: experiences of the U.S. Census Bureau. In Challenges of measuring an ethnic world: science, politics and reality. Proceedings of the Joint Canada-United States Conference on the Measurement of Ethnicity. April 1-3, 1992. U.S. Government Printing Office, Washington, DC, pp. 173-222.
McKenney NR, Bennett CE (1994). Issues regarding data on race and ethnicity: the Census Bureau experience. Public Health Rep. 1:16-25.
Morgan RO, Wei II, Virnig BA (2004). Improving identification of Hispanic males in Medicare: use of surname matching. Med Care. 8:810–6.
O’Connor GT, Quinton HB, Kahn R, Robichaud P, Maddock J, Lever T, Detzer M, Brooks JG (2002). Case-mix adjustment for evaluation of mortality in cystic fibrosis. Pediatr. Pulmonol. 2:99–105.
Pérez-Stable EJ, Hiatt RA, Sabogal F, Otero-Sabogal R (1995). Use of Spanish surnames to identify Latinos: comparison to self-identification. J. Natl. Cancer Inst. Monographs. 18:11–5.
Raskin S, Phillips JA 3rd, Krishnamani MR, Vnencak-Jones C, Parker
RA, Rozov T, Cardieri JM, Marostica P, Abreu F, Giugliani R (1993). DNA analysis of cystic fibrosis in Brazil by direct PCR amplification from Guthrie cards. Am. J. Med. Genet. 6:665–9.
Oliveira et al. 401 Raskin S, Phillips JA, Kaplan G, McClure M, Vnencak-Jones C, Rozov
T, Cardieri JM, Marostica P, Abreu F, Giugliani R, Reis F, Rosario NA, Ludwig N, Pereira L, Faucz F, Gabardo J, Culpi L (1999). Geographic heterogeneity of 4 common worldwide cystic fibrosis non-DF508 mutations in Brazil. Hum. Biol. 1:111–21.
Smith FD, Woo M, Austin SB (2010). “I didn”t feel like any of those things were me’: results of a qualitative pilot study of race/ethnicity survey items with minority ethnic adolescents in the USA. Ethn Health. 6:621–38.
Stewart SL, Swallen KC, Glaser SL, Horn-Ross PL, West DW (1999). Comparison of methods for classifying Hispanic ethnicity in a population-based cancer registry. Am. J. Epidemiol. 11:1063–71.
Stoll BJ, Hansen NI, Bell EF, Shankaran S, Laptook AR, Walsh MC, Hale EC, Newman NS, Schibler K, Carlo WA, Kennedy KA, Poindexter BB, Finer NN, Ehrenkranz RA, Duara S, Sánchez PJ, O'Shea TM, Goldberg RN, Van Meurs KP, Faix RG, Phelps DL, Frantz ID 3rd, Watterberg KL, Saha S, Das A, Higgins RD (2010). Neonatal outcomes of extremely preterm infants from the NICHD Neonatal Research Network. Pediatrics. 126(3):443-56.
Swallen KC, West DW, Stewart SL, Glaser SL, Horn-Ross PL (1997). Predictors of misclassification of Hispanic ethnicity in a population-based cancer registry. Ann. Epidemiol. 3:200–6.
Wong EC, Palaniappan LP, Lauderdale DS (2010). Using name lists to infer Asian racial/ethnic subgroups in the healthcare setting. Med Care. 6:540–6.
UPCOMING CONFERENCES
10th International Meeting on Microbial Epidemiological Markers (IMMEM-10), Paris, France, 2 Oct 2013
7th International Conference on Health Informatics, Angers, France, 3 Mar 2014

Conferences and Advert
August 2013
2013 Conference Environment and Health - Bridging South, North, East and West,
Basel, Switzerland, 19 Aug 2013
25th Conference of the International Society for Environmental Epidemiology, Basel, Switzerland, 19 Aug 2013
April 2014 Conference on Environmental Pollution and Public Health, Shanghai, China, 12 Apr 2014

Journal of
Public Health and
Epidemiology
Related Journals Published by Academic Journals
Journal of Diabetes and Endocrinology
Journal of Medical Genetics and Genomics
Journal of Medical Laboratory and Diagnosis
Journal of Physiology and Pathophysiology
Medical Practice and Reviews
Research in Pharmaceutical Biotechnology
Related Documents