DIRECTIONS IN DEVELOPMENT Energy and Mining People and Power Electricity Sector Reforms and the Poor in Europe and Central Asia Julian A. Lampietti, Sudeshna Ghosh Banerjee, and Amelia Branczik 37960 Public Disclosure Authorized Public Disclosure Authorized Public Disclosure Authorized ublic Disclosure Authorized

Welcome message from author
This document is posted to help you gain knowledge. Please leave a comment to let me know what you think about it! Share it to your friends and learn new things together.
Transcript

D I R E C T I O N S I N D E V E L O P M E N T
Energy and Mining
People and PowerElectricity Sector Reforms and the Poor
in Europe and Central Asia
Julian A. Lampietti, Sudeshna Ghosh Banerjee,and Amelia Branczik
37960P
ublic
Dis
clos
ure
Aut
horiz
edP
ublic
Dis
clos
ure
Aut
horiz
edP
ublic
Dis
clos
ure
Aut
horiz
edP
ublic
Dis
clos
ure
Aut
horiz
ed


People and Power


People and PowerElectricity Sector Reforms and the Poor
in Europe and Central Asia
Julian A. Lampietti
Sudeshna Ghosh Banerjee
Amelia Branczik

©2007 The International Bank for Reconstruction and Development / The World Bank1818 H Street NWWashington DC 20433Telephone: 202-473-1000Internet: www.worldbank.orgE-mail: [email protected]
All rights reserved
1 2 3 4 10 09 08 07
This volume is a product of the staff of the International Bank for Reconstruction andDevelopment / The World Bank. The findings, interpretations, and conclusions expressed in thisvolume do not necessarily reflect the views of the Executive Directors of The World Bank or thegovernments they represent.
The World Bank does not guarantee the accuracy of the data included in this work. The bound-aries, colors, denominations, and other information shown on any map in this work do not implyany judgement on the part of The World Bank concerning the legal status of any territory or theendorsement or acceptance of such boundaries.
Rights and Permissions
The material in this publication is copyrighted. Copying and/or transmitting portions or all ofthis work without permission may be a violation of applicable law. The International Bank forReconstruction and Development / The World Bank encourages dissemination of its work andwill normally grant permission to reproduce portions of the work promptly.
For permission to photocopy or reprint any part of this work, please send a request with com-plete information to the Copyright Clearance Center Inc., 222 Rosewood Drive, Danvers, MA01923, USA; telephone: 978-750-8400; fax: 978-750-4470; Internet: www.copyright.com.
All other queries on rights and licenses, including subsidiary rights, should be addressed to theOffice of the Publisher, The World Bank, 1818 H Street NW, Washington, DC 20433, USA;fax: 202-522-2422; e-mail: [email protected].
Cover design by Naylor Design, Washington, D.C. Photograph by Yuri Mechitov.
ISBN-10: 0-8213-6633-5ISBN-13: 978-0-8213-6633-2eISBN: 0-8213-6634-3DOI: 10.1596/ 978-0-8213-6633-2
Library of Congress Cataloging-in-Publication DataLampietti, Julian A.
People and Power: Electricity Sector Reforms and the Poor in Europe and Central Asia /Julian A. Lampietti, Sudeshna Ghosh Banerjee, Amelia Branczik.
p. cm. – (Directions in Development)Includes bibliographical references and index.ISBN-13: 978-0-8213-6633-2ISBN-10: 0-8213-6633-5
1. Electric utilities—Europe. 2. Electric utilities—Asia Central. 3. Households—Energyconsumption—Case studies. I. Banerjee, Sudeshna Ghosh, 1973- II. Branczik, Amelia 1978-III. Title. IV. Series: Directions in development (Washington, D.C.)
HD9685.E852L36 2006333.793’2094—dc22 2006045424
Foreword xvAcknowledgments xixAbbreviations xxiPreface: Why Look at the Household Effects of Reform? xxiii
PART I Introduction and Methodology 1
Chapter 1 Power’s Reforms—and the Problems 3Europe and Central Asia’s Challenges Were Unique 5The Onset of Crisis 7The Promise of Reform 8The Problems of Reform 11Rising Prices, Rising Opposition 13
Chapter 2 Using Poverty and Social Impact Analysis to Assess the Distributional Impact of Power Sector Reforms 17
Why These Studies? 18Who Are the Stakeholders of Reform? 19The Theoretical Basis 20
Contents
v

Welfare Indicators and How to Measure Them 23Qualitative Analysis 24Quantitative Analysis 25Generating Better Data 25Limitations of the Methodology 28
The Advantages of PSIAs for Designing Reform 29
PART 2 Case Studies 33
Chapter 3 Energy Reforms and Trends in Household Consumption 35
Patterns of Reform 35Trends in Residential Electricity Consumption 37
Service Quality and Availability 38Nonpayments 39
Other Energy Sources 39Other Network Fuels: Gas and District Heating 39Non-network Fuels 40
Changes in Consumption across Income Groups 41Conclusion 41
Chapter 4 Raising Prices in Armenia—What Happens to the Poor? 45
Before the Price Hike 46Residential Energy Consumption in Armenia 48
Uses of Energy 48Energy Consumption and Expenditure 49Improvements in Electricity Supply 50How Households Cope with Increasing
Collections 51Use of Substitutes 51Attitudes to Reform 53
Who Suffered Most: The Impact of Reform 53Magnitude of the Tariff Increase 53Overall Impact of the Price Increase 54Effects on the Poor and Nonpoor 55Effect on Bill Amounts and Payments 55Arrears Levels for the Poor and Nonpoor 56
How Effective Was the Cash Transfer? 57
vi Contents

Targeting Effectiveness of the Cash Transfers 57Effectiveness of Transfers in Softening the Impact 58
Conclusion 58
Chapter 5 Nonpayment and Power—Georgia 63Deep Declines—Then High Expectations 64Residential Energy Consumption in Georgia 67
Availability of Energy 67Changes in Relative Energy Prices 67Effect of Reform on Energy Consumption 69Changing Household Energy Expenditures 70Changes in Service Quality 70Welfare Implications of Changes in Electricity
Consumption 71More Use of Gas 71Impact of Increased Use of Traditional Fuels 72
How Was the Utility Able to Increase Revenues? 73Prices 75Subsidies 75Service Quality 75Remetering and Enforcement 76Nonpayment: Affordability or Free-Riding? 76
How Effective Were the Mitigating Transfers? 77Proposing a Better Mitigating Strategy 79
Conclusion 81
Chapter 6 Does Privatization Hurt the Poor of Moldova? 89The Long Slide 89Residential Energy Consumption in Moldova 93
Effect of Reform on Electricity Consumption 94Effect of Reform on Service Quality 95Differences between Urban and Rural
Households 96Did Reform Hurt the Poor? 97A Difference between the Private and
Public Utilities? 98How Effective Was the Social Transfer System? 101Proposing a Better Mitigating Strategy 103Conclusion 104
Contents vii

Chapter 7 Timing and Sequencing of Raising Rates—Azerbaijan 109
Energy Rich, with Unrealized Power 109Residential Energy Consumption 112How Will Households Respond to
Tariff Increases? 114Effect of Reform on Consumption 114Household Electricity Demand Model 115How Much Households Need to
Be Compensated 117Differences between the Poor and Nonpoor 118Availability of Substitutes 118
How to Mitigate the Impact of Tariff Increases 119Increase Tariffs Gradually 119Link Tariff Increases to Service Quality 119Improve Efficiency of Energy Use 120Improve Access to Clean Substitutes 120Consider Lifeline Tariffs or Direct Transfers 120Outside Baku 121
Conclusion 121
Chapter 8 Coping with the Cold: Heating Strategies for the Urban Poor 125
Inefficient District Heating Systems 126Household Demand for Heat 129
Estimating the Demand for Heat 130Household Heat Consumption 131Household Heat Expenditure 132
Rethinking Heat Supply 133The Cost of Full Service 134The Cost of Reduced Service 135Other Policies 137
Conclusion 138
PART 3 Lessons 143
Chapter 9 Implications for Operational Design 145Simulating the Impact of Tariff Reforms 145Softening the Blow: Direct Transfers and
Lifeline Tariffs 148
viii Contents

Other Considerations 151Other Pro-Poor Mitigating Measures 152
Explicitly Link Tariff Increases to Improvements in Service Quality 152
Raise Tariffs Slowly 153Raise Collections First 153Increase Access to Gas or Other
Clean Substitutes 154Make Metering a Priority 155Investments in Efficiency 155Financing Instruments 155
Mitigating the Environmental Effects of Reform 156Environmental Benefits from Increased
Energy Production Efficiency? 156Environmental Costs from Fuel Substitution 157Electricity Reform and Deforestation 159How to Improve the Environmental
Effects of Reform 160
Chapter 10 Conclusion: Designing Reforms to Produce Better Outcomes for the Poor 165Tariff Reform: Where Do We Stand? 166How Do Reforms Affect the Poor? 167
Residential Energy Consumption 167Nonpayment: Affordability versus Free-Riding 167Elasticity of Electricity Demand 167Coping Mechanisms 168Improvements in Service Quality 168
Designing Effective Mitigating Strategies 169Direct Transfers or Tariff-Based Subsidies? 169Improving the Efficiency of Energy Consumption 169Raising Tariffs Gradually 170Controlling Consumption 170
Designing and Implementing Successful Reform 170Improving Cost Recovery 170Outside Factors Affecting Reform 170Designing Suitable Policies 171
Analyzing Reform: The Potential of PSIAs 171Generating Better Data and Evidence 171
Contents ix

Involving Stakeholders 172Building Capacity 172
Lessons for PSIAs 173Necessary Steps 173Adapt to Local Context 173Allow Adequate Time and Resources 173Reframe Controversial Issues 174Involve a Broad Range of Stakeholders 174Ex Post and Ex Ante Approaches 174
Alternatives to Privatization 174Conclusion 175
AnnexesAnnex 1 Overview of the Reform Process in Eight
ECA Countries 181Annex 2 Summary of Household Survey Data 185Annex 3 Converting Energy Prices into Cost
per Effective Btu 201Annex 4 Combined Household Survey and
Utility Data for Four Countries 203Annex 5 Changes in Generation Mix in the Past
Decade and Price and Income Elasticityof Demand Estimates 207
References 211
Index 221
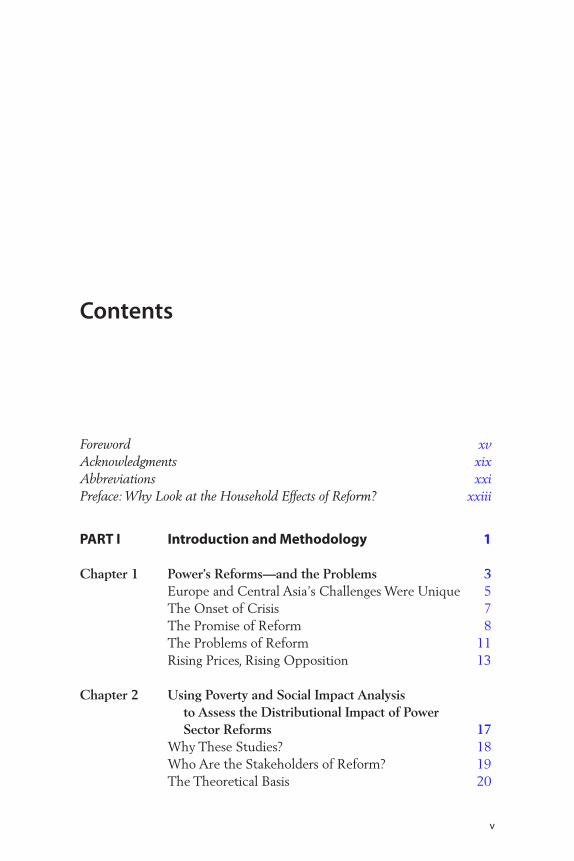
Boxes 4.1 Data for the Analysis—Armenia 485.1 Data for the Analysis—Georgia 666.1 Data for the Analysis—Moldova 916.2 Nominative Targeted Compensation Categories 1027.1 Data for the Analysis—Azerbaijan 1118.1 Methodology and Data Sources—Heat Demand 127
Tables1.1 ECA’s Generally Higher Incomes and Better
Human Development Indicators 61.2 Access to Power Is Higher in ECA 6
x Contents
1.3 Components of Energy Sector Reform as Promoted by the World Bank in 1998 9
1.4 Reform Goals and Indicators in ECA: ImprovedService Quality, Resource Efficiency, and Fiscal Balances 10
1.5 The Timing of Costs and Benefits Are Often Mismatched 122.1 Winners and Losers from Reform—A Typology
of Consumers 213.1 Timeline of Reforms in the Electricity Sector in ECA 363.2 Urban Non-network Energy Use in ECA 414.1 Wood and Electricity Make Up the Bulk of Household
Winter Energy Expenditures 494.2 The Burden Is Higher for the Poor 504.3 How Are Households Reducing Reliance on Energy? 524.4 Prices of LPG and Wood, December 1999 524.5 Aggregate Impact of Electricity Tariff Change 545.1 Aggregate Impact of Reform on Collection Rates in Tbilisi 745.2 Electricity Subsidy Incidence by Quintile in Tbilisi 775.3 Transfer Coverage in Tbilisi 785.4 State Budget Payments to the Energy Sector, 2001–03 795.5 Simulation of Cost-Effectiveness of Different
Transfers in Tbilisi 816.1 Share of Electricity Expenditures by the Poor and
Nonpoor, 1999 and 2003 966.2 Change in Electricity Consumption and Expenditures,
by Location 966.3 Consumption, Payments, and Percentage of Income
Spent on Electricity by Union Fenosa and NRED Customers, 2000–03 99
6.4 Change in Electricity Consumption between 2000 and 2003, by Type of Provider and Location 99
6.5 Net Sales at State-Run Electric Utilities and Union Fenosa, 1999–2002 100
6.6 Electricity Losses by Union Fenosa and the NREDs,1999–2002 101
6.7 Households Receiving Nominative Targeted Compensation for Electricity, by Income Quintile 103
7.1 Tariffs Are Lower and Consumption Is Higher in Azerbaijan 110
7.2 Differences between the Poor and Nonpoor in Baku Are Small, 2002 112
Contents xi

7.3 Electricity Consumption and Service Quality Vary Widely by Location 113
7.4 Changes in Consumption under Different Elasticities in Baku 114
7.5 Rising Income Will Offset the Blow of Tariff Increases on Baku Households’ Budget Shares 116
7.6 Household Consumption and Income Loss under Alternative Tariff Scenarios 117
7.7 Compensation for the Poor in Baku Should Be Higher 1187.8 Households with Less Access to Substitutes
Consume More Electricity 1199.1 Percentage Point Change in Consumer Surplus Following
Electricity Tariff Increase to Full Cost Recovery 1479.2 Per Household Annual Cash Compensation to
Offset Electricity Tariff Change for a Range of Demand Elasticities 148
9.3 Leakage and Coverage Are Highly Correlated, 2002 1509.4 Potential Maximum Loss of Life and Life Years
from Indoor Air Pollution 159A1 Overview of the Reform Process in Eight ECA Countries 181A2.1 Power Sector Access, Payment, and Affordability for
Urban Households in 2002 185A2.2 Power Sector Access, Payment, and Affordability
for Rural Households in 2002 186A2.3 Power Sector Access, Payment, and Affordability
for All Households in 2002 187A2.4 Power Sector Affordability Ratio Following Tariff
Increase to Full-Cost Recovery 188A2.5 Gas Sector Access, Payment, and Affordability
for Urban Households in 2002 189A2.6 Gas Sector Access, Payment, and Affordability
for Rural Households in 2002 190A2.7 Gas Sector Access, Payment, and Affordability
for All Households in 2002 191A2.8 District Heating Access, Payment, and Affordability
for Urban Households in 2002 192A2.9 District Heating Access, Payment, and Affordability
for Rural Households in 2002 193A2.10 District Heating Access, Payment, and Affordability
for All Households in 2002 194
xii Contents

A2.11 Total Energy Sector (Power, Gas, Heat, Oil, and Wood) Affordability in 2002 195
A2.12 Water Sector Access, Payment, and Affordability for Urban Households in 2002 196
A2.13 Water Sector Access, Payment, and Affordability for Rural Households in 2002 197
A2.14 Water Sector Access, Payment, and Affordability for All Households in 2002 198
A3.1 Calculation of Cost per Effective Btu 201A4.1 Summary of Combined Household Survey
and Utility Data for Four Countries 203A5.1 Empirical Estimates of Price and Income Elasticity
of Residential Electricity Demand inDeveloping Countries 209
Figures1.1 Energy Efficiency Is Lower in ECA 71.2 Rising Energy Prices Clashed with Falling Incomes
in ECA, 1991–2000 143.1 Poverty in ECA Increased with the Transition 373.2 The Poor Spend a Larger Share of Their
Income on Electricity 383.3 The Rural Poor Spend Less of Their Income on
Electricity Than the Urban Poor Do (2000) 393.4 Poor Households Are Less Likely to Pay
Their Electricity Bills 403.5 Expenditure Elasticity of Energy Demand—Higher for
the Poor than the Nonpoor 424.1 Electricity Price Increases Outpaced Real Wages 474.2 Arrears Increased for the Poor and Nonpoor 564.3 Arrears to the Utility Went Up 565.1 Milestones of Power Sector Reform in Georgia 64B5.1 Discrepancies between Stated and Actual Household
Electricity Payments in Tbilisi 675.2 Clean Network Fuels Cheaper Than Non-network Fuels 685.3 Energy Consumption Remained Low for the Lowest
20 Percent in Tbilisi 695.4 Most Households in Tbilisi Consumed
875–1,750 KWh a Year, 2002 72
Contents xiii

5.5 Tbilisi Households Shifted to Cleaner Fuels 735.6 Household Electricity Consumption in Tbilisi 806.1 Electricity Consumption in Moldova Plunged
between 1992 and 2000 906.2 Electricity Was the Most Expensive Source of
Energy in Moldova 936.3 The Gap Narrowed in Electricity Consumption
between the Poor and Nonpoor 956.4 The Share of Electricity Expenditures in Total
Expenditures Declined After 1999 97B8.1 Energy Consumption Scatterplots 1288.1 Urban Household Heating Fuel Choices by
Income Quintile 1298.2 Demand for Heat in Selected Countries 1308.3 Predicted per Capita Heat and Nonheat Energy
Consumption in Selected Countries 1328.4 Predicted Heat Expenditure as a Percentage of
Household Expenditures 1338.5 Annual Costs of Different Heating Options for Full
Heat Service in Yerevan, Armenia 1358.6 Fuel Costs as a Share of Total Heat Costs for Different
Heat Supply Options and Demand Levels,Yerevan, Armenia 136
8.7 Average Cost of Heating for High and Low Demand,Yerevan, Armenia 137
9.1 Price Elasticity of Residential Power Demand Depends on Local Conditions 146
9.2 Electricity Tariffs Are Higher Than Gas Tariffs,1992–2002 154
9.3 Electricity Is a Small Share in Health Damage 15810.1 Electricity Tariff Reform Is Still Needed 166A5.1 Changes in Generation Mix in the Past Decade 207
xiv Contents

xv
This important volume brings together a series of studies that were con-ducted to find out more about the distributional impacts of electricitysector reforms in the Europe and Central Asia (ECA) region between1999 and 2004. At the time, there were serious concerns among policymakers and other stakeholders about the potential effects of the reformson the poor, but precious little empirical evidence was available aboutexactly what these were and how best to mitigate them.These studies arean attempt to generate this information and identify more sophisticatedmitigation strategies.
The studies are novel in the approach they take to analyzing utilityreforms, and yield information that had previously been elusive andunavailable to policy makers. This provides policy makers with a morenuanced understanding of the effects of their reforms on the poor, and thuscan improve their ability to mitigate adverse effects. Ultimately, this willimprove the sustainability of reform and ensure that important macroeco-nomic objectives do not come at the expense of social development.
Beginning as a tool for understanding ex post the dynamics of reform,this approach was later used to produce a simulation of the effects ofreform ex ante. This body of work thus provides fascinating insights intoboth the social effects of policies that have been implemented and the
Foreword
possible implications of putative reform efforts. In particular, the abilityto forecast the effects of different policies is invaluable to the design offuture reform (and the results and recommendations in these studies haveindeed fed into subsequent reform design in several countries).
Though these studies focus primarily on electricity sector reforms,many of the themes run across the gamut of utility reforms. This makesthe book an important contribution to the literature on the effects ofinfrastructure reform, particularly in the electricity and water sectors.The findings on the distributional impacts of cost recovery and copingmechanisms employed by households show us what happens at thehousehold level when cost-recovery efforts are introduced. In addition,the book’s revealing insights on the costs and benefits of different socialmitigating strategies are an important contribution to the ongoing debateover subsidized utility provision versus direct transfers to the poor.
In contrast with other regions where reforms are aimed at increasingaccess to utility infrastructure, as a result of the Soviet legacy, countries inECA have enjoyed almost universal access to electricity. These countries,therefore, face unique challenges in utility reforms that aim primarily atimproving efficiency. By focusing on these challenges, this book fills animportant gap in the literature on utility reform—and as countries inLatin America and elsewhere move closer to solving their access issues,the lessons of ECA will be increasingly relevant.
Breaking new ground at the time, the approach taken with these stud-ies has been mainstreamed into Bank operations and is now routinelyconducted to analyze the likely impact of policy reforms and determineeffective mitigating strategies. Poverty and social impact analysis (PSIA)is now a vital input into the design of a broad range of reforms. It credi-bly informs policy makers and enables them to design social assistancemechanisms simultaneously with cost-recovery endeavors. This bookhighlights the potential of this approach, illustrates the kind of analysisthat can be undertaken, demonstrates various ways of using and integrat-ing quantitative and qualitative information, and offers invaluable guide-lines for practitioners seeking to undertake such studies.
Following the Preface, which outlines the purpose of the book, Part 1provides an introduction to the context of reform and the origin of thestudies that form this book. Chapter 1 analyzes the background of cri-sis and reform in ECA, and the problems faced by policy makers asreform got underway. Chapter 2 gives a comprehensive overview of themethodology employed in these studies, setting it in the context of PSIAmethodology.
xvi Foreword

Part 2 begins with an overview of reform patterns and changes in res-idential energy consumption in ECA during the 1990s, as energy sectorswere transformed by crisis and reform. The four country case studies goon to reveal the factors that were at play in changing household behaviorfollowing the reforms. They offer detailed analysis on the effect of reformin their respective countries, and analyze the effectiveness of various mit-igating strategies. Though they are united in examining the impact ofreform on the poor, each case study highlights specific political economyconditions and sheds new light on questions of reform—the importanceof understanding the effects of reform, problems associated with existingsocial benefit structures, and the importance of institutional factors inreducing nonpayment and improving cost recovery. The analysis of heat-ing demand and the assessment of interventions in district heating inchapter 8 illustrate the importance of understanding heat as a majorsource of energy consumption in these cold climates, and householdbehavior patterns in designing infrastructure reform.
Finally, Part 3 brings together the findings in the case studies, offeringa more in-depth analysis of some of the themes that have appeared in thepreceding chapters. Chapter 10 concludes with an overview of the book’smain findings, and offers broad guidelines on how to design effectivereform, deal with exogenous factors, and mitigate the social effects. It alsolooks at lessons learned for analyzing reform, and offers guidelines forpractitioners who are preparing to undertake similar analysis of infra-structure reform using PSIA.
This book is both a significant contribution to the literature on utilityreform, assisting those who seek to understand the effects of thesereforms, and an invaluable guide for those designing infrastructurereforms, in ECA and elsewhere.
Laura TuckSector Director, Europe and Central Asia Region Environmentally andSocially Sustainable Unit (ECSSD)January 2006
Foreword xvii


Acknowledgments
xix
This book is based on six studies that were authored or edited by JulianA. Lampietti within the World Bank between 1999 and 2004. Theseincluded four country studies on Armenia, Georgia, Moldova, andAzerbaijan, and two regional studies, Coping with the Cold: HeatingStrategies for Eastern Europe and Central Asia’s Urban Poor (2002) andPower’s Promise: Electricity Reforms in Eastern Europe and Central Asia(2004). The studies were edited and adapted for this book by Julian A.Lampietti, Sudeshna Ghosh Banerjee, and Amelia Branczik, who alsowrote new material for chapters 1, 2, and 10. The book benefited greatlyfrom editing by Bruce Ross Larson.
People and Power was generously sponsored by the Energy SectorManagement Assistance Program (ESMAP). Within ESMAP, Douglas F.Barnes was invaluable in guiding and supervising our efforts from concep-tion to completion, and we are extremely grateful for his support, and toMarjorie K. Araya for her guidance during the publications process.Valuable comments were provided by our peer reviewers: Robert Chase,Louise Cord, David Kennedy, and Johannes Linn. We are also very gratefulfor the comments and input of Lee Travers, Aline Coudouel, Laura Tuck,Peter Thomson, Nataliya Pushak, and the authors of the original studies:Julia Bucknall, Peter Dewees, Jane Ebinger, Irina Klytchnikova, Taras
xx Acknowledgments
Pushak, Gevorg Sargsyan, Sergei Shatalov, Katelijn Van den Berg, Anke S.Meyer, Anthony A. Kolb, Sumila Gulyani, Vahram Avenesyan, EllenHamilton, Hernan Gonzalez, Margaret Wilson, Sergo Vashakmadze, NilsJunge, Nora Dudwick, Karin Fock, Xun Wu, and Maria Shkaratan.The sup-port of Lazlo Lovei,Alexander Marc, and Anis Dani was pivotal in the con-ception and execution of the original studies. Countless other colleagueswithin the World Bank, local consultants, and individuals in governmentministries, energy regulatory bodies, utility companies, and communityassociations made instrumental contributions of research, data, and adviceto the studies. Several of the studies also benefited from financial supportprovided by the Poverty Window of the Norwegian Trust Fund forEnvironmentally and Socially Sustainable Development and the ItalianConsultant Trust Fund. Parts of the material in chapters 2 and 10 are basedon a chapter written by Nils Junge and Julian A. Lampietti for Poverty andSocial Impact Analysis of Reforms: Lessons and Examples from Implementation(Coudouel, Dani, and Paternostro 2006). The authors are also grateful forthe supervision and guidance of Laura Tuck and management in ECSSD.

ANRE National Energy Regulatory Agency—Moldova
Btu British thermal unit
CGE Computable general equilibrium
CHP Combined heat and power
CIS Commonwealth of Independent States
CPI Consumer Price Index
DALY Disability Adjusted Life Years
EBRD European Bank for Reconstruction and Development
ECA Europe and Central Asia
ECSSD Europe and Central Asia Region Environmentally and SociallySustainable Unit (World Bank)
ESMAP Energy Sector Management Assistance Program
EU European Union
FSU Former Soviet Union
GDP Gross domestic product
GNERC Georgian National Energy Regulatory Agency
GNI Gross national income
GWEM Georgian Wholesale Electricity Market
Abbreviations
xxi

xxii Abbreviations
GWh Gigawatt hour
HBS Household Budget Survey
HH Household
IFI International Financial Institution
IMF International Monetary Fund
KGOE Kilograms of oil equivalent
KWh Kilowatt hour
LPG Liquefied petroleum gas
LSMS Living Standards Measurement Study
NRED Regional electric distribution companies, state-owned—Moldova
NTC Nominative Targeted Compensation
PCE Monthly Per Capita Expenditure
PPP Purchasing power parity
PRS Poverty Reduction Strategy
PSIA Poverty and social impact analysis
RED Regional electricity distribution
STC Save the Children
UN United Nations
UNDP United Nations Development Programme
UNEP United Nations Environment Programme
USAID United States Agency for International Development
VAT Value-added tax
WHAP Winter Heat Assistance Program
WHO World Health Organization
Note: All dollar amounts are U.S. dollars, unless otherwise noted.

Preface: Why Look at the Household
Effects of Reform
The socialist legacy in Eastern Europe and Central Asia (ECA), whereutility access had been extended to virtually all consumers at nominalcost, was an electricity sector leaching scarce fiscal resources from impov-erished newly independent states, while seeing dramatic deterioration ofits infrastructure. In the worst affected countries service was failing andelectricity was unavailable for large parts of the day.The only option openin this situation was immediate implementation of a wide-reachingreform program.
The atmosphere of crisis that paved the way for reforms, and theurgency of reducing fiscal deficits and putting the energy sector backon its feet, precluded extensive consideration of the impact of reformsin advance. Reform was politically risky, but it was necessary—and itneeded to begin immediately. The alternative, a collapse in utilities, wasunthinkable. Those suffering most as a result of cost recovery, the poor,would be compensated, ideally with lump-sum transfers. When themomentum of reform began flagging, due to dissatisfaction with its per-ceived effects and mounting political pressures mobilizing against it, pol-icy makers and the development community began to turn their effortsto understanding more about the concerns that mobilized opposition toreform. Although hostility to reform came also from those with vested
xxiii

xxiv Preface
interests in the status quo—ministers unwilling to lose their power bases,utility managers, and utility employee unions—consumer opposition totariff increases lay behind some of the most virulent and vocal opposition,adding legitimacy to the antireform rhetoric of other constituencies.
The value of being able to separate perception and polemic from real-ity was obvious. What were the outcomes of reform? What were theeffects on the poor? How could the design of reform, and mitigatingstrategies to soften negative impacts on the poor, be improved?
Although policy makers were searching for answers to these ques-tions, no routine tool existed to analyze distributional impact—notonly for privatization, but any policy reform. The World Bank had itspoverty assessments, but they were not designed to answer thesequestions. They tended to be descriptive and their analyses of changesin poverty not policy specific. They were also of limited use in designingstrategies to alleviate the effects of reform on the poor. Since they didnot contain models for simulating responses to specific policies, it wasalmost impossible to measure empirically how different approachesto sequencing reform—such as increasing collections first, followedby raising tariffs—affected certain impacts groups. Without a tool orframework to examine distributional impacts on stakeholders, it wasdifficult to comprehend the aggregate picture, modify the design ofreform, and devise a more effective social assistance strategy.
Against this backdrop, various studies were undertaken using differ-ent quantitative and qualitative techniques to answer some of thesequestions.1 The studies that form the basis of this book, commissioned aspart of the World Bank’s analytic and advisory output contributing tothis work, are based on the hypothesis that more careful attention tohousehold preferences and behavior can smooth transition and reform ofthe power sector. These studies focus on quantifying the poverty andsocial impact of reforms. They identify what has worked and what hasnot in promoting both equity and efficiency, recognizing the importanceof externalities, information asymmetries, rent-seeking behavior, andother attributes of imperfect markets. They look at households’ copingmechanisms, the roles played by social assistance compensation, andconsumer perceptions of reform. These studies were among the firstexamples of a new systematic analytic approach now widely used at theWorld Bank—the poverty and social impact analysis (PSIA, explained indepth in chapter 2), which aims to measure the distributional impact ofmajor reforms on different groups in society, particularly the poor.

The contribution of these studies—and by extension this book—isthreefold. By providing answers to the troubling questions raised byreform, the studies can help steer the future direction of reform, both inthe respective countries and in the region, in a way that is responsive tothe needs of reforming countries. Although a decade and a half haspassed since the beginning of transition, much remains to be done inpower sector reform in ECA (the 15 countries that emerged from thecollapse of the Soviet Union and the 12 countries making the transitionfrom socialism in Central and Eastern Europe).2 Many countries stillneed to raise tariffs toward cost-recovery levels to make the power sectorfinancially viable and encourage efficient resource consumption.Estimates indicate that residential electricity tariffs are below cost recoveryin 14 of 19 ECA countries.3 The sizable tariff increases needed areunlikely to be welfare neutral unless accompanied by substantialimprovements in service quality or cushioned by appropriately designedincome transfers. The lessons from these studies can inform the design ofreform and the accompanying social policies—to maximize the welfarebenefits and lessen the negative impact of tariff increases.
The studies were initially intended for policy makers in the ECAregion, but the book informs the broader debate on the impact of powersector and utility reform, contributing to the literature on distributionalimpacts of infrastructure reform. While much has been written on thissubject, the majority of studies to date look at Latin America; very fewfocus on ECA.4 Yet ECA has important characteristics that sharpen ourunderstanding of how different factors affect policy choices, particularlythe starting point of universal access. For some countries, the challenge isto increase access while commercializing their utilities. But ECA’s expe-rience will be more relevant to economies that are moving toward fulfill-ing their access goals and will soon progress to service delivery challenges,such as those in Latin America. And given the similarities between theelectricity and water sectors, there is substantial scope for learning lessonsfor water sector reforms.
These studies also illustrate the potential offered by PSIAs to under-stand the impact of reforms and improve their design. In recent years, theWorld Bank has placed more emphasis on understanding the poverty andsocial implications of reforms. Poverty reduction is now articulated as themain goal of the Millennium Development Goals, and development insti-tutions emphasize a more country-owned rather than donor-drivenapproach to reform. Within the World Bank, a more “holistic” approach
Preface xxv

to development is institutionalized in Poverty Reduction Strategies(PRSs). Driven by the client country, these embody the World Bank’sembrace of participatory development and are informed by PSIAs.5 Thestudies in this book are some of the earliest examples of PSIAs, a frame-work that is now mainstreamed and embedded in the Bank’s operationalstrategy.6
This book aims to provide insights into how household consumptionand expenditure change in response to reform and what happens topayment levels, coping mechanisms used by households, and servicequality improvements. It looks at the main strategies used by policymakers to mitigate the impact of reform and assesses the efficacy ofthese strategies in different settings. In the course of finding answers tothese questions, it illustrates the key factors in the design of reforms thatcontribute to making them successful and examines how reform isaffected by factors external to its design, including institutional andpolitical economy factors.
Part 1 provides an introduction, looking at the promises and theproblems of reform and the methodology used to assess them. Thestudies empirically measure the impact of reform by introducing sev-eral sources of data, most importantly the integrated use of data fromhousehold budget surveys and data on energy use and expenditureobtained from utility companies. By correlating the household andutility data for individual households, the studies generated more pre-cise measures of how households responded to changes in energy priceand supply and cross-checked the two sources.
The chapters in Part 2 are based on individual case studies. An intro-duction to energy consumption patterns in ECA in the past decade anda half in chapter 3 is followed by country case studies in chapters 4–7.Each case study sets the scene by looking at patterns of household energyconsumption before focusing on one or more specific policy questionsrelated to electricity sector reform. The analysis of the effects of electricityprice increases on the poor in Armenia is the first case study (chapter 4).At the beginning of 1999, Armenia raised prices significantly andchanged the structure of its tariff system from a tariff-based subsidy to amuch higher uniform tariff accompanied by mitigating transfers to alle-viate the impact on the poor. The study, conducted immediately afterthe reform, generated empirical evidence on how large the tariff increasewas, who was most affected by reform and removal of subsidies, and howeffective the transfers were in comparison with the subsidies they hadreplaced.
xxvi Preface

Chapter 5 looks at how households responded to tariff increases inGeorgia. This study was conducted several years after reforms were putin place, giving a longer term perspective to the findings. By looking athow the utility attempted to increase payments, it sheds light on the roleof institutions, government commitment, and the design of privatizationin improving payments.
Chapter 6 considers Moldova, where a newly elected Communist gov-ernment threatened to reverse one of the biggest privatizations in theregion. One argument used by the opponents of reform was that it haddisproportionately affected the poor and that privatization in particularhad a negative effect. This led to a deeply acrimonious debate surround-ing electricity sector reform and the sale of part of the distribution systemto a foreign operator. This study provided ex post evidence that the accu-sations by opponents of privatization were groundless, thus answering animportant question and showing how this work can improve publicdebates on reform.
Chapter 7 presents an ex ante study of reform in Azerbaijan, a countrywith markedly different circumstances. As an oil-exporting country,Azerbaijan was not faced with the same urgency to reform as the otherthree. The government’s ambivalence about reform centered on the detri-mental effects it could have on the poor and the possible political fallout ofreform at a sensitive time in the presidential election cycle. In an attemptto inform policy discussions and lay out alternative scenarios for the gov-ernment, the study looks at the welfare effects of different rates of increasein tariffs. It also estimates the level of compensation needed in each case tokeep consumers as well off as before reforms. The study illustrates how thePSIAs can be used to design better reform strategies going forward.
Chapter 8 is a thematic case study, examining the most importantaspect of energy consumption in ECA, heat. By once more examiningtrends in household consumption and demand, it suggests approaches forimproving the traditional approach to designing investments in heatingsystems. It offers alternative recommendations on appropriate investmentsand policies to promote access to clean, affordable heat for the poor.
In reading the case studies, it is important to remember that they wereconducted at a specific point in the timeline of reform and that thefindings relate to the period for which data are analyzed, rather than forthe reform period as a whole. It is their ability to give a picture of whatis happening at a given point, rather than an evaluation of the reformprogram from inception to completion (most reform programs are notcomplete), that makes these studies valuable.
Preface xxvii

Part 3 synthesizes the lessons about the impact of power sector reformon the poor. Chapter 9 builds on the studies in Part 2 and on broaderstudies of household response to tariff increases across the region, andreflects on the implications for operational design of power sector reformin ECA and other regions. It reviews lessons on how to ensure that thepoor are not disproportionately affected, with an analysis of the mosteffective mitigating strategies. Chapter 10 provides an overview of thebook’s main findings.
Notes1. For a comprehensive bibliography of such studies see Foster, Tiongson,
and Laderichi (2005), pp. 121–43.2. This book uses the World Bank term “Europe and Central Asia” (ECA)
to refer to the 27 former Soviet Union countries and the formerlysocialist countries of Central, Eastern, and Southeastern Europe (theWorld Bank also includes Turkey in ECA, but this country is notincluded when referring to ECA in this book).
3. In percentage terms, the largest increases are needed in Central Asia(Azerbaijan, the Kyrgyz Republic, Tajikistan, and Uzbekistan). Thesefigures are for 2003 and were calculated from World Bank ECA elec-tricity data.
4. Foster, Tiongson, and Laderichi (2005), pp. 121–43.5. This broader approach is known as the Comprehensive Development
Framework, the emergence of which is widely associated with James D.Wolfensohn’s tenure as World Bank president.
6. World Bank (2004d).
xxviii Preface

P A R T 1
Introduction and Methodology


One of the most remarkable transformations of postcommunist Europeand Central Asia (ECA) was the mass reform and privatization of indus-try, infrastructure, and utilities that emerged from the economic collapseof the early 1990s. As with all reforms necessitated by crises of such mag-nitude, crises affecting the lives of so many in such tangible ways, themove to cost recovery as part of the fundamental restructuring of utilityinfrastructure was seen as either panacea or pariah of the new postcom-munist economic and social order, depending on where people stood.For policy makers and economists, it was the only response available to afiscal and economic crisis brought about by decades of manifestly unsus-tainable utility provision; the alternative was a collapse of the utilities. Forconsumers confronted with rising prices for energy and other utilities, itembodied the cataclysmic losses they were experiencing as part of thetransformation of their social contract.
Utility reforms aimed at cost recovery and privatization have becomeone of the most divisive and politically charged economic issues ofthe past two decades. This book grew out of a desire for an empiricalunderstanding of the effects of these reforms on the most vulnerable
C H A P T E R 1
Power’s Reforms—and the
Problems
3

stakeholders: poor consumers of energy. A better knowledge of theseeffects, and how they come about, can provide lessons on how toimprove the design of future reform to minimize welfare losses for thepoor.
For most of the 20th century, utility infrastructure was generally thepreserve of the state, in poor and wealthier countries around the globe.The natural monopoly characteristics of infrastructure networks,the large up-front investments required, the increasing returns to scale,the positive spillover effects of connecting all users to the network—allof these issues made infrastructure the natural responsibility of govern-ment. For political reasons, utility service delivery was often highly sub-sidized and available to consumers at below-cost prices. Supported bygovernment largesse, state-owned utilities had few incentives to raisetheir own resources or improve the efficiency of their output. And inmuch of the world in the second half of the 20th century, state-managedinfrastructure became synonymous with mismanagement, corruption,inefficiency, poor service, and huge fiscal transfers to cover operatinglosses. Donor-funded attempts to improve the record of state infrastructurein the developing world were repeatedly confounded by these structuralcharacteristics.
In the 1980s, the role of the state was transformed as groundbreakingprivatization schemes in the United Kingdom and Latin America heraldeda drive away from government ownership of industry and infrastructure.As technological innovations—such as the ability to unbundle verticallyintegrated power utilities into separate generation, transmission, and dis-tribution entities—made it feasible to introduce competition, operatingthese sectors as commercial ventures with private participation became amore realizable goal. By the 1990s, privatization of utility and physicalinfrastructure was gaining momentum and seen by many as a panaceafor problems of infrastructure management.
At the same time, the World Bank and other international financialinstitutions (IFIs) became strong proponents of this approach in develop-ing countries. Commercializing and privatizing infrastructure operationsand introducing competition between different suppliers was seen as themost effective means to achieve the investment capital and efficiencyimprovements needed for sustainable utility sectors. Privatization had theadded advantage of making reform politically feasible because it allowedgovernments, for many years pressured into providing cheap electricity toresidential consumers and failing industries, to distance themselves fromunpopular but necessary price increases.
4 Lampietti, Banerjee, and Branczik

Power’s Reforms—and the Problems 5
By the early 1990s, government retreat from infrastructure had becomea global phenomenon. Nowhere would this move be more dramatic thanin the ECA region. Together these countries faced a common set of chal-lenges in transitioning from socialist political and economic systems tomarket democracies, a process that is still ongoing. In the early 1990s,transition involved political opening, often accompanied by politicalinstability and conflict, and transformation from centrally planned toopen, market-driven economies, a process that frequently brought devas-tating macroeconomic instability, plummeting growth rates, and spiralingpoverty and inequality.
Previously able to rely on central transfers of resources and guaran-teed markets for their goods, these economies were characterized byenormously inefficient resource allocations. Unlike other regions of theworld, infrastructure provision under Soviet rule had been extremelyequitable—almost everyone had access to electricity and other basicservices—but extremely inefficient. Now with transition coincidingwith the global shift to market-oriented utility provision, the formerSoviet economies naturally became the new testing ground for reform.The IFIs, as they assisted countries with reform programs focused onfiscal discipline and trade liberalization, placed substantial emphasis onincreasing efficiency, eliminating losses, and introducing cost recoveryin utility infrastructure. The electricity sector, given its size and impor-tance to the fiscal budget, was a key contributor to the nonpaymentproblem, and it was inevitably among the first sectors to come underthe spotlight.
Europe and Central Asia’s Challenges Were Unique
The starting point of reform in ECA, and the challenges following thecollapse of socialism, made reform in this region uniquely challenging.Incomes were higher than those in developing countries in other partsof the world, except Latin America. And other human developmentindicators—infant mortality, illiteracy, access to basic infrastructure, andprogress toward the Millennium Development Goals—were better(table 1.1).
Infrastructure was also far more developed than in many parts of theworld. The socialist legacy was publicly owned and vertically integrated,and its highly centralized power infrastructure was designed to providereliable electricity to all households at little or no cost. Crucially, accessto electricity was and remains substantially higher than in other regions

with similar incomes (table 1.2), particularly for rural areas.1 In urbanareas, heating and often domestic hot water were also part of the cradle-to-grave centrally planned system.
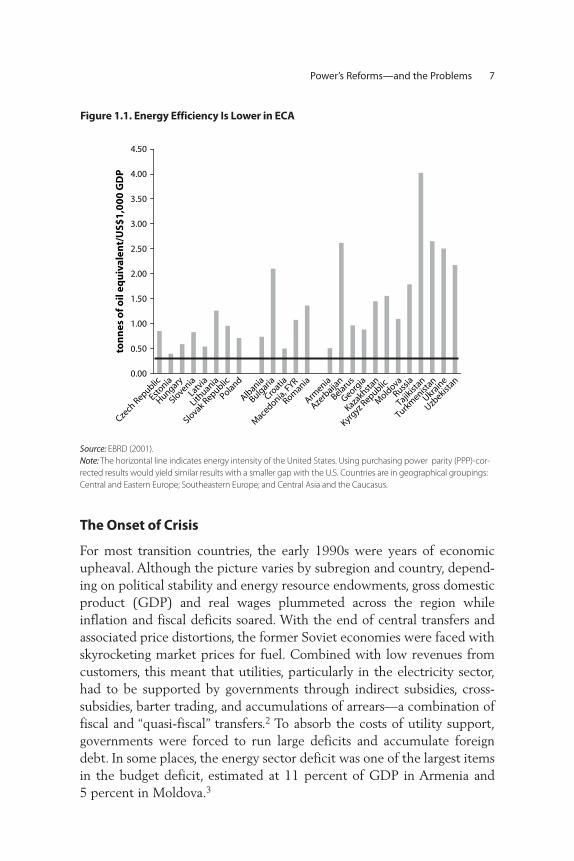
But central planning also led to an inefficient and overdeveloped energysector (figure 1.1), and with energy prices well below international prices,consumers enjoyed extremely low, nominal bills. Unsurprisingly, energyconsumption levels were high.
6 Lampietti, Banerjee, and Branczik
Table 1.1. ECA’s Generally Higher Incomes and Better Human Development Indicators
GDP per unit
Access to of energy use:
GNI per capita an improved purchasing
World Bank, water source: power parity,
Atlas method Adult literacy Infant percent of dollars per kg
(dollars) rate (2002) mortality population oil equivalent
(2003) M F rate (2003) (2002) (2000)
East Asia and 1,070 90 86 32 78 4.6
Pacific
Europe and 2,580 98 96 29 91 2.5
Central Asia
Latin America and 3,280 86 88 28 89 6.1
the Caribbean
Middle East and 2,390 82 61 43 88 3.5
North Africa
South Asia 510 73 44 66 84 5.1
Sub-Saharan Africa 500 71 58 101 58 2.8
Source: World Bank 2005b.
Note: GDP is gross domestic product, GNI is gross national income.
Table 1.2. Access to Power Is Higher in ECA
(percent of households with electricity connections, 2000)
Total Urban Rural GDP per capita
Region (percent) (percent) (percent) (percent)
East Asia 87 99 81 888
Europe and Central Asiaa 99 100 97 1,998
Latin America 87 98 52 3,888
Middle East and North Africa 90 99 79 2,304
South Asia 41 68 30 441
Sub-Saharan Africa 23 51 8 496
World 73 91 57 5,216
Source: International Energy Agency 2000; World Bank 2000c.
a. Figures for ECA derived by authors from household survey data.
Power’s Reforms—and the Problems 7
The Onset of Crisis
For most transition countries, the early 1990s were years of economicupheaval. Although the picture varies by subregion and country, depend-ing on political stability and energy resource endowments, gross domesticproduct (GDP) and real wages plummeted across the region whileinflation and fiscal deficits soared. With the end of central transfers andassociated price distortions, the former Soviet economies were faced withskyrocketing market prices for fuel. Combined with low revenues fromcustomers, this meant that utilities, particularly in the electricity sector,had to be supported by governments through indirect subsidies, cross-subsidies, barter trading, and accumulations of arrears—a combination offiscal and “quasi-fiscal” transfers.2 To absorb the costs of utility support,governments were forced to run large deficits and accumulate foreigndebt. In some places, the energy sector deficit was one of the largest itemsin the budget deficit, estimated at 11 percent of GDP in Armenia and5 percent in Moldova.3
Czech
Republic
Estonia
Hungary
Slovenia
Latvia
Lithuania
Slovak Republic
Poland
Albania
Bulgaria
Croatia
Mace
donia, FYR
Romania
Armenia
Azerb
aijan
Belarus
Georgia
Kazakhsta
n
Kyrgyz R
epublic
Mold
ova
Russia
Tajikist
an
Turkm
enistan
Ukrain
e
Uzbekist
an0.00
0.50
1.00
1.50
2.00
2.50
3.00
3.50
4.00
4.50
ton
nes
of o
il eq
uiv
alen
t/U
S$1
,00
0 G
DP
Figure 1.1. Energy Efficiency Is Lower in ECA
Source: EBRD (2001).
Note: The horizontal line indicates energy intensity of the United States. Using purchasing power parity (PPP)-cor-
rected results would yield similar results with a smaller gap with the U.S. Countries are in geographical groupings:
Central and Eastern Europe; Southeastern Europe; and Central Asia and the Caucasus.

For economies already suffering painful transitions, subsidies on thisscale were a further impediment to fiscal stability and recovery.The oppor-tunity costs of such substantial transfers were enormous, and as money wasfunneled to support utilities, public spending on health and education felldramatically. A decade after the onset of transition, Azerbaijan, Georgia,and Moldova’s health spending was less than a quarter of what it was inthe early 1990s. Armenia’s education spending was a mere one-sixth of itslevel in the early 1990s, and Azerbaijan’s one-third.4
Despite continuing government support to the power sector, utilitiessuffered significant financial losses and asset depreciation, and mainte-nance was neglected. Crumbling systems led to drastic declines in thequality and reliability of service delivery, with many consumers receivingelectricity for only a few hours a day. The energy crises that emergedacross the region, and the severe limitations they imposed on day-to-dayeconomic activity, compounded the effects of economic collapse and heldback recovery.
The Promise of Reform
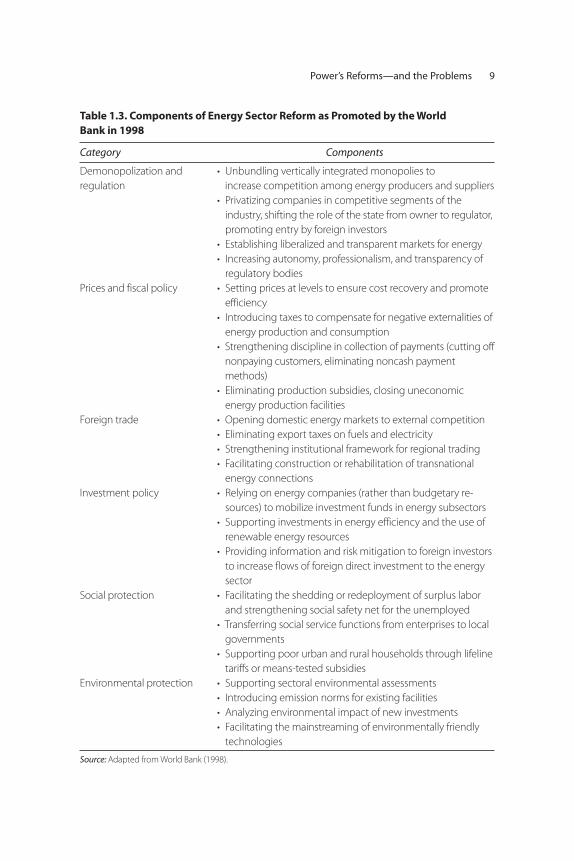
The need to solve these energy crises and rebalance government expen-ditures made reform of the power sector an urgent issue for govern-ments and donor institutions. The approach of the IFIs is crystallized inthe World Bank’s 1998 ECA energy sector strategy.5 Formerly verticallyintegrated utilities would be unbundled into separately managed compa-nies, and the sector would be deregulated, liberalized, and in many casesprivatized. Prices would be raised to cost-recovery levels, to be enforcedby metering and by cutting off nonpaying customers. Governmentswould establish predictable and transparent regulations, introduce com-petition in generation and distribution, sell industrial assets to privatestrategic investors, and improve the transparency of their financial flowsby converting hidden budget support for utilities to explicit transfers.Donors in turn would provide funding to improve energy efficiencyand advice on how to alleviate the impact of rising prices on poorhouseholds through means-tested transfers and tariff-based subsidies(table 1.3).
Unlike in Latin America and Africa, where reforms aimed at increasingaccess to electricity (equity), access in ECA was already almost universal.The major objectives of reform were thus to stop service quality deteri-oration and increase efficiency to improve the financial viability of thesector and reduce fiscal burdens (table 1.4).
8 Lampietti, Banerjee, and Branczik
Power’s Reforms—and the Problems 9
Table 1.3. Components of Energy Sector Reform as Promoted by the World
Bank in 1998
Category Components
Demonopolization and • Unbundling vertically integrated monopolies to
regulation increase competition among energy producers and suppliers
• Privatizing companies in competitive segments of the
industry, shifting the role of the state from owner to regulator,
promoting entry by foreign investors
• Establishing liberalized and transparent markets for energy
• Increasing autonomy, professionalism, and transparency of
regulatory bodies
Prices and fiscal policy • Setting prices at levels to ensure cost recovery and promote
efficiency
• Introducing taxes to compensate for negative externalities of
energy production and consumption
• Strengthening discipline in collection of payments (cutting off
nonpaying customers, eliminating noncash payment
methods)
• Eliminating production subsidies, closing uneconomic
energy production facilities
Foreign trade • Opening domestic energy markets to external competition
• Eliminating export taxes on fuels and electricity
• Strengthening institutional framework for regional trading
• Facilitating construction or rehabilitation of transnational
energy connections
Investment policy • Relying on energy companies (rather than budgetary re-
sources) to mobilize investment funds in energy subsectors
• Supporting investments in energy efficiency and the use of
renewable energy resources
• Providing information and risk mitigation to foreign investors
to increase flows of foreign direct investment to the energy
sector
Social protection • Facilitating the shedding or redeployment of surplus labor
and strengthening social safety net for the unemployed
• Transferring social service functions from enterprises to local
governments
• Supporting poor urban and rural households through lifeline
tariffs or means-tested subsidies
Environmental protection • Supporting sectoral environmental assessments
• Introducing emission norms for existing facilities
• Analyzing environmental impact of new investments
• Facilitating the mainstreaming of environmentally friendly
technologies
Source: Adapted from World Bank (1998).

In a perfectly competitive economy, trade-offs between equity and effi-ciency take place along a production frontier. The objective of infrastruc-ture reform is a function of the starting point of the reforming countrywithin the production frontier and the type of reforms carried out.6 Inprinciple, ECA economies are well inside the production frontier: theirpower sectors were very equitable under the socialist system, but highlyinefficient. With a balanced reform strategy, ECA countries could moveoutward toward the production frontier by improving efficiency withoutnecessarily sacrificing equity.7
Improving cost recovery by increasing tariffs would create a financiallysustainable power sector, freeing public resources for more productiveinvestments (including in the social sector), and improved fiscal balances
10 Lampietti, Banerjee, and Branczik
Table 1.4. Reform Goals and Indicators in ECA: Improved
Service Quality, Resource Efficiency, and Fiscal Balances
Outcome
Stakeholder objective Outcome indicator Examples
Consumers Improved • Reduced number • System average
service quality of outages interruption frequency
index
• Frequency and • Number of deviations from
voltage stability established standards
Power sector Improved • Increased revenue and • Rise in electricity billed as
(utilities) resource collections percentage of net supply;
efficiency rise in collections as
percentage of billings.
• Reduced cost of supply • Reduction in cost of
generation (dollars per KWh)
• Improved energy • Reduction in fuel use
efficiency per KWh of electricity
produced
• Reduced losses • Percent reduction (KWh lost
per net KWh generated)
• Improved operational Rise in sales per employee;
efficiency rise in consumers served
per employee
Government Increased • Increased sector • Percent increase in
financial investment (third party) investment in generation,
independence distribution, or transmission
• Reduced sector • Percent decline in
financial deficit sector financial deficit
expressed as a share of GDP
Source: Authors, based on reviews of project documents.

would lead to macroeconomic stability. Efficiently operated utilities wouldalso mean better consumer service and environmental benefits fromimproved energy efficiency and investments in environmentally friendlytechnology. Lower emissions would lead to better ambient air quality andbetter health outcomes for the local population. Consumers would sufferbecause they would pay more for their electricity, but they would ulti-mately gain from improved service quality and macroeconomic stability.
For the poorest consumers, who have greatest difficulties paying andoften the least access to substitutes, the impact would be greater, and thehardships particularly acute. But as with all reforms that generate anaggregate increase in welfare and an uneven distribution impact, the los-ers can be compensated. This means that it is particularly important forthe government to make early decisions about whom to compensate andover what time horizon. According to public finance theory, and based onextensive scholarship that considers how to introduce cost recovery ininfrastructure and other public services, the best solution is usually alump-sum transfer, implemented as part of a social benefit transfer. Muchreform in ECA has focused on moving from tariff-based subsidies—in theform of either across-the-board underpricing or lower tariffs for low vol-ume consumers—to direct lump-sum transfers.8
The Problems of Reform
Though the necessity of reform was clear, there were problems and con-troversies from the outset, most obviously the backdrop of dramaticallydeclining incomes across the region in the early stages of transition. Theextraordinary upheaval of the move to market economies created enormoushardship and took a huge toll on standards of living. From 1991 to 1996, realincomes dropped by 14 percent a year, with only slight improvement inthe remaining years of the 1990s. At the same time, ECA’s climate limit-ed how much people could cut back on energy expenditures.Winter tem-peratures can drop below –20° Celsius, and the heating season lasts onaverage five to seven months.9 Households spend a large share of theirincomes on energy for heat, and access to energy is a matter of survival.The legacy of free access and a sense of entitlement ensured controversyfor any intervention to improve cost recovery.
Despite the considerable promise of reform, implementation soonproved more difficult than anticipated. Governments were slow to adoptreforms and many introduced parts of the package selectively (annex 1).In large part these differences were based on domestic political and
Power’s Reforms—and the Problems 11

economic conditions. While the movement to reform began in the early1990s, for many countries, particularly those of the former Soviet Union,privatization started much later, if ever. Potential investors tended to bemultinational companies, often based in the West, in search of new desti-nations for investments in the bull market of the 1990s. Inside thereforming countries, foreign ownership of utilities was widely viewedwith suspicion, compounded by resentment over paying for a servicethat, for political reasons, used to be provided by the state at minimalcost. Many countries were highly ambivalent about reform, and thoughsome chose to open the power sector to foreign investment, others con-sidered generation assets as strategic and retained public ownership.Partial reforms were common, and progress was often the result of exter-nal pressure from donors, particularly for small, energy-poor countriessuch as Armenia and Moldova.
This ambivalence about reform can be traced in part to the mismatchbetween benefits and costs (table 1.5). While the costs are immediate,concentrated on a few groups, and highly tangible, the benefits takelonger to accrue, even for governments and utilities. The fiscal benefits,one of the primary motives for reform, were slow to materialize and dif-ficult to measure because of delays caused by institutions with vestedinterests, the appearance of formerly hidden transfers on the govern-ment’s books, and expenditures on social transfers required to mitigatethe impact of reform.10 There was typically no systematic methodologyto track and measure the fiscal benefits, and governments that shouldhave been embracing reforms for fiscal benefits were not always doing so.
The picture was also ambiguous on the utility side, with strategicinvestors finding it difficult to recover costs in the face of fierce resistancefrom consumers unaccustomed to paying. The talents of enterprising (anddesperate) consumers in tampering with meters and running dangerousillegal electricity connections from low-voltage cables made enforcementextraordinarily difficult. In the late 1990s, private investment in the sec-tor fell steadily, while private operators, embroiled in contractual disputes,
12 Lampietti, Banerjee, and Branczik
Table 1.5. The Timing of Costs and Benefits Are Often Mismatched
Institutions Costs (Usually immediate) Benefits (Usually take time)
Government Loss of control and rent-seeking Improved fiscal balance
opportunities
Utility Loss of public financing Financial sustainability and profit
Consumers Increasing tariffs and disconnections Improved service quality
Source: Authors.

withdrew or threatened to withdraw. In Kazakhstan, Belgian investorTractabel walked out after tariff disputes with the government. InMoldova, the state initiated a lawsuit against Spanish investor UnionFenosa, arguing that the privatization process was flawed. In Georgia, U.S.-based AES Corporation described its purchase of the Tbilisi distributioncompany as a mistake and in 2003 sold its stake in the company toRussian interests after experiencing sustained losses. The growing ambiva-lence of companies toward the region and the profound changes in theworld economy after 2000 resulted in a scarcity of strategic investors will-ing to pump the needed money into the sector, a scarcity reversed onlyrecently in parts of the region.
Rising Prices, Rising Opposition
Perhaps the most immediate and visible effects of reform were risingenergy prices and their impact on consumers, particularly the poor.Between 1991 and 2000, the price of electricity jumped by an average of177 percent in real terms throughout ECA.11 Universal access at little orno cost under socialism was clearly unsustainable, but it took time forconsumers to adjust to the idea that services once provided for free mustnow be paid for. Cost recovery, in the form of improving collections andincreasing tariffs, was immediate and visible. But the benefits for house-holds—a desperately needed reliable supply of electricity and a chancefor macroeconomic stability—would take longer to accrue, and econom-ic growth would benefit the populace only through less visible second-order effects. In the interim, rising energy prices clashed with fallingincomes, rising income polarization, and alarming levels of urban poverty(figure 1.2). And poor data made it difficult to assess whether the poor-est were being adequately compensated.
As the 1990s progressed, the emerging picture in many places was ofincomplete reforms and ambiguous results and benefits. Across ECA thepicture varied, with reform in the Baltics and some countries in CentralEurope reasonably rapid and successful. Elsewhere, difficulties in identify-ing and communicating the benefits of reform made it all the moredifficult for governments to credibly justify tariff increases.Amid the com-plicating factors, one certainty was emerging: public concern over theeffects of rising prices and privatization on the poor was helping to createand sustain significant and organized constituencies that opposed reform.The increasing tendency to doubt the virtues of reform was fueled byexternal developments: high profile “failures” such as Russia and the
Power’s Reforms—and the Problems 13

Czech Republic’s voucher privatizations and the backlash against the“shock therapy” of the early 1990s; the gaining momentum of theantiglobalization movement and its opposition to the market-drivenWashington Consensus supposedly championed by the IFIs; and the emer-gence of widespread public campaigns against utility reforms—most noto-riously the clash over the Cochabamba water utility in Bolivia in 2000.Although not necessarily backed by empirical evidence, a popular percep-tion that privatization failed consumers, combined with domestic opposi-tion to increased tariffs, further undermined confidence in reform amongpeople in ECA and the governments who needed their support.
Much progress had been made in some countries—Bulgaria,Hungary, and Poland, among others—but in many countries by the late1990s, particularly in the former Soviet Union, reform and privatizationwere perceived by many to have failed to live up to initial expectations.The bursting of the privatization bubble and the deviation of actualreform outcomes from intended outcomes posed a growing threat tothe continuation of reform. Countries that had entered the processwere reluctant to push for further reforms, especially tariff increases.Certain governments were distancing themselves from reform, someoverruling tariff increases set by independent regulators, and undermin-ing the efforts of utility operators to turn the sector around. Some gov-ernments, such as Moldova, even threatened to backslide and reversereforms, while countries that had not yet reformed their utilities wereconcerned about the social and political fallout of doing so.
14 Lampietti, Banerjee, and Branczik
0
50
100
150
200
250
1991 1992 1993 1994 1995 1996 1997 1998 1999 2000
ind
ex (1
99
1=
10
0)
clean fuels
traditional fuels
average GDP per capita
Figure 1.2. Rising Energy Prices Clashed with Falling Incomes in ECA, 1991–2000
Source: Authors’calculations from International Energy Agency data and World Bank data. These figures may not
be equal to the true resource cost because of the effect of subsidies (Lampietti and Meyer 2002).

Notes
1. Komives, Whittington, and Wu (2001); Clarke and Wallsten (2002).
2. Nonmonetary government support, often termed quasi-fiscal transfers,includes subsidized supplies, tax exemptions, or bartering of services withother state enterprises, which does not therefore appear in the state budget asa transfer.
3. Energy sector constituting electricity and gas. The Armenia figure is for 1995,the Moldova figure for 1999 (Sargsyan, Balabanyan, and Hankinson 2005;IMF 2001b).
4. As shares of GDP, total public expenditures on education, health, and socialassistance and welfare remained stable or fell (Public Expenditure Database,World Bank 2002).
5. World Bank (1998).
6. Birdsall and Nellis (2003, 2005).
7. Here the word “equity” is used in the same sense as in the World Bank’s WorldDevelopment Report 2006: Equity and Development, as ensuring that individualshave equal opportunities (in this case access to electricity) and are sparedfrom extreme deprivation in outcomes (World Bank 2006).
8. For a more detailed discussion of the different types of subsidy available seeKomives and others (2005), chapter 2, “A Typology of Consumer UtilitySubsidies.”
9. Exposure of populations to extreme temperatures was in some cases exacer-bated by Soviet planning policies, which encouraged settlement in areas withcold climates, such as Siberia (Hill and Gaddy 2003).
10. The fiscal deficit is the difference between revenues and expenditures asrecorded in the official government budget. In addition to fiscal deficit,public finance analysis takes into account government obligations that arenot reflected in the budget, but result from explicit or implicit governmentliabilities outside the budget framework. When a utility is publicly owned,the government receives taxes and dividends from the utility and providesexplicit and implicit subsidies, many of them not transparent. They couldbe explicitly recorded in legal documents or result implicitly from thelogic of political events, institutional rules, or social obligations of thegovernment as understood by the public. Untangling these financial flowsrequires detailed systematic data on financial flows that are not readilyavailable. The data and analysis of the electricity sector fiscal and quasi-fiscaldeficits are available for the countries for which the International MonetaryFund or the World Bank undertook detailed studies, such as Armenia,Romania, and Russia (Petri, Taube, and Tsyvinski 2002; Frienkman,Gyulumyan, and Kyurumyan 2003; Saavalainen and ten Berge 2003). Some
Power’s Reforms—and the Problems 15

evidence also exists for Georgia and Moldova, but no systematic methodologyor time series data have been available to date.
11. These data cover Armenia, Azerbaijan, Estonia, Georgia, Kazakhstan, theKyrgyz Republic, Latvia, Lithuania, Moldova, Tajikistan, and Uzbekistan(Lampietti and Meyer 2002).
16 Lampietti, Banerjee, and Branczik

A sustainable power sector rested on raising tariffs from below cost tolevels where utilities could recover costs. But tariff increases have con-tributed most to the widespread mobilization of opposition to utilityreform, even where reform has dramatically improved access. The justifi-cation for higher tariffs can be based on pro-poor arguments. When tariffsare below cost recovery, the government budget subsidizes the electricityconsumption of all members of society, poor and nonpoor. This subsidyoften comes at the expense of macroeconomic stability and much-neededinvestments in other sectors, including the social sector, that more directlybenefit the poor. And since people who are better off generally consumemore electricity, they capture the bulk of the subsidy in absolute terms.Subsidized provision of electricity to all consumers, as well as beingextremely costly and encouraging inefficient use of electricity, is thussocially regressive, and subsidies are commonly criticized for being unpre-dictable, unsustainable, and unaffordable.1
But removing across-the-board subsidies presents its own problems.As tariffs increase to cost-recovery levels, either the consumption of
C H A P T E R 2
Using Poverty and Social Impact
Analysis to Assess the Distributional
Impact of Power Sector Reforms
17
electricity must decrease, or the share of household income spent onelectricity must increase, or both. It may be that better-off householdsspend more on electricity in absolute terms, but the share of income spenton electricity is usually larger for the poor, so a tariff increase will affectthem more. When the ratio of income spent on energy exceeds a certainthreshold, households are in danger of becoming energy poor. Once theyhave cut back on all inessential electricity consumption, they must sacri-fice the consumption of other goods to satisfy their basic energy needs.
To prevent the potentially substantial welfare loss that results fromcrossing this threshold, economists usually favor lump-sum transfers tothe most vulnerable consumers. But whether tariff-based subsidies orlump-sum transfers are more effective and efficient in assisting the poorrests on answers to questions about access to subsidized utilities, house-hold consumption, and where transfers go. To meaningfully analyze thedistributional impact of reform and how this can be improved throughbetter policies requires reliable information—on access to energy, income,energy consumption, basic minimum needs, coping mechanisms used byhouseholds when energy prices increase, and how effective differentsubsidy or lump-sum transfer systems are at mitigating the impact ofreform on the most vulnerable. Based on an empirical understanding ofbudget shares spent on electricity, the methodology behind the studiesin this book can help answer these questions, showing who the winnersand losers of reform are and how the losers can be compensated.
Why These Studies?
When the studies were conceived, it was clear that the intended out-comes of energy sector reform were not materializing as quickly asexpected. The fiscal benefits of reform were obscured in a haze of indi-rect government subsidies. Utilities were charging more for electricity, butthe expected returns on their investments were elusive as consumersresisted tariff increases. And the poor were suffering, in many cases morethan expected.While donors pointed to net welfare improvements result-ing from reform,2 popular protests, politicians, and opposition groupsattested that the more immediate effects—increasing tariffs, collections,and disconnections—were felt far more strongly. Reform was provingtough on consumers and on governments trying to administer it.The polit-ical consequences of rising prices, combined with the less-than-perfectoutcomes for governments and utilities, threatened to bring reform to ahalt and deter other countries from reform altogether.
18 Lampietti, Banerjee, and Branczik

Using Poverty and Social Impact Analysis 19
In the absence of routine attempts to quantify the distributionalimpacts of large sectoral reforms, the impacts were not well understood.The donor community and governments lacked an empirical understand-ing, either ex ante or ex post, of what was going on. In theory, meanscould be found to compensate the losers, but the losers had to be identi-fied. If the poor had gained from better service, but lost to increasingprices, collections, and disconnections, what was the net effect on theirwelfare? How could the design of reform be improved to soften theblow? A systematic, analytical approach was needed to shine new light onthe empirical effects on the poor and to differentiate between the realityand perception of reforms.
These studies identified the possibilities offered by the available data forempirically identifying the direction and magnitude of the impact of elec-tricity reforms on welfare distribution—and the potential of policy analy-sis tools for producing a picture of household behavior under reform.
Who Are the Stakeholders of Reform?
The aim of these studies was to improve understanding of the distribu-tional impact of reform on primary stakeholders, focusing on the poor.The primary stakeholders are utilities, government, and consumers.3 Forutilities, reforms aim at distancing them from political control and intro-ducing profit as an incentive for greater efficiency. To minimize costs util-ities will make more efficient resource allocations, while improving costrecovery through tariff increases allows them to invest in maintenanceand repair. The net effect is a more efficient sector that is financially sus-tainable and delivers a better service to consumers. Furthermore, estab-lishing a regulatory body that is independent from the government canimprove the situation of utilities since—in theory at least—they are nolonger subject to political pressures to provide cheap electricity.
Governments will benefit from reduced sector liabilities and fewer indi-rect transfers. This promotes a stable macroeconomic environment, whichhelps economic growth and allows public investments in other prioritysectors. Indirect government transfers are converted to quantifiable subsi-dies, which improves government record keeping and budgeting. Pri-vatization allows governments to get the utilities off their books entirely.An independent regulator, setting service quality standards and regulatingtariff increases, allows the government to distance itself from utility priceincreases, sending a signal to private investors that the government isserious about reform and about improving the investment climate.

Consumers can be divided according to their income level, whetherthey are urban or rural, by geographical region, or by different types offuel users.4 In general, consumers in ECA are expected to lose fromincreases in tariffs and collections, but gain from improvements in servicequality and availability, and ultimately from macroeconomic stability andhigher social sector spending. The magnitude of any one of these benefitscan be great and depends on several factors.
Households that had reliable service and consumed a lot of electricitybut did not pay their bills will lose because service quality improvementswill be minimal, but their costs will increase. Households that had illegalconnections that are now curtailed will lose, too. Households that previ-ously faced electricity rationing or voltage fluctuations that ruined theirappliances will also lose from price increases, but they will gain consider-ably from improvements in service quality and supply. They will see a netgain in welfare if improvements in service quality are sufficient to makeup for the welfare loss incurred as a result of tariff increases. For house-holds that receive government benefits, the impact of increasing tariffs willbe greatly softened. Households able to switch away from electricity tocheaper fuels will also be better off compared to those more dependent onelectricity (table 2.1).
The Theoretical Basis
The theoretical framework of these studies lies in social cost-benefit analy-sis. This is part of the range of elements in poverty and social impactanalyses (PSIAs), along with analyzing stakeholders and the institutionsimplementing the reform, and identifying channels that transmit impactsand the risks to the reform.5 The PSIAs examine empirical data on theimpact of reforms and approximate net welfare changes, in this case as theyaccrue to the primary stakeholders, households, government, and utilities.
The vast scale of utility sector reform means that household con-sumers are affected both directly and indirectly. Consumers are directlyaffected by improvements in service quality and increased prices. Butelectricity is also an important input for producing goods. A reform thatsubstantially affects the availability of electricity or increases the cost canprofoundly influence the cost of the basic consumption basket.Electricity reform will also have macroeconomic effects, an importantdeterminant of the welfare of all groups in society. And as fiscal deficitsgo down, the impact on growth and on other areas of government spend-ing should be positive, which will also improve the welfare of the poor.6
20 Lampietti, Banerjee, and Branczik

Using Poverty and Social Impact Analysis 21
Table 2.1. Winners and Losers from Reform—A Typology of Consumers
Welfare impact of reform
Consumer Improved Improved Greater
characteristics service service payment
before reform reliability quality Higher tariffs discipline
Enjoys reliable and good quality service
Little or no No impact No impact Very negative Very negative
payment
Eligible for No impact No impact Negative, depends Negative
social benefits on level of
assistance
Access to cheaper No impact No impact Negative, depends Negative
substitutes on ability to
substitute
Limited access to reliable and good quality electricity
Little or no Positive Positive Very negative Very negative
payment
Eligible for Positive Positive Negative, depends Negative
payment social on level of
benefits assistance
Access to cheaper Positive Positive Negative, depends Negative
substitutes on ability to
substitute
Access to unreliable and low quality electricity
Little or no Very positive Very positive Very negative Very negative
payment
Eligible for Very positive Very positive Negative, Negative
social benefits depends on level
of assistance
Access to cheaper Very positive Very positive Negative, depends Negative
substitutes on ability to
substitute
Consumes free Slightly Slightly No impact Very negative
electricity from positive positive
illegal connection,
no payment
No access to No impact No impact Limited impact, No impact
electricity, consu- but can be
mes alternate fuels priced out
Source: Authors.
To quantify all these effects requires general equilibrium analysis, usinga computable general equilibrium (CGE) model. This enables a broadassessment of the net effects of reform on the entire economy. As well asthe direct or first-order effects of sector reform on the consumption of

electricity, CGE models capture the indirect or second-order effects. Theycan quantify changes in the consumer basket as a result of changes in inputprices of different goods. They also allow simulation of the macroeconom-ic effect of reforms, factoring in such effects as reduced fiscal deficits.7
But CGE models have drawbacks that make them inappropriate forthe studies here. They require a substantial volume of micro- and macro-economic data that must be entered into a Social Account Matrix, datathat take time to collect and that may not be uniformly reliable.They alsorequire a much larger number of assumptions about relationships betweenvariables, with the reliability of the entire model resting on the accuracyof these assumptions. For a study that aims to bring clarity to policydebates, the complexity of the CGE process, and its inaccessibility, aremajor disadvantages.
Other analytical tools can give valuable information on the first-order effects of reform but require fewer resources than a CGEmodel.8 The studies here looked primarily at trends in the share ofmonthly household expenditures on energy (budget shares), compar-ing budget shares across income groups. Welfare analysis looks atwhich groups are seeing benefits from a policy. Changes to consumersurplus provide a measure of changes in welfare (in the Azerbaijan casestudy and in looking at energy sector reform across ECA in chapter 9).Proxy determinants, such as the incidence of disease, can be used forthe key nonmonetary dimensions of well-being (to a limited extentagain in chapter 9, on the environmental impact of reform). Andcontingent valuation can be used to infer the willingness to pay toassess demand for heat (chapter 8).9
Basing the analysis on one or more of these approaches provides afairly straightforward process that gives empirically useful results, at thesame time using fewer assumptions and more readily available data thana CGE model.A simpler procedure, it uses methods and produces resultsthat are more easily explained to stakeholders—who can participate inthe analysis and use the tool in future analyses. Given that the PSIAswere intended to tap local capacity, this also made the simpler methodattractive. The studies paint a picture of how a small number of vari-ables, such as price and availability of electricity, affect the welfare of astakeholder group, and they do this in a way widely understood by policymakers.
The studies do not capture the second-order effects of reform thatwould be seen in a CGE model, but they do examine some of the linksthat contribute to a more comprehensive view of reform than would come
22 Lampietti, Banerjee, and Branczik
from a partial equilibrium analysis. They may not simulate the effects onthe entire economy, but they do take into account the effects on stake-holders other than consumers, and they look explicitly at the link betweenhousehold consumption and utility revenue. In Armenia, the study usedhousehold data to show, in the short term, that although revenues fromresidential consumption should have increased by 16 percent with the tar-iff increase, collection rates fell by almost 10 percentage points, meaningthat residential revenues increased by only 6 percent. The studies alsoconsider the impact on the fiscal deficit, a prime motive for reform. Inaddition to examining the effectiveness of the social assistance system, theGeorgia study found that the government was spending a lot of resourceson a subsidy captured largely by higher income households, and that sub-sidies for gas consumption were increasing, encouraging people to switchto gas. It also found that the money that the government was saving onsubsidized electricity was not being channeled into social spending.
The studies also look at some of the secondary effects of reform,including the social and environmental costs of households switchingfuels as a result of changes in relative fuel prices, such as the time takento gather wood and the indoor air pollution associated with burning thesetraditional fuels. The Azerbaijan study considered the economic gainsfrom improved access to electricity in the agroprocessing industry, whichwill gain from a reliable energy supply through additional revenues andcost savings. It also examined how projected income growth could allevi-ate the welfare impact of increased tariffs.
Welfare Indicators and How to Measure Them
To assess the distributional impact of electricity reform measures—tariffincreases, greater collections of tariffs, and changes in service quality andavailability—the studies built a comparison of budget shares spent ondifferent types of energy across a specified period of reform. Thiscomparison required extremely reliable information on a specific set ofdiagnostic welfare indicators that included household income and expen-diture, electricity consumption, and absolute electricity expenditure. Thebudget share analysis was supplemented by information on service avail-ability and quality.
These welfare indicators can be compared across different groups ofconsumers—poor and nonpoor, urban and rural, those with access to sub-stitutes and those without—to compare how reform affects differentstakeholders. For example, how do different quintiles of the population
Using Poverty and Social Impact Analysis 23

respond to changes in price? This information enabled comparisons of thenet welfare effects of reform on these stakeholders. (For more informationon the methods and sampling techniques, see http://wbln0018.worldbank.org/esmap/site.nsf/pages/Flagship_2006).
Qualitative Analysis Qualitative analysis involves consulting a variety of stakeholders, includingrepresentatives from consumer groups and utility companies, government,the private sector, regulators, and households from different socioeconomicstrata and with access to different substitutes to electricity to obtain theirviews and experiences of reform. The analysis draws on focus groupdiscussions and in-depth interviews of key informants.
Qualitative analysis complements the quantitative analysis and hastwo important uses. When it is carried out before the quantitative analy-sis (the preferred approach in these studies), it can generate testablehypotheses about behavior in response to higher tariffs and thus informthe design of the quantitative survey. In Azerbaijan, for example, the qual-itative analysis helped in developing the typology of households usingdifferent fuels and in designing the survey questions to capture andmeasure behavior. It also provided important knowledge on the kinds ofappliances used by households. The focus groups also helped identify theaspects of the reform program that people are particularly concernedabout and thus what questions the quantitative surveys should include.
In Georgia and Moldova, the survey data were already available foranalysis from earlier surveys, and the qualitative analysis came second. Thisapproach has advantages when the qualitative data can help shed light onotherwise opaque quantitative findings and paint a more complete picture.
In the Moldova study, the qualitative analysis confirmed the validityof the findings on household behavior gleaned from the quantitativeanalysis. The quantitative analysis had suggested that the poor weregenerally doing better than they had been when reform was introduced:electricity consumption was rising along with incomes, and electricityexpenditures represented a decreasing share of the household budget.But the qualitative analysis, from focus groups with a representativecross-section of households, revealed that despite these improvements,people still faced serious hardships, and enforcement of payment wasresented particularly by the poor. Consumers were compelled to takeextreme measures, such as unplugging their refrigerators for days at atime, to keep their electricity consumption down to an affordable bareminimum. While the data revealed that average electricity consumption
24 Lampietti, Banerjee, and Branczik

had increased by 10 percent, from 50 KWh to 55 KWh, the focus groupsrevealed that this improvement was imperceptibly small.
In Georgia, the quantitative data showed that households in Tbilisiwere maintaining fairly stable energy expenditures and consumption levelsdespite tariff increases. This implied that they were replacing electricitywith less expensive fuels. The focus groups confirmed that householdswith access to gas preferred to use gas when possible, since it was cheaperthan electricity and cleaner and more convenient than other substitutes,such as kerosene and wood. Conversely, households without access to gaswere using kerosene or wood for heating and cooking and desperatelywanted access to gas—feeding into a key recommendation at the time tosubsidize the extension of the gas network to poor neighborhoods.
Quantitative Analysis Several methods were used to obtain data for the quantitative analysis ofwelfare indicators. The bulk of the data for the quantitative analysis camefrom household budget surveys (HBSs) containing data on general house-hold expenditure (as a proxy for household income) and energy con-sumption and expenditures. First explored was the possibility of using anexisting data set, such as a Living Standard Measurement Study (LSMS)or HBS. If no appropriate data existed, a new primary data collectionexercise was initiated, keeping the sampling frame and parts of the ques-tionnaire consistent with the most recent HBS or LSMS—to ensure thatthe PSIA work was consistent with the broader poverty assessment.
A typical HBS includes a household roster to show the size of thehousehold, and questions on household monthly income and expenditure,expenditure on electricity, and, where possible, fuels that the householduses as substitutes for electricity.10 Although HBS or LSMS data were usedwhere already available, the surveys designed especially for the studiescontain far more detailed questions about the number of fuels used andwhat they are used for, as well as questions about the household’sattitudes and perceptions of electricity sector reform and tariff increases.Ideally, the households surveyed are the same before and after reform, todetermine the effect of reform on them and to obtain a dynamic pictureof household welfare.
Generating Better Data HBSs are widely used as a tool to analyze poverty. The PSIAs for thisbook used a key empirical enhancement, however, by collecting thebilling and payment records from utilities for the same households
Using Poverty and Social Impact Analysis 25

covered in the HBS. The billing and payment records were then mergedwith the HBS to correlate the data for the same household in the sametime period. This is a time-consuming process that requires complicateddatabase manipulation, but the information on household consumptionproduces important results.
Merging the two data sources provides external validation of the self-reported electricity expenditure data in the HBS. While questions onelectricity consumption and expenditures can be included as part oftraditional poverty monitoring surveys such as the HBS, self-reportedelectricity and energy expenditure data collected in these surveys arenotoriously unreliable. The results are often confounded by recall error,under- and overreporting, and the presence of arrears, making it almostimpossible to identify current and historical consumption. The potentialdisparity between HBS figures and the data from utility records is illus-trated in the Georgia study, which displayed significant discrepanciesbetween reported and utility data. Payments reported in the HBS wereconsistently higher than those recorded by the utility, a finding thatmight be attributed to corruption, with households paying more tometer readers than meter readers transfer to the utility, or to recall error,which is easily explained if the households are reporting bills receivedrather than payments made. Conversely, in the Moldova study, the twosets of data from the HBS and the utility records were highly correlated,increasing confidence in the HBS data.
Matching household survey data on income with household datafrom the utility on electricity billing, consumption, and paymentallows a much more reliable and sophisticated analysis of residentialdemand, of who is getting what, and how much they are consuming. Itprovides empirical data on the distributional impact of price changes,service quality improvements, and other reform impacts, since the datacan be tracked over time for the same household. It permits a reliablecomparison of how much households with different characteristics arespending on electricity—how much the poor and the nonpoor consumeand differences in consumption between rural and urban households.And it makes it possible to disaggregate the impact of rising tariffs fromrising collection rates, since it can be seen who is paying bills, who isaccumulating arrears, and how much they are accumulating—allowing adetermination of whether price changes have contributed to thefts ofelectricity or to changes in consumption, or to both. Knowing whichhouseholds are accumulating arrears—whether they are poor ornonpoor, and, therefore, whether nonpayment is due to free-riding or
26 Lampietti, Banerjee, and Branczik

affordability—also tells whether policy makers need to focus on improvingenforcement or social transfers.
The Georgia case is an example of the kind of insight that reliableconsumption and expenditure data can give. The utility data allow acareful examination of household electricity consumption patterns overthe past three years. While prices increased, mean household electricityconsumption remained constant at about 125 KWh per month. Thisfinding has two implications for policy makers. First, current consump-tion levels are extremely low. Basic minimum consumption is likely tobe approximately 125 KWh per month, roughly enough electricity topower a refrigerator and three incandescent lightbulbs. Second, demandin Tbilisi, where service has been quite reliable for the past few years,remains constant despite price increases, suggesting inelastic demandand large welfare losses from future price increases.
The Moldova study showed changes in welfare indicators—includingaccess to, consumption of, and expenditures on electricity—comparingpoor with nonpoor households. The household survey also highlightedcoping mechanisms induced by increasing tariffs, consumer perceptionsof reform, and the role of the social assistance compensation system. Theanalysis answered very specific but politically charged questions, such aswhether the impact of reform was different for the poor and the non-poor, and whether those served by the private operator were worse off.
Reliable data on consumption of electricity and substitutes also allowa more nuanced examination of alternative social protection measures,such as income transfers and lifeline tariffs, including their social andfiscal impacts. Knowing the income and consumption patterns ofindividual households made it possible to simulate how much they willreceive under different transfer regimes, and how this compares withtheir welfare under a different mitigating strategy. It was also possibleto see whether transfers are well targeted and how much differentprotection measures will cost the government. In the Georgia study(chapter 5), this insight enabled a comparison of the benefits and costsof the current social protection strategy with an alternative strategydevised by the authors, and the determination that the alternative strat-egy would be more effective at targeting poor households and wouldcost the government less.
The reliability and detail of the information created by merging the sur-vey and the utility data also allowed the authors to build a demand modelto simulate energy consumption at different levels of energy price andincome. In the Georgia study, an electricity demand model demonstrated
Using Poverty and Social Impact Analysis 27

the minimum level of consumption below which demand is extremelyinelastic. In Azerbaijan, the methodology was carried a step further; util-ity and survey data from several countries were combined to estimate anelectricity demand model. This model was then used to predict thehousehold consumption response and the welfare consequences of differ-ent potential rates and levels of tariff increase, which can help in design-ing reform policy.
Another innovation that allowed new empirical insights was a modelfor estimating energy and electricity demand. In the study on heatingstrategies for the urban poor in chapter 8, the authors developed a modelfor estimating household heat consumption.
Limitations of the Methodology There are some important qualifications when considering the findings inthese studies. Perhaps the most significant weakness, which this method-ology shares with other techniques, is the inability to compare the findingson household impact of reform with the counterfactual—the situationhouseholds would find themselves in if reform had not taken place. Tosome extent, the situation of households before reform can be taken as anapproximation for the counterfactual, since it can be assumed that thissituation would have continued in the absence of reform. This is mosteffective when the same households are compared before and afterreform (a panel study); only the study for Georgia had this data. In theMoldova study, the ability to compare households served by a privateoperator with those served by a public utility also goes some way towarda counterfactual.
Another potential weakness, already discussed, is the methodology’sinability to model the second-order effects of reform on household con-sumers, effects that might be transmitted through various channels, includ-ing changes in prices, assets, access, employment, or transfers. For example,though the studies show the impact of rising prices and improving servicequality, consumers will also be affected by improved macroeconomicstability resulting from the fiscal benefits of reform, and from economicgrowth resulting from increasing access to electricity (though these issuesare mentioned in several of the studies, particularly for Georgia andAzerbaijan). This is not a major shortcoming, however, given the purposeof the studies: to find ways to smooth the transition to cost recoverythrough an understanding of the first-order effects of reform, rather thanto provide a picture of the aggregate welfare impact on the economy as awhole.
28 Lampietti, Banerjee, and Branczik

The Advantages of PSIAs for Designing Reform
The PSIAs were valuable because they presented an opportunity to con-duct a more robust empirical analysis of the social consequences, particu-larly those relating to poverty elements of the sector reform program.Theygenerated specific analytical innovations and provided a critical emphasison household behavior and choices, with the analysis contributing to newideas on how to mitigate the negative impact of reform. PSIAs showed amore complete picture of winners and losers from reforms, and how tocompensate the losers. Moreover, they can be used to draw policy recom-mendations for formulating less contentious reform in the future.
The combination of appropriate tools for analysis and creative use ofdata produced a unique story of the household level impact of reforms.The ex post analyses of Armenia, Georgia, and Moldova offer an impor-tant empirical record of how power sector reform affected the poor. Thisunderstanding gives guidance on how to modify the design of reformgoing forward, in the country in question and in similar cases in the regionand beyond. Ex ante studies, of Azerbaijan and of heating strategies forthe urban poor, also have clear implications for operational design. Thesimulation of how different reforms will affect welfare is invaluable ininforming decisions on which policies to adopt.
The ability to map and simulate the effects of reform and the innova-tions in data use made the PSIAs a significant contribution to the toolsfor evaluating and designing policy reforms. But perhaps the most impor-tant contribution is that the process and findings of the studies encouragepublic discourse on the reforms. With these PSIAs, a working group ofgovernment, civil society, and nongovernment stakeholders can bebrought in at the concept stage to participate in the analysis and discussthe findings. Largely through the collection of qualitative data and analysisof quantitative data, but also by forging new insights about the effects ofreform, both the process and the findings of the studies can generatestakeholder dialogue and engagement.
Stakeholder engagement and public discourse can slow the processof reform. But in recent years they have become part of donor-fundedprojects and are expected to have a significant impact on differentstakeholder groups as part of a more participatory approach to develop-ment. Experience from these and other studies demonstrated that timespent in stakeholder engagement and dialogue could not only help buildconsensus on reform, but also actually improve the design and outcomeof reform, making it more sustainable. By enabling a better dialogue and
Using Poverty and Social Impact Analysis 29

understanding of the implications of reforms and the possible alterna-tives, the PSIAs could prevent questions from becoming politicallyfraught in the first place. In Moldova, for example, the PSIA broughtinto the open several unexpected findings that had been at the heart ofthe debate over the merits and costs of reform and privatization.
The open process of information gathering and discussion with stake-holders can thus foster local ownership of the studies and enhances thecredibility of their findings. The involvement of stakeholders and localexpertise in the design and execution can also contribute to building capac-ity at the local level, among consultants, working committees, and govern-ments. Through their involvement they can do more in designing reformand in weighing the trade-offs. Since the goal is for countries eventually tocarry out these studies independently, this is a significant contribution.Andby emphasizing the importance of empirical analysis in designing and meas-uring the impact of reform, the studies also highlighted the importance ofcareful record keeping by the government and by the utility.
Since the first of these studies was commissioned, PSIAs have come tobe regarded in the World Bank as best practice “to promote evidence-based policy choices and foster debate on policy reform options.”11 PSIAsare now meant to be embedded and mainstreamed in country work toimprove policy design and the outcome and sustainability of reform.PSIAs are particularly important in the design of reforms that “are expectedto have large distributional impacts, are prominent in governments policyagenda, and are likely to involved significant debates,” all of which char-acterize power sector reform in ECA.12
Notes
1. For a more detailed discussion of the costs of across-the-board subsidies seeLovei and others (2000a) and Komives and others (2005).
2. World Bank (1998).
3. For a broader discussion of stakeholders and tools for their analysis, seewww.worldbank.org/psia and World Bank (2003g). For a broader discussionof reforms of utility providers, see chapter 3 in Coudouel and Paternostro(2005).
4. For a more complete analysis of the range of consumer stakeholder groups, seeFoster, Tiongson, and Laderichi (2005), pp. 84–88.
5. See World Bank (2003g).
30 Lampietti, Banerjee, and Branczik

6. The channels for reforms to affect different groups can be classified asemployment, prices (production, consumption, and wages), access, assets, andtransfers. For a discussion of these channels, see World Bank (2003g).
7. See, for example, Chisari, Estache, and Romero (1999).
8. For a review of the broad range of tools available to measure distributionalimpacts, ranging from simple incidence analysis to more complex models link-ing macroeconomic models with microsimulation, see Bourguignon andPereira da Silva (2003), available at www.worldbank.org/psia.
9. For more on different techniques to measure or predict the impact of reform,see chapter 3 in Coudouel and Paternostro (2005), pp. 107–12.
10. See the HBS sample at http://wbln0018.worldbank.org/esmap/site.nsf/pages/Flagship_2006.
11. Coudouel and Paternostro (2005), p. xi.
12. Coudouel and Paternostro (2005), p. xi. Other examples include trade, mon-etary, and land policy reform. For illustrations of the particular aspects ofselected reforms, see Coudouel and Paternostro, eds. (2005). For examples ofapplications of the PSIA approach to other countries and sectors, see “A User’sGuide to Poverty and Social Impact Analysis,” at www.worldbank.org/psia.
Using Poverty and Social Impact Analysis 31


P A R T 2
Case Studies

Between 1990 and 1997, per capita commercial energy consumptionacross the Europe and Central Asia (ECA) region fell by one-third.1
Though much of this drop can be attributed to the collapse of industry,there also appears to have been a fundamental shift downward in resi-dential energy consumption, attributable to the decline in subsidizedinfrastructure services, coupled with rising poverty and higher prices ofbasic goods and services. This chapter reviews energy sector reforms inECA and changes in residential energy consumption over the pastdecade and a half.2
Patterns of Reform
Energy sector reform included unbundling, privatizing, establishing inde-pendent regulatory bodies, and improving cost recovery.3 But reform hasvaried widely across the region, with differences in how reforms havebeen adopted and their success (table 3.1 and annex 1). These differencescan be understood through the prism of political, institutional, and
C H A P T E R 3
Energy Reforms and Trends
in Household Consumption
35

macroeconomic conditions, including energy endowments, accession tothe European Union (EU), and the accumulation of energy-related debt.
Most Central and Eastern European countries made early progress inreforming the energy sector. They displayed better macroeconomic per-formance and provided a reasonably attractive environment for foreigninvestors.The prospect of EU accession and the need to conform with theEU directive on power reforms also provided the impetus for fast-pacedreform, especially in developing a regulatory framework and unified gasand electricity markets.4 Hungary was the leader in pursuing major elec-tricity privatizations in the 1990s, with most electric utilities privatizedand tariffs at the world market level.5
Countries in Southeastern Europe and the former Soviet Union werefrequently characterized by war and civil unrest, volatile political condi-tions, destroyed physical infrastructure, risky investment climates, weakadministrative capabilities, and low utility payments, resulting in extremedecapitalization of the sector.
Possessing energy resources could both ease and hurt progress withreform.6 Energy-exporting countries such as Azerbaijan, Kazakhstan, andTurkmenistan gained from a change in their terms of trade during transi-tion; they were able to export their energy resources at the higher worldprice, staving off fiscal crises. Energy-poor countries such as Armenia,Georgia, and Moldova lost due to dependency on unreliable and expen-sive external energy supplies. Forced to accumulate energy-related debt,they did not have the resources within the energy sector to mitigate theadverse social impact of reforms.
36 Lampietti, Banerjee, and Branczik
Table 3.1. Timeline of Reforms in the Electricity Sector in ECA
Date of passage
of energy law
and creation of
an independent Corporatization Privatization of Privatization
regulator and unbundling distribution generation
Armenia 1997 1997 2002 2002–03
Azerbaijan (2006) 1998 2002 (management None
contract)
Georgia 1997 1999–2000 1998 2000
Hungary 1993–94 1993–94 1995 1996–97
Kazakhstan 1998–99 1996 1996, 1999 1996, 1999–2002
Moldova 1998 1997 1999 None
Poland 1997 1993 Ongoing Nonea
Source: Adapted from Krishnaswamy and Stuggins (2003).
a. Except for new entry of private strategic investors.

Energy Reforms and Trends in Household Consumption 37
But energy endowments can also constitute a barrier to reform whenresource rents are appropriated by ruling elites.7 Just as the symbioticrelationship between energy utilities and the government meant wide-spread corruption and rent-seeking in the pre-reform era, there arepowerful motives for ruling elites to benefit from partial reforms in lucra-tive sectors by gaining control of the regulatory process and preventingthe creation of a level playing field. By contrast, the need to reduce energy-related external debt has been a significant driver of reform in heavilyindebted Armenia, Georgia, and Moldova,8 and conditional lending bydonors was used in an effort to promote reform (though the performanceof conditionality has been mixed).9
Trends in Residential Electricity Consumption
The second half of the 1990s saw a gradual return to political stability,paving the way for economic reform programs, and most countries sawstabilization and even improvement in their economic situation by theend of the decade.10 But the rocky transition of the 1990s took a heavytoll on living standards and equality, and high, if declining, levels of povertystill characterize much of the region (figure 3.1).
ECA households in the 1990s were spending 2–10 percent of theirincome on electricity.11 The lowest 20 percent of the households, thepoor, consistently spend a larger share of their income on electricitythan the top (figure 3.2), suggesting that once a certain minimum levelof consumption is reached, consumption becomes price inelastic.12 Iftrue, this analysis implies a greater proportionate welfare loss for the poorand a more active search for substitutes when tariffs are increased to cost-recovery levels.
0
5
10
15
20
25
1984 1987 1990 1993 1996 1999 2001
per
cen
tag
e o
f p
op
ula
tio
n li
vin
g o
nle
ss t
han
$2
a d
ay
Figure 3.1. Poverty in ECA Increased with the Transition
Source: World Bank (2005b).

That the poor spend a larger share of their income on electricity alsoimplies that they use it for needs for which other fuels are poor substi-tutes, such as lighting, refrigeration, and television.Wood, kerosene, lique-fied petroleum gas (LPG), and gas are viable substitutes for electricity inheating and cooking when available. Households that have few alterna-tives to heating with electricity have the greatest difficulty in shiftingtheir energy consumption to less expensive fuels, making them more vul-nerable to electricity tariff increases.
There are also sharp differences in electricity consumption betweenurban and rural areas. Poor rural households generally spend a lower shareof income on electricity than poor urban households (figure 3.3), perhapsbecause they have greater access to inexpensive substitutes such as woodand coal, which can be used instead of electricity for heating, but whichcan have environmental and social costs. In addition, as the electricitysupply deteriorated due to lack of investment and maintenance in the1990s, rural areas may have been disproportionately affected by black-outs, contributing to lower expenditures.
Service Quality and AvailabilityEven though official statistics and household surveys suggest that access toservice is nearly universal, supply is often rationed because of deteriorationsin service quality. Some countries experience frequent interruptions in elec-tricity supply and fluctuations in voltage that destroy household appli-ances.13 Supply shortages are likely to become more widespread unlessinvestments are made in rehabilitation and maintenance of infrastructure.14
38 Lampietti, Banerjee, and Branczik
0
2
4
6
8
10
Albania
Armenia
Azerb
aijan
Belarus
Bulgaria
Georgia
Hungary
Kazakhsta
n
Kyrgyz R
epublic
Mold
ova
Poland
Romania
Russia
Serbia
Tajikist
an
Turkey
Ukrain
e
lowest 20 percent highest 20 percent
per
cen
t
Figure 3.2. The Poor Spend a Larger Share of Their Income on Electricity
Source: Author’s calculations based on household survey data from the World Bank ECA HBS database.
Note: Conditional on households reporting positive expenditures. Figures for Bulgaria and Tajikistan are for 2003.

Energy Reforms and Trends in Household Consumption 39
Nonpayments Nonpayment is one of the most vexing problems for electricity sectorreform in ECA, and resolving it has been a key reform objective. Butknowing who accumulates arrears is critical to understanding the welfareeffects of reforms. If it is mainly the poor, affordability, not free-riding, isprobably the cause of nonpayment. In fact, the poor are much more like-ly than the nonpoor to report zero electricity payments.15 Nonpaymentsare positively correlated with expenditure ratios: the greater the electric-ity consumption as a percentage of total household expenditure, the morelikely that the household does not pay its electricity bills (figure 3.4).Thissuggests that policies to raise collections and tariffs simultaneously willdisproportionately affect the poor.
Other Energy Sources
Other Network Fuels: Gas and District Heating Gas is an efficient alternative to electricity for heating and cooking,even at full import prices. While there may be additional costs associat-ed with the technology required to use gas (metering and gas-firedappliances), the convenience and savings suggest that, given access, it isfavored as a household fuel for heating and cooking. Back-of-the-envelopecalculations confirm the rising use of natural gas. In Armenia, residen-tial consumption of natural gas more than tripled from 1996 to 2001(from 29,000 tons of oil equivalent to 90,000), while monthly electricity
0
2
4
6
8
10
12
Albania
Armenia
Azerb
aijan
Belarus
Bulgaria
Georgia
Hungary
Kazakhsta
n
Kyrgyz R
epublic
Mold
ova
Poland
Romania
Russia
Serbia
Tajikist
an
Turkey
Ukrain
e
urban lowest 20 percent rural lowest 20 percent
per
cen
t
Figure 3.3. The Rural Poor Spend Less of Their Income on Electricity Than the Urban
Poor Do (2000)
Source: Author’s calculations based on household survey data from the World Bank ECA HBS database.
Note: Conditional on households reporting positive expenditures. Figures for Bulgaria and Tajikistan are for 2003.

consumption dropped from 187,000 tons of oil equivalent to106,000.16 For Georgia, the number of gas connections in the capitalquadrupled from 2000 to 2003.17
The analysis for district heating and gas shows that while access levelsare not as high as for electricity, expenditure patterns are similar.The low-est 20 percent of the population spends a higher share of income on dis-trict heating and gas than the top, and nonpayment rates are higher in thelowest 20 percent. In almost all countries, the highest 20 percent of thepopulation has substantially higher access to gas than the bottom.
Non-network Fuels If poor people are not using network energy, what are they using? A2002 study found that in many cases the answer is traditional non-network energy.18 Of non-network fuels, the cleanest, LPG, tends tobe expensive, with coal and wood cheaper. Coal and wood use areconsistently higher for the poor than the nonpoor (table 3.2).19 Ofseven country studies, in six the nonpoor are more likely to use LPGwhile the poor favor traditional non-network energy. Burning tradi-tional fuels has environmental and social costs, including air pollutionand deforestation, implying that reforms that raise prices of cleanenergy must take into account the size and economic implications ofthese costs.
40 Lampietti, Banerjee, and Branczik
0
10
20
30
40
50
60
Albania
Armenia
Azerb
aijan
Belarus
Bulgaria
Georgia
Hungary
Kazakhsta
n
Kyrgyz R
epublic
Mold
ova
Russia
Serbia
Tajikist
an
Turkey
Ukrain
eper
cen
tag
e o
f ho
use
ho
lds
rep
ort
ing
zero
ele
ctri
city
exp
end
itu
res
lowest 20 percent highest 20 percent
Figure 3.4. Poor Households Are Less Likely to Pay Their Electricity Bills
Source: Author’s calculations based on household survey data from the World Bank ECA HBS database (2002). See
annex 2 for more information.

Changes in Consumption across Income Groups20
The trade-off between income and energy expenditure can be assessed(preliminarily) by running a regression to estimate the expenditure elas-ticity of energy demand.21 In doing so, however, it must be rememberedthat differences in rates of change in household spending across countriesmay be affected by differences in local policy and physical infrastructure.
Although there is variation across countries, the results show that, rel-ative to income, poor people’s overall energy expenditures are consistentlymore elastic than those of the nonpoor (figure 3.5).A 10 percent increase(decrease) in income results in an 8 percent increase (decrease) in energyexpenditure for poor people and a 5 percent increase (decrease) for non-poor people. (In other words, the elasticity of energy expenditure relativeto income is 0.8 for the poor and 0.5 for the nonpoor.) In an environmentof falling incomes in the late 1990s, the poor appeared to be cutting backon energy expenditures (as a percentage of income) faster than the non-poor, probably by consuming less expensive traditional fuels.
This finding contrasts with the price elasticity of electricity expendi-tures, which is lower for the poor than for the nonpoor in the countriesstudied here. Why? Because in many places the poor already consumevery low levels of electricity, and little scope remains for further reducingtheir consumption (chapter 9).
Conclusion
These findings tell us something about energy consumption patterns inECA and how they have changed since the onset of transition and
Energy Reforms and Trends in Household Consumption 41
Table 3.2. Urban Non-network Energy Use in ECA
(percent)
Liquefied
petroleum gas Kerosene Coal Wood
Country Poor Nonpoor Poor Nonpoor Poor Nonpoor Poor Nonpoor
Armenia, 1999 17 27 14 11 na na 47 50
Croatia, 1997 44 45 3 7 1 1 51 26
Kyrgyz 24 39 31 17 60 31 46 22
Republic, 1999
Latvia, 1997 37 28 na na <1 <1 1 2
Lithuania, 1998 na na na na <1 <1 1 2
Moldova, 1999 6 7 na na 9 5 12 9
Tajikistan, 1999 na na <1 1 11 18 47 32
Source: Author’s calculations from household survey data. Lampietti and Meyer 2002.
na = is not available from household survey.
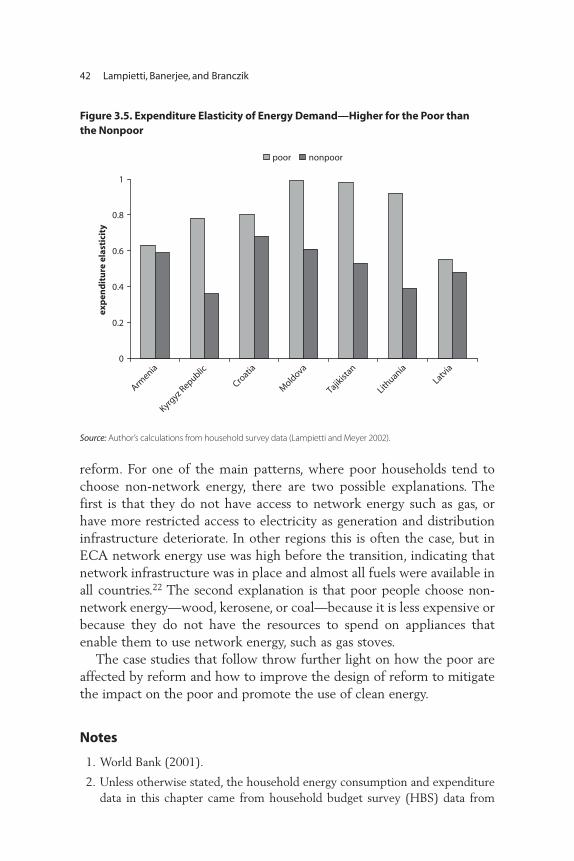
reform. For one of the main patterns, where poor households tend tochoose non-network energy, there are two possible explanations. Thefirst is that they do not have access to network energy such as gas, orhave more restricted access to electricity as generation and distributioninfrastructure deteriorate. In other regions this is often the case, but inECA network energy use was high before the transition, indicating thatnetwork infrastructure was in place and almost all fuels were available inall countries.22 The second explanation is that poor people choose non-network energy—wood, kerosene, or coal—because it is less expensive orbecause they do not have the resources to spend on appliances thatenable them to use network energy, such as gas stoves.
The case studies that follow throw further light on how the poor areaffected by reform and how to improve the design of reform to mitigatethe impact on the poor and promote the use of clean energy.
Notes
1. World Bank (2001).
2. Unless otherwise stated, the household energy consumption and expendituredata in this chapter came from household budget survey (HBS) data from
42 Lampietti, Banerjee, and Branczik
0
0.2
0.4
0.6
0.8
1
Armenia
Kyrgyz R
epublic
Croatia
Mold
ova
Tajikist
an
Lithuania
Latvia
exp
end
itu
re e
last
icit
y
poor nonpoor
Figure 3.5. Expenditure Elasticity of Energy Demand—Higher for the Poor than
the Nonpoor
Source: Author’s calculations from household survey data (Lampietti and Meyer 2002).

both urban and rural areas in 17 of the 29 countries across the region for2002. The HBS included questions on monthly per capita expenditure andaccess to and expenditure on electricity, gas, central heating, liquefied petro-leum gas, total energy, and water. From this information it is possible to cal-culate electricity expenditure as a share of total expenditure (budget share),changes in budget shares before and after reform, and changes in consumersurplus. A full breakdown of all the household survey data is in annex 2.
3. See table 2.3.
4. The EU directive on power reforms includes liberalizing markets, unbundlingutilities, and establishing regulated third-party access for the power network.
5. Poland, following the dissolution of the communist regime, embarked on anambitious “economic transformation program” in 1990. But the Polish govern-ment has been more careful than Hungary to allow entry of foreign investorsin the energy sector, deemed “strategic” by the government. For more infor-mation on Hungary’s and Poland’s EU requirements, see World Bank (1997b,1999c).
6. Saavalainen and ten Berge (2003).
7. Esanov and others 2001. For suggestive evidence on this in other regions, par-ticularly on the philosophical debate and empirical evidence on the inverserelationship between natural resource abundance and economic growth, seeSachs and Warner (1995).
8. Hellman (1998); Saavalainen and ten Berge (2003).
9. From 1993 to 2002, only 60 percent of International Monetary Fund (IMF)energy conditions were implemented (primarily relating to foreign energydebt and categorical privileges). Recognizing this, the IMF and the WorldBank later reduced the number of conditions in all countries except Georgia(Saavalainen and ten Berge 2003).
10. The analysis in this section is based on the World Bank’s ECA HouseholdBudget Survey database for 2002.
11. Throughout the rest of the book, total expenditure is used as a proxy forincome.
12. This finding holds across a wide number of countries, suggesting it is quiterobust.
13. Markandya, Jayawardena, and Sharma (2001).
14. Cambridge Energy Research Associates estimates that half of Russia’s gener-ation capacity must be retired in the next 20 years as it reaches the end of itsproductive life, while more than the total installed generation capacity ofFrance needs to be added. If these investments are not made, Russia is expect-ed to suffer from nationwide electricity shortages in the near future (TheEconomist 2002).
Energy Reforms and Trends in Household Consumption 43
15. Households may report zero payment for a variety of reasons, including poorservice quality, billing cycles, and arrears.
16. Total residential consumption from the energy balance data in Armenia(Ministry of Energy). Converted to kilowatt hours (KWh) using the conver-sion factor of 1,000 KWh = 0.086 tons oil equivalent, this gives an increase innatural gas consumption from 337 million KWh in 1996 to 1,046 millionKWh in 2001, and a reduction in electricity consumption from 2,174 millionKWh in 1996 to 1,232 million KWh in 2001 (conversion factor from theWorld Energy Council) (Lampietti 2004).
17. Tbilgazi’s customer base increased from 39,000 households in June 2000 to164,000 households in January 2003 (Lampietti and others 2003).
18. Lampietti and Meyer (2002).
19. The exception is Tajikistan, where coal is heavily subsidized for everyone.
20. The analysis here, based on data from seven countries, was originally presentedin Lampietti and Meyer (2002).
21. This follows the methodology in Subramanian and Deaton’s (1996) study ofthe demand for food calories. Log energy expenditure is regressed onto logtotal household expenditure (a proxy for income).
22. See annex 5.
44 Lampietti, Banerjee, and Branczik

A pivotal moment in Armenia’s electricity sector reform was a tariffincrease in January 1999, several years into the reform program and afterthe height of Armenia’s energy crisis.The increase was the most radical todate: it was the biggest, and it was a shift from an increasing block tariffto a single rate, removing the subsidy regime.
The move provoked an energetic debate among those working onreform at the World Bank, which had strongly encouraged Armenia’sgovernment to make the change. Those in favor of the increase arguedthat the current system, where the first 100 kilowatt hours (KWh) ofelectricity consumed was highly subsidized for all households, need-lessly benefited the nonpoor and encouraged inefficient usage.Opponents of the increase argued that electricity expenditures consti-tuted a higher percentage of the incomes of the poor, who wouldtherefore be disproportionately affected by the price increase. Thoughthe reform included a restructuring of the social benefits system,replacing the old tariff-based subsidy with a direct transfer, opponentswere not convinced that this would be effectively targeted to the poor.
C H A P T E R 4
Raising Prices in Armenia—What
Happens to the Poor?
45

Adding significance to the debate were more general concerns aboutthe effects of reform on the poor across the region.
Before the Price Hike
In the late 1980s and early 1990s, Armenia’s economy suffered a cata-strophic earthquake, the breakup of the Soviet Union, protracted con-flict, and the closure of borders with Azerbaijan and Turkey. Political andeconomic isolation—landlocked and entirely dependent on imported oiland gas—compounded the effects of rising energy prices. The cost ofsupplying electricity and central heating skyrocketed, while residentialelectricity prices remained very low. Unable to cover internal mainte-nance costs and crippled by the shutdown of the nuclear power plantand weekly interruptions in natural gas supply, by 1992 electricity utili-ties were on the verge of collapse.
Residential consumers bore the brunt of the utility crisis. From 1992to 1995, most of the population received only two to four hours of elec-tricity per day, and central heating and natural gas supplies were virtuallyterminated. The economy also suffered as public infrastructure and theindustrial sector were hit by shortages. Consumers stopped paying theirutility bills, and in 1994, payment for electricity fell to only 10 percent ofbillings, further threatening the sector’s sustainability. With district heat-ing also gone, residents of the capital Yerevan burned trees, telephonepoles, and books to get through the winter, and deforestation for fuelwood took place on a devastating scale.
With an economic reform program in 1995, the economy began to sta-bilize, and starting in 1995–96, the Armenian government embarked onreforms to put the energy sector back on its feet. Armenia soon madeprogress in restructuring and regulating the energy sector, raising tariffs,improving payment discipline, and making the electricity supply morereliable. The result was a dramatic improvement in the supply of electric-ity; by 1999 most households were again receiving service 24 hours a day,and outages were shorter and less frequent.
Increasing cost recovery by utilities became a cornerstone of the gov-ernment’s economic reform program. Until 1999, Armenia had anincreasing block tariff structure. The first 100 KWh of electricity con-sumed cost households dram 15 per KWh; the second block, 100–250KWh, cost dram 20 per KWh; and the third block, above 250 KWh,cost dram 25 per KWh. The government’s strategy—under pressurefrom the World Bank and the IMF, which were financing power sector
46 Lampietti, Banerjee, and Branczik

Raising Prices in Armenia—What Happens to the Poor? 47
rehabilitation—was to couple tariff increases with generalized socialtransfers targeted at low-income households.
On January 1, 1999, the Energy Regulatory Commission eliminatedthe increasing block tariff in favor of a single uniform tariff of dram 25($0.048) per KWh. The change in tariff structure led to a sizable increasein electricity prices, and to soften the impact of this increase, the pooresthouseholds were compensated with a direct cash payment through thesocial protection system.
Higher utility tariffs were already meeting political resistance, and inlate 1998 and early 1999 the government was concerned about theimpact of cost-recovery efforts on consumers, particularly the poor. Theeconomy appeared to be on the path of sustainable growth, but transi-tion, economic reform, natural disaster, and war had taken a heavy tollon the living standards of Armenians. Real wages were still only 12percent of 1990 levels, and increases were outpaced by real prices ofelectricity and other utilities combined with a substantial increase incollection rates (figure 4.1). Further increases in tariffs and collectionrates, unless effectively mitigated, would only add to the difficultiesfacing Armenians.
This study looks at who was more affected by tariff increases and theremoval of tariff-based transfers (the poor or the nonpoor), how theeffects show up, and whether transfers from the government’s social ben-efit system cover the increase in the average tariff. By analyzing thesequestions, the study can help the government devise a socially equitableand politically feasible strategy for reform (box 4.1).
050
100150200250300350400450500
1994 1995 1996 1997 1998 1999
per
cen
t o
f 19
94
pri
ces
real electricity pricesreal wages
Figure 4.1. Electricity Price Increases Outpaced Real Wages
Source: Authors’estimates.

Residential Energy Consumption in Armenia
Uses of Energy The surveys found that households consume energy for lighting, heating,water heating, and cooking. For lighting, 100 percent of households reliedon electricity. For heating and cooking they consumed wood, electricity,central gas, liquefied petroleum gas (LPG), and, much less commonly,dung, kerosene, and diesel.
Large amounts of energy were consumed for heating, particularly inthe colder winter months. Fifty-three percent of households used wood,and 17 percent electricity (table 4.1). Other important heating sources
48 Lampietti, Banerjee, and Branczik
Box 4.1
Data for the Analysis—Armenia
Qualitative analysis was conducted through interviews and focus group discus-
sions across the country to understand how people viewed reform and how they
were dealing with it through substitutes and other coping mechanisms. This in-
formed the quantitative data collection, which consisted of a survey of 2,010 ran-
domly selected households from different parts of the country where people had
access to gas, wood, and electricity, and was conducted in December 1999 and
January 2000.
The household survey data were merged with Armenergo billing, payment, and
consumption records from January 1, 1998 to December 31, 2000, to build a picture
of household energy consumption patterns in response to changes in energy sup-
ply and increased tariffs. A subset of 1,514 households with complete utility records
from March 1998 through December 1999 was used to analyze the impact of the
1999 tariff increase.a Unless otherwise noted, the discussion here compares house-
hold consumption and payment behavior between 1998 and 1999 using March
1998–November 1999 billing, payment, and consumption data.b
Note: a. In the analysis here, about 33 percent of rural and urban households are poor. The study draws
poverty lines so that rural households with per capita expenditures of less than dram 4,100 and urban
households with less than dram 6,700 are defined as poor. These are relative poverty lines defining the
poor as the lower one-third of households in the per capita expenditure distribution and are generally
consistent with the 1996 line. The proportion of poor and nonpoor households in the subset used to an-
alyze the impact of the tariff increase is equal to the proportion in the overall sample, 485 poor and
1,029 nonpoor households. Unfortunately, complete billing records for households in Yerevan are avail-
able from the utility only for months after March 1998.
b. December 1999 billing and consumption data are excluded because payment information is not
available for that month (January 2000 payments).

Raising Prices in Armenia—What Happens to the Poor? 49
included natural gas and central heat. Rural households depended moreon wood for heating than urban households. In urban areas, the poordepended significantly more on wood for heating (56 percent) and less onelectricity (14 percent) than the nonpoor (42 percent and 29 percent).
For heating water, 44 percent of households used wood, 35 percentelectricity, and 14 percent natural gas. Again, the urban poor dependedsignificantly more on wood and significantly less on electricity than theurban nonpoor for both heating water and cooking. Natural gas wasfavored for cooking by the nonpoor in both rural and urban areas.
Energy Consumption and Expenditure The poor consumed 20–30 percent less of each energy type than the non-poor. Median annual household consumption of electricity was 1,275KWh, LPG 60 kilograms, wood 5 cubic meters, and dung 5 cubic meters.1
Rural households consumed less electricity and natural gas and morewood and dung than urban households.
Though the poor consumed less, the burden of energy expenditureswas particularly large for them. Poor households devoted close to 30 per-cent of their monthly expenditure to energy, compared with 18 percentfor the nonpoor (table 4.2).2 Electricity made up the bulk of energyexpenditures for all households.The burden of tariff increases appeared tobe highest among the urban poor, with 16 percent of their total monthlyexpenditures going to electricity alone. The rural poor spent equivalentamounts on wood and electricity. In western countries, including NorthAmerica and Western Europe, electricity expenditures typically rangefrom 3 percent to 7 percent of total income.3
Table 4.1. Wood and Electricity Make Up the Bulk of Household Winter Energy
Expenditures (percent of household expenditure)
Heating Heating water Cooking
Primary source Poor Nonpoor Poor Nonpoor Poor Nonpoor
Electricity 10 20 31 37 28 29
Central heat 7 9 — — — —
Central gas 8 11 11 13 13 16
LPG <1 <1 1 1 8 13
Wood 59 50 47 43 41 35
Dung 6 5 6 5 6 4
Other 9 5 4 2 5 2
Total 100 100 100 100 100 100
Source: 1999–2000 survey. See box 4.1.
Note: This is household expenditure, not per capita expenditure. Poor households are typically larger than nonpoor
households, so per capita expenditure gives different results.

Remember that expenditures on wood and dung might not fullyreflect consumption, particularly for the poor, since households often col-lected part or all the wood they use for heating and cooking rather thanbuy it. Sixteen percent of households cut their own wood, with this activ-ity concentrated in the densely forested province of Lory Marz. The poorspent approximately 20 days a year on this activity, the nonpoor 12 days.
Improvements in Electricity Supply The reliability of electricity supply increased steadily after 1994, whenservice was available for only a few hours a day. In 1996, slightly less than 90 percent of households reported expenditures on electricity. By 1999,98 percent of households reported having electricity and paying for it,with the remaining 2 percent reporting that their service was cut off dueto nonpayment.
In addition to better coverage, electricity service became more reliable.In focus groups and individual interviews, respondents indicated thatelectricity was available 24 hours a day in all locations and that there wereno electricity failures. Seventy percent of respondents reported no breakin service in the preceding year. Of the 30 percent who did have a break,the median duration was 3 days and the mean 14 days.These figures wereslightly higher for the poor (4 days and 17 days) than for the nonpoor(3 days and 12 days). The quality of service was rated as average or betterthan average 95 percent of the time, though 22 percent of respondentsreported having lost an appliance in the last year as a result of a surge inelectricity.
Respondents were satisfied with the electricity service maintenance.Eighty-six percent believed that a utility employee performs mainte-nance activities. But the qualitative consumer satisfaction survey indicatedthat respondents were not sure whom they should contact if they had
50 Lampietti, Banerjee, and Branczik
Table 4.2. The Burden Is Higher for the Poor
(percent of monthly expenditure)
Rural Urban
Poor Nonpoor Poor Nonpoor
Electricity 13 7 16 9
Natural gas 6 4 3 2
Wood 13 8 5 2
Other 1 1 2 1
Total 34 21 27 16
Source: 1999–2000 survey. See box 4.1.
Note: Households reporting positive expenditures for at least one of the three energy sources in the table.

problems with their electricity service. Friends or relatives often madeinformal repairs in the household, while a higher percentage of thepoor reported making repairs themselves (13 percent) than the nonpoor(7 percent).
How Households Cope with Increasing Collections Armenia made considerable progress in improving electricity collectionrates after 1994. Electricity is metered in all households, with metersread at least once a month.4 But with energy expenditures accountingfor 15–30 percent of per capita income, many households have a verydifficult time paying bills. Focus group discussions suggested that onecoping mechanism was to pay only a fraction of the bill, maintainingservice while accumulating arrears. Another coping mechanism was tomonitor consumption closely and then impose austerity measures whenthe budget is reached.
Most households paid only part of their electricity bill each month,contributing to a rapid increase in arrears. When questioned directly,households reported that they paid to avoid having their service cut off.
A common explanation from households for nonpayment was that thegovernment owes them salary arrears, pension arrears, or the savings thatdisappeared from their bank accounts at the end of 1993. Public sectoremployees often stated that until wages are increased they would not paytheir utility bills.
How did people reduce consumption of electricity in the face of risingprices? Ninety percent of the poor and 86 percent of the nonpoor saidthey were always careful to turn out the lights when leaving a room.Seventy-three percent of the poor and 61 percent of the nonpoor saidthey always made an effort to wear more clothing to reduce the amountof electrical heating they consume. In response to higher prices, peoplebecame more economical with their consumption. The question is: Atwhat point does this change in behavior become a burden that reduceswelfare?
Use of SubstitutesEighty percent of all households and 95 percent of the rural poor reportedthat they substituted for electricity in response to rising prices, primarilyfor heating and cooking. As electricity consumption dropped, reportedconsumption of wood and natural gas increased. More than 60 percentreported that the primary substitute was wood and about 24 percent gas(table 4.3). The stated increased reliance on wood was particularly acute
Raising Prices in Armenia—What Happens to the Poor? 51
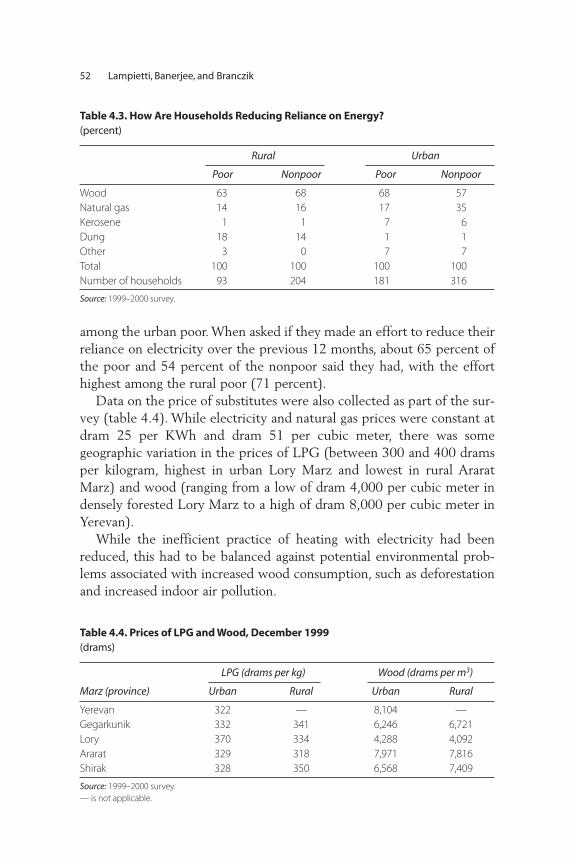
among the urban poor. When asked if they made an effort to reduce theirreliance on electricity over the previous 12 months, about 65 percent ofthe poor and 54 percent of the nonpoor said they had, with the efforthighest among the rural poor (71 percent).
Data on the price of substitutes were also collected as part of the sur-vey (table 4.4). While electricity and natural gas prices were constant atdram 25 per KWh and dram 51 per cubic meter, there was somegeographic variation in the prices of LPG (between 300 and 400 dramsper kilogram, highest in urban Lory Marz and lowest in rural AraratMarz) and wood (ranging from a low of dram 4,000 per cubic meter indensely forested Lory Marz to a high of dram 8,000 per cubic meter inYerevan).
While the inefficient practice of heating with electricity had beenreduced, this had to be balanced against potential environmental prob-lems associated with increased wood consumption, such as deforestationand increased indoor air pollution.
52 Lampietti, Banerjee, and Branczik
Table 4.3. How Are Households Reducing Reliance on Energy?
(percent)
Rural Urban
Poor Nonpoor Poor Nonpoor
Wood 63 68 68 57
Natural gas 14 16 17 35
Kerosene 1 1 7 6
Dung 18 14 1 1
Other 3 0 7 7
Total 100 100 100 100
Number of households 93 204 181 316
Source: 1999–2000 survey.
Table 4.4. Prices of LPG and Wood, December 1999
(drams)
LPG (drams per kg) Wood (drams per m3)
Marz (province) Urban Rural Urban Rural
Yerevan 322 — 8,104 —
Gegarkunik 332 341 6,246 6,721
Lory 370 334 4,288 4,092
Ararat 329 318 7,971 7,816
Shirak 328 350 6,568 7,409
Source: 1999–2000 survey.
— is not applicable.

Increases in wood consumption appeared closely correlated with theprice of wood, with the highest stated increases in wood consumptionin Lory Marz, and the lowest increase in Yerevan. Again, this suggestedthat the burden of rising electricity prices was likely to be highest forpoor urban households, who faced the highest priced substitutes forelectricity. Although nonpoor households consumed more electricity, asa percentage of household monthly expenditure the poor were dispro-portionately affected by the price increase.
Attitudes to Reform The qualitative data yielded interesting information about public opinionand awareness of the electricity sector, which backed up the government’sambivalence toward tariff reform. Although affected by power outagesand worried about the safety of the nuclear power plant, focus group par-ticipants worried that utility sector improvements would be too expen-sive to implement and were concerned about how utility reforms wouldaffect the poorest segments of the population. Corruption was perceivedas a major obstacle, suggesting that the government had limited credibilityand could not rely on public support for continuing policy changes.
Who Suffered Most: The Impact of Reform
The analysis provides a comprehensive snapshot of household energyconsumption in Armenia. The discussion now turns to look more closelyat the impact of the January 1999 change—from a tariff-based subsidy, inthe form of an increasing block tariff, to a uniform price—on householdelectricity consumption and payment behavior.
Magnitude of the Tariff Increase How much of an increase did the shift to a single tariff represent? In1998, before tariff restructuring, the government reported the effectiveaverage household tariff of dram 19.2 per KWh. This calculation wasbased on aggregate utility data, dividing total bills by total consumptionfor all households in 1998. Based on this average, the hike in the tariffto dram 25 per KWh represented an increase of 30 percent.5 But a moreaccurate measure of the effective average price facing individual house-holds under the old tariff structure could be calculated only by usingindividual household consumption and billing records. Taking the aver-age of the effective price facing each individual household during 1998using available monthly electrical utility billing records for the survey
Raising Prices in Armenia—What Happens to the Poor? 53
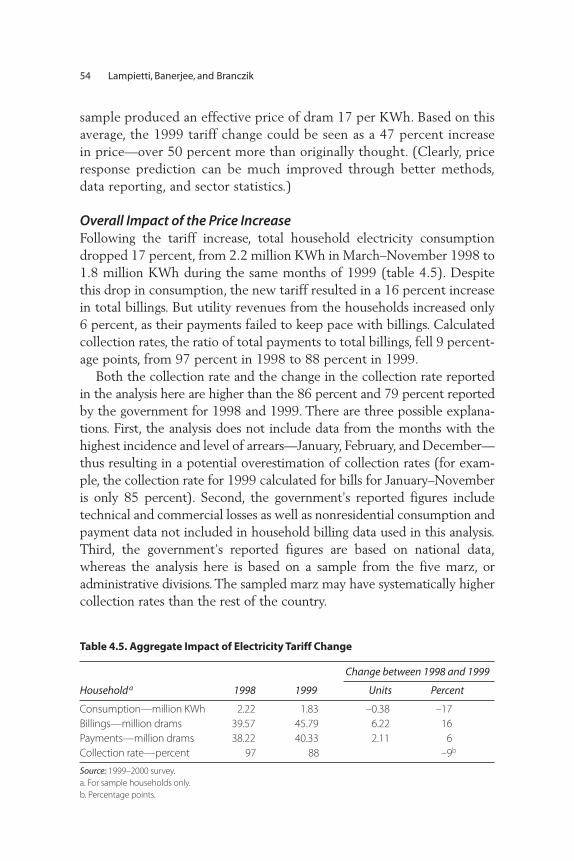
sample produced an effective price of dram 17 per KWh. Based on thisaverage, the 1999 tariff change could be seen as a 47 percent increasein price—over 50 percent more than originally thought. (Clearly, priceresponse prediction can be much improved through better methods,data reporting, and sector statistics.)
Overall Impact of the Price IncreaseFollowing the tariff increase, total household electricity consumptiondropped 17 percent, from 2.2 million KWh in March–November 1998 to1.8 million KWh during the same months of 1999 (table 4.5). Despitethis drop in consumption, the new tariff resulted in a 16 percent increasein total billings. But utility revenues from the households increased only6 percent, as their payments failed to keep pace with billings. Calculatedcollection rates, the ratio of total payments to total billings, fell 9 percent-age points, from 97 percent in 1998 to 88 percent in 1999.
Both the collection rate and the change in the collection rate reportedin the analysis here are higher than the 86 percent and 79 percent reportedby the government for 1998 and 1999. There are three possible explana-tions. First, the analysis does not include data from the months with thehighest incidence and level of arrears—January, February, and December—thus resulting in a potential overestimation of collection rates (for exam-ple, the collection rate for 1999 calculated for bills for January–Novemberis only 85 percent). Second, the government’s reported figures includetechnical and commercial losses as well as nonresidential consumption andpayment data not included in household billing data used in this analysis.Third, the government’s reported figures are based on national data,whereas the analysis here is based on a sample from the five marz, oradministrative divisions. The sampled marz may have systematically highercollection rates than the rest of the country.
54 Lampietti, Banerjee, and Branczik
Table 4.5. Aggregate Impact of Electricity Tariff Change
Change between 1998 and 1999
Household a 1998 1999 Units Percent
Consumption—million KWh 2.22 1.83 –0.38 –17
Billings—million drams 39.57 45.79 6.22 16
Payments—million drams 38.22 40.33 2.11 6
Collection rate—percent 97 88 –9b
Source: 1999–2000 survey.
a. For sample households only.
b. Percentage points.

Effects on the Poor and Nonpoor Average household consumption by the nonpoor fell by 16 percent—from 178 KWh per month during March–November 1998 to 141 KWhper month during these months in 1999.6 Poor households respondedmore strongly to the price change, lowering their consumption by anaverage of 20 percent from 152 KWh per month in 1998 to 121 KWhper month in 1999, enough for a refrigerator and a few lightbulbs. Thissuggests that consumption was more elastic among the poor, until theminimum basic consumption level was reached. Consumption declinedsignificantly more among rural households (26 percent) than urban (13percent), probably because rural households had greater access tosubstitutes.
Effect on Bill Amounts and Payments For nonpoor households, although average consumption fell 16 percent,average monthly bills under the new tariff increased 17 percent—fromdram 3,010 in 1998 to dram 3,520 in 1999. But these householdsincreased their average monthly payments to the utility by only 7.5percent—from dram 2,970 to dram 3,190.
Despite a 20 percent reduction in average consumption by the poor,their average bills increased by 13 percent—from dram 2,680 in 1998 todram 3,020 in 1999. Average payments by the poor remained about thesame at approximately dram 2,450 a month. The observation that aver-age expenditures by poor households were more or less constant beforeand after the price change suggests that the poor could not or would notspend more than they currently do on electricity.
The gap between billings and payment—the arrears—increased sig-nificantly for both the poor and the nonpoor between 1998 and 1999.From March to November, total arrears increased fourfold—fromdram 1.4 million in 1998 to dram 5.5 million in 1999 (figure 4.2). In1998, the nonpoor accounted for less than a quarter of arrears eventhough they constituted two-thirds of the sample population. In1999, arrears of the nonpoor grew dramatically, accounting for morethan half of the total. Two factors contributed to this increase. First,the number of households not paying their bill in full each monthincreased; in 1998, on average, fewer than a quarter of the householdsdid not clear their bills in a particular month. In 1999, this figure wentup to more than one-third of the households. Second, the averagemonthly size of the unpaid balance per household increased by13 percent.
Raising Prices in Armenia—What Happens to the Poor? 55

Arrears Levels for the Poor and NonpoorThe percentage of households carrying arrears increased more among thepoor than the nonpoor.7 Among the nonpoor, the percentage of house-holds carrying arrears increased from 22 percent to 37 percent, while thatof poor households increased from 27 percent to 46 percent, 15 and 19percentage points respectively.The increase in the size of arrears was larg-er among the poor than among the nonpoor, 15 and 10 percent respec-tively. That arrears were larger and increased more for the poor suggeststhat affordability, not free-riding, was the problem.
Monthly billing and payment trends in 1998 and 1999 suggest thathouseholds had the most difficulty paying bills in the winter when con-sumption was higher (figure 4.3). In 1998, before the tariff change,households paid off their winter arrears from May until August. In 1999,however, households were unable to pay off their winter arrears—they
56 Lampietti, Banerjee, and Branczik
0
1
2
3
4
5
6
Mar.–Nov. 1998 Mar.–Nov. 1999
mill
ion
dra
ms
nonpoor poor
Figure 4.2. Arrears Increased for the Poor and Nonpoor
Source: 1999–2000 survey.
–200,000
200,000
600,000
1,000,000
Apr. May June July Aug. Sep. Oct. Nov. Dec.
(dra
ms)
arre
ars
1998
1999
Figure 4.3. Arrears to the Utility Went Up
Source: 1999–2000 survey.

tended to accrue additional arrears during the summer months, accumu-lating significant debt to the utility over the year.
How Effective Was the Cash Transfer?
The Armenian government took two actions to minimize the impact onthe poor of the 1999 tariff increase. First, a newly designed family benefit,targeted at the 28 percent of households living below the poverty line, wasintroduced in 1999 as part of the government’s reshaping of the familybenefits system and to help alleviate the impact of the tariff increase.Second, an additional 9 percent of households not eligible for the familybenefit, but expected to have difficulty paying their electricity bills,received a smaller sum, dram 1,450 per month, to assist with electricitypayments.
The study data confirm that about 28 percent of households receivedthe family benefit, with the mean monthly amount received at drams9,480 per household, or dram 2,500 per capita.Those data also show thatabout 8 percent of households received a special cash benefit or otherelectricity privilege of some kind in 1999.8 Almost all of these latterhouseholds reported receiving dram 1,400 or 1,450 per month, thoughthey only received it an average of six times during the year, making an aver-age of dram 9,470 per household per year. This is less than the targeteddram 17,400 a year with 12 months of payments, but still represents a sig-nificant cash transfer—almost five months of the average 1999 electricitybill for these households.
Targeting Effectiveness of the Cash TransfersThe study team did not have access to information on the formula usedto determine which households were targeted to receive the cash trans-fers, so it was not possible to determine the success of targeting andwhether the family benefit was indeed going to the poorest households.9
But it was possible to examine whether poor households and householdsregularly consuming in the lower blocks of the 1998 tariff structurereported receiving the transfer. Poor households were more than twice aslikely to receive the cash transfer as nonpoor households, and householdsregularly consuming electricity in the first two blocks of the 1998 tariffwere significantly more likely to receive the cash transfers. But only 55percent of the poor received the cash transfer, meaning that 45 percentof poor households were faced with a 47 percent increase in their elec-tricity tariffs and no mitigating cash transfers.
Raising Prices in Armenia—What Happens to the Poor? 57

Effectiveness of Transfers in Softening the Impact The cash transfers did help soften the impact for those receiving them.Households receiving the cash transfer cut their consumption after theprice increase by about 20 percent—similar to poor households overall.And their average bills rose by 15 percent, again similar to poor house-holds overall. But unlike the other poor households—whose average pay-ments were unchanged between 1998 and 1999, and which thereforeaccumulated even more arrears—households receiving cash transfersincreased average monthly payments to the utility by 4 percent. It is dif-ficult to determine whether the cash transfers offset the adverse impactof the tariff increase. However, it may well have prevented an evengreater drop in consumption and an increase in arrears among the recip-ients. It is also possible that these cash transfers may work even better iftargeted households receive them every month.
Conclusion
In creating a picture of the household response to Armenia’s 1999 elec-tricity tariff change, this study reveals that restructuring the tariff to a lesssocially regressive single rate had a disproportionately negative impact onthe poor. The burden of energy expenditures, the bulk of them for elec-tricity, was large for most households and particularly for the poor.Relative to the nonpoor, the poor cut consumption more, the percentageof poor households with arrears was higher, and the average size of theirarrears increased more. The tariff increase was 50 percent greater thanoriginally conceived when the increase and mitigating transfers were for-mulated, so the impact was underestimated—spotlighting the need forcareful calculation and accurate price response prediction in forecastingand mitigating the impact of reform.
Though the poor were meant to be compensated with cash transfers,both the targeting and the timeliness of the transfers needed to beimproved. Opponents of the increasing block tariff were correct in argu-ing that it benefited 100 percent of consumers when only 33 percentwere classified as poor. But with the new tariff structure, only 55 percentof the poor actually received the social benefit transfer, leaving almosthalf of them uncompensated for the 47 percent tariff increase. With lim-ited access to low-cost substitutes, a further increase in tariffs and collec-tion rates would lead to the greatest hardship for the urban poor, whospend 16 percent of monthly cash expenditures on electricity and havethe least access to wood.
58 Lampietti, Banerjee, and Branczik

As electricity consumption dropped, reported consumption of naturalgas and wood during the period increased. Use of wood is associated withsuch environmental problems as deforestation and indoor air pollution.These serious concerns indicate that governments must be prepared withpolicies to identify economically efficient and sustainable actions to meetbasic heating needs as tariffs are increased and develop a long-termnational heating strategy.
Although the tariff increase was aimed at creating a more sustainablesector, the utility revenue increase of about 6 percent from sampled house-holds was less than expected, thanks to falling consumption and a simul-taneous increase in arrears. This suggests that the benefits of the reformprogram did not materialize as quickly or easily as intended, and that tar-iff increases must be accompanied by moves to encourage greater payment.That the fall in collections coincided with political turbulence in 1999 pointsto the importance of consistent government support and political stability insuccessful reform, issues that come up in other case studies.
This study provides valuable insights on the impact of reform in theshort term; since it was conducted, reform has had more time to takehold. Armenia has continued to reform and reorganize the electricity sec-tor, transforming it from imminent collapse in the mid 1990s to one ofthe region’s success stories. The government made abortive attempts tosell the loss-making distribution network to foreign strategic investorsbefore selling a controlling stake in 2002 to Midland Resources Holding,which managed to significantly improve collection rates. By 2004, collec-tions had reached almost 100 percent.10 Since 2002, Armenia has had anational heating strategy. Use of gas for heating has increased, while useof wood has declined. The economy has continued to grow and povertyhas declined significantly since 1999. Meanwhile the social protectionsystem has become better targeted since 1999, and efforts to improve itfurther continue.11
This study does much to illustrate that understanding the impact of tar-iff changes on the poor has been imperfect at best. It provides empiricalevidence to substantiate concerns about the speed of reform, suggestingthat though reform was indisputably necessary, a fuller understanding ofits effects could inform a more effective mitigating strategy. The studylooks only at the short-term effects on the poor, raising the obvious ques-tion of how the story changes when the effects of reform are studied overa longer period. It also raises other questions that could not be answeredwith the data available. How can cost recovery be improved while main-taining a balance with social protection? If affordability is an issue, as it
Raising Prices in Armenia—What Happens to the Poor? 59

appeared to be in Armenia, how can tariffs be increased at the same timeas collections? And what difference, if any, does it make if a private oper-ator, more explicitly motivated to improve revenues, enters earlier in the-process? To address these questions, the discussion turns to Georgia.
Notes
This chapter is based on Lampietti, Kolb, Gulyani, and Avenesyan 2001.
1. Conditional on positive consumption of a given type of energy. Wood con-sumption is substantially lower than reported in the qualitative portion of thesurvey, where households said they consumed 20–30 cubic meters a year.
2. This result must be treated with caution because the mean is influenced by anumber of high consumption and low expenditure values.
3. Kaiser (1999). Kaiser also reports that in 1997, an average of 9–10 percentof household income was spent on electricity during the winter and summerin Armenia. This is broadly consistent with data for Armenia from 1996,which suggest that the cost of electricity exceeded 10 percent of an urbanhousehold’s expenditures for the average very poor family and less than3 percent for a nonpoor family (World Bank 1996a). The poverty lines areset differently and expenditures are measured differently, so they are notdirectly comparable.
4. In 85 percent of households, meters are read once a month and, in the remain-ing 15 percent, an average of twice a month. The poor are much more likelyto have their meter read twice a month (22 percent) than the nonpoor(12 percent).
5. Performing this calculation with the utility billing record produces the samefigure of dram 19.2 per KWh.According to the World Bank’s Project AppraisalDocument for the Electricity Transmission and Distribution Project in Supportof the First Phase of the Power Sector Restructuring and DevelopmentProgram (February 8, 1999), the increase was from an average household tar-iff of dram 19.8 per KWh (p. 16).
6. The drop in consumption does not appear to be caused by climatic variationsbecause temperatures during the major heating months in the period of analy-sis were actually lower in 1999 than in 1998.
7. A household is considered in arrears if the difference between the paymentand the bill is greater than 5 percent of the bill.
8. Five percent of households said they received the special cash benefit while 3percent said they received a reduction in their bill or a voucher (usually for600 KWh) to help defray their electrical bill. Only 10 percent of householdsreceiving the special cash benefit, 9 of the 2,010 sampled, claimed to bereceiving both the family benefit and the special cash benefit.
60 Lampietti, Banerjee, and Branczik

9. An important future step will be to analyze this information and compare itwith this report’s findings.
10. World Bank (2004e). In 2005, Midland Resources Holding sold the distribu-tion company to RAO UES for a sizable profit.
11. World Bank Poverty Reduction Support Credit for Armenia, October 21,2004.
Raising Prices in Armenia—What Happens to the Poor? 61


The severity of Georgia’s electricity crisis in the late 1990s—wheneven households in the capital were receiving fewer than six hours ofelectricity a day, and collections were almost nonexistent—created animpetus for relatively rapid reform and privatization. In 1998, in thefirst privatization of its kind in the former Soviet Union, an Americandistribution company purchased Telasi, the Tbilisi power distributioncompany. From the outset, its main challenge was to increase revenueto cost-recovery levels. Over the next five years, battling low collec-tions, high theft levels, and diminishing political will to back reform,this task proved almost impossible. Amid mounting concerns that lowcollections were threatening the future of reform in Georgia and put-ting other strategic investors off investing in the region’s energy sector,this study set out to identify the factors that were driving householdelectricity consumption and payment behavior. It was hoped that thisanalysis would highlight effective strategies to increase collection ratesand improve cost recovery, while maintaining a balance with the socialand environmental effects of reform.
C H A P T E R 5
Nonpayment and
Power—Georgia
63

Deep Declines—Then High Expectations
Beset with civil war and the loss of central transfers, Georgia’s economicdecline following independence was among the deepest in the formerSoviet Union, with gross domestic product (GDP) falling by 70 percentfrom 1990 to 1994. With the end of civil war in 1994, the governmentstarted a program of economic reform, and in the late 1990s the econo-my stabilized. But recovery was slow to translate into better living stan-dards for Georgia’s 5.4 million people, and poverty remains widespread.1
In common with citizens in other energy-poor republics in the region,Georgians faced higher costs and deteriorating service for householdutilities, particularly energy. Georgia’s dependency on energy importsand high international prices for fuel were exacerbated by supply andgeneration disruptions from political turmoil. Utilities accumulated largepayment arrears, and energy supplies contracted dramatically. By 1997,electricity supply was 40 percent of peak levels and strictly rationed, anddistrict heating was no longer in service. Georgia was experiencing anenergy crisis.
Starting in 1996, with the support of the World Bank and otherdonors, the government of Georgia undertook a seemingly model pro-gram of utility sector reform (figure 5.1).2 Sakenergo, the vertically inte-grated electricity enterprise, was split into several generation enterprisesand separate transmission and dispatch companies. Distribution wasdivided into regional companies.3 And Telasi, the electricity distributioncompany serving Tbilisi, was sold to the American power generation anddistribution company, AES Corporation.4
64 Lampietti, Banerjee, and Branczik
0
0.04
0.08
0.12
0.16
1997 1998 1999 2000 2001 2002
GEL
per
KW
h
Regulatoryagency
established
Telasi privatized
Sakenergo unbundled
Georgian WholesaleElectricity Market
(GWEM) established
Georgian UnitedDistribution Company
(UDC) established
Electricity tariff
Figure 5.1. Milestones of Power Sector Reform in Georgia
Source: Georgia National Energy Regulatory Commission (Annual Reports) and personal interviews.
Nonpayment and Power—Georgia 65
Reform, particularly the high-profile entrance of an American company,brought high expectations for improving the situation. When AES tookover Telasi in December 1998, only about 15–30 percent of the sector’sgeneration capacity was operational. Households were receiving only fourto six hours a day of electricity in Tbilisi, and three to four hours a dayelsewhere.5 Investment in maintenance and repair of electricity infra-structure was impeded by a lack of capital, as a combination of subsidizedtariffs, nonpayment of bills, and thefts of electricity contributed to lowcost recovery. To turn this situation around and increase collections, AESTelasi adopted a strategy of investing significant resources in remeteringhouseholds in Tbilisi and cutting off dangerous illegal connections. As anincentive for payment, it promised 24-hour supply to households whopaid their electricity bills.
But falling incomes and a prevailing practice of nonpayment—withhigh theft levels, routine sabotage or destruction of meters, and protestsagainst increasing collections—proved to be major obstacles to improvingcost recovery. On top of this, corrupt and inefficient elements within thesupply system were undermining incentives to pay by diverting electrici-ty to some nonpaying public sector customers while depriving AES Telasiof sufficient power for its paying customers, particularly during periods ofhigh demand in winter.6
In 2002, when this study was commissioned, reform had stalled.Dissatisfaction with higher tariffs and greater enforcement was expressedthrough resentment at the presence of a western player in the electricitysector. In response to sustained operating losses, AES repeatedly threat-ened to withdraw from Georgia. Donors, losing confidence in the sustain-ability of the reform program and the probability of further reform, wereassessing options for moving forward. Regional geopolitics, and theprospect of expanding Russian control over energy markets in the formerSoviet Union, meant that the prospect of AES being replaced by aRussian operator was not viewed with total equanimity by western donorgovernments. And the experience of AES seemed to be part of a worry-ing trend across the region, as private interest in utility investments ebbedwith changes in the world economy and a bursting of the privatizationbubble. The Armenia study prompted hopes that analyzing what had andhad not worked—and taking a closer look at the dynamics of utilityreform—might help resolve some of the obstacles and mark out anapproach for moving forward. This analysis would be important forsustaining reform in Tbilisi and for the future of reform in other parts ofGeorgia still facing severe shortages in energy supply.

This study was conducted six years after reform began, so it could use aricher data set than the Armenia study and analyze trends over a longerperiod. This provides a more nuanced and comprehensive picture ofeffects, such as changes in consumption, coping mechanisms, fuel substitu-tion, access to alternative fuels, and factors determining household welfare.The study looks at a wider range of indicators and effects, including theimpact of social transfers on the government budget. It also looks at somekey questions on reform design in countries with low collections, analyz-ing what contributed to increased collection rates and suggesting how util-ities can increase payments. And it assesses the targeting success of thedirect transfers to mitigate the impact of reform and shows how the house-hold and utility data can be used to improve targeting of the transfer.
66 Lampietti, Banerjee, and Branczik
Box 5.1
Data for the Analysis—Georgia
Since the quantitative data already existed, they were analyzed first, followed by
qualitative analysis to better understand the findings. The data came from three
sources: the household budget survey (HBS), conducted quarterly since 1996 by
the Georgia State Department of Statistics;a the Multi-Sector National Survey of
Households in Georgia 2002,b carried out by Save the Children (STC) in February
2002; and the electricity consumption, billing, and payment data from AES Telasi
for those households in Tbilisi that were included in the HBS from 2000 to 2002.
Since the data concentrated on Tbilisi, and because the situation in rural areas is
rather different from that in the capital, the focus of the study is, for the most part,
limited to Tbilisi.
Merging the HBS data (based on households’ self-reported electricity pay-
ments) and AES Telasi data sets (based on household payments recorded in the
customer’s billing and payment records) revealed important discrepancies in re-
ported electricity payments. A comparison of the corresponding data (for the
same household in the same month) revealed that payments reported in the HBS
were consistently higher than those recorded by Telasi in 2000 and 2001 (box
figure B5.1). This difference could have been caused by corruption—for example,
households paying more to the meter readers than is transferred to the utility—
or recall error.c Despite these differences, the data sets provide a sound basis for
the analysis because both follow the same increasing trend in payments and
the difference between the two narrows over time.
(Continued)

Nonpayment and Power—Georgia 67
Residential Energy Consumption in Georgia
Availability of EnergyWhile 98 percent of households remained connected to the electricitynetwork, supply was still failing to meet demand even after almost adecade of reforms in 2003.7 In February and March 2001, less than halfof total demand in Tbilisi was supplied, though service in Tbilisi has gen-erally improved over the past few years. Outside Tbilisi, supply con-straints are severe and persistent, with households in 2002 receiving 4.5to 17 hours of electricity a day, depending on location.8
For natural gas, the number of connections increased in Tbilisi, partic-ularly in 2001 and 2002.9 Outside the capital, however, the number ofconnected households fell, possibly because of limited or nonexistentservice and an extremely dilapidated gas infrastructure.10 District heatingdisappeared in the late 1990s.
Changes in Relative Energy Prices Electricity tariffs have more than doubled since 1997 in nominal terms.11
This has a dramatic effect on the relative prices of other fuels, affectinghousehold energy consumption choices.12
Figure B5.1. Discrepancies between Stated and Actual Household
Electricity Payments in Tbilisi
Source: Georgia Household Budget Survey; AES Telasi.
a. State Department for Statistics of Georgia (2001).
b. This survey was funded by USAID, the authors are Larry Dershem and Irakli Sakandelidze.
c. Focus group sessions suggested that households paying more to meter readers than the meter readers
transfer to the utility had been a serious problem in the past, though the incidence decreased with the
installation of new meters and with better control by Telasi.
0
4
8
12
16
20
Jan. 00 May 00 Sept. 00 Jan. 01 May 01 Sept. 01 Jan. 02 May 02 Sept. 02
GEL
per
mo
nth
stated payment(HBS)
actual payment(AES Telasi)

Until recently, residential natural gas tariffs remained fairly constant atGEL 0.27 per cubic meter in Tbilisi and GEL 0.30 per cubic meter inother cities, and even at full import prices gas was much less expensivethan all other fuels. This, and the convenience of using it, suggests that itwas the household fuel of choice for those with access. But householdswishing to connect (or reconnect) to the gas network in Tbilisi had to payGEL 215 ($100 in 2002), either up front or over time to cover the costof a meter, or be billed GEL 6.50 per person a month.13 Some partici-pants in focus group sessions said that this high up-front connection cost,along with the need to invest in new gas-fired appliances, was a barrier toinstalling gas in their homes.
Clean network fuels—electricity and gas—had lower prices than non-network fuels, liquefied petroleum gas (LPG) and kerosene (figure 5.2).The latter actually became much more expensive over the period fromJanuary 1997 to January 2002.14 Kerosene, an inferior fuel, is by far themost expensive fuel and therefore the least likely choice.
An important omission in this comparison of energy prices is fuelwood. It is commonly used, but there are no reliable data on pricechanges over time. Estimating wood prices is complicated by regional dif-ferences in availability, and thus price, and by the fact that households caneither collect wood or buy it whole or split. The HBS collects informa-tion only from households that have purchased wood. This results inunderestimation of consumption, since the Save the Children surveyfound that, depending on the region, anywhere between 5 percent and75 percent of households cut their own wood. And there are important
68 Lampietti, Banerjee, and Branczik
0
10
20
30
40
50
60
70
80
Jan. 97 Jan. 98 Jan. 99 Jan. 00 Jan. 01 Jan. 02
Kerosene
Natural gas
Electricity(Tbilisi)
LPG
Electricity(Regions)
GEL
(19
97
)
Figure 5.2. Clean Network Fuels Cheaper Than Non-network Fuels
(effective energy prices, GEL per million Btu [British thermal unit])
Source: Georgia State Department for Statistics.

Nonpayment and Power—Georgia 69
differences in access for households that cut wood themselves—and thusin the time-related opportunity costs of collection.
The data give some idea of the relative price of wood. Survey researchindicates that in the winter of 2002, wood prices were on the order ofGEL 22 per cubic meter. Assuming a typical conversion efficiency of 20percent, the cost of wood energy would be GEL 15 per million Btu—lessthan for all other fuels except natural gas. For poor households not on thegas network, that makes wood the fuel of choice for cooking and heating.
Effect of Reform on Energy ConsumptionIn Tbilisi, the highest 20 percent of households’ energy consumption ini-tially dropped, but eventually recovered to prereform levels, at about 200million Btu per quarter. The lowest 20 percent of households maintainedthe same consumption, at about 55 million Btu per quarter (figure 5.3).Fairly stable energy expenditure shares and consumption levels suggestedthat households in Tbilisi, in response to tariff increases, appeared to bereplacing electricity with less expensive fuels.
Breaking down total expenditures into its parts reveals just thispattern. In Tbilisi, households increased the share of electricity in totalenergy from 45 percent to 51 percent from 1996 to 2002, and from 3percent to 7 percent of total expenditure. The share of kerosene dropped,and those of LPG and purchased fuel wood stayed constant. The share ofgas increased from 2 percent to 20 percent of energy expenditure, withthe greatest increases at the end of 1999.
0
50
100
150
200
250
300
350
1996
-III IV
1997
-I II III IV
1998
-I II III IV
1999
-I II III IV
2000
-I II III IV
2001
-I II III IV
2002
-I II
mill
ion
Btu
highest 20 percent
lowest 20 percent
Figure 5.3. Energy Consumption Remained Low for the Lowest 20 Percent in Tbilisi
Source: Georgia Household Budget Survey. (See box 5.1).

70 Lampietti, Banerjee, and Branczik
Outside Tbilisi, energy consumption fell significantly after 1997. Therewas some stabilization in mid-1999, but the highest 20 percent of house-holds now consume one-third as much energy (in effective Btus) as they didin 1997, and the lowest 20 percent of households about half as much. Unlikein Tbilisi, substitutes are not widely available. Fuel wood and kerosene remainsignificant in energy expenditures—and since kerosene is expensive, its usemay be a response to inadequate electricity supply. Similarly, the reductionin overall consumption can be attributed to budget constraints and the lackof opportunity to substitute lower cost fuels, such as electricity and naturalgas, for kerosene and LPG. This pattern of consumption implies that animprovement in electricity and gas supplies at their current prices is likely toresult in welfare gains for households outside Tbilisi.
Changing Household Energy ExpendituresAlthough energy prices increased, the average household share of expen-diture spent on energy remained constant at 8 percent. But it increasedmost in cities: in Tbilisi from 6.4 percent to 8.4 percent, and in other citiesfrom 6.9 percent to 8.7 percent. This finding makes sense given theprivatization of Telasi, the increase in tariffs, and a shift to more expensiveLPG in other major cities.
Expenditures on electricity were significantly higher in Tbilisi than inrural areas, consistent with Tbilisi’s higher tariffs and far more reliableservice quality. By the fourth quarter of 2001, 94 percent of householdsin Tbilisi received 24 hours of uninterrupted electricity, compared with25 percent of households in other cities and only 7 percent in ruralareas.15
Despite rising electricity prices, the absolute value of expenditures onenergy fell slightly in real terms over the period.16 One explanation is areduction in the amount of energy used by households; another is substi-tution for less expensive fuels.
Changes in Service QualityImprovements in service quality are the most direct positive effect ofreform for residential consumers and the only substantial compensationfor increasing tariffs. As with Armenia, the question of whether servicequality has improved is therefore important, since it is an indicator of bet-ter welfare and a measure of whether reform has been successful. A rea-sonable proxy for service quality is the hours of service that consumersreceive. In fact, most focus group participants noted that service qualityhad improved significantly since Telasi’s privatization.

Nonpayment and Power—Georgia 71
Welfare Implications of Changes in Electricity ConsumptionAlthough prices increased and customers paid a larger share of their elec-tricity bills, mean household consumption remained constant at about125 KWh per month, and median consumption at about 113 KWh.17
This reinforces the comments of focus group participants: gas use rose notbecause it was a substitute for electricity, but because it was a substitutefor wood. Households limit their use of electricity due to cost, the obli-gation to pay, and to periodic supply limitations.
The findings about mean consumption have two important policyimplications: first, current consumption levels were low relative to whatmight be expected in urban areas in a country at Georgia’s level of devel-opment. Average consumption of 125 KWh per month representsextremely limited use of electricity, possibly lighting and a modest num-ber of appliances. Electricity is certainly not used extensively for heatingor air conditioning.18 Second, in Tbilisi, where service was quite reliable,demand remained at about the same level despite price increases. Thissuggests inelastic demand; though prices rose, it was extremely difficultfor people to respond by lowering consumption any further. This suggestslarge welfare losses from future electricity price increases.
An electricity demand function is typically kinked. The curve slopessteeply around the minimum required for basic needs, since few house-holds consume less than this threshold amount. Demand in this part ofthe curve is inelastic. The curve then rapidly levels off as the quantity ofelectricity consumed moves from necessity to luxury, at which pointdemand is very elastic. Identifying the location of the kink is important.If prices rise above this point, consumption is pushed into the inelasticpart of the demand function, where consumption is already very low andwelfare losses associated with rising prices are large. At prices below thispoint, demand is more elastic and welfare losses are smaller. The distribu-tion of annual household electricity consumption indicates that house-holds were most likely to consume between 875–1,750 KWh per year(figure 5.4). A separate estimate of the demand curve confirms thathouseholds in Tbilisi were consuming close to basic minimum needs, thatdemand was inelastic, and that any future price increases would result inlarge welfare losses.
More Use of Gas Most focus group participants expressed a desire to use gas, preferring itto other fuels for both cooking and heating, and to some extent for waterheating. They noted that gas was cheaper than electricity, and cleaner and

72 Lampietti, Banerjee, and Branczik
more comfortable than kerosene and wood. Almost all participants with-out a gas connection said that they used kerosene or wood for heating andcooking, but after getting access to gas they gave up these fuels. Many saidthat they disliked both kerosene and wood so much that they used themonly when no other option was available. Access to gas gave them a desir-able substitute.
Installing a gas connection did not affect the level of electricity con-sumption, either because households were already managing the use ofelectricity to reduce bills or because the areas where they live have elec-tricity supply restrictions. In some areas with old and nonworking meters,people were not paying for electricity they consumed, so they had noincentive to reduce consumption.19
Despite the obvious benefits of gas, there are barriers to obtaining it,mainly the costs of installation, the meter, and the equipment and tech-nical difficulties in some areas.
Impact of Increased Use of Traditional FuelsAmong the key anticipated impacts of reform was that higher prices forclean network energy would increase the use of traditional fuels (woodand kerosene) by the poor.The correlation between illness and householduse of traditional fuels in poorly ventilated homes is well established. Thestudy found, as noted above, that households in Tbilisi have shifted toclean fuels, largely because of increased supply of clean and inexpensivenatural gas (figure 5.5).20 Statistical analysis of the relationship betweenhealth outcomes (such as the incidence of acute respiratory infections)
0
1
2
3
4
5
6
7
125 500 875 1,250 1,625 2,000 2,375 2,750 3,125 3,500 3,875
consumption per year (KWh)
per
cen
tag
e o
f ho
use
ho
lds
con
sum
ing
at
this
leve
l Figure 5.4. Most Households in Tbilisi Consumed 875–1,750 KWh a Year, 2002
(distribution of electricity consumption)
Source: AES Telasi.

Nonpayment and Power—Georgia 73
and fuel use did not reveal the same significant correlations picked up inlarger time series data sets, possibly because of the large number of con-founding factors associated with observed health outcomes.21
In rural areas, traditional fuel consumption potentially poses a publichealth risk.22 The Save the Children survey indicates that 80 percent ofrural energy consumption in the winter of 2001 was fuel wood. Manyother variables influence wood consumption, including forest cover,access to other fuels, proximity to forests, the availability of householdlabor to collect firewood, and temperature. There may be welfare gainsfrom increasing access to cleaner more efficient wood burning technolo-gy, which could reduce the cost per effective Btu, though it remains to bedetermined whether households would adopt these technologies.
How Was the Utility Able to Increase Revenues?
After major efforts to increase payment collections, AES Telasi dramati-cally improved its revenues, increasing receipts by 135 percent by 2002.23
While tariff increases accounted for some of the increase, better collec-tions from customers and increases in the volume of government transfersto consumers also played a role. AES Telasi was particularly successful inreducing household arrears, with collection rates rising from 44 percent in2000 to 86 percent in 2002.24 AES data suggest that metering and subsi-dies had a much larger impact on collection rates and revenues than servicequality and retail prices (table 5.1).25
0
10
20
30
40
50
60
70
80
90
100
1997
-I II III IV
1998
-I II III IV
1999
-I II III IV
2000
-I II III IV
2001
-I II III IV
2002
-I II III IV
clean fuels(electricity, gas, LPG)
dirty fuels(kerosene, wood)
per
cen
t
Figure 5.5. Tbilisi Households Shifted to Cleaner Fuels
(energy expenditure shares)
Source: Georgia Household Budget Survey.

74 Lampietti, Banerjee, and Branczik
To learn more about how Telasi raised collections from households, thestudy conducted a multivariate analysis to disaggregate some of theimportant factors driving payments. The analysis estimated receipts as afunction of service quality (ratio of requested and received energy), price,enforcement (percentage of households remetered), and subsidies. It alsocontrolled for monthly temperature and the temporary loss of thermalpower plants in the winter of 2001.26 It was complemented by focusgroup discussions that solicited the views of Telasi customers on a widerange of payment-related issues, including remetering, enforcement, andservice reliability. These tools can help answer whether improvements inservice quality make people more likely to pay their bills, how remeter-ing increases collections, and whether nonpayment is due to affordabilityor free-riding.
Table 5.1. Aggregate Impact of Reform on Collection Rates in Tbilisi
Change Change
2001 2002
over 2000 over 2001
2000 2001 2002 (percent) (percent)
Telasi received power 2,790 2,380 1,200 –15 –6
(million KWh)
Telasi requested power 3,230 2,760 1,290 –14 –20
(million KWh)
Ratio of received to 86 86 93 0 percentage 7 percentage
requested power (percent) points points
Average price (GEL/KWh) 0.093 0.100 0.124 8 24
Households remetered 38 69 76 32 percentage 7 percentage
(percent) points points
Consumption (million KWh) 2,350 2,310 2,490 –2 24
Billings (million GEL) 217 232 309 7 33
Total receipts (million GEL) 96 186 266 93 44
Subsidies (million GEL) 35 44 55 25 26
Winter Heat Assistance 29 37 47 28 27
Program (million GEL)
Government privileges 6 7 8 11 21
(million GEL)
Payments by customers 61 142 211 132 49
(million GEL)
Collection rate from 44 80 86 36 percentage 6 percentage
households (percent) points points
Source: AES Telasi.
Note: Table includes only Tbilisi households in the sample. Requested and received power in 2002 is only from
January to June.
Nonpayment and Power—Georgia 75
PricesIt is difficult to untangle prices from enforcement and service quality inimproving Telasi’s revenues. Higher prices would be expected to increaserevenues, but price increases could also reduce consumption and increasenonpayment.
The simple tabulations in table 5.1 indicate that consumption and col-lection rates increased as tariffs increased. Remember that consumptiondepends not only on price, but also on electricity supply (increasing dur-ing this period) and demand.
SubsidiesAES Telasi’s revenues from subsidies grew in absolute terms, largely dueto the increasing Winter Heat Assistance Program (WHAP) benefit, fund-ed and administered by the U.S. Agency for International Development(USAID).27 The program accounted for 29 percent of household receiptsin 2000, and about 18 percent in 2001 and 2002. In addition, governmentprivileges accounted for anywhere between 3 percent and 6 percent ofAES Telasi’s yearly receipts. Subsidies fell as a share of revenues becauseof the large increase in collections from households.
Service QualitySince AES emphasized service quality as the positive effect of reform forconsumers, it would be interesting to see whether improvements in serv-ice quality encouraged people to pay their electricity bills. It was not pos-sible to study in detail how changes in hours of service affectedindividual payment rates and arrears because the data needed to relateaggregate hours of supply within the AES Telasi service area to hours ofservice for individual customers were not available. But it was possibleto compare collection rates with the ratio of received to requested power.No substantial correlation was found, possibly because Tbilisi receivesclose to 24 hours of service a day.
Reliability of supply did not seem to be a major direct factor affectingthe electricity payments of focus group participants. But some noted thatthey were anxious to get new meters because “supply is better when youhave them.” Some participants also expressed dissatisfaction with Telasi’sfailure to adhere to its original promise that if customers paid their bills,they would have 24 hours of improved electricity service. This suggeststhat service quality may have affected the payments of some householdsand supports the argument that increased tariffs and collections need tobe explicitly linked to service quality and supply improvements.
76 Lampietti, Banerjee, and Branczik
Remetering and EnforcementTo improve payment enforcement, AES Telasi invested US$60 millioninstalling electricity meters in Tbilisi. In the statistical analysis, enforce-ment explains much of the improvement in collections. With remeteringa proxy for enforcement, collection rates are systematically higher forremetered households.28 There is no statistically significant difference inconsumption between remetered households and those having oldmeters, but remetered households pay a systematically higher percentageof their bill at all consumption levels—on average twice as much as thosenot yet remetered—and their arrears are significantly lower.
The multivariate analysis did not tell whether metering facilitatescutoffs for nonpayment (enforcement) or adds credibility to the invoice(a proxy for service quality). So the interaction between metering andpayments was a key issue addressed in the focus groups. The responsesof participants indicated that metering plays a complex role. Participantsfeared supply cutoffs, controlled consumption, and trusted that theamount of their bills was accurate (though some expressed doubts aboutthe accuracy of the new meters, which appeared to “go faster”). Somealso noted the advantage of reduced corruption due to the new meters,though others saw this as a disadvantage.
The fear of cutoff was particularly strong—even though Telasi said thatit probably cut off only 10 percent of nonpaying households in eachmonth. This suggests that the threat of disconnection (particularly if likelyat an inconvenient time) may be almost as effective as an actual cutoff inreducing nonpayment. The risk of disconnection was also cited as a factorin installing an illegal connection. Participants who paid their billsexpressed resentment that Telasi did not do a better job tracking downand removing illegal connections.
Nonpayment: Affordability or Free-Riding?Improving collections could have a disproportionate impact on low-income households. But changes in collection rates by income class indicatethat they increased uniformly across the lowest and highest 20 percent ofhouseholds, suggesting that free-riding rather than affordability wasbehind the arrears. If affordability were more important, collectionswould be lower for the lowest 20 percent.
After experimenting with alternative approaches to metering, AESand the management contractor for distribution outside Tbilisi con-cluded that communal metering—where a community bears collectiveresponsibility for paying the bill—can be more effective than individual

Nonpayment and Power—Georgia 77
household meters for increasing collections and keeping costs down. Inpart this was because the threat of cutting off a whole neighborhoodencouraged better self-policing within communities. With the cost ofmetering at around US$75 per meter installed, this was also a far morecost-effective means of improving collection rates.
How Effective Were the Mitigating Transfers?
Recognizing the need to mitigate the impact of rising prices on the poor,Georgia has a range of programs providing energy transfers to households.One provides all veterans and pensioners with a set allocation of electric-ity every month.29 Refugees and internally displaced persons also receivesubstantial quantities of free electricity, while other programs providecertain households with 850 cubic meters of natural gas per year.30 Inaddition to the government-funded transfers, the WHAP has been pro-viding families with US$12–$35 worth of electricity a month.
One of the most contentious debates among those working on powersector reform is tariff-based subsidies (such as lifeline tariffs) versus directincome transfers. One of the most useful characteristics of the AES utilitydata is that the bills identify whether the households received govern-ment transfers or the WHAP. Merging these data allows the identificationof energy consumption and payment patterns by welfare group and meas-ures the targeting effectiveness of the transfers.
The percentage of households receiving the government transfer—paid to veterans and pensioners, and not specifically poverty targeted—was evenly divided across all quintiles (table 5.2). The WHAP transfer,which is poverty targeted, accrued more to households in the lower quin-tiles, but a significant share of the WHAP went to households in the highexpenditure quintiles in 2000 and 2001.
Table 5.2. Electricity Subsidy Incidence by Quintile in Tbilisi
Percentage of households receiving government subsidy
Income quintile
Year Lowest Mid-Low Middle Mid-High Highest
2000 12 12 15 13 13
2001 10 16 18 11 10
Percentage of households receiving Winter Heat Assistance Program subsidy
2000 25 16 18 17 10
2001 27 23 21 19 14
Sources: Georgia Household Budget Survey and AES Telasi.

78 Lampietti, Banerjee, and Branczik
How much consumption was covered by the transfers? Recipients ofthe government transfer received 27–32 percent of their annual electric-ity for free (table 5.3), and WHAP transfer recipients received 54–64percent of their electricity free. More detailed analysis suggests thatWHAP recipients did not necessarily use the free electricity for heat-ing—in many cases, they used the subsidy to smooth their consumptionthrough the entire year. This may explain in part how households main-tained (and sometimes even increased) electricity consumption despitesubstantial tariff increases.
A large share of government transfers for electricity are compensationfor electricity consumption beyond levels that might be considered“basic”—suggesting that the government, in many instances, financedconsumption in excess of what typical households would be willing toconsume if they were obliged to pay from their own household budgets.The welfare gains of providing large electricity transfers to households(amounts greater than 150 KWh a month) were probably small.
Transfers were also a major contributor to government expenditureson the electricity sector, which between 2001 and 2003 increased from43 million GEL to 98 million GEL—or 7.3 percent of total governmentexpenditures. Some of this increase was due to monetizing formerlyhidden subsidies and to higher government expenditure on electricityin the public sector, but the higher cost of electricity transfers also con-tributed (table 5.4). Meanwhile the cost of subsidies for gas supply,provided by both the state and municipal budgets, was also rising asadditional households eligible for subsidized gas connected to the gasnetwork.31
Because transfers are generally intended as a tool for alleviating povertyand increasing equity, the merits of the current system are ambiguous.While the welfare gain to households associated with the misdirection of transfers is small, the burden on government expenditures is large.
Table 5.3. Transfer Coverage in Tbilisi
USAID subsidy
Government subsidy (Winter Heat Assistance Program)
Percentage of Percentage of
Mean annual (KWh) KWh free Mean annual (KWh) KWh free
2000 1,851 28 1,440 54
2001 1,659 32 1,461 64
2002 1,948 27 1,691 56
Sources: Georgia Household Budget Survey and AES Telasi.
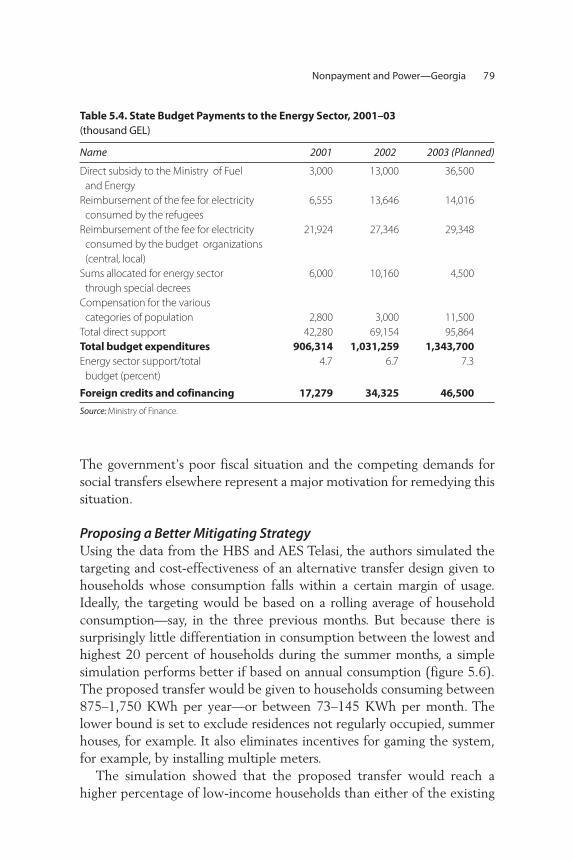
Nonpayment and Power—Georgia 79
The government’s poor fiscal situation and the competing demands forsocial transfers elsewhere represent a major motivation for remedying thissituation.
Proposing a Better Mitigating StrategyUsing the data from the HBS and AES Telasi, the authors simulated thetargeting and cost-effectiveness of an alternative transfer design given tohouseholds whose consumption falls within a certain margin of usage.Ideally, the targeting would be based on a rolling average of householdconsumption—say, in the three previous months. But because there issurprisingly little differentiation in consumption between the lowest andhighest 20 percent of households during the summer months, a simplesimulation performs better if based on annual consumption (figure 5.6).The proposed transfer would be given to households consuming between875–1,750 KWh per year—or between 73–145 KWh per month. Thelower bound is set to exclude residences not regularly occupied, summerhouses, for example. It also eliminates incentives for gaming the system,for example, by installing multiple meters.
The simulation showed that the proposed transfer would reach ahigher percentage of low-income households than either of the existing
Table 5.4. State Budget Payments to the Energy Sector, 2001–03
(thousand GEL)
Name 2001 2002 2003 (Planned)
Direct subsidy to the Ministry of Fuel 3,000 13,000 36,500
and Energy
Reimbursement of the fee for electricity 6,555 13,646 14,016
consumed by the refugees
Reimbursement of the fee for electricity 21,924 27,346 29,348
consumed by the budget organizations
(central, local)
Sums allocated for energy sector 6,000 10,160 4,500
through special decrees
Compensation for the various
categories of population 2,800 3,000 11,500
Total direct support 42,280 69,154 95,864
Total budget expenditures 906,314 1,031,259 1,343,700
Energy sector support/total 4.7 6.7 7.3
budget (percent)
Foreign credits and cofinancing 17,279 34,325 46,500
Source: Ministry of Finance.
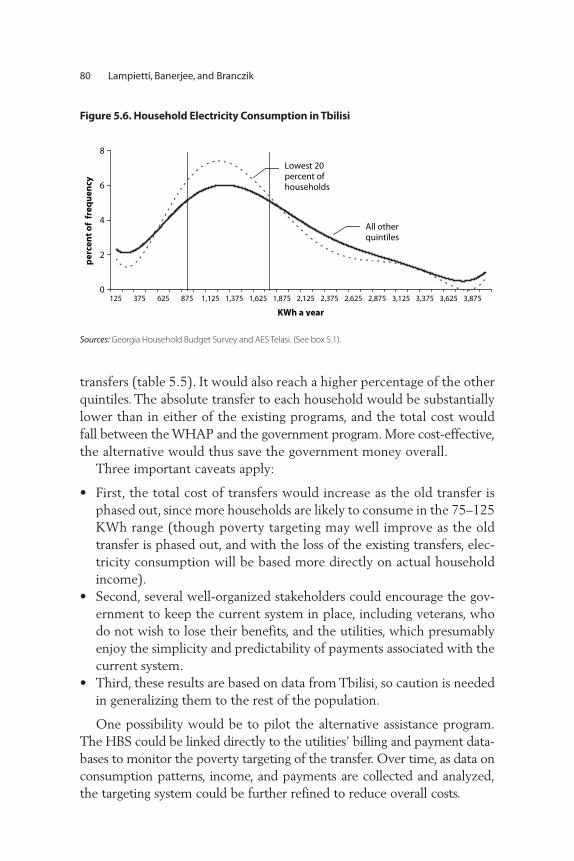
80 Lampietti, Banerjee, and Branczik
transfers (table 5.5). It would also reach a higher percentage of the otherquintiles. The absolute transfer to each household would be substantiallylower than in either of the existing programs, and the total cost wouldfall between the WHAP and the government program. More cost-effective,the alternative would thus save the government money overall.
Three important caveats apply:
• First, the total cost of transfers would increase as the old transfer isphased out, since more households are likely to consume in the 75–125KWh range (though poverty targeting may well improve as the oldtransfer is phased out, and with the loss of the existing transfers, elec-tricity consumption will be based more directly on actual householdincome).
• Second, several well-organized stakeholders could encourage the gov-ernment to keep the current system in place, including veterans, whodo not wish to lose their benefits, and the utilities, which presumablyenjoy the simplicity and predictability of payments associated with thecurrent system.
• Third, these results are based on data from Tbilisi, so caution is neededin generalizing them to the rest of the population.
One possibility would be to pilot the alternative assistance program.The HBS could be linked directly to the utilities’ billing and payment data-bases to monitor the poverty targeting of the transfer. Over time, as data onconsumption patterns, income, and payments are collected and analyzed,the targeting system could be further refined to reduce overall costs.
0
2
4
6
8
125 375 625 875 1,125 1,375 1,625 1,875 2,125 2,375 2,625 2,875 3,125 3,375 3,625 3,875
per
cen
t o
f fr
equ
ency
KWh a year
All otherquintiles
Lowest 20percent ofhouseholds
Figure 5.6. Household Electricity Consumption in Tbilisi
Sources: Georgia Household Budget Survey and AES Telasi. (See box 5.1).
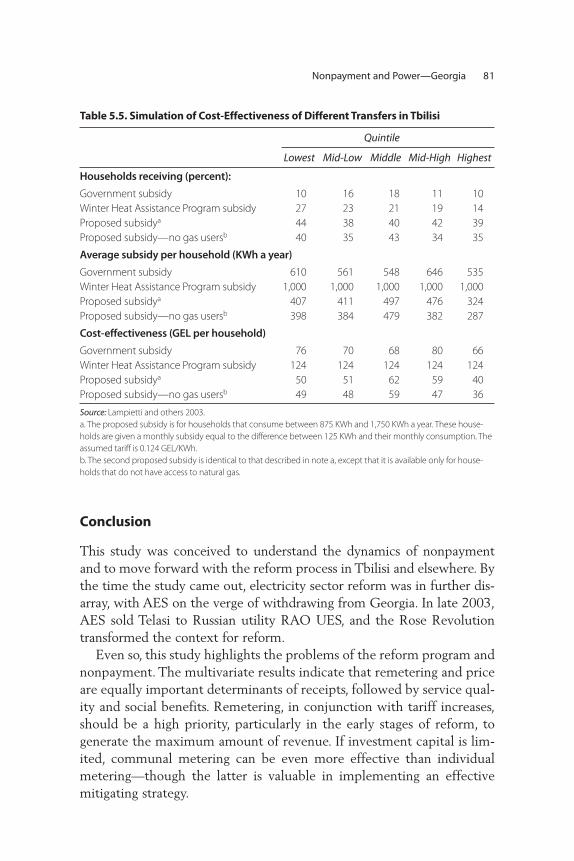
Nonpayment and Power—Georgia 81
Conclusion
This study was conceived to understand the dynamics of nonpaymentand to move forward with the reform process in Tbilisi and elsewhere. Bythe time the study came out, electricity sector reform was in further dis-array, with AES on the verge of withdrawing from Georgia. In late 2003,AES sold Telasi to Russian utility RAO UES, and the Rose Revolutiontransformed the context for reform.
Even so, this study highlights the problems of the reform program andnonpayment. The multivariate results indicate that remetering and priceare equally important determinants of receipts, followed by service qual-ity and social benefits. Remetering, in conjunction with tariff increases,should be a high priority, particularly in the early stages of reform, togenerate the maximum amount of revenue. If investment capital is lim-ited, communal metering can be even more effective than individualmetering—though the latter is valuable in implementing an effectivemitigating strategy.
Table 5.5. Simulation of Cost-Effectiveness of Different Transfers in Tbilisi
Quintile
Lowest Mid-Low Middle Mid-High Highest
Households receiving (percent):
Government subsidy 10 16 18 11 10
Winter Heat Assistance Program subsidy 27 23 21 19 14
Proposed subsidya 44 38 40 42 39
Proposed subsidy—no gas usersb 40 35 43 34 35
Average subsidy per household (KWh a year)
Government subsidy 610 561 548 646 535
Winter Heat Assistance Program subsidy 1,000 1,000 1,000 1,000 1,000
Proposed subsidya 407 411 497 476 324
Proposed subsidy—no gas usersb 398 384 479 382 287
Cost-effectiveness (GEL per household)
Government subsidy 76 70 68 80 66
Winter Heat Assistance Program subsidy 124 124 124 124 124
Proposed subsidya 50 51 62 59 40
Proposed subsidy—no gas usersb 49 48 59 47 36
Source: Lampietti and others 2003.
a. The proposed subsidy is for households that consume between 875 KWh and 1,750 KWh a year. These house-
holds are given a monthly subsidy equal to the difference between 125 KWh and their monthly consumption. The
assumed tariff is 0.124 GEL/KWh.
b. The second proposed subsidy is identical to that described in note a, except that it is available only for house-
holds that do not have access to natural gas.

82 Lampietti, Banerjee, and Branczik
The data also suggest, in Georgia at least, that an aggressive approachto reducing nonpayment did not necessarily have a disproportionateadverse impact on low-income households—particularly if suitable sub-sidy and transfer mechanisms could address cases of severe need. Thestudy simulated an alternative subsidy and provided empirical justifica-tion for adopting it.
This study also illustrates the importance of institutional and politicaleconomy factors in improving cost recovery. With an endemic propensityof electricity consumers to not pay, it was unrealistic to hope for a simul-taneous increase in collections and tariffs in Georgia. But the institution-al backdrop left AES at a fundamental disadvantage. Such an ambitiousreform agenda as Georgia’s cannot work without a strong regulator and awillingness within the sector to play by those rules—all shown to be lack-ing in Georgia.As a later report put it, “Factors that inhibited a better out-come include political pressure in the operation of energy companies toprovide electricity at any costs; strong vested interests to maintain the sta-tus quo; theft; corruption; political tolerance of nonpayment; lack ofincentives on the part of corporate management to resist political pres-sure and vested interests; and weak enforcement of laws and regula-tions.”31 Whereas a dramatic improvement in Armenia’s payment levelswas commonly ascribed to increased government commitment toimproving cost recovery, Georgia during the AES years showed how alack of high-level political commitment can hurt the reform process.
The government’s failure to back the rules of the game was exacerbatedby flaws in the design of privatization. Though paying customers werepromised full electricity supply,AES Telasi was dependent on an interme-diary, the Georgian Wholesale Electricity Market (GWEM), to ensurethose customers who paid were supplied. But with GWEM subject topolitical interference, this arrangement prevented AES Telasi from creat-ing an effective incentive regime for payment and undermined the impor-tant link between increased payments and service quality improvements.In addition, the government collected value-added tax (VAT) paymentsfrom AES based on the quantity of electricity distributed rather than thequantity actually paid for, meaning it had little financial incentive to backAES efforts at improving payments. If investors are to be found and main-tained in the future, not only must efforts be made to increase collectionsbefore privatization (as in Armenia), but privatization contracts mustensure that all players are united by the same incentives. The interests ofthe government and the utility clearly need to be aligned to back reformand share the risk of nonpayment.
Nonpayment and Power—Georgia 83
Unsurprisingly, AES’s experience in Georgia has become a celebratedcase study for energy sector privatization. The lessons, also examined inbusiness schools, informed the management contract experience of theUnited Energy Distribution Company (UEDC), the utility responsiblefor distribution outside Tbilisi. UEDC managers concluded that manage-ment and proper control are essential for the success of all other activi-ties. Under a management contract, the government is on the same sideof the table as the utility, government support becomes more reliable, andthe foundations can be laid for viable privatization.
Although the change in government renewed the commitment toimproving financial viability in the sector and improving supply, a 2005World Bank report cited continuing nonpayment, accumulated debts,theft, and possibly corruption as reasons why Georgia’s energy sectorremains financially bankrupt. The GWEM is now managed by a privateconsortium, and under a management contract UEDC has improved sup-ply and dramatically increased collections outside Tbilisi (without a pro-portionate increase in social transfers). But low collections still thwartmuch-needed investments, and the sector’s performance continues tohold back economic growth.
Georgia spotlights the difficulties encountered by utilities in pushingfor cost recovery in a hostile environment. The pace of reform was fairlyfast, and the government rapidly initiated all reform measures and overtlysupported AES Telasi. But then the government undermined the utility’sefforts at increasing revenues, and exploited resentment toward a foreignoperator to insulate itself from the political fallout of reform.
This study, by showing that nonpayment in Tbilisi was due to free-riding rather than affordability, suggests that despite the protests, collec-tions could be increased without necessarily hurting the poor. The nextcase study shows that the studies can go a step further, exploring thereality behind a fierce debate on reform and privatization and the poor—in Moldova.
Notes
This chapter is based on Lampietti, Gonzales, Hamilton,Wilson, and Vashakmadze2003.
1. World Bank (1999b, 2002e). The 2002 report concluded that since 1996,poverty had increased steadily, average consumption had fallen, inequalityhad risen, and living standards had declined. In real terms, average monthlyper capita expenditure fell 4 percent from late 1996 to late 2002. See WorldBank (2005a).
84 Lampietti, Banerjee, and Branczik
2. World Bank (1997a).
3. The same pattern occurred in the gas sector, though most gas was importedfrom Russia. Gas distribution companies in urban centers outside Tbilisi weresold to Sakgazia, a joint venture between local partners and the Russian gassupply company, Itera. Tbilgazi, the gas distribution company serving Tbilisi,was offered for privatization on a number of occasions, but the only crediblebidder was Itera. The government regards Itera’s ownership of Tbilgazi as anundesirable step toward the vertical reintegration of the gas supply sector, soTbilgazi remains a municipally owned utility.
4. Some of the smaller electricity distribution companies were sold to localinvestors. Eight small companies (less than 5 percent of the market in total)in the Kakheti region have been sold. Two hydroelectric plants (Khrami I andKhrami II) were also given to AES under a 25-year concession, and after pro-tracted negotiations the bulk of Georgia’s thermal generation capacity wassold to AES in April 2000.
5. World Bank (1999d).
6. This situation originated in the Georgian Wholesale Electricity Market(GWEM), established in 1999 to manage transfers between different electric-ity enterprises and transfer electricity payments from distribution companiesto generation companies. Rather than directly distributing the electricity thatit was generating, AES sold the electricity it generated to GWEM. AES Telasiwould then buy electricity for distribution from GWEM. The problemoccurred because GWEM would not make the electricity available to AESTelasi. In the end AES Telasi bypassed GWEM to ensure that it received theelectricity it was paying for.
7. External arrears reduced the ability to import electricity from such neighbor-ing countries as Armenia. Prolonged drought reduced the availability ofhydroelectricity, and an explosion at the Gardabani thermal plant reducedthermal generation by half for much of the winter of 2001.
8. Save The Children (2002).
9. Tbilgazi’s customer base increased from 39,000 households in June 2000 to164,000 households in January 2003. There are approximately 300,000households in Tbilisi. In the HBS, households were asked if they had a natu-ral gas connection. These data indicate that the number of connectionsdecreased nationwide from 1998 to 2000, with a small increase in Tbilisi from2000 to 2001.
10. Gas supply was intermittent, though it appeared to be stabilizing as externalarrears were paid off. Gas was purchased from the Russian company Itera byindustrial customers, from the Gardabani power plant, and from the local gasdistribution companies. In the past, Itera tied gas delivery to payments from

any and all of these large customers. So if one or more of them accumulatedsignificant arrears, gas supply to the country was curtailed until a satisfactorysettlement could be reached. The completion of the Baku-Tbilisi-Ceyhanpipeline was expected to further reduce supply constraints by providing analternative to Russian gas imports, though events of January 2006 suggest thatRussian control of gas supply remains a very sensitive issue (BBC NewsOnline, January 22, 2006).
11. Prices are in nominal terms to reflect tariff increases, including those imposedby the reform.
12. The prices are weighted national averages, which are based on data takenfrom the quarterly HBS. These prices are in cost per unit of effective energyoutput, rather than the prices that customers pay per unit of energy input.The adjustment was based on typical conversion efficiencies of the fuels andthe efficiency of different types of appliances. This implicitly assumes that allhouseholds have the same technology.
13. Gas tariffs at the end-user level cover the cost of importing the gas fromRussia (approximately US$60 per 1,000 cubic meters), transmission charges,and the costs of local distribution. The transmission and distribution marginshave been reviewed regularly by GNERC (Georgian National EnergyRegulatory Commission), and the companies are entitled to apply for a tariffincrease based on demonstrated costs of service supply.
14. This is not necessarily because of the reform program. For example, the largejump in the kerosene price in 1999 may be related to a rise in internationalcrude oil prices, which rose from US$10 a barrel to US$22 between Januaryand September.
15. Households in the HBS were asked to report the number of hours of electric-ity received during the week prior to the interview. Households were askedthis question only during the first of four interviews. The results shown hereare for the quarter in which the initial interview took place.
16. Household fuel expenditures are converted into physical units (million Btu)by dividing expenditures by unit price per million Btu and adjusting the phys-ical units to reflect the conversion efficiencies of typical energy-consumingappliances.
17. The data set contains a large number of zeros during the first few months of2000, so the median is close to zero. One explanation is that the billing sys-tem started in the middle of 1999, so the large number of zeros is part of theadjustment period during the creation of the data set. A second explanationis that there were few existing meters in the system during this period. Beforenew meters were widespread, an “average” or “estimated” amount of KWh wasassigned to households as their consumption. These numbers were later
Nonpayment and Power—Georgia 85

verified by AES Telasi as new meters were introduced into the distributionsystem, sometimes resulting in very large bills for the households.
18. A refrigerator (manual defrost 5–15 years old) consumes about 95 KWh permonth, and three incandescent lightbulbs consume another 30 KWh permonth.
19. According to information from AES Telasi, in some areas estimates show thatsupply accounts for GEL 60–70 per household a month while payments areonly GEL 2–3 per household a month.
20. This pattern holds for the lowest 20 percent and for the average household.
21. According to the Save the Children survey, in 2002 more than 53 percent ofhouseholds had one or more members with a chronic disease, and 76 percentof households had one or more members with either an illness or disease inthe previous three months. It is therefore possible that other factors for whichthere are no data mask health differences related to fuel use. For more detailson time series data, see Lampietti and others (2003).
22. The health impact will depend on the number of households and the tech-nologies used when burning traditional fuels—for example, improper stoves.
23. Revenue from the residential sector increased 91 percent from 2000 to 2001and another 41 percent from 2001 to 2002. These figures are for a sample of1,349 households included in the Georgia HBS. In total, AES Telasi hasapproximately 300,000 customers. Households participating in the HBS wererandomly selected and may be presumed representative of households inTbilisi.
24. At times collection rates even exceeded 100 percent of current billings, ashouseholds settled arrears and transfer payments for subsidies were receivedfrom U.S. Agency for International Development (USAID) or the govern-ment. Arrears for public sector customers were another very important issue.
25. The cost of meters is not taken into account in this analysis.
26. The program finances the supply of electricity to low-income households inTbilisi for winter heating during the January–April period. The amount eachhousehold receives has varied each year depending on the funding available.It was 850 KWh in 2000 and 1,000 KWh in both 2001 and 2002. Theplanned amount for 2003 was 480 KWh.
27. Remetering refers to both replacing old meters for newer ones and installingmeters outside the dwelling; households used to have meters inside thedwelling.
28. Before 2003, this was between 35 KWh and 70 KWh per household a month;it later increased to 240 KWh a month in the winter and 120 KWh a monthin the summer.
29. This program is part of the “President’s fund,” which covers veterans.
86 Lampietti, Banerjee, and Branczik

30. Gas connections in Tbilisi increased from 10,000 households in 1996 to170,000 in 2003.
31. World Bank 2005a, p. 60. The report continues to state that this was com-pounded by “[a]n increasing fragmentation of political power during theShevardnadze government [that] reduced high-level commitment to curbingcorruption and advancing difficult reforms” (p. 77).
Nonpayment and Power—Georgia 87


By the end of the 1990s, the perception was widespread that reform,particularly privatization, hurt the poor.While AES Corporation was on thebrink of withdrawing from its Georgia operations, the international finan-cial institutions and another foreign private utility operator in Moldovawere confronted with a government threatening to reverse privatization,using the popular perception of privatization’s negative effects on the poorto justify its actions. This study shows how understanding the effects ofreform on households can bring clarity and empirical evidence to debatesthat are ideologically motivated and highly politicized.
The Long Slide
Moldova’s postindependence decline lasted the whole of the 1990s, leav-ing it one of the poorest countries in the region.1 The war in Transnistriain the early 1990s weakened central government control over an area thatholds much of Moldova’s industrial and power generation capacity.2 Andtransition, poor governance, and corruption took a heavy toll on theeconomy. With declining economic opportunities and rising poverty, up
C H A P T E R 6
Does Privatization Hurt the Poor
of Moldova?
89

to a quarter of Moldova’s 4.2 million population is estimated to have leftthe country in search of work.3
Moldova depends on outside energy sources, importing more than95 percent of its energy from the Russian Federation and Ukraine.4
The movement of previously low Russian and Ukrainian gas and oilprices toward international levels contributed to the rapid accumulationof debts by the state energy company, Moldenergo, US$300 million by1995.5 Until 1998, residential energy tariffs remained low, and sector rev-enue could not cover the cost of imports. Funds for maintenance andrepairs dried up, decapitalizing power infrastructure assets. By the late1990s, Moldova was facing an energy crisis. Cash-flow problems madeMoldenergo vulnerable to supply shortages, resulting in regular powerinterruptions and lower quality. The areas outside Chisinau, where manypoor people live, were hardest hit by rationing, with many localitiesreceiving electricity for just a few hours a day.6 Power was often inter-rupted without warning, and per capita monthly electricity consumptionplunged to the lowest levels in Europe, (figure 6.1), at just 51 kilowatthours (KWh) in 2001—a quarter of the average in the Europe andCentral Asia (ECA) region and less than half the basic minimum need.7
In 1997, Moldova launched a reform program, and in 1999 tariffs wereincreased 84 percent, followed by smaller increases.8 In 2000, the govern-ment adopted a law on nominative targeted compensation (NTC) forenergy use to help vulnerable groups cover the rising cost of their energyconsumption.
Also in 2000, part of the distribution network was privatized. Three offive regional electricity distribution companies (REDs)—RED Chisinau(serving the capital region), RED Centru (serving central Moldova), and
90 Lampietti, Banerjee, and Branczik
0
2,000
4,000
6,000
8,000
10,000
1992 1993 1994 1995 1996 1997 1998 1999 2000
GW
h/y
ear
Albania
Armenia
Georgia
Moldova
Turkmenistan
Figure 6.1. Electricity Consumption in Moldova Plunged between 1992 and 2000
(total annual electricity consumption)
Source: International Energy Agency.

Does Privatization Hurt the Poor of Moldova? 91
RED Sud (serving southern Moldova)—were sold for US$26 million inan open tender to the Spanish utility Union Fenosa, which as part of thedeal committed to invest US$56 million in infrastructure rehabilitationover five years. The Union Fenosa service area covered 694,000 residen-tial and 33,000 nonresidential customers (60 percent of Moldova’s pop-ulation).9 Two other regional distribution companies, together known asthe NREDs, remained state owned.
After the peak of the energy crisis in 2000, reform produced substan-tial improvements in supply to consumers. But reform and privatizationelicited acrimonious debate among stakeholders and questions about thecosts and benefits of reform. Much disagreement centered on UnionFenosa, which became the country’s largest foreign investor in a highly vis-ible privatization deal. Union Fenosa electricity tariffs were about 10 per-cent higher than those of state companies, fueling concerns that theprofit motive left consumers, particularly the poor, worse off. UnionFenosa covered only 38 percent of its investment commitments from 2000to 2002, a failure that it ascribed to uncertainty in the investment climate,including a lawsuit centered on irregularities in the privatization procedureand the government’s reluctance to allow further tariff increases.10
Moldova’s government, which in 2001 became the first explicitlyCommunist government to be elected in a post-Soviet state, added to theuncertainty by openly announcing its intention to reverse privatization,including privatization in the energy sector. Other countries saw similardebates over the pros and cons of privatization, but in Moldova, the gov-ernment’s unambiguous agenda of reversing privatization was particularlypressing.
This study sheds light on a very contentious debate by providingempirical answers to two intentionally neutral questions. First, did reformaffect the poor and the nonpoor differently, as was charged by opponentsof reform? Second, were household electricity consumption patternsdifferent in private and public distribution networks?
Box 6.1
Data for the Analysis—Moldova
To determine whether the impact of reform was the same for poor and nonpoor,
the study compares three quantitative welfare indicators: electricity consumption,
electricity expenditures (payments), and share of electricity expenditures in total
(Continued)

92 Lampietti, Banerjee, and Branczik
household expenditure. To determine how privatization affected consumers, it
compares customers served by Union Fenosa and the NREDs. It therefore provides
a counterfactual view of privatization by comparing consumer outcomes in pri-
vate and public regions.
The quantitative analysis relies primarily on time series data from the Moldova
household budget survey (HBS) and records provided by Union Fenosa. The HBS
is a survey of more than 6,000 households conducted annually since 1997. Data
from the survey were compared with data provided by Union Fenosa to test the
reliability of survey responses to questions about electricity consumption, billing,
and payment. For NRED customers, only aggregate, not household utility data,
were available. But the two sets of data from the HBS and Union Fenosa were
highly correlated, increasing confidence in the HBS data for NRED customers.a The
HBS data were used to estimate a household electricity demand function and
compare price elasticity of demand by for different income groups.b
Since the quantitative data were already available, the qualitative analysis was
conducted afterward, to confirm and improve understanding of key questions
emerging from the household data analysis. The qualitative analysis is based on
focus group and key informant interviews in the winter of 2003–04. Forty-three
focus groups and 59 key informant interviews were held with poor and nonpoor
people, living in large cities, small towns, and rural areas, with access to different
sources of energy, living in areas served by Union Fenosa and the NREDs. Inter-
views were also held with distribution company managers, meter readers, postal
workers, social assistance providers, and mayors.
The analysis covers the four years starting with 2000 and ending in 2003.
Limiting the analysis to this period carries four important caveats. First, although
Union Fenosa took control of part of the network in February 2000, reform be-
gan in 1997, and the largest tariff increases occurred before 2000. So the quanti-
tative analysis does not capture the largest price effects on household welfare.
Second, the psychological point of reference for most people is the early 1990s,
when Moldova was more prosperous and reliable electricity was virtually free.
This tends to bias their responses to questions about the recent privatization,
because they do not compare it to the mid-1990s when the system was close to
collapsing. Third, the recent growth in the economy coincides with privatization,
which complicates inferences about the impact of reform on households.
Fourth, the high level of emigration in search of employment that began during
the 1990s also introduces uncertainty about aggregate consumption figures
and may have had a disproportionately large effect on the number and size of
poor households.(Continued)

Residential Energy Consumption in Moldova
Between 1998 and 2003 the cost of all energy products increased, butelectricity tariffs rose most rapidly (figure 6.2).11 Although district heatingtariffs increased even more than electricity, it is unclear whether paymentfor this service was enforced, given the difficulties of enforcing district heat-ing payments and the collapsed district heating systems in most towns.12
Residential electricity consumption in Moldova was very low. Monthlyhousehold electricity consumption averaged 61–84 KWh between 1997and 2003,13 less than one-tenth of the 852 KWh average in the United
Does Privatization Hurt the Poor of Moldova? 93
Another caveat is the dramatic decline in poverty during this period and how
this may affect the analysis. Between early 2000 and late 2003, Moldova’s pover-
ty level fell from 71 percent to 37 percent, with the greatest decline in rural areas.
Studying the same households over the four years (using “panel data”) would
have enabled the study to analyze the consumption changes of households that
started poor and joined the nonpoor. Instead, the study was only able to look at
aggregate data for poor and nonpoor groups. This limitation in the data means
that the findings understate changes in consumption for the poor. Households
originally “poor” increased their consumption as they became “nonpoor.” But this
increase in consumption is not captured in the poor group where they started,
since they are part of the nonpoor category the next time their consumption is
measured.
Source: a. Relying on the HBS also allowed the study to use the same definition of poverty as did the
World Bank poverty assessment (World Bank 2004c). The poverty line is 196.03 MDL per month.
b. See World Bank (2004f ) for details.
0123456789
10
Oct. 9
8
Apr. 99
Oct. 9
9
Apr. 00
Oct. 0
0
Apr. 01
Oct. 0
1
Apr. 02
Oct. 0
2
Apr. 03
Oct. 0
3
no
min
al le
i per
kg
oil
equ
ival
ent
Union Fenosaelectricity
NREDselectricity
gas
liquefiedpetroleum gas
coal
Figure 6.2. Electricity Was the Most Expensive Source of Energy in Moldova
Sources: Moldova Household Budget Survey and ANRE.

States.14 Even compared with other relatively poor countries in theregion, this was extremely low. Sixty KWh a month was enough to runonly a refrigerator for 5.5 hours a day and three 75-watt lightbulbs for4 hours a day. Many Moldovas, especially the poor, were thus extremelyrestricted in their electricity consumption and had to cope by consump-tion reducing measures, such as unplugging appliances. Public and privateinstitutions, including schools, hospitals, and cultural centers, were alsounable to pay for electricity. Despite significant improvements in supply,public areas remained dark. Communal areas in apartment blocks, suchas stairwells, often remained unlit when money or trust for making col-lective payments was lacking. And there were reports of residents suffer-ing injuries from navigating stairwells in the dark when elevators were notfunctioning. Safety at night was a concern, with many urban and rural res-idents afraid to leave their homes because the streets were dark.
In addition to normal uses, electricity in urban areas was sometimesused as a supplement or substitute for poorly or nonfunctioning districtheating. District heating served 98 percent of households in large citiesand 29 percent of households in small towns, according to the 2003 HBS.Where available, households reported spending a larger share of incomeon district heating than on gas or electricity. It is not clear, however,whether households were reporting the amount they were billed orthe amount they actually paid—nonpayment for district heating wasreported to be quite high.
In small towns without district heating, heavily subsidized gas was theheating fuel of choice if it was available, followed by electricity. Thispattern of use implied that future network energy price increases werelikely to hit people living in small towns hardest. The focus groupsrevealed that rural households rarely cooked or heated with electricity,usually using wood, coal, or gas.15 Access to piped gas is becoming morecommon with a government-financed program to provide gas to everyarea of the country by 2010.16
Effect of Reform on Electricity Consumption On average, the poor consumed 26 percent less electricity than thenonpoor (figure 6.3). But since 2000, the poor increased monthly electric-ity consumption by 14.6 percent (from 48–55 KWh), while the non-poor increased consumption by only 3.2 percent (from 62–64 KWh).So despite rising tariffs, the poor were catching up with the nonpoor.These findings are consistent with the household demand model, which
94 Lampietti, Banerjee, and Branczik

shows no difference in the price elasticity of demand between poor andnonpoor households.
Payment rates for the poor and nonpoor were similar, which sug-gests that the narrowing of the consumption gap between poor andnonpoor cannot be attributed to nonpayment by the poor. If con-sumption increased more among the poor than the nonpoor whilepayment rates reached the same levels (almost 100 percent by 2003),it follows that electricity expenditures would increase more rapidlyfor the poor than the nonpoor. This is exactly what is observed: in2000, the poor spent 38 percent less than the nonpoor on electricity,but by 2003, they were spending only 18 percent less,17 even whilepayment rates were the same for both groups.18 These figures suggestthat the poor were catching up with the nonpoor in electricityconsumption.
In spite of increased consumption and higher collection rates, the shareof expenditure on electricity declined for both poor and nonpoor. Thepoor continued to spend a larger share of their income on electricity thanthe nonpoor (4.7 percent versus 3.4 percent in 2003), but the gap wasclosing, as the share of income spent on electricity declined more rapidlyfor the poor (table 6.1).
Effect of Reform on Service Quality Availability of electricity improved greatly, and blackouts were dramati-cally reduced nationwide. The poor, disproportionately affected byblackouts, benefited most from the return to 24-hour service. Findingsfrom focus groups confirmed that the majority of Moldovans were satisfiedwith improved service quality and reliable supply.19 They also reported
Does Privatization Hurt the Poor of Moldova? 95
0
20
40
60
80
100
1997 1998 1999 2000 2001 2002 2003
KW
h p
er m
on
th
0
0.1
0.2
0.3
0.4
0.5
0.6
0.7
0.8
MD
L
nonpoor poor average tariff
Figure 6.3. The Gap Narrowed in Electricity Consumption between the Poor
and Nonpoor
Source: Moldova Household Budget Survey, Department of Statistics, Moldova.

no difference in service interruptions among poor and nonpoor house-holds after reform.
Focus group discussions also indicated that voltage levels and frequencyfluctuations improved, though problems remained in some localities. Poorhouseholds had a harder time repairing or replacing appliances damaged byvoltage fluctuations, and therefore derived greater benefit from a reductionin fluctuations.20
Differences between Urban and Rural HouseholdsHouseholds in large cities (lowest poverty rate) and small towns (highest)spent a higher share of their income on electricity than did households inrural areas.21 In 2003, the average household in large cities consumed 90 KWh per month, while the average household in small towns con-sumed 65 KWh, and the average in rural areas just 51 KWh. Between2000 and 2003, consumption increased by 26 percent in rural areas, com-pared with 11 percent in large cities and 3 percent in small towns (table6.2). These data are consistent with the findings of the poverty assess-ment, indicating that poverty fell most in rural areas.
96 Lampietti, Banerjee, and Branczik
Table 6.1. Share of Electricity Expenditures by the Poor and Nonpoor, 1999 and 2003
(MDL a month)
Poor Nonpoor
Percentage Percentage
Item 1999 2003 change 1999 2003 change
Electricity expenditures 28 40 42.9 33 47 42.4
Income 431 966 124.1 871 1,799 106.5
Share of electricity in 7.4 4.7 na 4.3 3.4 na
income (percent)
Source: Moldova Household Budget Survey.
na = not applicable
Note: Gross household expenditures are used as a proxy for income. Percentage changes were computed using
household data, not the aggregate data in the table.
Table 6.2. Change in Electricity Consumption and Expenditures, by Location
Percentage change between 2000 and 2003
Item Large cities Small towns Rural areas
Electricity consumption 11 3 26
Electricity expenditures 38 26 48
Share of income –27 –32 –33
Source: Moldova Household Budget Survey. See Box 6.1

The share of income spent on electricity in rural areas dropped signifi-cantly after the 84 percent tariff increase in 1999 (figure 6.4).That a dropof similar magnitude is not observed in cities or small towns suggests thatrural households either went without or found less expensive substitutesfor electricity.22
Did Reform Hurt the Poor?
Contrary to perceptions, the quantitative evidence suggests that the poorwere not hurt by reform. The gap in electricity consumption betweenpoor and nonpoor was closing, attributable not to the design of reformbut to the improved electricity supply, particularly to rural areas, coupledwith substantial income growth.
The qualitative analysis did reveal why people perceived thatreform hurt the poor. Despite improved electricity supply and quan-titative evidence suggesting that income growth offset the impactof tariffs, focus group respondents expressed anxiety over future tar-iff increases, consistent with a recent opinion poll that found thatMoldovans were becoming more pessimistic. One explanation is thatpeople were comparing the then-current situation with that of theearly 1990s, when electricity was inexpensive and plentiful, ratherthan with the later 1990s. Despite very positive macroeconomic indi-cators, fewer respondents (26 percent) said they had a better life nowthan a year ago (29 percent).23 Although the macroeconomic situation
Does Privatization Hurt the Poor of Moldova? 97
0123456789
1997 1998 1999 2000 2001 2002 2003
large cities small towns rural areas
per
cen
t
Figure 6.4. The Share of Electricity Expenditures in Total Expenditures Declined
After 1999
Source: Moldova Household Budget Survey. See box 6.1

has improved significantly for the poor, Moldova’s very poor remainunder stress, and income growth may not have reached them. In focusgroup discussions, the very poor indicated that they were still a longway from raising electricity consumption to minimum basic needs.They unplug their refrigerators for days at a time, minimize the use oftheir television sets, and restrict themselves to low-wattage lightbulbs.
A Difference between the Private and Public Utilities?
Examination of tariff increases, disconnections, consumption patterns,and power losses reveals very little difference between Union Fenosa andthe public electricity companies, refuting claims that privatization hurtsthe poor. Union Fenosa’s residential tariffs did increase more than NREDtariffs after privatization; nominal tariffs for Union Fenosa rose 26 per-cent, from MDL 0.50 in 1999 to MDL 0.78 in June 2004, while tariffscharged by the NREDs rose 13 percent, from MDL 0.50 to MDL 0.70.24
The difference is explained largely by the fact that until January 2004, themethodology for setting Union Fenosa’s tariffs included a fixed return oninvestment.25 Tariff methodologies then became the same for both com-panies and in the future will be strongly determined by the level of invest-ment in infrastructure.26
Increased enforcement of electricity payments did lead to loss ofaccess, and this was more frequent with the private sector operator.Union Fenosa reportedly disconnected 3.4 percent of its customers in2003, the NREDs only 0.4 percent. Qualitative evidence suggests thatpeople were often disconnected because they could not pay their bills.Reconnection fees and associated fines were often high, and consumersfelt that insufficient warning time was given before they were discon-nected for nonpayment.27
Once other factors are taken into account—tariff rates, income,household size, and apartment size—consumption patterns of house-holds served by Union Fenosa and households served by the NREDs areroughly similar.28 In areas Union Fenosa served, average monthly house-hold consumption increased from 55 KWh in 2000 to 62 KWh in 2003,a 12.7 percent increase. In areas the NREDs served, consumption rosefrom 52 KWh to 60 KWh, a 15.4 percent increase (table 6.3).The increasein payments was also very similar. That changes in consumption were sim-ilar despite an 11 percent difference in tariffs suggests that either demandwas relatively price inelastic or the NREDs had higher collections, offset-ting the effect of a lower tariff on consumption.29
98 Lampietti, Banerjee, and Branczik

The study analyzed the factors contributing to differences in consump-tion using a multivariate model.30 Those differences were more closelylinked to location and income than to the electricity provider. Electricityconsumption increased in cities and small towns served by Union Fenosaand decreased in cities and small towns served by the NREDs (table 6.4).The most significant difference was between Chisinau, served by UnionFenosa, and Balti, served by an NRED: consumption in Chisinau rose 16 percent, while consumption in Balti decreased by 13 percent. The
Does Privatization Hurt the Poor of Moldova? 99
Table 6.3. Consumption, Payments, and Percentage of Income Spent on Electricity
by Union Fenosa and NRED Customers, 2000–03
Percentage
Change between
Item 2000 2001 2002 2003 2000 and 2003
Union Fenosa
Average tariff (MDL) 0.62 0.66 0.7 0.75 21
Average monthly household 55 60 54 62 13
consumption (KWh)
Average monthly household 5 40 39 48 37
payment (MDL) 3
Average percent of income 5.3 5.3 4.2 3.9 –20
spent on electricity
NRED
Average tariff (MDL) 0.56 0.59 0.64 0.67 20
Average monthly household 52 52 56 60 15
consumption (KWh)
Average monthly household 29 31 36 40 38
payment (MDL)
Average percent of income 5.7 4.9 4.5 3.6 –33
spent on electricity
Source: Tariff data are from ANRE 2002 and 2003. Consumption data are from the Moldova Household Budget Survey.
Table 6.4. Change in Electricity Consumption between 2000 and 2003, by Type of
Provider and Location
(percent)
Item Large cities Small towns Rural areas
Average household electricity consumption
Union Fenosa 16 8 21
NREDs –13 –3 31
Average share of income on electricity
Union Fenosa –24 –32 –31
NREDs –39 –39 –36
Source: Moldova Household Budget Survey.

change was driven by faster income growth in Chisinau. Household elec-tricity consumption rose 31 percent in rural areas served by the NREDs,and 21 percent in rural areas served by Union Fenosa.
The quality of service provided by Union Fenosa and the NREDs wasalso roughly similar. Service interruptions at Union Fenosa reportedly fellfrom 5,645 hours in 1997 to 52 hours in 2002.31 Equivalent data were notavailable for the NREDs, nor were data available for such other measuresof service quality as customer complaints and billing flexibility and accu-racy. However, focus group discussions and interviews with consumersserved by both companies suggest that the number of interruptions andvoltage oscillations were similar.
Overall, electricity sales rose 47 percent between 1999 and 2002(table 6.5). The increase in sales by Union Fenosa and the NREDs wassimilar, with increases of 49 percent and 45 percent respectively. Debtsfor energy imports steadily declined for private companies and increasedfor public ones, suggesting better performance by the private sector.
Power losses—consisting of electricity transmitted by distributioncompanies minus residential and nonresidential metered consumption—remained high for both Union Fenosa and the NREDs, imposing a signif-icant cost on the sector. Between 1999 and 2002, commercial andtechnical losses decreased slightly from 31 percent of total power to 29 percent (table 6.6).32 Union Fenosa losses fell between those of thetwo state-owned companies. Virtually all commercial losses were attrib-utable to theft. Consumers were afraid of the large fines for theft, whichcould reach MDL 10,000, and this appears to have had a significanteffect on performance. Union Fenosa reported a 9.3 percent fall in
100 Lampietti, Banerjee, and Branczik
Table 6.5. Net Sales at State-Run Electric Utilities and Union Fenosa, 1999–2002
(millions of MDL)
Percentage
Change between
Company 1999 2000 2001 2002 2000 and 2002
NREDs 292 318 342 422 45
RED Nord 190 224 232 282 48
RED Nord-Vest 102 93 110 141 37
Union Fenosa 735 899 1,043 1,092 49
RED Chisinau 491 612 691 744 52
RED Centru 147 168 208 205 40
RED Sud 97 119 145 142 47
Total 1,027 1,216 1,385 1,515 48
Source: ANRE 2002 and 2003.

theft,33 attributing the decline to a new program to install tamper-proofmeters.34 Focus groups and interviews indicate that enforcementimproved as meter readers were rotated more frequently and given ashare of the fines they collected as a commission.
Quantitative data on theft were not available, but the qualitative find-ings suggest that it is not related to income. Indeed, it helps to have meansor connections to steal: focus groups and interviews indicate that wealthycustomers were most likely to steal. Theft was limited to those with themeans to bribe meter readers, invest in technology to circumvent themeter, or steal using other means; people who could afford theft devicesor had the technical skills to set up an illegal hook-up; small, energy-intensive enterprises, which often steal from other consumers; and poorhouseholds, which often steal only occasionally or because they were dis-connected for failure to pay their bills.
How Effective Was the Social Transfer System?
In common with many other former Soviet Union countries, Moldova’scurrent strategy for mitigating the impact of tariff increases, the nominativetargeted compensation (NTC) system, is not targeted at the poor. Insteadof being means tested, it is a system of categorical privileges: certain groupsof people receive the NTC (box 6.2), which helps cover the cost of elec-tricity, gas, district heating, hot water, cold water, coal, and firewood.
Even following reform of the system, which reduced the number ofcategories from 37 to 11,35 the correlation with poverty is weak: the
Does Privatization Hurt the Poor of Moldova? 101
Table 6.6. Electricity Losses by Union Fenosa and the NREDs, 1999–2002
Company 1999 2000 2001 2002
RED Nord
Volume of losses (millions of KWh) 251 155 155 138
Percent of revenues 38 28 28 24
RED Nord-Vest
Volume of losses (millions of KWh) 133 98 120 115
Percent of revenues 36 36 40 35
Union Fenosa
Volume of losses (millions of KWh) 678 722 753 655
Percent of revenues 28 32 34 29
Total
Volume of losses (millions of KWh) 1,061 974 1,028 908
Percent of revenues 31 32 34 29
Source: ANRE 2002 and 2003.

proportion of households in the lowest 20 percent receiving the NTCwas only slightly higher than for the highest 20 percent, 16 percent versus14 percent (table 6.7). Moreover, the lowest 20 percent of householdsreceived the smallest share of NTC resources, while the highest 20percent received the largest.36
102 Lampietti, Banerjee, and Branczik
Box 6.2
Nominative Targeted Compensation Categories
In accordance with Government Decision No. 761, as of July 31, 2000, compensa-
tion is paid to the following categories of people:
1. Disabled people belonging to groups I and II, regardless of the reason for
their disability.
2. Disabled people belonging to group III who are
a. Labor veterans.
b. Recognized as disabled as a result of severe injuries, traumas, or wounds
received during execution of military duties.
c. Participants in military actions for defending the integrity and independ-
ence of the Republic of Moldova.
d.Victims of political repressions between 1917 and 1990.
e. Former prisoners of concentration camps or ghettoes.
3. Disabled children under age 16.
4. People disabled from childhood.
5. Participants in World War II and their spouses, depending on circumstances.
6. People whose status is equal to that of World War II veterans.
7. Parents, spouses who do not remarry, and the preadolescent children of
people who were lost executing service duties or who died as a result of
participation in attempts to control the accident at the Chernobyl Atomic
Power Station.
8. Single pensioners.
9. Families with four or more children under age 18.
10. People who supported the troops during World War II.
11. People who were in Leningrad during its blockade.
Source: Moldova Ministry of Labor and the Social Protection (2003).
Note: The NTC is the Moldovan government’s primary instrument for delivery of social benefit
assistance.

The timing of NTC transfers was also important for the very poor. Itwas not aligned with the electricity company billing cycle, which made itharder for very poor consumers to pay their bills on time. Union Fenosaoffered consumers a financing mechanism for smoothing payments, butfew customers took advantage of it.37
Proposing a Better Mitigating Strategy
Despite positive news on rising income and the closing of the electricityconsumption gap between the poor and nonpoor, electricity consump-tion remained exceptionally low and inelastic, especially for the verypoor. Between 1998 and 2003, consumers reduced consumption andpaid more for the power they used (figure 6.4). This implies largepotential consumer welfare losses associated with future tariff increasesunless accompanied by further increases in income. It also implies thatthere may be room for substantial welfare gains through enablinghouseholds to better manage their electricity expenditures. This couldbe achieved by introducing prepayment swipe cards for meters toreduce both the cost and the anxiety associated with disconnections, orencouraging the poor to use more energy-efficient technologies for refrig-eration and lighting by introducing vouchers or similar programs. Thepublic sector could also help defray the cost of extending access toclean, inexpensive gas in small towns, where people must rely on elec-tricity for heating. But to achieve this, a financially sustainable gas sectoris needed first.
More could be done to target the very poor, such as reformulating theNTC to make it more of an income-based transfer and promoting theoptional lifeline introduced by the NREDs in June 2002. Under thatprogram, customers pay MDL 0.50 for the first 50 KWh and MDL 1.65for every KWh over 50. Interestingly, only about 10 percent of households
Does Privatization Hurt the Poor of Moldova? 103
Table 6.7. Households Receiving Nominative Targeted Compensation for Electricity,
by Income Quintile
Quintile Percent of households receiving compensation
Lowest 16
Mid–low income 17
Middle 15
Mid–high income 13
Highest 14
Source: Moldova Household Budget Survey.

served by the NREDs used this program.38 Given the very low consump-tion of poor people, it is unclear why more poor households have notelected to participate. One reason may be fear of the very high expendi-tures associated with exceeding the 50 KWh threshold. It is probablyworth exploring whether a different tariff structure would encouragemore poor people to participate without compromising utility finances.
Conclusion
Moldova’s energy sector has brought the country out of the energy crisisof the late 1990s. Electricity supply has increased, payments have goneup, and the sector’s performance has improved. Government expendi-tures on fuel and energy decreased from MDL 36.9 million in 1997 tojust MDL 2.1 million in 2003.39
The study showed that the poor benefited more than the nonpoor fromreform, having increased their consumption more than the nonpoor despiterising costs. Consumption and expenditure patterns of households servedby the private operator are roughly similar to those served by the publicutilities. While the share of electricity in income fell more for the NREDs,it was similar for all consumers and lower than at any time since 2000.
Privatization did not hurt the sector.The private company had a signif-icant positive impact on the government budget, while service qualityimproved (electricity is now available 24 hours a day), and collectionrates have risen to almost 100 percent across the country. Indeed, priva-tization might have improved performance by state-run companies, high-lighting another institutional factor that could influence the success ofreform efforts: the coexistence of private and public distribution compa-nies. With elements in Moldova keen to see privatization discredited, thepresence of a private operator put pressure on the NREDs to show thatpublicly run companies could produce results equal to or better than aprivate operator, and thus improve their performance. If true, this impliesthat the presence of a private operator in a chronically underperformingsector may have a significant positive spillover effect. There may be sig-nificant advantages to applying a partial privatization model in otherunderperforming sectors, such as district heating, water, and possibly gas.
Another possible spillover effect of privatization was the rapid remon-etization of the economy. Even before privatization, the barter systemwas beginning to disappear in Moldova, just as it did in the RussianFederation and Ukraine. It is likely that by refusing to engage in this highly
104 Lampietti, Banerjee, and Branczik

inefficient but widespread method of payment, Union Fenosa hastenedits demise in Moldova.
Notes
This chapter is based on World Bank 2004f.
1. In 2003, Moldova’s per capita gross domestic product (GDP) was US$543,among the lowest in the region (National Bank of Moldova at www.bnm.md/english/index_en.html). Multiple years.
2. World Bank (1996b).
3. World Bank (2004c).
4. Together with Transnistria, Moldova imports 30 percent of its electricity, withthe remainder produced by Moldova GRES in southern Transnistria from gasand oil purchased from the Russian Federation and Ukraine.
5. World Bank (2003e).
6. Dodonu (1999).
7. International Energy Agency (2003).
8. Moldova unbundled the state energy company into 16 generation, transmis-sion, distribution, and debt-holding entities. In 1998, an electricity law waspassed, and in preparation for privatization, an independent regulator, theNational Energy Regulatory Agency (ANRE), was established to regulate gasand electricity (Electricity Law No. 137-XIV of 1998, cited in World Bank2002b). In addition, debt was restructured and transferred to oldtranselectro,a state-owned debt-holding company (World Bank 2002b).
9. ANRE, multiple years.
10. Ministry of Energy. Data for the NREDs have not been made available.
11. These figures do not reflect the full economic costs of the different types ofenergy, which may include transport, storage, and costs to health. These costsmay apply much less to utilities than to nonnetwork energy sources.
12. Of 36 urban centers that once had district heating, only 6 (including Chisinauand Balti) still had functioning systems, and service was not reliable.
13. These figures are based on household-level data collected from the HBS andUnion Fenosa database. Figure 6.2 is different because its data are sourcedfrom the International Energy Agency and represent aggregate consumption(including residential and nonresidential) divided by total population.
14. Derived from U.S. Department of Energy (1997).
15. The price of wood was MDL 220 per cubic meter in 2003, or about MDL0.0012 kg oil equivalent.Wood use—which averaged about 0.5–1.5 cubic metersin an average summer month and 2–3 cubic meters in an average winter
Does Privatization Hurt the Poor of Moldova? 105

month—cost households MDL 110–330 in the summer and MDL 440–660in the winter. These figures are higher than those for gas: central gas expendi-tures were MDL 101 a month, and LPG expenditures averaged MDL 132 amonth.
16. Interview with Deputy Energy Minister Felix Varlan.
17. Moldova Household Budget Survey, multiple years.
18. Union Fenosa data reveal no statistically significant difference at 1 percentlevel between payment (or collection) rates for the poor and the nonpoor.
19. There is no reason to believe that marginal increases in monthly KWh con-sumption will decrease. Average household electricity consumption in Moldovais far below that of its neighbors.
20. Data are not available for voltage and frequency fluctuations, which are afunction of both generators and distributors.
21. A World Bank Poverty Assessment in 2003 found that large cities (Chisinauand Balti) had the lowest poverty rates, at 25 percent; poverty was higher inrural areas (38 percent) and highest in small towns (52 percent) (World Bank2004c).
22. Calculating the household energy bundle would show how it changed overtime with the change in the relative cost of fuels. Doing so is not possibleusing HBS data, however. Data on wood, coal, and other fuels are unreliablebecause of the small number of observations. Data on district heating expen-ditures are not believed to be reliable because many households apparentlydid not pay for this service.
23. Between 2000 and 2003, GDP rose by 21.6 percent and wages by more than70 percent, and unemployment fell (Economist Intelligence Unit 2004).
24. Derived from data from TACIS Moldova Economic Trends.
25. ANRE (2003).
26. Interview with ANRE director Nicolae Triboi, June 15, 2004.
27. Union Fenosa’s reconnection fee after debt payment varies by customer type,distribution company, distance, and other factors. RED Chisinau chargesMDL 92, RED Centru MDL 14–62, and RED Sud MDL 45–57 to reconnectresidential customers. RED Chisinau charges nonresidential customers MDL201, RED Centru charges MDL 155–234, and RED Sud charges 80–180(Union Fenosa data).
28. Data cover only the period after electricity distribution was split into privateand state-owned enterprises.
29. The impact of tariff changes on the two networks differs. Households servedby the NREDs had a lower elasticity than those served by Union Fenosa.
30. See World Bank (2004f) for details.
106 Lampietti, Banerjee, and Branczik

31. Union Fenosa data.
32. A concession for commercial and technical losses is included in the tariffmethodology (17.7 percent for Union Fenosa, 18.0 percent for the NREDs in2002), above which the cost is borne by the company (ANRE data).
33. Union Fenosa data comparing first quarter 2004 with first quarter 2003.
34. By March 2004, 133,749 new meters had been installed (Union Fenosa data).
35. The change was effected by the Law on Special Social Protection of SomeCategories of the Population No. 933 XIV, passed April 14, 2000.
36. Counterpart International Study, based on a different data set and showingthat compensation is poorly targeted.
37. The reasons for low participation were not found in the study. The study didfind that for some households the NTC for electricity was higher than actualelectricity expenditures. Some 15–20 percent of households receiving com-pensation for electricity were using the money for expenditures other thanelectricity.
38. ANRE data.
39. Moldova Economic Trends (2003). Data that could show the impact on thequasi-fiscal deficit—and thus quantify the impact of turning a debt-laden pub-lic entity into a tax-paying private company—are not available. In the future,it would be desirable for the government to maintain records to quantifythe fiscal impact of privatization reforms. Neither the government, theInternational Monetary Fund (IMF), nor the World Bank were able to furnishthese records.
Does Privatization Hurt the Poor of Moldova? 107


The previous studies have given a better understanding of how tariffincreases affect consumers, particularly the poor. The impact is mostnoticeable when tariff increases are sudden, leading to a dramatic declinein collections in Armenia and widespread opposition in Georgia. Thisstudy provides an ex ante analysis of an alternative approach, a moregradual increase in tariffs. In doing so it provides an idea of the advantagesfrom reforming more gradually in cases where this is possible, and canoffer reluctant governments empirical information on the consequencesof alternative reform strategies.
Energy Rich, with Unrealized Power
Azerbaijan is a net energy exporter, a characteristic that radically altersthe context of reform. Although it also experienced economic collapseand devastating conflict after the fall of the Soviet Union, it has not accu-mulated energy-related debts.And its natural resource endowment makes
C H A P T E R 7
Timing and Sequencing of Raising
Rates—Azerbaijan
109

it less dependent on external assistance—so the government has morefreedom to reject politically difficult reforms.
Despite being energy rich, Azerbaijan suffers from an unreliabledomestic power supply. Power outside Baku is supplied a limited numberof hours per day because of badly maintained infrastructure, high com-mercial losses, high nonpayment rates, and low tariffs. These problems aregetting worse as strong economic growth increases demand for electrici-ty. The opportunity cost of supplying the sector with low-cost domesticoil and gas is rising as international oil prices increase, and the governmentis sacrificing energy revenues.
To improve supply and reduce subsidies to the sector, Azerbaijan start-ed energy sector reforms fairly recently. A key part of the reforms is rais-ing tariffs to cost-recovery levels; at manat 96 ($0.0196) per kilowatthour (KWh), residential tariffs are well below other countries in theregion (table 7.1). Azerbaijan may be able to afford lower tariffs, but itmust raise prices to cover generation, transmission, and distribution costsfor the network to be financially viable. Without increased tariffs, the net-work will continue to decline, demand will outpace supply, and servicequality will fall. When reforms were being considered, internationalnorms suggested that cost recovery would be approximately manat 288($0.06) per KWh, an increase of 200 percent.1
Poor collection rates have further compounded problems associatedwith low tariffs. Collections from metered households in Baku (71 per-cent) are lower than in neighboring countries (see table 7.1).2 Low collec-tions reduce the tariff by half or more, the result of poor service quality,weak enforcement, theft, lack of metering, and nonpayment. Enforcementin Baku has improved in the last few years because of the presence of a private operator, Barmek, and collection rates are predicted to rise to 100 percent by 2008.
110 Lampietti, Banerjee, and Branczik
Table 7.1. Tariffs Are Lower and Consumption Is Higher in Azerbaijan
Collection rate Mean household
Tariff (percent of payment consumption
Country (dollars per KWh) per billing) (KWh a month)
Azerbaijan (Baku, 2002) 0.0196 71 198
Moldova (Chisinau, 2003) 0.0529 98 58a
Georgia (Tbilisi, 2002) 0.0564 90 158
Armenia (Yerevan, 1999) 0.0475 82 169b
Source: See annex 4.
Note: Figures for Baku are based on records for 1,094 metered households in the 2002 Household Budget Survey.
a. January–November.
b. January–June.

Timing and Sequencing of Raising Rates—Azerbaijan 111
Reluctant to implement politically difficult reforms, the Azerbaijanigovernment expressed concerns about the social impact of increasingelectricity prices, particularly the tariff level increase required for costrecovery. This study was to provide the government with information onthe potential impact of tariff increases and the mitigating strategies toavoid welfare losses for consumers. To increase tariffs to cost-recoverylevels would involve a tariff increase of 200 percent. Because of the gov-ernment’s concerns, the study simulated the impacts of an increase tocost-recovery levels and of smaller increases to show how differentoptions might affect household welfare and sector sustainability.
Box 7.1
Data for the Analysis—Azerbaijan
The study began with a stakeholder analysis to identify elements of the reform
package that were not supported by the stakeholders and why, using focus
groups and interviews with key informants.a These were followed by a household
budget survey (HBS) and quantitative analysis of the data to simulate the effects of
various tariff increases on household consumption.
The welfare effects were measured as the amount of compensation the
household would need to achieve the same welfare level as before the increase.
The effects can be evaluated using results of an electricity demand model. The
empirical strategy used in this study estimated the pooled model of electricity
demand using household survey data for four countries: Armenia, Azerbaijan,
Georgia, and Moldova.b These household survey data were merged, household
by household, with the payment and billing records provided by the electric util-
ities for limited samples of households in the capital cities of each country. Pool-
ing creates a data set with sufficient price variation to enable estimating the price
elasticity of demand.
Estimation of a single model on the pooled data set assumes that the four
countries have similar conditions, particularly in the household energy sector, a
reasonable assumption since the countries share many common characteris-
tics and are at approximately the same stage of transition. The biggest differ-
ences are in per capita income and access to substitutes, both accounted for in
the model.
a. These included representatives from the Presidential Administration, Cabinet of Ministers, Ministry of
Economic Development, Ministry of Fuel and Energy, Ministry of Labor, Ministry of Environment and
Natural Resources, Parliament, Energy Sector enterprises, the media, and nongovernmental
organizations.
b. The majority of observations in the data set came from Georgia.

Residential Energy Consumption
Average electricity consumption in Baku was well above basic minimumneeds and higher than in other countries with similar data (see table 7.1).These findings were expected because of Azerbaijan’s lower prices andcollections. Consumption was not significantly higher, possibly becausemany households in Azerbaijan, particularly in Baku, had access to a rea-sonably reliable supply of inexpensive natural gas. Average electricity con-sumption for metered households in Baku was anywhere from 2,376KWh3 to 2,952 KWh per year,4 or 198 KWh to 246 KWh per month.5
Metered households in Baku spent about 2 percent of their incomeon electricity in 2002 (table 7.2). This level of spending was similar tohouseholds in the United States (2.3 percent), but was well below thosein the United Kingdom (4 percent) and most of the transition economies(generally 4–6 percent).6 The low shares of income spent on electricitysuggest there may be room to raise tariffs in Baku without severelylimiting consumption of other goods and services.
There was little difference in consumption patterns between the poorand the nonpoor; in most countries, the lowest 20 percent of householdsspent a larger share of income on electricity than the highest. One expla-nation is that collections in Azerbaijan were lower for the poor (table 7.2),meaning that they faced a lower effective tariff than the nonpoor andconsumed proportionally more than if collections were fully enforced.7
Reliable data on household electricity consumption outside Baku are notavailable because of lack of metering, frequent service interruptions, andhigh nonpayment rates. Average household consumption outside Bakuand the Northeast—based on household data provided by the privatized
112 Lampietti, Banerjee, and Branczik
Table 7.2. Differences between the Poor and Nonpoor in Baku Are Small, 2002
Household Household Share of income Collection rate
Quintiles income (US consumption on electricity (percent of pay-
(per capita) dollars a month) (KWh a month) (percent) ment per bill)
1 (poorest 20 percent) 123 190 2.1 65
2 137 202 1.9 61
3 154 192 1.9 74
4 161 201 1.9 68
5 (richest 20 percent) 189 200 2.2 81
Total 158 198 2.0 71
Sources: 2002 HBS, 2002 Barmek Records.
Note: Figures are based on records for 1,094 metered households in the HBS.

Timing and Sequencing of Raising Rates—Azerbaijan 113
Table 7.3. Electricity Consumption and Service Quality Vary Widely by Location
Collection rate
Mean household Winter Summer (percent of
Billing consumption supply supply payments
Location method (KWh per month) (hours per day) (hours per day) per billing)
Alibayramly Norms 628 17 22 25
Baku Meters 265 24 24 63
Ganja Norms na 10 22 na
Goycay Norms 503 15 18 42
Guba Norms na 9 15 na
Imishly Norms 960 8 20 7
Ismailly Norms na 18 21 na
Mingecev Norms 260 9 21 28
Sabirabad Norms 447 8 20 35
Sumgait Meters 374 24 24 24
Source: 2003 Energy Survey (nonrandom) merged by household with 2003 Barmek and Bayva data (n = 2,000).
na = not available.
distribution company, Bayva8—ranged from 960 KWh a month in Imishlyto 260 KWh a month in Mingecevir (table 7.3). The reliability of these fig-ures is, however, highly questionable. For example, households with morehours of supply are expected to consume more, but the data show thereverse. One explanation is that households outside Baku were billed basedon norms, so these figures represent expected, not actual, consumption.True electricity consumption outside Baku is not known. If electricityconsumption outside Baku was as high as the data suggest, there may beopportunities to substantially increase the efficiency of electricity use.
It is not known whether electricity supply was rationed outside Baku,especially during the winter. No data are available from the utilities onthe number of hours of electricity delivered to different locations. Buthouseholds in Baku and Sumgait reported that electricity was available24 hours a day. In other areas, supply was worse in winter (16 hours aday) than in summer (21 hours a day).9 This is attributable to difficultiesin supplying higher loads associated with residential consumption of elec-tricity for heating.The results on hours of service are internally consistent—in different locations the majority of households reported similar hours ofservice. For example, all 150 households interviewed in Sumgait reported24 hours of service. The results are also consistent with other surveysundertaken in Azerbaijan, suggesting that poor service outside the capitalis a major impediment to economic development.10

How Will Households Respond to Tariff Increases?
This section examines how a tariff increase would affect household elec-tricity consumption in Baku, where there is no rationing constraint.11 Itthen goes on to calculate the size of the income loss from different poten-tial tariff increases—10 percent, 50 percent, and 200 percent—keepingeverything else constant. It concludes by identifying who will be mostaffected by the tariff increase and what potential mitigating actionsmight imply.
Effect of Reform on Consumption Understanding household responses to tariff increases requires knowinghow much they reduce consumption in response to changes in price. Todo this, a sensitivity analysis was first conducted looking at how consump-tion would change under a range of elasticities (low = –0.15, medium =–0.50, and high = –0.75). This was an informed estimate based on priorexperience in the region. The impact of alternative tariff scenarios onhousehold consumption was simulated based on these elasticities. Theresults show that large tariff increases combined with high elasticitiescause dramatic falls in consumption (table 7.4).
The assumption of high elasticity is unrealistic, since, as seen in previ-ous country studies, demand is likely to become more inelastic (less sen-sitive to price changes) as consumption approaches basic minimumneeds. Even if electricity tariffs increased by 200 percent, it is unlikelythat consumers would stop using electricity altogether. Also, the priceelasticity of demand may change over time, and it is important to differen-tiate between short-term and long-term price elasticities. In the short run,elasticity is likely to be closer to zero than in the long run because a house-
114 Lampietti, Banerjee, and Branczik
Table 7.4. Changes in Consumption under Different Elasticities in Baku
Predicted Predicted Predicted
consumption at consumption at consumption at
Consumption at 50 percent 100 percent 200 percent
current tariff tariff increase tariff increase tariff increase
Tariff elasticity level (manat 96) (manat 144) (manat 192) (manat 288)
–0.15 200 185a 170 140
–0.50 200 150 100 na
–0.75 200 125 50 na
Source: Authors’calculations based on average consumption of 200 KWh a month.
na = not applicable because the value is negative.
Note: Collection rates are held constant.
a. Illustratute calculation: 185 KWh = 200 KWh – (0.50 x 0.15 x 200 KWh).

hold is better able to adjust to new relative prices of fuels and switch tocheaper electricity substitutes over a longer time period.
A realistic short-run scenario is that with a 200 percent tariff increasethe elasticity is low; an informed estimate would be –0.15. At this elas-ticity, a 200 percent tariff increase will result in a fall in consumptionfrom 200 KWh to about 140 KWh a month, a drop of 30 percent. So,all else equal, this analysis suggests that increasing the tariff by 200 per-cent to full cost-recovery levels would cause metered consumption ofelectricity for households with a 24-hour supply of electricity to fall toclose to basic minimum needs.
Household Electricity Demand Model This sensitivity analysis shows how the impact of a tariff increase dependson the price elasticity of demand. To produce a more reliable assessmentof how household consumption and welfare will respond to pricechanges, the study created a household electricity demand model. Themodel was estimated by pooling household data sets and utility billingand payment records from capital cities of Armenia, Azerbaijan, Georgia,and Moldova.
In the model, which applies to urban households with meters, house-hold electricity consumption depends on the tariff, household income,the household’s access to substitute energy sources (natural gas, centralheating, or liquefied petroleum gas [LPG]) and other household charac-teristics. Other important factors include location, daily temperature,and cross-country differences, such as economic growth and inflation.The model was estimated using multivariate regression techniques. Withthis type of modeling exercise the results are usually more reliable forsmall price changes than for large changes.12 The model fits the data welland produces plausible results, providing a reasonably reliable basis onwhich to estimate the impact of tariff increases in Azerbaijan.
According to the model, a 10 percent increase in the price of electric-ity results in a 2 percent decrease in household electricity consumption—making the price elasticity of energy demand –0.20. This is very close to–0.15, the lower range of the sensitivity analysis presented earlier, and isalso reasonably consistent with the studies that have estimated residentialelectricity demand in other parts of the world.13
Consistent with expectations, the model indicates use of central gasand LPG are negatively correlated with electricity consumption. Alsoas expected, increasing the collection rate (more enforcement) wasnegatively correlated with consumption. The model can predict changes
Timing and Sequencing of Raising Rates—Azerbaijan 115

in consumption under different tariff scenarios based on the – 0.20elasticity.
This model provides the income elasticity of electricity consumption.It indicates that a 10 percent increase in income will produce a 1.2 per-cent increase in consumption of electricity, so the income elasticity ofelectricity consumption is 0.12. The significance of this finding is clear:future household income growth will help offset the blow of a tariffincrease, and incomes in Azerbaijan are expected to grow rapidly in thenext few years; an increase in the minimum wage is being contemplatedand civil servant wages were recently increased 50 percent.Therefore, cal-culating the negative impact of tariff increases on consumption and wel-fare levels without taking into account the positive impact from changesin income is the worst-case scenario.
Assuming current income of US$158 per household a month and aprice elasticity of demand of –0.20, under a variety of tariff scenarios—inthis case, increases of 50 percent, 100 percent, and 200 percent—incomegrowth of 10 percent will keep the share of income for electricity around4 percent (table 7.5). Depending on how quickly incomes grow and,more important, how growth is distributed between the poor and non-poor, this will bring shares of income for electricity in Azerbaijan closerto the level in other transition countries. Surprisingly, model testingrevealed no plausible significant differences in the price and income elas-ticity of demand for the poor and nonpoor.
116 Lampietti, Banerjee, and Branczik
Table 7.5. Rising Income Will Offset the Blow of Tariff Increases on Baku Households’
Budget Shares
(percent)
Share of income on electricity
Household income Household income Household income
Tariff growth at 0 percent growth at 5 percent growth at 10 percent
Current tariff 2.5a 2.4 2.3
(manat 96)
50 percent increase 3.3 3.2 3.0
(manat 144)
100 percent increase 4.0 3.8 3.6
(manat 192)
200 percent increase 4.5 4.3 4.1
(manat 288)
Source: Authors’calculations based on average consumption of 200 KWh a month and price elasticity of demand
of –0.20.
a. Illustrative calculation: 2.5 percent = (200 KWh x $0.02) / $158 a month.

The empirical data on the impact of different tariff increases on house-hold electricity consumption are an important input into policy makingbecause they offer a reliable measure of how much worse off householdswill be if different policy options are taken. They also suggest that small,gradual tariff increases rather than abrupt, large ones will soften the blowto household income, since this will allow time for income growth tooffset the increase in electricity prices.
How Much Households Need to Be Compensated The study also calculated the income loss from a tariff change using linearapproximation. The maximum, or upper bound, of this loss is the addi-tional amount of money that the consumer would have to pay after thetariff increase if electricity consumption is held constant. This assumeszero price elasticity of demand. The minimum, or lower bound, is theadditional amount of money that the consumer would have to pay at thenew tariff if their electricity consumption falls in response to higher prices,assuming the price elasticity of –0.2 calculated in the demand model.
If consumption before the tariff increase was 200 KWh—and assum-ing 100 percent collections—then the upper bound on the income lossfrom a 50 percent tariff increase would be manat 9,600 (US$1.95) permonth, and the lower bound manat 8,640 (US$1.76).14 So, the averagewelfare loss in dollar terms from a 50 percent tariff increase in Bakuwould be close to US$2 per household per month. This is the amount ofmoney that would have to be given to a household to make it no worseoff than it was before the tariff increase. The study made this calculationunder various tariff scenarios, including a 200 percent increase to cost-recovery levels (table 7.6).
Timing and Sequencing of Raising Rates—Azerbaijan 117
Table 7.6. Household Consumption and Income Loss under Alternative Tariff
Scenarios
(elasticity is –0.2)
Electricity Maximum Minimum
Percent increase Tariff Tariff consumption income loss income loss
in tariff (manat) (dollars) (KWh) (dollars per month) (dollars per month)
0 96 0.02 200 0 0
50 144 0.03 180 2.0 1.8
100 192 0.04 160 3.9 3.1
150 240 0.05 140 5.9 4.1
200 288 0.06 120 7.8 4.7
Note: Income loss calculated to one decimal place. Authors’calculations.

Differences between the Poor and Nonpoor Calculating the effect of a tariff increase is complicated by lower collec-tions for the poorest 20 percent of households than for the richest. Thismeans that the poor are more vulnerable than the nonpoor when risingcollections are taken into account; they face a bigger effective tariffincrease than the nonpoor if collections are uniformly enforced. Thisimplies that the poor require slightly more compensation than the non-poor if tariffs and collections increase simultaneously. For example, anominal 50 percent tariff increase to manat 144 per KWh, and enforce-ment of this tariff, will result in a higher effective increase for lower quin-tiles than for the higher quintiles. In this situation, to maintain constantwelfare levels, the poor require around US$3 a month, whereas the non-poor require closer to US$2.50 a month (table 7.7).
As in the previous studies, understanding who accumulates arrearshas important implications for the welfare effect of reforms. Becausemainly the poor accumulate arrears in Azerbaijan, affordability is a prob-lem and special care must be taken by the state to provide adequateassistance to them.
Availability of Substitutes Households without access to gas or wood in the capital towns of Rayonsand rural areas may be particularly vulnerable to tariff increases. Thereare no good substitutes for electricity for lighting, refrigeration, andtelevision. However, wood, kerosene, LPG, and gas, if available, are viablesubstitutes for electricity in heating and cooking. Households that donot have access to these alternatives will have the greatest difficulty in
118 Lampietti, Banerjee, and Branczik
Table 7.7. Compensation for the Poor in Baku Should Be Higher
Current Predicted Minimum Maximum
Current consumption Tariff consumption loss loss
Welfare effective (KWh) per tariff b (KWh) per (dollars per (dollars per
quintiles tariff a month) (manat) month) month) month)
1 (poorest) 62 190 82 140 2.3 3.2
2 59 202 85 144 2.5 3.5
3 71 192 73 153 2.3 2.9
4 65 201 79 152 2.5 3.2
5 (richest) 78 200 66 166 2.2 2.7
Source: Authors’ calculations assuming elasticity of –0.20.
a. Collection rate x manat 96.
b. manat 144 – effective tariff.

shifting their energy consumption to less expensive fuels, making themmore vulnerable to tariff increases.
Dividing households around the country into groups based on loca-tion and access to gas and wood revealed that typical electricity con-sumption was significantly higher (600–700 KWh per month) amonghouseholds in “other urban” and “rural” areas that did not have access togas or wood (table 7.8). In these areas, very high percentages of house-holds reported heating only with electricity. These households will beparticularly vulnerable to tariff increases, especially if there are noimprovements in service quality.
How to Mitigate the Impact of Tariff Increases
Increase Tariffs Gradually Future household income growth will help offset the burden of a tariffincrease, particularly if tariffs increase gradually. A gradual increase willsoften the blow to household income, since price elasticity is likely to begreater in the long run than in the short run.
Link Tariff Increases to Service Quality Experience shows that opposition to tariff increases can be avoided byexplicitly linking tariffs to improved service quality. Raising tariffs andenforcing disconnections is unpopular, and the public often views stateactions in this sector with skepticism. Consumers are especially skepti-cal when tariffs increase without any improvement in the quality ofservice because the costs (higher tariffs) come before consumers see the
Timing and Sequencing of Raising Rates—Azerbaijan 119
Table 7.8. Households with Less Access to Substitutes Consume More Electricity
Electricity Households heating
Access to Access (KWh per) with electricity Hours of
Location gas to wood month) (percent) winter supply
Baku Yes No 246 12 24
Other urban Yes No 403 19 16
Other urban Yes Yes 361 2 16
Other urban No No 713 76 12
Other urban No Yes 427 33 9
Rural Yes Yes 136 0 22
Rural No Yes 504 2 10
Rural No No 608 18 12
Source: 2003 Household Energy Survey.
gains (improved service). Qualitative evidence gained in focus groupsconfirmed that households were afraid that they would end up payingmore and still not receive sufficient supply of electricity. Investments inrehabilitation and maintenance of the infrastructure will help generatepopular support for the increases in enforcement and tariffs necessaryto finance such investments, especially outside Baku where servicequality is worse.
Improve Efficiency of Energy Use Households with access to few alternatives to electricity should be givenaccess to efficiency-increasing technology and appliances, less expensivefuels for cooking and heating, and household insulation.
Improve Access to Clean Substitutes Another option, if provided on a full cost-recovery basis, would be toencourage use of such clean and inexpensive substitutes for heating andcooking as natural gas. In Baku, 33 percent of households heated withelectricity, 12 percent only with electricity, and their average annualconsumption was 3,363 KWh.15 This was about 615 KWh per year morethan households that do not heat with electricity. Unless they can startheating with gas, they will require an additional US$5–$6 a year in com-pensation for a 50 percent tariff increase. Access to substitutes can beprovided through a variety of instruments, as long as the governmentexplicitly compensates the utility for any social transfers it provides.For example, the government could bid out competitive subsidies toencourage the extension of natural gas networks to poor neighborhoods.While the households would still have to pay the full cost of gas, thecost of bringing the network to them could be partly financed by thepublic sector.
Consider Lifeline Tariffs or Direct Transfers There is no easy answer when considering the tradeoffs between alterna-tive social protection strategies. The government can mitigate the welfareeffects of tariff increases by providing assistance to poor and vulnerablehouseholds and by stimulating income growth.16 In deciding betweenlifeline tariffs and targeted cash transfers, the Azerbaijani governmentneeds to consider such factors as the percentage of those living in pover-ty and the targeting effectiveness of social assistance schemes. Given theinfluence of location on poverty in Azerbaijan, a geographically targetedtransfer or lifeline tariff could be a highly effective and easily implemented
120 Lampietti, Banerjee, and Branczik

solution. Indeed, this solution would be worth further investigation bythe Azerbaijani government.
Outside Baku Clearly, better data are required on electricity consumption and substitu-tion behavior outside Baku before a definitive conclusion can be drawnon the magnitude of the impact. One solution would be to pilot meter-ing where households have little access to substitutes to observe actualelectricity consumption. These data could then be used to determine thebest mitigation strategy for such households.
Conclusion
Energy sector reform is highly sensitive for the Azerbaijani government,which fears opposition to tariff increases, particularly at critical times inthe presidential election cycle (the last presidential election was in late2003). It is also a sensitive topic for the donor community, which mustfind a way to manage the government’s opposition. As seen in chapter 6,misconceptions about the effects of reform can undermine the positiveeffects and threaten the sustainability of reform. And interviews with keyinformants within the government, business, media, and nongovernmentalorganizations revealed that though there was consensus on the need forreform (tariff reform, mitigating strategies, improved service, and privatesector participation), many stakeholders felt poorly informed and raisedconcerns about reform. Nonenergy enterprises and the general populationneed to be informed about the potential benefits of reform. Nonenergyenterprises were concerned about losing competitiveness because of high-er production cost from higher electricity tariffs. Households were afraidthey would end up paying more and still not receive a sufficient supply ofelectricity.
In such a context, the advantages of ex ante analysis for designingreform measures and mitigating actions are clear. In this case, the studyproduces several useful policy prescriptions, based on an empirical simu-lation of the welfare impact of reforms on stakeholders. These ex anteinsights arm the reforming government with powerful information on thefull set of policy choices available.
The qualitative data also provide valuable insights on attitudes towardreform. Perhaps most influential is the level of skepticism over tariffincreases and the promises of improved electricity supply. This insightunderlines the importance of linking tariff increases with improvements
Timing and Sequencing of Raising Rates—Azerbaijan 121
in service quality to enhance confidence in reforms. The study can help atargeted public information campaign address consumers’ concerns andbuild wide public support for the reform program.
More broadly, this study expands understanding of how tariff increas-es affect the poor. By using an electricity demand model it was able topredict the welfare impact of different tariff increases before they wereimplemented, providing a critical tool in evaluating different reformoptions. It suggests that small, gradual tariff increases are better than onelarge increase, because elasticity is greater in the long run and risingincomes help soften the blow.
Although future income growth will help offset effects of a tariffincrease, for a government trying to balance sector sustainability withpolitical sustainability of reform efforts, gradual tariff increases will be fareasier for the adjustment of low-income households. People have moretime to switch to substitutes and become better off as incomes rise. Thisapproach offers an alternative to the view proposed in the early 1990s:that reform must be undertaken swiftly to be successful. It also comeswith a significant caveat; countries poorer than Azerbaijan may not beable to wait before introducing cost recovery to their utilities. But forcountries like Azerbaijan, which can afford to adjust more slowly, andwhere external advocates of reform enjoy a little less leverage, reliableinformation on the consequences of various options is a valuable inputinto policy debates.17
Notes
This chapter is based on World Bank 2004g.
1. This figure would be equal to the long-run marginal cost of a greenfield powerplant in the United States. More careful country-specific calculations haveshown that cost-recovery levels for Europe and Central Asia tend to be lower,highlighting the need for careful analysis of local conditions prior to reform.
2. Collections from metered households were significantly higher than generalcollection rates for urban and rural households, which were 50 percent and30 percent respectively. 2003 Energy Survey (nonrandom) merged by house-hold with 2003 Barmek and Bayva data (n = 2,000).
3. 2002 Household Budget Survey data merged by household with 2002Barmek data (n = 1,106).
4. 2003 Energy Survey (nonrandom) merged by household with 2003 Barmekdata (n = 443).
122 Lampietti, Banerjee, and Branczik

5. The lower figure is more reliable because it is based on a larger, more repre-sentative sample.
6. Moldova (5 percent), Georgia (5 percent), and Armenia (8 percent).
7. Not as much separation in the quintiles was observed as might be expectedbecause income is presented on a household, not a per capita, basis.
8. The Barmek service area is Baku and the Northeast, and Bayva covers every-thing else. Barmek records are for the month of November 2003 only.
9. These averages are over the 2,000 households in the 2003 Household EnergySurvey.
10. Foreign Investment Advisory Service (2002); World Bank (2003f).
11. The impact of relieving the rationing constraint—the positive effect ofincreasing electricity supply—cannot be assessed because the data on house-hold behavior outside of Baku are not reliable. In Baku, consumption levelsare based on actual consumption. The only data available on consumption inrationed areas are based on norms, not actual consumption.
12. A detailed description of the data and model is included in annex 4.
13. Because Azerbaijan started with a higher consumption level, consumptionwas initially more elastic. A change in tariff would result in a proportionatelyhigher fall in consumption compared to other countries where the initial baseconsumption was lower. This also means that the estimate of compensationlater on in the chapter is marginally higher than it would be otherwise.
14. Lower bound = manat 8,640 = (manat 144 – manat 96) � 180 KWh a month.Upper bound = manat 9,600 = (manat 144 – manat 96) � 200 KWh a month.
15. These figures come from the 2003 Energy Survey (see box 8.1).
16. See chapter 9 for discussion on this topic.
17. Since this study came out in late 2004, Azerbaijan has introduced a powersector reform project financed by the World Bank and has committed tobringing electricity tariffs to cost-recovery levels by 2010. The governmenthas also implemented sharp tariff increases in gas and water.
Timing and Sequencing of Raising Rates—Azerbaijan 123


A significant part of energy demand in Europe and Central Asia (ECA) isdetermined by a single characteristic: the region’s extremely cold winters.Without reliable heat provision during winter, all aspects of everyday lifeare affected. Households rely on energy to generate warmth for survival.Businesses rely on it to operate. Without heat, such public institutions asschools and hospitals are forced to close or operate at close to freezingtemperatures. Unless there is access to clean, affordable heating, the bur-den of heating expenditures becomes unsustainable, and households mustresort to substitutes (wood and coal) that carry substantial negative envi-ronmental and health externalities. The social, economic, and politicalramifications of inadequate heat supply make the responsibility of govern-ments critical. They also make ECA the only region where the WorldBank routinely lends for heating.1
With district heating systems deteriorating as power sector infrastruc-ture collapsed, reform programs focusing on district heat have been anintegral part of energy sector reform. But as with electricity sectorreforms, a radically changing environment of reduced incomes and disap-pearing state subsidies makes it vital to understand household demand for
C H A P T E R 8
Coping with the Cold: Heating
Strategies for the Urban Poor
125

heat and the impact of policies on the poor. Without this knowledge it isdifficult to design investments that are appropriate and effective in thelocal context. Using household level data, this chapter builds a picture ofdemand for this basic component of energy use, and then makes recom-mendations on appropriate interventions.
Inefficient District Heating Systems
In the 1950s, large, centralized district heating became the system ofchoice in most developed countries, including Eastern Europe andCentral Asia. It is generally considered the most comfortable, efficient,and environmentally friendly heating mode, particularly for densely pop-ulated areas. And it often has the potential of efficiently using the wasteheat recovered from combined heat and power (CHP) plants. In ECA,most residences in urban areas were connected to the system, unmeteredand for a nominal fee. Users had no influence over when and how muchheat was provided, but could be reasonably sure that it would be provid-ed, for free, as soon as outside temperatures dropped below 8° Celsius (C)for at least five days. Rooms would be heated to at least 20°C most of thetime and, lacking individual controls, consumers would respond to over-heating by opening windows.
Transition, rising energy prices, and economic collapse brought diffi-cult choices to governments trying to rationalize their budgets. Years ofneglect and lack of investment have led to inefficient district heating sys-tems, deteriorating service quality, and badly needed repairs. Experiencein restructuring Soviet-type district heating systems in Eastern Europehad shown that, through a combination of investments, institutionalimprovements, and sector reform, district heating systems could be mod-ernized to approach efficiency, cost, and service levels of WesternEurope.2 In the 1990s, international financial institutions, includingthe World Bank and the European Bank for Reconstruction andDevelopment, took an active role in funding rehabilitation investmentsfor district heating in many cities in the region. As part of these donor-funded projects, many governments in ECA reduced general subsidies forheat and raised prices for district heating.
In making people pay for heating, however, household demand becamean important consideration. As discussed in chapter 3, as prices increasedand incomes fell, there was a significant contraction in demand for energyin the region. The solutions that worked elsewhere were not fully applica-ble when devising heating solutions for households in extremely poor
126 Lampietti, Banerjee, and Branczik

Coping with the Cold 127
countries, particularly in small, rural towns.Though district heating can bethe most efficient system, lack of metering in old systems and high fixedcosts made it very difficult for customers to control expenditures, whichparticularly hurt the poor. And the absence of meters and the technicaland political difficulties of disconnecting nonpaying customers made italmost impossible to enforce payment.The net result was a low-level equi-librium trap where on one side, often due to political pressure, govern-ments continued to pump money into antiquated and failing district heat-ing systems. On the other side, consumers refused to pay their bills for aservice that used to be very low cost or free and kept deteriorating, or wastoo expensive, or provided more heat than they demanded.
With increasing evidence that the prevailing practice of rehabilitatingdistrict heating may not always be adequate, this study set out to shed lighton the demand for heat and to recommend new ways to provide the poor,particularly the urban poor, with access to clean, affordable heat. Studyinghow people heat themselves when left to their own devices providesinsights into how much energy they demand for heating and how muchthey are willing to pay for it. It also provides important information onwhat fuels they use as substitutes and what issues need to be addressed.
Box 8.1
Methodology and Data Sources—Heat Demand
Determining household demand for heat is difficult using a household budget sur-
vey (HBS). It requires being able to separate the demand for heat from nonheat
energy, which can be confusing because households consume a mix of fuels for a
variety of purposes. One household may use wood for heating and cooking in the
winter and LPG for cooking in the summer; another household may use electricity
for heating and gas for cooking in the winter and electricity for air conditioning and
gas for cooking in the summer. One approach to identifying heat consumption is
to use norms to net out basic needs, then study what is left over of expenditure.
But that approach obscures the variations in consumption and spending patterns
that are of interest.
To get around these problems, a new approach for estimating heat demand
was developed that exploits a natural experiment deriving from data collected in
Armenia, the Kyrgyz Republic, and Moldova, where deterioration of district heat-
ing has meant that it is no longer available for households in some neighbor-
hoods who must now use other means to heat themselves. The approach relies
(Continued)

128 Lampietti, Banerjee, and Branczik
on splitting the data into two subsamples. The first subsample consists of house-
holds that are connected to the central heating network and report that central
heating is their only source of heat. For this group, all noncentral heat energy con-
sumption will be for such nonheating purposes as lighting and cooking.
The second subsample is households that have no central heat and must rely
on other means for heat. Their energy consumption will include consumption for
heat and nonheat purposes. Comparing the total energy consumption (not in-
cluding central heat) of these two groups of households makes it possible to
isolate the energy used for heating of the second group. The data used for the
model is from a sample of urban households from Armenia, the Kyrgyz Republic,
and Moldova from 1999.a The results can be seen in box figure B8.1.
Armenia
0200400600800
1,0001,2001,400
0 500 1,000 1,500 2,000 2,500 3,000 3,500 4,000
household income per year
kgo
e p
er y
ear
(no
tin
clu
din
g c
entr
al h
eat)
central heat connectionno central heat connection
Heat consumption
Kyrgyz Republic
0500
1,0001,5002,0002,5003,0003,5004,000
0 500 1,000 1,500 2,000 2,500 3,000 3,500household income per year
kgo
e p
er y
ear
(no
tin
clu
din
g c
entr
al h
eat)
central heat connectionno central heat connection
Heat consumption
Moldova
0
1,000
2,000
3,000
4,000
0 1,000 2,000 3,000 4,000 5,000 6,000
household income per year
kgo
e p
er y
ear
(no
tin
clu
din
g c
entr
al h
eat)
central heat connectionno central heat connection
Heat consumption
Figure B8.1. Energy Consumption Scatterplots
(Continued)
Source: Authors’calculations.
Note: kgoe = kilograms of oil equivalent.
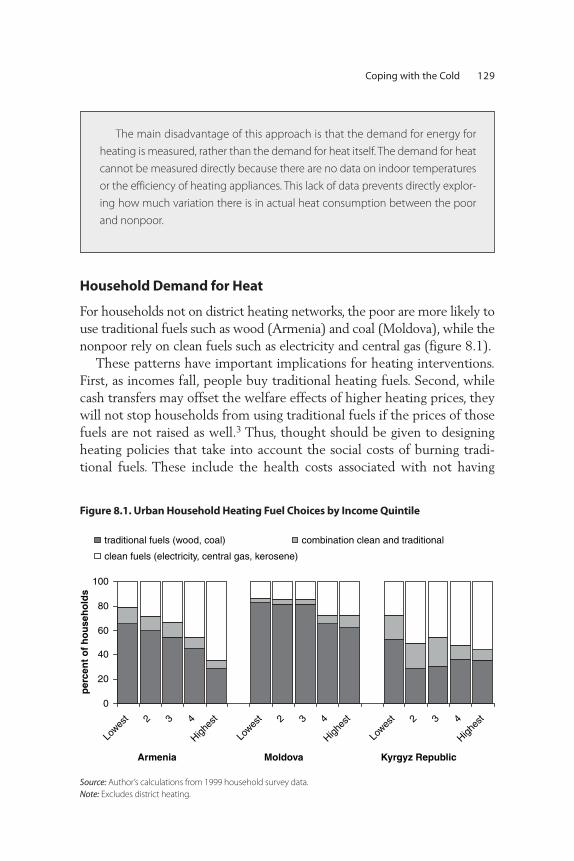
Coping with the Cold 129
Household Demand for Heat
For households not on district heating networks, the poor are more likely touse traditional fuels such as wood (Armenia) and coal (Moldova), while thenonpoor rely on clean fuels such as electricity and central gas (figure 8.1).
These patterns have important implications for heating interventions.First, as incomes fall, people buy traditional heating fuels. Second, whilecash transfers may offset the welfare effects of higher heating prices, theywill not stop households from using traditional fuels if the prices of thosefuels are not raised as well.3 Thus, thought should be given to designingheating policies that take into account the social costs of burning tradi-tional fuels. These include the health costs associated with not having
The main disadvantage of this approach is that the demand for energy for
heating is measured, rather than the demand for heat itself. The demand for heat
cannot be measured directly because there are no data on indoor temperatures
or the efficiency of heating appliances. This lack of data prevents directly explor-
ing how much variation there is in actual heat consumption between the poor
and nonpoor.
0
20
40
60
80
100
Lowes
t 2 3 4
Highes
t
Lowes
t 2 3 4
Highes
t
Lowes
t 2 3 4
Highes
t
per
cen
t o
f h
ou
seh
old
s
traditional fuels (wood, coal) combination clean and traditional
clean fuels (electricity, central gas, kerosene)
Armenia Kyrgyz RepublicMoldova
Figure 8.1. Urban Household Heating Fuel Choices by Income Quintile
Source: Author’s calculations from 1999 household survey data.
Note: Excludes district heating.

enough heat and the resulting productivity losses, the health costs associ-ated with burning traditional fuels, the environmental costs associatedwith deforestation, and the opportunity costs of time spent collectingheating material, especially wood.
Estimating the Demand for Heat The study estimated the income and price elasticity of demand for heatusing a heat demand function. This was derived by plotting predicted heatconsumption against price per kilogram of oil equivalent (kgoe) for threecountries, Armenia, the Kyrgyz Republic, and Moldova. A heat demandfunction is expected to be kinked. It slopes steeply around the minimumamount needed for survival, and then rapidly levels off as the quantity ofheat consumed goes from necessity to luxury. Identifying the location ofthis kink is important to understand how consumers respond to heatprices.At prices below the kink, demand is elastic and welfare losses result-ing from a price increase are small, since households can still respond tothe price rise by cutting consumption. At prices above the kink, demandis inelastic and welfare losses are large, because above this price householdshave already reduced consumption to basic minimum needs and cannotmake do with less even as prices increase further.
A scatter plot of predicted household heat consumption against priceper kgoe for Armenia, the Kyrgyz Republic, and Moldova suggests a func-tion of precisely this shape (figure 8.2). There is a steep downward slope
130 Lampietti, Banerjee, and Branczik
0
0.1
0.2
0.3
0.4
0.5
0.6
0.7
0 500 1,000 1,500 2,000
predicted kgoe per year consumed for heating
U.S
. do
llars
per
kg
oe
Armenia Kyrgyz Republic Moldova
Source: Authors’calculations.
Note: Excludes district heating.
Figure 8.2. Demand for Heat in Selected Countries

at prices above US$0.20 per kgoe (indicating the inelastic part of thedemand function), followed by a rapid flattening out. It appears thathouseholds alter their heating strategies quickly in response to pricechanges in the range of US$0.01–$0.20 per kgoe, below which pricedemand is elastic. For households without substitution opportunities, wel-fare losses will be greater when the price rises above US$0.20 per kgoe,the inelastic part of the curve. In these cases it will be particularly impor-tant to design policies that cushion the blow of energy price increases onthe poor.
This model suggests that the income elasticity of demand is between0.1 and 0.2, meaning that a 10 percent increase (decrease) in income willproduce a 1 percent increase (decrease) in energy consumption for heat-ing by the poor, and about a 2 percent increase (decrease) by the nonpoor.As expected, demand is less elastic for the poor than for the nonpoor.That the three data sets produce similar results and are consistent witheconomic theory increases confidence in the model.4
As expected, there is much greater variation in price response byincome group and country. Price elasticity is –0.4 in Armenia and –0.2 inthe Kyrgyz Republic and Moldova, meaning that a 10 percent increase inprice will produce about a 4 percent decrease in consumption in Armeniacompared with about 2 percent in the Kyrgyz Republic and Moldova. InArmenia and Moldova, the poor are less price elastic than the nonpoor.That the poor are less income and price elastic than the nonpoor suggeststhat they will have greater welfare losses from price increases unless theycan find less-expensive substitutes.
Although the elasticity and the point at which demand becomesinelastic will vary by country, this analysis provides policy guidance on theprice above which consumer welfare begins to drop quickly and comple-mentary interventions to address this drop may be needed.
Household Heat Consumption Household heat consumption was estimated using the above model, andthe results on a per capita basis are presented in figure 8.3.5 The figurereveals variations in household heat consumption.6 In Armenia and theKyrgyz Republic, the poor consume less heat per capita than do the non-poor.7 The results are confounded by larger low-income household size,complicating the design of pro-poor heating tariffs such as lifelines, whichare based on a minimum consumption level per household.
Annual nonheat energy consumption ranges from 50 kgoe per capitain Armenia to about 125 kgoe in the Kyrgyz Republic. Annual predicted
Coping with the Cold 131

heat consumption ranges from 40 kgoe per capita in Armenia to 175 kgoein Moldova to 180 kgoe in the Kyrgyz Republic. Thus heat consumptionaccounts for 40–60 percent of total energy consumption. Differencesacross countries are driven by differences in climate and energy pricingpolicies. The average temperature during the heating season is highest inArmenia (2.6°C), followed by Moldova (0.6°C) and the Kyrgyz Republic(–2.9°C). Energy prices are highest in Armenia, followed closely byMoldova, and are substantially lower in the Kyrgyz Republic.
Household Heat Expenditure To calculate heating expenditures, the study multiplied the predictedheat consumption by the price of a household’s primary heating fuel,which was obtained from the survey. These calculations indicate thatheating accounts for 5–10 percent of household spending and for 20–40percent of energy spending. On average, the poor spend almost twice asmuch of their household budgets on heating as do the nonpoor (figure8.4). In absolute terms, poor households spend US$25–$40 a year onheating and nonpoor households spend US$30–$50 a year.
These findings are important for three reasons. First, the fact that poorhouseholds spend a larger share of their budgets on heating suggests thatit is possible to design a heating subsidy that benefits the poor more thanthe nonpoor. Second, that heat is a large share of energy spending suggestshigher heating prices will considerably reduce household welfare unlessinexpensive substitutes are available. Third, poor people are unlikely to
132 Lampietti, Banerjee, and Branczik
0 100 200 300 400
Kyrgyz Republic nonpoor
Kyrgyz Republic poor
Moldova nonpoor
Moldova poor
Armenia nonpoor
Armenia poor
kgoe per year
predicted nonheat
predicted heat
Source: Authors’calculations
Note: Excludes households on district heat.
Figure 8.3. Predicted per Capita Heat and Nonheat Energy Consumption in Selected
Countries

pay for heating systems that cost more than US$25–$40 per year becausethey can find less expensive ways to heat themselves (they might, how-ever, be willing to pay slightly more for heating systems that are substan-tially more convenient).
Though we do not have data on actual heat consumption, the findingsfrom this methodology for estimating heat demand are backed up by HBSdata. In a survey, Armenian apartment dwellers were asked to estimatetheir previous year’s spending on heating and their average indoor tem-perature during the heating season. Self-reported spending ranged fromUS$10–$20 a year, the same order of magnitude as the model results.Also, poor households with full control of their heating keep their apart-ments at lower temperatures and spend less than households on the dis-trict heating network.This finding backs up the central finding of our heatdemand model: district heating designed based on a norm of 28°C pro-vides more heat than consumers demand or are willing to pay for.
Rethinking Heat Supply
An understanding of heat demand is essential to designing suitable strate-gies for supplying heat. Before the transition, consumers connected tocentral heating in ECA expected that every room in their living quarterswould be heated to about 20°C for 24 hours during the official heating
Coping with the Cold 133
0
2
4
6
8
10
12
Armenia Kyrgyz Republic Moldova
per
cen
t o
f to
tal i
nco
me
on
hea
t
poor nonpoor
Source: Authors’calculations.
Note: Excludes households on district heat.
Figure 8.4. Predicted Heat Expenditure as a Percentage of Household Expenditures

season. Under such conditions, and with high population density, theheating system that provides heat at the lowest cost is district heatingsupplied from cogeneration plants.8
But many poor urban households consume less heat and have lowerheat expenditures than usually associated with a district heating system.Lower household heat demand is manifested in lower supply tempera-tures, shorter heating seasons, and less area heated.
This section compares typical costs of various heat supply options fortwo levels of heat demand: full service, meaning provision of about 18°Cin all rooms of a dwelling,9 and reduced service, meaning a lower temper-ature in one or several rooms. Full service is the demand that is assumedwhen district heat is supplied; reduced service is a closer approximationof the actual demand revealed by the analysis above.
The heat supply options compared range from highly centralized dis-trict heating networks, fed by cogeneration plants or heat-only boilers, tobuilding boilers that supply only one or a few buildings with heat, todecentralized (individual) heating where each dwelling has its own heatsource. Each of these heating options can be based on a wide range of fuelsand come with very different levels of efficiency and environmental per-formance. The costs of these options at the different levels are then com-pared with typical household expenditure levels. This yields conclusionsabout how to implement financially and environmentally sustainable andaffordable heating strategies that take into account the fixed and variablecosts and investment requirements of various heat supply options.
The Cost of Full Service The costs of modernized district heating systems in countries and citieshave been well researched during the preparation of feasibility studies.The resulting costs per unit of heat delivered at the building entranceusually fall within a fairly similar range of US$0.20–$0.35 per kgoe, lead-ing to annual household heating bills of US$200–$900, depending ondwelling size, specific heat consumption, and heat tariff level.
How does this figure compare with the costs of other heating optionsfor full service? Though these figures are less well known in the region,recent studies from Armenia suggest these options cost between US$135and $324 a year for full heat service (figure 8.5). There is a large variationnot only in the annual costs but in the capital (fixed) and fuel (variable)costs of different options, with natural gas having high investment costsand low fuel cost, while the opposite is true for heating based on electric-ity, kerosene, liquefied petroleum gas (LPG), and wood.10
134 Lampietti, Banerjee, and Branczik

The Cost of Reduced ServiceWhat are the costs of these different options for reduced service supply?Although district heating systems can be the most convenient and cost-effective heating mode given a heavy heat load, their high fixed costsmake them expensive for consumers demanding less heat. Only for thosehouseholds not on the network would reduced heat consumption resultin lower heat bills. Those still connected to district heating experiencedrising heat tariffs and higher expenditures despite declining service levels.This is because when heat supply companies lose customers, the old partsof their district heating systems do not permit heat not consumed in oneplace to materialize as fuel savings at the heat generation plant.
This characteristic means that utilities are typically not able to reducecosts in the short to medium term in proportion to the decline indemand. Typically, district heating systems can only be adapted to alower heat load in the medium to long term with replacement invest-ment and modernization of the system configuration. In the interim, theremaining customers have to bear even higher costs. In Bulgaria, thisvicious circle could be observed in 1996–99. Since then, customers haveslowly started to reconnect because of efforts to meter heat consumptionand bill customers accordingly.
Coping with the Cold 135
0
50
100
150
200
250
300
350
com
bined h
eat and
power plant
large h
eat-only
boiler
small h
eat-only
boiler
block
boile
r,
natura
l gas
industr
ial
electric
stove
industr
ial natu
ral
gas sto
veso
lid fu
el
stove
LPG stove
kerose
ne
stove
do
llars
per
ho
use
ho
ld
different heating options
fuel
operation and maintenance
capital
More centralized less centralized
Source: Based on COWI (2002a).
Note: The calculations are based on a comfort level of 17oC and 110 heating days.
Figure 8.5. Annual Costs of Different Heating Options for Full Heat Service in
Yerevan, Armenia

More flexible options such as individual heat technologies, for whichfuel accounts for a larger share of total costs and which are modular, aremuch easier to adapt to the lower heat demand demonstrated and aremore cost-effective with reduced demand. With electrical heating, forexample, fuel accounts for about 85 percent of total costs (figure 8.6).Therefore, while electrical heating has a high unit cost, it may be lessexpensive for the household to heat with because it is more flexible.11
This suggests that district heating is inefficient and inappropriate formeeting new heating demand patterns. Centralized options are cheaperthan electric heating or wood stoves when providing full heat service, butindividual options are less expensive than centralized options for reducedservice because they tend to be modular (figure 8.7).
In some cases, district heating may remain the most appropriate option.There are compelling factors favoring maintenance of carefully plannedand affordable district heating systems in countries with relatively mod-ern CHP plants that are needed for the power system, such as Moldovaand the Kyrgyz Republic.12 In densely built urban environments, individ-ual heating is usually more expensive than any form of central heating atfull service levels and can have negative environmental impacts, including
136 Lampietti, Banerjee, and Branczik
0
10
20
30
40
50
60
70
80
90
100
com
bined h
eat and
power plant
large h
eat-only
boiler
small h
eat-only
boiler
block
boile
r,
natura
l gas
industr
ial elect
ric
stove
industr
ial natu
ral
gas sto
ve solid
fuel
stove
LPG stove
kerose
ne
stove
per
cen
t
survival (low demand)
consolidation (high demand)
Source: COWI (2002a).
Figure 8.6. Fuel Costs as a Share of Total Heat Costs for Different Heat Supply Options
and Demand Levels, Yerevan, Armenia

air pollution and deforestation. In cities where incomes are growing,investments in high efficiency and environmentally benign centralizedheating may be justified. If governments choose to invest in centralizedoptions for heating, though, consumers must be able to choose from arange of heating levels with corresponding payment levels so that they areas flexible as individual heating options.
If incomes and heat demand are expected to remain low for the fore-seeable future, even a modern, flexible system with lower costs will beunaffordable for many families. In many of the small towns of ECA, dis-trict heating systems are in dire need of renovation, with investmentrequirements beyond the means of these towns. And the high fixed costsof centralized heating systems make them relatively slow to react to a het-erogeneous heat demand. In these cases, the best strategy for investmentsin heating technology are individual systems at the building or apartmentlevel, which may be least cost. If individual options are chosen, moreinvestments are needed in clean and efficient technology to lessen thesocial costs of traditional fuels.13
Other Policies Whether individual or centralized heating options are chosen, metering andcontrol options are vital so users can choose levels of heat and spending.All
Coping with the Cold 137
0
50
100
150
200
250
300
350
com
bined h
eat and
power plant
large h
eat-only
boiler
small h
eat-only
boiler
block
boile
r,
natura
l gas
industr
ial elect
ric
stove
industr
ial natu
ral
gas sto
ve solid
fuel
stove
LPG stove
kerose
ne
stove
do
llars
per
flat
a y
ear
survival (low demand)
consolidation (high demand)
Source: COWI (2002a).
Note: Percentage of population purchasing heating services at different prices: 80 percent at $50 a year, 60 percent
at $70 a year, 40 percent at $100 a year.
Figure 8.7. Average Cost of Heating for High and Low Demand, Yerevan, Armenia
centrally provided heat supply options can be fitted with meters and con-trol options that make the systems more flexible. Whether and how muchconsumers can actually save depends on the level of over- or underheatingand the relationship between the system’s fixed and variable costs. Ingeneral, individual metering and control can save 15–20 percent of heatenergy. In some countries where individual meters are not yet in place, acrude approximation of a flexible district heating system has been used.Consumers are allowed to disconnect some of their radiators, and paymentis based on the number of radiators in use.
Better insulation of buildings is also necessary to lower the amount ofheating required to achieve a minimum comfort level. Most buildings inthe region use two to three times as much heat as buildings in compara-ble climates in Western Europe. However, beyond such basic solutions asfixing broken windows, repair measures can be expensive, typically taking5–10 years to pay back investments with lower bills.
Conclusion
With socialist-era heating systems in need of repair, new investments arebeing considered for heating projects across the region. But transition,reform of the power sector, rising prices, and falling incomes have pro-duced the greatest change in demand for heat since the Soviet era. Beforemaking the considerable investments required to rehabilitate districtheating systems, it is important to measure the demand for heat againstthe supply options offered by this and other systems.
On average, the poor spend almost twice as much of their householdbudgets on heating as do the nonpoor, and they are less income and priceelastic than the nonpoor. It should be possible to design a heating subsidythat will benefit the poor more than the nonpoor. But here is the problemoften faced with tariff-based subsidies: access. While access to electricity isalmost universal in ECA, access to network heating is greater among thenonpoor. Because they have greater access to clean energy networks, thenonpoor will capture the bulk of any subsidy passed through the network,unless the access rate of the poor increases.
But the analysis suggests that extending access to centralized networkheating systems may not be appropriate for poor households. The datafrom Armenia, the Kyrgyz Republic, and Moldova suggest that, unlessthere are significant improvements in heat quality, poor people areunlikely to pay for heating systems costing more than US$25–$40 a yearbecause they can find less expensive ways to heat themselves.This implies
138 Lampietti, Banerjee, and Branczik

that district heating may be a redundant option for many places and othermeasures are needed to assist the poor with heating.
The study also highlights the importance of focusing on heating sub-stitutes, generally traditional fuels for the poor. Social costs associatedwith their use may warrant public intervention, either through increasingincomes or reducing the relative cost of clean fuels through subsidies orinvestments in efficiency.
The findings in this chapter provide important insights into designingpro-poor heat investments and policies to promote clean choices for theurban poor, depending on local conditions.With its focus on Armenia, thisstudy fed directly into the design of a World Bank urban heating projectthere; the finding that even flexible and efficient district heat is unafford-able for the majority of Armenia’s poor effectively ruled out a large-scaleinvestment in district heating system rehabilitation.14
The focus is now on decentralized options. In situations with very dif-ferent conditions, for example, countries without access to gas, with CHPplants that are indispensable for the power sector, or where it is signifi-cantly colder, the policy prescription may be different. And rethinkingheat supply must be accompanied by policies to help consumers controltheir heat consumption and spending (chapter 8). But the implications ofthis study are wide reaching and highlight the importance of understand-ing household demand when designing any heating intervention.
Notes
This chapter is based on Lampietti and Meyer 2002.
1. Of 140 infrastructure projects under preparation or implementation in ECA,20 are either for heat rehabilitation or have a heat component. China has seena small number of heating projects.
2. Particularly Poland and the Baltics. In the Estonia District Heating Projectconsiderable energy efficiency improvements were achieved: “The Projecthas made efficiency gains in the areas of heat production, transmission,distribution, and consumption. In the production process, the specific fuelconsumption has been reduced by an estimated 5–10 percent, on average.The renovation of the transmission and distribution networks and installationof variable speed pumps has led to significant energy savings, again estimatedin the order of up to 10 percent heat and pumping losses. Very dramaticreductions in water losses have also been achieved through the switch fromdirect to indirect domestic hot water connections, amounting to a decreaseof over 85 percent in Tallinn, of almost 90 percent in Tartu, and over 90 percentin Parnu. The heat consumption in buildings equipped with renovated
Coping with the Cold 139
substations has been estimated to have been reduced by about 24 percent,on average,” (World Bank 2000d, p. 7).
3. Direct cash transfers are discussed in chapter 9.
4. This is in contrast to the energy demand model presented in chapter 3. Forenergy, income elasticity is higher for the poor than for the nonpoor. For heat,the income elasticity of the poor is lower than for the nonpoor.
5. The consumption and expenditure results here are not identical to those inthe previous section on household energy demand because the analysis in thissection focuses only on a subsample of urban households for which heatinginformation is available.
6. While heat is a public good at the household level, larger (poor) householdstend to consume more energy than smaller (nonpoor) households. There areon average two more people in poor than in nonpoor households. Also, thereis not much differentiation in living area because commercial real estate mar-kets are not well developed in the sample countries.
7. In Moldova, the difference is not statistically significant at the 5 percent level.
8. Comparative studies (“heat plans”) have been carried out in many cities inEastern and Western Europe confirming this result for greenfield develop-ment as well as for modernization of existing district heating systems.
9. The effective indoor temperature would be 20°C, considering 2°C addition-al from appliances and body temperature.
10. For all heating options represented in figure 8.5, investments have beenincluded to ensure that the equipment would be functional over a lifetime of20 years. As a result, the costs per apartment are lowest for wood stoves,building-based natural gas boilers, and apartment-based natural gas heaters.But the current natural gas tariff for small consumers is only about 17 percenthigher than that for large customers, and so does not reflect the higher distri-bution costs. The analysis is based on a cash-flow methodology, where allfuture cash flows are discounted by a discount factor of 10 percent a year.
11. In many countries of the region, however, the already overburdened electricaldistribution network would have to be strengthened to cope with additionalheat loads. This strengthening would cause additional investments, reflectedin higher electricity tariffs.
12. Parts of the centrally supplied district heating system that are not economic tosupply must be shut down. Minimum investment plans to make heat supplyand consumption more efficient must be devised. Financing sources must beidentified.And management and institutional measures to make the remainingleast-cost district heating systems viable both for producers and consumersmust be identified, which requires rebalancing tariffs between electricity andheat and commercializing the utilities. For details, see Swedpower/FVB (2001)and COWI A/S (2002b).
140 Lampietti, Banerjee, and Branczik

13. In Georgia and Mongolia, improved stoves for wood and coal have beendeveloped and commercially distributed. These stoves use much less fuel,burn much cleaner, and do not cost much more than a regular, inefficientstove. For Mongolia, see ESMAP (2001).
14. World Bank (2005b), p. 6.
Coping with the Cold 141


P A R T 3
Lessons

The social and political effects of improving utility cost recovery can pro-duce considerable skepticism from stakeholders—as seen with electricitysector reforms in Armenia, Azerbaijan, Georgia, and Moldova. A sensitiveand well-considered approach to designing policy can thus make a crucialdifference to the sustainability of utility reforms.This chapter looks at theprobable effects of electricity reform in 17 countries in the region that areat different stages of reform. By understanding how household behaviorwill change in response to tariff increases, informed judgments can bemade on what strategies and policies are most likely to be effective in mit-igating the welfare losses from reform and how to encourage the poor tomake clean fuel choices.
Simulating the Impact of Tariff Reforms
Household data can be used to simulate the potential effect of raising tar-iffs to cost-recovery levels.1 As with the Azerbaijan chapter, such simula-tions require information about the price elasticity of demand to estimateconsumption following a tariff increase. But empirical estimates of price
C H A P T E R 9
Implications for Operational Design
145
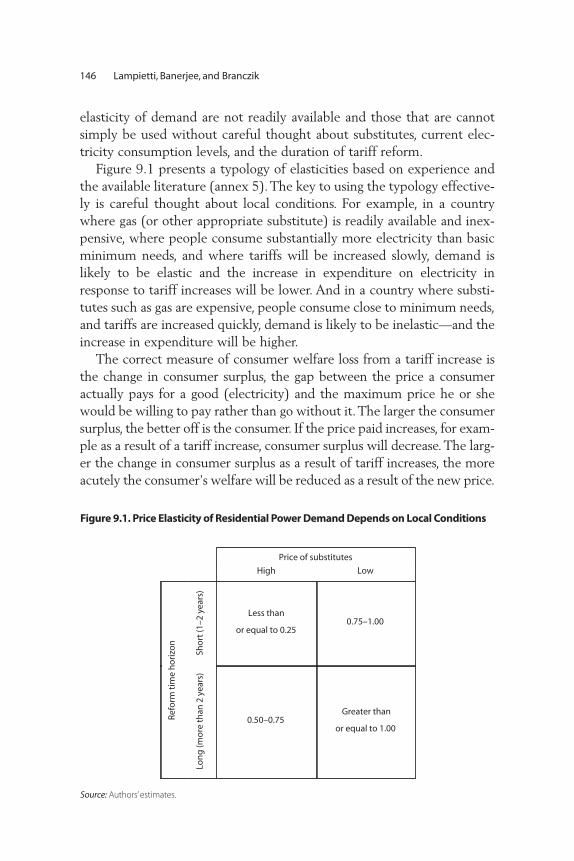
elasticity of demand are not readily available and those that are cannotsimply be used without careful thought about substitutes, current elec-tricity consumption levels, and the duration of tariff reform.
Figure 9.1 presents a typology of elasticities based on experience andthe available literature (annex 5). The key to using the typology effective-ly is careful thought about local conditions. For example, in a countrywhere gas (or other appropriate substitute) is readily available and inex-pensive, where people consume substantially more electricity than basicminimum needs, and where tariffs will be increased slowly, demand islikely to be elastic and the increase in expenditure on electricity inresponse to tariff increases will be lower. And in a country where substi-tutes such as gas are expensive, people consume close to minimum needs,and tariffs are increased quickly, demand is likely to be inelastic—and theincrease in expenditure will be higher.
The correct measure of consumer welfare loss from a tariff increase isthe change in consumer surplus, the gap between the price a consumeractually pays for a good (electricity) and the maximum price he or shewould be willing to pay rather than go without it.The larger the consumersurplus, the better off is the consumer. If the price paid increases, for exam-ple as a result of a tariff increase, consumer surplus will decrease. The larg-er the change in consumer surplus as a result of tariff increases, the moreacutely the consumer’s welfare will be reduced as a result of the new price.
146 Lampietti, Banerjee, and Branczik
Price of substitutes
High Low
Sho
rt (1
–2 y
ears
)
Less than
or equal to 0.250.75–1.00
Refo
rm t
ime
ho
rizo
n
Lon
g (m
ore
th
an 2
yea
rs)
0.50–0.75Greater than
or equal to 1.00
Figure 9.1. Price Elasticity of Residential Power Demand Depends on Local Conditions
Source: Authors’estimates.

Implications for Operational Design 147
Simulating the effect of tariff reform to cost-recovery levels revealsthat the change in consumer surplus varies depending on current share ofincome spent on electricity, the difference between the current tariffs andcost-recovery tariff, and the elasticity of demand (table 9.1). The greatestchanges in consumer surplus—the worst-affected consumers—can beseen in Armenia and Serbia. In all countries, the change in consumer sur-plus is greatest for the poor. Because the poor spend a larger share of theirincome on electricity, raising tariffs leads to a greater proportionate wel-fare loss for this group.
The simulation can also be used to identify the cash compensationthat would be needed each year to offset the impact of a tariff change(table 9.2). These figures suggest that without effective mitigation meas-ures, the impact of tariff increases may be enough to increase the numberof households living below the US$2.15 poverty line.2
Of course, as with the Azerbaijan study, calculating the impact of tariffincreases without taking into account the effects of rising incomes pro-duces a worst-case scenario. To calculate the income effect, information isneeded on how quickly incomes grow and, more importantly, howincome growth is distributed. Assuming there will be income growth,small, gradual tariff increases rather than abrupt, large ones will soften theblow to household welfare.
Table 9.1. Percentage Point Change in Consumer Surplus Following Electricity Tariff
Increase to Full Cost Recovery
Price elasticity e = –0.25 e = –0.50 e = –1
Lowest Highest Lowest Highest Lowest Highest
Country 20% 20% Total 20% 20% Total 20% 20% Total
Albania 5 3 4 4 3 4 3 2 3
Armenia 6 4 5 6 3 4 4 3 3
Azerbaijan 4 3 3 2 1 1 –2 –2 –2
Belarus 2 1 1 2 1 1 1 0 1
Bulgaria 3 3 3 3 3 3 3 2 3
Georgia 5 2 2 4 1 2 3 1 2
Kazakhstan 4 2 3 3 2 2 1 0 1
Moldova 3 2 2 3 2 2 2 1 2
Romania 1 1 1 1 1 1 1 1 1
Russia 4 2 3 2 1 1 –3 –1 –2
Serbia 10 6 8 8 5 6 3 2 3
Ukraine 4 2 3 3 2 2 1 0 0
Source: Authors’estimates from household budget survey (HBS).

The most important conclusion gained is that households with verylow electricity consumption will suffer higher welfare losses from tariffincreases because their demand is very inelastic. At the beginning of tran-sition there was scope for efficiency gains from lower consumptionbecause households in the region were traditionally energy intensive dueto low residential energy prices. But the move toward cost-recovery tar-iffs left little scope for further reductions in consumption, and if the priceof electricity increases further, high welfare losses will result.
Softening the Blow: Direct Transfers and Lifeline Tariffs
Quantifying the welfare impact of tariff increases does not imply thathouseholds should receive full monetary compensation for their welfarelosses. This is a choice that needs to be made by the country government,taking into account a multitude of factors that weigh in on this decision.Quantifying welfare impacts is a tool to illustrate to governments the pos-sible tradeoffs between efficiency and equity. Electricity reform is accom-panied in most cases by government measures to mitigate the welfareeffects of price increases through assistance to vulnerable households.This can be through direct transfers to help with electricity payments, oras a tariff-based subsidy, for example a lifeline tariff where an initial blockof electricity consumption, usually up to the minimum basic need, is sub-sidized by charging it at a much lower rate than subsequent consumption.
148 Lampietti, Banerjee, and Branczik
Table 9.2. Per Household Annual Cash Compensation to Offset Electricity Tariff
Change for a Range of Demand Elasticities
(dollars)
Country e = – 0.15 e = – 0.25 e = – 0.35 e = – 0.50 e = –1
Albania 108 103 98 90 65
Armenia 47 45 43 41 31
Azerbaijan 58 48 38 22 n.a.
Belarus 20 19 17 15 8
Bulgaria 71 70 69 67 61
Georgia 23 23 22 21 18
Kazakhstan 43 39 35 29 9
Moldova 12 12 12 11 10
Romania 11 11 11 11 11
Russia 59 48 36 20 n.a.
Serbia 207 190 173 148 64
Ukraine 36 32 29 23 4
Source: Authors’calculations.
n.a. = not applicable
Implications for Operational Design 149
The debate on the validity of direct income transfers versus tariff-basedsubsidies is one of the most contentious in utilities reform. But lessonsabout the region point to key considerations that can inform good policydecisions.
Ideally, any measures designed to cushion the blow from tariff increasesshould be well targeted to minimize costs for the government and notlead to price distortions that encourage inefficient resource use. Critics oftariff-based subsidies argue that they are expensive and socially regressive.Since they subsidize the first block of consumption for all consumers, theybenefit the poor and the nonpoor, and they encourage inefficient energyuse. Opponents of direct income transfers claim that payments throughthe general social assistance system, while theoretically attractive, fail toreach a large share of the poor because of inadequate targeting. In scoringsubsidy schemes against select criteria (coverage of the poor, targeting [theshare of the subsidy that goes to the poor], predictability of the benefit,price distorting and other side-effects, and the cost and difficulty ofadministration), Lovei and others (2000) found that instruments perform-ing well on some criteria performed poorly on others. Not all subsidymechanisms are applicable or perform equally well across all countriesand utility services, and no single instrument has been identified thatwould outperform all others.
Income transfers tend to be well targeted in countries with a smallpercentage of the population below the poverty line. In this case, as longas there are enough funds to finance the administration of social assis-tance and the informal sector is small, means testing is easy; examplesinclude Hungary and Poland. It is harder to produce well-targeted incometransfers in countries where nearly half the population is poor, budgetresources are insufficient, and means or proxy means testing is very diffi-cult because of a large informal sector.
A key problem in Europe and Central Asia (ECA) is that social pro-tection systems and energy-specific safety nets are not well correlatedwith poverty. In the past they were based on categorical privileges of thekind seen in the Moldova chapter. And reformulation of categories can bepolitically difficult, time consuming, and expensive. The amount of com-pensation is often subject to political exploitation. Improvements intargeting are being made, but this takes place over several years. In themeantime, direct transfers can be as wasteful as tariff-based subsidies, asseen in the Georgia study.
Furthermore, coverage of the poor is inversely related to the share ofthe subsidy that goes to the poor; the more households targeted by the
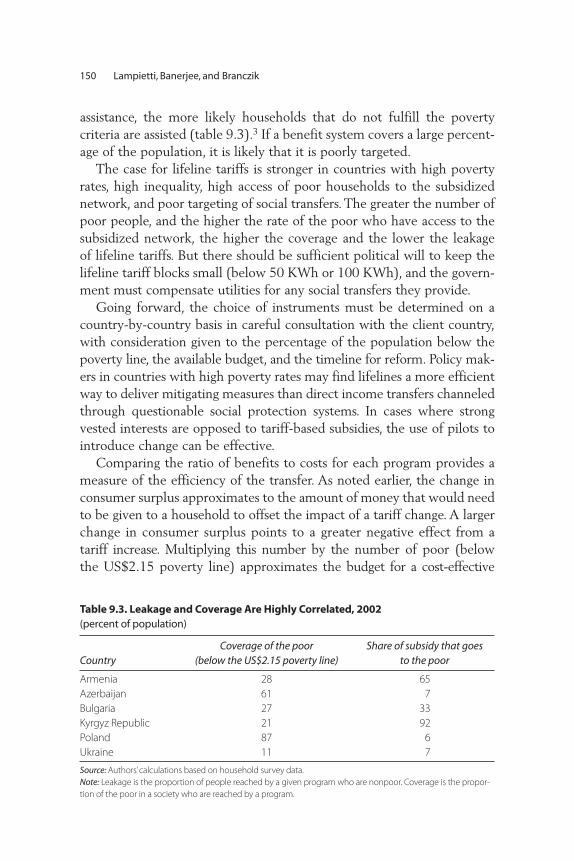
assistance, the more likely households that do not fulfill the povertycriteria are assisted (table 9.3).3 If a benefit system covers a large percent-age of the population, it is likely that it is poorly targeted.
The case for lifeline tariffs is stronger in countries with high povertyrates, high inequality, high access of poor households to the subsidizednetwork, and poor targeting of social transfers. The greater the number ofpoor people, and the higher the rate of the poor who have access to thesubsidized network, the higher the coverage and the lower the leakageof lifeline tariffs. But there should be sufficient political will to keep thelifeline tariff blocks small (below 50 KWh or 100 KWh), and the govern-ment must compensate utilities for any social transfers they provide.
Going forward, the choice of instruments must be determined on acountry-by-country basis in careful consultation with the client country,with consideration given to the percentage of the population below thepoverty line, the available budget, and the timeline for reform. Policy mak-ers in countries with high poverty rates may find lifelines a more efficientway to deliver mitigating measures than direct income transfers channeledthrough questionable social protection systems. In cases where strongvested interests are opposed to tariff-based subsidies, the use of pilots tointroduce change can be effective.
Comparing the ratio of benefits to costs for each program provides ameasure of the efficiency of the transfer. As noted earlier, the change inconsumer surplus approximates to the amount of money that would needto be given to a household to offset the impact of a tariff change. A largerchange in consumer surplus points to a greater negative effect from atariff increase. Multiplying this number by the number of poor (belowthe US$2.15 poverty line) approximates the budget for a cost-effective
150 Lampietti, Banerjee, and Branczik
Table 9.3. Leakage and Coverage Are Highly Correlated, 2002
(percent of population)
Coverage of the poor Share of subsidy that goes
Country (below the US$2.15 poverty line) to the poor
Armenia 28 65
Azerbaijan 61 7
Bulgaria 27 33
Kyrgyz Republic 21 92
Poland 87 6
Ukraine 11 7
Source: Authors’calculations based on household survey data.
Note: Leakage is the proportion of people reached by a given program who are nonpoor. Coverage is the propor-
tion of the poor in a society who are reached by a program.
mitigating program. Dividing this figure by the number of people bene-fiting from the lifeline and by the number receiving the direct incometransfer gives the average benefit per person (poor or not) for eachprogram. This figure will always be higher for income transfers, becausethe number of people receiving electricity is higher than the numberthat receive social protection assistance. For lifelines, as the incidence ofpoverty increases so does the efficiency of the lifeline.
Another key consideration is timing. While a poverty-targeted incometransfer is more efficient, it may take years to become operational. Thus,in the near term, the only feasible solution may be to channel compensa-tion through the existing social protection system. Ideally, tariff-based sub-sidies should not be phased out until targeting is significantly improved.
Other Considerations It is possible for lifelines to be self-funding. But this requires setting thetariff for the lower blocks below cost recovery and the higher blocksabove it, possibly resulting in inefficient resource consumption. It alsoplaces the burden of financing the subsidy on the utility and consumerswith higher consumption, rather than the government.
Alternatives to direct transfers and lifeline tariffs can be explored.4 Acommon objection to lifeline tariffs is that they are socially regressive andwasteful because they subsidize the first block of consumption of allconsumers, poor and nonpoor. A volume-differentiated tariff avoids thisproblem. It works by charging a lower tariff for households consumingless electricity than households consuming above a certain threshold level.Households consuming above this threshold level—which, according toHBS data, tend to be those on higher incomes—are charged a higher ratefor all their consumption. Thus nonpoor households are unlikely toreceive any of the subsidy.5 As with lifeline tariffs, appropriate measuresshould be taken to avoid incentives to game the system.
Any kind of tariff-based subsidy cannot work in the absence of meters.Many, but not all, countries in the region have good residential meteringfor electricity; lack of meters is more problematic in district heating, gas,and water. It is true that if lifelines are to be introduced in these othersectors—and there is a strong rationale for this—the cost and timerequired to introduce meters becomes a major challenge. But meters areimportant for other reasons too.Without meters it is impossible to measureor estimate the potential impact of tariffs on consumption and paymentpatterns; it is impossible to see whether direct transfer payments aretargeted at low consumption households and are at the right level; and
Implications for Operational Design 151

where there are no meters, and billing is based on average consumption,incentives to conserve are weak.
Where tariff-based subsidies are in use, it may be possible to reorienttheir design to maximize consumer welfare gains and minimize the cost tothe government budget, as was done with the simulation of an alternativesubsidy design aimed at households consuming within a certain margin inthe Georgia study.Another consideration is that using a price-based instru-ment can carry a positive externality if it encourages use of clean fuels. Asseen in chapter 8, if traditional fuels are significantly cheaper than cleanfuels, poor consumers may choose to spend direct transfers on consump-tion of traditional fuels that carry social and environmental costs.The poormust have access to network energy for the benefits of lifeline tariffs toreach them; if not, the bulk of energy subsidies will go to the nonpoor.
Other Pro-Poor Mitigating Measures
In addition to income transfers and lifelines, a number of other actionscan be taken to shield the poor from higher tariffs.
Explicitly Link Tariff Increases to Improvements in Service Quality As noted earlier, there could be a mismatch between the timing of thecosts (higher tariffs) and benefits (improved service quality) of tariffreform. In this case, the welfare loss from raising tariffs can be minimizedby explicitly linking tariff increases to improved service quality, particu-larly important for poor people who often suffer from the lowest qualityservice. It is also likely to generate more political will to support thereform.
But cost recovery is a requirement for the investments that will improveservice quality, so in most cases there is a time lag between higher tariffsand tangible improvements in service quality. The exceptions will becountries that can afford to time tariff increases on the basis of politicalconsiderations, such as Azerbaijan. In Georgia, this option was theoreti-cally possible and the utility attempted to use full services as an incentiveto pay bills, but the utility was unsuccessful due to political interference inelectricity dispatch.
It is often difficult to quantify service quality improvements. Limitedaggregate data suggest that service quality improved in a number ofcapital cities. But identifying any of the benefits of reform in the regionis confounded by changes in record keeping and accounting methods,by vested interests, and by private sector operators with few incentives
152 Lampietti, Banerjee, and Branczik
to report production efficiency gains. Data on service quality, even of avery basic nature, are seldom available. Measuring the number and loca-tion of blackouts over time, for example, and how dependent house-holds in blackout areas are on electricity (less in rural areas than in smalltowns), would provide a fairly straightforward way of measuring theimpact of return to 24-hour service. Other indicators that can be mon-itored to ensure better service quality include number of outages andfrequency and voltage stability.
Looking forward, World Bank operations can improve transparency andaccountability by emphasizing a systematic set of indicators in all sectoroperations and by disseminating this information to the public.A best prac-tice example is the Armenian Natural Monopoly Regulatory Commission,which discloses monthly power sector performance indicators on theInternet.6 A system of citizen feedback on service delivery, similar to thepublic services report cards used in the Philippines and India,7 can be insti-tuted.8 Such a mechanism can create a direct link between service qualityand tariff increases. Another good illustration is provided in the WorldBank’s World Development Report 2004: Making Services Work for PoorPeople, which focuses on how to make basic services—health, education,water, sanitation, and electricity—more accessible for the poor. The reportoutlines a system of accountability that connects consumers, government,and providers through four interrelationships: improving “client power” bymaking utility providers accountable to the poor, increasing the voice ofthe poor, improving compacts between policy makers and serviceproviders, and instituting better management procedures.
Raise Tariffs Slowly The shock therapy programs of the 1990s included sudden, radical increasesin tariffs. Sudden changes in tariffs require people to change their behaviorvery quickly, which is not always possible. Raising tariffs slowly minimizeswelfare losses by allowing consumers to adjust their consumption patterns,take advantage of income growth, and increase use of substitutes. But it isalso likely to have significant fiscal costs, especially if tariffs are well belowcost recovery. So, if sudden, large tariff increases are absolutely necessary,they should be accompanied by programs that provide households with theresources necessary to adjust to the new tariff structure.
Raise Collections First Improving cost recovery requires that tariffs be set to appropriate levels andthat these tariffs be enforced. But because nonpayment tends to be higher
Implications for Operational Design 153

among the poor before reform, increasing enforcement of tariffs alongsideprice increases will lead to larger effective tariff increases for the poor thanthe nonpoor, as seen in the country studies. To accurately calculate theimpact of tariff increases, policy makers should consider the price effect ofincreased tariff enforcement, which can create a much larger de factoincrease than predicted. Unless efforts are first made to raise collections, thepoor will cope with tariff increases by nonpayment or disconnection.
Increase Access to Gas or Other Clean Substitutes As seen in chapter 3, the poor generally have less access to gas infrastruc-ture, making it harder for them to reduce electricity consumption by sub-stitution of more efficient alternatives. At the time, increasing access tosuch clean and inexpensive substitutes as gas might have been one of thebest ways to offset the impact of electricity tariff increases, particularlywhere a large number of people heat with electricity (figure 9.2). But thetrue cost of gas is often higher than reflected in the figure. Many coun-tries, such as Armenia and Romania, keep gas tariffs below the true eco-nomic cost, distorting consumer choices away from district heating togas-fired heating.
The recommended switch to gas must therefore be qualified in light ofrecent signs that Russia’s willingness to supply large volumes of subsidizedgas may be coming to an end. If this happens, the price of gas will increase
154 Lampietti, Banerjee, and Branczik
0
0.5
1
1.5
2
2.5
3
3.5
4
4.5
5
92 93 94 95 96 97 98 99 00 01 02
cen
ts p
er K
Wh
gas tariff electricity tariff
Figure 9.2. Electricity Tariffs are Higher Than Gas Tariffs, 1992–2002
Source: Authors’calculations based on data from local consultants, Counterpart International (for Moldova), and
ERRANET database.
Note: The applied conversion factor was 277.8 KWh per Giga-Joule of natural gas (International Energy Agency).
Average tariffs were calculated for Armenia, Azerbaijan, Georgia, Hungary, Kazakhstan, Moldova, and Poland. This
figure is a simple average. The number of observations varies by year depending on data availability.

significantly from the levels indicated in figure 9.2. Subsequent changes inrelative prices must be taken into account when looking at the costs ofelectricity and gas. One way to increase access to gas, if this policy is cho-sen, is for the government to bid out competitive subsidies to encourageextension of natural gas networks to poor neighborhoods.
Make Metering a PriorityIn an environment of tariff reform, meters offer consumers informationabout and control over their energy use, leading to savings and possibly tomore efficient consumption—for electricity and for other network energysources, including gas and district heat. Whether and how much con-sumers actually save depends on the level of over- or underconsumptionand the relationship between the system’s fixed and variable costs.9
Imaginative use of technology can make meters a more helpful instru-ment for consumers to control their expenditures, for example, through“smart” metering technology. The simplest form of smart metering is adisplay meter that allows consumers to monitor consumption in moneyterms rather than kilowatt hours (KWh). It can be combined with a key-pad or smart card reader linked to prepayment systems, potentiallyreducing costs and allowing consumers to take advantage of lower tariffsgenerally offered for prepayment. Internet-linked systems can offerother services, including direct welfare benefits payments. Realizing thefull potential for smart metering requires piloting the technology toestablish the real value to customers. On the downside, it is unrealisticto expect low-income households to meet the cost of installing expen-sive new systems.10
Investments in Efficiency Most buildings in the region use two to three times as much heat as build-ings in comparable climates in Western Europe. Particularly promising forreducing energy expenditures, especially in areas where large increases inclean fuel prices are expected, are investments in efficiency and insulationthat can produce substantial reductions in consumption.
Financing Instruments Investments in efficiency and access to gas often carry high initial costsand must be coupled with innovative financial instruments that enableconsumers, particularly the poor, to distribute capital costs over a longerperiod. As seen in Georgia, focus group participants said that the costs ofconnecting and appliances were barriers to installing gas. Financing
Implications for Operational Design 155

instruments can help defray recurring costs of higher energy prices, asillustrated in the Armenia study, where customers commonly paid offtheir higher winter electricity bills during the summer months.
Mitigating the Environmental Effects of Reform
Increased production efficiency, new investment, and environmentallyfriendly technology accompanying reform were expected to contribute tolower fossil fuel consumption and lower emissions, better ambient airquality, and thus to better health outcomes for the local population.11 Butreforms affected household fuel choices, which also carried environmen-tal effects. This section looks at the environmental impact of sectorreform and its impact on poverty.
Environmental Benefits from Increased Energy Production Efficiency?Claims about improvements in ambient air quality because of reformsare difficult to verify for most pollutants, since pollutant indicators andmonitoring programs were never established in ECA—or if they were,collection collapsed with the breakup of the Soviet Union and the sub-sequent transition. Measured by fuel efficiency of electricity production,the environmental performance of the electricity sector has improvedslightly over the past decade, leading to reductions in carbon dioxideemissions and positive impacts on global and long-range air pollution.
Evaluating these benefits requires sophisticated climate change modelswell beyond the scope of this book; in any event, the benefits are globalrather than local.12 In most cases, increasing energy efficiency in electricityproduction has little direct impact on human health, because the electric-ity sector’s share of total health damage from air pollution is negligible.Moreover, it does not contribute greatly to the pollutants that cause themost local health damage.13 If power plant stacks are high or located insparsely populated areas, as in much of the region, they may not havemuch influence on ambient air quality.14
If the sector does not help determine local air quality, reforms willproduce small health benefits even if emission reductions are large. Theraw data suggest that urban air pollution decreased slightly in the majorcities during the reforms, though it continues to be a health hazard. 15
How much did the power sector reforms contribute to this change? A crudedispersion model was used to estimate the magnitude of the impact ofthe sector on air quality and health in selected cities.16 The model found
156 Lampietti, Banerjee, and Branczik
that the power sector contributed less than 1 percent of health damage fromall emissions because of its low contribution to total emissions. Between1990 and 2000, the share of the electricity sector in the disability adjustedlife years (DALYs) originating from low air quality ranged 0.1–2.0 percent.17
The analysis reveals five reasons for the sector’s low contribution tohealth damages:
1. The substantial drop in the amount of electricity produced in Armenia,Georgia, and Kazakhstan.
2. The shift in the fuel mix used for thermal power plants toward naturalgas in Armenia and Azerbaijan.
3. The location of high-capacity power plants far from populated cities.4. Improvements in fuel quality18 and abatement technologies for
particulate matter that were already in place before the reforms start-ed in Hungary and Poland, with average removal efficiencies of 97–99.9percent.
5. The fact that power station stacks were built high to reduce deteriora-tion of ambient air quality and were regulated by Soviet norms andregulations.
The share of overall emissions from power stations is falling as privatetransport has become a major source of urban air pollution in the largecities of ECA.19
Environmental Costs from Fuel Substitution While the environmental benefits of increased production efficiency arefairly ambiguous, the analysis confirms the findings of the country casestudies: there may be unintended environmental costs associated withreforms. As residential tariffs are brought to cost-recovery levels, house-holds, particularly in low-income groups, may switch to cheaper tradi-tional fuel (wood, coal, or kerosene), which contributes to indoor andoutdoor air pollution. Although there are no comprehensive data onhousehold emissions, survey evidence on household substitution behaviordoes exist. In the Armenia study, for example, 80 percent of householdsand 95 percent of poor households reported using alternative fuel sources(primarily wood) to reduce reliance on electricity. And a report by theUnited Nations Environment Programme (UNEP) indicated rising airpollution because of increased low temperature emissions, a large share ofwhich is attributable to household heating.20 In Katowice, one of Central
Implications for Operational Design 157
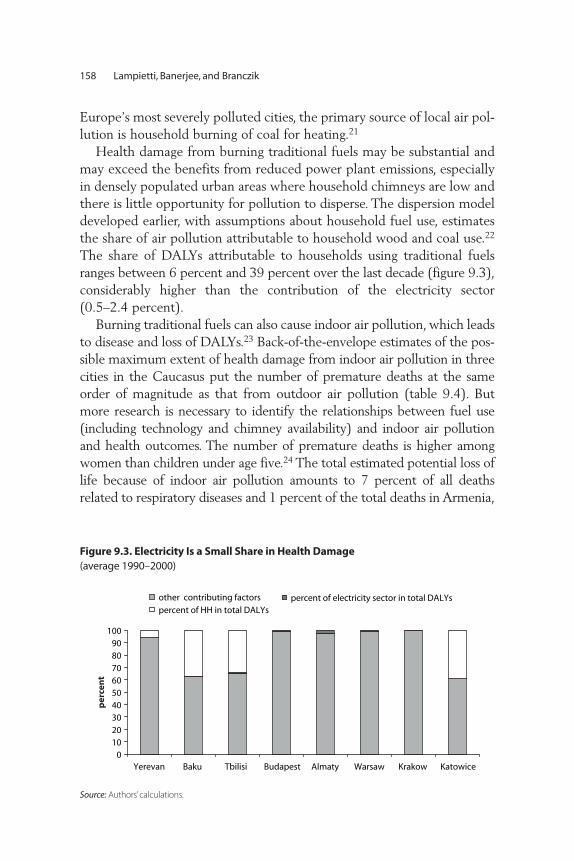
Europe’s most severely polluted cities, the primary source of local air pol-lution is household burning of coal for heating.21
Health damage from burning traditional fuels may be substantial andmay exceed the benefits from reduced power plant emissions, especiallyin densely populated urban areas where household chimneys are low andthere is little opportunity for pollution to disperse. The dispersion modeldeveloped earlier, with assumptions about household fuel use, estimatesthe share of air pollution attributable to household wood and coal use.22
The share of DALYs attributable to households using traditional fuelsranges between 6 percent and 39 percent over the last decade (figure 9.3),considerably higher than the contribution of the electricity sector(0.5–2.4 percent).
Burning traditional fuels can also cause indoor air pollution, which leadsto disease and loss of DALYs.23 Back-of-the-envelope estimates of the pos-sible maximum extent of health damage from indoor air pollution in threecities in the Caucasus put the number of premature deaths at the sameorder of magnitude as that from outdoor air pollution (table 9.4). Butmore research is necessary to identify the relationships between fuel use(including technology and chimney availability) and indoor air pollutionand health outcomes. The number of premature deaths is higher amongwomen than children under age five.24 The total estimated potential loss oflife because of indoor air pollution amounts to 7 percent of all deathsrelated to respiratory diseases and 1 percent of the total deaths in Armenia,
158 Lampietti, Banerjee, and Branczik
0102030405060708090
100
Yerevan Baku Tbilisi Budapest Almaty Warsaw Krakow Katowice
other contributing factors percent of electricity sector in total DALYspercent of HH in total DALYs
per
cen
t
Figure 9.3. Electricity Is a Small Share in Health Damage
(average 1990–2000)
Source: Authors’calculations.

10 percent and 1 percent in Georgia, and 2 percent and 0.3 percent inAzerbaijan.25
Electricity Reform and DeforestationFuel wood use may also contribute to deforestation and the loss of impor-tant forest resources—though the difficulty of obtaining data on defor-estation, particularly that attributable to fuel wood collection, makes itunclear whether this is a problem. Several studies and observations byforestry specialists visiting the Caucasus show a significant decrease oflocal forest cover and deterioration in forest quality, but these trends areoften not reflected in national or international statistics.26 Indeed, theforested area appears to be increasing from 0.2 percent a year in Polandto 2.2 percent a year in Kazakhstan in the last 10–15 years,27 althoughthese data are unlikely to be reliable since few ministries have theresources to monitor forest cover consistently and rigorously.28 It may alsobe that there is no visible change in total forest cover but the quality anddensity is decreasing.29
Certainly the low intensity harvesting of fuel wood from trees growingin agricultural land, around houses, and along roads is seldom shown tohave a significant impact on overall forest canopy cover (and is difficult tomeasure with remote sensing). And when trees are coppiced or pollardedto provide these supplies, the overall impact of rural firewood harvestingcan be negligible. But the situation is quite different in meeting urbandemands for firewood. When urban household energy use is constrainedbecause of utility reform, the negative environmental impact on forestedareas can be significant because of a shift from electricity to firewood,which can create market conditions that favor clear cutting of large forest-ed areas. From the household surveys, it is clear that the majority of rural
Implications for Operational Design 159
Table 9.4. Potential Maximum Loss of Life and Life Years from Indoor Air Pollution
Armenia (Yerevan) Georgia (Tbilisi) Azerbaijan (Baku)
Number of premature deaths
Children under age five 52 (19) 62 (20) 36 (17)
Women 164 (60) 147 (47) 114 (54)
Total 216 (79) 210 (66) 150 (71)
DALYs
Children under age five 1,820 (664) 2,186 (690) 1,260 (597)
Women 3,287 (1,199) 2,928 (931) 2,275 (1,078)
Total 5,107 (1,863) 5,134 (1,621) 3,535 (1,675)
Source: Authors’calculations based on World Health Organization statistics, mortality database, and household
surveys.

households and a substantial number of urban households used wood fortheir energy needs. An average expected household consumption of 5–10cubic meters of fuel wood per year can lead to substantial local deforesta-tion. More research is necessary on the amounts of fuel wood that house-holds burn, the sustainability of this practice, and the incremental use offuel wood resulting from electricity reforms. In addition it must beremembered that poor electricity supply prior to reform also creates con-ditions favoring deforestation, as with Armenia before reform.
How to Improve the Environmental Effects of Reform Better monitoring of ambient environmental quality improvements isnecessary for future measuring of the environmental effects of reform.Better information is also needed on fuel substitution to evaluate theimpact of reforms on fuel switching, energy use, substitution effects, andhealth and social effects. Household surveys currently do not revealenough information about energy and other utility reforms and need toinclude questions about utilities.30 Developing models to help predictbehavior under a variety of scenarios is also necessary.
It is likely that reforms have damaged health because householdsswitched to traditional fuels. One solution is to improve access andefficiency in using clean alternatives. Survey data indicate that fewerhouseholds would use wood and coal if they had access to gas. Ofcourse, in many countries the gas sector is also in need of reformbefore it can operate on a sustainable basis. In cases where switchingto traditional fuels is a problem and where the poor overwhelminglyhave access to gas, another option is to use a tariff-based subsidyrather than a direct transfer to encourage the poor to make cleanerfuel choices.
Notes
1. In this chapter, the same household data are used as for the energy demandanalysis in chapter 3, which are from 17 of 29 ECA countries. DetailedHousehold Budget Survey analysis can be found in Annex 2. As noted ear-lier, consumers gain from an improvement in service quality and the removalof rationing, but lose from tariff increases and disconnections. Existing datacollection efforts have not focused on quality, so at this time the gains fromthe service quality improvement cannot be measured. Therefore, the focus ofthe remaining analysis is on the consumer surplus change from a priceincrease.
160 Lampietti, Banerjee, and Branczik

2. While difficult to determine in practice, the correct measure of compensationwould be the amount of cash the consumer would need, given the new tariffstructure, to be as well off as before the tariff change.
3. Leakage is the proportion of people reached by a given program who are non-poor. Coverage is the proportion of the poor in a society who are reached bya program.
4. For further reading on direct transfers and lifeline tariffs, see Komives and oth-ers (2005), chapter 6.
5. For more information on volume-differentiated tariffs, see Komives and oth-ers (2005), p.13. Alternative pricing methods and their distributive implica-tions are also discussed in Linn and Bahl (1992). Multidimensional tariffschemes can differentiate between capital and variable costs and increase thescope for designing targeted subsidies.
6. Web address: http://rcnm.am. View indicators under “sector reports” link.
7. Bhatnagar (2001); Paul (1994, 1998).
8. Municipal utility users’ feedback was a key feature of the World Bank-Supported People’s Voice project in Ukraine (http://web.worldbank.org).
9. For district heat, individual metering and control can save 15–20 percent ofheat energy.
10. There is some tension between the advantages of effective individual meter-ing and the experience of private operators and management contractors. InGeorgia, communal metering proved an effective way to improve collectionsat a lower cost than installing individual meters.
11. An analysis of six reforming countries from across the region (Armenia,Azerbaijan, Georgia, Hungary, Kazakhstan, and Poland) was conducted totest the validity of these claims. This material was first published inLampietti ed. (2004).
12. Since these benefits are global rather than local, the costs could be partiallyfinanced through such institutions as the Global Environment Facility or thePrototype Carbon Fund. Costs then would not be borne by the local popula-tion, who experience only a small share of the benefits.
13. These are sulfur dioxide, nitrous oxides, and fine particulate matter (PM10).Improvements in air quality resulting from increased efficiency can beinsignificant when compared with emissions of these pollutants. Differentpollutants are associated with different health risks, commonly measured interms of the disability adjusted life years (DALY), used internationally tocompare health effects of different causes. One DALY is equal to the loss ofone healthy life year.
14. In the former Soviet Union, a number of state norms and rules regulated theheight and design of power plant chimneys. These rules and norms were
Implications for Operational Design 161

generally close to western norms. The Ekibastuz Power Plant in Kazakhstan,which uses coal as fuel, has two stacks of 330 meters each. Other knownstacks in Russia and Ukraine range from 250 meters to 1,370 meters.
15. Ambient air quality standards for PM10 continue to be surpassed regularly inKatowice, Tbilisi, and Yerevan (Lampietti and Meyer 2002). Baku, Tbilisi, andYerevan used to be included in the list of most polluted cities of the formerSoviet Union because of the industrialization and urbanization of the past 30years. Lack of monitoring data precludes in-depth assessment of the state ofthe air quality, though air quality has been monitored in all the countries formany years. After decentralization, lack of funds and obsolete monitoringmethods inhibited progress, and data collection has declined sharply.
16. Details of the model can be found in Lampietti ed. (2004).
17. The highest shares attributed to the sector are in Almaty and Warsaw. In theother cities, the contribution is less than 0.5 percent.Total DALYs from ambi-ent air pollution range from around 4,000 on average in Krakow to around50,000 on average in Katowice.
18. Sulfur and ash content of coal; sulfur content of liquid fuel.
19. In Tbilisi, for instance, transport accounts for 80 percent of total air pollutants.Private transport emissions are increasing because of the aging vehicle fleet,the low quality and high sulfur content of the fuel, and the decline in publictransport.
20. UNEP (2002).
21. Bucknall (1999); Bucknall and Hughes (2002). In the Katowice area, annu-al average levels of sulfur dioxide exceed the current European Unionstandard nearly threefold, and annual average levels of PM10 are well abovethe standard. Some parts of the metropolitan area exceed daily PM10 limitvalues for 200 days a year, causing significant respiratory illness and otherproblems for the population. The largest part of the average exposure toPM10 comes from household boilers, responsible for 80 percent of exposureto harmful particles in Katowice voivodship. Power and district heatingplants contribute little to exposure because—as a result of their highstacks—their emissions are dispersed over a wider area. The ambient air pol-lution impact in Katowice is attributable to coal and wood use for heatingand cooking purposes, not solely as substitution for electricity. In Katowice,409 households burn coal for heating, with lower income households morelikely to heat with coal.
22. The following assumptions are made: the share of population using wood isas reported earlier, the urban exposed population of Baku is estimated at 50percent, the average quantity of wood per household is 8 cubic meters peryear, the density factor of wood 0.5 ton per cubic meter, and the averagehousehold size is taken from UN World Prospects Population Database. In the
162 Lampietti, Banerjee, and Branczik

2002 census of Georgia, the actual population appears to be smaller than orig-inally listed in international databases of the United Nations and the WorldBank. The contribution of the household sector to atmospheric air pollutionfell from 34 percent to 29 percent on average for the past 10 years. The rela-tive contribution of the electricity sector to health effects will accordingly belower, since it also depends on the number of people affected.
23. Worldwide, inhalation of smoke from combustion of solid fuels causes about36 percent of lower respiratory infections, 22 percent of chronic obstructivepulmonary disease, and 1 percent of trachea, bronchus, and lung cancer(WHO 2002). It is also associated with tuberculosis, cataracts, and asthma(though the evidence here is weaker). Nearly 3 percent of DALYs worldwideare attributed to indoor smoke, 2.5 percent for men and 2.8 percent forwomen.
24. Though this is counterintuitive given the evidence in other continents, inECA, the number of women compared with the number of children is higherthan elsewhere. In Azerbaijan, it is 6 women per child; in Georgia, 10; and inArmenia, 8.5.
25. These estimates are based on the assumption that ventilation is lacking at thelocation of traditional fuel burning. More research is needed to identify theavailability and use of fuel burning technologies and chimneys in householdsto establish the precise relation between traditional fuel use, indoor air pollu-tion, and health outcomes.
26. For example, UNEP (2002).
27. Reference periods for the different countries are: Armenia 1983–96,Azerbaijan 1983–88, Hungary 1990–96, Kazakhstan 1988–93, Poland1987–91 and 1992–96, and Moldova 1990–95. No information is available forGeorgia.
28. The United Nations Economic Commission for Europe and Food andAgriculture Organization report (2000) on forest resources of Europe doesnot indicate a decline in forest resources. A forest is composed primarily ofindigenous (native) tree species. Natural forests include closed forests andopen forests (at least 10 percent tree cover). Total forests consist of all forestarea (plantations and natural forests) for temperate developed countries.
29. Changes in forest canopy cover, which can be monitored using conventionalremote sensing approaches, often do not reflect changes in forest health,yield, species mix, or density, which can be captured only by more rigorousground-based inventories and assessments (UNEP 2002). The CaucasusEnvironmental Outlook reports that selective cutting occurred when thehighest quality trees were cut. During the past 10 years, cutting was extensiveon the Saguramo-Yalon range (East Georgia), and on the outskirts of Tbilisiand Yerevan. In state-owned forests, there were no significant changes in the
Implications for Operational Design 163

total cover, but all valuable specimens of beech and some other species havebeen cut, drastically reducing forest quality. It is estimated by the CaucasusEnvironmental Outlook that in Armenia and Georgia, 26 percent of beechforest has been converted to coppice forests and only about 10 percent of thebeech forests left have a high density.
30. Suggested questions are presented at http://wbln0018.worldbank.org/esmap/site.nsf/pages/Flagship_2006.
164 Lampietti, Banerjee, and Branczik

The Soviet legacy left Europe and Central Asia’s (ECA) power sector ina state of disrepair and dependent on a complicated system of fiscallyunsustainable budget transfers. In many countries the result was a col-lapse of energy utilities and an inability to supply power for normalsocial and economic activity. To put the power sector back on its feet,governments across the region undertook far-reaching sector reforms,unbundling vertically integrated utilities, liberalizing and regulating thesector, privatizing companies, setting prices at cost-recovery levels,and improving payment discipline. But as with all utility reforms, policymakers were faced with the mismatch between the timing of costs andbenefits associated with reform, exacerbated by expectations rooted incommunist times that the state would take care of utility provision.Despite attempts to soften the blow, the negative effects of increasingtariffs and collections have often been highly disruptive, threatening thesustainability of reform.
After a decade of reform, most countries have only partially achievedcost recovery, and further tariff reform is needed for much of the region.The analysis and findings of the studies in this book provide informationon the expected household responses to reform—and on how the design
C H A P T E R 1 0
Conclusion: Designing Reforms
to Produce Better Outcomes
for the Poor
165

of reform can be modified to produce better outcomes and mitigate themore negative effects.This chapter provides an overview of the book’s keyfindings on the effects of reform on the poor, effectively mitigating strate-gies, approaches to designing successful reforms, and methods of analyzingreform.
Tariff Reform: Where Do We Stand?
Estimates indicate that residential electricity tariffs are below cost recoveryin 14 of 19 ECA countries (figure 10.1). The largest percentage increasesneeded are in Central Asia (Azerbaijan, the Kyrgyz Republic, Tajikistan,and Uzbekistan) and in Southeastern Europe (Albania, Macedonia, andSerbia and Montenegro). In absolute terms,Albania, Macedonia and Serbiaand Montenegro all need to increase tariffs more than 2 cents per kilowatthour (KWh).1 Such sizable tariff increases are unlikely to be welfare neu-tral unless accompanied by substantial and visible improvements in serv-ice quality or cushioned by income transfers.
166 Lampietti, Banerjee, and Branczik
Year 2002
Weightedaverage tariff
US c/kWh
Estimated cost recovery tariff
US c/kWh
4.30 4.075.00 5.003.72 3.667.70 8.003.31 3.572.57 3.005.79 7.506.00 8.005.32 7.504.76 7.032.62 4.004.70 7.504.11 7.501.90 3.801.50 3.004.30 8.631.13 2.303.06 7.500.85 3.500.50 2.10
0 10 20 30 40 50 60 70 80 90 100
TajikistanUzbekistan
Serbia and Mont.Kyrgyz
AlbaniaAzerbaijan
RussiaBulgaria
MacedoniaUkraine
RomaniaBosniaPolandCroatia
KazakhstanBelarusTurkey
ArmeniaMoldovaGeorgia
Share of current tariff in cost recovery tariff
percentage
Figure 10.1. Electricity Tariff Reform Is Still Needed
Source: World Bank ECA Electricity Data, 2003.
Note: Residential tariffs are usually set higher than average weighted tariffs because of the higher costs of
supplying electricity to low-voltage consumers. So the shortfall in current residential tariffs is slightly higher than
represented here.
Russia: no residential tariff available; weighted average end user tariff used instead.
Bosnia and Serbia and Montenegro: Figures are from 2002.

Conclusion: Designing Reforms to Produce Better Outcomes for the Poor 167
How Do Reforms Affect the Poor?
By using quantitative data to look closely at household behavior, the stud-ies in this book teach us about residential consumption of energy, whatdifferent fuels are used for, and what happens when relative fuel priceschange. Combined with qualitative data, they help clarify why peoplemake certain choices—for example, whether households use nonnetworkfuels because they do not have access to network fuels or because theycannot afford network fuels.
Ideally, poverty and social impact analyses (PSIAs) can be conductedto analyze reforms before they take place and to model the effects of dif-ferent policies so that policy makers can make empirically informedchoices. But even without conducting new studies, the knowledge andlessons gained from the PSIAs presented here will be useful for futurereform in ECA and elsewhere. As noted in the World Bank’s guidelinesfor PSIAs, “where information is sparse and time short, the core issuesmay have to be addressed on the basis of knowledge of the country andinternational experience of similar reforms.”2 What lessons can be drawnfrom these studies for future reform?
Residential Energy ConsumptionIn a region of low incomes that are only now on a moderate growth pathand are not keeping pace with price increases, the poor consume lessenergy than the nonpoor but spend a higher percentage of their monthlyexpenditure on energy. Electricity frequently forms the bulk of this energyexpenditure.
Nonpayment: Affordability versus Free-RidingNonpayment, stemming in part from a legacy of extremely low nominaltariffs, has proved an intractable problem for countries introducingreform. Identifying which groups do not pay enables a disaggregation ofaffordability and free-riding as possible causes. Though a culture of non-payment was pervasive in such countries as Georgia, in many cases it isthe poor who accumulate the greatest arrears, indicating that the moveto cost recovery has resulted in tariffs that are too high for householdsin lower income quintiles to afford.
Elasticity of Electricity Demand In response to increasing prices, the poor displayed greater elasticity thanthe nonpoor—their consumption decreased more rapidly. But with

sustained price increases, consumption levels in some countries are nowso low among poor households that they are extremely inelastic. Below acertain level of electricity consumption—typically about 125 KWh permonth, enough for a refrigerator and three lightbulbs—it is extremelyhard to reduce consumption any further. ECA’s cold winters make theneed for energy for heat particularly inelastic. Further moves to costrecovery in countries where a significant number of poor households con-sume at this level need to pay particular attention to measures that willprevent significant welfare losses among the poor.
Coping Mechanisms Households use various coping mechanisms to reduce their energyexpenditures. They include using energy more sparingly (turning offlights) and substituting cheaper fuels (gas and wood) for more expensiveones. While many ECA countries were very energy intensive beforereform, allowing some scope for improved efficiency, some of thesemeasures to reduce expenditures can carry significant negative effectsthat must be factored into calculations of reform outcomes. Theseinclude cases where households must go to extreme lengths to conserveenergy, such as turning off refrigerators for days at a time, and wheresuch substitutes as wood and coal contribute to indoor and outdoor airpollution, with adverse outcomes for health and the environment. Inaddition, the studies typically found that the urban poor experienced themost difficulties in coping with increased tariffs, since they face moredifficulty than the rural poor in getting wood, a relatively cheap substi-tute for electricity for heating.
Improvements in Service Quality For countries with low access rates, a major benefit of reform is betteraccess and service quality. In ECA, the decapitalization of energy utili-ties and the ballooning energy-related debts limited supply and resultedin electricity rationing. So the possibility of service quality improve-ments represented a significant potential benefit of reform. For manyconsumers, the welfare gains from service quality improvements canbalance the welfare losses from tariff increases. In countries where servicequality improvements did not uniformly accompany tariff increases, asfor some consumers in Georgia, not only did welfare decrease, but thesupport for reform and the willingness of customers to pay were alsocompromised. This proved a very real threat to the sustainability ofreform efforts.
168 Lampietti, Banerjee, and Branczik

Conclusion: Designing Reforms to Produce Better Outcomes for the Poor 169
Designing Effective Mitigating Strategies
Direct Transfers or Tariff-Based Subsidies? How best to mitigate the impact of cost recovery has been the subject ofconsiderable debate between the relative merits of tariff-based subsidiesand direct, targeted cash transfers. Lump-sum transfers are usually themost efficient way to help the poor, according to public finance theoryand studies looking at parts of the world where the poor have less accessto utility infrastructure, and where the nonpoor therefore capture thebenefits of subsidies. But when the social protection systems for channel-ing direct transfers are not well targeted to the poor, as in Georgia, theytoo can be inefficient, costly, and regressive. In the real world, and withdifferent circumstances, second-best solutions—tariff-based subsidies—sometimes make more sense.
In deciding between different options to assist the poor, governmentsneed to carefully consider the various factors (outlined in chapter 9) thatdetermine whether tariff-based subsidies or direct transfers will be moreeffective in reaching households in the lowest income quintiles. Thesefactors include the levels of access among the poor, the percentage ofpoor in the local population, and the targeting effectiveness of existingtransfer schemes. In a country where poverty is widespread and wherethe social benefit system is not well targeted to the poor, a tariff-basedsubsidy can be a more effective and reliable instrument than a directtransfer through the social benefit system. In Latin America and Africa,tariff-based subsidies have been found to be socially regressive becausethe poor do not have access to the network and cannot therefore capturethe benefits of such subsidies. This is much less the case in ECA,where almost all households, poor and nonpoor, enjoy access to networkenergy.
Improving the Efficiency of Energy Consumption Governments can also help mitigate welfare losses by helping householdsmove toward more efficient energy use. For some uses there are no suit-able alternatives to electricity—lighting and refrigeration, for example. Butclean and affordable alternatives can be found to heating with electricity.Where there is a supply of natural gas, connection subsidies or assistancein financing investment in gas-fired appliances can increase welfare for thepoor. Where gas is not available, more efficient and cleaner wood stoveshave been successful, as have improvements in building insulation. And insituations where incomes are sufficiently high, temperatures are very cold,
and combined heat and power plants are in use, investments in rehabil-itating district heating systems can be appropriate.
Raising Tariffs Gradually If a fiscal crisis does not preclude the practice, raising tariffs gradually cansmooth the impact considerably by giving households more time torespond to rising prices, since price elasticity is greater in the long runthan in the short. Clearly this is easier for energy-rich Azerbaijan than forenergy-poor Armenia, Georgia, or Moldova.
Controlling Consumption Households must be able to monitor their consumption by use of meters,whether for gas or electricity. Because of technological improvements,more options are now available in metering—for example, smart meter-ing, to allow consumption to be monitored for money spent rather thankilowatt hours consumed—and prepayments. These must be accompa-nied by financing instruments to give the poor access to systems that willimprove their welfare.
Designing and Implementing Successful Reform
Improving Cost Recovery In addition to mitigating strategies, the studies also shed light on moregeneral factors in the design of the reform that make it successful.Moves to cost recovery will be more palatable and credible to con-sumers if tariff increases can be more explicitly tied to improvements inservice quality. Improving billing and enforcing collections first, beforeraising tariffs, also increases the likelihood of sustainable reform. Sincenonpayment is generally higher among the poor, they will face muchhigher effective tariff increases than the rich if enforcement and tariffsincrease simultaneously.
Outside Factors Affecting ReformThe studies also shed light on institutional and political economy factorsthat determine the success of reform—factors to some extent beyond thecontrol of the policy makers designing utility sector interventions. Acountry’s macroeconomic condition and resource endowments, the levelof competence or corruption in domestic private sector and in govern-ment, and the constellation of vested interests that form the politicaleconomy backdrop of reform all have significant potential to affect the
170 Lampietti, Banerjee, and Branczik

outcomes of reform—often in unpredictable ways. A resource-poorArmenia, Georgia, or Moldova is pressed to reform far more rapidly thanan energy-exporting Azerbaijan. The ebb and flow of political power alsoplays a key role. With the Shevardnadze government’s diminishing credi-bility in Georgia, corruption and vested interests were given free reign toblock reform. In Armenia, too, a year of political instability in 1999 wasthought to have compromised efforts to improve cost recovery, while agovernment far more certain in its position was able to make dramaticinroads in improving collections in 2002.
Designing Suitable Policies With greater understanding of these factors, policy makers can tailor inter-ventions to mitigate the institutional and political economy risks inherentin the reform environment. In Georgia, the design of the privatizationcontract allowed the government to distance itself from reform and evenblame the private sector for price increases, undermining attempts toimprove cost recovery and leaving the private utility to fight politicalbattles. But in a subsequent management contract, an effective mechanismto share risk meant that the Georgian government and utility interestswere aligned in encouraging payments. In Armenia, the government tookresponsibility for improving collections, and thus much of the heat fortariff increases. Another lesson is that though economists and donors canpoint to an ideal sequence of reforms, reality imposes limitations. Reformscan be unpopular, and small windows of opportunity can often be usedaround such outside factors as election cycles. Policy makers have to beflexible and adaptive in responding to these external constraints.
Analyzing Reform: The Potential of PSIAs
Generating Better Data and Evidence The information gained on reform and household responses illustrates thepotential for PSIAs to inform policy decisions. In addition to the findings,the studies show the importance of having complete and accurate infor-mation as a basis for policy decisions—whether a correct prediction ofprice responses in response to reform in Armenia, or an accurate estimateof the demand for heat when making large investments in district heatingrehabilitation. As these PSIAs were conducted, large gaps were found inthe quantitative and qualitative data available—even though monitoringreform performance, and understanding its impact, should be a primaryconcern of policy makers.
Conclusion: Designing Reforms to Produce Better Outcomes for the Poor 171
This demonstrates the huge potential of the PSIA methodology for thefuture of reform design, by highlighting the extent to which reforms areproducing outcomes other than those that are commonly assumed oranticipated. In Armenia, the tariff increase was much larger than originallyplanned because the average monthly payment had not been appropriatelycalculated. A well-designed program in Georgia had not factored in apervasive culture of nonpayment and a network where theft was routineand payment unusual. In Moldova, far from hurting the poor, the con-sumption gap between the poor and the nonpoor was actually narrowingafter sector reforms, and the poor in particular appeared to be benefitingfrom a return to 24-hour service. By bringing empirical evidence todebates characterized by polemics and misperceptions, and by highlight-ing the need for better data to be collected, such studies have a criticalrole in designing good policy.
Involving StakeholdersSince the late 1990s, development institutions have adopted a more par-ticipatory approach in their business with client countries. PSIAs areindicative of this change, supporting it in several ways: PSIAs emphasizethe distributional impacts of reform; identify the trade-offs between effi-ciency and equity; account for the concerns of borrowing countries andthe constraints facing policy makers; and provide a broad range of stake-holders with the information required for a meaningful policy dialogue.They are thus a critical analytical tool supporting how the World Bankapproaches its policy and lending operations. PSIAs further validate thisapproach by demonstrating how an informed dialogue, based on rigorousempirical evidence, can actually advance reform—by providing clear,empirical answers to the concerns that stakeholders often bring todebates. Such debates have in the past been characterized by ideology andpolemics—an obvious example being whether privatization hurts thepoor in Moldova.
Building Capacity The PSIAs go even further in encouraging the participation of developingcountries by seeking the involvement of country stakeholders—govern-ment counterparts, nongovernmental organizations, utilities, and con-sumer groups. The analysis is usually conducted in partnership with localconsultants who become involved in the PSIA’s production. Indeed, theexplicit aim is to build capacity to enable countries to conduct suchanalyses themselves, and to encourage decision making at the local level
172 Lampietti, Banerjee, and Branczik

for reforms whose effects are local.This straightforward approach is makingthis goal a reality. And it clearly extends beyond the sphere of infrastruc-ture reforms and beyond the ECA region.
There are limitations, of course—the focus on first-order rather thansecond-order effects and the time frame of the studies, which do not tellthe story of the longer term impact of reform. But the ability to analyzethe results of reform, ex post and particularly ex ante, is a valuable tool indesigning policy.
Lessons for PSIAs
The studies here provide guidelines for using the methodology to analyzeinfrastructure reforms and undertaking such analysis in the future.
Necessary Steps The key welfare indicators that such PSIAs must quantify to build a pictureof budget shares spent on electricity are household income and expenditurelevels and absolute levels of electricity consumption. Additional informa-tion is needed on service quality and availability, access to different energysources, and coping mechanisms. Quantitative data form the empiricalbackbone of this analysis, but qualitative data are also critical to completethe story provided by the quantitative analysis and to point to the issuesthat need addressing and the questions that need to be asked.
Adapt to Local Context The study becomes most valuable when it is adapted to the local politi-cal economy and closely tailored to address issues and problems raised byprimary stakeholders. Although each of the studies was conceived as aresult of a disagreement or impasse in the reform project, conductingqualitative research through focus groups and key informant interviewsto inform the quantitative data was a highly effective way of discerningthe most pressing concerns of local stakeholders.
Allow Adequate Time and Resources The studies also demonstrated the importance of allowing adequate timeand resources to conduct a careful analysis, since the credibility of thefindings rests on the quality of the analysis. To some extent, this findingis in tension with the idea that PSIAs can form part of the cycle of deci-sion making, since the time required for a study may not conform to theBank or client country’s internal framework or budget cycle, and the
Conclusion: Designing Reforms to Produce Better Outcomes for the Poor 173
nature of a crisis may mean that reform is needed in a hurry. But a studyconducted without sufficient attention to the quality of the analysis willnot provide as useful an input to the debate. Given the controversysurrounding the reforms, and the often contentious nature of the PSIAfindings, rigorous analysis becomes all the more important.
Reframe Controversial Issues Again touching on the political sensitivity of some of the issues thatPSIAs address, in Moldova it proved very useful to reframe the issues byasking pointedly neutral questions. Rather than asking whether privati-zation hurt the poor, the study focused on a straightforward welfareindicator and compared it for different groups. By looking at the issuesin a different way, the PSIA can move the debate in a new direction,liberating it from the stalemate induced when it is based on polemicsand ideology.
Involve a Broad Range of Stakeholders The studies also illustrate the value of involving a broad range of stake-holders. Not only is this an important step in understanding the distrib-utional impact of reform—it also makes the PSIA process part of theforum for discussion. In promoting a broad-based dialogue on reform,the study can help clear up misunderstandings, “democratize” the debate,and build consensus on a reform program. Ultimately, this approach canhelp generate support for a reform process in which more members ofsociety feel ownership.
Ex Post and Ex Ante Approaches The range of studies in this book—with three ex post studies conductedimmediately postreform in Armenia, and several years later in Georgiaand Moldova, and an ex ante study in Azerbaijan—conveys an idea of theusefulness of both approaches in informing policy. While ex ante analy-sis is in many ways preferable when approaching the design of reform,ex post analysis has shown itself extremely useful in keeping a reformprogram on track when it threatens to derail.
Alternatives to Privatization
Since the hiatus of the 1990s, the enthusiasm for privatization in interna-tional financial institutions such as the World Bank has given way to anapproach that gives more consideration to public–private approaches.
174 Lampietti, Banerjee, and Branczik

While this results partly from practical constraints—in a very differentworld economy where the market appetite of investors has largely evapo-rated—attitudes have also been tempered by some of the more chasteningexperiences of privatization. Simply changing ownership has often provedan insufficient, ineffective, or inappropriate tool for turning a failing sectoraround—as, for example, expecting AES Corporation to transform aculture of nonpayment in Tbilisi in the absence of political support.Utilities that have remained publicly owned have demonstrated that theyare capable of becoming efficient and financially sustainable entities, as inMoldova.
The former orthodoxy of privatization has given way to greater consid-eration of such alternatives as partial privatization or selling off manage-ment contracts rather than entire utilities. These alternatives can providedifferent means to a sustainable sector. This change in stance cannot betraced to any single occurrence or study, but to the body of experience andstudies on reform and privatization.
Conclusion
Policy reforms are usually characterized by winners and losers. How tocompensate the losers has been the subject of countless debates and stud-ies. This book has taken a close look at the distribution effects of intro-ducing cost recovery to public services that were previously below cost.And it has illustrated how policy options that are widely advocated byeconomists work in these real-life cases.
Since the late 1990s, Europe and Central Asia (ECA) has seen impor-tant—and welcome—changes to the macroeconomic and institutionalbackdrop for reform. As transition has progressed, poverty levels havedeclined and living standards have improved across the region. Utilityreform, particularly electricity reform, has continued to bring significantimprovements to the electricity sector, notwithstanding some of the dif-ficulties met along the way and described in this book. And the climateof reform has changed markedly, with privatization, strongly favored inthe mid- to late-1990s, giving way to a management contract approach.Elsewhere, the private sector is returning to parts of ECA. Increases in gasprices must now be considered when recommending gas over electricityas an alternative energy.
Despite these changes, the findings of these studies, undertakenbetween 1999 and 2004, remain valid for reform today. The timingmismatch between the costs and benefits associated with reform; the fact
Conclusion: Designing Reforms to Produce Better Outcomes for the Poor 175

that the poor consume less energy than the nonpoor, spend a larger per-centage of their monthly income on energy, and reduce consumptionfaster when prices increase; the fact that when the poor have reduced theirconsumption to basic minimum level, further reductions are unachievablewithout significant decreases in welfare; and the importance of institutionsand political economy aspects in determining reform outcomes, remaincritical considerations for policy makers undertaking reform.
Although targeting of social benefit systems has improved markedlysince the 1990s, the legacy of systems based on categorical privileges ratherthan poverty targeting, and the high levels of access to electricity enjoyedby the poor, mean that under the right circumstances tariff-based subsidiescan still be more effective than direct transfers in helping the poor accesselectricity, particularly when a large percentage of the population is poor.
Many studies of utility reforms focus on cases where access to utilitiesis low and largely concentrated among the nonpoor—a reality in largeparts of Africa, Asia, and Latin America. The prescription that flows fromthis context is a strong argument in favor of direct transfers to poorer con-sumers, rather than socially regressive tariff-based subsidies. But the find-ings in this book point to the importance of testing such a prescriptionagainst the characteristics of local infrastructure networks. In ECA arefound some circumstances that may favor continuation of an alternativesystem of tariff-based subsidies.
But policy options such as this, or the argument in favor of publicinterventions to extend access to such efficient alternatives as gas, or theimportance for welfare levels of ensuring that service quality improve-ments accompany tariff increases, are only one part of the lessons learnedfrom this book.
Broadly, the cases looked at here are a powerful testament to the impor-tance of an empirical understanding of the distributional impact on differ-ent stakeholders of reform based on quantitative and qualitative analysis.Only by building a comprehensive picture of the behavior of differentgroups can we understand what reform means to these groups, how andwhy their behavior changes, and the impact of reform on their welfarelevels. The increasing trend to engage in this kind of rigorous analysis toinform the design of successful, sustainable, and politically acceptablereform programs is one more testament to the growing recognition of theimportance of this exercise.
Achieving cost recovery remains a pressing need in much of ECA. Buthard-won experience, backed by empirical evidence, shows that if welfarelosses greatly exceed gains, the social and economic costs of reform can
176 Lampietti, Banerjee, and Branczik
threaten to outweigh the benefits. Moldovans unable to afford more than55 KWh of electricity per month, who must unplug their refrigerators,minimize use of their television sets, and use low-wattage lightbulbs, or arecut off as a result of being unable to pay their electricity bills, do not per-ceive the welfare gains from a return to 24-hour service, only the welfarelosses from higher prices. In addition to the very real problem for povertyand inequality, this can make reform politically and socially unacceptable.To counter this danger, cost-recovery reforms must be accompanied bymeasures to facilitate the redistribution of net welfare gains to the mostvulnerable members of society to mitigate their welfare losses.
Successful reform depends on many variables in any one country, bothwithin the design of the reform program and beyond it. The reformexperience of countries in ECA and elsewhere has spawned muchwork examining the factors determining success or failure in reform—sequencing, political economy, and institutional factors. It is equally thecase that it is easy for a well-conceived reform program to be derailed byfactors outside the design of reform. Most often this factor is a lack ofpolitical will to support reform, as in Georgia. But improvements in thedesign of reform aimed at minimizing welfare losses can decrease thepotential for organized constituencies to mobilize support against reform.In Bolivia, Georgia, Moldova, and elsewhere, such groups have comeperilously close to derailing reform, if not succeeding. Minimizing thelikelihood that such constituencies will mobilize is important for success-ful reform. Putting into action the lessons from the PSIAs in this book,and from those in the future, is central to this effort.
Notes
1. In addition Azerbaijan, Bulgaria,Tajikistan, and Ukraine need to increase tariffsby more than 1.5 cents per KWh. These figures, for 2003, were calculatedfrom World Bank ECA electricity data.
2. World Bank (2004d), p. 1.
Conclusion: Designing Reforms to Produce Better Outcomes for the Poor 177


ANNEXES
179


Country
Regulatory
development
Corporatization and
unbundling of monolithic
company Privatization of distribution Privatization of generation
Armenia
Azerbaijan Regulatory framework to be
established in 2006. Tariff
Council has control over
tariff policy.
1998: “Azerbaijan Republic
Law on electric power
engineering”approved.
Power grid divided into three
parts: State electric energy
2002: Management of four
regional distribution
companies contracted for a
25-year period to two private
companies: Barmek Holding
State-owned enterprise Azernerji
manages generation and transmission
1997: Energy law
established an independent
Energy Commission, the
Armenian Energy
Regulatory Commission.
1997: State-owned
enterprise Armenergo
unbundled into generation,
transmission, and
distribution.
2002: Midland Resources
Holding (MRH) assumed
control of Electricity
Distribution Company (EDC)
with a management
contract. In 2005, MRH sold
the company to RAO UES.
2002–03: Ownership of the Hrazdan
Thermal Power Plant, the
Sevan-Hrazdan Hydro Cascade, and
financial control of Medzamor,
transferred against US$96 million in
state debt forgiveness: Hrazdan TPP
transferred to a Russian state company
for US$31 million; Sevan Hrazdan
Cascade transferred to RAO “Nordic” for
US$25 million; and financial
management of Medzamor given to
another RAO subsidiary, Inter-RAO UES,
in exchange for US$40 million in debt
for nuclear fuel.
Annex 1. Overview of the Reform Process in Eight ECA Countries
(Continued)
18
1

182Lam
pietti,B
anerjee,an
d B
ranczik
Georgia 1997: Electricity Law
established an independent
regulator, Georgia National
Energy Regulatory
Commission (GNERC).
Georgian Wholesale
Electricity Market (GWEM)
established in 1999.
1999–2000: State-owned
enterprise Sakenergo
unbundled.
1998: Tbilisi distribution
company Telasi (accounting for
30–50 percent of total national
consumption) sold to U.S. com-
pany AES. In late 2003, AES sold
Telasi to RAO UES of Russia. The
other two large distribution
companies, UDC and Ajara, are
still owned by the state. UDC is
under management contract;
privatization considered a
possibility in the future.
In 2000–02 units, (eight, of which six
are not operational) at the thermal
generation plant Tbilsresi were sold
to AES. AES also managed the
Khrami hydrogeneration station. AES
sold its assets to RAO UES in 2003.
Currently, five generating plants in
western Georgia are being prepared
for privatization.
enterprise; independent pow-
er producers; and power
supply enterprises. The state
power company, Azerenergy,
was turned into a
state-owned, closed
joint-stock company, with a
five-year program for
privatization after the
company's outstanding debts
are paid.
Annex 1 (Continued)
Country
Regulatory
development
Corporatization and
unbundling of monolithic
company Privatization of distribution Privatization of generation
(Turkish) and Baku High Volt-
age Electrical Equipment.
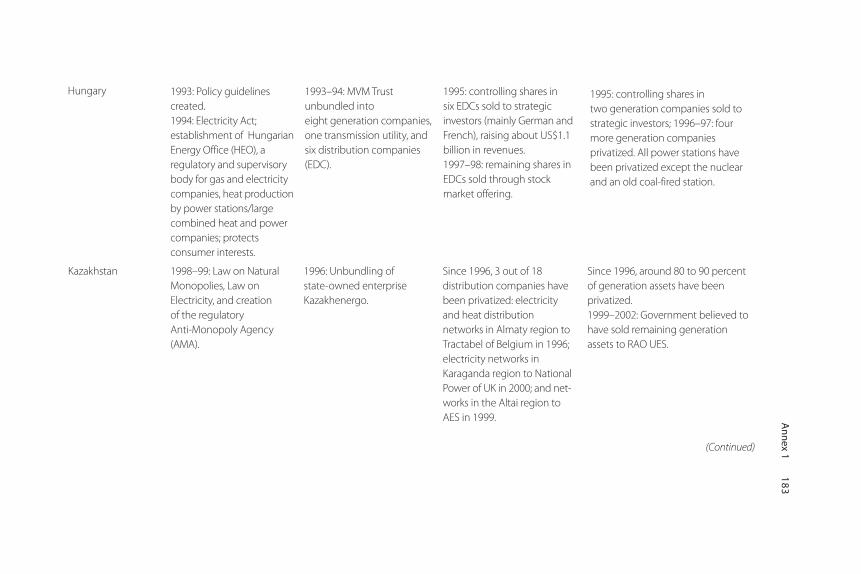
An
nex 1
18
3
Kazakhstan
Hungary
1998–99: Law on Natural
Monopolies, Law on
Electricity, and creation
of the regulatory
Anti-Monopoly Agency
(AMA).
1996: Unbundling of
state-owned enterprise
Kazakhenergo.
Since 1996, 3 out of 18
distribution companies have
been privatized: electricity
and heat distribution
networks in Almaty region to
Tractabel of Belgium in 1996;
electricity networks in
Karaganda region to National
Power of UK in 2000; and net-
works in the Altai region to
AES in 1999.
Since 1996, around 80 to 90 percent
of generation assets have been
privatized.
1999–2002: Government believed to
have sold remaining generation
assets to RAO UES.
1993: Policy guidelines
created.
1994: Electricity Act;
establishment of Hungarian
Energy Office (HEO), a
regulatory and supervisory
body for gas and electricity
companies, heat production
by power stations/large
combined heat and power
companies; protects
consumer interests.
1993–94: MVM Trust
unbundled into
eight generation companies,
one transmission utility, and
six distribution companies
(EDC).
1995: controlling shares in
six EDCs sold to strategic
investors (mainly German and
French), raising about US$1.1
billion in revenues.
1997–98: remaining shares in
EDCs sold through stock
market offering.
1995: controlling shares in
two generation companies sold to
strategic investors; 1996–97: four
more generation companies
privatized. All power stations have
been privatized except the nuclear
and an old coal-fired station.
(Continued)

184Lam
pietti,B
anerjee,an
d B
ranczik
Country
Regulatory
development
Corporatization and
unbundling of monolithic
company Privatization of distribution Privatization of generation
Poland 1997: Energy law laid out
reforms and created an
independent Energy
Regulatory Agency (ERA).
1993: Commercialization
and unbundling of PSE
(Polish Power Grid
Company).
2003: Five distribution
companies in Western and
Northern Poland
consolidated. Future plans
include creating three more
power distribution
enterprises. Privatization is
under way in eight power
distribution enterprises in
Northern and Central Poland.
Consolidation of the generation
sector continues with merger of PKE
SA and BOT. Plans are underway to
merge five other companies that
would constitute 26 percent of
national installed capacity. No
privatization has yet taken place.
Sources: (1) “Private Sector Participation in the Power Sector in ECA Countries: Lessons from the Last Decade.”World Bank. 2002. Draft. (2) “Privatization of the
Power and Natural Gas Industries in Hungary and Kazakhstan.”World Bank. 1999. (3) News sources. (4) Sargsyan G., A. Balabanyan, and D. Hankinson. 2005.
“Unexpected Light: Armenia’s Experience with Power Sector Reform.”
Annex 1 (Continued)
Moldova 1998: Electricity law
approved and independent
regulatory agency ANRE
established.
1997: State energy company
Moldenergo unbundled into
three generation companies,
five distribution, and six other
construction and heat
companies and a state
enterprise responsible for
transmission and dispatch.
1999: Sale of three out of five
distribution companies
(covering more than
two-thirds of the market) to
Union Fenosa of Spain.
No privatization has yet taken place.

18
5
Table A2.1 Power Sector Access, Payment, and Affordability for Urban Households in 2002
Households reported zero electricity
Households with access to electricity expenditures Electricity expenditures over income
Country Bottom 20% Top 20% Total Bottom 20% Top 20% Total Bottom 20% Top 20% Total
Albania 100 100 100 35 7 17 10 5 7
Armenia 98 99 99 52 20 30 10 6 8
Azerbaijan 100 100 100 13 12 12 2 2 2
Belarus 100 100 100 5 3 4 2 1 1
Bulgaria 99 100 100 1 1 1 12 8 10
Georgia 100 100 100 24 10 17 8 4 5
Hungary 100 100 100 2 1 2 7 5 6
Kazakhstan 100 100 100 9 3 4 4 2 2
Kyrgyz Republic 98 99 98 7 2 2 3 2 2
Moldova 95 100 99 30 31 25 9 6 7
Poland 100 100 100 42 28 31 10 5 7
Romania 96 100 99 28 11 15 7 5 6
Russia 100 100 100 19 12 13 2 1 1
Serbia 100 100 100 3 0 1 10 5 7
Tajikistan 100 100 100 22 13 16 3 2 2
Turkey 100 100 100 55 33 43 10 6 8
Ukraine 90 97 96 1 1 1 3 2 2
Annex 2. Summary of Household Survey Data1

186Lam
pietti,B
anerjee,an
d B
ranczik
Table A2.2 Power Sector Access, Payment, and Affordability for Rural Households in 2002
Households reported zero electricity
Households with access to electricity expenditures Electricity expenditures over income
Country Bottom 20% Top 20% Total Bottom 20% Top 20% Total Bottom 20% Top 20% Total
Albania 99 100 100 19 9 13 5 3 4
Armenia 94 99 98 55 42 42 8 4 6
Azerbaijan 99 100 100 16 12 12 2 1 1
Belarus 97 100 99 9 6 6 1 1 1
Bulgaria 94 100 99 1 0 1 8 8 8
Georgia 100 100 100 10 7 8 9 2 4
Hungary 100 100 100 3 1 2 7 5 6
Kazakhstan 100 100 100 4 1 2 3 1 2
Kyrgyz Republic 100 100 100 7 4 6 2 2 2
Moldova 97 100 99 14 11 12 7 4 5
Poland 100 100 100 41 26 32 10 7 8
Romania 86 98 94 34 26 29 6 5 6
Russia 100 100 100 18 10 12 2 1 1
Serbia 99 100 100 4 1 2 7 5 6
Tajikistan 99 99 99 13 7 9 3 1 2
Turkey 100 100 100 50 18 26 10 5 7
Ukraine 94 99 98 0 0 0 3 2 2
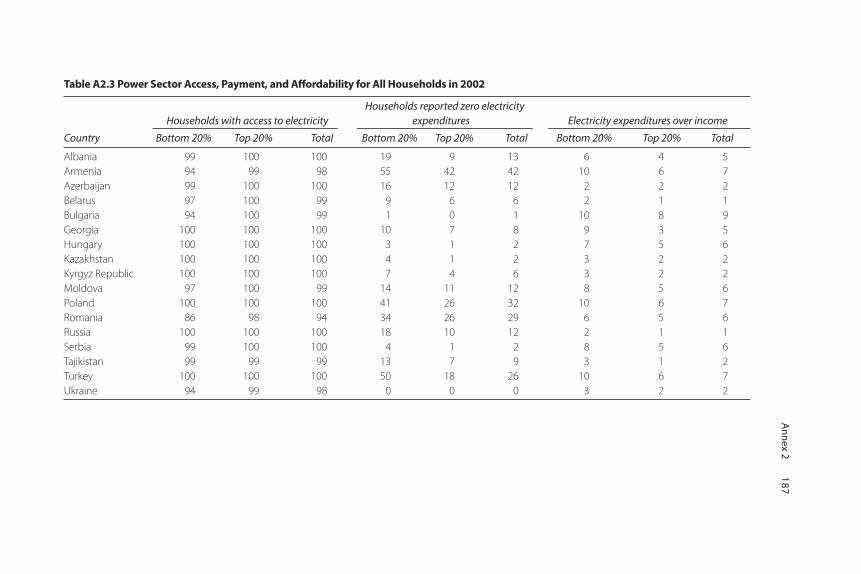
An
nex 2
18
7Table A2.3 Power Sector Access, Payment, and Affordability for All Households in 2002
Households reported zero electricity
Households with access to electricity expenditures Electricity expenditures over income
Country Bottom 20% Top 20% Total Bottom 20% Top 20% Total Bottom 20% Top 20% Total
Albania 99 100 100 19 9 13 6 4 5
Armenia 94 99 98 55 42 42 10 6 7
Azerbaijan 99 100 100 16 12 12 2 2 2
Belarus 97 100 99 9 6 6 2 1 1
Bulgaria 94 100 99 1 0 1 10 8 9
Georgia 100 100 100 10 7 8 9 3 5
Hungary 100 100 100 3 1 2 7 5 6
Kazakhstan 100 100 100 4 1 2 3 2 2
Kyrgyz Republic 100 100 100 7 4 6 3 2 2
Moldova 97 100 99 14 11 12 8 5 6
Poland 100 100 100 41 26 32 10 6 7
Romania 86 98 94 34 26 29 6 5 6
Russia 100 100 100 18 10 12 2 1 1
Serbia 99 100 100 4 1 2 8 5 6
Tajikistan 99 99 99 13 7 9 3 1 2
Turkey 100 100 100 50 18 26 10 6 7
Ukraine 94 99 98 0 0 0 3 2 2

188Lam
pietti,B
anerjee,an
d B
ranczik
Table A2.4 Power Sector Affordability Ratio Following Tariff Increase to Full-Cost Recovery
Price
elasticity e = –0.15 e = –0.25 e = –0.35 e = –0.50 e = –1
Bottom Top Bottom Top Bottom Top Bottom Top Bottom Top
Country 20% 20% Total 20% 20% Total 20% 20% Total 20% 20% Total 20% 20% Total
Albania 10 6 8 9 6 8 8 5 7 7 4 5 1 1 1
Armenia 15 9 11 14 8 10 12 7 9 11 6 8 4 3 3
Azerbaijan 4 3 4 2 2 2 0 0 0
Belarus 3 1 2 3 1 2 2 1 1 1 1 1
Bulgaria 13 10 12 13 10 11 12 10 11 11 9 10 9 7 8
Georgia 12 4 7 12 4 6 11 4 6 10 3 5 6 2 3
Kazakhstan 6 3 4 5 2 3 4 2 2 2 1 1
Moldova 10 6 8 10 6 8 9 5 7 9 5 7 7 4 5
Romania 7 6 7 7 6 6 7 6 6 7 6 6 6 5 6
Russia 5 2 3 2 1 1
Serbia 16 10 12 13 8 10 10 6 8 6 4 4
Ukraine 6 3 4 4 2 3 3 2 2 1 0 1

Table A2.5 Gas Sector Access, Payment, and Affordability for Urban Households in 2002
Households reported zero network
Households with access to network gas gas expenditures Network gas expenditures over income
Country Bottom 20% Top 20% Total Bottom 20% Top 20% Total Bottom 20% Top 20% Total
Albania na na na na na na na na na
Armenia 36 45 36 95 82 86 5 5 6
Azerbaijan 92 94 92 21 23 20 2 1 1
Belarus 92 89 90 na na na na na na
Bulgaria 1 7 4 0 0 0 3 2 2
Georgia 23 53 37 42 17 26 9 3 4
Hungary 67 84 79 9 7 8 10 5 7
Kazakhstan 30 62 50 51 19 28 3 1 2
Kyrgyz Republic 36 76 60 35 12 17 4 3 3
Moldova 60 79 72 45 29 34 9 3 5
Poland 58 83 74 49 35 38 7 5 5
Romania 55 82 75 35 8 14 6 4 5
Russia 74 65 71 27 18 19 2 0 1
Serbia 5 12 9 32 19 25 7 6 5
Tajikistan 49 51 50 na na na na na na
Turkey 0 1 0 — 100 100 — — —
Ukraine 74 79 78 14 6 8 4 2 3
n.a. = not available An
nex 2
18
9

190Lam
pietti,B
anerjee,an
d B
ranczik
Table A2.6 Gas Sector Access, Payment, and Affordability for Rural Households in 2002
Households reported zero network
Households with access to network gas gas expenditures Network gas expenditures over income
Country Bottom 20% Top 20% Total Bottom 20% Top 20% Total Bottom 20% Top 20% Total
Albania na na na na na na na na na
Armenia 12 34 22 95 66 67 13 5 5
Azerbaijan 6 11 8 6 6 7 1 2 2
Belarus 95 99 98 na na na na na na
Bulgaria 0 1 1 0 0 1 1 1 2
Georgia 8 5 6 40 26 33 7 3 5
Hungary 36 80 58 6 5 7 13 6 8
Kazakhstan 10 9 12 86 57 85 4 0 2
Kyrgyz Republic 10 39 19 100 80 89 — 4 3
Moldova 5 17 10 28 24 24 9 9 8
Poland 13 23 17 41 29 36 7 8 7
Romania 5 16 11 20 14 13 8 9 8
Russia 55 54 56 31 20 23 4 2 3
Serbia 3 8 6 31 13 22 6 5 5
Tajikistan 5 8 7 na na na na na na
Turkey 1 27 12 56 22 25 29 7 8
Ukraine 29 48 38 6 2 3 7 5 6
n.a. = not available

An
nex 2
19
1Table A2.7 Gas Sector Access, Payment, and Affordability for All Households in 2002
Households reported zero network
Households with access to network gas gas expenditures Network gas expenditures over income
Country Bottom 20% Top 20% Total Bottom 20% Top 20% Total Bottom 20% Top 20% Total
Albania na na na na na na na na na
Armenia 28 40 30 95 76 80 7 5 6
Azerbaijan 57 58 54 18 18 17 2 1 1
Belarus 93 92 92 na na na na na na
Bulgaria 1 5 3 0 0 0 3 2 2
Georgia 13 34 22 41 18 27 8 3 4
Hungary 53 83 72 8 6 8 11 5 7
Kazakhstan 15 53 34 67 20 37 3 1 2
Kyrgyz Republic 17 58 33 64 34 43 4 3 3
Moldova 23 49 32 42 28 32 9 4 6
Poland 34 68 51 48 35 38 7 5 5
Romania 21 65 46 32 8 14 7 5 5
Russia 66 63 67 28 18 20 3 1 1
Serbia 4 11 8 32 17 24 7 6 5
Tajikistan 16 24 19 na na na na na na
Turkey 1 20 8 56 23 26 29 7 8
Ukraine 57 71 65 13 5 7 4 2 3
n.a. = not available

192Lam
pietti,B
anerjee,an
d B
ranczik
Table A2.8 District Heating Access, Payment, and Affordability for Urban Households in 2002
Households with access to central Households reported zero central Central heating expenditures
heating heating expenditures over income
Country Bottom 20% Top 20% Total Bottom 20% Top 20% Total Bottom 20% Top 20% Total
Albania 0 1 0 — 0 0 — 22 18
Armenia 4 7 6 100 89 95 — 7 8
Azerbaijan 21 33 24 99 98 99 1 1 1
Belarus 89 94 92 na na na na na na
Bulgaria 21 37 31 21 6 10 12 9 11
Georgia 0 0 1 100 92 99 — 12 12
Hungary 18 32 27 10 0 3 15 10 12
Kazakhstan 32 78 60 69 22 32 12 6 8
Kyrgyz Republic 32 72 54 86 27 38 8 4 5
Moldova 60 94 78 99 66 80 19 15 15
Poland 38 67 58 23 10 11 10 7 9
Romania 41 65 57 79 35 45 13 11 11
Russia 85 95 91 36 18 24 4 2 3
Serbia 22 52 40 22 29 27 1 0 1
Tajikistan 10 32 21 91 93 96 4 9 8
Turkey 0 18 5 na na na na na na
Ukraine 56 74 64 25 6 12 7 5 6
n.a. = not available
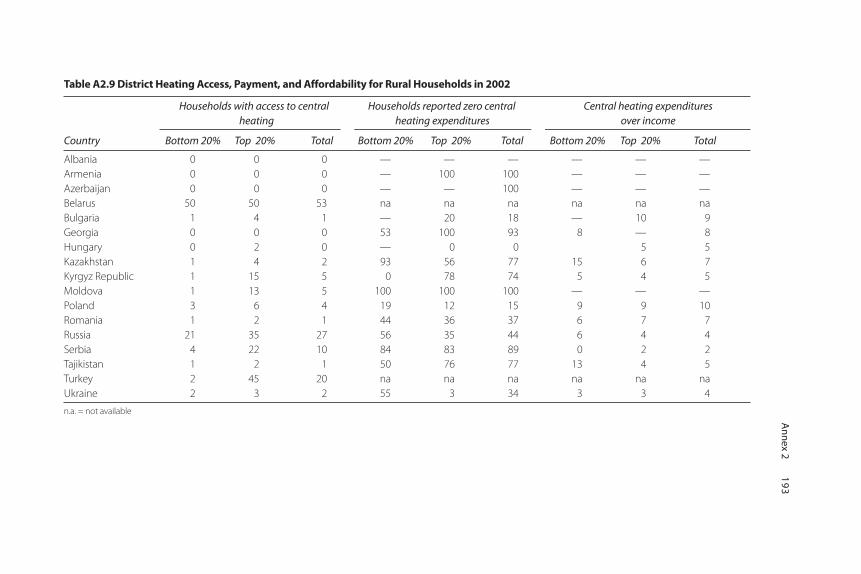
An
nex 2
19
3Table A2.9 District Heating Access, Payment, and Affordability for Rural Households in 2002
Households with access to central Households reported zero central Central heating expenditures
heating heating expenditures over income
Country Bottom 20% Top 20% Total Bottom 20% Top 20% Total Bottom 20% Top 20% Total
Albania 0 0 0 — — — — — —
Armenia 0 0 0 — 100 100 — — —
Azerbaijan 0 0 0 — — 100 — — —
Belarus 50 50 53 na na na na na na
Bulgaria 1 4 1 — 20 18 — 10 9
Georgia 0 0 0 53 100 93 8 — 8
Hungary 0 2 0 — 0 0 5 5
Kazakhstan 1 4 2 93 56 77 15 6 7
Kyrgyz Republic 1 15 5 0 78 74 5 4 5
Moldova 1 13 5 100 100 100 — — —
Poland 3 6 4 19 12 15 9 9 10
Romania 1 2 1 44 36 37 6 7 7
Russia 21 35 27 56 35 44 6 4 4
Serbia 4 22 10 84 83 89 0 2 2
Tajikistan 1 2 1 50 76 77 13 4 5
Turkey 2 45 20 na na na na na na
Ukraine 2 3 2 55 3 34 3 3 4
n.a. = not available

194Lam
pietti,B
anerjee,an
d B
ranczik
Table A2.10 District Heating Access, Payment, and Affordability for All Households in 2002
Households with access to central Households reported zero central Central heating expenditures
heating heating expenditures over income
Country Bottom 20% Top 20% Total Bottom 20% Top 20% Total Bottom 20% Top 20% Total
Albania 0 0 0 — 0 0 — 22 18
Armenia 3 4 3 100 90 95 — 7 8
Azerbaijan 13 19 13 99 98 99 1 1 1
Belarus 79 79 80 na na na na na na
Bulgaria 13 29 22 21 6 10 12 9 11
Georgia 0 0 0 70 95 97 8 12 11
Hungary 10 24 18 10 0 3 15 10 12
Kazakhstan 10 65 35 71 22 33 12 6 8
Kyrgyz Republic 9 44 22 81 35 43 7 4 5
Moldova 20 54 32 99 70 82 19 15 15
Poland 20 52 37 22 10 11 10 7 9
Romania 14 49 32 78 35 45 12 11 11
Russia 60 86 74 38 19 26 4 2 3
Serbia 12 43 27 33 38 37 1 0 1
Tajikistan 3 13 6 84 92 94 7 8 7
Turkey 1 38 14 na na na na na na
Ukraine 36 56 43 26 6 12 7 5 6
n.a. = not available

An
nex 2
19
5Table A2.11 Total Energy Sector (Power, Gas, Heat, Oil, and Wood) Affordability in 2002
Urban Rural Total
Country Bottom 20% Top 20% Total Bottom 20% Top 20% Total Bottom 20% Top 20% Total
Albania na na na na na na na na na
Armenia na na na na na na na na na
Azerbaijan 4 3 3 5 5 5 4 4 4
Belarus na na na na na na na na na
Bulgaria 18 14 16 12 15 14 16 14 16
Georgia 14 7 10 14 6 9 14 7 9
Hungary 20 13 17 19 14 17 20 14 17
Kazakhstan 10 7 9 7 7 7 9 7 8
Kyrgyz Republic 4 7 6 4 5 4 4 6 5
Moldova 14 14 14 7 10 8 9 12 10
Poland 15 13 14 11 18 13 13 14 14
Romania na na na na na na na na na
Russia na na na na na na na na na
Serbia 14 7 10 16 9 12 15 8 11
Tajikistan na na na na na na na na na
Turkey 14 13 13 13 12 13 13 12 13
Ukraine 9 7 8 7 7 7 9 7 8
n.a. = not available

196Lam
pietti,B
anerjee,an
d B
ranczik
Table A2.12 Water Sector Access, Payment, and Affordability for Urban Households in 2002
Households with access to cold Households reported zero cold Cold water expenditures
water network water expenditures over income
Country Bottom 20% Top 20% Total Bottom 20% Top 20% Total Bottom 20% Top 20% Total
Albania 79 96 91 40 14 24 2 1 1
Armenia 94 99 97 97 88 92 2 2 3
Azerbaijan 89 87 86 21 27 23 1 1 1
Belarus 87 93 91 na na na na na na
Bulgaria 93 100 99 15 8 8 5 2 3
Georgia 90 97 94 70 45 56 2 1 1
Hungary 94 99 98 23 21 20 5 3 4
Kazakhstan 68 93 86 29 10 14 2 1 1
Kyrgyz Republic 63 91 80 44 14 21 1 1 1
Moldova 61 96 78 69 45 52 4 2 3
Poland 97 100 99 37 18 21 5 2 3
Romania 77 97 92 42 9 18 6 4 5
Russia 94 98 96 32 15 20 2 1 1
Serbia 96 100 99 na na na na na na
Tajikistan 82 87 82 34 28 31 3 2 2
Turkey 71 96 87 74 57 62 5 2 3
Ukraine 84 95 89 19 6 9 2 1 2
n.a. = not available

An
nex 2
19
7Table A2.13 Water Sector Access, Payment, and Affordability for Rural Households in 2002
Households with access to cold Households reported zero cold Cold water expenditures
water network water expenditures over income
Country Bottom 20% Top 20% Total Bottom 20% Top 20% Total Bottom 20% Top 20% Total
Albania 33 53 39 17 21 24 2 1 1
Armenia 87 88 86 97 95 95 3 1 2
Azerbaijan 27 32 32 27 9 13 1 1 1
Belarus 53 52 55 na na na na na na
Bulgaria 86 99 93 12 7 7 5 3 4
Georgia 66 79 74 78 83 80 3 0 1
Hungary 85 99 94 21 18 21 4 3 4
Kazakhstan 34 37 33 3 13 6 2 1 1
Kyrgyz Republic 10 47 22 37 21 23 0 1 1
Moldova 2 8 4 52 33 38 4 2 3
Poland 90 97 94 65 53 58 4 3 3
Romania 7 23 14 42 26 30 4 3 3
Russia 57 73 65 52 41 45 2 1 1
Serbia 71 92 83 na na na na na na
Tajikistan 21 36 29 16 18 17 2 1 2
Turkey 98 100 99 50 26 33 6 3 4
Ukraine 35 35 34 29 23 27 2 1 1
n.a. = not available

198Lam
pietti,B
anerjee,an
d B
ranczik
Table A2.14 Water Sector Access, Payment, and Affordability for All Households in 2002
Households with access to cold Households reported zero cold Cold water expenditures
water network water expenditures over income
Country Bottom 20% Top 20% Total Bottom 20% Top 20% Total Bottom 20% Top 20% Total
Albania 48 76 61 29 16 24 2 1 1
Armenia 91 94 92 97 91 93 2 2 2
Azerbaijan 64 63 62 22 23 21 1 1 1
Belarus 78 79 80 na na na na na na
Bulgaria 90 100 97 14 8 8 5 3 4
Georgia 75 90 84 75 58 66 2 1 1
Hungary 90 99 97 22 21 21 5 3 4
Kazakhstan 44 84 63 15 10 12 2 1 1
Kyrgyz Republic 24 69 42 42 16 22 1 1 1
Moldova 21 52 32 67 44 51 4 2 3
Poland 93 99 97 51 26 35 4 3 3
Romania 30 79 56 42 10 19 6 4 5
Russia 79 94 88 37 18 25 2 1 1
Serbia 82 98 92 na na na na na na
Tajikistan 36 54 43 27 23 24 3 1 2
Turkey 85 99 94 59 34 44 5 2 4
Ukraine 66 80 71 21 8 12 2 1 2
n.a. = not available

Annex 2 199
Note
1. All data reported in this annex are derived by the authors from 2002household budget data.

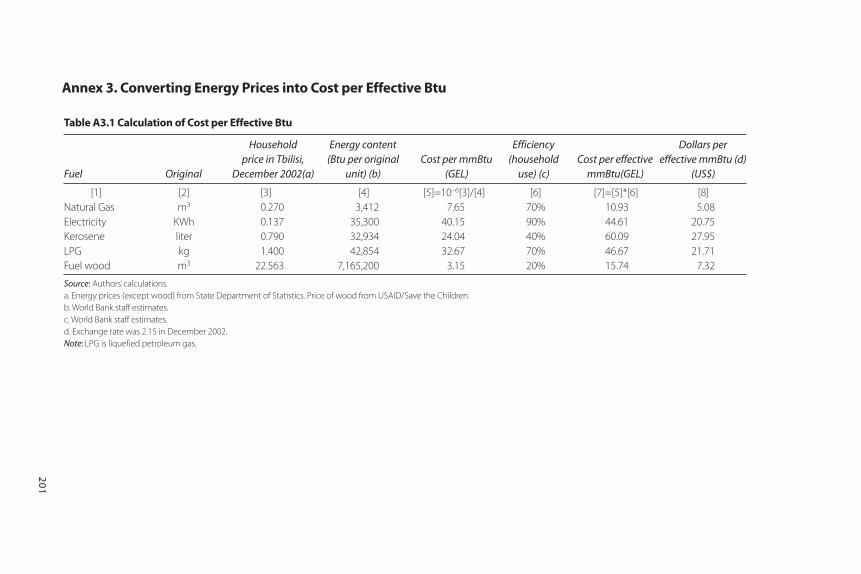
20
1
Table A3.1 Calculation of Cost per Effective Btu
Household Energy content Efficiency Dollars per
price in Tbilisi, (Btu per original Cost per mmBtu (household Cost per effective effective mmBtu (d)
Fuel Original December 2002(a) unit) (b) (GEL) use) (c) mmBtu(GEL) (US$)
[1] [2] [3] [4] [5]=10–6[3]/[4] [6] [7]=[5]*[6] [8]
Natural Gas m3 0.270 3,412 7.65 70% 10.93 5.08
Electricity KWh 0.137 35,300 40.15 90% 44.61 20.75
Kerosene liter 0.790 32,934 24.04 40% 60.09 27.95
LPG kg 1.400 42,854 32.67 70% 46.67 21.71
Fuel wood m3 22.563 7,165,200 3.15 20% 15.74 7.32
Source: Authors’calculations.
a. Energy prices (except wood) from State Department of Statistics. Price of wood from USAID/Save the Children.
b. World Bank staff estimates.
c. World Bank staff estimates.
d. Exchange rate was 2.15 in December 2002.
Note: LPG is liquefied petroleum gas.
Annex 3. Converting Energy Prices into Cost per Effective Btu

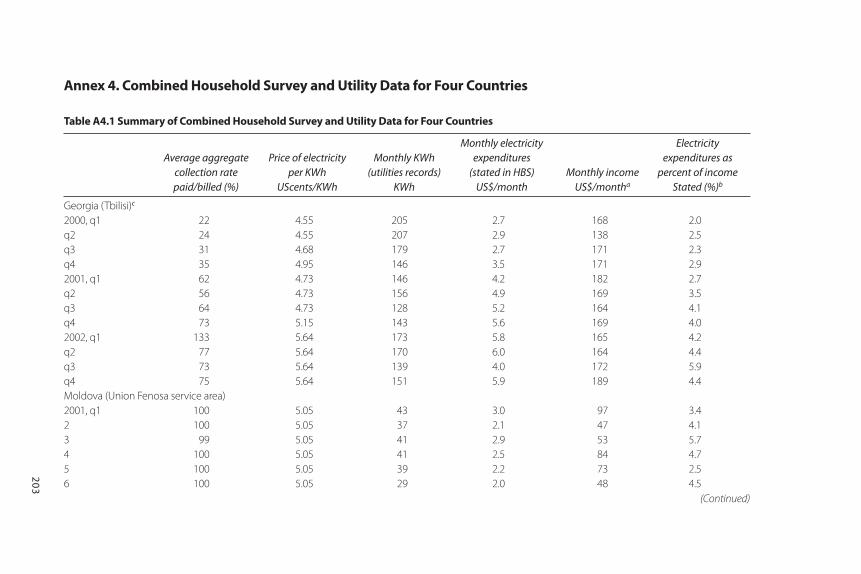
Table A4.1 Summary of Combined Household Survey and Utility Data for Four Countries
Monthly electricity Electricity
Average aggregate Price of electricity Monthly KWh expenditures expenditures as
collection rate per KWh (utilities records) (stated in HBS) Monthly income percent of income
paid/billed (%) UScents/KWh KWh US$/month US$/montha Stated (%)b
Georgia (Tbilisi)c
2000, q1 22 4.55 205 2.7 168 2.0
q2 24 4.55 207 2.9 138 2.5
q3 31 4.68 179 2.7 171 2.3
q4 35 4.95 146 3.5 171 2.9
2001, q1 62 4.73 146 4.2 182 2.7
q2 56 4.73 156 4.9 169 3.5
q3 64 4.73 128 5.2 164 4.1
q4 73 5.15 143 5.6 169 4.0
2002, q1 133 5.64 173 5.8 165 4.2
q2 77 5.64 170 6.0 164 4.4
q3 73 5.64 139 4.0 172 5.9
q4 75 5.64 151 5.9 189 4.4
Moldova (Union Fenosa service area)
2001, q1 100 5.05 43 3.0 97 3.4
2 100 5.05 37 2.1 47 4.1
3 99 5.05 41 2.9 53 5.7
4 100 5.05 41 2.5 84 4.7
5 100 5.05 39 2.2 73 2.5
6 100 5.05 29 2.0 48 4.5
(Continued)
20
3
Annex 4. Combined Household Survey and Utility Data for Four Countries

7 100 5.05 29 2.2 50 5.5
8 99 5.04 47 3.2 73 6.0
9 100 5.01 51 3.0 72 5.4
10 100 5.03 56 3.0 90 4.5
11 100 5.25 60 3.2 72 5.1
12 100 5.26 57 3.0 72 4.9
2002, q1 100 4.99 62 3.2 76 4.3
2 100 4.99 53 2.8 73 4.9
3 99 5.00 50 2.6 70 4.7
4 100 5.00 49 2.7 69 5.0
5 100 4.98 53 2.6 74 4.0
6 98 4.99 45 2.5 73 4.4
7 99 4.98 50 2.6 77 4.3
8 100 4.99 50 2.8 87 4.1
9 99 5.26 52 3.0 109 3.6
10 100 5.25 52 2.6 99 3.4
11 100 5.26 60 3.1 94 3.8
12 100 5.27 64 3.5 102 3.9
2003, q1 98 5.10 69 3.0 98 3.6
2 100 5.13 58 4.0 94 4.5
3 99 5.13 65 3.3 90 3.9
4 99 5.15 56 3.0 100 3.5
5 100 5.13 56 3.3 95 3.8
204Lam
pietti,B
anerjee,an
d B
ranczik
Monthly electricity Electricity
Average aggregate Price of electricity Monthly KWh expenditures expenditures as
collection rate per KWh (utilities records) (stated in HBS) Monthly income percent of income
paid/billed (%) UScents/KWh KWh US$/month US$/montha Stated (%)b
Table A4.1. (Continued)

An
nex 4
20
56 99 5.13 55 3.1 92 4.1
7 96 5.17 52 3.0 104 3.7
8 97 5.61 51 2.7 102 3.4
9 96 5.55 51 3.4 127 3.9
10 95 5.54 60 2.9 105 3.4
11 85 5.51 61 3.3 91 4.5
Armenia (Yerevan) 3/
June–Dec. 98 89 3.80 173 5.9 100 9.0
Azerbaijan 2002 (all months) Baku, only metered households
Poorest
20% 65 1.96 190 2.2 123 2.1
2 61 1.96 202 2.1 137 1.9
3 74 1.96 192 2.3 154 1.9
4 68 1.96 201 2.4 161 1.9
Richest
20% 81 1.96 200 2.6 189 2.2
Total 71 1.96 198 2.3 158 2.0
Source: Calculated from household survey data and utility company billing records.
a. Income proxied by total monthly household expenditures.
b. In Armenia and in Azerbaijan, electricity expenditures shown here are not stated in the survey, but calculated as an average monthly electricity payment from the utility company records.
c. Decreasing electricity consumption despite increasing income may be due to rationing.


Georgia
-
4
8
12
16
1991 1992 1993 1994 1995 1996 1997 1998 1999 2000
GW
h
thermal/fossil fuels hydro
Armenia
-
5
10
15
20
1988
1990
1991
1992
1993
1994
1995
1996
1997
1998
1999
2000
2001
2002
GW
h
thermal GWh hydro GWh nuclear GWh
Azerbaijan
-
5
10
15
20
25
1992 1993 1994 1995 1996 1997 1998 1999 2000
GW
h
thermal/fossil fuels hydro
Hungary
-
10
20
30
40
1990 1991 1992 1993 1994 1995 1996 1997 1998 1999 2000
GW
h
thermal/fossil fuels hydro
nuclear comb. renew + waste
Figure A5.1 Changes in Generation Mix in the Past Decade
(Continued)
20
7
Annex 5. Changes in Generation Mix in the Past Decade and Price and Income Elasticity of Demand Estimates

208Lam
pietti,B
anerjee,an
d B
ranczik
Kazakhstan
-
20
40
60
80
100
1992 1993 1994 1995 1996 1997 1998 1999 2000
GW
h
thermal/fossil fuels hydro
Poland
120
130
140
150
1990 1991 1992 1993 1994 1995 1996 1997 1998 1999 2000
GW
h
thermal/fossil fuels hydro renewables comb. renew + waste
Figure A5.1 (Continued)
Source: Lampietti 2004.

209
Table A5.1. Empirical Estimates of Price and Income Elasticity of Residential
Electricity Demand in Developing Countries
Country Price elasticity Income elasticity Source
Ethiopia –0.74 1.005 Kebede, Bereket, Almaz Bekele, and
Elias Kedir. 2002. “Can the Urban Poor
Afford Modern Energy? The Case of
Ethiopia.” Energy Policy 30.
Greece –0.41 1.56 Hondroyiannis, George. 2004.
“Estimating Residential Demand for
Electricity in Greece.” Energy
Economics.
India –0.42 (winter) Filippini, Massimo, and Shonali
–0.51 Pachauria. 2004. Elasticities of
(monsoon electricity demand in urban Indian
–0.29 (summer) 0.6–0.64 households. Energy
Policy 32: 429–436.
Norway –0.5 (short-run) 0.2 Nesbakken, Runa. 1999. “Price
sensitivity of residential energy
consumption in Norway.” Energy
Economics 21.
Taiwan –0.15 1.04 Holtedahl, Pernille, and Frederick
L. Joutz. 2004. “Residential Electricity
Demand in Taiwan.” Energy
Economics 26.
United Kingdom –0.5 0.5 Manning, D. N. 1988. “Household
demand for energy in the UK.”
Energy Economics January.
United States –0.5 0.62 Silk, Julian I., and Frederick L. Joutz.
1997. “Short and long-run elasticities
in U.S. residential electricity demand:
A co-integration approach.”
Energy Economics 19.
United States –0.27 Wills, John. 1981. “Residential demand
for electricity.” Energy Economics
October.


Alam, A., M. Murthi, R. Yemtsov, and others. 2005. Growth, Poverty, andInequality—Eastern Europe and the Former Soviet Union. Washington, DC:World Bank.
ANRE (National Energy Regulatory Agency). 2002. Report on National Agencyfor Regulation of Energy Activity During 2001. Chisinau.
ANRE. 2003. Report on National Agency for Regulation of Energy Activity During2002. Chisinau.
BBC News Online. 2006. “Russia Blamed for ‘Gas Sabotage.’” January 22, 2006.
Besant-Jones, John E. 2006. Lessons and Sourcebook for Reforming Power Marketsin Developing Countries. Washington, DC: World Bank.
Bhatnagar, B. 2001. “Filipino Report Card on Pro-poor Services.” Report No.22181-PH, Environment and Social Development Sector Unit, East Asia andPacific. World Bank, Washington, DC.
Birdsall, N., and J. Nellis, eds. 2005. Reality Check: The Distributional Impact ofPrivatization in Developing Countries. Center for Global Development,Washington, DC.
Birdsall, N., and J. Nellis. 2003. “Winners and Losers: Assessing the DistributionalImpact of Privatization.” World Development 31(10): 1617–33.
References
211

Bourguignon, F., and L. A. Pereira da Silva. 2003. “The Impact of EconomicPolicies on Poverty and Income Distribution: Evaluation Techniques andTools.” Washington, DC: World Bank. www.worldbank.org/PSIA.
Bucknall, J. 1999. “Poland—Program for Air Protection in Silesia Project.” ProjectInformation Document, World Bank, Washington, DC.
Bucknall, J., and G. Hughes. 2000. “Poland—Complying with EU EnvironmentalLegislation.” Technical Paper No. 454, World Bank, Washington, DC.
Castel, Paulette. Forthcoming. “Moldova: Public and Private Safety Net.” InRecession, Recovery, and Poverty in Moldova. Vol. 2. Report No. 28024-MD.ECSPE, World Bank, Washington, DC.
Chisari, O., A. Estache, and C. Romero. 1999. Winners and Losers from UtilityPrivatization in Argentina: Lessons from a General Equilibrium Model. PolicyResearch Working Paper No. 1824, November 30, 1999, World Bank,Washington, DC.
CISR (Counterpart International/Center for Strategic Studies and Reforms).2002. “Evaluation of Social Assistance to Population through the NominativeTargeted Compensations.” Low-Income Energy and Social Assistance Project(LIESAP). Chisinau.
Clarke, G. R. G., and S. J. Wallsten. 2002. Universal(ly Bad) Service: ProvidingInfrastructure Services to Rural and Poor Urban Consumers. Policy ResearchWorking Paper No. 2868, July 19, 2002, World Bank, Washington, DC.
Cornillie, J., and S. Frankhauser. 2002. “The Energy Intensity of TransitionCountries.” Working Paper 72, European Bank for Reconstruction andDevelopment.
Coudouel, Aline, and Stefano Paternostro, eds. 2005. Analyzing the DistributionalImpact of Reforms: A Practitioner’s Guide to Trade, Monetary, and ExchangeRate Policy, Utility Provision, Agricultural Markets, Land Policy and Education.Volume 1. Washington, DC: World Bank.
COWI A/S. 2002a. Urban Heating Strategy Development for Republic of Armenia.Draft Final Consultant Report to the Government of Armenia.
COWI A/S. 2002b. Development of Heat Strategies for the Kyrgyz Republic. DraftFinal Consultant Report.
Dalmazzo, A., and G. de Blasio. 2003. “Resources and Incentives to Reform.”Staff Papers 50(2), International Monetary Fund, Washington, DC.
Department of Privatization of the Republic of Moldova. http://www.privatization.md/privatization/privatization_companies/strategic_projects/wine_tobac-co_energy/energy/.
Department of Statistics, Yerevan. 1999. “Socio-economic Situation of theRepublic of Armenia,” January–December. Monthly Statistical AnalyticalReport 2000. Government of Armenia.
212 References

Dodonu, Veaceslav. 1999. “Moldova’s Power Sector: Challenges andOpportunities.” www.bisnis.doc.gov/bisnis/bisdoc/000113power.htm.
EBRD (European Bank for Reconstruction and Development). 2001 “TransitionReport 2001: Energy in Transition.” London.
Economist Intelligence Unit. 2004. “Moldova Country Report. February 2004.”www.eiu.com.
Environmental Resources Management. 2002. Urban Heating Strategy forArmenia: Demand Analysis. Draft Report. London.
Esanov, A., M. Raiser, and W. Buiter. 2001. “Nature’s Blessing or Nature’s Curse:The Political Economy of Transition in Resource Based Economies.” WorkingPaper 65, European Bank of Reconstruction and Development. London.
ESMAP (Energy Sector Management Assistance Program). 2000. Increasing theEfficiency of Heating Systems in Central and Eastern Europe and the FormerSoviet Union. Report 234/00, ESMAP, World Bank, Washington, DC.
ESMAP. 2001. Improved Space Heating Stoves for Ulan Baatar (Mongolia).Implementation Completion Report, ESMAP, World Bank, Washington, DC.
Estache, A., V. Foster, and Q. Wodon. 2001. Accounting for Poverty inInfrastructure Reform. World Bank Institute, World Bank, Washington, DC.
Flaig, Gebhard. 1990. “Household Production and the Short- and Long-RunDemand for Electricity.” Energy Economics April 1990.
Foreign Investment Advisory Service Report on Azerbaijan. 2002. InternationalFinance Corporation, Washington, DC.
Foster V., E. Tiongson, and C. R. Laderichi. 2005. In Analyzing the DistributionalImpact of Reforms: A Practitioner’s Guide to Trade, Monetary, and ExchangeRate Policy, Utility Provision, Agricultural Markets, Land Policy, and Education.Volume 1. A. Coudouel and S. Paternostro, eds. World Bank, Washington, DC.
Freinkman, L., G. Gyulumyan, and A. Kyurumyan. 2003. “Quasi-Fiscal Activities,Hidden Government Subsidies, and Fiscal Adjustment in Armenia.” WorldBank, Washington, DC.
Freund, C. L., and C. I. Wallich. 1995. “Raising Household Energy Prices inPoland: Who Gains? Who Loses?” Policy Research Working Paper 1495,World Bank, Washington, DC.
Freund, C., and C. Wallich. 1996. “The Welfare Effect of Raising HouseholdEnergy Prices in Poland.” The Energy Journal 17:1.
Galal, A., L. Jones, P. Tandon, and I. Vogelsang. 1994. Welfare Consequences ofSelling Public Enterprises: An empirical analysis. World Bank: OxfordUniversity Press.
Guasch, J. L. 2004. “Granting and Renegotiating Infrastructure Concessions—Avoiding the Pitfalls.” World Bank, Washington, DC.
References 213

Hellman, J. S. 1998. “Winners Take All: The Politics of Partial Reform in Post-Communist Transitions.” World Politics 50(2).
Hill, Fiona, and Clifford G. Gaddy. 2003. The Siberian Curse: How Communist PlannersLeft Russia Out in the Cold. Washington, DC: Brookings Institution Press.
IMF (International Monetary Fund). 2001a. “Republic of Armenia: RecentEconomic Developments and Selected Issues.” Country Report 01/78. IMF,Washington, DC.
IMF. 2001b. “Republic of Moldova: Recent Economic Developments andSelected Issues.” Country Report No. 01/22. IMF, Washington, DC.
IMF. 2001c. “Republic of Georgia: Recent Economic Developments and SelectedIssues.” Country Report 01/211. IMF, Washington, DC.
Institute for Public Policy/CIVIS. 2004. “Barometer of Public OpinionApril–May 2004.” Public Opinion Poll Press Release. Chisinau, Moldova.
International Energy Agency. 2000. “Energy Balances of OECD and Non-OECDCountries.” www.iea.org.
———. Various years. “Energy Balances of OECD and Non-OECD Countries.”www.iea.org.
IPA Energy Consulting. 2003. “South East Europe Power Sector Affordability.”November. Edinburgh, Scotland.
Junge, Nils, and Julian A. Lampietti. 2006. In Poverty and Social Impact Analysisof Reforms: Lessons and Examples from Implementation, ed. A. Coudouel,A. A. Dani, and S. Paternostro. Washington, DC: World Bank.
Kaiser, M. J. 1999. “Energy Utilization Patterns in the Republic of Armenia I.Residential Sector.” Energy Sources 21 (9).
Katyshev, S., and G. Mandrovskaya. 2003. “Social and Environmental Impact ofElectricity Reform in Kazakhstan.” ECSSD, World Bank, Washington, DC.
Kennedy, D. 1996. “Competition in the Power Sector of Transition Economies.”Working Paper 41, European Bank of Reconstruction and Development, London.
Kennedy, D. 2003. “Power Sector Regulatory Reform in Transition Economies:Progress and Lessons Learned.” Working Paper 78, European Bank ofReconstruction and Development, London.
Komives, K., D. Whittington, and X. Wu. 2001. “Infrastructure coverage and thepoor: A global perspective.” Policy Research Working Paper 2551, WorldBank, Washington, DC.
Komives, K. D., Vivien Foster, Jonathan Halpern, and Quentin Wodon. 2005.Water, Electricity, and the Poor: Who Benefits from Utility Subsidies?Washington, DC: World Bank.
Krishnaswamy, V., and G. Stuggins. 2003. “Private Participation in the PowerSector in Europe and Central Asia, Lessons from the Last Decade.” WorkingPaper No. 8, World Bank, Washington, DC.
214 References

Lampietti, J. A., ed. 2004. Power’s Promise: Electricity Reforms in Eastern Europeand Central Asia. Working Paper No. 40, World Bank, Washington, DC.
Lampietti, J.A., and A. Meyer. 2002. “Coping with the Cold: Heating Strategies forEurope and Central Asia’s Urban Poor.” Technical Paper No. 529, World Bank,Washington, DC.
Lampietti, J. A., A. A. Kolb, S. Gulyani, and V. Avenesyan. 2001. “Utility Pricingand the Poor: Lessons from Armenia.” Technical Paper No. 497, World Bank,Washington, DC.
Lampietti, J. A., and B. Kropp. 2002. “Climbing Down the Energy Ladder?Household Energy Trends in Eastern Europe and Central Asia.” ECSSD,World Bank, Washington, DC.
Lampietti, J.A., H. Gonzalez, E. Hamilton, M.Wilson, and S.Vashakmadze. 2003.“Revisiting Reform: Lessons from Georgia.” ECSSD,World Bank,Washington,DC.
Lengyel, L. 2003. “Status of Power Sector in Hungary.” Eurocorp Commerz Ltd.,ECSSD, World Bank, Washington, DC.
Linn, Johannes, and Roy With. Bahl. 1992. Urban Public Finance in DevelopingCountries. New York: Oxford University Press.
Lovei, L., E. Gurenko, M. Haney, P. O. Keefe, and M. Shkaratan. 2000. Scorecardfor Subsidies: How Utility Subsidies Perform in Transition Economies.Washington, DC: World Bank.
Lvovsky, K. 2000. “Environmental Costs of Fossil Fuels.” Environment DepartmentPapers No. 78, Pollution Management Series, World Bank, Washington, DC.
Markandya, A., M. Jayawardena, and R. Sharma. 2001. “The Impact ofInfrastructure Investments on Measured Poverty.” A Viewpoint Note, unpub-lished manuscript, World Bank, Washington, DC.
McKenzie, D., and D. Mookherjee. 2002. “Distributive Impact of Privatization inLatin America: An Overview of Evidence from Four Countries.” EconomiaSpring 2003: 161–218.
Moldovan Economic Trends. 2003. “Economic Trends Quarterly Issue.”July–September. www.met.dnt.md.
Nadiradze, N. 2003. “Study of Social and Environmental Impacts of ElectricityReform in Georgia.” ECSSD, World Bank, Washington, DC.
Paul, S. 1994. “Does Voice Matter? For Public Accountability, Yes.” PolicyResearch Working Paper 1388, World Bank, Washington, DC.
Paul, S. 1998. “Making Voice Work: The Report Card on Bangalore’s PublicService.” Policy Research Working Paper 1921, World Bank, Washington, DC.
Petri, M., G.Taube, and A.Tsyvinski. 2002. “Energy Sector Quasi-Fiscal Activitiesin the Countries of the Former Soviet Union.” IMF Working PaperWP/02/60, IMF, Washington, DC.
References 215

Public Expenditure Database for the Transition Countries. World Bank (2002).
Republic of Moldova. 2002. Annual Social Report 2001. Ministry of Labor andSocial Protection, Chisinau.
Republic of Moldova. 2003. Annual Social Report 2002. Ministry of Labor andSocial Protection, Chisinau.
Rio+10. 2001. “Report on the Rio+10.” National Assessment WorkshopMoldova, Chisinau, June 20, 2001.
Saavalainen, T. O., and J. ten Berge. 2003. “Energy Conditionality in Poor CISCountries.” IMF, Washington, DC.
Sachs, J., and A. Warner. 1995. “Natural Resource Abundance and EconomicGrowth.” NBER Working Paper No. 5398, National Bureau of EconomicResearch, Cambridge, Mass.
Sargsyan, Gevorg, Ani Balabanyan, and Denzel Hankinson. 2005. “UnexpectedLight: Armenia’s Experience with Power Sector Reform.” World Bank,Washington, DC.
State Department for Statistics of Georgia. 2001. “Poverty Monitoring inGeorgia: Annual Report 2000.” Tbilisi.
STC (Save the Children). 2002. “Multi-Sectoral National Survey of Householdsin Georgia.”
Subramanian, S., and A. Deaton. 1996. The Demand for Food and Calories.Journal of Political Economy 104:1.
SwedPower/FVB. 2001. Strategic Heating Options for Moldova. Final ConsultantReport.
The Economist. 2002. “Russian Electricity: In Need of Shock Therapy.” August 31,pp. 50–51.
UNECE (United Nations Economic Commission for Europe) Co/FAO (Foodand Agriculture Organization). 2000. “Forest Resources of Europe, CIS,North America, Australia, Japan and New Zealand: Contribution to theGlobal Forest Resources Assessment 2000.” Geneva Timber and Forest StudyPapers 17. United Nations, New York and Geneva.
United Nations Environment Programme. 2002. “Caucasus EnvironmentOutlook.” UNEP, Nairobi.
U.S. Department of Energy, Energy Information Administration. 1997. AnnualEnergy Consumption Percentiles, 1997. www.eia.doe.gov.
Valiyev, V. 2003. “State of Azerbaijan Republic Electric Power Industry(1990–2002).” Shems Energy Ltd., Baku.
Vashakmadze, E., and V. Kvekvetsia. 2000. “Georgian Power Sector Deficit.”Sector Note, ECSSD, World Bank, Washington, DC.
216 References

Wodon, Q., M. I. Ajwad, J. Baker, R. Jayasuriya, C. Siaens, and J. P. Tre. 2003.“Poverty and Public Spending in Latin America.”World Bank,Washington, DC.
World Bank. 1993a. “Armenia: Energy Sector Review.” Washington, DC.
World Bank. 1993b. “Energy Efficiency and Conservation in the DevelopingWorld: The World Bank’s Role.” World Bank Policy Paper, Washington, DC.
World Bank. 1996a. “Improving Social Assistance in Armenia.” Washington, DC.
World Bank. 1996b. “Republic of Moldova: Energy Project.” Staff AppraisalReport, Washington, DC.
World Bank. 1997a. “Georgia: Power Rehabilitation Project.” Staff AppraisalReport, Washington, DC.
World Bank. 1997b. “Poland—Country Economic Memorandum: Reform andGrowth on the Road to the EU.” World Bank Economic Report, July 1997,Washington, DC.
World Bank. 1998. “Energy in Europe and Central Asia: A Sector Strategy for theWorld Bank Group.” Discussion Paper No. 393, Washington, DC.
World Bank. 1999a. “Privatization of Power and Natural Gas Industries inHungary and Kazakhstan.” Technical Paper No. 451, Washington, DC.
World Bank. 1999b. “Georgia Poverty and Income Distribution.” Report No.19348-GE, Washington, DC.
World Bank. 1999c. “Hungary, on the Road to the European Union.” World BankCountry Study, November 1999, Washington, DC.
World Bank. 1999d. “Proposed Energy Sector Adjustment Credit (Georgia).”Washington, DC.
World Bank. 2000a. “Kazakhstan Public Expenditure Review—I, II, and III.”Report No. 20489-KZ, Poverty Reduction and Economic Management Unit,Europe and Central Asia, Washington, DC.
World Bank. 2000b. “Making Transition Work for Everyone: Poverty andInequality in Europe and Central Asia.” Washington, DC.
World Bank. 2000c. World Development Indicators. Washington, DC.
World Bank. 2000d. “Estonia: Implementation Completion Report for a DistrictHeating Rehabilitation Project.” Report No. 20631, Washington, DC.
World Bank. 2000e. “Maintaining Utility Services for the Poor: Policies andPractices in Central and Eastern Europe and the Former Soviet Union.”Washington, DC.
World Bank. 2001. World Development Report 2000/2001: Attacking Poverty. NewYork: Oxford University Press.
World Bank. 2002a. “Description of the Existing Power Networks in Armenia—Bank Mission Aide Memoirs.” ECSIE, Washington, DC.
References 217

World Bank. 2002b. “Implementation Completion Report. Republic of MoldovaEnergy Project.” Report No. 24446-MD, ECSIE, Washington, DC.
World Bank. 2002c. “Georgia Public Expenditure Review.” Report No. 22913-GE, Poverty Reduction and Economic Management Unit, Europe andCentral Asia, Washington, DC.
World Bank. 2002d. “Private Sector Development in the Electric Power Sector:A Joint OED/OEG/OEU Review of the World Bank’s Assistance in the1990s.” Washington, DC.
World Bank. 2002e. “Georgia Poverty Update.” Report No. 22350-GE,Washington, DC.
World Bank. 2003a. World Development Indicators. CD-ROM, Washington, DC.
World Bank. 2003b. “Armenia Public Expenditure Review.” Report No. 24434-AM, Poverty Reduction and Economic Management Unit, Europe andCentral Asia, Washington, DC.
World Bank. 2003c. “Azerbaijan Public Expenditure Review.” Report No. 25233-AZ, Poverty Reduction and Economic Management Unit, Europe andCentral Asia, Washington, DC.
World Bank. 2003d. “Moldova Public Economic Management Review.” ReportNo. 25423-MD, Poverty Reduction and Economic Management Unit,Europe and Central Asia, Washington, DC.
World Bank. 2003e.”Project Appraisal Document. Moldova Energy II.”Washington, DC.
World Bank. 2003f. “Azerbaijan Rural Investment Project Social Assessment.”Washington, DC.
World Bank. 2003g, “A User’s Guide to Poverty and Social Impact Analysis.”Washington, DC. www.worldbank.org/psia.
World Bank. 2004a. “Public and Private Sector Roles in the Supply of ElectricityServices.” Washington, DC.
World Bank. 2004b. “World Development Report—Making Services Work forPoor People.” Washington, DC.
World Bank. 2004c. Recession, Recovery and Poverty in Moldova. Vols. I and II.Report No. 28024-MD. ECSPE, Washington, DC.
World Bank. 2004d. “Good Practice Note: Using Poverty and Social Impact Analysisto Support Development Policy Operations.” June 21, Washington, DC.
World Bank. 2004e. “Armenia—Country Assistance Strategy.” June 30,Washington, DC.
World Bank. 2004f. “Moldova Sharing Power: Lessons Learned from the Reformand Privatization of Moldova’s Electricity Sector.” December 10,Washington, DC.
218 References

World Bank. 2004g. “Azerbaijan Raising Rates: Short-Term Implications ofResidential Electricity Tariff Rebating.” December 10, Washington, DC.
World Bank. 2005a. “Country Partnership Strategy for Georgia.” August 18,Washington, DC.
World Bank. 2005b. World Development Indicators. Washington, DC.
World Bank. 2006. World Development Report 2006: Equity and Development.Washington, DC.
WHO (World Health Organization). 2002. “Reducing Risk, Promoting HealthyLife.” World Health Report, Geneva.
References 219


A
accountability. See transparency andaccountability
AES Corporation, 13, 64–65, 89, 175AES Telasi (Georgia), 65, 66b, 73–83Africa, 8, 169, 176Albania, 166, 166fArmenia, xxvi, 45–65
background to price hike, 46–47, 47f,48b, 160
cash transfers to minimize tariffincrease, 57–58
consumer surplus change in, 147data analysis, 48benergy sector deficit in, 7, 36, 37financing instruments and, 156fiscal deficit in, 23foreign investment in, 12, 59, 61nheat demand, 128fheating strategies for the urban
poor in. See heating strategies for urban poor
impact of reform, 53–57on arrears levels of poor and
nonpoor, 55, 56f
on bill amounts and payments, 55,56f
environmental effects of, 157,158–59, 163n
magnitude and term of tariffincrease, 53–54, 170
overall impact of price increase,54, 54t
on poor and nonpoor, 55, 58–59natural gas consumption in, 39–40, 154power sector reform in, 35, 36t, 170,
171residential energy consumption in, 23,
48–53, 205tattitudes toward reform, 53consumption and expenditure, 44n,
49–50, 50tcoping with increasing collections,
51, 171improvements in electricity supply,
50–51substitutes, use of, 51–53, 52f,
58–59, 157uses of energy, 48–49, 49t
Armenian Natural Monopoly RegulatoryCommission, 153
Index
221
Boxes, figures, notes, and tables are indicated by “b,” “f,” “n,” and “t.”

Asia, 176Azerbaijan
data analysis, 22, 24, 28, 29, 111beconomic gains from improved access
to electricity in, 23, 28energy resources in, 36, 109–11, 110thealth spending in, 8household response to tariff increase,
114–19compensation to households, 117,
117tdifferences between poor and non-
poor, 22, 29, 118, 118t, 122household electricity demand model,
28, 115–17, 116t, 145substitutes, availability of, 24, 118–19,
119tincome effect in, 147mitigation of tariff increases, 119–21
clean substitutes, improving accessto, 120
efficiency of energy use, improving,120
gradual tariff increases, 119, 170lifeline tariffs or direct transfers,
120–21outside Baku, data from, 121service quality linked to tariff
increases, 119–20, 121–22political consideration and tariff
increases in, 152reform in, 35, 36t, 166, 166f, 171
effect on consumption, 114t, 114–15environmental effects of, 157, 159,
163nresidential energy consumption,
112–13, 112–13t, 205t
B
Baku–Tbilisi–Ceyhan pipeline, 85nbarter system, 104–5basic services, accessibility for poor people
to, 153blackouts, 38, 95, 153Bolivia, 14, 177building capacity, 172–73Bulgaria, 14, 135
C
China, 139nclean fuel substitutes. See fuel substitutes
coal, 40See also fuel substitutes
Cochabamba water facility (Bolivia), 14combined heat and power (CHP) plants,
126, 136, 139consumers as stakeholders, 20consumer surplus change, 147, 147fcorruption
in Armenia, 53as factor affecting reform, 170, 171in Georgia, 26, 66b, 76, 82, 83,
87n, 171in Moldova, 89state–managed infrastructure and, 4, 37
cost recovery. See designing reforms toassist poor; power sector reforms;specific countries
Czech Republic, 14
D
deforestation. See environmental effectsdesigning reforms to assist poor, xxviii,
165–77See also implications for operational
designcontrolling consumption, 170coping mechanisms, 168cost recovery, improving, 170direct transfers or tariff–based subsidies,
169elasticity of electricity demand,
167–68power sector affordability ratio by
country, 188tenergy consumption, improving
efficiency of, 169–70nonpayment, 167outside factors affecting reform, 170–71PSIAs
advantages of, 29–30lessons from, 173–74potential of, 167, 171–73
raising tariffs gradually, 170reforms affecting poor, 167–68residential energy consumption, 167service quality, improving, 168successful reform, designing and
implementing, 170–71suitable policies, 171tariff reform, 166, 166f
diesel. See fuel substitutes
222 Index

Index 223
direct transfers. See tariff–based subsidiesvs. direct transfers
dung. See fuel substitutes
E
efficiency, 8, 9t, 11, 120, 156–57, 169–70electricity consumption. See household
consumption trendsEnergy Regulatory Commission
(Armenia), 47environmental effects
deforestation, 40, 46, 52, 59, 130, 137,159–60
heating strategies for urban poor and,125, 129–30, 136–37
of reform, mitigation of, 11, 23, 72–73,156–60, 158f, 159t, 168
Estonia District Heating Project,139–40n
European Bank for Reconstruction andDevelopment, 126
European Union, 43n
F
financing instruments, 155–56fiscal deficit, 15–16nforeign investment, 81, 89
See also specific companiesin Armenia, 12, 59, 61nenergy sector reform and, 12–13in Georgia, 13, 63–65, 73–77, 79,
81–83, 89in Moldova, 13, 91, 92b, 98–101, 104–5
fuel substitutesin Armenia, 48–50, 51–53, 52f, 157in Azerbaijan, 24, 115–16, 118–19,
119t, 120clean fuels, 84n, 120, 154f, 154–55, 160as coping mechanism to reduce energy
expenditures, 168environmental costs of, 157–60, 158f,
159tin Georgia, 25, 68f, 68–73, 73f, 84–85n,
141nheating strategies for urban poor and,
125, 129f, 129–30, 134, 137, 141n,152
household consumption trends and, 38,39–42, 41t
in Moldova, 94, 101, 103, 105–6n
G
gas and district heating, 39–40, 154f, 154–55See also fuel substitutesdistrict heating access, payment, and
affordabilityall households, 194trural households, 193turban households, 192t
gas sector access, payment, and affordabilityall households, 191trural households, 190turban households, 189t
general equilibrium (CGE) model,21–23
Georgia, xxvii, 63–87data analysis, 24–29, 66–67b, 67feconomic gains from improved
electricity access in, 28environmental effects of reform in, 157,
159, 163nfinancing instruments and, 155–56health spending in, 8heating in, 141nmitigating transfers
effectiveness of, 27, 77–79, 77–79t,149
proposing better mitigating strategy,27, 79–81, 80f, 81t, 152
power sector reform in, 13, 36, 36t, 37,64f, 64–66, 82, 170, 171, 177
privatization contract in, 171residential energy consumption, 67–73,
203tavailability of energy and, 67effect of reform on, 28, 44n, 69f,
69–70gas usage, 71–72household energy expenditure
changes and, 27–28, 70relative energy price changes and,
40, 67–69, 68fservice quality changes and, 70, 75,
152, 168traditional fuel usage and, 25, 72–73,
73fwelfare implications of electricity
consumption and, 27, 28, 29,71, 72f
revenue increase by utility, 73–81, 74tnonpayment, 26, 76–77, 82, 83, 167,
172, 175

prices, 74t, 75remetering and enforcement, 26, 76,
81, 86nservice quality, 70, 75, 152, 168subsidies, 23, 75
Georgian National Energy RegulatoryCommission (GNERC), 85n
Georgian Wholesale Electricity Market(GWEM), 82, 83, 84n
Global Environment Facility, 161ngovernments as stakeholders, 19
H
health effects. See environmental effectsheating strategies for urban poor,
125–41heat demand, measurement of,
127–29b, 128fhousehold demand for heat, 129f,
129–38consumption of heat, 131–32, 132festimation of, 130f, 130–31heat consumption, 131–32household heat expenditure,
132–33, 133finefficient heating systems, 126–27methodology and data sources for,
127–29b, 128frethinking heat supply, 133–38
cost of full service, 134, 135fcost of reduced service, 135–37,
136f, 137fother policies, 137–38
hot water, 6, 48–49, 71, 101, 139nhousehold budget surveys (HBSs), 25–26,
42–43n, 66b, 68, 79, 80, 111b, 151household consumption trends, xxvi,
xxvii, 35–44See also specific countrieschanges in consumption across income
groups, 41, 42fother energy sources, 39–42
gas and district heating, 39–40,189–93t
non–network fuels, 40, 41tpatterns of reform and, 35–37, 36t,
181–84residential electricity consumption,
37–39, 37–39f, 203–5thousehold survey data by country,
185–87t
nonpayments, 39, 40tservice quality and availability, 38
Hungary, 14, 35, 36t, 149, 157
I
implications for operational design, xxviii,145–54
direct transfers and lifeline transfers, 77,120–21, 148–52, 150t, 169
environmental effects of reform, miti-gating, 156–60deforestation, 159–60fuel substitution, environmental
costs of, 157–59, 158f, 159timprovement of, 160increased energy production
efficiency, 156–57other considerations, 151–52pro–poor mitigating measures,
152–56access to gas and other clean substi-
tutes, 154f, 154–55collections increase, 153–54explicitly linking tariff increases to
service quality improvement,152–53
financing instruments, 155–56investments in efficiency, 155metering as priority, 155slow rise in tariffs, 153
simulating impact of tariff reforms,145–48, 146f, 147–48t, 207–8
India, 153international financial institutions (IFIs),
4, 5, 8, 14, 89, 126International Monetary Fund (IMF), 43nInternet–linked metering technology, 155Itera (Russia), 84n
K
Kazakhstan, 13, 36, 36t, 157, 159, 162nkerosene, 42
See also fuel substitutesKyrgyz Republic
heat strategies for urban poor. Seeheating strategies for urban poor
tariff reform in, 166, 166f
L
Latin America, xxv, 4, 5, 8, 169, 176See also specific countries
224 Index
Index 225
lifeline tariffs, 120–21, 148–52See also tariff–based subsidies vs. direct
transfersliquefied petroleum gas (LPG), 38, 40Living Standard Measurement Study
(LSMS), 25lump–sum transfers, xxiii, 11, 18, 169
See also tariff–based subsidies vs. directtransfers; specific countries
M
Macedonia, 166, 166fmanagement contracts, 78, 83, 171, 175metering and enforcement, 12–13,
151–52, 155, 170See also specific countries
Midland Resources Holding, 59, 61nMillennium Development Goals (MDGs),
xxv, 5, 6t, 7fMoldenegro (Moldova), 90Moldova, xxvii, 89–107
data analysis, 24–29, 91–93benergy sector deficit in, 7, 36, 37foreign investment in, 12, 13health spending in, 8heat demand in, 128, 128fheating strategies for urban poor in. See
heating strategies for urban poormitigating strategy, proposal for improv-
ing, 97f, 103–4nominative targeted compensation
(NTC) system, 90, 101–3, 102bpostindependence decline of, 89–91, 90fprivate vs. public utilities in, 28,
98–101, 99–101treform in, 35, 36t, 170, 171, 177
impact on poor, 27, 29, 97–98, 104,149, 172, 177
reversal of, 14remonetization of economy in, 104–5residential energy consumption, 27, 93f,
93–103, 96t, 203–5tdifferences between rural and urban
households, 96t, 96–97, 97felectricity consumption, effect of
reform on, 24–25, 94–95, 95fservice quality, effect of reform on,
95–96social transfer system, effectiveness of,
101–3, 102b, 103t, 149stakeholder engagement in, 29–30
Mongolia, 141n
N
National Energy Regulatory Agency(ANRE, Moldova), 105n
natural gas. See gas and district heatingnominative targeted compensation (NTC),
90, 101–3, 102bnon–network fuels, 40, 41t, 42
See also fuel substitutesnonpayment
in Armenia, 54t, 54–57, 56fin Azerbaijan, 110in Georgia, 26, 76–77, 82, 83, 167, 172,
175heating strategies for urban poor and,
126–27impact of reforms on poor and, 167implications for operational design and,
153–54trends in residential consumption and,
39, 40tNREDs, 91, 92b, 98–100, 103–4
See also Moldova
P
Philippines, 153Poland, 14, 35, 36t, 43n, 139n, 149,
157–58, 159poverty, xxv
analyses. See poverty and social impactanalyses (PSIAs)
reforms to assist poor. See designingreforms to assist poor; specificcountries and types of energy
urban poor. See heating strategies forurban poor
poverty and social impact analyses(PSIAs), xxiv, 17–31
See also specific countriesadaptation to local context, 173advantages for designing reforms, 29–30allowance of adequate time and
resources, 173–74building capacity, 172–73controversial issues, reforming of, 174ex post and ex ante approaches, 29, 174generation of better data and evidence,
25–28, 171–72lessons from, 173–74limitations of methodology, 28necessary steps, 173potential of, 167, 171–73

privatization, alternatives to, 174–75purpose of studies, 18–19qualitative analysis, 24–25, 48bquantitative analysis, 25, 66–67b,
91–92b, 111bstakeholders of reform, 19–20, 21t, 172,
174theoretical basis for, 20–23welfare indicators measurement, 23–28
Poverty Reduction Strategies (PRSs), xxvipower sector reforms, 3–16
See also specific countries and types ofpower
onset of crisis and, 7–8problems of, 11–13, 12t, 181–84promise of, 8–11, 9t, 10trising prices and rising opposition,
13–14, 14fconverting prices into cost per
effective Btu, 201tunique challenges of ECA and, 5–7, 6t
prepayment systems, 155, 170President’s fund (Georgia), 86nprivatization
See also power sector reforms; specificcountries for experience with privatization
alternatives to, 174–75voucher, 14
Prototype Carbon Fund, 161npublic services report card, 153
R
RAO UES, 61n, 81reform and household consumption
trends. See household consumptiontrends
regional electricity redistribution centers(REDs), 90–91
residential energy consumption. Seehousehold consumption trends;specific countries
Romania, 154Rose Revolution, 81rural areas, 38
See also specific countriesdistrict heating access, payment, and
affordability by country, 193telectricity access, payment, and
affordability by country, 186t
gas sector access, payment, and afford-ability by country, 190t
total energy sector affordability bycountry, 195t
water sector access, payment, andaffordability by country, 197t
Russia, 13–14, 43n, 84–85n, 90, 104,154–55
S
Sakenegro (Georgia), 64Sakgazia (Georgia), 84nSave the Children (STC), 66b, 68, 73, 86nSerbia and Montenegro, 166, 166fservice quality
in Azerbaijan, 119–20, 121–22energy sector reform and, 8, 9tin Georgia, 70, 75, 152, 168impact of reforms on poor and, 168in Moldova, 95–96tariff increases, linking of, 152–53trends in residential consumption and,
38Siberia, 15n, 147smart metering technology, 155, 170Social Account Matrix, 22social benefit transfers, 11
See also specific countriessocialist legacy of energy infrastructure,
4–6, 6t, 13stakeholders of reform, 19–20, 21t, 29–30,
172, 174subsidies, 7–8, 17, 75, 169
See also tariff–based subsidies vs. directtransfers; specific countries
T
Tajikistan, 44n, 166, 166ftariff–based subsidies vs. direct transfers,
17, 77, 120–21, 148–52, 150t, 169See also specific countries
tariff reform, xxv, 17–18, 166, 166fSee also power sector reforms; specific
countriesTbilgazi (Georgia), 84nTelasi (Georgia), 63, 64–65, 70
See also AES Telasi (Georgia)theft of services, 26, 63, 65, 100–101, 110,
172Tractabel, 13
226 Index
Index 227
traditional fuel usage. See fuel substitutes-transparency and accountability,8, 153
Turkmenistan, 36
U
Ukraine, 90, 104, 161nUnion Fenosa, 13, 91, 92b, 98–101United Energy Distribution Company
(UEDC), 82United Kingdom, 4, 112United Nations Environment Program
(UNEP), 157United States, 93–94, 112urban households
district heating access, payment, andaffordability by country, 192t
electricity access, payment, and affordability by country, 185t
gas sector access, payment, and affordability by country, 189t
poor. See heating strategies for urbanpoor
total energy sector affordability bycountry, 195t
water sector access, payment, andaffordability, 196t
U.S. Agency for InternationalDevelopment (USAID), 75, 86n
Uzbekistan, 166, 166f
V
value–added tax (VAT), 82volume–differentiated tariff, 151voucher privatization, 14
W
Washington Consensus, 14water, heating of. See hot waterwater sector access, payment, and afford-
abilityall households, 198trural households, 197turban households, 196t
welfare impact of reforms, 20, 148–52See also poverty and social impact
analyses (PSIAs); specific countriesWinter Heat Assistance Program (WHAP,
Georgia), 75, 77–78, 80wood. See fuel substitutesWorld Bank
Armenia and, 45, 60n, 61nGeorgia and, 64heating for urban poor and, 125, 126privatization and, 174–75on PSIAs, 30, 167role of, 4transparency and accountability and, 153Ukraine and, 161n
World Development Report 2004: MakingServices Work for Poor People (WorldBank), 153

Eco-AuditEnvironmental Benefits Statement
The World Bank is committed to preserving endangered forests and naturalresources. The Office of the Publisher has chosen to print People andPower on 30% post-consumer chlorine-free recycled fiber paper in accor-dance with the recommended standards for paper usage set by the GreenPress Initiative—a nonprofit program supporting publishers in using fiberthat is not sourced from endangered forests. By using this paper, the fol-lowing were saved: 7 trees, 341 pounds of solid waste, 2,658 gallons ofwater, 640 pounds of greenhouse gases, and 5 million BTUs of total energy.For more information, visit www.greenpressinitiative.org.


ISBN 0-8213-6633-5
The Energy Sector Management Assistance Program (ESMAP) is a global technical assistance
program that promotes the role of energy in poverty reduction and economic growth with
redistribution. ESMAP undertakes analytical work and provides policy advice on sustainable
energy development to governments and other institutions in developing countries and
economies in transition. ESMAP was established in 1983 under the joint sponsorship of the
World Bank and the United Nations Development Programme as a partnership in response
to global energy crises. Since its creation, ESMAP has operated in some 100 countries through
approximately 500 activities covering a broad range of energy issues.
This is a very well written, easily readable book that will be accessible to a wide readership.
I found its focus on the winners and losers, and especially on the costs to low-income users
of power, very welcome. The analytical framework of PSIAs is well presented; it is intuitive
and analytically sound and its application is convincingly demonstrated. The extensive and
pragmatic uses of the simple tools of welfare economics are welcome in their transparency
and rigor.
—Johannes F. Linn
Executive Director, The Wolfensohn Initiative
The Brookings Institution
This is a comprehensive piece of work, an engaging narrative with lots of insight, and the
authors should be highly commended for it. They highlight the essence of the problem:
the mismatch between timing of costs and benefits associated with reform, which is
exacerbated by expectations rooted in old communist times. Certainly the level of detailed
analysis that they provide should be useful in informing the design of reform programs
that may be more politically acceptable.
—David Kennedy
Senior Economist at the Department of Trade and Industry
UK Government
Related Documents