ED 173 202 _! DOCUMENT RESUdi 95 .,._ fs; 1,_.... AUTH,OR, ,- Hannan, Michael T.; Tula, -Nancy -andon7.-- ..., : --- 0 ,- e.- TITLE Final Report for Dynamic Models: .,ausal Analysis of Panel Data. Methods-for Ttopibra Ilysis..PnXt I, .- , ,. Chapter: 1._ % INSTITUTION Stanford Univ., Calif... ...,,SPONS AGENCY National Inst.of Education (DdEW), WashingtOni D.:C;1 , National .5cienbe Foll:dtio.n, washingtoio-b.7C.-. PUBDATE . Oct 78 GRANT 8NS-76-22943; NI E -G -76 -0082; oc-73.-1231F-; , .--... ---::: .. NOT 9 47p.; Po lg.or the- original dOc0mont i$ missin-9;- - . 1 i For relatad4lo&-uments,'-'ss SO:011_. 759-772 ..,,, , EURS PRTCE M01/CO2 Plus Postage. -... _ .. DESCRII)ToRS *Comparative- AnaIYsisk- Models; ,.*Pessarch D.,:.sinn; *I.:e3est,ch7Ns.ods;. *RessArcn Problems; *Socialthailg?;- 6ocial-Scienc-?: Research; .3ociolc4yi;SOciomet-ric, . . ,Tchniqu?,s;--*Timi7-: Perspectiv. . A Bs Tik ,r)c*T - Phi docum-=,nt is part of A...sries of chanters: de.sc=ibd in SO 011 759.' Working from,th pr'emise- -Y.hat telporal ----:analysis.is-indisOnsa4 for th Study Of change, ths docume.,nt . .- I) --)1(AILL.n?s,major-alarnatives'in research design-of. laisnafur.s. .Fivs.,. sT!Ctions focus on the fures, advantag-a.s, And lithitaiOns- of fsmporal analYsis. your designs which concern both ghantitativl and qqlitativ eutcom.s- irevalued: paril, event-count, , 1/,.--nt-segunc,,':, ,and Thitht-hi'St.ory'. Panal. designs record stat..,s, . occupncy of-a- Saipis of units. at two or mor-,- points' in time; for- . =XAMPYi Vot-q.-6 disclose voting int-shtions in a sequ,-.nce oI.surveys leading up to an :=Aection. An evat-count :cord s .the humbT2r ot diffl--ht typs. Or _events in an int?rval (amployed, ullamploysd; .. mird, not.ma7rio.d). An evant7sagunc di!.S-ign rcordS til: segusnce's of states occupied-by each unit and is ms?ful in study of caresrs. An,sv-:.nt-histy asiq,,t, r.cords timing of all movs:in a sequeno,e. '. FOr-.rAcampil, 3 study or collectiva volenzi rscordd the data.s. Of all .' -%'-uch-events grf,ater -than 'soMe mi.nimll sicop-i. cohclusiOn arr-that' LI iint-cou, :-11--_,nt-squances, And ev-_nt-nistoriss 6..rmit-tuch fine model- *-4stir g and should he uss)(Lmor,.3, or t,=A ,in sociol-ogical ressarch. AlsO, sociologists hav,a began to d4-vo.mora attenton to mOdeling chlni-,: processes whicn prmit .:.io-hr u of tTmp6ral data Finally, 7.11.. :d to :.'xamine linked chang,.aS in gu.lity and conntitl is -,-ocpr--ssed.,,(Author/KC) l'ehroductions suppli--I ay 'L.)5'.-3 h, from ti = criqinil locum =--%7. *

Welcome message from author
This document is posted to help you gain knowledge. Please leave a comment to let me know what you think about it! Share it to your friends and learn new things together.
Transcript
ED 173 202
_! DOCUMENT RESUdi
95.,._
fs; 1,_....
AUTH,OR, ,- Hannan, Michael T.; Tula, -Nancy -andon7.-- ..., : . --- 0 ,-
e.- TITLE Final Report for Dynamic Models: .,ausal Analysisof Panel Data. Methods-for Ttopibra Ilysis..PnXt I, .- ,
,.
Chapter: 1._ %
INSTITUTION Stanford Univ., Calif....
...,,SPONS AGENCY National Inst.of Education (DdEW), WashingtOni D.:C;1 ,
National .5cienbe Foll:dtio.n, washingtoio-b.7C.-.PUBDATE . Oct 78GRANT 8NS-76-22943; NI E -G -76 -0082; oc-73.-1231F-; , .--...
---::: ..NOT 9 47p.; Po lg.or the- original dOc0mont i$ missin-9;- - . 1 i
For relatad4lo&-uments,'-'ss SO:011_. 759-772 ..,,, ,
EURS PRTCE M01/CO2 Plus Postage. -...
_ . ..DESCRII)ToRS *Comparative- AnaIYsisk- Models; ,.*Pessarch D.,:.sinn;*I.:e3est,ch7Ns.ods;. *RessArcn Problems; *Socialthailg?;-6ocial-Scienc-?: Research; .3ociolc4yi;SOciomet-ric, . .
,Tchniqu?,s;--*Timi7-: Perspectiv. .
A Bs Tik ,r)c*T-
Phi docum-=,nt is part of A...sries of chanters:de.sc=ibd in SO 011 759.' Working from,th pr'emise- -Y.hat telporal
----:analysis.is-indisOnsa4 for th Study Of change, ths docume.,nt.
..-
I)--)1(AILL.n?s,major-alarnatives'in research design-of. laisnafur.s. .Fivs.,.sT!Ctions focus on the fures, advantag-a.s, And lithitaiOns- offsmporal analYsis. your designs which concern both ghantitativl andqqlitativ eutcom.s- irevalued: paril, event-count, ,
1/,.--nt-segunc,,':, ,and Thitht-hi'St.ory'. Panal. designs record stat..,s, .
occupncy of-a- Saipis of units. at two or mor-,- points' in time; for- .
=XAMPYi Vot-q.-6 disclose voting int-shtions in a sequ,-.nce oI.surveysleading up to an :=Aection. An evat-count :cord s .the humbT2r otdiffl--ht typs. Or _events in an int?rval (amployed, ullamploysd; ..
mird, not.ma7rio.d). An evant7sagunc di!.S-ign rcordS til: segusnce'sof states occupied-by each unit and is ms?ful in study of caresrs.An,sv-:.nt-histy asiq,,t, r.cords timing of all movs:in a sequeno,e. '.FOr-.rAcampil, 3 study or collectiva volenzi rscordd the data.s. Of all .'
-%'-uch-events grf,ater -than 'soMe mi.nimll sicop-i. cohclusiOn arr-that' LI
iint-cou, :-11--_,nt-squances, And ev-_nt-nistoriss 6..rmit-tuch finemodel- *-4stir g and should he uss)(Lmor,.3, or t,=A ,in sociol-ogical ressarch.AlsO, sociologists hav,a began to d4-vo.mora attenton to mOdelingchlni-,: processes whicn prmit .:.io-hr u of tTmp6ral data Finally,7.11.. :d to :.'xamine linked chang,.aS in gu.lity and conntitl is-,-ocpr--ssed.,,(Author/KC)
l'ehroductions suppli--I ay 'L.)5'.-3 h,from ti = criqinil locum =--%7. *

APR
FARt I - Chapter
DYNANTC MODE S FOR ±AUSAL ANALYSIS OF PANEL
METHODS F R TEMPORAL ANALYSIS
Michael T. Hann Nancy Brandon
ord.University
OctOher 197$
T44 ,I
work on 'this paperInstitute of=Fduca:Foundation (S0078-Science_ Foundation*avanced Study ±ftOblished in, a forThis paper is alsoLaboratory for Soc
U.S. DEPARTMENT OF NEALTI:EDUCATION WELFARENATIONAL INSTITUTE OF.
EDUCATION
',f1115 DOCUMENT HAS SEEN REPRO-.
1DUCED EXACTLY -AS RECEIVED FROMTHE PERSON OR ORGANIZATION ORIGIN-
1ATING II. POINTS OF VIEW OR OPINIONSSTATED DO NOT NECESSARILY REFIRE.SENT.OFFICIAL NATIONAL INSTITUTE OPEDUCATION POSITION OR' PpLicy
ATA.'
s supported by grants from the National'o_ (NIP-C76'-.0082) and the Nationa Sciente
Hannan was:also supporters r4ant BNS76-22943 to the Center for rhrBehavioral Sciences. .This paper will be
c9mipg issue of Annual Reviews in 'StoLzp.vailableas Technical Report #68 of theI Research, Stanford University...
TRODUCTION
ualitative Outcomes
an11;411g Outcomes
EVENT-HISTORY ANALYSIS
tra
Extensions'
Latent States
Es
Population Heterogeneity
Time Stationatity
oment EstimationEstimation
M4xitnm Likelihood Est
Partial L slihood Estima,tion\ t
PANELINALYSIS OF QUALITATIVE OUTCOMES
The ContiegencyTable Strafe
Regressipn Strategy
I Continuous TimeStrategit
PANEL ANALYSIS OF QUANTITATIVE OUTCOMES
/Strategies
Estimation
1E SERIES, ANALYSIS,
CONCLUSIONS
16
17
18
19
21
22
22
25

ODUCTION,
Most ociological'reSearch still relieS on cross-sectional analysis.4_
etheless,'the field has a long hiatory' interest emporil analysis.- , _ -
Much of the traditional interest derivbs from the conc- that causal
inferences cannot be Macle'dependably from g cross sec because one
pannot ihoW that 'a variable affects ehailge in another. This concern was
frequently accompanied by exaggetated,claims for the p wer of temporal
analysis. The older li eralUre abounds with claim': the t temporal designs
are_ always Uperior to. cross-.4avtions.: We have,since ealized,that cross-.
sections ' give sounder results if confounding in`fluene =s vary more vet
time than over units. As a result of this knowledge much more empered
view-on:the methodological value of tempOral'analysis.currently'pervacles
ociology.
Current' enthusiasffipfor'temporel analysis steals more from substantiVe
eoncers than fro ethodological prejudice; ,MeerOsotiblogy,i-ias begin to
reorient to issues of structural change.- Likewise the study of individual
4
development aree s has ldemed progressively larger in microanalysis.
So6,iolgista ny srilSes have come to emphablze change; temporal
analys indispensible for the study of ghange whatever its:nther
benef
re are least two literatures on temporal. analysis 'one'dealing
h ise-reee outcomes, theiother h quantitative :outo es. eas and-.
..developments in one area diffuse ..slowly-into the other. At present,- J 8 ..
progress on specifyinglthe ptobabiliste mechanisms is been eater in.j-, ,
the:study of discrete outcomes; explicit stochastic models underlie --
,
many sociological' studies of change th qualitative variables. Studies
.changes in .quantitative variables eVidence an ad hoc approach to

atmea _or.causa
effee
stddies of.ctange -in both discrete and
r basic design issues as ,weA,-as-a variety
eohnical.fissneaidoncerning/
literature-on this subj
:biometrics econometric
aniy'of these fields: Rte
mationand 'testa Much df the technical
annd outside.Soctology--in stapttics,
ring etc, 'We do not pretend'to survey
emphastge met actually US
soc °logical research: We `the An allied:riglds hendevelopme
they-have soxe obvioua-beafingA6ndutrent research practice in so iolOgyz
Sticiological ethrdology has recently- favored' reatments o estimation
and testing rather than-d design issues may be-stifficient-
ly well understood that such an` emphasis is appropriate, this is not the. .
case in temporal analysis. Thus we begin by reviewing the major
alternatives n the design o temporal anarYsis.
Qualttative Outcomes
Studies of ch in qualitative variables typfidally take on'e of
foul- forms : pan -count, event-sequence, or event- story deSigna
Sociologists have relie mainly on panel designs which record state occupancy
ofasimple of units two or more points' intime. Lazarsfeld, terelson &
Gaucletrs (4944) viTti_n
disclose their,votfng _
study is he prrtotype:.yr
individuals in a sample(
ntions in a sequence of surveys Ivceding an;
el In'tudies changes ,.in cognitive and affective scates "panel
surveys appear to be td alte ative. Halever, when interest focuses on-
changes n state -Whose timing may recalled accurately, panel data
thered retrospectivel. The classic example is amalvsis of

robilit tha_t is based: on info.rration.on current- otr upation and on occupation
some earlier time (
age, etc
.if accuracy of re
father's job whd reSPoOdent is 16 years
designs compare favorably to
ntly- high, retrospective panel
designs -that record outcomes -sontemporane-
ously. But they differ, greatly in one respect the sampling process.
A current-panpl seletts a. sample or population and follows members
forward in time; a retrospectiveopanel selects a sample and works
backwards in time.
I
a retr ective panel systematically-mis represents earlienpoptlations.
or whose sons dicta
son mobility
As Duncan (1960).has shown for mobility naly
Men frot :earlier generations who did .not fLtherRsond
emigrated are not represented in a retrospective
table. The etroepective panel yields c ensored samples of earlie
populations. One way around the-proble ,ias Duncan has noted,-la to
eonsiderthe'father-son.table a characterization of the status origins
of those interviewed at the second "wave." But the problem is not ,so
easily avoided if one retainaaninterest i the prope, as of `change.-_
(./
An eventcbuht design fills some of the gaps in the panel design:
it records the number of different types oeevents an inaerval.
When a unit can be in only taro states married or tried),
records sidOly the number of times each state is left (e.g., the number
-f martiagdsland. marital dissolutions) in a period. Wen there are
several taes'(e.i 1TengloYed- 2-=unemOloyed, and 3= of- the - labor'
orce), an event-Count design-may record the'number of episodes (or
--spells) in each.state each unit S,11 more usefully, it may give:,
-/the number of transitions. between.ps of states .g., changes from-1
v be distinguished from choiabs froM 1 to 3),- Event -count designsA7[

are comparatiVeiy,_ ociology, except counts. of a singes k:
of riots ,lynchiriga, hospitalizations, aic. ,Methe4s
.
'specifically develop analysis of event counts are still rarer, and
Our di'scpssion below touches pay briefly on, methods for this des4 .
Sociological methodologyAstipe10
change processes fry di'sign as compared to either the
a study of what can be learned about
traditiongl-panel des 13.1 'tdesigns that supply
1,-
sr i tempOve,al ordering.
An event-
each un
equenc de's
n mere iriformation
uences 9f states opcupied.., by (
, 4
,it can4be ewed as an 1_ on of the event -cent design.4
Suppose the possible states a
might be (2
an-event-seqgenc
1, and 3%
as above. A unit's record
soteAperiod of time.. Singe i,(1977.) awes that
_Sign,p, °vides the' mind necessary info
that-this design improves considerably o thestudying career
more common pane
sociology (see,
0
,This,type of design ism far from new
I-
9), 1)1'4 interest'lim it has only
recently reawakened (see, Spildiman'1977 id Hogan 1978
not revIew'literature,on thip deslgn in a separate section as it is
'customaryto=analyie event sequences using- techniques for panel nalysis;
this ePP oath assumed that the timing of events is
An evenb7hilary (or sample patho
recotds the timing of all moves in a.sequence., M11'
small
elevant'l *
designfilll in re twining gaps:
coup interaction provide ever -hiStory data
tunity 19 observe a group contiguously, experimenter_i' '..,,
ing Of, nsitions among structural tyPes, Jri nonexp rimental
aboratory studies
e to' the poor
y rec9rd t
/studies, event histories a epeceslarily iqtroSpective! Nonetheless,
r
they may, differ Markedly iii 'length of the recall period. The Johns
--2
,Hopkins pccupatton,l history study Co eman et 1972) record dates
entrie man exita-in ondentol-cateers. lbe-Seatt- envet--
Income Maintenance EXpe_ ant obtains h inforlition e well.. But
Once families are intervieWed.three:times a year,oyer,4 A
.
respondents need to recall theit'Avent.bistor es fbr only four month,
:he study period,
pe ibds (Robins &Tunis 1971').
Perhaps the most widesptead application of eyen history,desi
'in archival reseaich For example, C. Tilly's (see references below)
1 1,
.pioneering study of :ends in collective violence in small French
s records the Bates events of collective.violence greater than
thdt illy typically Aggregates ova knits
o the year) in his.analysis,shOuld not
obscure the fact that the design itself records -event histories to a
population ofismall areal nits. Numerous other studies of collective4
same minimal -8,,c00e.
Oto the nation) and over
violence haVe adopted a similar design.
The four types of design are otdettd in the exteneof detail acquied
on the process of change. 'ISocioloists show p very strong preference for
the Vmplest,.,the panel design In some situations the panel is, the
oniyveasible temporal design. However, SOUologists ,often forego
pricrrttInit:igi,to collect' and use data onAequenqes and timing of events.i '
suspect_tha this tendency reflects uncertainty regarding the valuL of sueh
reformation.- Thus it. is important to consider whether -designs containing
about cheriming of measurements in panel studiel. Does. the,0 ,
asurement- i N_
-.
interval reflect some fundamental periodicitc in the procesS under
Sequences and timing of vents confer any iMportan'advantages.1 1"
If we orb to make system comparisonsOamong designs, we must be clear0
study? t sow we cannot easily.c pare the various designs. Di, however,
the timing of measurements is largely arbitrary nd events may occur
-0at any timer the appropriate mat4gLac egl_ISPeeitid*tittn,o
7procesS generatingthe data is that of.a continuoUS7time
state stochastic p.rbcess. The Narkov process-A.ntroduced-to
''Nby Coleman (1964a),rovides an;imp-
th_ type.i
,
The designs differ in their ability to
The class
tociologiSts
am baseline stochastic process of/
Mina e among classes
ofzItantinuous-time stochastic models.-t
is very weak'in
0Lwave panel design
terms of its `ability to reject classes oaf models (Singer'
Spilerman 1976a' One may test only for time -homo neity, i.e., one
can'use data to accept or reject 0lie class\ of .models yith-statipoary
transition probabilities. A: third wave, of observations, permits a test
the _kov property butA.t doesnot petmit, for e ample, distinguish-
ing b tween ,MarkoV and semi-Markov processes. o--ever, data On event-.
counts and event - sequences permit stronger infe ences,,aAd edent-hiS"Mr
data solve completely the so- called embedding problem
Hannan & Groeneveld'17479). That:is, informationon the
together with event - sequences makes it possible to tes
(Singer 1977; Tuma,r \
ing of -entp,
clases'of model. These analytic resxlts tell a
design: whenever possible we should collec..1moves and the timing of moves.
Quantitative Outcbmee,
ery narrow
-important lesson in
a on' he sequenoes of
Some metric outcomes apid'y relative_to our'abilj.ty to
measure them, e.g., size of large organizations, hours of work of
individuals. Other quantitative oVicomes,change levels infrequently,
pres ige wage rates associated ,ith4j
For the lat
event-history designs that record both, the dates of jumps and
the sizes of the jumps appropriate. In mathematical apLms, the1
-underlying stochastic oceiss is a jump process i which one set
parameters overns heading times in state- and, anothet set controls.k E,

averagelieight jumps (see cinlar 1975: 90 -94 for a.brief discussion).
Both seta of parameters may be treated a functions of exogeticius'ivariables,
'though this tramework. appea 6 natural for much SocioloAcal research,
we are not aware
When sociel,Ogi
any sociological applications.
)
study changes in metric vaiiables, they typically
rely, on ihter ittant observations, This is the only feasible design--.for4
rapidly changing outcomes. We typically disti ish three such-designs:
A time series design records the level of the outcome at many dates fo,
one unit. The term panel design refers to a collection of short time
,series (as few as tWo time points) on S number of units. If longer-
time series are available on several units; the design is called a
multiple time series design.
Panel designs have been used in the study of individual social,psychology ( g., Kohn & Schooler 1978), status attainment (Kelley .197:
organizational structure and demography (Meyer 1975), and change in
national social ucture (ChaSeDunn11975).
Time- series designs have been employed largely in macrosociological
research. ,Examples include studies of levels of collective violence
(Snyd-r '& Tilly 1972), changes in voting patterns (Doreian & Hummon 1976)
4
rates (Vigderhous 1977), and studies of variations over time insni
. ,
1a organization and activity (Shorter & Tilly- 1970)." ,Although efforts
h -begun to oontrast time series differentaystems (e.g., Tilly, Tilly
Tilly's (1975) comparisons of rates of violent pretest in France,
Germany and Italy for 1830-1930 sociologists have net fully exploited
multiple time - series designs..
The sociological literature contains little guidancefon the choice:
between panel and time - series designs. If we include all the levant
causal variables and specify the proper -form -f thd model, replications
-

1
of'' the process over time are
hoice-be t-de igns hinges-on-tudgments about
If the confounding factors are likely to vary over
ciin-praetice--th
confounding facto
time but n
as useful as replication over units.
is eta point in time (e.g., prices in weld
markets),:the panel design has the edge. If the confounding factors
are likely to vary more across units but noc over time (e. national.
culture) the timetrriesaesign has the edge
To this point we have focused op the broadest fea es of designs fo
,tempbral Analysis. We turn now to consideration of the details ofthe,
various strategies, discussing sti hsand weaknesses of alternative
-approaches to modeling and estimaton. We -begin with is,nes °fit-tthe
study of changes 1(n qualitative outcomes.
EVENT-HISTORY
§1EALtglft!
Three main strategies for analyzing event-history data have been
used and/or discUssed in sociological rese: ch. The first strategy - -by
far, the most common--negleotS
analyzes
some tnformation in event histories-and
a asif they were generated by some other design.
Palmer' (1954) Labor obilit in Six-Cities provides a good illustration'
of,the many outcomes that can be obtained frdfri Event histories The
data consist of work histories for the-years 1.,940-1950 for roughly
13,006 people,:-Some.of Palmer's findings could have been collected
by series of cross -ctfons the distribution of empIoymen1
status for a series of years )-or, by a panel (e.g., occUpatignal
status in 950 by status in- 1940). She also reports event ounts
'number o jobs held) in different periods. Althoughotha range pf
Outcomes reported is impressive, her anal 'vsis does not make clear what
(if anything) was gain: -t)yr the event - history design that could no h-
been- learned by another des
More ecent'analyses ofavent-histoiy datahaveAAS tended to use
only part_ of the inf.or matien.in event history data. They have n d
,y ller rang of outcome :thee Palmer but:have eon rolled
for a larger number of variables, primarily through multivariate techni-
ques. Ord :arily information on the dates of events:is used only to.
compute co is of events in some period. Then these counts are analyzed
as a metric variable measured either atone "t me",(iie., in one period)
or at a series of " imes." In shert0 event- history data .are treated as
. event counts.
For example, Inverar ty (1976) obtains the tdtal number of lynchings
in a Period from newspaper reportg on the dates of lynchings. Then he
analyzes thiS variable tho hamultiple indicator, multiple cause
model using a procedure developed,by J;5reskog (1970). The analysis
. is indistinguishable from that usually performed on cross-sectional
data. Similarly,' Snyder and Tilly (1972) compute the count of annual
collective disturbances in France from archival
Of violent outbreaks. Unlike lrniverarity, they thelh'use time- series
ermation on dates
analysis to investigate the relation of,these.cou- s to other
charac
imeverying
tstics of France. Similarly, Spilerman (1,970) obtains the,a d
number of riots per city in different time periods ftbm archival reports
on riot dates. He not only analyzes these counts, by linear regression,
(as in the usual cross-sectional approach)- but so considers whether
.they could have been generated by various stochastic processes (e.g.,
Poisson, time-dependent Poi son, etc.). Eaton 74) fits Poisson and
negative binomial distribLtions to event
of admissions to*mental hospitals.
aken" from event histories
The second and third strategies use the information in event histories
on the timing and semence of events as well as information on the
number of events. These strategies, resemble one another in assuming
that a stochastic probabilisElc process generates _events and ghat
events may occur continuously in tame. (Changes that can only occur at,
discrete t_te int4rvalt are regarded as a special _a the two strategies--/
differ in their additional aasdthptions and in, the questions they'ask of O-.
the,data.
The exploratory strategy avoids making any additional' assumptions'
about the process. Instead, t asks what classes of stochastic processes
might have generated the data and what classes are unlikely to have generate(
them. Its goal is to reject types of models` i.e. , to-narrow the dais of
possible models tather than to Accept any particular model. For example,
appropqate analysis, we might be able to cork der that the ..data axe incon-
sistent with models in which the probability of an event per unit of time
increases with length of time since the last event (where an event
could be, for exathple, ob change). We might still be unable to tell
whether the probability of an event per unit of time decreases with the
length of this- interval-, or whether is constant over time but varies
from one member of the population to another. Methods for implementing
this strategy are still in a primitive state; see Singer (1977) and
Singer S Spilerman (1976b) or preliminAry ideas on his strategy.
The third strategy, a model-testing approach, begins by
assuming some simple stochastic process, estimates its parameters, and
then tests whether some of its implications fit the data. More
complicated model's are introduced either Co test an argument or to
(improve fit. This strategy resembles the one used by most sociologists
.
in analyzing cross sectional data; it mainly differs in the kinds of
models that are assumed.
A comparatively simple stochastic model often assumed to describe,
change qualitative outcomes i a irs.t7order, discrete state,

7 'contihuollsti-- Sarkov process, which- includes the familiarToisson model
r the number of events in a period and the general bi th-and-deth model
as special cases: The (simple) MArkov model has been applied to a wide
varfety,of'phenomena: labor mobility'(e.g., Blumen, Kogan & McCarthy 1955
changes in attitudes (e.g., Coleman 1964a), changes in.friendship networks
SOrehsen & Hallinan 1977), marital stability Hannan, Mama &
Groeneveld 1977), outbreaks of collective violence (e.g., Spilerman,1970),ete.
Unfortunately the simple Markov model rarely fits sociological 'data
1. This lack pf fit has motivated various revisions and extensions
the model. it i- Convenient to distinguish among three types: (1)
those focusing on reconceptualizing the process being studied in terms
'latent states," (2) those assuming the population studied is hetero-
geneous, and (3) those postulating time-dependence in the process.
Extensions
LATENT STATES in typical applications of Markov models, observed
outcomes are assumed to be identical to the states of the Markov process.
So, for example, if the data tell only that people hold a job or not, the
states are assumed to be "holding a job" and "not holding a job."
improved conceptualization can sometimes make the application of the simple
`larkov model more appropriate. For example, o8served states may be
assumed to be related to unobserved (latent) states in some specified
-,wey., If change on the latent states is inde A Markovlan butIthe observed
and latent states are noti'perfectly correlated, then observed changes are
generally not describable by the simple Markov model. We consider three cases.
First, suppose each observed state is composed of several unobserved
states, and movement among the latent states is Markovinn. Since each
observed ciated with twc more unobserved states, observed
changes will Ipt be Markovian. But an extended model may retain the
staeionary:Markov framework and still fit the data. for example, Ae-rb4t',.I. .'-.
-
(1963) -proposed a model of iiiterfirm mobility in which "belonging to a-
firm (what' the data recorded) consists of four states: undecided,
temporarily committed, permanently committed and decided to leave.
Mayer (1972) proposed a similar kind of model in which the data record'
occupational categories, but each category is composed of two latent
states, one that can be left (analogous to Herbst's temporary_ commitment)
and one that cannot (analogous to Herbst's permanent commitment).
Second, suppose true states correspond to probabilities of malc.ing
an'observagIe response, and change ;from one probability to another is
Markovian. This is the basic idea underlying Coleman's (1964b) Models
of_Chanzeand Response Uncertainty. -Again, changejn observed responses
is not Markovian, even though thelatent process is. This.ingenious
formulation has not been widely applied, perhaps because of its mathematical
complexity. Wiggins (1973) elaborates-on Coleman's (1964b) discussion.
Third, suppose change is Markovian but the true state for each
episode ;is not always recorded accurately. if the error structure can
be described, then observes changes can be expressed as a function of the
true underlying Markovian process. To our knowledge this conceptualization
has not yet Seen applied in sociological research. We mention it because
it resembles the errors-in-measurement models discussed in ,the litera
on linear models of quantitative variables.
POPULATION HOMOGENEITY Population heterogeneity has been introduced
a- e
in two in ways. One approach assumes that the iun4amental pprameterS of
the Mar_. v model have some postulated probability distribution with unknown
pArlmete s For example, in their stucly of industrial mobility, Biumen,
KEgan & McCarthy (1955) postulated that there are ,tWO-kinds of people,
movers and stayers. In effect, they assume a Bernoulli distribution on
the.liarameters of the- Markov process: a fraction, p?',of the population
move according to a Markov model and the rest, (I-p )., do not mOlie at all.
Spiles (1972b) anSinger- pilerman (1974) assumed that the rate of
leaving a state has A.ga__a probability distribution but that the condition-
al p obability f each move is the same for everyone intthe population.
- This way. of introducing heterogeneity into Markov models _aA armajor.
disadvantage.
about the determinants of changes in qualitative outcomes.
does not permit the investigator to make inferences
The alternative'approach assumes'that the fundamental parameters of the
Markov process- -the instantaneous rates of change from one state
another--depend on ob ervable variables in some specified way. Below we
discuss Coleman's (1964a),approach to the study of causal effects on
rates from panel data. He also proposed-an extension in which rates
of change are linear function's of exogenous variables, and_Tuma (1976)
estimated such a model. The assumption that transition rates are
linear in observable: can lead to a mathematically impossible situatibn--
namely, that transition rates are negative. It seems to be both
mathematically and empirically more satisfactory to assume that transition
rates are log-linear functions of exogenous variables. This approach was
also suggested by Coleman (1973), and it has been applied by Hannan, Tuma
Groeneveld (1977) to the study of marital stability.
TIME- STATIONARITY According to the social process being studied,
authors have suggested tlia,t parameters of the M rkov model 4epend on age
(e.g., Mayer 1972), duration in a state (e.g., McGinnis 1968, Tuma 1976),
experience (e SOr-nsen 1975), and/or experimental time {e.g., Tuma,

Pa issing nd theroforo not available from its on ilnal source

15
M-estimators-that take censoring into account.
-The main a.d, tage, of .M estLmato
obtained when o er estimators
implement.
have OPtimil statistical properties, even in loge samples. For example,
Tuma- & Hannan (1978) show that one of'Sgirensen's M,Jestimatoes that
that they can some _es be
cannot be derived or are very difficult to
isadV:ptage Of -estimators is that they rarely
also maximuid likelihood (ML) performs posy compared to _-estimators.
MAXIMUM LIKELIHOOD, ESTIMATION Maximum like ihood (ML) estimators,
for the continuous -time, discrete-state Markovmoddl seems to have been
cliscussed first.bytbidmetricians (Boag 1949) and statisticians (Alber,
1962). Tuma, (19 6) applied ML estimation to the case in6whIch parameters
depend on exogenou ohservables andidura ion in a state. -Tuma & Hannan's
(1978) Monte Carlo experiments shoW that ML- estimator; based on event-.
history data have good properties (small bias and variance) even when
sample arc moderate in size and a high proportion of episodes have not
yet ended i.e., are censored). Turn- Hannan & GrOeneveld (1979) siva
a detailed discussion of the use of ML- estimation in event-history
and distuss advantages of the event-history design oter, panel and
event-count designs.
P
The main advantage of ML-estimation of event histories 4s that it'
yields estimators with good prope2-
iea as long as the data are generated.
by the postulated stochastic process. However,.triere is no guarantee
tha-t '171-es imators 'retain their good properties when the assumptions
.
of the model are violated. That ls Mi. estimators may not be robust
PARTIAL. LIKELI D EgTI1SATI N. F ,-13artial likelihood 41, estimation
was "p'ropoAed ty Cok-tcl 72) Astimaie effects of exogenous varitttles
6h transition rates from eVen 7his ry data when 'one dOes not know hOW
these rates Crary Over ime, ,Coxlh mad that the instantaneo s rateof
an event (als,o called hazarAjunction 4 is
where h(t)
,x) = h(t)e-
an unknown function of
exogenous variables, and b is
me t, x is a vector of observed
a vector of parameters to be estimated:'Ntw
The likelihood function for this model the product of three toT
16
terms depend 9n the unknown h(t); the last, which Cox called the partial
likelihood, depends only on exp(bx) and the timecorde-ing of, events in the
sample. Without specifying h(t) we- cannot -write the whole likelihood.,
'.Cox sho d that treating the partial likelihood as though it were the
whole likelihood gives consistent estimators of the b's. Efron (1977)
oved that under fairly general conditions the FL-estimators of the b's
a.e asympo otically normal and maximally efficient. FL- estimation has
en used to estimate effects of variables on mortality 'rates of heart
ansplant patients (Miller 1976). A sociologiCal application has not
yet been published, to the best of our knowledge. For A brief review of
the statistical literature on PL-est mation, see Tuma & Hannan (1978).WI
The main Advantage of FL-estimation is that it requires weaker
assumption, than le-estimation, but1still yields estimators with good
statistical properties. For this.reason it has generated considerables
interest among statisticians. One disadvantage for investigators wishing

to
conr-.
rate
i. 3. ,
e events is that PL-Estimetion _oes riot identify ."the
tint tpirm:s" .That s, though it estimates of
does, dt,. estimate the ,rate;0 ,
estimate, slopes but not-theinteveept
17
of var bl-es. od'the
...-
analogous to-being able to
linear regtjession analysis,
PANEL ANALYSIS OF QUALITATkVE OUTCONFS
Laza sfeld (1948) appears te,haveobeen the irat sociologist to have
40050 pane"l analysis of qualitative variables noted that inilIh
data studied by sociologists concerns an association between, two variables
X and Y. Sociologists want to know ghether X indncesiNchan e in Y or Y
induces change in X. Observations X and Y a- a'- point in times,.4t, )
cannot telltthis. Lazarsfeld suggested measurliqg Xand, at two times,9
-0and If X and Y are slichotemous, then
possible res fonse patterns. raying responses' at time .0 by those' at0
.
_k4,.-
time 1 gives 4 famous 16-fold table. 'Now should one analyze
such a table (or one lie it but with more waves, more variables, or moreA
,
possible responses for
change in one variable affects another?
Sociologi
,variable) to,determine the extent,to which
s have used several approaches One reats panel
data on K'qualAtive variables et T,ppints in time as a ptoblemAin
analyzing a contingency table, with KT variables. Another applies
,
ordinary' linear regressionanaaysis, treatin change between
successive waves as a dichotOmous depen en( ariable. Both of,t4ese
strategies' implicitly assume that changes occur at discrete points in
me or thpt the timing of changes is irrelevant to answering questions
concerning the deteLminants of:change. Another strategy assumes that
changes can occur continuously :idle, even though data happen to be
recotided at discrete' times.
Contingency} table amelysi% has-llou.,
Various 'authors,, especiallx,geedman'(1972a, _
A 'set_ of powerful metho.da fa' estimating and test4 ,V
the entries in a 'contingency table. These - models
-r-,
e devel
ing-log linear, mgdel
used fcrr an
number
can ba
_riables and nu ber of discrete eategoriSs ,pervariable
do not attempt eo summert the main ea dres of these models because,
there are a variety of clear.(e.. Davis 1974) and comprehensive .(e.gA .
Bishop, Fienberg & Holland 1975; diaberman 1974).expositiens,of them,
and because by now they are rathetr well kno to speielogists.
These techniques can be viewed as natural extension's of Laza field's
earlie erk on panel analysis of qualitative outcomes. Goodman
these models and methods toVdiscusses and illustrates application
analysis of panel data`. A variety ef other 'ociological applications
to 'panel d _a have followed. One, by Hauser al. (1975) on temporal
change in occupational mobility, contains an especially clear statement
pf. the-Model and a good illustraton 'of how to interpret results based on
it,/ For an application of this specification to parameterize age,
,Reried,f-and cohort effects, see Pullum (1977).
The advantages of this approach are the wide range of substantivelyn _
interesting questions for which it provides an answer and the comparative
ease with which it can be used, One disadvantage is that-all variables
,
included in the analysis must be changed into qualitative,mariables. An
added disadvantagerpartly arising _ the total reliance on polvtomous
variables, is the practiCal problem of finding a sufficiently large sample
to ,fill all cells of the contingency table. This is especially troublesome
when a large number Variables must be considered. Another possible
disadvantage concerns the value of these methods in situations in which
2 1
the o utcome s beidg studied c
in more detail below..
19-
' ange continuous-ix in time, as discussed
Regression Strategy
.The regression strategy treats a change between two-wave as a
dichotomous dependent variable in a regression on a set of independent
variables. Sociologists usually ass
in the independent variables,
e regression is. linear
N
nonlinear. approaches (see below
are often d 1.9 Other fields.
Sp legman. (1472a) s ggests, this strategy as a may to incorporate77)
indepOddent variables into a Markov model. Duncan Perrucci (1976) t..e e
16this approach in. studying whether or not couples have migrated between
.
two waves of a'panel. Bumpass & Sweet .(197,2! use' -this method
investigate effects of causal variables onmarital dissolution.
k
This strategy has several advantages and at least as many (if not
more) disadvaptages. Its main'advantages are ease of application
and comparatieTy low cost. In additin, unlike the log-linear
'models discussed under the contingency t ble strategy, a regression
approach allows both quantitative and qualitative independent variables
to be included in the analysis. Consequently, the "empty-cell" problem
mentioned under the contingency table strategy is not likely to occur
unless a great many interaction terms are included.
/-icime of the disadvantages of this strategy result from assuming
that _ dichotomous dependent variable is linear in the independent
variables. These disadvantages include he _ oscedas icity of distur-
bances, iiJieflficiency of ordinary least squares estimates-, and the
possibility th predicted probabilities of a change lie outside the
(0-1) range '(Goldberger 1.964) Various nonithear regression methods,
k
multivariate probit analysis and tultivarate logic analys
hese def.iciencies.of the linear model.
20
potentially mom Aisturbing disadvantage of the regression approach
dne sffared by the contingency table approacharises from the fact that
,they ignore thektiming of chan- Both approaches implicitly assume
.
that the timing of changes isirrelevant to identification:of the true, . L.
underlying structure generating-chan Timing is indeed; ilTrelevant
ff changes can only occur at the the waves of the panel. This
can happen when change occurs at discrete intervals, and the investigator
knows th true'lag a_d can arrange to collect data at this interval.
But usually it is false, either betause the lag is unknown or because
changes an occur continuously in time.
Little is known'about the' consequences of applying either regression
or contingency table strategies to panel analysis when the assumption
-
mentioned above false. Tuma (1973) has noted that the effects f inde-
pendent variables vary both in magnitude and in sta ical significance
as the length of the time period varied in linear regression analysis
job changes. Singer & Spil- an (1976a b) discuss a more fundamental
problem. As we discuss below, identification of structural parameters
in continuous-ti models of change in qualitative outcomes is problematic
With panel data. Moreover, these problems cannot be evaded by treating
the underlying processes as occurring at discrete intervals. These
dipturbing conclusions give added, force to suggestions that investigate
collect as detailed information about change in the qualitative outcotrie
being studied as feasible. Recognition-of these problems also pro-
mo renew_ interest in panel analysis of
a strategy based on continuous-time models.
2 rs
litative outcomes using,
nuous-Time Strategies _
e .
Coleman (1964a) 1_ sociologist to have argued persuasiv- .
,f..,
:f qualitative outcomes .on .the assumption of.
for baSing panel analysis
21
In underlying stochastic process i- which changes may occur ssntiltiousiy
in time. His elaborations of this : rategy are often based on the
discrete -fie, continuous-time Markov model discussed above.
As already mentioned, the simple Markov model rarely fits data ell:
and various improvements have been,proposed to remedy this. Coleman
(1964a,b) has contributed many ideas for doing this, and his suggtions
are oftlihquite,mathematically sophisticated. However, his
empiriCal applicatiohs usually ol've comparatively simple situations,
e.g., two waves of observations on two endogenous dichotomous variables
or on one dichotomous dependent variable and one dichotomous exogenous
variablq, Even models d -c4ibing these rather simple interrelationships
give estimation equations that are not trivial( implement. Other
sociologists (e.g., Mayer, 1972) have also constructed continuous-time
Stochastic models with greater realism than the simple Markov model, but
have not been able to estimate parameters from panel data in a satisfactory
Way_
In the past few years Singer &.SpileLman (1974, 1976a,b) have begun
to clar hat can be learne4 from panel data when the outcome of
interest generated by continuous-time stochastic process. These
authors have not been concerned with estimating parameters in any
particular model. Instead -they have.emphasized the development
for Choosing among broad classes of models (compare the second strategy
discdssed under event-history analysis). Among their findings are the
folio
=22
First, observations nn the proportion of transitions among scats=
of the qualitative outcome being studied, which gives, an estimate of the.
matrix of transition probabilities, cannot always be embedded in (des-
cribed by) a (simple) Markey process. Moreover, sampling error can sometimes
)
cause panel data to be,uneMbeddable, .ev'en thbugh they are actually
generated by a Markov process. Second, even if the data are embeddable
in a Markov process, there may not be a unique set of parameters that
could have generated the data. Singer & Spilerman (1976a) detail a
procedure for finning an exhaustive set of possibilities, but sometimes
the final choice must be made on substantive grounds. Third, small
changes in an observed matrix of tran tion probabilities (which can
occur because of sampling variability) can lead to a quite different
set of poSsible processes. A number of design features can reduce these
problems, e.g., multiple waves with irregular spacing, shorter intervals
between waves, etc. In short, the more closely panel data resemble
event-histo y data, the fewer the problems in analysis.
Thus, in spite of tiiis.recent research, it is still the case that
panel analysis of qualitative outcomes is a methodological Mine field--
changes can occur continuously in time. While n6thematical and
statis ical invention may clarify what we can learn- from a panel design,
we will not be able to answer all the questions that sociologists like
to ask.
PANEL ANALYSIS' OF QUANTITATIVE OUTCOMES
Strategies
The two-wave panel has also become a standard tool for the 'Study
change in metric variables. But the problem of casting substantive argument!;
operational terms within this framework is far from settled.
Researchers choose panel designs masons; consequently the
1s no single methodology of panel. analysis. W ffnd three broad
approaches to panel analysis in theSo-iolog cal literature.
The first strategy follows Lazars eld (1948.) in sSeking-Tan.approxi-,
matIon taF experimental design. 'Lazarsfeld-argued that one could 'ap roxi-
Amate the study of experimentally =induced changes by iskating certain,-
classes of changes in a turnover table (Such as the 16-fold table). According
to this view the panel design is a special tool for detecting causal
effects. The goal is to choose between two competing hypotheses:
causes Y, or Y causes X. This perspective has been taken over literally
study of changes in quantitative variables WCamphell (1963into the
and Pelz & Andrews (1964). They reasoned that ore might use cross-
correlations (correlation of X0 with Y1 and Y0 with X1, where subsCripts/
denote the time period of measurement) to choose between the twodenote
competing hypotheses. If Px P
0 1
causes Y", etc.
then choose the hypothesis "XX1
The defects in this inference rule soon became apparent, and the
. -
procedure was recast in terms of partial cross correlations px_-x
and-0 1
- -Y0
Otherwise, the logic remained the same. This has become,aYX0 1
standard procedure for choosing among rival explanations in psychological
research (See, for example, Crano, Kenny & Campbell 1972).
Kenny (197 1975) has'explicated ,the logic of this procedure as a
"test for spuriousness." He actually specifies a particular covariance
structure among unmeasured X's and Y's and their measured values and
,argues that cross-lag correlation tests correspond to certain meaningful
restrictions on the covar ance structure. In particu at-, if the co-1
variance structure does no
7
contain "causal effects" relating X and Y, and!
if a number f other strong conditions hold (such as constant variances
of atent and measured variables over time), the crops-lag oartial
correlations will be zero on average.
24
The "test for Spuriousness" depends on a particular specification of
the covariance structurein shOrt, on a el. eover, some ofWV!
KennYt conditions appear not to hold in many situations, X ,and
ften.have very different stabilities Over time. In many =easonable-
Situations, cross-lag,correlation teats give exactly the Okong answer,
i.4 suggest that X causes Y when the reverse is true (RogOsa 1978a).
Many diffilcultieb that beset cross-lag correlation analysis can be
aced'to the main question: does X cause Y or Y cause X? Though the
question admits the possibility that neither effect exists, it does not
anticipate that bOth effects may hold.
-The structural equation approach to.panel analysis per_ saystematic
treatment of more general questions. Instead of viewing panel designs,as
a special tool for testing, it focuses-on estimating parameters of the
joint distribution of variables measured at two or more point's in time.
The sociological literatur_ shows that one may form simple models that
embody the various alternative causal structures relating X and Y (Duncan
-1969:11eise 1970). The panel design may thus be treated as a special
case of the usual nonexperimenral cross-sectional design. Then, as
Goldberger (1971) argued there is no need foroany-special estimation.
and testing theory for panel analysis. Standard and widely available
methods for structural-equation analysis apply.
The view that 'panel analysis has bedn subsumed as a Pecial case of
ructural-equation methods seems be w= y held in sociology. Ho ev6r,
third view contends this claim. ThiS perspective, advocated bya r.
2 7
Coletan 1964
ees
change cannot' be model-free. It argues that explicit dynamic,models are
needed if panel analysis is to yield meaningful substantive results. In
9_Ae.senSe,.the usual structural - equation models for panel analysis f
25
1968), follows Lazarsfeld in emphasizing change. But
ructural7equation perspective that` inferences concern
these criteria, since the equations.may be considered stochastic difference
equations. But, if as we argued earlier, most social processes
do not have fixed lag structures and may change at any Instant,
the proper specification is a continuous -time process. The structural
relations are expressed as time-differential equations. The usualwe*
panel regressions can then be viewed as particular forms of the solution
of fiie equations of the process, as integral equations. The relation
between integral equations and p nel regressions perTits use of data with
discrete spacing' to estimate e parameters:of a process changing
continuously in time. We argue below that this perspective has considerable
advantages. However, to date this approach has been used only sparingly
in sociological' research (for example, see Freeman & Hannan 1975; Hummon,
Doreian & Teuter 1975; Doreian & Hummon 1976; &tire sen & HAllinan 1977
and Hannan & Freeman 1978).
The recent sociological literature contains treatments of special
complications that arise in the various approaches to panel analysis.
In some cases, these developments tell cautionary tales, in others
they suggat alternative estimation strategies.
Duncan (1969) raised a fundamental abjection the then widely held
view that panel analysis offers a "free lunch namely that it obviates
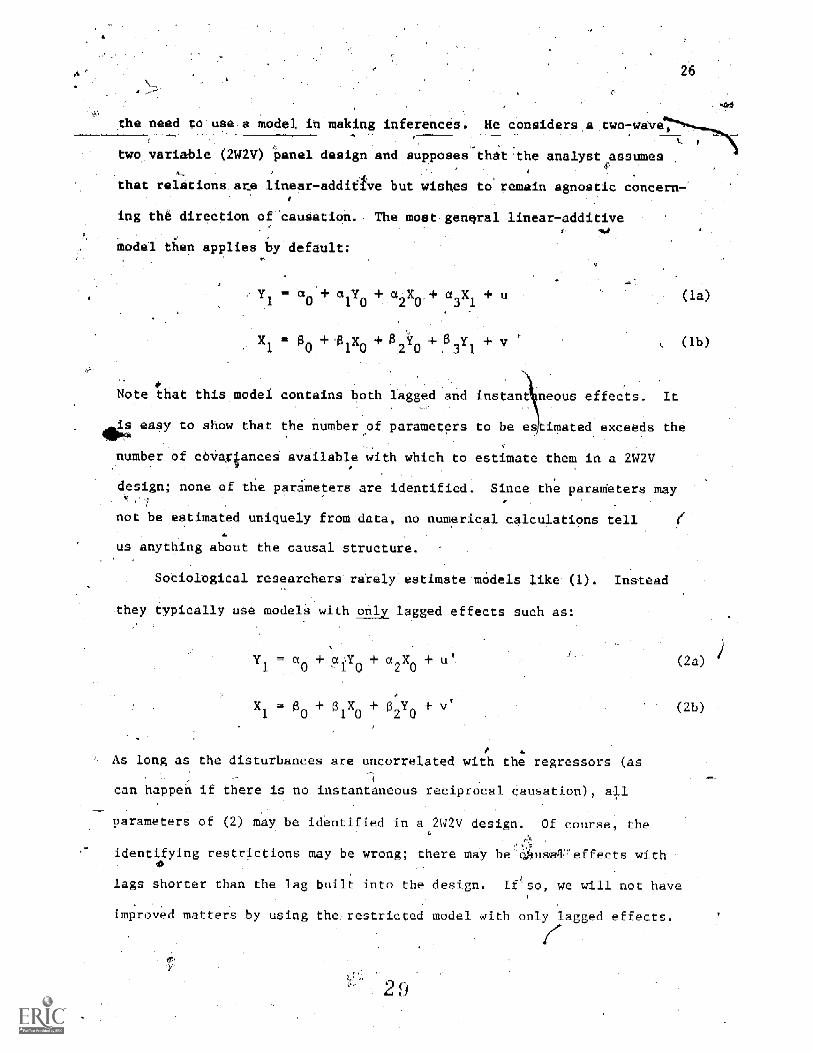
he need to Use-a model in making inferences. He considers a o-wav
26
wo variable (2W2V) panel design and suppoSes that'the analyst assumes
that relations, ate linear-addif_ve but wishes to remain agnostic conce
-ing the direction of causation. The moat gengra near-additive
Model then applies by default:
-1+a.X +a X +u
+ + 0 _ + v
Note that this model contains bOth lagged and instant neouA effects. It
(lb)
easy to show that the number of parameters to be es imated exceeds the
number of caveriancea available with which to estimate them in a 2W2V
design; none of the parameters are identified. Since the parajeters may
not be estimated uniquely from data, no numerical calculations tell
us anything about the causal structure,
Sociological researchers rarely estimate models like instead
they typically use models with only lagged effects such as:
Y1
a
X10
+ '.11 +c2-X + u
-1 0
+ v'2 0
As long as the disturbances are uncorrelated with the regressors (as
can happen if there is no instantaneous reciprocal causation), all
parameters of (2) may be identified in a 2W2V design. Of course, the
identifying restrictions may be wrong; there may be -,Sus'aVeffects with
(2a)
(2b)
lags shorter than the lag built into the design. I so, we will not have
improved matters by using the, restricted model with only lagged effects.
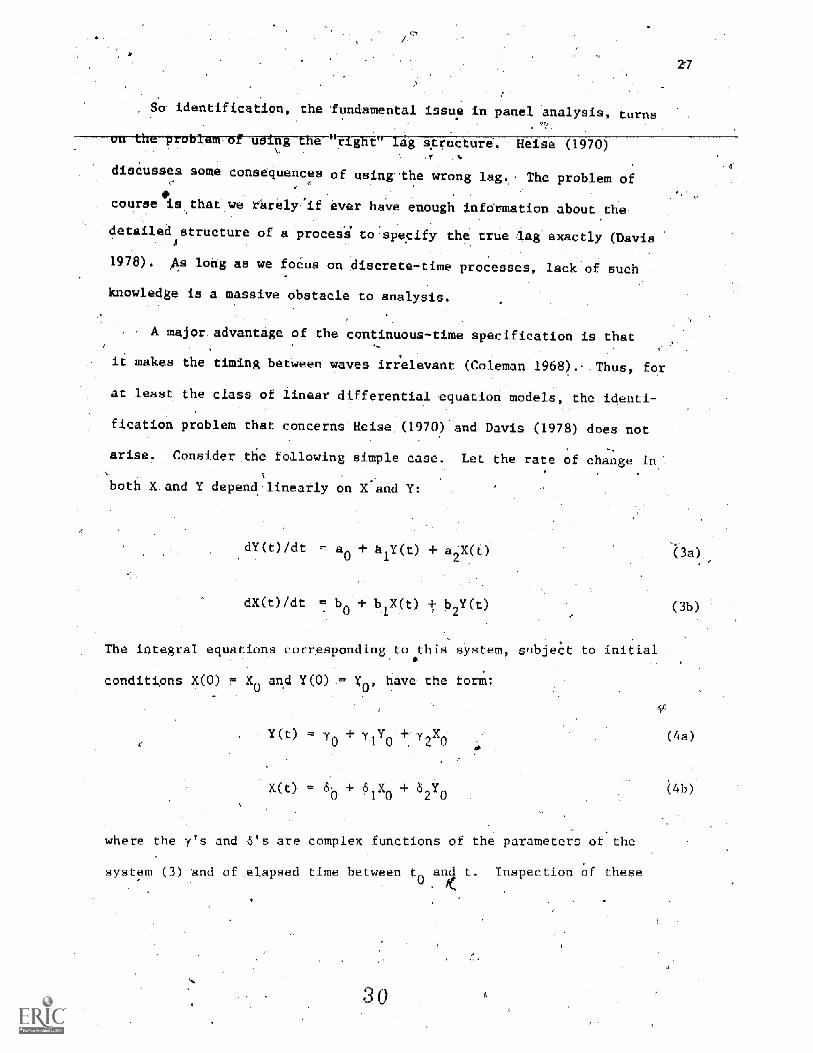
dentification, the fundamental issue in panel analysis, turns
lem o u rfSliV"fijh-1"-lag s ure. Heise (1970)
discusses some consequences of using-the wrong lag.. The problem of
course his that we rarely:if ever have enough information about the
detailed structure of a process to specify the true lag exactly (Davis
1978). As long as we foCus on discrete -time processes, lack of such
knowledge is a massive obstacle to analysis.
A major advantage of the continuous-time specification is that
it makes the timing betWeen reeves irrelevant (Coleman 1968).- Thus, for
at least the class of linear differential equation models, the identi-
fication problem that concerns. Heise. (1970)- and Davis (1978) does not
arise. Consider the following simple case. Let the rate of change in
both X and Y depend linearly on X and Y:
dY(t)/dt = a
dX
a 1Y (t) X(t)
dt = b X(t Y(t)
The integral equations corresponding to this system, subject to initial
conditions X(0) = X0 and Y(0) = yo, have the form:
Y(t) = yo yi yX0
+ 6
where the y's and 6's are complex functions of the parameters of the
system (3) and of elapsed time bet_een t Inspection of these
27
a.
(3b)
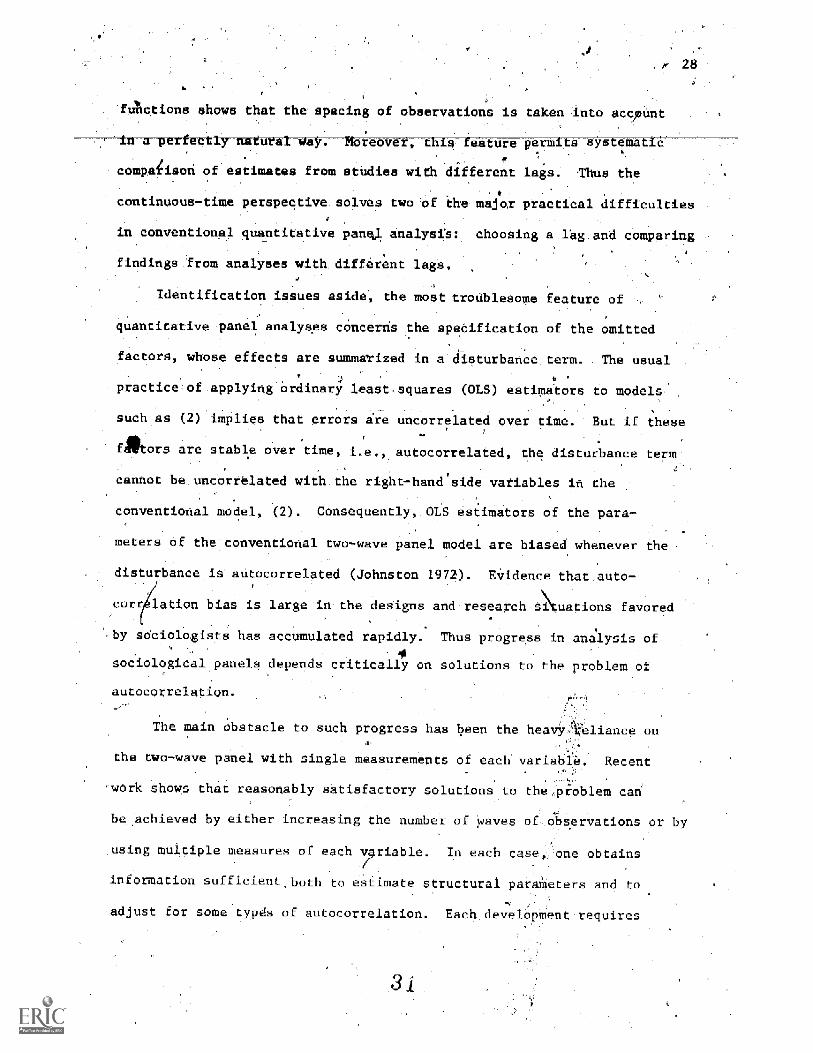
etions show' that the spacing of observations is taken into accpunt
eov perml
28
COMPA ison of estimates from studies with different lags. Thus the
continuous -time perspective solves two of the major practical difficulties
in conventional quantitative pan analysis: choosing a lag.and comparing
findings from analyses with. different lags.
Identification issues aside the most troublesome feature of
quantitative panel analyses concerns the speCification of the omitted
factors, whose effects are summarized in a disturbance term. The usual
practice-of applying ordinary least.squares (OLS) estimators to models
such as (2) implies that errors are uncorrelated over time. But if these
fors are stable over time, i.e. , autocorrelated, the disturbance er-
.
cannot be uncorrelated with the right-hand side variables in the
conventional model, (2).. Consequently, OLS estimators of the pare-
me the conventional two-wave panel model arebiased whenever the
disturbance is autocorrelated (Johnston-1972). Evidence thatauto-
ation bias is large in the designs and _research s'uations favored
by sociologists has accumulated rapidly. Thus progress in analysis of4
sociological panels depends critically on solutions to the problem of
autocorrelation.
The main obstacle to such progress has been the heavy' reliance on
the two-wave panel with single measurements of each variable. Recent
work shows that reasonably satisfactory solutions to the,pioblem can
be achieved by either increasing the number of waves of- observations or by
using multiple measures of each riable. In each case, one obtains
information sufficient,both to estimate structural parariieters and to
adjust for some types of autocorrelation. Eachdevelop ent requires

moving beyond- ordin least squares estimators as we .discuss 'below
61-1-wM' variables n panel designs
first attracted attention, in sociology as a framework within tach to
cope with measurement error (Blalock 1970; Dundan,1972; Hannan, Rubinson
,.4 Warren 1974). This early literature recognized that structural para-
-,
- meters could still be identified .in some such Models even when measurement
errors are aut correlated.= More recent work hat; shown that disturbances
29
associated with the laten variables may 'also` be autocorrelated_without
destroying identification' if one place%, plcrvt restrictions on 'the
model.
Current work in this tradition focuses oh efficient'estimation
-and model testing. The key innovation is JOreskog' (1970) development
of "full information" maximum likelihood procedures for linear structural
equation systems. The adyentagesHof.this approach are discussed by
e-
Jdreskog A Sprbom 976) and igheaton, A14in & Summers ,(1977).. Thid:,
C\s,
procedure has been implemented in empirical research by Bielby, Hauseri
-- & Featherman (1977), Kohn & SchPolar 1978Yand,Hsmer (1979).
An alternative strategy,involves pooling waves of a multi -wave
Th resulting design, called a pooled cross-section and time
series design, tacitly assumes thatthe same structure operates in each
pair of adjacent waves. If so, the information in excess of that gener-,
ated by a two-wave panel can be used to estimate paraMeters of a postulated,-t '
aUtoco relation process. One promising specification of the autocor elation
process uses the c'assical variance-components model. It assumes that the
disturbance tons sts of two (or more'- -see below) unrelated components:
one component is truly random; the other is a constant that characterizes
the unit of observation (e.g., genetic composition, enduring features

30
spLificationi the disturbances are autocOrrelated only because, of the
unit-specific components. If the latter are ionsidered to be fixed effects,
pooled within-unit regressions, eliminate autoregression bias (Maddala 1971),
If tl "unit-specific effects.areconsidered random variables drawn from
some distribution, one may use generalized leas& squares estimators.-that
have good large sample Properties and reasonably good small sample
properties as well"(Nerlove_1971; Hannan.& Young 1977).
The pooled ores section-and time-series estimators have been
extended to deal with further practical complications. Lillard &
Willis (1976) have estimated models with-fixed individual effects and
random disturbances that are themselves autocorrelated (with a first -order
autoregressive scheme). Nielsen &-Hannan (1977) have used an estimator
that accommodates for individual-specific effects and heteroscedasticity
of the random component.
It is also straightforward to add.Period-specific egfec as well
(Kuh 1959; Balestra & Nerlove 1966). The period effect summarizes the
environmental factors that are unique tothe measurement period and affect
all units alike. These effects " mad aISO be considered as fixed fan
or as ealizations'of'some stochastic proses generating environmental
variability. Simple extensions of the fixed effects and. - generalized
least squares estimators apply to these spebifications.
The pooled cross - section and time-series design-seems a natural
framework within which to study age, period, and cohort effects (see

HYder'1965for a disicusSion of:the importance o distinguishing these
mponents). Drell known that the three- effects cannot be identified
n Cross7se tions.. However as long as one a elutes an additive structure,
way be.identifiedin Such designs (Mason et al 1973):two of the'three
In a pooled model, petiod effects may be estimated iiithout difficulty;`'
hoWever,age,and cohort (viewed as. an individual-specific effect) may
not be distinguished without further restrictions on the model.,
One last estimation issue deserves mention. The sociological and
economic literaturea have pu -ued different tracks in estimating systems
of linear differential equations. The integral equations corresponding.
to systems contain matrix functions of the form exp,(Bt) where SiS i a k
by k matrix when the syStem contains k eqUations. Sociologists,
following Coleman (1968)-r-but see Kaufman 1976)--use what is-known as
a speCtral decomposition of this matrix function to rela
estimates to dynamic parameters.
regression
But this strategy doea not.peLmit use of
constraints on elements of B in estimation. Consequently, estimation is
not fully efficient: Econometricians, seeking efficient estimators, have
focused on discrete approXlmationa'Aothe differential equation systems,
that permit the use of constraints on ,parameters,.(Bergstrom 1976). It
is not yet known whether the approximation erroisintroduced by this
approach compensate for the.abili
TIME SERIES ANALYSIS
y utilize constraints.
will only briefly indicate the main lines of development of time
es analysis in sociological research. Many of dila issues of strategy.
and estimation parallel those already discussed. Morever, the
Statistical theory of time series 'estimation is far more codified
2
than ase for panel analysis.
series literature, eppeei hasTofte
focused on questions similar to those posed by Lazarsfeld. In an influ-°
ential paper'Granger (1969) defined direction Of causality in terms of
ediatability in multiple r-titite series. He proposed that one time series,
(X ), causes anothe-t
(Yt), if current values of Y can be predicted from
past valuesi of X, paftialling for.'the effects of paste values of Y. Thislr'
conceptiOn resemble4 that underlying. cross -lag correlation analysis--
with: the important exception- that Granger expliCitlY includes the
possibility of joint causation. Nonetheless, much has been.made of,
. ,..,..-
Sims (1972) use of distributed-lag estimators to determine whether the
-stock of money causes income variations or vice versa,
It turns out that translating Granger's criteria for causation Info
two7wave panel prat does not give a cross -lag correlation test.
Instead, it implies-that X causes Y if the structural cross-lag
p ameterlabeled-a2 in equation (2a) is nonzero and that Y causes X
;62(2b) is nonzero (Rogosa 1978b).in nonzero
Time-series analysis4is the Standard prodedure for estimating
continuous-time dynamic models.' For examples, see Doreian & Hummon
(1976) and Pitcher, Hamblin & Miller (1978). However, the structural-
equation perspective with discrete lags, is ore commonly applied to
sociological time series. Then the standard econometric literature on
time series with. its focus on autocorrelation of'disturbances applies
(see Hibbs 1974 for a review). The econometric literature stress two
-forms of autocorrelation, auto egressivec and moving average processes.
Much, recent work follows Sox S Jenkins (1976) in specifying a very general
mixture of the two processes As a morel the noise processi This
strategy has Swept the field 'of applied time-series analysis, but has
barely penetrated sociological research. Hibbs (1977) discusses the
potential ,value of the Box-Jenkins apprciach to the study of PeliCy
.interventions when long time series are availableiand'iligderhous (1977)
has illustrated' its value in forecasting Social trends..' Finally Much,
Eheoretical Werkon time series uses aspectral represen ation of the
iseries that transforms from a time domain to a f-equency domain. The:-
Agoal is to decompose a long series into components of different fre-
quency just as sound may be s decomposed. tie may then wish to smeoth,
high'-frequency'(or short-period) waves so as to achieve a clearervepre-
sentation of the longer cycles of the p ocess. Possible sociological
applications of this strategy haVes-been discussed by Mayer Arney
(1974).
CONCLUSIONS''
The notion that temporal analysis automatically yields
conclusive inferences dies hard. However, the thrust of most recent,
Methodological developments has been t6 argue cogently against,
this view. have emphasized that the stock tools of temporal analy:ills,
in sociologY; the two -gave panel for qualitative-and quantitative out
ad nits multiple interpretations. In the qualitative case, when changes
occur at dfi time, one cannot identify structural parameters from
only-two .av of panel data. Event counts, event sequences and event
histories permit Much finer model.testing,and should be used more often
in sociological research. The identification problem plaguq,s the
quantitative case as well. If t'he model assumes a discrete-time process,-,
one must know the timing of _the causa lags.
34
these recent
methodological developments reemphasize the.importaneecef_substantive
theory and medelAfer,making good use of temporal data.
The situation is not,whol jbleak, however. Sociologists have begun.
to devote moreiAitention to modeling change precesses.,,We:propose that
such developments, particularly the use of continuous-time stochastic
models of change, will permit.a much richer use of temporal data than in
past sociological research. Not only will such models enrich sociological
Analysis, they also focus attention squarely on change, processes.
emphasize that temporal data is not just like cross- sectional data, b
that it contains information on the manner in which kange comes about.
:Finally we have commented separatelyon afialysis Of qualitative and
quantitative,outcomes. But:many of the most interesting issues in Sociolo-
gical theory concern linked changes in quality and quantity. Sociologists
have not even begun systematic study of coupled chatigesjn qualitative.
and quantitative outcomes. One major obstacle to thedeVelepment of ex-
the
plicit process models fcir quality and quantity is that we use different
mathematical structures in :he qualitative and quantitative case'. For
forter we use stochastic models; for the latter we use deterministic
'models (see the discussion on Coleman 1964a: 528). Clearly there_ls
a need to develop Stoqhastie models for changes in quantitative variables.-4
Unfortunately this leads to considerable mathematical complexity (see
Jazwinsk 1970 for discussion). Nonetheless,. this seems a"nc cessary
next step if we are to use temporal data to address mania fuhrlamental
issues
Literature Cited
35
Zatima ngtheinfrinitesims- rater- i abieueee
time, finite state Markov process. Ann. o Math._Stat. 33:)27-53
,Balestri, P., Nerlove, 1j 1966. 'PoOling
a dynamic
585-6i2
data .in eatima
gas. Econometricar
Bergstr A. R. ed. 1976. Statistical Inference in Continuo
cross-section and ime series
°deli, the demand for natural
,Economic Models. Amsterdam: North-Holland. 333-pp.
Bielby, W. T. Hauser Featherman, D. L. 1977. Response errors
of no:II:deck males in models of intergenerational tranmission of
socioeeono c status.
Bdshop,
-Multivariate Anal
Blalock, H. M.,
-Fienberg,
Social. 82: 1242 -88.
E. Hollaed,.P. W. 1975. Discrete
le;
Theor and'Practice. Cambridge: The MITPr !
1970. __timating mesuremen error using multiple
indicators and several points in time. Am. Social. Rev. 35: 101-117.
Blau, P. M., Duncan; 0. D. 1967. The American Occupational Structure.
New Yerk: Wiley, 520 pp.
Blumen, I., Kogan, M., McCarthy 1955. The industrial mobility of
labor as a probahility,process. Cornell StudieS in -Iedustriil a:nd,
Itabor-Rilations 6. Ithaca: Cornell tniversity
Hoag W. 1949. Maximum lik-elihood estinat2s of the proportion patien_
cured by cancer therapy. JRoy. Sta Sec. SerieS B.11 15-53.,
Box jet(10Ats
and Control.
1976, Time Series _Adel-uls _Forecasting6
San Francisco: Holden-Day- 575 pp. 2nd ed.
-ass,, L. Sweet, J. A. 1972. Differenbials in marital instability"
1970. Am,Seciol. :371 754-66.
Campbell, D. T. 1963. Si-DM description to expe rimentation: in
trends as quasi-experiments. In Froblemsiin Measurin: Chan-
W,:Harris, pp. 212 -42. Madisohr: University qt Wisconsin Press.
38

Chase-Dunn,. C. 1975. The effects of international economic dependence
On development and inequality: a cross-national study. iol.
Rev. 40: 720-38.
Chi rot, D., Ragin, C.. 1975. The market, traditiodin and peasant,rebellion:
the case of Romania,In4 907. Am. SocioL Rev. 40: 428 -44.'
cinlar R 1975. Introduction to Stochastic Processes. Engle od Clif
NJ: Prentice-Hall. 402 pp.
Coleman S. 1964a. Introduction to hematical'Sociolo New York:.
I
The Free Press 554 pp.
Coleman J. S. 1964b. Models of Change and RfispOnse Uncertaitty. Englewood
Cliffs, NJ: Prentice, -Hall. 130 pp.
Coleman, J. S. 1968. The-mathematical study of change. In Methodology
M. lalock, Jr. A. Blalock, pp. 428-78.
oft.
in Social Research, ed.
New York: McGray-Hill.
eLeman, 1973.
Aldip 191 pp.
Blum, Z. D. -, S
o Collective' Action.- Chicago:
set:, A. B., Rossi, P. 1972. White
_nd black careers during the first decade of labor
Res. 1: 243-70.
1972. Regression models and life tables.
SOc. Series B 34': 187-220.
Crano, W.O. 1977. , What do infancy mental tests test?
--ce experience.
oss-lagged
panel analysis of selected data from the Berkeley Growth Study.
Child Dev. 48: 144-51.
W. D., Kenny, D. A,, Campbell, D. T. 1972. Does intelligence
.aUse achievement? A cross-lagged panel analysis. d. Eduo,
631,25875.

modelisfor significance tests in
ngency.tables: an exegesis of Goodman's recen
papers. In 1geliocioloital-M, ed. Rerbert L
Costner, PP= .18923E..-SaAlrancisco: jmaiwy-Bass,
Davis, .1 A. ;1078. -,.'Studing-cfle
Doreian Hutmon, N odelingSocial: Processes,
ice' data over time. Sc
dam:
Elsevier. 172.PP.
DU can, i it 196f).- __Methodological lasues.47.the Inalysis of_SociaV,
Social Structure a deSecial:Mobil t in Economic'mobility. In
Development, ed N. Smelser, S. M. Lipset 51-9
Aldine,
Duncan, 0. D. 1969, 'Some linear models fo two 7.variable panel analysis.
72: 177-p,
Duncan . 1972,. UnmeasuredVariables in linear models for panel. D
analyis. IJi (3c1.01.0cal, ed. H. Costner, PP=
36-g2. San -isco: Joasey-Bass.'
unean, 0. D. 1075 Introduction to StruCcurE4nEtioLCModelp
York: Academi0Press.
can, R. P., PerEu6ci C.
migration.
Dual occupation families and:
252;61...
197e Mental hospitalization as a reinfo
. Sociol. Rev. 39: 252-60.
The efficiency of Cox's likelihood unction
Ste 72: 557-65.
for ed
1979. Po
confirmatory f
Educa
Meyer & M. T.J. W.
edenomic"4evelopment: a
38
analy i I gati.dattlapment'and the_World
In press,
Form, W. H., Miller, D. C. 1949. Octupationil career patterns as a
Hannan.
Political Chan =e 1950-1970,' ed.
chicago University:of Chicago Press.
sociological instrument. Am. ..Sociol. 54 : 317-29.
Freeman, J., Hannan, M. I. 1975. Growth and dgcline processes in4 2'
nizations. Am. Sociol. Rev. 40: 215'q'
Goldberger, A. S. 1964. Econometric NeW York: Wiley. 399 pp.
Goldberger, A. S. 1971. Econometrics and psychdmetrics:
communalitfes. Psycho -etrika 36: 83-107.
a survey of
Goodman, L. A. J972a. A modified multiple regre,.sion approach to the analysis
of dichotomous variables.
Goodman, L. A. 49724, A general model for the analysis of surveys.
,
Am. J. Social. 77': 1035-86.
Goodman, L. A. 1973. Causaanalysis of data from panel studies and
Sociol. Rev. 37: 28-46.
'other-kinds of surveys. Am, J. Sociol. 78: 4135-91.
CrangetIC. W. J. 1969. Investigating, caual relations by econometric
models and cross-spectral methods. 'Econometrica
Haberman, S. 1974. The Analysis of Frequency Data. Chica
University :.f .Chicago Press. 419 pp.
Hannan, M. T., Freeman, J. 1978. Th6 internal politics of growth add
decline. In Environments and Organizations, ed. M. MezeT, pp. 177-
99. San Francisco: Jossey-.Bass.
Hannan, M. T., Rubinson, El., Warren, J. T. 1974: The causal approach to
measurement error panel analysis. somehfurther contingencies.
In Measurement in the Social Sciences, cc. R. M. Blalock, Jr.,
pp. 293-324. Chicago: Aldine.
39
'Hannan, M. T. Tuma, N. B., Groerreld, L. P. 1977. Indoffle and marit
events: evidence from an income maintenance experiment. Aii. J.
Social. 82: 1186-211.
Hannan,'M. T., Young, A. A. 1977. Estimation in panel models: results
on pooling,crosssections and time series. In SocioLqgical:Methodol(*y_
1977, ed. D. R. Heise,Pp. 52-83. -San Francisco: Jossey-Bass.
Hauser, R. M., Koffel, J. N., Travis, H. P., Dickinsoni P. J. 1975:
Temporal change in occupational mobility: evidence from men n the
United States. Am. Sociol. Rev. 40: 279-97.
Heise, D. R. 1969. Separating reliability and stability in test retest
correlations. Am. Sociol. Rev. 34: 93-101.
Heise, D. R. 1970. Catisal inferencq from panel data. In Sociological
Methodology 1970, ed. F. Borgotta, G Bohrensfedt, pp. 3-27. San
Francisco: Jossey-Bass.
Herbst, P. G. 1963. Organizational commitment: a decision process
model. Acta Social. Y4'746.
Hibbs, D. A., Jr. 1974,,' Pzoblets of statistical estimation and causal
inference in time-ser es regression models. See Davis 1974, pp. 252-308.
Hibbs, D. A., 1977. On analyzing_the effects of policy interventions:
Box-Jenkins and Box-Tiao versus structural equation models. See
Hannan & Young 1977, pp. 137779.
Hogan, D. P. 1978. The variable order of events in the life course.
Am. Social. Rev. 43: 573-86.
Hu 7on, N. P., Doreian, P., Teuter, K. 1375. A structural control model
of organizational change. Am. Social. Rev. 40: 813-24.
Inverari J. 1976. Populism and lynching in Louisiana, 1889 -1896: a
test of Erickson's thcory of the relationship of boundary crises
and repressive justice. Am. Social. Rev. 41: 26-79
Ja nski, A. H. 1970. Stochastic Processes and Filter_n Theor New
40
York: Academic res
Johnston, J. 1972. ,Econome d Methods'. New York: McGraw-Hill. 437 pp. ,2nd e
Jdreskog, K. G. 1970. A general method for the analysis of covariance
structures. Hiometrika 57: 239-51.
J8reskog K.G., Sorbom, D. 1976. Statistical models and methods for
analysis of longitudinalAata. In Latent Variables__in Socioeconomic
l,fodel.J ed. D. J. Aigner, A. S. Goldberger, pp. Amsterdam:
Nerth-Hefland.
Kaufman, R. L. 1976. The solution and - interpretation of dif ferential
equation models. Am. Sociol. Rev. 41: 746-47.
Kelley, J. 1973. Causal chain models for the socioeconom career.'
Sociol. Rev. 38: 481-93.
Kenny, D. A. 1973. Cross-lagged and synchronous common factors in panel
data. In Structural E uation Models in the Social Sciences, ed.
A. S. Goldberger, 0. D. Duncan, pp. 153-67. New York: Seminar Press.
Kenny, D. A. 1975. Cross-lagged panel correlation: a test for spurious-
ness. Psychol. Bull. 82: 345-62.
Kohn, M. L., Schooler, C. 1978. The reciprocal effects of the substan-
tive complexity of work and intellectual flexibility: a longitudinal
assessment. Am. -Aol 84: 24-52.
Kuh, 1959. The validity of cross-sectionally estimated behavior
equations in time series application. Econometrica 39: 341-58.
Lazarsfeld, P. F. 1948. The use of panels in social research. elm. Philos.
92:405-10.
F. 1972. Mutual effects of statistical variables. InLazarsfeld,
inuitiee in the L n ua e of Social R search, ed. Paul F. Lazarsfeld,
-Ann K. Pasnella & Morris Rosenberg, pp. 388-98. New York: The Free Pres ;.
41
Lazarsfeld, Berelson, B. R., Caudet, H. 1944-. The People's
Choice. York: DuellSlaan, & Pearce. 178 pp.
s
Liilar(h L. A., Willis, R. J. 1976. Dynamic:aspects of earnings mobility.
Working Paper No. 150. National Bureau of Economic Research, Inc.,
Stanford, Calif.
Maddala, G. S. 1971. The use of variance components models in pooling
cross-section and time series data.. Econometrics 39: 341-58.
Mason, K. O., Mason, W. Z.6 Winsborough, H. H., Poole, W. K. 1973.
Some methodological problems in cohort analysis of archival data.
Am. Social. Rev. 18:242-57:
-er, T. F. 1972. Models of intragenerational mobility. In Sociological
if
Theories in_Prokress, ed. J. Berger, M. Zelditch, Jr., B. Anderson,
Vol. 2, pp. 308 -57. Boston: Houghton-Mifflin.
er, T. F., Arney, W. R. 1974. Spectral analysis and the study of social
:change. See Davis 1974, pp. 305-55:.
McGinnis, R. 1968. A stochastic model of social mobility. A n._Sociol.`
Rev. 33: 712-22.
dyer, 1975. Leadership and organizational structure. Am. J. Sociol.
514-42.-
ildr, R. G. 1976. Least squares regression with censored data.
Biometrika 63: 449-464.
Nerrove, M. 1971. Further evidence on the estimation of dynamic economic
vie
C
relations from n time series of cross-sections. Econometrics
359-82.
Hannan, S. T. 1977.. Jhe,expansion of national educational
systems:
42: 479-90.
ests of a populatfon,ecology model. Ar,. Sociol. Rev.
42
Palmer, G. L. 1954. Lab_
.Science Research Council. 177 pp.
Pelz, D. C., Andrews, F. M. 1964. Causal priorities in panel study
data. Ai. Sociol. Rev. 29: 836-48.
x Cities. New York: Social
Pitcher, B. L., Hamblin, R. L., Miller, J. L. L. 1978. The diffusion
of collective violence. Am. Social. Rev. 43: 23-354
Pullum, T. W. 1977-: Parameterizing age, period, and cohort effects:
an application to U.S. delinquency rates, 1964-1973. In Sociological
Methodology 1978, ed. K. Schuessler, pp. 116-140. San Francisco:
,Jossey-Bass.
Robins, P., Tuta, N. B. 1977. Change in rates of entering and leaving
employment under a negative income tax program: evidence from the
Seattle and Denver income maintenance experiments.- Research Memorandum
#48, SRI International, Menlo Park, CA.
Rogosa, D. 1978a. Causal models in longitudinal research: rationale,
formulation, and interpretation. In Lonitudinal Research in Huron
Development: Design and Analysis, ed.
N'ew York: Academic Press. In press.
R. Nesselroode, P. B. Baltes.
Rogosa, D. I978b. Time and time again: some analysis problems in
longitudinal research. Chicago: Educational Finance and Product
vity Center, University of Chicago.
Ryder, N. 11. 1965. The cohort as a concept in the study of social
change. Am. Social. Rev. 30: 843-61.
Shorter, E. Tilly, C. 1970. The shape of strikes in France Comparative
Studist. 13: '60-86.
Sims, C. A. 1972. Money, income, and causality. Am. Econ. Rev. 62: 540-
52.
43
Singer, B. 1977. Individual histories as the focus of analysis.in
longitudinal surveys. SSRC Conference on the National Longitudinal
Surveys, Washington, D. C.
ger, B., Spilerman, S. 1974. Social mobil y models for. heterogeneous
=populations. See Davis 1974, pp. 256-401.
Singer, W., Spilerman, S. 1976a. The representation of social processes
by Markov models. Sociol. 82: 1-54.
Singer, B., Spilepman, S. 1476b. Some methodological issues in the
analysis, of longitudinal surveys. Ann. of Econ. and,Sec Measurement
5: 447-74.
Snyder, C. 1972,. and collective violence nHFrance,
1830-1960. Am. Sociol. Rev. 37: 520-32.
SS ensen, A. B. 1975. The structure of intrageners.tidnal mobility.
Am. Sociol. Rev. 40: 451.
S ensen, A. B. 1977. Estim ting rates frpm re -ospelir ve questions.
See Hannan & Yourig 1977, pp. 20923.
SSrensen A. B. Hallinan, M. T. 1976. A stochastic model for change in
group structure. Soc. Sci. Res. 43 -61.
SSrensen, A. B., Hallinan, M. T. 1977. A reconceptualization of school
effects. Sociol. Educ. 50: 273-89.
S6rensen, A. B., Tama, N. B. 1978. Labor market structures and job
mobility. Working Paper #505-78. University of Wisconsin, Madison.
Spilerman, S. 1970. The causes of racial disturbances: a comparison
of alternative explanations. iol. Rev. 35: 627-49.
Spilerman, S. 1972a. The analysiaof mobility, processes by the intro-
duction o- independent variables into a Markov chain. Sociol.
Rev. 37: 277-94.
Spile
44
S. 1972b. Extensions of the mover-stayer model,. J. Sociol.
78: 599-626.*a
Spilerman. S. 1977. Careers, labor market structure, and socioeconomic
achievement. J. Sociol. 83 551-93.
Tilly, C., Tilly, L., Tilly, R. 1975. Rebellious_ Century 1 0-1930.
Cambridge: Harvard UniverSity Press. 354 pp.
Tuma, N. B. 1973. Incorporating independent variables into stochastic
models of social mobility. Presented at Ann. Meet. Am. Sociol. Assoc.
Tuma- N. B. 1976. Rewards, resources and rate of mobility: a nonstationary
multivariate stochastic model. Am. Social. Rev. 41: 338-60.
Tuma N. B., Hannan, M. T., Groeneveldi L. P. 1979. Dynamic analysis
of event histories. Aati. J. Sociol. 84. In press.
Tuma, N. B., Hannan, M. T. 1978. Approaches to the censoring problem in
analysis of event histories. In Sociological Methodol_1979, ed.
K. Schuessler. In press.
Vigderhous, G. 1977. Forecasting sociological phenomena: applications
of Box-Jenkins methodology to suicide rates. See Pullum 1977,
pp. 20-51.
Wheaton, B., Muthen, B,, Alwin, D. F., Summers G. F. 1977. Assessing
reliability and stability in panel models. See Hannan & Young 1977,
PP 84-136.
Wiggins, L. M. 1973. Panel Anal sis Probabil Models
Attitude and Behavior Processes. San Francisco: Jossey-Bass. 255 pp.
Related Documents