Available online at www.sciencedirect.com Journal of Power Sources 178 (2008) 603–609 Pt–Co cathode electrocatalyst behaviour viewed by in situ XAFS fuel cell measurements Agnieszka Witkowska a,∗ , Sonia Dsoke b , Emiliano Principi c , Roberto Marassi b , Andrea Di Cicco c,1 , Valerio Rossi Albertini d a Department of Solid State Physics, Gdansk University of Technology, 80-952 Gdansk, Poland b Chemistry Department, University of Camerino, I-62032 Camerino (MC), Italy c CNISM, CNR-INFM SOFT, Department of Physics, University of Camerino, I-62032 Camerino (MC), Italy d ISM-CNR, via del Fosso del Cavaliere 100, 00133 Roma, Italy Received 12 July 2007; received in revised form 21 August 2007; accepted 22 August 2007 Available online 1 September 2007 Abstract The paper presents a preliminary structural investigation of the 20% Pt–Co (1:1) alloy on Vulcan XC-72 catalyst using X-ray absorption spectroscopy (XAS), transmission electron microscopy (TEM) and X-ray diffraction (XRD). XAS results have been obtained ex situ and in situ using a specially optimized for XAS measurement fuel cell (down to 6 keV). The results are compared with those obtained for pure Pt catalyst on the same carbon support under the same working conditions. © 2007 Elsevier B.V. All rights reserved. Keywords: In situ X-ray absorption spectroscopy; Fuel cell; Pt–Co catalyst 1. Introduction The cathode polarization is the main source of loss in low temperature polymer electrolyte membrane fuel cells (PEMFCs) and a lot of research activity is directed towards the development of catalysts with increased activity toward oxygen reduction reaction (ORR). Platinum alloys with transition metals, such as M=V, Cr, Co, Ti and Ni, as well as ternary alloys, exhibit significantly higher ORR electrocatalytic activities than Pt alone [1–4]. Although several hypotheses have been put forward in the literature to justify the reasons for this activity enhancements, the matter is still under debate. Many experimental works show that the increase in the kinetics of ORR compared to pure Pt could be attributed to changes in the geometric structure (i.e. Pt–Pt bond distance, number of Pt nearest neighbors, surface com- position), in the electronic structure (i.e. orbitals energy levels, ∗ Corresponding author. Present address: CNR-ISM Roma, Department of Physics, University of Camerino, I-62032 Camerino, Italy. Tel.: +39 0737 40 25 50; fax: +39 0737 40 28 53. E-mail address: [email protected] (A. Witkowska). 1 Present address: IMPMC-CNRS, Universit` e P.et M. Curie, 140 rue de Lourmel, 75015 Paris, France. electron density of states in the Pt 5d band, strength of interac- tion between the Pt and M atoms) and to the nature and coverage of surface oxide layers [1,2,5–9]. Moreover, recent theoretical works suggest that sites like Pt–M or Pt–M–M are more active in promoting O 2 dissociation and that M atoms are better centers for OOH adsorption than Pt [10,11]. Several studies have been carried out to characterize the Pt–Co catalyst and to understand the chemical properties of the system [12–18], and references therein, but still some contra- dictory results may be found in the literature. For example, the stability of the alloy during operation, the mass activity enhance- ment factor in comparison to pure Pt and the influence of catalyst structure, ordering and atoms segregation on the catalytic reac- tivity are still under discussion. In situ X-ray absorption spectroscopy (XAS) has been proved to be a powerful tool to investigate the fuel cell catalysts because of its ability to provide information regarding oxidation states and local coordination, numbers and identity of the neighbors of the absorbing atom. Several papers deal with the application of this technique in the fuel cell field [19]. Most of them have been performed ex situ or in situ with floated half cells [1,20–22]. Single cells equipped with fuel cell membrane electrode assembly (MEA) and without aqueous acidic electrolytes have 0378-7753/$ – see front matter © 2007 Elsevier B.V. All rights reserved. doi:10.1016/j.jpowsour.2007.08.074

Welcome message from author
This document is posted to help you gain knowledge. Please leave a comment to let me know what you think about it! Share it to your friends and learn new things together.
Transcript
A
sut©
K
1
taoras[lmtbbp
PT
L
0d
Available online at www.sciencedirect.com
Journal of Power Sources 178 (2008) 603–609
Pt–Co cathode electrocatalyst behaviour viewed byin situ XAFS fuel cell measurements
Agnieszka Witkowska a,∗, Sonia Dsoke b, Emiliano Principi c,Roberto Marassi b, Andrea Di Cicco c,1, Valerio Rossi Albertini d
a Department of Solid State Physics, Gdansk University of Technology, 80-952 Gdansk, Polandb Chemistry Department, University of Camerino, I-62032 Camerino (MC), Italy
c CNISM, CNR-INFM SOFT, Department of Physics, University of Camerino, I-62032 Camerino (MC), Italyd ISM-CNR, via del Fosso del Cavaliere 100, 00133 Roma, Italy
Received 12 July 2007; received in revised form 21 August 2007; accepted 22 August 2007Available online 1 September 2007
bstract
The paper presents a preliminary structural investigation of the 20% Pt–Co (1:1) alloy on Vulcan XC-72 catalyst using X-ray absorption
pectroscopy (XAS), transmission electron microscopy (TEM) and X-ray diffraction (XRD). XAS results have been obtained ex situ and in situsing a specially optimized for XAS measurement fuel cell (down to 6 keV). The results are compared with those obtained for pure Pt catalyst onhe same carbon support under the same working conditions.2007 Elsevier B.V. All rights reserved.
etowif
Psdsms
eywords: In situ X-ray absorption spectroscopy; Fuel cell; Pt–Co catalyst
. Introduction
The cathode polarization is the main source of loss in lowemperature polymer electrolyte membrane fuel cells (PEMFCs)nd a lot of research activity is directed towards the developmentf catalysts with increased activity toward oxygen reductioneaction (ORR). Platinum alloys with transition metals, suchs M = V, Cr, Co, Ti and Ni, as well as ternary alloys, exhibitignificantly higher ORR electrocatalytic activities than Pt alone1–4]. Although several hypotheses have been put forward in theiterature to justify the reasons for this activity enhancements, the
atter is still under debate. Many experimental works show thathe increase in the kinetics of ORR compared to pure Pt could
e attributed to changes in the geometric structure (i.e. Pt–Ptond distance, number of Pt nearest neighbors, surface com-osition), in the electronic structure (i.e. orbitals energy levels,∗ Corresponding author. Present address: CNR-ISM Roma, Department ofhysics, University of Camerino, I-62032 Camerino, Italy.el.: +39 0737 40 25 50; fax: +39 0737 40 28 53.
E-mail address: [email protected] (A. Witkowska).1 Present address: IMPMC-CNRS, Universite P.et M. Curie, 140 rue deourmel, 75015 Paris, France.
t
toattpSa
378-7753/$ – see front matter © 2007 Elsevier B.V. All rights reserved.oi:10.1016/j.jpowsour.2007.08.074
lectron density of states in the Pt 5d band, strength of interac-ion between the Pt and M atoms) and to the nature and coveragef surface oxide layers [1,2,5–9]. Moreover, recent theoreticalorks suggest that sites like Pt–M or Pt–M–M are more active
n promoting O2 dissociation and that M atoms are better centersor OOH adsorption than Pt [10,11].
Several studies have been carried out to characterize thet–Co catalyst and to understand the chemical properties of theystem [12–18], and references therein, but still some contra-ictory results may be found in the literature. For example, thetability of the alloy during operation, the mass activity enhance-ent factor in comparison to pure Pt and the influence of catalyst
tructure, ordering and atoms segregation on the catalytic reac-ivity are still under discussion.
In situ X-ray absorption spectroscopy (XAS) has been provedo be a powerful tool to investigate the fuel cell catalysts becausef its ability to provide information regarding oxidation statesnd local coordination, numbers and identity of the neighbors ofhe absorbing atom. Several papers deal with the application of
his technique in the fuel cell field [19]. Most of them have beenerformed ex situ or in situ with floated half cells [1,20–22].ingle cells equipped with fuel cell membrane electrodessembly (MEA) and without aqueous acidic electrolytes have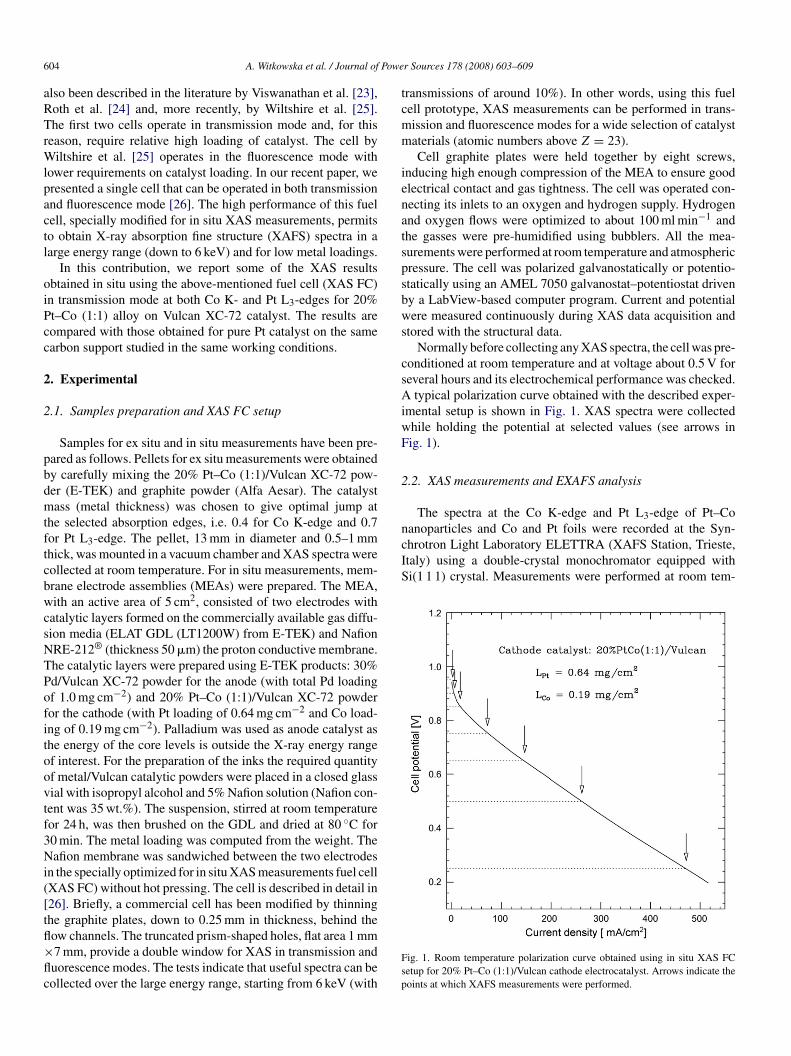
6 Powe
aRTrWlpactl
oiPcc
2
2
pbdmtftcbwcsNTPofitoovtf3Ni([tfl×flc
tcmm
ienatspsbws
csAiwF
2
nanoparticles and Co and Pt foils were recorded at the Syn-chrotron Light Laboratory ELETTRA (XAFS Station, Trieste,Italy) using a double-crystal monochromator equipped withSi(1 1 1) crystal. Measurements were performed at room tem-
04 A. Witkowska et al. / Journal of
lso been described in the literature by Viswanathan et al. [23],oth et al. [24] and, more recently, by Wiltshire et al. [25].he first two cells operate in transmission mode and, for this
eason, require relative high loading of catalyst. The cell byiltshire et al. [25] operates in the fluorescence mode with
ower requirements on catalyst loading. In our recent paper, weresented a single cell that can be operated in both transmissionnd fluorescence mode [26]. The high performance of this fuelell, specially modified for in situ XAS measurements, permitso obtain X-ray absorption fine structure (XAFS) spectra in aarge energy range (down to 6 keV) and for low metal loadings.
In this contribution, we report some of the XAS resultsbtained in situ using the above-mentioned fuel cell (XAS FC)n transmission mode at both Co K- and Pt L3-edges for 20%t–Co (1:1) alloy on Vulcan XC-72 catalyst. The results areompared with those obtained for pure Pt catalyst on the samearbon support studied in the same working conditions.
. Experimental
.1. Samples preparation and XAS FC setup
Samples for ex situ and in situ measurements have been pre-ared as follows. Pellets for ex situ measurements were obtainedy carefully mixing the 20% Pt–Co (1:1)/Vulcan XC-72 pow-er (E-TEK) and graphite powder (Alfa Aesar). The catalystass (metal thickness) was chosen to give optimal jump at
he selected absorption edges, i.e. 0.4 for Co K-edge and 0.7or Pt L3-edge. The pellet, 13 mm in diameter and 0.5–1 mmhick, was mounted in a vacuum chamber and XAS spectra wereollected at room temperature. For in situ measurements, mem-rane electrode assemblies (MEAs) were prepared. The MEA,ith an active area of 5 cm2, consisted of two electrodes with
atalytic layers formed on the commercially available gas diffu-ion media (ELAT GDL (LT1200W) from E-TEK) and NafionRE-212® (thickness 50 �m) the proton conductive membrane.he catalytic layers were prepared using E-TEK products: 30%d/Vulcan XC-72 powder for the anode (with total Pd loadingf 1.0 mg cm−2) and 20% Pt–Co (1:1)/Vulcan XC-72 powderor the cathode (with Pt loading of 0.64 mg cm−2 and Co load-ng of 0.19 mg cm−2). Palladium was used as anode catalyst ashe energy of the core levels is outside the X-ray energy rangef interest. For the preparation of the inks the required quantityf metal/Vulcan catalytic powders were placed in a closed glassial with isopropyl alcohol and 5% Nafion solution (Nafion con-ent was 35 wt.%). The suspension, stirred at room temperatureor 24 h, was then brushed on the GDL and dried at 80 ◦C for0 min. The metal loading was computed from the weight. Theafion membrane was sandwiched between the two electrodes
n the specially optimized for in situ XAS measurements fuel cellXAS FC) without hot pressing. The cell is described in detail in26]. Briefly, a commercial cell has been modified by thinninghe graphite plates, down to 0.25 mm in thickness, behind the
ow channels. The truncated prism-shaped holes, flat area 1 mm7 mm, provide a double window for XAS in transmission anduorescence modes. The tests indicate that useful spectra can beollected over the large energy range, starting from 6 keV (withFsp
r Sources 178 (2008) 603–609
ransmissions of around 10%). In other words, using this fuelell prototype, XAS measurements can be performed in trans-ission and fluorescence modes for a wide selection of catalystaterials (atomic numbers above Z = 23).Cell graphite plates were held together by eight screws,
nducing high enough compression of the MEA to ensure goodlectrical contact and gas tightness. The cell was operated con-ecting its inlets to an oxygen and hydrogen supply. Hydrogennd oxygen flows were optimized to about 100 ml min−1 andhe gasses were pre-humidified using bubblers. All the mea-urements were performed at room temperature and atmosphericressure. The cell was polarized galvanostatically or potentio-tatically using an AMEL 7050 galvanostat–potentiostat driveny a LabView-based computer program. Current and potentialere measured continuously during XAS data acquisition and
tored with the structural data.Normally before collecting any XAS spectra, the cell was pre-
onditioned at room temperature and at voltage about 0.5 V foreveral hours and its electrochemical performance was checked.
typical polarization curve obtained with the described exper-mental setup is shown in Fig. 1. XAS spectra were collectedhile holding the potential at selected values (see arrows inig. 1).
.2. XAS measurements and EXAFS analysis
The spectra at the Co K-edge and Pt L3-edge of Pt–Co
ig. 1. Room temperature polarization curve obtained using in situ XAS FCetup for 20% Pt–Co (1:1)/Vulcan cathode electrocatalyst. Arrows indicate theoints at which XAFS measurements were performed.
Power Sources 178 (2008) 603–609 605
pwi7
m(tdu
lcwabam
etrrtbuTtu
2
tbs(
dgtcp
3
3
trtcricp
Fn
Atbawri
niFtl
A. Witkowska et al. / Journal of
erature ex situ and in situ. Data were collected over thehole XAFS range: 11.4–12.8 keV for Pt (Pt L3-edge energy
s 11.564 keV), and 7.5–8.3 keV for Co (Co K-edge energy is.7 keV).
To obtain acceptable quality spectra, each XAFS measure-ent was repeated twice and averaged for successive processing
integration time was 2 s per point, total acquisition time equaledo about 60 min). The sampling procedure was chosen to yieldata available for both pre- and post-edge background analysessed to normalize the spectra.
The experimental EXAFS data have been object of a pre-iminary analysis with an advanced technique using theoreticalalculations of the X-ray absorption cross-section in the frame-ork of the GNXAS method [32,33]. GNXAS method allows forproper inclusion of “ab initio” multiple scattering (MS) contri-utions in the EXAFS data-analysis. Details of the methodologypplied to the EXAFS data-analysis obtained for nanostructuredaterials are described in [27].In the case of the Pt–Co alloy catalyst, a simultaneous two-
dge analysis (Co K and Pt L3) have been performed. Usinghis approach, the closer-shell distributions are determined accu-ately, because the parameters defining these distributions areelated to the direct two-body signals and several MS con-ributions calculated for both Co K- and Pt L3-edges. Theackground models for Co K and Pt L3signals were the samesed in the bulk crystallines (Co and Pt foils, respectively).he other nonstructural parameters (S2
0 , E0) were fixed tohe values obtained for bulk materials within their estimatedncertainty.
.3. TEM and XRD measurements
Transmission electron microscopy (TEM) images have beenaken using a Philips CM-10. Particles size distribution, on thease of the profile of 200 randomly selected quasi-sphericallyhaped particles, has been obtained using ImageJ programimage processing and analysis program).
X-ray powder diffraction patterns were obtained by a Philipsiffractometer (PW1830 X-ray generator) with Bragg-Brentanoeometry. Cu K � radiation (λ = 1.5406 A) was monochroma-ised by means of a graphite crystal. Step-scan patterns wereollected in the 30◦ to 90◦ 2θ range, with 0.02◦ step and 4 s peroint counting time.
. Results
.1. Pt–Co alloy structure characterization
The activity of nanocatalyst strongly depends on the par-icles size, shape and structural details at the atomic level,elated to bond distance, ordering and surface composition. Forhis reason, accurate morphological investigations and structuralharacterization should be performed prior to any effort to cor-
elate XANES data with electrochemical behaviour. Besides, its known that Pt–Co alloy can crystallise in both face-centeredubic (fcc) and tetragonal phases (depending on the alloy com-osition), in ordered and substitutionally disordered form [28].rmsd
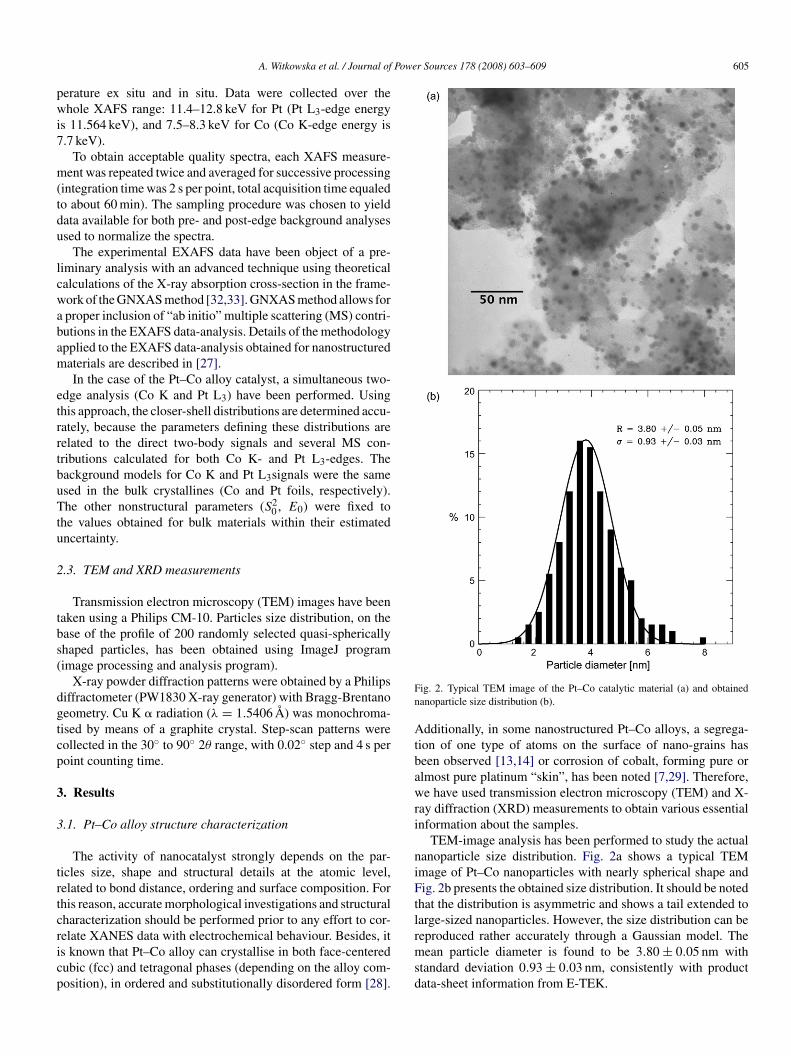
ig. 2. Typical TEM image of the Pt–Co catalytic material (a) and obtainedanoparticle size distribution (b).
dditionally, in some nanostructured Pt–Co alloys, a segrega-ion of one type of atoms on the surface of nano-grains haseen observed [13,14] or corrosion of cobalt, forming pure orlmost pure platinum “skin”, has been noted [7,29]. Therefore,e have used transmission electron microscopy (TEM) and X-
ay diffraction (XRD) measurements to obtain various essentialnformation about the samples.
TEM-image analysis has been performed to study the actualanoparticle size distribution. Fig. 2a shows a typical TEMmage of Pt–Co nanoparticles with nearly spherical shape andig. 2b presents the obtained size distribution. It should be noted
hat the distribution is asymmetric and shows a tail extended toarge-sized nanoparticles. However, the size distribution can be
eproduced rather accurately through a Gaussian model. Theean particle diameter is found to be 3.80 ± 0.05 nm withtandard deviation 0.93 ± 0.03 nm, consistently with productata-sheet information from E-TEK.
606 A. Witkowska et al. / Journal of Power Sources 178 (2008) 603–609
Fig. 3. X-ray powder diffraction pattern of the Pt–Co nanocatalyst. Experimentaldata (points) are compared with the calculations using Voigt functions (solidline). The agreement with calculated spectrum is very good, and the residualcs(
tctm(aitcoBT
dPp2cvp
3
ocsbetcfe[
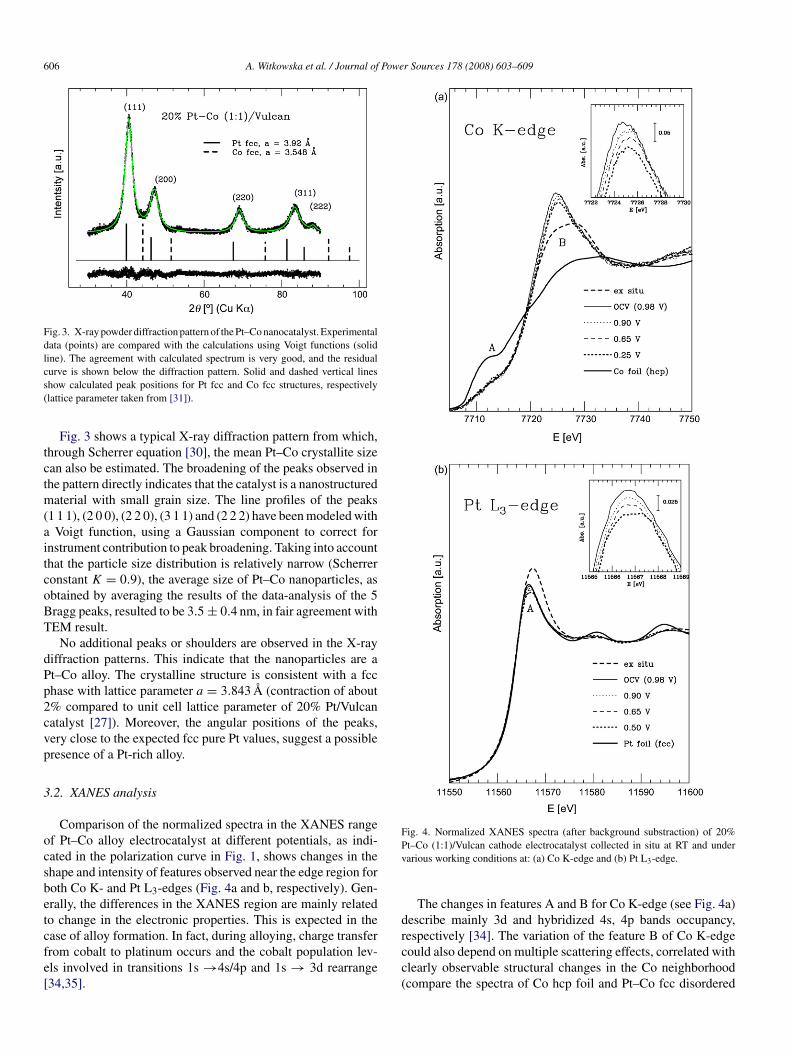
Fig. 4. Normalized XANES spectra (after background substraction) of 20%Pv
d
urve is shown below the diffraction pattern. Solid and dashed vertical lineshow calculated peak positions for Pt fcc and Co fcc structures, respectivelylattice parameter taken from [31]).
Fig. 3 shows a typical X-ray diffraction pattern from which,hrough Scherrer equation [30], the mean Pt–Co crystallite sizean also be estimated. The broadening of the peaks observed inhe pattern directly indicates that the catalyst is a nanostructured
aterial with small grain size. The line profiles of the peaks1 1 1), (2 0 0), (2 2 0), (3 1 1) and (2 2 2) have been modeled with
Voigt function, using a Gaussian component to correct fornstrument contribution to peak broadening. Taking into accounthat the particle size distribution is relatively narrow (Scherreronstant K = 0.9), the average size of Pt–Co nanoparticles, asbtained by averaging the results of the data-analysis of the 5ragg peaks, resulted to be 3.5 ± 0.4 nm, in fair agreement withEM result.
No additional peaks or shoulders are observed in the X-rayiffraction patterns. This indicate that the nanoparticles are at–Co alloy. The crystalline structure is consistent with a fcchase with lattice parameter a = 3.843 A (contraction of about% compared to unit cell lattice parameter of 20% Pt/Vulcanatalyst [27]). Moreover, the angular positions of the peaks,ery close to the expected fcc pure Pt values, suggest a possibleresence of a Pt-rich alloy.
.2. XANES analysis
Comparison of the normalized spectra in the XANES rangef Pt–Co alloy electrocatalyst at different potentials, as indi-ated in the polarization curve in Fig. 1, shows changes in thehape and intensity of features observed near the edge region foroth Co K- and Pt L3-edges (Fig. 4a and b, respectively). Gen-rally, the differences in the XANES region are mainly relatedo change in the electronic properties. This is expected in the
ase of alloy formation. In fact, during alloying, charge transferrom cobalt to platinum occurs and the cobalt population lev-ls involved in transitions 1s →4s/4p and 1s → 3d rearrange34,35].rcc(
t–Co (1:1)/Vulcan cathode electrocatalyst collected in situ at RT and underarious working conditions at: (a) Co K-edge and (b) Pt L3-edge.
The changes in features A and B for Co K-edge (see Fig. 4a)escribe mainly 3d and hybridized 4s, 4p bands occupancy,
espectively [34]. The variation of the feature B of Co K-edgeould also depend on multiple scattering effects, correlated withlearly observable structural changes in the Co neighborhoodcompare the spectra of Co hcp foil and Pt–Co fcc disordered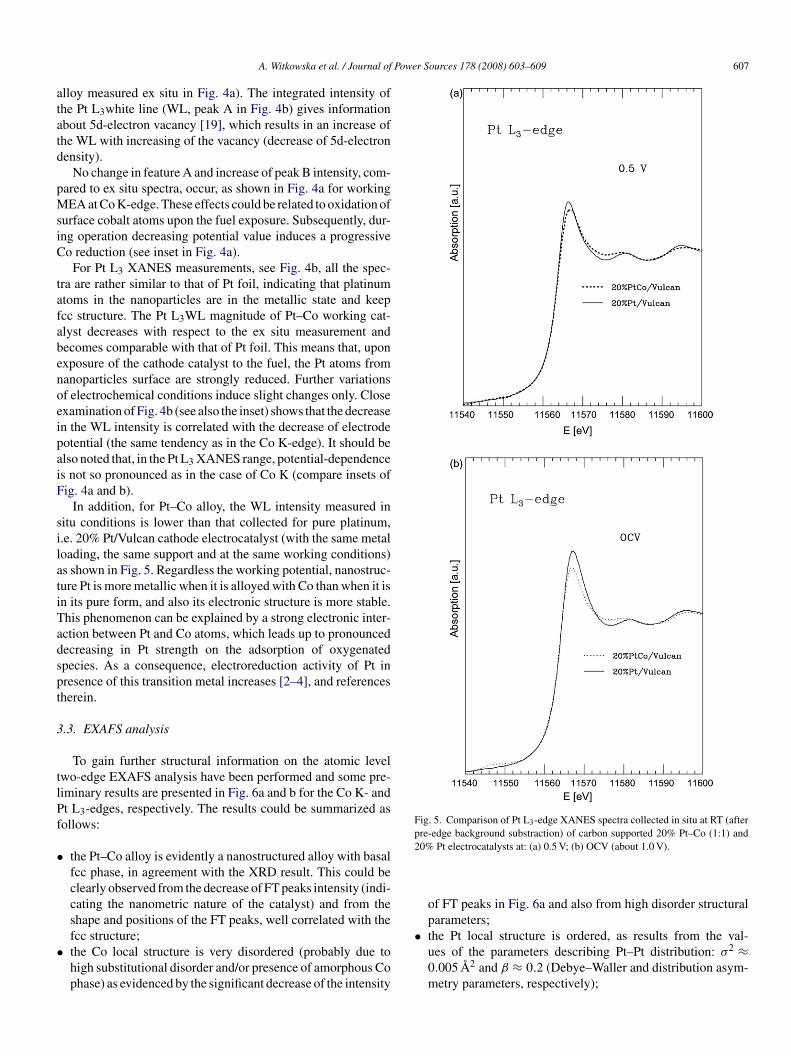
Power Sources 178 (2008) 603–609 607
atatd
pMsiC
tafabenoeipaiF
silatiTadspt
3
tlPf
•
•
Fig. 5. Comparison of Pt L3-edge XANES spectra collected in situ at RT (afterpre-edge background substraction) of carbon supported 20% Pt–Co (1:1) and2
A. Witkowska et al. / Journal of
lloy measured ex situ in Fig. 4a). The integrated intensity ofhe Pt L3white line (WL, peak A in Fig. 4b) gives informationbout 5d-electron vacancy [19], which results in an increase ofhe WL with increasing of the vacancy (decrease of 5d-electronensity).
No change in feature A and increase of peak B intensity, com-ared to ex situ spectra, occur, as shown in Fig. 4a for workingEA at Co K-edge. These effects could be related to oxidation of
urface cobalt atoms upon the fuel exposure. Subsequently, dur-ng operation decreasing potential value induces a progressiveo reduction (see inset in Fig. 4a).
For Pt L3 XANES measurements, see Fig. 4b, all the spec-ra are rather similar to that of Pt foil, indicating that platinumtoms in the nanoparticles are in the metallic state and keepcc structure. The Pt L3WL magnitude of Pt–Co working cat-lyst decreases with respect to the ex situ measurement andecomes comparable with that of Pt foil. This means that, uponxposure of the cathode catalyst to the fuel, the Pt atoms fromanoparticles surface are strongly reduced. Further variationsf electrochemical conditions induce slight changes only. Closexamination of Fig. 4b (see also the inset) shows that the decreasen the WL intensity is correlated with the decrease of electrodeotential (the same tendency as in the Co K-edge). It should belso noted that, in the Pt L3 XANES range, potential-dependences not so pronounced as in the case of Co K (compare insets ofig. 4a and b).
In addition, for Pt–Co alloy, the WL intensity measured initu conditions is lower than that collected for pure platinum,.e. 20% Pt/Vulcan cathode electrocatalyst (with the same metaloading, the same support and at the same working conditions)s shown in Fig. 5. Regardless the working potential, nanostruc-ure Pt is more metallic when it is alloyed with Co than when it isn its pure form, and also its electronic structure is more stable.his phenomenon can be explained by a strong electronic inter-ction between Pt and Co atoms, which leads up to pronouncedecreasing in Pt strength on the adsorption of oxygenatedpecies. As a consequence, electroreduction activity of Pt inresence of this transition metal increases [2–4], and referencesherein.
.3. EXAFS analysis
To gain further structural information on the atomic levelwo-edge EXAFS analysis have been performed and some pre-iminary results are presented in Fig. 6a and b for the Co K- andt L3-edges, respectively. The results could be summarized asollows:
the Pt–Co alloy is evidently a nanostructured alloy with basalfcc phase, in agreement with the XRD result. This could beclearly observed from the decrease of FT peaks intensity (indi-cating the nanometric nature of the catalyst) and from theshape and positions of the FT peaks, well correlated with the
fcc structure;the Co local structure is very disordered (probably due tohigh substitutional disorder and/or presence of amorphous Cophase) as evidenced by the significant decrease of the intensity•
0% Pt electrocatalysts at: (a) 0.5 V; (b) OCV (about 1.0 V).
of FT peaks in Fig. 6a and also from high disorder structuralparameters;
the Pt local structure is ordered, as results from the val-ues of the parameters describing Pt–Pt distribution: σ2 ≈0.005 A2 and β ≈ 0.2 (Debye–Waller and distribution asym-metry parameters, respectively);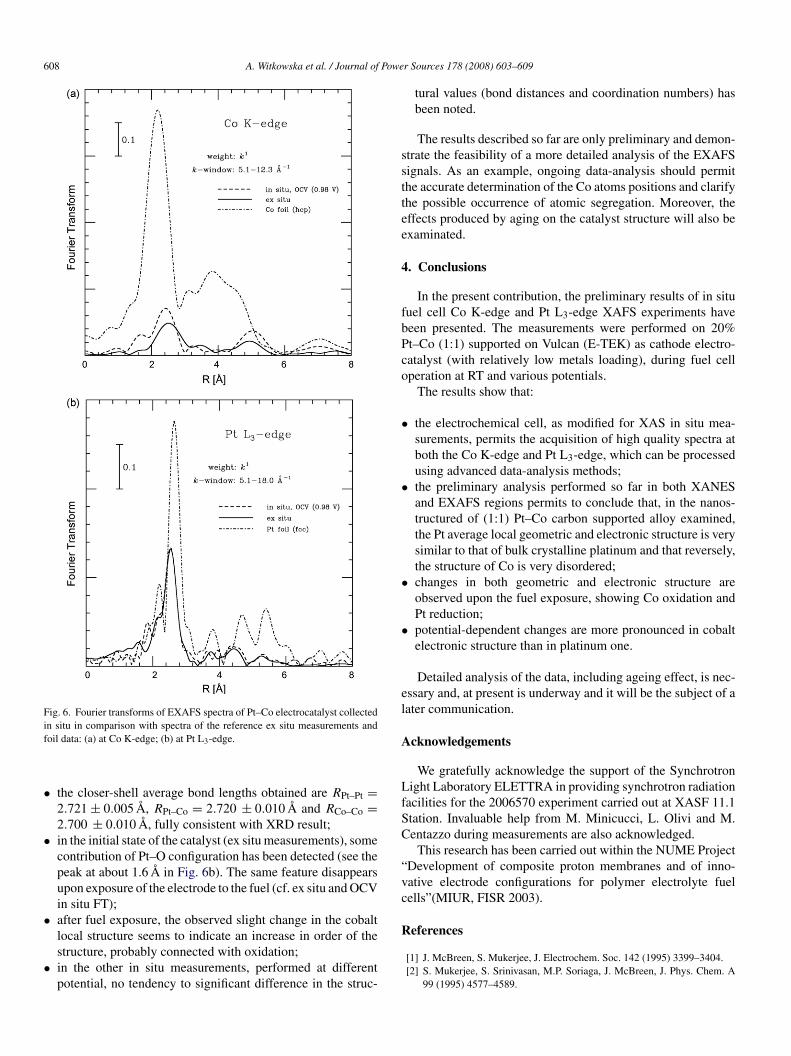
608 A. Witkowska et al. / Journal of Powe
Fig. 6. Fourier transforms of EXAFS spectra of Pt–Co electrocatalyst collectedif
•
•
•
•
ssttee
4
fbPco
•
•
•
•
el
A
LfSC
“vc
References
n situ in comparison with spectra of the reference ex situ measurements andoil data: (a) at Co K-edge; (b) at Pt L3-edge.
the closer-shell average bond lengths obtained are RPt–Pt =2.721 ± 0.005 A, RPt–Co = 2.720 ± 0.010 A and RCo–Co =2.700 ± 0.010 A, fully consistent with XRD result;in the initial state of the catalyst (ex situ measurements), somecontribution of Pt–O configuration has been detected (see thepeak at about 1.6 A in Fig. 6b). The same feature disappearsupon exposure of the electrode to the fuel (cf. ex situ and OCVin situ FT);after fuel exposure, the observed slight change in the cobaltlocal structure seems to indicate an increase in order of the
structure, probably connected with oxidation;in the other in situ measurements, performed at differentpotential, no tendency to significant difference in the struc-r Sources 178 (2008) 603–609
tural values (bond distances and coordination numbers) hasbeen noted.
The results described so far are only preliminary and demon-trate the feasibility of a more detailed analysis of the EXAFSignals. As an example, ongoing data-analysis should permithe accurate determination of the Co atoms positions and clarifyhe possible occurrence of atomic segregation. Moreover, theffects produced by aging on the catalyst structure will also bexaminated.
. Conclusions
In the present contribution, the preliminary results of in situuel cell Co K-edge and Pt L3-edge XAFS experiments haveeen presented. The measurements were performed on 20%t–Co (1:1) supported on Vulcan (E-TEK) as cathode electro-atalyst (with relatively low metals loading), during fuel cellperation at RT and various potentials.
The results show that:
the electrochemical cell, as modified for XAS in situ mea-surements, permits the acquisition of high quality spectra atboth the Co K-edge and Pt L3-edge, which can be processedusing advanced data-analysis methods;the preliminary analysis performed so far in both XANESand EXAFS regions permits to conclude that, in the nanos-tructured of (1:1) Pt–Co carbon supported alloy examined,the Pt average local geometric and electronic structure is verysimilar to that of bulk crystalline platinum and that reversely,the structure of Co is very disordered;changes in both geometric and electronic structure areobserved upon the fuel exposure, showing Co oxidation andPt reduction;potential-dependent changes are more pronounced in cobaltelectronic structure than in platinum one.
Detailed analysis of the data, including ageing effect, is nec-ssary and, at present is underway and it will be the subject of aater communication.
cknowledgements
We gratefully acknowledge the support of the Synchrotronight Laboratory ELETTRA in providing synchrotron radiation
acilities for the 2006570 experiment carried out at XASF 11.1tation. Invaluable help from M. Minicucci, L. Olivi and M.entazzo during measurements are also acknowledged.
This research has been carried out within the NUME ProjectDevelopment of composite proton membranes and of inno-ative electrode configurations for polymer electrolyte fuelells”(MIUR, FISR 2003).
[1] J. McBreen, S. Mukerjee, J. Electrochem. Soc. 142 (1995) 3399–3404.[2] S. Mukerjee, S. Srinivasan, M.P. Soriaga, J. McBreen, J. Phys. Chem. A
99 (1995) 4577–4589.
Powe
[
[
[
[
[
[
[
[[
[[
[
[
[
[
[
[
[
[
[
[[
[
A. Witkowska et al. / Journal of
[3] E. Antolini, J.R.C. Salgado, E.R. Gonzalez, J. Power Sources 160 (2006)957–968.
[4] Q. Huang, H. Yang, Y. Tang, T. Lu, D.L. Akins, Electrochem. Commun. 8(2006) 1220–1224.
[5] M. Min, J. Cho, K. Cho, H. Kim, Electrochim. Acta 45 (2000) 4211–4217.[6] S.S. Arico, A.K. Shukla, H. Kim, S. Park, M. Min, V. Antoniucci, Appl.
Surf. Sci. 172 (2001) 33–40.[7] T. Toda, H. Igarashi, M. Watanabe, J. Electroanal. Chem. 460 (1999)
258–262.[8] A.K. Shukla, M. Neergat, P. Bera, V. Jayaram, M.S. Hedge, J. Electroanal.
Chem. 504 (2001) 111–119.[9] F.H.B. Lima, M.J. Giz, E.A. Ticianelli, J. Braz. Chem. Soc. 16 (2005)
328–336.10] P.B. Balbuena, D. Altomare, L. Agapito, J.M. Seminario, J. Phys. Chem.
B 107 (2003) 13671–13680.11] J.M. Seminario, L.A. Agapito, L. Yan, P.B. Balbuena, Chem. Phys. Lett.
410 (2005) 275–281.12] L. Guczi, D. Bazin, I. Kovacs, L. Borko, Z. Schay, J. Lynch, P. Parent, C.
Lafon, G. Stefler, Zs. Koppany, I. Sajo, Top. Catal. 20 (2002) 129–139.13] U.A. Paulus, A. Wokaun, G.G. Scherer, T.J. Schmidt, V. Stamenkovic,
V. Radmilovic, N.M. Markovic, P.N. Ross, J. Phys. Chem. B 106 (2002)4181–4191.
14] J.R.C. Salgado, E. Antolini, E.R. Gonzalez, J. Power Sources 138 (2004)56–60.
15] E. Antolini, J.R.C. Salgado, M.J. Giz, E.R. Gonzalez, Int. J. HydrogenEnergy 30 (2005) 1213–1220.
16] J.R.C. Salgado, E. Antolini, E.R. Gonzalez, Appl. Catal. B: Environ. 57(2005) 283–290.
17] P. Yu, M. Pemberton, P. Plasse, J. Power Sources 144 (2005) 11–20.18] F.H.B. Lima, W.H. Lizcano-Valbuena, E. Teixeira-Neto, F.C. Nart, E.R.
Gonzalez, E.A. Ticianelli, Electrochim. Acta 52 (2006) 385–393.
[[
[
r Sources 178 (2008) 603–609 609
19] A.E. Russell, A. Rose, Chem. Rev. 104 (2004) 4613–4635.20] S. Maniquet, R.J. Mathew, A.E. Russell, J. Phys. Chem. B 104 (2000)
1998–2004.21] J. McBreen, W.E. O’Grady, K.J. Pandya, P.W. Hoffman, D.E. Sayers,
Langmuir 3 (1987) 428–433.22] M.E. Herron, S.E. Doyle, S. Pizzini, K.J. Roberts, J. Robinson, G. Hards,
F.C. Walsh, J. Electroanal. Chem. 324 (1992) 243–258.23] R. Viswanathan, G. Hou, R. Liu, S.R. Bare, F. Modica, G. Mickelson,
C.U. Segre, N. Leyarovska, E.S. Smotkin, J. Phys. Chem. B 106 (2002)3458–3465.
24] C. Roth, N. Martz, T. Buhrmester, J. Sherer, H. Fuess, Phys. Chem. Chem.Phys. 4 (2002) 3555–3557.
25] R.J.K. Wiltshire, C.R. King, A. Rose, P.P. Wells, M.P. Hogarth, D.Thompsett, A.E. Russell, Electrochim. Acta 50 (2005) 5208–5217.
26] E. Principi, A. Di Cicco, A. Witkowska, R. Marassi, J. Synchr. Rad. 14 (3)(2007) 276–281.
27] A. Witkowska, A. Di Cicco, E. Principi, Phys. Rev. B,. 76 (2007)104110.
28] C. Leroux, M.C. Cadeville, V. Pierron-Bohnes, G. Inden, F. Hinz, J. Phys.Met. Phys. 18 (1988) 2033–2051.
29] N. Travitsky, T. Ripenbein, D. Golodnitsky, Y. Rosenberg, L. Burshtein, E.Peled, J. Power Sources 161 (2006) 782–789.
30] J. Langford, A. Wilson, J. Appl. Cryst. 11 (1978) 102–113.31] R.W.G. Wyckoff, in: Crystal Structures, vol. 1, 2nd ed., John Wiley & Sons,
New York-London-Sydney, 1963.32] A. Filipponi, A. Di Cicco, C.R. Natoli, Phys. Rev. B 52 (1995)
15122–15134.33] A. Filipponi, A. Di Cicco, Phys. Rev. B 52 (1995) 15135–15149.34] E.K. Hlil, R. Baudoing-Savois, B. Moraweck, A.J. Renouprez, J. Phys.
Chem. 100 (1996) 3102–3107.35] A. Kootte, C. Haas, R.A. de Groot, J. Phys. CM 3 (1991) 1133–1152.
Related Documents