1 March 9, 2012 11:00 – 11:45 MSTA Presenter Lesson Topic School E-mail Tim Elyea Water Cycle GRPS – Sherwood Park [email protected] Mary Lewandoski Volcanoes GRPS – CA Frost [email protected] Michelle Welsh Watersheds GRPS – CA Frost [email protected] Susan Porter Alternative Wind Energy GRPS – Westwood Middle School [email protected] Beth Dondit EarthCache Forest Hills Public Schools - Goodwillie Environmental School [email protected]

Welcome message from author
This document is posted to help you gain knowledge. Please leave a comment to let me know what you think about it! Share it to your friends and learn new things together.
Transcript
1
March 9, 2012 11:00 – 11:45
MSTA
Presenter Lesson Topic School E-mail
Tim Elyea Water Cycle GRPS – Sherwood Park [email protected]
Mary Lewandoski
Volcanoes GRPS – CA Frost [email protected]
Michelle Welsh Watersheds GRPS – CA Frost [email protected]
Susan Porter Alternative Wind Energy
GRPS – Westwood Middle School
Beth Dondit EarthCache Forest Hills Public Schools - Goodwillie Environmental School

2
Lesson Plan
The Water Cycle
Tim Elyea
I. Student knowledge and skills needed to complete the lesson activity.
o Ability to follow written instructions.
o Ability to work in cooperative groups.
o Ability to make and record observations.
o Ability to explain observations.
o The earth’s water is contained in a closed system.
o The sun is the energy source that powers the water cycle.
o Plants give off water into the atmosphere from their leaves.
o Cool temperatures in the atmosphere cause water vapor molecules to join together
as water droplets. This process is called condensation.
o Evaporation is caused by the sun’s energy, activating liquid water molecules and
releasing them into the atmosphere as a gas.
o Precipitation can occur as rain, ice, snow, sleet or fog.
o Water seeps into the ground to become ground water.
II. Useful websites
o www.sepuplhs.org- SEPUP website
o www.kidzone.ws/water/ o www.treehugger.com o www.windows2universe.org o www.youtube.com/watch?v=vYBjPE0wekw (water cycle video explanation) o www.ga.water.usgs.gov/edu/watercyclehi.html o www.doityourself.com/stry/the-water-cycle

3
III. Word Bank/Key Vocabulary
o Evaporation: the process by which any liquid is converted from a liquid state into
a gaseous state, and carried off in vapor.
o Condensation: the process by which matter changes from a gaseous state to a
liquid state.
o Precipitation: water that falls to the ground in a solid or liquid form.
o Transpiration: process by which water is released by plants into the atmosphere.
o Surface runoff: A flow of rainwater, melted snow or sleet from the surface of the
land into streams, rivers and oceans.
o Discharge: Water released from the zone of saturation.
o Groundwater: Water that is underground.
o Biological storage: water stored in the bodies of plants and animals.
o Absorption: Water seeping into the pores of soils on the surface and below the
surface of the earth.
IV. Goal of Lesson
The objective of this lesson is to get students to understand that water on the earth is in a
cycle that is neither gained nor lost. It goes from one state of matter to another and from
one place to another. This is a hands-on investigation that helps students see the water
cycle working in a short period of time.
E4.p1A – Describe that the water cycle includes evaporation, transpiration, condensation,
precipitation, infiltration, surface runoff, groundwater and absorption.
E4.p2A – Describe the composition and layers of the atmosphere.
E1.1A – Generate new questions that can be investigated in the laboratory or field.
E1.1C – Conduct scientific investigations using appropriate tools and techniques.
E1.1E – Describe a reason for a given conclusion using evidence from an investigation.
E1.1h – Design and conduct a systematic scientific investigation that tests a hypothesis.
Draw conclusions from data presented in charts or tables.
E1.2B – Identify and critique arguments about personal or societal issues based on
scientific evidence.

4
E1.2D – Evaluate scientific explanations in a peer review process or discussion format.
E2.1A – Explain why the Earth is essentially a closed system in terms of matter.
E2.2A – Describe the Earth’s principal sources of internal and external energy (solar
energy).
V. Materials and supplies needed for each group of four to complete this lesson.
o 4 student science journals or paper on a clipboard.
o Large transparent glass bowl or plastic tub about 4-6 quarts in size for each group.
o Two cups of salt water per group, muddy water or colored water.
o Empty cup for inside of bowl with calibrations on it for measuring liquid volumes
for each group.
o Clear plastic wrap for covering the dish or tub for each group.
o Tape if necessary to seal the plastic wrap to bowl or tub.
o Heat lamp with clamp. (60-75 watt bulb) for each group.
o Ice (about a cup for each group).
o Student created observation sheets with a chart and a drawing.
VI. Procedures and Instructions:
Engage:
Where Did the Water Come From? (A probe from volume 3: Uncovering Student Ideas in
Science. NSTA press.).
The scenario says this:
Latisha took a sealed, plastic container of ice cubes out of the freezer. The outside of the
container was dry when she took it out of the freezer. She set the container on the counter. She
did not open the container. Half an hour later she noticed the ice had melted inside the
container. The container was full of water. A small puddle of water had formed on the kitchen
countertop, around the outside of the container. Which best describes where the puddle of water
came from?
o A gas in the air.
o Melted ice inside the container.
o Cold on the outside of the container.
o Condensation evaporated from water inside the container.
o Water that evaporated from inside the container.
o Cold changed hydrogen and oxygen atoms to water.

5
Describe your thinking about where the water came from? Provide an explanation for
your answer.
Students use Accountable Talk to discuss within their groups, choose the most valid
explanation and share out with the class. Verifying and clarifying each others points
keeps them accountable to the learning community. Include a drawing to explain your
answer.
Explore:
After the discussion, propose an experiment we could try to test their hypotheses and
ideas using the materials on the lab tables.
Ask: What is the power source for your experiment and what does it represent in the
water cycle? Most will say the heat lamp represents the sun which is the energy source
for the earth and drives the cycles that occur there.
Ask: Why are we using salt water, muddy water or colored water? Allow them to use
Accountable Talk within their groups to come up with a reason.
Ask: What does the plastic wrap seal represent? Accountable Talk again. Students
respond with answers.
Ask: Where will we put the ice and why? Accountable Talk…many students aren’t sure
about this one. (It represents the cold temperatures in the upper atmosphere that causes
water vapor to condense.)
Ask: What do you think will happen when we turn the heat lamp on your sealed
containers of salt water with ice on the plastic wrap top? Students discuss this within
their groups and share ideas.
OK, LET’S SET UP OUR EXPERIMENTS AND TEST OUR HYPOTHESES.
Procedure:
1. Students share tasks of placing the salt water in the bottom of the bowl.
2. Students place the collection cup in the middle of the dish, secured so it doesn’t float in
the water. (Could be weighted on the underside, but not inside).
6
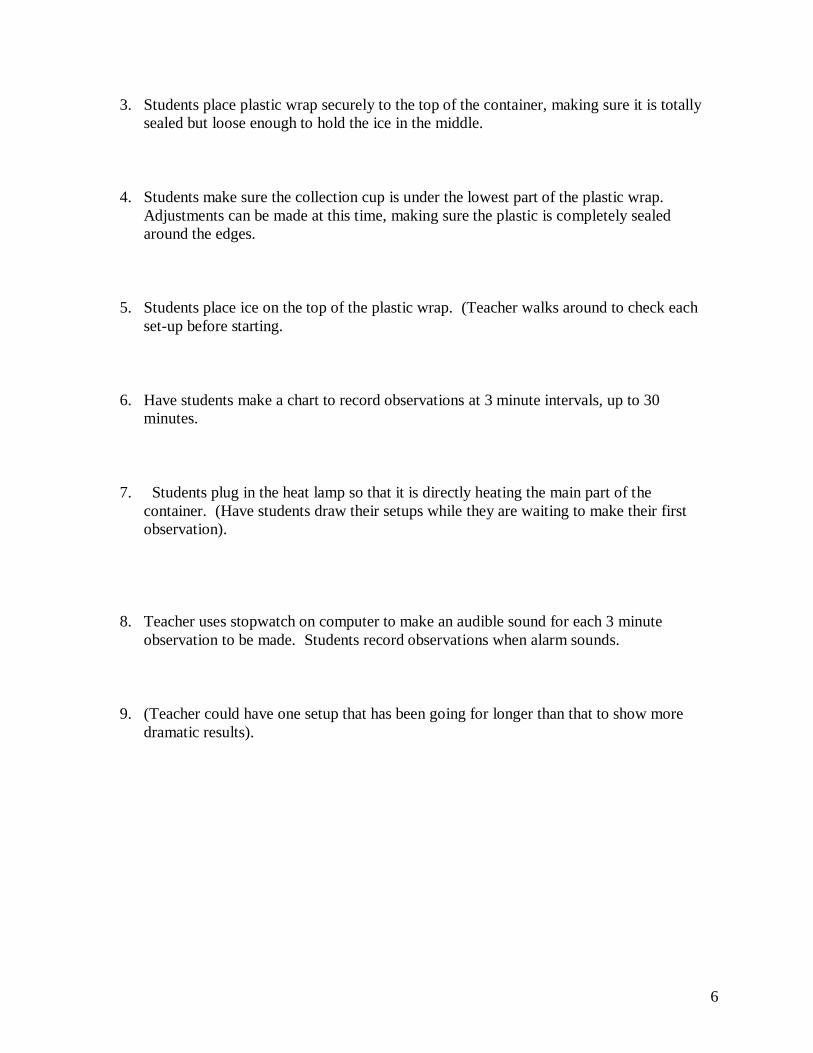
3. Students place plastic wrap securely to the top of the container, making sure it is totally
sealed but loose enough to hold the ice in the middle.
4. Students make sure the collection cup is under the lowest part of the plastic wrap.
Adjustments can be made at this time, making sure the plastic is completely sealed
around the edges.
5. Students place ice on the top of the plastic wrap. (Teacher walks around to check each
set-up before starting.
6. Have students make a chart to record observations at 3 minute intervals, up to 30
minutes.
7. Students plug in the heat lamp so that it is directly heating the main part of the
container. (Have students draw their setups while they are waiting to make their first
observation).
8. Teacher uses stopwatch on computer to make an audible sound for each 3 minute
observation to be made. Students record observations when alarm sounds.
9. (Teacher could have one setup that has been going for longer than that to show more
dramatic results).
7
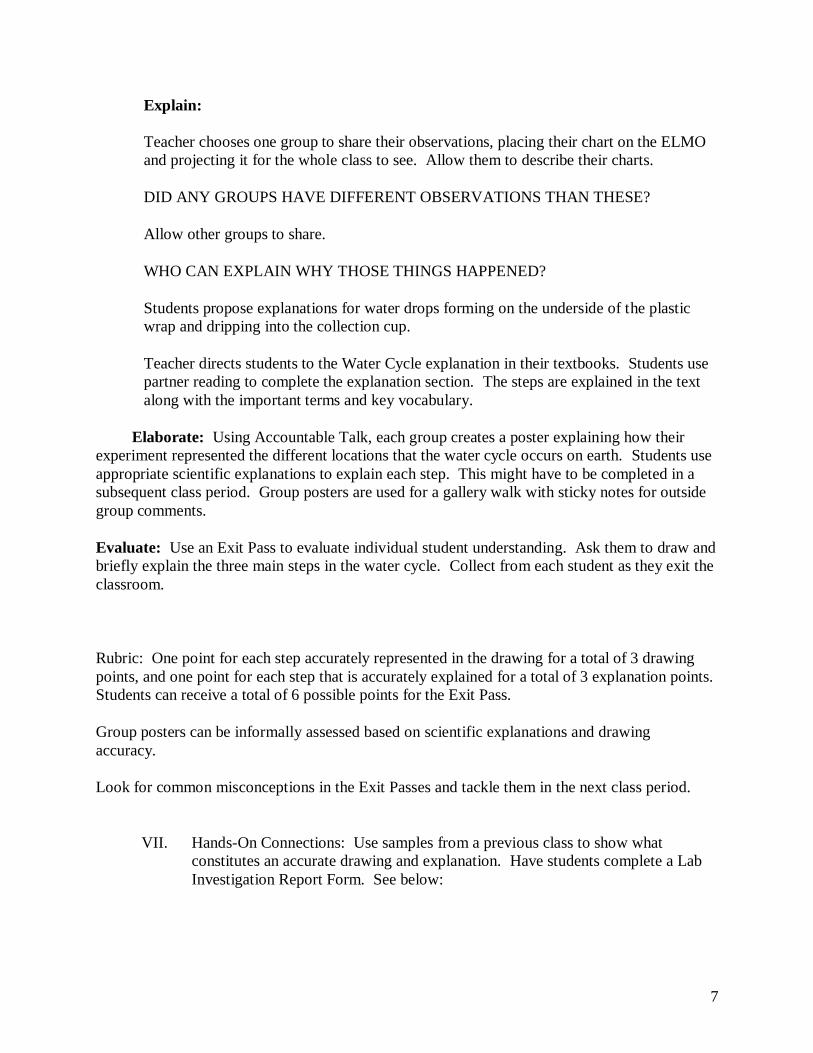
Explain:
Teacher chooses one group to share their observations, placing their chart on the ELMO
and projecting it for the whole class to see. Allow them to describe their charts.
DID ANY GROUPS HAVE DIFFERENT OBSERVATIONS THAN THESE?
Allow other groups to share.
WHO CAN EXPLAIN WHY THOSE THINGS HAPPENED?
Students propose explanations for water drops forming on the underside of the plastic
wrap and dripping into the collection cup.
Teacher directs students to the Water Cycle explanation in their textbooks. Students use
partner reading to complete the explanation section. The steps are explained in the text
along with the important terms and key vocabulary.
Elaborate: Using Accountable Talk, each group creates a poster explaining how their
experiment represented the different locations that the water cycle occurs on earth. Students use
appropriate scientific explanations to explain each step. This might have to be completed in a
subsequent class period. Group posters are used for a gallery walk with sticky notes for outside
group comments.
Evaluate: Use an Exit Pass to evaluate individual student understanding. Ask them to draw and
briefly explain the three main steps in the water cycle. Collect from each student as they exit the
classroom.
Rubric: One point for each step accurately represented in the drawing for a total of 3 drawing
points, and one point for each step that is accurately explained for a total of 3 explanation points.
Students can receive a total of 6 possible points for the Exit Pass.
Group posters can be informally assessed based on scientific explanations and drawing
accuracy.
Look for common misconceptions in the Exit Passes and tackle them in the next class period.
VII. Hands-On Connections: Use samples from a previous class to show what
constitutes an accurate drawing and explanation. Have students complete a Lab
Investigation Report Form. See below:

8
Title of Lab:__________________
Previous Knowledge:
Hypothesis:
Materials Needed:
Procedure:
Data Collection: Charts and Graphs
Observations:
Conclusion:
Error Analysis:

9
Mary Lewandoski
July 15, 2011
MiTEP Volcanoes:ModeltoMapT.doc
“Volcanoes: Model to Map” adapted from: Living with a Volcano in your Backyard -- An Educator's Guide with
Emphasis on Mount Rainier
I. Knowledge Needed
Student prior knowledge/skills
Basic map reading skills.
Cooperative group working skills.
Beginning knowledge of volcanic structure and mountain ranges.
Completion of the vocabulary cards for lesson required terms.
Topic related websites and other sources
http://vulcan.wr.usgs.gov/Outreach/Publications/GIP19/framework.html
Living with a Volcano in your Backyard -- An Educator's Guide with Emphasis on
Mount Rainier
http://www.agiweb.org/earthcomm/index2.html?State=MI
on line text for: EarthComm: Earth’s Dynamic Geosphere
Blackline Topo map of Mt. St. Helens
II. Vocabulary (all definitions from EarthComm text)
caldera: a large basin-shaped volcanic depression, more of less circular, the diameter of which is
many times greater then that of the included vent or vents.
composite cone (stratovolcano): a volcano that is constructed of alternating layers of lava and
pyroclastic deposits.
contour interval: the vertical distance between the elevations represented by two successive
contour lines on a topographic map.
contour lines: a line on a map that connects points of equal elevation of the land surface.
igneous rock: rock or mineral that solidified from molten or partly molten materiel, i.e., from
magma.
relief: the physical configuration of a part of the Earth’s surface, with reference to variations of
height and slope or to irregularities of the land surface.
shield volcano: a broad, gently sloping volcanic cone of flat-dome shape, usually several tens
or hundreds of square miles in extent.

10
silica: material with the composition SiO2.
topographic map: a map showing the topographic features of the land surface.
III. Goal of Lesson
Based on GRPS district syllabus:
ASW describe how the sizes of volcanoes are measured or characterized. (E3.4B)
ASW describe a reason for a given conclusion using evidence from an investigaion. (E1.1E)
Based on the goals from the required GRPS EarthComm text:
ASW create a topographic map from a volcano model.
ASW understand the meanings of contour line, contour interval and relief.
ASW interpret a topographic map.
IV. Materials and Set-Up
Engage:
11 laminated Volcano pictures from the Cascade Range. Each picture is labeled with
volcano name, type of volcano and elevation. One set per table group.
(see file: cascadeMtpicsEle.doc)
The laminated handout titled: “Major Cascade Range Volcanoes” with a topo map of Mt .
St. Helens copied on the back. One handout for each student.
(see file: Eng-CascadeMap.doc and black-line master in teacher manual pg 47)
Explore
Per Person
Notebook paper, per person
Per Group:
The laminated volcano picture sets from the engage activity.
Student model directions with questions “Volcanoes: Model to Map”, highlight letters a
though i so students see questions that need to have written answers.
(see file: ModeltoMapSt.doc and file: ModelsToMapRubric.doc))
Volcano making material:
play-dough (see attached recipe), wooden dowel, plastic
knife or wire, ruler, cardboard, gallon -ziplock bag
PLAYDOH recipe that worked: Stir together in a 2-quart pan:
1 cup flour, 1/2 cup salt, 2 teaspoons of cream of tartar
Add: 1 Tablespoon vegetable oil, 1 cup water (optional add
food coloring to water)

11
Cook over medium to medium-high heat. At first it will seem like you have too much water
but it all cooks down to a big chunk of playdoh in about 3 minutes. Stir until it sticks together and then put on a cutting board to cool a little. Once you can touch it, knead it until
it's completely smooth. Store in an air tight container and it will last for months. I used gallon
ziplock bags for storage. Make about 1 ½ recipes per volcano.
Map Making Materials: 11x17 blank paper, pen, pencil
Explain and Evaluate One page student quiz, unlined piece of paper, Mt. St. Helens topo map (EarthComm
Text) (see file: QuizTopoPg1.doc and QuizTopoPg2.doc)
VI. 5 E Lesson Plan
(2 day lesson)
Engage: Students title their notebook paper “Volcanoes: Model to Map”. Each student group
of 4 is given a set of the Cascade Range volcano pictures and the handout titled “Major
Cascade Range Volcanoes”. Students are asked to put the pictures in the order of the map, with
the northern-most volcano first and the most southern volcano last. Students are to copy the
name and elevation of the volcanoes starting with the north and ending with the south.
Once the list is completed the teacher asks the students if they were flying over the
Cascade Range from British Columbia to California what would they see? Could they
identify the highest peaks? How about the lowest peaks? How could someone draw a
map to show these different elevations? The teacher can either have students make
sketched on their notebook paper and/or share ideas. The teacher tells students that
topographic maps show differences in elevation. Each group will be choosing a volcano
to create a model and then use it to make a topo map.
Explore: The teacher hands out the directions “Volcanoes: Model to Map” and asks each
student to spend the next 5 minutes reading the activity directions. The teacher than asks
if anyone has any questions. If not she calls on students to help explain different parts of
the activity.
To start Part 1 each pair of students choose one of the volcano pictures to make their
model volcano (or assign volcanoes so everyone does not make the same model).
After selecting/assigning the mountain picture students need to complete Part I of the
activity.
After completing Part I, student groups may get their required materials to make their
model. During this time the teacher moves around the room to monitor the groups for
cooperation and for accurately following the directions. She reminds them that it is
important that their volcano model does not have all smooth surfaces and that the slope
and steepness should resemble their picture and that it is probably different on each side
of the volcano.

12
Prior to students slicing their models the teacher needs to approve the model height,
contour line markings and north marking.
(If time is short this is a good place to stop. Students should not slice their model until
they have time to complete their map. To keep from drying out store volcano in a
gallon ziplock bag.)
Day 2: Students complete their topo map following the directions. After making the map
students reassemble their models. Students follow the last step to adequately label their
topo map.
Explain: As the groups are working on their models and maps the teacher moves around the
room to discuss the work with the groups and verbally assess understanding. Also
check that students are correctly answering questions a through i.
Elaborate/Expand: As part of the unit, another topographic activity is set up as one of the
work stations. This additional work will help students to become more comfortable with
reading contour lines.
Evaluate: Each group will present to the teacher their model and map work based on the
rubric to complete a joint assessment (student group and teacher).
Students take their individual quiz after completing this presentation.
VI. Hands-on Connections: Engage: Students are in small groups using Cascade Range volcano pictures and a map
of the same volcanoes showing where they are located. Students will be organizing
pictures based on location and making a list. After creating the list students discuss how
you would map these mountains you would see while flying over the Cascade Range
from British Columbia to California.
Explore: Pairs to groups of 4 students are creating a model of a volcano then using their model
to create a topographic map. Students should be able to look down at their model and
their map and note similarities. End results should be a play-dough volcanic model on a
piece of cardboard. This model should match their drawn topographic map, which has the title
of their model, a north arrow, and 5 to 6 contour lines with every other line labeled in meters
.
Evaluate: Student pairs/group present their model and map to the teacher using the rubric.
Points are given as part of this discussion between teacher and student group.

13
VIII. Assessment Rubric:
Rubric: “Model to Map”
Volcano Model: 15 pts
Topographic Map: 9 pts
Total Points for lesson: 60 pts
Engage: Volcano and Elevation List: 11 pts
Explore: “Model to Map” Rubric: 24 pts
Explain: Questions a through i: 9 pts
Evaluate: Student Quiz: 20 pts

14
MiTEP Lesson Plan Michelle Welsh Cohort 2
Watersheds Big Idea #7 Humans depend on Earth for resources. 7.5 Water resources are essential for agriculture, manufacturing, energy production and life. Big Idea #9 Humans significantly alter the Earth. 9.4 Humans affect the quality, availability, and distribution of Earth’s water through the modification of streams, lakes, and groundwater. 9.9 An Earth Science literate public, informed by current and accurate scientific understanding of Earth, is critical to the promotion of good stewardship, sound policy, and international cooperation. State GLCES and GRPS GLCES Science S.IP.06.11 Generate scientific questions based on observations,investigations, and research. S.IP.06.12 Design and conduct scientific investigations. S.IA..06.12 Evaluate data, claims, and personal knowledge through collaborative science discourse. S.IA.06.13 communicate and defend findings of observations and investigations using evidence. S.RS.06.13 Identify the need for evidence in making scientific decisions. S.R.S.06.15 Demonstrate scientific concepts through various illustrations, performances, models, exhibits, and activities.f S.RS.06.17 Describe the effect humans and other organisms have on the balance of the natural world.
15
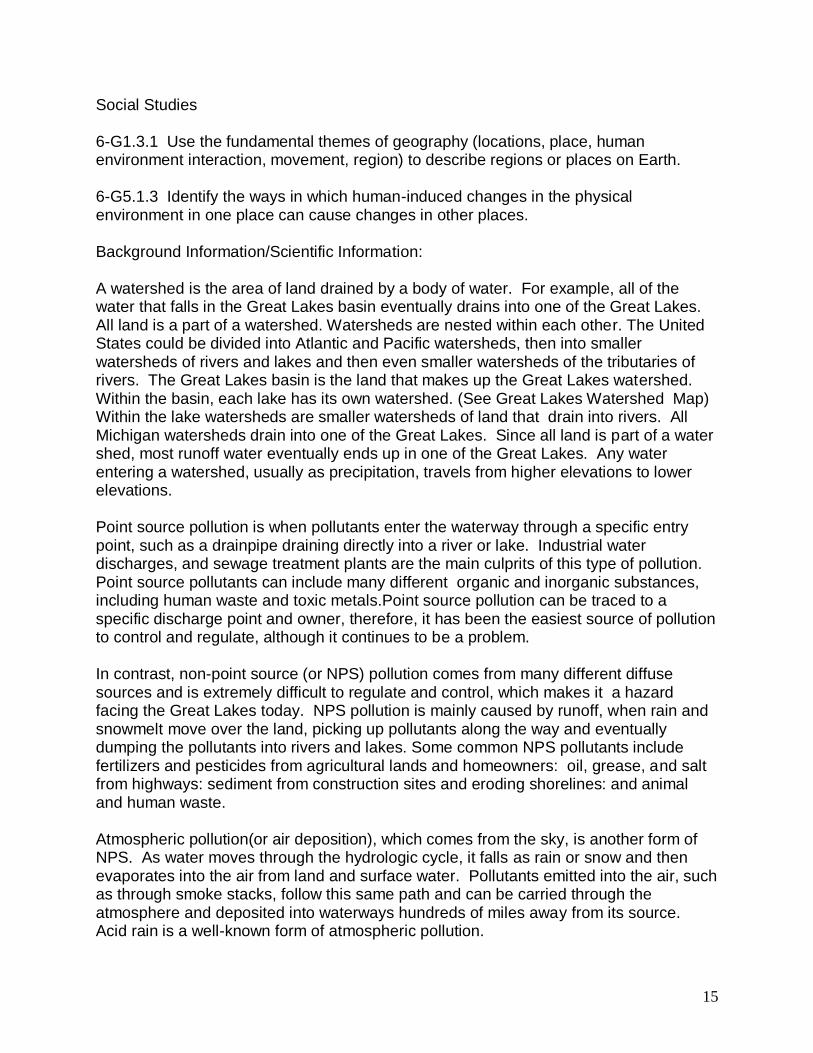
Social Studies 6-G1.3.1 Use the fundamental themes of geography (locations, place, human environment interaction, movement, region) to describe regions or places on Earth. 6-G5.1.3 Identify the ways in which human-induced changes in the physical environment in one place can cause changes in other places. Background Information/Scientific Information: A watershed is the area of land drained by a body of water. For example, all of the water that falls in the Great Lakes basin eventually drains into one of the Great Lakes. All land is a part of a watershed. Watersheds are nested within each other. The United States could be divided into Atlantic and Pacific watersheds, then into smaller watersheds of rivers and lakes and then even smaller watersheds of the tributaries of rivers. The Great Lakes basin is the land that makes up the Great Lakes watershed. Within the basin, each lake has its own watershed. (See Great Lakes Watershed Map) Within the lake watersheds are smaller watersheds of land that drain into rivers. All Michigan watersheds drain into one of the Great Lakes. Since all land is part of a water shed, most runoff water eventually ends up in one of the Great Lakes. Any water entering a watershed, usually as precipitation, travels from higher elevations to lower elevations. Point source pollution is when pollutants enter the waterway through a specific entry point, such as a drainpipe draining directly into a river or lake. Industrial water discharges, and sewage treatment plants are the main culprits of this type of pollution. Point source pollutants can include many different organic and inorganic substances, including human waste and toxic metals.Point source pollution can be traced to a specific discharge point and owner, therefore, it has been the easiest source of pollution to control and regulate, although it continues to be a problem. In contrast, non-point source (or NPS) pollution comes from many different diffuse sources and is extremely difficult to regulate and control, which makes it a hazard facing the Great Lakes today. NPS pollution is mainly caused by runoff, when rain and snowmelt move over the land, picking up pollutants along the way and eventually dumping the pollutants into rivers and lakes. Some common NPS pollutants include fertilizers and pesticides from agricultural lands and homeowners: oil, grease, and salt from highways: sediment from construction sites and eroding shorelines: and animal and human waste. Atmospheric pollution(or air deposition), which comes from the sky, is another form of NPS. As water moves through the hydrologic cycle, it falls as rain or snow and then evaporates into the air from land and surface water. Pollutants emitted into the air, such as through smoke stacks, follow this same path and can be carried through the atmosphere and deposited into waterways hundreds of miles away from its source. Acid rain is a well-known form of atmospheric pollution.
16
The major sources of atmospheric pollution include coal-burning energy plants and waste incinerators. The combustion of fossil fuels and waste (such as from hospitals) produces large amounts of mercury in the air, a toxic chemical that is fatal to humans and animals in large quantities. Phosphorus and polychlorinated biphenyls (PCBs) are also transported to water ways via air deposition. Reference: Unit 1 Lakes, Explore 4-Watershed Orientation,Alliance for the Great Lakes/ Great lakes in My World. Prior Knowledge Needed By Students: Knowledge of: The consequences of pollution in the Great Lakes to the Great Lakes ecosystem,water quality, and to humans. The path that water takes from their school yard to Lake Michigan. The path that water takes from Grand Rapids to the Atlantic Ocean. Solid understanding of the water cycle Experience reading different types of maps Experience working in cooperative groups and sharing ideas using accountable talk. Experience drawing conclusions based on evidence Vocabulary Bank: Watershed - An area of land that drains into a river system. Elevation - the altitude of a place above sea level or ground level non-point source pollution - pollution coming from many different diffuse sources. point source pollution - pollution coming from a specific source birds eye view - View from directly above an area

17
Materials Needed: Enough for each group (Have groups work in groups of 3-4) several tall objects and short objects (2 or 3 of each per model) 1 blue permanant marker(to mark the direction of water flow in model) White butcher paper (large enough to cover the trays that you use) large water proof tin trays small spray bottles with water newspaper 1 or 2 green permanant markers (non polluted water shed) only one or two groups will have this marker. brown, red, and black water soluble markers (brown=Loose sediment from various locations and animal and human waste: red=fertilizers and pesticides from agricultural lands and homeowners: black=oil, grease, chemicals, and salt from paved locations such as highways and parking lots.) Each group will have a different color. For the classroom 1 large classroom map of Michigan Watersheds For each student: What is A Watershed? part 1 and part 2 found at www.misegrant.umich.edu/flow , however, I have modified these to fit my students and that is attached. Reflection/Assesment sheet from Alliance for the Great Lakes/Great Lakes in My World, I have also modified and attached. Watershed map (several different types can be found and printed off at http://www.geo.msu.edu/geogmich/MIwatershed.html ) Choose the map that works best for your students

18
Engage: Take a hike around your schoolyard, neighborhood, or an area around your school preferablly during a light rain. Ask students where the water is flowing and why it is flowing that way. Have students share ideas. If your school is by a stream or creek, take a hike there and ask students where the water that is in it comes from, which way the water is flowing and why it is flowing that way. Ask them how pollution gets into it. Listen for misconceptions so that you can address them during the lesson. Students may record observations in science journal. When you return to class, record questions that students have about water flow, pollution in water etc... that they have after the above hike. Put up classroom map of Michigan Watersheds and ask students what a watershed is and how it works. Explore: Students will build a model of a watershed and make observations I. Put students into groups of 3-4 II. Pass out What is A Watershed? Part 1 Lab instructions. 1. Have students complete steps 1-4. Walk around and assist groups by asking them
questions that will assist them in setting up model correctly,for example, how does your model show tall and short hills? Also, direct students back to the procedures when they have questions about the set up of model, or if you observe that they are not following the procedures as they are written.
2. Have them raise hand when they get to step 5. Give each one of the washable marker colors, however, give at least one group the green permanant marker. Have them use these markers to mark the high areas and low areas. Do not tell them what the markers represent at this time.
Make sure they know what bird’s eye view means before they make their elevation
maps. 6. Have them complete steps 5-7, and raise their hand when they are done. Check that
groups have followed and completed all steps up to this point. Discuss the predictions that they made in step 7. Then, give them a spray bottle and have them complete the rest of the investigation. Continue to monitor groups and assist where needed by asking guiding questions.
19
Explain: 1. Discuss the model parts: Paper = land, spray = precipitation, branching pattern of
the water flow = a river system, wet portions of the paper = absorption of water by land, flow of water over the paper = run-off, change in elevations on land = slope, entire model= watershed, color of washable markers represent different types of pollution. Write on board so that students can refer back to.
2. Give students time to discuss and prepare to present findings to class. 3. Have groups share their elevation maps on an Elmo. They will need to answer the
following questions when presenting. a. How did the water flow over the surface of the land? b. What caused the water to flow in the direction that it flowed? c. Where did the water accumulate? Explain why. d. What type of pollution was found in your water shed? Describe what happened to the pollution as the water flowed through the watershed?
4. Agree as a class to the answers to the questions and write on chart paper. Elaborate 1. Play 1 min youtube video http://www.youtube.com/watch?v=f63pwrMXkV4&feature=related. 2. Pass out a copy of Great Lakes watershed map to each student 3. Have students find and highlight the water shed that they live in. If computers are available, have students go to www.epa.gov/surf to locate their watershed and then highlight it on the map. 4. Discuss point and non-point pollution. 5. Have groups discuss ways that they can help to keep a watershed healthy. 6. Play http://www.youtube.com/watch?v=HhlPtNX5XTM about 8min.long. 7. Have groups make a list of ways that they can help to keep their watershed healthy. 8. Have students make a list of questions that they may still have. Students may
investigate using the internet, or by designing their own models. Evaluate: Students will complete Reflection sheet Have students answer any of the questions that they wrote down during the engage Another option is to have students teach another grade level about watersheds

20
References: YouTube www.misegrant.umich.edu/flow Flow unit 2:Water, Michigan Sea Grant, Regent of the University of Michigan http://www.ports.parks.ca.gov/pages/22922/files/salmonsourceguide-salmonstoryassessment.pdf Oregon Department of Fish and Wildlife Alliance for the Great Lakes, Great Lakes in My World www.epa.gov/surf Blandford Field Lessons GEO 202 Winter 2007, written by Steve Maddox and his students

21
What is a Watershed ?
Build Your Watershed Model 1. Place newspaper under the tray. 2. Arrange a tall object near one edge of the tray and arrange the shorter objets toward
the enter of the tray. 3. Crumple up a piece of butcher. Be careful not to rip any holes in the paper. 4. Carefully cover the tall and short objects with the sheet of butcher paper, pressing the
paper down so that it looks like tall and short hills. Use pieces of tape to keep the paper from lifting up from the tray. Raise hand and get approval before moving on.
5. On the model, mark high areas with an H and low areas with an L using the marker that your teacher gives you.
6. Draw an elevation map of your model on the back of this sheet, sketch a bird’s eye view of the high and low areas (as if you were looking down at your model) Mark the high areas with H and the low areas with L.
7. Predict how the water will flow over the model if you spray water on it. Include where water will flow and accumulate. On your model, use the blue marker to draw arrows to show how the river will flow and draw circles to indicate where the water will accumulate. Use pencil to add this to your Elevation Map as well.
8. Make observations(record all observations on the back of this sheet) as you spray your model with water in the following steps
9. Hold spray bottle about 5 inches from your model and spray for several minutes until you get a continual flow of water. Take turns spraying your model. Alternate where each person sprays.
10. Return spray bottles 11. Using a colored pencil, draw on your Elevation Map how the water flows over
your model and where the water accumulates. Note the pattern of how the water flows over your model, how smaller rivers join to form larger rivers and how rivers flow into lakes.
1. Explain how the water flowed over your model (what patterns occured?) What
caused the water to flow the way it did? 2. Did your observations agree or disagree with your predictions? How were they similar or different?

22
Reflection
1. Draw a map of your watershed. 2. Describe the water flow in a watershed. 3. What are the problems associated with nonpoint source pollution? 4. What can you do to decrease problems with nonpoint source pollution in your
watershed? 5. What questions do you still have about watersheds and pollution?
23
Susan Porter
July, 2011
MiTEP Lesson Plan
Title: Alternative Wind Energy
I. Knowledge Needed
Issues and Earth Science Textbook- Energy Unit
Activity 67: Measuring Wind Speed and Direction (p175-189)
Students construct a wind vane and an anemometer
Activity 68: Worldwide Wind (p191-199)
Students use a computer simulation to identify the common
wind directions & construct a map of global wind patterns.
http://en.wikipedia.org/wiki/Wind_power
A general overview of wind power, history, wind energy,
electricity generation, wind farms, offshore wind power, etc.
http://www.kidwind.org by U.S. Department of Energy’s Office of Energy
Efficiency and Renewable Energy
See the Wind
PBS: Wind Power for Educators
Small Wind Electric Systems
Scale Models and Wind Turbines
Building the Basic PVC Wind Turbine
http:www.michiganadvantage.org/Wind-Energy/
Includes Michigan wind energy resource maps that are intended to
suggest areas in Michigan that may be best suited for wind
generators.
http://www.landpolicy.msu.edu/WPT/ The Land Policy Institute Wind
Prospecting Tool Prototype developed by MSU to help foster
the development of wind energy in the state of Michigan.
II. Vocabulary
Anemometer: An instrument used for measuring wind speed.
Beaufort’s wind force scale: A scale that ranges wind velocities based on
observations.
Latitude: The angular distance north or south of the equator, measured in degrees
along a meridian on a map or globe.
Prevailing winds: The global pattern at different latitudes in which the direction
from which the wind is generally blowing.

24
Wind: caused by atmospheric pressure changes that occur when the sun heats air
in some places more than others. Form of solar energy.
Wind direction: Direction from which the wind is blowing.
Wind vane: An instrument that points in the direction the wind is coming from.
Wind farm: A location that wind turbines are placed to convert wind energy into
electricity.
Wind mill: A wind machine that takes the energy from the wind and uses it to do something like
pump water, move mechanical parts on other machines or even cut lumber is called a windmill. (from tinygreenbubble.com).
Wind turbines: A wind machine that converts the wind’s kinetic energy into electricity is actually
technically called a wind generator, wind turbine, wind turbine generator (WTG), wind power unit (WPU), wind energy converter (WEC) or an aerogenerator. (from tinygreenbubble.com). Not to be confused with a windmill.
III. Goal of Lesson
Students will understand that Michigan receives enough wind to make it
feasible to build wind farms that will convert wind energy into electricity.
Students will construct a wind vane and an anemometer to understand how
wind direction and wind speed are calculated. Students will analyze maps
to determine where Michigan gets the most wind, in order to determine
optimal regions to build wind farms.
P.EN.M.1 Kinetic and Potential Energy- Objects and substances in motion
have kinetic energy. Objects and substances may have potential energy
due to their relative positions in a system.
P.EN.06.12 Demonstrate the transformation between potential and kinetic
energy in simple mechanical systems (wind vane & anemometer).
IV. Materials/Tech Support
Teacher: Pictures of hydro dams, coal burning plants, wind mills,
wind turbines, Beaufort Wind Force Scale poster, large fans, chart for
class data.
Pairs of students: stopwatch, compass, wooden sticks with pointed end,
thumbtacks, index cards, paper clips, popsicle sticks, tongue depressors,
plastic straws, small and large paper cups/plastic cups, modeling clay,
sand, scissors, stapler, glue, markers, tape, student sheet for Design
Process. Computers for computer simulation from Sep-up lab.
V. Procedure/Instructions
Engage: What happens when we plug something into an electrical outlet?
Where does our electricity come from? How does the energy company
create electricity? Generate class discussion. Lead to the idea that some
electricity is converted from hydro dams or a coal burning plant or more

25
popular today wind turbines in groups, called a wind farm. (Show pictures
of each of these examples).
Read about Francis Beaufort and review the Beaufort Wind Force
Scale (Science Issues textbook, Activity 67). Review that a wind vane
indicates the direction the wind is coming from and an anemometer
measures the wind speed. (Many students might think the wind vane
points in the direction the wind is going.) Show students pictures of wind
vanes and anemometers used by meteorologists.
Explore: Using the listed materials, have students work in pairs to design
and construct a wind vane and an anemometer. Use the student design
process sheet to record plans/construction sketches. Use the large fans to
test out the wind vane and anemometer in the classroom. Measure the
wind speed and record the data. Compare with other groups. Teacher visits
groups as they work, monitoring progress. Ask students to explain what
they are doing and why. Some students may mount the compass onto the
wind vane; suggest that instead they mark the four cardinal directions on
the vane.
Explain: Why does measuring wind direction and wind speed important
skills and knowledge for converting wind energy into electricity?
Scientists that work for energy companies need to know where the most
optimal place is to build wind farms/wind power plants in order to produce
the most electricity. Do Activity 68 in the Science Issues text. This is a
computer simulation that will show the most common wind directions for
a particular location and then you can use this information, along with data
gathered by classmates, to construct a map of global wind patterns.
Elaborate: How does learning about wind direction and wind speed affect
how we can generate electricity from the force of the wind in Michigan?
Use the handout or website http://www.landpolicy.msu.edu/WPT/ to
evaluate the results of the work done with the wind prospecting tool
prototype. According to this work, the top 12 areas for wind utility scale
wind development areas in the state of Michigan include: Eastern UP,
Keweenaw, Leelanau, Mason County, Presque Isle, Straits, Thumb area,
and Traverse Bay.
Evaluate: Work with a partner to design a hypothesis of where you think
the best place in Michigan is to put a wind farm. Why? What concerns
would people living in the area have regarding using wind as a way of
generating electricity? Do you think most people would be in favor of
your proposed area, or against the idea? Why?

26
VI. Hands-On Connection
Prototype of a wind vane & an anemometer. (TE has a sketch available).
Teacher gives their hypothesis for the best place in Michigan to build a wind
utility power plant (wind farm). Ludington in Mason County is the closest for
Grand Rapids Public Schools students, and offer the most familiarity. Mason
County is listed as #4 in the Top 12 list from MSU’s prototype tool.
VII. Assessment Rubric
Design
Investigation
Design and construction of a wind vane and anemometer
Level 4 Student accomplishes level 3 and also able to identify an alternate
procedure, suggest improved materials, and/or relate clearly to scientific
principles and approaches to utilizing the wind as an energy source.
Active in class discussion using Accountable Talk.
Level 3 Students design is appropriate and has a reproducible procedure evident
in the Design Process sheet.
Level 2 Students design and/or procedure is incomplete or has significant errors.
Student not cooperative with partner and/or classmates/teacher for
suggestions to help with understanding.
Level 1 Student design is incorrect, or demonstrates a lack of understanding of
the goals of the investigation and not cooperative with partner and/or
classmates/teacher for suggestions to help with understanding.
Examples of Wind Vanes
27
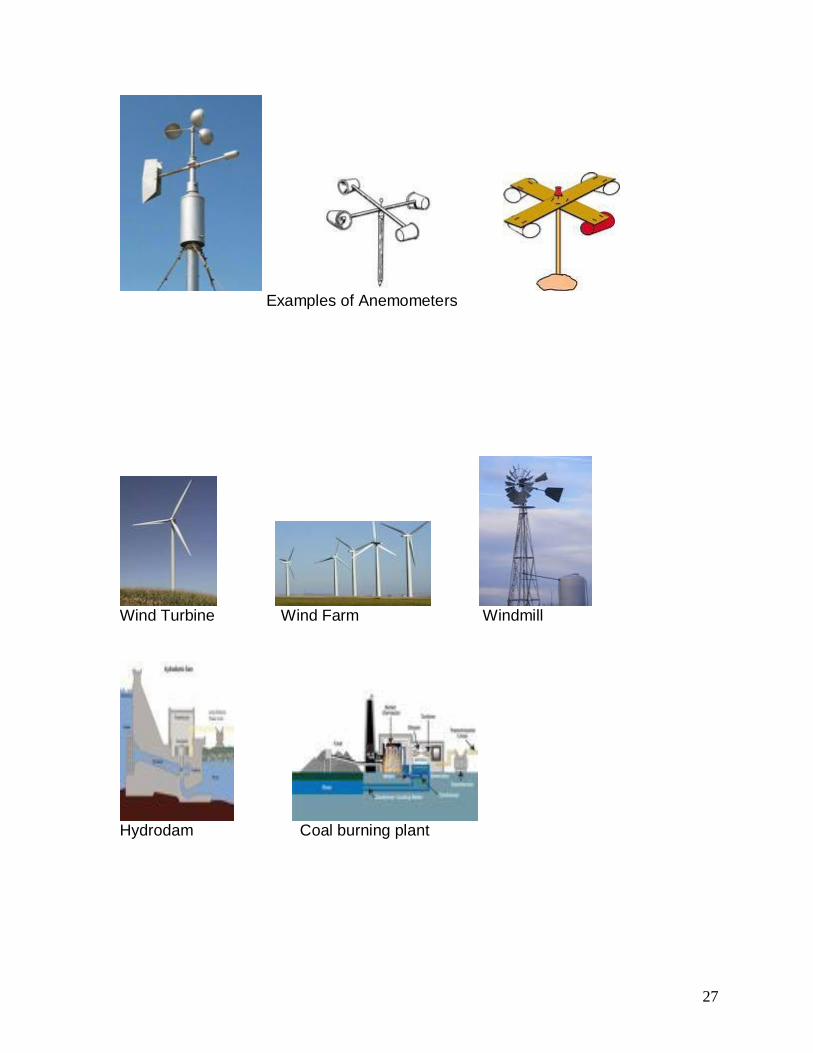
Examples of Anemometers
Wind Turbine Wind Farm Windmill
Hydrodam Coal burning plant

28
Design Process Sheet (Issues in Science: Student Sheet 67.1a. &1b)
Instrument designed: Instrument measures: Sketch of design: Feedback from group: Testing Procedure: (explain how to use your instrument to measure wind) 1. 2. 3. 4. Results of testing the instrument
Possible problem with instrument design
Planned changes Results of testing revised design
Final design: Measuring Wind data (identify speed or direction)
Trial 1 Trial 2 Trial 3
Date
Time
Location
Wind data
Related Documents


