Date 22-01-2016 PT KARYA MAKMUR ABADI Progress Report For the month of DESEMBER 2015 KUALA LUMPUR KEPONG ………………………………………. (ARVIN SANGGARIN) Manager (No. Syarikat: 15043-V) PT KARYA MAKMUR ABADI

Welcome message from author
This document is posted to help you gain knowledge. Please leave a comment to let me know what you think about it! Share it to your friends and learn new things together.
Transcript

Date 22-01-2016
PT KARYA MAKMUR ABADI
Progress Report
For the month ofDESEMBER 2015
KUALA LUMPUR KEPONG
……………………………………….(ARVIN SANGGARIN)
Manager
(No. Syarikat: 15043-V)PT KARYA MAKMUR ABADI

PAGE 1
HIGHLIGHTSEstimated percentage of FFB pushed by shovelPercentage FFB pushed due to grading
PRODUCTION
RAINFALL RECORD (mm) Year 2015
Fin Year Oct Nov Dec Jan Feb Mar Apr May Jun Jul Aug SepLast FYThis FY 62.00 252.00 204.00
OTHER HIGHLIGHTS
DESCRIPTION OF PROBLEMS / ACHIEVEMENTS
Comments :
ITEM
2.11
O.E.R %
K.E.R %
PROGRESS REPORT ON
(3RD MONTH OF FINANCIAL YEAR)FOR THE MONTH OF DESEMBER 2015
PT KARYA MAKMUR ABADI
Todate Current Financial Year Same Period Last Year
Last Month TodateThis Month This Month
2.22
23.72
2.12
24.05 23.33
- OER mengalami peningkatan sebesar 0,72% dibanding bulan lalu.- KER mengalami peningkatan sebesar 0.11% dibanding bulan lalu- Rainfall sebesar 204 mm, dikategorikan memasuki awal musim hujan

PAGE 2
1 PRODUCTION REPORT
1.1. FFB STATEMENT
1.1.1. FFB CONTRIBUTION
Estimate for Estimate +/- Estimate +/- EstimateThis Month Todate This Month Todate This Month Todate
KLK Estates MT MT MT MT MT MT6424.710 19088.700 7039.000 19357.000 -8.73% -1.39%2792.320 8759.260 3338.000 9597.000 -16.35% -8.73%
20.480 49.560 568.000 1633.000 -96.39% -96.97%- -- -- -- -- -- -- -- -- -- -- -- -- -- -
Sub Total 9237.510 27897.520 10945.000 30587.000 -15.60% -8.79%
Non-KLK Estates- -- -- -- -- -- -- -- -- -- -- -
Sub Total - - - - - -
Estimate for Estimate +/- Estimate +/- EstimateThis Month Todate This Month Todate This Month Todate
Outsiders MT MT MT MT MT MT- -- -- -- -- -- -- -- -- -- -- -- -- -- -- -- -- -- -- -- -- -- -- -- -- -- -- -- -- -- -- -- -
KMA SELATANKMA TENGAHKMA UTARA
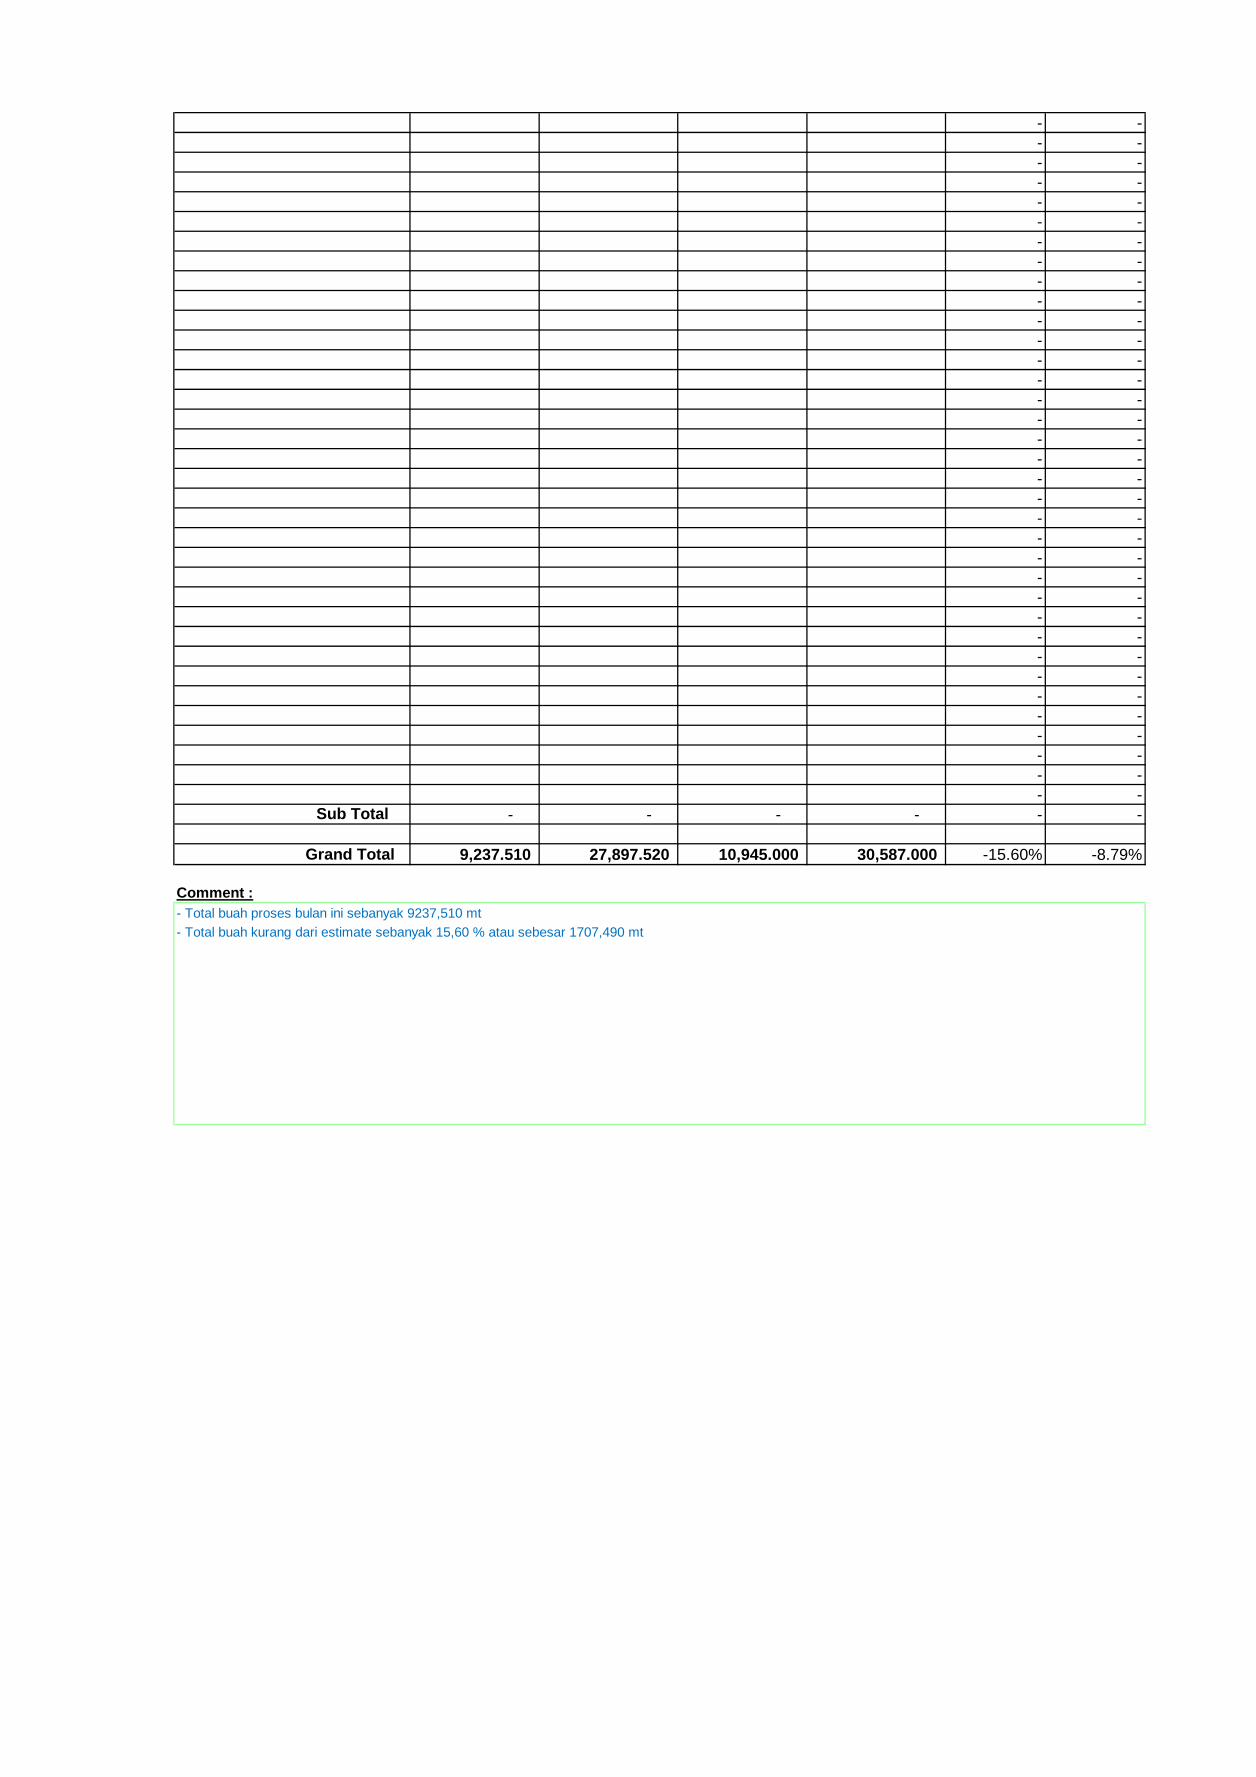
- -- -- -- -- -- -- -- -- -- -- -- -- -- -- -- -- -- -- -- -- -- -- -- -- -- -- -- -- -- -- -- -- -- -- -
Sub Total - - - - - -
Grand Total 9,237.510 27,897.520 10,945.000 30,587.000 -15.60% -8.79%
Comment :- Total buah proses bulan ini sebanyak 9237,510 mt- Total buah kurang dari estimate sebanyak 15,60 % atau sebesar 1707,490 mt

PAGE 31.1.2. FFB COMPOSITION
Composition of crop from various years of planting are :-
MT % MT %2008 3766.060 40.78 11477.480 41.16 2009 4752.390 51.46 14682.080 52.65 2010 215.220 2.33 656.830 2.36 2011 0.000 - 0.000 - 2012 497.360 5.39 1061.350 3.81 2013 4.130 0.04 6.580 0.02
- - - - - - - - - - - - - - - - - - - - - - - - - - - - - - - - - - - - - - - - - - - - - - - - - - - - - - - - - - - - - - - - - - - -
Total 9235.160 100.00 27884.320 100.00
Append below the classification of Palms According to Age :-Category Palm Age (years) TM % TD %
Immature 1st - 3rd 5% 4%Young 4th - 9th 95% 96%Prime 10th - 18th 0% 0%Old 19th and above 0% 0%Comments :- Presentase buah immature sebesar 5%- Presentase buah young sebesar 95%
This Month TodateYear of Planting
Remarks
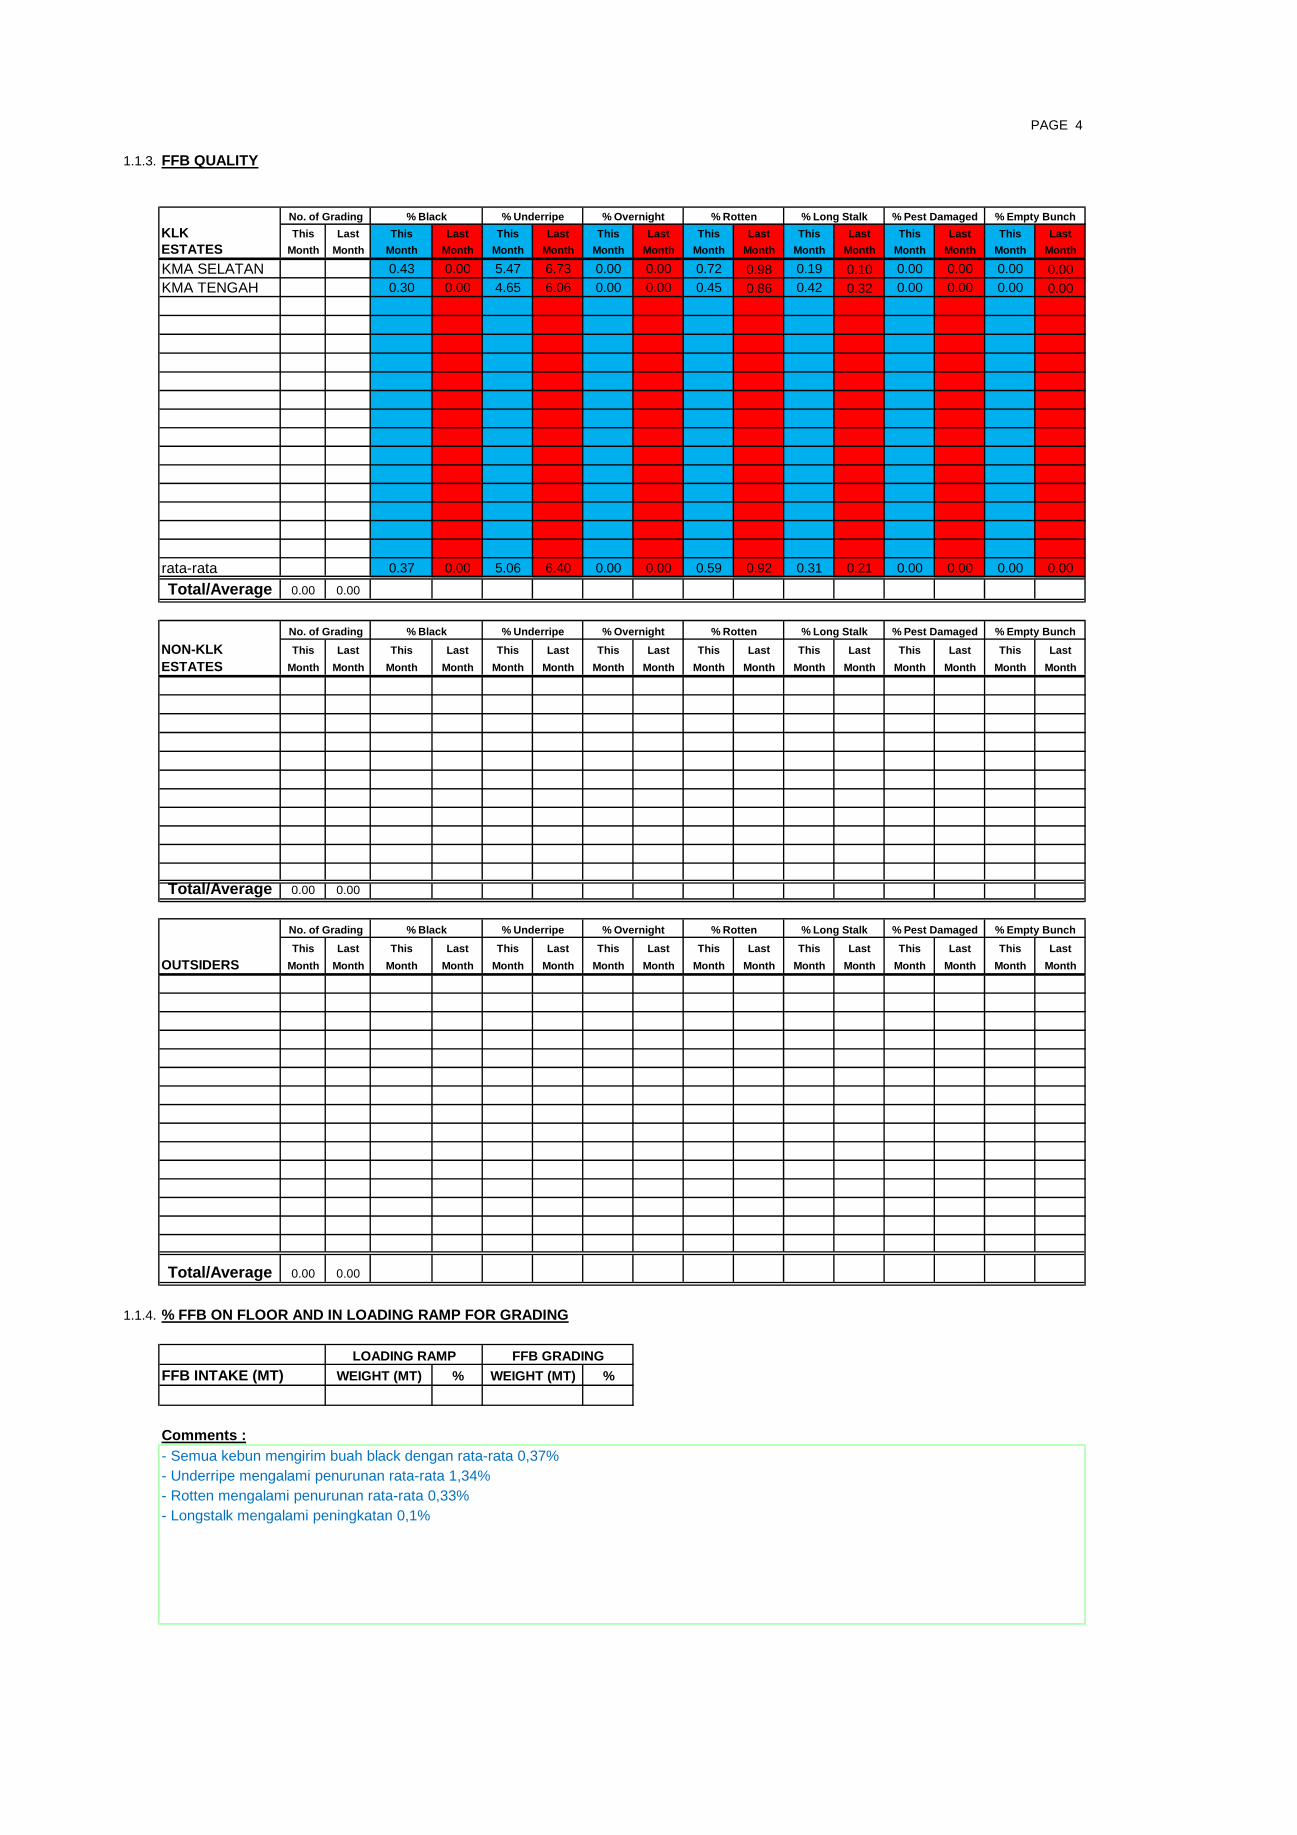
1.1.3. FFB QUALITY
KLK This Last This Last This Last This Last This Last This Last This Last This LastESTATES Month Month Month Month Month Month Month Month Month Month Month Month Month Month Month Month
KMA SELATAN 0.43 0.00 5.47 6.73 0.00 0.00 0.72 0.98 0.19 0.10 0.00 0.00 0.00 0.00KMA TENGAH 0.30 0.00 4.65 6.06 0.00 0.00 0.45 0.86 0.42 0.32 0.00 0.00 0.00 0.00
rata-rata 0.37 0.00 5.06 6.40 0.00 0.00 0.59 0.92 0.31 0.21 0.00 0.00 0.00 0.00Total/Average 0.00 0.00
NON-KLK This Last This Last This Last This Last This Last This Last This Last This LastESTATES Month Month Month Month Month Month Month Month Month Month Month Month Month Month Month Month
Total/Average 0.00 0.00
This Last This Last This Last This Last This Last This Last This Last This LastOUTSIDERS Month Month Month Month Month Month Month Month Month Month Month Month Month Month Month Month
Total/Average 0.00 0.00
1.1.4. % FFB ON FLOOR AND IN LOADING RAMP FOR GRADING
FFB INTAKE (MT) % %
Comments :
PAGE 4
No. of Grading % Black % Underripe % Long Stalk % Empty Bunch% Rotten % Pest Damaged% Overnight
WEIGHT (MT)LOADING RAMP
WEIGHT (MT)FFB GRADING
- Semua kebun mengirim buah black dengan rata-rata 0,37%
- Longstalk mengalami peningkatan 0,1%
- Underripe mengalami penurunan rata-rata 1,34%- Rotten mengalami penurunan rata-rata 0,33%
% Empty Bunch
No. of Grading % Black % Underripe
No. of Grading
% Rotten
% Overnight
% Empty Bunch
% Black % Underripe % Rotten % Long Stalk % Pest Damaged
% Overnight % Long Stalk % Pest Damaged
1.1.5. LOOSE FRUIT & TRASH CONTENT
This Last This Last This Last This LastNO ESTATES Month Month Month Month Month Month Month Month
123456789
101112
Average 0 0
NO Outsider Estate123456789
101112131415
Average 0 0
1.1.6. LOOSE FRUITS TO FFB RATIO
NO ESTATES1 KMA SELATAN2 KMA TENGGAH345678
AverageNO Outsider Estate
PAGE 4.1
No. of Grading % Loose Trash Content in Trash Content in
This Month Last MonthTotal Tonnage
This Month Last Month
Fruit in Load Loose Fruit (%) FFB %
% to FFB
- - - 2.35 10.85 0.004 0.11 -
0.11 2.35 10.85 0.004

12345678
Average
1.1.7. STONES & TRASH IN FFB
NO ESTATES12345678
Comments :
- -
TrashTonnage (mt) % to FFBStones (kgs) per 100 tn FFB
- KMA Selatan mengirim loose fruit sebanyak 2,350 mt atau sebesar 0,004% /FFB ratio

PAGE 5
1.2. PRODUCTION QUALITY
1.2.1. PRODUCTION OIL / DESPATCH OIL
X S.D. X S.D. X S.D. X S.D.
FFA %
Moisture (VM) %
Dirt %
Peroxide Value %
DOBI
ANALYSIS RESULT BY (KDC/TQCC)
TaikoSAMPLE Average StandardFFA 3.0 MaxVM 0.13 MaxDIRT 0.03 MaxPEROXIDE VALUE 0.60 MaxIODINE VALUE 50 - 54DOBI VALUE 3.0 MinCAROTENE 600 MinE233 (1% CORR.) 1.20 MaxE269 (1% CORR.) 0.20 MaxIRON 5.0 - 3.0PHOSPHORUS 8.0 - 5.0D.F. (Delta Y) 20.0 MinQUALITY RATING NIL
Comments :
Marketing
< 5.0
Specification
3.60 0.37 3.80 0.47 4.75 0.09
0.12 0.01
0.002
DESPATCH PRODUCTIONThis Month Last Month This Month Last Month
0.001
4.12 0.52
0.01
0.000
< 0.25
> 2.31
1st Week 2nd Week 3rd Week
0.19
0.016
2.54
0.04
0.07
0.018
0.20
4th Week
0.020
0.04 0.23
- FFA produksi mengalami penurunan sebesar 0,2%
0.000 0.020
0.04 2.63 0.022.48 0.022.59
- Moisture produksi mengalami penurunan sebesar 0,01- Dirt mengalami penurunan sebesar 0,002%- Nilai Dobi produksi sebesar 2,54
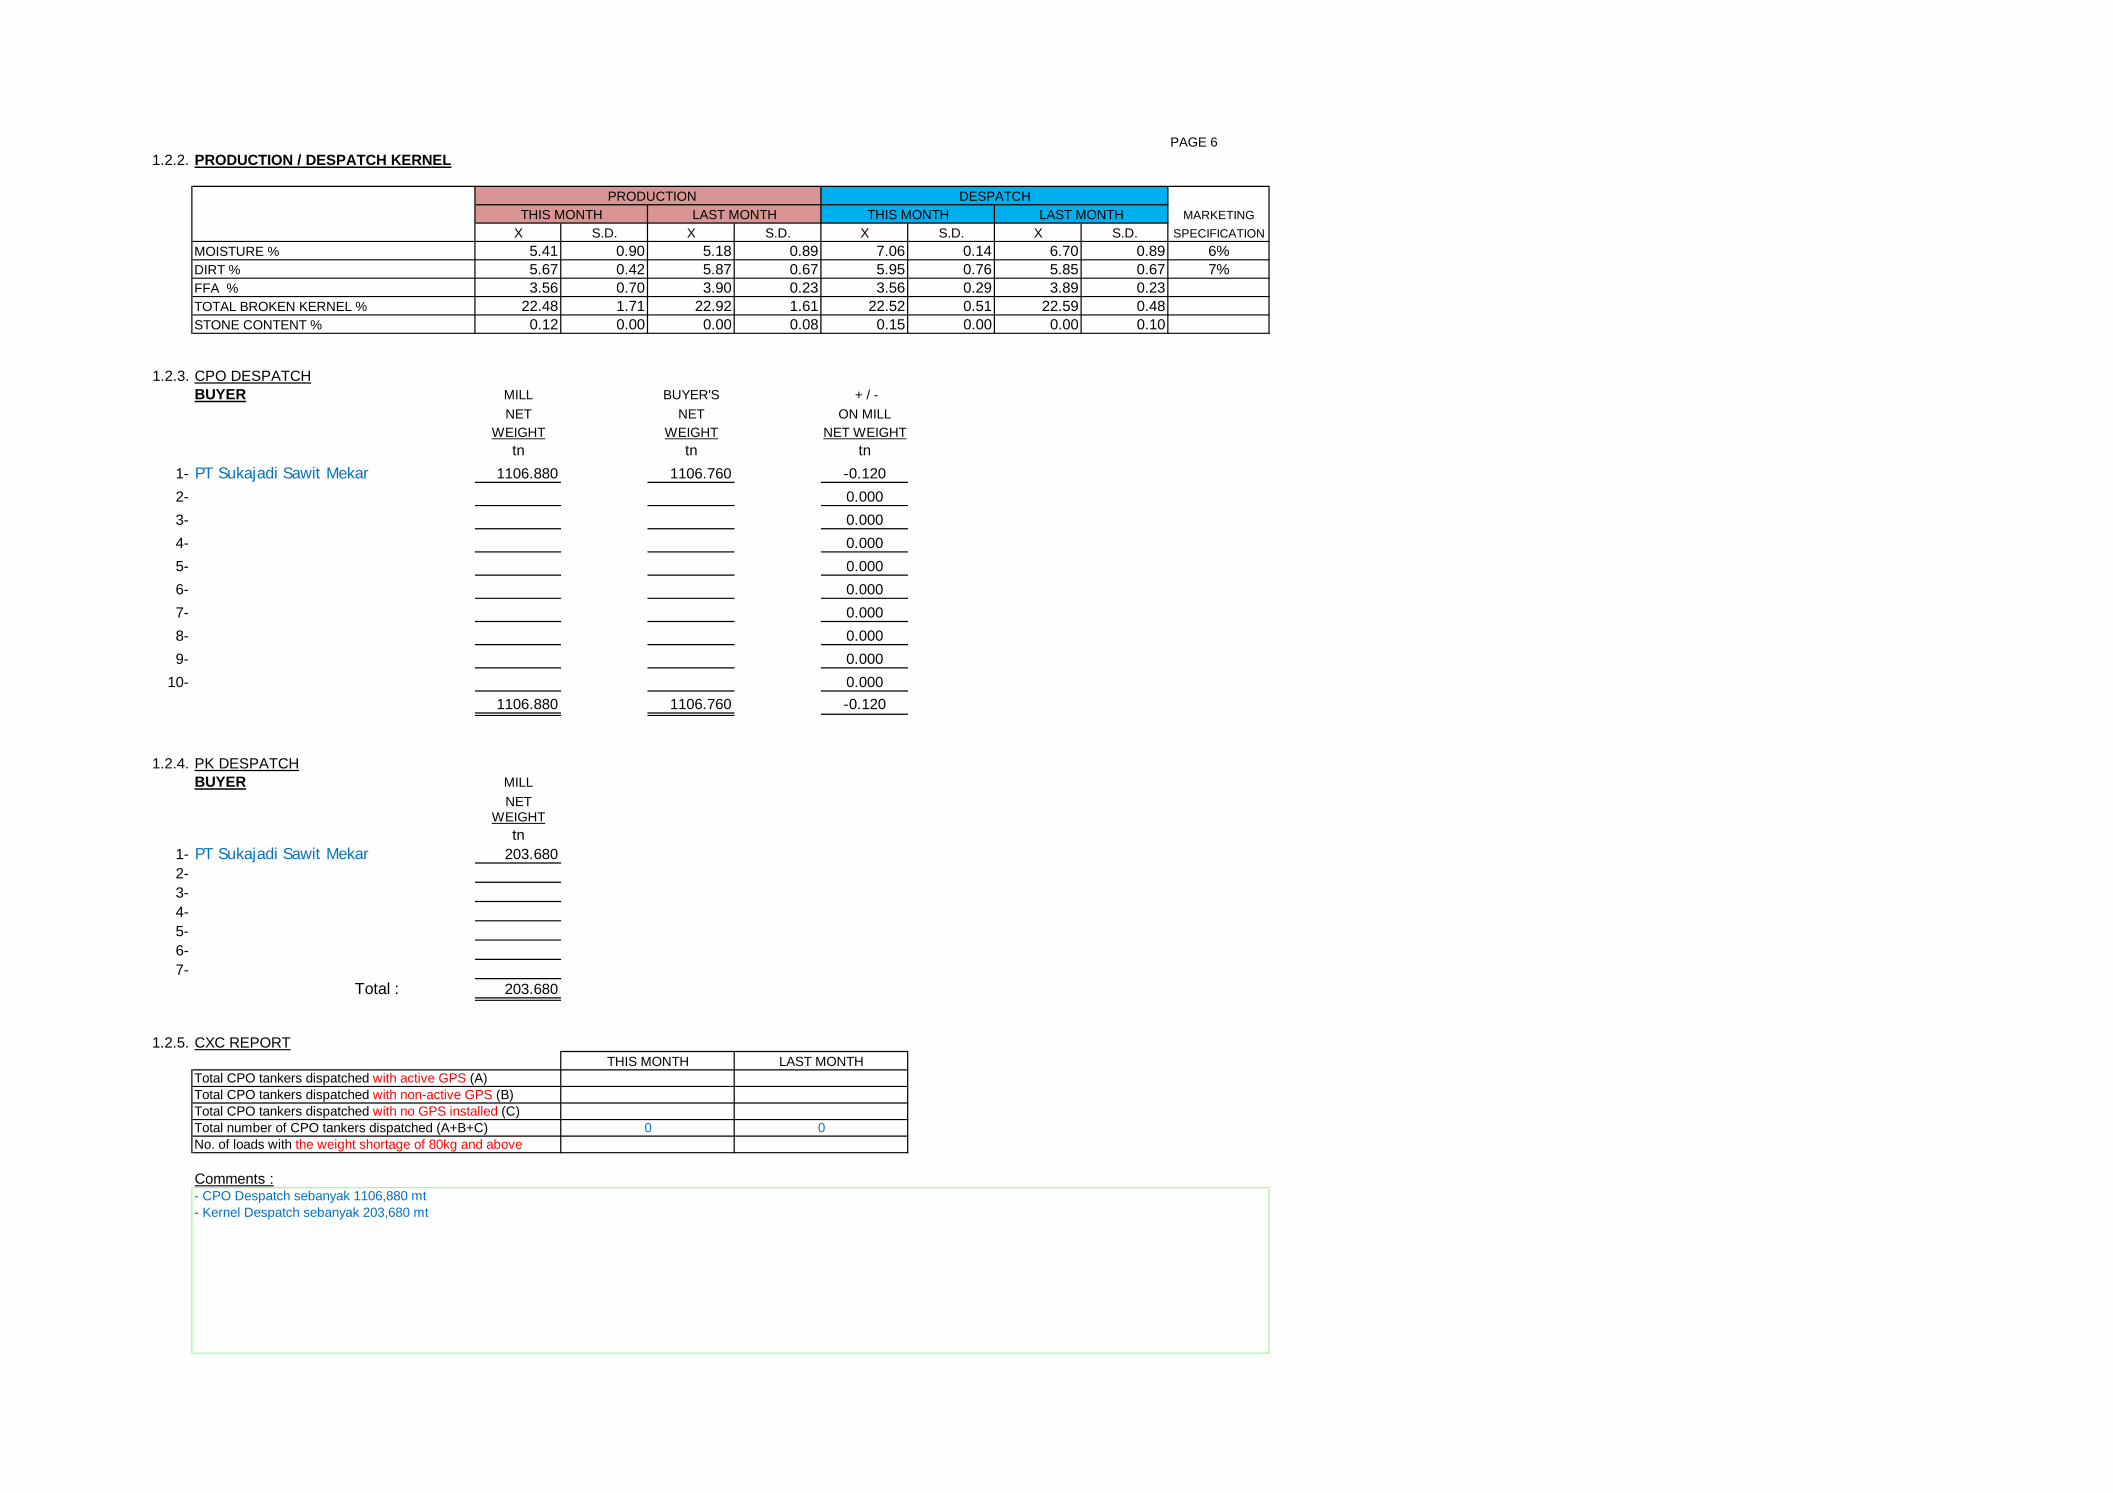
PAGE 61.2.2. PRODUCTION / DESPATCH KERNEL
MARKETINGX S.D. X S.D. X S.D. X S.D. SPECIFICATION
5.41 0.90 5.18 0.89 7.06 0.14 6.70 0.89 6%5.67 0.42 5.87 0.67 5.95 0.76 5.85 0.67 7%3.56 0.70 3.90 0.23 3.56 0.29 3.89 0.23
22.48 1.71 22.92 1.61 22.52 0.51 22.59 0.480.12 0.00 0.00 0.08 0.15 0.00 0.00 0.10
1.2.3. CPO DESPATCHBUYER MILL BUYER'S + / -
NET NET ON MILLWEIGHT WEIGHT NET WEIGHT
tn tn tn1- 1106.880 1106.760 -0.1202- 0.0003- 0.0004- 0.0005- 0.0006- 0.0007- 0.0008- 0.0009- 0.000
10- 0.000 1106.880 1106.760 -0.120
1.2.4. PK DESPATCHBUYER MILL
NETWEIGHT
tn1- 203.6802- 3- 4-5-6-7-
Total : 203.680
1.2.5. CXC REPORT
Comments :
Total CPO tankers dispatched with no GPS installed (C)00
- CPO Despatch sebanyak 1106,880 mt
No. of loads with the weight shortage of 80kg and aboveTotal number of CPO tankers dispatched (A+B+C)
Total CPO tankers dispatched with non-active GPS (B)
MOISTURE %
THIS MONTH
THIS MONTH LAST MONTH
- Kernel Despatch sebanyak 203,680 mt
Total CPO tankers dispatched with active GPS (A)
PRODUCTIONLAST MONTH
DESPATCHTHIS MONTH LAST MONTH
DIRT %FFA %TOTAL BROKEN KERNEL %STONE CONTENT %
PT Sukajadi Sawit Mekar
PT Sukajadi Sawit Mekar

PAGE 6.1
LOADS FROM MONTH: Desember 2015
Ticket No Driver Vehicle Date Mill Buyer Loss (A) Buyer
Total 0.000 0.000 0.000* Chargeable to transporters when (A) - (B) is above 80kg. Quantity chargeable is net after minus the limit of 80kg.
Comments
Weight Details (MT) Tanker with GPS
Charges to the
transporters (MT) *
EXTRACTED FROM CXC REPORTCPO Despatch Loads With Weight Shortage of 80kg and Above
Actual oil recovered (MT) at Mill
(B)

PAGE 6.2
No. Tanker number Date Time Action Taken / RemarksNett Weight diff. with buyers (+/-) (MT)
Total 0.000
GPS VIOLATION REPORT FOR PT KARYA MAKMUR ABADI ON Desember 2015On Exit the Zone Grid of Authorized Route during CPO delivery to Buyers Only
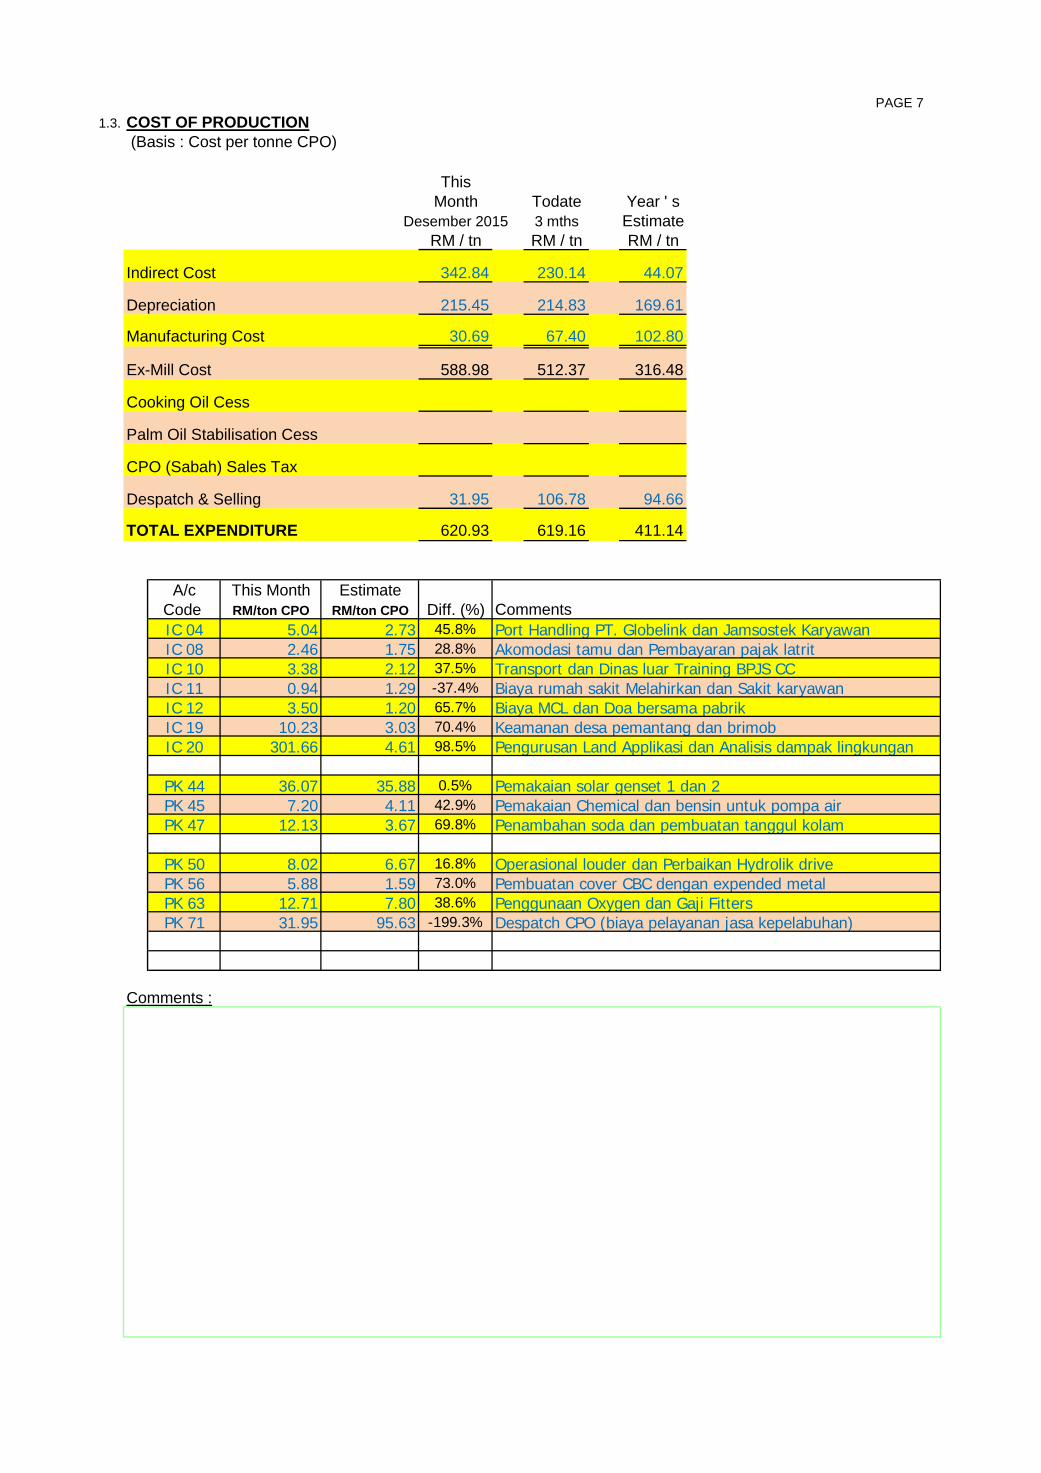
PAGE 71.3. COST OF PRODUCTION
(Basis : Cost per tonne CPO)
ThisMonth Todate Year ' s
Desember 2015 3 mths EstimateRM / tn RM / tn RM / tn
Indirect Cost 342.84 230.14 44.07
Depreciation 215.45 214.83 169.61
Manufacturing Cost 30.69 67.40 102.80
Ex-Mill Cost 588.98 512.37 316.48
Cooking Oil Cess
Palm Oil Stabilisation Cess
CPO (Sabah) Sales Tax
Despatch & Selling 31.95 106.78 94.66
TOTAL EXPENDITURE 620.93 619.16 411.14
A/c This Month Estimate
Code RM/ton CPO RM/ton CPO Diff. (%)IC 04 5.04 2.73 45.8%IC 08 2.46 1.75 28.8%IC 10 3.38 2.12 37.5%IC 11 0.94 1.29 -37.4%IC 12 3.50 1.20 65.7%IC 19 10.23 3.03 70.4%IC 20 301.66 4.61 98.5%
PK 44 36.07 35.88 0.5%PK 45 7.20 4.11 42.9%PK 47 12.13 3.67 69.8%
PK 50 8.02 6.67 16.8%PK 56 5.88 1.59 73.0%PK 63 12.71 7.80 38.6%PK 71 31.95 95.63 -199.3%
Comments :
Pemakaian solar genset 1 dan 2
Penggunaan Oxygen dan Gaji Fitters
Comments
Despatch CPO (biaya pelayanan jasa kepelabuhan)
Port Handling PT. Globelink dan Jamsostek KaryawanAkomodasi tamu dan Pembayaran pajak latritTransport dan Dinas luar Training BPJS CCBiaya rumah sakit Melahirkan dan Sakit karyawanBiaya MCL dan Doa bersama pabrikKeamanan desa pemantang dan brimobPengurusan Land Applikasi dan Analisis dampak lingkungan
Operasional louder dan Perbaikan Hydrolik drive
Pemakaian Chemical dan bensin untuk pompa airPenambahan soda dan pembuatan tanggul kolam
Pembuatan cover CBC dengan expended metal

PAGE 82 PROCESS PERFORMANCE
2.1. STERILIZATION
Summary of sterilisation cycle for the month is tabulated as follows :-
Function X (min) S.D.Deaeration 2 01st. Peak (1,3 Bar / 18,85 psi) 15 01st. Peak exhaust 3 02nd. Peak (2 Bar / 29 psi) 10 02nd. Peak exhaust 3 03rd. Peak (2,5 Bar / 36,25 psi) 10 03rd. Peak exhaust - -4th. Peak (0 Bar / 0 psi) - -Holding Time 35 0Final exhaust 8 0Steaming cycle 86 0Door Open to Door Shut Time 125 0
X S.D. X S.D.USB after 1st Threshing (%) 0.38 0.15 0.53 0.22USB after 2nd Threshing (%) 0.06 0.07 0.17 0.14Threshing Efficiency (%) 88.62 14.69 71.91 21.06
STERILIZER CONDENSATE
This Month Last MonthX S.D. X S.D.
4.89 0.76 4.97 0.75
Condensate / FFB Ratio
Absolute oil loss (kg/tn FFB)
Comments :
Last MonthThis Month
Steriliser condensate (Oil Content in Wet Basis)
- Oil Content WB condensate sebesar 4,89% (condensate digunakan sebagai dilution)- USB final sebesar 0,06%
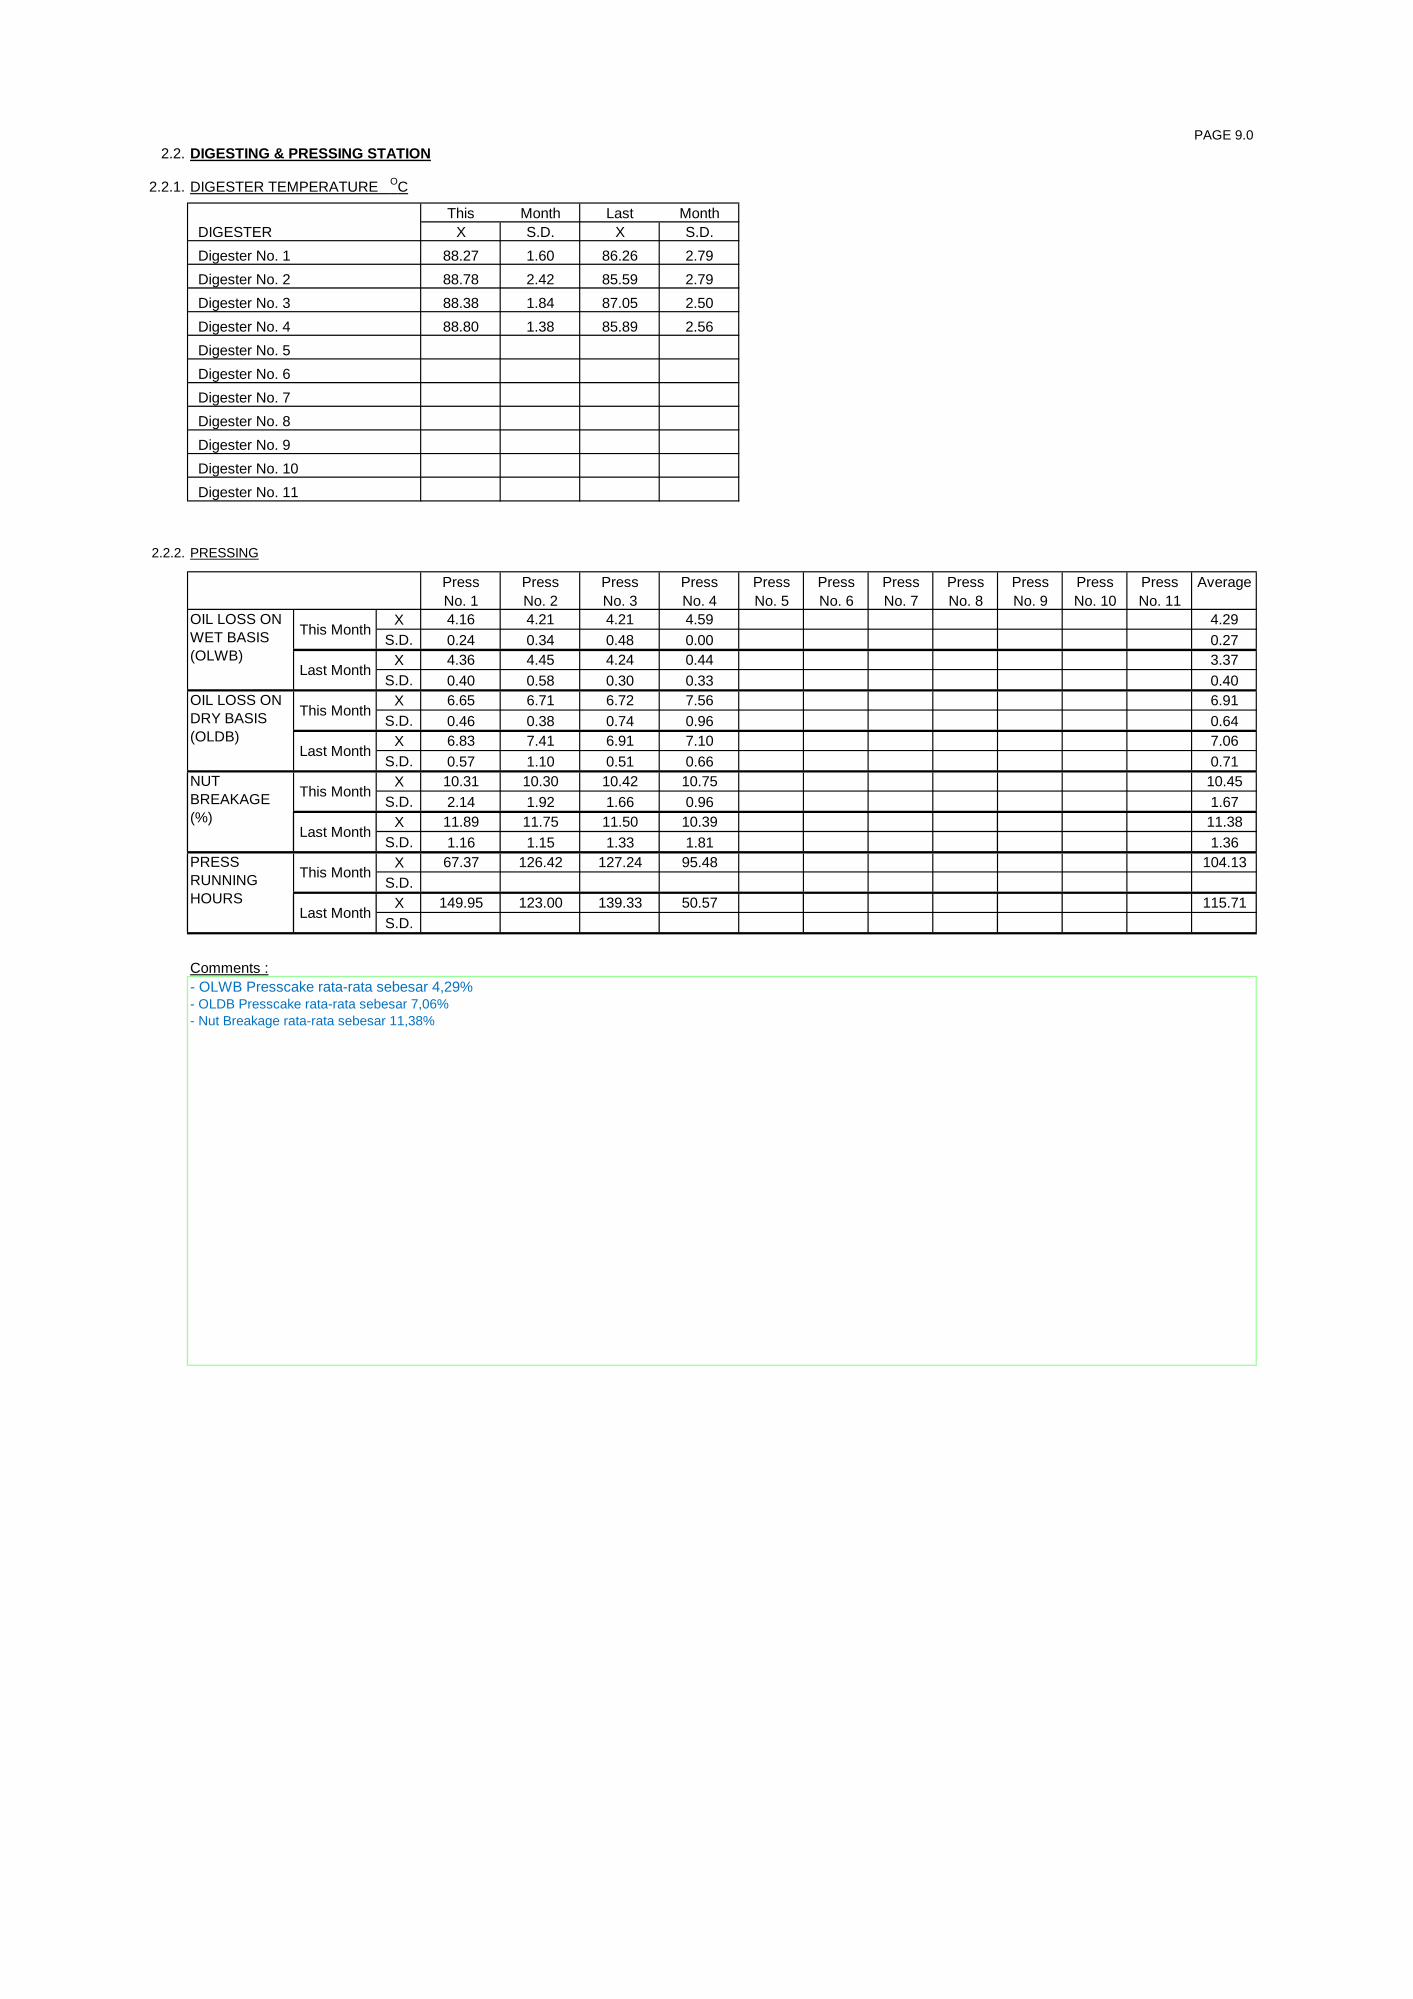
PAGE 9.02.2. DIGESTING & PRESSING STATION
2.2.1. DIGESTER TEMPERATURE OC
This Month Last Month DIGESTER X S.D. X S.D. Digester No. 1 88.27 1.60 86.26 2.79 Digester No. 2 88.78 2.42 85.59 2.79 Digester No. 3 88.38 1.84 87.05 2.50 Digester No. 4 88.80 1.38 85.89 2.56 Digester No. 5 Digester No. 6 Digester No. 7 Digester No. 8 Digester No. 9 Digester No. 10 Digester No. 11
2.2.2. PRESSING
Press Press Press Press Press Press Press Press Press Press Press AverageNo. 1 No. 2 No. 3 No. 4 No. 5 No. 6 No. 7 No. 8 No. 9 No. 10 No. 11
X 4.16 4.21 4.21 4.59 4.29S.D. 0.24 0.34 0.48 0.00 0.27
X 4.36 4.45 4.24 0.44 3.37S.D. 0.40 0.58 0.30 0.33 0.40
X 6.65 6.71 6.72 7.56 6.91S.D. 0.46 0.38 0.74 0.96 0.64
X 6.83 7.41 6.91 7.10 7.06S.D. 0.57 1.10 0.51 0.66 0.71
X 10.31 10.30 10.42 10.75 10.45S.D. 2.14 1.92 1.66 0.96 1.67
X 11.89 11.75 11.50 10.39 11.38S.D. 1.16 1.15 1.33 1.81 1.36
X 67.37 126.42 127.24 95.48 104.13S.D.
X 149.95 123.00 139.33 50.57 115.71S.D.
Comments :
This Month
Last Month
This Month
Last Month
OIL LOSS ON WET BASIS (OLWB)
- Nut Breakage rata-rata sebesar 11,38%
OIL LOSS ON DRY BASIS (OLDB)
NUT BREAKAGE (%)
PRESS RUNNING HOURS
This Month
Last Month
This Month
Last Month
- OLWB Presscake rata-rata sebesar 4,29%- OLDB Presscake rata-rata sebesar 7,06%

PAGE 9.12.2.3.
This Month
Last Month
This Month
Last Month
This Month
Last Month
This Month
Last Month
This Month
Last Month
This Month
Last Month
This Month
Last Month
This Month
Last Month
XS.D.N
True Nut TrashTrue Mesocarp (ripe)
True Mesocarp (unripe)
Oil in Mesocarp OLWB Normal Parthenocarp
Abnormal Partnenocarp
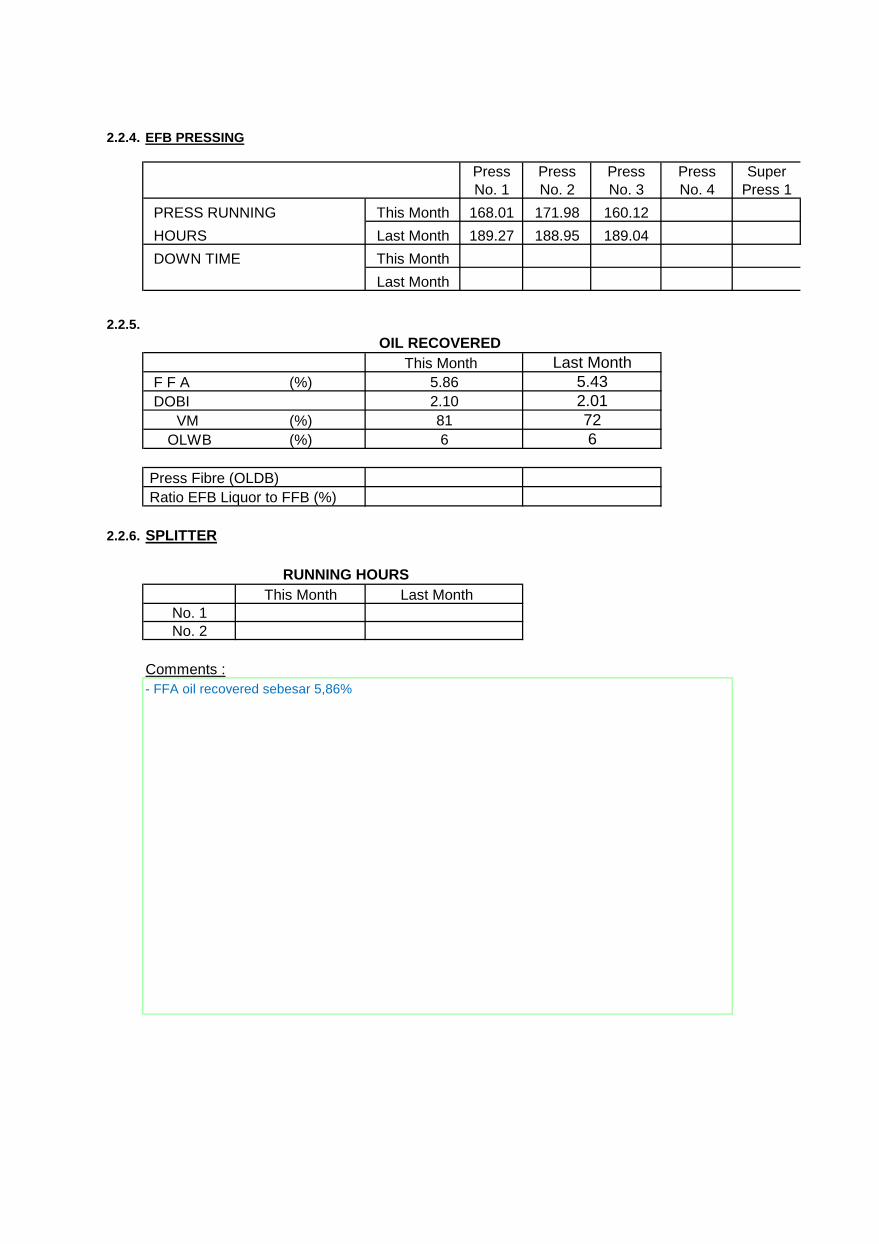
2.2.4. EFB PRESSING
Press Press Press Press SuperNo. 1 No. 2 No. 3 No. 4 Press 1
PRESS RUNNING This Month 168.01 171.98 160.12 HOURS Last Month 189.27 188.95 189.04 DOWN TIME This Month
Last Month
2.2.5. OIL RECOVERED
This Month F F A (%) DOBI
VM (%)OLWB (%)
Press Fibre (OLDB) Ratio EFB Liquor to FFB (%)
2.2.6. SPLITTER
RUNNING HOURSThis Month Last Month
No. 1 No. 2
Comments :
5.862.1081
- FFA oil recovered sebesar 5,86%
6
Last Month5.432.01726

PAGE 10
2.3. CLARIFICATION STATION
2.3.1. CLARIFICATION TANK
Tank 1 Tank 2 Tank 3 Tank 4 Tank 1 Tank 2 Tank 3 Tank 4X 91.50 91.25 92.00 92.21
S.D 1.20 1.23 1.26 1.24 % Oil in underflow X 6.98 6.70 6.59 6.42 (% OLWB) S.D 0.35 1.78 0.54 1.42
2.3.2. SLUDGE SEPARATOR (S) / CENTRIFUGE (C)
S1 S2 S3 S4 C1 C2 C3 C4 C5 C6 C7 C8X 0.97 0.98 0.94 0.92 0.95
S.D 0.08 0.06 0.07 0.05 0.07X 0.91 0.92 0.91 0.93 0.92
S.D. 0.08 0.08 0.07 0.05 0.07T Mth X 152.43 140.36 119.53 136.79 137.28L Mth X 120.55 137.18 129.12 105.74 123.15T Mth X 1.90 1.90 1.90 1.90 1.90L Mth X 1.90 1.90 1.90 1.90 1.90T Mth XL Mth XT Mth XL Mth X
Comments :
% Oil loss on wet basis (x)
Operating Hours (hrs)
Nozzle size (mm)
This Month Last Month
Temperature OC
This MonthLast
Month
Separate Waste Basculator (mt)
Oil losses on Absolute Terms (Kg/tn FFB)
- OLWB underlow CST 1 = 6,98% ; CST 2 = 6,70% - OLWB Separator rata-rata 0,95%
PAGE 11
2.3.2. DECANTER (D)
Inlet
D1 D2 D1 D2 D1 D2X
S.DX
S.D.X
S.DX
S.D.X
S.DX
S.D.T Mth XL Mth X
Comments :
This MonthLast
Month
Light Phase
Oil % (x) Last Month
Solid Phase
VM % (x)
Last MonthTemperature (oC)
Operating Hours
NOS % (x)
Heavy Phase
This MonthLast
Month
This Month
This Month

PAGE 12
2.3.3. DILUTION RATE & ABSOLUTE OIL LOSS
X S.D. X S.DDILUTION RATE % 33.21 1.94 31.26 5.96Separator Waste to FFB ratio 62.00 0.56 52.00 0.70Decanter cake to FFB ratioAbsolute Oil loss in Separator/Centrifuge kg/mt FFB 5.70 0.61 4.78 0.20Absolute Oil loss in Decanter Cake kg/mt FFBTotal Oil loss kg/MT FFB 5.70 0.61 4.78 0.20
2.3.4. OIL LOSSES AFTER DEOILING TANK TO EFFLUENT
DescriptionAfter Deoiling tank (OLWB)After Cooling pond
Comments :
- Oil losses after deoiling tank OLWB 0,80
0.80 0.88
This Month Last Month
This Month Last Month
- Separator waste to FFB ratio 62%

PAGE 13
2.3.5. PURIFIER & VACUUM DRYER
No: 1 No: 2 No: 1 No: 2 No: 3 No: 4 No: 5X 0.70 0.53 0.51
S.D 0.08 0.06 0.06X 0.79 0.56 0.56
S.D. 0.08 0.10 0.06X 0.03 0.01 0.01
S.D 0.01 0.01 0.02X 0.06 0.01 0.02
S.D. 0.10 0.01 0.01X 58.27
S.D 10.31X 59.59
S.D. 7.94X 98.99
S.D 0.96X 99.12
S.D. 0.14
2.3.6. VACUUM DRYER
X S.D X S.D X S.DThis Month 69.41 2.62 0.46 0.06 0.16 0.06 58.27Last Month 69.35 2.33 0.50 0.07 0.14 0.01 64.18This MonthLast MonthThis MonthLast Month
Comments :
No: 1
VACUUM DRYER Vacuum (-cm Hg) VM % After DryerVM % Before Dryer VM. Removal
Eff.
No: 2
No: 3
- VM after vacuum dryer sebesar 0,16 %
VM Rem. Eff
This MonthLast
Month
Dirt Rem. Eff
This MonthLast
Month
% Dirt
This MonthLast
Month
PURIFIER After PurifierBefore Purifier
% VM
This MonthLast
Month

2.4. NUT & KERNEL STATION PAGE 13.1
2.4.1. NUT SILO & KERNEL SILOS
DESCRIPTION No: 1 No: 2 No: 3 No: 4X
S.DX
S.D.X
S.DX
S.D.X
S.DX
S.D.
2.4.2. KERNEL SILO
1 2 3 4 5 1 2 3 4 5Top - - - - -
Middle 65.25 60.55 58.96 - - - - -Bottom 75.52 73.83 74.95 80.30 81.58 82.14
% VM Fresh Kernel X 22.15 22.01 21.30 21.89 22.16 21.81S.D 1.00 0.98 1.00 0.95 0.91 1.37X 5.41 5.74 5.59 5.92 5.97 5.94
S.D 0.65 1.06 0.43 0.48 0.93 0.52% Drying Efficiency 75.52 73.83 74.95 rata-rata 74.77 72.91 72.96 72.46 rata-rata 72.78
Comments :
% VM Fresh Nut
This MonthLast
Month
% Dried Nut
This MonthLast
Month
% Dried Kernel
Temperature oC
This MonthLast
Month
- Drying efficiency rata-rata 74,77%
This Month Last Month
% Drying Efficiency

2.4.3. NUT CRACKING EFFICIENCY PAGE 13.2
X SD X SD X SD X SD X SD X SD X SD X SD X SD X SD X SDWhole Nut (%)Broken Nut (%)Whole Kernel (%)Brokern Kernel (%)
X SD X SD X SD X SD X SD X SD X SD X SD X SD X SD X SDWhole Kernel (%) 6.85 2.15 6.42 2.62 6.06 2.84 6.71 2.53Broken Kernel (%) 19.39 5.77 16.06 7.19 18.87 5.32 15.31 6.33Uncracked Nut (%) 0.73 0.27 0.52 0.29 0.46 0.18 0.53 0.32Half cracked Nut (%) 1.17 0.49 1.45 0.48 1.97 0.55 1.42 0.45
X SD X SDRipple Mill No: 1 97.50 0.41Ripple Mill No: 2 98.04 0.41Ripple Mill No: 3 97.57 0.42Ripple Mill No: 4 98.06 0.38Ripple Mill No: 5Ripple Mill No: 6Ripple Mill No: 7Ripple Mill No: 8Ripple Mill No: 9Ripple Mill No: 10 Rata-rataRipple Mill No: 11 97.79 0.41
Comments :
Nut Composition before Cracker (INPUT)
No: 4 No: 5 No: 6 No: 7R I P P L E M I L L
R I P P L E M I L L
No: 1 No: 2 No: 3 No: 8 No: 9 No: 11No: 10
Nut Cracking Eff.
Kernel Recovery Eff.
- Nut Cracking efficiency rata-rata sebesar 97,79%
No: 6 No: 7 No: 10 No: 11No: 8 No: 9No: 2 No: 3 No: 4 No: 5Mixture Composition after Cracker
No: 1

PAGE 142.4.4. KERNEL LOSSES / COST
X SD X SD X SD X SD X SD X SD
1.29 0.47 1.63 0.33 ave 1.46 1.04 0.05 1.89 0.25
1st Stage
2nd Stage
1st Stage
2nd Stage
1st Stage
2nd Stage
1st Stage
2nd Stage
1st Stage
2nd Stage
1st Stage
2nd Stage
0.91 0.02 0.99 0.06 ave 0.950 0.93 0.02 0.96 0.02
2.22 1.38 1.29 0.75
Claybath 1.14 0.31 1.02 0.11
2.4.5. RUNNING COST
Comments :
14.25 15.49 14.56
Line 2 Line 3
Cost / MT of PK (RM)
Cyclone Fibre
LTDSHydrocyclone (PK in wet shell)
8607.26
This MonthLine 3Line 1
2923.47
This Month Last Month Todate
205.501 591.145
3183.88
Last MonthLine 1 Line 2
Kernel Produced (mt)Total Kaolin or Calcium Carbonate Cost (RM)Other Cost e.g Sodium Silicate (RM)
205.154
Cost / MT of FFB (RM)
- Losses claybath 1,14%
0.32 0.33 0.52
- Cost Calcium carbonate sebesar 32 sen ringgit- Losses LTDS rata-rata 0,95 %

PAGE 152.5. BOILER / POWER HOUSE
2.5.1. BOILER HOUSE
Description This Month Last Month TodateBoiler Chemical Cost (Rupiah) Rp5,083,010 Rp4,990,187 Rp14,434,622 Cost / MT FFB (Rupiah) Rp550 Rp511 Rp1,551
2.5.2. POWER HOUSE
DescriptionThis Month Last Month This Month Last Month This Month Last Month This Month Last Month This Month Last Month
Turbines > ElliotNo. 1 (1700 KW) 203.2 215.3 185728.1 204890.4 914.0 951.7No. 2 (0 KW)No. 3 (0 KW)No. 4 (0 KW)Diesel Gen Set > CumminsNo. 1 (280 KW) 390.1 358.3 35531.1 39181.6 12621.0 13962.0 91.1 109.4 2.82 2.81No. 2 (650 KW) 163.9 156.7 20865.4 23042.3 6510.0 7440.0 127.3 147.0 3.21 3.10No. 3 (0 KW)KwHr / mt FFB (Turbine + Genset)
2.5.3. TNB POWER SUPPLY
KwHr Rp KwHr Rp KwHr RpPalm Oil MillRubber FactoryEcomat PlantTotal 0.00 0.00 0.00 0.00 0.00 0.00
Comments :
Last Month Todate
Operating Hours Total KwH Generated Kw KwHr / LitDiesel Consumption (Litres)
- Cost chemical boiler / mt FFB sebesar 550 rupiah
This Month
Steam Consumption per KwHr (Turbine)26.2
PAGE 16
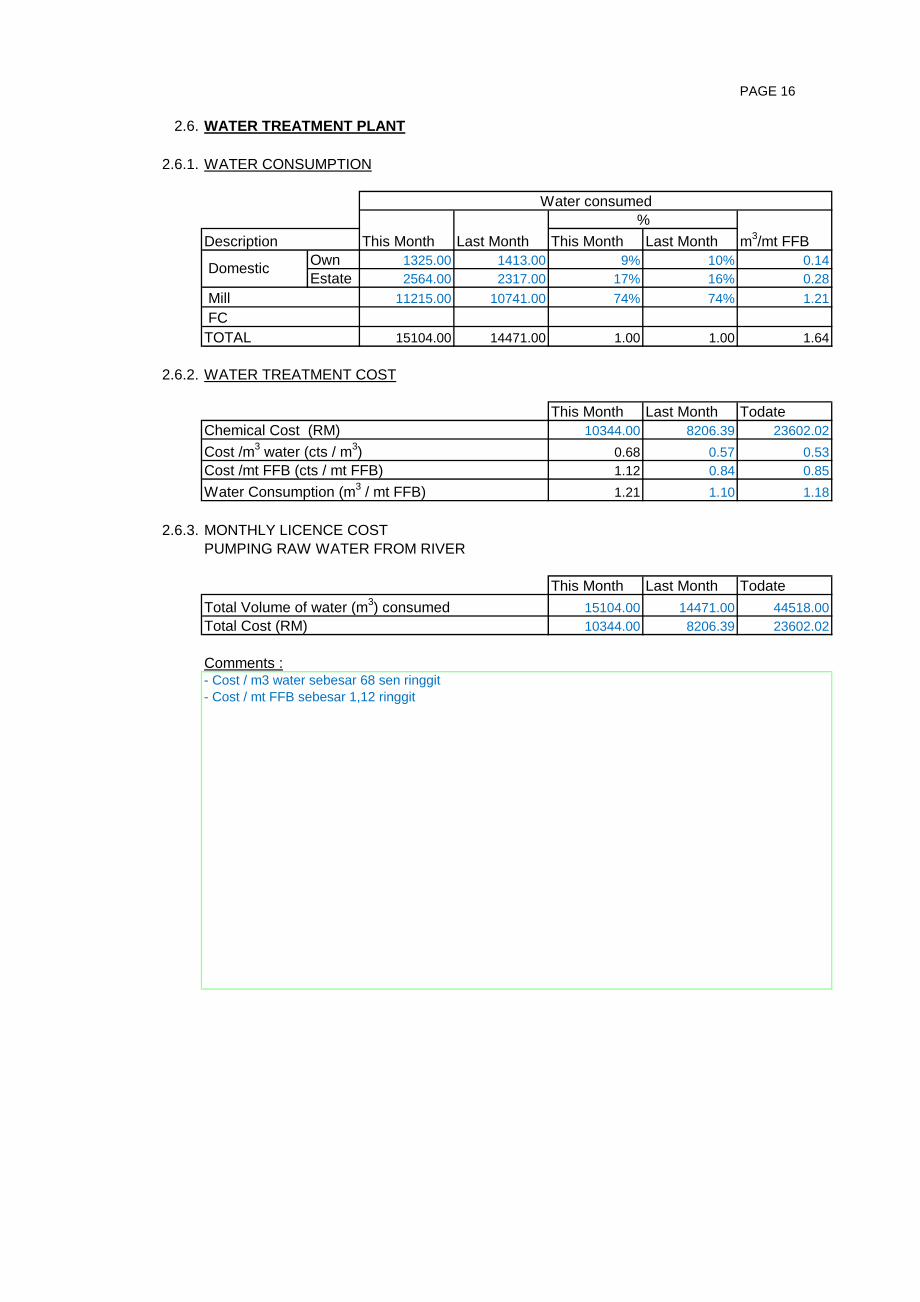
2.6. WATER TREATMENT PLANT
2.6.1. WATER CONSUMPTION
Description This Month Last Month This Month Last Month m3/mt FFBOwn 1325.00 1413.00 9% 10% 0.14Estate 2564.00 2317.00 17% 16% 0.28
Mill 11215.00 10741.00 74% 74% 1.21 FCTOTAL 15104.00 14471.00 1.00 1.00 1.64
2.6.2. WATER TREATMENT COST
This Month Last Month TodateChemical Cost (RM) 10344.00 8206.39 23602.02Cost /m3 water (cts / m3) 0.68 0.57 0.53Cost /mt FFB (cts / mt FFB) 1.12 0.84 0.85Water Consumption (m3 / mt FFB) 1.21 1.10 1.18
2.6.3. MONTHLY LICENCE COSTPUMPING RAW WATER FROM RIVER
This Month Last Month TodateTotal Volume of water (m3) consumed 15104.00 14471.00 44518.00Total Cost (RM) 10344.00 8206.39 23602.02
Comments :
Domestic
Water consumed%
- Cost / m3 water sebesar 68 sen ringgit- Cost / mt FFB sebesar 1,12 ringgit

PAGE 17
2.7. General (Visitors / Security / Training Programme / Details of Breakdown, etc)
2.7.1. Visitation
Date15-12-2015 Mr pang pik kuang Kunjungan ke pabrik06-12-2015
2.7.2. Training
Date21-12-2015
2.7.3. Security
Date
2.7.4. OSH Matter
Date
2.7.5. RSPO Matter
Date
2.7.6. Amenities
Date
2.7.7. Water Supply
Date
2.7.8. EFB DISPOSAL
2.7.9. DECANTER CAKE DISPOSAL
Training BPJS CC
Remarks
Remarks
Mr supramanram. K Kunjungan ke pabrik
RemarksPerson
Remarks
Remarks
1,692.59 484.62 Balance b/f (mt) Production (mt) Collected (mt) Balance c/f (mt)
976.33 1,200.88
Remarks
Remarks
Balance b/f (mt) Production (mt) Collected (mt) Balance c/f (mt)

PAGE 17.1
2.8.0. Effluent Treatment
Date15-12-2015
2.8.1 Mill Downtime
Date Hours Date Hours
Total 0 0
2.8.2 Housekeeping / Beautification / Linesite / Compound
Date
2.8.3. Others
Date
Comments
Remarks
Remarks
RemarksProses menghidupkan kolam anaerobic no.1
Details DetailsLine 1 Line 2

PAGE 17.2
2.8.4. Effluent Result For Desember 2015
abcdefgh
2.8.5 Trailing Report
TQCC Result
Oil & Grease (mg / l)
Ammonical Nitrogen (mg / l)Total Solids (mg / l)Suspended Solids (mg / l)
COD (mg / l)Total Nitrogen (mg / l)
DOE LimitpHBOD (mg / l)

PAGE 183.0 MANPOWER
3.1. EMPLOYEES
INDO CHINESE INDIANS OTHERS TOTAL Executives 3 1 4 Subordinate Staff 3 3 PBT 0 KHT 50 50 KHL 24 24 TOTAL 80 0 1 0 81
3.2. SUBORDINATE STAFF LEAVE STATUS
Leave Leave Leave B/F from Earned Todate TakenYear '14 for Year '15 (A+B) This Bal
No. Position (Days)-A (Days)-B Total Month (A+B-C)12345678910111213141516171819202122232425262728
Comments :
Leave Taken Todate
(C)NAME

PAGE 18.13.3 EMPLOYEE (MILL WORKERS)
(A) CHECKROLL
(1) INDONESIAN Male Female Sub Total Male Female Sub Total Chinese - - - Indian - - - Others - - - Grand Total - - - - - - -
(2) NON-INDONESIAN Sri Lanka - - - India - - - Indonesia 67 7 74 - 74 Bangladeshi - - - Thai - - - Filipino - - - Grand Total 67 7 74 - - - 74 Total Checkroll 67 7 74 - - - 74
(B) CONTRACT / TEMPORARY
(1) INDONESIAN Male Female Sub Total Male Female Sub Total Chinese - - - Indian - - - Others - - - Grand Total - - - - - - -
Employees Dependants (Resident)Total
Employees Dependants (Resident)Total

PAGE 19Appendix 1
Unit This Month Last Month Todate1.0 FFB
1.1.1 Weight of FFB processed MT 9,237.510 9,762.240 27,897.611 1.1.2 Estimate MT 10,945.000 10,065.000 30,587.000 1.1.3 Shift Hours Hrs -
2.0 OIL MANUFACTURE2.1.1 Weight of Oil Produced MT 2,221.580 2,277.566 6,614.561 2.1.2 Estimate MT 2,682.000 2,466.000 7,495.000
2.1.3 Oil Extraction Rate % 24.05 23.33 23.71 2.1.4 Estimate % 24.50 24.50 24.50
2.1.5 Press Running Hours Hrs. 416.51 462.85 1,299.81 2.1.6 Production Hours Hrs. 161.50 172.25 489.50 2.1.7 Downtime (Line 1) Hrs. - 2.1.8 Downtime (Line 2) Hrs. - 2.1.9 Press Capacity per unit MT / hr 22.18 21.09 21.46 2.2.0 F.F.B. Manufactured / Hours MT / hr 57.20 56.67 56.99 2.2.1 Oil Recovered / Hours MT / hr 13.76 13.22 13.76
3.0 KERNEL MANUFACTURE3.1.1 Weight of kernel Produced MT 205.504 205.501 591.495 3.1.2 Estimate MT 328.000 302.000 918.000
3.1.3 Kernel Extraction Rate % 2.22 2.11 2.12 ;3.1.4 Estimate % 3.00 3.00 3.00
3.1.5 Production Hours Hrs. 161.50 172.25 489.50 3.1.6 Kernel Recovered / Hr MT / hr 1.27 1.19 1.21
4.0 DESPATCH AND STOCK4.1.1 Oil Despatched MT 1,106.760 2,758.140 5,915.950 4.1.2 Oil in Stock MT 2,640.780 1,525.959 6,173.272 4.1.3 Kernels Despatched MT 203.330 166.300 608.540 4.1.4 Kernels in stock MT 168.384 166.560 462.303
- Packed / Bulk Silo MT 168.384 166.560 462.303 - Kernel in Bag MT -
Remarks :
PROGRESS REPORT FOR THE MONTHOF DESEMBER 2015

PAGE 20
MAJOR MAINTENANCE REPORT FOR THE MONTH OF DESEMBER 2015
(1) RECEPTION STATION / (2) LOADING PUMP / (3) STERILISER STATION(4) HOISTING / TIPPER AND THRESHING STATION
(3) Penambahan Platform & Support Inclened FFB Conveyor
PAGE 21
MAJOR MAINTENANCE REPORT FOR THE MONTH OF DESEMBER 2015
(5) PRESS AND DIGESTER STATION / (6) EFB PRESSING STATION / (7) KERNEL PLANT STATION(8) CLARIFICATION STATION
(6) Penggantian Front Press Cage dan High Pressure Screw EFB Press No. 2(7) Penggantian Wire Mesh No. 30 Vibrating Screen No.1

PAGE 22
MAJOR MAINTENANCE REPORT FOR THE MONTH OF DESEMBER 2015
(9) RAW WATER HOUSE AND WATER TREATMENT PLANT STATION / (10) POWER STATION / (11) BOILER STATION(12) EFFLUENT STATION

PAGE 23
MAJOR MAINTENANCE REPORT FOR THE MONTH OF DESEMBER 2015
(13) MILL BUILDING UPKEEP / (14) VEHICLE / (15) WORKSHOP / (16) GENERAL
Related Documents