Psychological Theories of Hyperactivity: A Behaviour Genetic Approach Jonna Pauliina Kuntsi Thesis submitted for the Degree of Doctor of Philosophy September 1998 Institute of Child Health, University College London Medical School

Welcome message from author
This document is posted to help you gain knowledge. Please leave a comment to let me know what you think about it! Share it to your friends and learn new things together.
Transcript
Psychological Theories of Hyperactivity:
A Behaviour Genetic Approach
Jonna Pauliina Kuntsi
Thesis submitted for the Degree of Doctor of Philosophy
September 1998Institute of Child Health, University College London Medical School

To Markus
Abstract
This study was an attempt to combine two research literatures on hyperactivity: the
behaviour genetic research and the studies testing psychological theories of
hyperactivity. We obtained behavioural ratings from the teachers of 1316 twin
pairs, aged 7-12, from the general population. For a subsample of 268 twin pairs
we obtained ratings also from their parents. Forty-six hyperactive twin pairs (pairs
in which at least one twin was pervasively hyperactive) and 47 control twin pairs
were then assessed on tests relating to three theories of hyperactivity, those of
response inhibition deficit, working memory impairment and delay aversion.
Confirming previous findings, genetic factors accounted for 50-70% of the
variance in hyperactivity when considered as a continuous dimension. There was
also significant evidence of genetic effects on extreme hyperactivity, although the
present group heritability estimates were somewhat lower than previous estimates.
The hyperactive group performed worse than the control group on the delay
aversion measure and some of the working memory tasks. Controlling for IQ
removed the significant group differences on the working memory measures,
however. Although there were no significant group differences on the inhibition
variables, the inhibition measure, stop task, produced evidence of a pattern of
responding that was strongly characteristic of hyperactivity: hyperactive children
were variable in their speed, generally slow and inaccurate. This pattern of
responding may indicate a non-optimal effort/activation state.
To investigate the possibility that the cognitive impairments or task engagement
factors associated with hyperactivity mediate the genetic effects on the condition,
bivariate group heritability analyses were carried out. There was significant
evidence of shared genetic effects only on extreme hyperactivity and the variability
of speed. The findings are interpreted as supporting the state regulation theory of
hyperactivity. Although delay aversion is a characteristic of hyperactivity, it seems
to have an environmental rather than a genetic origin.
3

Acknowledgements
Many thanks to
All the children, parents and teachers who took part in this study. Your helpfulnessand enthusiasm about the research inspired us and made the study possible.
Professor Jim Stevenson for thoroughly expert supervision, for introducing me tothe field of behaviour genetics and for an excellent training in research methods.Thank you for your patience even when my email queries exceeded the averageseven a day and for replying 'it is your thesis, you decide!' when it was my turn todo the thinking.
Doug Barrett, Emma Canning and Nisha Karia for invaluable help during thescreening and data collection phases of the study. Your dedication, great sense ofhumour and ability to manage each unpredictable situation kept me and the wholeproject going. It was a less lonely road working from within our little team.
Professor David Skuse for encouragement and many thought-provoking theoreticaldiscussions.
Dr Jaap Oosterlaan for help with the stop task.
Colleagues at the Behavioural Sciences Unit for sharing the joys and frustrations ofcarrying out research.
Drs Bettina Hohnen, Thalia Eley and Jane Gilmour for telling me 'what it's allabout'.
The Wellcome Trust for funding the study, for providing training opportunities andfor a refreshingly fair and modern attitude towards PhD-students.
My parents, Leena and Pentti - kiitos tuesta ja kannustuksesta näiden pitkienopiskeluvuosien aikana.
Markus for your love and support and for reminding me that there is more to lifethan work. The title never became 'Child Development: Behaviour ProblemsApproach', but thanks for the suggestion.
4
Table of contents
Abstract
3
Acknowledgements
4
Table of contents
5
List of tables
13
List of figures
16
Chapter 1 Childhood hyperactivity
1.1
Introduction
17
1.2
Cardinal symptoms
18
1.3
Historical perspective
23
1.4
Prevalence
25
1.5
Dimensions or categories?
26
1.6
Developmental progression
28
1.7
Subgroups
31
1.7.1 Pervasive vs situational hyperactivity
311.7.2 Hyperactivity-impulsivityvs inattentiveness
33
1.7.3 Girls with hyperactivity
34
1.8
Co-occurrence of other disorders
36
1.8.1 Hyperactivity and learning disabilities
381.8.2 Hyperactivity and anxiety disorders
41
1.9
Family-environmental factors
43
1.10 Toxic factors and diet
45
1.11 Neurological aspects
47
1.11.1 Neurological damage
471.11.2 Neuroanatomical studies
48
1.11.3 Neurochemical studies
511.11.4 Neurophysiological studies
54
5
1.12 Measurement issues
56
1.13 Chapter summary
59
Chapter 2 Cognitive and task engagement factorsin hyperactivity
2.1 Attention deficit
61
2.1.1 Aspects of attention
612.1.2 A deficit in sustained attention?
62
2.2
Response inhibition
65
2.2.1 Quay's theory
652.2.2 The race model and the stop task paradigm
66
2.2.3 Studies using the stop task
67Meta-analysis of studies
67Criticisms of the meta-analysis
70
Further studies
72Factors influencing stop task perfonnance
74
2.2.4 Response inhibition and brain anatomy
752.2.5 Barkley's theory
76
2.3
Executive functions
78
2.3.1 The frontal metaphor
782.3.2 Working memory
80
2.3.3 Executive functions and ADHD
82Pennington and Ozonoff's review
82
Studies on working memory
86Other studies on executive functions in ADHD
88
2.3.4 Criticisms of research on executive functions
90
2.4 Delay aversion
91
2.4.1 Performance on the MFFT - delay aversion?
912.4.2 An inhibition deficit, maximising rewards or delay
aversion?
932.4.3 Further evidence of delay aversion
96
6
2.5 Theories of state-regulation dysfunction 97
2.5.1 The optimal stimulation theory 982.5.2 The state-regulation theory 98
Van der Meere 's approach 98Effects of rewards on performance on reaction time tasks 100Effects of medication on state mechanisms 101
2.6 Chapter summary
102
Chapter 3 Behaviour genetics
3.1 Quantitative genetics
104
3.1.1 Quantitative genetic theory
1043.1.2 Family and adoption studies
107
3.1.3 Twin studies
109Assumption of representativeness
111
Equal environments assumption
112Zygosity determination
114
3.2
Molecular genetics
115
3.3
Criticisms of behaviour genetics
117
3.4
Behaviour genetic studies on hyperactivity
119
3.4.1 Family studies
1193.4.2 Adoption studies
1213.4.3 Twin studies
123General population samples
123
Sibling interaction or rater bias?
129Extreme hyperactivity
130Summa,y offindings from twin studies
133
3.4.4 Animal models
1343.4.5 Molecular genetic studies
135
Human homolog of the Snap gene?
135The thyroid gene
136Three dopaminergic genes
137
The dopamine D4 receptor gene polymorphism
138
3.5 Chapter summary
140
7
Chapter 4 Co-occurrence of hyperactivity andconduct problems
4.1
Conduct problems
142
4.1.1 Defining features
1424.1.2 Subtypes
1464.1.3 Etiology
147Environmental factors
147Genetic effects
1484.1.4 Cognitive impairments?
150
4.2
Co-occurrence of conduct problems and hyperactivity
152
4.2.1 Prevalence 152
4.2.2 Reasons for the co-occurrence
154
4.3 Chapter summary
156
Chapter 5 Aims of the study
5.1 Integration of the literature
158
5.2 Aims and hypotheses 161
Chapter 6 Design and Methodology
6.1
Analysis of twin data 164
6.1.1 Twin correlations 164
6.1.2 Model fitting 165
6.1.3 Model fitting with twin data 167
The univariate model
167The multivariate model
1696.1.4 Group heritability analyses
170
6.2
Statistical power 172
6.3 Design of the study 173
6.4
Ethical consideration 173
8
6.5 Participants
173
6.5.1 Recruitment of sample
173Contacting LEAs and schools
173
Contacting parents
175Response rates
1766.5.2 Twin characteristics
178
6.5.3 Family demographics
1806.5.4 Zygosity determination
182
6.6 Procedure
183
6.7 Measures
184
6.7.1 Delay aversion task
1846.7.2 Delayed Response Alternation task
185
6.7.3 Stop task
1876.7.4 Sentence Span and Counting Span tasks
189
6.7.5 Wechsler Intelligence Scales for Children
1906.7.6 Revised Conners' Parent and Teacher Rating Scales
190
6.7.7 Interview with parents
1916.7.8. Ratings of behaviour during testing
192
6.8 The reliability studies
192
6.8.1 Reliability study I
1926.8.2 Reliability study II
199
6.8.3 Reliability study III
206
Chapter 7 Results
7.1 Exploration of the data
210
7.1.1 Missing data
2107.1.2 Cases excluded from analyses
210
7.1.3 Parametric vs non-parametric methods
2137.1.4 Should IQ or age be controlled for?
213
7.2 Group comparisons on task variables and rating scale data 216
7.2.1 Delay aversion and working memory tasks
2167.2.2 Stop task
222Time-on-task
228Speed accuracy trade-off
228
7.2.3 Ratings of behaviour during testing
2307.2.4 Sex effects
231
9
7.2.5 Discriminant function analysis
2317.2.6 Ratings on other subscales of the Conners'
233
7.2.7 Birthweight
234
7.3
Correlational analyses
234
7.3.1 Correlations between the task variables
2357.3.2 Task variables and hyperactivity ratings
235
7.3.3 Hyperactivity ratings and observations of behaviour
239
7.4
Introduction to model fitting analyses
240
7.5
Model fitting analyses on rating scale data
243
7.5.1 Hyperactivity ratings
2447.5.2 Other dimensions on Parent Conners'
245
7.5.3 Other dimensions on Teacher Conners'
247
7.6
Model fluing analyses on testing data
248
7.6.1 Delay aversion and working memory measures
2487.6.2 Stop task
2507.6.3 Ratings of behaviour during testing
252
7.6.4 IQ data
2527.6.5 Discriminant function score
254
7.7
Concordance rates
254
7.8
Univariate group heritability analyses 255
7.9
Bivariate group heritability analyses
257
Chapter 8 Discussion
8.1 Introduction to discussion 262
8.2 Summary of main findings 263
8.3 Which theory do the data support?
265
8.3.1 Delay aversion
2668.3.2 Impaired working memory
2688.3.3 Response inhibition deficit
271
8.3.4 Evidence for a different hypothesis?
275
8.4 Heritability of hyperactivity
276
8.4.1 Heritability of individual differences in hyperactivity
2768.4.2 Heritability of extreme hyperactivity
279
10
8.5 Mediators of genetic effects on hyperactivity
281
8.6 Further insight into hyperactivity
284
8.6.1 Association with lower IQ
2848.6.2 Co-occurring conduct problems
286
8.6.3 Cross-informant consistency
2888.6.4 Sex effects
2898.6.5 Co-occurence of other problem behaviours
289
8.7 Further findings 290
8.7.1 Developmental effects
2908.7.2 Heritability of other problem behaviours
292
8.7.3 Heritability of IQ
293
8.8 Limitations and comments
294
8.8.1 Statistical power
2948.8.2 Representativeness of the sample
295
Representativeness of twins
295Representativeness within the geographical location
296
Representativeness of the population of hyperactivechildren 296
Appropriateness of the screening procedure
2988.8.3 Adequacy of measures
299
Reliability
299Measurement of inhibition
299
Inferences about state regulation
300
8.9 Towards a more comprehensive account of hyperactivity
300
8.9.1 Cognitive impairment or a state-regulation deficit
3008.9.2 Delay aversion or a state-regulation deficit
304
8.9.3 A schematic representation of possible links
305
8.10 Challenges for future research
309
8.11 Practical implications
311
References
313
11
Appendices
Appendix A UK norms for the Revised Conners' Teacher Scale
349
A. 1 Introduction
350A.2 Method
353A.2.1 Recruitment of the sample
353
A.2.2 Measures
355A.3 Results
356A.4 Discussion
362
Appendix B Results from Kolmogorov-Smirnov tests
367
Appendix C Model fitting results for testing data: Age-adjustedscores
371
Appendix D Twin Similarity Questionnaire
374
Appendix E Instructions for the delay aversion task
376
Appendix F Instructions for the DRA task
380
Appendix G Instructions for the stop task
386
Appendix H Sentence span and counting span tasks
392
Appendix I Revised Teacher and Parent Conners' Scales
396
Appendix J Interview with parents
399
Appendix K Tester's form
404
Appendix L Stop task inhibition variables
409
12
List of tables
Table 1.2a DSM-IV symptom list for ADHD
19
Table 1.2b
ICD-10 symptom list for hyperkinetic disorder
22
Table 2.3.3 Consistency of differences and average effect sizes ofEF measures in ADHD (taken from Pennington &Ozonoff, 1996)
84
Table 3.4.3a Twin studies of hyperactivity/ADHD: individualdifferences heritability estimates
125
Table 3.4.3b Twin studies of hyperactivity/ADHD: groupheritability estimates
131
Table 4.1. la DSM-IV symptom list for conduct disorder
144
Table 4.1. lb lCD-b symptom list for conduct disorders
145
Table 6.1.2 Fit indices used in present thesis
167
Table 6.5.2 Group characteristics
180
Table 6.5.3 Parents' educational qualifications
181
Table 6.7.3 Temporal stability results for the stop task(Kindlon et a!., 1995)
188
Table 6.8. la Test-retest reliability results for the total sample:paper-and-pencil measures
195
Table 6.8. lb Test-retest reliability results for children with IQsabove 65: paper-and-pencil measures
196
Table 6.8. lc Study 1: Comparison of mean values between twotesters, Emma and Jonna
197
Table 6.8. ld Study 1: Comparisons of mean values between twotesters, Doug and Jonna
198
Table 6.8. be Study 1: Comparisons of mean values between twotesters, Doug and Emma
199
Table 6.8.2a Reliability results for the computer tasks
202
Table 6.8.2b Study 2: Comparisons of mean values between twotesters, Emma and Jonna
203
Table 6.8.2c Study 2: Comparisons of mean values between twotesters, Doug and Jonna
204
13
Table 6.8.2d Study 2: Comparisons of mean values between twotesters, Emma and Doug
205
Table 6.8.3a Results from the third reliability study: paper-and-pencil measures
207
Table 6.8. 3b Results from the third reliability study: computermeasures
208
Table 7.1 .4a Group comparisons for performance and verbal IQscores: MANOVA results
214
Table 7.1 .4b Correlations between main task variables and IQ scores 215
Table 7.1 .4c Correlations between main task variables and age 216
Table 7.2.1 a Group comparisons for delay aversion, sentence spanand counting span tasks
218
Table 7.2. lb Group comparisons for DRA scores
219
Table 7.2. lc Frequencies (and percentages) of children who foundor did not fmd out the DRA rule on their own
220
Table 7.2. id Reasons for making choices on the delay aversion task 221
Table 7.2.1 e Testers' rating of children's delay aversion during thetask
221
Table 7.2.2.a Group comparisons for stop task variables (includingthe high error cases)
225
Table 7.2.2b Group comparisons for stop task variables (excludingthe high error cases)
227
Table 7.2.2c Time-on-task effects: mean reaction time (MRT) andstandard deviation of reaction times (SD)
229
Table 7.2.4 ANOVA results: sex effects on task variables
232
Table 7.2.5 Results from the discriminant function analysis: linearclassification functions (LCFs) and linear discriminantfunctions (LDFs) 233
Table 7.2.6 Group comparisons on the subscales of the Conners'
234
Table 7.3.1 Correlations between main task variables
236
Table 7.3.2a Correlations between main task variables andhyperactivity dimensions
237
Table 7.3.2b Partial correlations between main task variables andhyperactivity dimensions, controlling for conductproblems
238
14
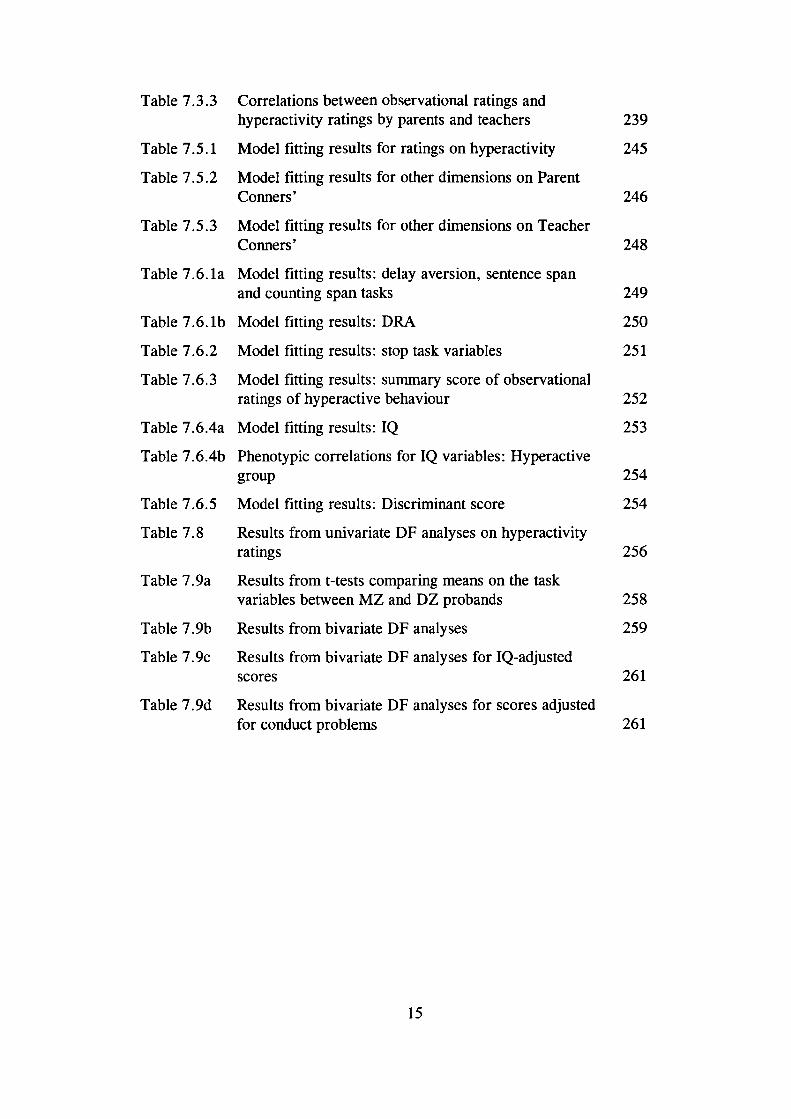
Table 7.3.3 Correlations between observational ratings andhyperactivity ratings by parents and teachers
239
Table 7.5.1 Model fitting results for ratings on hyperactivity
245
Table 7.5.2 Model fitting results for other dimensions on ParentConners'
246
Table 7.5.3 Model fitting results for other dimensions on TeacherConners'
248
Table 7.6.la Model fitting results: delay aversion, sentence spanand counting span tasks
249
Table 7.6. lb Model fitting results: DRA
250
Table 7.6.2 Model fitting results: stop task variables
251
Table 7.6.3 Model fitting results: summary score of observationalratings of hyperactive behaviour
252
Table 7.6.4a Model fitting results: IQ
253
Table 7.6.4b Phenotypic correlations for IQ variables: Hyperactivegroup
254
Table 7.6.5 Model fitting results: Discriminant score
254
Table 7.8 Results from univariate DF analyses on hyperactivityratings
256
Table 7.9a Results from t-tests comparing means on the taskvariables between MZ and DZ probands
258
Table 7. 9b Results from bivariate DF analyses
259
Table 7.9c Results from bivariate DF analyses for IQ-adjustedscores
261
Table 7.9d Results from bivariate DF analyses for scores adjustedfor conduct problems
261
15
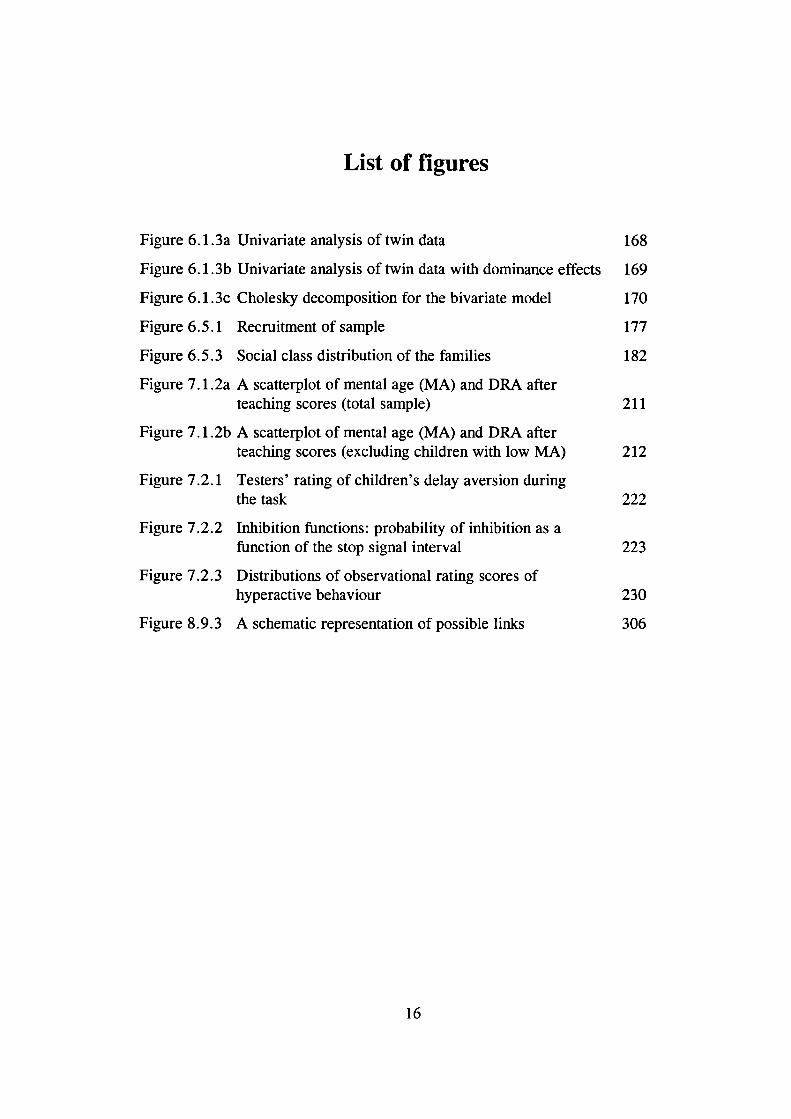
List of figures
Figure 6.1 .3a Univariate analysis of twin data
168
Figure 6.1. 3b Univariate analysis of twin data with dominance effects 169
Figure 6.1 .3c Cholesky decomposition for the bivariate model
170
Figure 6.5.1 Recruitment of sample
177
Figure 6.5.3 Social class distribution of the families
182
Figure 7.1 .2a A scatterplot of mental age (MA) and DRA afterteaching scores (total sample)
211
Figure 7.1 .2b A scatterplot of mental age (MA) and DRA afterteaching scores (excluding children with low MA)
212
Figure 7.2.1 Testers' rating of children's delay aversion duringthe task
222
Figure 7.2.2 Inhibition functions: probability of inhibition as afunction of the stop signal interval
223
Figure 7.2.3 Distributions of observational rating scores ofhyperactive behaviour
230
Figure 8.9.3 A schematic representation of possible links
306
16
Chapter 1
Childhood hyperactivity
1.1 Introduction
"Consider this: Suppose your child had no friends. ... Supposing yours was the
child who always had to work alone at school because the other children did
not want him in their group... Supposing you were unable to take your child to
all the places that a child would normally go because his behaviour was
inappropriate. Living with an ADD child is like living with a caged wild
animal. Would you not seek a way to help your child be 'normal'?"
(M. Johnson, The Times Magazine 26/10/1996)
The above quotation is a parent's reply to a newspaper article which disapproved the
use of medication in the treatment of hyperactivity. The parent points out that the aim
of such treatment is not just to keep teachers and parents happy: it is the children
themselves who ultimately suffer the consequences of their impulsive, thoughtless
actions.
The quotation highlights the seriousness of the condition. Hyperactive children are
not only overactive, impulsive and inattentive, but they frequently suffer from other
17
problems too. In addition to rejection from peers, hyperactivity is associated with
antisocial behaviours and academic underachievement. The outcome for most of
these children is not encouraging either: their problems tend to persist, although the
particular symptoms they show may change across development. As researchers have
become increasingly aware of the seriousness of the disorder, hyperactivity has
become one of the most investigated topics in developmental psychopathology.
In the letter, an extract of which is quoted above, the parent goes on to describe the
immediate benefits of stimulant medication. Behaviour modification techniques have
also proved beneficial in the short-term (Yule, 1986). However, it remains an
enormously difficult task to achieve long-term gains in the treatment of hyperactive
children (Hinshaw, 1994). To provide theory to guide the intervention efforts is a
major challenge for investigators. From another perspective, research on
developmental disorders will also provide insight into normal development (Sroufe &
Rutter, 1984). In particular if the view of hyperactivity as a continuous dimension
rather than a discrete category is correct (see section 1.5), an understanding of the
underlying processes has much wider implications than those relevant only for
individuals showing extreme hyperactivity.
1.2 Cardinal symptoms
The core features of hyperactivity are overactivity, inattention and impulsivity. The
DSM-IV (American Psychiatric Association, 1994) diagnosis of auention deficit
hyperactivity disorder (ADHD) requires that the child has shown at least six
symptoms from a list of inattention symptoms or at least six symptoms of
hyperactivity-impulsivity. Table 1 .2a lists all the symptoms specified in DSM-IV.
Children who meet the criteria both with regard to the inattention and the
hyperactivity-impulsivity symptoms are classified as 'combined type'. Those who
18
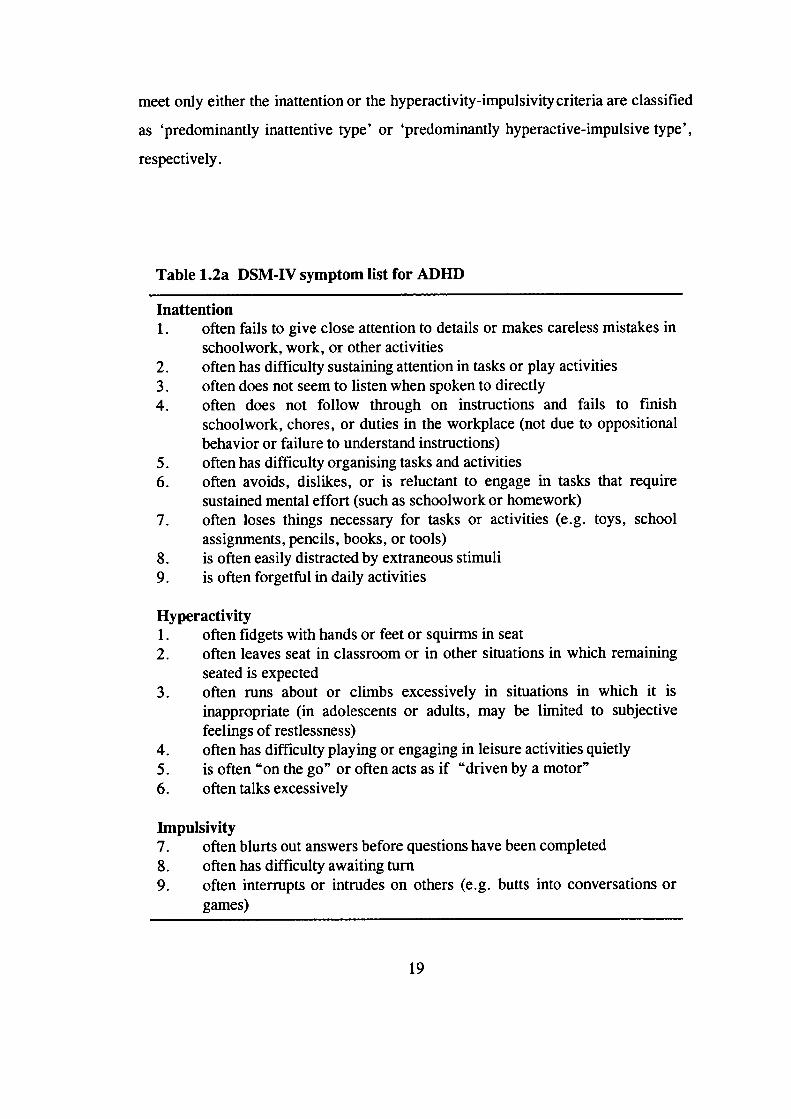
meet only either the inattention or the hyperactivity-impulsivity criteria are classified
as 'predominantly inattentive type' or 'predominantly hyperactive-impulsive type',
respectively.
Table 1.2a DSM-IV symptom list for ADHD
Inattention1. often fails to give close attention to details or makes careless mistakes in
schoolwork, work, or other activities2. often has difficulty sustaining attention in tasks or play activities3. often does not seem to listen when spoken to directly4. often does not follow through on instructions and fails to finish
schoolwork, chores, or duties in the workplace (not due to oppositionalbehavior or failure to understand instructions)
5. often has difficulty organising tasks and activities6. often avoids, dislikes, or is reluctant to engage in tasks that require
sustained mental effort (such as schoolwork or homework)7. often loses things necessary for tasks or activities (e.g. toys, school
assignments, pencils, books, or tools)8. is often easily distracted by extraneous stimuli9. is often forgetful in daily activities
Hyperactivity1. often fidgets with hands or feet or squirms in seat2. often leaves seat in classroom or in other situations in which remaining
seated is expected3. often runs about or climbs excessively in situations in which it is
inappropriate (in adolescents or adults, may be limited to subjectivefeelings of restlessness)
4. often has difficulty playing or engaging in leisure activities quietly5. is often "on the go" or often acts as if "driven by a motor"6. often talks excessively
Impulsivity7. often blurts out answers before questions have been completed8. often has difficulty awaiting turn9. often interrupts or intrudes on others (e.g. butts into conversations or
games)
19
The DSM-IV ADHD diagnosis also requires that some of the symptoms were present
before age 7 years and that the symptoms have persisted for at least six months. The
symptoms must be shown to a degree that is 'maladaptive and inconsistent with
developmental level' (p. 83). Unlike the earlier versions of the DSM classification,
but in agreement with the lCD classification, it is also required that some impairment
is present in two or more settings.
The ICD-1O (WHO, 1993) diagnosis of hyperkinetic disorder differs from the DSM-
IV diagnosis of ADHD in that it requires that the child has shown symptoms in each
of the three areas: at least six symptoms of inattention, at least three hyperactivity
symptoms and at least one impulsivity symptom (see Table 1 .2b). The other
requirements are rather similar to those of the DSM-N. Swanson, Sergeant et al.
(1998) point out that the lCD-b criteria in fact identify a phenotype which is a
subset of the DSM-IV diagnosis of ADHD.
Apart from differences between the DSM and lCD classification systems, the
changes in the diagnostic criteria within a classification system have obvious
implications for research: the groups of children studied may differ between studies
that have used different versions of the same classification system. For example,
DSM-IV criteria for ADHD are 'less tight' than DSM-III-R (American Psychiatric
Association, 1987) criteria, in the sense that children who are only inattentive can
now receive the diagnosis too. The DSM-IV criteria also identify fewer children with
comorbid oppositional and conduct disorders (Biederman et al., 1997). Nevertheless,
Biederman et al. (1997) showed that, in a sample of 405 clinic-referred children,
93% of those who received a DSM-III-R diagnosis of ADHD also received a DSM-
IV ADHD diagnosis.
The DSM-IV criteria for ADHD reflect findings from factor analytic studies of
parent and teacher ratings of the core symptoms which suggest that there are two
major dimensions rather than three (Bauermaister, Alegria, Bird, Rudio-Stipec &
20
Canino, 1992; Lahey, Pelham et a!., 1988). The first factor, Inattention-
Disorganisation, encompasses items describing distractibility, difficulties in
concentration and other deficits in attention. Items describing excessive motor
activity and impulsivity load on the second factor, hence called Hyperactivity-
Impulsivity. (Subtypes in hyperactivity/ADHD will be discussed in section 1.7.)
Inattentiveness, impulsivity and overactivity are the core behavioural features of
hyperactivity, but are they truly the 'core' symptoms? Despite the emphasis on
attention deficits in the DSM terminology, recent research questions this view of
hyperactivity being associated with an attention deficit. Chapter two reviews the
research evidence, as well as the research exploring the issue of whether hyperactive
children are truly impulsive.
In contrast to views prevalent in the 1 970s, motoric overactivity per se is now
considered to be a crucial feature in hyperactivity or ADHD (see Hinshaw, 1994).
Porrino et al. (1983) measured activity in hyperactive and control boys continuously
for a one-week period with a portable solid-state monitor. Hyperactive boys were
more active than control boys during each period of the day and a situation-by-
situation analysis showed that the difference between the groups was most
pronounced during structured school activities. The change in emphasis with regard
to the importance of overactivity was also reflected in the DSM classification, as
attention deficit disorder (ADD; American Psychiatric Association, 1980) became
attention deficit hyperactivity disorder (ADHD; American Psychiatric Association,
1987).
More recent studies, both using observational measures (Roberts, 1990) and
actigraph measures (Halperin, Matier, Bedi, Sharma & Newcorn, 1992), have
confirmed the specificity of overactivity to ADHD. For a discussion of how various
psychological theories of hyperactivity would explain the motoric overactivity, see
chapter two.
21
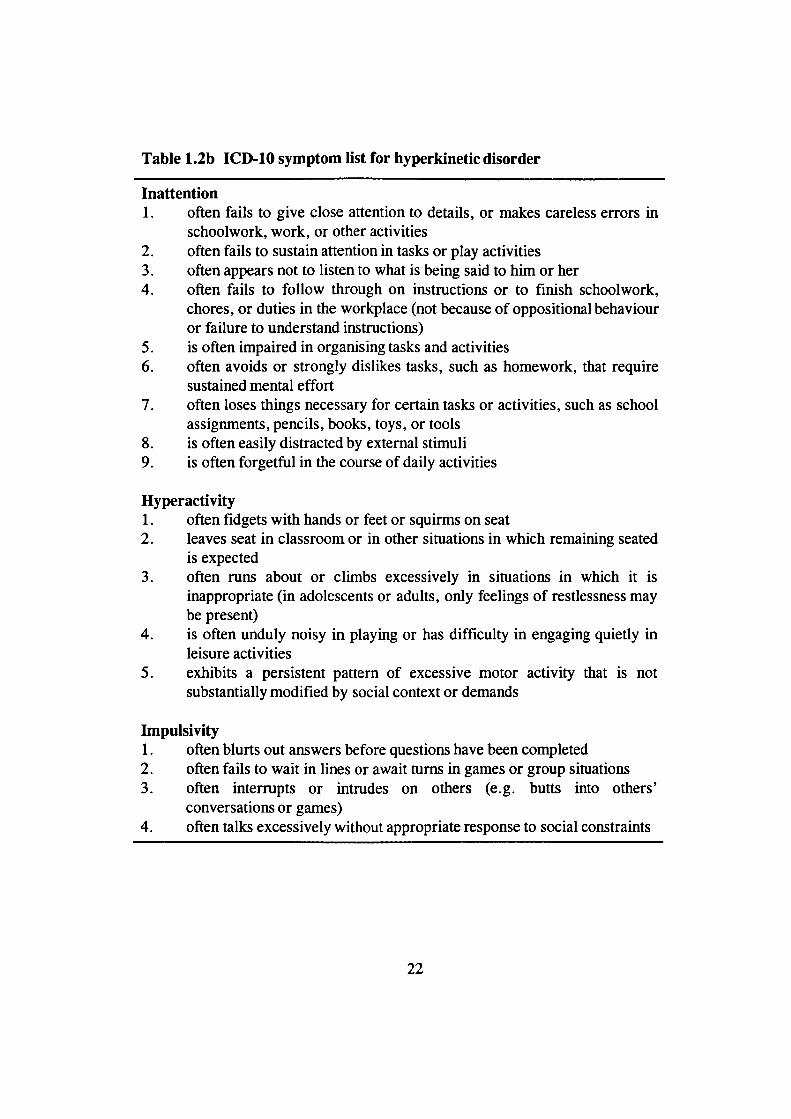
Table 1.2b ICD-1O symptom list for hyperkinetic disorder
Inattention1. often fails to give close attention to details, or makes careless errors in
schoolwork, work, or other activities2. often fails to sustain attention in tasks or play activities3. often appears not to listen to what is being said to him or her4. often fails to follow through on instructions or to finish schoolwork,
chores, or duties in the workplace (not because of oppositional behaviouror failure to understand instructions)
5. is often impaired in organising tasks and activities6. often avoids or strongly dislikes tasks, such as homework, that require
sustained mental effort7. often loses things necessary for certain tasks or activities, such as school
assignments, pencils, books, toys, or tools8. is often easily distracted by external stimuli9. is often forgetful in the course of daily activities
Hyperactivity1. often fidgets with hands or feet or squirms on seat2. leaves seat in classroom or in other situations in which remaining seated
is expected3. often runs about or climbs excessively in situations in which it is
inappropriate (in adolescents or adults, only feelings of restlessness maybe present)
4. is often unduly noisy in playing or has difficulty in engaging quietly inleisure activities
5. exhibits a persistent pattern of excessive motor activity that is notsubstantially modified by social context or demands
linpulsivity1. often blurts out answers before questions have been completed2. often fails to wait in lines or await turns in games or group situations3. often interrupts or intrudes on others (e.g. butts into others'
conversations or games)4. often talks excessively without appropriate response to social constraints
22
1.3 Historical perspective
The hyperactivity literature gives the impression of a field in a state of constant
disagreements. A look at the historical development of the concept of hyperactivity
or ADHD will help to appreciate how much has in fact been achieved. Sandberg and
Barton (1996) have recently written a comprehensive review of the roots of the
current concept of hyperactivity; this review forms the basis for this brief summary
of the literature.
In the beginning of the century, Still (1902) and Tredgold (1908) wrote descriptions
of children we would most likely now call hyperactive. Still explained the behaviour
the children exhibited as a 'defect of moral control', whereas Tredgold is thought to
be the first to provide an account of 'minimal brain damage'. The term minimal brain
damage refers to the idea that the hyperactivity would be due to brain damage the
child has suffered, although in many cases such brain damage could not be
substantiated. Further interest in minimal brain damage resulted from the encephalitis
epidemic in 1917-1918 which brought children to clinicians' attention who showed
symptoms resembling hyperactivity.
The term 'hyperkinetic disease' surfaced in the early 1 93 Os, in Kramer and Polnow '5
(1932) description of 15 children who presented with extreme restlessness. Another
description of cases referred to the central behaviour abnormality of hyperactivity,
which was explained as 'organic drivenness, or a surplus of inner impulsion' (Kahn
& Cohen, 1934). Associations between symptoms of hyperactivity and factors such
as epilepsy or lead poisoning were considered as further evidence of brain damage.
Throughout the first half of the twentieth century, the emphasis was on the
association between presumed brain damage and hyperactivity.
23
The 1930s were also the time of the 'discovery' of the efficacy of amphetamines in
the treatment of children showing symptoms of hyperactivity. Use of the medication
was not common until the 1950s, however. Laufer (1975) attributes this reluctance to
use medication to the prevailing psychoanalytic climate, which saw poor parenting as
the cause of hyperactivity.
The work by Strauss and his colleagues (e.g. Strauss & Lehtinen, 1947) further
promoted the idea of minimal brain damage. One of the first signs of a challenge to
this assumption of a causal link between brain damage and symptoms of
hyperactivity was the renaming of minimal brain damage as 'minimal brain
dysfunction' (MBD). However, later this term, MBD, became to be viewed as
overinclusive. The terms 'hyperkinetic behaviour syndrome' and 'hyperkinetic
impulse disorder' were introduced in the late 1950s and early 1960s. Chess (1960)
emphasised particularly the role of motoric overactivity in the condition, referring to
'physiologic hyperactivity'. Chess suggested that the prognosis would be good, with
many hyperactive children outgrowing their problems by puberty. In the 1960s the
American and European views on the condition started to grow apart, with the
Americans viewing the condition as more common and less likely to be associated
with overt signs of brain damage.
Two new trends emerged in the 1970s. First, the emphasis moved from motoric
overactivity to inattention. Second, environmental explanations were gaining
popularity. The idea that hyperactivity would result from an allergic reaction to food,
and food additives in particular, became widely known (see section 1.10).
During the last two decades hyperactivity has generated a vast amount of research
interest. Improved research methodology has led to the current understanding of the
disorder, which is discussed in the other sections of this literature review.
24
1.4 Prevalence
Recent epidemiological studies in Germany and Tennessee (Baumgaertel, Woiraich
& Dietrich, 1995; Woiraich, Hannah, Pinnock, Baumgaertel & Brown, 1996) show
how prevalence estimates vary depending on particular classification criteria and
cultural factors. In the German population of 5-12-year-old children the prevalence
figures for the DSM-IV ADHD subtype classifications of primarily inattentive type,
primarily hyperactive-impulsive type and the combined subtype were 9.0%, 3.9%
and 4.8%, respectively. The same figures were 5.4%, 2.4% and 3.6%, respectively,
in the Tennessee population of 5 to 11 year olds.
Prevalence rates were lower in both populations when DSM-III or DSM-III-R criteria
were used. For example, the same German population had a prevalence rate of
10.9% for the DSM-III-R diagnosis of ADHD and 9.6% for the DSM-llI diagnosis
of ADD (6.4% for ADD with hyperactivity and 3.2% for ADD without
hyperactivity). The DSM-IV ADHD combined subtype is most similar to the DSM-
III ADDH diagnosis (Wolraich et al., 1996). More boys than girls were classified as
having ADHD: the gender ratios varied from 5:1 (German sample) and 4:1
(Tennessee sample) for ADHD hyperactive-impulsive subtype to 2:1 for ADHD
inattentive subtype. Both the German and the Tennessee studies relied on teacher
ratings only and no data was obtained on the pervasiveness of symptoms. These are
serious limitations, given the requirement in DSM-IV of some impairment in two or
more settings for a diagnosis of ADHD. Nevertheless, these studies are useful in
indicating reasons which may account for differences in prevalence rates across
studies.
Anderson et al. (Anderson, Williams, McGee & Silva, 1987) in New Zealand found
an overall prevalence rate of 6.7% for the DSM-III diagnosis of ADD (with and
without hyperactivity) in 11-year-old children and a males-to-females ratio of 5:1.
25
This study used child interviews in addition to parent and teacher questionnaires. The
Ontario Child Health Study found a prevalence rate of 9.0% in 4-16-year-old boys
and 3.3% in girls for ADDH (Szatmari, Offord & Boyle, 1989b).
If only children who show severe and pervasive hyperactivity are included,
prevalence rates drop sharply. In the UK, Taylor and colleagues (Taylor, Sandberg,
Thorley & Giles, 1991) reported a prevalence of 1.7% in a population of primary
school boys for the narrowly defined ICD-10 category of hyperkinesis. Other studies
in the lCD tradition similarly suggest low prevalence rates of between 1 % and 2%
(see Swanson, Sergeant et al., 1998).
Overall, excluding the recent German and Tennessee studies that relied on teacher
ratings only, it may be concluded that between 2% and 7% of children are
hyperactive. The finding of hyperactivity being much more common among boys
than girls echoes the findings of many other early-onset disorders, such as
developmental learning and language disorders, and pervasive developmental
disorders (Lord & Schopler, 1985; Robinson, 1987).
1.5 Dimensions or categories?
In the research literature hyperactivity may refer either to a continuously measured
dimension or to a categorical classification. The DSM and lCD classification systems
exemplify the categorical psychiatric tradition, which assumes qualitative differences
between individuals with and without a particular disorder, such as ADHD. Whereas
such qualitative differences may indeed exist, in the absence of strong research
evidence this should not automatically be assumed to be the case.
26
Hyperactivity is commonly measured quantitatively, using measures such as parent
or teacher rating scales or interviews, or direct observations of behaviour. To
classify children as hyperactive or not hyperactive, a decision has to be made
regarding the cut-off point on the scales. Unless there are true discontinuities
between cases and non-cases, this may be an arbitrary decision.
Achenbach (1993) has pointed out that the dimensional approach is not intrinsically
incompatible with the categorical approach: for example, blood pressure is measured
quantitatively, whereas hypertension is diagnosed only when a specified threshold in
blood pressure is crossed. In fact, in their epidemiological investigations Taylor et a!.
(1991) found support both for the view that there is 'a continuum of hyperactive
behaviour shading into normality' (p. 119) and for the view that the extreme of the
dimension may be qualitatively different. Only children with hyperkinetic disorder
(i.e. the severe cases) were more likely to have lower IQs, be clumsy and have a
history of perinatal adversity. However, other studies suggest that the more general
definition of hyperactivity or ADHD is also associated with lower IQs (see section
1.8.1).
Behaviour genetic studies may provide further insight into the issue of dimensions
versus categories, as it is possible to compare heritability differences between a
general population sample and a clinical or 'extreme' sample (for a further discussion
of behaviour genetics, see chapter three). Goodman and Stevenson (1989b) carried
out a twin study of hyperactivity and found the heritabilities to be similar for the total
general population sample and a clinically relevant sample. Two recent large-scale
twin studies have similarly found no change in the relative genetic influence on
attention problems (Gjone, Stevenson & Sundet, 1996) and ADHD (Levy, Hay,
McStephen, Wood & Waldman, 1997) with increasing severity. These findings are
suggestive of a continuously distributed genetic liability to hyperactivity and attention
problems.
27
1.6 Developmental progression
The overall picture of the developmental course of hyperactivity is one of continuity
and persisting problems. With regard to early signs of hyperactivity, Richman,
Stevenson and Graham (1982) found that, in a representative sample of children, a
third of those who had been overactive and restless at age 3 still had such problems
at age 8.
A peak 'age of onset' for hyperactivity is between the ages of 3 and 4 (Palfrey,
Levine, Walker & Sullivan, 1985) and children usually present to health services
between the ages of 3 and 7 (Graham, 1991). Whether a particular child is referred
to health services undoubtedly depends on many factors apart from the actual
symptoms the child shows: the tolerance and management capacities of the
caregivers, the availability of services and mental health system politics (Buitelaar &
van England, 1996).
Most follow-up studies have examined the period from diagnosis of hyperactivity to
adolescence, with a few studies extending to early adulthood. With regard to
outcome in adolescence, studies have consistently found that over two thirds of
children diagnosed with hyperactivity or ADHD in childhood still receive the
diagnosis in mid- to late adolescence (e.g. Barkley, Fischer, Edelbrock & Smallish,
1990; Gittelman, Mannuzza, Shenker & Bonagura, 1985; Hart, Lahey, Loeber,
Applegate & Frick, 1995; Mannuzza et a!., 1991).
The symptom dimensions of hyperactivity-impulsivity and inattention may show
different patterns of change over time. In a longitudinal study of boys with ADHD,
Hart et al. (1995) found that only symptoms of hyperactivity-impulsivity declined
consistently with increasing age. At the start of the study the boys were 7 to 12 years
of age (mean age 9.4 years) and they were assessed annually for 4 years. Inattention
28
symptoms declined from the first year of the study to the next, but then remained
stable during the last two years of the study. Hart et at. suggest that the decline in
hyperactivity-impulsivity symptoms is likely to be truly developmental (older
children show fewer symptoms), whereas the change in the frequency of inattention
symptoms may be due to other factors, such as regression to the mean on repeated
measurement.
Not only is there continuity of hyperactivity symptoms from childhood to
adolescence, but childhood hyperactivity also predicts later antisocial behaviour.
Between 25% and 50% of hyperactive children show conduct problems by
adolescence and substance abuse is also common (e.g. Barkley, Fischer et al., 1990;
Eiraldi, Power & Maguth Nezu, 1997; Gittelman et al., 1985; Loney, Whaley-
Klalm, Kosier & Conboy, 1983; Mannuzza et al., 1991). In addition, there is a
strong association between childhood hyperactivity and academic underachievement
in adolescence (e.g. Fischer, Barkley, Edelbrock & Smallish, 1990).
However, a significant minority of children who have been diagnosed as hyperactive
in childhood do not continue to show the symptoms into adolescence. It is not known
whether these children simply do not cross the diagnostic threshold, having perhaps
learnt to control the symptoms of their 'underlying' hyperactivity to some extent.
The concept of heterotypic continuity (Kagan, 1969) is relevant here: the
manifestations of the underlying behavioural patterns or traits may change over time.
It is not at all improbable, perhaps given a relatively stable home background and the
absence of learning difficulties, that a child who has high levels of energy and is
impulsive could also benefit from these very characteristics later on in life. Studies
which have investigated predictors of outcome in hyperactivity have not provided
unequivocal results, however; methodologically strong studies are needed to specify
such factors (see Klein & Mannuzza, 1991; Hinshaw, 1994).
29
Studies which have followed up hyperactive children into adulthood show that,
whereas there is some overall improvement in functioning, these individuals are still
at risk for continuing ADHD symptomatology, antisocial behaviour and, in some
cases, substance abuse (e.g. Gittelman et al., 1985; Mannuzza, Klein, Bessler,
Malloy & LaPadula, 1998; Mannuzza et al., 1991). There is also an elevated risk for
a criminal outcome (Mannuzza, Klein, Konig, & Giampino, 1989; Satterfield &
Schell, 1997).
The link between childhood hyperactivity and adulthood antisocial behaviour or
criminality may be mostly accounted for by conduct problems in childhood. In a
prospective study of 89 hyperactive and 87 normal controls, Satterfield and Schell
(1997) found that hyperactive children who did not have conduct problems were not
at an increased risk for later criminality. Although the hyperactive group was in
general at risk for adult criminality, this was associated with conduct problems in
childhood and serious antisocial behaviour in adolescence.
Childhood hyperactivity also predicts compromised academic achievement and
educational history still in early adulthood (Mannuzza, Klein, Bessler, Malloy &
Hynes, 1997; Mannuzza, Klein, Bessler, Malloy & LaPadula, 1993; Weiss,
Hechtman, Milroy & Penman, 1985).
There is very little evidence regarding the outcome for hyperactive girls, as most of
the follow-up studies have included boys only. One study that did include a small
group of girls in their sample did not find significant sex-related differences in terms
of the developmental course of the disorder (Mannuzza & Gittelman, 1984).
30
1.7 Subgroups
1.7.1 Pervasive vs situational hyperactivity
In the hyperactivity literature, a distinction is frequently made between pervasive
hyperactivity (symptoms shown in more than one context) and situational
hyperactivity (symptoms shown in either school or home setting only). As was
already noted in the section on cardinal symptoms of hyperactivity, the DSM
requirements for the pervasiveness of ADHD symptoms have varied in different
versions of the classification system, whereas the lCD classification of hyperkinesis
has consistently required that the symptoms must be shown in more than one
situation.
When hyperactivity has been considered as a continuous dimension, it has become
clear that the agreement between parents and teachers is not high (see section 1.12
for a further discussion). Taylor (1994) has pointed out that an underlying dimension
of hyperactivity, source error (imperfect reporting of parents and teachers), bias and
situational effects (child behaves differently in different settings) can all contribute to
any single measure of hyperactivity. The evidence for rater bias is discussed in
section 3.4.3.
The pervasively hyperactive children seem to be a more severely affected group than
the situationally hyperactive children (see Hinshaw, 1994). For example, in a
representative sample of 13-year-old twins situational hyperactivity had similar, but
weaker, correlates as pervasive hyperactivity: both types of hyperactivity were
associated with male sex, social disadvantage, low IQ and psychiatric disorder
(mainly antisocial) (Goodman & Stevenson, 1989a). There is no strong evidence to
suggest that the differences between the situational and pervasive groups would be
31
qualitative rather than quantitative. However, the view that the situational group may
not comprise a valid disorder has also been expressed (Schachar, 1991).
The data from the twin study (Goodman & Stevenson, 1989a) suggest that an
additional distinction may be necessary between hyperactivity confined to the home
context and that confined to the school setting: the correlations with the various
factors were weaker for home hyperactivity than for school hyperactivity. Further
evidence for this distinction comes from a study in which hyperactive children were
followed up to investigate rates of psychiatric diagnoses in adulthood (Klein, 1990;
reviewed in Klein & Mannuzza, 1991). Teacher-identified hyperactive children had
similar rates of diagnoses in early adulthood as pervasively hyperactive children,
whereas parent-identified hyperactive children had much lower rates of ADHD and
conduct disorder at follow up.
With regard to possible cognitive deficits in hyperactivity, Schachar and colleagues
(Schachar, Tannock, Marriott & Logan, 1995) examined the performance of children
with pervasive, school-only and home-only ADHD on an inhibition task (see also
section 2.2.3). Whereas the poorest performance on the task was observed in the
pervasive group, the differences between the pervasive and the school-only groups
were small. In contrast, the home-only ADHD group showed no deficit on this task.
However, as the sample sizes were small, these findings await replication. Schachar
et al. (1995) concluded that it is not clear whether the three groups differ in kind or
in degree in their performance on the inhibition task.
The evidence on the situational versus pervasive issue emphasises the need to make
explicit decisions regarding the informants chosen to rate children's hyperactive
behaviour. Children identified as hyperactive by parents only may differ,
quantitatively if not qualitatively, from those identified by parents and teachers, or by
teachers only.
32
1.7.2 Hyperactivity-impulsivityvs inattentiveness
Hyperactive children have also been categorised into subgroups based on the
presence or absence of hyperactivity-impulsivity. The group of children who show
only symptoms of inattentiveness differ from the other children with ADHD with
regard to several features. Compared to 'hyperactive-impulsive' children or children
showing symptoms of both hyperactivity-impulsivityand inattentiveness, 'inattentive'
children show lower rates of comorbidity with conduct problems (Eiraldi et al.,
1997; Goodyear & Hynd, 1992) and a smaller proportion of them are boys (Lahey,
Applegate, McBurnett et al., 1994; Lahey, Pelham et al., 1988).
Barkley, DuPaul and McMurray (1990) found that the 'pure' ADD group responded
to lower stimulant dosages than the ADDH children and a greater percentage of them
also showed a negative response to medication. The family histories of
psychopathology also differ: high rates of externalising problems characterise the
biological relatives of the hyperactive-impulsive children, whereas internalising
problems and learning disabilities characterise the relatives of the inattentive children
(Barkley et al., 1990). The inattentive children are often characterised as sluggish,
drowsy and prone to daydreaming; the 'pure' attention deficit disorder may indeed be
a form of internalising disorder (see Hinshaw, 1994).
Because of these differences between the inattentive group and other children with
ADHD, it is possible that the groups differ also at the cognitive and motivational
level. In the sections that follow, the discussion will mostly focus on those children
who show symptoms of hyperactivity-impulsivity, with or without symptoms of
inattentiveness.
33
1.7.3 Girls with hyperactivity
Much of the hyperactivity literature has focused on boys only and the gender issue
has largely been brushed to the side. A recent review by Heptinstall and Taylor
(1996) addresses this neglected issue. The authors point out that sex differences in
hyperactivity are important and may give clues to the etiology of the disorder.
The reported sex difference in the prevalence of hyperactivity vary between studies
(see also section 1.4), but the figure of 3 boys to 1 girl is often quoted (Heptinstall &
Taylor, 1996). Could under-recognition by parents and teachers explain the lower
prevalence figures for girls? Recent data from a two-stage epidemiological study of
6-8-year-old girls (Taylor, Sandberg, Sonuga-Barke & Bowyer, unpublished;
reviewed in Heptinstall & Taylor, 1996) suggests that this is not the case:
hyperactive girls were less active than hyperactive boys (Taylor et al., 1991),
whether their movements were measured physically, directly observed or recorded
through interviews. As the same cut-off points on the same questionnaires were used
for both girls and boys to define hyperactivity, this finding suggests that parents and
teachers tend to overestimate hyperactivity in girls. That is, both the girls and boys
obtained ratings above the hyperactivity cut-off point, but the girls were less active
on objective measures. However, it is possible that high levels of hyperactivity in
girls less frequently lead to referrals to clinics, than is the case for boys (Heptinstall
and Taylor, 1996).
If rater bias cannot explain the male predominance, could it be due to other co-
occurring conditions? Heptinstall and Taylor (1996) conclude that it cannot be
attributed to antisocial behaviour, as the sex rations are similar for 'pure'
hyperactivity and for comorbid hyperactivity-conduct disorder. Learning disorders
are also unlikely candidates, as they are more common in hyperactive girls than
hyperactive boys (Berry, Shaywitz & Shaywitz, 1985; James & Taylor, 1990).
34
The step-by-step exclusion of possible explanations leads to the possibility that girls
are protected against hyperactivity. As a sex difference on hyperactivity ratings exists
also among children who score below a cut-off point for hyperactivity (Taylor et al.,
unpublished; reviewed in Heptinstall & Taylor, 1996), this suggests that the
protection extends to the whole population of girls.
An obvious next step is to attempt to provide an explanation for this protection. A
review of the relevant research (Heptinstall & Taylor, 1996) shows the inconclusive
nature of the findings. Evidence for environmental causes, such as those emphasising
socialisation practices or greater male vulnerability to stress, is scarce. Biological
explanations frequently refer to relative male immaturity, but there is no strong
support for such hypotheses. A genetic hypothesis, the two-threshold model, predicts
that girls need a higher dosage of the 'hyperactivity genes' than boys to show
hyperactive behaviour. Findings from methodologically strong studies fail to support
this hypothesis (e.g. Goodman & Stevenson, 1989b).
Another genetic hypothesis, that of X-linked inheritance, is incompatible with father-
son transmission. However, a hypothesis of an imprinted gene on the X-chromosome
would be compatible with father-son transmission. Imprinting is a phenomenon in
which the expression of an allele depends on its parental origin; imprinted genes
control the actions of other genes (see Skuse, in press). Skuse (in press) has
hypothesised that an imprinted X-linked locus could explain the male predominance
in disorders such as autism. This could theoretically also explain the greater
vulnerability of males to hyperactivity.
In sum, hyperactivity is less common among girls than boys. Rather than reflecting a
rater bias, many studies may overestimate the numbers of hyperactive girls due to
adults' tendency to emphasise hyperactive behaviour more easily in girls. The
preliminary conclusion is that females are protected against the development of
hyperactivity, although the reason for this remains poorly understood. Few studies
35
have investigated possible sex effects on cognitive skills among hyperactive children
and the results have been inconsistent (see Heptinstall & Taylor, 1996).
1.8 Co-occurrence of other disorders
Research on both child and adult psychopathology shows that various disorders
frequently co-occur in the same individuals (Anderson, Williams, McGee & Silva,
1987; Boyd et al., 1984; Flament et al., 1988; Kashani et al., 1987; Szatmari, Boyle
& Offord, 1989; Weissman et al., 1987). Despite the intuitive appeal of the
comorbidity concept, researchers have only relatively recently started to investigate
this important issue. In the past, the psychiatric classification tradition has tended to
discourage multiple diagnoses (Caron & Rutter, 1991).
Caron and Rutter (1991), in a review of the topic, point out two main reasons why
comorbidity should receive more attention in research studies. First, factors that are
found to be associated with a particular disorder may in fact be correlates of a co-
occurring condition. For example, before the field made the distinction between
ADHD and conduct disorder, ADHD was thought to be associated with parental
psychopathology in the antisocial spectrum; only later was it discovered that this
association holds for conduct disorder only (see section 1.9). Second, it is possible
that the meaning of a disorder is different in its 'pure' form and comorbid form.
From the viewpoint of planning effective treatment, a better understanding of the
comorbidity between disorders would be crucial.
An apparent co-occurrence of two or more disorders may also be artifactual. Caron
and Rutter (1991) discuss several possibilities, including: one disorder representing
an early manifestation of the other; artificial subdivisions of disorders; use of
overlapping diagnostic criteria; and one condition being part of a secondary
36
manifestation of the other condition. It is also possible, as discussed earlier and also
raised in Caron and Rutter's review, that the categorical approach to
psychopathology is misconceived and instead researchers should study how
individuals vary on behavioural dimensions. The extent to which two 'disorders'
would seem to co-occur would then be related to the particular cut-off points that
were used to define cases. The behavioural dimensions related to a diagnostic
category could also function as risk factors for the other condition at levels below the
diagnostic threshold.
If the apparently comorbid conditions are indeed separate and independent from one
another, several explanations are possible: the disorders may share the same risk
factors; one disorder may increase the risk for the other; or the comorbid condition
may be a separate condition from either of the 'pure' conditions (Caron & Rutter,
1991). A further possibility - that the risk factors for the disorders would themselves
be associated - cannot, as Stevenson (1996) argues, be logically differentiated from
the possibility of the disorders sharing the same risk factors. If the risk factors are
correlated, there must be some shared cause, however distant.
Behavior genetic designs are particularly well suited for the study of co-occurrence
of disorders. Neale and Kendler (1995) developed several models for comorbidity
between multifactorial disorders. Their models are based on the idea that there is a
normal distribution of disease liability which arises from the action of a large number
of factors, each of which has a small effect. Neale and Kendler (1995) point out that
'given cross-sectional data collected from unrelated individuals, there is almost no
information to discriminate between different models of comorbidity... When we
extend these models to data from relatives, the information on comorbidity rates
across family members may resolve the different origins of comorbidity' (p. 941).
Hyperactivity frequently co-occurs with antisocial behaviour/conduct problems,
learning disabilities and underachievement, and with anxiety disorders. The strongest
37
and most investigated association is that between hyperactivity and antisocial
behaviour; this topic will be discussed in chapter four.
1.8.1 Hyperactivity and learning disabilities
The association between hyperactivity and academic underachievement or learning
disabilities is well documented. However, researchers have defined learning
disabilities or underachievement in several ways. The term learning disability in the
American research literature often refers to poor reading achievement (reading age
significantly below that expected based on chronological age and IQ), whereas in the
UK the term commonly refers to generally low intelligence (the term specWc
learning disability may be used to denote reading difficulty).
Estimates of the strength of the association between hyperactivity and
underachievement have varied widely. McGee and Share (1988) argued for an
overlap of greater than 50%. After a careful consideration of the literature, Hinshaw
(1992) concluded that the overlap between hyperactivity and marked achievement
deficits (defined by IQ-achievement discrepancies) does not exceed 20%. However,
the figure is notably higher when more general indicators of underachievement (e.g.
grade retention, low grades) are used.
A few studies have investigated whether subgroups of hyperactive children differ in
the degree of association with reading disability, but the evidence has been
inconclusive (see Stevenson, 1996). A recent investigation, using the DSM-IV
framework, suggests that children with predominantly inattentive type or combined
type ADHD are more likely to have academic problems than children with
predominantly hyperactive-impulsive type ADHD (Lamminmäki, Ahonen, Närhi,
Lyytinen & Todd de Barra, 1995).
38
Hinshaw (1992) found little support for the view that the association would be
specific to IQ-discrepant achievement deficits: hyperactivity seems to be related both
to lower general intelligence and to reading delay. The research literature similarly
does not support the conclusion of some earlier reports that hyperactivity and
aggressive behaviour would be equally strongly associated with academic
underachievement. In childhood the link is stronger for hyperactivity (Frick et al.,
1991; Sonuga-Barke, Lamparelli, Stevenson, Thompson & Henry, 1994), though by
adolescence there is a clear association between antisocial behaviour and
underachievement (see Hinshaw, 1992).
Goodman, Simonoff and Stevenson (1995) discussed different causal pathways which
could explain the association between lower IQ and high rates of problem behaviours
in general. The 'rater bias' hypothesis suggests that teachers and parents overreport
behaviour problems in children with lower IQs. The 'IQ as a cause' explanation
suggests that low IQ leads to behavioural deviance. The opposite is also possible:
behavioural deviance, as it would affect learning in the classroom and compliance
during testing, could lead to lower IQ scores. A fourth alternative explanation the
authors considered is that of 'IQ as a marker': some antecedent, 'third' factor (e.g.
genes or motivation to succeed) could cause both low IQ and behaviour problems.
Analyses on teachers' and parents' ratings of 13-year-old twins' behaviour provided
more support for the 'IQ is a marker' and 'IQ is a cause' hypotheses than the other
two possible explanations. However, the study did not focus on hyperactivityper Se.
With regard to reading disability, the evidence is strongest for the existence of shared
influences on both hyperactivity and reading disability (Hinshaw, 1992; Stevenson,
1996). Possible candidates that have been suggested to explain the co-occurrence of
these disorders include language deficits and neurodevelopmental delay (Hinshaw,
1992; Stevenson, 1996). Stevenson (1996) reviewed the genetic literature which
shows that both conditions have genetic etiologies and that there is indeed evidence
of shared genetic effects on hyperactivity and literacy. For example, Stevenson,
39
Pennington, Gilger, DeFries and Gillis (1993) carried out a twin study on
hyperactivity and spelling ability which suggests that the co-occurrence between the
disorders is mostly (75%) due to shared genetic influences. More recently, Light,
Pennington, Gilger and DeFries (1995) obtained highly similar findings from their
twin data on the association between reading disability and hyperactivity.
Some evidence suggests that hyperactivity may lead to reading disability. Fergusson
and Horwood (1992) studied attention deficits and reading achievement in a sample
of 777 New Zealand children at ages 10 and 12 years. Model estimates suggested
that the causal pathway was from attention deficits to reading achievement, whereas
there was no evidence for a causal pathway in the opposite direction. Rowe and
Rowe (1992) similarly found evidence of inattentiveness having a negative influence
on reading achievement in a general population sample. In contrast to the findings of
the New Zealand study, their study provided support for a reciprocal model too.
Reading achievement, which was mediated by attitudes and reading activity at home,
had a positive effect on attentiveness at school.
Despite some inconsistencies in the literature (see Stevenson, 1996), a few studies
suggest that a separate subgroup of hyperactive children may exist whose ADHD-
type symptoms are secondary to reading disability (e.g. Duffy & McAnulty, 1990;
McGee, Williams & Feehan, 1992; Pennington, Groisser & Welsh, 1993).
Pennington et al. (1993), for example, found a double dissociation between ADHD
and reading disability: only ADHD was associated with poor performance on
executive function measures and only reading disability was related to deficits in
phonological processing. The comorbid group had the same cognitive deficits as the
reading disability group, which suggests that the ADHD characteristics of these
children were a behavioural consequence of their reading disability.
Overall, the evidence is strongest for shared, common influences on hyperactivity
and reading disability. Although there may indeed be common genetic effects on the
40
two disorders, an alternative explanation for what appears to be shared genetic
etiology is also plausible. As Stevenson (1996) points out, genetic factors could
influence reading disability, which could then lead to hyperactivity. Together with
the evidence reviewed above, this raises the issue of the possible heterogeneity of
hyperactivity (see also Hinshaw, 1994).
1.8.2 Hyperactivity and anxiety disorders
Compared to the other disorders that tend to co-occur with hyperactivity, anxiety and
depression have not attracted quite the same amount of research interest. In part, this
may be due to a reluctance to accept that internalising and externalising problems are
not 'opposing poles' but rather co-occur in the same individuals more often than
would be expected by chance.
Taylor et al. (1991) found hyperactivity to carry a relative risk of 1.3 for a high
'emotional symptoms' score in a general population sample of 7- and 8-year-old
boys. Epidemiological studies suggest that between one-fourth and half of children
who are diagnosed as having ADHD or ADD also meet the diagnostic criteria for an
anxiety disorder (Anderson et al., 1987; Bird, Canino & Rubio-Stipec, 1988; Bird,
Gould & Staghezza, 1993). The New Zealand birth cohort study (Fergusson &
Horwood, 1993) found correlations of around .3 between ADHD symptoms and
symptoms of anxiety-withdrawal at ages 8, 10 and 12 years. The rate of co-
occurrence with anxiety disorders may be higher in children with the 'inattentive'
form of ADHD than in children who show hyperactive-impulsive symptoms (e.g.
Lahey, Schaughency, Hynd, Carison & Nieves, 1987), although the evidence is not
consistent (Eiraldi et al., 1997).
There is some evidence that children who have both ADHD and anxiety disorder
may differ from children with ADHD only (Livingston, Dykman & Ackerman,
1990; Pliszka, 1989, 1992; Tannock, Ickowicz & Schachar, 1995). Pliszka (1992)
41
found that children in the comorbid group (ADHD + overanxious disorder) were less
hyperactive during a behavioural observation than were children with ADHD only,
and they also made fewer commission errors on the continuous performance task (for
an explanation of the task, see section 2.1.2). This is an intriguing finding, which
awaits replication.
Research on the effects of medication suggests that the presence of comorbid anxiety
in children with ADHD is associated with a poorer response to stimulant treatment
(see Tannock et at., 1995, for a summary of the findings). Whereas most studies
have relied on behavioural outcomes, Tannock et al. (1995) showed that stimulant
medication improved performance on a working memory task only in the 'pure'
ADHD group and not in the comorbid (ADHD + anxiety) group. Apart from this
difference in response to medication, the two ADHD groups did not differ in their
performance on the working memory task.
A few studies have focused on the possibility of shared, common influences on
hyperactivity and anxiety disorder. Relatives of children with ADHD have a higher
risk for anxiety disorders than do relatives of non-ADHD children (Biederman et a!.,
1992; Biederman et at., 1991; Perrin & Last, 1996). However, relatives of children
with anxiety disorder do not seem to be at an increased risk for ADHD (Perrin &
Last, 1996). The evidence is most consistent with the view that ADHD and anxiety
share common risk factors, but are independently transmitted in families (Perrin &
Last, 1996). A limitation of this type of familial risk analysis is that shared
environmental effects cannot be separated from genetic effects.
In sum, the rather limited literature on the co-occurrence of hyperactivity and anxiety
disorders suggests that the two disorders may share common risk factors. Even less
is currently known about the co-occurrence of hyperactivity and depressive
disorders, which is seen in up to 27% of cases (Bird, Gould & Staghezza, 1993).
42
1.9 Family-environmental factors
Several early studies which did not control for conduct disorder suggested that
parents of hyperactive children would be characterised by psychopathology in the
'antisocial spectrum' (Cantwell, 1972; Morrison, 1980; Morrison & Stewart, 1971).
More recent investigations have found that there is no association between
hyperactivity, independent of conduct problems, and parental antisocial disorders
(Biederman, Mumr & Knee, 1987; Faraone, Biederman, Keenan & Tsuang, 1991b;
Lahey, Piacentini et al., 1988; Reeves, Werry, Elkind & Zametkin, 1987; Stewart,
deBlois & Cummings, 1980).
Rather, parents and other biological relatives of non-aggressive hyperactive children
show higher than expected rates of attentional problems and learning problems
(Biedennan et al., 1987; Faraone et al., 1991; Frick, Lahey, Christ, Loeber &
Green, 1991; Lahey, Piacentini et a!., 1988; Schachar & Wachsmuth, 1990).
Early research investigating the links between parenting behaviour and hyperactivity
similarly did not distinguish between 'pure' hyperactivity or ADHD and comorbid
hyperactivity-conduct problems (see Frick, 1994). Some more recent investigations
have also failed to make this distinction (e.g. Biederman et a!., 1995). Some studies
which have considered the comorbidity issue suggest that hyperactivity per se is not
associated with parenting and other measures of the quality of the home environment
(Loeber, Brinthaupt, & Green, 1990; Paternite & Loney, 1980; Szatmari, Offord &
Boyle, 1989a; Taylor, Schachar, Thorley & Wieselberg, 1986).
Other studies report positive findings, however. Taylor et al. (1991) found that
hyperactivity was associated with poor coping and expressed criticism from parents
even when conduct disorder was controlled for. Woodward, Taylor and Dowdney
(1998) also found an association between hyperactivity and poor parent coping and
43
the use of aggressive discipline methods, after adjustment for the effects of conduct
disorder and parental mental health.
Frick's (1994) review of the literature highlights an important issue: parenting
measures may in fact be picking up parents' responses to the hyperactive behaviour
of their child. That is, the correlational nature of the findings leaves open the
possibility that the parenting difficulties would be a consequence of the child's
difficult behaviour rather than a causal factor. Indeed, Barkley and colleagues
(Barkley, Karlsson, Strzelecki & Murphy, 1984) found that stimulant medication not
only improved the hyperactive children's behaviour but that it also improved mother-
child interactions in an observational seuing.
In general, reviewers of the literature agree that while family-environmental factors
do not seem to be directly implicated in the etiology of hyperactivity, they may play
a role in the maintenance and even eventual course of the disorder (Hinshaw, 1994;
Taylor, 1994). Sandberg and Garralda (1996) write: 'it seems likely that rather than
directly causing it, the environment mainly influences the expression of overactivity,
acting as a stressor or trigger mechanism in pre-disposed vulnerable children' (p.
318). The importance of factors related to the family environment becomes clear
when the issue of the co-occurrence of hyperactivity and conduct problems is
considered (chapter four).
Although similarly not implicated in the etiology of the disorder, peer rejection is a
salient accompanying feature of hyperactivity (see Hinshaw, 1994, for a review).
Both aggressive and non-aggressive children with ADHD seem to be negatively
appraised by their peers (Peiham & Bender, 1982).
Above the levels of peer and family factors, cross-cultural aspects are also important
for understanding hyperactivity. A recent review (Luk, 1996) concludes that cultural
44
factors influence how hyperactivity is manifested, perceived, tolerated, referred and
managed.
1.10 Toxic factors and diet
In the search for etiological factors in hyperactivity, environmental toxins have been
put forward as possible candidates. Lead is one such candidate, as it affects the
brain. A high concentration of body lead is associated with low IQ and behaviour
disturbances (see Kado & Takagi, 1996). However, evidence for a specific link from
high lead concentrations to hyperactivity is less strong. In their review of the
literature, Kado and Takagi (1996) conclude: 'The tentative conclusion is that lead
exposure is not the major cause of hyperactivity, that it is neither a necessary nor
(except at very high doses) a sufficient cause, and that its weak contributory effect is
probably not specific to hyperactivity disorders' (p. 266) (see also Taylor, 1986).
Another hypothesis is that there is a causal relationship between food substances and
hyperactivity. Of all the variations of this hypothesis, Feingold's (1975a,b) proposal
of an association between food additives and hyperactivity is the best known. Food
additives refer to synthetic colourings, flavourings and preservatives, but Feingold
put the blame on naturally occurring salicylates in fruits too. The research that
followed Feingold's proposal was of mixed quality methodologically and provided
inconsistent results (see Kado & Takagi, 1996). On the whole, controlled studies
failed to support Feingold's hypothesis (Taylor, 1991). Single case control studies,
however, suggested that artificial colours can have an effect on the behaviour of
individual children (see Taylor, 1991).
Other studies widened the focus from food additives to include also foods such as
milk and wheat. Egger et al. (Egger, Carter, Graham, Gumley & Soothill, 1985), in
45
a double-blind controlled study, obtained some evidence suggesting that foods and
additives could have an adverse effect on hyperactive behaviour. This effect only
emerged in parental ratings of behaviour and not in objective psychological testing.
However, the study suffered from methodological limitations (see Carter Ct a!.,
1993). Several subsequent studies obtained contradictory results and have been
criticised, like the Egger et al. (1985) study, of having atypical samples (see Carter et
at., 1993; Kado & Takagi, 1996).
In an attempt to improve the methodology of the Egger et a!. (1985) study, Carter et
al. (1993) carried out another study involving a 'few foods' diet. The children
(N=78), aged between 3 and 12 years, had been referred to a special diet and
behaviour clinic in a hospital and were diagnosed as having ADDH using DSM-III
criteria. In the first phase of the study, the children were put on a 'few foods' diet for
three to four weeks. Those children whose behaviour improved during this first
phase (N=59), entered the second phase of open introduction: food and additives
were reintroduced, at the rate of one a week. Where possible, the children completed
the third phase of the study (N =19) - a double blind, crossover, placebo controlled
trial. This involved the reintroduction of one or more provoking items. The battery
of outcome measures included the following: Conners' Parent Rating Scale, a
parental global rating of severity, an observational rating of behaviour by a
psychologist, a paired associate learning test and the Matching Familiar Figures Test
(MFFT).
The active versus placebo phase comparisons for the 19 children showed significant
effects for the Conners' hyperactivity rating, the psychologist's observation score and
the MFFT measures. Thus, children whose behaviour was 'diet-responsive' on an
open trial maintained this pattern of responding in a double blind, placebo controlled
trial with objective tests. The authors point out that there was some suggestion that
the effect of diet would be on irritability rather than on the 'core' symptoms of
46
hyperactivity as such. With regard to how broad the diet should be, the data
suggested that an additive-free diet by itself would be of little benefit.
The conclusion from the research on the effects of diet on hyperactivity seems to be
that a small subgroup of hyperactive children may exist who respond favourably to a
'few foods' elimination diet. It is not clear how the diet works or specifically which
behaviours it affects and which it does not.
1.11 Neurological aspects
1.11.1 Neurological damage
The great majority of hyperactive children do not show any obvious signs of
neurological damage. However, various neurological problems can sometimes be
associated with ADHD-type symptomatology (for a review, see British Psychological
Society, 1996). Head injury, cerebral vascular accident, epilepsy, infection
(meningitis and encephalitis), phenylketonuria and certain other conditions can all
lead to symptoms resembling those observed in children with ADHD.
Studies which have investigated the association between low birthweight and
hyperactivity have obtained contradictory results. The twin study by Goodman and
Stevenson (1989b; see section 3.4.3), for example, found no evidence for such a
link. A birthweight of 2000 grams or less was not a predictor of hyperactivity or
inattentiveness in their sample. Within-pair comparisons provided further support for
this conclusion: lighter born twins were not more likely to be hyperactive or
inauentive than their co-twins. Taylor et al. (1991) found that their measure of
perinatal insult, which included low birthweight, was not associated with milder
47
degrees of hyperactive behaviour or ADDH but was associated with the more severe
hyperkinetic syndrome.
Studies which have followed up children who were born with very low birthweights
suggest that the prevalence of ADHD may be higher than expected among these
children. In a cohort study of 137 children with birthweights below 1501 grams
(Bouing, Powis, Cooke & Marlow, 1997), 23% of these children met the clinical
criteria for ADHD at age 12 years, compared to 6% of matched control children.
Szatmari et al. (Szatmari, Saigal, Rosenbaum & Campbell, 1993) similarly found an
increased incidence for ADHD at age 8 years among children born with very low
birthweights.
One possible interpretation of the research findings on the links between neurological
damage and hyperactivity relates to the concept of heterogeneity: a small subgroup of
all the children who meet the criteria for hyperactivity or ADHD could show the
symptoms because of underlying brain damage. These children may or may not share
the 'specific associations of hyperactivity' with the majority of the hyperactive
children at the neurochemical and the cognitive-motivational level. This would
depend on whether the neurological damage would disrupt the same 'critical
pathway' which would be disrupted in the 'mainstream' hyperactive group.
1.11.2 Neuroanatomical studies
Although in the great majority of cases there is no evidence of obvious neurological
damage, unusual brain functioning could nevertheless be a factor in hyperactivity.
Neurological evidence comes from three sources - from neuroanatomical,
neurochemical and neurophysiological studies. Neuroanatomical studies involve
scanning of the brain. Structural imaging, such as magnetic resonance imaging
(Mm), may show subtle abnormalities in brain structure.
48
Studies using MRI scanning have implicated the caudate nucleus, which is part of
basal ganglia, in ADHD. (Basal ganglia are part of the motor system.) Hynd and
colleagues (Hynd et al., 1993) reported a reversal of the left-larger-than-rightcaudate
asymmetry, which 73% of the control children demonstrated, in children with
ADHD. This was due to a significantly smaller left caudate area in the ADHD
group. The boys with ADHD also had total brain volume 5% smaller than the
control boys. In contrast to the findings of Hynd et al. (1993), Castellanos et a!.
(1994) found no asymmetry in caudate volume in their sample of boys with ADHD,
but the mean right caudate volume was smaller in the ADHD group than in the
matched comparison boys. The control children showed a right-larger-than-left
asymmetry.
Other studies have focused on the corpus callosum, which connects homotopic
regions of the cerebral hemispheres. Semrud-Clikeman et a!. (1994) reported that the
splenial area of the corpus callosum was smaller in children with ADHD than in
comparison children. Another investigation (Baumgardner et a!., 1996) found ADHD
to be associated with a reduction in the rostral body region of the corpus callosum.
Recently Filipek et a!. (1997) reported localised hemispheric structural anomalies in
ADHD. The boys with ADHD had similar hemispheric volumes with matched
controls, but had smaller volumes of the right anterior-superior (frontal) hemispheric
region, bilateral anterior-inferior (pen-basal ganglia) hemispheric regions, and
bilateral retrocallosal (posterior parietal-occipital) hemispheric regions. The authors
suggest that the findings are not consistent with an explanation involving
degeneration or atrophy. Rather, the results implicate a neurodevelopmental process
that alters neural system configuration in children with ADHD.
The boys with ADHD also had smaller left caudate and caudate head volumes, with
reversed asymmetry. This finding is in line with the results from the Hynd et al.
(1993) study, but not with those from the Castellanos et al. (1994) study. Filipek et
49
al. (1997) discuss several possible explanations for these discrepancies in the results.
For example, the ADHD group in the Castellanos et al. study had a high rate of
comorbid diagnoses, whereas the boys with ADHD in the Filipek et al. study were
free of comorbid disorders.
Filipek et al. (1997) conclude that the results of their study 'potentially suggest that
predominantly hyperactive-impulsive symptoms may be due to right frontal/bilateral
striatal dopamine dysfunction, leading to underactivation of the right hemisphere' (p.
599). The striatum, which includes the caudate nucleus, putamen and ventral
striatum, is a brain region implicated in the control of motivation and reward.
Functional imaging techniques, positron emission tomography (PET) and single
photon emission computed tomography (SPECT), measure cerebral blood flow. A
few studies on ADHD have utilised such techniques. Lou, Henriksen and Bruhn
(1984) found that all the 11 children with ADD in their sample had hypoperfusion
(reduced blood flow) in the white matter of the frontal lobes and seven of the
children also in the caudate nuclei region. Methyiphenidate increased blood flow in
the central regions, including basal ganglia and mesencephalon, but decreased blood
flow in the motor and primary sensory cortical areas.
In subsequent studies Lou and colleagues (Lou, Henriksen & Bruhn, 1990; Lou,
Henriksen, Brubn, Borner & Nielsen, 1989) found hypoperfusion in striatal
(particularly right striatal) and posterior periventricular regions in ADHD subjects,
whereas regional cerebral activity was abnormally high in occipital regions and in
some cases also in the left primary auditory and sensorimotor regions.
Zametkin et al. (1990) investigated cerebral glucose metabolism in 25 adults who had
been hyperactive since childhood (they were also biological parents of a child with
diagnosed ADHD) and 50 control adults. In the adults with hyperactivity global
cerebral glucose metabolism was reduced by 8%. The reduction was greatest in the
50
premotor cortex and the superior prefrontal cortex. Similar investigation with
adolescents with ADHD, some of whom had also learning difficulties, found reduced
cerebral glucose metabolism in the left frontal region, left thalamus, right temporal
region and hippocampus (Zametkin et al., 1993).
To summarise, the studies which have used brain imaging techniques provide some
support for the suggestion that hyperactivity would be associated with abnormalities
in frontal-striatal circuits. The evidence with regard to left versus right hemispheric
dysfunction is contradictory, but more often the right hemisphere has been implicated
than the left. Interpretation of the results is somewhat difficult, however, due to
limitations of the current studies and differences in methodologies across studies (see
Tannock, 1998).
1.11.3 Neurochemical studies
At the neurochemical level the focus is on how different neural systems
communicate. Research evidence implicates several transmitter substances in
hyperactivity: dopamine, norepinephrine (also known as noradrenalin), epinephrine
(adrenalin) and serotonin. These neurotransmitters belong to a family of compounds
called monoamines. A subclass of monoamines, to which dopamine, norepinephrine
and epinephrine belong, is called catecholamines. General research in the field of
neurochemistry shows how these neurotransmitters play a role in different functions
(see, for example, Carlson, 1986). Norepinephrine is involved in arousal and
alertness. Dopamine has been implicated in several important functions, including
movement, attention and learning. Serotonin plays a role in the regulation of mood
and pain and in the control of eating, sleep and arousal.
The fact that stimulants, which act as dopaminergic and noradrenergic agonists, are
efficient in the treatment of children with ADHD supports a 'catecholamine
hypothesis' of ADHD. Pliszka, McCracken and Maas (1996) recently reviewed the
51
literature on the role of catecholamines in ADHD. They point out that the literature
on the relationship of stress-induced catecholamine release to personality and
performance may be relevant to understanding ADHD. This research has shown that
stress tolerance and good performance on tasks are related both to low basal levels of
catecholamines and to higher acute releases of catecholamine during mental stress.
Thus, catecholamine release in response to events may be particularly informative.
With regard to the literature on the role of norepinephrine (NE) and epinephrine
(EPI) in ADHD, Pliszka et al. (1996) conclude that children with ADHD may show
higher levels of NE activity but lower levels of EPI activity than other children. An
interesting finding emerged in a study with healthy adult males (van Zijderveld et al.,
1993). Compared to a placebo infusion, an EPI infusion led to shorter reaction times
and fewer errors on a mental arithmetic task, and the participants also reached a
higher level of difficulty. Chapter three, which summarises the research on cognitive
and task engagement factors in hyperactivity, shows that hyperactive children's
performance on cognitive tasks is characterised by longer reaction times and a high
number of errors. Studies also show that stimulants increase urinary EPI (see Pliszka
et al., 1996). Another interesting finding, given the results from the brain imaging
studies, is that NE inputs to the right cerebral cortex are more dense than to the left
cortex (Tucker & Williamson, 1984).
Pliszka et a!. (1996) suggest that 'NE primes the posterior attention system, which
orients to and engages new stimuli. It is clear that for efficient attentional
functioning, there must then be a clean "hand off' to the anterior system, which co-
ordinates the frontal lobe functions necessary to analyse the data, then selects and
initiates a response. Dopaminergic inputs to the prefrontal cortex serve to "lock out"
new information and ready the individual for response' ( pp. 268-269).
The dopamine hypothesis of ADHD has, in general, been widely endorsed (see, for
example, Levy, 1991). Research shows that dopamine is involved in frontal lobe
52
functioning and has been implicated in the functioning of working memory
(Goldman-Rakic, 1992). Not all data have been consistent with the dopamine
hypothesis, however. Pliszka et a!. (1996) conclude that the evidence does not
provide strong support for a simple 'hypofunctioning of the dopamine system'
account of ADHD. Distinguishing between the various dopamine subtypes may be
important. For example, Dl agonists disrupt working memory in nonhuman
primates, whereas D3 receptors may relate to responding to rewards. Pliszka et al.
(1996) suggest that ADHD could be related to hyperfunctioning of the mesolimbic
dopamine system (the D3 subtype is found in these areas). The mesolimbic dopamine
system is the dopaminergic innervation of the nucleus accumbens, which is part of
the ventral striatum. It has been implicated in activation and locomotor behaviour, as
well as in psychostimulant-inducedlocomotor behaviour (see Koob, 1996).
Koob (1996) reviewed the literature on the association between dopamine and
motivational processes. Whereas research has long suggested a role for the
mesolimbic dopamine system in reward and motivational processes, recent
neuropharmacological and electrophysiological data, as well as results from
modelling studies, have advanced our understanding of these processes. Based on
these new data, Koob (1996) concludes that 'midbrain dopamine neurons may be part
of the process by which rewards motivate or guide behaviour (incentive motivation).
Under this formulation, changes in positive incentives would, through an activation
of the mesolimbic dopamine system, allow or actually release species-specific
approach responses or changes in direction toward these larger incentives. The
mechanism for this enabling function could be through additional activation of the
central motive state (in addition to primary drives) or by feeding directly to motor
routines in the extrapyramida! motor system or both' (p. 188).
The research on the catecholamine hypothesis of ADHD points to the following
conclusion (Pliszka Ct a!., 1996): an explanation in terms of 'too much' or 'too little'
of a single neurotransmitter is too simplistic. An account emphasising the interactions
53
between the different catecholamines holds more promise. Other reviewers of the
literature agree that a single transmiuer defect hypothesis cannot be correct
(Hechtman, 1994; Kado & Takagi, 1996). In addition to the catecholamines, there is
some, although limited, evidence supporting the role of serotonin in ADHD (for
reviews, see Hechtman, 1994; Kado & Takagi, 1996).
Research on the personality factor of sensation seeking, which refers to behaviours
rather similar to those observed in ADHD (see section 2.5.2), similarly points to
interactions between these neurotransmiuers - serotonin, dopamine and
norepinephrine. Zuckerman (1996) suggests that impulsive unsocialized sensation
seeking is based on 'a highly reactive dopaminergic system and a weakly reactive
serotonergic and noradrenergic systems producing strong approach and weak
inhibition and arousal reactions to novel situations or situations containing
possibilities of both primary reward and punishment' (pp. 125-126).
1.11.4 Neurophysiological studies
Earlier studies on ADHD using electroencephalogram (EEG) measures reported
inconclusive findings (see Chabot & Serfontein, 1996; Kado & Takagi, 1996). A
methodologically stronger study is a recent study by Chabot and Serfontein (1996),
which used neurometric quantitative EEG (QEEG). The study sample consisted of
407 children with ADD and 310 comparison children. The ADD diagnosis was based
on a DSM-III Symptom List rating scale which the child's teacher, or a parent if the
child was not in school, completed. The ADD group was divided into low-IQ
(IQ <85; N=88) and normal-IQ (N=319) groups. Within these two groups, the
children were further divided into the following subgroups: ADHD, ADD (i.e.
without hyperactivity) and an attention problem group (ATT; children not reaching
DSM-III criteria for ADD or ADHD but showing inattentive behaviour). The
children were between aged between 6 and 16 years.
54
A discriminant analysis showed that the QEEG distinguished well control children
from those with attention deficit disorder: the specificity was 88.0% (control children
called controls) and sensitivity 93.7% (ADHD, ADD and ATT children called
cases). Of the children in these three clinical groups, 92.6% had an abnormal QEEG.
The patterns of QEEG abnormality varied in degree rather than in the type of
abnormality. The children with ADHD showed more generalised and extreme QEEG
abnormality than the children with ADD, with the children with ATT showing the
least extreme abnormality. The children in the low-IQ group similarly showed more
extreme QEEG abnormality than the children in the normal-IQ group. A previous
study with children with learning disorders but without ADD/ADHD (John et al.,
1983) found abnormal QEEG features which differ in the type of abnormality from
those observed in Chabot and Serfontein's sample.
The investigators identified two primary neurophysiological subtypes based on the
QEEG findings showing abnormality. The first subtype, which involved an increase
in EEG activity, especially in frontal regions, included 46.4% of the children. In
contrast, EEG slowing, again especially in frontal regions, was characteristic of the
second subtype (29.8% of the children). The results were not consistent with the
view that children with ADHD show immature EEG patterns, but rather suggest that
ADHD is associated with deviations from normal development.
A third of the children in the ADHD, ADD and ATT groups showed signs of
disturbed interhemispheric function. Interhemispheric power asymmetry was
common, particularly excess right hemisphere power, which was eight times as
common as excess left hemisphere power. Interhemispheric incoherence was
frequently observed too. (Significant incoherence represents decreased
synchronisation of the EEG across cortical regions, relative to the normal
population.) The authors point out that this indicates disturbed cortical-cortical
relationships that are modulated by subcortical interconnection via the thalamus or
basal ganglia or both. Taken together, the findings from this study provide further
55
support for frontal-striatal and corpus callosum dysfunction in ADHD, and implicate
the right hemisphere in particular. The results support models of both hypo- and
hyperarousal of these structures.
1.12 Measurement issues
How best to measure hyperactivity or ADHD depends obviously on whether the aim
is to obtain a clinical diagnosis for an individual child or to study a large population
of children for research purposes. In research studies the approach can either be
categorical or dimensional, or a combination of the two.
Another important issue is who should report on the child's behaviour. As child self-
reports are rather unreliable for ADHD symptomatology (Loeber, Green, Lahey &
Stouthamer-Loeber, 1991), parents and teachers are usually the preferred informants.
Some studies have also used independent observers.
Studies on undercontrolled (externalising) problems have revealed a degree of cross-
informant inconsistency when rating the same child: whereas correlations between
the ratings of two teachers (.74) or two parents (.62) are moderately high,
correlations between the ratings of different types of informants are lower (e.g.
teacher vs parent .32) (Achenbach, McConaughy & Howell, 1987). The meta-
analysis by Achenbach et al. (1987) also showed that consistency between different
raters is higher for ratings of 6-1 1-year-olds than for ratings of adolescents.
Rather than despairing about the modest correlations between different types of
informants, Achecbach et al. (1987) emphasise the need to consider the situation-
specificity of children's behaviour. Teachers and parents, for example, observe a
child's behaviour in very different contexts. As there is no 'gold standard' for
56
hyperactivity, it is best to obtain information about a child's behaviour from several
sources. (See section 3.4.3 for evidence from twin studies regarding possible bias in
ratings by parents and teachers.)
In research studies on hyperactivity and attention deficits, rating scales or
questionnaires are perhaps used more often than any other assessment tools
(Hinshaw, 1994). They are easy to use, tap the child's behaviour in natural settings
and enable comparisons between the reports of different informants. Rating scales
that cover a broad range of childhood problem behaviours can provide a useful
profile of the child's strengths and weaknesses.
Perhaps the most widely used of such broad scales of childhood psychopathology is
the Child Behaviour Checklist, CBCL, (Achenbach, 1991a) and its teacher form, the
TRF (Achenbach, 1991b). The psychometric properties of the Achenbach scales have
been thoroughly investigated and extensive norms exist for the scales. Whilst very
useful for studying aggression and delinquency, their weakness from the viewpoint of
studying hyperactivity-impulsivityis the lack of a clear separate dimension.
The Conners' parent and teacher forms (Goyette, Conners & Ulrich, 1978) provide a
good measure of hyperactivity-impulsivity (Scott, 1996). The revised forms of the
scales are short, containing only 28 and 48 items, which is an obvious advantage
over the rather lengthy Achenbach scales. In studies which involve screening, a
shorter length of questionnaires is probably the easiest method of ensuring as high a
response rate as possible. The revised forms of the Conners' scales should not be
confused with the Conners' Abbreviated Symptom Questionnaire (also known as the
'Hyperkinesis Index'), which contains a mixture of hyperactivity and oppositionality
or aggression items.
Several other rating scales for measuring hyperactivity exist too. For example,
Pelham and colleagues (Peiham, Gnagy, Greenslade & Milich, 1992) transformed the
57
DSM-III-R diagnostic criteria for the disruptive behaviour disorders (ADHD, CD
and ODD) into a rating scale format for teachers.
For diagnostic purposes in particular, interviews with parents or other significant
adults provide more in-depth information than that obtained from rating scales.
Widely used structured interviews for child psychopathology include the Diagnostic
Interview Schedule for Children (DISC; NIMH, 1992) and the Schedule for
Affective Disorders and Schizophrenia for School-aged Children (K-SADS; Puig-
Antich & Chambers, 1978). Observational methods have the advantage of being less
susceptible for rater bias, but they are costly and time-consuming. As a hyperactive
child's behaviour in a clinic is unlikely to be representative of the child's general
behaviour at home or at school (Sleator & Ullmann, 1981), the observations should
ideally be carried out in natural settings. Peer sociometric evaluations may provide
useful additional information about the child's popularity at school, although their
diagnostic value is limited. (Laboratory measures are discussed in chapter two.)
Variations across studies in how hyperactivity has been measured make the
interpretation of the results often a difficult task. Few studies have investigated the
convergence between the questionnaire-based approach and the diagnostic approach.
In studies by Kasius et al. (Kasius, Ferdinand, van den Berg & Verhulst, 1997) and
Biederman et al. (1993), high scores on the Attention problems subscale of the
CBCL strongly predicted DSM-III-R diagnosis of ADHD.
In the present study we used the Revised Parent and Teacher Conners' Rating Scales
as the measures of hyperactivity. This allowed us to focus on the symptoms of
hyperactivity-impulsivity and, as we obtained ratings from both teachers and parents,
allowed us to focus on pervasive hyperactivity; both of these are important
theoretical issues.
58
1.13 Chapter summary
Hyperactivity, or Auention Deficit Hyperactivity Disorder, refers to three types of
behaviour: overactivity, impulsivity and inattentiveness. The prevalence of
hyperactivity is estimated to be between 2% and 7%; it is more common among boys
than girls. Longitudinal studies show that the symptoms of hyperactivity tend to
persist over time. Hyperactivity also frequently co-occurs with other conditions, such
as conduct problems, learning disabilities and anxiety disorders. In addition to the
categorical approach of the psychiatric classification systems, hyperactivity can also
be considered as a continuous dimension. The most common measures of
hyperactivity are rating scales and interviews; parents and teachers are the preferred
informants.
Several studies have investigated whether subgroups exist within hyperactivity. The
distinction between pervasive and situational hyperactivity seems important, and
indeed both the DSM-IV and ICD-1O require pervasiveness of symptoms for the
diagnosis of ADHD or hyperkinetic disorder. Another important distinction is that
between the 'inattentive' subtype and the 'hyperactive-impulsive' or 'combined'
subtypes. Children who show only symptoms of inattentiveness differ from the other
children with hyperactivity or ADHD with regard to several features. (This thesis
focuses on children who show symptoms of hyperactivity and impulsivity.) Because
of the male predominance in hyperactivity, few studies have investigated whether
girls with hyperactivity differ from boys with the condition.
The consensus from research on family-environmental factors is that these 'act' on
pre-disposed vulnerable children, rather than directly cause hyperactivity. There is
less consensus on the effects of diet on hyperactivity. Even if a small subgroup of
hyperactive children exists who respond to a 'few foods' elimination diet, it is
unclear which behaviours show improvement.
59
Neurological studies point to frontal-striatal and possible corpus callosum dysfunction
in hyperactivity. At the neurochemical level, the neurotransmitters of dopamine,
norepinephrine and serotonin have been implicated. These neurological findings link
both to the cognitive/motivational findings (chapter two), as well as to the findings
from molecular genetic studies (chapter three).
60
Chapter 2
Cognitive and task engagement
factors in hyperactivity
This section which focuses on the cognitive and task engagement factors associated
with hyperactivity is unavoidably a selective rather than exhaustive review of the
relevant literature. The amount of research articles published on the topic is
astounding. The main aim in writing this review was to provide an up-to-date
summary of what appears to be the most pertinent issues.
2.1 Attention deficit
2.1.1 Aspects of attention
Despite the deterministic-sounding term attention deficit hyperactivity disorder,
investigators have long questioned whether attention deficit is truly the core
problem in the condition. A definition of attention is a good starting point.
Sergeant and van der Meere (1989) defined attention as 'the rate at which
controlled information processing occurs in human short term memory' (p. 154).
Barkley (1996) referred to attention as 'describing the conditional or functional
relations between environmental events and the behavior of an organism, in this
61
case a person... Attention refers to the relation of behavior to its environment.' (p.
307).
Attention is a multidimensional construct; for example, a distinction can be made
between divided, focused and sustained attention (see Sergeant & van der Meere,
1994). Van der Meere, Sergeant and their colleagues in the Netherlands have
carried out a series of studies to investigate which aspect of attention, if any, is
impaired in hyperactivity. The findings from their research, conducted from an
information processing approach, as well as the findings from other studies, show
that early (encoding) and middle (memory search, decision) stages of information
processing are intact in children with ADHD (see Sergeant & van der Meere,
1994; van der Meere, 1996). This leads to the conclusion that ADHD is not
associated with a divided or a focused attention deficit (together called selective
attention).
2.1.2 A deficit in sustained attention?
The crucial question then is whether children with ADHD show a deficit in
sustained attention, the ability to maintain performance over time. Hyperactive
children's performance on the continuous performance task (CPT) is frequently
cited as evidence for such a deficit.
Several variations of the CPT exist, but in short, the task involves responding to
stimuli (usually letters or digits) that are presented on a computer screen. The child
is asked to respond to target stimuli (e.g. a particular letter or a sequence of two
letters) but to refrain from responding to nontarget stimuli. Several studies have
shown that children with ADHD, compared to controls, commit more commission
(responding to incorrect stimuli) and omission (failing to respond to correct
stimuli) errors on the CPT (for reviews, see Corkum & Siegel, 1993; Losier,
McGrath & Klein, 1996). The meta-analytic review of 26 studies by Losier et al.
62
(1996) also showed that methylphenidate reduces the numbers of commission and
omission errors that children with ADHD make on the task.
Van der Meere and Sergeant (1988) point out, however, that a group difference in
the 'overall' CPT performance is not evidence for a sustained attention deficit. To
demonstrate such a deficit in hyperactive children, there has to be a decline in
performance over time and this decline in performance has to be greater in the
hyperactive than in the control group. The majority of studies have failed to find
evidence for a sustained attention deficit, when properly defined, in children with
ADHD (see van der Meere, 1996). Studies which have employed self-paced paper
and pencil tasks have similarly failed to differentiate between hyperactive and
control children in performance decline over time (van der Meere, Wekking &
Sergeant, 1991).
The picture is somewhat more complex, howevec. In contrast to the majority of
CPT studies which have used a fast presentation rate of stimuli, van der Meere and
his colleagues have carried out studies also using a slow event rate of stimuli.
Twelve boys with ADHD and 12 control boys (mean age 10 years) participated in
a study which also examined the effects of stimulant medication and the
presence/absence of experimenter (van der Meere, Shalev, Borger & Gross-Tsur,
1995). The diagnosis of ADHD was made clinically, using DSM-III-R criteria, and
the children also had to obtain a score of 16 or higher on both teacher and parent
ratings on the Conners' abbreviated questionnaire. The experimental design was a
double-blind placebo crossover. The children were told to respond when the letter
'0', continuously presented in the middle of a computer screen, changed into the
letter 'Q'.
The authors obtained support for their hypothesis that a slow presentation rate of
stimuli elicits a sustained attention deficit in children with ADHD. This was found
whether or not the experimenter was present during task administration, although
the effect was more marked in the experimenter-absent condition. Methylphenidate
63
(MPH) completely erased the sustained attention deficit, as well as slowness of
responding, in the ADHD group.
In a second study the participants were three groups of boys: 13 with ADHD and
conduct disorder, 13 with ADHD only and 13 controls (mean age 10 years) (van
der Meere, Hughes, Borger & Sallee, 1995). Diagnoses were based on DSM-III-R
criteria. The CPT task was the same as in the study described above, with slow
presentation rate of stimuli, but the children performed the task under both reward
and non-reward conditions. Both ADHD groups were on medication: MPH was the
most common medication in the ADHD-only group, whereas the comorbid group
received a variety of medications, including lithium, carbemazepine and tricyclic
antidepressant.
In the non-reward condition only the comorbid group showed a sustained attention
deficit; the ADHD-only group was no different from the control group, which
could be attributed to the effects of MPH (the medication the children in the
comorbid group received may not have had the same effect). Reward had an
immediate effect of improving the performance of boys in the control and ADHD-
only groups. In contrast, the 'ADHD and conduct disorder' group's performance
improved only midway through the task when the reward was increased to one
dollar, although this improvement in performance was short-lived. A limitation of
this study, as it did not include children with ADHD who were free of medication,
is that it is difficult to disentangle the effects of MPH from the effects of rewards
and group status (ADHD with or without conduct disorder).
Taken together, the evidence does not support the assumption that children with
ADHD have a deficit in sustained attention. The findings that factors such as
presentation rate of stimuli, rewards and the presence or absence of experimenter
(see also Draeger, Prior & Sanson, 1986) influence their performance on vigilance
tasks provide clues to alternative interpretations of the results. These are discussed
in later sections of this chapter.
64
In situations where children with ADHD show an apparent sustained attention
deficit, methyiphenidate erases this 'deficit'. A recent study (Levy & Hobbes,
1996) showed that this effect is blocked when MPH is preceded by haloperidol,
suggesting a blockade of dopaminergic mechanisms.
2.2 Response inhibition
2.2.1 Quay's theory
If the core deficit in hyperactivity is not sustained attention, what could it then be?
Many investigators have argued it is an impairment in response inhibition, in the
ability to withhold a prepotent response.
Quay (1988; 1997) proposed a hypothesis of the underlying deficit in ADHD
which was based on Gray's (1982; 1987) theory of brain function. The hypothesis
is that ADHD is due to an underactive behavioural inhibitory system (BIS). The
anatomical location of the BIS is assumed to be in the septo-hippocampal system,
with connections to the frontal cortex. Quay (1997) suggests it receives
noradrenergic inputs from the locus coeruleus and serotonergic inputs from the
raphe nucleus.
With regard to the function of the BIS, it 'responds to conditioned stimuli for
punishment and nonreward as well as novelty and innate fear stimuli, to bring
about passive avoidance and extinction. Its output causes the cessation of ongoing
behaviour, an increase in nonspecific arousal, and a focusing of attention on
relevant environmental cues' (Quay, 1997, p. 8). In a recent update of his theory,
Quay (1997) points out that it does not apply to those children with ADHD who
could be classified as predominantly inattentive type. The empirical evidence cited
in support of his model comes mainly from studies using the stop task paradigm
(see section 2.2.3).
65
The model also attempts to explain the core deficits in two other childhood
disorders - in conduct disorder and anxiety disorders. The hypothesis is that
conduct disorder results from an overactive behavioural activation system (sensitive
to signals of reward), which predominates over the BIS (sensitive to signals of
punishment), and that an overactive BIS explains anxiety disorders.
2.2.2 The race model and the stop task paradigm
Response inhibition could easily remain a vaguely specified term. An explicit
model of response inhibition does, however, exist - it is known as the race model
(see Logan, 1994; Logan & Cowan, 1984). In the race model, stopping
performance depends on the outcome of the race between two processes: the stop
process and the go process. If the stopping process finishes first, the response is
inhibited. If the go process wins (is faster than the stop process), the ongoing
action is completed. Cues, such as an error, which indicate that the current course
of action should be discontinued or changed, trigger the stopping process. The
proportion of trials on which the response will be inhibited depends on the
distributions of finishing times for the stop and go processes and on the delay
between the onsets of the stop and go stimuli.
A laboratory analogue, called the stop signal paradigm, provides an empirical
measure of the ability to interrupt an ongoing response (Logan & Cowan, 1984;
Logan, Cowan & Davis, 1984). The primary task in the stop signal paradigm is a
simple reaction time task: the child responds as fast and accurately as possible to
stimuli presented on a computer screen. On some of the trials an auditory stop
signal is presented, in which case the child should withhold responding.
The stop signals are presented at different intervals and many investigators
compensate for differences in the primary (go) task reaction times by presenting
the stop signals relative to the child's mean reaction time. The longer the delay
between the onset of the primary task stimulus and the onset of the stop signal, the
66
more difficult it becomes to withhold responding. It is common practice to set up
the stop signal delays so that the probability of inhibition is close to 0 with the
longest delay and close to 1 with the shortest delay. Plotting the probability of
inhibition against the stop signal delay generates an 'inhibition function'. The slope
of the inhibition function is calculated by fitting a regression line to the inhibition
functions.
The stop task has several advantages over other measures of inhibition. First, it is
based on an explicit model of the inhibitory process. Second, it allows a distinction
between inhibitory control and the processes involved in the execution of the
primary task. Although successful inhibition of the ongoing action is not
observable, the stop task provides a way to measure stop signal reaction time.
2.2.3 Studies using the stop task
Meta-analysis of studies
Several studies have used the stop task to investigate response inhibition in children
with ADHD. Oosterlaan, Logan and Sergeant (1998) recently carried out a meta-
analysis of studies, conducted between 1990 and 1997, which fulfilled the
following criteria: the study included a control group and one or more of the
groups of interest - ADHD, conduct disorder and anxiety disorder. Eight
independent studies fulfilled these criteria (Aman, Roberts & Pennington, in press;
Daugherty, Quay & Ramos, 1993; Jennings, van der Molen, Pelham, Debski &
Hoza, 1997; Oosterlaan & Sergeant, 1996; Pliszka & Borscherding, unpublished;
Schachar & Logan, 1990; Schachar & Tannock, 1995; Schachar, Tannock, Marriot
& Logan, 1995).
The children who participated in these studies were aged between 6 and 12 years
(N =456 in total). Five of the studies included boys only and the remaining three
studies included children of both sexes. In five of the studies the diagnoses were
67
based on DSM-III-R criteria, with parents or teachers, or both, as informants. In
the remaining three studies the diagnoses were based on: teacher ratings only;
parent, teacher and child ratings (agreement between two informants required); and
parent interview and teacher ratings (ADHD), parent interview only (CD) and
child interview only (anxiety disorders). Four of the studies included only children
with pervasive ADHD.
With one exception (Daugherty et al., 1993) the samples were obtained from
children referred to clinics or special educational services. The children classified
as 'ADHD only' in the meta-analysis indeed included, from most studies, ADHD
children who were free of comorbid ODD/CD symptomatology. The samples from
two of the studies (Oosterlaan & Sergeant, 1996; Pliszka & Borcherding,
unpublished), however, included some children who showed associated 'aggressive
or delinquent' or ODD symptoms, respectively.
The studies differed in terms of the stimuli used (letters X and 0; white squares;
red and green lights). Two of the studies (Schachar & Tannock, 1995; Schachar et
a!., 1995) used a modification of the stop task, known as the change task (De Jong,
Coles & Logan, 1995; Logan & Burke!!, 1986). The change task is similar to the
stop task but has the additional requirement of a response to the stop signal
(pressing a third button). Due to this additiona! feature of response re-engagement,
the change task seems to exert higher cognitive processing demands than the stop
task. For further details of the studies, see Oosterlaan et al. (1998).
The results of the meta-analysis showed that there was a group difference on the
inhibition slope, with children with ADHD having 'flatter' inhibition functions
than the control group. To examine whether this was due to the ADHD group
being less likely to trigger the inhibitory process or to their inhibitory process
being more variable, Oosterlaan et al. (1998) investigated whether the group
difference would disappear after correction for the so-called ZRFT. This
transformation removes the effects of stop signal reaction time and variability of
68
speed on the inhibition function (see Logan, 1994). The meta-analysis showed that
the children with ADHD did not differ significantly from the control children on the
ZRFT-slope. That is, children with ADHD are neither less likely to trigger the
inhibitory process nor is their inhibitory process more variable on the stop task.
Another possible explanation for the flatter inhibition function associated with
ADHD is that it could be due to a slower inhibitory process. The meta-analysis
indeed found a significant group difference on the stop signal reaction time (SSRT;
for an explanation of how this is calculated, see Appendix L), with the ADHD
group being slower than the control group. The children with ADHD were also
slower in their responses on the primary task (the reaction time task). The children
with ADHD therefore seem to differ from other children in the speed of their
responses - both speed on the primary task and, once this has been controlled for,
speed on the stopping task.
The results for the conduct disorder group were less consistent, but led the authors
to conclude that this group was indistinguishable from the ADHD group. As the
children with ADHD, the children with conduct disorder had flatter inhibition
slopes than the control children. There was some suggestion that this could have
resulted from a slow inhibitory process, but as the findings were inconsistent
across studies, this conclusion is, at best, preliminary. (Note that, due to the young
age of the children who participated in these studies, the findings are only relevant
for the CD subgroup called childhood-onset conduct disorder - see chapter four.)
Children with comorbid ADHD and conduct disorder did not seem to differ from
those with ADHD only, but again these findings need to be interpreted with
caution due to the inconsistent findings across studies. Contrary to Quay's
prediction (1988a,b), the anxious group did not show enhanced response inhibition.
Considering the studies included in the meta-analysis individually, the only study
which did not report differences between ADHD and control groups on the slope
of the inhibition function was that by Daugherty et al. (1993). This study differed
69
from the other studies in how the children were selected, as they were chosen from
a general population sample. The slight possibility therefore remains that the stop
task results from the other studies would be an artifact of selection. This is one of
the issues the present study aimed to investigate.
Criticisms of the meta-analysis
Oosterlaan et al. (1998) concluded that the meta-analysis supported the hypothesis
of a response inhibition deficit in ADHD. They based this conclusion on the
finding of a slower inhibitory process in children with ADHD; the groups did not
differ in the likelihood of triggering the inhibitory process or in the variability of
the inhibitory process. It is worth considering the results in some more detail,
however.
When a group difference is found on the inhibition slope on the stop task, there are
three possible explanations for this. Oosterlaan et al. (1998) considered two
possibilities - that the inhibitory process would be slower in children with ADHD,
or that they would be less likely to trigger the inhibitory process or their inhibitory
process would be more variable.
The third possibility is that of greater variability of responding on the primary
task. The authors do not present data in the meta-analysis on the standard
deviations of the primary task reaction times. However, the standard deviations
were greater for the ADHD group (Oosterlaan, personal communication,
November 1997). The conclusion in the meta-analysis that the poorer performance
of children with ADHD on the stop task, compared to control children, relates
only to their slower inhibitory process may be premature. Instead, the data show
that it may be due, not only to their slower inhibitory process, but also to greater
variability of responding on the primary task.
70
This suggestion that the presumed response inhibition deficit in ADHD is due, in
part, to their higher variability in the latency of responding is theoretically
important. One possible interpretation of such a finding is that motivational factors
may be important determinants of ADHD children's performance on the stop task.
In their earlier publication, Oosterlaan and Sergeant (1996) write: 'high variability
in reaction times [could] reflect a lack of motivation or effort on some trials' (p.
33). Rather than supporting the notion of a response inhibition deficit in ADHD,
the results may be more in line with the predictions of other theories, for example
the state-regulation theory (van der Meere, 1996; see section 2.5.2). Oosterlaan et
al. (1998) mention the state-regulation and other theories in their discussion, but
they nevertheless conclude that 'consistent and robust evidence was found for a
response inhibition deficit in AD/HD' (p. 411).
An additional problem with the meta-analysis relates to the selection of the groups
included in the analyses. First, the authors decided to exclude home-only ADHD
and school-only ADHD children from the Schachar et a!. (1995) study. The
authors admit that this was done, in part, 'to maximise the chance of finding group
differences' (Oosterlaan et a!., 1998, p. 413). This does not seem justified, as
children with situational ADHD were included from other studies (i.e.
pervasiveness of the symptoms was not a selection criterion). Second, the authors
excluded those ADHD children from the Jennings et al. (1997) study who did not
show comorbid ODD/CD symptomatology. The reasons for this are not clear,
except that Jennings et al. (1997) did not find group differences between the
ADHD group without codiagnoses and controls. This selective inclusion of groups
is inappropriate, as is inclusion in the ADHD-only group of some children who
showed comorbid aggressive/ODD symptomatology (from two studies: Oosterlaan
& Sergeant, 1996; Pliszka & Borcherding, unpublished). The authors had aimed to
investigate possible differences between ADHD-only, comorbid ADHD and CD
and CD-only groups.
71
Further studies
A recent study by Oosterlaan and Sergeant (1998a) provides further evidence for
this 'new' interpretation of the stop and change task results. Four groups of 8-12-
year-old children participated in the study: 10 children with ADHD, 11 disruptive
children, 11 anxious children and 21 comparison children. With the exception of
the children in the control group, they were recruited from special schools. The
modification of the stop task, the change task, was used in the study.
The children were classified as having ADHD if they obtained: a) a score at or
above the 95th percentile on the CBCL (Child Behaviour Checklist; parent ratings)
Attention Problem scale, and b) a score at or above the 95th percentile on the TRF
(Teacher Report Form) Attention Problem scale or a score above the age-
appropriate cut-off on the IOWA Conners' Teacher Rating Scale Inattention-
Overactivity scale. Similar criteria were used to classify children as disruptive
(showing aggressive and/or delinquent problems) or anxious. The investigators
excluded those children from the study who fulfilled the criteria for more than one
psychopathological group. However, both the ADHD and disruptive groups scored
high on the TRF Aggressive Behaviour scale (indeed the ADHD group scored
slightly higher on this scale than the disruptive group).
The results showed that, compared to the control group, both the ADHD and
disruptive groups had flatter inhibition slopes. As in previous research, the groups
did not differ on the ZRFT-slope. Compared to the control and anxious children,
the children with ADHD had slower inhibitory processes. The disruptive group
was not significantly different either from the ADHD or the control groups in the
speed of the inhibitory process. On the primary task, the ADHD and disruptive
children had more variable reaction times and they were also generally slower and
less accurate than the comparison children. In terms of the response re-engagement
process, both ADHD and disruptive children were more variable in the speed of
their responses and were less accurate than the children in the control group.
72
These findings provide further support for the conclusion that the task performance
of children with ADHD is characterised by slow and inaccurate responding, and
high variability in the speed of responding. As the children with ADHD were more
variable in the speed of their responding and less accurate also on response re-
engagement compared to control children, this shows that the ADHD children's
pattern of responding is not limited to response inhibition tasks.
These same groups of children also participated in another study by Oosterlaan and
Sergeant (1998b), which investigated the effects of reward and response cost on
stop task performance. Several investigators (e.g. Douglas, 1983) have suggested
that the performance of children with ADHD is particularly sensitive to response
contingencies. Both in the reward and response cost conditions, when the children
either won one point for each successful inhibition or lost a point for failing to
inhibit, the children with ADHD showed their 'typical' pattern of responding: they
were slower and more variable in the speed of response execution, and they also
had marginally slower inhibitory processes, compared to the control children. The
task was set up so that all the children inhibited on approximately 50% of the
trials. The authors argue that these results show that the 'response inhibition
deficit' in ADHD is not due to motivational factors.
However, the study was not really a strong test of the effects of rewards and
response costs on the presumed response inhibition deficit in children with ADHD.
First, the investigators did not compare the children's performance on a baseline
(no rewards or response costs) condition to their performance on the reward and
response cost conditions. Rewards or response costs could have improved the
ADHD group's performance more than they improved the control children's
performance. Second, the study was limited by the small sample sizes (only 10
children in the ADHD group). Third, it is unclear to what extent the rewards and
response costs succeeded in motivating the children to perform better on the task.
The children rated their 'motivation to complete the task' on a visual analogue
scale, but no data is reported regarding the validity and reliability of this scale.
73
Factors influencing stop task performance
Neither gender (Daugherty et a!., 1993; Pliszka & Borcherding, unpublished) nor
IQ (Oosterlaan & Sergeant, 1996; Schachar & Logan, 1990; Schachar et al., 1995)
seem to influence children's performance on the stop task. Age also does not seem
to be related to all stop task measures, at least in the 8-12 age range: both Schachar
and Logan (1990) and Oosterlaan and Sergeant (1996) found no significant age-
related differences on the slope of the inhibition function or on error rates. The
latter study also found no developmental effects on the speed of the inhibitory
process, whereas Schachar and Logan (1990) found a moderate negative
correlation between SSRT and age. With regard to the primary task processes,
speed significantly improves with age.
Stimulant medication improves performance on the stop and change tasks
(Tannock, Schachar, Carr, Chajczyk & Logan, 1989; Tannock, Schachar &
Logan, 1995). The Tannock et al. (1995) study was a randomised, double-blind,
placebo-controlled trial which assessed the effects of methylphenidate (MPH) on
change task performance in 28 children with DSM-III-R -based clinical diagnoses
of ADHD. The stimulant medication accelerated the inhibitory process. MPH also
accelerated both the primary- and secondary-task responses and made these less
variable, and improved the children's error rates. Although there were some MPH-
related effects on the inhibition slope, Tannock et at. (1995) showed that these
resulted from the beneficial effects of the medication on the variability of the
primary-task execution process and on the speed of the inhibitory process.
These findings provide further support for the notion that the poorer performance
of children with ADHD on the stop task, compared to controls, relates to the speed
and variability of their primary-task performance and the speed of their inhibitory
process, rather than to their inhibitory process being more variable or being
triggered less often.
74
2.2.4 Response inhibition and brain anatomy
A recent study (Casey et al., 1997) explored the relationship between response
inhibition and brain structures in children with ADHD. The participants were 26
boys with ADHD (mean age = 9.7 years) and 26 control boys matched on age,
weight, height, Tanner stage and handedness. The ADHD diagnoses were based on
DSM-III-R criteria; the information was obtained from both interviews and parent
and teacher ratings. Three tasks involving inhibitory control were used. The first
task assessed inhibition of attention to the sensory attribute just attended, the
second task assessed the ability to select responses to specific stimuli that were
based on compatible or incompatible mappings. The third task required the
children to respond every time they heard a single tone and to refrain from
responding when hearing a double tone.
Confirming the results from previous studies, the boys with ADHD had longer and
more variable reaction times on both control and inhibitory trials than the control
boys. During the inhibitory trials they were also less accurate. The results from the
magnetic resonance imaging (MRI) showed that performance on these tasks
correlated with prefrontal cortex (the inhibitory conditions of the tasks), caudate
nucleus and globus pallidus volumetric measures (both inhibitory and control
conditions), but not with putamen volumetric measures. These findings provide
further support to the authors' previous findings of fronto-striatal involvement in
ADHD (Castellanos et al., 1994, 1996). The MRI-scanning results also showed
that the correlations between task performance and prefrontal and caudate volume
were mainly within the right hemisphere.
These findings implicating right fronto-striatal circuitry in ADHD, though
interesting, are based on rather crude MRI-based anatomical measures of structure
size. As the authors note, the next step would be to carry out studies using
functional imaging techniques which provide information about brain activation.
75
2.2.5 Barkley's theory
Another theory of ADHD which emphasises the role of inhibition is that of
Barkley's (1994; 1997). Barkley criticises other theories and models of ADHD of
being limited in their approach, in that they do not attempt to explain all the
various cognitive deficits these children seem to have. Like the recent revision of
Quay's (1997) theory, Barkley's (1997) most recent revision of his theory does not
refer to the subgroup of ADHD children called predominantly inattentive type.
Unlike investigators in the 'stop task tradition' (e.g. Quay, 1988; Schachar &
Logan, 1990), who focus on momentary inhibition, Barkley emphasises also the
role of ongoing inhibition. Momentary inhibition refers to the ability to suppress a
particular response when it is signalled, whereas ongoing inhibition refers to the
ability to suppress responding over a period of delay (see Sonuga-Barke, 1995, for
a further discussion).
In Barkiey's (1997) theory behavioural inhibition refers to three processes:
inhibition of the initial prepotent response to an event, stopping of an ongoing
response and interference control. The evidence Barkley (1997) cites in support of
an inhibition deficit comes from various sources (see his review for the
references). In terms of their observable behaviour, Barkley (1997) suggests
evidence for an inhibition deficit comes from findings that children with ADHD
talk more than other children and they also make more vocal noises. With regard
to their performance on cognitive tasks, children with ADHD show poorer
performance, compared to controls, on the stop task (as reviewed above) and other
motor inhibition tasks, such as the go no-go paradigm and delayed response tasks.
They are also reported to have some difficulties on, for example, the Wisconsin
Card Sorting Test, which tests response perseveration (see section 2.3.3 below)
and, as discussed earlier in this chapter, make more errors on the CPT. Barkley
(1997) suggests that the findings of children with ADHD performing relatively
poorly on tasks such as the Stroop Colour-Word Interference Test indicate
difficulties with interference control.
76
A weakness of Barkley's theory is the use of the term inhibition deficit at a very
general, descriptive level. The previous sections on sustained attention and stop
task studies showed that finding a difference between ADHD and control groups in
the overall performance tells little about any actual 'deficit'. A more fine-grained
approach is needed to understand the processes involved in task performance.
In contrast to models which only focus on inhibition deficits in ADHD, Barkley's
(1997) model predicts that the core deficit in behavioural inhibition leads to
secondary deficits in four types of executive functions: working memory, self-
regulation of affect-motivation-arousal, internalisation of speech and reconstitution
(behavioural analysis and synthesis). These abilities are called executive functions
because they are 'critical for self-regulation and goal-directed persistence'; they
depend on inhibition for their efficient execution because 'the first executive, self-
regulatory act must be inhibition of responding' (Barkley, 1997, p. 68). (For a
further discussion of executive functions, see section 2.3 below.)
As evidence of working memory deficits in ADHD, Barkley (1997) cites research
showing ADHD children's relative weaknesses in mental arithmetic, repetition of
digit spans, memory for spatial location, memory for finger-pointing or hand-
movement sequences and on tasks such as the Tower of Hanoi and Tower of
London and the freedom from distractibility of the WISC. However, it is very
likely that such tasks tap onto several other mental functions too, apart from
working memory.
The second executive function in the model is the self-regulation of affect-
motivation-arousal. For a discussion of self-regulation of motivationleffort, and of
arousal/activation in ADHD, see section 2.5 below. Little direct evidence exists as
yet for the other two executive functions in the model, internalisation of speech and
reconstitution. Barkley (1997) suggests that some evidence for the latter comes
from studies which show that children with ADHD may be less competent than
77
non-ADHD children on tasks measuring complex language fluency and discourse
organisation.
In the model these four executive functions in turn influence what is labelled motor
control-fluency-syntax (the control of motor behaviour by internally represented
information). Some studies suggest a link between ADHD and fine motor
coordination difficulties. The strongest evidence for a motor control deficit in
ADHD, Barkley (1997) argues, is the research of Sergeant, van der Meere and
their colleagues in the Netherlands. Their research shows that hyperactive
children's difficulties relate to the motor control (output) stage rather than the
earlier stages of information processing.
Although Barkley (1997) is aware that his theory might be criticised of being a
'theory of everything', it is difficult not to make this criticism. If the model's
attempt to provide a comprehensive account of the cognitive deficits in ADHD is
its strength, it could also be the model's weakness. The theory does not provide
specific, easily testable hypotheses regarding the links proposed in the model.
2.3 Executive functions
As reviewed above, the evidence suggests that a deficit in response inhibition may
not be quite enough as an explanation for the core deficit in ADHD. Barkley
(1997) is not alone in suggesting that a more general deficit in executive functions
may be involved. Not everyone agrees that an inhibition deficit would cause the
other executive function impairments, however.
2.3.1 The frontal metaphor
Pennington and Ozonoff (1996) note, in their review of executive function deficits
in childhood disorders, that such research has been guided by the 'frontal
78
metaphor'. This term refers to the idea that an individual may perform like patients
with frontal lobe damage on a neuropsychological test battery, although there may
not be any evidence of frontal lobe damage in this individual.
The role of the prefrontal cortices in human cognition has been the subject of much
debate. Pennington and Ozonoff (1996) argue for a more central and pervasive role
than is often acknowledged. The current view is that the frontal lobes are important
for the 'executive' or 'supervisory' aspects of task performance which is involved
in goal-directed behaviour. They may also be important for 'fluid' intelligence, the
aspect of intelligence which is seen as 'innate', as opposed to accumulated
information or 'crystallised' intelligence (Pennington & Ozonoff, 1996).
Welsh and Pennington (1988, pp. 201-202) defined executive function as
"the ability to maintain an appropriate problem-solving set for attainment of a
future goal (Bianchi, 1922; Luria, 1966). This set can involve one or more of
the following: (a) an intention to inhibit a response or to defer it to a later
more appropriate time, (b) a strategic plan of action sequences, and (c) a
mental representation of the task, including the relevant stimulus information
encoded into memory and the desired future goal-state. In cognitive
psychology, the concept of executive function is closely related to the notion of
a limited-capacity central processing system."
The following is a list of abilities frequently subsumed under the heading executive
function (EF): set-shifting and set maintenance, interference control, inhibition,
integration across space and time, planning and working memory. Several
investigators have argued that in fact only two of the components are crucial for
understanding what various EF tasks have in common: inhibition and working
memory (e.g. Cohen & Servan-Schreiber, 1992; Goidman-Rakic, 1987a,b;
Roberts, Hager & Heron, 1994).
79
Pennington and Ozonoff (1996) argue that the correspondence between prefrontal
lesions and EF deficits is convincing. However, it is undoubtedly not perfect:
damage to brain systems such as basal ganglia, which have close connections to the
frontal lobes, can also cause EF deficits (see Pennington & Ozonoff, 1996).
Performance on EF tasks shows developmental effects, but the age at which
children achieve adult-level performance varies across measures (Levin et al.,
1991; Welsh, Pennington & Groisser, 1991). On some tasks (e.g. 3-disk Tower of
Hanoi) the performance of children as young as 6 years is indistinguishable from
adults, whereas on other tasks (e.g. verbal fluency efficiency) performance
continues to improve into adolescence.
2.3.2 Working memory
Instead of the two-factor (inhibition and working memory) model of EF,
Pennington and colleagues (Pennington, Bennetto, McAleer & Roberts, 1996) now
argue for a single-factor construct. In this model, working memory is seen as the
critical factor that underlies performance on EF tasks. Inhibition is seen as intrinsic
to the operation of the working memory. Computer simulations provide some
support for this view (see, for example, Kimberg & Farah, 1993). Pennington
(1994) refers to working memory as 'a limited capacity computational arena' (p.
248). Working memory maintains representations of past, present and future
briefly over time, 'in a common system so they can interact' (p. 248). It is future
oriented and transient.
This working memory model of EF emphasises the reciprocal connections between
the prefrontal cortex and other parts of the brain. Arousal also plays a part in the
model: too high or too low levels of arousal can have an adverse effect on the
working memory system. Pennington et al. (1996) point out that dopaminergic
fibers, which originate in brain stem nuclei, seem to modulate the arousal level of
the prefrontal cortex.
80
Using PET scanning, Gold and colleagues (Gold, Faith Berman, Randolph,
Goldberg & Weinberger, 1996) validated a novel working memory task as a
prefrontal task. They developed a hybrid computerised version of the delayed
response and delayed alternation paradigms. Although patients with frontal lesions
have been shown to perform poorly on these tasks (Freedman & Oscar-Berman,
1986), Gold et al. (1996) argue that the processing demands of these paradigms
may not be 'high enough' for humans.
In the hybrid task, which the authors called the delayed response alternation (DRA)
task, two boxes, one coloured and the other uncoloured, are first presented on the
screen for one second. After a two-second presentation of an empty screen, two
uncoloured boxes appear on the screen and the subject has to choose one of these
boxes. The computer gives feedback as to whether the choice was correct or
incorrect after each choice. The task for the subject is to find out the rule that the
computer uses to decide which box is the correct one each time. The rule involves
choosing the coloured and the uncoloured box (whatever side they appear on) on
alternate trials.
With a sample of 18 adults, Gold et al. (1996) found that during initial task
performance there were significant activations in a network of frontal, parietal,
occipital and temporal regions. Half of the participants subsequently performed the
task again, after a training session. The purpose of the training session was to
ensure that the participants knew the rule and could respond correctly. The
activations which were observed during the second task performance were similar
to those observed during the initial task performance, although they were of a
lesser magnitude. These results support the notion that frontal lobes contribute to
performance on working memory tasks.
Like other executive function measures, working memory tasks show
developmental effects. For example, studies report developmental increases on the
counting span and sentence span tasks. In the sentence span task the tester reads
out sentences to the subject who has to supply the missing last word in each
81
sentence. In the end of each set, the child is asked to repeat all the words that he or
she had supplied, in the correct order. The counting span task is similar to the
sentence span task, except that the child is asked to count yellow dots on cards
rather than to supply words.
In a study with 1266 individuals between the ages of 6 and 49 years, Siegel (1994)
found that performance on the sentence span task improved up to the age of 19
years, gradually declining thereafter. Case, Kurland and Goldberg (1982) similarly
found developmental increases on the counting span task between the ages of 6 and
12 years. Case et al. (1982) concluded that with development processing speed
increases and processing becomes more efficient, which then results in more
processing space becoming available for storage.
2.3.3 Executive functions and ADHD
Pennington and Ozonoff's review
The idea that individuals with ADHD would show deficits on executive function
measures seems, at first sight, appealing. Research suggests a link between frontal
lesions and hyperactive, distractible or impulsive types of behaviours, both in
humans and in animals (e.g. Fuster, 1989; Levin, Eisenberg & Benton, 1991;
Stuss & Benson, 1986).
Pennington and Ozonoff (1996) put forward one possible theory of brain
mechanisms in ADHD:
"The executive function deficit of ADHD children is caused by functional
hypofrontality, which in turn is caused by either structural and/or biochemical
changes in the prefrontal lobes, and is detectable as reduced frontal blood
flow. Biochemically, the cause would be low dopamine levels, which Ritalin
treatment reverses, at least in part. " (p. 63)
82
Such a hypothesis may in fact reflect an oversimplification, as was discussed in the
section on neurological aspects in hyperactivity (chapter one). Nevertheless, this
does not undermine the plausibility of the EF hypothesis. The research evidence
does implicate the frontal lobes, as well as dopamine, in hyperactivity, even if
other brain structures and neurotransmitters seem to be involved too.
What is then the evidence for an executive function deficit in children with
ADHD? Pennington and Ozonoff (1996) reviewed studies which fulfilled the
following criteria: (1) an explicit test of the frontal hypothesis of ADHD using
cognitive measures; and/or (2) use of commonly-accepted EF measures in a study
of ADHD; and (3) publication in a refereed journal; and (4) inclusion of a control
group.
The following studies were included in the review: Arnan, Roberts & Pennington
(in press); Boucugnani & Jones, 1989; Breen, 1989; Chelune, Ferguson, Koon &
Dickey, 1986; Cohen, Weiss & Minde, 1972; Dykman & Ackerman, 1991;
Fischer, Barkley, Edelbrock & Smallish, 1990; Gorenstein, Mammato & Sandy,
1989; Grodzinsky & Diamond, 1992; Hopkins, Perlman, Hechtman & Weiss,
1979; Korkman & Pesonen, 1994; Loge, Staton & Beatty, 1990; McGee,
Williams, Moffitt & Anderson, 1989; Pennington, Groisser & Welsh, 1993;
Robins, 1992; Shue & Douglas, 1992; Trommer, Hoeppner, Lorber & Armstrong,
1988; and Weyandt & Willis, 1994. In the majority of the studies the ADHD
group was ascertained from a clinic. The exceptions were five studies in which the
ADHD group was obtained from schools and one study which consisted of a
population sample of ADHD children. The ages of the children participating in the
studies varied widely, from 6 to 24 years.
Out of the 18 studies, 15 studies found a significant group difference on one or
more EF measures between ADHD and control children. Looking at the results
from another perspective, 40 (67%) out of 60 different EF measures showed worse
performance in the ADHD group. To compare the sensitivity of the various
83
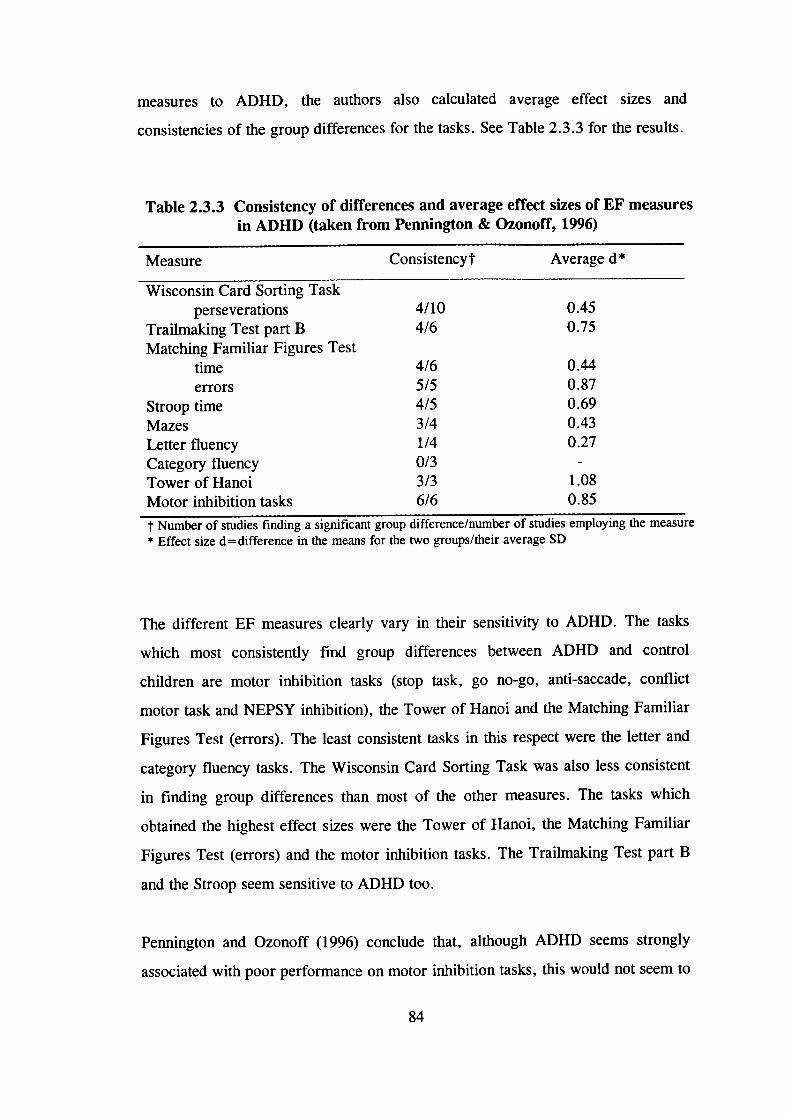
measures to ADHD, the authors also calculated average effect sizes and
consistencies of the group differences for the tasks. See Table 2.3.3 for the results.
Table 2.3.3 Consistency of differences and average effect sizes of EF measuresin ADHD (taken from Pennington & Ozonoff, 1996)
Measure Consistencyt Average d*
Wisconsin Card Sorting Taskperseverations 4/10 0.45
Trailmaking Test part B 4/6 0.75
Matching Familiar Figures Testtime 4/6 0.44
errors 5/5 0.87
Stroop time 4/5 0.69
Mazes 3/4 0.43
Letter fluency 1/4 0.27
Category fluency 0/3 -Tower of Hanoi 3/3 1.08
Motor inhibition tasks 6/6 0.85
t Number of studies fmding a significant group difference/number of studies employing the measure* Effect size d = difference in the means for the two groups/their average SD
The different EF measures clearly vary in their sensitivity to ADHD. The tasks
which most consistently find group differences between ADHD and control
children are motor inhibition tasks (stop task, go no-go, anti-saccade, conflict
motor task and NEPSY inhibition), the Tower of Hanoi and the Matching Familiar
Figures Test (errors). The least consistent tasks in this respect were the letter and
category fluency tasks. The Wisconsin Card Sorting Task was also less consistent
in finding group differences than most of the other measures. The tasks which
obtained the highest effect sizes were the Tower of Hanoi, the Matching Familiar
Figures Test (errors) and the motor inhibition tasks. The Trailmaking Test part B
and the Stroop seem sensitive to ADHD too.
Pennington and Ozonoff (1996) conclude that, although ADHD seems strongly
associated with poor perfonnance on motor inhibition tasks, this would not seem to
84
be the exclusive area of difficulty. Two of the studies included in the review found
significant group differences between controls and children with ADHD also on
working memory measures (see below).
The majority of the studies included in the review used non-EF measures in
addition to the EF measures. Most of these tasks (65%) did not find differences
between ADHD and control children. Verbal and visuo-spatial measures were
particularly unlikely to find group differences. In contrast, measures of vigilance
(Gordon Diagnostic System) and perceptual speed (coding and symbol digit)
showed poorer performance in the ADHD group.
The authors point out that potential confounding variables, such as age, sex, IQ,
SES, ethnicity or comorbid reading disability or conduct disorder, cannot explain
the findings. The studies which carefully matched ADHD and control groups still
found differences on the EF measures. However, they note that the possibility of
the results being an artifact of selection cannot be completely ruled out. The
children with ADHD in all studies except one consisted of referred samples from
clinics and schools. The only study which had a population sample of ADHD
children (McGee et a!., 1989) did not find the presumed EF deficit.
The idea that ADHD may be a rather heterogeneous disorder receives support from
the studies, included in the review, which used discriminant function analysis to
investigate how accurately EF measures would classify ADHD children. The
sensitivity (confirming ADHD in those classified as having the disorder) of the
tasks seemed to be lower than their specificity (excluding control children from the
ADHD category). These results suggest that, although the majority of children
with ADHD show poor performance on EF tasks, a noticeable minority of them do
not. There are several possible explanations for this finding. For example, the 'EF
deficit' might be so subtle in some of the ADHD children that the EF tasks would
not detect it. Alternatively, some ADHD children could show the behavioural
symptoms of the disorder, but the underlying cause could be different and the
85
children would not have the same cognitive deficit as the majority of the ADHD
children.
Could the findings be due to the EF tasks, which find group differences, being
more complex or more difficult than the tasks not finding group differences? A
proper test of this would compare the children's perfonnance on two versions, an
EF and a non-EF version, of the same task. Three studies of those included in the
review used such a within-task design (Aman et al., in press; Gorenstein et a!.,
1989; Shue & Douglas, 1992). The findings from these studies led Pennington and
Ozonoff (1996) to conclude that 'more rigorous tests of a differential deficit do not
strongly support [the EF] hypothesis, and it may be that ADHD children have a
mix of specific and general deficits: a core deficit, perhaps in motor inhibition, and
some general cognitive inefficiency' (p. 65).
Studies on working memory
The two studies included in Pennington and Ozonoffs review, which found a
significant difference between ADHD and control groups on a working memory
measure, were those of Gorenstein et al. (1989) and Shue and Douglas (1992). In
the Gorenstein et al. (1989) study, the children in the 'Inattentive-Overactive'
group (N =21) had been referred for disruptive behaviour problems and they also
had to obtain a score of 7 or above on the Inattention-Overactivity subscale of the
IOWA Conners' Teachers' Rating Scale. The children in the control group (N = 26)
were from ordinary classrooms of the same school. All the children were aged
between 8 and 12 years.
The working memory measure was the sequential matching memory task. In this
task the tester shows the child cards, one by one, each of which has either a minus
or a plus sign on them. When the tester presents each card, the child has to say the
sign which had appeared on the card which the tester had shown two cards prior to
86
the present card. The children in the Inattentive-Overactive group made more
errors on this task than the control children.
In the study by Shue and Douglas (1992), the ADHD group consisted of 24
children, aged between 8 and 12 years, who met both the DSM-III diagnostic
criteria for ADDH and the DSM-III-R criteria for ADHD. In addition, they had to
receive ratings of 1.5 or greater on the Hyperactivity Index of both the Revised
Conners' Teacher and Parent Scales. The control group consisted of 24 children
who were matched on sex, age and IQ.
The working memory measure, the self-ordered pointing task, involved showing
the children large cards with pictures on them. The pictures in each set were the
same, but the spatial arrangement of the pictures varied randomly. The children
had to touch one picture on each card, but a different one on all subsequent cards.
They were not allowed to repeatedly touch the picture in the same location. The
task began with a 6-item set and progressed to a 12-item set. When the pictures
were representational, children with ADHD made more errors and broke the rule
more often than control children. For abstract pictures, there were no significant
group differences - both the ADHD and control children found the task difficult,
making a high number of errors.
Siegel and Ryan (1989) reported, however, no differences on most comparisons
between children with and without ADD on two working memory measures: the
sentence and counting span tasks, which were described in section 2.3.2 above.
The children were included in the ADD group if they obtained a score two
standard deviations above the mean on the Conners' Parent Questionnaire and if
teachers, parents and/or physicians had reported them having behaviour problems.
There were 15 children in the ADD group and 74 in the control group; they were
aged between 7 and 13 years. The only comparison on which children with ADD
performed worse than the control children was that for the younger age group (7-8-
year-olds) on the sentence span task.
87
Stimulant medication may have positive effects on the performance of children with
ADHD on working memory measures. Tannock, Ickowicz and Schachar (1995)
found that methyiphenidate improved working memory in nonanxious children with
ADHD, but not in the ADHD group who had comorbid anxiety.
In sum, the studies on hyperactive children's performance on working memory
measures have obtained conflicting results. It was one of the aims of the present
study to investigate this further, by including three different working memory
measures in the test battery. Pennington (personal communication, 1996) is also
currently carrying out research on working memory performance in children with
ADHD and other disorders. Interestingly, Pennington (1994) argues that the
underlying deficits in working memory explain the association between ADHD and
slightly lower IQ scores. That is, the argument is that working memory and
intelligence are partially overlapping constructs.
Other studies on executive functions in ADHD
A few studies investigating ADHD children's performance on EF tasks have been
published recently which were not included in Pennington and Ozonoff's (1996)
review. Mariam and Barkley (1997) compared the performance of 34 boys with
ADHD and 30 control boys on a range of EF and non-EF tasks. This is one of the
few studies focusing on preschool children - the boys were aged 4 and 5 years. The
ADHD group consisted of clinic-referred boys who had been diagnosed using
DSM-III-R criteria. An additional requirement was that they had to obtain a score
of at least 1.5 standard deviations above the mean on the Impulsive-Hyperactive
factor on either the Teacher or Parent Conners' Rating Scale.
Owing to the large number of dependent (response) variables, the authors
performed a factor analysis on the data. The results suggested that the ADHD
group showed deficits on 'motor control' and 'working memory-persistence', but
not on 'verbal learning-memory' or 'picture identification-factual knowledge'. As
88
the tasks included in each dimension are quite diverse, these findings are rather
difficult to interpret. This is especially true for the dimension called working
memory-persistence, the authors noting that 'its validity and content are in need of
more research' (p. 122). With respect to the EF-type tasks, there was a significant
group difference on the Porteus Mazes but not on MFFT latency or errors or on
colour forms - errors (this latter task is similar to the Trailmaking Test).
Carte, Nigg and Hinshaw (1996) similarly found that boys diagnosed with ADHD
(N=51), aged 6 to 12 years, performed worse than comparison boys (N=31) on
the Porteus Mazes. On the Rey-Osterreith Complex Figure Task there was no
significant difference between the groups.
Other studies have failed to fmd any group differences between ADHD and control
children. Seidman et al. (1997) reported that their sample of 43 girls with ADHD,
aged 6 to 17 years, did not differ significantly from the comparison girls on EF
tasks (the Stroop test, the Wisconsin Card Sorting Test and the Rey-Osterreith
Complex Figure Task). A serious limitation of this study is that 84% of the girls in
the ADHD group were on stimulant medication. In this light their conclusion that
girls with ADHD might be less vulnerable than boys with the condition to EF
deficits does not seem justified.
Närhi and Ahonen (1995) compared the performance of 17 boys with 'pure'
ADHD (without comorbid reading disability), 25 boys with ADHD and comorbid
reading disability, 21 boys with 'pure' reading disability and 10 control boys.
There were no significant differences between the groups on an executive function
score which was based on performance on the Wisconsin Card Sorting Test and the
trailmaking test part B. The children were classified as having ADHD if they
obtained a score of 18 or more on the Attention scale of the Teacher Report Form.
Like the studies included in Pennington and Ozonoff's (1996) review, these studies
show that, although some EF tasks rather consistently find group differences
89
between children with and without ADHD, such results are not always replicated.
Differences between studies, for example in the selection of subjects, may account
for the inconsistencies across studies.
2.3.4 Criticisms of research on executive functions
In general, the research literature on executive functions is frequently criticised of
vague definitions and imprecise measures. It undoubtedly reflects how little we
know as yet about this area of cognition. For many of the existing EF measures it
is difficult to know which aspects of EF, and perhaps which aspects of non-EF
functioning, they tap onto. For example, performance on the Tower of Hanoi may
to some extent reflect spatial cognitive abilities (Pennington & Ozonoff, 1996).
Another issue is the discriminant validity problem: EF deficits are not only
observed in ADHD but also in other disorders, such as autism. There is some
evidence for differences in EF profiles and severity of the deficits, however (see
Pennington & Ozonoff, 1996). At the level of brain mechanisms, Pennington and
Ozonoff (1996) list six different possibilities of how different brain changes across
disorders can all lead to EF deficits.
First, different disorders may differ in the severity of a change in brain
development which causes EF deficits. Second, the timing of the change in brain
development could lead to different disorders which, nonetheless, all share EF
deficits. Third, different areas of the prefrontal cortex could be involved. Fourth,
the brain changes that cause EF deficits could also take place outside the prefrontal
cortex in areas closely connected to it (e.g. the basal ganglia, the limbic system,
the thalamus and posterior cortex). Thus, different disorders could be due to
localised brain changes in different areas, either within the prefrontal cortex or in
structures closely connected to it. Fifth, each disorder could involve brain changes
in two areas, one of which would cause EF deficits and the other the behavioural
symptoms specific to the disorder. Finally, instead of localised brain changes, the
90
changes could be diffuse - either structural or metabolic. At present, these remain
hypothetical possibilities.
2.4 Delay aversion
2.4.1 Performance on the MFFT - delay aversion?
Sonuga-Barke and his colleagues have carried out a systematic series of studies on
hyperactivity, the results of which challenge the notion that the core deficit would
be one of response inhibition or a more general executive function deficit. By
manipulating variables which influence task performance, they have obtained
evidence in favour of an alternative hypothesis: hyperactive children could be delay
averse.
The Matching Familiar Figures Test (MFFT) is one of the EF measures which
Pennington and Ozonoff (1996) identified as sensitive to ADHD. Sonuga-Barke,
Houlberg and Hall (1994) carried out a study investigating whether hyperactive
children's poorer performance on this task could in fact be due to them simply
trying to finish the task more quickly. The children who took part in the study
were recruited from schools. The hyperactive group consisted of nine children,
aged between 8 and 12 years, who scored 3 or more on the hyperactivity factors on
both Rutter's teacher (B2) and parent (A2) scales. The nine children in the control
group were matched for age and intellectual ability.
All the children performed the task under two conditions: a standard condition and
a revised condition. In the standard condition, the children had to select the target
from amongst the foils, continuing to select the next choice until they made a
correct response. The stimuli then disappeared from the screen and the next trial
was presented immediately. In the revised condition the children were told that,
91
however quickly they identified the target, each trial would last 45 seconds. In
most cases this meant that there was a delay period before the next trial began.
The standard condition replicated the result from previous studies: hyperactive
children responded more quickly than control children and they also made more
errors. In the revised condition the group difference for speed of responding
disappeared. One possible explanation for this finding is that hyperactive children
are not 'impulsive' in the sense that they would not be able to wait, but rather they
don 't want to wait - they are delay averse. If faster responding does not reduce the
overall session length, hyperactive children can wait.
The finding which makes the results harder to interpret is that the hyperactive
group still made more errors than the control group in the revised condition.
Sonuga-Barke et al. (1994) suggest that this could be due to them not being
motivated to reduce errors as such. It is possible that the hyperactive children were
attempting to maximise the level of stimulation (see section 2.5 below) or to reduce
the perceived length of the session by spending the 'extra' time off-task. This
would result in them making more errors than the children in the control group.
These findings still do not rule out the alternative explanation that the hyperactive
children were unable to use the extra time associated with slower responding to
reduce the number of errors made.
In a subsequent study Sonuga-Barke and colleagues (Sonuga-Barke, Williams, Hall
& Saxton, 1996) investigated further the group difference between hyperactive and
control children on the number of errors on the MFFT. They explored the
possibility that the group difference would disappear when each error would lead
to a delay period before the next trial. Ten children with pervasive hyperactivity
and ten control children took part in the study. The children were selected as in the
study above and they were aged between 8 and 12 years. The first of the two task
conditions was similar to the standard condition in the earlier study, with one
exception: the children were given only one chance at identifying the target. In the
92

second condition, incorrect responses led to a fixed trial length of 45 seconds,
whereas a correct response led immediately to the next trial.
The standard condition again replicated the finding that children in the hyperactive
group gave shorter latencies and made more errors than children in the control
group. In the second condition the group difference on speed of responding
disappeared. Contrary to the prediction, and despite a significant drop in error
rates from the first to the second condition, hyperactive children still made more
errors than control children in the second condition. This was because the number
or errors made decreased in the control group too. Hyperactive children did not
seem to be able to use the 'extra' time as efficiently as control children. Sonuga-
Barke et al. (1996) suggest several possible explanations for this finding. For
example, the inability to use time efficiently could be a developmental consequence
of delay aversion. Because of their aversion to delay, hyperactive children may not
have learned the strategies needed to use time efficiently in such learning
situations. Alternatively, this inability to use time efficiently could cause delay
aversion. Difficulties in processing temporal stimuli could mean that tasks
involving delay would be particularly difficult, which could then make such
situations aversive.
2.4.2 An inhibition deficit, maximising rewards or delay aversion?
Sonuga-Barke, Taylor, Sembi and Smith (1992) carried out two studies to
explicitly contrast the predictions of an inhibition deficit/impulsivity, reward
maximising and delay aversion hypotheses. The participants in the first study were
31 boys, aged 6 and 7 years: 15 boys with pervasive hyperactivity (chosen as in
the studies above) and 16 control boys. All children who scored 5 or higher on the
emotional disorder subscales on either of the questionnaires were excluded from
the study.
93
The task was a computer task in which the children had to choose, by pressing the
appropriate button, either a small reward (1 point) or a large reward (2 points). In
the no post delay condition, if the children chose the small reward, they received it
after 2 seconds. If they chose the large reward, they received it after 30 seconds.
Whichever reward they chose, the children could make another choice immediately
after receiving the previous reward. In the post delay condition choosing the small
reward led to a delay period of 30 seconds and choosing the large reward to a
delay period of 2 seconds before the next trial. In both conditions the game stopped
when the child had scored 30 points. The child then received a prize of 20 pence.
In the no post delay condition the best strategy was to consistently choose the small
reward; in the post delay condition it was obviously to choose the larger one.
The results did not support the 'impulsivity' hypothesis: hyperactive children
waited as well as control children for the larger reward when it was the most
efficient strategy (the post delay condition). They were not simply attempting to
minimise levels of pre-reward delay. The groups were also indistinguishable in the
no post delay condition: both groups of children preferred the smaller reward. Two
explanations could account for these findings. First, hyperactive children could be
reward maximisers, using the strategy which brings the greatest number of rewards
overall. The second possible explanation is that of delay aversion: the levels of
overall delay would determine the choices hyperactive children make. They would
only give preference to an immediate reward if it reduced the overall delay period.
The second study contrasted these two competing hypotheses. The participants
were the same children as in the first study, except for four hyperactive boys who
were unable to take part in this second study. The basic task was the same as in the
first study, with a pre-reward delay of 2 seconds for the small reward and 30
seconds for the large reward and no post-reward delay. However, now the
investigators contrasted two different conditions. In the time constraint condition
the children had 10 minutes to continue to choose between the small immediate and
the large delayed reward. The best strategy would be consistently to choose the
94
small reward. In the trials constraint condition the children could make a choice
between the rewards 20 times, in which case choosing the large reward 20 times
would be the best strategy. For each point earned, the children received 1 penny.
Both groups of children preferred the small immediate reward in the time
constraint condition. The hyperactive boys differed from the control boys only in
the trials constraint condition, choosing the larger reward less often. These results
suggest that hyperactive children are delay averse rather than reward maximisers.
In the trials constraint condition they earned less money than control boys, as they
were less willing to wait for the large delayed reward. However, as the hyperactive
children had also conduct problems, it was not possible to investigate whether
hyperactivity per se is associated with delay aversion, independent of co-occurring
conduct problems.
Schweitzer and Sulzer-Azanoff (1995) also studied the preference for smaller
immediate versus larger delayed rewards in 5- and 6-year-old boys with ADHD
(N=10) and control boys (N =8). The diagnosis of ADHD was based on DSM-III-
R criteria and on ratings on questionnaires. Six of the children with ADHD
received an additional diagnosis of oppositional defiant disorder. The task involved
the children making a choice between a small immediate reward (one nickel) and a
large delayed reward (three nickels), which was delivered after a 16 second delay.
Choosing the small reward resulted in a post-reward delay of either 12 seconds or
20 seconds. On average, therefore, the overall delay period was the same for the
small and large rewards.
Under these conditions, the boys with ADHD chose the large delayed reward less
often than the control boys. Schweitzer and Sulzer-Azanoff (1995) concluded that
this study failed to support the delay aversion hypothesis. Sonuga-Barke (1996a),
in a reply to the authors, suggests that the pattern of choices the children with
ADHD made shows indifference between the two choices: instead of preferring the
larger reward, they showed no preference. An alternative explanation for the
95
results relates to the fact that the delay period after the small reward was not
constant (it was either 12 or 20 seconds, averaging at 16 seconds). This
'unpredictable' delay period could have led the children with ADHD to 'try their
luck' with the small reward, as this choice might have led to a shorter delay
period.
2.4.3 Further evidence of delay aversion
Sonuga-Barke and his colleagues have also carried out other studies which provide
further support for the delay aversion hypothesis. In a study with 6-8-year-old
hyperactive girls (Sonuga-Barke, Taylor and Heptinstall, 1992), hyperactivity was
associated with poorer performance on a recognition memory task, but only when
the girls set their own limits on presentation time (they chose shorter presentation
times). When the presentation time was fixed, the hyperactive girls performed as
well as the control girls. This pattern of results was observed in the hyperactive
and comorbid hyperactive and conduct problem groups, but not in the conduct
problem -only group. The delay aversion hypothesis would suggest that, in the
self-imposed presentation condition, the hyperactive girls were unwilling to sustain
their inspection, as they were attempting to minimise any delay.
In another study (Sonuga-Barke & Taylor, 1992) the task for the children was to
focus on a stimulus on a computer screen and to respond as quickly as possible to
the disappearance of the stimulus. Control children performed equally well under
different pre-response delays. Hyperactive children, in contrast, were sensitive to
pre-reward delays: their reaction times were slower with longer delays. Sonuga-
Barke and Taylor (1992) suggest that this shows how a difficulty with tasks
incorporating delays can sometimes manifest as a sustained auention deficit.
All of this evidence suggests that the cognitive 'deficits' hyperactive children are
thought to show could in fact be more motivational in nature: they could be due to
an aversion to delay. Sonuga-Barke (1994) suggests that the delay aversion
hypothesis could not only explain hyperactive children's impulsivity, but also their
96
inattentiveness and overactivity. In situations where a delay cannot be avoided,
hyperactive children may tend to focus on aspects of the environment which reduce
the subjective experience of delay. This could explain why these children appear
inattentive. Another strategy to reduce the subjective experience of delay would be
to increase the level of stimulation by fidgeting and moving around.
Descriptions of hyperactive children's behaviour during a testing session illuminate
this. Mischel (1983, quoted in Sonuga-Barke, 1994) describes how some children
in their study 'converted the aversive waiting situation into a non-aversive waiting
situation... [by using] elaborate self distraction techniques through which they
spent their time doing almost anything but waiting' (p. 152). Similarly, Schweitzer
and Sulzer-Azaroff (1995) observed that 'children with ADHD frequently dived
under the table that held the apparatus, danced while watching their reflection in
the observation window; and twirled in their chairs. The typical children, however,
sat in their chairs waiting for each trial to begin.' (p. 682).
The delay aversion theory differs from most theories of hyperactivity in that it does
not consider hyperactive children to have a deficit as such. Sonuga-Barke (1994) is
critical of the research tradition which considers difficult behaviours certain groups
of children exhibit as evidence of psychological dysfunction. The alternative
approach is to consider whether these children simply have aims (e.g. avoiding
delay) which differ from the aims of the majority of children.
2.5 Theories of state-regulation dysfunction
The delay aversion theory is not the only theory of hyperactivity which, instead of
focusing on cognitive deficits, emphasises more motivational, or state-related (see
below), aspects of task performance. The term 'task engagement factors' in the
title of this chapter refers to such factors. This is not a new trend in hyperactivity
97
research either: Barkley, for example, gave a more central role to motivational
factors in his earlier publications (e.g. Barkley, 1989).
2.5.1 The optimal stimulation theory
Zentall and Zentall (1983) suggested that a state of underarousal underlies
hyperactivity. The effects of stimulants and extraneous distraction, and the
sensation seeking behaviours, could be seen as helping to normalise hyperactive
children's levels of arousal. In support of the theory, Zentall and Zentall (1983)
cite research suggesting that hyperactive children are indistinguishable from control
children in relatively high-stimulation settings (e.g. novel, game or playground
settings). There is also evidence supporting the idea that reduced levels of
environmental stimulation or reduced task novelty can increase overactivity and
inattentiveness in hyperactive children, whereas increased external stimulation can
improve their behaviour (see Zentall & Zentall, 1983).
2.5.2 The state-regulation theory
Van der Meere 'S approach
Van der Meere (1996) criticises the 'unitary state' concept of arousal. Based on the
work of several investigators, he and his colleague Sergeant (e.g. Sergeant & van
der Meere, 1990a,b) argue for a multi-state model. First, a distinction between
arousal and activation seems important. With regard to neurotransmitters, the
important ones in the arousal system are noradrenaline and serotonin, whereas the
primary neurotransmitters in the activation system are dopamine and acetylcholine
(Tucker & Williamson, 1984). The two systems are also located in different parts
of the brain: arousal in the fronto-limbic forebrain and activation in the basal
ganglia (Pribram & McGuinness, 1975). Different medications affect the two
systems, for example barbiturates affecting arousal and amphetamine affecting
activation (see van der Meere, 1996).
98
Another addition to the model is a third energetic system, the effort system. In
Sander's (1983) model an evaluation system controls the effort system and 'scans'
the individual's arousal and activation state. If the arousal level is non-optimal, the
effort system can compensate for this. The hippocampus is postulated as the
location of this system. Van der Meere (1996) argues that motivational factors,
such as knowledge of results, absence-presence of the experimenter and pay-off,
influence the effort mechanism.
How does this model explain the task performance of hyperactive children? The
evidence from information processing studies suggests that the deficit hyperactive
children show relates to the motor processing stage rather than the earlier stages of
information processing. Instead of showing a pattern of fast-inaccurate responding,
however, hyperactive children show a pattern of slow-inaccurate responding. Van
der Meere (1996) argues that what appears to be a motor processing deficit could
in fact involve an activation/effort dysfUnction: 'the engine is intact (i.e. the basic
information processing capacity is intact), but there is a problem with the supply of
petrol (i.e. the utilisation of the cognitive capacity depends on state factors such as
incentives, event rate and presence/absence of the experimenter, etc.)' (p. 133).
Some of the evidence in support of the state-regulation hypothesis has been
reviewed in earlier sections (e.g. the CPT-studies). Evidence from studies on
reorienting and dual task performance shows that hyperactive children have no
problems switching from one course of action to another. Studies using
psychophysiological measures, such as evoked potentials, provide further support
for the theory. (See van der Meere, 1996, for a review of these studies.)
From the state-regulation perspective, there is no validity in the definition of
impulsivity as fast-inaccurate responding. The emphasis is on the sensation-seeking
component of impulsivity. Sensation seeking is a personality characteristic which,
like hyperactivity, has been linked to the neurotansmitters serotonin,
norepinephrine and dopamine (Zuckerman, 1996). The components of sensation
99
seeking are boredom susceptibility, experience seeking, thrill seeking and
disinhibition (seeking sensation through social activities such as parties). (For a
further discussion of the possible links between hyperactivity and sensation or
novelty seeking, see section 3.4.5.)
Van der Meere (1996) concludes that, instead of attention deficit hyperactivity
disorder, a more appropriate diagnostic term would be state regulation deficit. He
emphasises the observations of many parents of hyperactive children that the
'deficit' seems only to be present during boring tasks. It disappears, when the child
is well motivated.
Effects of rewards on performance on reaction time tasks
Research by Douglas and her colleagues illustrates how rewards can influence the
task performance of children with hyperactivity. Douglas and Parry (1983)
investigated the effects of rewards on hyperactive and control children's
performance on a delayed reaction time task. There were 33 children in each group
and they were further subdivided into three reward groups. The hyperactive and
control groups were matched on age (mean age 9.6 years), IQ and socioeconomic
status. The classification of hyperactivity was based on parent and teacher rating
scales and interviews. The children were told to put their finger down on a key
when hearing a bleep and to lift off the finger as fast as possible when a light came
on. The rewards were simply positive verbal feedback. The criterion for a reward
was a reaction time equal to or shorter than the child's median reaction time
obtained during the baseline trials.
Overall, the reaction times of the hyperactive children were slower and more
variable than those of the control children. Continuous reward (rewarding the
children each time they reach the criterion) reduced mean reaction times and
reaction-time variability in both the hyperactive and control groups. The authors
did not directly contrast the results between the two groups. However, an
100
inspection of the means indicates that the improvement from the baseline to the
reward condition was somewhat greater in the hyperactive group both for mean
reaction times and standard deviations of reaction times. Despite this, the
hyperactive children were still a little slower and more variable in their speed even
in the reward condition (though the statistical significance of this was not tested).
In contrast to the performance of the control children, the hyperactive children's
performance did not improve significantly in the partial reward condition, and in
fact deteriorated in the noncontingent ('random rewards') condition. A study using
a serial reaction time task (Douglas & Parry, 1994) reported no difference in
reaction times between hyperactive and control groups on a 100% reinforcement
schedule.
These studies demonstrate how rewards even in the form of positive verbal
feedback can at least reduce hyperactive children's slow and variable pattern of
responding on reaction time tasks. This can be considered as further evidence of a
state-regulation deficit in hyperactivity. Other types of incentives or other state
factors could well have a stronger effect on hyperactive children's performance.
Effects of medication on state mechanisms
Milich, Carlson, Pelham and Licht (1991) investigated the effects of
methylphenidate on the task persistence of 21 7-10-year-old boys with ADHD. The
ADHD diagnoses were based on DSM-III-R criteria; the majority of the boys
obtained an additional diagnosis of oppositional defiant or conduct disorder. This
placebo-controlled, double-blind study involved the boys attempting to solve both
soluble and insoluble find-a-word puzzles over four days (across two levels of
medication, MPH vs placebo, and two task conditions, soluble vs insoluble).
Compared to placebo days, the boys did significantly better, while on medication,
on the task following a failure experience (i.e. insoluble puzzles). That is,
medication prevented the decrement in performance following the insoluble
101
problems, which was observed on placebo days. There was no difference in their
performance between placebo and medication days following the soluble puzzles.
This suggests that on medication the boys exerted more effort or were more willing
to cooperate after experiencing failure. The authors concluded that this latter
explanation is less likely 'because the boys were told that they could stop early if
they could not find a word and, thus, it was socially acceptable to stop early' (p.
531). This finding of stimulant medication having an effect on the effort
mechanism provides further evidence for the state regulation theory of
hyperactivity.
2.6 Chapter summary
The 'core' deficit or difficulty underlying hyperactivity has proved very difficult to
define. Owing to the efforts of several research groups, the picture is getting
clearer, however. Hyperactivity does not seem to be associated with a divided,
focused or sustained attention deficit.
Recent research suggests that the popular response inhibition hypothesis of ADHD
is in need of a revision. First, it remains to be shown that the group differences
between ADHD and control children on the inhibition tasks generalise to children
chosen from a general population sample. Second, studies show that children with
ADHD are not less likely to trigger the inhibitory process than other children, nor
is their inhibitory process more variable. Rather, children with ADHD show a
pattern of responding which is characterised by high variability in the speed of
responding and generally slow responding.
Research on the wider area of executive functions has pointed to possible working
memory deficits in hyperactivity. The small number of studies focusing on this
issue, and the inconsistencies in findings across studies, emphasise the need for
further research.
102
A potentially fruitful approach to integrating the research findings are the theories
which emphasise the role of task engagement factors in hyperactive children's
performance on psychological tests and tasks. The findings from studies indicating
the importance of factors such as presentation rate of stimuli, rewards and the
presence or absence of experimenter, as well as the findings from inhibition
studies, could all be explained from this 'alternative' perspective.
The delay aversion theory is one candidate for providing an explanation for the
pattern of task performance that is characteristic of hyperactivity. Rather than
having a cognitive deficit, such as a response inhibition deficit, hyperactive
children could simply be aiming to reduce overall periods of delay. In situations
where it is not possible to reduce the delay period, hyperactive children may be
attempting to reduce the subjective experience of delay (by spending time off-task)
or to increase the level of stimulation (by fidgeting and moving around).
The effects of stimulant medication on the performance of hyperactive children are
in line with the other findings. In conditions which elicit a sustained attention
deficit in hyperactive children, methylphenidate (MPH) erases it. MPH seems to
improve hyperactive children's performance on working memory measures too. On
the stop task, MPH has several effects: it accelerates the inhibitory process and the
primary-task responses, it makes the responses less variable, and it improves error
rates. On medication hyperactive children also seem to exert more effort when
attempting difficult tasks.
103
Chapter 3
Behaviour genetics
3.1 Quantitative genetics
3.1.1 Quantitative genetic theory
Behaviour genetics combines genetics and the behavioural sciences: it is the study of
genetic and environmental influences on individual differences in behaviour. As it
focuses on individual differences, behaviour genetics addresses the type of question
that is often of most interest from the society's viewpoint: Why do people differ so
much in ability, personality and psychological adjustment?
Whereas there are several examples of the potentially devastating effects of single
genes (e.g. the phenylketonuria gene which causes learning difficulties), most aspects
of behaviour are likely to be influenced by multiple genes (see Plomin, DeFries,
McClearn & Rutter, 1997). Behaviour genetics therefore studies the theory
underlying quantitative inheritance. A distinction between the terms genotype and
phenotype is important: genotype refers to the actual genetic makeup of an
individual, phenotype is what we observe.
104

In quantitative genetics the variance in a phenotype is divided into that due to genetic
factors and that due to environmental factors - shared and non-shared. Shared
environmental influences are those that tend to make members of a family similar to
one another and non-shared environmental influences those that tend to make family
members different from one another. Environment in behaviour genetics refers to all
non-genetic influences. Genetic influences can be additive or non-additive. Additive
genetic influences - when the effects of alleles at a locus and across loci simply 'add
up' - are responsible for genetic similarities between parents and offspring. Non-
additive genetic effects refer to the interactions between alleles at a locus (called
dominance) or across loci (called epistasis).
To estimate the genetic and environmental contributions to behaviour, behaviour
geneticists compare individuals who vary in genetic or environmental relatedness.
For example, siblings as well as parents and offspring share half of the additive
genetic variance. Non-identical or dizygotic twins are simply siblings born at the
same time and they share on average half of their genes, whereas identical or
monozygotic twins share all their genes. If genetic factors are important for a given
trait, individuals who are genetically more closely related should resemble each other
more than individuals who are genetically further apart.
Comparisons of genetically related individuals provide estimates of heritability,
which refers to 'the proportion of phenotypic variance that can be accounted for by
genetic differences among individuals' (P10mm et al., 1997, p. 79). Heritability is an
estimate of the size of the genetic influences in a given population at a given time. It
can change from population to population and from time to time. A distinction can be
made between broad-sense heritability, which includes all genetic variance, and
narrow-sense heritability, which refers only to additive genetic variance.
A phenomenon that may influence the heritability estimates is that of assortative
mating. Humans do not choose their partners randomly but, to some extent, choose
105

partners who are similar to themselves. For example, spouses correlate about .10 to
.20 for personality traits, .25 for height and as high as .60 for education (see Plomin
et a!., 1997, for a review). Assortative mating increases the correlations for first-
degree relatives, but can only lower the heritability estimate in a twin study (it raises
the correlation for dizygotic twins and therefore lessens the difference between
monozygotic and dizygotic twin pairs). It also increases genetic variance in a
population.
Although behaviour geneticists have a particular interest in genetic inheritance,
behaviour genetic research has also substantially increased our knowledge of the role
of nurture in behaviour. A major discovery has been the realisation of the importance
of the non-shared environment. The environmental influences that are often most
important are not those that are shared by children growing up in the same family but
those that are specific to each individual (see Plomin, Chipuer & Neiderhiser, 1994).
However, Simonoff and colleagues (Simonoff et al., in press) point out that another
explanation is possible too: both common environment and contrast effects (see
section 3.4.3) could be present. Few studies have investigated possible contrast
effects (sibling interaction and rater bias) and detecting both common environment
and contrast would require large sample sizes and either extended genetic designs or
multiple informants.
Another exciting finding has been the 'nature of nurture': many environmental
measures show in fact genetic effects (see Plomin et al., 1997). This genotype-
environment correlation means that there is some 'genetic control of exposure to the
environment' (Kendler & Eaves, 1986). In a recent review of genetic factors in child
psychiatric disorders, Rutter (1997) emphasises how the effects of nature and nurture
are not simply additive: 'Genetic factors (through gene-environment correlations)
influence the probability that people will experience environmental stressors, and
(through gene-environment interactions) they affect people's susceptibility to such
stressors.' (p. 573).
106
In quantitative genetic research on human behaviour, the main methods are family,
adoption and twin studies.
3.1.2 Family and adoption studies
Family studies investigate the degree to which genetically related individuals are
similar phenotypically. If there is no resemblance between family members on a
given trait, genetic factors do not influence the phenotypic variance on the trait.
Family studies can therefore be useful in disconfirming the genetic hypothesis, but
their limitation is that they cannot distinguish between genetic and shared
environmental effects when there is family resemblance on a particular trait. The
advantage of family studies over twin and adoption studies is that they can be more
useful in providing information about the mode of genetic transmission (see Risch,
1990a,b).
Adoption studies can provide a powerful demonstration of genetic influences on
behaviour. The logic of an adoption design is very straightforward: similarities
between adopted-apart relatives suggest genetic influences, whereas similarities
between adoptive relatives suggest environmental influences. Several different
adoption designs exist. Two major strategies are the adoptees' study method and the
adoptees' family method. The adoptees' study method starts with affected biological
parents of adopted-away children. The incidence of the disorder is then investigated
in the adopted-away children. In the adoptees' family method the rates of disorder
are investigated in the biological and adoptive parents of affected and unaffected
children adoptees. If the rate of the disorder is greater among biological relatives of
the affected adoptees than among the unaffected adoptees, this suggests genetic
influence. If the disorder is more common among the adoptive relatives of the
affected adoptees than among the adoptive relatives of the control adoptees, this
suggests environmental influence.
107
An obvious disadvantage of adoption studies is the difficulty in obtaining the sample.
Two other issues that need to be considered are the representativeness of the sample
and the possibility of selective placement.
It is a common presumption that the families who give up their children for adoption,
and the adoptive parents, may not be representative of the general population.
Evidence from the Colorado Adoption Project suggests that this need not be the case:
both biological and adoptive parents in this study are quite representative of the
general population for characteristics such as cognitive ability, educational and socio-
economic level, personality and family environment (e.g. Plomin & DeFries, 1985).
Some differences have been reported in other studies, however (see, for example,
Bohman & Sigvardsson, 1980). Deutsch and colleagues (Deutsch et al., 1982)
reported an unexpectedly high number of adoptees in their sample of 200 children
with ADD. The reasons for this finding are not clear, but referral bias is one possible
explanation.
Another issue is the possibility of selective placement. Adoption agencies often
attempt to place adoptees in families that resemble their biological parents in some
ways. The information the adoption agencies have is unavoidably limited, however.
They may have information regarding the physical characteristics or education level
of the parents but are unlikely to have any more detailed information about the
parents' behavioural characteristics. Although for most characteristics there is little
evidence of selective placement, some adoption studies show such an effect for IQ
(see Plomin et al., 1997). If selective placement takes place, it may increase the
degree of resemblance between the individuals being studied and therefore inflate the
estimate of environmental influences.
108
3.1.3 Twin studies
A popular method in quantitative genetics is the twin study. The relatively high rate
of twinning might come as a surprise to many people: approximately 1 in every 85
births is a twin birth. One third of twins are monozygotic (MZ), one third are same-
sex dizygotic (DZ) and the remaining third are opposite-sex DZ twins. However, due
to the decreased viability of MZ twins, the rate of this type of twin drops to
approximately one quarter after childhood. Opposite-sex DZ twins are often excluded
from twin studies for two reasons: male and female twins may experience somewhat
different environments and there are obviously sex-chromosome differences between
males and females.
Several factors influence the rate of DZ twinning in a population (see Plomin et at.,
1997). In recent years the increased use of fertility treatments has increased the rates
of multiple births dramatically. The rate of DZ twinning varies geographically and
may be inherited in some families. Maternal age and the number of previous
offspring are other significant factors. None of these factors influences the rate of
MZ births.
The twin method relies on the assumption that, as MZ twins are twice as similar
genetically as DZ twins, a characteristic is genetically influenced if MZ twins are
more alike on the characteristic than DZ twins. In other words, the additive genetic
correlation between the twins of an MZ pair is 1.0, whereas for DZ twins it is 0.5.
The within-pair correlation for genetic dominance is 1.0 for MZ twins and 0.25 for
DZ twins. By definition, the within-pair correlation for the shared environment is 1.0
and for the non-shared environment 0, for both types of twins.
The first stage of analysis for twin data usually focuses on the MZ/DZ phenotypic
correlations (for continuous variables) or concordance rates (for binary variables).
Subtracting the DZ correlation from the MZ correlation and doubling this figure
109
gives a rough estimate of broad-sense heritability. Concordance rates can be
calculated if at least one member of each twin pair is a 'case' (e.g. has hyperactivity/
ADHD). Investigators can calculate either a pairwise concordance rate (the number
of concordant pairs in a sample divided by the total number of pairs) or a
probanthvise concordance rate (the number of affected individuals in concordant
pairs divided by the total number of affected individuals).
The second stage of analysing twin data usually involves model fitting techniques.
Model fitting analyses provide estimates of heritability (h 2), common or shared
environmentality (c2) and specific or non-shared environmentality (e 2). If the
common environmental influences do not appear important, dominance effects (d2)
can also be calculated. Model fitting analyses can also be used to answer more
complex questions, such as whether the genes influencing one characteristic are the
same as those influencing some other characteristic. The trend in behaviour genetics
in general is to move towards the question of how - by which mechanisms do genes
have their effect - rather than simply focusing on the extent of genetic effects per se
(Plomin et al., 1997).
Another use of twin data is to calculate a group heritability. DeFries and Fulker
(1985, 1988) developed a technique, now known as DF extreme analysis, which
calculates the regression toward the mean for MZ and DZ co-twins of probands. If
the probands have, say hyperactivity, which is heritable, the MZ co-twins would be
expected to regress less towards the mean for the unselected population than the DZ
co-twins. Group heritability is derived from the mean differences between groups
and is different from the usual heritability estimate, which refers to differences
between individuals. DF extreme analysis is also useful for studying the issue of
disorders versus continuous dimensions, as it is possible to investigate differences in
the magnitude of genetic and environmental effects across different definitions of
caseness.
110
Variations of the classical twin method exist too. For example, some studies have
included only twins reared apart (combining the twin and adoption methods),
whereas other studies have focused on the families of identical twins.
An issue worth mentioning briefly, though rarely discussed with regard to twin
studies, is that of X-chromosome inactivation. This refers to the process, taking place
in females during fetal development, during which genes on one or the other of the
X-chromosomes are switched off apparently randomly in each cell. This phenomenon
could theoretically lead to differences between MZ twins, but could of course only
be relevant for genes located on the X-chromosome.
Several assumptions underlie the twin design, including the assumption of
representativeness and the equal environments assumption. Another important issue
to consider is zygosity determination.
Assumption of representativeness
Are twins representative of the general population or are they in some ways different
from singletons? Some small differences between twins and singletons do exist (see
Plomin et a!., 1997). Twins are more likely to have a low birthweight and to be born
premature, and they therefore are more likely to suffer from the medical problems
associated with prematurity. Twins are also slightly delayed in language development
and in learning to read, compared to singletons, and they have a slightly lower
average IQ (96). Simonoff (1992) reported slight twin-singleton differences for
conduct disorder.
Very few studies have investigated whether the rates of hyperactivity differ between
twins and singletons. Van den Oord, Koot, Boomsma, Verlhurst and Orlebeke
(1995) compared the rates of behaviour problems in 2- and 3-year-old twins
(N= 1281 pairs) and singletons (N =420). Overall, maternal ratings on the Child
111
Behaviour Checklist (CBCL) showed that the level of behaviour problems, including
the 'Overactive syndrome' (derived from the CBCL), were comparable between
twins and singletons.
In contrast, Levy and colleagues (Levy, Hay, McLaughlin, Wood & Waidman,
1996) reported a higher rate of ADHD in twins than in non-twin siblings in their
sample of 1938 families. However, once speech and reading problems were
controlled for, the twin/sibling status did not explain any additional variance in
ADHD. This study differed from the study by van den Oord et al. (1995) in several
respects: the children were older (between 4 and 12 years), the singletons were
siblings rather than unrelated children, and the mothers rated their children on a
questionnaire which was based on DSM-III-R criteria for ADHD. Levy et a!. (1996)
conclude that, as there are no obvious differences in the degree of resemblance for
ADHD symptomatology between sibling-sibling, twin-sibling and DZ twin pairs, the
finding of higher rates of ADHD among twins does not invalidate genetic analyses.
See Appendix A for a discussion of the relevance of the present findings for the
representativeness issue.
The equal environments assumption
The equal environments assumption (EEA) states that the shared environments are
equally similar for MZ and DZ twins. A common counter-argument is that MZ twins
may be treated more alike because of their greater physical similarity. To test the
EEA in twin studies, four main methods have been used. The first method has
investigated whether, controlling for zygosity, twins who are rated as more similar in
physical appearance are also rated as more alike for behavioural characteristics. The
studies investigating this issue have found no such evidence for mood and anxiety
disorders (Hettema, Neale & Kendler, 1995), schizophrenia (Kendler, 1983),
intelligence and personality traits (Matheny, Wilson & Dolan, 1976; Plomin,
112
Willerman & Loehlin, 1976) or ADHD (Gillis, Gilger, Pennington & DeFries,
1992).
The second method involves direct observations and asks the following question: if
parents treat MZ twins more alike than DZ twins, is this because MZ twins behave
more alike? In a study with young twins and their parents, the behaviours observed
were divided into those which were self-initiated and those which occurred in
response to the twins' behaviour (Lytton, 1977). The parents did indeed treat MZ
more similarly than DZ twins but this was, as predicted, in response to the twins'
behaviour.
The third method to test the EEA focuses on the observations that the environments
for MZ twins are somewhat more similar than the environments for DZ twins (for
example, MZ twins are more likely to share friends and to share the same room -
Kendler, Heath, Martin & Eaves, 1986; Kendler, Neale, Kessler, Heath & Eaves,
1992). The question is whether these environmental similarities influence twin
similarity on the characteristics being measured. If they do, MZ (or DZ) twins whose
environments are more similar should resemble each other more than MZ (or DZ)
twins whose environments are less similar. Several studies have failed to find any
such effects for measures of personality, intellectual ability or psychopathology in
childhood (see Kendler, Neale, Kessler, Heath & Eaves, 1993, for a review).
Similarly, Thapar, Hervas and McGuffin (1995; for a further discussion of the study,
see section 3.4.3) found that, although there was a greater resemblance between MZ
twins than DZ twins on an environmental sharing score, this score was not associated
with MZ twin similarity for hyperactivity scores.
The fourth method relies on the findings that a proportion of twins are mistaken
about their zygosity. If it is the expectation of greater similarity for MZ twins that
also causes them to behave more alike than DZ twins, then the MZ/DZ differences
in behaviour should be observed for the perceived rather than true zygosity. Kendler
113
et a!. (1993), for example, interviewed 1030 female-female twin pairs. In 158 pairs
(15.3%) one or both twins disagreed with the project-assigned zygosity. Model
fitting analyses provided no evidence of such zygosity expectation effects for major
depression, generalised anxiety disorder, phobia, bulimia or alcoholism.
Goodman and Stevenson (1989b), in a study on hyperactivity, also examined results
separately for recognised and unrecognised MZ pairs. In their sample of 213 twins,
the parents of 37 pairs were mistaken about their twins' zygosity. Both parents and
teachers rated MZ twins more similarly for hyperactivity when they were perceived
as 'identical', as opposed to 'non-identical'. However, the MZ twins who were
perceived as non-identical still had correlations much greater than the true DZ twin
pairs: true zygosity was clearly important and not just the parents' perception of their
twins' zygosity. The direction of effect is also not clear. Although parents'
expectations of their twins' zygosity may have influenced their ratings, it is also
possible that parents were more likely to assume the twins were identical if they
behaved more alike. In another study on hyperactivity, Thapar, Hervas and
McGuffin (1995) found that the correlations for recognised (N=70) and
unrecognised (N=35) MZ twins were highly similar.
Overall, research evidence suggests that the equal environments assumption is a
reasonable one.
Zygosity determination
It is of course crucial in twin studies that the zygosity of the twin pairs is classified as
correctly as possible. Blood typing and DNA-fingerprinting are both very accurate
methods, achieving 95-99% (Lykken, 1978; Wilson, 1980) and theoretically 100%
accuracy, respectively.
114
In many cases it is not practical to obtain blood samples from large numbers of twins
taking part in a study. Luckily a method exists which is easy and cheap to use and
still achieves high accuracy: the parents can rate the twins with regard to their
physical similarity and confusability. Questionnaires achieve an accuracy of between
90% and 98% in zygosity determination, when compared to blood typing
(Bonnelykke, Hauge, Holm, Kristoffersen & Gurtler, 1989; Cohen, Dibble, Grawe
& Pollin, 1973; Magnus, Berg & Nance, 1983; Nichols & Bilbro, 1966). This level
of accuracy is considered sufficient for most purposes.
3.2 Molecular genetics
Research using quantitative genetic methods has paved the way for the search for the
actual genes influencing behaviour, including those influencing complex behaviours.
Complex behaviours are those that are thought to be influenced by multiple genes
and also by environmental factors. Although quantitative genetics will continue to
play an important role in future investigations too, advances in molecular genetics
have in many ways changed the direction in behaviour genetic research (Plomin et
al., 1997; Rutter, 1994).
Several different genetic mechanisms could produce complex inheritance (for
reviews, see Craddock & Owen, 1996; Skuse, 1997). As discussed earlier, epistasis
refers to the interaction between multiple genes and is therefore a separate
phenomenon from the simple additive effects of two or more genes. Another possible
mechanism is genetic or locus heterogeneity: several genes, each of them on its own,
can produce the same phenotype. If different pairs of alleles at a single locus result in
expression of subtle variations in a phenotype, this is known as allelic heterogeneity.
Imprinting is a phenomenon in which the expression of an allele depends on its
parental origin. Anticipation or dynamic mutation 1 refers to the deterioration of a
'Mutation = a heritable change in DNA base pair sequences (Plomm et a!., 1997)115
disorder as it is passed on to the next generation. Mitochondrial gene mutation is also
possible: the mutation lies not in the nuclear genome but in the mitochondrial
genome which results in maternal pattern of inheritance. These different genetic
mechanisms could of course also act together in various combinations. An important
possibility also to bear in mind is that what appears to be the same phenotype could
also be due, not to any susceptibility alleles, but to environmental or other random
causes - such cases are known as phenocopies (see Skuse, 1997).
The most important issue here, however, is the assumption of behavioural traits
resulting from the mainly additive combination of many genes at different loci (see
McGuffin, Owen, O'Donovan, Thapar & Gottesman, 1994). Instead of the term
polygenic inheritance, a modern approach refers to QTLs 2 (quantitative trait loci).
Implicit in the QTL-approach is that the multiple genes can have varying effect sizes.
In humans the two main methods in molecular genetics are association and linkage
studies. Allelic association refers to a correlation between a particular allele and a
trait in a population. A difficulty with this method lies in identifying the candidate
genes, the genes that could potentially affect the behaviour under investigation. One
approach is to use QTLs found in mice as candidate genes for research in humans,
which is possible because of the similarity between mouse and human genes. In
association studies the marker has to lie very close to the susceptibility gene. An
advantage of association studies over linkage studies (see below) is that they can find
QTLs which have only small effects (Craddock & Owen, 1996).
Linkage studies differ from association studies in that, instead of studying
populations of unrelated individuals, they focus on large pedigrees. The aim is for
the pattern of inheritance to reveal a linkage between a DNA marker and a trait. Due
to various methodological difficulties with the traditional linkage approach (see
2 QTL = genes of various effect sizes in multiple-gene systems that contribute to quantitative(continuous) variation in a phenotype (Plomin et a!., 1997)
116

Craddock & Owen, 1996), a technique called the affected sib-pair design is often
preferable. In this type of a linkage study, allele sharing between sibling pairs is
compared. If allele sharing for particular markers exceeds the expected 50 percent (if
both members of the sibling pair are affected), this suggests linkage. This sib-pair
design is not only useful for studying dichotomous variables (e.g. affected!
unaffected), but also for studying continuous variables. Linkage studies can provide a
preliminary localisation of a gene and association studies can then narrow down the
region of interest.
Molecular genetics is a rapidly developing discipline. The future is likely to see yet
faster and more effective methods being developed for identifying genes that affect
complex behaviours.
3.3 Criticisms of behaviour genetics
Apart from criticisms aimed at the methodology of behaviour genetic investigations
(many of these issues have been discussed in the sections above), the field has also
been the subject of criticisms of another kind. One argument is that it is not fruitful
to investigate genetic influences, as these cannot be altered, and that researchers
should focus on the environment, as it is open to intervention.
Firstly, it is important that the term heritability is not misunderstood (see Plomin et
al., 1997). Heritability does not imply genetic determinism. Even if a trait is highly
heritable, it does not mean that environmental interventions could not work.
Heritability describes what is, rather than what could be.
Genetic information can, in fact, be invaluable in the treatment and prevention of
disorders (see Rutter et al., 1990). Phenylketonuria is a well-known example of how
an understanding of the genetics of a disorder can lead to a treatment in which the
117
environment is manipulated. This autosomal recessive condition causes intellectual
impairment unless the affected individual follows a diet low in phenylalanine from
early on.
Genetic information can also be used in genetic counselling, to inform parents of the
risks of carrying certain inherited disorders. The other side of the coin is, though,
that genetic information could also be misused. When more is known about genetic
factors, will people with certain characteristics or at a particular genetic risk be
discriminated against? Plomin and colleagues (P10mm Ct al., 1997) argue that
'despite the problems created by advances in science, we would not want to cut off
the flow of knowledge and its benefits in order to avoid having to confront such
problems' (p. 279). Nevertheless, scientists should of course take a responsible
approach to their research; ethical considerations are an integral part of planning a
research project.
Behaviour genetics is certainly often seen to place the emphasis on inequality, as it
focuses on differences between individuals. We are indeed, in certain respects, born
unequal - but let's call it each of us being unique. In the same way as we accept
obvious physical differences between us, we can acknowledge that we differ in terms
of our psychological characteristics and our specific patterns of risk and protective
factors. Plomin et al. (1997) rightly point out that the findings of individual
differences that have a genetic basis do not compromise the value of social equality.
An emphasis on the environment also is not a guarantee on obtaining the most
valuable information for the treatment and prevention of disorders. In some cases an
emphasis on the home environment led to blaming the parents for their children's
difficulties when this was misguided, as in the case of autism. With regard to
hyperactivity, an understanding of its genetic etiology has led to a better
understanding of why some treatments may work better than others. This is not to
say that environment is unimportant. Behaviour geneticists take into account both
118
genes and the environment, and attempt to understand the complex interactions
between them.
3.4 Behaviour genetic studies on hyperactivity
3.4.1 Family studies
Family studies have found an increased incidence of ADD/ADHD in the relatives of
ADD/ADHD probands (e.g. Biederman et a!., 1992; Biederman, Faraone, Keenan,
Knee & Tsuang, 1990; Biederman et a!., 1986; Cantwell, 1972; Faraone,
Biederman, Keenan & Tsuang, 1991; Perrin & Last, 1996; Roizen et al., 1996;
Schachar & Wachsmuth, 1990). Although some of the studies have suffered from
methodological limitations (with regard to diagnostic procedures and nonblind ratings
of psychopathology, for example), the general picture strongly suggests that ADHD
runs in families.
An example of one of the methodologically stronger studies is that by Biederman and
colleagues (Biederman et al., 1992). Two groups of boys aged between 6 and 17
took part in the study: 140 probands with ADHD and 120 normal controls. Children
were excluded if they had major sensorimotor handicaps, psychosis, autism, full-
scale IQ below 80, were from the lowest socio-economic status, had been adopted or
if their nuclear family was unavailable for study. All the probands had been referred
to a pediatric or a psychiatric clinic. 'Blind' raters conducted DSM-III-R -based
structured interviews with parents, siblings and the probands themselves (expect for
children younger than 12 years). The estimates of risk for relatives were adjusted for
age, as a younger relative may not yet have lived through the risk period for a
particular disorder.
119
The main finding was that parents and siblings of ADHD probands were five times
more likely than relatives of controls to receive a (lifetime) diagnosis of ADHD
themselves. This result remained significant even after controlling for measures of
psychosocial adversity. When the relatives were classified based on a broader
definition of ADHD, the proportion of affected individuals increased from 16% to
25 %. Relatives of ADHD probands were also at an increased risk for antisocial
disorders, major depressive disorder, substance dependence and anxiety disorders.
However, a more recent analysis of this sample (Faraone, Biederman, Jetton &
Tsuang, 1997) showed that the higher rates of conduct disorder and antisocial
personality disorder were limited to the relatives of those probands who had
comorbid conduct disorder in addition to ADHD. Although this study included boys
only, an earlier study (Faraone, Biederman, Keenan & Tsuang, 1991a) suggests that
the findings are highly similar for girls.
Faraone and colleagues (Faraone et al., 1992) also carried out a segragation analysis
of ADHD on this same sample, using the computer programmes POINTER and
REGTL. The authors concluded that the results were most consistent with the effects
of a single major gene; the data provided no support for multifactorial polygenic
transmission, non-familial environmental transmission or for cultural transmission.
The model predicted that only 46% of boys and 31% of girls with the 'ADHD gene'
would obtain a diagnosis of ADHD. The authors suggest that environmental factors
determine whether individuals carrying the 'ADHD gene' will actually express it.
The reduced penetrance could also theoretically be due to the 'ADHD gene's'
interaction with another gene. Faraone et al. (1992) also discuss the possible
relevance of their findings to the gender differences in the prevalence of ADHD.
However, because of low power in their study and as their findings are not consistent
with some earlier findings, the usefulness of their findings in this respect is limited.
In general, the results of this study await replication. (Later sections of this chapter
discuss findings which are more in line with models of QTL effects.)
120
The family studies show that there is a familial contribution to ADHD. To
investigate whether the familial contribution is a genetic one, one needs to focus on
twin and adoption studies.
3.4.2 Adoption studies
Only a small number of adoption studies on ADHD/hyperactivity have been carried
out. The early adoption studies generally supported the genetic hypothesis (e.g.
Cantwell, 1972; Morrison & Stewart, 1971), but as their methodologies had several
limitations (see McMahon, 1980), these studies will not be reviewed here.
The Toronto Adoption Study (see Deutsch & Kinsbourne, 1991) compared three
groups: ADD probands and their biological parents and siblings, ADD probands and
their adoptive parents and siblings, and control probands and their biological parents
and siblings. The three proband groups (N =72) were matched on age, gender and
parental socio-economic status. ADD symptomatology was assessed on a continuous
scale. The relatives of the 'biological' ADD group had a higher rate of ADD
symptomatology than the relatives of the 'adopted' ADD group, which supports the
genetic hypothesis. This group difference remained also when discrete diagnoses
(ADD/non-ADD) were used instead of the continuous dimension. The rates of ADD
symptomatology in the relatives of the control group probands were similar to those
of the adopted ADD group probands.
Alberts-Corush, Firestone and Goodman (1986) investigated the performance of
biological and adoptive parents of hyperactive and control children on
neuropsychological measures. The hyperactive group consisted of 25 children and
their biological parents and of another group of 18 children and their adoptive
parents. The control group similarly had a group of 25 children and their biological
parents and another group of 20 children and their adoptive parents. To be classified
as hyperactive the children had to receive a diagnosis of ADDH based on DSM-llI
121
criteria and to have obtained a Conners' Teacher Hyperactivity Index score of 1.5 or
higher.
Compared to the other groups of parents, the biological parents of hyperactive
children had slower mean reaction times on a delayed reaction time task and they
made fewer correct recognitions with increasing matrix size on a task called the span
of apprehension. The groups did not differ on their performance on an executive
function measure (Porteus Maze test), however.
A limitation with this study is that the biological parents of hyperactive children
differed from the other parent groups on IQ and educational level. It would have
been informative too, if the investigators had tested the children on the same tasks as
their parents and if they had determined the hyperactivity status also of the parents
using interviews or rating scales. These limitations aside, this study tentatively
suggests that the genetic resemblance between hyperactive children and their parents
need not be limited to diagnoses of ADHD/hyperactivity, but may also be found on
psychological tests.
Nigg, Swanson and Hinshaw (1997) obtained similar findings on a measure of covert
visual attention. The ADHD group consisted of 27 boys and the comparison group of
17 boys aged between 6 and 12 years. There were three parent groups: biological
parents of boys with ADHD (N =16), biological parents of the comparison group
(N= 14) and adoptive parents of boys with ADHD (N= 12). Only the ADHD group
and the biological parents of ADHD boys showed lateral effects, that is differences in
performance depending on whether stimuli was presented in the left or the right
visual field.
The comparison boys and their parents and the adoptive parents of ADHD boys
showed a 'normal' pattern of responses on the task. The investigators also assessed
parent history of childhood attention problems or ADHD symptoms. The biological
122
fathers of ADHD boys reported significantly higher rates of childhood attention
problems than the other two groups of fathers. For mothers the differences between
the groups were in the same direction, but statistically non-significant. Nigg et al.
(1997) conclude that, due to several methodological limitations, such as the small
sample sizes, the study is best viewed as exploratory.
Van den Oord, Boomsma and Verhuist (1994) in the Netherlands carried out a rather
different type of an adoption study. The sample (N =758; mean age 12.4 years)
consisted of three groups: 1) biological siblings adopted away together; 2)
biologically unrelated adoptees growing up as siblings; and 3) adoptees growing up
as singletons. The authors used the Child Behaviour Checklist (CBCL) to obtain
ratings of problem behaviours, including attention problems. Model fitting techniques
were used to analyse the data. Genetic effects accounted for 47% of the variance on
the Attention Problems subscale; the effects of the shared environment were very
small.
In sum, the adoption studies suggest that genetic factors are involved in the etiology
of hyperactivity. The evidence is rather limited, however, due to the small number of
studies that have been carried out and the methodological limitations with the existing
studies. None of the studies reviewed here studied both the adoptive and biological
relatives of the same children. To obtain further evidence of genetic effects, one has
to focus on twin studies.
3.4.3 Twin studies
General population samples
Twin studies which have taken a model fitting approach have investigated scores on a
hyperactivity dimension in general population samples. This approach produces a
heritability estimate of individual differences in hyperactivity. Table 3.4.3a
123
summarises the results from these twin studies. Note that heritability (h 2) is given as
a proportion in the table and that the phenotypic correlations are given separately for
males (M) and females (F) when the authors reported these separately. Phenotypic
DZ correlations refer to the correlations for same-sex DZ twins (for correlations for
opposite-sex DZ twins in the few studies that included them, see the original
references).
An early twin study by Willerman (1973) reported a heritability of 77% for scores on
an 'activity' questionnaire. The first methodologically strong twin study on
hyperactivity was carried out by Goodman and Stevenson (1989a,b). The sample was
a general population sample of 213 13-year-old twin pairs. Parent and teacher ratings
on the Rutter questionnaires provided a measure of hyperactivity (the items included
in the hyperactivity dimension are 'squirmy', 'restless' and 'cannot settle', each rated
between 0 and 2). The twins were also assessed on two measures of attentiveness:
freedom from distractibility and an 'E' scan test, which involved detecting and
deleting as many E-letters as possible in two minutes. This study did not involve
model fitting analyses; the heritability estimates were obtained from the twin
correlations.
The heritability estimates varied across raters and measures, but were in general
rather high: 54-100% for hyperactivity ratings and 32% (freedom from
distractibility) and 42% ('E' scan) for the inattentiveness measures. However,
expectancy effects inflated the estimates for the hyperactivity ratings, though not for
the attentiveness measures. Taking the expectancy effects into account, genetic
factors explained approximately half of the explainable variance (taking also the
reliability of the measures into account). There was no evidence to suggest that the
heritabilities would be different for boys and girls.
124
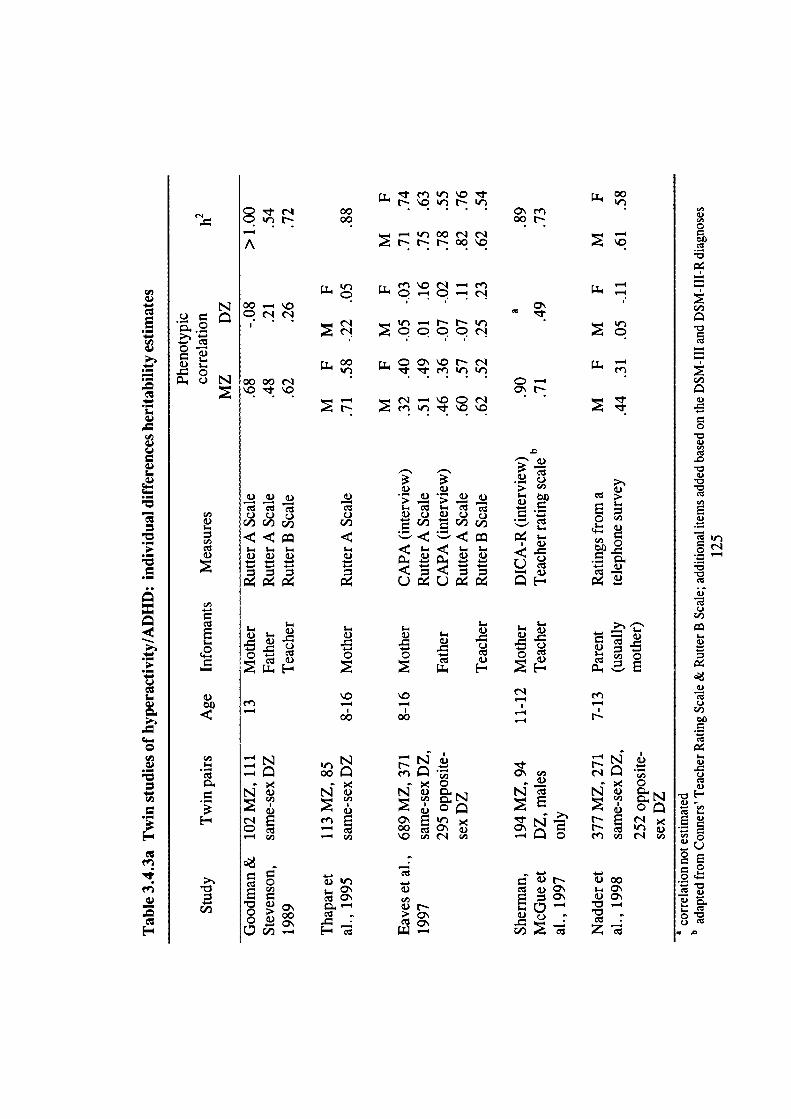
E
.-
C
I.0
C
—
N
C N
I-
C#D
1)
a,)I-
c.
00
C'
V
5-
CCI)
C,)0
H
V
en—4
en< 0
N vCI)
C' E " <00 C\ V,o c
VCI)V r-;,. CC Q\
.< 0
NV
r- Escr)enri
vs V00VC' s-C\
E r
__;00c Za
5- 5-5- (1) I()u 5- V.- V —
0 0o C 0C
E2 E2
5-
.
c)
C
en —4—4
ri NOlrr00 C\Cfl00 OON•
—4 —ooririA NtN00\O
n O ('1 — en
I.L4c Q-•Q—•r1j00.4O
I.
1 cQN
11 00 IT C O\ \O r r-i. . en 'r 'r
0000r'i
__4 - r' — \O C (1
.N CC
—— —
en
a.>a,,0
a,)
a,)
a.>
0
a.>C,,
a.>
U,Ea.>
ci
Cia.>ciC.)a,)
I..a.)
a.)ciC.)a,)00
ci
I-a.>C->cia.>
a)-- U,ci'-a.>
F;L.Ci0
c000000011)
,_ $_• _
' -'1) )
5-
0 U0)011) 0000c/)
;..
5- <-<
— i N—— 00
a,)
mE
— C,) a,)
CID
. &)O 00 c0aL00-4 Ec
A subsequent twin study (Thapar, Hervas & McGuffin, 1995) replicated Goodman
and Stevenson's (1989b) results. This population-based sample consisted of 198 pairs
of twins aged between 8 and 16 years. The three activity items from the Rutter
questionnaire were used to define hyperactivity, but only maternal ratings were
obtained.
The AE model, which includes additive genetic and non-shared environmental effects
only, fitted the data better than the other 'basic' models (see section 6.1.3) and
provided a heritability estimate of 59%. Because of the findings of very low DZ
correlations and of differences in MZ and DZ variances, the authors also fitted a
sibling interaction model to the data. Sibling interaction here refers to the situation
where phenotypic differences between the members of a twin pair become
exaggerated; one twin's high activity level results in the co-twin showing lower
levels of activity (compared to 'true' levels of activity). The authors concluded that
the model incorporating sibling interaction, which produces a heritability estimate of
88%, explains the data best.
This conclusion has come under some criticism recently, however. Silberg and
colleagues (Silberg et al., 1996) point out that Thapar et al. (1995) did not
systematically compare their model with a model that includes genetic non-additivity,
nor did they consider the possibility of rater bias.
The findings of high heritability for the dimension of hyperactivity (Goodman &
Stevenson, 1989b; Thapar et al., 1995) were replicated in a large-scale twin study by
Eaves et al. (1997). The twins, aged between 8 and 16 years, were participants in the
Virginia Twin Study of Adolescent Behavioral Development. Interviews with both
parents (with the Child and Adolescent Psychiatric Assessment, CAPA) and ratings
by parents (Rutter's A2) and teachers (Rutter's B2) formed the measures of ADHD.
126
Additive genetic factors accounted for between 50% and 80% of the variance after
removing contrast effects (rater bias and/or sibling interaction; see the following
section) from the data, with the non-shared environment (and measurement error)
explaining the remaining variance. Questionnaire and interview data from both
parents produced highly similar results and the results were also relatively
homogeneous over sexes. The evidence for twin contrast effects, implicated by
reduced DZ correlation and increased DZ variance, was very strong both for mother-
report and father-report data. The model with the contrast effects produced a
significantly better fit for the data than did a model with genetic non-additivity
(dominance) effects. Teacher ratings did not show any significant contrast effects and
also produced slightly lower heritability estimates than parent ratings.
The evidence continues to accumulate in support of the findings from the earlier twin
studies. Sherman, McGue and lacono (1997) analysed data from boys aged 11 and 12
years taking part in the Minnesota Twin Family Study. Mothers were interviewed
using a modified version of the DICA-R and teachers completed the MTFS Teacher
Rating Form (the items were adapted from the Conners Teacher Rating Scale, the
Rutter Child Scale B and other items were added based on the DSM-III and DSM-III-
R diagnoses). Genetic effects accounted for 73 % of the variance in teacher-reported
ADHD symptoms and for 89% of the variance in mother-reported ADHD
symptoms.
Sherman, lacono and McGue (1997) carried out model fitting analyses also on the
two ADHD dimensions separately. Factor analyses on the behavioural items revealed
the two dimensions of inattention and impulsivity-hyperactivity both for teacher-
report and mother-report data. Heritability estimates were high, in particular for
impulsivity-hyperactivity: 91 % for mother-rated and 69% for teacher-rated
impulsivity-hyperactivity, and 69% for mother-rated and 39% for teacher-rated
inattention. Bivariate analyses suggested that these two ADHD dimensions are
mediated by a common genetic factor. The shared environment was important only
127
for teacher-rated inattention. A limitation of these two sets of analyses is that the
authors did not fit the data to models including dominance or contrast effects.
Recently Nadder and colleagues (Nadder, Silberg, Eaves, Maes & Meyer, 1998)
have reported data from the second wave of ascertainment of the Virginia Twin
Study of Adolescent Behavioral Development. The measure of ADHD
symptomatology was different from the other studies, in that the maternal ratings
were obtained from a telephone survey. The model including contrast effects
provided the best fit for the data and showed that genetic effects explained
approximately 60% of the variance in ADHD symptomatology in this sample of 7-
13-year-old girls and boys. The authors point out, however, that they could not
exclude with statistical significance additional effects from dominance. The results
suggested that the magnitude of genetic and environmental causes is the same for
both sexes.
Studies using the Child Behaviour Checklist (CBCL) provide further evidence for the
heritability of attention problems (these measures were not included in the summary
table). Gjone, Stevenson and Sundet (1996) reported heritabilities for the Attention
Problems subscale ranging from 66% to 79% in a sample of twins aged 5 to 9 years
and 12 to 15 years. The results were robust across age, sex and severity. Edeibrock,
Rende, Plomin and Thompson (1995) obtained a heritability estimate of 66% in a
sample of twins aged 7 to 15 years. Similarly, Zahn-Waxler, Schmitz, Fulker,
Robinson and Emde (1996) found that between 56% (father report) and 72% (mother
report) of the variance in the Attention Problems subscale for a sample of 5-year-old
twins was due to genetic effects.
The findings also apply to even younger children. With a sample of 3-year-old twins,
van den Oord, Verlhurst and Boomsma (1996) found that genetic factors explained
more than half of the variance in the 'Overactive syndrome' (derived from the
CBCL). Although extreme scores on the CBCL do not equate directly to ADHD,
128
there is convergence between the two approaches. Kasius, Ferdinand, van den Berg
and Verhuist (1997) found that the Attention Problems scale was a significant
predictor of 'pure' ADHD, as diagnosed using the DSM-III-R.
Sibling interaction or rater bias?
The low, even negative, DZ correlations for parental (especially maternal) ratings is
a consistent finding across the studies. Additive genetic effects on their own cannot
account for DZ correlations which are less than half of MZ correlations. The two
possible explanations for such a pattern are those of dominant or epistatic
(interactive) genetic influences and contrast or competition effects. However,
dominance effects would not be expected to produce negative DZ correlations.
As briefly discussed earlier, contrast effects refer to the negative influence of the
phenotype or behaviour of one individual on that of another: a high rating of
hyperactive behaviour in one twin decreases the hyperactivity rating in the other
twin. Contrast effects decrease MZ and, in particular, DZ correlations. They also
increase the variance of ratings, again the DZ variances in particular. Competition
effects refer to the opposite situation of a positive influence of the phenotype on that
of another.
The evidence from the twin studies on hyperactivity suggests that contrast effects
explain the pattern of findings that has emerged. However, it has remained unclear
whether the contrast effects reflect true sibling interaction or whether they reflect
rater bias. True sibling interaction means that the more one twin is hyperactive, the
less hyperactive the other. The rater bias explanation suggests that the more
hyperactive one twin is perceived to be, the less the perception of the other twin's
hyperactivity.
129
To explore this issue, Simonoff et al. (in press) analysed data from 1044 twin pairs
from the Virginia Twin Study of Adolescent Behavioral Development. Ratings from
different teachers for the twins in a pair for a subsample of these twins enabled the
comparison between true phenotypic effects and contrast as a form of rater bias. As
father-report data was missing from a high proportion of cases, the analyses focused
on maternal ratings only. The analyses supported the rater bias explanation of
contrast effects in maternal hyperactivity ratings. Simonoff and colleagues suggest
that parents may find it difficult to judge 'normal' levels of activity, attention and
impulsivity. The findings of no contrast effects on conduct problems, for which
norms may be more clear cut, support this argument.
Although there is no evidence of contrast effects in teacher ratings of hyperactivity,
the analyses by Simonoff et al. (in press) suggest that teacher ratings reflect a
different bias. Ratings made by the same teacher were more highly correlated than
ratings made by different teachers. The study did not have enough power to
distinguish between two possible models - those of 'twin confusion' and 'correlated
errors' - but they could both influence teacher ratings. The twin confusion model
suggests that teachers may have difficulty attributing behaviour to the correct child.
The correlated errors model suggests that teachers vary in their expectations of
behaviour, which is then reflected in their ratings.
Extreme hyperactivity
A smaller number of twin studies have investigated the heritability of extreme
hyperactivity, using the DeFries and Fulker approach. Such studies produce a group
heritability estimate for hyperactivity. Table 3 .4.3b summarises the results from
these studies.
130
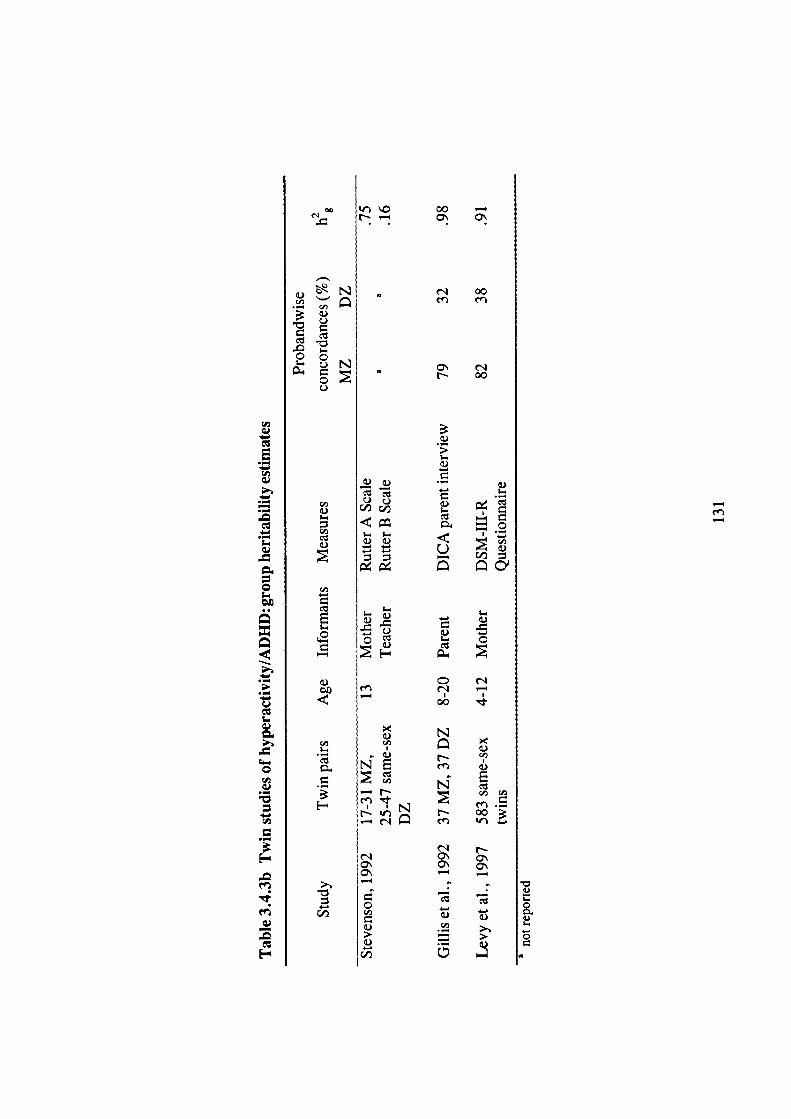
00 —a
00n cn
t- 00
N1
5-00
0 .C.)
5-
cd
t)
5-
00
5-
2.-2C
- 14—•CID
U— C/D
5--.
• )
0C - 0
r —I I
00
N
CID
NE C )
cd 1._i
—b ..s cl
cr1S 00cfl
(1 sa
p1.) tt) I
0000
s_
Stevenson (1992) analysed the results for their sample of 13-year-old twins
(Goodman & Stevenson, 1989a,b) using this approach. Ratings of hyperactivity by
mothers produced a high group heritability estimate of 75 %, whereas the group
heritability estimate for teacher-rated hyperactivity was noticeably lower at 16%. The
estimates were 25% (freedom from distractibility) and 76% ('E' scan) for the
attentiveness measures.
Gillis, Gilger, Pennington and DeFries (1992) obtained further evidence of strong
genetic effects on parent reports of extreme hyperactivity. The children were a
subsample of twins taking part in the Colorado Reading Project: 37 MZ and 37 DZ
pairs in which at least one of the twins was classified as having ADHD. The
diagnosis of the twins was based on the Diagnostic Interview for Children and
Adolescents - Parent Interview (DICA-P). Probandwise concordance rates for
ADHD were 79% for MZ pairs and 32% for DZ pairs. The group heritability
estimate varied between 87% and 98%, depending on adjustment for differences in
IQ or reading.
The Australian Twin ADHD Project (ATAP; Levy, Hay, McStephen, Wood &
Waldman, 1997) is one of the largest genetic studies of ADHD. Out of a total of
5067 children, aged between 4 and 12 years, 583 same-sex twin pairs were included
in the DF extreme analysis. At least one twin in each of these pairs scored above a
specific cut-off point on a DSM-III-R -based parent questionnaire, which was
specifically designed for the study. The investigators validated the ADHD diagnosis
obtained from the questionnaire using a diagnostic interview.
The results from this study show the robustness of the heritability findings: the group
heritability of ADHD was 91 % and the heritability of the trait (i.e. number of
symptoms, ignoring diagnostic cut-offs) was 75%. This finding of the disorder not
being significantly more heritable than the trait, and also the finding that the results
132
are similar even if different cut-off criteria are applied for ADHD, support the idea
of the probands representing the high end of a continuum.
Levy et al. (1997) also report that when DSM-IV criteria were applied in a
preliminary analysis of data from 1618 families taking part in the ATAP, the
heritabilities for the inattentive and hyperactive-impulsive subtypes were similar to
those they report for ADHD based on DSM-III-R criteria.
Summary offindings from twin studies
The overall conclusion from this increasing number of twin studies is that there are
strong genetic effects on ADHD or hyperactivity. The findings are quite consistent
across the different measures used. Heritability estimates for the dimension of
hyperactivity vary between 50% and 100% for parent-report data and between 50%
and 70% for teacher-report data. There is evidence of rater bias in maternal ratings
of hyperactivity, but it is posssible to remove the variance due to such bias
statistically from the variance explained by genetic and environmental factors.
Teacher ratings may reflect another type of bias, that of 'twin confusion' or
'correlated errors'.
Twin studies similarly report high group heritability estimates (75-98%) for extreme
hyperactivity, when reported by parents. The only group heritability estimate
reported for teacher ratings (Stevenson, 1992) is noticeably lower at 16%. The
sample size was small in this study and it is too early to draw conclusions based on
this single result. The findings of high heritabilities for hyperactivity whether it is
measured as a dimension or as a categorical classification have generally been
interpreted as supporting the notion of a continuous dimension of hyperactivity at the
phenotypic level (e.g. Tannock, 1998).
133
The amount of variance in hyperactivity not due to genetic effects has been attributed
to the non-shared environment (and measurement error). The evidence does not
support a clear role for shared environmental factors in hyperactivity.
3.4.4 Animal models
Animal models for hyperactivity can be useful for identifying candidate genes and for
providing insight into the neurochemical pathways involved in ADHD
symptomatology.
One animal model of hyperactivity is the Spontaneously Hypertensive Rat (SHR; see,
for example, Russell, de Villiers, Sagvolden, Lamm & Taljaard, 1995; Sagvolden et
al., 1992). Unlike some other animal models in which the hyperactivity has been
caused by surgical, neurotoxic or environmental intervention, the SHR is
spontaneously hyperactive. Sagvolden et a!. (1992) obtained evidence which suggests
that the SHR are more sensitive to immediate reinforcement than control rats.
Methyiphenidate decreased the relative effectiveness of an immediate reinforcer and
increased the relative effectiveness of delayed reinforcers.
Russell et al. (1995) found differences between the SHR and control rats in
dopaminergic function in the prefrontal cortex, nucleus accumbens and caudate-
putamen. An experiment using a different animal model of ADHD (Kostrzewa, Brus,
Kalbfleisch, Perry & Fuller, 1994) similarly suggests that dopamine - as well as
serotonin - neurons are implicated in hyperactivity. These findings parallel the
findings with humans (section 1.11).
Owing to the advances in molecular genetics, reports, based on research on mice and
rats, are now appearing which suggest actual candidate genes for hyperactivity.
Moisan and colleagues (Moisan et al., 1996) carried out the first behavioural QTL
analysis in rat. The WKHA rats used in the study originate from an intercross
134
between the SHR and WKY rats (the control rats in the studies described above). A
QTL on chromosome 8 explained 29% of the variance of the intercross between the
strains, influencing spontaneous activity, activity in a novel environment and rearing
in the open-field.
A mouse model of hyperactivity based on the mouse mutant coloboma has provided
evidence for another candidate gene, the Snap gene (Hess, Collins & Wilson, 1996).
A deletion mutation (including the deletion of the Snap gene) causes the profound
hyperactivity the coloboma mice exhibit spontaneously. The replacement of the
deleted Snap gene with a Snap transgene resulted in the mice exhibiting normal
levels of locomotor activity.
3.4.5 Molecular genetic studies
Human homolog of the Snap gene?
The application of the findings regarding the Snap gene to humans has not been
successful. Hess et al. (1995) carried out linkage studies to determine whether the
human homolog of the Snap gene or other gene within the deletion interval would be
associated with ADHD. Five families, in which there appeared to be autosomal
dominant transmission, took part in the investigation. The ADHD diagnosis in
children under the age of 17 was based on a DSM-III-R -based interview with
parent(s) and on a T-score greater than 70 on the Hyperactivity Index of the
Conners' Parent Rating Scale. In older family members the diagnosis was based on
an interview with the individual and his/her spouse and on ratings by the individual's
mother or father on the Conners' scale.
The analyses failed to find any evidence for the predicted linkage. The authors
discuss several possibilities for this negative finding. For example, their sample may
not have been representative of the majority of ADHD families or a different
135
component of a 'critical pathway' might be involved in mice and in humans. With
regard to the pattern of inheritance for ADHD the authors conclude that 'although
the pedigrees employed in this study suggest autosomal dominant transmission with
variation in expression, multifactorial inheritance or the presence of a second gene
which modifies phenotype cannot be excluded with certainty' (p. 578).
The thy roid gene
Other studies have reported more success in the search for genes causing
hyperactivity in humans. Hauser et a!. (1993) studied 18 families (49 affected and 55
unaffected family members) with generalised resistance to thyroid hormone (GRTH),
a disease caused by mutations in the thyroid receptor-B gene. Among the children,
70% of the affected individuals and 20% of the unaffected individuals obtained a
diagnosis of ADHD (according to DSM-III-R criteria). Among the adults, 50% of
the affected individuals and 7% of the unaffected individuals met the criteria for
ADHD. This is evidence for a linkage between ADHD and the thyroid gene. Hauser
et a!. (1993) also discuss some possible mechanisms by which the thyroid receptor-
thyroid hormone complex could insert its influence on behaviour: it seems to be
involved in brain development and may influence catecholamine neurotransmitter
systems too.
However, as the incidence of the resistance to thyroid hormone in the population is
less than that of ADHD, it could only possibly be a small genetic subtype. Also, the
prevalence of GRTH in ADHD is very low and subsequent studies have not
supported the linkage of ADHD and GRTH (Elia, Gulotta, Rose, Mann & Rapoport,
1994; Valentine et al., 1997; Weiss et al., 1994; Weiss, Stein, Trommer & Refetoff,
1993).
136
Three dopaminergic genes
Because of the efficacy of pharmacological agents that act on the dopaminergic
system in the treatment of many ADHD children, the dopaminergic genes have been
considered as candidate genes for hyperactivity. Cook et al. (1995), using the
haplotype-based haplotype relative risk method (HHRR), investigated the possibility
of an association between ADHD and the dopamine transporter gene (DAT 1). The
HHRR avoids the problems associated with population stratification and the
classification of relatives with other psychiatric disorders as affected or unaffected; it
investigates whether, in the transmission of allele from parents to offspring, the ratio
deviates from the expected 50%.
The participants in the study were 49 children with ADHD and their parents and 8
children with undifferentiated attention deficit disorder (UADD) and their parents.
The diagnoses were based on DSM-III-R criteria and involved semistructured
interviews and several teacher and parent rating scales. In DSM-III-R children are
diagnosed as having UADD if they have attentional problems, but not enough
hyperactivity and impulsivity symptoms to reach the cut-off point for ADHD. The
results from the analyses suggested a significant association between ADHD/UADD
and the dopamine transporter gene. Excluding the UADD cases from the analyses
did not change the results. This association between ADHD and the dopamine
transporter polymorphism has recently been replicated in a study with 40 probands
and their parents, using the same methods as in the Cook et al. (1995) study (Gill,
Daly, Heron, Hawi & Fitzgerald, 1997).
A separate study suggests that three dopaminergic genes - dopamine D2 receptor
(DRD2), dopamine B-hydroxylase (DBH) and the dopamine transporter (DAT 1) - are
all involved in ADHD (Comings et al., 1996). Comings and colleagues (Comings et
al., 1991) had already earlier reported an association between ADHD and the
dopamine D2 receptor gene (DRD2).
137
The study focusing on the three dopaminergic genes (Comings et al., 1996)
investigated a group of patients originally diagnosed with Tourette syndrome
(N =255), their relatives (N= 192) and controls (N =67). A questionnaire which
included DSM-III and DSM-III-R items was used to make a diagnosis of ADHD and
other disorders. Each of the three dopaminergic genes was individually associated
with ADHD. The results provided further evidence for polygenic inheritance in that
the ADUD scores ranged from a high score (in the clinical range) for those who
inherited all the three alleles to a low score (in the normal range) for those who
inherited none of the three alleles. The three dopaminergic genes were also
associated with other behavioural variables (e.g. tics, stuttering, conduct and
oppositional disorders), but the association was strongest for ADHD (explaining
7.6% of the variance). A recent review (Blum et al., 1996) concludes that the D2
dopamine receptor gene is associated with a whole range of problem behaviours -
alcoholism, polysubstance abuse, smoking, obesity, Tourette syndrome and ADHD -
which the authors collectively call the 'reward deficiency syndrome'.
The dopamine D4 receptor gene polymorphism
Another development in the search for genes influencing the dopaminergic system is
the report by LaHoste et al. (1996) of an association between the dopamine D4
receptor gene polymorphism (located on chromosome 11) and ADHD. The
participants were 39 children between the ages of 7 and 12 years who were
diagnosed as having ADHD according to DSM-IV criteria. The DNA from the cases
was compared with that from carefully matched controls. The ADHD group differed
from the controls in that they were more likely to have the 7-fold repeat and less
likely to have the 4-fold repeat form (the most prevalent form in the human
population) of DRD4. There was some suggestion that children with ADHD who had
at least one 7-fold repeat allele were more severely affected than ADHD children
without this allele.
138
This research group recently replicated and extended the findings of their initial study
(Swanson, Sunohara et a!., 1998). The replication study employed a family-based
association design, instead of the population-association (case-control) design of the
initial study. Haplotype relative risk (HRR) analysis on the DNA from 52 families
(ADHD probands and their parents) provided evidence for an association between
the DRD4 gene and ADHD. However, having a 7-repeat allele of the DRD4 gene
caimot be a necessary condition for the diagnosis of ADHD, as only 50% of the
ADHD probands were in this category.
Swanson and colleagues (Swanson, Sunohara Ct al., 1998) also discuss the possibility
that ADHD would have both genetic and non-genetic etiologies: 'It has been
suggested that environmentally-alteredbrain development due to fetal distress, which
selectively damages dopamine neurons and affects cortical-basal ganglia dopamine
pathways, may increase risk for behavioral symptoms of ADHD. We hypothesize
that similar biological consequences (e.g. underactivity in cortical-basal ganglia
neural networks) may occur due to genetic factors (e.g. inheritance of a 7 + genotype
that produces a subsensitive dopamine D4 receptor variant) or to non-genetic factors
(e.g. damage to striatal dopamine neurons during fetal distress).' (pp. 39-40).
There are also reports of associations between the dopamine D4 receptor gene
polymorphisms and a personality trait known as novelty seeking (Benjamin et al.,
1996; Ebstein et al., 1996). Novelty seeking refers to characteristics such as
impulsiveness, exploration, changeableness and excitability - behaviours similar to
those observed in ADHD. A recent study indeed demonstrated that adult ADHD
patients score higher than normal controls on a novelty seeking scale (Downey,
Stelson, Pomerleau & Giordani, 1997).
Three investigations have failed, however, to replicate the finding of an association
between novelty seeking and the DRD4 7-repeat allele (Jönsson et a!., 1997;
Maihotra et a!., 1996; Vandenbergh, Zonderman, Wang, Uhi & Costa, 1997). The
139
results of a further study (Ebstein, Nemanov, Klotz, Gritsenko & Belmaker, 1997)
suggest the following conclusion: the effect of the DRD4 gene on novelty seeking is
small (explaining only about 3-4% of the variance) and therefore the 'noise'
generated by differences in methodology or demographic characteristics between
studies could have obscured the finding of an association.
To summarise, new evidence from molecular genetic studies on animals and humans
suggests several genes that may be implicated in hyperactivity. The dopaminergic
genes may provide a particularly fruitful direction for future research. The QTL
found on rat chromosome 8 is another candidate worth exploring further.
3.5 Chapter summary
The first half of this chapter introduced the methods of behaviour genetics. Family,
adoption and twin studies form the main quantitative genetic methods in research on
human behaviour. Family studies can be informative regarding the mode of
inheritance and they can also disconfirm a genetic hypothesis. Twin and adoption
studies can confirm the genetic hypothesis. The difficulty in obtaining the sample
often rules out the possibility of carrying out an adoption study.
The twin method relies on comparisons between monozygotic and dizygotic twin
pairs. Research supports the equal environments assumption, which underlies the
twin design, and shows that questionnaires achieve high levels of accuracy in
determining zygosity of twins. With regard to the representativeness issue, some
small differences between twins and singletons do exist, but these do not invalidate
genetic analyses. Whereas the quantitative genetic methods operate at the level of
overall genetic and environmental influences, molecular genetic techniques aim to
identify the actual genes influencing behaviour.
140
The second half of this chapter reviewed the research on hyperactivity which has
used these various behaviour genetic methods. Overall, the studies suggest a high
heritability for the dimension of hyperactivity in the general population, with genetic
factors accounting for approximately 60-70% of the variance. The non-shared
environment (including measurement error) rather than the shared environment
explains most of the remaining variance. The finding that the estimates vary
somewhat depending on the informant, and the evidence for rater bias in maternal
ratings, highlight the importance of obtaining ratings from multiple sources. Parent
reports on extreme hyperactivity show similarly high heritability. New evidence from
molecular genetic studies has already implicated several possible candidate genes that
may be involved in the etiology of hyperactivity.
141
Chapter 4
Co-occurrence of hyperactivity
and conduct problems
4.1 Conduct problems
Although hyperactivity frequently co-occurs with several other childhood disorders,
the strongest association is that with antisocial behaviours. In fact the co-occurrence
of the two conditions is so common that for a long time it was questioned whether
they can be distinguished at all (see Taylor, Schachar & Wieselberg, 1986). At
present the key challenge is to understand why this co-occurrence emerges. Studies
which aim to focus only on either hyperactivity or conduct problems also have to
explicitly consider how to tackle the issue of comorbidity. To place the co-
occurrence of conduct problems and hyperactivity in a theoretical context,
background issues relating to conduct disorder will be first briefly reviewed.
4.1.1 Defining features
The term 'externalising problems' encompasses not only hyperactivity but also
conduct problems. As with hyperactivity, conduct problems can either be consiclred
as a categorical classification or as a continuous dimension. Conduct problems or
142
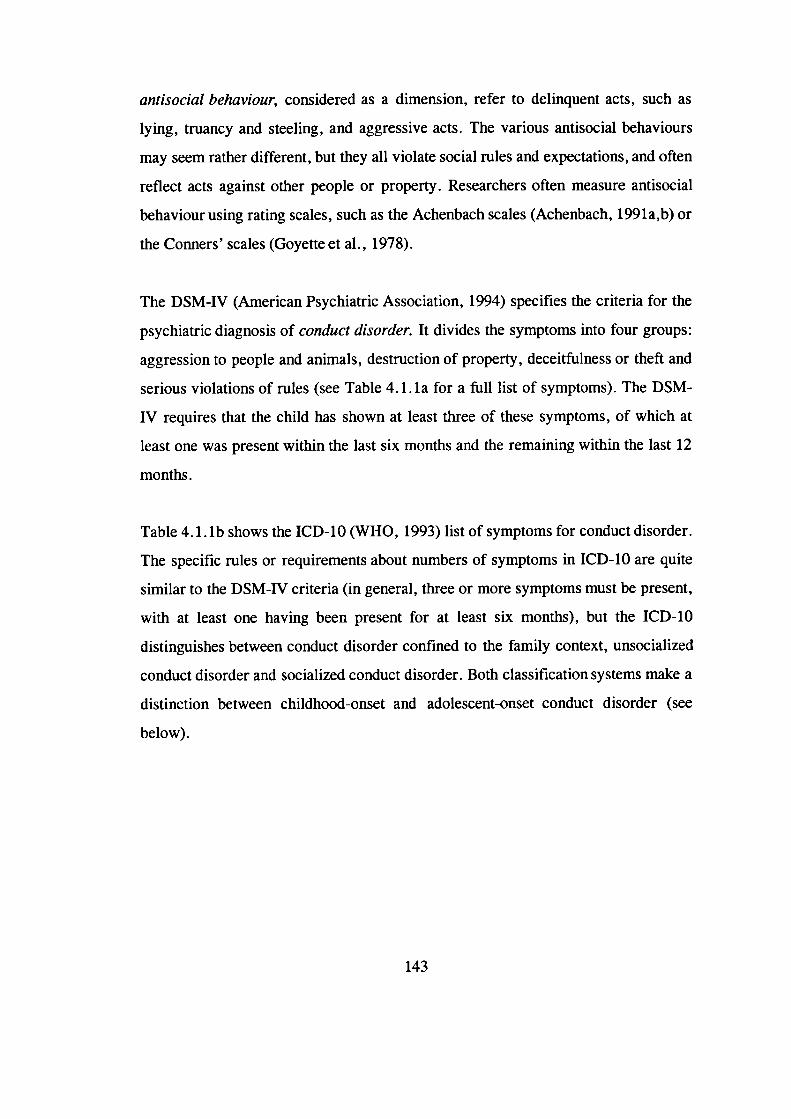
antisocial behaviour, considered as a dimension, refer to delinquent acts, such as
lying, truancy and steeling, and aggressive acts. The various antisocial behaviours
may seem rather different, but they all violate social rules and expectations, and often
reflect acts against other people or property. Researchers often measure antisocial
behaviour using rating scales, such as the Achenbach scales (Achenbach, 1991 a,b) or
the Conners' scales (Goyeue et al., 1978).
The DSM-IV (American Psychiatric Association, 1994) specifies the criteria for the
psychiatric diagnosis of conduct disorder. It divides the symptoms into four groups:
aggression to people and animals, destruction of property, deceitfulness or theft and
serious violations of rules (see Table 4.1. la for a full list of symptoms). The DSM-
IV requires that the child has shown at least three of these symptoms, of which at
least one was present within the last six months and the remaining within the last 12
months.
Table 4.1. lb shows the ICD-1O (WHO, 1993) list of symptoms for conduct disorder.
The specific rules or requirements about numbers of symptoms in lCD-b are quite
similar to the DSM-IV criteria (in general, three or more symptoms must be present,
with at least one having been present for at least six months), but the ICD-1O
distinguishes between conduct disorder confined to the family context, unsocialized
conduct disorder and socialized conduct disorder. Both classification systems make a
distinction between childhood-onset and adolescent-onset conduct disorder (see
below).
143

Table 4.1.la DSM-IV symptom list for conduct disorder
Aggression to people and animals1. often bullies, threatens, or intimidates others2. often initiates physical fights
3. has used a weapon that can cause serious physical harm to others(e.g. a bat, brick, broken bottle, knife, gun)
4. has been physically cruel to people5. has been physically cruel to animals6. has stolen while confronting a victim (e.g. mugging, purse snatching,
extortion, armed robbery)7. has forced someone into sexual activity
Destruction of property8. has deliberately engaged in fire setting with the intention of causing
serious damage9. has deliberately destroyed others' property (other than fire setting)
Deceitfulness or theft10. has broken into someone else's house, building, or car11. often lies to obtain goods or favors or to avoid obligations (i.e. "cons"
others)12. has stolen items of nontrivial value without confronting a victim
(e.g. shoplifting, but without breaking and entering; forgery)
Serious violations of rules13. often stays out at night despite parental prohibitions, beginning before
age 13 years14. has run away from home overnight at least twice while living in parental
or parental surrogate home (or once without returning for a lengthyperiod)
15. is often truant from school, beginning before age 13 years
144
Table 4.1.lb ICD-1O symptom list for conduct disorders
1. has unusually frequent or severe temper tantrums for his or herdevelopmental level
2. often argues with adults3. often actively refuses adults' requests or defies rules4. often, apparently deliberately, does things that annoy other people5. often blames others for his or her own mistakes or misbehaviour6. is often "touchy" or easily annoyed by others7. is often angry or resentful8. is often spiteful or vindictive9. often lies or breaks promises to obtain goods or favours or to avoid
obligations10. frequently initiates physical fights (this does not include fights with
siblings)11. has used a weapon that can cause serious physical harm to others (e.g.
bat, brick, broken bottle, knife, gun)12. often stays out after dark despite parental prohibition (beginning before
13 years of age)13. exhibits physical cruelty to other people (e.g. ties up, cuts, or burns a
victim)14. exhibits physical cruelty to animals15. deliberately destroys the property of others (other than by fire-selling)16. deliberately sets fires with a risk or intention of causing serious damage17. steals objects of non-trivial value without confronting the victim, either
within the home or outside (e.g. shoplifting, burglary, forgery)18. is frequently truant from school, beginning before 13 years of age19. has run away from parental or parental surrogate home at least twice or
has run away once for more than a single night (this does not includeleaving to avoid physical or sexual abuse)
20. commits a crime involving confrontation with the victim (includingpurse-snatching, extortion, mugging)
21. forces another person into sexual activity22. frequently bullies others (e.g. deliberate infliction of pain or hurt,
including persistent intimidation, tormenting, or molestation)23. breaks into someone else's house, building, or car
Recent genetic analyses on data from a large-scale twin study have provided support
for the view that conduct disorder represents an extreme of the normal variation in
conduct-disordered behaviour found in the general population (Slutske et al., 1997).
145
The study focused on conduct disorder symptoms in childhood and adolescence, but
adult twins provided the information retrospectively. Model-fitting analyses showed
that a multiple-threshold model fit the data. This suggests that subclinical
manifestations of conduct disorder lie on the same liability dimension as the
diagnosed disorder.
The prevalence rate of conduct disorder is between 2% and 6% among community
samples of children (see Kazdin, 1995). As with hyperactivity, conduct problems are
more common among boys than girls: the sex ratio is around 3-4:1 (see Zoccolillo,
1993). Among those children who show conduct problems from an early age, the
symptoms tend to persist over time (see below). The concept of heterotypic
continuity (Kagan, 1969) is again helpful: the underlying characteristics or tendencies
may be stable, but children of different ages show different symptoms. For example,
a young child, however aggressive or antisocial, would be unlikely to break into
someone else's house or force someone into sexual activity.
4.1.2 Subtypes
A substantial amount of evidence suggests that there are two distinct developmental
pathways to antisocial behaviour - one emerging in childhood and the other during
adolescence (see, for example, Hinshaw, Lahey & Hart, 1993). Both the DSM-IV
and the lCD-b also make the distinction between childhood-onset (onset prior to age
10 years) and adolescent-onset conduct disorder.
Hinshaw and colleagues (Hinshaw et al., 1993) and Kazdin (1995) have reviewed the
evidence supporting the distinction between the two subtypes. The symptoms of
oppositional defiant disorder - defiant, disobedient and hostile behaviours toward
authority figures - are considered early signs of childhood-onset conduct disorder.
The childhood-onset type is the more severe form, with stability over time: a link is
suggested from childhood-onset conduct disorder to antisocial behaviour in
146
adulthood. The co-occurrence of conduct problems and hyperactivity is specific to
conduct problems with childhood onset (see section 4.2.2 below).
Adolescent-onset conduct disorder is markedly less aggressive and less severe than
the childhood-onset subtype. It is less likely to continue beyond the adolescent years;
Moffitt (1993) suggests that the distinction between the two subtypes explains the
almost tenfold temporary increase in the prevalence of antisocial behaviour during
adolescence. In contrast to childhood-onset antisocial behaviour, which is much more
common among boys than girls, adolescent-onset antisocial behaviour is more evenly
distributed among the sexes. Peer influences are considered important in the etiology
of the adolescent-onset form of antisocial behaviour (Moffitt, 1993). The distinction
between childhood- and adolescent-onset conduct disorder in many respects mirrors
the previous distinction between aggressive and non-aggressive forms of conduct
disorder (see Hinshaw et a!., 1993).
4.1.3 Etiology
Environmentalfactors
Certain parenting practices, in particular lack of monitoring and harsh and
inconsistent discipline, are associated with aggressive and delinquent behaviours (for
a review, see Frick, 1994). For example, Kingston and Prior (1995) found that, in a
sample of 2-8-year-old children, harsh child-rearing practices were associated with
stable aggressive behaviour. Studies have linked conduct problems with various other
environmental factors too, such as dysfunctional family relationships and lower
socio-economic status (see Kazdin, 1995; Lahey et al., 1995).
There is a strong association between conduct disorder and parental (in particular
paternal) antisocial personality disorder, as well as other antisocial behaviours, such
as substance abuse (see Frick, 1994; Kazdin, 1995). However, demonstrating such
147
an association does not answer the question of whether the transmission is genetic,
environmental or a combination of both. An antisocial child with an antisocial father
may not only be copying his father's behaviour, but may also have inherited the
genes predisposing for aggressive behaviour.
Most studies investigating the role of environmental factors in conduct problems have
not explicitly distinguished between the childhood- and adolescent-onset subtypes.
Nevertheless, many of the parenting variables have been associated with conduct
problems in pre-adolescent children and therefore seem to play a role in childhood-
onset antisocial behaviour (see Kazdin, 1995; Kingston & Prior, 1995). Adolescent-
onset antisocial behaviour is thought to relate particularly to peer influences, which
may itself be related to factors such as lack of monitoring and disadvantaged
neighbourhood.
Genetic effects
Before investigators became aware of the distinction between childhood- and
adolescent-onset antisocial behaviour, the inconsistent findings regarding genetic
effects presented a puzzle. There is only slight evidence of genetic effects on juvenile
delinquency (McGuffin & Gottesman, 1985). Criminality and antisocial personality
disorder in adulthood show marked heritability, however (McGuffin & Gottesman,
1985; see also Plominet a!., 1997).
The 'two developmental pathways' view explains these findings as showing that
genetic factors do not play a major role in adolescent-onset conduct disorder (juvenile
delinquency), whereas there are moderately strong genetic effects on childhood-onset
conduct disorder (with criminality as one manifestation of the disorder in adulthood).
In their review of the genetic literature, Dilalla and Gottesman (1989) used the terms
'transitory delinquents' and 'continuous antisocials', which nicely capture the
difference between the two subtypes.
148
Two recent twin studies which used the Child Behaviour Checklist and obtained their
samples from the general population exemplify the results for the continuous
dimensions of aggressive and delinquent behaviours. Edeibrock, Rende, Plomin and
Thompson (1995) studied a sample of 99 MZ and 82 DZ twin pairs and Schmitz,
Fuller and Mrazek (1995) a sample of 66 MZ and 137 DZ twin pairs. The
heritability estimates were 60% for the Aggressive behaviour subscale and 35% for
the Delinquent behaviour sub scale in the Edeibrock et al. (1995) study; the estimates
were 55% and 79%, respectively, in the Schmitzet al. (1995) study. The two studies
obtained comparable results for the Aggressive behaviours subscale, but how could
we explain the widely different estimates for the Delinquent behaviours subscale?
Again, the age of the children might provide an explanation: the average age of the
children was 11.0 years (range 7-15 years) in the Edeibrock et a!. study and 7.6
years (range 4-18 years) in the Schmitz et al. study. More children in the study by
Edeibrock et a!. may have showed adolescent-onset antisQcial behaviour, which the
lower heritability estimate for the Delinquent behaviours subscale may indicate.
Perhaps providing some direction for molecular genetic investigations, studies have
linked antisocial behaviour to reduced levels of serotonin and norepinephrine (see
Pennington & Ozonoff, 1996). A recent study (Unis et at., 1997) reported an
increase in whole blood serotonin levels in adolescents with childhood-onset conduct
disorder, compared to adolescents with adolescent-onset conduct disorder. In section
1.11.3 we discussed the association between hyperactivity and serotomn levels. Unis
et al. (1997) did not report rates of co-occurring hyperactivity in their samples, but
noted that the two groups did not differ in rates of comorbid ADHD diagnoses. This
suggests that their samples of the two types of conduct disorder may not be
representative of other such samples and therefore it is difficult to judge the
significance of these results.
An important finding has emerged from analyses on Swedish adoption data on
criminality in adulthood: environmental stressors seem to interact with specific
149
genetic predispositions, either increasing or decreasing the risk of different genotypes
(Bohman, 1996). This evidence of gene-environment interaction shows how genes
may operate by influencing an individual's susceptibility to environmental stressors.
4.1.4 Cognitive impairments?
Studies on possible cognitive deficits in children with conduct problems have
produced mixed results, in part because of methodological limitations. Recent
reviews on hypothesised executive function (Pennington & Ozonoff, 1996) and
response inhibition (Oosterlaan, Logan & Sergeant, 1998) deficits in both conduct
disorder and ADHD provide a useful framework for discussing the findings. Both
reviews were discussed in more detail in chapter two; here the main findings are only
briefly summarised as they relate to conduct disorder.
In their review of executive function (EF) deficits in childhood disorders, Pennington
and Ozonoff (1996) summarised the studies which had tested the EF hypothesis in
relation to conduct disorder. Nine studies fulfilled their criteria of (1) an explicit test
of the frontal hypothesis of conduct disorder or use of commonly accepted EF
measures; (2) publication in a refereed journal; and (3) inclusion of a control group
(Dykman & Ackerman, 1991; Hurt & Naglieri, 1992; Lueger & Gill, 1990;
McBurnett et a!., 1993; Moffitt & Henry, 1989; Moffitt & Silva, 1988; Moffitt,
Lynam & Silva, 1994; Seguin, Pihi, Harden, Tremblay & Boulerice, 1995; and
White et a!., 1994).
There was evidence of poor performance on EF measures in both clinic-referred and
population samples of children with conduct disorder, and this was not due to lower
IQs of these children. The crucial finding, however, was that this only held for
children who showed both conduct disorder and ADHD symptoms; conduct disorder
on its own was not associated with poor performance on EF tasks. Pennington and
Ozonoff (1996) concluded that some non-EF measures (in particular verbal
150
measures, such as verbal IQ) often show a stronger association with conduct disorder
than do EF measures. A limitation of the review, which reflects a limitation of the
studies included in the review, is that no distinction was made between childhood-
and adolescent-onset conduct disorder.
The review of stop task studies (Oosterlaan et a!., 1998) concluded that children with
conduct disorder were indistinguishable from children with ADHD. (See section
2.2.3 for a critique of the meta-analysis.) Both groups of children had flatter
inhibition slopes than the control children. However, the results regarding conduct
disorder were inconsistent across studies. The authors did not report the results for
the standard deviations of reaction times. For the mean reaction times, the results
are difficult to interpret due to methodological reasons (Oosterlaan et al., 1998).
The only safe conclusion at present is that we do not yet know how conduct
disorder, independent of ADHD, relates to performance on the stop task and other
measures of response inhibition. As the children in the stop task studies were aged
between 6 and 12 years, we know even less about any possible link between
adolescent-onset conduct disorder and performance on such tasks.
The research literature on the association between the disruptive behaviour
disorders and academic underachievement was reviewed in section 1.8.1. The
conclusion was that in childhood the link is stronger for hyperactivity (Frick et al.,
1991; Sonuga-Barke et al., 1994), though by adolescence there is a clear association
between antisocial behaviour and underachievement (see Hinshaw, 1992b).
Antisocial behaviour and delinquency are associated with low verbal intelligence in
particular (see Earls, 1994).
The possibility that poor performance on psychological tests and tasks could also
reflect 'task engagement' factors, such as delay aversion, rather than a cognitive
deficit was discussed in some detail in chapter two. Very few methodologically
strong studies have investigated this possibility with regard to children with conduct
151
problems. The study by Sonuga-Barke, Taylor and Heptinstall (1992; see section
2.4.3), which investigated the effects of presentation time on task performance,
found that the conduct disorder -only group of 6-8-year-old girls did not show the
same tendency to choose shorter presentation times as the hyperactive and comorbid
hyperactive and conduct problem groups.
The inconsistent findings regarding the association between conduct disorder and
performance on cognitive and other tasks may reflect, in part, a lack of a proper
theoretical framework. Studies have often failed to adopt a developmental perspective
to antisocial behaviour. Before asking the question of whether hyperactivity and
conduct disorder are associated with the same 'deficits' on certain tasks, it is essential
to consider the reasons for the co-occurrence of the two disorders.
4.2 Co-occurrence of conduct problems and hyperactivity
4.2.1 Prevalence
In general, between 25% and 50% of hyperactive children show conduct problems
by adolescence (e.g. Barkley, Fischer, Edelbrock & Smallish, 1990; Eiraldi, Power
& Maguth Nezu, 1997; Gittelman, Mannuzza, Shenker & Bonagura, 1985; Loney,
Whaley-Klahn, Kosier & Conboy, 1983; Mannuzza et al., 1991). The exact rate of
co-occurrence depends crucially on how each disorder is defined. For example, in a
sample of 6-12-year-old children, 44% of those with ADHD combined type (based
on DSM-IV criteria) met diagnostic criteria for conduct disorder, compared to none
of those with the inattentive type of ADHD (Eiraldi et al., 1997).
McArdle, O'Brien and Kolvin (1995) investigated the relationship between
hyperactivity and conduct disorder in a large community-based sample. The children
152
were aged 7 and 8 years and 11 and 12 years. McArdle et a!. (1995) defined conduct
disorder based on data from semi-structured parent interviews and hyperactivity
based on the Rutter teacher and parent scales.
Grouping situational and pervasive hyperactivity together, 28% of the younger and
13% of the older children with hyperactivity had conduct problems. Of the younger
children with pervasive hyperactivity, a total of 44% were conduct disordered, of
whom 7% severely so. For the older children with pervasive hyperactivity, the
figures were 28% and 11 %, respectively. But how large proportion of children with
conduct problems are also classified as hyperactive? Almost all (93%) of the younger
children with conduct problems, but somewhat fewer (65%) of the older children,
had either situational or pervasive hyperactivity. Considering only pervasive
hyperactivity, 32% of the younger children and 26% of the older children with
conduct problems were also classified as hyperactive.
These prevalence figures show that, when defining hyperactivity as including both
situational and pervasive subtypes, hyperactivity was virtually a prerequisite for
conduct disorder among the younger children. The opposite was not true, however:
the majority of hyperactive children, in either age group, did not have comorbid
conduct disorder. When using the pervasiveness criterion for hyperactivity, the
prevalence rate differences between hyperactive children showing conduct problems
and conduct disordered children showing hyperactive symptoms were less obvious.
Overall, these fmdings confirm the high rates of co-occurrence between the two
disorders. There is also a strong association between the dimensions of conduct
disorder/oppositional behaviour and hyperactivity. The correlations between the
dimensions for the same rater are around .6 and for different raters around .4 (which
is as high as correlations between raters for the same psychopathology) (Fergusson,
Horwood & Lloyd, 1991).
153
4.2.2 Reasons for the co-occurrence
Silberg et al. (1996) point out that there are two different strategies for examining the
reasons for the co-occurrence of two disorders. The first strategy investigates causal
influences that are separate for the two disorders, as well as causal influences that the
disorders may share. The second strategy focuses on the developmental pathways of
the disorders.
Following the first approach, Silberg et al. (1996) analysed data from the Virginia
Twin Study of Adolescent Behavioral Development (VTSABD) to explore the
possibility of shared genetic effects on hyperactivity and conduct problems. The
analyses focused on mothers' ratings (both biological and adoptive) of 265 MZ and
163 DZ male-male, 347 MZ and 160 DZ female-female, and 262 male-female twin
pairs. See section 3.4.3 for a discussion of the measures used in the study.
Silberg et al. (1996) carried out bivariate model fitting analyses, using the Cholesky
decomposition model (see section 6.1.3), separately for the younger cohort (8-11
years) and the older cohort (12-16 years). In the younger cohort, the covariation
between hyperactivity and conduct problems was almost entirely due to genetic
factors. For both girls and boys, the same set of genes were influencing the two
types of problem behaviours. A very different pattern of results emerged for the
older cohort: there was evidence of a distinct set of genes influencing hyperactivity
and conduct problems.
A latent class analysis of the VTSABD data on antisocial behaviours provided further
evidence for this: Silberg and colleagues (Silberg et a!., 1995) showed that separate
classes of 'pure' conduct problems and comorbid hyperactivity-conduct problems
emerged. There were strong genetic effects on the comorbid class, whereas the pure
conduct problems class had a very strong shared environmental component.
154
The recent twin study by Nadder et al. (1998; see section 3.4.3) confirmed the
finding from the Silberg et al. (1996) study of a common genetic factor influencing
the coexpression of ADHD and ODD/CD symptomatology. Although the results
suggested that the two phenotypes share only 50% of the additive genetic factors, this
finding may be due to the study not distinguishing between childhood- and
adolescent-onset conduct problems (the children were aged between 7 and 13 years).
To investigate more directly the developmental progression of the disorders, Taylor
and colleagues (Taylor, Chadwick, Heptinstall and Danckaerts, 1996) carried out a
longitudinal study. The first phase of the study involved screening a population of 6-
and 7-year-old boys and obtaining ratings on the Rutter scales from teachers and
parents. More detailed data, including interview with parents (the Parental Account
of Children's Symptoms, i.e. PACS), was obtained for a selected subsample of the
children. At the follow-up stage, when the boys were aged between 16 and 18 years,
the parents again completed the Rutter scale and were interviewed using the Parental
Account of Child and Adolescent Symptoms (PACAS).
This longitudinal approach revealed an interesting developmental pattern:
hyperactivity in childhood predicted conduct problems in adolescence, whereas
conduct problems in childhood did not predict adolescent hyperactivity. This led the
authors to conclude that the two conditions frequently co-occur because conduct
disorder is a complication of hyperactivity. The children in the comorbid group were
similar to the hyperactive-only group on various outcome measures. In children
showing symptoms of both conditions, hyperactivity seems to be the primary
problem.
Taylor et al. (1996) emphasise that their suggestion 'is not the same as the idea that
hyperactivity represents an early stage of a single disorder of which conduct disorder
is a later stage. The development of poor social adjustment in the hyperactive group
did not depend on the development of antisocial symptoms; to the contrary,
155
antisociality as such played only a weak role in determining later social adjustment'
(p. 1224).
4.3 Chapter summary
Antisocial behaviour, or the diagnosis of conduct disorder, refers to aggressive and
delinquent acts. Several studies indicate an association between environmental
factors, such as parenting characterised by harsh discipline and lack of monitoring,
and children's antisocial behaviour. The distinction between childhood-onset and
adolescent-onset conduct problems is important. Genetic factors seem to be play a
more important role in the etiology of childhood-onset antisocial behaviour.
Adolescent-onset antisocial behaviour is more common and less severe, and peer
influences in particular are thought to be involved in the etiology of this subtype.
The two types of externalising behaviours frequently co-occur in the same children.
However, although hyperactivity predicts later conduct problems, the reverse is not
true. In section 1.8 the various possibilities for explaining the co-occurrence of two
conditions were discussed, using the framework of Caron and Rutter (1991). Recent
evidence provides strongest support for the view that hyperactivity increases the risk
for conduct problems. Taylor Ct al. (1996) suggest that hyperactivity raises the
likelihood of impaired social adjustment, including the development of conduct
problems. This refers to childhood-onset antisocial behaviour; adolescent-onset
antisocial behaviour is not associated with hyperactivity.
Although hyperactivity may lead to conduct problems, not all hyperactive children
will follow this pathway; some of them will not show any symptoms of conduct
disorder. Regarding performance on psychological tests or tasks, a largely
unresolved issue is the extent to which any true or apparent deficits on hyperactive
156
children's task performance are related to the co-occurring conduct disorder
symptomatology or to the 'core' hyperactivity symptomatology itself.
157
Chapter 5
Aims of the study
5.1 Integration of the literature
Chapters one to three reviewed the research literature on hyperactivity. The first
chapter focused on general background literature. Between 2% and 7% of children
could be classified as hyperactive and longitudinal investigations show that the
symptoms tend to persist over time. Hyperactive children frequently suffer from
other problems too, such as learning disabilities, anxiety disorders and, in
particular, antisocial behaviour. Although most studies on hyperactivity have
adopted a categorical approach, research suggests an underlying continuous
dimension of hyperactivity.
Studies on cognitive and task engagement factors in hyperactivity (chapter two)
provide little support for the view that the core 'deficit' would be one of sustained
attention. Several alternative theories have attempted to explain the emerging
pattern of findings. A popular theory is the response inhibition hypothesis.
Evidence for this view comes from studies which show group differences between
hyperactive and control children on inhibition tasks. The debate, however, centers
on the interpretation of these group differences. It now appears that hyperactive
children are not less likely to trigger the inhibitory process than other children, nor
158
is their inhibitory process more variable. Rather, the group differences emerge
because children with hyperactivity are generally slower and more variable in their
speed of responding on these tasks. To confirm that these results, particularly that
of slower speed of the inhibitory process, are not an artifact of selection, it would
be important to show that this pauern of responding is also characteristic of a
general population -based sample of hyperactive children and not only of clinic-
based samples.
Another hypothesis of the presumed cognitive deficits in hyperactivity focuses on
working memory. This view reflects an attempt to explain the findings that
children with hyperactivity tend to perform poorly on various executive function
measures. The argument is that the function which all the so-called executive
function measures share is that of working memory. The available evidence
suggests that children with hyperactivity may perform poorly on some working
memory measures. As the evidence is very limited, it would be important to study
the working memory performance of an unbiased sample of hyperactive children.
In contrast to these cognitive theories, the delay aversion hypothesis suggests that
children with hyperactivity simply have aims that are different from those of other
children: in their behaviour and task performance they aim to reduce overall
periods of delay. Evidence from several studies supports this hypothesis.
Chapter three reviewed the research on genetic factors in hyperactivity. It is clearly
a condition which has a very strong genetic component. Twin studies suggest a
heritability of around 60-70% and molecular genetic studies have started to provide
preliminary evidence about specific genes which may be involved.
A general picture of hyperactivity is slowly emerging. It all seems to start from
genes. Certain genes start a chain of changes which in the end results in an
individual showing a tendency to behave in an overactive, impulsive and inauentive
maimer. However, genes do not in some mysterious way cause behaviour directly.
159
Genes simply code for proteins, which create the different physiological systems
(the skeletal system, muscles, the endocrine system, the immune system, the
digestive system and, most important for behaviour, the nervous system).
At the neurochemical level, the evidence is strongest for the involvement of
dopamine and norepinephrine in hyperactivity. Research implicates the frontal-
striatal circuits as the areas of the brain whose functioning the 'hyperactivity genes'
seem to influence. These differences in how the brain functions between
individuals with and without hyperactivity could cause the group differences on the
psychological tests or tasks. This cognitive or motivational level could also be seen
as mediating the link between genetic factors and behaviour.
An important issue to remember is that whatever the specific associations of
hyperactivity are at the various levels of the 'causal pathway', the differences
between individuals with and without hyperactivity need not be qualitative, but
may simply be quantitative. Another important issue is the possible heterogeneity
in hyperactivity. One should also not forget that the heritability of hyperactivity,
though high, is not 100%: the environment must play a role too.
Chapter four reviewed the research on conduct problems and on the co-occurrence
of conduct problems and hyperactivity. Studies indicate an association between
environmental factors, such as parenting characterised by harsh discipline and lack
of monitoring, and children's antisocial behaviour. The co-occurrence of
hyperactivity and antisocial behaviour is specific to childhood-onset conduct
problems. Recent research suggests that hyperactivity may lead to conduct
problems; this would also explain the findings of shared genetic effects on the two
types of externalising behaviours. These new findings lead to new research
questions. We do not yet know, for example, to what extent any true or apparent
deficits on hyperactive children's task performance are related to the co-occurring
conduct problem symptomatology or to the 'core' hyperactivity symptomatology
itself.
160
5.2 Aims and hypotheses
The present study was an attempt to start to integrate the disparate sub-fields of
research on hyperactivity. The main hypothesis combines the research traditions
of behaviour genetic studies and studies testing psychological theories of
hyperactivity: the cognitive impairments or task engagement factors associated
with hyperactivity mediate the genetic effects on the condition. It was possible to
investigate this by establishing whether the genetic influences on ratings of
hyperactivity are also those which produce poor performance on the measures. The
present design allowed the testing of this type of a genetic hypothesis, as we
employed a twin design.
The study also aimed to investigate the task performance of hyperactive children in
more detail. The three theories of hyperactivity which we focused on are those of
response inhibition deficit, working memory impairment and delay aversion. We
contrasted the relative efficacy of tasks related to each of these theories in
differentiating children with hyperactivity from control children. The hypothesis
was that children with hyperactivity perform worse than control children on tasks
measuring inhibition, working memory and delay aversion. In contrast to most
previous studies, the present sample of hyperactive children was obtained from the
general population and is therefore unbiased. As recent evidence seems to provide
somewhat stronger support for the delay aversion than the other two theories, we
could investigate the possibility that the delay aversion task would be a better
discriminator between the groups than the other tasks. We also aimed to explore
the largely neglected issue of possible sex differences in hyperactive children's
performance on the tasks.
From a behaviour genetic perspective, the present study had several further aims.
We aimed to replicate the previous findings of high heritability both for the
dimension of hyperactivity and for extreme hyperactivity. As a measure of
hyperactivity we used the Conners' Revised Teacher and Parent Rating Scales.
161
These questionnaires are frequently used in hyperactivity research but have not, to
our knowledge, been used in a twin study before. Another aim was to explore the
extent to which hyperactive children's performance on the various tasks is
influenced by genetic, shared environmental and non-shared environmental
factors.
This study also attempted to provide further insight into the co-occurrence of
hyperactivity and conduct problems. We aimed to explore the extent to which
hyperactive children's poor performance on any of the tasks is related to the co-
occurring conduct problem symptomatology. The study also aimed to replicate the
recent findings of shared genetic effects on hyperactivity and conduct problems.
In contrast to the previous studies exploring this issue, which considered
hyperactivity as a continuous dimension, we focused on extreme hyperactivity.
In addition to the main hypotheses and aims outlined above, the study design also
allowed an investigation of several other issues that may further our understanding
of hyperactivity. We aimed to investigate whether a population-based sample of
hyperactive children have lower average IQs than other children. If hyperactivity
were associated in our sample with lower IQs, we could investigate whether this
would explain any possible group differences on performance on the various tasks.
A further aim was to explore the possibility of shared genetic effects on extreme
hyperactivity and IQ. With regard to task performance, we also aimed to
investigate possible age effects.
As hyperactivity is frequently associated with not only conduct problems, but also
other types of problems, such as anxiety, we aimed to investigate this in our
population-based sample of hyperactive children. We also aimed to explore the
possibility of co-occurring anxiety symptoms influencing task performance. The
twin design also allowed us to investigate the heritability of the other types of
problem behaviours, as well as the heritability of IQ. In addition, although the
162

study focused on pervasive hyperactivity, we aimed to examine the extent to which
there is cross-informant consistency in ratings of hyperactive behaviour.
A further aim of this study was to obtain UK norms for the Revised Conners'
Teacher Rating Scale. The original norms are based on a rather small North
American sample, for which the data was collected 20 years ago (Goyette et al.,
1978).
163
Chapter 6
Design and Methodology
6.1 Analysis of twin data
6.1.1 Twin correlations
The fact that DZ twins share approximately half their genes and MZ twins all their
genes provides the basis for analysing twin data. Based on this genetic relatedness
and the assumption that the environments for MZ and DZ twins are roughly equal
(the equal environments assumption, see section 3.1.3), it is possible to quantify
the importance of genetic and environmental factors in causing differences between
individuals on traits or abilities.
In the basic equation, variance in a phenotype (V p) is divided into that due to
additive genetic factors (A) and that due to the environment (common or shared, C,
and nonshared, E):
V = A2 + C2 + E2
164
Within-pair correlations between twins provide estimates of the A, C and E terms:
rMz = A2 + C2
rDz = ½A2 + C2
Inspection of the twin correlations gives an indication of the importance of the A
and C terms. If the twin correlations are approximately the same for MZ and DZ
twins, this suggests a role for the shared environment but not for genetic factors.
An MZ correlation twice the size of a DZ correlation suggests that additive genetic
factors may be important for the trait. A larger difference between the MZ and DZ
correlations suggests that, in addition to additive genetic factors, nonadditive
genetic factors, or contrast effects (sibling interaction and/or rater bias), contribute
to the phenotypic variance too. (Only if there is no shared environmental influence,
can the nonadditive genetic effects be estimated.) An MZ correlation less than
twice the size of the DZ correlation suggests that both additive genetic and shared
environmental factors are important.
Obtaining estimates for the A, C and E terms from these basic calculations has its
limitations. First, this approach does not allow one to test whether a particular
parameter differs significantly from zero. Second, it does not take into account
variance differences between twins. Model fitting provides a method which
overcomes these limitations.
6.1.2 Model fitting
Structural equation modelling (SEM) combines two methods of analysis: path
analysis and factor analysis. The term structural equation refers to a regression
equation in the context of a causal model. The aim in a factor analysis is to account
for the correlation (covariance) between sets of measures in terms of a smaller
number of underlying dimensions (factors). The form of factor analysis used in
SEM is called confirmatory factor analysis. In contrast to exploratory factor
165
analysis, which is data-driven, confirmatory factor analysis tests a hypothesised set
of relationships between the measured variables by using latent (unobserved)
variables. The latent variables are commonly theoretical constructs which are
thought to explain the covariance between two or more measured variables.
In short, SEM is a theory-driven method for testing the fit of multiple relationships
simultaneously; the relationships between variables can be unidirectional or two-
directional (correlational). Various packages exist for carrying out SEM analyses.
We used the EQS (Bentler, 1995) to analyse the present data.
In SEM terminology, problems of identification refer to the restrictions on the
number of free parameters that can be estimated from the number of data points
specified. A model is under-identified, if one or more of the parameters cannot be
estimated due to insufficient number of data points. If there is exactly the same
number of data points as there are parameters, the model is said to be just-
identified. An over-identified model has fewer parameters than there are data
points.
In SEM, estimating parameters is an iterative process. The programme first derives
the goodness of fit using some initial values for the parameters that it needs to
estimate. The programme then determines which parameter changes lead to an
improvement in the fit. This is repeated until the fit cannot be improved any
further. The fit of the model is evaluated based on several fit indices. In analysing
the present data, we used the following fit indices: chi-square, Akaike's
information criteria and comparative fit index (see Table 6.1.2).
As the aim is to choose the model that best fits the data, the investigator has to
compare different models of the same data. It is possible to carry out a statistical
comparison, if the models are nested. The models are nested, if a subset of free
parameters in one model is contained in the other model. The investigator can then
calculate the change in the chi-square value (A 2). Choosing the model that best
166
fits the data follows the principle of parsimony. If a parameter can be dropped
without it significantly worsening the fit of the model, it is dropped. That is, the
aim is to choose the model with the fewest parameters, without significant
deterioration in fit.
Table 6.1.2 Fit indices used in present thesis
Symbol Method of evaluation
Chi-squareGiven that the model is correct and the sample sizesufficiently large, this is the likelihood ratio test statistic fortesting the model against the alternative that the covariancematrix is unconstrained. The smaller the value, the better thefit.
AIC Akaike's information criteriaThis takes into account both the statistical goodness of fit andthe number of parameters that have to be estimated. Themodel with the lowest value, which should ideally benegative, is the one with the best fit.
CFI Comparative fit indexThis is based on the value of the fitting function for thecurrent model and varies between zero and one. For themodel to be considered adequate, the value should be above0.9 (Dunn, Everitt & Pickles, 1993).
6.1.3 Model fitting with twin data
The univariate model
In model fitting with twin data, the MZ and DZ covariance matrices provide the
data against which the model is tested. Latent variables in this type of analysis are
the A, C and E terms. Figure 6.1 .3a shows the simple univariate model (the full
ACE model; Neale & Cardon, 1992). The covariance between the A terms is set to
167
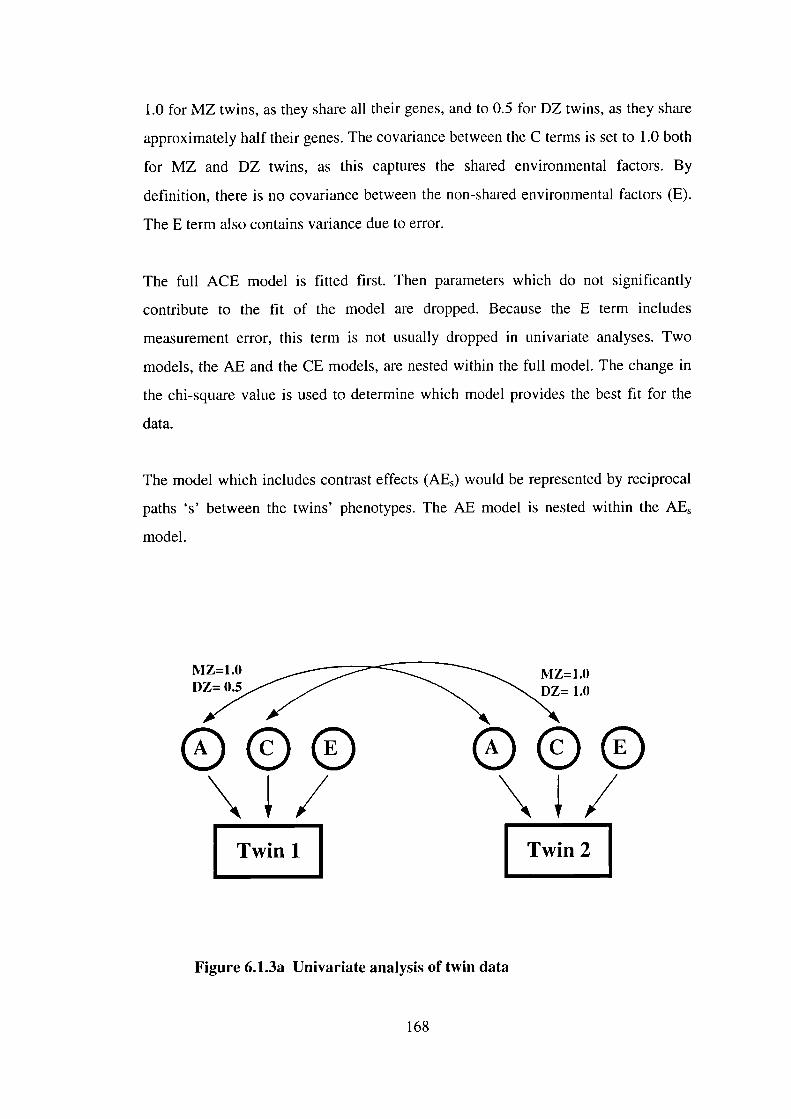
1.0 for MZ twins, as they share all their genes, and to 0.5 for DZ twins, as they share
approximately half their genes. The covariance between the C terms is set to 1.0 both
for MZ and DZ twins, as this captures the shared environmental factors. By
definition, there is no covariance between the non-shared environmental factors (E).
The E term also contains variance due to error.
The full ACE model is fitted first. Then parameters which do not significantly
contribute to the fit of the model are dropped. Because the E term includes
measurement error, this term is not usually dropped in univariate analyses. Two
models, the AE and the CE models, are nested within the full model. The change in
the chi-square value is used to determine which model provides the best fit for the
data.
The model which includes contrast effects (AE) would be represented by reciprocal
paths 's' between the twins' phenotypes. The AE model is nested within the AE
model.
MZ=1.O MZ=1.0D,_..1ZIIITZ 1.0
Twini Twin2
Figure 6.1.3a Univariate analysis of twin data
168
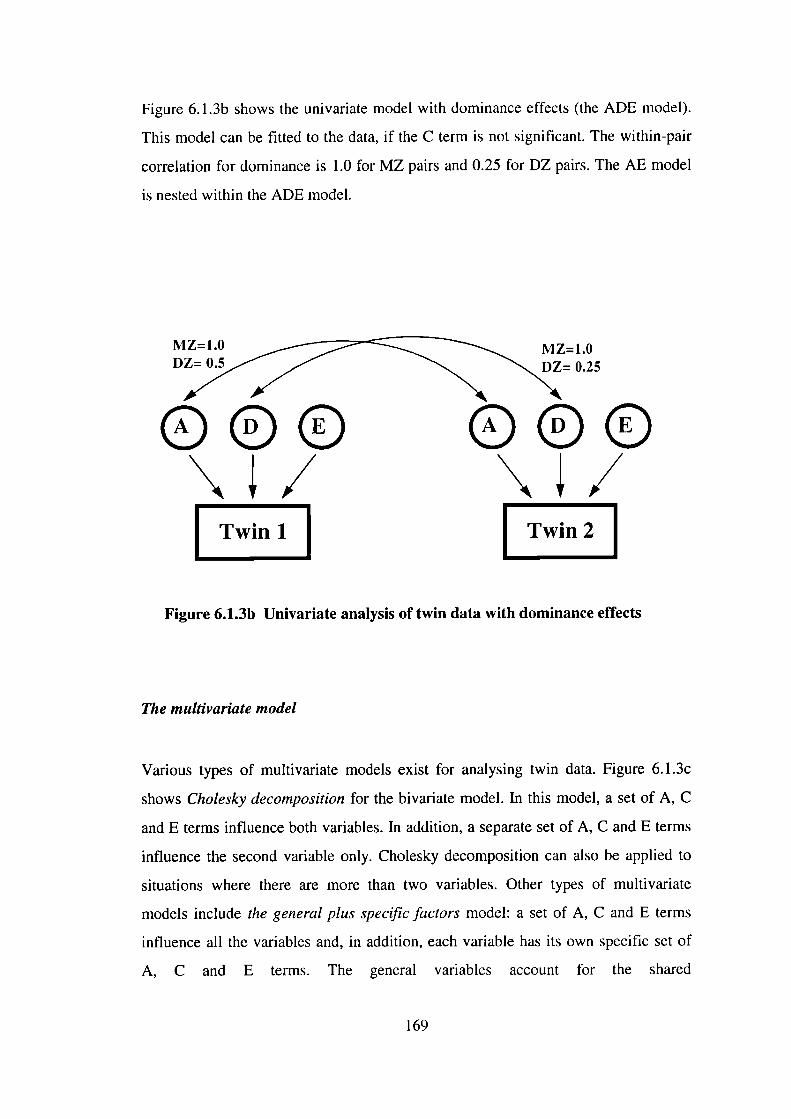
Figure 6.1.3b shows the univariate model with dominance effects (the ADE model).
This model can be fitted to the data, if the C term is not significant. The within-pair
correlation for dominance is 1.0 for MZ pairs and 0.25 for DZ pairs. The AE model
is nested within the ADE model.
0.25
Twin2
Figure 6.1.3b Univariate analysis of twin data with dominance effects
The multi variate model
Various types of multivariate models exist for analysing twin data. Figure 6.1 .3c
shows Cholesky decomposition for the bivariate model. In this model, a set of A, C
and E terms influence both variables. In addition, a separate set of A, C and E terms
influence the second variable only. Cholesky decomposition can also be applied to
situations where there are more than two variables. Other types of multivariate
models include the general plus specific factors model: a set of A, C and E terms
influence all the variables and, in addition, each variable has its own specific set of
A, C and E terms. The general variables account for the shared
169
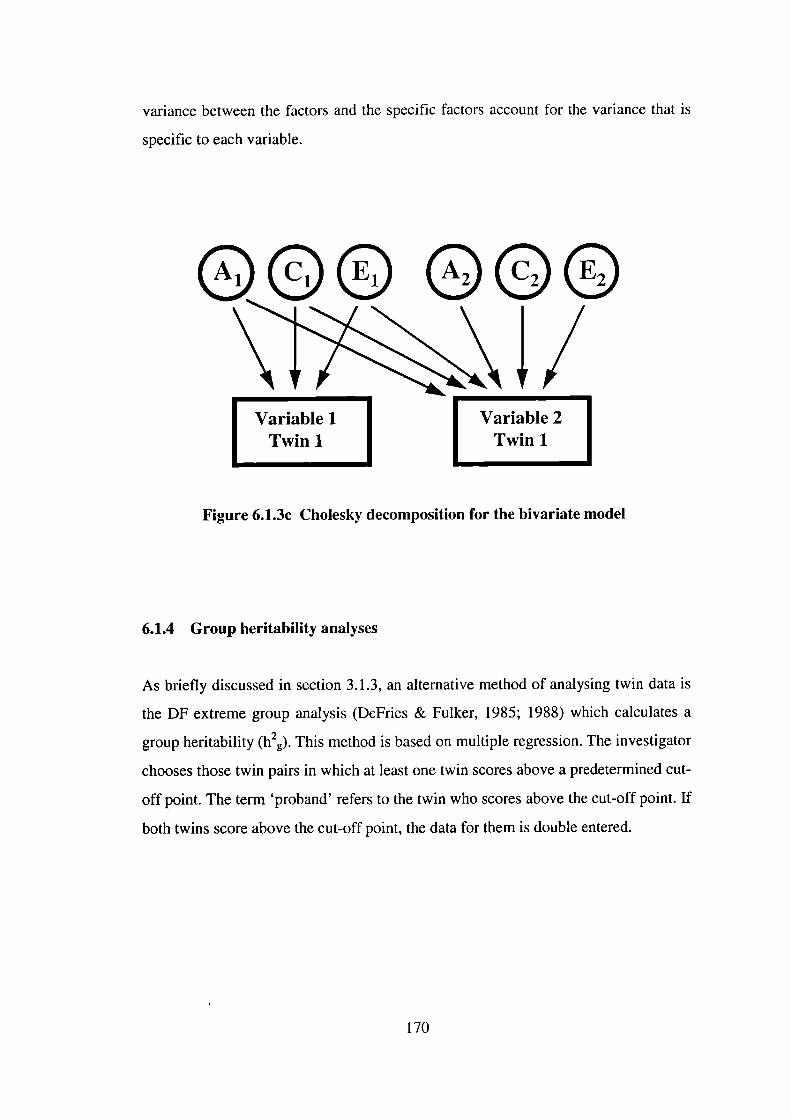
variance between the factors and the specific factors account for the variance that is
specific to each variable.
0 ©
Figure 6.1.3c Cholesky decomposition for the bivariate model
6.1.4 Group heritability analyses
As briefly discussed in section 3.1.3, an alternative method of analysing twin data is
the DF extreme group analysis (DeFries & Fulker, 1985; 1988) which calculates a
group heritability (h2g). This method is based on multiple regression. The investigator
chooses those twin pairs in which at least one twin scores above a predetermined cut-
off point. The term 'proband' refers to the twin who scores above the cut-off point, if
both twins score above the cut-off point, the data for them is double entered.
170
This method calculates the regression toward the mean for MZ and DZ co-twins of
probands. In the regression equation, the predictors are the proband's score (P) and
the coefficient of genetic relatedness between the twins (R; 1.0 for MZ twins and
0.5 for DZ twins). The response (dependent) variable is the co-twin's predicted
score (C).
C = B 1P + B2R + A
B 1 is the partial regression of co-twin's score on proband's score and B 2 is the
partial regression of co-twin's score on coefficient of relationship. If the data have
been transformed prior to the analysis, B 2 is a direct estimate of h2g . A
transformation here means that each score is expressed as a deviation from the
mean of the unselected population and then divided by the proband mean for the
zygosity group (i.e. MZ scores are divided by the MZ proband mean). The last
term in the equation, A, is the regression constant.
Because the data are double entered, the standard errors for the h 2g term have to be
corrected using the following formula (see Stevenson, Pennington, Gilger, DeFries
& Gillis, 1993):
corrected SE = obtained SE x I(ND - K - l)/(N5 - K - 1)
where ND is the number of double-entered twin pairs, N is the number of single-
entered twin pairs and K is the number of terms in the equation, which is 2 in this
case. The transformed MZ co-twin mean gives an upper limit for the total genetic
and shared environmental influences.
The bivariate DF extreme analysis calculates the regression towards the mean on a
second variable in the co-twins of probands. The bivariate group heritability
estimate is denoted as h2g(xy) : x is the variable used to define the probands and y is
the measure on which the co-twins are predicted. That is, the co-twin's score on Y
171
is regressed onto the proband's X score and the R term. The final transformation is
achieved by dividing the scores of co-twins (Y) by the proband mean sore on X for
the respective zygosity groups. Like in the univariate case, the regression
coefficient B2(XY) provides an estimate of h2g (xy) . The bivariate group heritability
analysis examines whether there are shared genetic effects on the two variables.
6.2 Statistical power
Power calculations are needed to give an indication of the sample sizes required to
detect significant differences. Our study design involves both genetic and non-
genetic analyses. The non-genetic analyses are simply comparisons between two
independent means, those of hyperactive and control groups. To detect a medium
difference between two independent sample means (d= .50) at a= .05 and 80%
power requires a sample size of 64 in each group (Cohen, 1992). The sample size
requirement would be 26 individuals to detect large effect sizes (d = .80).
In the present study the emphasis in the genetic analyses is on the DF extreme
analyses, as these test the main hypothesis of the study. With a group heritability
estimate of .60 (i.e. a difference in the standardised co-twins' means of .30) and
one-tailed a = .05, the sample size would need to be 138 children to achieve 80%
power (Cohen, 1988).
The model fitting approach has less power than the DF extreme analysis. Using the
technique developed by Neale and Cardon (1992), a sample of 75 MZ and 75 DZ
twin pairs would be required to detect a heritability of .6 ( rMz = .65, rDz .35) with
80% power and a = .05.
172
6.3 Design of the study
The design of the study is a twin design. Identical and non-identical twin pairs
participated in the study. The children were further divided into hyperactive and
control groups. To remove the confound of sex, we included only same-sex twins
in the study.
6.4 Ethical consideration
The Great Ormond Street Hospital for Children NHS Trust and the Institute of
Child Health Research Ethics Committee gave ethical permission for this study to
be carried out. Parents of the twin pairs invited for an assessment session received
information sheets explaining the nature of the study. They signed consent forms
prior to the session. The nature of the study was not intrusive. We did not provide
formal feedback as to the children's level of performance, except in the case of two
twin pairs whose parents specifically requested this. We sent a summary of the
results of the study to all the families who came for an assessment session.
6.5 Participants
6.5.1 Recruitment of sample
Contacting LEAs and schools
The sample was recruited from a general population sample of same-sex twins aged
between 7 and 11 years. We obtained a permission from the following 16 Local
Education Authorities to approach the primary schools in their area: Redbridge,
Cambridgeshire, Barking and Dagenham, Haringey, Havering, Surrey,
173

Bedfordshire, Oxfordshire, Hounslow, Bexley, Hertfordshire, Croydon, East
Sussex, Buckinghamshire, Avon and Hillingdon. Only one education authority,
Berkshire, was unwilling for us to make contact with schools in their area, as they
were already taking part in another large-scale research project.
The criterion we used in choosing the LEAs was their geographical location - as
close to London as possible. However, we had to exclude most of the London
LEAs, as these had recently taken part in another twin study (Hohnen &
Stevenson, in press). As our ultimate aim was to test the top 5% of the pervasively
hyperactive twins, we decided on the number of LEAs we should approach based
on our estimates of the number of twin pairs in each LEA, the likely drop-out rates
at the various stages of the screening, the rate of agreement between teacher and
parent ratings and also based on power calculations of the sample size required.
After obtaining a permission from the LEAs, we then wrote to the head teachers of
all the primary schools within the LEAs (including special schools). There were
2439 schools taking children in the age range of 7-11 years in this area. We asked
the class teachers of any twins fulfilling the criteria for our study (same-sex twins;
date of birth between 1 September 1985 and 1 September 1990) to complete the
Revised Conners' Teacher Rating Scale (CTRS-28; Goyette et al., 1978), one for
each twin. As many schools have a policy of placing the members of a twin pair in
separate classes, different teachers may have rated each twin's behaviour. Some
schools wished the children to remain anonymous at this stage and they therefore
gave their initials only, rather than giving the children's full names. Some other
schools contacted the parents at this stage to ask for their permission for the
teachers to fill in the rating scales about their children's behaviour at school. We
sent one reminder leuer to those schools which did not reply to our initial letter.
The next stage of the screening process involved choosing the twin pairs in which
at least one twin scored above the cut-off point (T-score of 64 or higher) on the
Hyperactivity dimension of the Teacher Conners'. This cut-off point represents our
174
estimate of the top 5% of the pervasively hyperactive children, taking into account
the likely rate of agreement between parents and teachers and the estimated
percentage of cases who would drop out at any stage during the screening process.
We were therefore not aiming to include the highest scoring 5% in the 'potentially
hyperactive' group at this stage, as this would have resulted in including only a
very small percentage of the sample after the last stage of the screening. We also
chose children who were candidates for the control group, stratifying them (i.e. not
matching one by one) with the hyperactive twin pairs on age, sex and zygosity. To
be chosen as controls, both twins had to score below the cut-off point on the
Hyperactivity dimension.
Contacting parents
We then wrote to the parents of the chosen twin pairs - via the schools - and asked
one of the parents, or both parents together, to fill in the Revised Conners' Parent
Rating Scale (CPRS-48; Goyette et al., 1978) for each twin and also to complete the
Twin Similarity Questionnaire (Nichols & Bilbro, 1966). Only if the same twin
scored at or above the cut-off point (T-score = 64) on the Hyperactivity dimension of
the teacher questionnaire and on the Impulsive-Hyperactive dimension of the parent
questionnaire, was the twin pair invited to the Institute for an assessment session.
Similarly, for a control pair to be included in the last stage of the study, both twins
had to score below the cut-off point on the hyperactivity dimension on both the
Teacher and Parent Conners'.
We excluded twin pairs if one or both of them had serious disabilities or medical
conditions or if they were on stimulant medication. In total we excluded 11 twin
pairs: two with autism, four with physical disabilities (e.g. cerebral palsy), two with
medical syndromes, two with learning difficulties and one twin pair in which the
other twin was on stimulant medication (Ritalin). We sent a remainder letter to those
parents who did not reply to our initial letter. Towards the end of the data collection,
when several of the families cancelled their appointments, we contacted some of
175

these parents again, in an attempt to increase the sample size for the hyperactive
group. We also made one reminder phone call to those families who did not reply to
our second letter to them, in which we had invited the family for an assessment
session.
Response rates
We received replies from 1629 (66.8%) schools. Of those schools which replied to
our letter, only 59 indicated that they did not wish to take part in the study. In 858 of
the schools there were no twins fulfilling the criteria for our study. We received
Teacher Conners' for 1316 twin pairs. In 262 (19.9%) of the twin pairs at least one
twin scored above the cut-off point on the Hyperactivity dimension. To get an
estimate of the proportion of a population of singletons who would score above this
cut-off point (to remove the twin effect of an increased likelihood of at least one of
the twins being a 'case'), it is useful to consider this result separately for 'twins A'
and 'twins B': 13.7% of 'twins A' and 12.6% of 'twins B' scored above the cut-off
point on the Hyperactivity dimension.
We wrote to 392 families, asking the parents to complete the Parent Conners'. Of the
parents who replied, 7 did not wish to participate in the study and therefore did not
complete the questionnaires. We received Parent Conners' from 68.4% (268) of the
families we contacted (66.4% of the potential hyperactive families and 72.3 % of the
potential control families). The parents completed the Conners' scale on average
three months after the teachers had completed the Teacher Conners'.
Of those twin pairs of whom one or both twins were classified as a 'case' according
to teacher report and for whom we received the Parent Conners', 41.4% retained
their group status based on parent report. Twin pairs classified as 'controls' based on
teacher report (and for whom we received the Parent Conners') scored below the cut-
off point also on Parent Conners' in 78.7% of the cases. Of those families whom we
invited for an assessment session (N=146), 65.8% (96) agreed to make the visit (49
176
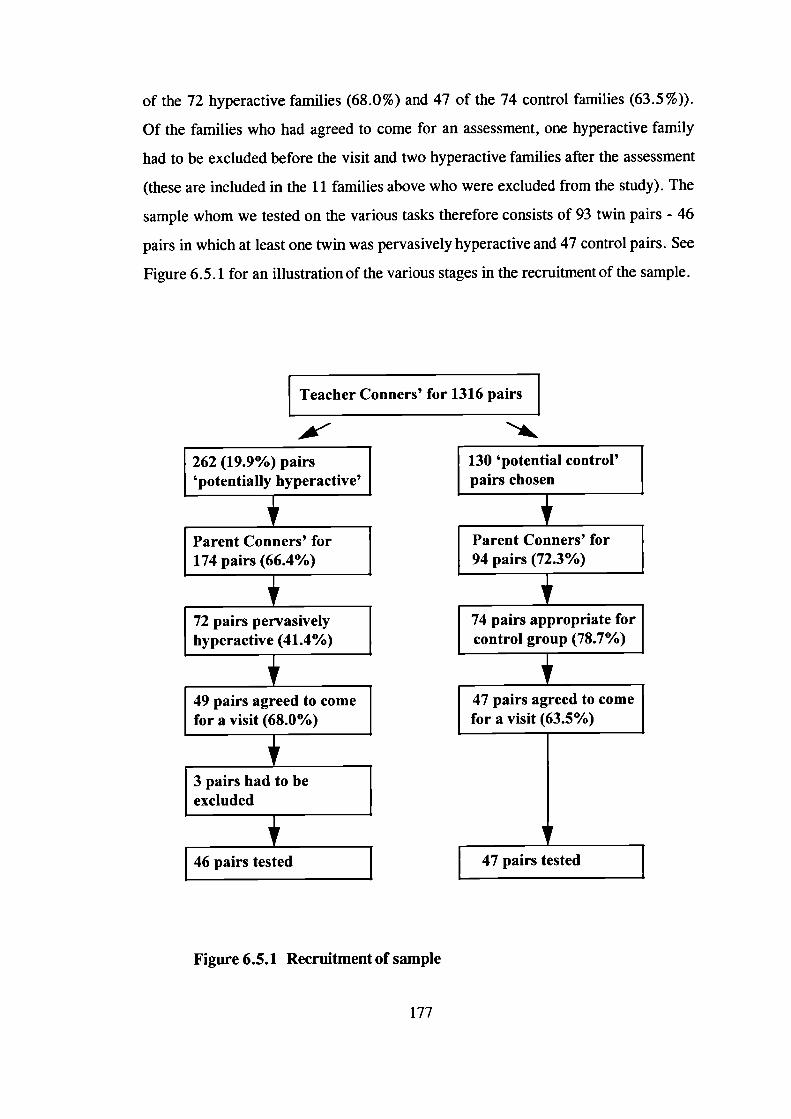
130 'potential control'pairs chosen
Parent Conners' for94 pairs (72.3%)
74 pairs appropriate forcontrol group (78.7%)
47 pairs agreed to comefor a visit (63.5%)
47 pairs tested
of the 72 hyperactive families (68.0%) and 47 of the 74 control families (63.5%)).
Of the families who had agreed to come for an assessment, one hyperactive family
had to be excluded before the visit and two hyperactive families after the assessment
(these are included in the 11 families above who were excluded from the study). The
sample whom we tested on the various tasks therefore consists of 93 twin pairs - 46
pairs in which at least one twin was pervasively hyperactive and 47 control pairs. See
Figure 6.5.1 for an illustration of the various stages in the recruitment of the sample.
Teacher Conners' for 1316 pairs
Figure 6.5.1 Recruitment of sample
177
If there was any missing data on the questionnaires, we contacted the person who had
completed the questionnaire. In the very rare cases where we were unable to obtain
the missing information, we coded the missing item using the most conservative
option (e.g. '0' for 'not at all').
6.5.2 Twin characteristics
How close did we get to our original aim of testing the top 5% of the pervasively
hyperactive children (as defined in the present study)? The 46 hyperactive twin pairs
whom we assessed represent 3.5% of the total population of 1316 twin pairs (for
whom we received Teacher Conners'). However, not all families whom we invited
agreed to make the visit. A more interesting question is what proportion of the total
twin population do those twins represent who would have been appropriate to be
included in the hyperactive group. We invited 76 hyperactive families for an
assessment session, but subsequently had to exclude 3 of these families. The 73
hyperactive twin pairs whom we would have liked to assess represent 5.5% of the
total population of 1316 twin pairs.
Of the 1316 twin pairs, 52.4% were girls and 47.6% boys. Mean age was 8.3 years
(SD =1.5 years). We also asked the teachers whether they thought the twins were
identical, non-identical or whether they were unsure about the twins' zygosity. This
rather crude measure of zygosity resulted in 57.7% of the twin pairs being classified
as identical, 34.2% as non-identical and 8.1 % as 'not known'. These twin pairs were
the sample for the analyses to obtain UK norms for the Revised Conners' Teacher
Rating Scale.
Of the 268 twin pairs for whom we received ratings also from parents, 51.9% were
girls and 48.1% boys. Mean age for this group of children was 7.9 years (SD1.4
years); 131 of them were classified as MZ and 136 as DZ pairs (TSQ was missing
for one twin pair; see section 6.4.4 for zygosity determination).
178
Because this sample of 268 twin pairs has an excess of hyperactive children, we
created a sample representative of the general population for the model fitting
analyses on the rating scale data. This representative sample was chosen as
follows. We estimated that, using our hyperactivity criteria, approximately 5% of
the children in the general population would be pervasively hyperactive and 12-
15% situationally hyperactive. We first chose randomly from twins A so that the
proportions of situationally hyperactive, pervasively hyperactive and control
children would equal approximately these proportions estimated for a general
population sample. We then deleted further pairs in which twin B was situationally
or pervasively hyperactive, until the total proportions of situationally hyperactive,
pervasively hyperactive and control children were close to the figures estimated for
the general population. There are 125 pairs in this sample: 61 MZ and 64 DZ
pairs. Of the 250 children, 6% were pervasively hyperactive, 15.6% were
situationally hyperactive and 78.4% were controls. Mean age was 8.0 years
(SD= 1.39 years) and 44.8% of them were girls.
The 93 twin pairs who took part in the last stage of the study were 8.9 years old on
average at the time of the assessment (SD = 1.3 years; range = 6.9 - 12.2 years). The
Parent Conners' were completed on average four months (SD =2.2 months) prior to
the assessment. Table 6.5.2 shows the figures for age, sex and zygosity for the two
groups separately. An independent t-test and chi-square tests showed that there were
no significant differences between the groups on age or sex, but the chi-square value
for zygosity was significant (X(1)2 = 3.887, p = .049). Despite us stratifying the
groups on zygosity after the first stage of screening, the groups of children we
actually assessed differed in their distribution of MZ and DZ twins (there were more
DZ twins in the hyperactive group than in the control group).
179
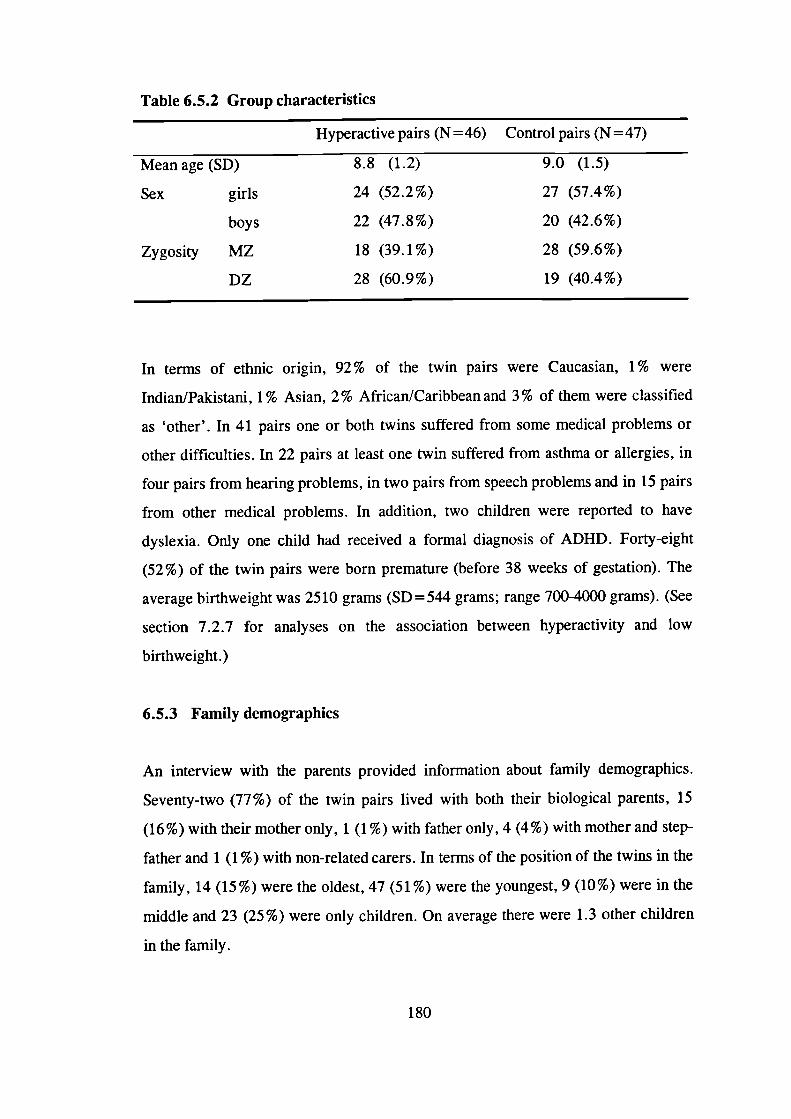
Table 6.5.2 Group characteristics
Hyperactive pairs (N = 46) Control pairs (N = 47)
Mean age (SD)
8.8 (1.2)
9.0 (1.5)
Sex girls 24 (52.2%)
27 (57.4%)
boys
22 (47.8%)
20 (42.6%)
Zygosity MZ
18 (39.1%)
28 (59.6%)
DZ 28 (60.9%) 19 (40.4%)
In terms of ethnic origin, 92% of the twin pairs were Caucasian, 1% were
Indian/Pakistani, 1% Asian, 2% African/Caribbean and 3% of them were classified
as 'other'. In 41 pairs one or both twins suffered from some medical problems or
other difficulties. In 22 pairs at least one twin suffered from asthma or allergies, in
four pairs from hearing problems, in two pairs from speech problems and in 15 pairs
from other medical problems. In addition, two children were reported to have
dyslexia. Only one child had received a formal diagnosis of ADHD. Forty-eight
(52%) of the twin pairs were born premature (before 38 weeks of gestation). The
average birthweight was 2510 grams (SD =544 grams; range 700-4000 grams). (See
section 7.2.7 for analyses on the association between hyperactivity and low
birthweight.)
6.5.3 Family demographics
An interview with the parents provided information about family demographics.
Seventy-two (77%) of the twin pairs lived with both their biological parents, 15
(16%) with their mother only, 1 (1%) with father only, 4 (4%) with mother and step-
father and 1 (1%) with non-related carers. In terms of the position of the twins in the
family, 14(15%) were the oldest, 47(51%) were the youngest, 9(10%) were in the
middle and 23 (25%) were only children. On average there were 1.3 other children
in the family.
180
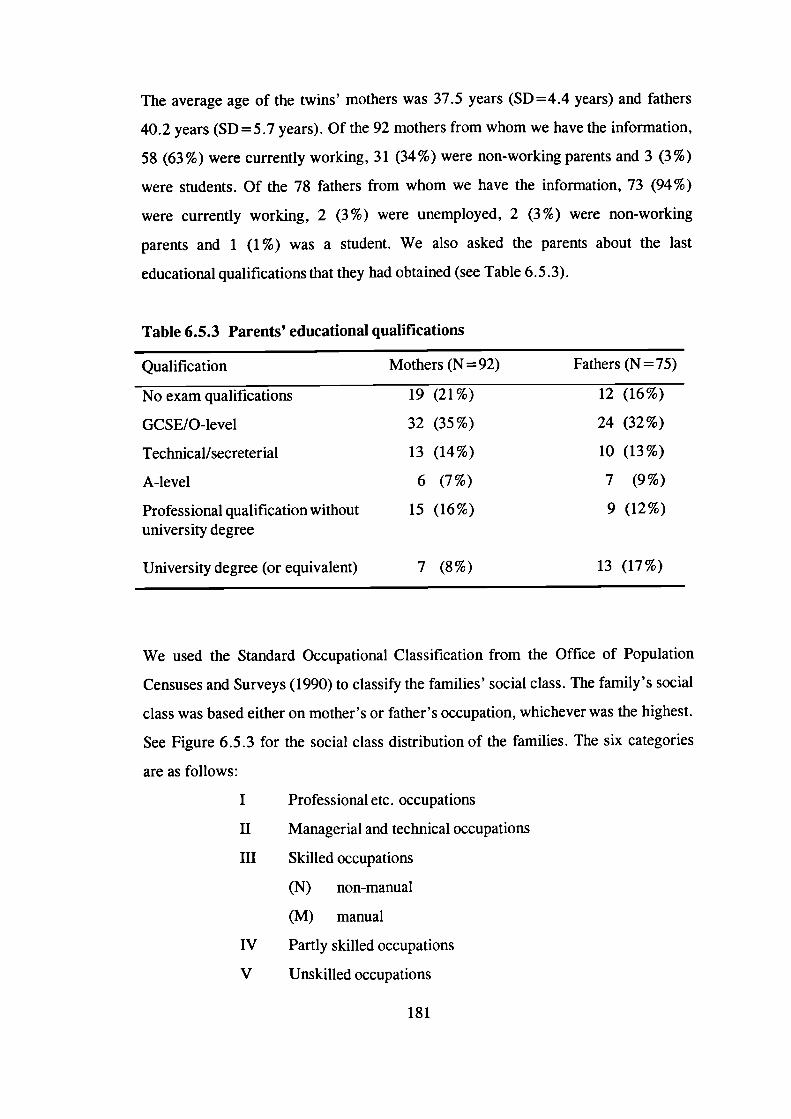
The average age of the twins' mothers was 37.5 years (SD =4.4 years) and fathers
40.2 years (SD=5.7 years). Of the 92 mothers from whom we have the information,
58 (63%) were currently working, 31(34%) were non-working parents and 3 (3%)
were students. Of the 78 fathers from whom we have the information, 73 (94%)
were currently working, 2 (3%) were unemployed, 2 (3%) were non-working
parents and 1 (1 %) was a student. We also asked the parents about the last
educational qualifications that they had obtained (see Table 6.5.3).
Table 6.5.3 Parents' educational qualifications
Qualification Mothers (N = 92) Fathers (N = 75)
19 (21%)
12 (16%)
32 (35%)
24 (32%)
13 (14%)
10 (13%)
6 (7%)
7 (9%)
15 (16%)
9 (12%)
No exam qualifications
GCSE/O-level
Technical/secreterial
A-level
Professional qualification withoutuniversity degree
University degree (or equivalent) 7 (8%) 13 (17%)
We used the Standard Occupational Classification from the Office of Population
Censuses and Surveys (1990) to classify the families' social class. The family's social
class was based either on mother's or father's occupation, whichever was the highest.
See Figure 6.5.3 for the social class distribution of the families. The six categories
are as follows:
I Professional etc. occupations
II Managerial and technical occupations
III Skilled occupations
(N) non-manual
(M) manual
IV Partly skilled occupations
V Unskilled occupations
181
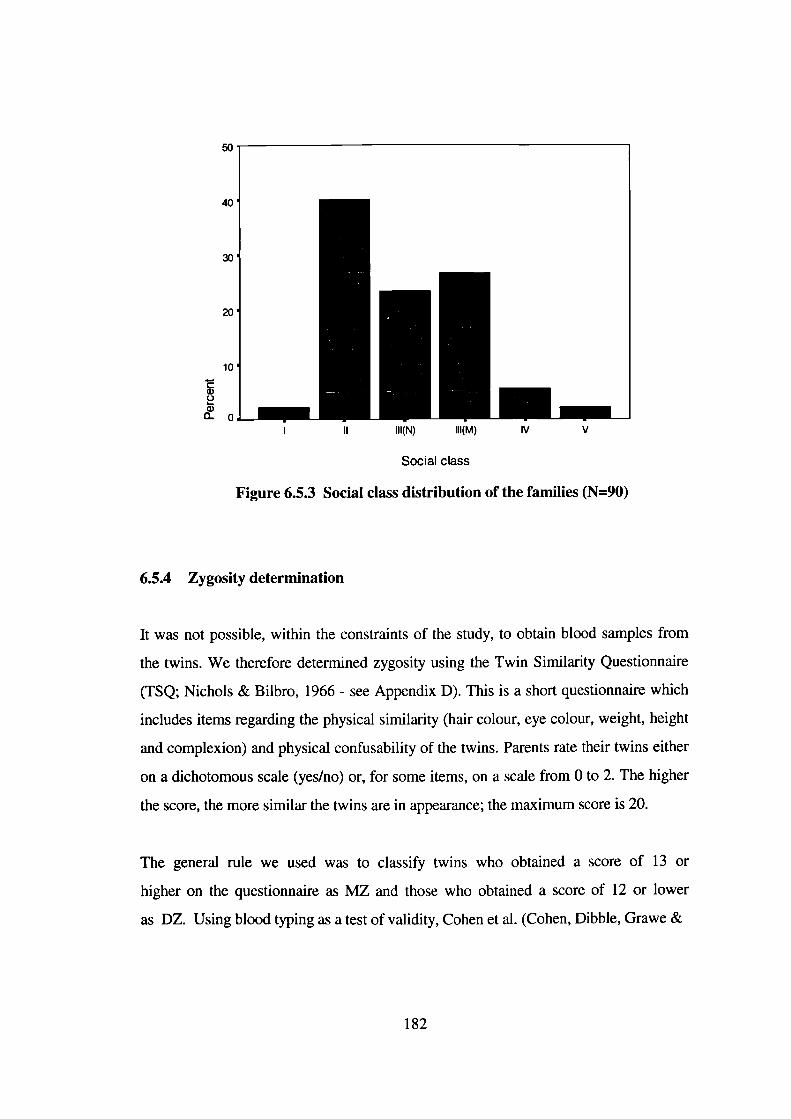
50
40
30
20
10
a)0a)0_0
I II 111(N) 111(M) IV V
Social class
Figure 6.5.3 Social class distribution of the families (N=90)
6.5.4 Zygosity determination
It was not possible, within the constraints of the study, to obtain blood samples from
the twins. We therefore determined zygosity using the Twin Similarity Questionnaire
(TSQ; Nichols & Bilbro, 1966 - see Appendix D). This is a short questionnaire which
includes items regarding the physical similarity (hair colour, eye colour, weight, height
and complexion) and physical confusability of the twins. Parents rate their twins either
on a dichotomous scale (yes/no) or, for some items, on a scale from 0 to 2. The higher
the score, the more similar the twins are in appearance; the maximum score is 20.
The general rule we used was to classify twins who obtained a score of 13 or
higher on the questionnaire as MZ and those who obtained a score of 12 or lower
as DZ. Using blood typing as a test of validity, Cohen et al. (Cohen, Dibble, Grawe &
182
Pollin, 1975) had shown that all twins scoring 13 or above on the TSQ were MZ
twins and all those scoring below 9 were DZ twins.
We also took a photograph of each twin pair whom we tested. For those cases who
were on the MZ/DZ borderline on the TSQ (scoring 12-14), we used the
photographs to determine their zygosity: three raters independently classified the twin
pairs as MZ or DZ based on the photographs. In the very rare cases when the raters
disagreed about the twins' zygosity, we either rang the parents to inquire whether the
twins' zygosity had been determined using blood tests or we obtained further ratings
from two other raters. We also used this procedure in the few cases where the twins
did not obtain scores on the MZ/DZ borderline, but their TSQ score did not seem to
match their zygosity as determined using the photograph. In all cases, an agreement
was reached about the twins' zygosity. A comparison of TSQ scores and our
zygosity classification based on the photographs had suggested that the 12/13 cut-off
point on the TSQ would be the most appropriate.
6.6 Procedure
Each family - the twins and at least one parent - made one visit to the Institute of
Child Health. Apart from us reimbursing their travel expenses, the families did not
receive any financial reward for participation. The parents had signed a consent form
prior to the session.
The parents were first interviewed, to obtain background information, such as social
class and any illnesses or disabilities the twins might suffer from. The parents then
left the testing room and two testers assessed the twins in two separate rooms. The
twins were told they were going to play some games, some of which would be easy
and some hard for children of their age and that all the information would be
confidential (they would not receive any individual feedback although all the families
would later receive a summary of the results of the study).
183
The order of task presentation was fixed, but different for each twin. For 'twin A',
we presented the tasks in the following order: stop task, counting span, similarities,
sentence span, delayed response alternation, delay aversion, picture completion,
vocabulary and block design. The order of task presentation for 'twin B' was the
following: counting span, similarities, sentence span, stop task, picture completion,
vocabulary, block design, delayed response alternation and delay aversion. The same
tester assessed the same twin throughout the session. The order of task presentation
was counterbalanced across the testers, that is, each tester tested 'twin A' equally
often. The twins were given an approximately 20 minute break in the middle of the
testing and also several shorter breaks. In total, the testing session took
approximately three hours.
The testers aimed to be 'blind' with regard to the group status of the twins. Only in
the very rare cases where a tester remembered the name of a particular family for a
specific reason, did we not achieve this aim.
6.7 Measures
Measures of working memory, response inhibition and delay aversion were chosen
for the test battery. The measures had to be appropriate for the age range in question
(ages 7-11 years). We also wanted to obtain an estimate of the children's IQ, to be
able to control for differences in general cognitive ability. A time limit that we set
for the testing session (excluding breaks) was 2,5 hours and this obviously limited
the number of tests we could include in the test battery.
6.7.1 Delay Aversion Task - "Star Trek" (Warner-Rogers, Taylor, Sonuga-
Barke & Newman, unpublished)
This is a new computer task designed to test the delay aversion theory of
hyperactivity. The full task involves several conditions, but in the present study we
184
included only the condition that is predicted to show differences between hyperactive
and control children (Sonuga-Barke, personal communication, 1996). See Appendix
E for the task instructions, which were specifically written for this study. In this task
the child has to make a choice, for 20 times, between a small immediate reward (one
point involving a two second pre-reward delay) and a large delayed reward (two
points involving a 30 second pre-reward delay). If the child chooses the small
reward, the next trial starts immediately afterwards; this of course reduces the overall
length of the session.
The task is presented as a Star Trek game, in which the child, as a captain of the
U.S.S. Enterprise, has to fire Klingon Battle Cruisers (using the computer mouse).
The aim of the game is to earn as many points as possible and to motivate the
children they are told that they will receive a small prize in the end (in this study the
children received Great Ormond Street Hospital pencils). Before the experimental
trials, the child first practises using the mouse and choosing each of the rewards. The
tester also asks the child questions about the game, to ensure that he or she has
understood the rules and aims of the game correctly. No reports have previously
been published regarding the reliability of the task (for reliability results from our
studies, see section 6.8). The delay aversion variable used in the analyses is the
percentage of choices for two points.
The tester also rated the child's apparent delay aversion (the extent to which the child
continued talking or doing something else while waiting) on a simple three-point
scale (see Appendix K).
6.7.2 Delayed Response Alternation Task (DRA; Carpenter & Gold, 1994; Gold,
Faith Berman, Randolph, Goldberg & Weinberger, 1996)
This task is a computerised spatial working memory measure which, to our
knowledge, has not been used in a hyperactivity study before. The task was validated
as a prefrontal measure in a study with adults that involved PET scanning (Gold et
185

al., 1996; see section 2.3.2). No reliability data have previously been published for
this task.
In this task two boxes, one coloured (yellow) and the other uncoloured, are first
presented on the screen for one second. After a two second presentation of an empty
screen, two uncoloured boxes appear on the screen and the child has to choose one of
these boxes, either the one on the side where the coloured box was or the one on the
side where the uncoloured box was. The computer gives feedback as to whether the
choice was correct or incorrect (the word right or wrong is presented on the screen
for 1.5 seconds immediately after the child has responded). New stimuli (another two
boxes, one coloured and the other uncoloured) then appear on the screen after a 1.5
second delay.
The task for the child is to find out the rule that the computer uses to decide which
box is the correct one each time. If the child does not find out the rule on his or her
own, the rule is then taught explicitly. The rule involves choosing the coloured and
the uncoloured box (whatever side they appear on) on alternate trials. The position of
the coloured box varies randomly. All children do the task for a second time after the
teaching session.
We modified the original instructions rather extensively, as these had been written
for adults and were not appropriate for children (see Appendix F for the task
instructions). Before the children started the task proper, they first practised
responding (pressing the numbers 1 and 2 on the keyboard) with a practice version of
the task. In this practice version the correct rule was always to choose the coloured
(blue) box. The children were told after the practice that the rule might be different
in the 'real game'.
The DRA variables used in the analyses are the percentage of correct choices before
and after the teaching session.
186
6.7.3 Stop Task (Logan & Cowan, 1984; Logan, Cowan & Davis, 1984 - the
original version; Oosterlaan & Sergeant, 1998a - the version used in this
study)
This computer task measures inhibition and is based on Logan and Cowan's (1984)
'race model' of inhibition. This particular version of the task is presented as a
game in which the child has to perform tasks similar to those of an airtraffic
controller. The child is first taught to respond to airplanes appearing on the
computer screen by pressing the response button that is on the same side as the
plane was (a two-choice reaction time task). The child is then instructed to
withhold responding whenever he or she hears a tone on headphones (the 'stop'
trials), but otherwise to keep on responding to the planes as quickly as possible
(the 'go' trials). The tones are presented at four different intervals after the
presentation of the planes. All children did four experimental blocks (with 64 trials
in each) on this task and were given short breaks between the blocks.
Twenty-five percent of the trials are stop trials. The stop signals are presented at
the following stop signal intervals: 50, 200, 350 and 500 msec before the child's
expected response. The expected moment of responding is estimated from the
child's mean reaction time (MRT) in the preceding block of trials. MRT is
calculated across correctly executed responses on go trials. The stop signals are
1 kHz tones produced by a function generator.
Each trial begins with a 350 msec presentation of a fixation point ('+ '-sign
presented at the centre of the screen). The presentation of the stimuli (an airplane,
displayed for 1500 msec) follows this. The intertrial interval is 1000 msec. A
Keithley P10-12 digital interface board enables the stimuli to be presented and the
data to be collected with millisecond accuracy. The stimuli appear equally often on
either side of the screen within each block and the stop signals are presented
equally often after left- and right-sided presentations of the stimuli. A go trial
187
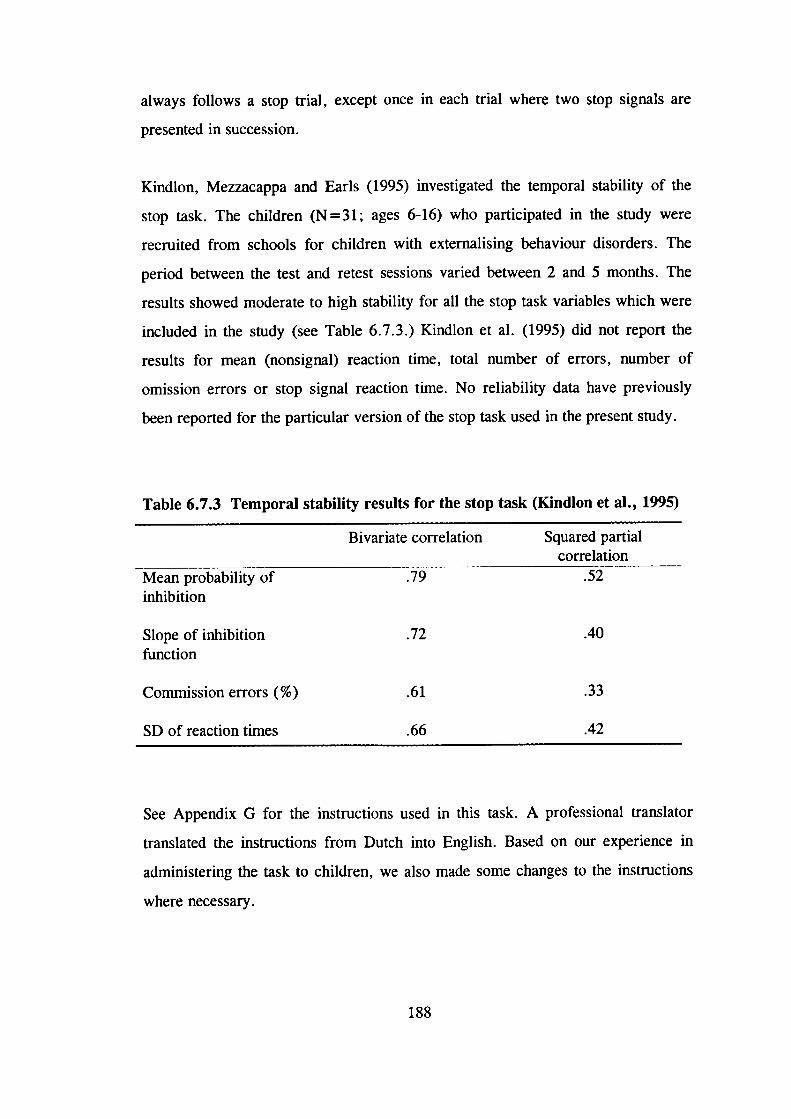
always follows a stop trial, except once in each trial where two stop signals are
presented in succession.
Kindlon, Mezzacappa and Earls (1995) investigated the temporal stability of the
stop task. The children (N = 31; ages 6-16) who participated in the study were
recruited from schools for children with externalising behaviour disorders. The
period between the test and retest sessions varied between 2 and 5 months. The
results showed moderate to high stability for all the stop task variables which were
included in the study (see Table 6.7.3.) Kindlon et a!. (1995) did not report the
results for mean (nonsignal) reaction time, total number of errors, number of
omission errors or stop signal reaction time. No reliability data have previously
been reported for the particular version of the stop task used in the present study.
Table 6.7.3 Temporal stability results for the stop task (Kindlon et al., 1995)
Bivariate correlation Squared partialcorrelation
Mean probability of .79 .52inhibition
Slope of inhibition .72 .40function
Commission errors (%) .61 .33
SD of reaction times .66 .42
See Appendix G for the instructions used in this task. A professional translator
translated the instructions from Dutch into English. Based on our experience in
administering the task to children, we also made some changes to the instructions
where necessary.
188
The following stop task variables were used in the analyses: inhibition slope, stop
signal reaction time (SSRT), mean reaction time (MRT), standard deviation of
reaction times (SD of RTs), total number of errors, number of omission errors and
number of commission errors (see Appendix L for an explanation of the inhibition
variables).
6.7.4 Sentence Span (Daneman & Carpenter, 1980 - the original version; Siegel
& Ryan, 1989 - the version used in this study) and Counting Span (Case,
Kurland & Goldberg, 1982) Tasks
These tasks are working memory measures (see Appendix H for the task
instructions). In the sentence span task, the tester reads sentences out to the child
who has to supply the missing last word for each sentence. In the end of each set,
the child is asked to repeat all the words that he or she had supplied, in the correct
order. The tester first gives the child a practice sentence and then, in order also to
practise recalling the supplied words, further two sentences. The task proper
begins with two-sentence sets and, unless the child fails all three sets of any level,
finishes with five-sentence sets. The sentences for the task have been chosen so
that the missing word is virtually predetermined. However, the particular word that
the child supplies is not important. We made some modifications to the sentences
in order for them to be more appropriate for British children.
The counting span task is similar to the sentence span task except that the child is
asked to count yellow dots on cards rather than to supply words. The tester asks
the child to touch each yellow dot with his or her finger and to count out loud. The
child is asked to ignore blue dots on the cards, which are arranged randomly with
the yellow dots to prevent counting by subitizing. The practice starts with counting
the yellow dots on one card. The tester then, presenting one card at a time, asks
the child to count the dots on two cards and, when presenting a blank card, to
recall the numbers of dots on the cards. The testing proper starts with two-card
sets and, unless the child fails all three sets of any level, finishes with five-card
189
sets. The size of the cards was 14 cm x 21 cm and the dots were 0.9 cm in
diameter. The studies using these tasks with children have not reported reliability
data for them. The possible scores range from 0 to 12 on both tasks.
6.7.5 Wechsler Intelligence Scales for Children (WISCIIIth(; Wechsler, 1992)
Four subtests from the WISC were used to obtain an estimate of the child's IQ:
picture completion and block design provided an estimate of performance IQ, and
vocabulary and similarities an estimate of verbal IQ. We chose these subtests
because they have high loadings on the performance and verbal IQ factors,
respectively. The four subtests together provided an estimate of the child's full-
scale IQ. We use the term 'full-scale IQ' to refer to this estimate of the children's
full-scale IQ.
Hunter et al. (Hunter, Yule, Urbanowics & Lansdown, 1989) have shown the use
of four subtests from the WISC to estimate full-scale IQ to be reliable in a British
sample of children. We used British standardised norms to score the test along with
the standard coding instrument and manual. The validity and reliability of the
WISC-III are well established.
6.7.6 Revised Conners' Parent (CPRS-48) and Teacher (CTRS-28) Rating
Scales (Goyette, Conners & Ulrich, 1978)
The Conners' scales (see Appendix I) are widely used to obtain ratings from
parents and teachers on a range of problem behaviours in children, and on
hyperactivity in particular. These revised, shorter versions of the original scales
are relatively quick to complete and therefore have advantages over lengthier scales
such as the Child Behaviour Checklist (CBCL; Achenbach, 1991) and the Teacher
Report Form (TRF; Achenbach, 1991). The parent scale provides the following
dimensions: Conduct problem, Learning problem, Psychosomatic, Impulsive-
Hyperactive, Anxiety and Hyperactivity Index. The dimensions obtained from the
190
teacher scale are the following: Conduct problem, Hyperactivity, Inattentive-
Passive and Hyperactivity Index.
Extensive data exists to support the validity and reliability of these scales, although
much of these data are based on the original scales rather than the revised ones.
For example, no data on the test-retest reliability of the CPRS-48 have been
reported. Edelbrock, Greenbaum and Conover (1985) reported one-week test-retest
reliabilities for the three factors of CTRS-28 which ranged from .88 to .96.
Goyette et al. (1978) reported data on inter-rater reliability; the correlation between
teacher and parent ratings on the Impulsive-Hyperactive/Hyperactivity dimension
was .36. They also reported data on internal consistency: item-total correlations on
the CPRS-48 range from .13 for item 44 (vomiting or nausea) to .65 for item 6
(sucks or chews thumb, clothing, blanket). High internal consistency reliability has
been reported for the longer version of the Teacher Conners' (see Conners, 1989),
but no such data have been published for the shorter version of the rating scale.
See Conners (1989) for data on the validity on the scales, although again most of
the data is based on the original rather than revised versions of the scales. Goyette
et al. (1978) provided normative data, on which the T-scores are based, for the
CPRS-48 and CTRS-28. See Appendix A for norms for the CTRS-28 obtained
from the present sample.
The Hyperactivity Index combines items relevant for both hyperactivity and
conduct problems and therefore this dimension was not used in the present study.
6.7.7 Interview with parent(s)
This structured interview included questions about various background variables
(see Appendix J). The first section included questions about the family: type of
accommodation, number and position (older/younger) of other children, number of
individuals in the household and type of family (biological parents/stepparents
etc.). The second section included questions about the parents: both parents'
191
occupations, educational background, age, and ethnic origins. The third and last
section focused on the twins: whether they were born premature, their birthweights
and whether they suffer from any medical problems or other difficulties.
6.7.8 Ratings of behaviour during testing
After the testing session, the tester rated the child on hyperactive behaviours
(fidgeting, lower limb movements, bottom shuffling movements and gross motor
activity) on a four-point scale, ranging from 'not at all' to 'very much' (see
Appendix K).
6.8 The reliability studies
To investigate the test-retest reliability of the tasks which we intended to include in
the test battery, as well as the reliability of the testers who were to be involved in
the main study, we carried out three separate reliability studies. The first reliability
study focused on paper-and-pencil measures and the second on computer tasks. The
testers in these studies were myself and two research assistants who were involved
in the data collection for the first half of the main study. The third reliability study
was carried out to establish the reliability of a third research assistant who was
involved in the data collection for the latter half of the main study. With one
exception, the tasks included in these reliability studies were described in section
6.7 above. The exception is a task called the dual task, which is briefly described
below. Because of the low test-retest reliability of this task (see below), we decided
to exclude the dual task from the test battery for the main study.
6.8.1 Reliability study I
A test-retest reliability study was first carried out for the following measures: the
four subtests of the WISC, the dual task, the counting span and sentence span tasks.
192

The dual task (Baddeley, Della Sala, Gray, Papagno & Spinnier, in press) is an
executive function measure. It is a paper-and-pencil measure in which the child first
performs two simple tasks (a memory span task and a tracking task) separately and
then simultaneously (the dual task condition).
After all three testers had been trained in how to administer and score the tasks, we
carried out a small pilot study. Two London schools, a primary and a secondary
school, participated in this pilot phase. Based on our experience in administering the
tasks on children, we made minor changes to the procedures and instructions where
necessary.
Following this initial pilot phase, we then carried out the test-retest reliability study.
Two different inner London schools, a primary and a secondary school, took part in
this study. The head teachers in both schools wrote letters to the parents of an agreed
number of children, explaining the nature of the study and asking for permission for
their child to take part. We had emphasised to the head teachers that we were aiming
to obtain as representative a sample as possible. The parents of only one child
refused to allow their child to participate. In addition, one child, while given parental
consent, did not wish to take part in the study.
A total of 34 children, 15 girls and 19 boys, participated in the reliability study. The
children ranged in age from 7.9 to 15.3 years (mean age = 11.4 years, SD=2.3
years). (We decided only later to include only children aged between 7 and 11 years
in the main study.) Twenty of the children were from the primary school and 14
from the secondary school. Majority (71 %) of them were Caucasian, 15% were
Indian/Pakistani, 3% were Asian, 9% were African/Caribbean and 3 % were
classified as 'other' in terms of ethnic origin.
The children were tested individually in separate rooms in the school. On any single
day, two testers tested children simultaneously. We divided the tests into two
standard test batteries. Test battery A contained the following tests, which were
193

presented in the following order: counting span, similarities, dual task and sentence
span. The tests in test battery B were picture completion, vocabulary and block
design. The order of presentation of the tasks was counterbalanced across children;
that is, half of the children did test battery A first and half of them test battery B
first. The order of task administration was similarly counterbalanced across the three
testers. That is, each tester started with test battery A with approximately equal
numbers of children.
The children were tested again after a two-week period. The tests were presented in
the same order for each child as they had been presented at time 1. However, each
tester now administered a different test battery to each child: if tester 1 tested child 1
with test battery A at time 1, he or she tested this child with test battery B at time 2.
All children whom we assessed at time 1, we also assessed at time 2.
Despite us having emphasised to the head teachers that the children should not be
chosen with any particular criteria in mind, apart from age, the sample from the
primary school included several children with general learning disabilities. In part,
this seems to have resulted from a misunderstanding between the head teacher and a
teacher. However, both schools were in relatively disadvantaged areas of London
and the IQs of the children might have been expected to be, on average, somewhat
below average.
The average full-scale IQ (based on the four subtests) for the total sample was 83.74.
We therefore decided to analyse the results both for the total sample and for a
subsample of the children, excluding children with very low IQs. Preliminary
analyses indicated that excluding children with low IQs, whether those with IQs
below 70 or only those with even lower IQs, did not seem to have a noticeable effect
on the reliability results. Table 6.8. la shows the results for the total sample and
Table 6.8. lb for the subsample of children with IQs above 65.
194
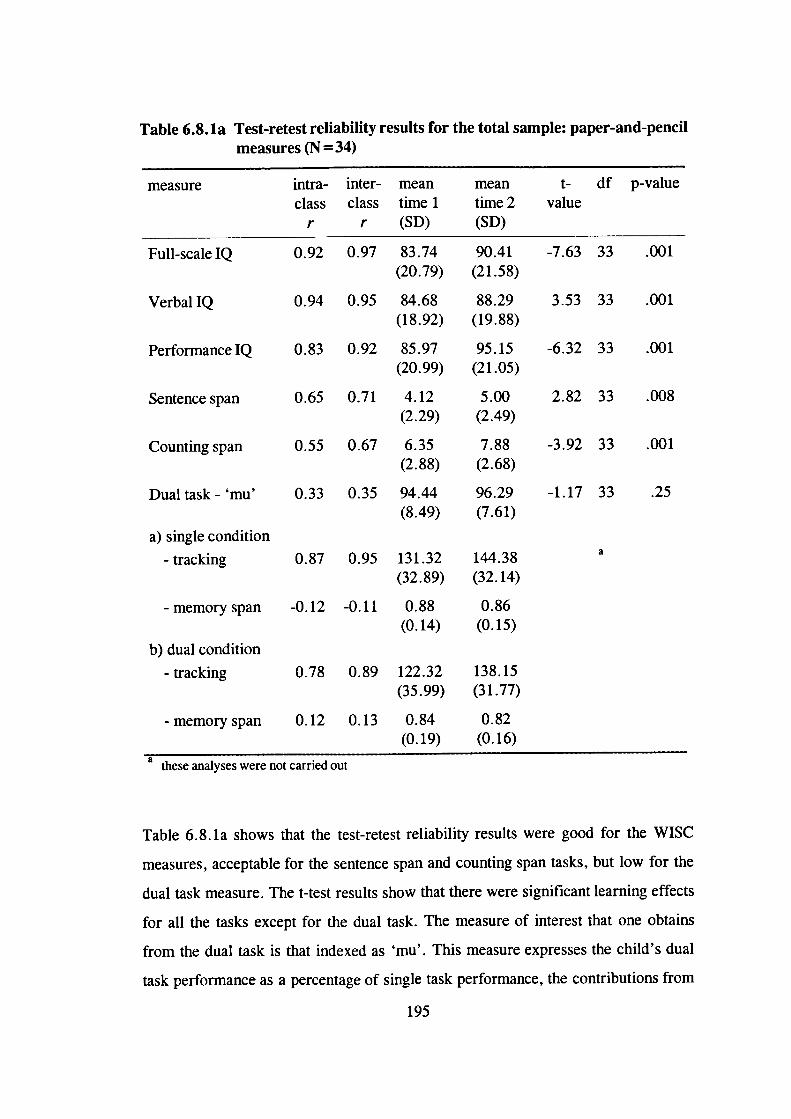
a0.87 0.95
-0.12 -0.11
a) single condition
- tracking
- memory span
131.32 144.38(32.89) (32.14)
0.88 0.86(0.14) (0.15)
Table 6.8. la Test-retest reliability results for the total sample: paper-and-pencilmeasures (N=34)
measure intra- inter- mean mean t- df p-value
class class time 1 time 2 valuer r (SD) (SD)
Full-scalelQ 0.92 0.97 83.74 90.41 -7.63 33 .001
(20.79) (21.58)
VerbalIQ 0.94 0.95 84.68 88.29 3.53 33 .001
(18.92) (19.88)
PerformancelQ 0.83 0.92 85.97 95.15 -6.32 33 .001
(20.99) (21.05)
Sentencespan 0.65 0.71 4.12 5.00 2.82 33 .008
(2.29) (2.49)
Counting span 0.55 0.67 6.35 7.88 -3.92 33 .001
(2.88) (2.68)
Dual task- 'mu' 0.33 0.35 94.44 96.29 -1.17 33 .25(8.49) (7.61)
b) dual condition
-tracking 0.78 0.89 122.32 138.15
(35.99) (31.77)
- memory span 0.12 0.13 0.84 0.82
(0.19) (0.16)a these analyses were not carried out
Table 6.8. la shows that the test-retest reliability results were good for the WISC
measures, acceptable for the sentence span and counting span tasks, but low for the
dual task measure. The t-test results show that there were significant learning effects
for all the tasks except for the dual task. The measure of interest that one obtains
from the dual task is that indexed as 'mu'. This measure expresses the child's dual
task performance as a percentage of single task performance, the contributions from
195
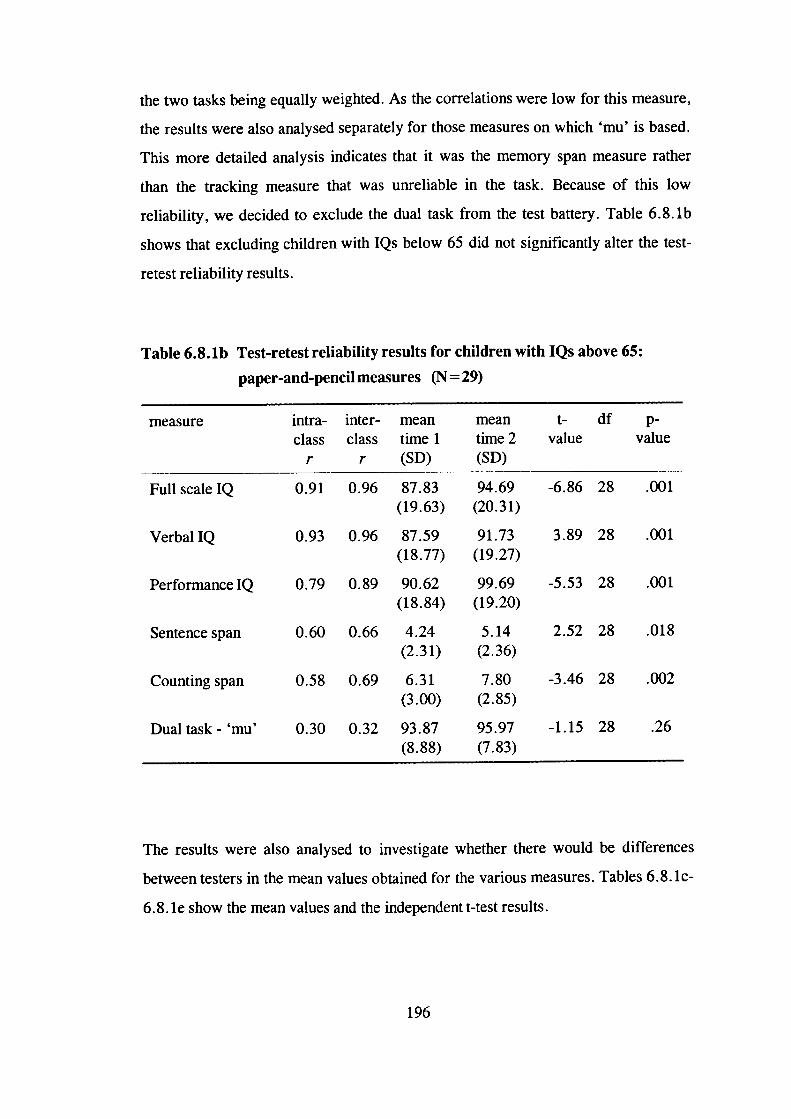
the two tasks being equally weighted. As the correlations were low for this measure,
the results were also analysed separately for those measures on which 'mu' is based.
This more detailed analysis indicates that it was the memory span measure rather
than the tracking measure that was unreliable in the task. Because of this low
reliability, we decided to exclude the dual task from the test battery. Table 6.8. lb
shows that excluding children with IQs below 65 did not significantly alter the test-
retest reliability results.
Table 6.8. lb Test-retest reliability results for children with IQs above 65:
paper-and-pencil measures (N = 29)
measure intra- inter- mean mean t- df p-
class class time 1 time 2 value valuer r (SD) (SD)
Full scale IQ 0.91 0.96 87.83 94.69 -6.86 28 .001
(19.63) (20.31)
VerbalIQ 0.93 0.96 87.59 91.73 3.89 28 .001
(18.77) (19.27)
PerformancelQ 0.79 0.89 90.62 99.69 -5.53 28 .001
(18.84) (19.20)
Sentence span 0.60 0.66 4.24 5.14 2.52 28 .018
(2.31) (2.36)
Counting span 0.58 0.69 6.31 7.80 -3.46 28 .002
(3.00) (2.85)
Dualtask-'mu' 0.30 0.32 93.87 95.97 -1.15 28 .26
(8.88) (7.83)
The results were also analysed to investigate whether there would be differences
between testers in the mean values obtained for the various measures. Tables 6.8. ic-
6.8.1 e show the mean values and the independent t-test results.
196
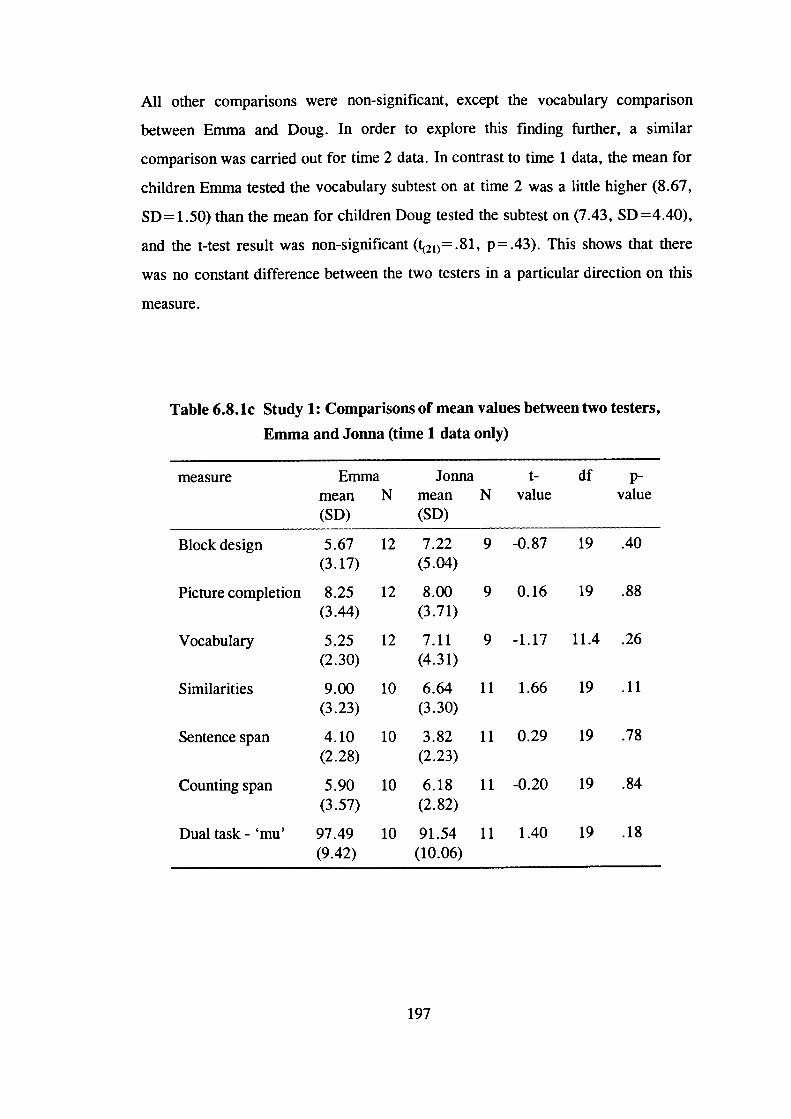
All other comparisons were non-significant, except the vocabulary comparison
between Emma and Doug. In order to explore this finding further, a similar
comparison was carried out for time 2 data. In contrast to time 1 data, the mean for
children Emma tested the vocabulary subtest on at time 2 was a little higher (8.67,
SD= 1.50) than the mean for children Doug tested the subtest on (7.43, SD =4.40),
and the t-test result was non-significant (21)= .81, p = .43). This shows that there
was no constant difference between the two testers in a particular direction on this
measure.
Table 6.8.lc Study 1: Comparisons of mean values between two testers,
Emma and Jonna (time 1 data only)
measure Emma Jonna t- dfmean N mean N value value(SD) (SD)
Block design 5.67 12 7.22 9 -0.87 19 .40(3.17) (5.04)
Picture completion 8.25 12 8.00 9 0.16 19 .88(3.44) (3.71)
Vocabulary 5.25 12 7.11 9 -1.17 11.4 .26(2.30) (4.31)
Similarities 9.00 10 6.64 11 1.66 19 .11(3.23) (3.30)
Sentence span 4.10 10 3.82 11 0.29 19 .78(2.28) (2.23)
Counting span 5.90 10 6.18 11 -0.20 19 .84(3.57) (2.82)
Dualtask-'mu' 97.49 10 91.54 11 1.40 19 .18(9.42) (10.06)
197
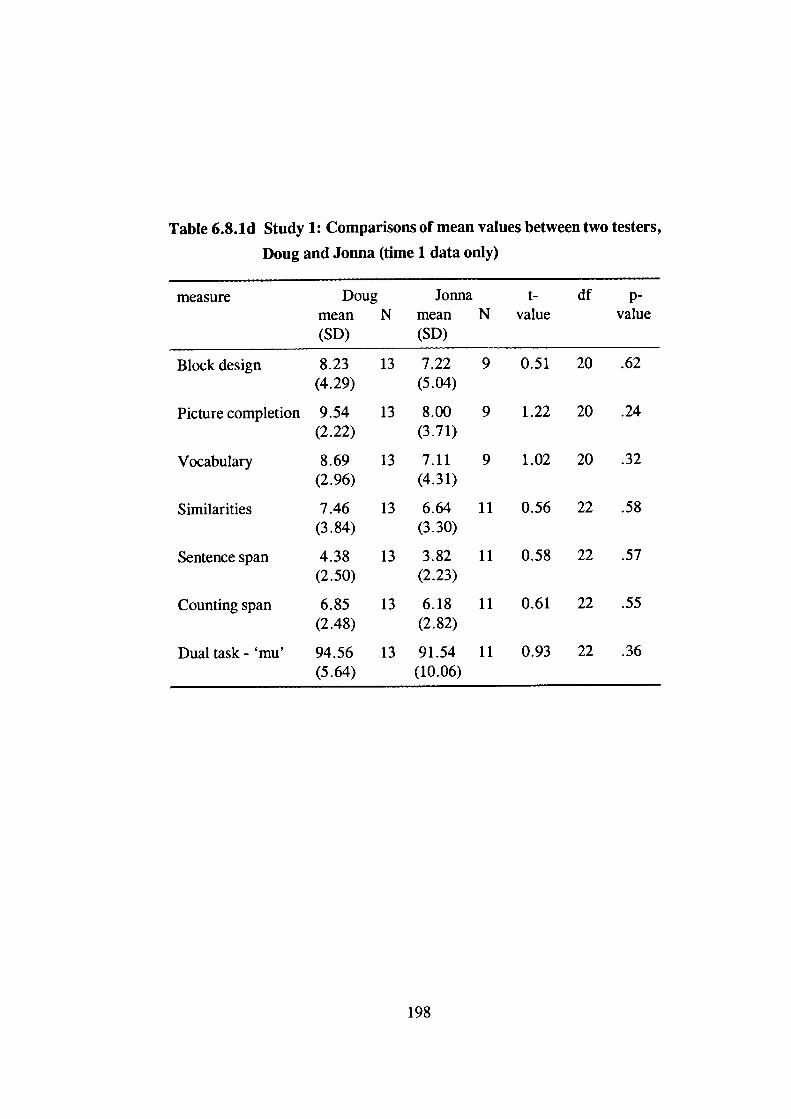
Table 6.8.ld Study 1: Comparisons of mean values between two testers,
Doug and Jonna (time 1 data only)
measure Doug Jonna df p-mean N mean N value value(SD) (SD)
Block design 8.23 13 7.22 9 0.51 20 .62(4.29) (5.04)
Picture completion 9.54 13 8.00 9 1.22 20 .24(2.22) (3.71)
Vocabulary 8.69 13 7.11 9 1.02 20 .32(2.96) (4.31)
Similarities 7.46 13 6.64 11 0.56 22 .58(3.84) (3.30)
Sentence span 4.38 13 3.82 11 0.58 22 .57(2.50) (2.23)
Counting span 6.85 13 6.18 11 0.61 22 .55(2.48) (2.82)
Dual task- 'mu' 94.56 13 91.54 11 0.93 22 .36(5.64) (10.06)
198
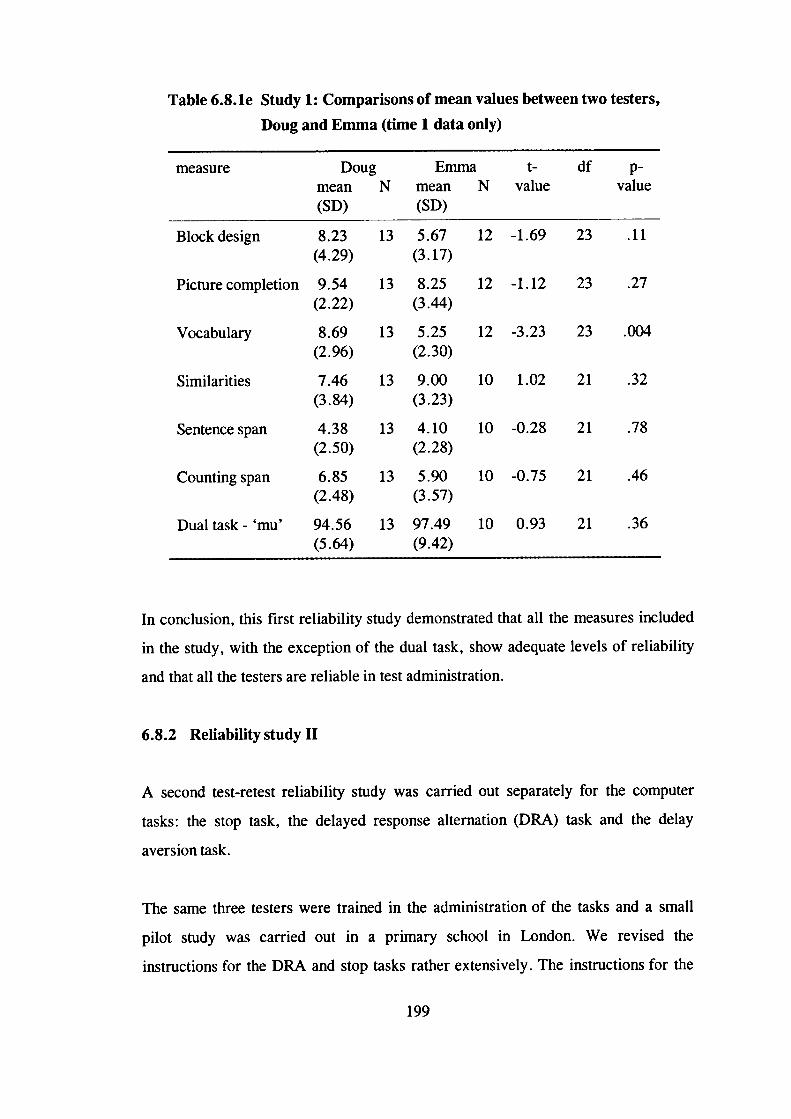
Table 6.8.le Study 1: Comparisons of mean values between two testers,
Doug and Emma (time 1 data only)
measure Doug Emma t- df p-mean N mean N value value(SD) (SD)
Block design 8.23 13 5.67 12 -1.69 23 .11(4.29) (3.17)
Picture completion 9.54 13 8.25 12 -1.12 23 .27(2.22) (3.44)
Vocabulary 8.69 13 5.25 12 -3.23 23 .004(2.96) (2.30)
Similarities 7.46 13 9.00 10 1.02 21 .32(3.84) (3.23)
Sentence span 4.38 13 4.10 10 -0.28 21 .78(2.50) (2.28)
Counting span 6.85 13 5.90 10 -0.75 21 .46(2.48) (3.57)
Dualtask-'mu' 94.56 13 97.49 10 0.93 21 .36(5.64) (9.42)
In conclusion, this first reliability study demonstrated that all the measures included
in the study, with the exception of the dual task, show adequate levels of reliability
and that all the testers are reliable in test administration.
6.8.2 Reliability study II
A second test-retest reliability study was carried out separately for the computer
tasks: the stop task, the delayed response alternation (DRA) task and the delay
aversion task.
The same three testers were trained in the administration of the tasks and a small
pilot study was carried out in a primary school in London. We revised the
instructions for the DRA and stop tasks rather extensively. The instructions for the
199
DRA were written for adult subjects and were therefore inappropriate for children. A
professional translator translated the stop task instructions from Dutch into English
and we made changes to them where we felt it was necessary. As no written
instructions existed for the delay aversion task, we wrote them and then piloted the
instructions with 7-11-year-old children. We also made changes to the administration
procedures of the tasks where necessary.
The reliability study was carried out in an inner London primary school. The head
teacher in the school wrote to the parents of children in the 7-11 age range, asking
for permission for their child to take part in the study. We then chose the children to
be tested randomly from those whose parents had given their consent, although we
aimed for approximately equal numbers of girls and boys and children of different
ages. The study sample consisted of 18 children: 8 girls and 10 boys. Mean age was
8.8 years (SD=1.4 years). In terms of ethnic origin, majority (78%) of the children
were Caucasian, 11 % were Asian and 11 % were AfricanlCaribbean.
On any single day, one tester assessed children individually in a separate room in the
school. We varied the order of administration of the tasks randomly across children
and testers, but administered the tasks in the same order at test and retest for each
child. Each examiner tested children of both sexes and of the various age groups.
The testing session lasted for approximately lh 15mm and we gave the children
several breaks during the testing. There was a two-week period in between the test
and retest sessions; for two children only this period was longer by a few days, as
these children were absent during the 'proper' retest days. A different examiner
tested each child at time 1 and time 2. In the delay aversion task, the children were
asked to try to earn as many points as possible and they were told they would receive
a small prize in the end. The prizes were Great Ormond Street pencils and badges.
We did not think it ethically acceptable to give the children money for the points
earned.
200

A practical problem arose when administering the delay aversion task. On a few
occasions, the mouse did not work properly which resulted in the child not being
able to shoot the Klingon Cruisers at the chosen time. However, as we kept detailed
notes it was possible to alter the data afterwards, so that it corresponded to the
child's actual choices of rewards rather than what the computer had recorded.
Table 6.8.2a shows the test-retest reliability results for the DRA, delay aversion and
stop tasks. In the DRA task, the child first attempts, on his or her own, to find out
the rule that the computer uses to decide which of the two boxes is the correct one
each time. The rule is then taught to the child and, after some practice, the child does
the same task again. As many children would be expected to remember the rule at
retest, the comparison that is of most interest in terms of test-retest reliability is that
between time 1 and time 2 after teaching sessions.
The children made an average of 56% correct choices on the DRA task at time 1
before the teaching session and 77% after the teaching session. At time 2 they made
an average of 76% correct choices before the teaching session and 78% afterwards.
More than half (61 %) of the children did not find out the rule on their own at time 1,
but 78% of them remembered the rule at time 2. In the delay aversion task, at time 1
the children chose the larger reward on 53.9% of the trials on average and at time 2
on 54.4% of the trials on average.
The reliability correlation coefficients were of the same magnitude - both 0.74 and
therefore acceptable - for the DRA (after teaching) and delay aversion tasks. The
correlation coefficients were low for the measure of DRA performance before
teaching, as expected, and the significant t-test result confirms the learning effect
from time 1 to time 2 sessions.
Of the stop task variables the inter-class correlation coefficients were acceptable for
the mean probability of inhibition, mean reaction time and standard deviation of
reaction times. The lower intra-class correlations and the significant t-test results
201
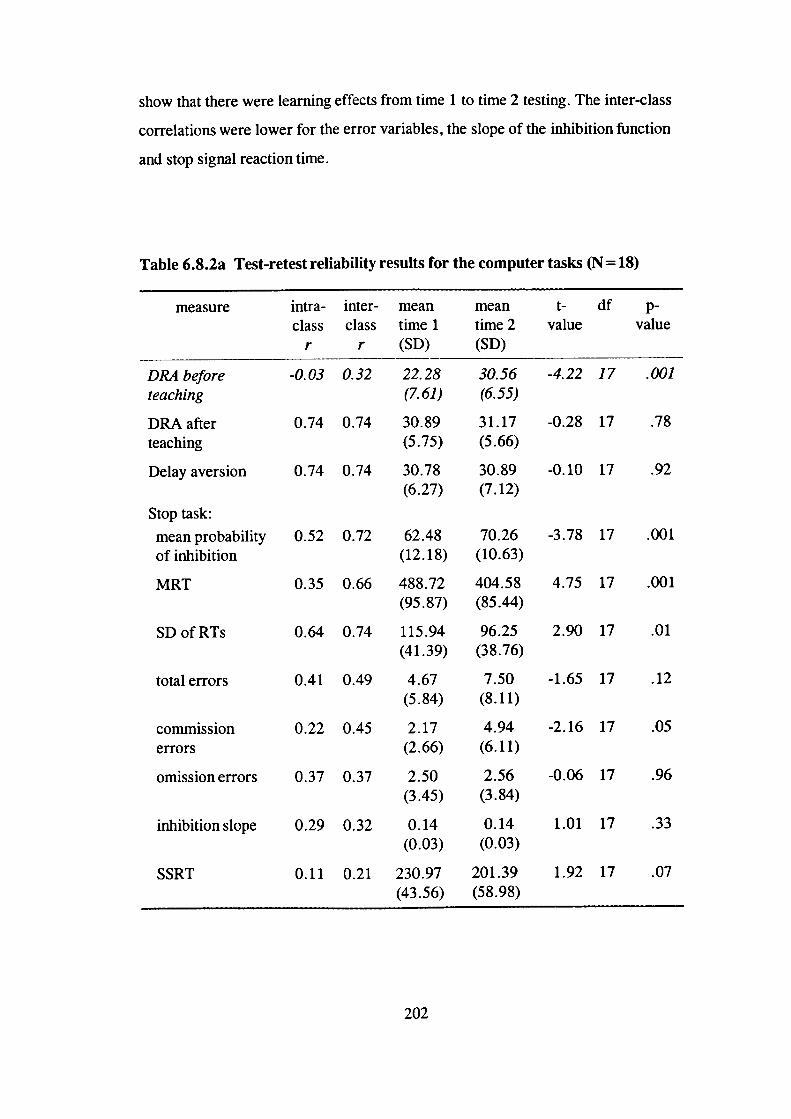
show that there were learning effects from time 1 to time 2 testing. The inter-class
correlations were lower for the error variables, the slope of the inhibition function
and stop signal reaction time.
Table 6.8.2a Test-retest reliability results for the computer tasks (N =18)
measure intra- inter- mean mean t- df p-class class time 1 time 2 value value
r r (SD) (SD)
DRA before -0.03 0.32 22.28 30.56 -4.22 17 .001teaching (7.61) (6.55)
DRA after 0.74 0.74 30.89 31.17 -0.28 17 .78teaching (5.75) (5.66)
Delay aversion 0.74 0.74 30.78 30.89 -0.10 17 .92(6.27) (7.12)
Stop task:
mean probability 0.52 0.72 62.48 70.26 -3.78 17 .001of inhibition (12.18) (10.63)
MRT 0.35 0.66 488.72 404.58 4.75 17 .001(95.87) (85.44)
SDofRTs 0.64 0.74 115.94 96.25 2.90 17 .01(41.39) (38.76)
totalerrors 0.41 0.49 4.67 7.50 -1.65 17 .12(5.84) (8.11)
commission 0.22 0.45 2.17 4.94 -2.16 17 .05
errors (2.66) (6.11)
omission errors 0.37 0.37 2.50 2.56 -0.06 17 .96(3.45) (3.84)
inhibitionslope 0.29 0.32 0.14 0.14 1.01 17 .33(0.03) (0.03)
SSRT 0.11 0.21 230.97 201.39 1.92 17 .07(43.56) (58.98)
202
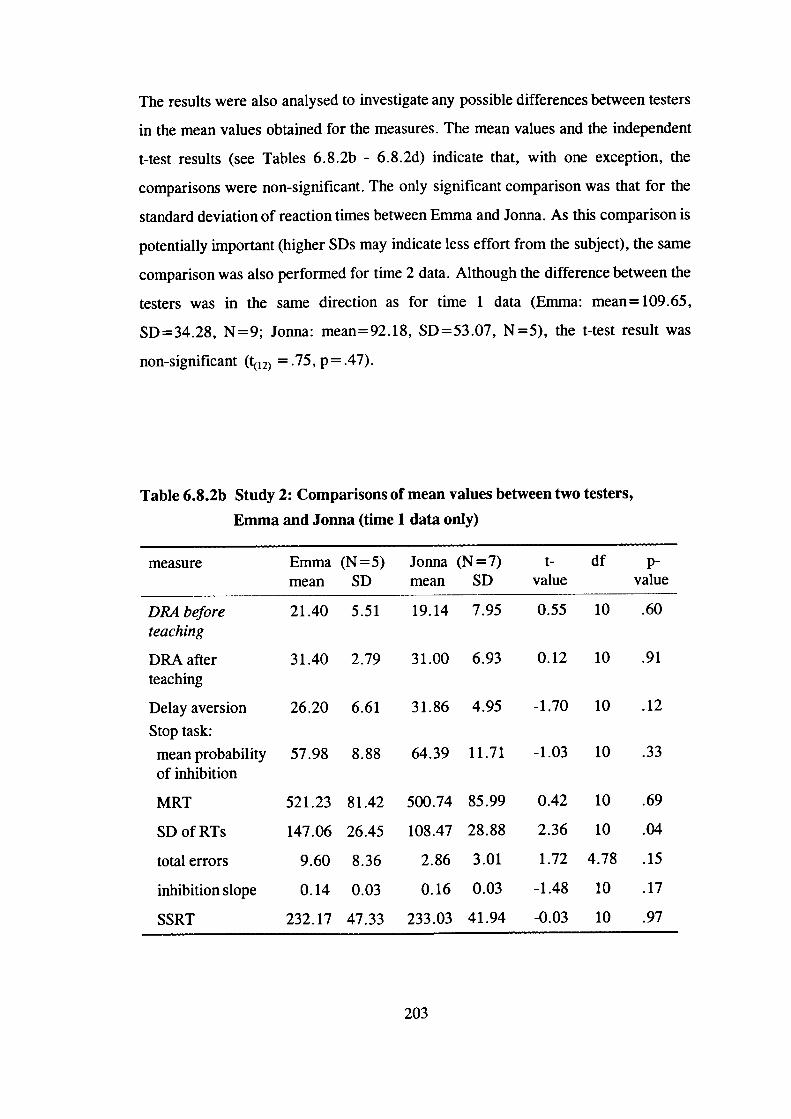
The results were also analysed to investigate any possible differences between testers
in the mean values obtained for the measures. The mean values and the independent
t-test results (see Tables 6.8.2b - 6.8.2d) indicate that, with one exception, the
comparisons were non-significant. The only significant comparison was that for the
standard deviation of reaction times between Emma and Jonna. As this comparison is
potentially important (higher SDs may indicate less effort from the subject), the same
comparison was also performed for time 2 data. Although the difference between the
testers was in the same direction as for time 1 data (Emma: mean= 109.65,
SD=34.28, N=9; Jonna: mean=92.18, SD=53.07, N=5), the t-test result was
non-significant (ç12) = .75, p = .47).
Table 6.8.2b Study 2: Comparisons of mean values between two testers,
Emma and Jonna (time 1 data only)
measure Emma (N = 5) Jonna (N = 7) t- dfmean SD mean SD value value
DRA before 21.40 5.51 19.14 7.95 0.55 10 .60teaching
DRA after 31.40 2.79 31.00 6.93 0.12 10 .91teaching
Delay aversion 26.20 6.61 31.86 4.95 -1.70 10 .12
Stop task:
meanprobability 57.98 8.88 64.39 11.71 -1.03 10 .33of inhibition
MRT 521.23 81.42 500.74 85.99 0.42 10 .69
SD of RTs 147.06 26.45 108.47 28.88 2.36 10 .04
totalerrors 9.60 8.36 2.86 3.01 1.72 4.78 .15
inhibitionslope 0.14 0.03 0.16 0.03 -1.48 10 .17
SSRT 232.17 47.33 233.03 41.94 -0.03 10 .97
203
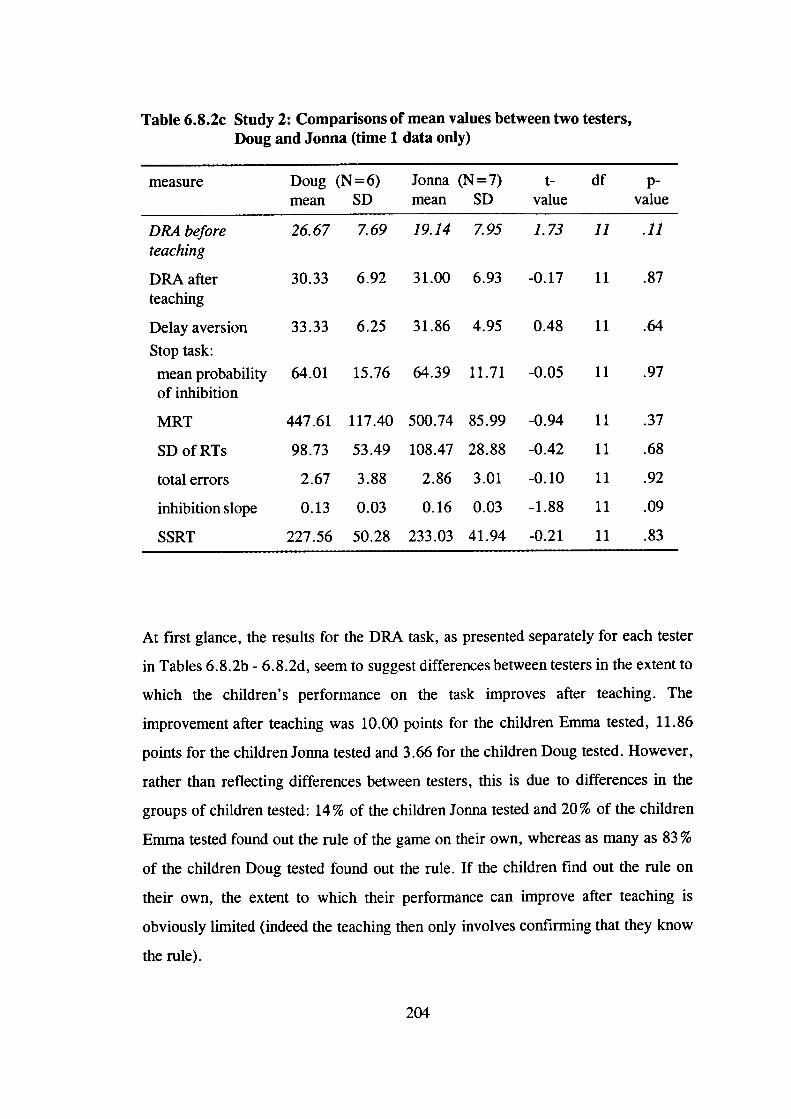
Table 6.8.2c Study 2: Comparisons of mean values between two testers,Doug and Jonna (time 1 data only)
measure Doug (N = 6) Jonna (N = 7) t- df p-mean SD mean SD value value
DRA before 26.67 7.69 19.14 7.95 1.73 11 .11teaching
DRA after 30.33 6.92 31.00 6.93 -0.17 11 .87teaching
Delay aversion 33.33 6.25 31.86 4.95 0.48 11 .64
Stop task:
mean probability 64.01 15.76 64.39 11.71 -0.05 11 .97of inhibition
MRT 447.61 117.40 500.74 85.99 -0.94 11 .37
SDofRTs 98.73 53.49 108.47 28.88 -0.42 11 .68
totalerrors 2.67 3.88 2.86 3.01 -0.10 11 .92
inhibitionslope 0.13 0.03 0.16 0.03 -1.88 11 .09
SSRT 227.56 50.28 233.03 41.94 -0.21 11 .83
At first glance, the results for the DRA task, as presented separately for each tester
in Tables 6.8.2b - 6.8.2d, seem to suggest differences between testers in the extent to
which the children's performance on the task improves after teaching. The
improvement after teaching was 10.00 points for the children Emma tested, 11.86
points for the children Jonna tested and 3.66 for the children Doug tested. However,
rather than reflecting differences between testers, this is due to differences in the
groups of children tested: 14% of the children Jonna tested and 20% of the children
Emma tested found out the rule of the game on their own, whereas as many as 83 %
of the children Doug tested found out the rule. If the children find out the rule on
their own, the extent to which their performance can improve after teaching is
obviously limited (indeed the teaching then only involves confirming that they know
the rule).
204
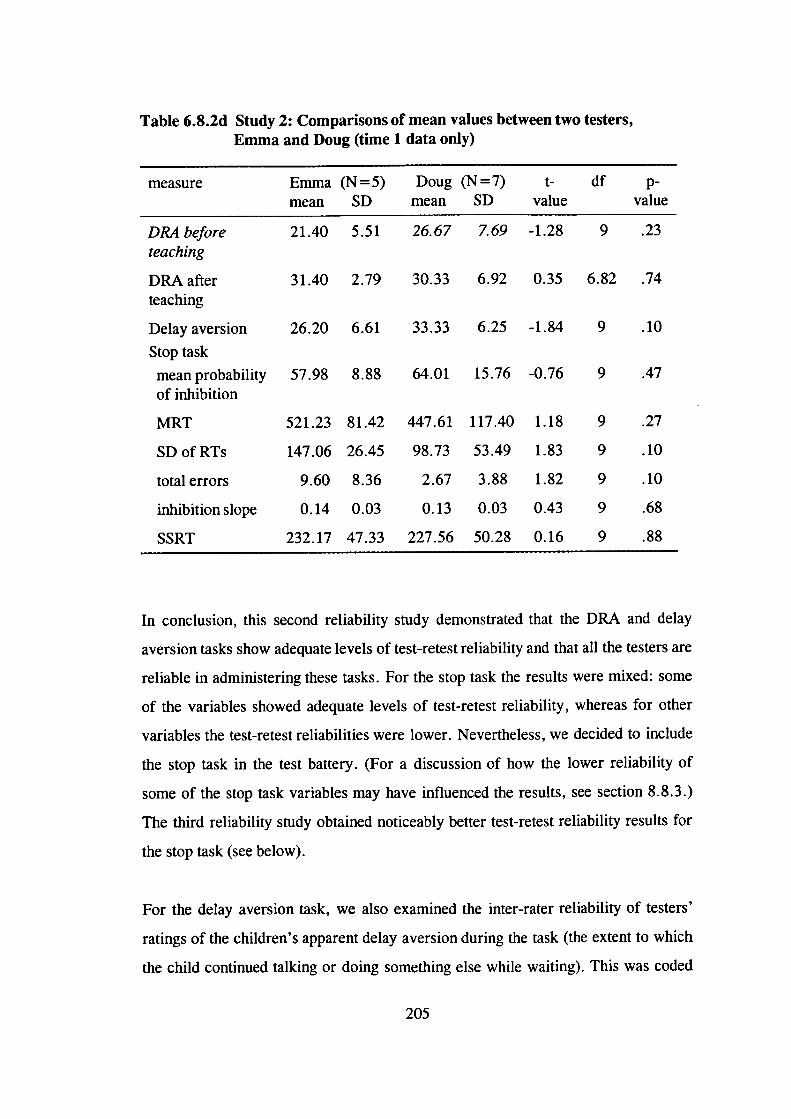
Table 6.8.2d Study 2: Comparisons of mean values between two testers,Emma and Doug (time 1 data only)
measure Emma (N =5) Doug (N =7) t- df p-mean SD mean SD value value
DRA before 21.40 5.51 26.67 7.69 -1.28 9 .23teaching
DRA after 31.40 2.79 30.33 6.92 0.35 6.82 .74teaching
Delay aversion 26.20 6.61 33.33 6.25 -1.84 9 .10
Stop task
mean probability 57.98 8.88 64.01 15.76 -0.76 9 .47of inhibition
MRT 521.23 81.42 447.61 117.40 1.18 9 .27
SD of RTs 147.06 26.45 98.73 53.49 1.83 9 .10
total errors 9.60 8.36 2.67 3.88 1.82 9 .10
inhibitionslope 0.14 0.03 0.13 0.03 0.43 9 .68
SSRT 232.17 47.33 227.56 50.28 0.16 9 .88
In conclusion, this second reliability study demonstrated that the DRA and delay
aversion tasks show adequate levels of test-retest reliability and that all the testers are
reliable in administering these tasks. For the stop task the results were mixed: some
of the variables showed adequate levels of test-retest reliability, whereas for other
variables the test-retest reliabilities were lower. Nevertheless, we decided to include
the stop task in the test battery. (For a discussion of how the lower reliability of
some of the stop task variables may have influenced the results, see section 8.8.3.)
The third reliability study obtained noticeably better test-retest reliability results for
the stop task (see below).
For the delay aversion task, we also examined the inter-rater reliability of testers'
ratings of the children's apparent delay aversion during the task (the extent to which
the child continued talking or doing something else while waiting). This was coded
205
as 'not at all', 'a liule', or 'very much' (or 'not applicable' if the child always chose
the small immediate reward) (see Appendix K). For this reliability analysis the
category of 'not at all' was compared to the category of 'a little or very much'. The
sample for these analyses were 18 children (nine twin pairs) who participated in the
main study. However, the data for one child could not be used in the analysis, as this
child continuously chose the small immediate reward. Each child's apparent delay
aversion was rated by the tester and, based on a video tape of the testing session, by
a second rater. Each family had, prior to the session, signed a consent form agreeing
for the child to be videotaped. The kappa value was .60 (p = .003), which indicates
good agreement between the testers (see Landis & Koch, 1977).
6.8.3 Reliability study III
A third reliability study was carried out to establish the reliability of a new tester
who replaced Emma and Doug two thirds through the testing for the main study.
After an initial training phase, the study was carried out with eight twin pairs. The
twins were those for whom teachers and parents had disagreed about their group
status, that is, at least one of the twins was classified as situationally hyperactive.
We had therefore excluded these twins from the main study. Six of the twin pairs
were girls and two pairs were boys. Their mean age was 8.9 years (SD= 1.2
years). In terms of ethnic origin, seven of the twin pairs were classified as
Caucasian and one pair as 'other'.
Each family - the twins and at least one parent - made two visits to the Institute,
with a two-week period in between the visits. In order to limit the length of the
session to 2,5 hours, each twin did half of the test battery. 'Twin A' did the
following tasks: stop task, sentence span, similarities and counting span. 'Twin B'
did the remaining tasks: DRA, delay aversion, picture completion, vocabulary and
block design. At retest each twin did the same tasks and in the same order;
however, now the tester assessed 'twin B' first. Tables 6.8.3a and 6.8.3b show the
results from this study.
206
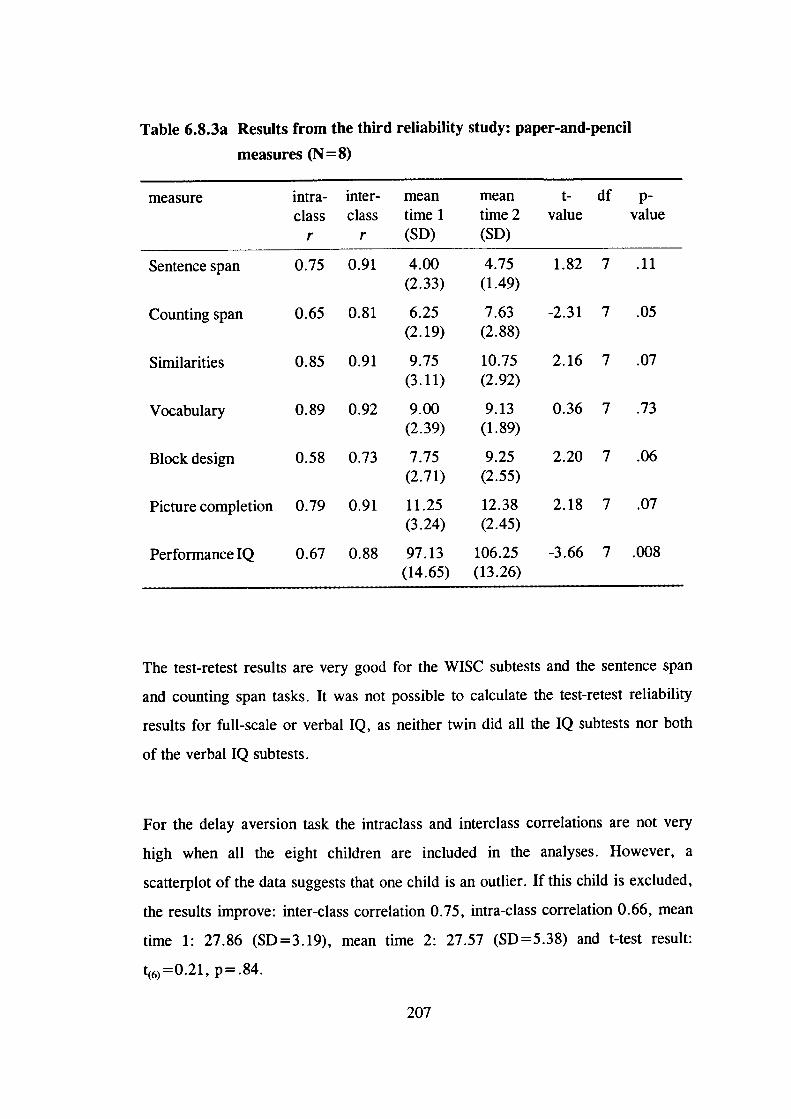
Table 6.8.3a Results from the third reliability study: paper-and-pencil
measures (N = 8)
measure intra- inter- mean mean t- df p-class class time 1 time 2 value value
r r (SD) (SD)
Sentence span 0.75 0.91 4.00 4.75 1.82 7 .11(2.33) (1.49)
Counting span 0.65 0.81 6.25 7.63 -2.31 7 .05(2.19) (2.88)
Similarities 0.85 0.91 9.75 10.75 2.16 7 .07(3.11) (2.92)
Vocabulary 0.89 0.92 9.00 9.13 0.36 7 .73(2.39) (1.89)
Block design 0.58 0.73 7.75 9.25 2.20 7 .06(2.71) (2.55)
Picture completion 0.79 0.91 11.25 12.38 2.18 7 .07(3.24) (2.45)
PerformancelQ 0.67 0.88 97.13 106.25 -3.66 7 .008(14.65) (13.26)
The test-retest results are very good for the WISC subtests and the sentence span
and counting span tasks. It was not possible to calculate the test-retest reliability
results for full-scale or verbal IQ, as neither twin did all the IQ subtests nor both
of the verbal IQ subtests.
For the delay aversion task the intraclass and interclass correlations are not very
high when all the eight children are included in the analyses. However, a
scatterplot of the data suggests that one child is an outlier. If this child is excluded,
the results improve: inter-class correlation 0.75, intra-class correlation 0.66, mean
time 1: 27.86 (SD =3.19), mean time 2: 27.57 (SD =5.38) and t-test result:
t(6yO.2l, p.84.
207
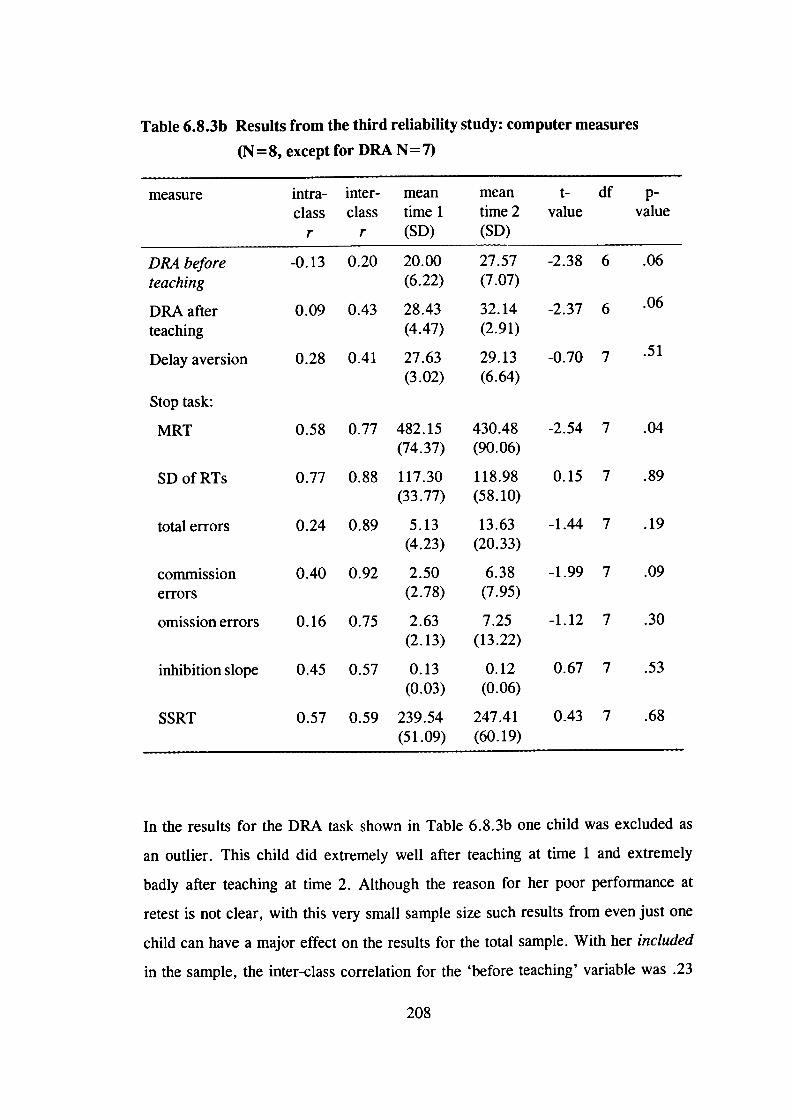
Stop task:
MRT -2.54 7 .04430.48(90.06)
118.98(58.10)
totalerrors 0.24 0.89 5.13 13.63 -1.44 7 .19(4.23) (20.33)
commission 0.40 0.92 2.50 6.38 -1.99 7 .09errors (2.78) (7.95)
omissionerrors 0.16 0.75 2.63 7.25 -1.12 7 .30(2.13) (13.22)
inhibitionslope 0.45 0.57 0.13 0.12 0.67 7 .53(0.03) (0.06)
SSRT 0.57 0.59 239.54 247.41 0.43 7 .68(51.09) (60.19)
0.58 0.77 482.15(74.37)
117.30(33.77)
0.15 7 .890.77 0.88SD of RTs
Table 6.8.3b Results from the third reliability study: computer measures
(N =8, except for DRA N=7)
measure intra- inter- mean mean t- df p-class class time 1 time 2 value value
r r (SD) (SD)
DRA before -0.13 0.20 20.00 27.57 -2.38 6 .06teaching (6.22) (7.07)
DRA after 0.09 0.43 28.43 32.14 -2.37 6 .06
teaching (4.47) (2.91)
Delay aversion 0.28 0.41 27.63 29.13 -0.70 .51
(3.02) (6.64)
In the results for the DRA task shown in Table 6.8.3b one child was excluded as
an outlier. This child did extremely well after teaching at time 1 and extremely
badly after teaching at time 2. Although the reason for her poor performance at
retest is not clear, with this very small sample size such results from even just one
child can have a major effect on the results for the total sample. With her included
in the sample, the inter-class correlation for the 'before teaching' variable was .23
208
and for the 'after teaching' variable -.34; the intra-class correlations were -.15 and
-.35, respectively. However, even when this child is excluded, the results for the
DRA are still not as good as in the previous reliability study.
There could be several reasons for this and the other small differences between the
results of this study and the previous ones. First, the sample was different from the
children who took part in the earlier studies: the children who participated in this
later study were situationally hyperactive. These children's behaviour could, for
example, be more variable from time to time than that of control children
(especially on tasks on which hyperactive children generally perform poorly).
Also, as discussed above, the sample size was obviously very small. Second, the
tester felt that whether the child was assessed before or after his or her co-twin
influenced the performance of some of the children. For example, on the delay
aversion task the child might have been better motivated to wait when doing the
tasks before the co-twin than when doing the task last. The children in the earlier
reliability studies were singletons.
Taking these limitations of this last small-scale reliability study into account, the
results suggest that the tester is reliable in administering these tasks. This study
also suggested a better test-retest reliability for several of the stop task variables
compared to the previous study, which further justifies the inclusion of the stop
task in the test battery.
209
Chapter 7
Results
7.1 Exploration of the data
7.1.1 Missing data
For most measures, there is very little missing data. Data for verbal IQ and full-
scale IQ is missing for one child: she was an extremely shy child who refused to
answer most verbal questions. For the stop task the data is missing for three cases,
because with these children it was not possible to carry out all four experimental
blocks. The data is also missing for two children for the DRA (delayed response
alternation) 'after teaching' variable and for one child for the delay aversion
measure. These children refused to finish these tasks.
7.1.2 Cases excluded from analyses
For the stop task data, all the preliminary analyses were carried out both including
and excluding children with high error rates, to investigate what effect this would
have on the results (this will be discussed later in section 7.2.2).
210
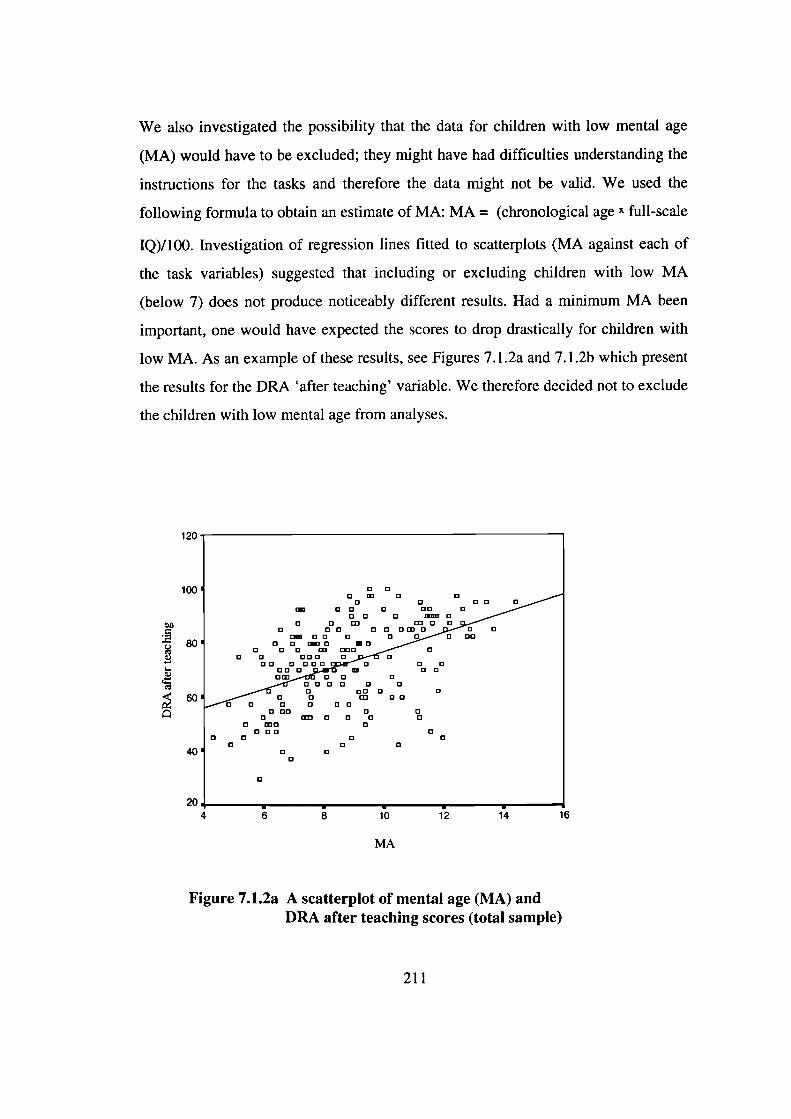
We also investigated the possibility that the data for children with low mental age
(MA) would have to be excluded; they might have had difficulties understanding the
instructions for the tasks and therefore the data might not be valid. We used the
following formula to obtain an estimate of MA: MA = (chronological age x full-scale
IQ)/100. Investigation of regression lines fitted to scatterplots (MA against each of
the task variables) suggested that including or excluding children with low MA
(below 7) does not produce noticeably different results. Had a minimum MA been
important, one would have expected the scores to drop drastically for children with
low MA. As an example of these results, see Figures 7.1 .2a and 7.1 .2b which present
the results for the DRA 'after teaching' variable. We therefore decided not to exclude
the children with low mental age from analyses.
120
100
80
60
40
6 8 10 12 14 16
MA
Figure 7.1.2a A scatterplot of mental age (MA) andDRA after teaching scores (total sample)
204
211
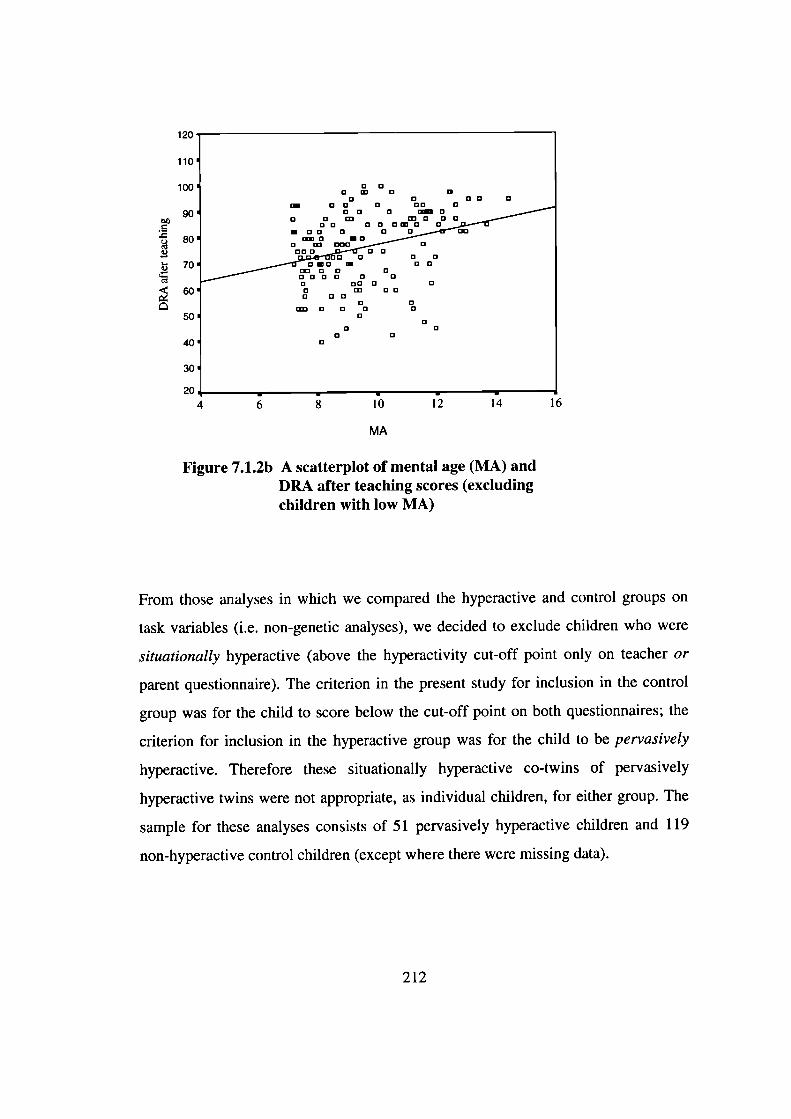
120
110
100
90b
4 80
70
60
50
40
30
20
4 6 8 10 12 14 16
MA
Figure 7.1.2b A scatterplot of mental age (MA) andDRA after teaching scores (excludingchildren with low MA)
From those analyses in which we compared the hyperactive and control groups on
task variables (i.e. non-genetic analyses), we decided to exclude children who were
situationally hyperactive (above the hyperactivity cut-off point only on teacher or
parent questionnaire). The criterion in the present study for inclusion in the control
group was for the child to score below the cut-off point on both questionnaires; the
criterion for inclusion in the hyperactive group was for the child to be pervasively
hyperactive. Therefore these situationally hyperactive co-twins of pervasively
hyperactive twins were not appropriate, as individual children, for either group. The
sample for these analyses consists of 51 pervasively hyperactive children and 119
non-hyperactive control children (except where there were missing data).
212
7.1.3 Parametric vs non-parametric methods
The distributions for the variables were examined using the one-sample
Kolmogorov-Smirnov test (see Appendix B). The issue is whether the distributions
would be close to a normal distribution for a general population sample; parametric
methods assume an underlying normal distribution. These analyses were therefore
carried out on the 'representative' sample for the rating scale variables (see section
6.5.2) and on the total sample of children tested (that is, not excluding situationally
hyperactive children) for the testing variables.
For several variables the distributions were reasonably close to a normal
distribution, suggesting that it would be appropriate to use parametric methods.
The distributions for the four observational rating variables were very skewed,
however, and we decided to use a summary score of these four scores in the
analyses rather than the raw scores. For some other variables the distributions were
also skewed, such that most children obtained low scores and only a few children
obtained high scores. As such distributions are difficult to normalise, we decided
to carry out the analyses on the existing scores. Note that the DF extreme group
analysis, the method used to test the main hypothesis of this thesis, is a robust
method in relation to the assumption of normality of distribution.
7.1.4 Should IQ or age be controlled for?
We investigated the possibility that IQ should be included in the analyses as a
covariate. Table 7.1 .4a shows the results from a MANOVA, comparing the two
groups on verbal and performance IQ. The results are also presented controlling
for conduct problems (average conduct problem scores based on teacher and parent
report).
213
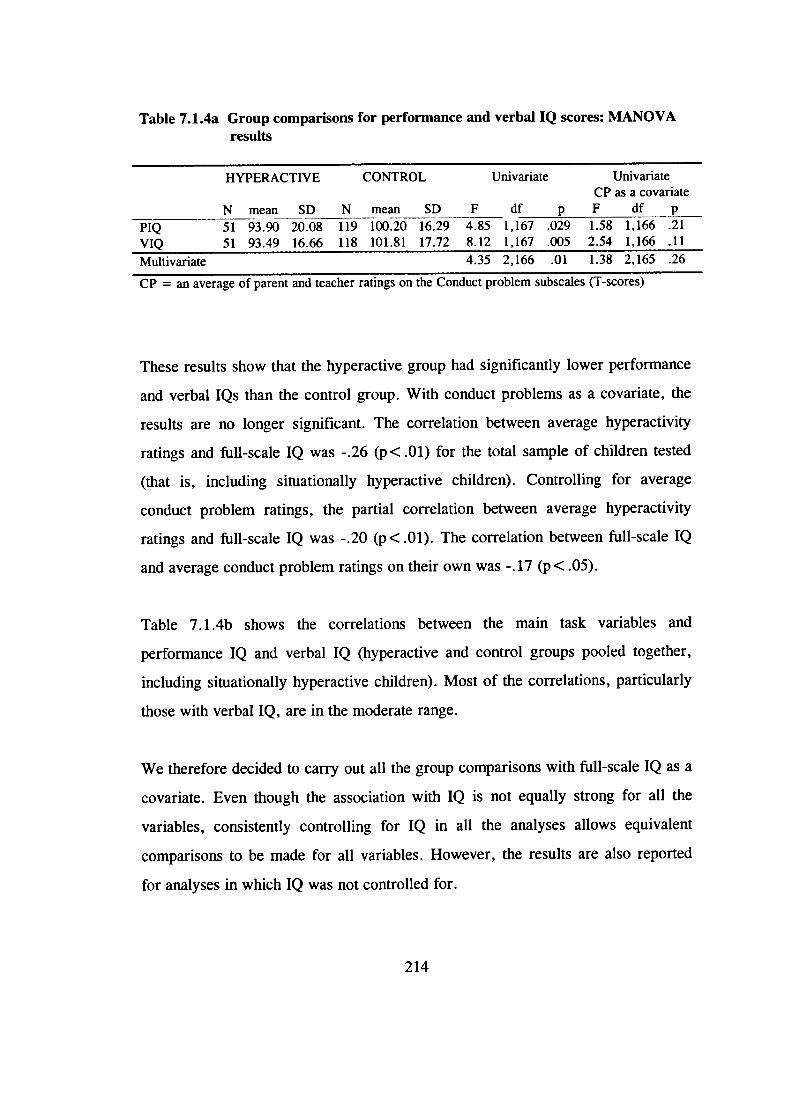
Table 7.1.4a Group comparisons for performance and verbal IQ scores: MANOVAresults
HYPERACTIVE CONTROL Univariate UnivariateCP as a covariate
N mean SD N mean SD F df p F df p
PIQ 51 93.90 20.08 119 100.20 16.29 4.85 1,167 .029 1.58 1,166 .21VIQ 51 93.49 16.66 118 101.81 17.72 8.12 1,167 .005 2.54 1,166 .11
Multivariate 4.35 2,166 .01 1.38 2,165 .26
CP = an average of parent and teacher ratings on the Conduct problem subscales (T-scores)
These results show that the hyperactive group had significantly lower performance
and verbal IQs than the control group. With conduct problems as a covariate, the
results are no longer significant. The correlation between average hyperactivity
ratings and full-scale IQ was -.26 (p < .01) for the total sample of children tested
(that is, including situationally hyperactive children). Controlling for average
conduct problem ratings, the partial correlation between average hyperactivity
ratings and full-scale IQ was -.20 (p < .01). The correlation between full-scale IQ
and average conduct problem ratings on their own was -.17 (p < .05).
Table 7.1 .4b shows the correlations between the main task variables and
performance IQ and verbal IQ (hyperactive and control groups pooled together,
including situationally hyperactive children). Most of the correlations, particularly
those with verbal IQ, are in the moderate range.
We therefore decided to carry out all the group comparisons with full-scale IQ as a
covariate. Even though the association with IQ is not equally strong for all the
variables, consistently controlling for IQ in all the analyses allows equivalent
comparisons to be made for all variables. However, the results are also reported
for analyses in which IQ was not controlled for.
214
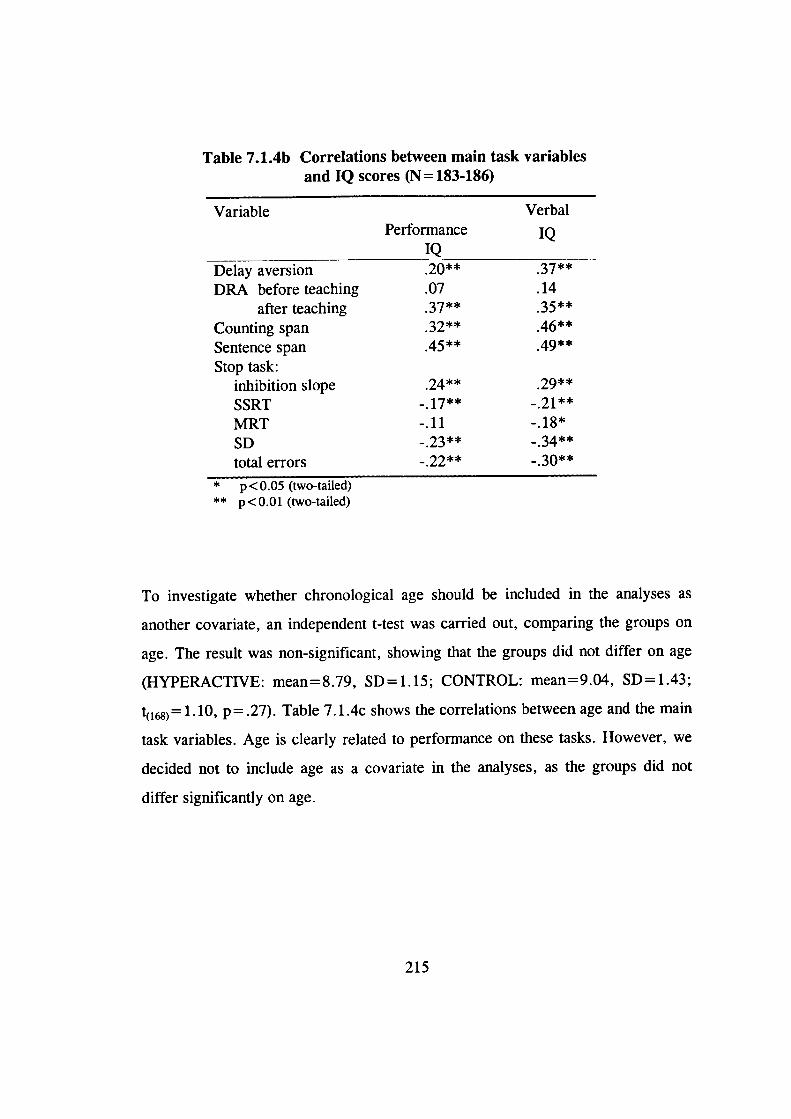
Table 7.1.4b Correlations between main task variablesand IQ scores (N=183-186)
Variable VerbalPerformance IQ____IQ
.20** 37**
.07 .1437** 35**
.46**45** 49**
Delay aversionDRA before teaching
after teachingCounting spanSentence spanStop task:
inhibition slope .24**
SSRT .17**
MRT -.11SD .23**
total errors .22**
* p <0.05 (two-tailed)** p<O.Ol (two-tailed)
To investigate whether chronological age should be included in the analyses as
another covariate, an independent t-test was carried out, comparing the groups on
age. The result was non-significant, showing that the groups did not differ on age
(HYPERACTIVE: mean=8.79, SD=1.15; CONTROL: mean=9.04, SD=1.43;
1) =1.10, p = .27). Table 7.1. 4c shows the correlations between age and the main
task variables. Age is clearly related to performance on these tasks. However, we
decided not to include age as a covariate in the analyses, as the groups did not
differ significantly on age.
215
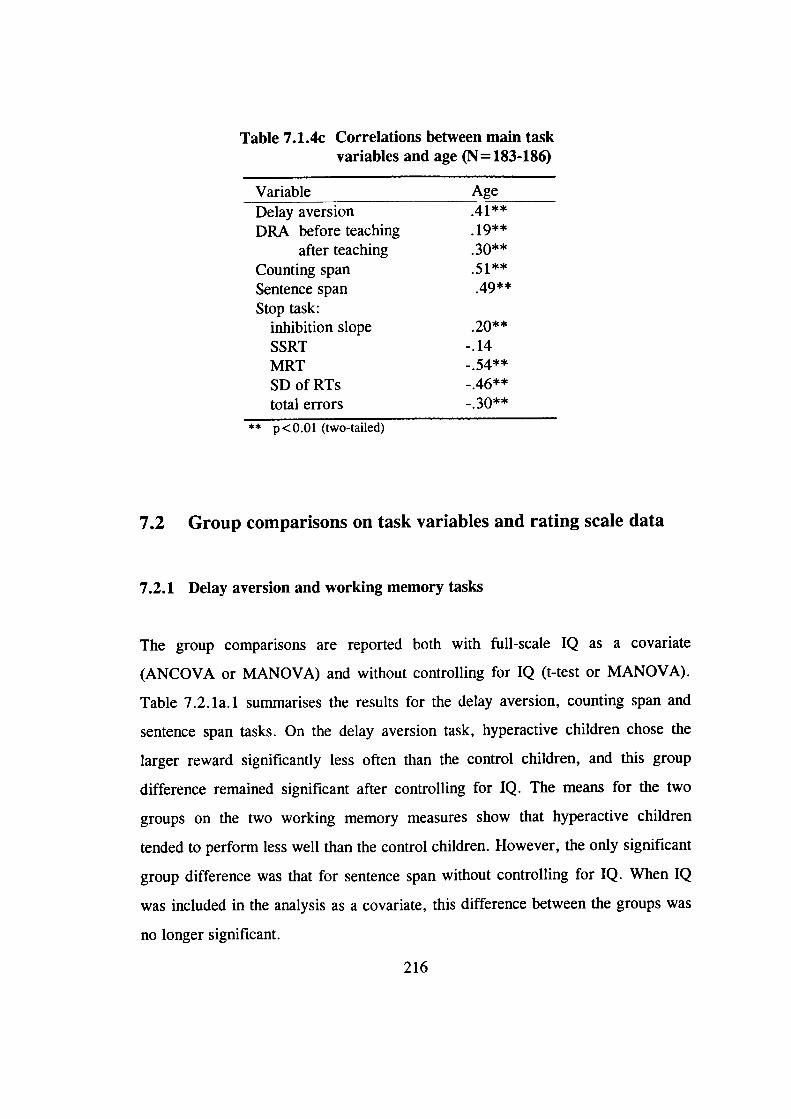
Table 7.1.4c Correlations between main taskvariables and age (N= 183-186)
Variable AgeDelay aversion .41**
DRA before teaching . 19**after teaching 3Ø**
Counting spanSentence span 49**
Stop task:inhibition slope .20**
SSRT -.14MRTSDofRTstotal errors -. 30**
** p < O.Ol (two-tailed)
7.2 Group comparisons on task variables and rating scale data
7.2.1 Delay aversion and working memory tasks
The group comparisons are reported both with full-scale IQ as a covariate
(ANCOVA or MANOVA) and without controlling for IQ (t-test or MANOVA).
Table 7.2.la.1 summarises the results for the delay aversion, counting span and
sentence span tasks. On the delay aversion task, hyperactive children chose the
larger reward significantly less often than the control children, and this group
difference remained significant after controlling for IQ. The means for the two
groups on the two working memory measures show that hyperactive children
tended to perform less well than the control children. However, the only significant
group difference was that for sentence span without controlling for IQ. When IQ
was included in the analysis as a covariate, this difference between the groups was
no longer significant.
216
The results are also reported controlling for conduct problems and anxiety (Table
7.2. la.2). With conduct problems as a covariate, none of the group comparisons
are significant. In contrast, controlling for anxiety does not alter the pattern of
findings: the group comparisons for the delay aversion and sentence span tasks
remain significant.
The mean scores on the sentence span and counting span tasks (Table 7.2. la. 1)
suggest that both groups performed relatively better on the counting span than on
the sentence span task. Paired t-tests confirmed that these within-group differences
were significant (HYPERACTIVE: t (50) =4.06, p< .001; CONTROL: t(118)=6.08,
p< .001).
The DRA before and after teaching scores were analysed together in a MANOVA
(see Table 7.2. lb.!). Before teaching the children the rule, both groups performed
at chance levels. After the children had been taught the rule, the control children
performed significantly better than the hyperactive children. When IQ is controlled
for, this group difference disappears. Table 7.2. lb.2 shows the results when
conduct problems and anxiety are controlled for. In both cases the group
comparison for the 'after teaching' variable remains significant.
217
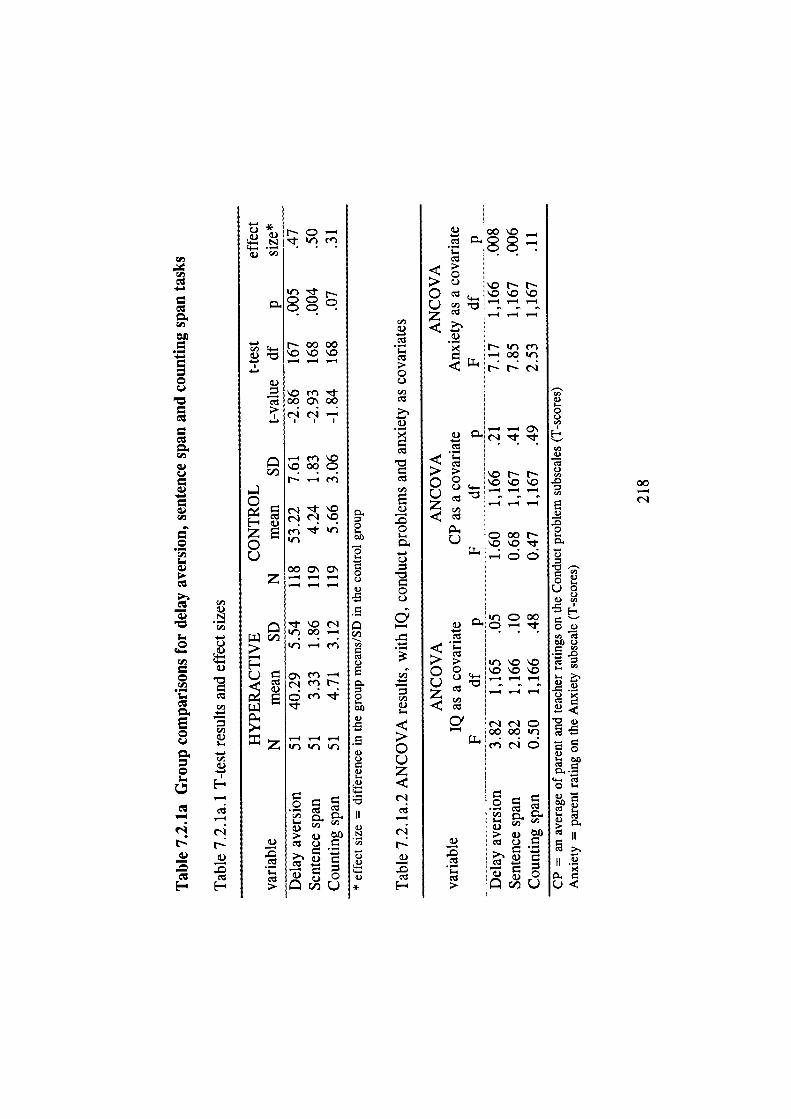
.-
CJ
a)
a)C,,
a)
a)
1
0
E0
0
Na)
C)NCl,
C,,C)I-0C.)
C.,C)
C)C,,.0
C)•00I-.
C)
O
11
- .C.)
C)
I-.
C)00IC
Ca II
II
0<
00'-4
(I,
0c)Cl,
a)
Cl,
Ea)
0
r-)
0C)
4-.
Cl,
C.,,a)
0C-)z
—4
a)
F-
.t) Cfl
CC
N00O0'0 \'.0
_4 —
a)onr00C\0r'1 cI
I I I
I—' ' Cfl 0O0•C
-
zoC)
O0a.az — — -— — —
t'.or'1
If. —4 fl
U cn —
•
_4 .-4 —4z
a)Cl1
> a) ti)a)
-a)'-,
00'.0c CC.
:::?. C) ko r- N0 o'.o'.oC-)z - —
• r-'rn__OOIr,
J4 '-4 O
- -
> '.0 N N0C) — —4
--4—
COON'-.
•'t C 00—4 -
00 .0'.0o
C-)
z
0' r'IrC
— :00OO
. a)C)a)
a) 0crjU
C)
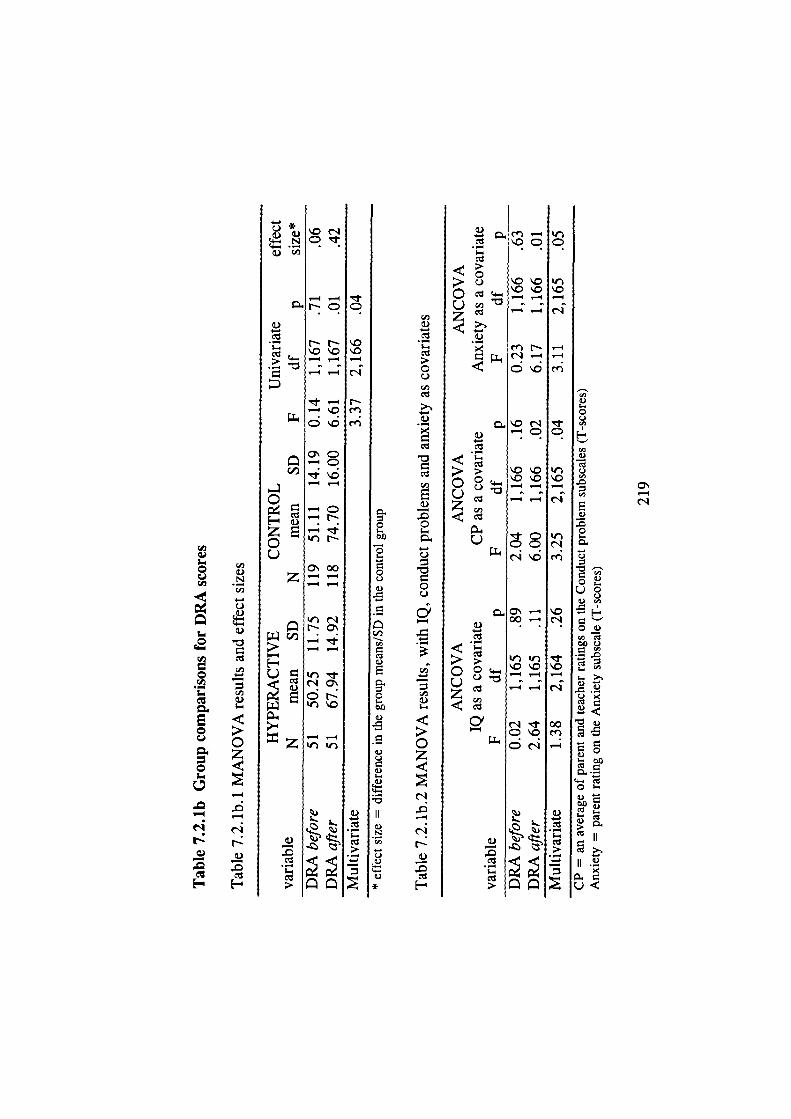
—4
5
000
00U
(I)
E
000
N
00
Et)
0
c)
Cz
—4
rN
—4—4
—4
\0
'-4
00en—4
0U
U
EU00
0
00 U•0
. .9U
. U
00
4- C
0
U
00
II
II .2
U
—4
V
0N
—4-
•— SN
—4-
--4
'—.4 QE-
E—Ir)NC-)
c00z--- _.4
NO\
'--4
C-)o]
--4Zitr
I-
[-' 00 0\0r.4 — —
z --
t)mN
_4 ;--, c \OO
0 e44
-c
—
'-,
r0
'-.400. -
0—.4-4
(ID
—
L
z
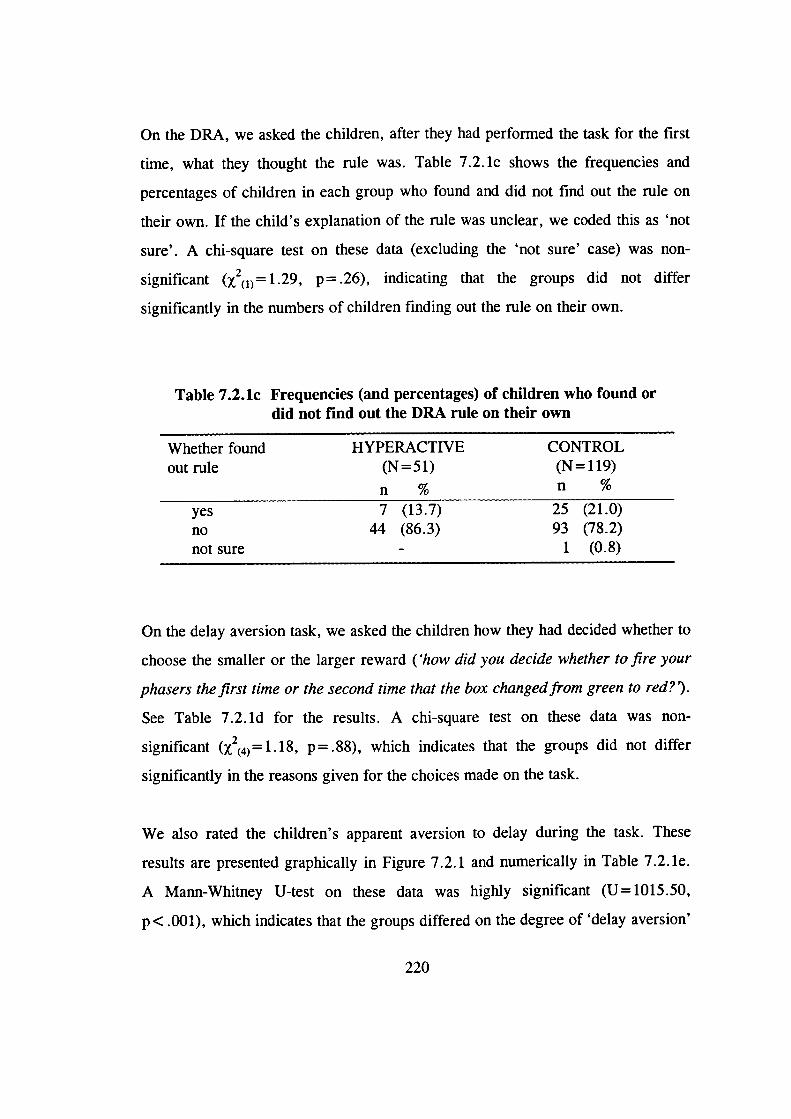
On the DRA, we asked the children, after they had performed the task for the first
time, what they thought the rule was. Table 7.2. ic shows the frequencies and
percentages of children in each group who found and did not find out the rule on
their own. If the child's explanation of the rule was unclear, we coded this as 'not
sure'. A chi-square test on these data (excluding the 'not sure' case) was non-
significant (X2(1)= 1.29, p=.26), indicating that the groups did not differ
significantly in the numbers of children finding out the rule on their own.
Table 7.2.lc Frequencies (and percentages) of children who found ordid not find out the DRA rule on their own
Whether found HYPERACTIVE CONTROLout rule (N = 51) (N =119)
n % n
yes 7 (13.7) 25 (21.0)no 44 (86.3) 93 (78.2)not sure - 1 (0.8)
On the delay aversion task, we asked the children how they had decided whether to
choose the smaller or the larger reward ('how did you decide whether to fire your
phasers the first time or the second time that the box changed from green to red?).
See Table 7.2. id for the results. A chi-square test on these data was non-
significant (X2(4) =1.18, p = .88), which indicates that the groups did not differ
significantly in the reasons given for the choices made on the task.
We also rated the children's apparent aversion to delay during the task. These
results are presented graphically in Figure 7.2.1 and numerically in Table 7.2. le.
A Mann-Whitney U-test on these data was highly significant (U=1015.50,
p < .001), which indicates that the groups differed on the degree of 'delay aversion'
220
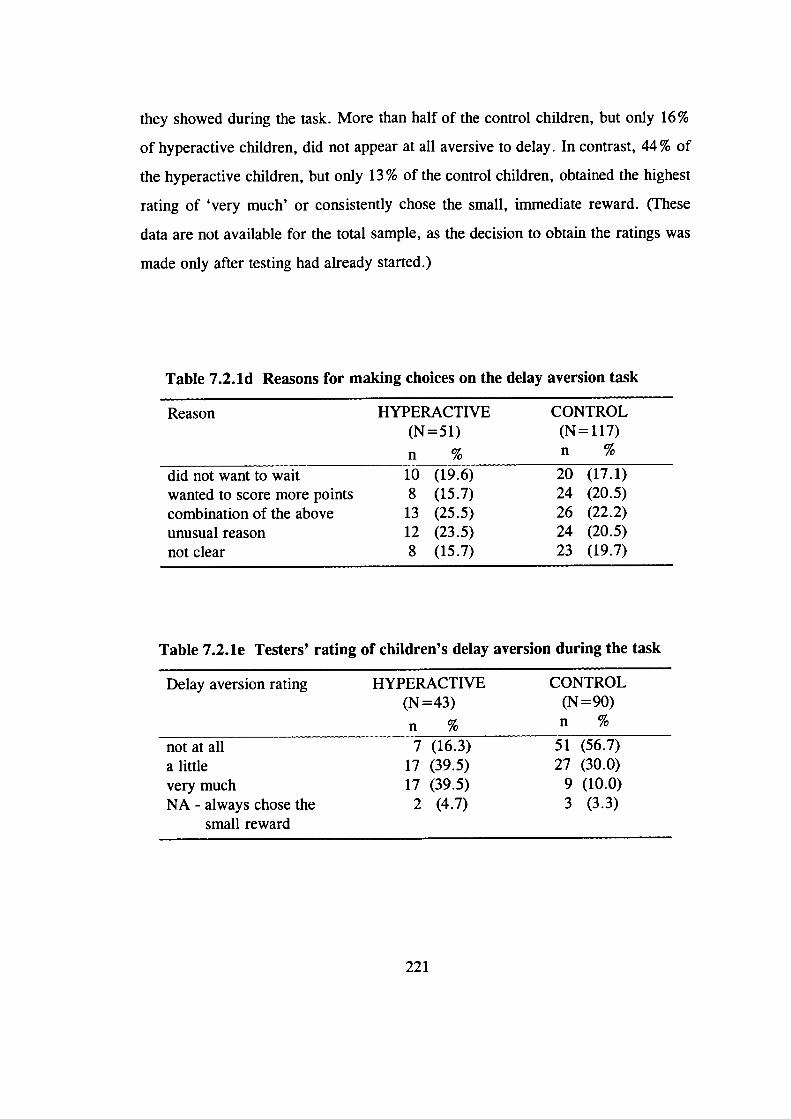
they showed during the task. More than half of the control children, but only 16%
of hyperactive children, did not appear at all aversive to delay. In contrast, 44% of
the hyperactive children, but only 13% of the control children, obtained the highest
rating of 'very much' or consistently chose the small, immediate reward. (These
data are not available for the total sample, as the decision to obtain the ratings was
made only after testing had already started.)
Table 7.2.ld Reasons for making choices on the delay aversion task
Reason HYPERACTIVE CONTROL(N=51) (N=117)
n % n %
did not want to wait 10 (19.6) 20 (17.1)wanted to score more points 8 (15.7) 24 (20.5)combination of the above 13 (25.5) 26 (22.2)unusual reason 12 (23.5) 24 (20.5)not clear 8 (15.7) 23 (19.7)
Table 7.2.le Testers' rating of children's delay aversion during the task
Delay aversion rating HYPERACTIVE CONTROL
(N=43) (N=90)
% n
not at all 7 (16.3) 51 (56.7)a little 17 (39.5) 27 (30.0)very much 17 (39.5) 9 (10.0)NA - always chose the 2 (4.7) 3 (3.3)
small reward
221
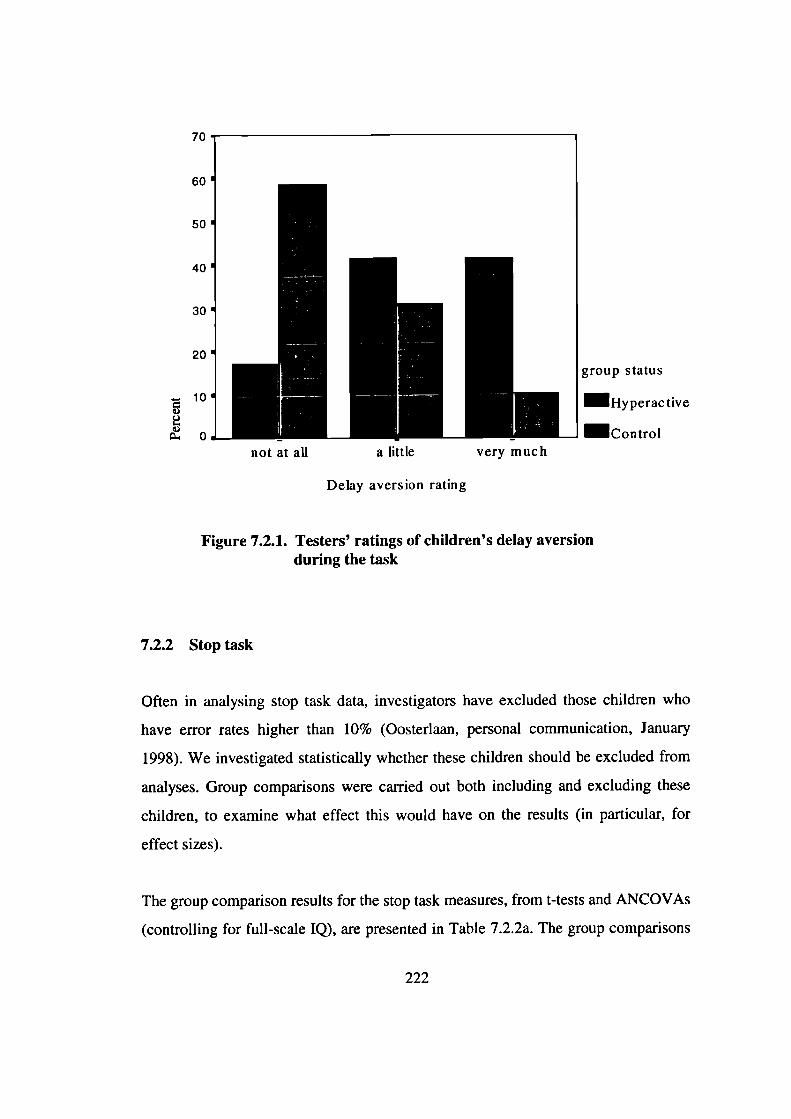
not at all a little very much
70
60
50
40
30
20
10VUI-V 0
group status
Hyperactive
Control
Delay aversion rating
Figure 7.2.1. Testers' ratings of children's delay aversionduring the task
7.2.2 Stop task
Often in analysing stop task data, investigators have excluded those children who
have error rates higher than 10% (Oosterlaan, personal communication, January
1998). We investigated statistically whether these children should be excluded from
analyses. Group comparisons were carried out both including and excluding these
children, to examine what effect this would have on the results (in particular, for
effect sizes).
The group comparison results for the stop task measures, from t-tests and ANCOVAs
(controlling for full-scale IQ), are presented in Table 7.2.2a. The group comparisons
222
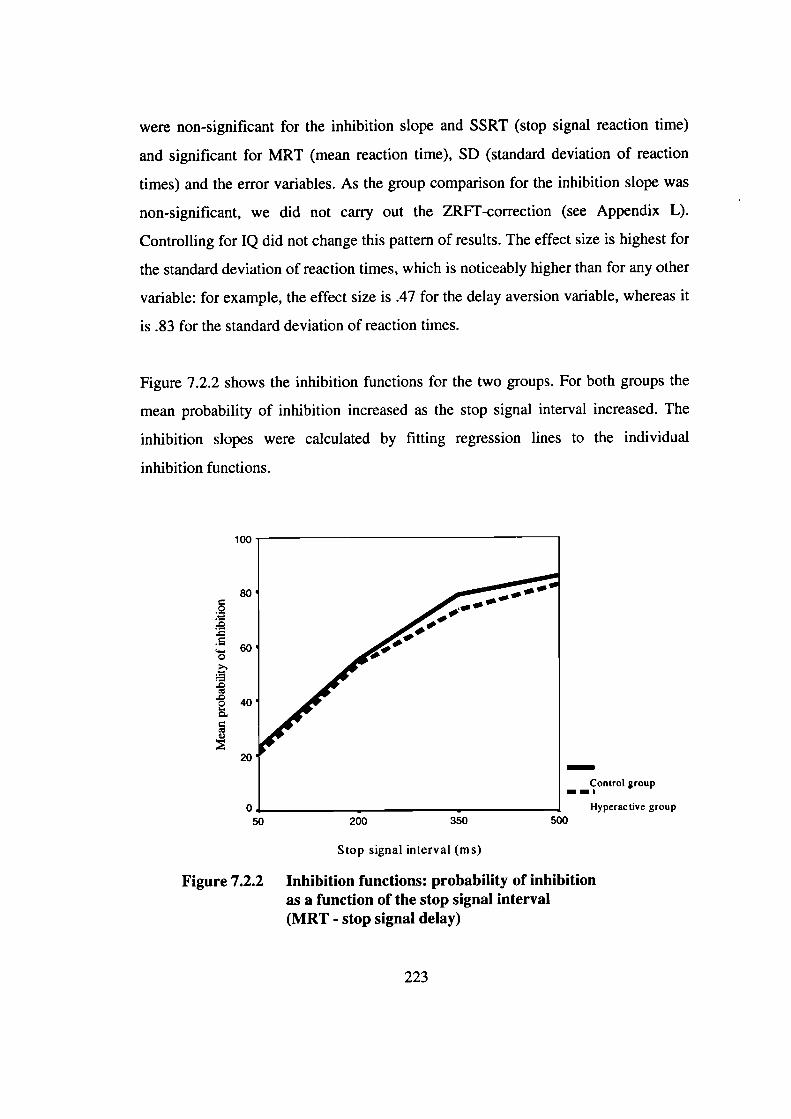
100
80
0
60
2 °
20
were non-significant for the inhibition slope and SSRT (stop signal reaction time)
and significant for MRT (mean reaction time), SD (standard deviation of reaction
times) and the error variables. As the group comparison for the inhibition slope was
non-significant, we did not cany out the ZRFT-correction (see Appendix L).
Controlling for IQ did not change this pattern of results. The effect size is highest for
the standard deviation of reaction times, which is noticeably higher than for any other
variable: for example, the effect size is .47 for the delay aversion variable, whereas it
is .83 for the standard deviation of reaction times.
Figure 7.2.2 shows the inhibition functions for the two groups. For both groups the
mean probability of inhibition increased as the stop signal interval increased. The
inhibition slopes were calculated by fitting regression lines to the individual
inhibition functions.
-Control group
- _,
Hyperactive group
50
200 350 500
Stop signal interval (ms)
Figure 7.2.2 Inhibition functions: probability of inhibitionas a function of the stop signal interval(MRT - stop signal delay)
223
Table 7.2.2b shows the results when the children who had a total error rate of 10%
or higher (N=19) were excluded from the analyses. In general, the results are
rather similar to those for the total sample. However, after controlling for IQ, the
group comparison for the mean reaction time is no longer significant. The effect
sizes are also lower than for those for the total sample.
The results were also analysed with conduct problems and anxiety as covariates.
Controlling for anxiety did not alter the pattern of findings. With conduct problems
as a covariate, the group comparison for mean reaction time is no longer
significant. When the children with high error rates are excluded, the group
comparison for the standard deviation of reaction times is, in addition, no longer
significant.
These analyses suggest that excluding children with high error rates does not have
a marked effect on the results. We therefore decided not to exclude this subgroup
of children from further analyses on the stop task data.
224
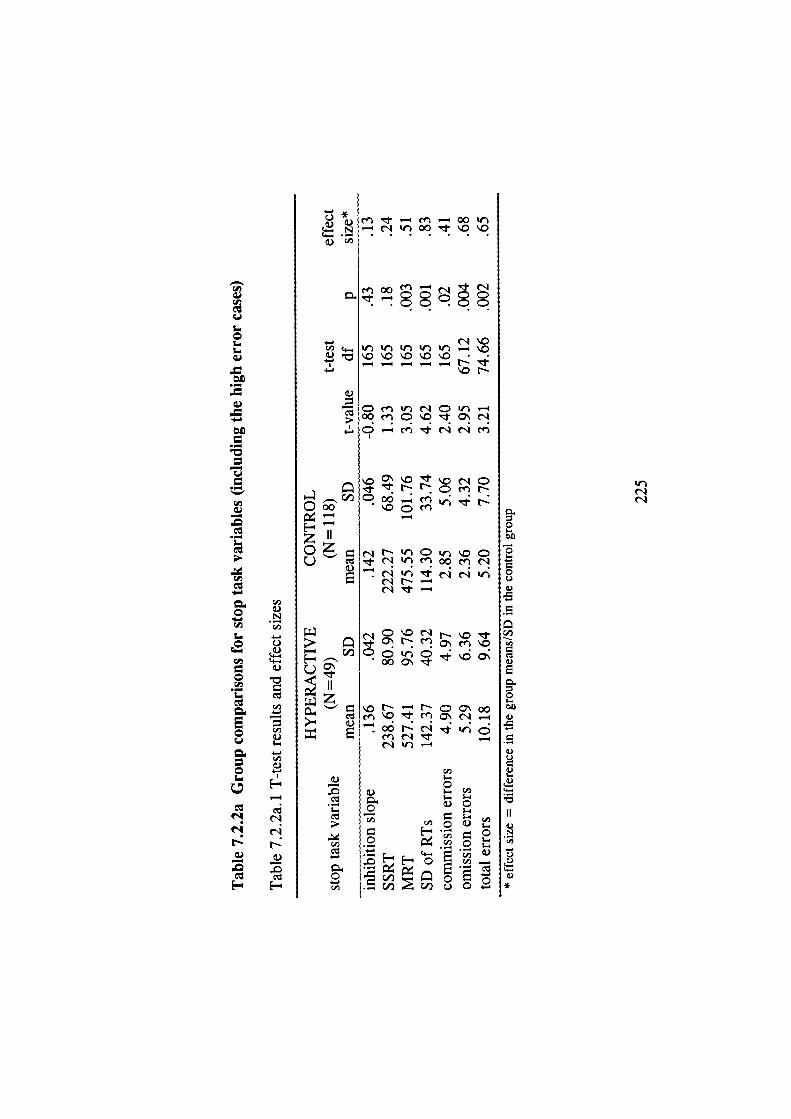
.-
-
.-
rI
.-
E0
0
N
—
VN
Cd,
Cd,V
Cd,V
NNNV
-400• '— N 'I 00 1- o
rN
'.r it it-i I(i .— .OI — l — — — N
.0N
V
00qo.N
N N
—4
ZI'0 N N C ir '.0 CU 0fl•N
N '( N N
. N0
z'. N - N C O oon '.0 Cfl C' N —
Cd,
VV
;_ I_
Cl,
(l,V
0(I, C/D r;i u 0
NN
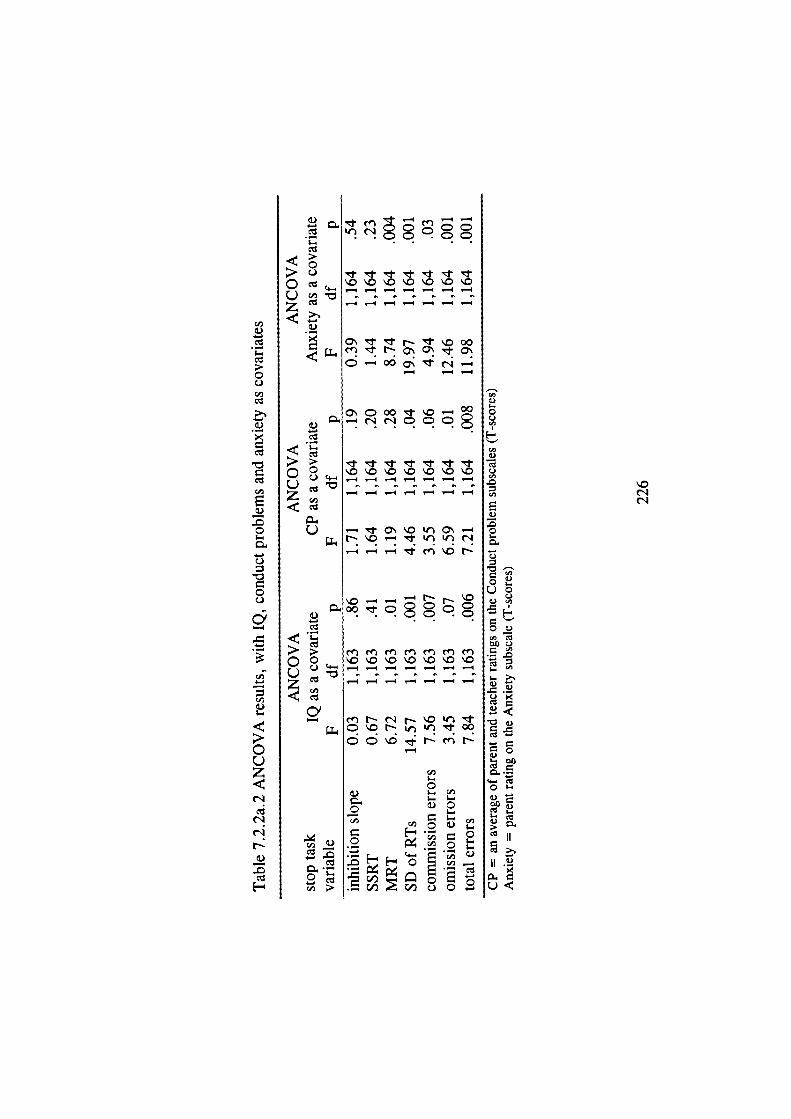
4-.0C)
C)
(4,
0I-
ou4-(Jo
o)44,
C.)
. .0
4-I-
U
0•
U
U°
0.
0 4-
4-. 4-
0.
II
ii .9
'.0
0C-)
I)
Cd,
E
0
C)
0C-)
0'
Cd,
Cd,
I..
C0z
— .-4 —
<IC-)
C c '0 '.0 "0"0 '.0 'O '.0
0Z C — .—.4 — ,.-4 ,-4 — —
IN'.0OO
— .— —
cu
'.0 '.0 0 '.0 '.0 '.0
'— — — — — —
0 O'.O0\
cn cn en en en en e0 0 "0'.O'.O'.O'.O\O'.O
0Z C — — — — 4 —
Cd)
—NOO
c\0r-cnN
Cd)
01-4 C',
0 0
—Cd)0
Cd)
Cd) —
c - C-I) I—i 0 1-.
C-I) C)
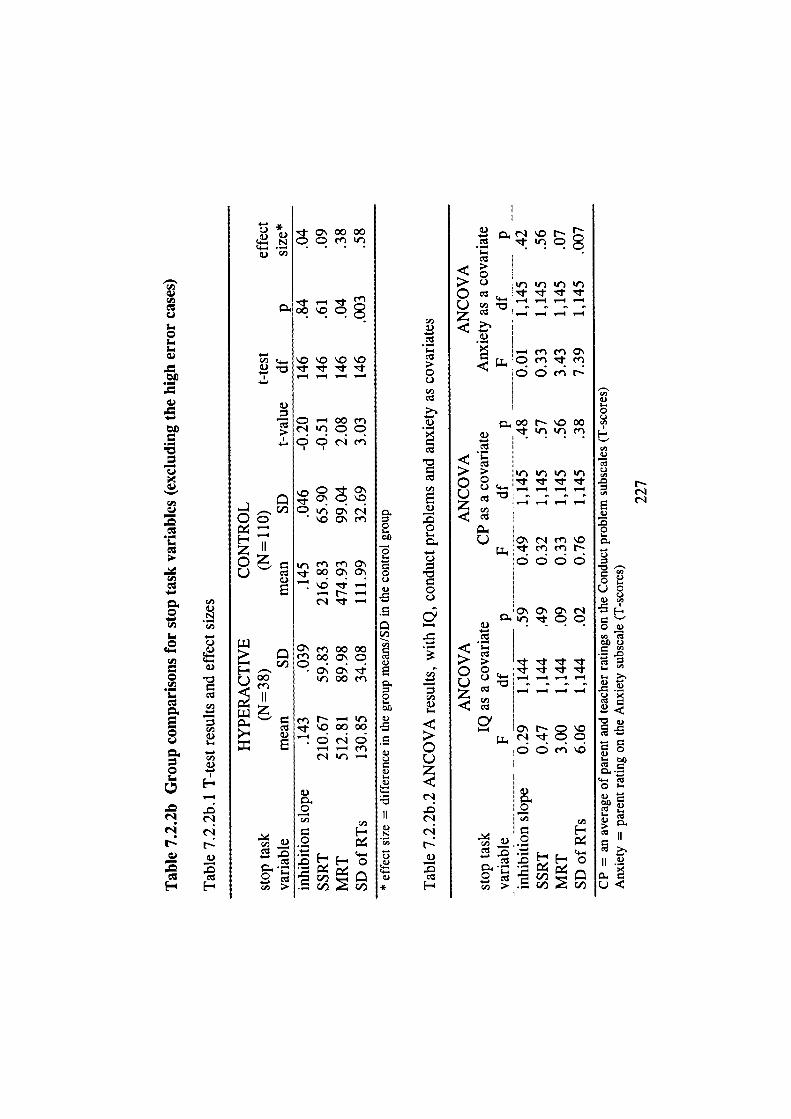
L.i
.-
-
.-
E
01-I
NNN—
N
C',
I-
C',
1.N
C',
I-
0C)C',
V
C',
EV
0
C)
0C)
C',
C',VI-
00z(1
NV
CO
F-
tr00000
-o.'o'o'o
I — — '
1c
\OC\rfl
ZI'
E
1J
—
ooc
.o'o
Uoo
I'QOfl
0000
0
C',
c1
:il
<I> C)0 CO • • •0z CO — — — —
cn OI
C fl N
00NC0OVCO
0 — — —_, -. _4 — .-C',
0 jO\r'lcn\O
C C C
o\ 0 C c'IVCO
k!j. ' J.. .1
0 0 -0
CO J ._ — —<CO
, 0'NC.Or1CC
C C en
0
H'F-
CO - _
I-0C.)Cl,
'I,
C',- NC',
E0.).00I-
00.)I-000.)",
00)
00 C)
I-CL >.
0)
I- 000
C- CO
0)00CO1..
CO
II
0<
Time-on-task
To investigate whether the speed of responding on the task remains stable over time
in each group, a repeated measures ANOVA was carried out, with group as the
between-subjects variable (see Table 7.2. 2c). Mean reaction time was calculated
across the first half (blocks 1 and 2) and the second half (blocks 3 and 4). The
results show that both groups were faster during the second half of the task (a
practice effect) and that children in the hyperactive group were generally slower
than the control children. The group by time-on-task interaction was not significant,
however.
Table 7.2.2c also reports the results from a similar analysis for the standard
deviation of reaction times. Only the main effect for group was significant,
indicating that the hyperactive children were more variable in the speed of
responding than control children, but there was no change for either group in the
variability of speed over time.
Speed accuracy trade-off
Is there evidence of speed accuracy trade-off? The correlation between mean
reaction time and total number of errors was .24. Considering the two types of
errors separately, it is clear that there is a relationship between MRT and omission
errors (r= .44), but not between MRT and commission errors (r= -.04). As the
correlation between MRT and omission errors is positive, it shows an association
between slow speed and a high number of omission errors. Therefore there was no
evidence of speed accuracy trade-off.
228
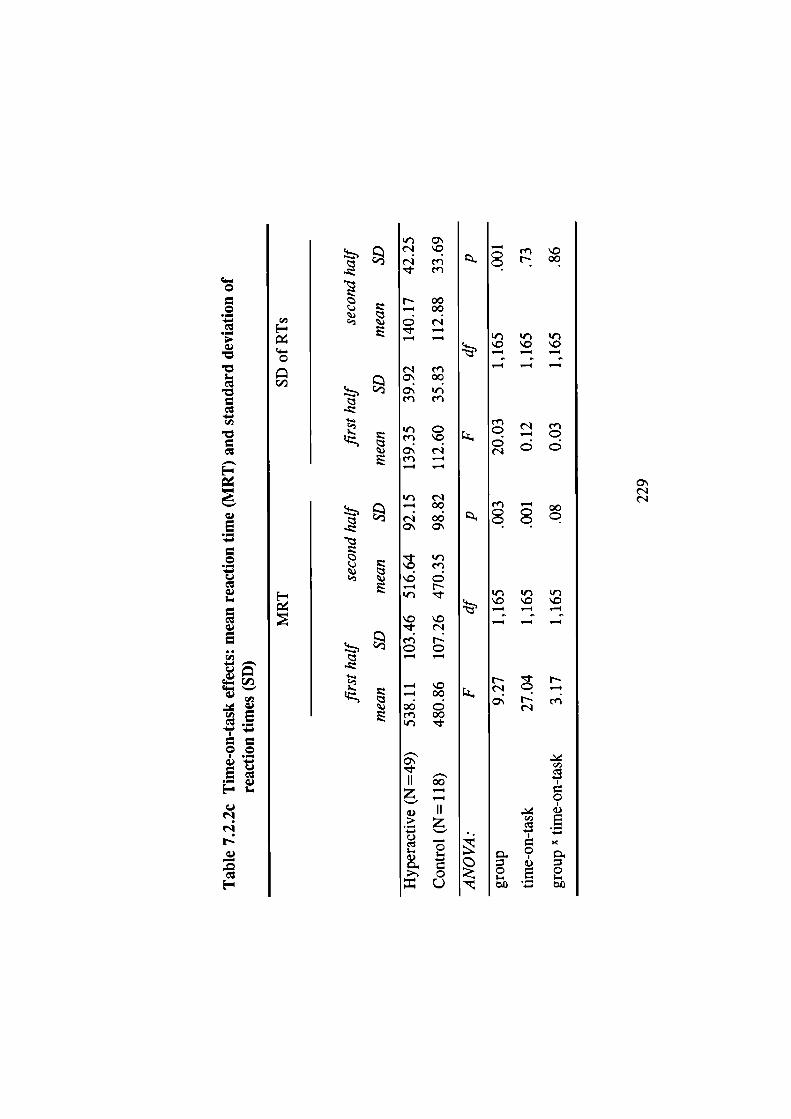
C,,
Cs-
0
c/-i
.
-Q.-
NNN-
c_-i
E
I;
'r) O\
N en- en
N 00-4 00
.-4 -
ri eno'.00a "en en
ir CenoC Nen --4
N— 00
N 000 O
. ',\0 en
-4 N
en NC C
-4
- 0— 0000Cen 00
', .
1100-V
V
>- 0L)
enoCN.00
(I Il 'r0 0 0
-4 _4 -4
en N en
CC
Nen - 00
N
'r)0 \C 0
_4 -4 -4
NNNLCe
9. VC,,
V0 0;-
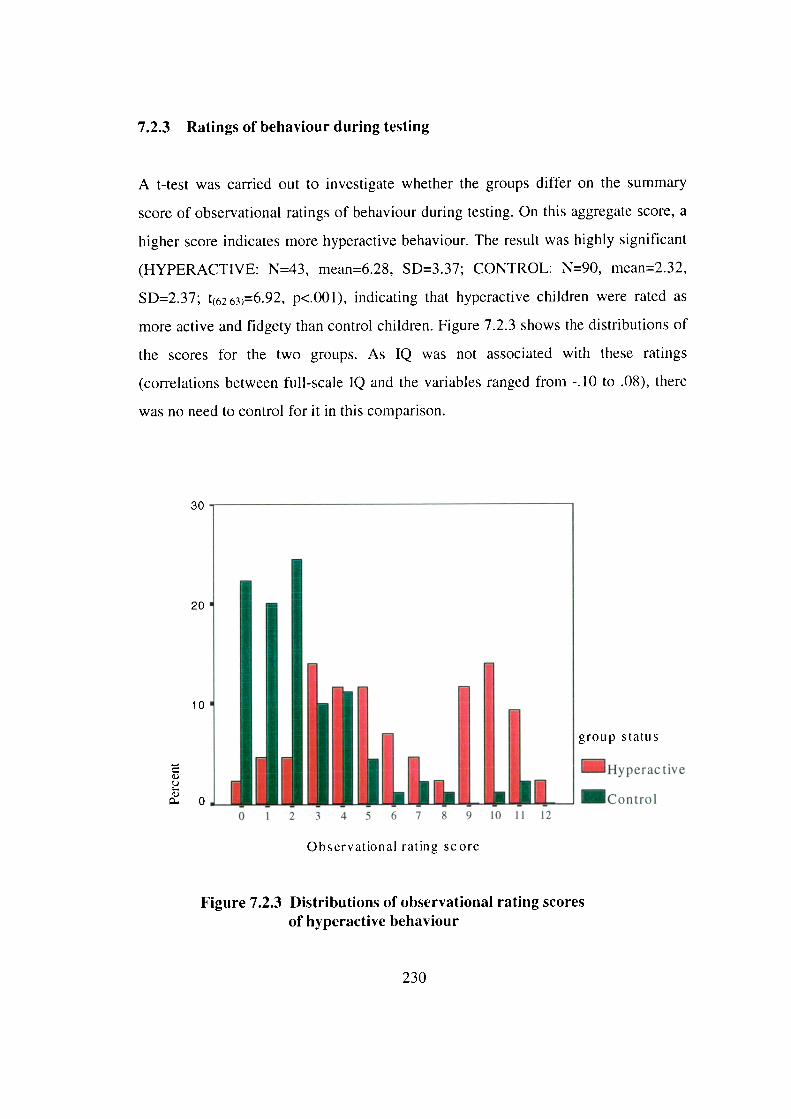
7.2.4 Sex effects
Do girls and boys differ in their performance on the various tasks? Separate
ANOVAs for each of the task variables were carried out to investigate this issue.
The results (see Table 7.2.4) show that there were no significant main effects for
sex or sex X group interactions.
7.2.5 Discriminant function analysis
To obtain scores which maximally discriminate between the hyperactive and
control groups, a discriminant function analysis was carried out. The situationally
hyperactive children were excluded from this analysis, as were children who had
missing data on any of the variables which were entered into the analysis. The
sample therefore consists of 49 hyperactive children and 115 control children.
However, the situationally hyperactive children received a discriminant function
score and were included in the genetic analyses reported in later sections of this
chapter. The variables included in the discriminant function analysis were all the
main task variables and performance and verbal IQs.
Table 7.2.5 shows two sets of coefficients from the discriminant function analysis:
linear classification functions (the actual weights used to create the discriminant
scores) and linear discriminant functions. The latter give the relative magnitude of
the contributions to the discriminant score, that is they take into account scaling
differences between the measures. The standard deviation of reaction times on the
stop task comes out again as the strongest variable, with a linear discriminant
function (LDF) score of .81. Other variables with LDF scores of +1- .5 or higher
are omission errors, sentence span, delay aversion, mean reaction time and verbal
IQ.
231
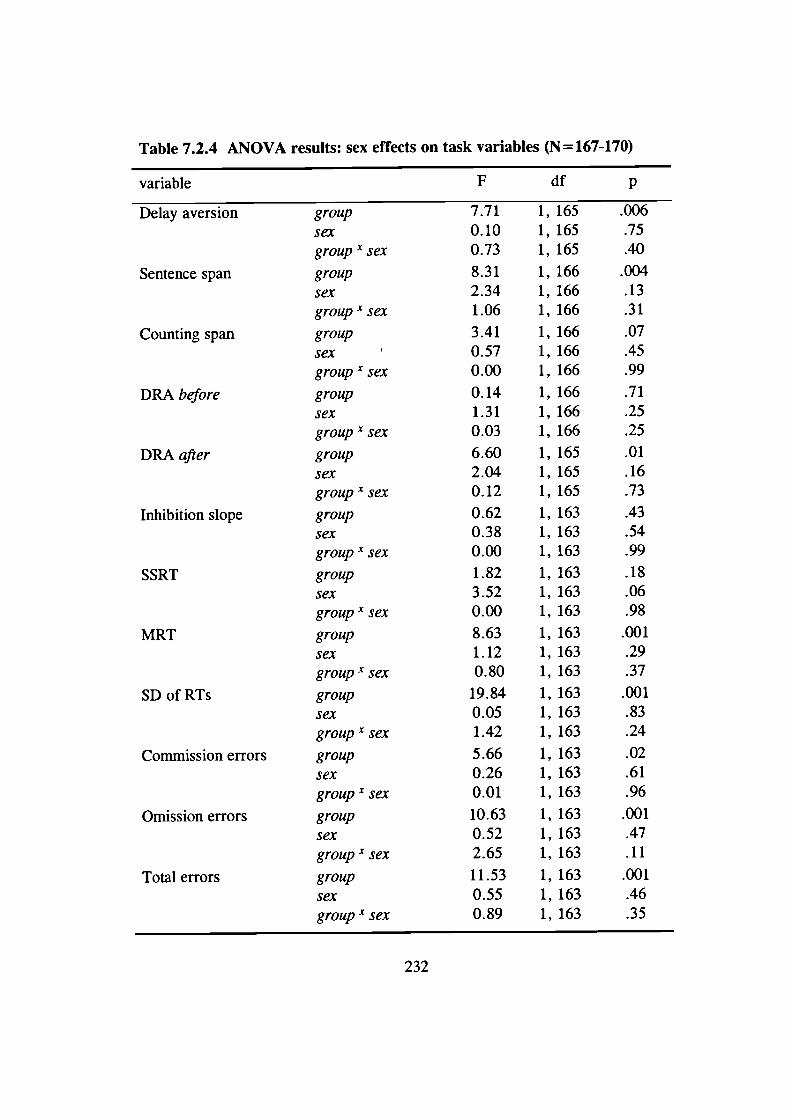
Table 7.2.4 ANOVA results: sex effects on task variables (N= 167-170)
variable F df p
Delay aversion group 7.71 1, 165 .006
sex 0.10 1, 165 .75
group-c sex 0.73 1, 165 .40
Sentence span group 8.31 1, 166 .004
sex 2.34 1, 166 .13group x sex 1.06 1, 166 .31
Counting span group 3.41 1, 166 .07
sex 0.57 1, 166 .45group x sex 0.00 1, 166 .99
DRA before group 0.14 1, 166 .71
sex 1.31 1, 166 .25
group X sex 0.03 1, 166 .25
DRA after group 6.60 1, 165 .01sex 2.04 1, 165 .16group- sex 0.12 1, 165 .73
Inhibition slope group 0.62 1, 163 .43
sex 0.38 1, 163 .54group x sex 0.00 1, 163 .99
SSRT group 1.82 1, 163 .18
sex 3.52 1, 163 .06group x sex 0.00 1, 163 .98
MRT group 8.63 1, 163 .001
sex 1.12 1, 163 .29group-v sex 0.80 1, 163 .37
SD of RTs group 19.84 1,163 .001
sex 0.05 1, 163 .83group x sex 1.42 1, 163 .24
Commission errors group 5.66 1, 163 .02
sex 0.26 1, 163 .61group x sex 0.01 1, 163 .96
Omission errors group 10.63 1, 163 .001
sex 0.52 1, 163 .47
group X sex 2.65 1, 163 .11
Total errors group 11.53 1, 163 .001
sex 0.55 1, 163 .46group x sex 0.89 1, 163 .35
232
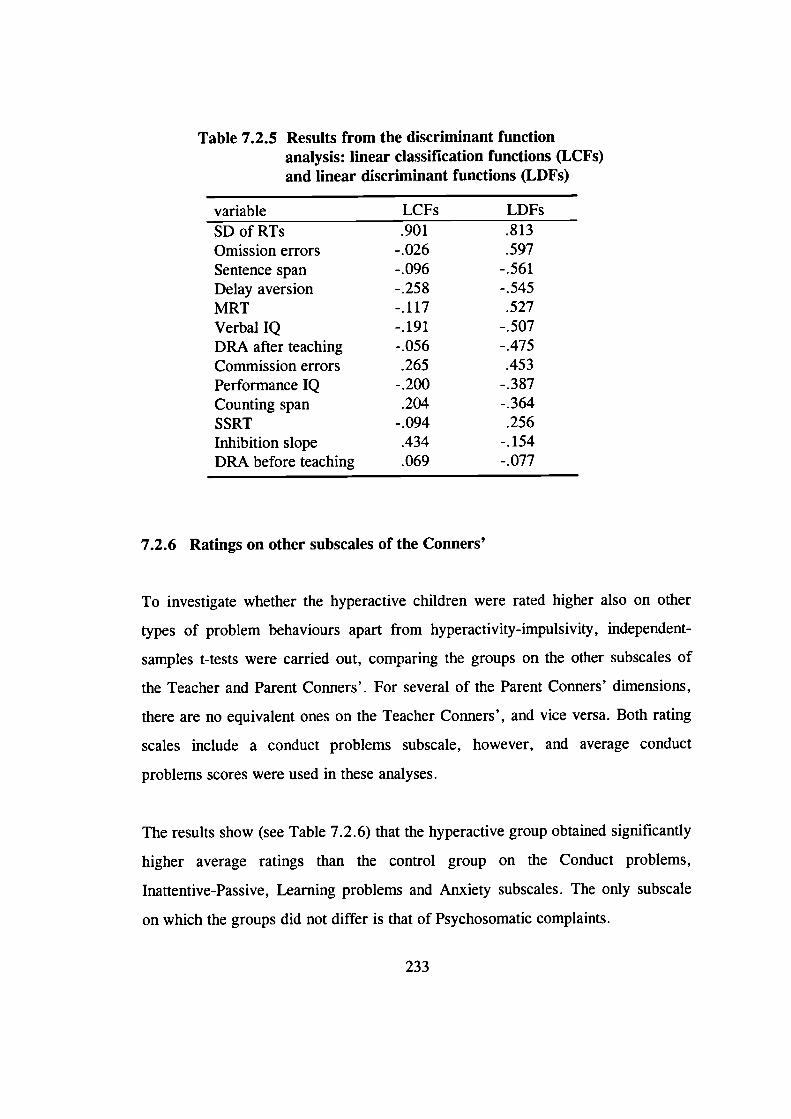
Table 7.2.5 Results from the discriminant functionanalysis: linear classification functions (LCFs)and linear discriminant functions (LDFs)
variable LCFs LDFsSDofRTs .901 .813Omission errors -.026 .597Sentence span -.096 -.56 1Delay aversion -.25 8 -.545MRT -.117 .527Verbal IQ -.191 -.507DRA after teaching - .056 -.475Commission errors .265 .453Performance IQ -.200 -.387Counting span .204 -.364SSRT -.094 .256Inhibition slope .434 -.154DRA before teaching .069 -.077
7.2.6 Ratings on other subscales of the Conners'
To investigate whether the hyperactive children were rated higher also on other
types of problem behaviours apart from hyperactivity-impulsivity, independent-
samples t-tests were carried out, comparing the groups on the other subscales of
the Teacher and Parent Conners'. For several of the Parent Conners' dimensions,
there are no equivalent ones on the Teacher Conners', and vice versa. Both rating
scales include a conduct problems subscale, however, and average conduct
problems scores were used in these analyses.
The results show (see Table 7.2.6) that the hyperactive group obtained significantly
higher average ratings than the control group on the Conduct problems,
Inattentive-Passive, Learning problems and Anxiety subscales. The only subscale
on which the groups did not differ is that of Psychosomatic complaints.
233
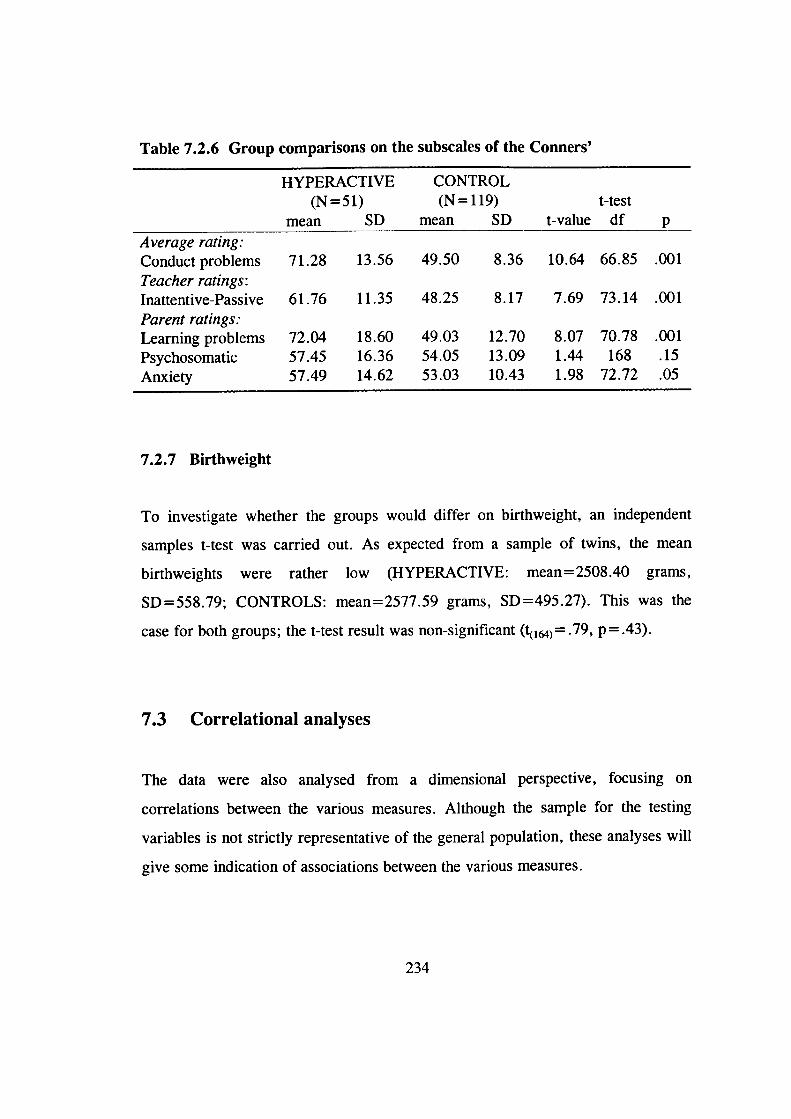
Table 7.2.6 Group comparisons on the subscales of the Conners'
HYPERACTIVE CONTROL(N51) (N119) t-test
mean SD mean SD t-value df pAverage rating:Conduct problems 71.28 13.56 49.50 8.36 10.64 66.85 .001Teacher ratings:Inattentive-Passive 61.76 11.35 48.25 8.17 7.69 73.14 .001Parent ratings:
Learning problems 72.04 18.60 49.03 12.70 8.07 70.78 .001Psychosomatic 57.45 16.36 54.05 13.09 1.44 168 .15Anxiety 57.49 14.62 53.03 10.43 1.98 72.72 .05
7.2.7 Birthweight
To investigate whether the groups would differ on birthweight, an independent
samples t-test was carried out. As expected from a sample of twins, the mean
birthweights were rather low (HYPERACTIVE: mean=2508.40 grams,
SD=558.79; CONTROLS: mean=2577.59 grams, SD=495.27). This was the
case for both groups; the t-test result was non-significant (t( 1M) = .79, p = .43).
7.3 Correlational analyses
The data were also analysed from a dimensional perspective, focusing on
correlations between the various measures. Although the sample for the testing
variables is not strictly representative of the general population, these analyses will
give some indication of associations between the various measures.
234
7.3.1 Correlations between the task variables
Table 7.3.1 shows the correlations between the various task variables. Those
variables which differentiated between the groups (not controlling for IQ - delay
aversion, DRA after teaching, sentence span, and stop task variables SD of RTs,
MRT and total number of errors), correlate moderately with one another (most of
the correlations are around .4). In these analyses the total sample of children was
included; that is, children with situational hyperactivity were not excluded.
7.3.2 Task variables and hyperactivity ratings
Table 7.3.2 presents correlations between the main task variables and the
hyperactivity ratings as continuous dimensions (T-scores on the Hyperactivity
dimension of Teacher Conners', 1-scores on the Impulsive-Hyperactive dimension
of Parent Conners', the average of these two scores and the summary score of the
testers' ratings on the four observational rating scales). These correlations were
calculated both as ordinary bivariate correlations and as partial correlations,
controlling for full-scale IQ and conduct problems. Children with situational
hyperactivity were included in these analyses.
235
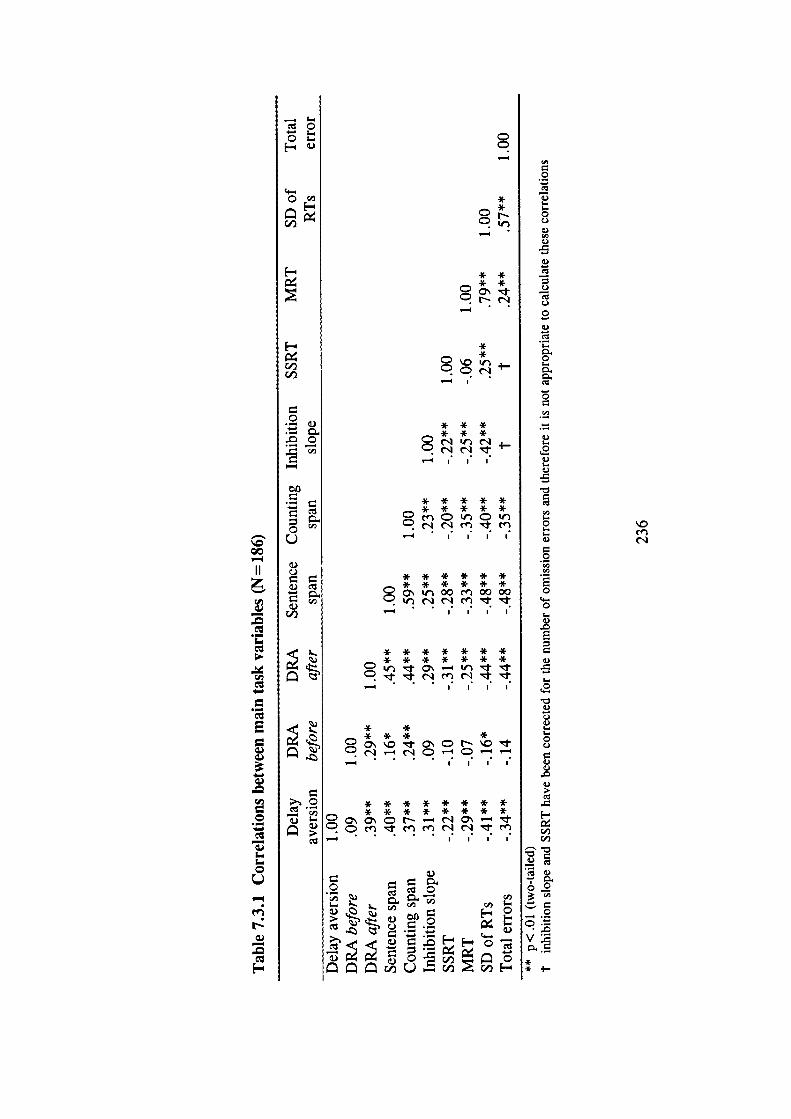
oc#
F-
F-
('1(ID
0
0U
(ID
0.$ .
:J ;-
00—4
.-
E
I
0
I-
0C.)
C.)
.5
C.)
C.)
0C.)
I-
0I-
0
C.)I-
C.)I-.C.)
.5
0I..I-C.)
0
0
4-.0
C.)
.5I-.
0.)C.)C.)I-.I-0C.)C.)
C.)
C,,
C.)
0
V .-
** •1-
-
—-. ;_
**Cs
* ** *Cct.sri
**
* * ** * *
* * * * ** * * * *CnClrCIt
I I
* * * * * *
* * * * * *C 0 00 Cfl 0000
I I I I
* * * * * * *
* * * * * * *
— . . . I I I
* *
* * * *
— •
* * * * * * * *
C* * • * * * * *
C..,
F- 0— 0 0
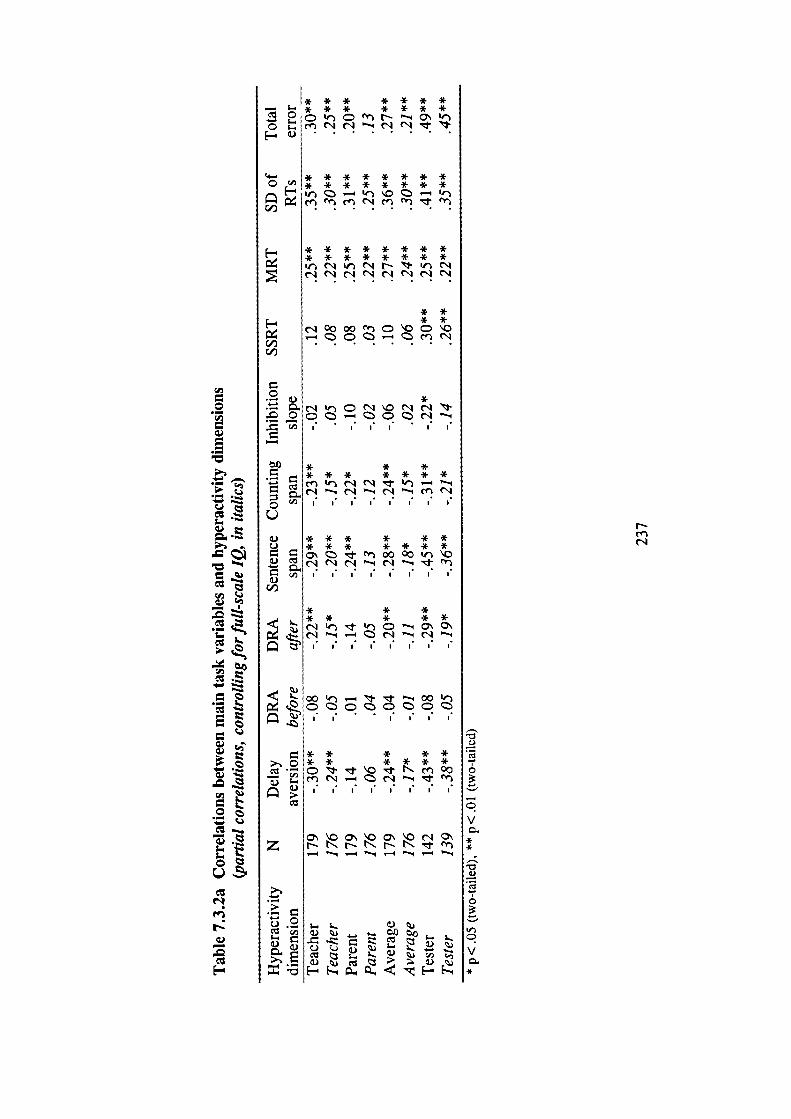
* ** *
0L)
a)C.)
a.)
a.)
C.
a)
z
L* * * * * ** * * * * * *Q er — Q\
o - n (N r -i C'1 (N 'l 1-
CI- * * * * * * * *0 ",* * * * * * * *
ee
* * * * * * * ** * * * * * * *NN(N
C,,
.
. •C.)l-e
.
.-e
— I
. '*__I
C':'..
C': .
a.) -a.)
a.)
—a.),.
C':
Na.)
C':
*(N 0 (N c'1 -
0 .- CI I I• I•
* * ** * * * * * *
I I
* * * * * *
* * * * * * *en 00 00
I I I I• I I I I
* * ** * * * *
I I• I I
I I• I I
* * * * ** * * * * *CON.en0O
I I• I
CO'\Oc'IO\bbNrfl— _l — 4 'l —
ra) -o.
5-. 5-.
C) _L ) C
a.)
enC."
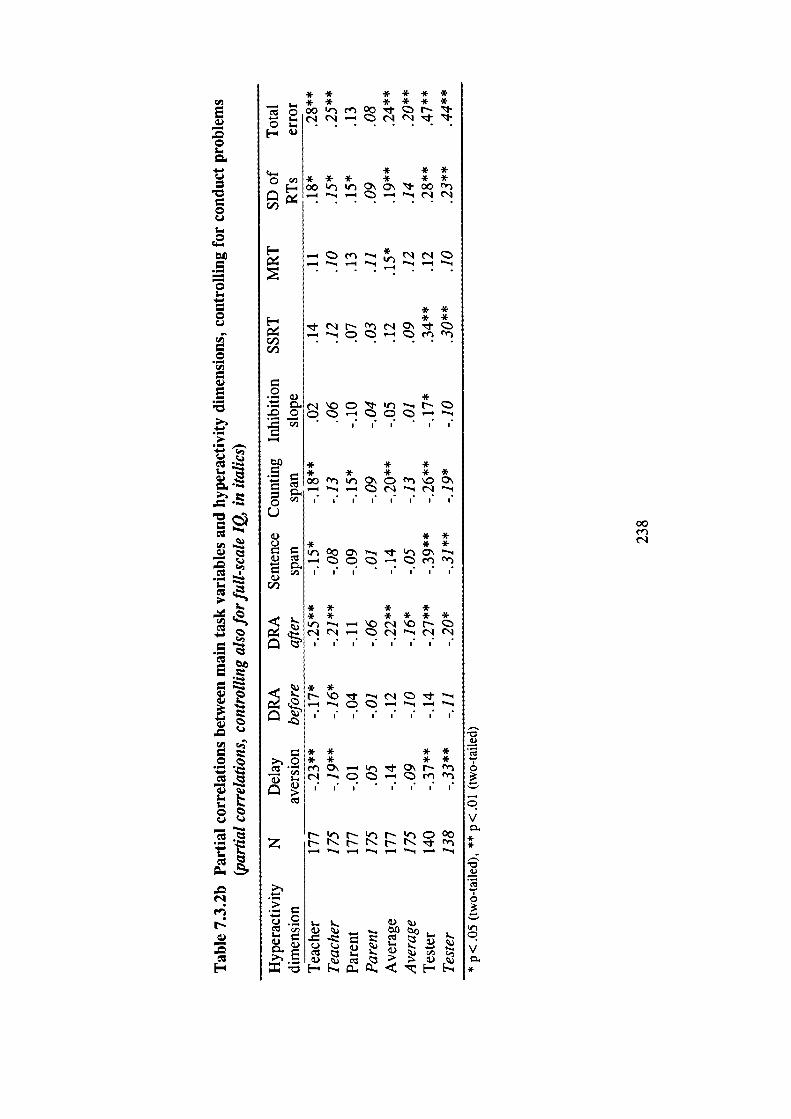
0C.)
0. .
)
z
E—
0
0
0
0
•0
.-
.- .-'
0.1
— c.e
I-
.-
-
.0
N
—.0
* * * * * *
* * * * *o 00 en 00 N
* * ** * * * *
00 0\ 00
I..
* *F- * *
C,)C,)
0*
.0
* * ** * * * *00O\C00\
I I• I I• I
* *
* * *
* * * *
* * * * * *
I I• I l• I I•
* *
— — .— _•4
* * * *
* * * *
en0-0\Nen
I I• I I I• I
en— '-4 M
_ 0 _- VL..
00en
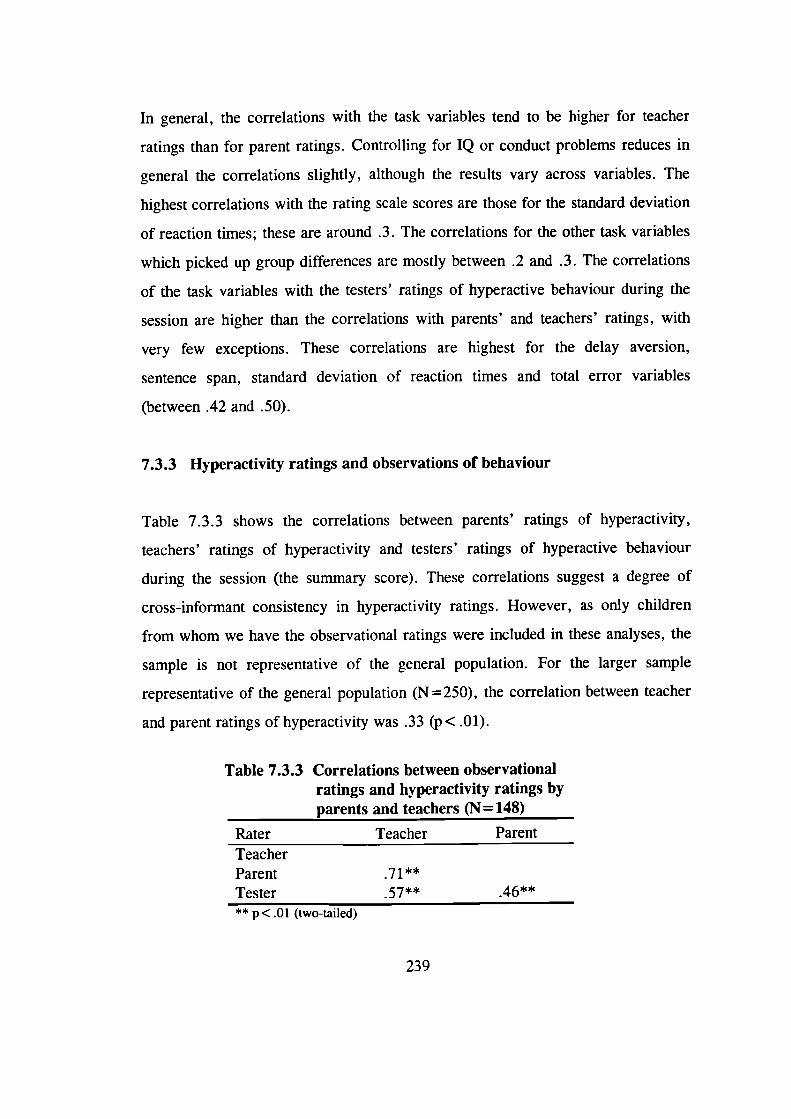
In general, the correlations with the task variables tend to be higher for teacher
ratings than for parent ratings. Controlling for IQ or conduct problems reduces in
general the correlations slightly, although the results vary across variables. The
highest correlations with the rating scale scores are those for the standard deviation
of reaction times; these are around .3. The correlations for the other task variables
which picked up group differences are mostly between .2 and .3. The correlations
of the task variables with the testers' ratings of hyperactive behaviour during the
session are higher than the correlations with parents' and teachers' ratings, with
very few exceptions. These correlations are highest for the delay aversion,
sentence span, standard deviation of reaction times and total error variables
(between .42 and .50).
7.3.3 Hyperactivity ratings and observations of behaviour
Table 7.3.3 shows the correlations between parents' ratings of hyperactivity,
teachers' ratings of hyperactivity and testers' ratings of hyperactive behaviour
during the session (the summary score). These correlations suggest a degree of
cross-informant consistency in hyperactivity ratings. However, as only children
from whom we have the observational ratings were included in these analyses, the
sample is not representative of the general population. For the larger sample
representative of the general population (N = 250), the correlation between teacher
and parent ratings of hyperactivity was .33 ( p < .01).
Table 7.3.3 Correlations between observationalratings and hyperactivity ratings byparents and teachers (N= 148)
Rater Teacher ParentTeacherParentTester 57**
** p< .01 (two-tailed)
239
7.4 Introduction to model fitting analyses
To obtain estimates of the importance of genetic, shared environmental and non-
shared environmental effects on the behavioural ratings and performance on each
of the tests, univariate ACE models were fitted to each of these variables. The
structural equation programme EQS (Bentler, 1995) was used to analyse the data.
The rating scale data is based on a subsample of those cases from whom we
obtained ratings from both teachers and parents (and therefore obtained zygosity
information). Because the total sample from whom we obtained this information
has an excess of hyperactive children, a sample representative of the general
population was created for these analyses. Section 6.5.2 described how we chose
this sample.
For these analyses, we followed the standard procedure of first fitting the full ACE
model and then dropping the A and C terms individually, to investigate whether
this would significantly worsen the fit of the model. Following the rule of
parsimony, the model with the fewest parameters, which did not significantly
worsen the fit, was chosen as the best-fitting model. If the full ACE model did not
converge, the model with the smallest (or largest negative) AIC value was chosen
as the one providing the best fit for the data. (If a model does not converge in
EQS, this indicates that a parameter is zero or negative.) As in some cases the data
suggested that a contrast effect model might be needed (very low DZ twin
correlations and differences in variances between MZ and DZ twins), this
possibility was also tested for each of the rating scale dimensions. The ADE
models were also fitted to the data, to enable a comparison between the contrast
effect model and a model which includes genetic non-additivity.
240
In some cases, using the standard EQS approach, the fit of even the best-fitting
model was poor (CFI-value less than .9). When this happened it was because the
DZ variances were larger than the MZ variances. We therefore altered the EQS
syntax file to analyse correlations rather than covariances (which is the standard
approach). This greatly improved the fit in each case. The results were analysed
using this approach for the following dimensions: average hyperactivity ratings,
parent ratings on Hyperactivity, Learning problems, Psychosomatic and Anxiety.
Due to the relatively small sample size, the rating scale data were not analysed
using the four-group sex limitation model approach. This approach would enable
investigation of sex effects, as two models are compared: a model where the paths
for girls and boys are constrained to be equal and a model where no constraints are
imposed. Section 7.8 reports the results separately for girls and boys for the
average hyperactivity ratings using the DF extreme groups approach.
The results for the testing data are presented only for the hyperactive group (with
the exception of IQ data - see below). Given that the prediction is that the
etiologies for performance on these tasks may be different for hyperactive children
and control children, obtaining estimates for data pooled together from the two
groups might be inappropriate (DeFries, personal communication, January 1998).
Such analyses for the control group would be difficult to interpret; lack of variance
in scores would complicate the issue further. The control group was a 'super-
normal' group rather than a representative group, in the sense that both twins
scored below the hyperactivity cut-off points.
For the hyperactive group the ACE analyses on the testing data estimate the extent
to which genetic, shared environmental and non-shared environmental factors
contribute to individual differences on performance on the tasks for pairs in which
at least one twin is pervasively hyperactive. These analyses relate to the group
241
heritability analyses presented in section 7.9. If there are genetic influences on
performance on a particular task within the hyperactive group, it is possible that
these genetic effects are shared genetic effects with those on hyperactivity ratings.
This issue of shared genetic effects is explored using bivariate group heritability
analyses. It was not possible to investigate genetic effects on an 'extreme group' on
each of the task variables (that is, a group of children who performed particularly
poorly on a task) using the DF extremes analysis. The reason for this is how the
sample was selected: we selected children based on their scores on the
hyperactivity ratings rather than based on their scores on the tasks. Model fitting
provides an alternative approach to the investigation of genetic effects on
performance on the tasks within the hyperactive group. It is only a first step,
however, and the group heritability analyses presented in section 7.9 answer the
main research questions more directly.
Analysing the results for the hyperactive group only resulted in a rather small
number of MZ and DZ pairs for each of these analyses, which calls for caution in
interpreting the results (particularly in the case of the C terms). We therefore
decided only to report the full ACE model (as the most conservative option) and
the ADE model, if they converged. The reason for reporting the ADE model, if it
converged, is that it could provide a better fit for the data, if the effect of the C
term is very small. If the full ACE model did not converge, the same procedure
was followed as for the rating scale data: the results are reported for the AE, CE
and ADE models (if these converged) and the model with the smallest (or largest
negative) AIC value was chosen as the best-fitting model. If the ADE model
converged, the change in chi-square from the ADE model to the AE model was
also calculated, but due to the small sample size the significance of this comparison
has to also be interpreted with caution.
242
As the task variables correlate with age (see Table 7.1 .4c), all these analyses were
also rerun using age-adjusted scores (age regressed out), to explore what effect this
would have on the results. The fit of the models was in most cases worse than that
based on the original scores (see Appendix C) and therefore only the results based
on the original scores are reported.
For the IQ data, we inspected the phenotypic correlations for both groups, but
performed the ACE analyses only on data from the control group. See section
7.6.4 for a further discussion.
The estimates in the tables are the squared path coefficients representing the
proportion of variance explained. The phenotypic correlation between MZ and DZ
twins, as well as the standard deviations, are shown below each table. The
numbers of MZ and DZ twins refer to pairs of twins. If results for a model
(commonly the ACE and/or ADE models) are not reported in a table at all, this
means that the model(s) did not converge. For the contrast effect models (AE), the
coefficients were restandardised to equal to 1 (e.g. restandardised a 2 =
a2/(a2+e2)). The contrast effect coefficient (B, unsquared) is shown in the table in
the place of the C term. Shaded background indicates a best-fitting model.
Confidence intervals are not reported for the coefficients, as EQS does not provide
standard errors for standardised coefficients. These standard errors would be
needed to calculate the confidence intervals.
7.5 Model fitting analyses on rating scale data
The sample for these analyses consists of 61 MZ pairs and 64 DZ pairs, which is
the reconstituted representative sample.
243
7.5.1 Hyperactivity ratings
Table 7.5.1 shows the results from univariate model fitting for the Hyperactivity
1-scores from Teacher and Parent Conners', as well as for an average
hyperactivity rating score (an average of these two I-scores). The full ACE models
did not converge for any of these variables. The ADE model converged for teacher
ratings on hyperactivity, but the change in the chi-square value from the ADE
model to the AE model was non-significant. This indicates that the AE model
provides a better fit for the data than the ADE model. The fit of the AE model is
also better than the fit of the CE model, judging by the AIC-values. Heritability is
estimated at .57. That is, genetic factors account for approximately 60% of the
variance in hyperactivity based on teacher report.
The low DZ correlations, relative to the MZ correlations, for parent-report and
average hyperactivity scores suggest that contrast effect models might provide a
good fit for the data. For parent ratings of hyperactivity the change in chi-square
from the AE model to the AE model narrowly fails to reach significance,
however, and therefore the AE model has to be chosen as the best-fitting model.
This results in a somewhat lower heritability estimate of .41. The results from
analyses on the average hyperactivity rating, which may be considered as the most
reliable measure of hyperactivity, provide evidence of contrast effects (sibling
interaction and/or rater bias). To obtain an estimate of the proportion of variance
in the average hyperactivity ratings that was due to contrast effects, the three terms
(a2 , e2 and B2) were restandardised to equal 1. Such contrast effects explain 3% of
the variance. With the contribution of the contrast effects removed (a 2 + C2
restandardised to equal 1), genetic factors explain 74% of the variance. For each
hyperactivity variable, the non-shared environment and/or measurement error
account for the remaining variance.
244
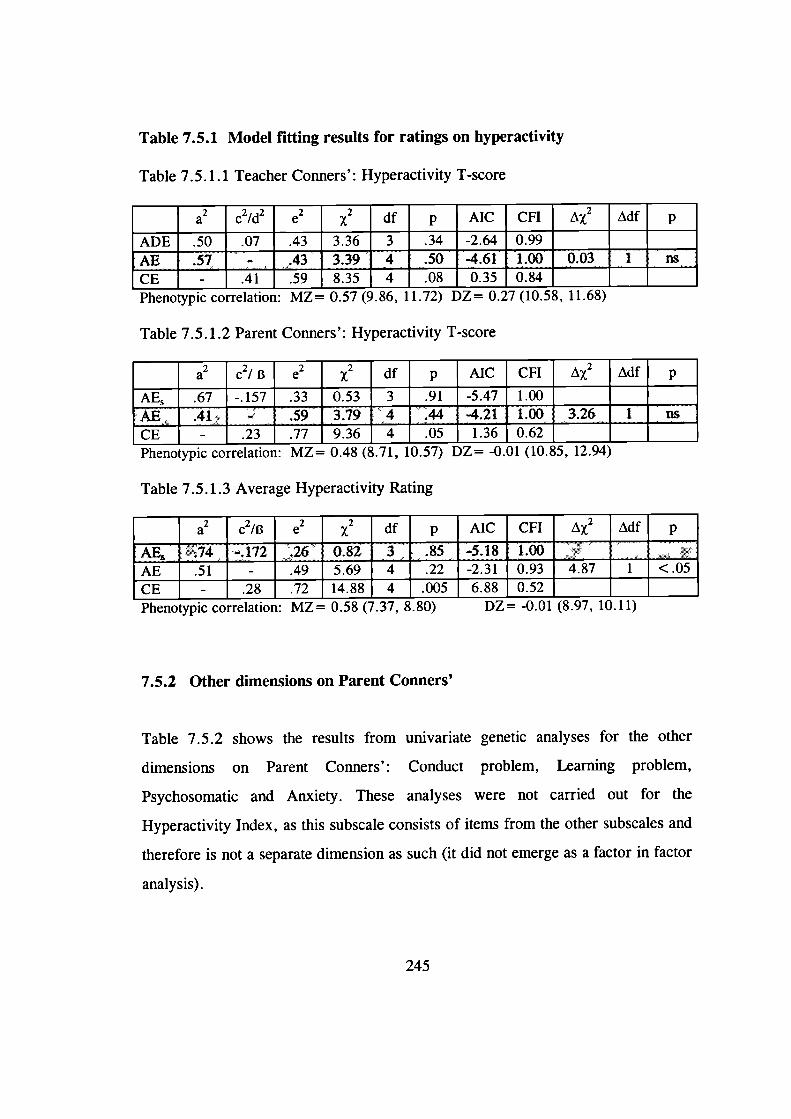
Table 7.5.1 Model fitting results for ratings on hyperactivity
Table 7.5.1.1 Teacher Conners': Hyperactivity T-score
a2 c21d2 e2x2 df p AIC CFI AX2
ADE.50 .07 .43 3.36 3 .34 -2.64 0.99 ______ _____AE 57 - 43 339 4 50 -461 100 003 1 ns
CE- .41 .59 8.35 4 .08 0.35 0.84 ______ _____Phenotypic correlation: MZ= 0.57 (9.b, 11.12) I)L= 0.2/ (1U.5, 11.Dö)
Table 7.5.1.2 Parent Conners': Hyperactivity T-score
a2 c21 B e2 x2 df p AIC CFI A2
AE .67 -.157 .33 0.53 3 .91 -5.47 1.00 ______ _____AE 41 - 59 379 4 44 -421 100 326 T osCE- .23 .77 9.36 4 .05 1.36 0.62 ______ _____Phenotypic correlation: ML= 0.4 (&71, 10.5/) t)L= -U.Ul (1U.SD, 12.94)
Table 7.5.1.3 Average Hyperactivity Rating
a2c2/B e2x2 df p AIC CFI A2
AE 74 - 172 26 0 82 3 85 -5 18 1 00 -AE .51 - .49 5.69 4 .22 -2.31 0.93 4.87 1 <.05CE - .28 .72 14.88 4 .005 6.88 0.52 ______ _____Phenotypic correlation: MZ= 0.5l (7.37, &0) L)L= -0.01 (5.9/, 10.11)
7.5.2 Other dimensions on Parent Conners'
Table 7.5.2 shows the results from univariate genetic analyses for the other
dimensions on Parent Conners': Conduct problem, Learning problem,
Psychosomatic and Anxiety. These analyses were not carried out for the
Hyperactivity Index, as this subscale consists of items from the other subscales and
therefore is not a separate dimension as such (it did not emerge as a factor in factor
analysis).
245
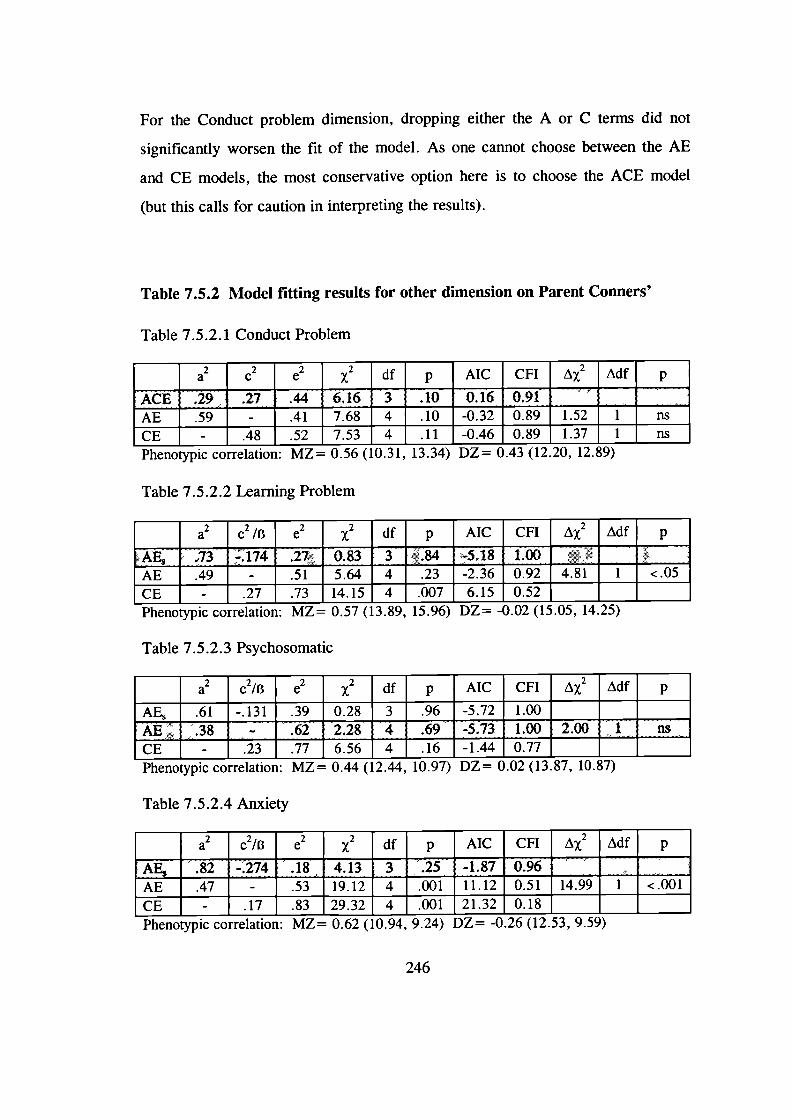
For the Conduct problem dimension, dropping either the A or C terms did not
significantly worsen the fit of the model. As one cannot choose between the AE
and CE models, the most conservative option here is to choose the ACE model
(but this calls for caution in interpreting the results).
Table 7.5.2 Model fitting results for other dimension on Parent Conners'
Table 7.5.2.1 Conduct Problem
a2c2 e2 x2 df p AIC CFI A2
ACE 29 27 44 6 16 3 10 0 16 091 _____ _____AE .59 - .41 7.68 4 .10 -0.32 0.89 1.52 1 nsCE - .48 .52 7.53 4 .11 -0.46 0.89 1.37 i nsPhenotypic correlation: MZ = U.M (IU.31, 13.i4) L)L= U.43 (1Z.ZU, 1z.o)
Table 7.5.2.2 Learning Problem
a2c2 /B e2x2 df p AIC CFI A2
AE 73 * 174 27 0 83 3 84 -5 18 1 00 _____ ______AE .49 - .51 5.64 4 .23 -2.36 0.92 4.81 1 <.05CE -.27 .73 14.15 4 .007 6.15 0.52 _____ ______Phenotypic correlation: MZ = U.31 (13.9, D.9b) L)L = -(J.UZ (ID.UD, iq.z)
Table 7.5.2.3 Psychosomatic
a2c2/B e2x2 df p AIC CFI A 2 Adf p
AE, .61 -.131 .39 0.28 3 .96 -5.72 1.00 _____ ______AE 38 - 62 2 28 'T 69 -5 73 1 00 2 00 F ns
CE- .23 .77 6.56 4 .16 -1.44 0.77 _____ ______Phenotypic correlation: MZ = U.44 (12.44, IU.9/) VL U.UZ (1i.I, 1U.o/)
Table 7.5.2.4 Anxiety
a2c2/B e2x2 df p AIC CFI A 2 AdS p
AE 82 - 274 18 4 13 3 25 -1 87 096 _____ ______AE .47 - .53 19.12 4 .001 11.12 0.51 14.99 1 <.001CE - .17 .83 29.32 4 .001 21.32 0.18 _____ ______Phenotypic correlation: ML = U.2 (10.94, 9.24) L)L = -U.ZO (1Z.D.i, 9.D')
246

For the Psychosomatic subscale the AE model provided the best fit for the data,
with heritability estimated at .38. Parents' ratings on Anxiety and Learning
problems suggest that contrast effects explain part of the variance. The AE models
suggest strong genetic effects for both dimensions (h 2 = . 82 for Anxiety and .73
for Learning problems). Before the contributions of the contrast effects were
removed, they explained 3% of the variance in Learning problems and 7% of the
variance in Anxiety.
7.5.3 Other dimensions on Teacher Conners'
Table 7.5.3 shows the results from model fitting analyses for the Conduct problem
and Inauentive-Passive subscales of the Teacher Conners'. For both dimensions
dropping the C term did not significantly worsen the fit of the model, whereas
dropping the A term resulted in a significantly worse fit. The AE and ADE
models did not converge. Heritability was estimated at .69 for Conduct problems
and at .80 for Anxiety, with the non-shared environment and/or measurement error
accounting for the remaining variance.
247
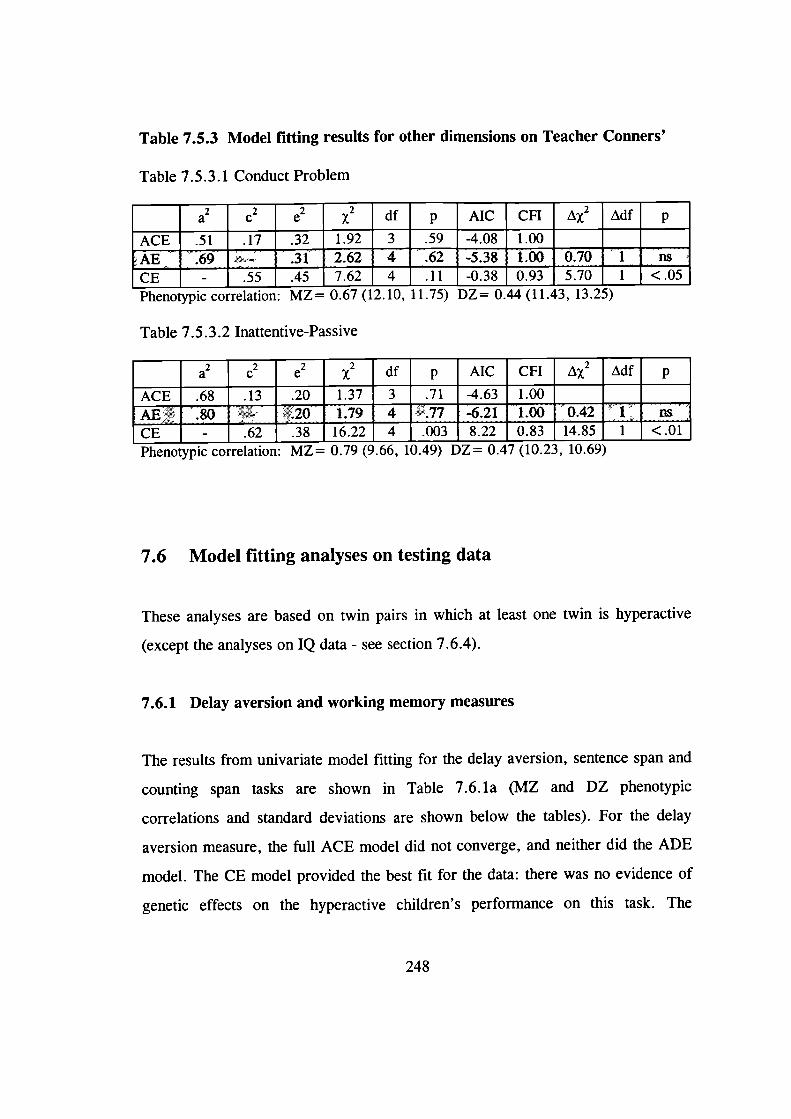
Table 7.5.3 Model fitting results for other dimensions on Teacher Conners'
Table 7.5.3.1 Conduct Problem
a2c2 e2 x2 df p AIC CFI A2
ACE .51 .17 .32 1.92 3 .59 -4.08 1.00 - _____
AE 69 - 31 2 62 4 62 -5 38 1 00 070 i ns
CE - .55 .45 7.62 4 .11 -0.38 0.93 5.70 1 <.05
Phenotypic correlation: MZ 0.bI (12.10, 11. 1i) IJL = 0.44 (11.43, 13.LD)
Table 7.5.3.2 Inattentive-Passive
a2c2 e2 x2 df p AIC CFI A2
ACE .68 .13 .20 1.37 3 .71 -4.63 1.00 _____ _____
AE 80 - 20 1 79 4 77 -621 1 00 042 1 ns
CE - .62 .38 16.22 4 .003 8.22 0.83 14.85 1 <.01
Phenotypic correlation: ML = 0.19 (9.00, 10.49) VL = 0.4/ (IU.Z3, 1U.0)
7.6 Model fitting analyses on testing data
These analyses are based on twin pairs in which at least one twin is hyperactive
(except the analyses on IQ data - see section 7.6.4).
7.6.1 Delay aversion and working memory measures
The results from univariate model fitting for the delay aversion, sentence span and
counting span tasks are shown in Table 7.6. la (MZ and DZ phenotypic
correlations and standard deviations are shown below the tables). For the delay
aversion measure, the full ACE model did not converge, and neither did the ADE
model. The CE model provided the best fit for the data: there was no evidence of
genetic effects on the hyperactive children's performance on this task. The
248
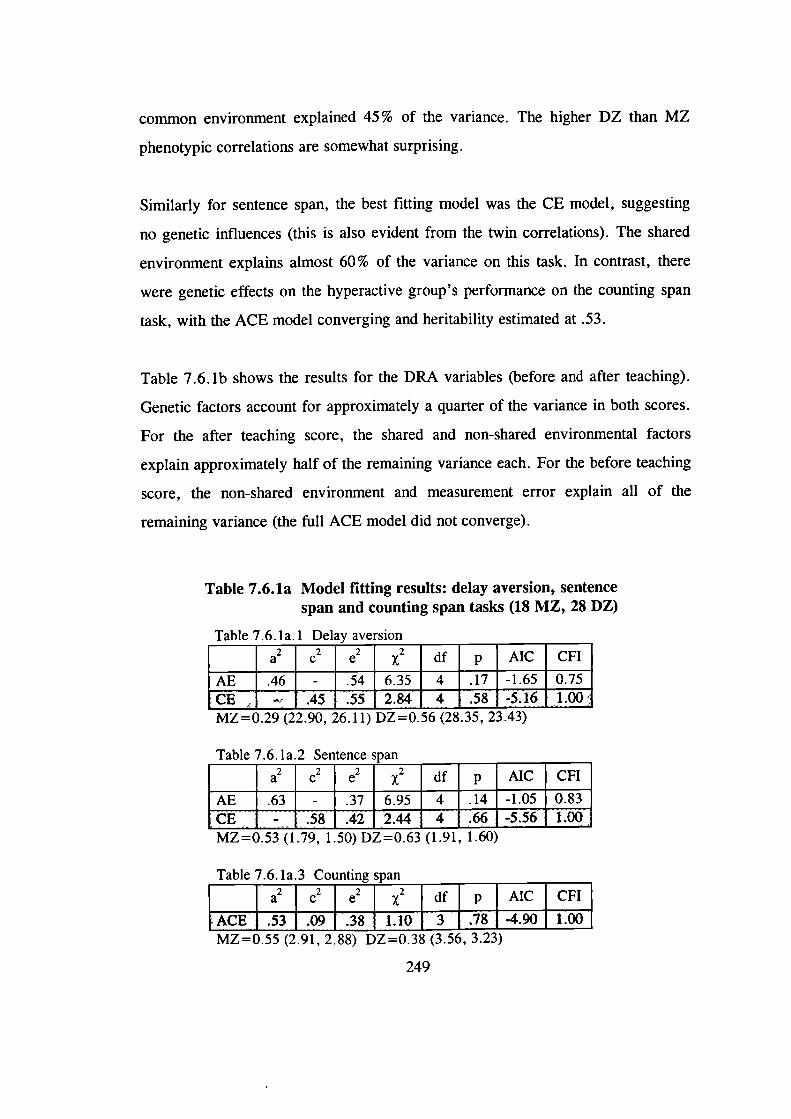
common environment explained 45% of the variance. The higher DZ than MZ
phenotypic correlations are somewhat surprising.
Similarly for sentence span, the best fitting model was the CE model, suggesting
no genetic influences (this is also evident from the twin correlations). The shared
environment explains almost 60% of the variance on this task. In contrast, there
were genetic effects on the hyperactive group's performance on the counting span
task, with the ACE model converging and heritability estimated at .53.
Table 7.6. lb shows the results for the DRA variables (before and after teaching).
Genetic factors account for approximately a quarter of the variance in both scores.
For the after teaching score, the shared and non-shared environmental factors
explain approximately half of the remaining variance each. For the before teaching
score, the non-shared environment and measurement error explain all of the
remaining variance (the full ACE model did not converge).
Table 7.6.la Model fitting results: delay aversion, sentencespan and counting span tasks (18 MZ, 28 DZ)
Table 7.6.la.1 Delay aversion
a2c2 - e2x2 df p AIC CFI
AE .46 - . 54 6.35 4 .17 -1.65 0.75
CE •45 55 2.84 4 .58 -5.16 1.00MZ=0.29 (22.90, 2O.11) DL=0.5b (2&3, L5.43)
Table 7.6. la 2 Sentence span _____ ____
a2c2e2x2 df p AIC CFI
AE .63 - .37 6.95 4 .14 -1.05 0.83CE - .58 .42 2.44 4 -5.56 1.00MZ=0.53 (1.79, 1.50) DZ=0.63 (1.91, 1.60)
Table 7.6. la.3 Counting span
MZ=0.55 (2.91, 2.88) DZ=0.38 (3.56, 3.23)
249
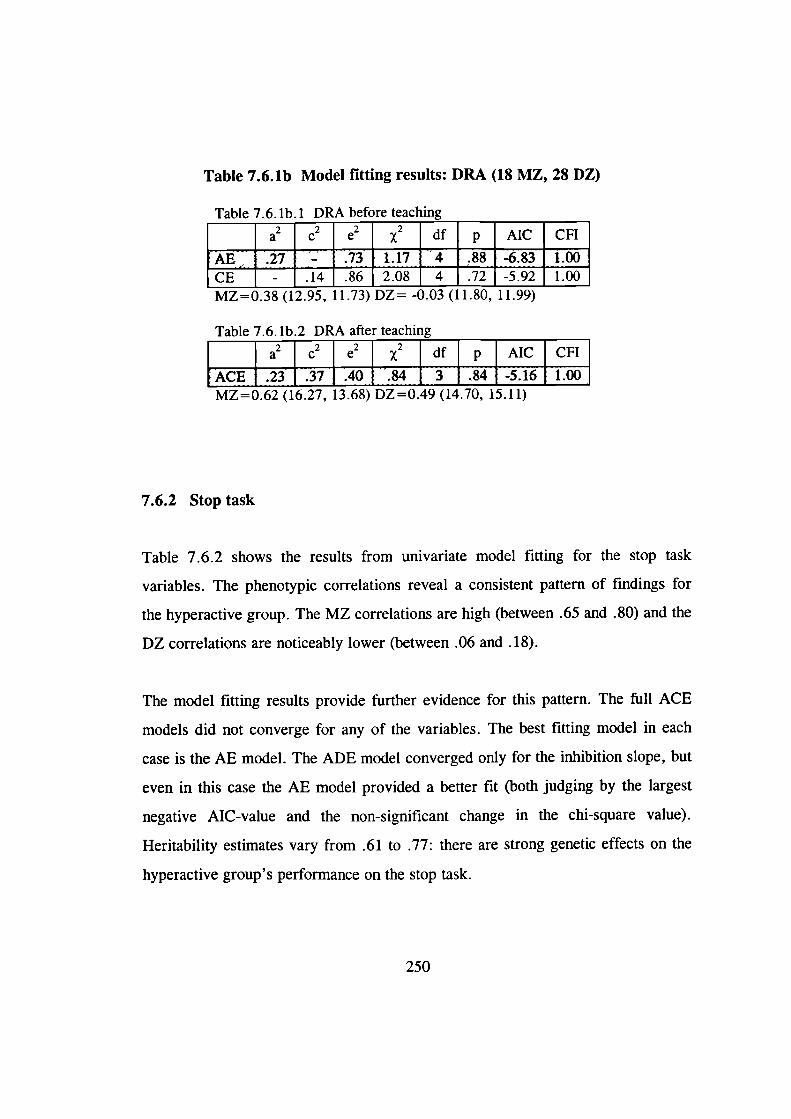
Table 7.6.lb.l DRA before
Table 7.6.lb Model fitting results: DRA (18 MZ, 28 DZ)
MZ=0.38 (12.95, 11.73) DZ= -0.03 (11.80, 11.99)
Table 7.6. lb.2 DRA after teaching
a2c2e2x2 df p AIC CFI
ACE 23 .37 .40 .84 3 .84 -5.16 1.00MZ=0.62 (16.27, 13.68) DZ=0.49 (14.70, 15.11)
7.6.2 Stop task
Table 7.6.2 shows the results from univariate model fitting for the stop task
variables. The phenotypic correlations reveal a consistent pattern of findings for
the hyperactive group. The MZ correlations are high (between .65 and .80) and the
DZ correlations are noticeably lower (between .06 and .18).
The model fitting results provide further evidence for this pattern. The full ACE
models did not converge for any of the variables. The best fitting model in each
case is the AE model. The ADE model converged only for the inhibition slope, but
even in this case the AE model provided a better fit (both judging by the largest
negative AIC-value and the non-significant change in the chi-square value).
Heritability estimates vary from .61 to .77: there are strong genetic effects on the
hyperactive group's performance on the stop task.
250
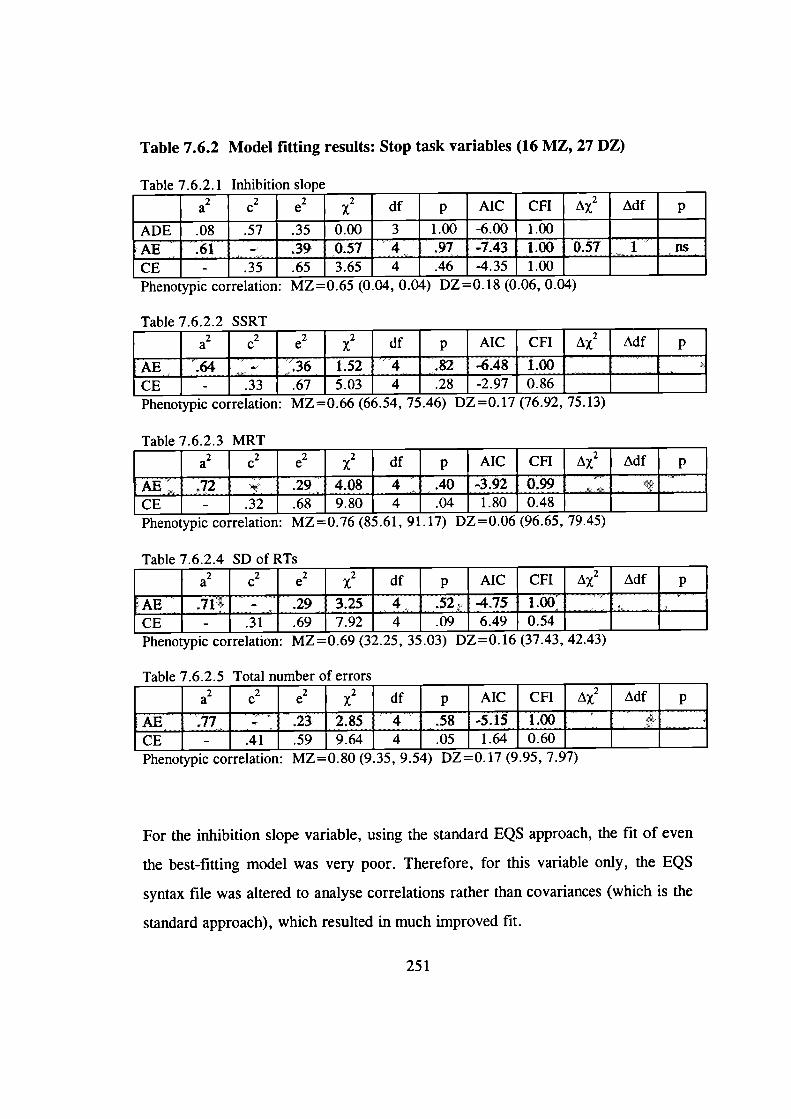
Table 7.6.2 Model fitting results: Stop task variables (16 MZ, 27 DZ)
Table7.6.2.1 Inhibition slope _____ _____ _____ _____ _____ _____ _____ -
a2c2 e2 x2 df p AIC CFI A 2 Adf p
ADE .08 .57 .35 0.00 3 1.00 -6.00 1.00 -
AE 61 - 39 057 4 97 -743 1 00 057 1 nsCE - .35 .65 3.65 4 .46 -4.35 1.00 -Phenotypic correlation: MZ=0.65 (0.04, 0.04) DZ0.18 (0.06, 0.04) -
Table 7622 SSRT
a2c2 e2 x2 df p AIC CFI A 2 Adf p
AE 64 - 36 1 52 4 82 -648 1 00 ____ _____ _____CE- .33 .67 5.03 4 .28 -2.97 0.86 _____ _____ _____
Phenotypic correlation: ML =U.bt (Ob.)4, 1,.4b) L)L =U.1/ IIO.9Z, IJ.li)
Table 7.6.2.3 MRT
a2c2 e2 2 df p AIC CFI AX2 Adf p
AE 72 - 29 408 4 40 -3 92 099 _____ _____ _____CE- .32 .68 9.80 4 .04 1.80 0.48 ____ ____ ____
Phenotypic correlation: ML=U.Ib (.O1, 91.1/) VL = U.UO (90.0.), I9.'))
Table 7.6.2.4 SD of RTs
a2c2 e2 x2 df p AIC CFI A 2 Adf p
AE 71 - 29 3 25 4 52 -475 1 00 _____ _____ _____CE- .31 .69 7.92 4 .09 6.49 0.54 _____ _____ _____
Phenotypic correlation: ML=UM9 (32.2, i.Ui) VL =U.10 (.5I.4, '1Z.'Ii)
Table 7.6.2.5 Total number of errors
a2c2 e2 x2 df p AIC CFI A 2 Adf p
AE77 - 23 2 85 4 58 -5 15 1 00 _____ _____ _____CE- .41 .59 9.64 4 .05 1.64 0.60 _____ _____ _____
Phenotypic correlation: MZ=U.0 (9.3, 9.4) L)L=U.1 I (9.9), 1.91)
For the inhibition slope variable, using the standard EQS approach, the fit of even
the best-fitting model was very poor. Therefore, for this variable only, the EQS
syntax file was altered to analyse correlations rather than covariances (which is the
standard approach), which resulted in much improved fit.
251
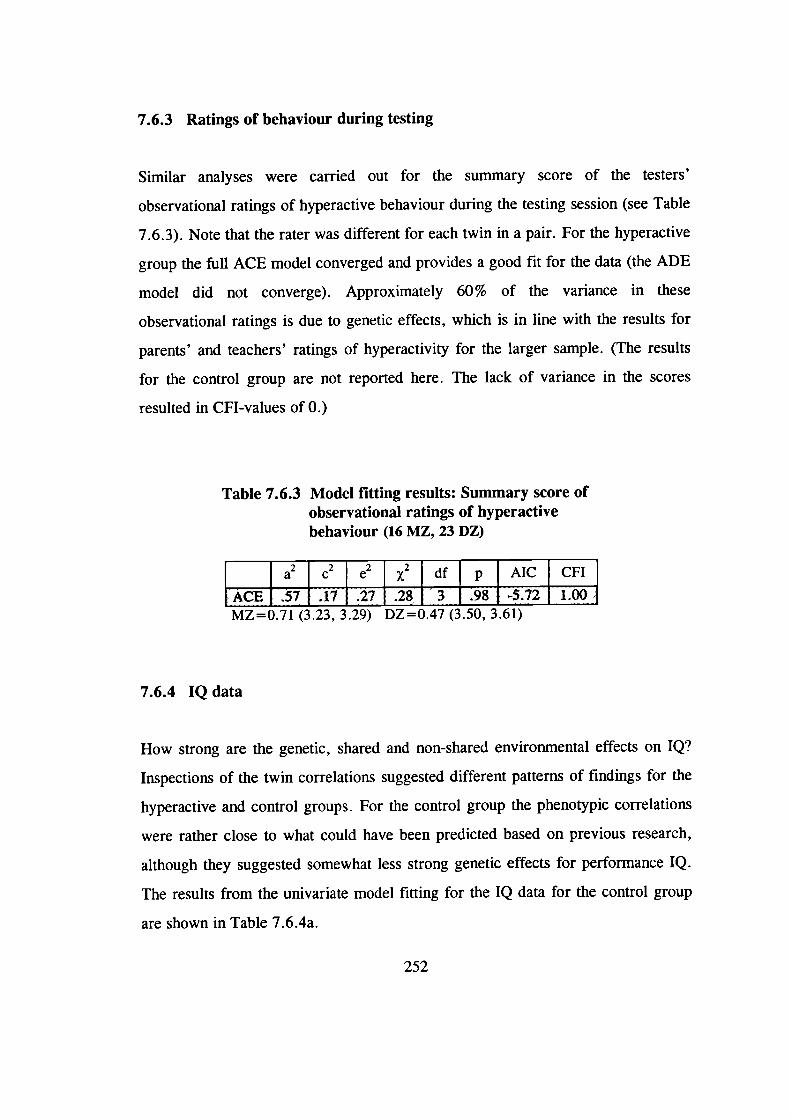
7.6.3 Ratings of behaviour during testing
Similar analyses were carried out for the summary score of the testers'
observational ratings of hyperactive behaviour during the testing session (see Table
7.6.3). Note that the rater was different for each twin in a pair. For the hyperactive
group the full ACE model converged and provides a good fit for the data (the ADE
model did not converge). Approximately 60% of the variance in these
observational ratings is due to genetic effects, which is in line with the results for
parents' and teachers' ratings of hyperactivity for the larger sample. (The results
for the control group are not reported here. The lack of variance in the scores
resulted in CFI-values of 0.)
Table 7.6.3 Model fitting results: Summary score ofobservational ratings of hyperactivebehaviour (16 MZ, 23 DZ)
a c2e2x2 df p AIC CFI
LACE 57 17 27 28 3 98 -5 72 1 00MZ=0.71 (3.23, 3.29) DZ=0.47 (3.50, 3.61)
7.6.4 IQ data
How strong are the genetic, shared and non-shared environmental effects on IQ?
Inspections of the twin correlations suggested different patterns of findings for the
hyperactive and control groups. For the control group the phenotypic correlations
were rather close to what could have been predicted based on previous research,
although they suggested somewhat less strong genetic effects for performance IQ.
The results from the univariate model fitting for the IQ data for the control group
are shown in Table 7.6.4a.
252
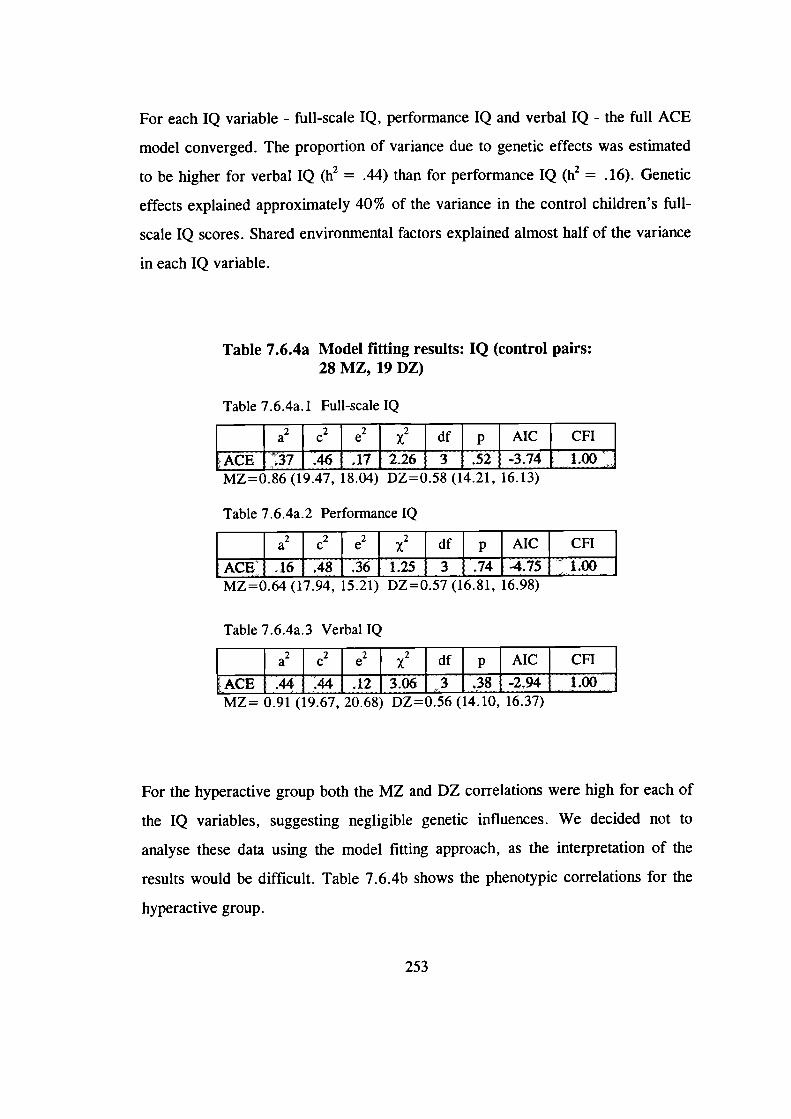
For each IQ variable - full-scale IQ, performance IQ and verbal IQ - the full ACE
model converged. The proportion of variance due to genetic effects was estimated
to be higher for verbal IQ (h2 = .44) than for performance IQ (h2 = . 16). Genetic
effects explained approximately 40% of the variance in the control children's full-
scale IQ scores. Shared environmental factors explained almost half of the variance
in each IQ variable.
Table 7.6.4a Model fitting results: IQ (control pairs:28 MZ, 19 DZ)
Table 7.6.4a. 1 Full-scale IQ
MZ=0.86 (19.47, 18.04) DZ=0.58 (14.21, 16.13)
Table 7.6.4a.2 Performance IQ
MZ=0.64 (17.94, 15.21) DZ=0.57 (16.81, 16.98)
Table 7.6.4a.3 Verbal IQ
MZ= 0.91 (19.67, 20.68) DZ=0.56 (14.10, 16.37)
For the hyperactive group both the MZ and DZ correlations were high for each of
the IQ variables, suggesting negligible genetic influences. We decided not to
analyse these data using the model fitting approach, as the interpretation of the
results would be difficult. Table 7.6.4b shows the phenotypic correlations for the
hyperactive group.
253
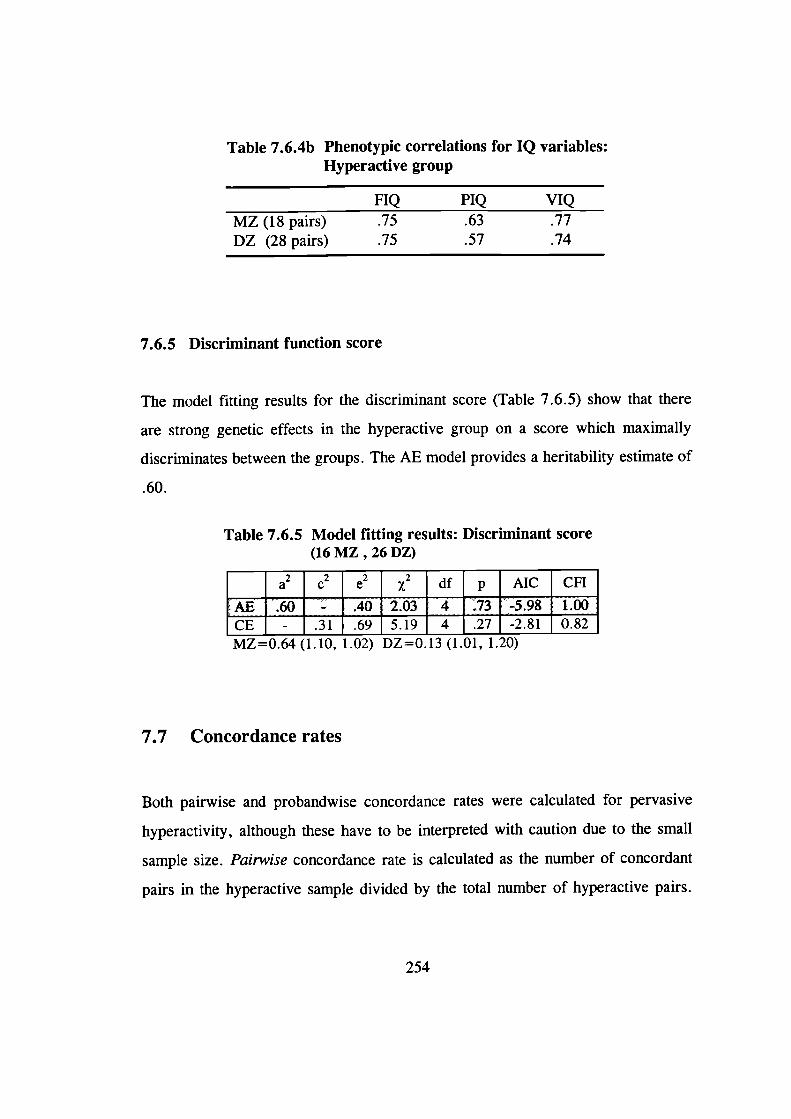
Table 7.6.4b Phenotypic correlations for IQ variables:Hyperactive group
FIQ PIQ VIQMZ (18 pairs) .75 .63 .77DZ (28 pairs) .75 .57 .74
7.6.5 Discriminant function score
The model fitting results for the discriminant score (Table 7.6.5) show that there
are strong genetic effects in the hyperactive group on a score which maximally
discriminates between the groups. The AE model provides a heritability estimate of
.60.
Table 7.6.5 Model fitting results: Discriminant score(16 MZ , 26 DZ)
a2c2e2x2 df p AIC CFI
AE 60 - 40 2 03 4 73 -5 98 1 00CE - .31 .69 _5.19 _4 _.27 _-2.81 _0.82MZ=0.64 (1.10, 1.02) DZ=0.13 (1.01, 1.20)
7.7 Concordance rates
Both pairwise and probandwise concordance rates were calculated for pervasive
hyperactivity, although these have to be interpreted with caution due to the small
sample size. Pairwise concordance rate is calculated as the number of concordant
pairs in the hyperactive sample divided by the total number of hyperactive pairs.
254
Probandwise concordance rate is calculated as the number of affected individuals
in concordant pairs divided by the total number of affected individuals.
The pairwise concordance rate was .22 (4/18) for MZ twins and .07 (2/28) for DZ
twins. The probandwise concordance rate was .36 (8/22) for MZ twins and .14
(4/29) for DZ twins. The significance of the probandwise concordance rate can be
tested with the chi-square test. The chi-square value was 3.54 which, with 1
degrees of freedom, narrowly fails to reach significance (the critical value is 3.84).
7.8 Univariate group heritability analyses
Section 6.1.4 introduced the DF extreme group analysis (DeFries & Fulker, 1985;
1988), a method based on multiple regression which calculates a group heritability.
It focuses on the regression to the mean in the co-twins of MZ and DZ probands.
Using this method, univariate analyses were carried out on the hyperactivity
ratings.
The sample from which the probands have been chosen is the sample of 267 twin
pairs for whom we have the TSQ scores and therefore know their zygosity. For
each of the analysis - teacher ratings on the Hyperactivity dimension (T-scores),
parent ratings on the Impulsive-Hyperactive dimension (T-scores) and an average
of these two - the probands were chosen as those with a T-score of 65 or above
(i.e. 1.5 standard deviations above the mean, based on the standardisation sample)
on the particular dimension. In these analyses we did not use our definition of
pervasive hyperactivity, as it is more appropriate to choose the probands as
extreme scorers on the particular dimension for which the co-twin means are also
calculated.
255
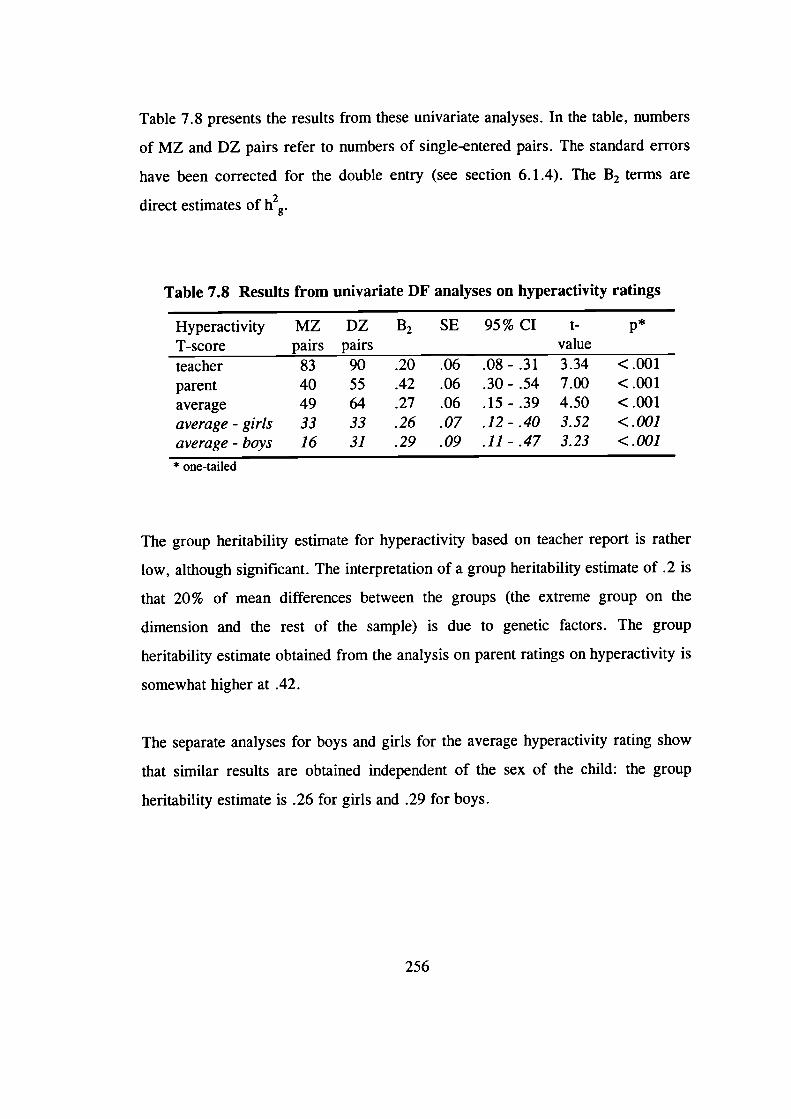
Table 7.8 presents the results from these univariate analyses. In the table, numbers
of MZ and DZ pairs refer to numbers of single-entered pairs. The standard errors
have been corrected for the double entry (see section 6.1.4). The B 2 terms are
direct estimates of h2g.
Table 7.8 Results from univariate DF analyses on hyperactivity ratings
Hyperactivity MZ DZ B2 SE 95% CI t-1-score pairs pairs valueteacher 83 90 .20 .06 .08- .31 3.34 <.001parent 40 55 .42 .06 .30- .54 7.00 <.001average 49 64 .27 .06 .15- .39 4.50 <.001average - girls 33 33 .26 .07 .12 - .40 3.52 <.001average - boys 16 31 .29 .09 .11 - .47 3.23 <.001* one-tailed
The group heritability estimate for hyperactivity based on teacher report is rather
low, although significant. The interpretation of a group heritability estimate of .2 is
that 20% of mean differences between the groups (the extreme group on the
dimension and the rest of the sample) is due to genetic factors. The group
heritability estimate obtained from the analysis on parent ratings on hyperactivity is
somewhat higher at .42.
The separate analyses for boys and girls for the average hyperactivity rating show
that similar results are obtained independent of the sex of the child: the group
heritability estimate is .26 for girls and .29 for boys.
256
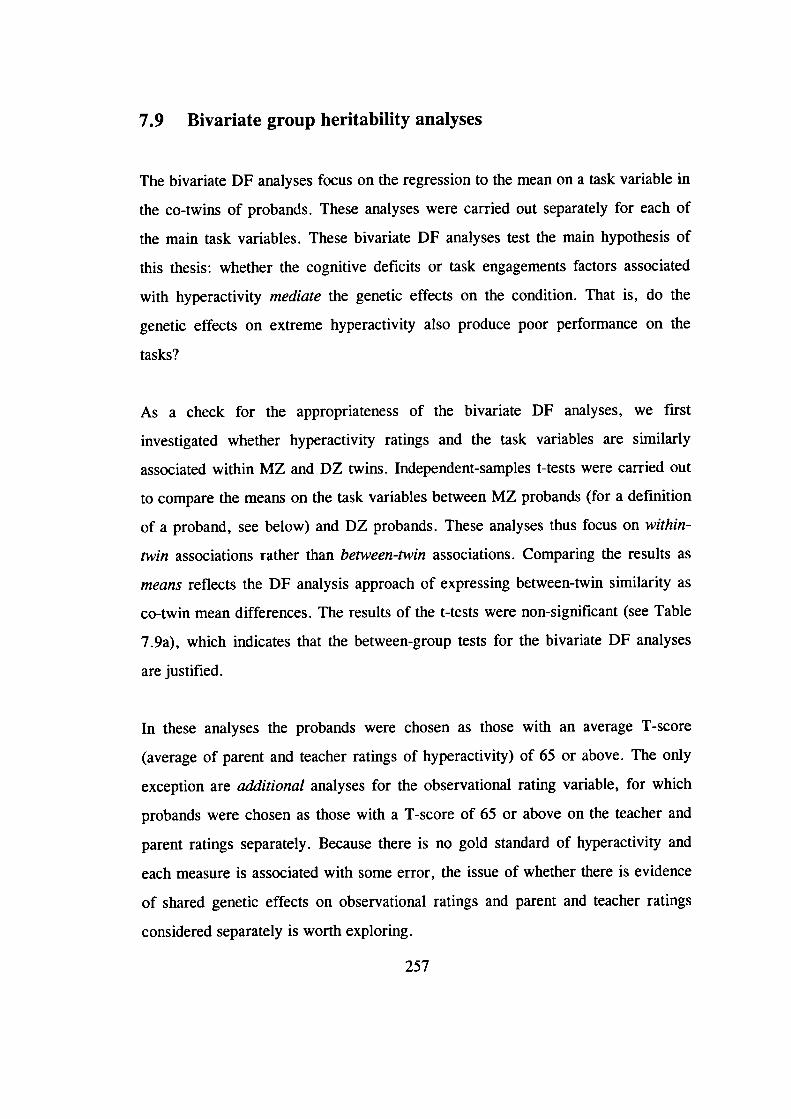
7.9 Bivariate group heritability analyses
The bivariate DF analyses focus on the regression to the mean on a task variable in
the co-twins of probands. These analyses were carried out separately for each of
the main task variables. These bivariate DF analyses test the main hypothesis of
this thesis: whether the cognitive deficits or task engagements factors associated
with hyperactivity mediate the genetic effects on the condition. That is, do the
genetic effects on extreme hyperactivity also produce poor performance on the
tasks?
As a check for the appropriateness of the bivariate DF analyses, we first
investigated whether hyperactivity ratings and the task variables are similarly
associated within MZ and DZ twins. Independent-samples t-tests were carried out
to compare the means on the task variables between MZ probands (for a definition
of a proband, see below) and DZ probands. These analyses thus focus on within-
twin associations rather than between-twin associations. Comparing the results as
means reflects the DF analysis approach of expressing between-twin similarity as
co-twin mean differences. The results of the t-tests were non-significant (see Table
7.9a), which indicates that the between-group tests for the bivariate DF analyses
are justified.
In these analyses the probands were chosen as those with an average T-score
(average of parent and teacher ratings of hyperactivity) of 65 or above. The only
exception are additional analyses for the observational rating variable, for which
probands were chosen as those with a T-score of 65 or above on the teacher and
parent ratings separately. Because there is no gold standard of hyperactivity and
each measure is associated with some error, the issue of whether there is evidence
of shared genetic effects on observational ratings and parent and teacher ratings
considered separately is worth exploring.
257
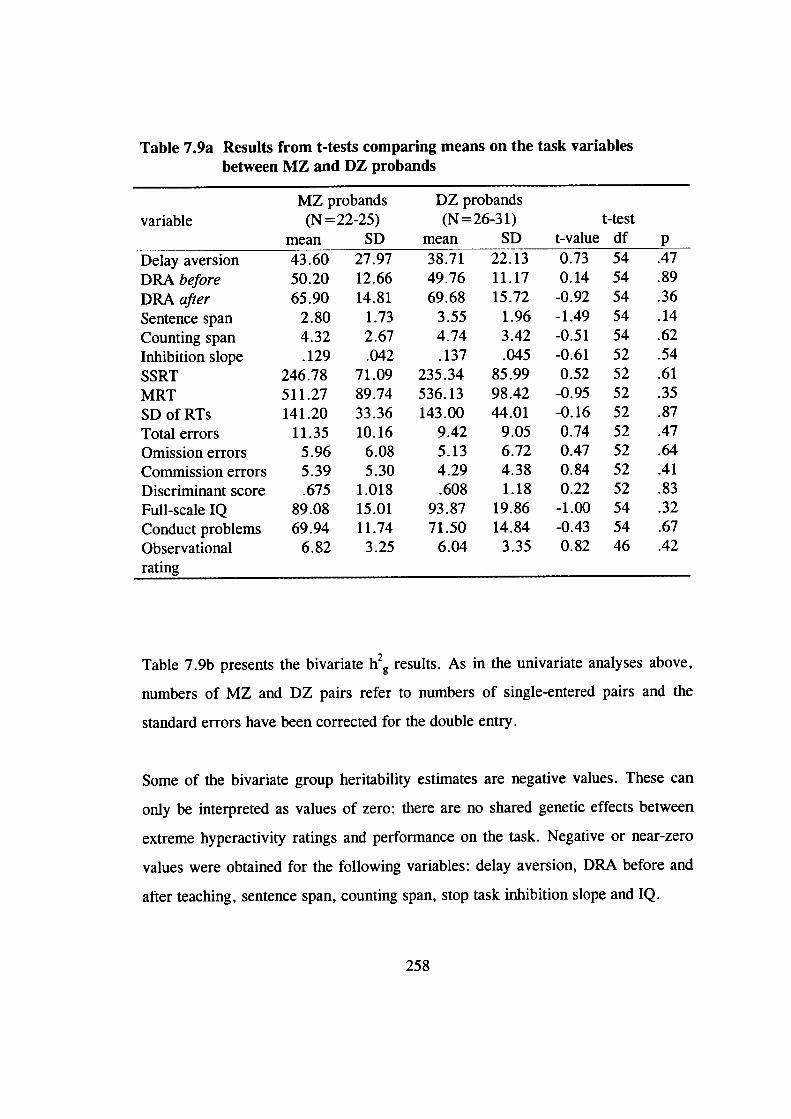
Table 7.9a Results from t-tests comparing means on the task variablesbetween MZ and DZ probands
MZ probands DZ probandsvariable (N=22-25) (N=26-31) t-test
mean SD mean SD t-value df pDelay aversion 43.60 27.97 38.71 22.13 0.73 54 .47
DRA before 50.20 12.66 49.76 11.17 0.14 54 .89DRA after 65.90 14.81 69.68 15.72 -0.92 54 .36Sentence span 2.80 1.73 3.55 1.96 -1.49 54 .14Counting span 4.32 2.67 4.74 3.42 -0.51 54 .62Inhibition slope .129 .042 .137 .045 -0.61 52 .54
SSRT 246.78 71.09 235.34 85.99 0.52 52 .61MRT 511.27 89.74 536.13 98.42 -0.95 52 .35SDofRTs 141.20 33.36 143.00 44.01 -0.16 52 .87Total errors 11.35 10.16 9.42 9.05 0.74 52 .47Omission errors 5.96 6.08 5.13 6.72 0.47 52 .64Commission errors 5.39 5.30 4.29 4.38 0.84 52 .41Discriminant score .675 1.018 .608 1.18 0.22 52 .83Full-scale IQ 89.08 15.01 93.87 19.86 -1.00 54 .32Conduct problems 69.94 11.74 71.50 14.84 -0.43 54 .67Observational 6.82 3.25 6.04 3.35 0.82 46 .42rating
Table 7.9b presents the bivariate h 2g results. As in the univariate analyses above,
numbers of MZ and DZ pairs refer to numbers of single-entered pairs and the
standard errors have been corrected for the double entry.
Some of the bivariate group heritability estimates are negative values. These can
only be interpreted as values of zero: there are no shared genetic effects between
extreme hyperactivity ratings and performance on the task. Negative or near-zero
values were obtained for the following variables: delay aversion, DRA before and
after teaching, sentence span, counting span, stop task inhibition slope and IQ.
258
Table 7.9b Results from bivariate DF analyses
variable MZ DZ B2(xy) SE 95% CI t-value ppairs pairs
Delay aversion 18 28 -.06 .42 -0.88 - 0.75 -0.15 ns
DRA before 18 28 .02 .40 -0.77-0.81 0.06 ns
DRA after 18 27 -.23 .42 -1.07-0.60 -0.55 ns
Sentence span 18 28 -.49 .39 -1.26 - 0.27 -1.26 nsCounting span 18 28 -.16 .46 -1.05 - 0.73 -0.35 nsInhibition slope 16 27 -.07 .45 -0.95 - 0.81 -0.15 nsSSRT 16 27 .59 .44 -0.28 - 1.46 1.33 ns
MRT 16 27 .23 .34 -0.44 - 0.89 0.67 ns
SDofRTs 16 27 .64 .36 -0.07-1.35 1.77 <.05
Total errors 16 27 .60 .46 -0.30 - 1.50 1.32 nsOmission errors 16 27 .35 .49 -0.61 - 1.30 0.71 nsCommission errors 16 27 .60 .46 -0.30 - 1.50 1.32 nsDiscriminant score 16 26 .80 .41 0.003 - 1.60 1.97 <.05
Full-scale IQ 18 28 -.16 .38 -0.90 - 0.59 -0.41 nsConduct problems 18 28 .63 .38 -0.12 - 1.38 1.66 nsObservational 16 23 .63 .50 -0.35 - 1.61 1.25 ns
ratingObservational 16 23 .56 .52 -0.46 - 1.58 1.08 ns
rating"Observational 16 23 .73 .52 -0.29 - 1.75 1.40 ns
rating'S'* one-tailedB2(xy) = bivariate group heritability estimatea =probands chosen based on only teacher ratings of hyperactivityb = probands chosen based on only parent ratings of hyperactivity
In contrast, the bivariate group heritability estimates for several of the stop task
variables were rather high, although mostly non-significant due to the relatively
high standard errors. The highest estimate for an individual variable was that for
the standard deviation of reaction times and it is also the only one which is
statistically significant: there are shared genetic effects on extreme hyperactivity
and the variability of speed. Other variables which obtained a high group
259
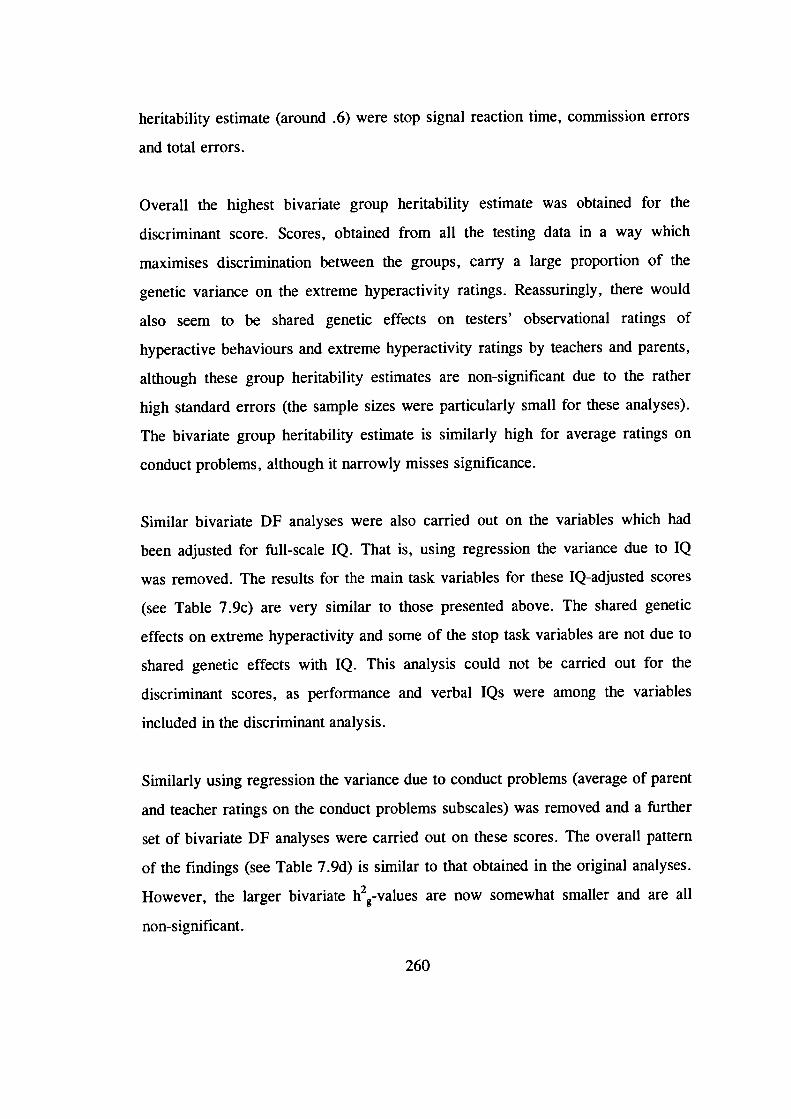
heritability estimate (around .6) were stop signal reaction time, commission errors
and total errors.
Overall the highest bivariate group heritability estimate was obtained for the
discriminant score. Scores, obtained from all the testing data in a way which
maximises discrimination between the groups, carry a large proportion of the
genetic variance on the extreme hyperactivity ratings. Reassuringly, there would
also seem to be shared genetic effects on testers' observational ratings of
hyperactive behaviours and extreme hyperactivity ratings by teachers and parents,
although these group heritability estimates are non-significant due to the rather
high standard errors (the sample sizes were particularly small for these analyses).
The bivariate group heritability estimate is similarly high for average ratings on
conduct problems, although it narrowly misses significance.
Similar bivariate DF analyses were also carried out on the variables which had
been adjusted for full-scale IQ. That is, using regression the variance due to IQ
was removed. The results for the main task variables for these IQ-adjusted scores
(see Table 7.9c) are very similar to those presented above. The shared genetic
effects on extreme hyperactivity and some of the stop task variables are not due to
shared genetic effects with IQ. This analysis could not be carried out for the
discriminant scores, as performance and verbal IQs were among the variables
included in the discriminant analysis.
Similarly using regression the variance due to conduct problems (average of parent
and teacher ratings on the conduct problems subscales) was removed and a further
set of bivariate DF analyses were carried out on these scores. The overall pattern
of the findings (see Table 7.9d) is similar to that obtained in the original analyses.
However, the larger bivariate h2g-values are now somewhat smaller and are all
non-significant.
260
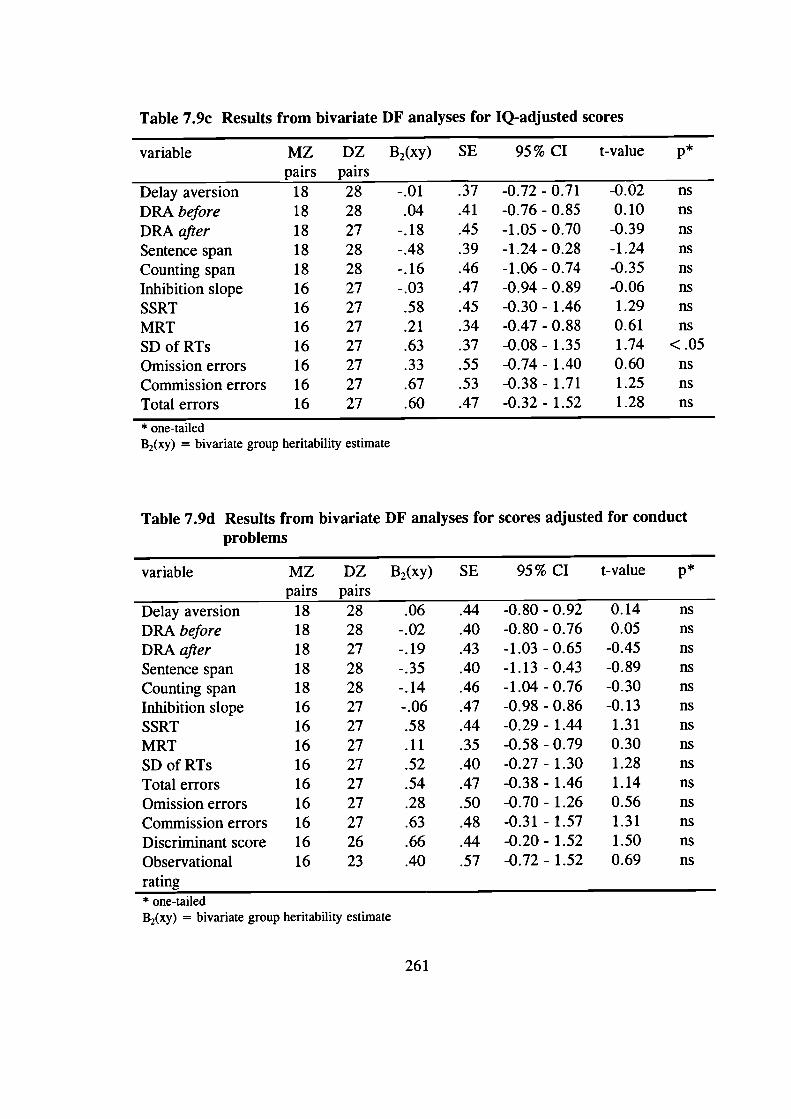
Table 7.9c Results from bivariate DF analyses for IQ-adjusted scores
variable MZ DZ B2(xy) SE 95% CI t-value ppairs pairs
Delay aversion 18 28 -.01 .37 -0.72 - 0.71 -0.02 nsDRA before 18 28 .04 .41 -0.76-0.85 0.10 nsDRA after 18 27 -.18 .45 -1.05 - 0.70 -0.39 nsSentence span 18 28 -.48 .39 -1.24-0.28 -1.24 nsCounting span 18 28 -.16 .46 -1.06 - 0.74 -0.35 nsInhibition slope 16 27 -.03 .47 -0.94 - 0.89 -0.06 nsSSRT 16 27 .58 .45 -0.30-1.46 1.29 nsMRT 16 27 .21 .34 -0.47 - 0.88 0.61 nsSDofRTs 16 27 .63 .37 -0.08-1.35 1.74 <.05Omission errors 16 27 .33 .55 -0.74 - 1.40 0.60 nsCommission errors 16 27 .67 .53 -0.38 - 1.71 1.25 nsTotal errors 16 27 .60 .47 -0.32 - 1.52 1.28 ns
* one-tailedB2(xy) = bivariate group heritability estimate
Table 7.9d Results from bivariate DF analyses for scores adjusted for conductproblems
variable MZ DZ B2(xy) SE 95% CI t-value ppairs pairs
Delay aversion 18 28 .06 .44 -0.80 -0.92 0.14 nsDRA before 18 28 -.02 .40 -0.80-0.76 0.05 nsDRA after 18 27 -.19 .43 -1.03 -0.65 -0.45 nsSentence span 18 28 -.35 .40 -1.13 -0.43 -0.89 nsCounting span 18 28 -.14 .46 -1.04 - 0.76 -0.30 nsInhibition slope 16 27 -.06 .47 -0.98 - 0.86 -0.13 nsSSRT 16 27 .58 .44 -0.29-1.44 1.31 nsMRT 16 27 .11 .35 -0.58 - 0.79 0.30 nsSDofRTs 16 27 .52 .40 -0.27-1.30 1.28 nsTotal errors 16 27 .54 .47 -0.38 - 1.46 1.14 nsOmission errors 16 27 .28 .50 -0.70 - 1.26 0.56 nsCommission errors 16 27 .63 .48 -0.31 - 1.57 1.31 nsDiscriminant score 16 26 .66 .44 -0.20 - 1.52 1.50 nsObservational 16 23 .40 .57 -0.72 - 1.52 0.69 nsrating* one-tailedB2(xy) = bivariate group heritability estimate
261
Chapter 8
Discussion
8.1 Introduction to discussion
The discussion starts with a summary of the main findings from the study. After
this, each of the three theories of hyperactivity is evaluated in the light of the
results. The following two sections examine the support for the genetic hypotheses,
those regarding the heritability of hyperactivity and the possible mediators of the
genetic effects.
A further two sections discuss other findings that provide further insight into
hyperactivity and the more general issues of heritability of other problem
behaviours and of IQ. Then the limitations of the present study, as well as more
general issues about design in the light of the choices we made, are discussed. The
next section draws all the present and previous findings together, in an auempt to
provide a more comprehensive account of hyperactivity. A discussion of the
directions for future research follows this. The last section considers the practical
implications of the findings.
262
8.2 Summary of main findings
Confirming findings from previous twin studies, hyperactivity as a dimension had a
high heritability: 50-70% of the variance was due to genetic effects. The genetic
analyses provided evidence of contrast effects in average hyperactivity ratings
based on both teacher and parent report; teacher-report data was not on its own
suggestive of any such rater bias or sibling interaction effects, however. There was
significant evidence of genetic effects also on extreme hyperactivity, although the
present group heritability estimates were somewhat lower than those reported in
previous studies. In line with previous research, the evidence was also suggestive
of shared genetic effects on extreme hyperactivity and conduct problems.
The performance of the hyperactive and control groups on the tasks was compared
to test the predictions of the different theories of hyperactivity. On the delay
aversion task hyperactive children chose the small immediate reward more often
than the control children, supporting the delay aversion hypothesis. Testers' ratings
of the children's apparent delay aversion confirmed this finding. However,
controlling for conduct problems removed the significant group difference.
Hyperactive children's performance on the working memory measures produced a
somewhat mixed set of findings. They performed significantly worse than the
control group on the sentence span task but not on the counting span task (although
there was a trend for them to perform worse on the counting span task too). On the
delayed response alternation task both groups performed at chance levels before
they were taught the rule. A significant group difference emerged on the 'after
teaching' scores, with the hyperactive children performing worse. Neither of the
significant group differences on the working memory measures remained
significant after controlling for IQ. The theoretical issues of whether it is
appropriate to control for IQ in these comparisons and whether poor performance
on a working memory task could reflect something other than impaired working
memory are discussed in later sections of this chapter.
263
The analyses on the stop task variables showed that hyperactive children were not
less likely to trigger the inhibitory process nor did they have a more variable
inhibitory process than control children, confirming previous findings. The failure
to find a significant group difference on the stop signal reaction time suggests that
a slow inhibitory process may be characteristic of only clinic-referred children and
not of the total population of hyperactive children, although this result has to be
viewed with some caution. Even if hyperactivity were associated with a slow
inhibitory process, this may reflect a general slowing down of responses rather
than a specific deficit in response inhibition.
In contrast to these negative findings regarding the inhibition variables, there were
significant group differences on the other stop task variables. Hyperactive children
were slower and more variable in their speed on the primary task (a reaction time
task) and they also made more errors. Of all the variables which discriminated
between the groups, the effect was strongest for the variability of speed. This
pattern of responding - variable in speed, slow, and inaccurate - is interpreted as
supporting the state-regulation theory of hyperactivity (van der Meere, 1996),
which argues that hyperactive children have a non-optimal activation/effort state.
The data produced significant evidence of shared genetic effects on extreme
hyperactivity and the variability of speed on the stop task. There was also some
suggestion of shared genetic effects with the number of commission errors made
and the speed of the inhibitory process, although these results were not statistically
significant. Given that the pattern of responding characteristic of hyperactivity
would truly indicate an activation/effort problem rather than a cognitive deficit,
these findings suggest that the non-optimal activation/effort state mediates the
genetic effects on hyperactive behaviour. Although the delay aversion and the two
working memory measures discriminated between the groups, there was no
evidence of shared genetic effects on extreme hyperactivity and performance on
these tasks. Delay aversion is a characteristic of hyperactivity, but it seems to have
264
an environmental rather than a genetic origin. The small sample sizes in these
analyses call for some caution in interpreting these results, however.
Girls and boys with hyperactivity were indistinguishable in their performance on
the various tasks. The genetic analyses similarly supported the idea of similar
etiology across gender: the group heritability estimates for hyperactivity were of
similar magnitude for boys and girls.
Overall, the findings from this study take us a step further towards a more
comprehensive account of hyperactivity. The present and previous research
findings pooled together suggest one possible link from genes to behaviour: from
genes to neurotransmitters (dopamine, norepinephrine and serotonin) and frontal-
striatal functioning, and then, via a non-optimal effort/activation state, to
hyperactive behaviour. However, hyperactivity is not purely genetic and delay
aversion may relate to the environmental variables that may play a role.
8.3 Which theory do the data support?
With regard to the non-genetic side of the thesis, the main research question was
whether children with hyperactivity would show a response inhibition deficit,
impaired working memory or a tendency to be particularly aversive to delays. To
our knowledge, this was the first study to contrast these three different theories of
hyperactivity within a single study, with the same group of children. The present
study is also one of the few studies which recruited the sample from the general
population. Most previous studies have relied on clinic-referred samples which are
unlikely to be representative of the total population of hyperactive children. Do the
data support any of these theories of the 'core' deficit in hyperactivity?
265
8.3.1 Delay aversion
Like in the previous study with a similar task (Sonuga-Barke, Taylor, Sembi et at.,
1992), hyperactive children chose the small, immediate reward more often than the
control children. This finding supports the delay aversion hypothesis: hyperactive
children seem to aim to reduce the overall length of the delay period, at the
expense of earning higher rewards. The testers' ratings on the apparent delay
aversion of the children confirmed this finding, as a similar group difference
emerged on these ratings. The hyperactive children not only chose the immediate
reward more often, but they also appeared to find the waiting period very aversive
(they continued talking or doing something else) when they did wait for the larger
reward. Analysing the data using a dimensional approach confirmed these results.
Hyperactivity ratings by testers and teachers correlated moderately and
significantly with performance on the delay aversion task; the correlations with
parents' ratings were low and non-significant. (See section 8.6.3 for a discussion
of rater effects.)
Despite these differences between the hyperactive and control groups in the choices
made on the task, the groups did not differ significantly in the reasons the children
themselves gave for making their choices. Approximately a fifth of the children in
both groups admitted that they wanted to minimise any waiting during the task.
Between 16% and 20% of the children gave the 'expected' reason of wanting to
score a lot of points.
Both the current study and the study by Sonuga-Barke, Taylor, Sembi et al. (1992)
found a significant group difference on a computerised delay aversion measure.
The difference in the results between the two studies relates to the magnitude of the
difference. In the Sonuga-Barke et al. study hyperactive children chose the larger
reward on average 18% of the trials (and control children on 48% of the trials),
compared to 40% of the trials in the present study (53% for the control group).
Differences in methodology could explain the 'stronger' delay aversion tendency of
266
hyperactive children in the original study. For example, the presentation of the task
as a Star Trek game, with well-designed graphics, could have made the task more
interesting in the present study. In the present study the children also had to
perform the task only once, whereas the original study included several different
conditions. Another possible explanation is the age of children: the children in the
Sonuga-Barke et al. study were younger (6 and 7 year olds) than the children in the
present study. Some support for this possibility comes from the findings of a
correlation between age and performance on the delay aversion task (see section
8.7.1).
Due to time constraints for the testing sessions, we did not include in this study the
condition where there would be a delay period after choosing the small reward.
Sonuga-Barke, Taylor, Sembi et al. (1992) showed that in this situation, where
choosing the immediate reward did not reduce the overall delay period, the
hyperactive and control groups were indistinguishable. This led to the argument
that hyperactive children are not truly impulsive, but are delay averse.
Although the hyperactive group obtained lower performance and verbal IQs than
the control group, the group difference on the delay aversion measure remained
significant after controlling for IQ. The hyperactive group's tendency to choose the
immediate reward more often was not due to their lower general cognitive ability.
Performance on the delay aversion task correlated moderately with performance
(.21) and verbal (.40) IQs, however. Children with higher IQs tended to wait more
often for the larger reward.
The group difference on the delay aversion measure did not remain significant after
controlling for conduct problems. This suggests that co-occuring conduct problems
carry some of the association between hyperactivity and delay aversion.
Hyperactivity and conduct problems indeed correlated to roughly the same degree
with performance on the task (with teacher ratings -.30 and -.15 and with parent
ratings -.14 and -.19, respectively). Sonuga-Barke, Taylor, Sembi et a!. (1992) did
267
not investigate this issue of whether delay aversion is spec jfic to hyperactivity. A
separate study by Sonuga-Barke and colleagues (Sonuga-Barke, Taylor and
Heptinstall, 1992) found adverse effects of self-imposed presentation time on both
the hyperactive-only and comorbid hyperactive-conduct problems groups, but not
on the conduct problem -only group. See section 8.6.2 for a further discussion of
the implications of the present findings for understanding the co-occurrence of
hyperactivity and conduct problems. Ratings on anxiety were not related to
performance on the delay aversion measure.
In sum, the results supported the delay aversion hypothesis, although delay
aversion may not be specific to hyperactivity symptoms; the group difference on
the task did not remain significant after controlling for conduct problems. But is
delay aversion truly a 'core' deficit in hyperactivity or could it be a consequence of
something else? This is discussed in section 8.9.
8.3.2 Impaired working memory
Few previous studies have investigated hyperactive children's performance on
working memory measures. The study using the counting span and sentence span
tasks (Siegel & Ryan, 1989) reported no differences between ADD and control
groups on most comparisons. The only comparison on which children with ADD
performed worse was that for the younger age group (7 and 8 year olds) on the
sentence span task. The findings of the present study add to this evidence which at
first sight seems inconclusive: hyperactive children performed significantly worse
than control children on the sentence span but not on the counting span task. There
was a trend, however, for the hyperactive group to perform worse on the counting
span task too.
What could explain the differences in the results between the findings from the
present study and those from the study by Siegel and Ryan (1989)? The children
with ADD in the Siegel and Ryan study may not be representative of children with
268
hyperactivity. The two groups of ADD children had average IQs of 108 and 112.
Because of the association between IQ and working memory (see below), having a
sample of ADD children with unusually high IQs may have 'hidden' a working
memory impairment, if such existed. Indeed, the group difference on the sentence
span task disappeared in the present study when IQ was controlled for. Another
difference between the studies is that pervasiveness of symptoms was not a
requirement in the Siegel and Ryan study.
Taken together, data from the present and the previous (Siegel & Ryan, 1989)
studies suggest that the relationship between hyperactivity and poor performance
on these working memory tasks is stronger for younger children and for the
sentence span rather than the counting span task.
Why do hyperactive children perform relatively better on the counting span task?
In most respects the two tasks are very similar. The most obvious difference
between the tasks relates to the level of difficulty (other than the working memory
requirements). Although the words in the sentence span task were meant to be
virtually predetermined, some of the children had to think for a short while about a
suitable answer. This slowed down the pace of the task, which presumably
increased the working memory demand. Indeed it was not only hyperactive
children who performed relatively better on the counting span task, but this held
for the control group too. The two tasks also differ on how active a role the child
plays: on the counting span task the child is actively involved in counting the dots
with his or her finger, whereas on the sentence span task the child simply responds
verbally to verbal items the tester presents.
Controlling for anxiety did not change the pattern of findings on the working
memory measures, but controlling for conduct problems resulted in a non-
significant group difference on the sentence span task.
269
On the computerised working memory measure, the delayed response alternation
task, both groups performed at chance levels before they were taught the rule. This
was clearly a difficult task for children between the ages of 7 and 12 years. The
'before teaching' score does not therefore reflect working memory ability. The
groups did not differ significantly in the numbers of children reporting to have
found out the rule on their own: 14% of the hyperactive children and 21% of the
control children did so. This task has neither been used with children nor in a
study on hyperactivity in previous research.
When the children performed the task again after having been taught the rule, the
hyperactive group performed significantly worse than the control group. One
possible interpretation of this finding is that the children with hyperactivity showed
impaired working memory. This conclusion would fit in with the evidence from
the two previous studies which found that hyperactive children performed worse
than control children on a working memory task (Gorenstein et a!., 1989; Shue &
Douglas, 1992).
The group difference remained significant after controlling for conduct problems or
anxiety, indicating that neither of these other types of problem behaviours explains
the association between hyperactivity and poor performance on the task.
Considering the data as continuous variables confirmed this pattern of findings.
Hyperactivity ratings correlated significantly (although only in the low-to-moderate
range) with the 'after teaching' scores for tester, teacher, and average of teacher
and parent ratings. There was no association between hyperactivity ratings and the
'before teaching' scores, or between ratings on conduct problems and either before
or after teaching scores on the delayed response alternation task.
The significant group differences on the sentence span and DRA after teaching
variables disappeared when IQ was controlled for. Whether controlling for IQ is in
fact appropriate is a rather complicated theoretical issue. The argument for
270
including IQ as a covariate in the analyses is that the groups differed significantly
on IQ. Any group differences on task performance could be due to differences in
general cognitive ability. The counter-argument is that the lower IQ of the
hyperactive children is very much part of the disorder and gives clues about the
nature of the 'core' deficit. Pennington (1994) emphasises the relation between
working memory and intelligence: 'working memory is clearly one very important
mechanism that appears to account for considerable variance in what is called fluid
intelligence' (p. 267).
In sum, there was some, but not conclusive, evidence of poor performance on
working memory tasks among hyperactive children. Controlling for IQ removes
the group differences, however. Even if the research findings are interpreted as
showing poor performance on working memory tasks, the question remains
whether this really indicates impaired working memory or whether it could be the
result of, for example, delay aversion or lack of effort (see section 8.9).
8.3.3 Response inhibition deficit
The overall conclusion from previous research with the stop task is that
hyperactive children are neither less likely to trigger the inhibition process nor are
they less variable in their inhibitory process (Oosterlaan et al., 1998). The present
findings support this conclusion: the failure to find a group difference on the
inhibition slope ruled out these possibilities.
The difference between the present findings and those from most previous studies
relate to the inhibition slope, however. The previous studies found a significant
difference between hyperactive and control children on the inhibition slope,
although this difference disappeared after the ZRFT-correction, leading to the
above conclusion. In these studies the group difference on the inhibition slope was
due (in part, see section 2.3.3) to a slower inhibitory process. The present study
271
did not find this: the groups did not differ significantly on the stop signal reaction
time.
The only previous study of those included in the meta-analysis of stop task studies
(Oosterlaan et al., 1998), which similarly failed to find a difference between
hyperactive and control groups on the stop signal reaction time, was that by
Daugherty et al. (1993). Like the present study, and unlike the other stop task
studies, Daugherty et a!. recruited their sample of hyperactive children from the
general population. This raises the possibility that the slow inhibitory process is
characteristic only of clinic-referred children with hyperactivity or ADHD.
There is reason to be somewhat cautious about conclusions regarding the speed of
the inhibitory process. The test-retest reliabilities were lower for both the
inhibition slope and the stop signal reaction time than for most other variables. It
may be that the failure to find significant group differences on these variables was
due to their lower reliability. The theoretically important issue is whether the
groups would have differed on stop signal reaction time, had it been a more
reliable measure of the speed of the inhibitory process. If the groups had differed
on the inhibition slope too, this would have simply reflected the group differences
on the stop signal reaction time and the variability of speed on the primary task. It
is extremely unlikely, had the inhibition slope result been significant, that it would
have remained significant after the ZRFT-correction. Previous research has shown
that the ZRFT-correction removes the significant difference between the groups:
hyperactive children are not less likely to trigger the inhibitory process nor do they
have a more variable inhibitory process than other children (Oosterlaan et al.,
1998).
How likely is it that the non-significant stop signal reaction time was due to its
lower reliability? Low reliability may inflate the variances within each group. This
would reduce the power to detect significant differences between the groups.
Inspection of the standard deviations of the variables between the present results
272
and those from two previous studies which were similar to the present one
(Oosterlaan & Sergeant, 1996; Oosterlaan & Sergeant, 1998a) do not suggest any
consistent differences in their magnitude. For some of the stop task variables the
standard deviations were similar for the hyperactive groups in the present study
and the study by Oosterlaan and Sergeant (1998a), but the standard deviations were
higher for the control group in the present study. However, some of the variables
for which this pattern emerged detected highly significant group differences. That
is, even if the standard deviations had been greater for the control group in the
present study, this is unlikely to account for the non-significant group comparison
on the stop signal reaction time.
On the other hand, some support for the possibility of low reliability causing the
non-significant stop signal reaction time result comes from the moderate
correlations between SSRT and task variables which detected significant group
differences.
In sum, the hyperactive children were not less likely to trigger the inhibitory
process nor was their inhibitory process more variable, compared to control
children. The groups also did not differ significantly in terms of the speed of the
inhibitory process, although there is a slight possibility that this was due to the
lower reliability of this measure.
Even if hyperactivity would be associated with a slow inhibitory process, this does
not necessarily indicate a response inhibition deficit (although this is a common
interpretation; e.g. Oosterlaan et al., 1998). Given that hyperactive children are
also slower in their responses on the primary task (see below), these results
together may indicate a general slowing down of responses, rather than a specific
response inhibition deficit. In the Users' Guide to the Stop Signal Paradigm, Logan
(1994) writes: 'Differences in stop signal reaction time have to be interpreted.
They could reflect a specific deficit in inhibition ... or a general slowing down that
affects go processes as well as stop processes' (p. 233).
273
Apart from the issue of a response inhibition deficit and the variables measuring it,
other stop task variables picked up significant group differences. Children in the
hyperactive group were slower (in terms of their reaction times on the primary
task), more variable in their speed of responding (on the primary task) and they
made a higher number of both omission and commission errors than the children in
the control group. (See section 8.3.4 below for an interpretation of these findings.)
However, neither the hyperactive children, nor the control children, became slower
or more variable in their speed of responding over time. In fact, both groups
became faster on the primary task over time, indicating a practice effect.
Could the lower IQs of the children with hyperactivity explain the pattern of
findings that emerged? This could not be the explanation, as the hyperactive
children were slower and more variable in their speed and made more errors even
when IQ was controlled for.
Ratings on conduct problems, but not anxiety, were associated with the stop task
variables. Controlling for conduct problems had the effect of reducing the size of
the group differences: the group difference on the mean reaction time became non-
significant (whether children with high error rates were included or excluded) and
the group difference on the standard deviation variable (a stronger finding) became
non-significant only in the latter case. See section 8.6.2 for a further discussion of
the significance of co-occurring conduct problems in hyperactivity.
Considering the hyperactivity and task variables as continuous dimensions for the
total sample of children tested on the tasks confirmed the main pattern of findings.
See section 8.6.3 for a discussion of differences in results depending on who rated
the child.
274
8.3.4 Evidence for a different hypothesis?
Rather than brushing aside the findings regarding the stop task variables which do
not measure response inhibition as uninteresting, perhaps they give important clues
about the nature of the disorder. Overall, the variability in the speed on the
reaction time task (the primary task of the stop task) best discriminated between the
hyperactive and control groups. The effect size was highest for this variable, it
came out as the strongest variable in the discriminant function analysis and it also
correlated significantly with teacher, parent and tester ratings of hyperactivity,
irrespective of whether IQ was controlled for or not.
What could cause some children to be particularly variable in their speed of
responding on a reaction time task, sometimes responding fast and other times
slowly? One possibility Oosterlaan and Sergeant (1996) suggested is that it may
indicate lack of consistent effort. On some trials the children try harder and
respond quicker, on other trials they try less hard and are slower.
A speculative alternative explanation would involve the concept of a neurological
insult: a neurological 'event' (something resembling a seizure, say) would cause
the child to lose concentration for short periods of time every now and then, which
would result in variable reaction times (Goodman, personal communication, May
1998). This explanation is unlikely, as such a neurological event which would
disrupt concentration should also influence performance with regard to other
variables. The child would be likely to miss the stop signal every now and then,
resulting in a decreased likelihood of triggering the inhibition process. Neither the
present study nor the previous ones have found evidence for this. As reviewed in
section 2.1, previous research has also not found evidence for an attention deficit
in hyperactivity.
The explanation of hyperactive children's task performance as indicating lack of
consistent effort may come quite close to parents' and teachers' description of
275
hyperactive children's behaviour (see van der Meere, 1996), which in some cases
leads to a referral to a clinic. Despite the apparent circulatory nature of the
argument, it is an important theoretical issue. Most theories of hyperactivity refer
to a deficit, whether in response inhibition, working memory or something else. If
hyperactive children perform worse than other children on certain tasks due to lack
of consistent effort rather than impaired cognitive functioning, this has also
practical implications (see section 8.11 for a further discussion).
The children with hyperactivity were not only more variable in their reaction
times, but they were also generally slower and made more errors. This pattern of
responding (slow, variable and inaccurate) conforms to the pattern van der Meere
(1996) concluded in his review as characteristic of hyperactivity. These findings
support the state-regulation theory of hyperactivity, which argues that the core
problem in hyperactivity relates to a non-optimal activation/effort state.
This 'new' interpretation of findings from studies on hyperactivity seems to be
gaining popularity in general. For example, the report on ADHD by the working
party of the British Psychological Association (1996) concluded that 'it would seem
that problems regarded as either attentional or inhibitory may be underpinned
by an inability to maintain effort over time in order to meet task demands' (p. 8).
8.4 Heritability of hyperactivity
8.4.1 Heritability of individual differences in hyperactivity
Previous twin studies have consistently reported high heritability estimates for
individual differences in hyperactivity, that is when hyperactivity has been
measured as a continuous dimension in a sample from the general population.
Heritability estimates based on mother-report data have been around 70-100%,
whereas teacher ratings (on the same scales) have produced heritabilities in the
276
range of 50-60% (Eaves et al., 1997; Goodman & Stevenson, 1989b; Silberg et
al., 1996).
The heritability estimates of between 41% and 74% from the present study add to
this existing evidence of strong genetic effects on hyperactivity. It is important to
remember that these values are indeed estimates which in reality have confidence
intervals; the exact values do not deserve too strong an emphasis. The heritability
estimate of 41 % from parent ratings may slightly underestimate the extent of
genetic effects, as it was difficult to choose between the AE and AE models: the
AE model would have produced a higher heritability estimate of 67%. The
heritability estimate based on the average hyperactivity ratings (74%), combining
teacher- and parent-report data, could perhaps be considered as the most reliable
estimate.
The twin correlations from the present data are also close to the twin correlations
reported in previous studies (e.g. Eaves et al., 1997; Goodman & Stevenson,
1 989b). Further validation for the role of genetic effects in hyperactivity came
from the genetic analyses on the testers' ratings of the hyperactive children's
behaviour during the session, as the heritability for hyperactive behaviours was
estimated at 57%.
The overall conclusion is that genetic effects explained approximately 50-70% of
the variance in individual differences in hyperactivity. This finding also suggests
that the hyperactivity dimensions of the Conners' scales indeed measure a similar
phenotype as other measures of hyperactivity or ADHD (none of the previous twin
studies on hyperactivity used the Conners' rating scales).
The previous twin studies which have obtained ratings from both teachers and
parents have tended to find somewhat higher heritability estimates for parent-
reported (especially mother-reported) than teacher-reported hyperactivity (e.g.
Eaves et al., 1997; Sherman et a!., 1997). The present estimates from parent and
277
teacher ratings on hyperactivity were rather close to one another and for the
reasons mentioned above it would be difficult to conclude that there was any
evidence of a meaningful difference in the estimates. We did not distinguish
between ratings by mothers and ratings by fathers in this study: parent ratings refer
to a combination of the two, as well as in some cases to a joint effort by both
parents.
Some of the previous heritability estimates based on parent-report data are in fact
suspiciously high. For example, Goodman and Stevenson (1989b) obtained a
heritability estimate of greater than 1.00 for mothers' ratings of hyperactivity!
More recent studies which have systematically compared a model including
contrast effects with the other models suggest that contrast effects explain 1-5% of
the variance in parent-reported hyperactivity (e.g. Eaves et al., 1997). The present
data similarly showed significant contrast effects, although only for average
hyperactivity ratings, which explained 3% of the variance. The teacher-report data
did not on its own show any evidence of contrast effects, however, which
replicates the finding from the Eaves et al. (1997) study.
These findings are suggestive of rater bias in parental ratings, although the present
design did not allow an explicit comparison between rater bias and true sibling
interaction. Such analyses by Simonoff et al. (in press) provided evidence for the
rater bias account of parent ratings on hyperactivity. As discussed in section 3.4.3,
Simonoff and colleagues suggest that parents may find it difficult to judge 'normal'
levels of activity, attention and impulsivity. The findings from the present and
previous studies of no contrast effects on conduct problems, for which norms may
be more clear cut, support this argument. The analyses by Simonoff et al. (in
press) also showed that teacher ratings are not a gold standard of hyperactivity
either, but show different biases - those of 'twin confusion' or 'correlated errors'.
Although this study had low power to detect shared environmental influences, the
previous large-scale twin studies have similarly not found evidence of such effects
278
(Eaves et at., 1997; Levy et al., 1997). The environmental factors which influence
hyperactive behaviours seem not to be of the kind which are shared between
members of the same family but seem to be those factors which are specific to each
individual. On the other hand, Simonoff and colleagues (Simonoff et at., in press)
point out that it is difficult to detect both shared environmental effects and contrast
effects, if both were present; this requires large sample sizes and either extended
genetic designs or multiple informants.
In sum, our findings replicated the previous findings of high heritability for the
dimension of hyperactivity and were also suggestive of contrast effects in parental
ratings.
8.4.2 Heritability of extreme hyperactivity
The existing literature has not only showed that hyperactivity as a continuous
dimension has a high heritability but also that there are strong genetic effects on
extreme hyperactivity ratings, when studied on their own. Most previous group
heritability estimates have been based on parent-report (mostly mother-report) data.
The estimates vary from around 70% to almost 100% (Gillis et al., 1992; Gjone et
al., 1996, Levy et al., 1997; Stevenson, 1992).
The present group heritability estimate of 42% for parent-reported hyperactivity is
therefore somewhat lower than the previous estimates. There are several possible
explanations for this. First, the sample of parents in the present study might have
included a higher proportion of fathers, although we did not keep records of
whether it was the mother or father who completed the questionnaire. Some
evidence suggests that father-report data produces lower heritability estimates than
mother-report data (e.g. Goodman & Stevenson, 1989b), although the evidence is
not consistent (Eaves et at., 1997). Second, this could be due to the different
measure of hyperactivity used in the present study. Both of these possible factors
would presumably have had an effect also on the individual differences heritability
279
estimates. Although the individual differences heritability estimates (those based on
parent and average ratings) were somewhat closer to those found in previous
studies than the group heritability estimates, they were still among some of the
lower estimates.
Another possibility is the high proportion of girls in the present sample. The
finding that the group heritability estimates were very similar for average
hyperactivity ratings for girls and boys seems to rule out this possibility, however.
Age is also unlikely to explain the lower group heritability estimate. Studies
suggest that the group heritability estimate for hyperactivity does not vary
significantly as a function of age (e.g. Levy et al., 1997) and the age range in the
present study was also similar to those in previous studies.
The group heritability estimate of 20% for teacher-reported hyperactivity data is
very close to the estimate Stevenson (1992) reported for his sample (16%).
Although these findings need to be replicated with larger sample sizes, they raise
the possibility that teacher-report data produces lower group heritability estimates
for hyperactivity than parent-report data. If parent ratings are more prone to bias
than teacher ratings, some of the very high group heritability estimates reported in
previous research may reflect this.
On the other hand, we do not know how accurate teachers are at identifying
extreme hyperactivity. If teacher ratings of extreme hyperactivity would reflect
'true' hyperactivity better than parent ratings, perhaps the evidence for shared
genetic effects between questionnaire ratings and testers' observational ratings
would be greater for teacher than for parent ratings. The observational ratings are
not a gold standard of hyperactivity either, but offer a measure of hyperactivity
that does not reflect the same biases as questionnaire ratings. Our data did not
support this suggestion of stronger evidence of shared genetic effects on
observational ratings and ratings by teachers rather than by parents.
280
It was not possible within the present study to investigate whether the group
heritability estimates for hyperactivity were significantly lower than the individual
differences heritability estimates. The evidence from previous studies is consistent
with the idea of strong genetic effects on hyperactivity whether it is considered as a
dimension or as a categorical classification (Levy et al., 1997; Sherman et al.,
1997). Our results call for more caution in reaching such a conclusion as yet.
Future studies could be specifically designed to investigate this issue.
The concordance rates were similarly lower in the present study compared to
previous findings. The probandwise concordance rates were 36% for MZ and 14%
for DZ twins, compared to around 80% for MZ and 30-40% for DZ twins in
previous studies (Gillis et al., 1992; Levy et al., 1997). Admittedly the sample size
in the current study was very small for this type of analysis.
To summarise, there was significant evidence of genetic effects on extreme
hyperactivity ratings. The genetic effects were less strong than in previous
research, however.
8.5 Mediators of genetic effects on hyperactivity
The main hypothesis of this thesis was that the cognitive impairments or task
engagement factors that would be associated with hyperactivity would mediate the
genetic effects on the condition. Previous twin studies of hyperactivity have not
explored this issue. The present study reflects the move in quantitative genetics
from simply calculating heritability estimates to also asking more complex, more
informative questions about genetic effects.
We tested this hypothesis by investigating whether there are shared genetic effects
on extreme hyperactivity ratings and the task variables. The measures which
differentiated between the groups - delay aversion, sentence span, delayed response
281
alternation after teaching score and the stop task variables of standard deviation of
reaction times, mean reaction time and the error variables - are all potential
candidates for sharing genetic effects with hyperactivity ratings. The other
requirements are those of genetic effects on extreme hyperactivity and on
hyperactive children's performance on the tasks. Although the genetic effects on
extreme hyperactivity were not as strong as those found in previous research, they
were still significant.
The failure to find any evidence of genetic effects on hyperactive children's
performance on the delay aversion and sentence span tasks ruled out the possibility
of shared genetic effects with hyperactivity ratings. This suggests that the poor
performance of hyperactive children on these tasks has an environmental rather
than a genetic origin. (The data was suggestive of both shared and non-shared
environmental effects on performance on these tasks.)
For the hyperactive group, genetic factors explained approximately a quarter of the
variance on the DRA after teaching scores and between 60% and 80% of the
variance on the stop tasks variables. However, there was no evidence that the
genetic effects on performance on the spatial working memory measure would have
been shared with those on extreme hyperactivity ratings. This leaves some of the
stop task variables as the only possible candidates for sharing genetic effects with
hyperactive behaviour.
One variable emerged again as the strongest finding: there was significant evidence
of shared genetic effects on extreme hyperactivity and the variability of speed on
the stop task. That is, of those genetic effects that there were on extreme
hyperactivity ratings, a significant proportion was shared with the genetic effects
on the variability of speed. This was the only statistically significant finding for
any of the individual task variables.
282
Due to the small sample size, it is informative also to consider the size of the
bivariate group heritability estimates, rather than exclusively focus on the statistical
significance of these estimates. The group heritability estimates were rather high
for two other stop task variables too: for commission errors and stop signal
reaction time. The number of commission errors made discriminated well between
the groups and therefore the possibility of shared genetic effects on this variable
and hyperactivity fits in with the general pattern of findings. The finding which is
more difficult to interpret is that of possible shared genetic effects on hyperactivity
and the speed of the inhibitory process. (The hyperactive and control groups did
not differ significantly on this variable.) It suggests that to the extent that
hyperactivity and the speed of the inhibitory process are related, they may be so
through genetic influences held in common.
In addition to the variability of speed on the stop task, the only other statistically
significant result was that for the discriminant score. Scores based on all the testing
data which maximally differentiate between the groups carry a significant
proportion of the genetic effects on extreme hyperactivity ratings.
The finding of possible shared genetic effects on hyperactivity and some of the stop
task variables is not due to shared genetic effects on hyperactivity and IQ. The
pattern of the findings was very similar when IQ was controlled for, with the
group heritability estimate for the variability of speed remaining significant.
There was evidence of shared genetic effects on extreme hyperactivity and conduct
problems (although this finding narrowly missed statistical significance). This
confirms the findings from previous twin studies (see section 8.6.2 for a further
discussion). Conduct problems seem to have carried a small proportion of the
shared genetic effects on hyperactivity and the task variables, as controlling for
conduct problems had the effect of reducing the bivariate group heritability
estimate or increasing the size of the standard errors, or both. This resulted in non-
significant bivariate group heritability estimates for each of the variables, although
283
the estimates were still high for the discriminant score, commission errors, stop
signal reaction time and standard deviation of the reaction times (between .58 and
.66).
In sum, there was significant evidence of shared genetic effects on extreme
hyperactivity and the variability of speed of responding. There was also some
suggestion of hyperactivity sharing genetic effects with the number of commission
errors made and the speed of the inhibitory process, although these findings were
not statistically significant. These variables may mediate the genetic effects on
hyperactivity. Despite the delay aversion and the two working memory (sentence
span and DRA after teaching) measures distinguishing between the two groups,
these measures do not seem to share genetic effects with those on hyperactive
behaviour.
8.6 Further insight into hyperactivity
8.6.1 Association with lower IQ
Whereas it is helpful to investigate what effects controlling for IQ has on the group
differences on testing data, the lower average IQ of the hyperactive group is in
itself a theoretical issue. How does the present data help to understand the
association of hyperactivity with slightly lower scores on IQ tests?
It is worth considering the possibility that the association of hyperactivity with
lower IQ would arise because of the association between hyperactivity and conduct
problems. The difference in the IQs between the groups did not remain significant
when conduct problems were controlled for. On the other hand, when both
hyperactivity and conduct problems were considered as dimensions, the negative
correlation between hyperactivity and IQ remained significant when conduct
problems were controlled for, though it was slightly less in magnitude. Conduct
284
problems on their own showed some association with IQ, although somewhat less
strong than hyperactivity (the correlation between full-scale IQ and hyperactivity
was - .26, compared to -.17 with conduct problems). Together these data suggest
that co-occurring conduct problems do not completely explain the association
between hyperactivity and lower IQ.
Goodman et al. (1995) concluded from their investigation onto the association
between behavioural problems and lower IQ that the 'IQ as a marker' hypothesis is
a plausible explanation. The authors discussed, though did not test, the possibility
of genes as the 'third factor' causing both lower IQ and behavioural deviance. Our
data did not support this hypothesis: there was no evidence of shared genetic
effects on extreme hyperactivity and IQ. Another possible 'third factor' Goodman
et al. (1995) discussed is motivation to succeed and to please. This
motivational/effort account remains a possibility. An important issue for future
research would be to investigate whether medication improves hyperactive
children's scores on IQ tests.
Another factor that could theoretically explain the link between hyperactivity and
lower IQ is low birthweight. As expected from a sample of twins, both groups had
rather low average birthweights. However, the hyperactive group did not have
lower average birthweight than the control group, confirming the finding from the
twin study by Goodman and Stevenson (1989b). In contrast to these findings, the
follow-up studies of children born with very low birthweights have found an
increased incidence of ADHD among these children (Botting et a!., 1997; Szatmari
et al., 1993). It is possible that only very low birthweight would be related to
ADHD symptomatology; the numbers of children with birthweights below 1500
grams were too low in the present study to investigate this. The children with very
low birthweights may have suffered brain damage which could cause the
hyperactive and inattentive behaviour, as well as the low IQs.
285
In sum, low birthweight or co-occurring conduct problems do not seem to
adequately explain the association between hyperactivity and lower IQ scores.
There was no evidence of shared genetic effects on hyperactivity and IQ scores.
Future studies could aim to investigate the extent to which the lower IQ scores of
hyperactive children might reflect lack of effort and to what extent they reflect
'true' lower general cognitive ability.
8.6.2 Co-occurring conduct problems
The children with hyperactivity were rated significantly higher on conduct
problems, compared to the control children. As there is extensive literature on the
high rates of co-occurrence of these behaviours (see section 4.2.1), this provides
further support for the representativeness of the present sample of hyperactive
children.
If, among pre-adolescent children, conduct disorder is a complication of
hyperactivity (Taylor et a!., 1996), this raises the question of whether the poor
performance of hyperactive children on some tasks is due to the 'core'
hyperactivity or the co-occurring conduct problems. Previous research has not
answered this question satisfactorily. Controlling for conduct problems removed
the significant group difference on the delay aversion and sentence span tasks. As
there were no genetic effects on hyperactive children's performance on either of
these tasks, this suggests that their performance on these tasks may relate to some
of the environmental factors which are also associated with conduct problems.
Controlling for conduct problems also removed the significant group difference on
the speed of responding on the stop task (and the variability of speed, when the
children with high error rates were excluded). These variables were related to
genetic factors, but environmental variables did of course account for a proportion
of the variance too. The significant group differences on the remaining variables -
DRA after teaching and the error variables on the stop task - remained significant
after controlling for conduct problems. (To be precise, the p-value for commission
286
errors was .06 and therefore only showing a 'trend'.) This suggests that the
association between hyperactivity and these variables is not due to the co-occurring
conduct disorder symptomatology.
The heritability of the conduct problems dimension was estimated at 69% based on
teacher report and at 29% based on parent report. Caution is needed when
interpreting the parent-report data, however, as it was difficult to choose between
the various models. The heritability estimate based on teacher ratings on conduct
problems is in line with previous reports of the extent to which genetic factors
account for aggressive behaviour (e.g. Edelbrock et al., 1995; Schmitz et al.,
1995). The Conners' scales do not have separate subscales for aggressive
behaviour and delinquent behaviour, but the emphasis on the conduct problems
subscale is on aggressive behaviours.
The finding of genetic effects on conduct problems raises the possibility of shared
genetic effects on hyperactivity and conduct problems. The data indeed provided
support for this hypothesis (although the result narrowly missed statistical
significance). Silberg et a!. (1996) similarly showed that in the younger age group
(8-11 years) of their sample the same set of genes influenced hyperactivity and
conduct problems. Significant evidence of shared genetic effects on the two
phenotypes also emerged in the study by Nadder et al. (1998). Both of these
studies focused on normal variation of scores on the behavioural dimensions, using
the Cholesky decomposition approach. The present study confirmed this finding
using the DF extreme group approach, focusing on extreme hyperactivity. This
result fits in with the idea of hyperactivity increasing the risk for the development
of conduct problems. Although the finding is not inconsistent with conduct
problems increasing the risk for hyperactivity, previous research does not support
this possibility (see chapter four). Longitudinal genetic studies could investigate
this issue more directly. Within the present design we could not explore the other
possible routes to conduct disorder.
287
8.6.3 Cross-informant consistency
The present study focused on pervasive hyperactivity: the children were included in
the hyperactive group only if both teachers and parents rated them highly on the
hyperactivity dimension. It is useful to consider very briefly the implications of the
data with regard to rater effects.
The current data suggests a similar degree of cross-informant consistency as previous
research. Goyette et al. (1978) reported a correlation of .36 between teacher and
parent ratings on the hyperactivity dimensions of the Conners' scales; the correlation
for the sample representative of the general population was .33 for our data.
The teachers' and parents' ratings of hyperactivity correlated moderately highly with
testers' ratings of hyperactive behaviours during the session. A caveat here is that the
sample of children - all the children whom we tested - are not representative of the
general population. The high correlation (.7) between teachers' and parents' ratings
on this sample reflects this. Nonetheless, the correlations suggest some degree of
consistency between the rather crude ratings of behaviour during a single testing
session and ratings on the Conners'. The finding of a highly significant group
difference on the testers' ratings confirms this (as the parent and teacher ratings were
used to define the groups).
The correlations between ratings of hyperactivity and performance on the tasks were
somewhat higher for teacher rather than parent ratings, although we did not test
whether the correlations were significantly higher for teacher ratings. For several of
the variables the correlations with tester ratings were even somewhat higher than
those with teacher ratings. The genetic analyses provided some evidence of possible
rater bias in ratings by parents. These findings together point to the need to obtain
ratings from multiple sources.
288
8.6.4 Sex effects
Many studies on hyperactivity have not included girls at all in their samples. It was
one of the aims of the present investigation to explore this neglected issue of the
nature of sex effects in hyperactivity. Heptinstall and Taylor (1996) suggest that
hyperactivity is truly less common among girls than boys.
The focus on sex effects in the present study is more dimensional in nature than
that of the diagnostic approach to hyperactivity or ADHD. Rather than comparing
girls who show 'clinically significant' hyperactivity to boys who show 'clinically
significant' hyperactivity, we compared the 'top end' of boys showing hyperactive
behaviours to a similar proportion of 'top end' girls. With regard to performance
on the tasks, hyperactive girls were indistinguishable from hyperactive boys. This
suggests that even if hyperactive girls (as defined in this study) show hyperactive
behaviours to a lesser extent (see Appendix A for the results), they still show the
same pattern of responding on tasks as hyperactive boys.
The group heritability estimates for hyperactivity ratings based on both teacher-
and parent-report data were also similar for boys and girls, which provides further
evidence of similar etiology across gender. We did not have enough power in the
study to investigate sex effects for the heritability of individual differences in
hyperactivity. Previous twin studies which have included both boys and girls in
their samples have obtained comparable heritability estimates - whether individual
differences or group heritabilities - across the sexes (e.g. Eaves et al., 1997; Gillis
et a!., 1992; Goodman & Stevenson, 1989b).
8.6.5 Co-occurrence of other problem behaviours
The fact that hyperactivity frequently co-occurs not only with conduct problems but
also with learning problems and anxiety is an important issue both theoretically and
clinically. Confirming this general pattern of findings, the present sample of
289
hyperactive children obtained higher scores than the control children on ratings of
anxiety and learning problems. The hyperactive children obtained higher scores
also on the Inattentive-Passive dimension, but to an extent this finding simply
reflects the fact that children who are hyperactive and impulsive (the characteristics
used to define the hyperactive group) are often also inattentive (the third ADHD
symptom category). On only one of the dimensions of the Conners' was there no
significant group difference: the parents of the hyperactive children did not rate
their children higher on Psychosomatic complaints than did parents of control
children.
Our data did not support the view that hyperactive children who also show
symptoms of anxiety may differ from other hyperactive children with regard to
cognitive or task engagement factors (e.g. Pliszka, 1992). Controlling for anxiety
did not change the pattern of findings for group comparisons and the correlational
analyses also showed that ratings on anxiety were not related to performance on the
tasks. However, we did not design this study specifically to address this question
and parents' ratings on the Anxiety subscale of the Conners' may not be a
completely adequate measure of anxiety.
8.7 Further findings
8.7.1 Developmental effects
Although developmental effects were not a specific focus of the present thesis, it is
useful to consider the findings within the developmental context. The finding of
moderate correlations between age and performance on the sentence span and
counting span tasks confirms the previous reports of developmental effects on
children's performance on these tasks (Case et at., 1982; Siegel, 1994).
290
There was also a significant and moderate association between age and
performance on the delayed response alternation task, which provides further
evidence of developmental effects on working memory. However, children in this
age group - 7 to 12 years - have clearly not yet achieved adult-level performance
on the task: control children made an average of 75% correct responses after they
had been taught the rule, whereas the figure was 99% for the healthy adults in the
study by Gold et a!. (1996).
Age was also related to the children's performance on the delay aversion task, with
older children being more likely to wait for the larger reward and therefore to
obtain more points. Sonuga-Barke, Taylor, Sembi et al. (1992) did not focus on
age effects; the children in their sample were all 6 and 7 year olds. This
association between age and performance on the delay aversion task may explain
the 'stronger' delay aversion tendency of the hyperactive children in the previous
study (Sonuga-Barke et al.) than in the present study.
Previous studies using the stop task have suggested that age is not significantly
related to the slope of the inhibition function or to error rates (Schachar & Logan,
1990; Oosterlaan & Sergeant, 1996). The present data indicate significant, though
moderately low, correlations between age and the inhibition slope and total number
of errors. Age was more strongly related to the speed and variability of speed on
the primary task, which is in line with previous findings. The existing evidence on
developmental effects on the speed of the inhibitory process is inconclusive. As in
the study by Oosterlaan and Sergeant (1996), age was not significantly related to
stop signal reaction time in the present study; Schachar and Logan (1990),
however, reported a moderate negative correlation between age and the speed of
the inhibitory process.
In sum, age was related to most of the response variables. However, the usefulness
of the present correlational findings is limited by the fact that the sample was not a
general population sample.
291
8.7.2 Heritability of other problem behaviours
We obtained heritability estimates for other problem behaviours too, apart from
hyperactivity and conduct problems. Whereas several previous twin studies have
estimated the extent to which genetic factors influence individual differences in
scores on behavioural rating scales, to our knowledge this is the first twin study to
report such data for the Conners' scales.
Teacher ratings on the Inattentive-Passive dimension suggested high heritability:
approximately 80% of the variance was due to genetic effects. This links with the
literature showing strong genetic effects on ADHD symptomatology, as
inattentiveness is one of the three ADHD dimensions. Not all the items of this
subscale focus on inattentiveness, however. The other items include, for example,
'difficulty in learning', 'appears to be easily led by other children' and 'childish
and immature'.
The present data on ratings of anxiety and somatic complaints can be compared to
the results from two recent twin studies which obtained ratings from parents on the
Child Behaviour Checklist. The samples in both studies were general population
samples and the twins were aged between 7 and 15 years in the study by Edelbrock
and colleagues (Edelbrock, Rende, Plomin & Thompson, 1995) and between 4 and
18 years in the study by Schmitz and colleagues (Schmitz, Fulker & Mrazek,
1995).
Somatic complaints refer to complaints of, for example, headaches and stomach
aches. The present data confirms the finding of genetic factors influencing somatic
symptoms, although the heritability estimate (38%) was somewhat lower than the
heritability estimates from the CBCL studies (51 % and 73%). For parents' ratings
on anxiety, our findings suggest higher heritability (82%) than the CBCL studies
(34% and 50%). The CBCL anxiety subscale in fact includes both anxiety and
292
depression items, whereas the Conners' anxiety subscale focuses exclusively on
anxiety. This is one possible explanation for the discrepant findings.
The learning problems subscale of the Conners' includes items such as 'difficulty
in learning' and 'fails to finish things'. Genetic factors explained approximately
73% of the variance on this dimension. Parents' ratings on both the learning
problems and the anxiety subscales showed evidence of contrast effects (sibling
interaction and/or rater bias). Eaves et a!. (1997) similarly reported evidence of
contrast effects for parental ratings on anxiety.
To summarise, genetic factors seem to influence various types of problem
behaviours in childhood. These findings refer to normal variation on these
behavioural dimensions in the general population.
8.7.3 Heritability of IQ
Twin studies of general population samples suggest a heritability of around 50%
for IQ; the average twin correlations are .86 for MZ twins and .60 for DZ twins
(see Plomin et a!., 1997). The shared environment accounts for approximately 40%
of the variance in IQs for twins, although the shared environmental effects may be
slightly weaker for nontwin siblings (P10mm et al., 1997). Genetic factors become
more, rather than less, important for IQ with age; the heritability of IQ increases
throughout childhood and into adulthood (McGue, Bouchard, lacono & Lykken,
1993).
Data from the present control twin pairs replicated the previously reported twin
correlations for full-scale IQ (although in the present study we used only four
subtests): the twin correlations were .86 for MZ and .58 for DZ twins. Genetic
factors explained approximately 40% of the variance in full-scale and verbal IQ
scores, whereas the heritability estimate was somewhat lower for performance IQ
(20%). The shared environment accounted for approximately half of the variance
for each type of IQ scores.
293

8.8 Limitations and comments
Each study has its limitations and the conclusions must be interpreted with these in
mind. Acknowledging those limitations which suggest specific improvements to
methodology is beneficial for future research. Accepting the limitations over which
one has liule control teaches a useful lesson about the real world.
8.8.1 Statistical power
The most obvious limitation of the present study relates to sample size and its
implications for statistical power. Whereas at the first stage of the study we had a
large sample of 1316 twin pairs, each stage of the selection procedure unavoidably
reduced the sample size.
The sample size for the non-genetic group comparisons was 49-51 children in the
hyperactive group and 118-119 children in the control group. As discussed in
section 6.2, at a = .05 and 80% power the sample size requirement would be 64
individuals in each group to detect medium effect sizes and 26 individuals to detect
large effect sizes. These power calculations show that the sample sizes were
adequate for the non-genetic analyses.
In the genetic analyses on the testing data, the emphasis was on the DF extreme
group analyses, as these tested the main hypotheses of the study. The sample sizes
were 40-83 MZ pairs and 55-90 DZ pairs in the univariate DF analyses (except
when the results were analysed separately for girls and boys), and 16-18 MZ and
27-28 DZ pairs in the bivariate DF analyses. As discussed earlier, with a group
heritability estimate of .60 (i.e. a difference in the standardised co-twins' means of
.30) and one-tailed a =05, the sample size would need to be 138 children to
achieve 80% power (Cohen, 1988). Therefore the power in the present study for
the DF analyses was lower than the preferred 80% (although the results showed
that the power was adequate to detect several statistically significant effects).
294
Nonetheless, it is necessary to consider the findings as preliminary; only
replication of the findings in future studies would justify drawing firm conclusions.
The model fitting approach has less power than the DF extreme group approach
and therefore one has to be even more cautious when interpreting the ACE results
for the task variables. These were only used as 'first-step' analyses, however, to
give an indication of whether the task variables would show genetic effects, before
carrying out the bivariate DF analyses which tested the main hypothesis directly.
The model fitting analyses on rating scale data were based on 61 MZ pairs and 64
DZ pairs. The power calculations we reported in section 6.2 showed that a sample
of 75 MZ and 75 DZ twin pairs would be required to detect a heritability of .6
(rMz = .65, rDz = .35) with 80% power and a= .05. Although the sample sizes were
adequate for detecting genetic effects on the rating scale data, the identification of
common environmental terms would require larger sample sizes (see Neale and
Cardon, 1992).
In general, a larger sample for the testing data would have been ideal. However, it
simply would not have been feasible within the constraints of the study to screen a
larger population of twins and to carry out the testing on a larger sample.
8.8.2 Representativeness of the sample
Representativeness of twins
The representativeness of twins in general, and how the present data supports the
representativeness of this sample of twins, are discussed in Appendix A. In brief,
there were very few significant differences between the present sample and the
standardisation sample on the mean scores of the Teacher Conners' subscales. As
the children in the standardisation sample were singletons, this suggests that ratings
on the CTRS-28 are comparable for twins and singletons.
295
Representativeness within the geographical location
We decided not to use an existing twin register, but rather to recruit the twins from
schools, in order to obtain a sample that would be representative of children in the
area. Did we achieve this aim? The response rate from schools was approximately
70%; it is quite likely that some of the schools that did not reply in fact did not
have any twins fulfilling the criteria for the study. Of the parents whom we
contacted, approximately 70% completed the questionnaires. We do not know
whether the parents who did not reply were different with regard to any
background variables to those who replied. However, rather similar numbers of
parents of both potential hyperactive and potential control twins replied. This is
reassuring, as it suggests that parents of hyperactive children were not less likely
than parents of non-hyperactive children to agree to participate in the study. This
was also the case for the families we invited for a testing session: 68% of the
hyperactive and 64% of the control families agreed to make the visit.
Representativeness of the population of hyperactive children
Another issue is whether the children in the hyperactive group are representative of
hyperactive children in general. There are two issues here in fact: how comparable
is the present sample of hyperactive children to the samples of hyperactive or
ADHD children in other studies and how representative are they of a 'true' group
of hyperactive children.
There is undoubtedly some, but not complete, overlap between the current
definition of hyperactivity and the clinical diagnosis of ADUD according to DSM-
IV criteria. Both require pervasiveness of the symptoms and the prevalence
estimates are similar (around 5%). On the other hand, the current definition
focused on the symptoms of hyperactivity and impulsivity, whereas a diagnosis of
ADHD can be based on symptoms of hyperactivity-impulsivity only, of inattention
only, or a combination of both. The current definition did not include the DSM-IV
296
requirements of age of onset and duration of symptoms. The present sample of
hyperactive children is likely to resemble more closely samples of hyperactive
children in studies which, like the present study, adopted a dimensional rather than
a categorical approach. Such studies select the hyperactive children as those
scoring above a predetermined cut-off point on a hyperactivity rating scale.
An aspect on which the present sample differs from most previous studies is the
proportion of girls in the sample. The use of T-scores for cut-off points ensured
approximately equal numbers of girls and boys. The argument could be made that
girls in the hyperactive group would show less severe symptomatology than boys,
because of girls' tendency to score lower on the hyperactivity dimensions. Whereas
this is a valid argument, the sex differences themselves were what we were
interested in and were the reason for the selection procedure we adopted. The
question was whether the girls scoring in the approximately top 5 % on the
hyperactivity dimensions would differ from the top 5 % of pervasively hyperactive
boys, even if the average raw scores would be lower for girls than boys. Sex
effects in hyperactivity have largely been neglected in previous hyperactivity
research. Section 8.6.4 discussed the findings from the present study.
There is no gold standard of hyperactivity. Validation for the present definition of
hyperactivity came from the observational ratings of hyperactive behaviours during
the session, as these ratings differentiated well between the hyperactive and control
groups. Although hyperactive children do not necessarily 'show their true colours'
during a short clinic session, they may be more likely to do so in a long testing
session which requires concentration. There was also some evidence of shared
genetic effects on the questionnaire ratings of extreme hyperactivity and the
observational ratings of hyperactive behaviours, although this finding was not
statistically significant (the sample size here was particularly small, resulting in
high standard errors).
297
Complicating the measurement of hyperactivity is the possible heterogeneity of the
disorder. Subgroups of hyperactive children may exist whose etiologies differ,
although they may show similar symptoms. If some children are phenocopies (see
section 3.2) rather than 'true' cases, including them in a study may cloud the
picture. Although the present study was not specifically designed to address
heterogeneity as such, we did consider the effects of anxiety, conduct problems, IQ
and gender on the results. In addition, the selection criteria ensured the exclusion
of children showing the 'inattentive' type of hyperactivity or ADHD. This was
important, as it is possible that these children do not have the same 'core' deficit as
hyperactive children showing hyperactive-impulsive symptoms.
Appropriateness of the screening procedure
We designed the screening procedure with the aim of obtaining a sample of
pervasively hyperactive children and a sample of non-hyperactive children. The
requirement for both twins in the control group to score below the hyperactivity
cut-off points was made with the group comparisons in mind: we wanted to
compare pervasively hyperactive children to non-hyperactive children. The
selection of the control group has no bearing on the DF extreme group analyses, as
only hyperactive children and their co-twins are included in these analyses. For the
model-fitting analyses the fact that the control group represented a 'super-normal'
group meant that it was not possible to examine genetic effects on performance on
the tasks in a general population sample.
Because of the screening procedure we adopted, we had to 'create' a sample
representative of the general population for the model-fitting analyses on the rating
scale data. Ideally the sample for these analyses would have been randomly
selected from the general population.
These limitations reflect the trade-off between benefits and costs in any study
design. The justification for the screening procedure was that the main focus of the
298
study was on the genetic effects on task performance (as mediators) within the
hyperactive twin pairs. The design of the study enabled an investigation of all the
hypotheses of the study.
8.8.3 Adequacy of measures
Reliability
The purpose of the test-retest reliability studies was to determine whether the
measures show adequate test-retest reliability. Most of the measures showed good
or adequate reliability, but the stop task variables of inhibition slope and stop
signal reaction time showed lower test-retest reliability. The implications of this for
the results was discussed in section 8.3.3. Worth noting in passing is that the
version of the stop task we used was the same as the version used in the study by
Oosterlaan and Sergeant (1998a; although they also included response re-
engagement as an additional condition). They did not report reliability data for the
measure.
Measurement of inhibition
Due to time limits on the testing session, we did not include other measures of
inhibition in the test battery apart from the stop task. With all its advantages (see
section 2.2.2), it does have a disadvantage too. Logan (1994) points out that 'the
disadvantage of the stop signal paradigm is that it reflects an extreme form of
control that may be different in important ways from more subtle forms of control'
(p. 191). Further, the stop task focuses on momentary inhibition, the ability to
suppress a particular response when it is signalled. It does not measure ongoing
inhibition, which some accounts (e.g. Barkley, 1997) view as important in
hyperactivity.
299
Inferences about state regulation
A rather different type of a limitation relates to inferences about activationleffort
state. That is, we did not design the study to test the state-regulation theory of
hyperactivity, but nonetheless interpret the stop task findings as supporting this
view (see below). This reflects at the same time both the joys and frustrations of
carrying out research: one never knows beforehand what the results will look like
and only after analysing the results will one realise which interesting research
questions had not even been asked. This is truly what research is all about. It is
about testing reasonable theories, but having the flexibility of mind to give up the
pet theories when the data support an alternative view. Whether the pattern of
responding on the stop task which was associated with hyperactivity in fact reflects
a non-optimal activation/effort state is discussed below.
8.9 Towards a more comprehensive account of hyperactivity
The previous sections discussed the findings as they relate to each separate
research issue. This section attempts to pull together the main findings from this
study, as well as those from previous research. The approach is novel in that it
combines the genetic and non-genetic findings, with the aim of taking us towards a
more comprehensive account of hyperactivity.
8.9.1 Cognitive impairment or a state-regulation deficit
The findings from the present study challenge the response inhibition deficit
hypothesis. Even if hyperactivity would be associated with a slower inhibitory
process, the findings could be interpreted as showing a general slowing down of
responses rather than a specific difficulty with response inhibition.
300
Although the present study was not specifically designed to test the state-regulation
theory (van der Meere, 1996), the data provided strongest support for this view.
An effort/activation problem could explain the variability in speed, the general
slowing down of responses and the high numbers of both commission and omission
errors made among the hyperactive children. Although van der Meere (1996)
emphasises the role of the effort and activation systems in particular, the arousal
system may well be involved too. As discussed in section 2.5.2, the important
neurotransmitters in the arousal system are noradrenaline and serotonin.
The description of hyperactivity as a state regulation problem not only fits well
with the present findings but also with the findings from previous research. The
state-regulation theory emphasises those aspects of ADHD which are most similar
to the personality theory concept of novelty seeking or sensation seeking. As
discussed in section 2.5.2, sensation seeking refers to characteristics such as
boredom susceptibility and thrill and experience seeking. The evidence for the
association between the dopamine D4 receptor gene polymorphisms and both
ADHD and novelty seeking was reviewed in section 3.4.5. Adults with ADHD
indeed score higher than other adults on a novelty seeking scale (Downey et al.,
1997). Section 2.2.3 reviewed the evidence that stimulant medication makes
hyperactive children's responses on the stop task faster, less variable in speed and
more accurate. Stimulant medication also increases the levels of epinephrine (which
are low in ADHD) in urine; injections of epinephrine to healthy adults lead to
faster and more efficient task performance (section 1.11.3).
Both the genetic and the non-genetic analyses suggest that the slow, variable and
inaccurate responding may indicate a 'core' deficit in hyperactivity at the
cognitive/motivational level. Could this pattern of responding in fact be due to a
cognitive deficit rather than a non-optimal activationleffort state? Lower general
cognitive ability cannot explain the results, but perhaps the core problem would be
a more specific cognitive deficit yet to be properly defined.
301

How could we investigate whether the pattern of responding would be due to a
cognitive deficit or an activation/effort problem? If it were the latter, under certain
circumstances hyperactive children should not be any more variable in their speed
of responding, any slower or more inaccurate than other children. The argument is
that they would perform as well as their peers, if their activation/effort state was
optimal. Following this argument, medication seems to optimise hyperactive
children's activation/effort state. Setting up a task which would optimise their
activation/effort state without the use of medication would be challenging, but not
impossible.
The concept of novelty seeking might provide some suggestions what the task
should be like - the children should perceive it as interesting, exciting and
challenging. Our experience from testing the hyperactive children and from
discussions with their parents suggests that hyperactive children often seem to be
trying hardest when playing a favourite computer game. For a laboratory task set
up as a computer game to fulfil the criteria above, it indeed should be as gripping
as commercial computer games. For example, a game stimulating driving might
provide an opportunity to collect reaction time data.
On the other hand, any school-like task involving sitting at a desk and performing
a task that an adult has requested may not be likely to optimise hyperactive
children's activation/effort state. An interesting alternative, although more
challenging to set up, would be a task involving physical activity. For example, the
task could involve an 'activity round': in a rather large room there would be
different tasks or activities within some distance from one another that the child
should perform. The child would be timed for finishing the whole round and
therefore should move as quickly as possible from one activity to another. Some of
the activities would be simply 'fun activities', whereas others would be reaction
time type of tasks on which hyperactive children usually exhibit their slow,
variable and inaccurate style of responding. The child would only perform each
task for a short time any given time, but would perhaps do the whole round a few
302
times, so that enough data could be collected. A chart could be put up on a wall
where the child's finishing times would be recorded, to further motivate the child.
Rewards or 'punishments' could be used to minimise 'unwanted' tendencies, such
as making errors on a reaction time task.
If hyperactive children would not show their typical pattern of responding on such
a task or some other task which would aim to optimise their activation/effort state,
this would suggest that this pattern of responding does not reflect a cognitive
deficit.
A complicating issue is that it may not be possible to optimise hyperactive
children's activation/effort state, if it in fact reflected 'learned helplessness'.
Aspects of task performance which appear 'motivational' could in fact have a
cognitive basis: if hyperactive children found certain tasks difficult because of a
cognitive deficit, they might give up even trying to do well on such tasks. Lack of
effort would then reflect a past history of failures. Longitudinal studies could be
designed to investigate this possibility.
The evidence from studies on the effects of medication make this a less plausible
explanation, however. Hyperactive children did not show their typical pattern of
responding on the stop task while on medication (Tannock et a!., 1995) and Milich
and colleagues (Milich et al., 1991) reported that hyperactive children showed
increased effort while on medication. These were immediate effects of medication
and therefore medication could not have reversed a cognitive deficit which would
then have led, in the long term, to more experiences of successes and to increased
effort. The studies by Douglas and colleagues (reviewed in section 2.5.2), using
reaction time paradigms, similarly do not support the cognitive deficit -hypothesis:
continuous positive feedback reduced the variability of reaction times and
decreased mean reaction times of hyperactive children.
303
Apart from response inhibition the other possible cognitive deficit associated with
hyperactivity that we specifically tested in this study was that of working memory
impairment. The inconsistency in hyperactive children's performance on working
memory measures in the present and previous studies is the first reason to question
the working memory impairment hypothesis. Another complicating issue is the
failure in the present study to find any group differences on working memory tasks
when IQ was controlled for. The genetic analyses showed that there were no
shared genetic effects on hyperactivity and performance on any of the working
memory tasks: working memory impairment cannot be a mediator of genetic
effects on hyperactivity.
Together with previous findings, the present results do not therefore provide strong
support for a working memory impairment as the core deficit in hyperactivity. It
seems more likely that when hyperactive children show poor performance on
working memory tasks, it is a consequence of something else. Because of the
hypothesised partial overlap between the constructs of working memory and
intelligence (especially fluid intelligence; Pennington, 1994), the explanation for an
association between hyperactivity and poor performance on working memory tasks
may be the same as that for an association between hyperactivity and lower IQ
scores (see section 8.6.1).
8.9.2 Delay aversion or a state-regulation deficit
How could we test between the predictions of the delay aversion and state-
regulation theories? This may be asking the wrong question. The data from the
present study provides support for both theories in differentiating between
hyperactive and control groups. The genetic data distinguished between the two
theories, however.
Whereas the activationleffort mechanism could be seen as carrying some of the
genetic effects on hyperactive behaviour, delay aversion seems to have an
304
environmental origin. The evidence suggests that delay aversion is a characteristic
of hyperactivity, but it is not a mediator of genetic effects on hyperactivity.
Hyperactivity is not purely genetic; delay aversion may relate to some of the
environmental factors which are involved.
8.9.3 A schematic representation of possible links
Figure 8.9.3 represents an attempt to present graphically the overall pattern of
findings from the present and previous studies on hyperactivity. In the figure, the
square with the black frame represents variables which were not measured in this
study. As we did not investigate the specific environmental factors which could
influence performance on the tasks, all environmental factors are lumped together.
This does not imply that the same environmental factors would necessarily
influence the various variables. The variables in the model represent specific
variables which have been associated with hyperactivity, either in the present or in
previous investigations. For example, the findings regarding neurotransmitters and
frontal-striatal 'dysfunction' in hyperactivity were reviewed in section 1.11.
What is the evidence for each of these links in the model? Let's consider each of
them separately.
link a -
Genes influence the functioning of neurotransmitters. For example, several
dopamine genes are known (see section 3.4.5).
305
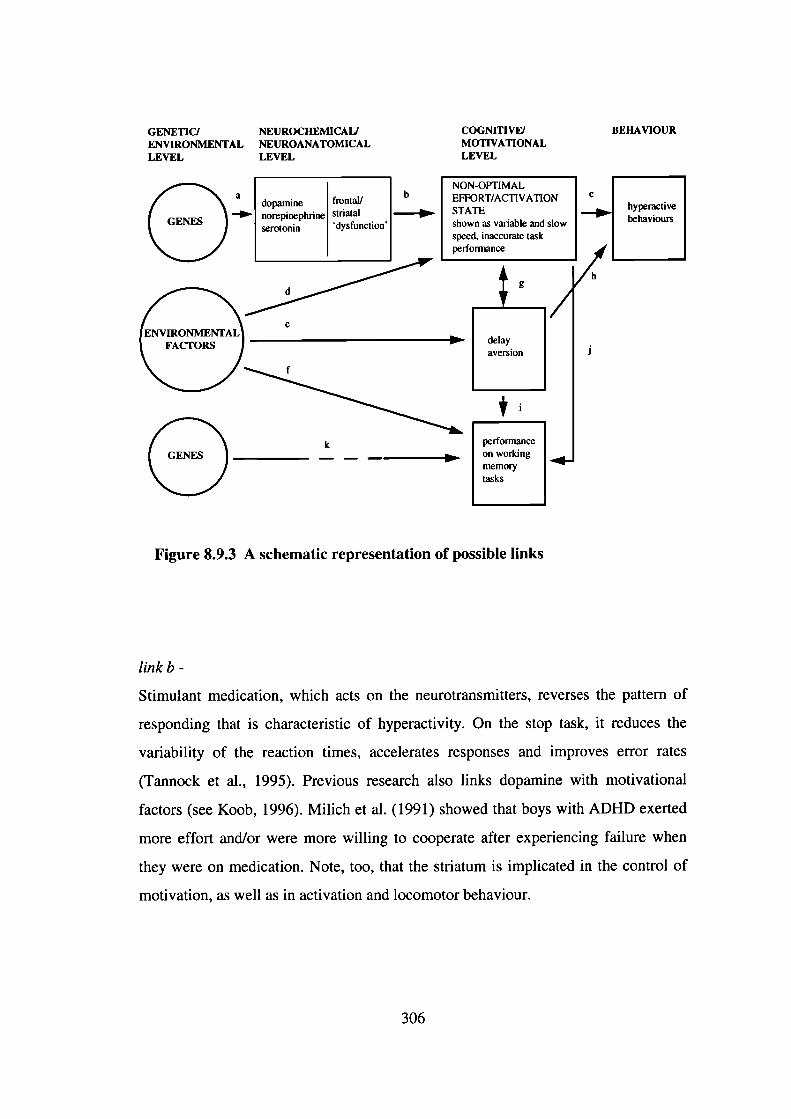
GENETICI NEUROCHEMICAI) COGNI11VFJ BEHAVIOURENVIRONMENTAL NEUROANATOMICAL MOTIVATIONALLEVEL LEVEL LEVEL
a bNON-OPTIMAL
norepinephrine striatal STATE iVedopamine frontal' EFFORT/ACTIVATION C
serotonin 'dysfunction' shown as variable and slow .....] behavioursspeed, inaccurate taskperformance
/,,1 [__],/h
NTALe_II
aversionFACTORS )
delay
(3k
performance I______________ ______________
on working ____memorytasks
I
Figure 8.9.3 A schematic representation of possible links
link b -
Stimulant medication, which acts on the neurotransmitters, reverses the pattern of
responding that is characteristic of hyperactivity. On the stop task, it reduces the
variability of the reaction times, accelerates responses and improves error rates
(Tannock et a!., 1995). Previous research also links dopamine with motivational
factors (see Koob, 1996). Milich et al. (1991) showed that boys with ADHD exerted
more effort and/or were more willing to cooperate after experiencing failure when
they were on medication. Note, too, that the striatum is implicated in the control of
motivation, as well as in activation and locomotor behaviour.
306
link ab -
This study showed that there were genetic effects on the hyperactive children's
speed and variability of speed, as well as on error rates on the stop task.
link c -
This study showed that this pattern of responding - slow, variable and inaccurate -
was strongly characteristic of hyperactive children. Previous research has obtained
similar findings. The reason why it is unlikely that this pattern of responding
would be a consequence rather than a cause of the behavioural phenotype was
discussed in section 8.3.4.
link ac -
The findings from this study confirmed the previous findings of genetic effects on
hyperactive behaviour.
link ab + c -
The main hypothesis of this thesis tested this idea of mediators between genes and
hyperactive behaviour. There was significant evidence for shared genetic effects on
extreme hyperactivity and the variability of speed. There was also some suggestion
of shared genetic effects with task accuracy and the speed of the inhibitory process.
links d, e andf -
This study showed that environmental factors influenced the hyperactive children's
performance on the delay aversion and working memory tasks. In fact, there was
no evidence of genetic effects on their performance on the delay aversion and
sentence span tasks. Interestingly the group differences on both the delay aversion
and the sentence span tasks were non-significant when conduct problems were
controlled for; conduct problems have been strongly associated with various
environmental factors (see section 4.1.3). Environmental factors also seemed to
have an effect, though less strong, on the stop task variables. As genetic factors do
not account for all of the variance in hyperactive behaviours, environmental factors
307
must play a role too. The links between environmental factors and the task
engagement and cognitive variables may be bi-directional, although there is no
direct evidence for this.
link g -
Our data suggested a moderate correlation between delay aversion and certain stop
task variables, in particular the variability of speed. There is no evidence regarding
the direction of causality. If the association exists because of a shared third
variable, such a variable does not seem to be shared genes, as there was no
evidence of genetic effects on performance on the delay aversion measure.
Sonuga-Barke (1996b) has suggested that delay aversion could explain the stop task
finding of slower stop signal reaction time even when the primary task reaction
time is controlled for. The argument is that the longer inter-stimulus interval for
the stop signal compared to the inter-stimulus interval for the go signal would
explain the particularly slow reaction times of hyperactive children to the stop
signal. It is not clear, however, why the time between the stop signals would count
as a 'delay' period, as the child continuously responds to stimuli appearing on the
screen (even if the go signals are different from the stop signals). The issue of
whether hyperactivity is in fact associated with a slower inhibitory process was
discussed in section 8.3.3.
link h -
The present and previous studies have shown delay aversion to be a characteristic
of hyperactivity. Sonuga-Barke (1994) argues that delay aversion causes the
behavioural symptoms of hyperactivity.
link i -
The present findings suggested a moderate correlation between the working
memory measures and the delay aversion scores. One could speculate that delay
aversion to some extent causes the poor performance on measures such as working
308
memory measures. If the association exists because of a shared third variable, such
a variable does not seem to be shared genes, as there was no evidence of genetic
effects on performance on the delay aversion measure.
link j-
Our data suggested a moderate correlation between the working memory measures
and certain stop task variables, again the variability of speed in particular.
Although there is no evidence regarding the direction of causality, one could
speculate that a non-optimal activationleffort state could be causally related to the
lower scores on working memory tasks.
link k -
Although there was no evidence of shared genetic effects on hyperactivity and any
of the working memory measures, there was nonetheless some evidence of genetic
effects on hyperactive children's performance on two of the working memory
measures (counting span and DRA after teaching).
This schematic representation of possible links within variables associated with
hyperactivity is undoubtedly a simplistic attempt to bring some of the research
findings together. For example, it does not explicitly consider the possible
heterogeneity in hyperactivity. Some of the 'causal' links are merely speculative.
However, it is useful in that it suggests directions for future research.
8.10 Challenges for future research
Many challenges remain for future research. First of all, the present findings
regarding genetic effects on task performance and the possible mediators of genetic
effects on hyperactivity should be replicated with a larger sample size. Genetic
analyses on hyperactivity should also further explore the issue of whether genetic
309
factors are equally important for extreme hyperactivity and for individual
differences in the dimension of hyperactivity. Studies should focus, too, on the
discrepancy between the group heritability estimates based on teacher ratings of
hyperactivity and those based on parent ratings.
An important theoretical challenge is to investigate whether the pattern of
responding characteristic of hyperactivity reflects a non-optimal activationleffort
state or whether it could reflect a cognitive deficit. Studies would also benefit from
a theoretical approach to the issue of lower IQ scores among hyperactive children,
rather than considering the IQ differences between groups only as an added
'nuisance'. Would stimulant medication improve hyperactive children's scores on
IQ tests?
If the findings of no genetic effects on performance on some of the tasks are
confirmed, this points to the need to explore environmental factors that may play a
role. This implies the delay aversion measures in particular, as these discriminate
well between hyperactive and control children. Studies could also explore the
possibility that the same environmental factors are related to the co-occurring
conduct problem symptomatology. Considering this from another angle, it would
be important to study the extent to which delay aversion is related to 'pure'
hyperactivity (i.e. hyperactivity not associated with conduct problems).
Investigations of the interrelationships between the various measures which are
associated with hyperactivity (for example, delay aversion and the variability of
speed) will hopefully inform about the direction of causality. An interesting
research question is whether stimulant medication would improve hyperactive
children's performance on delay aversion measures.
Studies using different methods - including those of molecular genetics, functional
imaging, response to medication - will undoubtedly continue to add to our
understanding of what has been labelled attention deficit hyperactivity disorder.
310
8.11 Practical implications
If hyperactive children perform poorly on some tasks because of a non-optimal
effort/activation state and not because of any cognitive deficit, this has important
practical implications. Neither teachers nor parents should accept that these
children cannot do school work and other tasks like other children, but they should
view these children nonetheless as needing a lot of attention from them. School
work and other tasks would need to be planned carefully, with the aim of keeping
the children actively engaged in doing something they would view as interesting.
As delay aversion is also characteristic of hyperactivity, avoiding any unnecessary
delays in order to keep the children motivated seems important too. Whereas all
children would be likely to benefit from an emphasis on such factors, hyperactive
children may be particularly likely to suffer in the long-term if no special
consideration is given to how best motivate them to work hard.
On the one hand, these suggestions may seem purely common sense. On the other
hand, the explanation of hyperactive children's performance in terms of an
effort/activation problem rather than a cognitive deficit, if valid, emphasises in
particular the need to change the attitudes of teachers and parents of these children.
The findings of genetic factors being implicated in the etiology of hyperactivity
could easily be misinterpreted; the 'if it is genetic, nothing can be done about it'
attitude is much too common. If hyperactivity can simply be described as the
extreme end on certain personality-type dimensions, this makes the genetic findings
easier to understand. A focus on the similarities between the concepts of
hyperactivity and novelty seeking may be helpful. For example, the 'novelty
seeking' tendency may explain why attempts to improve hyperactive children's
academic performance by isolating them and removing all extraneous stimuli have
proved unsuccessful (see Douglas, 1983).
A better understanding of the role of genetic factors in hyperactivity may also help
to understand why stimulant medication is often such an effective treatment. In the
311
past much too often the blame for any difficulties a child was experiencing was
placed on the shoulders of the parents. In the case of hyperactivity, a focus on
understanding the characteristics and tendencies the child is born with, and how
these then interact with the environment, is important.
This takes us back to the quote with which this thesis began. The parent, in a letter
to the Times Magazine, described what it is like living with a child who, in this
case, had received a diagnosis of ADD. The difficulties of these children are real
and often have serious consequences. Although we do not yet have answers to all
questions, we have come a long way since the early descriptions of 'moral
deficiency' or 'minimal brain damage' in our attempt to understand what causes
some children to behave in this restless and overactive manner, which often makes
everyday life a real challenge.
312
References
Achenbach, T.M. (1991a). Manual for the Child Behavior Checklist/4-18 and 1991profile. Burlington, VT: University of Vermont Department of Psychiatry.
Achenbach, T.M. (1991b). Manual for the Teacher's Report Form and 1991 profile.Burlington, VT: University of Vermont Department of Psychiatry.
Achenbach, T.M. (1993). Taxonomy and comorbidity of conduct problems: Evidencefrom empirically based approaches. Development and Psychopathology, 5, 51-64.
Achenbach, T.M., McConaughy, S.H. & Howell, C.T. (1987). Child/adolescentbehavioral and emotional problems: Implications of cross-informant correlations forsituational specificity. Psychological Bulletin, 101, 213-232.
Alberts-Corush, J., Firestone, P. & Goodman, J.T. (1986). Attention and impulsivitycharacteristics of the biological and adoptive parents of hyperactive and normal controlchildren. American Journal of Orthopsychiatry, 56, 413-423.
Aman, C.J., Roberts, R.J. & Pennington, B.F. (in press). A neuropsychologicalexamination of the underlying deficit in ADHD: the frontal lobe vs. right parietal lobetheories. Developmental Psychology.
American Psychiatric Association (1980). Diagnostic and statistical manual of mental
disorders (3rd ed., DSM-III). Washington, DC: American Psychiatric Association.
American Psychiatric Association (1987). Diagnostic and statistical manual of mental
disorders (3rd, revised ed., DSM-III-R). Washington, DC: American PsychiatricAssociation.
American Psychiatric Association (1994). Diagnostic and statistical manual of mental
disorders (4th ed., DSM-IV). Washington, DC: American Psychiatric Association.
Anderson, J.C., Williams, S., McGee, R. & Silva, P.A. (1987). DSM-III disorders inpreadolescent children: Prevalence in a large sample from the general population.Archives of General Psychiatry, 44, 69-76.
313
Baddeley, A., Della Sala, S., Gray, C., Papagno, C. & Spinnier, H. (in press).Testing central executive functioning with a pencil-and-paper test. In P. Rabbitt (Ed.),Methodology offrontal and executive functions. Hove: LEA.
Barkley, R.A. (1989). The problem of stimulus control and rule-governed behavior inchildren with attention deficit disorder with hyperactivity. In L.M. Bloomingdale & J.Swanson (Eds.), Attention deficit disorder (Vol. 4, pp. 203-228). Oxford, UK:Pergamon.
Barkley, R.A. (1994). Impaired delayed responding: A unified theory of attention-deficit hyperactivity disorder. In D.K. Routh (Ed.), Disruptive behavior disorders inchildhood (pp. 11-57). New York: Plenum Press.
Barkley, R.A. (1996). Linkages between attention and executive functions. In G.R.Lyon & N.A. Krasnegor (Eds.), Attention, memory, and executive function (pp. 307-325). Baltimore: Paul H. Brookes Publishing Co.
Barkley, R. A. (1997). Behavioral inhibition, sustained attention, and executivefunctions: Constructing a unifying theory of ADHD. Psychological Bulletin, 121, 65-94.
Barkley, R.A., DuPaul, G.J. & McMurray, M.B. (1990). Attention deficit disorderwith and without hyperactivity: Clinical response to three dose levels ofmethylphenidate. Pediatrics, 87, 519-531.
Barkley, R.A., Fischer, M., Edeibrock, C. S. & Smallish, L. (1990). The adolescentoutcome of hyperactive children diagnosed by research criteria: I. An 8-yearprospective follow-up study. Journal of the American Academy of Child andAdolescent Psychiatry, 29, 546-557.
Barkley, R.A., Karlsson, J., Strzelecki, E. & Murphy, J. (1984). Effects of age andRitalin dosage on the mother-child interactions of hyperactive children. Journal ofConsulting and Clinical Psychology, 52, 750-758.
Bauermeister, J.J., Alegria, M., Bird, H.R., Rubio-Stipec, M. & Canino, G. (1992).Are attentional-hyperactivity deficits unidiniensional or multidimensional syndromes?Empirical findings from a community survey. Journal of the American Academy ofChild and Adolescent Psychiatry, 31, 423-431.
Baumgaertel, A., Wolraich, M.L. & Dietrich, M. (1995). Comparison of diagnosticcriteria for attention deficit disorders in a German elementary school sample. Journalof the American Academy of Child and Adolescent Psychiatry, 34, 629-638.
314
Baumgardner, T.L., Singer, H.S., Denckla, M.B., Rubin, M.A., Abrams, M.T.,Colli, M.J. & Reiss, A.L. (1996). Corpus callosum morphology in children withTourette syndrome and attention deficit hyperactivity disorder. Neurology, 47, 477-482.
Benjamin, J., Li, L., Patterson, C., Greenberg, B.D., Murphy, D.L. & Hamer, D.H.(1996). Population and familial association between the D4 dopamine receptor geneand measures of Novelty Seeking. Nature Genetics, 12, 8 1-84.
Bentler, P.M. (1995). EQS structural equations program manual. Encino, CA:Multivariate Software Inc.
Berry, C.A., Shaywitz, S.E. & Shaywitz, B.A. (1985). Girls with attention deficitdisorder: A silent minority? A report on behavioral and cognitive characteristics.Pediatrics, 76, 80 1-809.
Biederman, J., Faraone, S.V., Doyle, A., Lehman, B.K., Kraus, I., Perrin, J. &Tsuang, M.T. (1993). Convergence on the Child Behavior Checklist with structuredinterview-based psychiatric diagnoses of ADHD children with and withoutcomorbidity. Journal of Child P3ychology and Psychiatry, 34, 1241-1251.
Biederman, J., Faraone, S.V., Keenan, K., Benjamin, J., Krifcher, B., Moore, C.,Sprich-Buckminster, S., Ugaglia, K., Jellinek, M.S., Steingard, R., Spencer, 1.,Norman, D., Kolodny, R., Kraus, I., Perrin, J., Keller, M.B. & Tsuang, M.T.(1992). Further evidence for family-genetic risk factors in attention deficithyperactivity disorder. Patterns of comorbidity in probands and relatives ofpsychiatrically and pediatrically referred samples. Archives of General Psychiatry, 49,728-738.
Biederman, J., Faraone, S.V., Keenan, K., Knee, D. & Tsuang, MT. (1990).Family-genetic and psychosocial risk factors in DSM-III attention deficit disorder.Journal of the American Academy of Child and Adolescent Psychiatry, 29, 526-533.
Biederman, J., Faraone, S.V., Keenan, K., Steingard, R., Spencer & Tsuang, M.T.(1991). Familial association between attention deficit disorder and anxiety disorders.American Journal of Psychiatiy, 148, 25 1-256.
Biederman, J., Faraone, S.V., Weber, W., Russell, R.L., Rater, M. & Park, K.S.(1997). Correspondence between DSM-III-R and DSM-IV attention-deficit/hyperactivity disorder. Journal of the American Academy of Child andAdolescent Psychiatry, 36, 1682-1687.
315
Biederman, J., Milberger, S., Faraone, S.V., Kiely, K., Guite, J., Mick, E., Ablon,S., Warburton, R. & Reed, E. (1995). Family-environment risk factors for attention-deficit hyperactivity disorder: A test of Rutter's indicators of adversity. Archives of
General Psychiatry, 52, 464-470.
Biederman, J., Munir, K. & Knee, D. (1987). Conduct and oppositional disorder inclinically referred children with attention deficit disorder: A controlled family study.Journal of the American Academy of Child and Adolescent Psychiatry, 26, 724-727.
Biederman, J., Munir, K., Knee, D., Habelow, W., Armentano, M., Autor, S.,Hoge, S.K. & Waternaux, C. (1986). A family study of patients with Attention DeficitDisorder and normal controls. Journal of Psychiatric Research, 20, 263-274.
Bird, H.R., Canino, G. & Rubio-Stipec, M. (1988). Estimates of the prevalence ofchildhood maladjustment in a community survey in Puerto Rico. Archives of General
Psychiatry, 45, 1120-1126.
Bird, H.R., Gould, M.S. & Staghezza, B.M. (1993). Patterns of diagnosticcomorbidity in a community sample of children aged 9 through 16 years. Journal of
the American Academy of Child and Adolescent Psychiatry, 32, 361-368.
Blum, K., Sheridan, P.J., Wood, R.C., Braverman, E.R., Chen, T.J.H., Cull, J.G. &Comings, D.E. (1996). The D 2 dopamine receptor gene as a determinant of rewarddeficiency syndrome. Journal of the Royal Society of Medicine, 89, 396-400.
Bohman, M. (1996). Predisposition to criminality: Swedish adoption studies inretrospect. Ciba Foundation Symposium, 194, 99-114.
Bobman, M. & Sigvardsson, 5. (1980). A prospective, longitudinal study of childrenregistered for adoption. A 15-year follow-up. Acta Psychiatrica Scandinavica, 61,339-355.
Bonnelykke, B., Hauge, M., Hoim, N., Kristoffersen, H. & Gurtler, H. (1989).Evaluation of zygosity diagnosis in twin pairs below age seven by means of a mailedquestionnaire. Acta Geneticae Medicae et Gemellologiae, 38, 305-313.
Botting, N., Powls, A., Cooke, R.W.I. & Marlow, N. (1997). Attention deficithyperactivity disorders and other psychiatric outcomes in very low birthweightchildren at 12 years. Journal of Child Psychology and Psychiatry, 38, 931-941.
Boucugnani, L.L. & Jones, R.W. (1989). Behaviors analogous to frontal lobedysfunction in children with attention deficit hyperactivity disorder. Archives ofClinical Neuropsychology, 4, 161-173.
316
Boyd, J.H., Burke, J.D., Gruenberg, E., Hoizer, C.E., Rae, D.S., George, L.K.,Karno, M., Stoltzman, R., McEvoy, L. & Nestadt, G. (1984). Exclusion criteria ofDSM-III. Archives of General Psychiatry, 41, 93 8-989.
Breen, M.J. (1989). Cognitive and behavioral differences in ADHD boys and girls.Journal of Child Psychology and Psychiatry, 30, 711-716.
British Psychological Society (1996). Attention deficit hyperactivity disorder (ADHD):A psychological response to an evolving concept. Report of a Working Party of theBritish Psychological Society. Leicester: The British Psychological Society.
Buitelaar, J.K. & van Engeland, H. (1996). Epidemiological approaches. In S.Sandberg (Ed.), Hyperactivity disorders of childhood (pp. 26-68). Cambridge:Cambridge University Press.
Cantwell, D.P. (1972). Psychiatric illness in the families of hyperactive children.Archives of General Psychiatry, 414-417.
Carison, N.R. (1986). Physiology of behavior (3rd ed.). Newton: Allyn and Bacon.
Caron, C. & Rutter, M. (1991). Comorbidity in child psychopathology: Concepts,issues and research strategies. Journal of Child Psychology and Psychiatry, 32, 1063-1080.
Carpenter, C.J. & Gold, J.M. (1994). Prefrontal functioning in schizophrenia. Paperpresented at the International Neuropsychological Society Annual Meeting, Seattle.February 1994.
Carte, E.T., Nigg, J.T. & Hinshaw, S.P. (1996). Neuropsychological functioning,motor speed, and language processing in boys with and without ADHD. Journal ofAbnormal Child Psychology, 24, 481-498.
Carter, C.M., Urbanowicz, M., Hemsley, R., Mantilla, L., Strobel, S., Graham, P.J.& Taylor, E. (1993). Effects of a few food diet in attention deficit disorder. Archivesof Disease in Childhood, 69, 564-568.
Case, R., Kurland, D.M. & Goldberg, J. (1982). Operational efficiency and thegrowth of short-term memory span. Journal of Experimental Child Psychology, 33,386-404.
317
Casey, B.J., Castellanos, F.X., Giedd, J.N., Marsh, W.L., Hamburger, S.D.,Schubert, A.B., Vauss, Y.C., Vaituzis, A.C., Dickstein, D.P., Sarfatti, SE. &Rapoport, J.L. (1997). Implication of right frontostriatal circuitry in responseinhibition and attention-deficit/hyperactivity disorder. Journal of the AmericanAcademy of Child and Adolescent Psychiatry, 36, 374-383.
Castellanos, F.X., Giedd, J.N., Eckburg, P., Marsh, W.L., Vaituzis, A.C., Kaysen,D., Hamburger, S.D. & Rapoport, J.L. (1994). Quantitative morphology of thecaudate nucleus in attention deficit hyperactivity disorder. American Journal of
Psychiatry, 151, 1791-1796.
Castellanos, F.X., Giedd, J.N., Marsh, W.L., Hamburger, S.D., Vaituzis, A.C.,Dickstein, D.P., Sarfatti, S.E., Vauss, Y.C., Snell, J.W., Lange, N., Kaysen, D.,Krain, A.L., Ritchie, G.F., Rajapakse, J.C. & Rapoport, J.L. (1996). Quantitativebrain magnetic resonance imaging in attention-deficit/hyperactivity disorder. Archives
of General Psychiatry, 53, 607-6 16.
Chabot, R.J. & Serfontein, G. (1996). Quantitative electroencephalographic profiles ofchildren with attention deficit disorder. Biological Psychiatry, 40, 95 1-963.
Chelune, G.J., Ferguson, W., Koon, R. & Dickey, T.O. (1986). Frontal lobedisinhibition in attention deficit disorder. Child Psychiatry and Human Development,16, 221-234.
Chess, S. (1960). Diagnosis and treatment of the hyperactive child. New York State
Journal of Medicine, 60, 2379-2385.
Cohen, D.J., Dibble, E., Grawe, J.M. & Pollin, W. (1973). Separating identical fromfraternal twins. Archives of General Psychiatry, 29, 465-469.
Cohen, J. (1988). Statistical power analysis for the behavioral sciences. 2nd ed.Hilisdale, New Jersey: Lawrence Eribaum Associates.
Cohen, J. (1992). A power primer. Psychological Bulletin, 112, 155-159.
Cohen, J.D. & Servan-Schreiber, D. (1992). Context, cortex, and dopamine: aconnectionist approach to behavior and biology in schizophrenia. Psychological
Review, 99, 45-77.
Cohen, N.J., Weiss, G. & Mide, K. (1972). Cognitive styles in adolescents previouslydiagnosed as hyperactive. Journal of Child Psychology and Psychiatry, 13, 203-209.
318
Comings, D.E., Comings, B.G., Muhieman, D., Dietz, G., Shahbahrami, B., Tast,D., Knell, E. et a!. (1991). The dopamine D2 receptor locus as a modifying gene inneuropsychiatric disorders. Journal of the American Medical Association, 266, 1793-1800.
Comings, D.E., Wu, S., Chiu, C., Ring, R.H., Gade, R., Ahn, C., MacMurray,J.P., Dietz, G. & Muhieman, D. (1996). Polygenic inheritance of Tourette Syndrome,stuttering, Attention Deficit Hyperactivity, Conduct, and Oppositional DefiantDisorder: The additive and subtractive effect of the three dopaminergic genes - DRD2,DBH, and DAli. American Journal of Medical Genetics (Neuropsychiatric Genetics),67, 264-288.
Conners, C.K. (1969). A teacher rating scale for use in drug studies with children.American Journal of Psychiatry, 126, 884-888.
Conners, C.K. (1989). Conners' Rating Scales Manual. Toronto, Canada: Multi-Health Systems.
Cook, E.H.J., Stein, M.A., Krasowski, M.D., Cox, N.J., Olkon, D.M., Kieffer, J.E.& Leventhal, B.L. (1995). Association of attention-deficit disorder and the dopaminetransporter gene. American Journal of Human Genetics, 56, 993-998.
Corkum, P.V. & Siegel, L.S. (1993). Is the continuous performance task a valuableresearch tool for use with children with attention-deficit hyperactivity disorder?Journal of Child Psychology and Psychiatry, 34, 1217-1239.
Craddock, N. & Owen, M.J. (1996). Modern molecular genetic approaches topsychiatric disease. British Medical Bulletin, 52, 434-452.
Daneman, M. & Carpenter, P.A. (1980). Individual differences in working memoryand reading. Journal of Verbal Learning and Verbal Behavior, 19, 450-466.
Daugherty, T.K., Quay, H.C. & Ramos, L. (1993). Response perseveration,inhibitory control, and central dopaminergic activity in childhood behavior disorders.The Journal of Genetic Psychology, 154, 177-188.
DeFries, J.C. & Fulker, D.W. (1985). Multiple regression analysis of twin data.Behavior Genetics, 15, 467-473.
DeFries, J.C. & Fulker, D.W. (1988). Multiple regression analysis of twin data:Etiology of deviant scores versus individual differences. Acta Geneticae Medicae etGemellolologiae, 37, 205-2 16.
319
De Jong, R., Coles, M.G.H. & Logan, G.D. (1995). Strategies and mechanisms innonselective and selective inhibitory motor control. Journal of ExperimentalPsychology, 21, 498-511.
Deutsch, C.K. & Kinsbourne, M. (1991). Genetics and biochemistry in attentiondeficit disorder. In M. Lewis & S.M. Miller (Eds.), Handbook of developmentalpsychopathology (pp. 93-107). New York: Plenum Press.
Deutsch, C.K., Swanson, J.M., Bruell, J.H., Cantwell, D.P., Weinberg, F. & Baren,M. (1982). Overrepresentation of adoptees in children with the attention deficitdisorder. Behavior Genetics, 12, 231-238.
Dilalla, L.F. & Gottesman, 1.1. (1989). Heterogeneity of causes for delinquency andcriminality: Lifespan perspectives. Development and Psychopathology, 1, 339-349.
Douglas, V.1. (1983). Attentional and cognitive problems. In M. Rutter (Ed.),Developmental neuropsychiatly (pp. 280-329). New York: The Guildford Press.
Douglas, V.!. & Parry, P.A. (1983). Effects of reward on delayed reaction time taskperformance of hyperactive children. Journal of Abnormal Psychology, 11, 3 13-326.
Douglas, V.!. & Parry, P.A. (1994). Effects of reward and nonreward on frustrationand attention in attention deficit disorder. Journal of Abnormal Child Psychology, 22,281-302.
Downey, K.K., Stelson, F.W., Pomerleau, O.F. & Giordani, B. (1997). Adultattention deficit hyperactivity disorder: psychological test profiles in a clinicalpopulation. Journal of Nervous and Mental Disease, 185, 32-3 8.
Draeger, S., Prior, M. & Sanson, A. (1986). Visual and auditory attentionperformance in hyperactive children: competence or compliance. Journal of AbnormalChild Psychology, 14, 411-424.
Duffy, F.!-!. & McAnulty, G. (1990). Neurophysiological heterogeneity and thedefinition of dyslexia: preliminary evidence for plasticity. Neuropsychologia, 28, 555-571.
Dunn, G., Everitt, B. & Pickles, A. (1993). Modelling covariances and latentvariables using EQS. London: Chapman & Hall.
Dykman, R.A. & Ackerman, P.T. (1991). Attention deficit disorder and specificreading disability: separate but often overlapping disorders. Journal of LearningDisabilities, 24, 96-103.
320
Earls, F. (1994). Oppositional-defiant and conduct disorders. In M. Rutter, E. Taylor,& L. Hersov (Eds.), Child and adolescent psychiatry: Modern approaches (pp. 308-329). Oxford: Blackwell Scientific Publications.
Eaves, L.J., Silberg, J.L., Meyer, J.M., Maes, H.H., Simonoff, E., Pickles, A.,Rutter, M., Neale, M.C., Reynolds, C.A., Erikson, M.T., Heath, A.C., Loeber, R.,Truett, K.R. & Hewitt, J. (1997). Genetics and developmental psychopathology: 2.The main effects of genes and environment on behavioral problems in the VirginiaTwin Study of Adolescent Behavioral Development. Journal of Child Psychology andPsychiatry, 38, 965-980.
Ebstein, R.P., Nemanov, L., Klotz, I., Gritsenko, I. & Belmaker, R.H. (1997).Additional evidence for an association between the dopamine D4 receptor (D4DR)exon III repeat polymorphism and the human personality trait of Novelty Seeking.Molecular Psychiatry, 2, 472-477.
Ebstein, R.P., Novick, 0., Umansky, R., Priel, B., Osher, Y., Blame, D., Bennett,E.R., Nemanov, L., Katz, M. & Belmaker, R.H. (1996). Dopamine D4 receptor(D4DR) exon III polymorphism associated with the human personality trait of NoveltySeeking. Nature Genetics, 12, 78-80.
Edelbrock, C., Greenbaum, R. & Conover, N.C. (1985). Reliability and concurrentrelations between the teacher version of the Child Behavior Profile and Conners'Revised Teacher Rating Scale. Journal of Abnormal Child Psychology, 13, 295-303.
Edelbrock, C., Rende, R., Plomin, R. & Thompson, L.A. (1995). A twin study ofcompetence and problem behavior in childhood and early adolescence. Journal ofChild Psychology and Psychiatry, 36, 775-785.
Egger, J., Carter, C.M., Graham, P.J., Gumley, D. & Soothill, J.F. (1985).Controlled trial of oligoantigenic treatment in the hyperkinetic syndrome. Lancet, 1,540-545.
Eiraldi, R.B., Power, T.J. & Maguth Nezu, C. (1997). Patterns of comorbidityassociated with subtypes of attention-deficit/hyperactivity disorder among 6- to 12-year-old children. Journal of the American Academy of Child and AdolescentPsychiatry, 36, 503-5 14.
Elia, J., Gulotta, C., Rose, S.R., Mann, G. & Rapoport, J. (1994). Thyroid functionand attention deficit hyperactivity disorder. Journal of the American Academy of Childand Adolescent Psychiatry, 33, 169-172.
Erford, B.T. (1996). Analysis of the Conners' Teacher Rating Scale - 28 (CTRS-28).Assessment, 3, 27-36.
321
Faraone, S.V., Biederman, J., Chen, W.J., Krifcher, B., Keenan, K., Moore, C.,Sprich, S. & Tsuang, M.T. (1992). Segregation analysis of attention deficithyperactivity disorder. Psychiatric Genetics, 2, 257-275.
Faraone, S.V., Biederman, J., Jetton, J.G. & Tsuang, M.T. (1997). Attention deficitdisorder and conduct disorder: Longitudinal evidence for a familial subtype.Psychological Medicine, 27, 291-300.
Faraone, S.V., Biederman, J., Keenan, K. & Tsuang, M.T. (1991a). A family-geneticstudy of girls with DSM-III attention deficit disorder. American Journal of Psychiatry,148, 112-117.
Faraone, S.V., Biederman, J., Keenan, K. & Tsuang, M.T. (1991b). Separation ofDSM-llI attention deficit disorder and conduct disorder: Evidence from a family-genetic study of American child psychiatric patients. Psychological Medicine, 21, 109-121.
Feingold, B.F. (1975a). Hyperkinesis and learning disabilities linked to artificial foodflavors and colors. American Journal of Nursing, 75, 797-803.
Feingold, B.F. (1975b). W"hy your child is hyperactive. New York: Random House.
Fergusson, D.M. & Horwood, L.J. (1992). Attention deficit and reading achievement.Journal of Child Psychology and Psychiatry, 33, 375-385.
Fergusson, D.M. & Horwood, L.J. (1993). The structure, stability and correlations ofthe trait components of conduct disorder, attention deficit and anxiety/withdrawalreports. Journal of Child Psychology and Psychiatry, 34, 749-766.
Fergusson, D.M., Horwood, L.J. & Lloyd, M. (1991). Confirmatory factor models ofattention deficit and conduct disorder. Journal of Child Psychology and Psychiatry,32, 257-274.
Filipek, P.A., Semrud-Clikeman, M., Steingard, R.J., Renshaw, P.F., Kennedy,D.N. & Biederman, J. (1997). Volumetric MRI analysis comparing subjects havingattention-deficit hyperactivity disorder with normal controls. Neurology, 589-601.
Fischer, M., Barkley, R.A., Edelbrock, C.S. & Smallish, L. (1990). The adolescentoutcome of hyperactive children diagnosed by research criteria: II. Academic,attentional and neuropsychological status. Journal of Consulting and ClinicalPsychology, 58, 580-588.
322
Flament, M.F., Whitaker, A., Rapaport, J.L., Davies, M., Zaremba Berg, C.,Kalikow, K., Sceery, W. & Shaffer, D. (1988). Obsessive compulsive disorder inadolescence: an epidemiological study. Journal of the American Academy of ChildPsychiatry, 27, 764-771.
Freedman, M. & Oscar-Berman, M. (1986). Bilateral frontal lobe disease andselective delayed-response deficits in humans. Behavioral Neuroscience, 100, 337-342.
Frick, P.J. (1994). Family dysfunction and the disruptive behavior disorders: Areview of recent empirical findings. In T.H. 011endick & R.J. Prinz (Eds.), Advancesin Clinical Child Psychology (pp. 203-226). New York: Plenum Press.
Frick, P.J., Kamphaus, R.W., Lahey, B.B., Loeber, R., Christ, M.A., Hart, E.L. &Tannenbaum, L.E. (1991). Academic underachievement and the disruptive behaviordisorders. Journal of Consulting and Clinical Psychology, 59, 289-294.
Frick, P.J., Lahey, B.B., Christ, M.G., Loeber, R. & Green, S. (1991). History ofchildhood behavior problems in biological relatives of boys with attention-deficithyperactivity disorder and conduct disorder. Journal of Clinical Child Psychology, 20,445-451.
Fuster, J.M. (1989). The prefrontal cortex: anatomy, physiology and neuropsychologyof the frontal lobe (2nd ed.). New York: Raven.
Gill, M., Daly, G., Heron, S., Hawi, Z. & Fitzgerald, M. (1997). Confirmation ofassociation between attention deficit hyperactivity disorder and a dopamine transporterpolymorphism. Molecular Psychiatry, 2, 311-313.
Gillis, J.J., Gilger, J.W., Pennington, B.F. & DeFries, J.C. (1992). Attention deficitdisorder in reading-disabled twins: Evidence for a genetic etiology. Journal of
Abnormal Child Psychology, 20, 303-3 15.
Gittelman, R., Mannuzza, S., Shenker, R. & Bonagura, N. (1985). Hyperactive boysalmost grown up. Archives of General Psychiatry, 42, 937-947.
Gjone, H., Stevenson, J. & Sundet, J.M. (1996). Genetic influence on parent-reportedattention-related problems in a Norwegian general population twin sample. Journal of
the American Academy of Child and Adolescent Psychiatry, 35, 588-596.
Gold, J.M., Faith Berman, K., Randolph, C., Goldberg, I.E. & Weinberger, D.R.(1996). PET validation of a novel prefrontal task: Delayed response alternation.Neuropsychology, 10, 3-10.
323
Goidman-Rakic, P.S. (1987a). Circuitry of primate prefrontal cortex and regulation ofbehavior by representational memory. In F. Plum (Ed.), Handbook of physiology. Thenervous system: higher functions of the brain. Bethesda, MD: American PhysiologyAssociation.
Goldman-Rakic, P.S. (1987b). Development of cortical circuitry and cognitivefunction. Child Development, 58, 601-622.
Goidman-Rakic, P.S. (1992). Dopamine mediated mechanisms of the prefrontalcortex. Seminars in Neuroscience, 4, 149-159.
Goodman, R. & Stevenson, J. (1989a). A twin study of hyperactivity - I. Anexamination of hyperactivity scores and categories derived from Rutter Teacher andParent Questionnaires. Journal of Child Psychology and Psychiatry, 30, 67 1-689.
Goodman, R. & Stevenson, J. (1989b). A twin study of hyperactivity - II. Theaetiological role of genes, family relationships and perinatal adversity. Journal of
Child Psychology and Psychiatry, 30, 69 1-709.
Goodman, R., Simonoff, E. & Stevenson, J. (1995). The impact of child IQ, parentIQ and sibling IQ on child behavioural deviance scores. Journal of Child Psychologyand Psychiatry, 36, 409-425.
Goodyear, P. & Hynd, G.W. (1992). Attention-deficit disorder with (ADD/H) andwithout (ADD/WO) hyperactivity: Behavioral and neuropsychological differentiation.Journal of Clinical Child Psychology, 21, 273-305.
Gorenstein, E.E., Mammato, C.A. & Sandy, J.M. (1989). Performance of inattentive-overactive children on selected measures of prefrontal-type function. Journal ofClinical Psychology, 45, 6 19-632.
Goyette, C.H., Conners, C.K. & Ulrich, R.F. (1978). Normative data on revisedConners parent and teacher rating scales. Journal of Abnormal Child Psychology, 6,221-236.
Graham, P.J. (1991). Child psychiatry: A developmental approach (2nd ed.). NewYork: Oxford University Press.
Gray, J.A. (1982). The neuropsychology of anxiety: an enquiry into the functions ofthe septo-hippocampal system. New York: Oxford University Press.
Gray, J.A. (1987). The psychology of fear and stress. New York: CambridgeUniversity Press.
324
Grodzinsky, G.M. & Diamond, R. (1992). Frontal lobe functioning in boys withattention deficit hyperactivity disorder. Developmental Neuropsychology, 8, 427-445.
Guilford, J.P. (1965). Fundamental statistics in psychology and education (4th ed.).New York: McGraw-Hill.
Halperin, J.M., Matier, K., Bedi, G., Sharma, V. & Newcorn, J.H. (1992).Specificity of inattention, impulsivity, and hyperactivity to the diagnosis of attention-deficit hyperactivity disorder. Journal of the American Academy of Child andAdolescent Psychiatry, 31, 190-196.
Hart, E.L., Lahey, B.B., Loeber, R., Applegate, B. & Frick, P.J. (1995).Developmental change in attention deficit hyperactivity disorder in boys: A four-yearlongitudinal study. Journal of Abnormal Child Psychology, 23, 729-749.
Hauser, P., Zametkin, A., Martinez, P., Vitiello, B., Matochik, J.A., Mixson, A.J.& Weinstraub, B.D. (1993). Attention deficit hyperactivity disorder in people withgeneralized resistance to thyroid hormone. The New England Journal of Medicine,328, 997-1001.
Hechtman, L. (1994). Genetic and neurobiological aspects of attention deficithyperactive disorder: A review. Journal of Psychiatry & Neuroscience, 3, 193-201.
Heptinstall, E. & Taylor, E. (1996). Sex differences and their significance. In S.Sandberg (Ed.), Hyperactivity disorders of childhood (pp. 329-349). Cambridge:Cambridge University Press.
Hess, E.J., Collins, K.A. & Wilson, M.C. (1996). Mouse model of hyperkinesisimplicates SNAP-25 in behavioral regulation. The Journal of Neuroscience, 16, 3104-3111.
Hess, E.J., Rogan, P.K., Domoto, M., Tinker, D.E., Ladda, R.L. & Ramer, J.C.(1995). Absence of linkage of apparently single gene mediated ADHD with the humansyntenic region of the mouse mutant Coloboma. American Journal of MedicalGenetics (Neuropsychiatric Genetics), 60, 573-579.
Hettema, J.M., Neale, M.C. & Kendler, K.S. (1995). Physical similarity and theequal-environment assumption in twin studies of psychiatric disorders. Behavior
Genetics, 25, 327-335.
Hinshaw, S.P. (1992). Externalizing behavior problems and academicunderachievement in childhood and adolescence: Causal relationships and underlyingmechanisms. Psychological Bulletin, 111, 127-155.
325
Hinshaw, S.P. (1994). Attention deficits and hyperactivity in children. ThousandOaks: Sage Publications.
Hinshaw, S.P., Lahey, B.B. & Hart, E.L. (1993). Issues of taxonomy andcomorbidity in the development of conduct disorder. Development andPsychopathology, 5, 31-49.
Hohnen, B. & Stevenson, J. (in press). The structure of genetic influences on generalcognitive, language, phonological and reading abilities. Developmental Psychology.
Hopkins, J., Perlman, T., Hechtman, L. & Weiss, G. (1979). Cognitive style inadults originally diagnosed as hyperactive. Journal of Child Psychology andPsychiatry, 20, 209-216.
Hunter, J., Yule, W., Urbanowicz, M.A. & Lansdown, R. (1989). Cross-validationof short forms of the WISC-R in twin British samples. British Journal of EducationalPsychology, 59, 366-371.
Hurt, J. & Naglieri, J.A. (1992). Performance of delinquent and nondelinquent maleson planning, attention, simultaneous and successive cognitive processing tasks.Journal of Clinical Psychology, 48, 120-128.
Hynd, G.W., Hem, K.L., Novey, E.S., Eliopulos, P., Marshall, R., Gonzalez, J.J. &Voeller, K.K. (1993). Attention-deficit hyperactivity disorder and asymmetry of thecaudate nucleus. Journal of Child Neurology, 8, 339-347.
James, A. & Taylor, E.A. (1990). Sex differences in the hyperkinetic syndrome ofchildhood. Journal of Child Psychology and Psychiatry, 31, 437-446.
Jennings, J.R., van der Molen, M.W., Peiham, W., Debski, K. & Hoza, B. (1997).Inhibition in boys with attention deficit hyperactivity disorder as indexed by heart ratechange. Developmental Psychology, 33, 308-318.
John, E.R., Prichep, L.S., Ahn, H., Easton, P., Fridman, J. & Kaye, H. (1983).Neurometric evaluation of cognitive dysfunctions and neurological disorders inchildren. Progress in Neurobiology, 21, 239-290.
Jönsson, E.G., Nöthen, M.M., Gustavsson, P., Neidt, H., Brené, S., Tylec, A.,Propping, P. & Sedvall, G.C. (1997). Lack of evidence for allelic association betweenpersonality traits and the dopamine D4 receptor gene polymorphisms. AmericanJournal of Psychiatry, 154, 697-699.
Kado, S. & Takagi, R. (1996). Biological aspects. In S. Sandberg (Ed.), Hyperactivitydisorders of childhood. Cambridge: Cambridge University Press.
326
Kagan, J. (1969). Continuity in cognitive development during the first year. Merrill-Palmer-Quarterly, 15, 101-119.
Kahn, E. & Cohen, L.H. (1934). Organic drivenness. A brain stem syndrome and anexperience with case reports. New England Journal of Medicine, 210, 748-756.
Kasius, M.C., Ferdinand, R.F., van den Berg, H. & Verhuist, F.C. (1997).Associations between different diagnostic approaches to child and adolescentpsychopathology. Journal of Child Psychology and Psychiatry, 38, 625-632.
Kashani, J.H., Beck, N.C., Hoeper, E.W., Fallahi, C., Corcoran, C.M., McAllister,J.A., Rosenberg, T.K. & Reid, J.C. (1987). Psychiatric disorders in a communitysample of adolescents. American Journal of Psychiatry, 144, 584-589.
Kazdin, A.E. (1995). Conduct disorders in childhood and adolescence (2nd ed.).Thousand Oaks: Sage Publications.
Kendler, K.S. (1983). Overview: A current perspective on twin studies ofschizophrenia. American Journal of Psychiatry, 140, 1413-1425.
Kendler, K.S. & Eaves, L.J. (1986). Models for the joint effects of genotype andenvironment on liability to psychiatric illness. American Journal of Psychiatry, 143,279-289.
Kendler, K.S., Heath, A.C., Martin, N.G. & Eaves, L.J. (1986). Symptoms ofanxiety and depression in a volunteer twin population: The etiologic role of geneticand environmental factors. Archives of General Psychiatry, 43, 213-221.
Kendler, K.S., Neale, M.C., Kessler, R.C., Heath, A.C. & Eaves, L.J. (1992). Apopulation based twin study of major depression in women: The impact of varyingdefinitions of illness. Archives of General Psychiatry, 49, 257-266.
Kendler, K.S., Neale, M.C., Kessler, R.C., Heath, A.C. & Eaves, L.J. (1993). Atest of the equal-environment assumption in twin studies of psychiatric illness.Behavior Genetics, 23, 2 1-27.
Kimberg, D.Y. & Farah, M.J. (1993). A unified account of cognitive impairmentsfollowing frontal lobe damage: The role of working memory in complex, organizedbehavior. Journal of Experimental Psychology: General, 122, 411-428.
Kindlon, D., Mezzacappa, E. & Earls, F. (1995). Psychometric properties ofimpulsivity measures: Temporal stability, validity and factor structure. Journal of
Child Psychology and Psychiatry, 36, 645-661.
327
Kingston, L. & Prior, M. (1995). The development of patterns of stable, transient,and school-age onset aggressive behavior in young children. Journal of the AmericanAcademy of Child and Adolescent Psychiatry, 34, 348-358.
Klein, R.G. & Mannuzza, S. (1991). Long-term outcome of hyperactive children: Areview. Journal of the American Academy of Child and Adolescent Psychiatry, 30,383-387.
Koob, G.F. (1996). Hedonic valence, dopamine and motivation. MolecularPsychiatry, 1, 186-189.
Korkman, M. & Pesonen, A.-E. (1994). A comparison of neuropsychological testprofiles of children with attention deficit hyperactivity disorder and/or learningdisorder. Journal of Learning Disabilities, 27, 383-392.
Kostrzewa, R.M., Brus, R., Kalbfleisch, J.H., Perry, K.W. & Fuller, R.W. (1994).Proposed animal model of attention deficit hyperactivity disorder. Brain Research
Bulletin, 34, 161-167.
Lahey, B.B., Applegate, B., Barkley, R.A., Garfinkel, B., McBurnett, K., Kerdyck,L., Greenhill, L., Hynd, G.W., Frick, P.J., Newcorn, J., Biederman, J., 011endick,T., Hart, E.L., Perez, D., Waidman, I. & Shaffer, D. (1994). DSM-IV field trials foroppositional defiant disorder and conduct disorder in children and adolescents.American Journal of Psychiatry, 151, 1163-1171.
Lahey, B.B., Applegate, B., McBurnett, K., Biederman, J., Greenhill, L., Hynd,G.W., Barkley, R.A., Newcorn, J., Jensen, P., Richters, J., Garfinkel, B., Kerdyk,L., Frick, P.J., 011endick, 1., Perez, D., Hart, E.L., Waidman, I. & Shaffer, D.(1994). DSM-IV field trials for attention deficit hyperactivity disorder in children andadolescents. American Journal of Psychiatry, 151, 1673-1685.
Lahey, B.B., Loeber, R., Hart, E.L., Frick, P.J., Applegate, B., Zhang, Q . , Green,S.M. & Russo, M.F. (1995). Four-year longitudinal study of conduct disorder inboys: Patterns and predictors of persistence. Journal of Abnormal Psychology, 104,83-93.
Lahey, B.B., Pelham, W.E., Schaughency, E.A., Atkins, M.S., Murphy, H.A.,Hynd, G., Russo, M., Hartdagen, S. & Lorys-Vernon, A. (1988). Dimensions andtypes of attention deficit disorder with hyperactivity in children: A factor and clusteranalytic approach. Journal of the American Academy of Child and AdolescentPsychiatry, 27, 330-335.
328
Lahey, B.B., Piacentini, J.C., McBurnett, K., Stone, P., Hartdagen, S. & Hynd, G.(1988). Psychopathology and antisocial behavior in the parents of children withconduct disorder and hyperactivity. Journal of the American Academy of Child andAdolescent Psychiatry, 27, 163-170.
Lahey, B.B., Schaughency, E.A., Hynd, G.W., Carlson, C.L. & Nieves, N. (1987).Attention deficit disorder with and without hyperactivity: Comparison of behavioralcharacteristics of clinic-referred children. Journal of the American Academy of Childand Adolescent Psychiatry, 26, 718-723.
LaHoste, G.J., Swanson, J.M., Wigal, S.B., Glabe, C., Wigal, T., King, N. &Kennedy, J.L. (1996). Dopamine D4 receptor gene polymorphism is associated withattention deficit hyperactivity disorder. Molecular Psychiatry, 1, 121-124.
Lamminmäki, T., Ahonen, T., Närhi, V., Lyytinen, H. & Todd de Barra, H. (1995).Attention deficit hyperactivity disorder subtypes: Are there differences in academicproblems? Developmental Neuropsychology, 11, 297-310.
Landis, J.R. & Koch, G.G. (1977). The measurement of observer agreement forcategorical data. Biometrics, 33, 159-174.
Laufer, M.N. (1975). In Osler's day it was syphilis. In E.J. Anthony (Ed.),Explorations in Child Psychiatry (pp. 105-124). New York: Plenum Press.
Levin, H.S., Eisenberg, H.M. & Benton, A.L. (1991). Frontal lobe function anddysfunction. New York: Oxford University Press.
Levin, H.S., Cuihane, K.A., Hartmann, J., Evankovich, K., Mattson, A.J., Harward,H., Ringholz, H., Ewing-Cobbs, L. & Fletcher, J.M. (1991). Developmental changesin performance on tests of purported frontal lobe functioning. DevelopmentalNeuropsychology, 7, 377-395.
Levy, F. (1991). The dopamine theory of attention deficit hyperactivity disorder(ADHD). Australian and New Zealand Journal of Psychiatry, 25, 277-283.
Levy, F., Hay, D., McLaughlin, M., Wood, C. & Waidman, I. (1996). Twin-siblingdifferences in parental reports of ADHD, speech, reading and behaviour problems.Journal of Child Psychology and Psychiatry, 37, 569-578.
Levy, F., Hay, D., McStephen, M., Wood, C. & Waldman, I. (1997). Attention-deficit hyperactivity disorder: A category or a continuum? Genetic analysis of a large-scale twin study. Journal of the American Academy of Child and AdolescentPsychiatry, 36, 737-744.
329
Levy, F. & Hobbes, G. (1996). Does haloperidol block methyiphenidate? Motivationor attention? Psychophannacology, 126, 70-74.
Light, J.G., Pennington, B.F., Gilger, J.W. & DeFries, J.C. (1995). Readingdisability and hyperactivity disorder: Evidence for a common genetic etiology.Developmental Neuropsychology, 11, 323-335.
Livingston, R.L., Dykman, R.A. & Ackerman, P.T. (1990). The frequency andsignificance of additional self reported psychiatric diagnoses in children with attentiondeficit disorder. Journal of Abnormal Child Psychology, 18, 465-478.
Loeber, R., Brinthaupt, V.P. & Green, S.M. (1990). Attention deficits, impulsivity,and hyperactivity: Relationships to delinquency and unique contextual factors. In R.J.McMahon & DeV. Peters (Eds.), Behavior disorders of adolescent: Research,intervention, and policy in clinical and school settings (pp. 39-6 1). New York:Plenum Press.
Loeber, R., Green, S.M., Lahey, B.B. & Stouthamer-Loeber, M. (1991). Differencesand similarities between children, mothers and teachers as informants on disruptivebehavior disorders. Journal of Abnormal Child Psychology, 19, 75-95.
Logan, G.D. (1994). On the ability to inhibit thought and action: A users' guide to thestop signal paradigm. In D. Dagenbach & T.H. Can (Eds.), Inhibitory processes inattention, memory, and language (pp. 189-239). San Diego: Academic Press.
Logan, G.D. & Burkell, J. (1986). Dependence and independence in responding todouble stimulation: A comparison of stop, change, and dual-task paradigms. Journalof Experimental Psychology, 12, 549-563.
Logan, G.D. & Cowan, W.B. (1984). On the ability to inhibit thought and action: Atheory of an act of control. Psychological Review, 91, 295-327.
Logan, G.D., Cowan, W.B. & Davis, K.A. (1984). On the ability to inhibit simpleand choice reaction time responses: A model and a method. Journal of ExperimentalPsychology, 10, 276-291.
Loge, D.V., Staton, R.D. & Beatty, W.W. (1990). Performance of children withADHD on tests sensitive to frontal lobe dysfunction. Journal of the AmericanAcademy of Child and Adolescent Psychiatry, 29, 540-545.
Loney, J., Whaley-Klahn, M.A., Kosier, T. & Conboy, J. (1983). Hyperactive boysand their brothers at 21: Predictors of aggressive and antisocial outcomes. In K.T. vanDusen & S.A. Mednick (Eds.), Prospective studies of crime and delinquency (pp. 181-206). Boston: KJuwer-Nijhoff.
330
Lord, C. & Schopler, E. (1985). Differences in sex ratios in autism as a function ofmeasured intelligence. Journal of Autism and Developmental Disorders, 15, 185-193.
Losier, B.J., McGrath, J. & Klein, R.M. (1996). Error patterns on the continuousperformance test in non-medicated and medicated samples of children with and withoutADHD: A meta-analytic review. Journal of Child Psychology and Psychiatry, 37,971-987.
Lou, H.C., Henriksen, L. & Bruhn, P. (1984). Focal cerebral hypoperfusion inchildren with dysphasia and/or attention deficit disorder. Archives of Neurology, 41,825-829.
Lou, H.C., Henriksen, L. & Bruhn, P. (1990). Focal cerebral dysfunction indevelopmental learning disabilities. The Lancet, 335, 8-11.
Lou, H.C., Henriksen, L., Bruhn, P., Borner, H. & Nielsen, J.B. (1989). Striataldysfunction in attention deficit and hyperkinetic disorder. Archives of Neurology, 41,825-829.
Lueger, R.J. & Gill, K.J. (1990). Frontal-lobe cognitive dysfunction in conductdisorder adolescents. Journal of Clinical Psychology, 46, 696-706.
Luk, S-L. (1996). Cross-cultural aspects. In S. Sandberg (Ed.), Hyperactivitydisorders of childhood (pp. 350-38 1). Cambridge: Cambridge University Press.
Lykken, D.T. (1978). The diagnosis of zygosity in twins. Behavior Genetics, 8, 437-443.
Lytton, H. (1977). Do parents create, or respond to, differences in twins?Developmental Psychology, 13, 456-459.
Lyytinen, H. (1995). Comorbidity and developmental neurocognitive disorders.Developmental Neuropsychology, 11, 269-273.
Magnus, P., Berg, K. & Nance, W.E. (1983). Predicting zygosity in Norwegian twinpairs born 1915-1960. Clinical Genetics, 24, 103-112.
Malhotra, A.K., Virkkunen, M., Rooney, W., Eggert, M., Linnoila, M. & Goldman,D. (1996). The association between the dopamine D4 receptor (D4DR) 16 amino acidrepeat polymorphism and Novelty Seeking. Molecular Psychiatry, 1, 388-391.
Mannuzza, S. & Gittelman, R. (1984). The adolescent outcome of hyperactive girls.Psychiatry Research, 13, 19-29.
331
Mannuzza, S., Klein, R.G, Konig, P.H. & Giampino, T.L. (1989). Hyperactive boysalmost grown up, IV: Criminality and its relationship to psychiatric status. Archives of
General Psychiatry, 46, 1073-1079.
Mannuzza, S., Klein, R.G., Bessler, A., Malloy, P. & Hynes, M.E. (1997).Educational and occupational outcome of hyperactive boys grown up. Journal of theAmerican Academy of Child and Adolescent Psychiatry, 36, 1222-1227.
Mannuzza, S., Klein, R.G., Bessler, A., Malloy, P. & LaPadula, M. (1993). Adultoutcome of hyperactive boys. Educational achievement, occupational rank, andpsychiatric status. Archives of General Psychiatry, 50, 565-576.
Mannuzza, S., Klein, R.G., Bessler, A., Malloy, P. & LaPadula, M. (1998). Adultpsychiatric status of hyperactive boys grown up. American Journal of Psychiatry, 155,493-498.
Mannuzza, S., Klein, R.G., Bonagura, N., Malloy, P., Giampino, T.L. & Addalli,K.A. (1991). Hyperactive boys almost grown up: V. Replication of psychiatric status.Archives of General Psychiatry, 48, 77-83.
Mariani, M.A. & Barkley, R.A. (1997). Neuropsychological and academicfunctioning in preschool boys with attention deficit hyperactivity disorder.Developmental Neuropsychology, 13, 111-129.
Matheny, A.P. Jr., Wilson, R.S. & Dolan, A.B. (1976). Relations between twins'similarity of appearance and behavioral similarity: Testing an assumption. BehaviorGenetics, 6, 343-351.
McArdle, P., O'Brien, G. & Kolvin, I. (1995). Hyperactivity: Prevalence andrelationship with conduct disorder. Journal of Child Psychology and Psychiatry, 36,279-303.
McBurnett, K., Harris, S.M., Swanson, J.M., Pfiffner, L.J., Tamm, L. & Freeland,D. (1993). Neuropsychological and psychophysiological differentiation ofinattention/overactivity and aggression/defiance symptom groups. Journal of ClinicalChild Psychology, 22, 165-171.
McGee, R. & Share, D.L. (1988). Attention deficit disorder - hyperactivity andacademic failure: Which comes first and what should be treated? Journal of theAmerican Academy of Child and Adolescent Psychiatry, 27, 3 18-325.
McGee, R., Williams, S. & Feehan, M. (1992). Attention deficit disorder and age ofonset of problem behaviors. Journal of Abnor,nal Child Psychology, 20, 487-502.
332
McGee, R., Williams, S., Moffitt, T. & Anderson, J. (1989). A comparison of 13-year-old boys with attention deficit and/or reading disorder on neuropsychologicalmeasures. Journal of Abnormal Child Psychology, 17, 37-53.
McGuffin, P. & Gottesman, 1.1. (1985). Genetic influences on normal and abnormaldevelopment. In M. Rutter & L. Hersov (Eds.), Child and adolescent psychiatry:Modern approaches (2nd ed., pp. 17-33). Oxford: Blackwell Scientific.
McGuffin, P., Owen, M.J., O'Donovan, M.C., Thapar, A. & Gottesman, 1.1. (1994).Seminars in psychiatric genetics. London: Gaskell/Royal College of Psychiatrists.
McMahon, R.C. (1980). Genetic etiology in the hyperactive child syndrome: Acritical review. American Journal of Orthopsychiat,y, 50, 145-150.
Milich, R., Carison, C.L., Pelham, W.E. & Licht, B.G. (1991). Effects ofmethylphenidate on the persistence of ADHD boys following failure experiences.Journal of Abnormal Child Psychology, 19, 5 19-536.
Miller, L.S., Koplewicz, H.S. & Klein, R.G. (1997). Teacher ratings ofhyperactivity, inattention, and conduct problems in preschoolers. Journal of AbnormalChild Psychology, 25, 113-119.
Moffitt, T.E. (1993). Adolescence-limited and life-course-persistent antisocialbehavior: A developmental taxonomy. Psychological Review, 100, 674-701.
Moffitt, T.E. & Henry, B. (1989). Neuropsychological assessment of executivefunctions in self-reported delinquents. Development and Psychopathology, 1, 105-118.
Moffitt, T.E., Lynam, D.R. & Silva, P.A. (1994). Neuropsychological testspredicting persistent male delinquency. Criminology, 32, 277-300.
Moffitt, I.E. & Silva, P.A. (1988). Self-reported delinquency, neuropsychologicaldeficit, and history of attention deficit disorder. Journal of Abnormal childPsychology, 16, 553-569.
Moisan, M., Courvoisier, H., Bihoreau, M., Gauguier, D., Hendley, E.D., Lathrop,M., James, M.R. & Mormedè, P. (1996). A major quantitative trait locus influenceshyperactivity in the WKHA rat. Nature Genetics, 14, 471-473.
Morrison, J. (1980). Adult psychiatric disorders in parents of hyperactive children.American Journal of Psychiatry, 3, 825-827.
Morrison, J. & Stewart, M.A. (1971). A family study of the hyperactive childsyndrome. Biological Psychiatry, 3, 189-195.
333
Nadder, T.S., Silberg, J.L., Eaves, L.J., Maes, H.H. & Meyer, J.M. (1998). Geneticeffects on ADHD symptomatology in 7- to 13-year-old twins: results from a telephonesurvey. Behavior Genetics, 28, 83-99.
Närhi, V., & Ahonen, T. (1995). Reading disability with and without attention deficithyperactivity disorder: Do attentional problems make a difference? DevelopmentalNeuropsychology, 11, 337-349.
Neale, M.C., & Cardon, L.R. (1992). Methodology for genetic studies of twins andfamilies. Dordrecht: Kiuwer Academic Publishers.
Neale, M.C., & Kendler, K.S. (1995). Models of comorbidity for multifactorialdisorders. American Journal of Human Genetics, 57, 935-953.
Nichols, R.C. & Bilbro, W.C. (1966). The diagnosis of twin zygosity. Acta GeneticaeMedicae et Gemellologiae, 16, 265-275.
Nigg, J.T., Swanson, J.M. & Hinshaw, S.P. (1997). Covert visual spatial attention inboys with attention deficit hyperactivity disorder: Lateral effects, methylphenidateresponse and results for parents. Neuropsychologia, 35, 165-176.
NIMH (National Institute of Mental Health). (1992). Diagnostic interview schedule forchildren. New York: New York State Psychiatric Institute Division of Child andAdolescent Psychiatry.
Office of Population Censuses and Surveys (1990). Standard Occupational
Classfi cation. London: HMSO.
Oosterlaan, J., Logan, G.D. & Sergeant, J.A. (1998). Response inhibition in AD/HD,CD, comorbid AD/HD+CD, anxious, and control children: A meta-analysis ofstudies with the stop task. Journal of Child Psychology and Psychiatry, 39, 411-425.
Oosterlaan, J. & Sergeant, J.A. (1996). Inhibition in ADHD, aggressive, and anxiouschildren: A biologically based model of child psychopathology. Journal of AbnormalChild Psychology, 24, 19-36.
Oosterlaan, J. & Sergeant, J.A. (1998a). Response inhibition and response re-engagement in ADHD, disruptive, anxious and normal children. Behavioural Brain
Research, 94, 33-43.
Oosterlaan, J. & Sergeant, J.A. (1998b). Response inhibition and the effects of rewardand response cost: A comparison between ADHD, disruptive, anxious and normalchildren. Journal of Abnormal Child Psychology, 26, 161-174.
334
Palfrey, J.S., Levine, M.D., Walker, D.K. & Sullivan, M. (1985). The emergence ofattention deficits in early childhood: A prospective study. Journal of Developmentaland Behavioral Pediatrics, 6, 339-348.
Patemite, C.E. & Loney, J. (1980). Childhood hyperkinesis: Relationships betweensymptomatology and home environment. In C.K. Whalen & B. Henker (Eds.),Hyperactive children. The social ecology of identification and treatment (pp. 105-141).New York: Academic Press.
Peiham, W.E. & Bender, M.E. (1982). Peer relationships in hyperactive children:Description and treatment. In K. Gadow & I. Bialer (Eds.), Advances in learning andbehavioral disabilities (Vol. 1, pp. 365-436). Greenwich, CT: JAI.
Peiham, W.E., Gnagy, E.M., Greenslade, K.E. & Milich, R. (1992). Teacher ratingsof DSM-ffl-R symptoms for the disruptive behavior disorders. Journal of theAmerican Academy of Child and Adolescent Psychiatry, 31, 2 10-218.
Pennington, B.F. (1994). The working memory function of the prefrontal cortices:Implications for developmental and individual differences in cognition. In M.M.Haith, J.B. Benson, R.J. Roberts Jr, & B.F. Pennington (Eds.), The development of
future-oriented processes (pp. 243-289). Chicago: The University of Chicago Press.
Pennington, B.F., Bennetto, L., McAleer, 0. & Roberts, R.J. Jr. (1996). Executivefunctions and working memory. In Lyon, G.R. & Krasnegor, N.A. (Eds), Attention,memory, and executive function. (pp. 327-348). Baltimore: Paul H. BrookesPublishing Co.
Pennington, B.F., Groisser, D. & Welsh, M.C. (1993). Contrasting cognitive deficitsin attention deficit hyperactivity disorder versus reading disability. DevelopmentalPsychology, 29, 511-523.
Pennington, B.F. & Ozonoff, S. (1996). Executive functions and developmentalpsychopathology. Journal of Child Psychology and Psychiatry, 37, 5 1-87.
Perrin, S. & Last, C.G. (1996). Relationship between ADHD and anxiety in boys:Results from a family study. Journal of the American Academy of Child andAdolescent Psychiatry, 35, 988-996.
Pliszka, S.R. (1989). Effect of anxiety on cognition, behavior and stimulant responsein ADHD. Journal of the American Academy of Child and Adolescent Psychiatry, 28,882-887.
335
Pliszka, S.R. (1992). Comorbidity of attention-deficit hyperactivity disorder andoveranxious disorder. Journal of the American Academy of Child and AdolescentPsychiatry, 31, 197-203.
Pliszka, S.R. & Borcherding, S.H. The stop signal task in children with attentiondeficit hyperactivity disorder and anxiety. Manuscript submitted for publication.
Pliszka, S.R., McCracken, J.T. & Maas, J.W. (1996). Catecholamines in attention-deficit hyperactivity disorder: Current perspectives. Journal of the American Academy
of Child and Adolescent Psychiatry, 35, 264-272.
Plomin, R., Chipuer, H.M. & Neiderhiser, J.M. (1994). Behavioral genetic evidencefor the importance of nonshared environment. In E.M. Hetherington, D. Reiss & R.Plomin (Eds.), Separate social worlds of siblings: Impact of nonshared environmenton development (pp. 1-3 1). Hillsdale, NJ: Erlbaum.
Plomin, R. & DeFries, J.C. (1985). A parent-offspring adoption study of cognitiveabilities in early childhood. Intelligence, 9, 341-356.
Plomin, R., DeFries, J.C., McClearn, G.E. & Rutter, M. (1997). Behavioral genetics(3rd ed.). New York: W H Freeman.
Plomin, R., Willerman, L. & Loehlin, J.C. (1976). Resemblance in appearance and theequal environments assumption in twin studies of personality traits. Behavior genetics,6, 43-52.
Porrino, L.J., Rapoport, J.L., Behar, D., Sceery, W., Ismond, D.R. & Bunney Jr,W.E. (1983). A naturalistic assessment of the motor activity of hyperactive boys.Archives of General Psychiatry, 40, 68 1-687.
Pribram, K.H. & McGuinness, D. (1975). Arousal, activation and effort in the controlof attention. Psychological Review, 2, 116-149.
Puig-Antich, J. & Chambers, W. (1978). The Schedule for Affective Disorders andSchizophrenia for School-age Children (Kiddie-SADS). New York: New York StatePsychiatric Institute.
Quay, H.C. (1988). The behavioral reward and inhibition system in childhoodbehavior disorder. In L.M. Bloomingdale (Ed.), Attention deficit disorder: Newresearch in attention, treatment and psychopathology ( pp. 176-186). Oxford:Pergamon Press.
Quay, H.C. (1997). Inhibition and attention deficit hyperactivity disorder. Journal of
Abnormal Child Psychology, 25, 7-13.
336
Reeves, J.C., Werry, J.S., Elkind, G.S. & Zametkin, A. (1987). Attention deficit,conduct, oppositional, and anxiety disorders in children: H. Clinical characteristics.Journal of the American Academy of Child and Adolescent Psychiatry, 26, 144-155.
Richman, N., Stevenson, J. & Graham, P.J. (1982). Pre-school to school: Abehavioural study. Behavioural Development, 228.
Risch, N. (1990a). Linkage strategies for genetically complex traits. I: Multilocusmodels. American Journal of Human Genetics, 46, 222-228.
Risch, N. (1990b). Linkage strategies for genetically complex traits. II: The power ofaffected relative pairs. American Journal of Human Genetics, 46, 229-241.
Roberts, M.A. (1990). A behavioral observation method for differentiatinghyperactive and aggressive boys. Journal of Abnormal Child Psychology, 18, 13 1-142.
Roberts, R.J., Hager, L. & Heron, C. (1994). Prefrontal cognitive processes: workingmemory and inhibition in the Antisaccade task. Journal of Experimental Psychology:General, 23, 374-393.
Robins, P.M. (1992). A comparison of behavioral and attentional functioning inchildren diagnosed as hyperactive or learning-disabled. Journal of Abnormal ChildPsychology, 20, 65-82.
Robinson, R.J. (1987). Introduction and overview. In: Proceedings of the FirstInternational Symposium on Specific Speech and Language Disorders in Children (pp.1-19). London: AFASIC.
Roizen, N.J., Blondis, l.A., Irwin, M., Rubinoff, A., Kieffer, J. & Stein, M.A.(1996). Psychiatric and developmental disorders in families of children with attention-deficit hyperactivity disorder. Archives of Pediatric and Adolescent Medicine, 150,203-208.
Rowe, K.J. & Rowe, K.S. (1992). The relationship between inattentiveness in theclassroom and reading achievement (Part A): Methodological issues. Journal of theAmerican Academy of Child and Adolescent Psychiatry, 31, 349-356.
Rowe, K.S. & Rowe, K.J. (1997). Norms for parental ratings on Conners'Abbreviated Parent-Teacher Questionnaire: Implications for the design of behavioralrating inventories and analyses of data derived from them. Journal of Abnormal ChildPsychology, 25, 425-451.
337
Russell, V., de Villiers, A., Sagvolden, T., Lamm, M. & Taljaard, J. (1995). Altereddopaminergic function in the prefrontal cortex, nucleus accumbens and caudate-putamen of an animal model of Attention-Deficit Hyperactivity Disorder - thespontaneously hypertensive rat. Brain Research, 676, 343-351.
Ruuer, M. (1994). Psychiatric genetics: Research challenges and pathways forward.American Journal of Medical Genetics (Neuropsychiatric Genetics), 54, 185-198.
Rutter, M. (1997). Implications of genetic research for child psychiatry. CanadianJournal of Psychiatry, 42, 569-576.
Rutter, M., Bolton, P., Harrington, R., Le Couteur, A., Macdonald, H. & Simonoff,E. (1990). Genetic factors in child psychiatric disorders - I. A review of researchstrategies. Journal of Child Psychology and Psychiatry, 31, 3-37.
Rutter, M. & Redshaw, J. (1991). Annotation: Growing up as a twin: Twin-singletondifferences in psychological development. Journal of Child Psychology andPsychiatry, 32, 885-895.
Sagvolden, T., Metzger, M.A., Schiorbeck, H.K., Rugland, A., Spinnangr, I. &Sagvolden, G. (1992). The spontaneously hypertensive rat (SHR) as an animal modelof childhood hyperactivity (ADHD): Changed reactivity to reinforcers and topsychomotor stimulants. Behavioral and Neural Biology, 58, 103-112.
Sandberg, S. & Barton, J. (1996). Historical development. In S. Sandberg (Ed.),Hyperactivily disorders of childhood (pp. 1-25). Cambridge: Cambridge UniversityPress.
Sandberg, S. & Garralda, M.E. (1996). Psychosocial contributions. In S. Sandberg(Ed.), Hyperactivity disorders of childhood (pp. 280-349). Cambridge: CambridgeUniversity Press.
Sanders, A.F. (1983). Toward a model of stress and human performance. ActaPsychologica, 53, 6 1-97.
Satterfield, J.H. & Schell, A. (1997). A prospective study of hyperactive boys withconduct problems and normal boys: Adolescent and adult criminality. Journal of theAmerican Academy of Child and Adolescent Psychiatry, 36, 1726-1735.
Schachar, R. (1991). Childhood hyperactivity. Journal of Child Psychology andPsychiatry, 32, 155-191.
338
Schachar, R. & Logan, G.D. (1990). Impulsivity and inhibitory control in normaldevelopment and childhood psychopathology. Developmental Psychology, 26, 710-720.
Schachar, R. & Tannock, R. (1995). Test of four hypotheses for the comorbidity ofattention-deficit hyperactivity disorder and conduct disorder. Journal of the American
Academy of Child and Adolescent Psychiatry, 34, 639-648.
Schachar, R., Tannock, R., Marriott, M. & Logan, G. (1995). Deficient inhibitorycontrol in attention deficit hyperactivity disorder. Journal of Abnor,nal ChildPsychology, 23, 411-437.
Schachar, R. & Wachsmuth, R. (1990). Hyperactivity and parental psychopathology.Journal of Child Psychology and Psychiatry, 31, 381-392.
Schmitz, S., Fulker, D.W. & Mrazek, D.A. (1995). Problem behavior in early andmiddle childhood: An initial behavior genetic analysis. Journal of Child Psychologyand Psychiatry, 36, 1443-1458.
Schweitzer, J.B. & Suizer-Azaroff, B. (1995). Self-control in boys with attentiondeficit hyperactivity disorder: Effects of added stimulation and time. Journal of ChildPsychology and Psychiatry, 36, 67 1-686.
Scott, S. (1996). Measuring oppositional and aggressive behaviour. Child Psychology& Psychiatry Review, 1, 104-109.
Seguin, J.R., Pihi, R.O., Harden, P.W., Tremblay, R.E. & Boulerice, B. (1995).
Cognitive and neuropsychological characteristics of physically aggressive boys.Journal of Abnormal Psychology, 104, 614-624.
Seidman, L.J., Biederman, J., Faraone, S.V., Weber, W., Mennin, D. & Jones, J.(1997). A pilot study of neuropsychological function in girls with ADHD. Journal of
the American Academy of Child and Adolescent Psychiatry, 36, 366-373.
Semrud-Clikeman, M., Filipek, P.A., Biederman, J., Steingard, R., Kennedy, D.,Renshaw, P. & Bekken, K. (1994). Attention-deficit hyperactivity disorder: Magneticresonance imaging morphometric analysis of the corpus callosum. Journal of the
American Academy of Child and Adolescent Psychiatry, 33, 875-881.
Sergeant, J.A. & van der Meere, J.J. (1989). The diagnostic significance of attentionalprocessing: Its significance for ADDH classification - A future DSM. In T. Sagvolden& T. Archer (Eds.), Attention deficit disorder: Clinical and basic research. London:Lawrence Erlbaum Associates.
339
Sergeant, J.A. & van der Meere, J.J. (1990a). Convergence of approaches inlocalizing the hyperactivity deficit. In B.B. Lahey & A.E. Kazin (Eds.), Advances inclinical child psychology (pp. 207-246). New York: Plenum Press.
Sergeant, J.A. & van der Meere, J.J. (1990b). Additive factor method applied topsychopathology with special reference to childhood hyperactivity. Acta Psychologica,74, 277-296.
Sergeant, J.A. & van der Meere, J.J. (1994). Toward an empirical childpsychopathology. In D.K. Routh (Ed.), Disruptive behavior disorders in childhood(pp. 59-85). New York: Plenum Press.
Sherman, D.K., lacono, W.G. & McGue, M.K. (1997). Attention deficithyperactivity disorder dimensions: A twin study of inattention and impulsivity-hyperactivity. Journal of the American Academy of Child and Adolescent Psychiatry,36, 745-753.
Sherman, D.K., McGue, M.K. & lacono, W.G. (1997). Twin concordance forattention deficit hyperactivity disorder: A comparison of teachers' and mothers'reports. American Journal of Psychiatry, 154, 532-535.
Shue, K.L. & Douglas, V.1. (1992). Attention deficit hyperactivity disorder and thefrontal lobe syndrome. Brain and Cognition, 20, 104-124.
Siegel, L.S. (1994). Working memory and reading: A life-span perspective.International Journal of Behavioral Development, 17, 109-124.
Siegel, L.S. & Ryan, E.B. (1989). The development of working memory in normallyachieving and subtypes of learning disabled children. Child Development, 60, 973-980.
Silberg, J., Meyer, J., Pickles, A., Simonoff, E., Eaves, L., Hewitt, J., Maes, H. &Rutter, M. (1996). Heterogeneity among juvenile antisocial behaviours: findings fromthe Virginia Twin Study of Adolescent Behavioural Development. Ciba FoundationSymposium, 194, 76-86.
Silberg, J., Rutter, M., Meyer, J., Maes, H., Hewitt, J., Simonoff, E., Pickles, A.,Loeber, R. & Eaves, L. (1996). Genetic and environmental influences on thecovariation between hyperactivity and conduct disturbance in juvenile twins. Journalof Child Psychology and Psychiatry, 37, 803-816.
Simonoff, E. (1992). A comparison of twins and singletons with child psychiatricdisorders: an item sheet study. Journal of Child Psychology and Psychiatry, 33, 1319-1332.
340
Simonoff, E., Pickles, A., Hervas, A., Silberg, J., Rutter, M. & Eaves, L. (in press).Genetic influences on childhood hyperactivity: Contrast effects imply parental ratingbias, not sibling interaction. Psychological Medicine.
Skuse, D. (1997). Genetic factors in the aetiology of child psychiatric disorders.Current Opinion in Pediatrics, 9, 354-360.
Skuse, D. (in press). Genomic imprinting of the X-chromosome: a novel mechanismfor the evolution of sexual dimorphism. Journal of Laboratory and Clinical Medicine.
Sleator, E.K. & Uliman, R.K. (1981). Can the physician diagnose hyperactivity in thedoctor's office? Pediatrics, 67, 13-17.
Slutske, W. S., Heath, A. C., Dinwiddie, S. H., Madden, P.A.F., Bucholz, K.K.,Dunne, M.P., Statham, D.J. & Martin, N.G. (1997). Modeling genetic andenvironmental influences in the etiology of conduct disorder: A study of 2,682 adulttwin pairs. Journal of Abnormal Psychology, 106, 266-279.
Sonuga-Barke, E.J.S. (1994). Annotation: On dysfunction and function inpsychological theories of childhood disorder. Journal of Child Psychology andPsychiatry, 35, 801-815.
Sonuga-Barke, E.J.S. (1995). Disambiguating inhibitory dysfunction in childhoodhyperactivity. In J. Sergeant (Ed.), Eunethydis: European approaches to hyperkineticdisorder (pp. 209-223). Zurich: Fotorotar.
Sonuga-Barke, E.J.S. (1996a). Debate and Argument: When "impulsiveness" is delayaversion; A reply to Schweitzer and Sulzer-Azaroff (1995). Journal of ChildPsychology and Psychiatry, 37, 1023-1025.
Sonuga-Barke, E.J.S. (1996b). The stop signal paradigm: A measure of instructionalcontrol? A paper presented at the Biophyris meeting in London, June 1996.
Sonuga-Barke, E.J.S., Houlberg, K. & Hall, M. (1994). When is 'impulsiveness' notimpulsive? The case of hyperactive children's cognitive style. Journal of ChildPsychology and Psychiatry, 35, 1247-1253.
Sonuga-Barke, E.J.S., Lamparelli, M., Stevenson, J., Thompson, M. & Henry, A.(1994). Behaviour problems and pre-school intellectual attainment: The associations ofhyperactivity and conduct problems. Journal of Child Psychology and Psychiatry, 35,949-960.
341
Sonuga-Barke, E.J.S. & Taylor, E. (1992). The effect of delay on hyperactive andnon-hyperactive children's response times: A research note. Journal of ChildPsychology and Psychiatry, 33, 1091-1096.
Sonuga-Barke, E.J.S., Taylor, E. & Heptinstall, E. (1992). Hyperactivity and delayaversion - II. The effects of self versus externally imposed stimulus presentationperiods on memory. Journal of Child Psychology and Psychiatry, 33, 399-409.
Sonuga-Barke, E.J.S., Taylor, E., Sembi, S. & Smith, J. (1992). Hyperactivity anddelay aversion - I. The effect of delay on choice. Journal of Child Psychology andPsychiatry, 33, 3 87-398.
Sonuga-Barke, E.J.S., Williams, E., Hall, M. & Saxton, T. (1996). Hyperactivity anddelay aversion III: The effect on cognitive style of imposing delay after errors.Journal of Child Psychology and Psychiatry, 37, 189-194.
Sroufe, L.A. & Rutter, M. (1984). The domain of developmental psychopathology.Child Development, 55, 17-29.
Stevenson, J. (1992). Evidence for a genetic etiology in hyperactivity in children.Behavior Genetics, 22, 337-344.
Stevenson, J. (1996) Hyperactivity, reading disability and schooling. In S. Sandberg(Ed.), Hyperactivity disorders (pp. 382-432). Cambridge: Cambridge UniversityPress.
Stevenson, J., Pennington, B.F., Gilger, J.W., DeFries, J.C. & Gillis, J.J. (1993).Hyperactivity and spelling disability: Testing for shared genetic aetiology. Journal of
Child Psychology and Psychiatry, 34, 1137-1152.
Stewart, M.A., deBlois, C.S. & Cummings, C. (1980). Psychiatric disorder in theparents of hyperactive boys and those with conduct disorder. Journal of ChildPsychology and Psychiatry, 21, 283-292.
Still, G.F. (1902). The Coulstonian Lectures on some abnormal physical conditions inchildren. Lancet, 1, 1008-1012; 1077-1082; 1163-1168.
Strauss, A.A. & Lehtinen, L.E. (1947). Psychopathy and education of the brain-injured child. New York: Grune and Stratton.
Stuss, D.T. & Benson, D.F. (1986). The frontal lobes. New York: Raven Press.
342
Swanson, J.M., Sergeant, J.A., Taylor, E., Sonuga-Barke, E.J., Jensen, P.S. &Cantwell, D.P. (1998). Attention-deficit hyperactivity disorder and hyperkineticdisorder. Lancet, 351, 429-433.
Swanson, J.M., Sunohara, G.A., Kennedy, J.L., Regino, R., Fineberg, E., Wigal,T., Lerner, M., Williams, L., LaHoste, G.J. & Wigal, S. (1998). Association of thedopamine receptor D4 (DRD4) gene with a refined phenotype of attention deficithyperactivity disorder (ADHD): a family-based approach. Molecular Psychiatry, 3,38-41.
Szatmari, P., Boyle, M. & Offord, D.R. (1989). ADDH and conduct disorder: degreeof diagnostic overlap and differences among correlates. Journal of the AmericanAcademy of Child and Adolescent Psychiatry, 28, 865-872.
Szatmari, P., Offord, D.R. & Boyle, M.H. (1989a). Correlates, associatedimpairments and patterns of service utilization of children with attention deficitdisorder: Findings from the Ontario Child Health Study. Journal of Child Psychologyand Psychiatry, 30, 205-217.
Szatmari, P., Offord, D.R. & Boyle, M.H. (1989b). Ontario Child Health Study:Prevalence of attention deficit disorder with hyperactivity. Journal of ChildPsychology and Psychiatry, 30, 2 19-230.
Szatmari, P., Saigal, S., Rosenbaum, P. & Campbell, D. (1993). Psychopathologyand adaptive functioning among extremely low birthweight children at eight years ofage. Development and Psychopathology, 5, 345-357.
Tannock, R. (1998). Attention deficit hyperactivity disorder: Advances in cognitive,neurobiological, and genetic research. Journal of Child Psychology and Psychiatry,39, 65-99.
Tannock, R., Ickowicz, A. & Schachar, R. (1995). Differential effects ofmethylphenidate on working memory in ADHD children with and without comorbidanxiety. Journal of the American Academy of Child and Adolescent Psychiatry, 34,886-896.
Tannock, R., Schachar, R., Carr, R.P., Chajczyk, D. & Logan, G.D. (1989). Effectsof methylphenidate on inhibitory control in hyperactive children. Journal of AbnormalChild Psychology, 17, 473-491.
Tannock, R., Schachar, R. & Logan, G. (1995). Methylphenidate and cognitiveflexibility: Dissociated dose effects in hyperactive children. Journal of AbnormalChild Psychology, 23, 235-266.
343
Taylor, E. (1986). The causes and development of hyperactive behaviour. In E.A.Taylor (Ed.), The overactive child (pp. 118-160). London: Spastics InternationalMedical Publications.
Taylor, E. (1991). Toxins and allergens. In M. Rutter & P. Casaer (Eds.), Biologicalrisk factors for psychosocial disorders. Cambridge: Cambridge University Press.
Taylor, E. (1994). Syndromes of attention deficit and overactivity. In M. Rutter, E.Taylor, & L. Hersov (Eds.), Child and adolescent psychiatry: Modern approaches
(pp. 285-307). Oxford: Blackwell Scientific Publications.
Taylor, E., Chadwick, 0., Heptinstall, E. & Danckaerts, M. (1996). Hyperactivityand conduct problems as risk factors for adolescent development. Journal of the
American Academy of Child and Adolescent Psychiatry, 35, 1213-1226.
Taylor, E. & Sandberg, S. (1984). Hyperactive behavior in English schoolchildren: Aquestionnaire survey. Journal of Abnormal Child Psychology, 12, 143-156.
Taylor, E., Sandberg, S., Thorley, G. & Giles, S. (1991). The epidemiology of
childhood hyperactivity. New York: Oxford University Press.
Taylor, E., Schachar, R., Thorley, G. & Wieselberg, M. (1986). Conduct disorderand hyperactivity: I. Separation of hyperactivity and antisocial conduct in British childpsychiatric patients. British Journal of Psychiatry, 149, 131-139.
Taylor, E., Schachar, R. & Wieselberg, M. (1986). Conduct disorder andhyperactivity: I. Separation of hyperactivity and antisocial conduct in British childpsychiatric patients. British Journal of Psychiatry, 149, 760-777.
Thapar, A., Hervas, A. & McGuffin, P. (1995). Childhood hyperactivity scores arehighly heritable and show sibling competition effects: Twin study evidence. Behavior
Genetics, 25, 537-544.
Tredgold, C.H. (1908). Mental deficiency (amentia). New York: W. Wood.
Trommer, B.L., Hoeppner, J.B., Lorber, R. & Armstrong, K.J. (1988). The go-no-go paradigm in attention deficit disorder. Annals of Neurology, 24, 610-614.
Tucker, D.M. & Williamson, P.A. (1984). Asymmetric neural control systems inhuman self regulation. Psychological Review, 91, 185-215.
Unis, A.S., Cook, E.H., Vincent, J.G., Gjerde, D.K., Perry, B.D., Mason, C. &Mitchell, J. (1997). Platelet serotonin measures in adolescents with conduct disorder.Biological Psychiatry, 42, 553-559.
344
Valentine, J., Rossi, E., O'Leary, P., Parry, T.S., Kurinczuk, J.J. & Sly, P. (1997).Thyroid function in a population of children with attention deficit hyperactivitydisorder. Journal of Paediatrics and Child Health, 33, 117-120.
van den Oord, E.J.C.G., Boomsma, D.I. & Verhulst, F.C. (1994). A study ofproblem behaviors in 10- to 15-year-old biologically related and unrelatedinternational adoptees. Behavior Genetics, 24, 193-205.
van den Oord, E.J.C.G., Koot, H.M., Boomsma, D.I., Verhuist, F.C. & Orlebeke,J.F. (1995). A twin-singleton comparison of problem behaviour in 2-3-year-olds.Journal of Child Psychology and Psychiatry, 36, 449-458.
van den Oord, E.J.C.G., Verhulst, F.C. & Boomsma, DI. (1996). A genetic study ofmaternal and paternal ratings of problem behaviors in 3-year-old twins. Journal ofAbnormal Psychology, 105, 349-357.
van der Meere, J. (1996). The role of attention. In S. Sandberg (Ed.), Hyperactivitydisorders of childhood (pp. 111-148). Cambridge: Cambridge University Press.
van der Meere, J., Hughes, K., Borger, N. & Sallee, F.R. (1995). The effect ofreward on sustained attention in ADHD children with and without CD. In J. Sergeant(Ed.), Eunethydis. European approaches to hyperkinetic disorder (pp. 24 1-253).Zurich: Fotorotar.
van der Meere, J. & Sergeant, J.A. (1988). Controlled processing and vigilance inhyperactivity: Time will tell. Journal of Abnormal Child Psychology, 16, 641-655.
van der Meere, J., Shalev, R., Borger, N. & Gross-Tsur, V. (1995). Sustainedattention, activation and MPH in ADHD: A research note. Journal of ChildPsychology and Psychiatry, 36, 697-703.
van der Meere, J., Wekking, E. & Sergeant, J. (1991). Sustained attention andpervasive hyperactivity. Journal of Child Psychology and Psychiatry, 32, 275-284.
van Zijderveld, G.A., van Doornen, L.J.P., van Faasen, I., Orlebeke, J.F., vanDyck, R. & Tilders, F.J.H. (1993). Adrenaline and the relationship betweenneurosomatism, aerobic fitness and mental task performance. Biological Psychiatry,
36, 157-181.
Vandenbergh, D.J., Zonderman, A.B., Wang, J., Uhl, G.R. & Costa Jr, PT. (1997).No association between Novelty Seeking and dopamine D4 receptor (D4DR) exon IIIseven repeat alleles in Baltimore Longitudinal Study of Aging participants. MolecularPsychiatry, 2, 417-419.
345
Weiss, G., Hechtman, L., Milroy, T. & Penman, 1. (1985). Psychiatric status ofhyperactives as adults: A controlled prospective 15-year follow-up of 63 hyperactivechildren. Journal of the American Academy of Child Psychiatry, 24, 211-220.
Weiss, R.E., Stein, M.A., Duck, S.C., Chyna, B., Phillips, W., O'Brien, T.,Gutermuth, L. & Refetoff, 5. (1994). Low intelligence but not attention deficithyperactivity disorder is associated with resistance to thyroid hormone caused bymutation R316H in the thyroid hormone receptor b gene. Journal of ClinicalEndocrinology and Metabolism, 78, 1525-1528.
Weiss, R., Stein, M. Trommer, B. & Refetoff, S. (1993). Attention deficithyperactivity disorder and thyroid function. Journal of Pediatrics, 123, 539-545.
Weissman, M.M., Gammon, G.D., John, K., Merikangas, K.R., Warner, V.,Prusoff, B.A. & Sholomskas, D. (1987). Children of depressed parents. Increasedpsychopathology and early onset of major depression. Archives of General Psychiatry,
44, 847-853.
Welsh, M.C. & Pennington, B.F. (1988). Assessing frontal lobe functioning inchildren: views from developmental psychology. Developmental Neuropsychology, 4,199-230.
Welsh, M.C., Pennington, B.F. & Groisser, D.B. (1991). A normative-developmentalstudy of executive function: A window on prefrontal function in children.Developmental Neuropsychology, 7, 131-149.
Werry, J.S. & Hawthorne, D. (1976). Conners' Teacher Questionnaire: Norms andvalidity. Australian and New Zealand Journal of Psychiatry, 10, 257-262.
Werry, J.S., Sprague, R.L. & Cohen, N.M. (1975). Conners' teacher rating scale foruse in drug studies with children - an empirical study. Journal of Abnormal Child
Psychology, 3, 217-229.
Weyandt, L.L. & Willis, W.G. (1994). Executive functions in school-aged children:Potential efficacy of tasks in discriminating clinical groups. Developmental
Neuropsychology, 10, 27-38.
White, J.L., Moffitt, I.E., Caspi, A., Bartusch, D.J., Needles, D.J. & Stouthamer-Loeber, M. (1994). Measuring impulsivity and examining its relationship todelinquency. Journal of Abnormal Psychology, 103, 192-205.
Willerman, L. (1973). Activity level and hyperactivity in twins. Child Development,
44, 288-293.
346
Wilson, R.S. (1980). Bloodtyping and twin zygosity. Reassessment and extension.Acta Geneticae Medicae et Gemellologicae, 29, 103-120.
Wilson, J.M. & Kiessling, L.S. (1988). What is measured by the Conners' TeacherBehaviour Rating Scale? Replication of Factor Analysis. Developmental andBehavioral Pediatrics, 9, 271-278.
Wolraich, M.L., Hannah, J.N., Pinnock, T.Y., Baumgaertel, A. & Brown, J. (1996).Comparison of diagnostic criteria for attention-deficit hyperactivity disorder in acounty-wide sample. Journal of the American Academy of Child and AdolescentPsychiatry, 35, 3 19-324.
Woodward, L., Taylor, E. & Dowdney, L. (1998). The parenting and familyfunctioning of children with hyperactivity. Journal of Child Psychology andPsychiatry, 39, 161-169.
World Health Organization (1993). The lCD-b classWcation of mental andbehavioural disorders: Diagnostic criteria for research. Geneva: World HealthOrganization.
Yule, W. (1986). Behavioural treatments. In E. Taylor (Ed.), The overactive child.Clinics in Developmental Medicine no. 97 (pp. 219-235). Oxford: MacKeithPress/Blackwell.
Zalm-Waxler, C., Schmitz, S., Fulker, D., Robinson, J. & Emde, R. (1996).Behavior problems in 5-year-old monozygotic and dizygotic twins: Genetic andenvironmental influences, patterns of regulation, and internalization of control.Development and Psychopathology, 8, 103-122.
Zametkin, A.J., Liebenauer, L.L., Fitzgerald, G.A., King, A.C., Minkunas, D.V.,Herscovitch, P., Yamada, E.M. & Cohen, R.M. (1993). Brain metabolism inteenagers with attention-deficit hyperactivity disorder. Archives of General Psychiatry,50, 333-340.
Zametkin, A., Nordahl, T.E., Gross, M., King, A.C., Semple, W.E., Rumsey, J.,Hamburger, S. & Cohen, R.M. (1990). Cerebral glucose metabolism in adults withhyperactivity of childhood onset. The New England Journal of Medicine, 323, 1361-1366.
Zentall, S.S. & Zentall, T.R. (1983). Optimal stimulation: A model of disorderedactivity and performance in normal and deviant children. Psychological Bulletin, 94,446-471.
347

Zoccolillo, M. (1993). Gender and the development of conduct disorder. Developmentand Psychopathology, 5, 65-78.
Zuckerman, M. (1996). The psychobiological model for impulsive unsocializedSensation Seeking: A comparative approach. Neuropsychobiology, 34, 125-129.
348

Appendix A
349
UK norms for the Revised Conners'
Teacher Rating Scale
A.1 Introduction
The Conners' scales are widely used to obtain ratings from teachers and parents on
a range of problem behaviours in children. An advantage of the revised, shorter
versions of the original scales - the Conners' Teacher Rating Scale CTRS-28 and
the Conners' Parent Rating Scale CPRS-48 (Goyette, Conners & Ulrich, 1978) - is
that they are relatively quick to complete. Data exists to support the validity and
reliability of the original Conners' scales; fewer studies have investigated the
validity and reliability of the revised scales (see Conners, 1989). Edeibrock,
Greenbaum and Conover (1985) reported one-week test-retest reliabilities for the
three factors of CTRS-28 which ranged from .88 to .96.
Goyette Ct al. (1978) provided normative data for the CTRS-28. The sample was
383 children (175 females and 208 males) between the ages of 3 and 17 years. The
results are reported separately for the sexes and for five age groups (3-5, 6-8, 9-
11, 12-14 and 15-17 years): in each sex/age group cell there were on average 38
participants. Erford (1996) has pointed out that the small number of participants in
the standardisation sample poses the most serious threat to the scale's usefulness.
350
In their factor analysis of the data, Goyette et al. (1978) extracted three factors
(Conduct Problem, Hyperactivity and Inattentive-Passive) which together
accounted for 61.7% of the variance. These factors are highly similar to the first
three of the five factors which emerged in a factor analysis of the original 39-item
teacher version (Conners, 1969). In addition a Hyperactivity Index can be derived
from the CTRS-28. The Hyperactivity Index is based on 10 items from the other
dimensions and constitutes the Conners' Abbreviated Symptom Questionnaire
(ASQ). Although the ASQ was originally developed as a measure of hyperactivity,
it is now considered a more general index of child psychopathology (Conners,
1989). (See Rowe and Rowe, 1997, for a critical evaluation of the revised ASQ.)
Two recent factor analytic studies report a somewhat different factor structure for
the CTRS-28. With a sample of 354 clinic-referred children aged between 6 and 16
years, Wilson and Kiessling (1988) found evidence for a six-factor solution
accounting for 69% of the variance. The Hyperactivity and Conduct factors
consisted of the same items, with one exception, as in the Goyette et al. (1978)
study. The Inattentive-Passive factor, however, split into three factors, labelled
Passive, Inattentive and Learning Problems. Items which were not, with one
exception, included in any of factors in the Goyette Ct a!. (1978) study, formed an
Unsociability factor.
Erford (1996) obtained ratings from the teachers of 540 children, aged between 5
and 10 years, in ordinary classrooms. Instead of the original three factors, four
factors emerged, which Erford (1996) labelled AD/H, Oppositional Behavior,
Emotional Lability and Passive-Withdrawal. The greatest similarity between these
new factors and the original three factors is for the AD/H factor, which consists of
all the seven items in the original Hyperactivity factor plus three additional items.
In general, the Hyperactivity factor emerges as the most robust factor. This is
reassuring, considering that the scale was originally developed to measure the
response of hyperactive children to drug treatment (Conners, 1969).
351
A further concern over the use of the scale is whether the norms are appropriate
for use with children in other countries. In the UK, Taylor and Sandberg (1984)
used the original version of the Teacher Conners (CTRS-39; Conners, 1969) with a
sample of 437 ordinary school children and a clinic-referred sample of 76 children.
The scale had moderate inter-rater reliability and stability over time and it also
distinguished the sample of clinic-referred children from the other children.
Comparisons between the mean scores for the sample of school children and the
mean scores obtained in surveys in other countries showed cross-national
differences. In general, the mean scores for the UK sample tended to fall between
the scores for a New Zealand sample (who were scoring highest; Werry &
Hawthorne, 1976) and those for US samples (Goyette et al., 1978; Werry, Sprague
& Cohen, 1975). To the best of our knowledge, UK norms for the revised
Conners' Teacher Rating Scale have not previously been reported.
Despite attempts at providing a new factor structure for the CTRS-28, researchers
and clinicians using the questionnaire are likely to rely on the Conners' rating
scales manual (Conners, 1989) and the scoring sheets, which are based on the
original factor structure and the related norms. As the scale is frequently used to
guide decisions about caseness, it is crucial that the norms are appropriate for the
population to which they are applied. The norms are based on a rather small North
American sample for which the data was collected twenty years ago. There is
clearly a need to provide up-to-date norms for the CTRS-28 with a large,
representative sample. Miller, Koplewicz and Klein (1997) provided age and sex
norms for a sample of pre-school children, but no such recent data exists for
school-age children. It was the aim of the present study to obtain norms for British
children aged 7 to 11 years.
The original study, as well as more recent surveys, have reported sex and age
effects for the CTRS-28. Teachers consistently rate younger children higher on the
352
Hyperactivity and Conduct Problem dimensions, indicating more problematic
behaviour (Goyette et a!., 1978; Wilson & Kiessling, 1988). Males obtain higher
scores on average than females on the Hyperactivity and Inattentive-Passive
(Goyette et a!., 1978) or Inattentive (Wilson & Kiessling, 1988) dimensions. With
the sample of pre-school children, Miller et al. (1997) similarly reported higher
scores on the Hyperactivity and Conduct Problem dimensions for younger children
and higher scores on all dimensions for boys. Most studies report no sex and age
interactions. However, using the Conners' 10-item Abbreviated Parent-Teacher
Questionnaire, which is a slightly reworded version of the Hyperactivity Index,
Rowe and Rowe (1997) reported both main effects for sex and age, as well as an
interaction for sex and age. This study had a sample of 6841 children aged 5 to 14
years and the ratings were obtained from parents.
The present study therefore aimed to obtain norms for the CTRS-28 with a large,
representative sample of 7-11-year-old British twin school children. Research
suggests that twins are representative of the general population with regard to most
demographic, diagnostic and symptomatic variables (Simonoff, 1992; Rutter &
Redshaw, 1991). Within this design it was possible to investigate whether previous
findings of sex and age effects would be replicated. Of particular relevance for
clinical use of the scale is whether the present data would replicate the cut-off
points for 'extreme' groups, children scoring particularly highly on the
dimensions.
A.2 Method
A.2.1 Recruitment of the sample
The participants were twin pairs who represent a general population sample of
same-sex twins aged between 7 and 11 years. They were recruited to take part in a
353

twin study on hyperactivity. We obtained permission from 16 Local Education
Authorities (LEAs) in the UK to approach the primary schools in their area. Of the
LEAs we approached, only one was unwilling for us to make contact with schools
in their area as they were already taking part in another large-scale research
project. The criterion we used in choosing the LEAs was their geographical
location - as close to London as possible. However, we had to exclude most of the
London LEAs, as these had recently taken part in another twin study (Hohnen &
Stevenson, in press).
After obtaining permission from the LEAs, we then wrote to the head teachers of
all the primary schools within the LEAs (including special schools). There were
2439 schools taking children in the age range of 7-11 years in this area. We asked
the class teachers of any twins fulfilling the criteria for our study (same-sex twins;
date of birth between 1 September 1985 and 1 September 1990) to complete the
Teacher Conners' (CTRS-28; Goyette, Conners & Ulrich, 1978) - one for each
twin. As many schools have a policy of placing the members of a twin pair in
separate classes, different teachers may have rated each twin's behaviour. We sent
one reminder letter to those schools which did not reply to our initial letter.
We received replies from 1629 (66.8%) schools. Of those schools which replied to
our letter, only 59 indicated that they did not wish to take part in the study. In 858 of
the schools there were no twins fulfilling the criteria for our study. We received
Teacher Conners' for 1316 twin pairs. If there was any missing data on the
questionnaires, we contacted the person who had filled in the questionnaire to obtain
the missing items. In the very rare cases where we were unable to obtain the missing
information, we coded the missing item using the most conservative option (e.g. '0'
for 'not at all').
The mean age of the sample was 8.3 years (SD =1.5 years) and of the 1316 twin
pairs, 52.4% were girls and 47.6% boys.
354
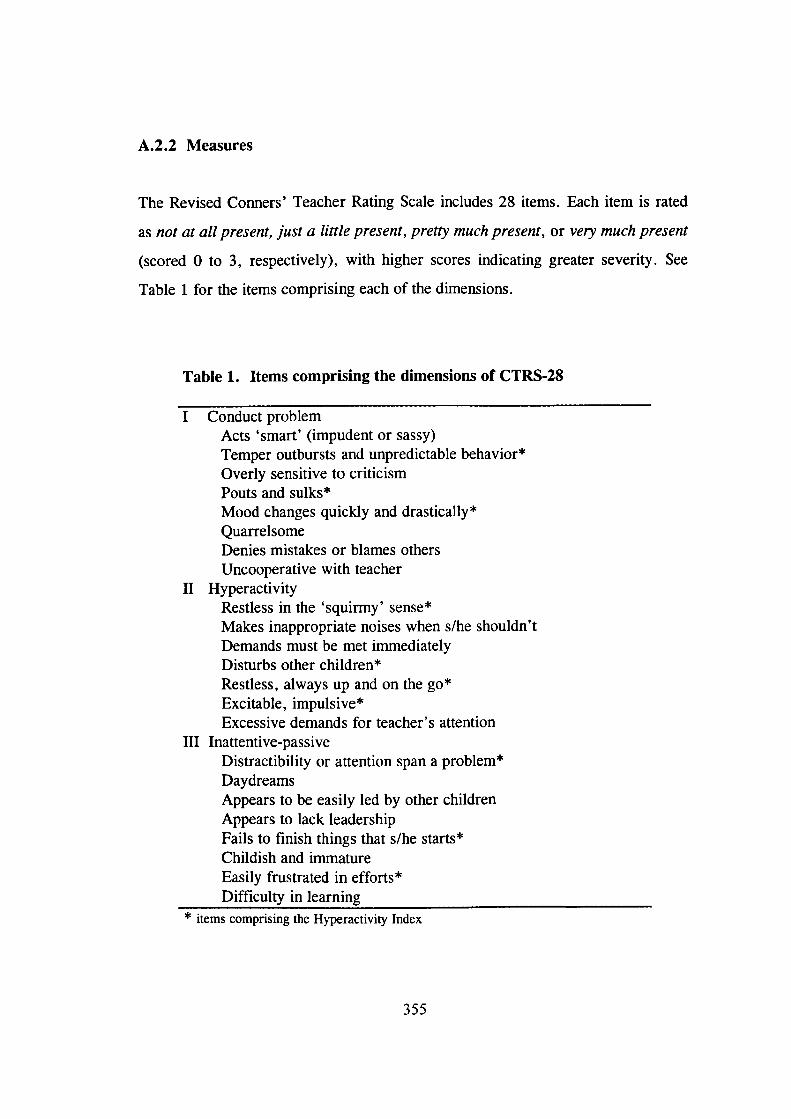
A.2.2 Measures
The Revised Conners' Teacher Rating Scale includes 28 items. Each item is rated
as not at all present, just a little present, pretty much present, or very much present
(scored 0 to 3, respectively), with higher scores indicating greater severity. See
Table 1 for the items comprising each of the dimensions.
Table 1. Items comprising the dimensions of CTRS-28
Conduct problemActs 'smart' (impudent or sassy)Temper outbursts and unpredictable behavior*Overly sensitive to criticismPouts and sulks*Mood changes quickly and drastically*QuarrelsomeDenies mistakes or blames othersUncooperative with teacher
II HyperactivityRestless in the 'squirmy' sense*Makes inappropriate noises when s/he shouldn'tDemands must be met immediatelyDisturbs other children*Restless, always up and on the go*Excitable, impulsive*Excessive demands for teacher's attention
III Inattentive-passiveDistractibility or attention span a problem*DaydreamsAppears to be easily led by other childrenAppears to lack leadershipFails to finish things that s/he starts*Childish and immatureEasily frustrated in efforts*Difficulty in learning
* items comprising the Hyperactivity Index
355
A.3 Results
Table 2 shows the means and standard deviations for each of the dimensions, for
the total sample and for each age group separately, further divided by sex. To
follow the procedure Goyette et al. (1978) adopted, item scores were summed
within each factor and then divided by the number of items constituting the factor,
to yield a mean score.
Table 3 shows a comparison of the mean scores between the present sample and
the standardisation sample of Goyette et al. (1978). Results using Fisher's formula
for t-tests (Guilford, 1965, p. 183) showed that the differences between the means
of the two samples were non-significant for the older age group and significant for
the younger age group only in two cases: boys in the present sample obtained
higher scores on the Conduct problem dimension and girls obtained higher scores
on the Hyperactivity dimension.
356
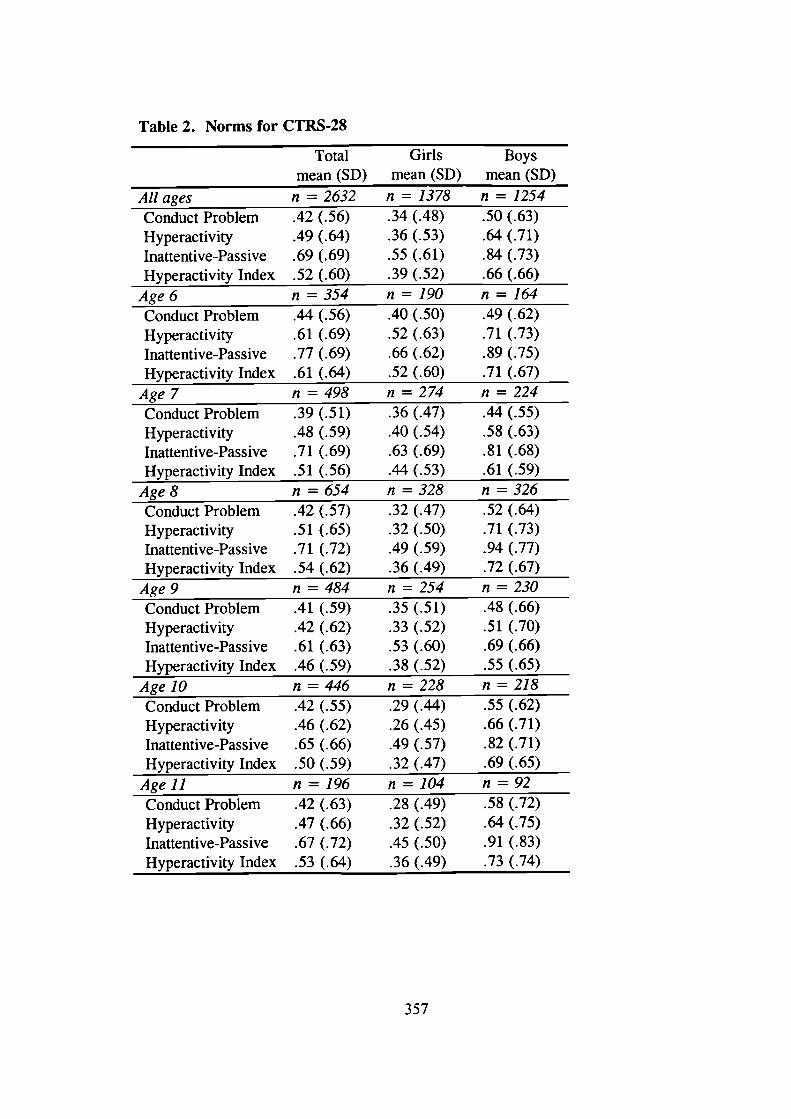
Table 2. Norms for CTRS-28
Total Girls Boysmean (SD) mean (SD) mean (SD)
All ages n = 2632 n 1378 n = 1254Conduct Problem .42 (.56) .34 (.48) .50 (.63)Hyperactivity .49 (.64) .36 (.53) .64 (.7 1)Inattentive-Passive .69 (.69) .55 (.61) .84 (.73)
Hyperactivity Index .52 (.60) .39 (.52) .66 (.66)
Age6 n=354 n=190 n=164Conduct Problem .44 (.56) .40 (.50) .49 (.62)Hyperactivity .61 (.69) .52 (.63) .71 (.73)Inattentive-Passive .77 (.69) .66 (.62) .89 (.75)
Hyperactivity Index .61 (.64) .52 (.60) .71 (.67)
Age7 n=498 n=274 n=224Conduct Problem .39 (.5 1) .36 (.47) .44 (.55)Hyperactivity .48 (.59) .40 (.54) .58 (.63)Inattentive-Passive .71 (.69) .63 (.69) .81 (.68)
Hyperactivity Index .51 (.56) .44 (.53) .61 (.59)
Age 8 n = 654 n = 328 n = 326Conduct Problem .42 (.57) .32 (.47) .52 (.64)Hyperactivity .51 (.65) .32 (.50) .71 (.73)Inattentive-Passive .71 (.72) .49 (.59) .94 (.77)
Hyperactivity Index .54 (.62) .36 (.49) .72 (.67)Age 9 n = 484 n = 254 n = 230Conduct Problem .41 (.59) .35 (.5 1) .48 (.66)Hyperactivity .42 (.62) .33 (.52) .51 (.70)Inattentive-Passive .61 (.63) .53 (.60) .69 (.66)
Hyperactivity Index .46 (.59) .38 (.52) .55 (.65)Age 10 n = 446 n = 228 n = 218Conduct Problem .42 (.55) .29 (.44) .55 (.62)Hyperactivity .46 (.62) .26 (.45) .66 (.71)Inattentive-Passive .65 (.66) .49 (.57) .82 (.71)
Hyperactivity Index .50 (.59) .32 (.47) .69 (.65)
Agell n=196 n=104 n=92Conduct Problem .42 (.63) .28 (.49) .58 (.72)Hyperactivity .47 (.66) .32 (.52) .64 (.75)Inattentive-Passive .67 (.72) .45 (.50) .91 (.83)
Hyperactivity Index .53 (.64) .36 (.49) .73 (.74)
357
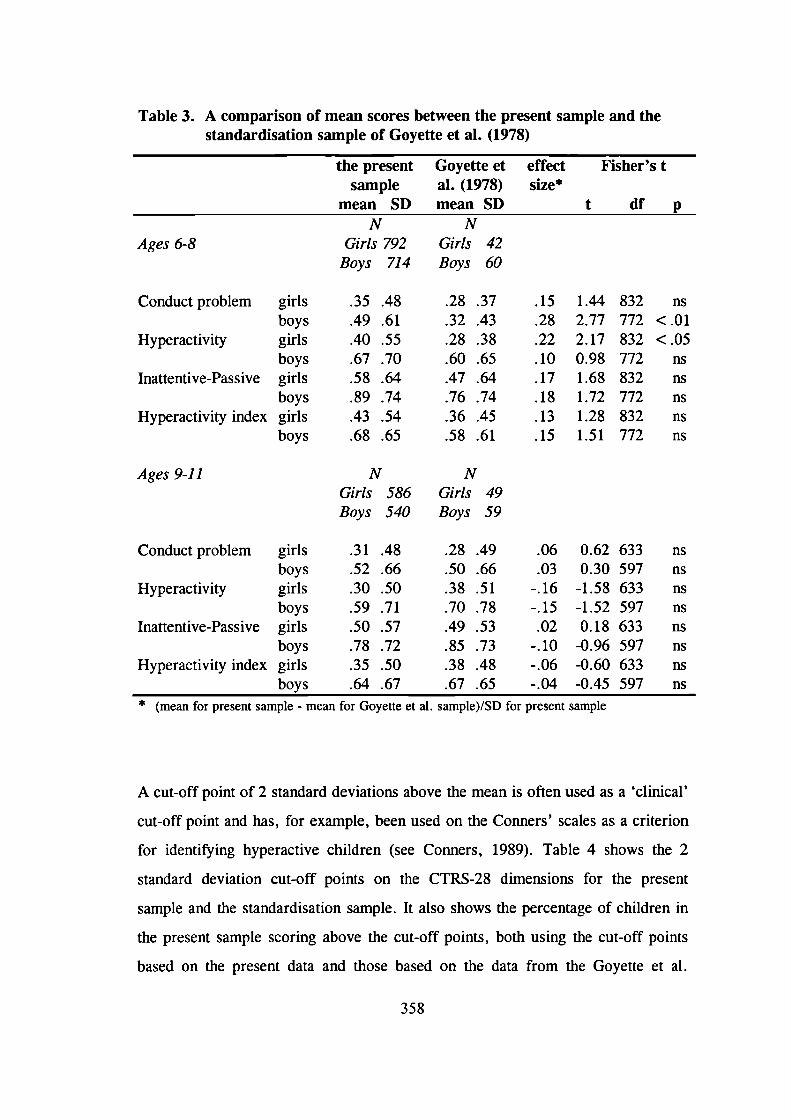
.15
.28
.22
.10
.17
.18
.13
.15
1.442.772.170.981.681.721.281.51
832772832772832772832772
Table 3. A comparison of mean scores between the present sample and thestandardisation sample of Goyette et al. (1978)
the present Goyette et effect Fisher's tsample al. (1978) size*
mean SD mean SD t df pN N
Ages 6-8 Girls 792 Girls 42Boys 714 Boys 60
Conduct problem girlsboys
Hyperactivity girlsboys
Inattentive-Passive girlsboys
Hyperactivity index girlsboys
.35 .48
.49 .61
.40 .55
.67 .70
.58 .64
.89 .74
.43 .54
.68 .65
.28 .37
.32 .43
.28 .38
.60 .65
.47 .64
.76 .74
.36 .45
.58 .61
ns<.01<.05
nsnsnsnsns
Ages 9-11
N
NGirls 586 Girls 49Boys 540 Boys 59
Conduct problem girls .31 .48 .28 .49 .06 0.62 633 ns
boys .52 .66 .50 .66 .03 0.30 597 nsHyperactivity girls .30 .50 .38 .51 -.16 -1.58 633 ns
boys .59 .71 .70 .78 -.15 -1.52 597 ns
Inattentive-Passive girls .50 .57 .49 .53 .02 0.18 633 ns
boys .78 .72 .85 .73 -.10 -0.96 597 ns
Hyperactivity index girls .35 .50 .38 .48 -.06 -0.60 633 ns
boys .64 .67 .67 .65 -.04 -0.45 597 ns* (mean for present sample - mean for Goyette et a!. sample)/SD for present sample
A cut-off point of 2 standard deviations above the mean is often used as a 'clinical'
cut-off point and has, for example, been used on the Conners' scales as a criterion
for identifying hyperactive children (see Conners, 1989). Table 4 shows the 2
standard deviation cut-off points on the CTRS-28 dimensions for the present
sample and the standardisation sample. It also shows the percentage of children in
the present sample scoring above the cut-off points, both using the cut-off points
based on the present data and those based on the data from the Goyette et al.
358
(1978) study. The significance of these differences in the numbers of children
scoring above and below the present and original cut-off points were tested using
the McNemar's test.
For the older age group, an equal percentage of children score above the present
and original 2 standard deviation cut-off points in five cases. For the Inattentive-
Passive dimension, the present cut-off points identify fewer girls but more boys
than the original cut-off points. These differences are significant at the 0.05 level,
but rather small in magnitude. Boys' scores on the Hyperactivity dimension bring
out the greatest difference: using the present cut-off point 5.4% of boys, whereas
using the original cut-off point only 3.4% of them, would be identified as clinically
hyperactive using this criterion.
In the case of the younger age group, the present 2 standard deviation cut-off
points consistently identify a smaller percentage of children than do the original
cut-off points for the same sample. The largest difference holds for Conduct
problems in boys, with the present cut-off point identifying 5.2% of the boys,
compared to 11.3 % using the original cut-off point.
359
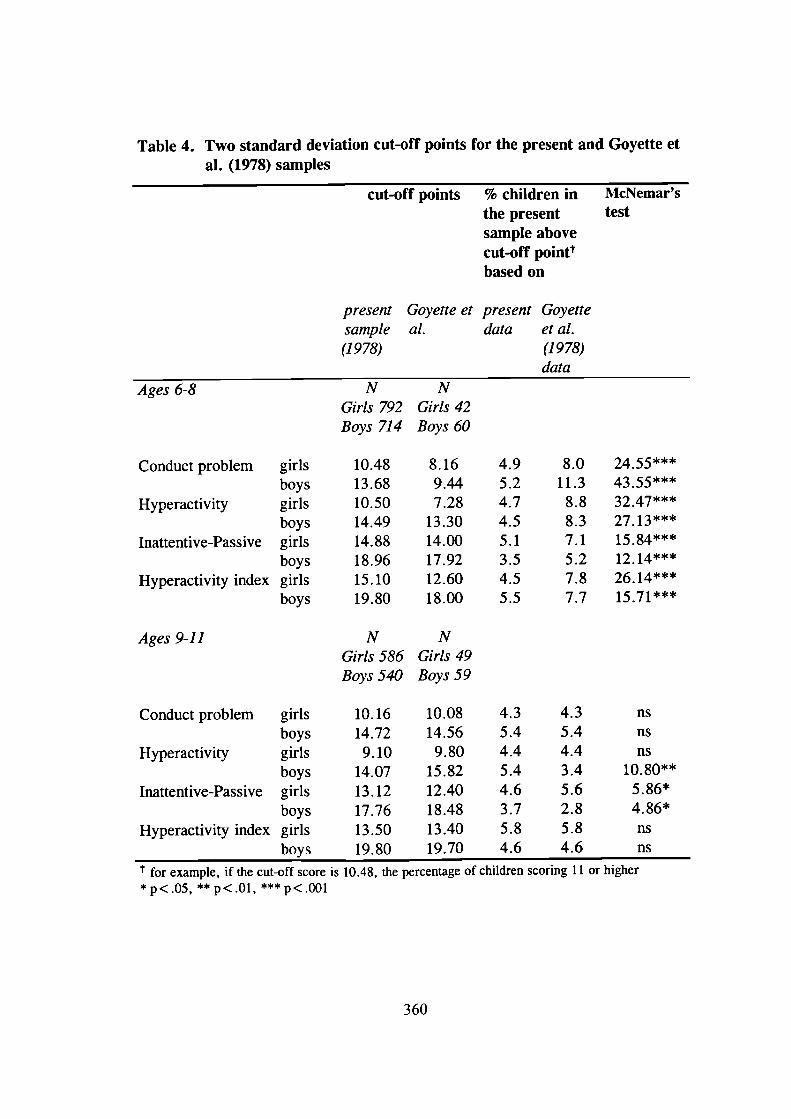
Table 4. Two standard deviation cut-off points for the present and Goyette etal. (1978) samples
cut-off points % children in McNemar'sthe present testsample abovecut-off poiflttbased on
present Goyette et present Goyettesample al. data et a!.(1978) (1978)
data
4.9
8.0
5.2
11.3
4.7
8.8
4.5
8.3
5.1
7.1
3.5
5.2
4.5
7.8
5.5
7.7
Ages 6-8
Conduct problem girlsboys
Hyperactivity girlsboys
Inattentive-Passive girlsboys
Hyperactivity index girlsboys
Ages 9-11
NGirls 792Boys 714
10.4813.6810.5014.4914.8818.9615.1019.80
NGirls 586Boys 540
NGirls 42Boys 60
8.169.447.28
13.3014.0017.9212.6018.00
NGirls 49Boys 59
24.554355***32.47***27. 13***15.84***12. 14***26.14***15.7
Conduct problem girls 10.16 10.08 4.3 4.3 ns
boys 14.72 14.56 5.4 5.4 nsHyperactivity girls 9.10 9.80 4.4 4.4 ns
boys 14.07 15.82 5.4 3.4 10.80"
Inattentive-Passive girls 13.12 12.40 4.6 5.6 5.86*
boys 17.76 18.48 3.7 2.8 4.86*
Hyperactivity index girls 13.50 13.40 5.8 5.8 ns
boys 19.80 19.70 4.6 4.6 ns
for example, if the cut-off score is 10.48, the percentage of children scoring 11 or higher*p<.05, **p< . Ol , ***p<.00l
360
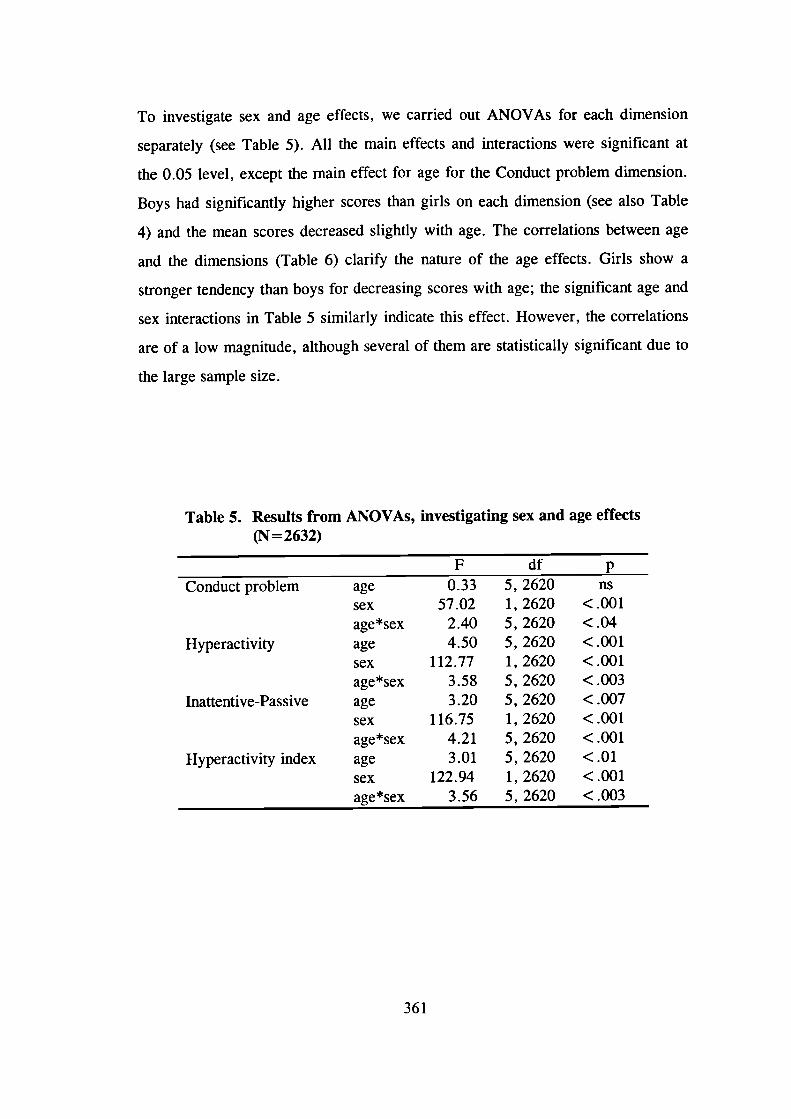
To investigate sex and age effects, we carried out ANOVAs for each dimension
separately (see Table 5). All the main effects and interactions were significant at
the 0.05 level, except the main effect for age for the Conduct problem dimension.
Boys had significantly higher scores than girls on each dimension (see also Table
4) and the mean scores decreased slightly with age. The correlations between age
and the dimensions (Table 6) clarify the nature of the age effects. Girls show a
stronger tendency than boys for decreasing scores with age; the significant age and
sex interactions in Table 5 similarly indicate this effect. However, the correlations
are of a low magnitude, although several of them are statistically significant due to
the large sample size.
Table 5. Results from ANOVAs, investigating sex and age effects(N = 2632)
F df pConduct problem age 0.33 5, 2620 ns
sex 57.02 1,2620 <.001age*sex 2.40 5,2620 <.04
Hyperactivity age 4.50 5, 2620 <.001sex 112.77 1,2620 <.001age*sex 3.58 5,2620 <.003
Inattentive-Passive age 3.20 5, 2620 <.007sex 116.75 1,2620 <.001age*sex 4.21 5,2620 <.001
Hyperactivity index age 3.01 5, 2620 <.01sex 122.94 1,2620 <.001age*sex 3.56 5, 2620 <.003
361
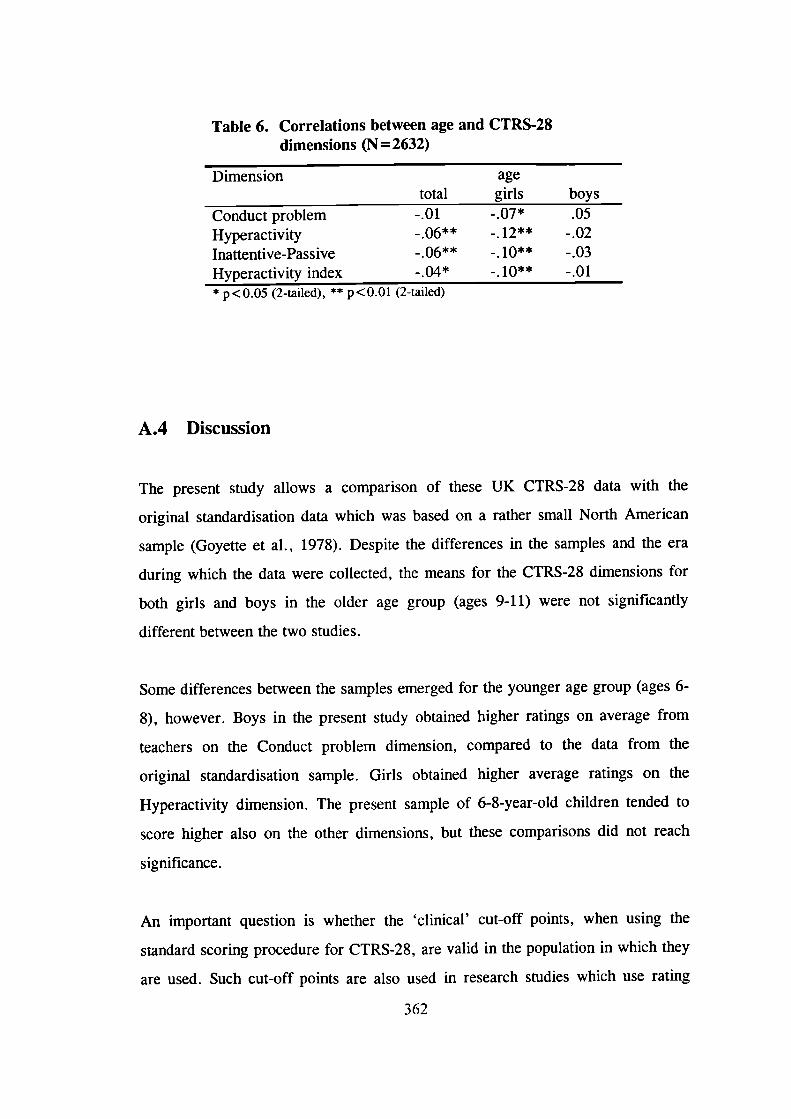
Table 6. Correlations between age and CTRS-28dimensions (N=2632)
Dimension agetotal girls boys
Conduct problem -.01 .05
Hyperactivity - .06** -. 12** - .02Inattentive-Passive _.06** -. 10** -.03Hyperactivity index -.10 -.01* p<O.O5 (2-tailed), ** p<O.Ol (2-tailed)
A.4 Discussion
The present study allows a comparison of these UK CTRS-28 data with the
original standardisation data which was based on a rather small North American
sample (Goyette et a!., 1978). Despite the differences in the samples and the era
during which the data were collected, the means for the CTRS-28 dimensions for
both girls and boys in the older age group (ages 9-11) were not significantly
different between the two studies.
Some differences between the samples emerged for the younger age group (ages 6-
8), however. Boys in the present study obtained higher ratings on average from
teachers on the Conduct problem dimension, compared to the data from the
original standardisation sample. Girls obtained higher average ratings on the
Hyperactivity dimension. The present sample of 6-8-year-old children tended to
score higher also on the other dimensions, but these comparisons did not reach
significance.
An important question is whether the 'clinical' cut-off points, when using the
standard scoring procedure for CTRS-28, are valid in the population in which they
are used. Such cut-off points are also used in research studies which use rating
362
scales as a screening instrument. There is undoubtedly an arbitrary nature to any
cut-off points on rating scales. However, such cut-off points are useful for
identifying 'extreme' groups, children scoring particularly highly on a behavioural
dimension. For example, if a T-score of 70 (2 standard deviations above the mean)
is used to identify such an extreme group, it is important that the norms, on which
the T-scores are based, generalise to the population in question.
The present data show that, for the older age group, a T-score cut-off point of 70
would have resulted for most dimensions in identifying an identical 'extreme'
group as using a 2 standard deviation cut-off point based on the present norms.
Approximately 4-5 % of the children obtained scores above these cut-off points.
There were only three exceptions. On the Inattentive-Passive dimension the present
cut-off point identified fewer girls but a larger number of boys than the original
cut-off points, although the differences were only 1 % in magnitude. On the
Hyperactivity dimension, 5.4% of boys scored above the present cut-off point and
3.4% above the original cut-off point. This finding is particularly relevant, as the
Conners' scales are frequently used to guide the identification of hyperactive
children.
In contrast, the results for the younger age group indicate how noticeably different
populations can form the 'extreme' groups, depending on the generalisability of the
norms. Whereas between 5.2% and 11.3 % of the children obtained scores at or
above the standardisation T-scores of 70, only between 3.5% and 5.2% of them
were in the 'extreme' groups when using the 2 standard deviation cut-off points
based on the present data.
In line with the recent data on pre-school children (Miller et a!., 1997), boys
obtained higher scores than girls on all dimensions. The present data does not
allow an investigation of whether these sex differences could, in part, reflect a
rater bias or whether they indicate a true difference in the degree to which girls
363
and boys show the types of problem behaviours the CTRS-28 measures. A recent
review on sex differences in prevalence rates for hyperactivity (Heptinstall &
Taylor, 1996) concludes that the male excess is a true finding and not due to rater
bias.
The present data from 7-11-year-old children does not provide support for the
previously reported decline in the mean scores for conduct problems with
increasing age (Goyette et a!., 1978; Wilson & Kiessling, 1988). The rather limited
age range of the present study could, in part, explain this lack of replication. Such
a pattern emerged for the other dimensions, however. The statistically significant
age and sex interactions indicated that the decline in scores with age was greater
for girls than boys. The inconsistency between the present results and those from
previous studies, which did not report age and sex interactions (e.g. Goyette et al.,
1978), may relate to differences in sample sizes. Indeed, the study which did report
an age and sex interaction for the Hyperactivity Index (Rowe & Rowe, 1997) had a
very large sample of 6841 children. Girls may show a greater decline in mean
scores with age, at least until adolescence, but the effect is small.
Whereas the present sample is, in general, a representative sample of 7-1 1-year-old
children in Southern England, two points are worth noting. First, the children were
identified through state schools and therefore the approximately 5 % of children in
the 7-11 age range who go to private schools in the UK (Department for Education
and Employment, personal communication, February 1998) were excluded from
the study.
Second, all the children were twins, which raises the issue of whether twins are
representative of the general population or whether they are in some ways different
from singletons. Some small differences between the psychological characteristics of
twins and singletons have been found (see Plomin, DeFries, McClearn & Rutter,
1997). Twins are on average slightly delayed in language development and in
364
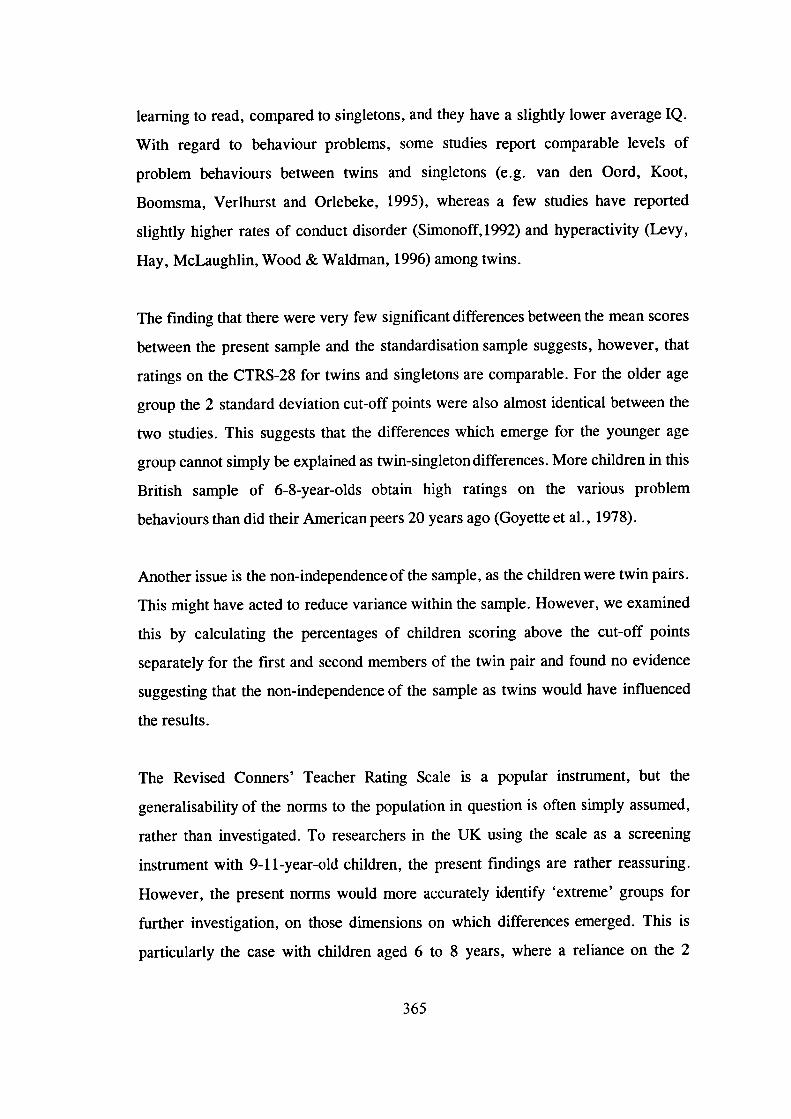
learning to read, compared to singletons, and they have a slightly lower average IQ.
With regard to behaviour problems, some studies report comparable levels of
problem behaviours between twins and singletons (e.g. van den Oord, Koot,
Boomsma, Verlhurst and Orlebeke, 1995), whereas a few studies have reported
slightly higher rates of conduct disorder (Simonoff, 1992) and hyperactivity (Levy,
Hay, McLaughlin, Wood & Waldman, 1996) among twins.
The finding that there were very few significant differences between the mean scores
between the present sample and the standardisation sample suggests, however, that
ratings on the CTRS-28 for twins and singletons are comparable. For the older age
group the 2 standard deviation cut-off points were also almost identical between the
two studies. This suggests that the differences which emerge for the younger age
group cannot simply be explained as twin-singleton differences. More children in this
British sample of 6-8-year-olds obtain high ratings on the various problem
behaviours than did their American peers 20 years ago (Goyette et al., 1978).
Another issue is the non-independence of the sample, as the children were twin pairs.
This might have acted to reduce variance within the sample. However, we examined
this by calculating the percentages of children scoring above the cut-off points
separately for the first and second members of the twin pair and found no evidence
suggesting that the non-independence of the sample as twins would have influenced
the results.
The Revised Conners' Teacher Rating Scale is a popular instrument, but the
generalisability of the norms to the population in question is often simply assumed,
rather than investigated. To researchers in the UK using the scale as a screening
instrument with 9-11-year-old children, the present findings are rather reassuring.
However, the present norms would more accurately identify 'extreme' groups for
further investigation, on those dimensions on which differences emerged. This is
particularly the case with children aged 6 to 8 years, where a reliance on the 2
365

standard deviation cut-off points based on the original norms would lead to the
identification of substantially larger groups of children than would the use of similar
cut-off points based on the present data. Similar investigations in other countries
could clarify the issue of the extent to which the differences are the result of cross-
cultural factors.
366

Appendix B
367
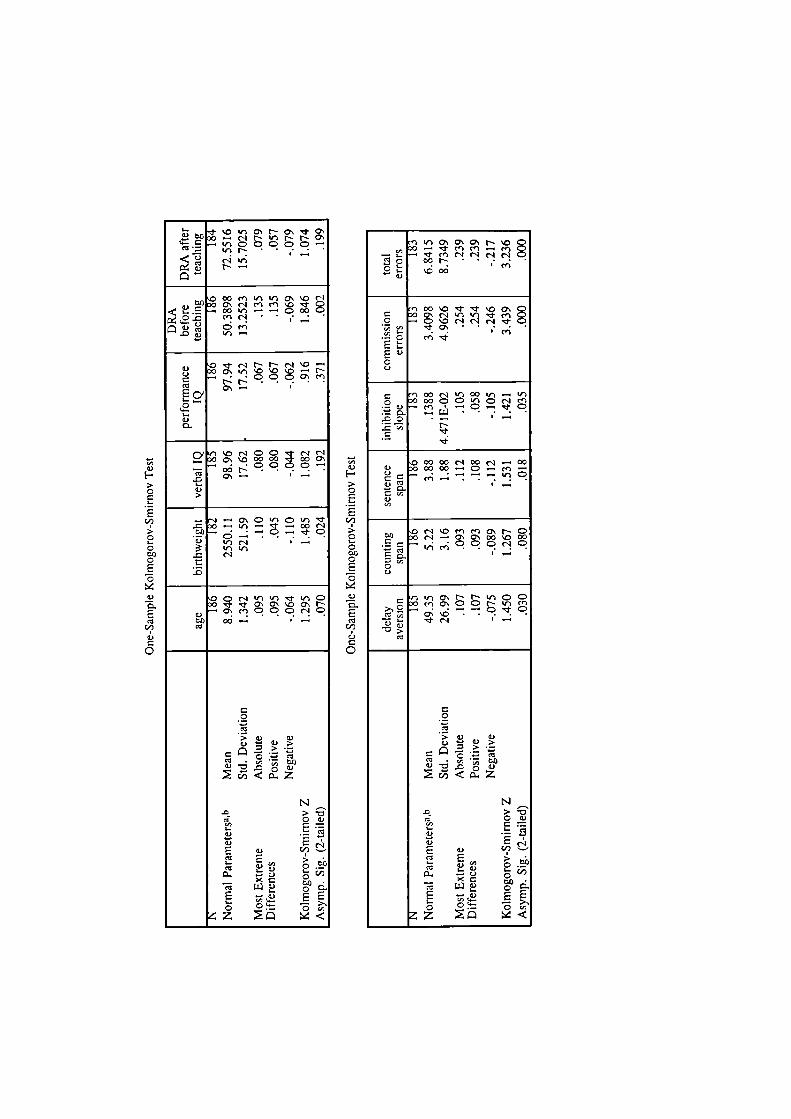
>CES
00
C
C01)C
SC
a)
0.
SCl
00
a)00
'Ca0.)
F->CCI-
S00
0-CI-C00CSC
a)0.
SCO
00a)C0
0 - C'1 N N N O-.E -.(t,CCQCC
N .-
0 00 en If O\ .O r'01) o c c-i en en '.o 'Cf
lC-.._ 00flC00enc- —Cm
a)C.)
O\
I-a)
0' - '.0 r-1 C C .Cf c-a c-I- 0 Q\ '.0 00 00 'aj 00
.CC
.0 OI-0)>
-I - O C 'r C) 'r 'Cf.0 0 If) - 'Cf -. 00 C')
c; , — — ca) If)c_') —Ir,Ir,.0 C')t.0
O C C'I ") If) 'ml- ir, C0 'ml- 'ml' O 0" '.b 0 N
a) CaCenQCCC
00
0C
Cl0)
0
.
N.0,
a)E a)CO
1<0
EEo
0'\ 0' 0'. N '.0'0 - 'ml- en en - en— ,. - en c--I c-I c--I c--Ic00N ......'.cod0)
fl 00 '0 '0
.2 -'C'.0C"lC"Ic--l-'Cf O ••enen
E0)CC)
Co '0O0CC"CC'Ien
a) - en — C — C.o- — .......00 •-
N'2
O 00 00 C') 00 C') - 00a) o 00 00 — C — en —
a)C1)
a)'I,
O C'-) '.0 en en O\ N C00 0c'--a\o00\000-. c. Q I-0C)
If) O N N Ir C C0 en 0' C C N Ii' en
-: — C' - C'
•0CO
C
C
CO
>a) a)
• '2 '0 COd. '
N.0Ca Ca)
E c-
S0) 00'-..-
- a) 0_
S '—, 55
C '2'
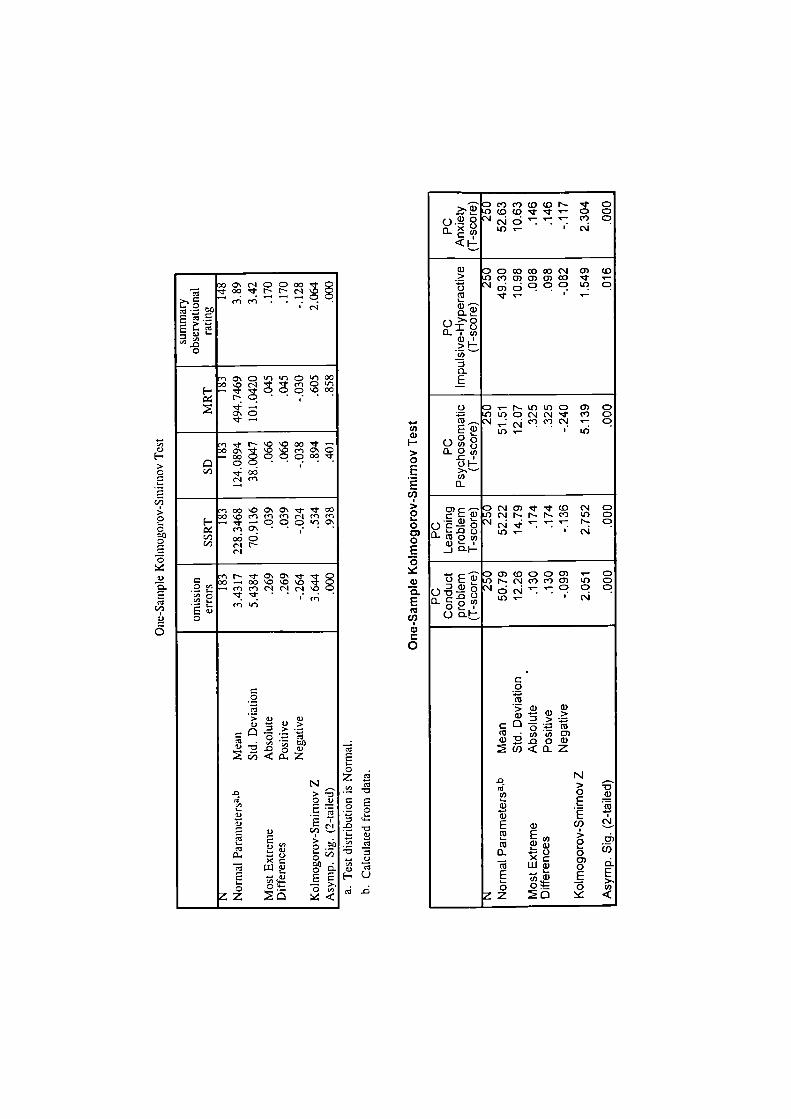
0 0'. (1 C) C) 00- r 00 - N N
eneflC'I
E'I,.00
- '. C) It) It) C) It) 000 '.0 C'l "i ' en C)
H - CO 00N•C)•
- N '.0 '.0 00 —0 0) ' '.0 '.0 en 0)
00 C) CO C) C) 00
Cl) 00en
') 00 '.0 0'. 0' j It 000 '.0 en en en ri en en
H - — C) C) I1I 0'eno\oddIC/)C.'.'
) N 'It 0'. 0) It= o_.0000'.0'.0.9 - en en r.' c' ç'.
E-'- enit)
0
C0
I• :N
,0 >'00)
9'° 90.. C/)
- 0.
E0
'I,0)H0-0
C0')0-00000
0:41)
0..
CCl
0'00)C0
4..CO0)I-0-0L.
EC,)>0I-0C)0E0
0)0.ECO
Cl)0)
0
zClCl
. 0
'0"C Cl
0- C,)
HO
"Dc)(O(ON It C)I_ C) (0 (0 'It It '- C) C)
c') C)'4,'- I C"1
<I-
(1) 0 0 0) 0) CO ('1 0) (0.2 C) CC) 0) 0) 0) 0) It.i '.1O)d00 U) C)
It'-
> 0'-"I 0
0).>1'-Cl)0
E
o D - N- U) U) (0 0) C)C) U) C) ('.1 ('1 It (', C)
cC)C)('J '-: dlU)
0
0O(l)
01-0-.' .'-C/)0
C)) - - 0 C.'.' 0) It It (0 ('4 C)CC0)0C'.JN-rN e) 4, C)
o'E'4.'.'-' N C)L0 • ('4
-J 0H
)O)(00C)0) '- C)O cE N-.' cCc.' o U) C)
o--30 Q
U)'- C'.'
ob _____________
C0
CO
0) 0)
CO(0 ' Cl) C/) C)0) .. .o 0 0)
N
> -D
a) . .E
E a, -) -(° E >
00 .0
L1J
0 0 0 Cl)z 0
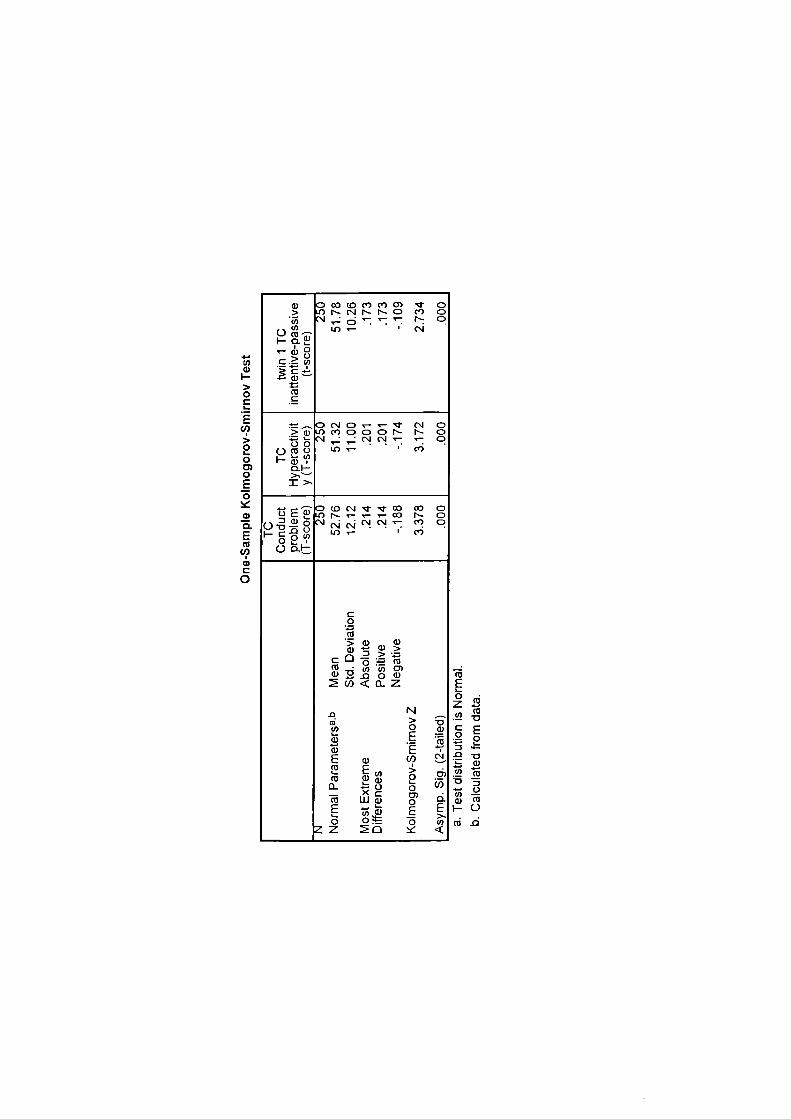
4-.U)a)I->0
E
>0I-00E0a)0.EC',
a)
0
a, D CO CO C) C) 0) CD> 0 N- ('J N- N- C) CO C)
- d'' N C)• C,l
C
.c a,
C',C
-DC'JC)---'J (sJ C)> a) 0 CO C) C) C) N- N- C)
' C)c',o U)- • c')
01->-'----I>,
.-. C D CC) C-1 'J- 'J- CO CO C)0 c 0 N- ' a) N- C)c'. c'— 2 P
HC• Lfl' COo0c-b
C0C',
•50) aa, -
C',cO)
a,
-D N03 > t3
- .a, EE (1)
Ca, 0 2
D_ -C)- XCm LI.Ja, oE - E E
-3 .:z o
1)z2C',
-D
CE2°
a, C',HO

Appendix C
371
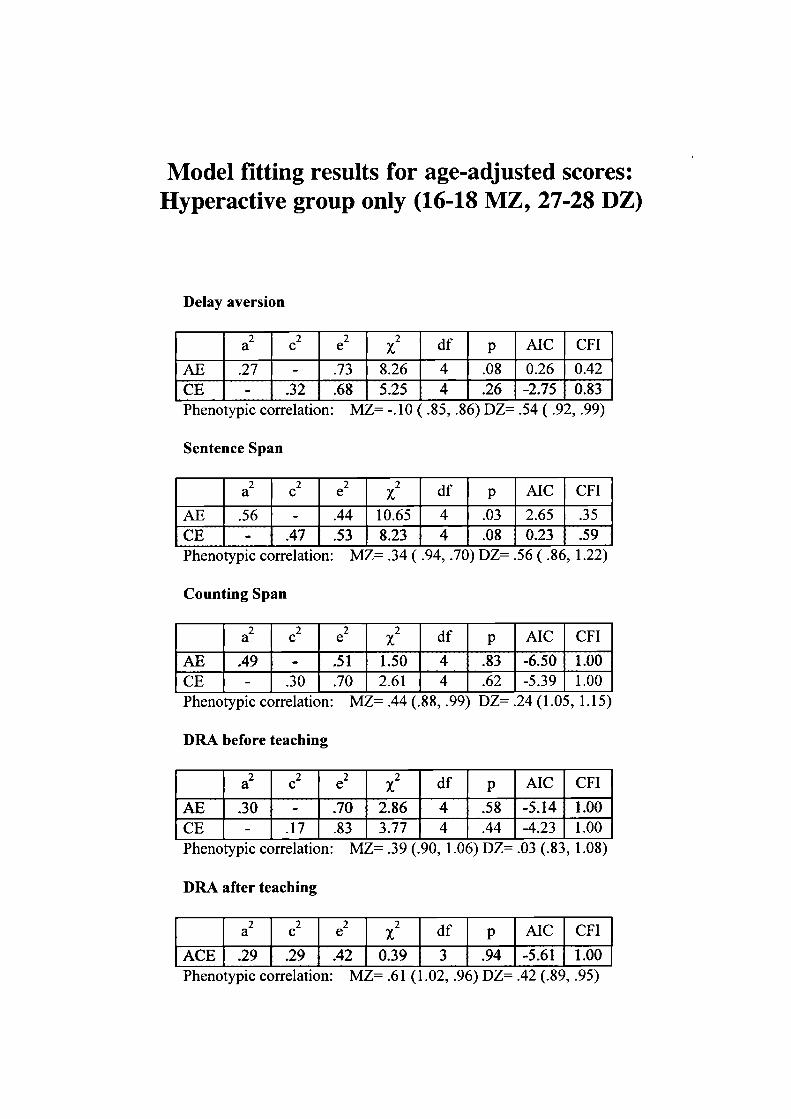
Model fitting results for age-adjusted scores:Hyperactive group only (16-18 MZ, 27-28 DZ)
Delay aversion
a2c2 e2 df p AIC CFI
AE .27 - .73 8.26 4 .08 0.26 0.42CE - .32 .68 5.25 4 .26 -2.75 0.83Phenotypic correlation: MZ= -.10 ( .85, .86) L)Z= .54 ( .92, .99)
Sentence Span
a2 c2 e2 df p AIC CFI
AE .56 - .44 10.65 4 .03 2.65 .35CE - .47 .53 8.23 4 .08 0.23 .59Phenotypic correlation: MZ= .34 ( .94, .70) DZ .56 ( .86, 1.22)
Counting Span
a2 c2 e2 2 df p AIC CFI
AE .49 - .51 1.50 4 .83 -6.50 1.00CE - .30 .70 2.61 4 .62 -5.39 1.00Phenotypic correlation: MZ= .44 (.88, .99) DZ= .24 (1.05, 1.15)
DRA before teaching
a2 c2 e2 df p AIC CFI
AE .30 - .70 2.86 4 .58 -5.14 1.00CE - .17 .83 3.77 4 .44 -4.23 1.00Phenotypic correlation: MZ= .39 (.90, 1.06) DZ .03 (.83, 1.08)
DRA after teaching
a2 c2 e2 df p AIC CFI
ACE .29 .29 .42 0.39 3 .94 -5.61 1.00Phenotypic correlation: MZ= .61 (1.02, .96) DZ= .42 (.89, .95)
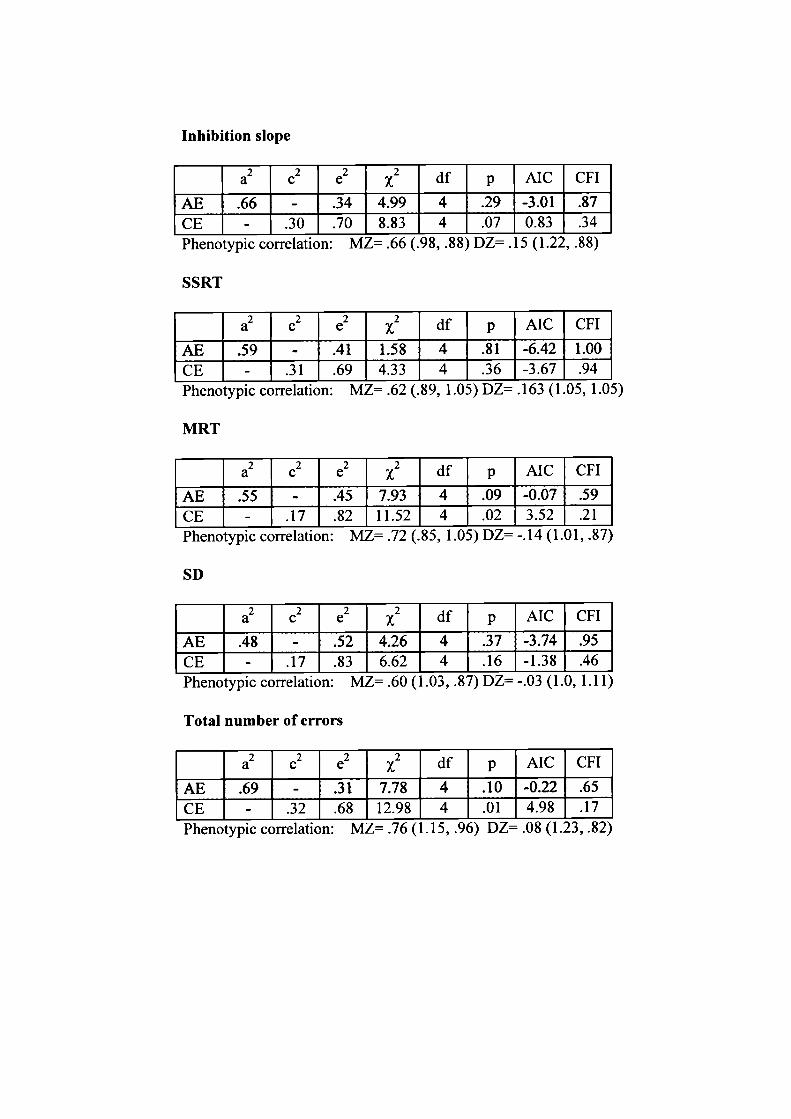
Inhibition slope
a2 c2 e2 df p AIC CFI
AE .66 - .34 4.99 4 .29 -3.01 .87CE - .30 .70 8.83 4 .07 0.83 .34Phenotypic correlation: ML= .b (.9, .) L'L= .D (1.22, .5)
SSRT
2 2 2 2a c e df p AIC CFI
AE .59 - .41 1.58 4 .81 -6.42 1.00CE - .31 .69 4.33 4 .36 -3.67 .94Phenotypic correlation: MZ= .62 (.89, 1.05) DZ= .163 (1.05, 1.05)
MRT
a2 c2 e2 df p AIC CFI
AE .55 - .45 7.93 4 .09 -0.07 .59
CE - .17 .82 11.52 4 .02 3.52 .21Phenotypic correlation: MZ= .72 (., 1.0) DL -.14 (1.U1, .S/)
SD
a2 c2 e2 2 df p AIC CFI
AE .48 - .52 4.26 4 .37 -3.74 .95
CE - .17 .83 6.62 4 .16 -1.38 .46Phenotypic correlation: MZ= .60 (1.03, .87) L)L= -.03 (1.0, 1.11)
Total number of errors
a2 c2 e2 2 df p AIC CFI
AE .69 - .31 7.78 4 .10 -0.22 .65
CE - .32 .68 12.98 4 .01 4.98 .17Phenotypic correlation: ML .IO (1.D, .9b) UL .WS (1.2i, .2)

Appendix D
374

TWIN SIMILARITY QUESTIONNAIRE {scoring instructions)
NAMESOF CHILDREN.............................................................................
NAMESOF PARENTS...............................................................................
Address..................................................................................................
Please ring the answer that iscorrect for your twins. If questions 1-6 are difficult toanswer because of the twins' age please enter N/A for not applicable.
1. Are the twins emotionally attached to each other?
N/A Strongly Somewhat Not at all
2. Do the twins have the same friends at the house?
N/A Share all friends Share some Not shared
3. Do the twins argue?
N/A A lot Sometimes Not at all
4. Do the twins try to be different from one another?
N/A Yes A little Not at all
5. Up to what age were the twins dressed alike?
Still are 8 6 4 2 Before 2
6. Has one of the twins ever told you that they should not be dressed the same any more?
N/A Yes No
7. To what extent are the twins similar at the moment for the following:
Height
Weight
Facial appearance
Hair colour
Eye colour
Complexion
Not at all (0)
Not at all (0)
Not at all (0)
Not at all (0)
Not at all (0)
Not at all (0)
Somewhat (1) Exactly (2)
Somewhat (1) Exactly (2)
Somewhat (1) Exactly (2)
Somewhat (1) Exactly (2)
Somewhat (1) Exactly (2)
Somewhat (1) Exactly (2)
8. Do they look as alike as two peas in a pod? NO (0) YES (2)
9. Do you ever confuse them? NO (0) YES (2)
10. Are they sometimes confused by other people in the family? NO (0) YES (2)
11. Is it hard for strangers to tell them apart? NO (0) YES (2)
Only numbers 7-11 receive a score as shown in brackets.

Appendix E
376
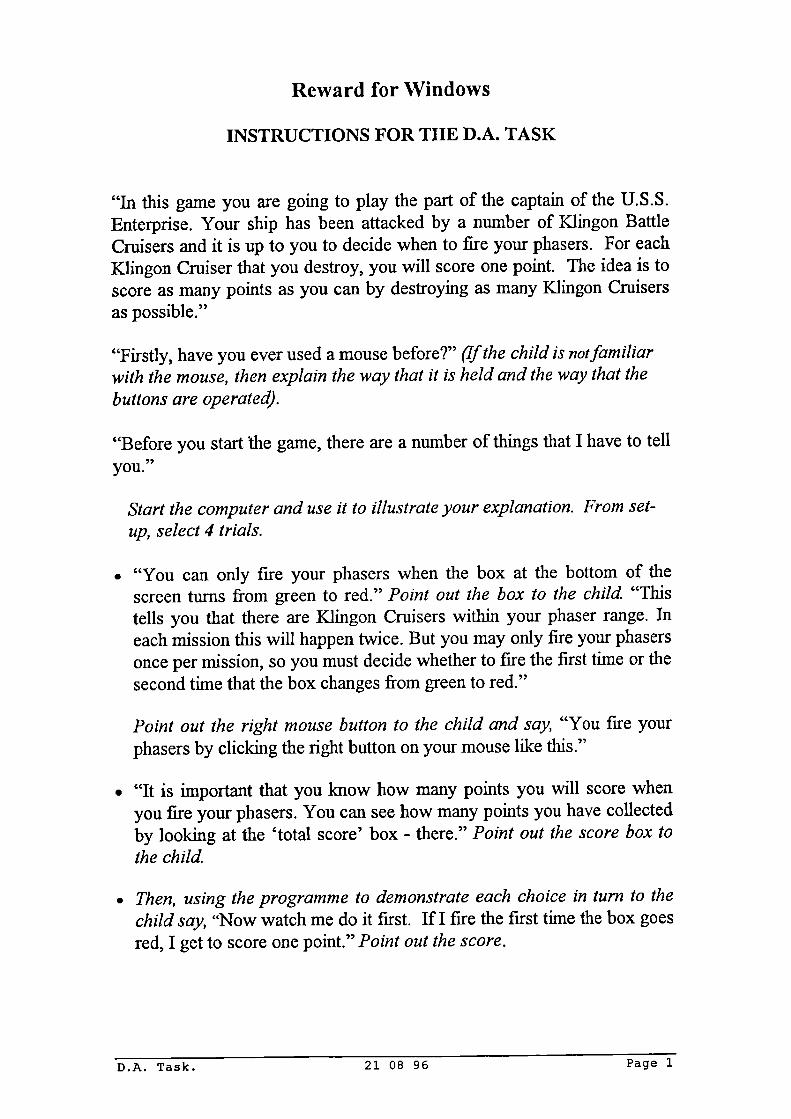
Reward for Windows
INSTRUCTIONS FOR THE D.A. TASK
"In this game you are going to play the part of the captain of the U.S.S.Enterprise. Your ship has been attacked by a number of KJingon BattleCruisers and it is up to you to decide when to fire your phasers. For eachKlingon Cruiser that you destroy, you will score one point. The idea is toscore as many points as you can by destroying as many Klingon Cruisersas possible."
"Firstly, have you ever used a mouse before?" (If the child is notfamiliarwith the mouse, then explain the way that it is held and the way that thebuttons are operated).
"Before you start the game, there are a number of things that I have to tellyou."
Start the computer and use it to illustrate your explanation. From set-up, select 4 trials.
• "You can only fire your phasers when the box at the bottom of thescreen turns from green to red." Point out the box to the child. "Thistells you that there are Klingon Cruisers within your phaser range. Ineach mission this will happen twice. But you may only fire your phasersonce per mission, so you must decide whether to fire the first time or thesecond time that the box changes from green to red."
Point out the right mouse button to the child and say, "You fire yourphasers by clicking the right button on your mouse like this."
• "It is important that you know how many points you will score whenyou fire your phasers. You can see how many points you have collectedby looking at the 'total score' box - there." Point out the score box tothe child.
• Then, using the programme to demonstrate each choice in turn to thechild say, "Now watch me do it first. If I fire the first time the box goesred, I get to score one point." Point out the score.
D.A. Task. 21 08 96 Page 1
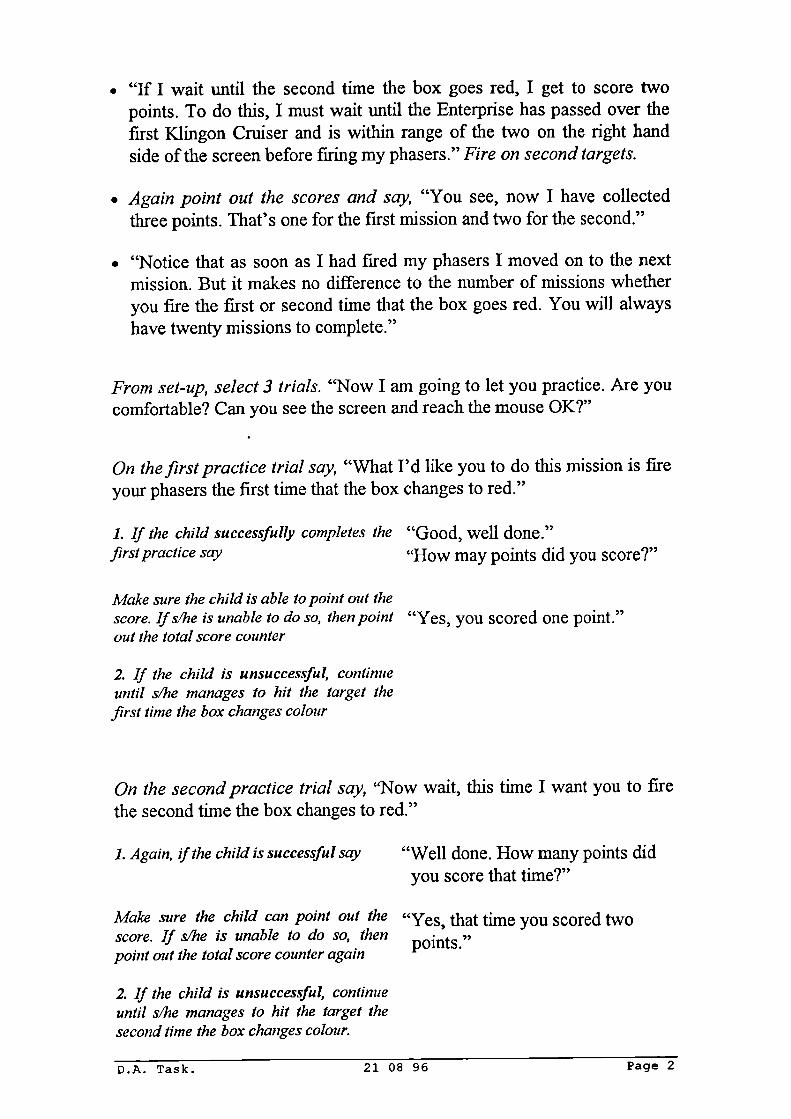
• "If I wait until the second time the box goes red, I get to score twopoints. To do this, I must wait until the Enterprise has passed over thefirst Klingon Cruiser and is within range of the two on the right handside of the screen before firing my phasers." Fire on second targets.
• Again point out the scores and say, "You see, now I have collectedthree points. That's one for the first mission and two for the second."
• "Notice that as soon as I had fired my phasers I moved on to the nextmission. But it makes no difference to the number of missions whetheryou fire the first or second time that the box goes red. You will alwayshave twenty missions to complete."
From set-up, select 3 trials. "Now I am going to let you practice. Are youcomfortable? Can you see the screen and reach the mouse OK?"
On the first practice trial say, "What I'd like you to do this mission is fireyour phasers the first time that the box changes to red."
1. If the child successfully completes the "Good, well done."first practice say "How may points did you score?"
Make sure the child is able to point out thescore. Ifs/he is unable to do so, then point "Yes, you scored one point."out the total score counter
2. If the child is unsuccessful, continueuntil s/he manages to hit the target thefirst time the box changes colour
On the second practice trial say, "Now wait, this time I want you to firethe second time the box changes to red."
1. Again, f the child is successful say "Well done. How many points didyou score that time?"
Make sure the child can point out the "Yes, that time you scored twoscore. If s/he is unable to do so, then points."point out the total score counter again
2. If the child is unsuccessful, continueuntil s/he manages to hit the target thesecond time the box changes colour.
D.A. Task. 21 08 96 Page 2
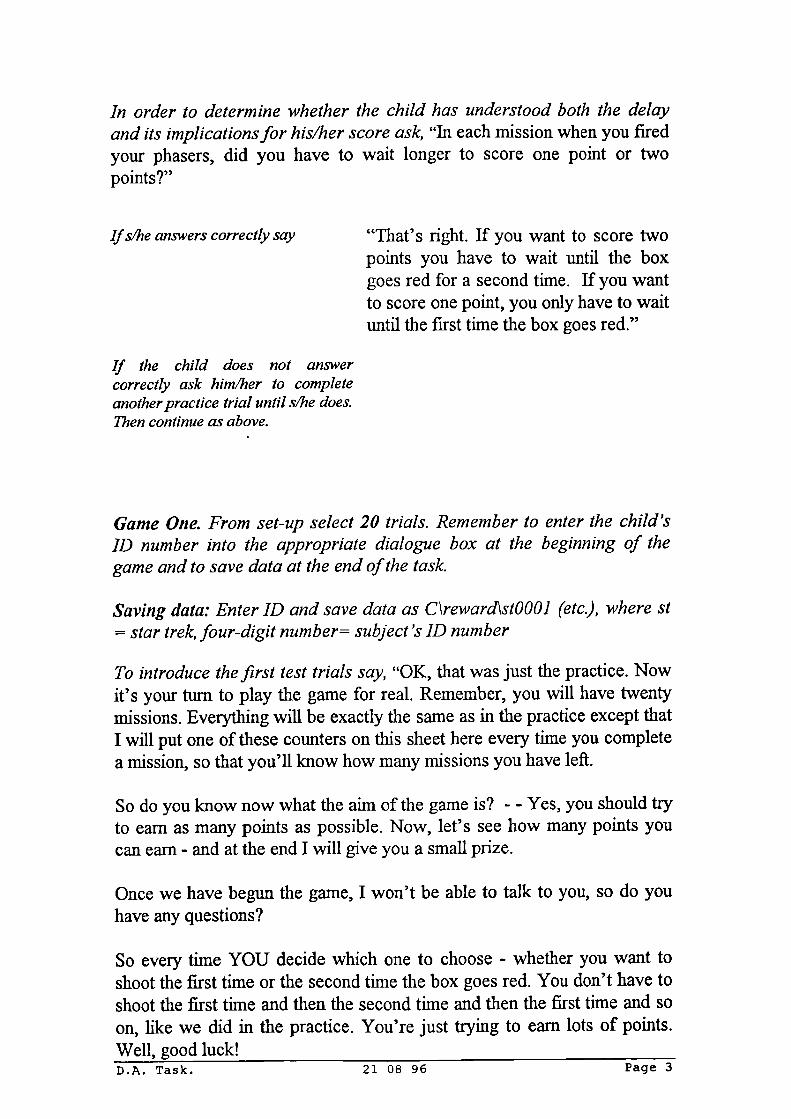
In order to determine whether the child has understood both the delayand its implications for his/her score ask, "In each mission when you firedyour phasers, did you have to wait longer to score one point or twopoints?"
Ifs/he answers correctly say "That's right. If you want to score twopoints you have to wait until the boxgoes red for a second time. If you wantto score one point, you only have to waituntil the first time the box goes red."
If the child does not answercorrectly ask him/her to completeanother practice trial until s/he does.Then continue as above.
Game One. From set-up select 20 trials. Remember to enter the child'sID number into the appropriate dialogue box at the beginning of thegame and to save data at the end of the task
Saving data: Enter ID and save data as C\reward\st000l (etc.), where St= star trek, four-digit number= subject 's ID number
To introduce the first test trials say, "OK, that was just the practice. Nowit's your turn to play the game for real. Remember, you will have twentymissions. Everything will be exactly the same as in the practice except thatI will put one of these counters on this sheet here every time you completea mission, so that you'll know how many missions you have left.
So do you know now what the aim of the game is? - - Yes, you should tryto earn as many points as possible. Now, let's see how many points youcan earn - and at the end I will give you a small prize.
Once we have begun the game, I won't be able to talk to you, so do youhave any questions?
So every time YOU decide which one to choose - whether you want toshoot the first time or the second time the box goes red. You don't have toshoot the first time and then the second time and then the first time and soon, like we did in the practice. You're just trying to earn lots of points.Well, good luck!D.A. Task. 21 08 96 Page 3

Appendix F
380
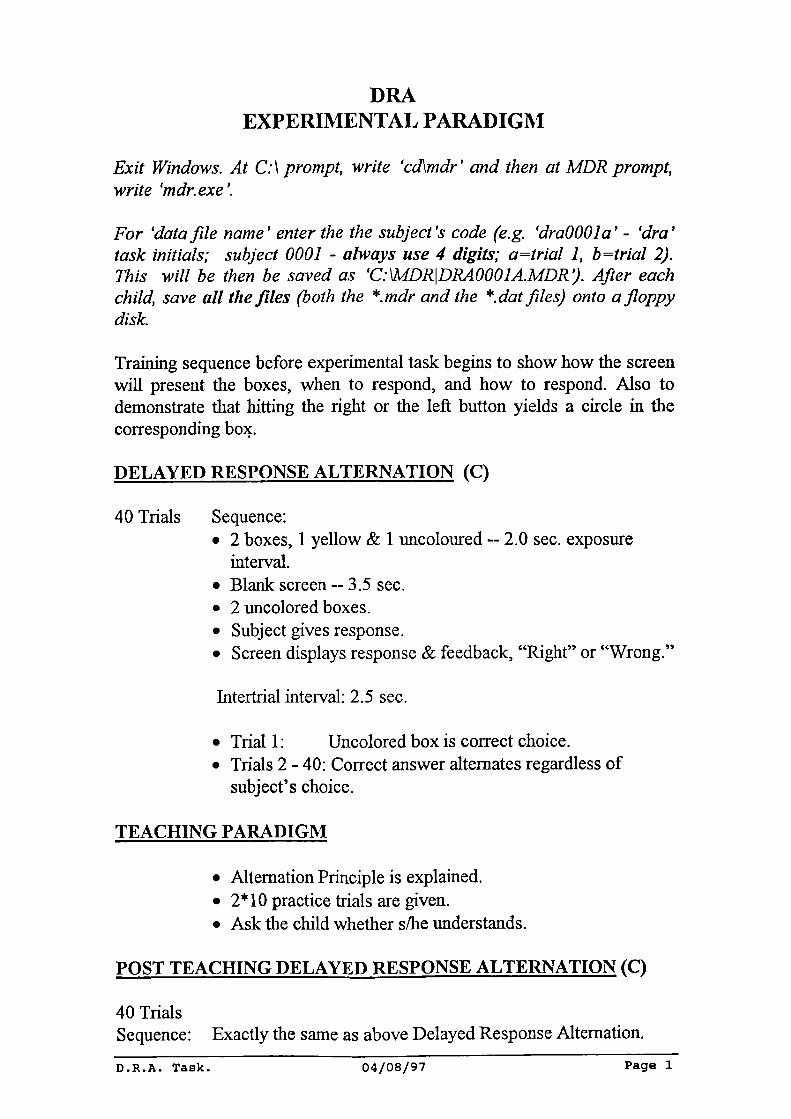
DRAEXPERIMENTAL PARADIGM
Exit Windows. At C. \ prompt, write 'cd\mdr' and then at MDR prompt,write 'mdr. exe'.
For 'data file name' enter the the subject's code (e.g. 'dra000la' - 'dra'task initials; subject 0001 - always use 4 digits; a=trial 1, b =trial 2).This will be then be saved as 'C:\MDRDRA0001A.MDR3. After eachchild, save all the files (both the *.mdr and the *.dat files) onto a floppydisk.
Training sequence before experimental task begins to show how the screenwill present the boxes, when to respond, and how to respond. Also todemonstrate that hitting the right or the left button yields a circle in thecorresponding bwç.
DELAYED RESPONSE ALTERNATION (C)
40 Trials Sequence:• 2 boxes, 1 yellow & 1 uncoloured -- 2.0 sec. exposure
interval.• Blank screen-- 3.5 sec.• 2 uncolored boxes.• Subject gives response.• Screen displays response & feedback, "Right" or "Wrong."
Intertrial interval: 2.5 sec.
• Trial 1: Uncolored box is correct choice.• Trials 2 - 40: Correct answer alternates regardless of
subject's choice.
TEACHING PARADIGM
• Alternation Principle is explained.• 2*10 practice trials are given.• Ask the child whether s/he understands.
POST TEACHING DELAYED RESPONSE ALTERNATION (C)
40 TrialsSequence: Exactly the same as above Delayed Response Alternation.
D.R.A. TaBk. 04/08/97 Page 1

INTRODUCTION TO GAME
File manager, C: mdr. exe - Select test A and move to blank screen
Now we are going to play a game using the computer screen and these twobuttons in front of you - numbers one and two. First though, let me explainhow to play the game.
In this game, the computer will select a rule and it's up to you to work outwhat that rule is. On the screen there will be two boxes that come up overand over again. One box will be blue and the other box will be empty. Bothof these will stay on the screen for a short while and you should try toremember on which side the blue and empty boxes were. This is importantbecause the rule that the computer uses has to do with the position of thesetwo boxes.
Next, the screen will go blank for a short while and after that, two emptyboxes will appear. You must then guess which of these is the correct boxaccording to the rule that the computer is using. For example, is the correctbox on the same side as the blue box was or the same side as the emptybox was? To pick the left hand box, you must press number one (here). Topick the right hand box, you must press number two (there). After youhave made your choice of box, the computer will tell you whether youwere right or wrong. The goal of the game is to make as many correctchoices as you possibly can.
Right, now we are going to practise so that you can see how the gameworks for yourself. First though, I'd like you to watch while I go through acouple of trials.
1. Start test A. Watch which side the blue box and the empty box are on.As you saw, the blue box on that screen was on the left hand side andthe empty box was on the right hand side. I have decided that I amgoing to pick the one that is on the same side as the blue box was, theleft hand side. So this time I'll press number one.
2. When the computer displays the "right" message say, Look, I got itright that time.
3. When the new screen appears say, That time the blue box was on theright hand side and the empty box was on the left hand side. This timeI'll choose the empty box, the one on the left hand side.
D.R.A. Task. 04/08/97 Page 2
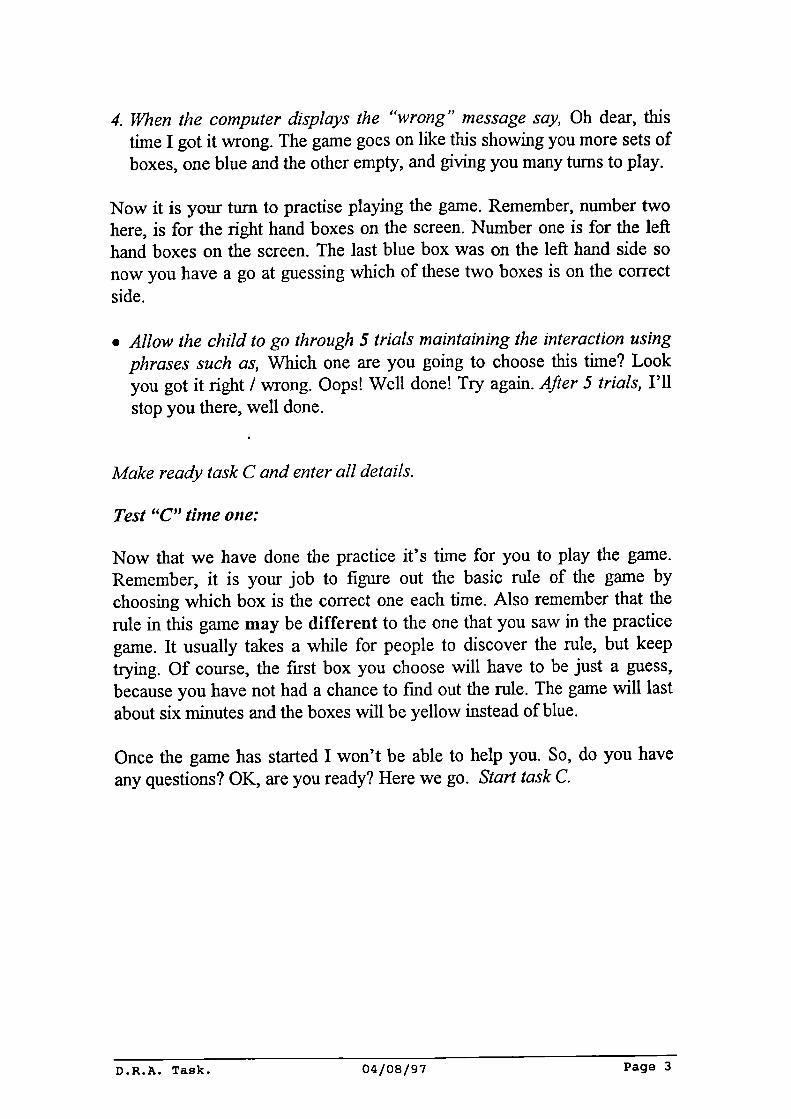
4. When the computer displays the "wrong" message say, Oh dear, thistime I got it wrong. The game goes on like this showing you more sets ofboxes, one blue and the other empty, and giving you many turns to play.
Now it is your turn to practise playing the game. Remember, number twohere, is for the right hand boxes on the screen. Number one is for the lefthand boxes on the screen. The last blue box was on the left hand side sonow you have a go at guessing which of these two boxes is on the correctside.
• Allow the child to go through 5 trials maintaining the interaction usingphrases such as, Which one are you going to choose this time? Lookyou got it right / wrong. Oops! Well done! Try again. After 5 trials, I'llstop you there, well done.
Make ready task C and enter all details.
Test "C" time one:
Now that we have done the practice it's time for you to play the game.Remember, it is your job to figure out the basic rule of the game bychoosing which box is the correct one each time. Also remember that therule in this game may be different to the one that you saw in the practicegame. It usually takes a while for people to discover the rule, but keeptrying. Of course, the first box you choose will have to be just a guess,because you have not had a chance to fmd out the rule. The game will lastabout six minutes and the boxes will be yellow instead of blue.
Once the game has started I won't be able to help you. So, do you haveany questions? OK, are you ready? Here we go. Start task C.
D.R.A. Task. 04/08/97 Page 3
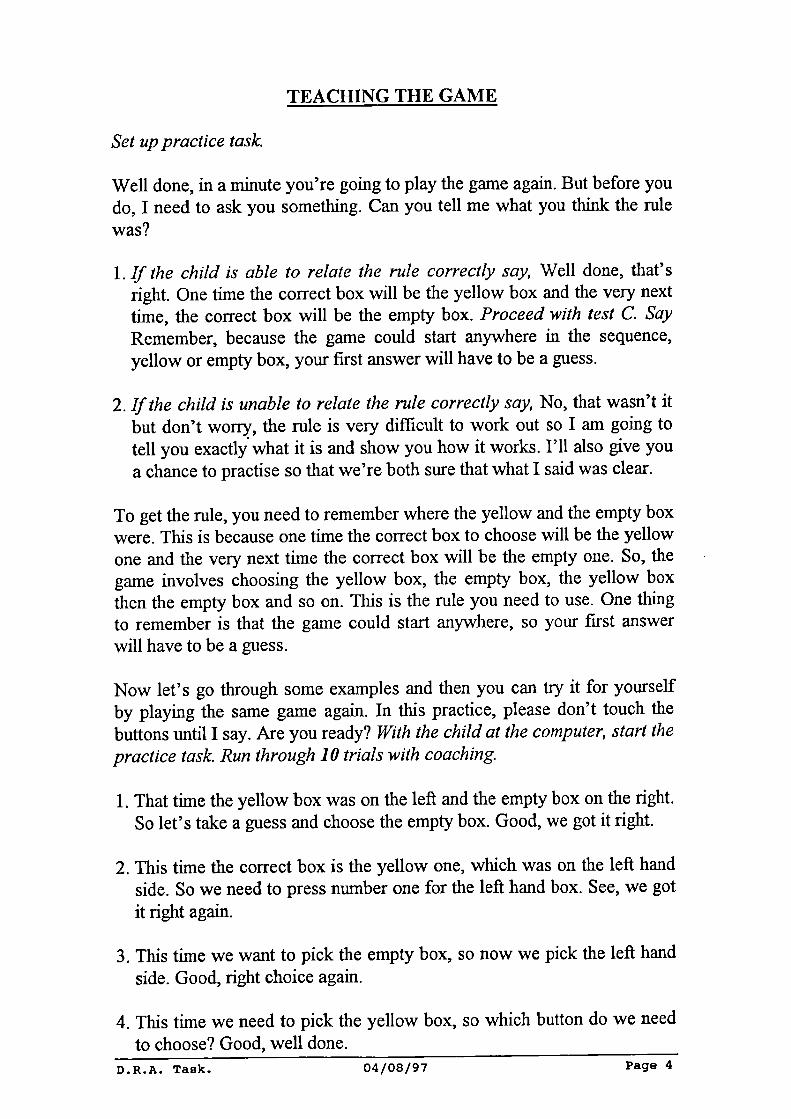
TEACHING THE GAME
Set up practice task.
Well done, in a minute you're going to play the game again. But before youdo, I need to ask you something. Can you tell me what you think the rulewas?
1. If the child is able to relate the rule correctly say, Well done, that'sright. One time the correct box will be the yellow box and the vely nexttime, the correct box will be the empty box. Proceed with test C. SayRemember, because the game could start anywhere in the sequence,yellow or empty box, your first answer will have to be a guess.
2. If the child is unable to relate the rule correctly say, No, that wasn't itbut don't worry, the rule is very difficult to work out so I am going totell you exactly what it is and show you how it works. I'll also give youa chance to practise so that we're both sure that what I said was clear.
To get the rule, you need to remember where the yellow and the empty boxwere. This is because one time the correct box to choose will be the yellowone and the very next time the correct box will be the empty one. So, thegame involves choosing the yellow box, the empty box, the yellow boxthen the empty box and so on. This is the rule you need to use. One thingto remember is that the game could start anywhere, so your first answerwill have to be a guess.
Now let's go through some examples and then you can try it for yourselfby playing the same game again. In this practice, please don't touch thebuttons until I say. Are you ready? With the child at the computer, start thepractice task. Run through 10 trials with coaching.
1. That time the yellow box was on the left and the empty box on the right.So let's take a guess and choose the empty box. Good, we got it right.
2. This time the correct box is the yellow one, which was on the left handside. So we need to press number one for the left hand box. See, we gotit right again.
3. This time we want to pick the empty box, so now we pick the left handside. Good, right choice again.
4. This time we need to pick the yellow box, so which button do we needto choose? Good, well done.
D.R.A. Task. 04/08/97 Page 4
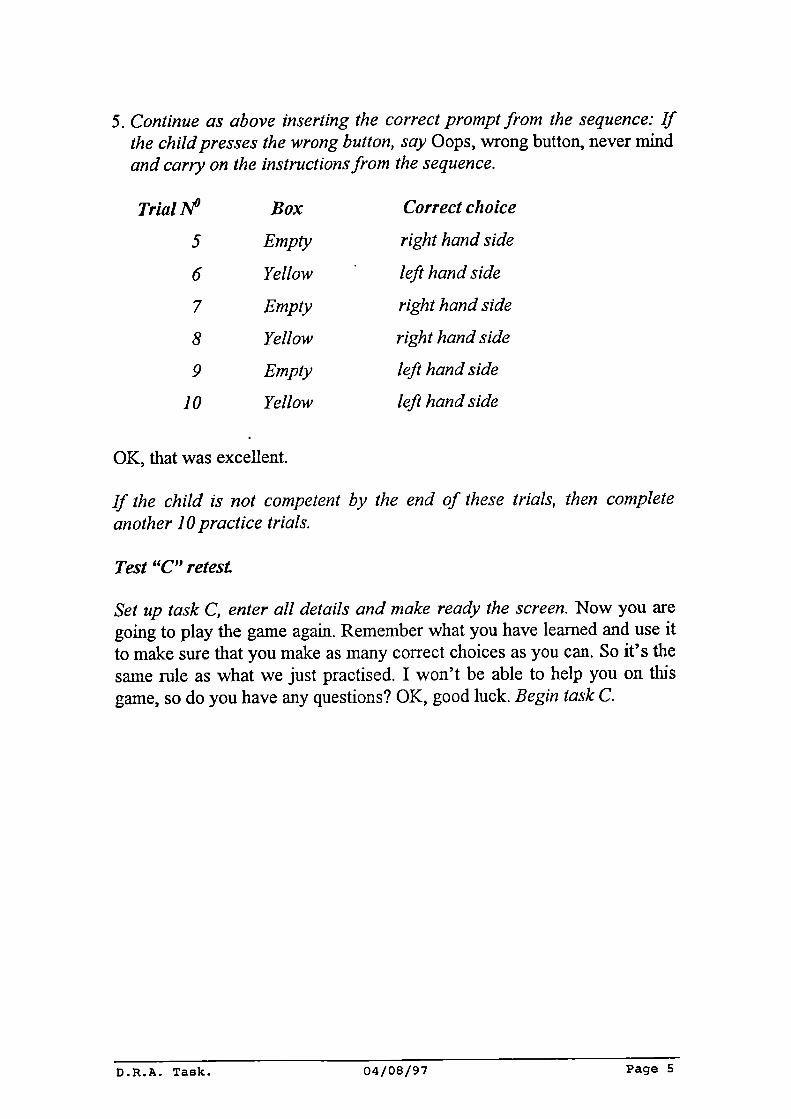
5. Continue as above inserting the correct prompt from the sequence: Ifthe child presses the wrong button, say Oops, wrong button, never mindand carry on the instructions from the sequence.
Trial JV°
Box
Correct choice
5
Empty right hand side
6
Yellow
left hand side
7
Empty right hand side
8
Yellow right hand side
9
Empty
left hand side
10
Yellow
left hand side
OK, that was excellent.
If the child is not competent by the end of these trials, then completeanother 10 practice trials.
Test "C" retesL
Set up task C, enter all details and make ready the screen. Now you aregoing to play the game again. Remember what you have learned and use itto make sure that you make as many correct choices as you can. So it's thesame rule as what we just practised. I won't be able to help you on thisgame, so do you have any questions? OK, good luck. Begin task C.
D.R.A. Task. 04/08/97 Page 5

Appendix G
386

Stop task handbook
STOP TASK
hANDBOOK
based on
Jaap Oosterlaan'sChange Task Handbook
Jonna Kuntsi 270996
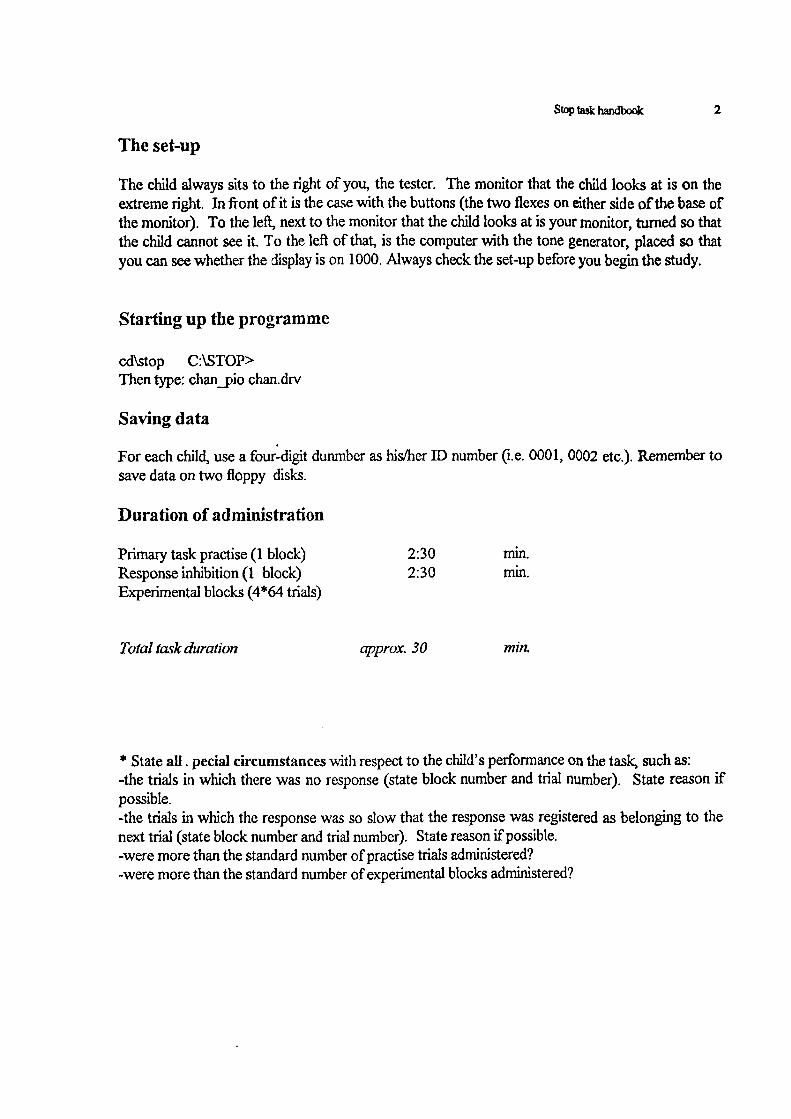
Stop task handbook 2
The set-up
The child always sits to the right of you, the tester. The monitor that the child looks at is on theextreme right. In front of it is the case with the buttons (the two flexes on either side of the base ofthe monitor). To the left, next to the monitor that the child looks at is your monitor, turned so thatthe child cannot see it. To the left of that, is the computer with the tone generator, placed so thatyou can see whether the display is on 1000. Always check the set-up before you begin the study.
Starting up the programme
cd\stop C:\STOP>Then type: chan_pio chan.drv
Saving data
For each child, use a four-digit dunmber as his/her ID number (i.e. 0001, 0002 etc.). Remember tosave data on two floppy disks.
Duration of administration
Primary task practise (1 block) 2:30 mm.Response inhibition (1 block) 2:30 mm.Experimental blocks (4*64 trials)
Total task duration approx. 30 miii.
* State all . pecial circumstances with respect to the child's performance on the task, such as:-the trials in which there was no response (state block number and trial number). State reason ifpossible.-the trials in which the response was so slow that the response was registered as belonging to thenext trial (state block number and trial number). State reason if possible.-were more than the standard number of practise trials administered?-were more than the standard number of experimental blocks administered?
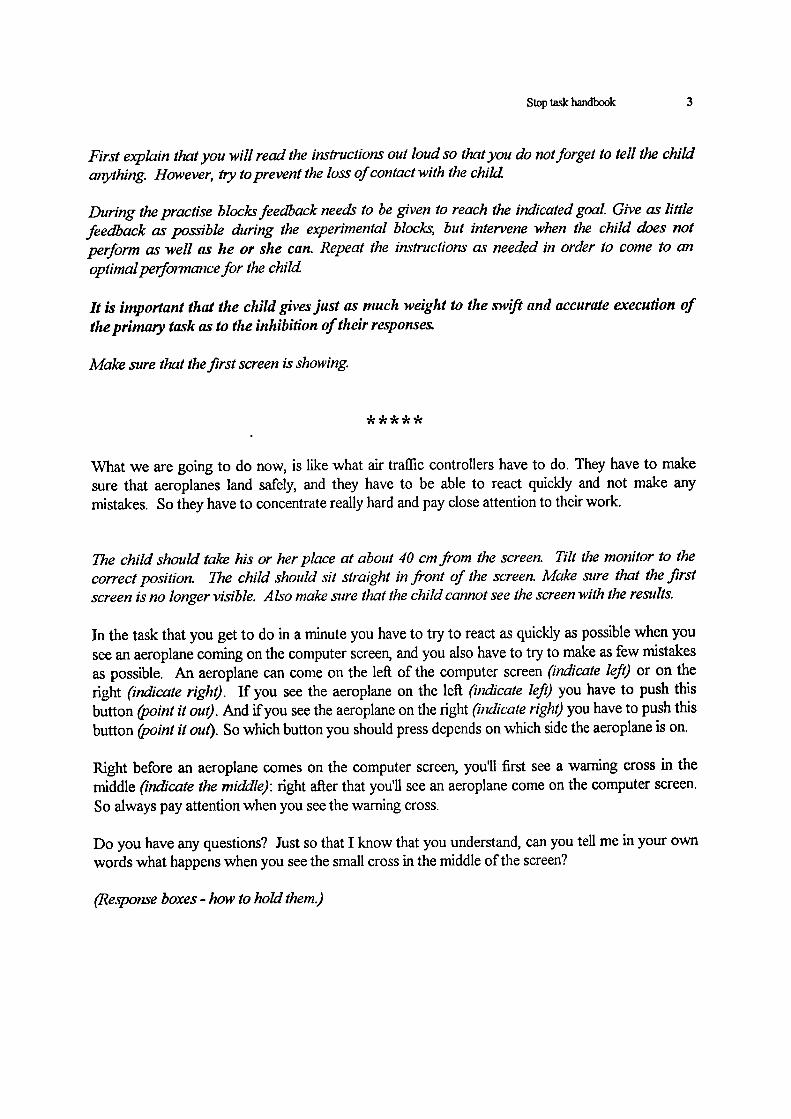
Stop task handbook
First explain that you will read the instructions out loud so that you do not forget to tell the childanything. However, try to prevent the loss of contact with the child
During the practise blocks feedback needs to be given to reach the indicated goal. Give as littlefeedback as possible during the experimental blocks, but intervene when the child does notperform as well as he or she can. Repeat the instructions as needed in order to come to anoptimal peiform ance for the child
It is important that the child gives just as much weight to the swfI and accurate execution ofthe primary task as to the inhibition of their response&
Make sure that the first screen is showing
What we are going to do now, is like what air traflic controllers have to do. They have to makesure that aeroplanes land safely, and they have to be able to react quickly and not make anymistakes. So they have to concentrate really hard and pay close attention to their work.
The child should take his or her place at about 40 cm from the screen. Tilt the monitor to thecorrect position. The child should sit straight in front of the screen. Make sure that the firstscreen is no longer visible. Also make sure that the child cannot see the screen with the results.
In the task that you get to do in a minute you have to try to react as quickly as possible when yousee an aeroplane coming on the computer screen, and you also have to try to make as few mistakesas possible. An aeroplane can come on the left of the computer screen (indicate left) or on the
right (indicate right). If you see the aeroplane on the left (indicate left) you have to push this
button (point it out). And if you see the aeroplane on the right (indicate right) you have to push this
button (point it out). So which button you should press depends on which side the aeroplane is on.
Right before an aeroplane comes on the computer screen, you'll first see a warning cross in themiddle (indicate the middle): right after that you'll see an aeroplane come on the computer screen.So always pay attention when you see the warning cross.
Do you have any questions? Just so that I know that you understand, can you tell me in your ownwords what happens when you see the small cross in the middle of the screen?
(Response boxes - how to hold them.)
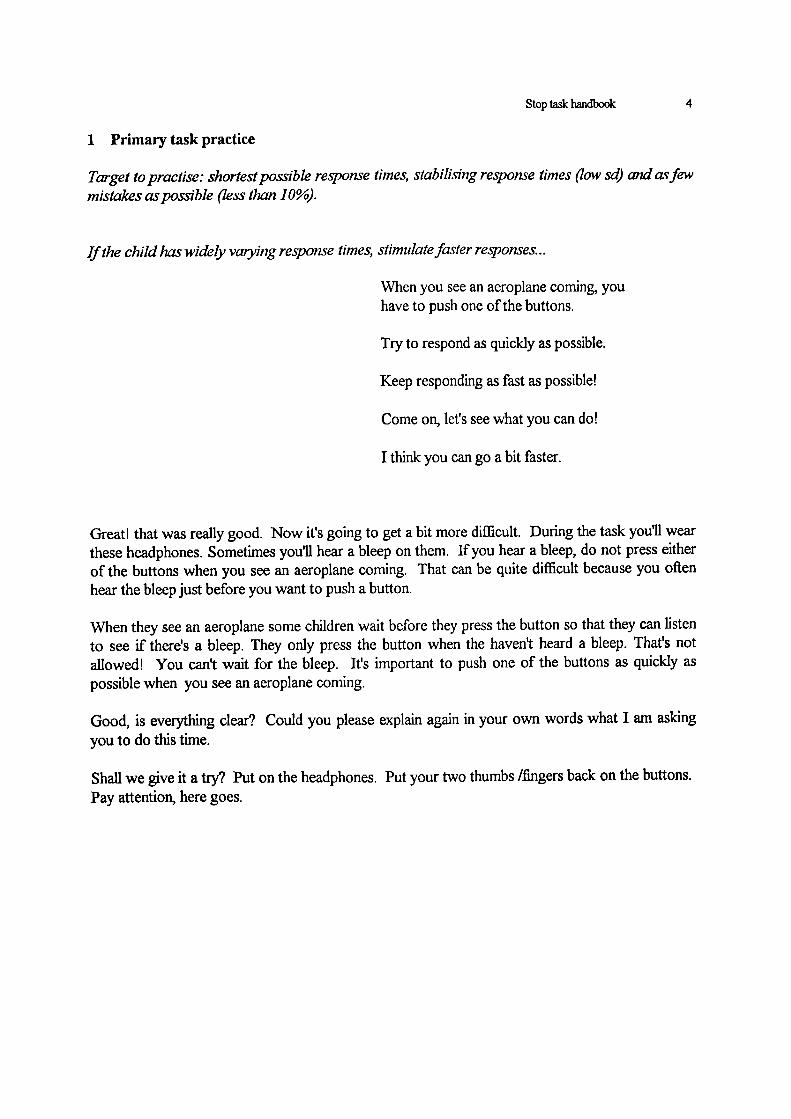
Stop task handbook
1 Primary task practice
Target to practise: shortest possible response times, stabilising response times (low sd) and as fewmistakes as possible (less than 10%).
If the child has widely varying response times, stimulate faster responses...
When you see an aeroplane coming, youhave to push one of the buttons.
Try to respond as quickly as possible.
Keep responding as fast as possible!
Come on, let's see what you can do!
I think you can go a bit faster.
Great! that was really good. Now it's going to get a bit more difficult. During the task you'll wearthese headphones. Sometimes you'll hear a bleep on them. If you hear a bleep, do not press eitherof the buttons when you see an aeroplane coming. That can be quite difficult because you oftenhear the bleep just before you want to push a button.
When they see an aeroplane some children wait before they press the button so that they can listento see if there's a bleep. They only press the button when the haven't heard a bleep. That's notallowed! You can't wait for the bleep. It's important to push one of the buttons as quickly aspossible when you see an aeroplane coming.
Good, is everything clear? Could you please explain again in your own words what I am askingyou to do this time.
Shall we give it a try? Put on the headphones. Put your two thumbs /fingers back on the buttons.Pay attention, here goes.
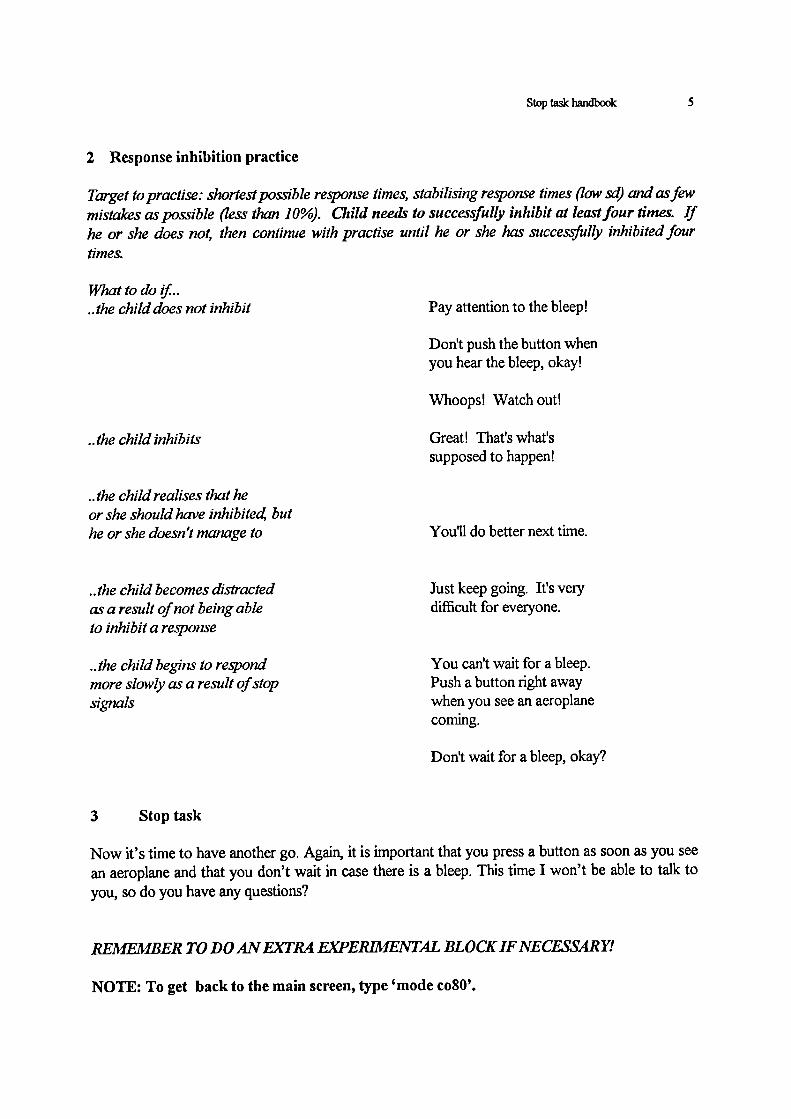
Stop task handbook
2 Response inhibition practice
Target to practise: shortest possible response times, stabilising response times (low sd) and as fewmistakes as possible (less than 10%). Child needs to successfully inhibit at least four times. Ifhe or she does not, then continue with practise until he or she has successfully inhibited fourtimes.
What to dothe child does not inhibit
Pay attention to the bleep!
the child inhibits
the child realises that heor she should have inhibitea buthe or she doesn't manage to
the child becomes distractedas a result of not being ableto inhibit a response
the child begins to respondmore slowly as a result of stopsignals
Don't push the button whenyou hear the bleep, okay!
Whoops! Watch out!
Great! That's what'ssupposed to happen!
You'll do better next time.
Just keep going. Ifs verydifficult for everyone.
You can't wait for a bleep.Push a button right awaywhen you see an aeroplanecoming.
Don't wait for a bleep, okay?
3 Stop task
Now it's time to have another go. Again, it is important that you press a button as soon as you seean aeroplane and that you don't wait in case there is a bleep. This time I won't be able to talk toyou, so do you have any questions?
REMEMBER TO DO ANEXTRA EKPERJMENTAL BLOCK IF NE CESSARY!
NOTE: To get back to the main screen, type 'mode co8O'.

Appendix H
392

Sentence Span Task - Anglicised Version
Name:
Date: / I
INSTRUCTIONS: I am going to say some sentences and the last word in each sentence will bemissing. I want you to tell me what you think the last word should be. Let's tiy one. "For breakfastthe little girl had orange ___________." Now I am going to read two sentences. After each sentenceI want you to tell me the word that should go at the end of the sentence. When I finish the twosentences, I want you to tell me the two words that you said at the end of the sentence. Please tellme the words in the order that you said them. Let's try it. "When we go swimming we wearswimming ___________. Cars have to stop at red ___________
Discontinue when the child has failed an entire Jevel. Give credit only when the child remembersthe words in the correct order.Note: Announce each new level. Record words in the order that the child said them.
Level I Two sentences •. .. . . . .: ... . ..:. ..: . ...: .. ...: . ... ... .
High Probability Response(s)ballfingers
2A1. In a tennis game the player hits the _________2. On my two hands I have ten _________
Responses
2B1. A tortoise is slow, a rabbit is ___________2. When we are sick we often go to the __________
Responses
2C1. An elephant is big, a mouse is -2. Asawisusedtocut _________
Responses
fastdoctor hospital
smallwood
I 2:llree sentences . . . . . •.., .. ....:. .................... I
3A1. Running is fast, walking is _________2. At the library people read ___________3. An apple is red, a banana is _________
Responses
3B1. The sun shines during the day, the moon at __________2. In the winter we have to wear warm __________3. The child had blonde hair and blue ___________
Responses
3C1. Insummeritisvery __________2. People go to see monkeys in a __________3. To cut meat we use a sharp __________
Responses
slowbooksyellow
nightclotheseyes
hot warmzoo circus
knife
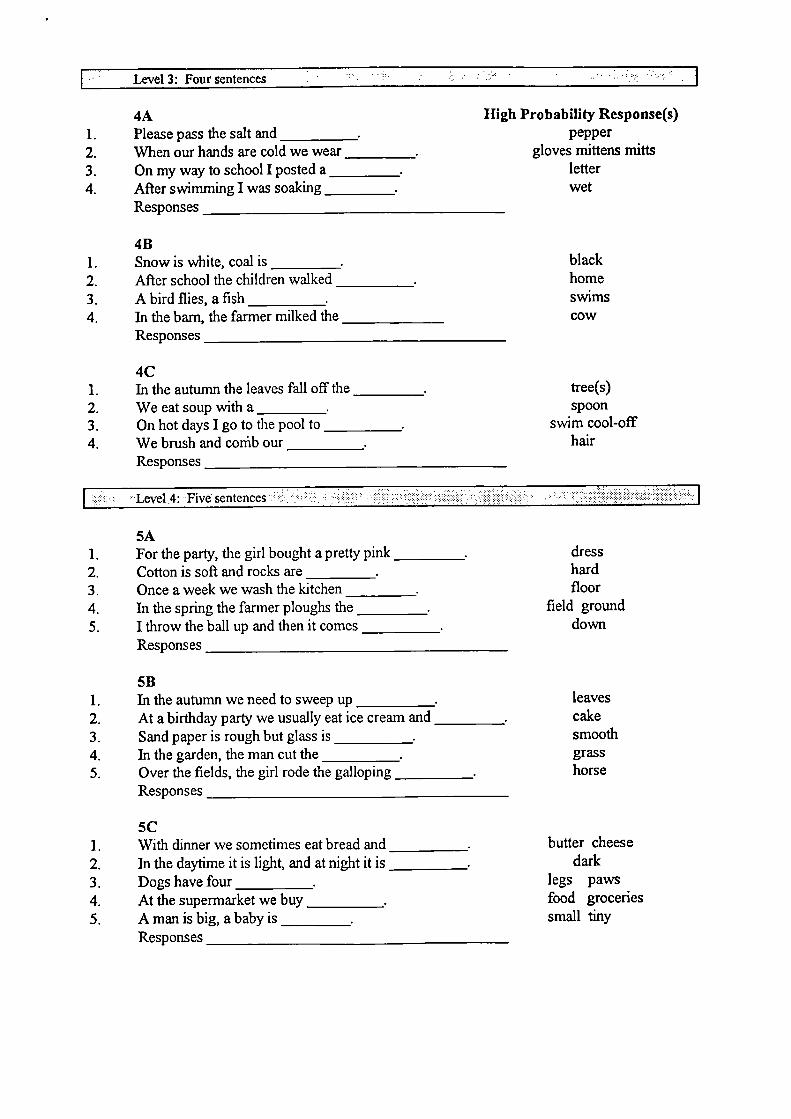
• Level 3: Four Sentences • .: •:. .:.
High Probability Response(s)pepper
gloves mittens mittsletterwet
4A1. Pleasepassthesaltand2. When our hands are cold we wear _________3. On my way to school I posted a __________4. After swimming I was soaking _________
Responses
4B1. Snow is white, coal is _________2. After school the children walked ___________3. Abirdflies,aflsh ________4. In the barn, the farmer milked the __________
Responses
4C1. In the autumn the leaves fall off the2. We eat soup with a _________3. On hot days I go to the pool to -4. We brush and cothb our ________
Responses
blackhomeswimscow
tree(s)spoon
swim cool-offhair
Level 4: Five sentences I
5A1. For the party, the girl bought a pretty pink _________2. Cotton is soft and rocks are _________3. Once a week we wash the kitchen _________4. In the spring the farmer ploughs the _________5. I throw the ball up and then it comes ___________
Responses
5B1. In the autumn we need to sweep up ___________2. At a birthday party we usually eat ice cream and _________3. Sand paper is rough but glass is __________4. In the garden, the man cut the __________5. Over the fields, the girl rode the galloping ___________
Responses
5C1. With dinner we sometimes eat bread and ___________2. In the daytime it is light, and at night it is ___________3. Dogs have four __________4. At the supermarket we buy __________5. Amanisbig,ababyis _______
Responses
dresshardfloor
field grounddown
leavescakesmoothgrasshorse
butter cheesedark
legs pawsfood groceriessmall tiny
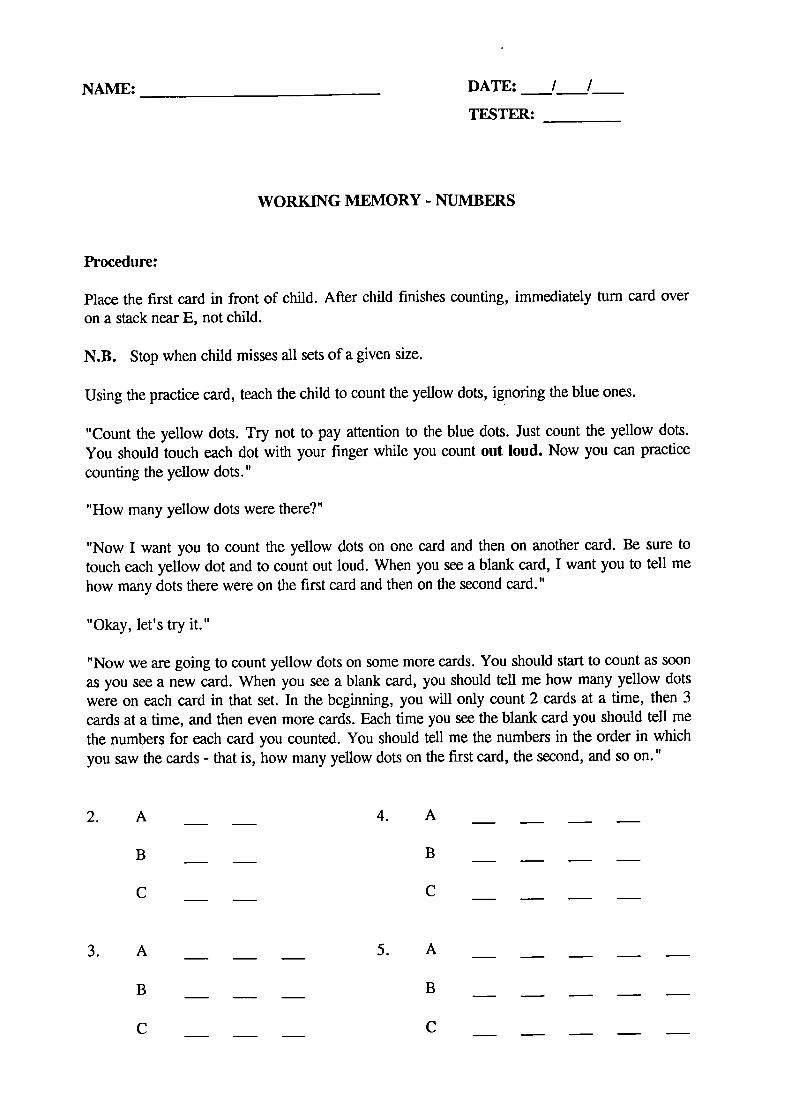
4. A
B
C
5. A
B
C
2. A
B
C
3. A
B
C
NAME: ____________________ DATE: ___I___/
TESTER:
WORKING MEMORY - NUMBERS
Procedure:
Place the first card in front of child. After child finishes counting, immediately turn card overon a stack near E, not child.
N.B. Stop when child misses all sets of a given size.
Using the practice card, teach the child to count the yellow dots, ignoring the blue ones.
"Count the yellow dots. Try not to pay attention to the blue dots. Just count the yellow dots.You should touch each dot with your fmger while you count out loud. Now you can practice
counting the yellow dots."
"How many yellow dots were there?"
"Now I want you to count the yellow dots on one card and then on another card. Be sure totouch each yellow dot and to count out loud. When you see a blank card, I want you to tell mehow many dots there were on the first card and then on the second card."
"Okay, let's try it."
"Now we are going to count yellow dots on some more cards. You should start to count as soonas you see a new card. When you see a blank card, you should tell me how many yellow dotswere on each card in that set. In the beginning, you will only count 2 cards at a time, then 3cards at a time, and then even more cards. Each time you see the blank card you should tell methe numbers for each card you counted. You should tell me the numbers in the order in whichyou saw the cards - that is, how many yellow dots on the first card, the second, and so on."

Appendix I
396
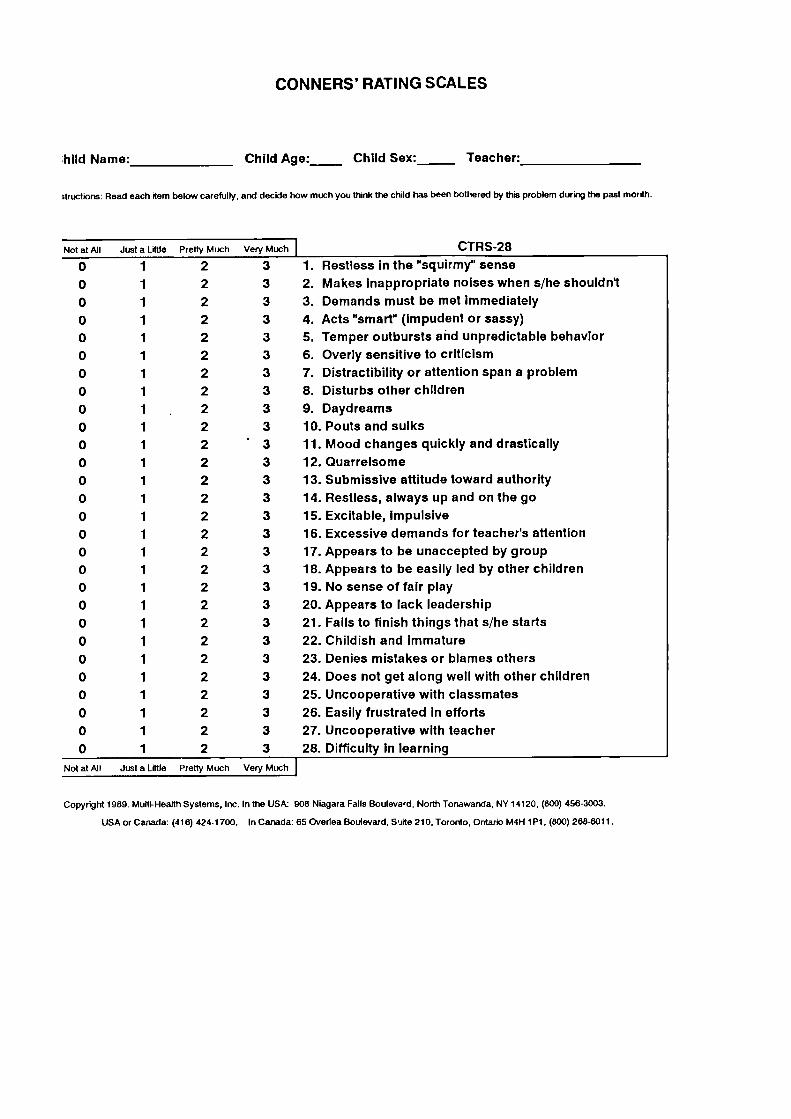
CONNERS' RATING SCALES
hild Name:
Child Age:_____ Child Sex:_____ Teacher:
t,uctions: Read each item below carefully, and decide how much you think the child has been bothered by th,s Problem during the past month.
Much Venj Much
2
32
32
32
32
32
32
32
32
32
3
2
.3
2
3
2
3
2
3
2
3
2
3
2
3
2
3
2
3
2
3
2
3
2
3
2
3
2
3
2
3
2
3
2
3
2
3
Not at All Just a Little Prett
0
1
0
1
0
1
0
10
1
0
1
0
1
0
1
0
1
0
1
0
1
0
1
0
1
0
1
0
1
0
1
0
10
1
0
1
0
1
0
1
0
1
0
1
0
10
1
0
1
0
1
0
1
CTRS-28
1. Restless in the "squirmy" sense
2. Makes Inappropriate noises when s/he shouldn't
3. Demands must be met immediately
4. Acts "smart" (impudent or sassy)
5. Temper outbursts and unpredictable behavior
6. Overly sensitive to criticism
7. Distractibility or attention span a problem
8. Disturbs other children
9. Daydreams
10. Pouts and sulks
11. Mood changes quickly and drastically
12. Quarrelsome
13. Submissive attitude toward authority
14. Restless, always up and on the go
15. Excitable, Impulsive
16. Excessive demands for teacher's attention
17. Appears to be unaccepted by group
18. Appears to be easily led by other children
19. No sense of fair play
20. Appears to lack leadership
21. Falls to finish things that s/he starts
22. Childish and Immature
23. Denies mistakes or blames others
24. Does not get along well with other children
25. Uncooperative with classmates
26. Easily frustrated In efforts
27. Uncooperative with teacher
28. Difficulty in learning
Not at All --usta Little Pretty Much Very Much
Copyright 1989. Multi-Health Systems, Inc. In the USk 908 Niagara Falls Bouleva'd, North Tonawanda, NY 14120, (800) 458-3003.
USA or Canada: (416) 424-1700. In Canada: 65 Overlea Boulevard, Suite 210, Toronto, Ontario M4R 1 P1 (800) 268-6011.
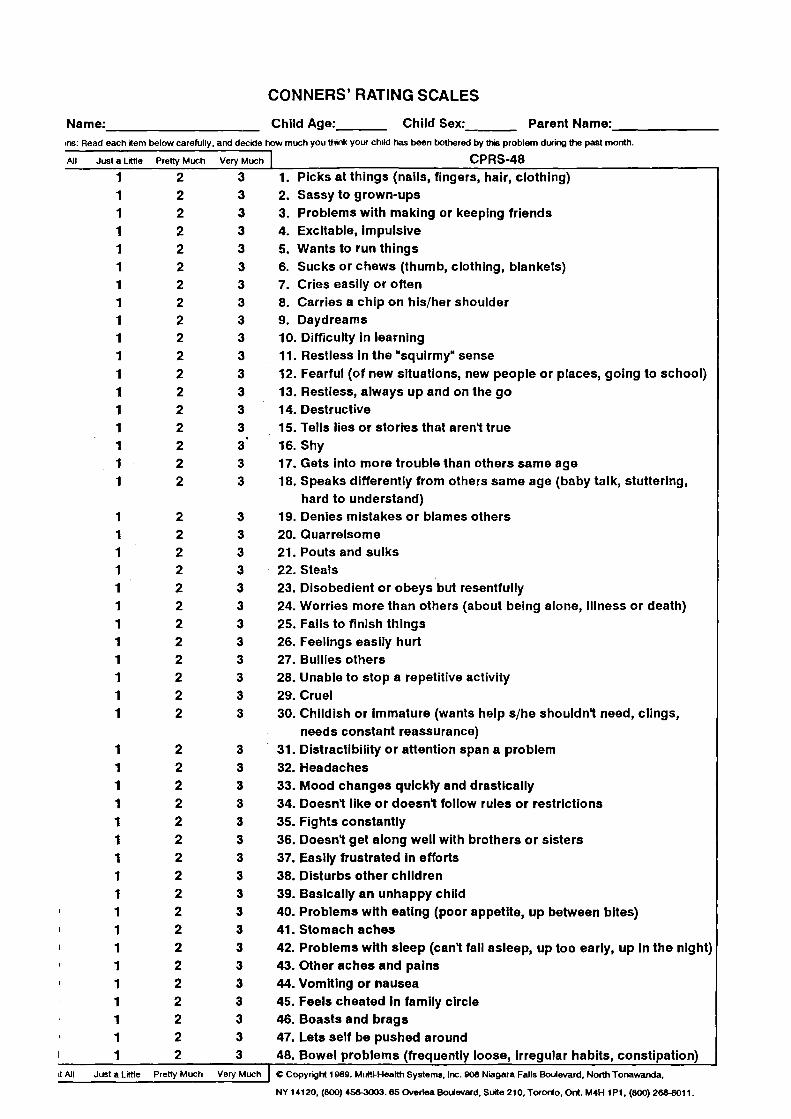
CONNERS' RATING SCALES
Name:______________________ Child Age:_______ Child Sex:_______ Parent Name:_>ns: Read each item below carefully, and deckle how much you think your child has been bothered by th problem during the past month.
JI Just a Little Pretty Much Very Much __________ - CPRS48 --1
2
3 1. Picks at things (nails, fingers, hair, clothing)1
2
3 2. Sassy to grown-ups1
2
3 3. Problems with making or keeping friends1
2
3 4. Excitable, Impulsive1
2
3 5. Wants to run things1
2
3 6. Sucks or chews (thumb, clothing, blankets)1
2
3 7. Cries easily or often1
2
3 8. Carries a chip on his/her shoulder1
2
3 9. Daydreams1
2
3 10. Difficulty In learning1
2
3 11. Restless In the "squirmy" sense1
2
3 12. Fearful (of new situations, new people or places, going to school)1
2
3 13. Restless, always up and on the go1
2
3 14. Destructive1
2
3 15. Tells lies or stories that aren't true1
2
3 16. Shy1
2
3 17. Gets Into more trouble than others same age1
2
3 18. Speaks differently from others same age (baby talk, stuttering,hard to understand)
1
2
3 19. Denies mistakes or blames others1
2
3 20. Quarrelsome1
2
3 21. Pouts and sulks1
2
3 22. Steals1
2
3 23. Disobedient or obeys but resentfully1
2
3 24. Worries more than others (about being alone, Illness or death)1
2
3 25. Fails to finish things1
2
3 26. Feelings easily hurt1
2
3 27. Bullies others1
2
3 28. Unable to stop a repetitive activity1
2
3 29. Cruel1
2
3 30. Childish or Immature (wants help s/he shouldn't need, clings,needs constant reassurance)
1
2
3 31. Distractibility or attention span a problem1
2
3 32. Headaches1
2
3 33. Mood changes quickly and drastically1
2
3 34. Doesn't lIke or doesn't follow rules or restrictions1
2
3 35. Fights constantly1
2
3 36. Doesn't get along well with brothers or sisters1
2
3 37. Easily frustrated In efforts1
2
3 38. Disturbs other chIldren1
2
3 39. Basically an unhappy child1
2
3 40. Problems with eating (poor appetite, up between bites)1
2
3 41. Stomach aches1
2
3 42. Problems with sleep (can't fall asleep, up too early, up In the night)1
2
3 43. Other aches and pains1
2
3 44. Vomiting or nausea1
2
3 45. Feels cheated in family circle1
2
3 46. Boasts and brags1
2
3 47. Lets self be pushed around1
2
3 48. Bowel problems (frequently loose, irregular habits, constipation)Lt JI Just a Little Pretty Much Very Much C Copyright 1989. Multi-Health Systems, Inc. 908 Niagara Falls Boulevard, North Tonawanda,
NY 14120, (800) 456-3003.65 Overlea Boulevard, Suite 210, Toronto, Ont. M4H 1 P1, (800) 268-8011.

Appendix J
399
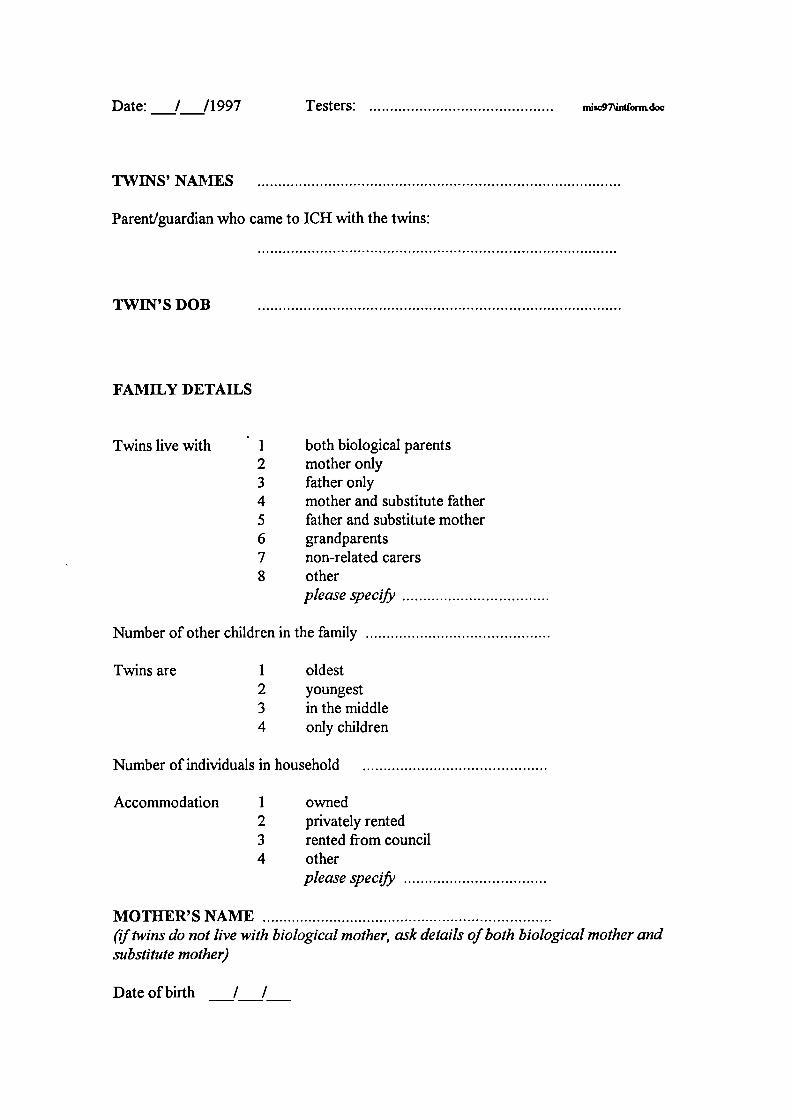
Date: / /1997
Testers ............................................ mintform.doc
TWINS' NAMES
Parent/guardian who came to ICH with the twins:
TWIN'S DOB
FAMILY DETAILS
Twins live with 1 both biological parents2 mother only3 father only4 mother and substitute father5 father and substitute mother6 grandparents7 non-related carers8 other
pleasespecify ...................................
Numberof other children in the family ............................................
Twins are 1 oldest2 youngest3 in the middle4 only children
Number of individuals in household
Accommodation 1 owned2 privately rented3 rented from council4 other
pleasespecify ..................................
MOTHER'S NAME(?f twins do not live with biological mother, ask details of both biological mother andsubstitute mother)
Date of birth / /
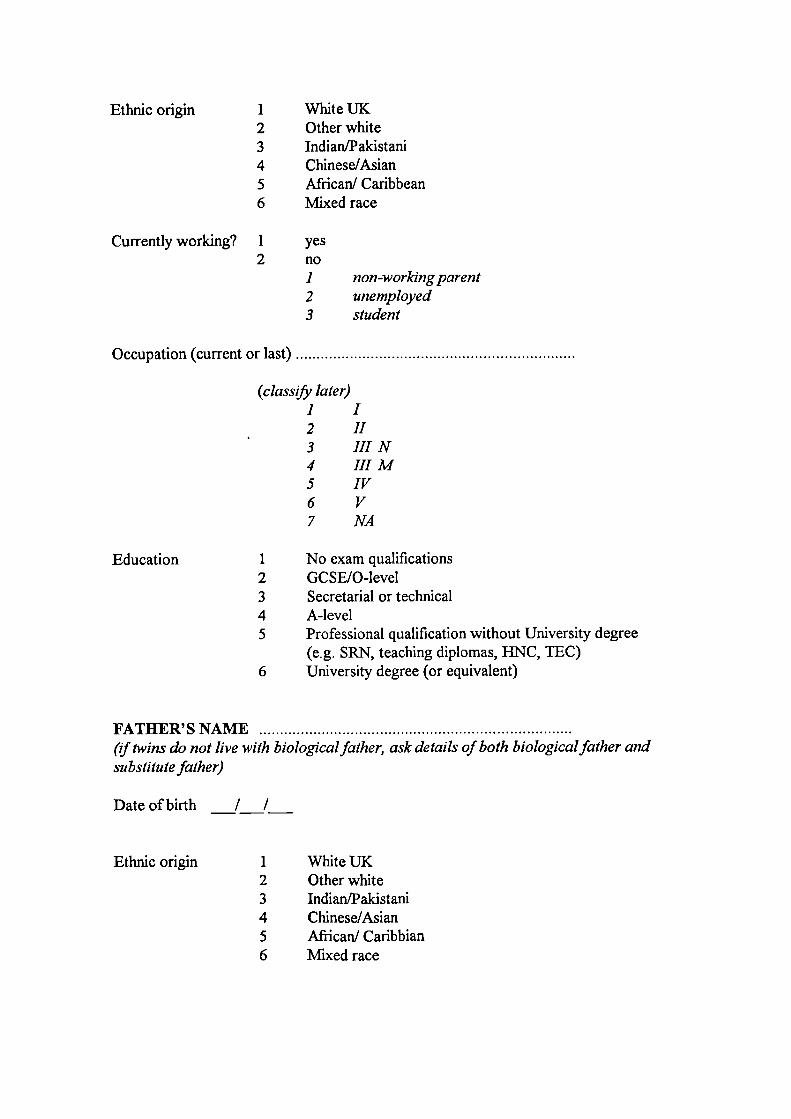
Ethnic origin
123456
Ethnic origin
123456
Currently working? 12
\Vhite UKOther whiteIndian/PakistaniChinese/AsianAfrican! CaribbeanMixed race
yesno1
non-working parent2
unemployed3 student
Occupation(current or last) ...................................................................
(classify later)1 I2 II3 JuN4 hIM5 Iv6 V7 NA
Education 1 No exam qualifications2 GCSE/O-Ievel3 Secretarial or technical4 A-level5 Professional qualification without University degree
(e.g. SRN, teaching diplomas, HNC, TEC)6 University degree (or equivalent)
FATHER'S NAME(f twins do not live with biologicalfarher, ask details of both biological father andsubstitute father)
Date of birth / /
White UKOther whiteIndian/PakistaniChinese/AsianAfrican! CaribbianMixed race
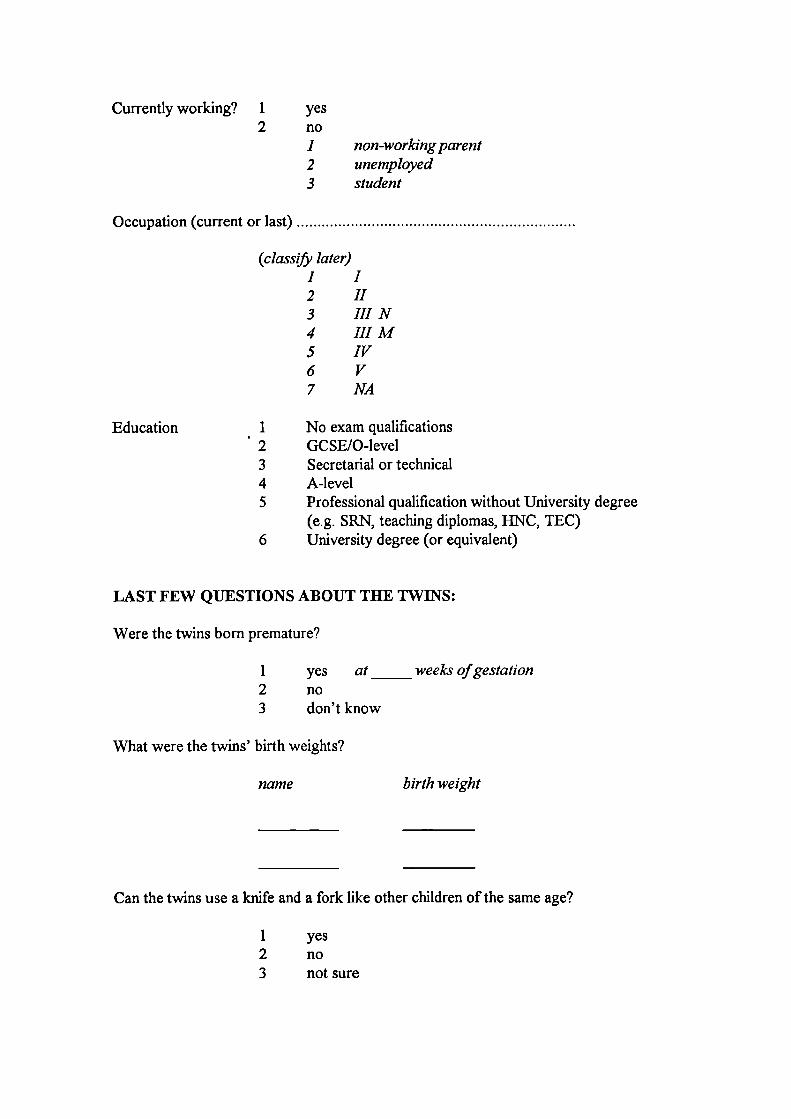
yesno123
Currently working? 12
non-working parentunemployedstudent
Occupation(current or last) ...................................................................
(classify later)1 I2 II3 JuN4 hIM5 Iv6 V7 NA
Education 1 No exam qualifications2 GCSE/O-level3 Secretarial or technical4 A-level5 Professional qualification without University degree
(e.g. SRN, teaching diplomas, HNC, TEC)6 University degree (or equivalent)
LAST FEW QUESTIONS ABOUT THE TWINS:
Were the twins born premature?
1 yes at _____ weeks of gestation2 no3 don't know
What were the twins' birth weights?
name
birth weight
Can the twins use a knife and a fork like other children of the same age?
1 yes2 no3 not sure
Do the twins suffer from any medical problems?
yesplease specfy
2 no

Appendix K
404
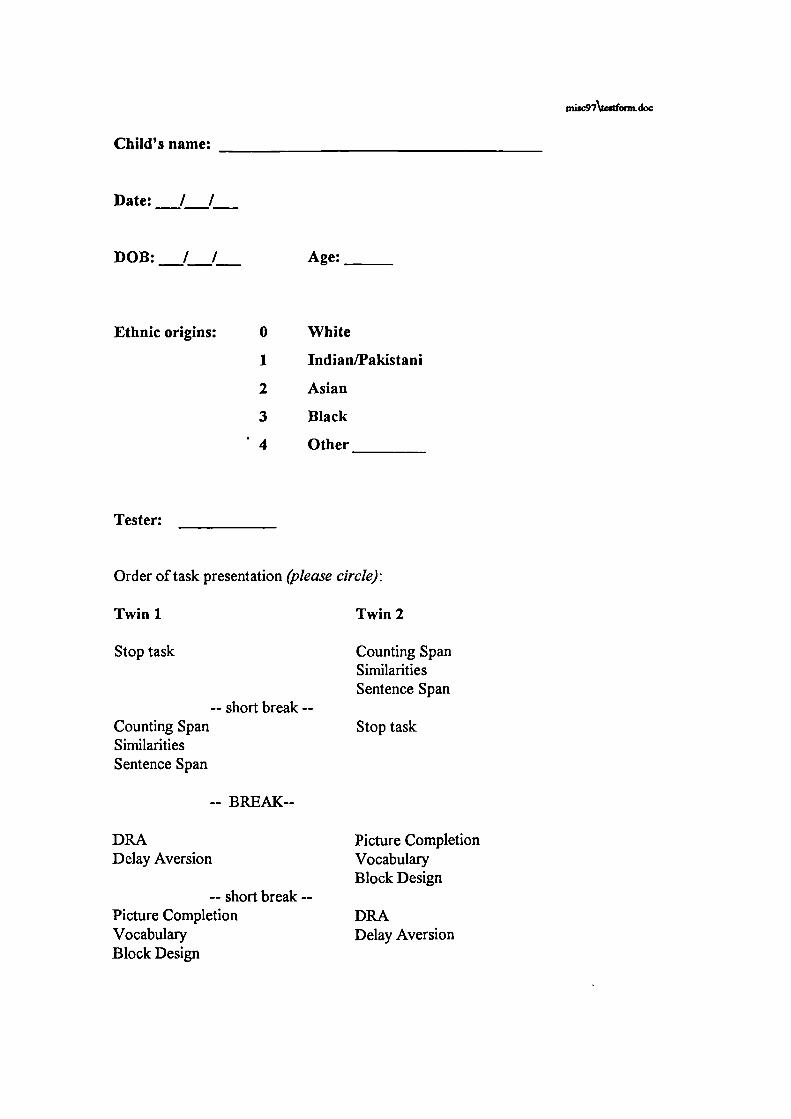
inisc97\Lcstfoim.doc
0
1
2
3
.4
Child's name:
Date: / /
DOB: I /
Ethnic origins:
Age:
White
Indian/Pakistani
Asian
Black
Other
Tester:
Order of task presentation (please circle):
Twin 1
Twin 2
Stop task
-- short break --Counting SpanSimilaritiesSentence Span
-- BREAK--
DRADelay Aversion
Counting SpanSimilaritiesSentence Span
Stop task
Picture CompletionVocabularyBlock Design
--short break--Picture Completion DRAVocabulary Delay AversionBlock Design
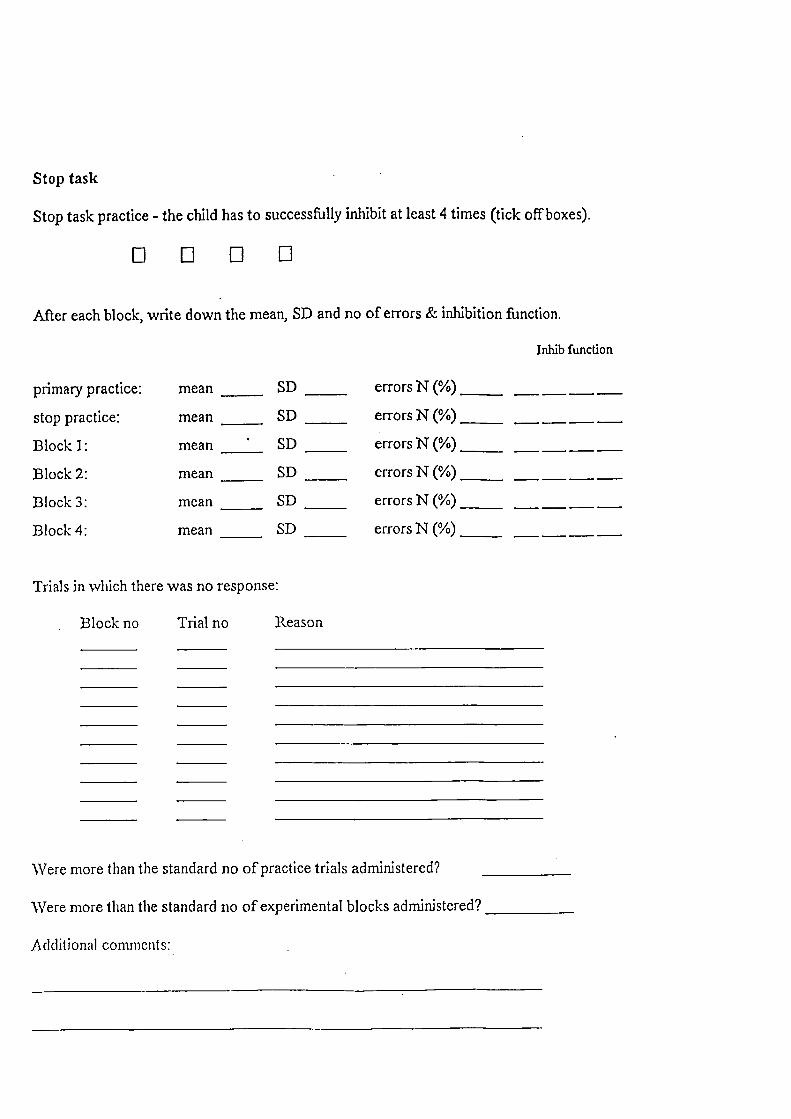
Stop task
Stop task practice - the child has to successfully inhibit at least 4 times (tick off boxes).
0000After each block, write down the mean, SD and no of errors & inhibition function.
Inhib function
primary practice
stop practice:
Block J:
Block 2:
Block 3:
Block 4:
mean_____ SD _____
mean_____ SD _____
mean_____ SD _____
mean_____ SD _____
mean_____ SD _____
mean_____ SD _____
errorsN(%) _____
errorsN(%) _____
errorsN(%)_
errorsN(%) _____
errorsN(%) ______
errorsN(%) ______
Trials in which there was no response:
Block no Trial no Reason
Were more than the standard no of practice trials administered?
Were more than the standard no of experimental blocks administered? ____________
Additional comments:
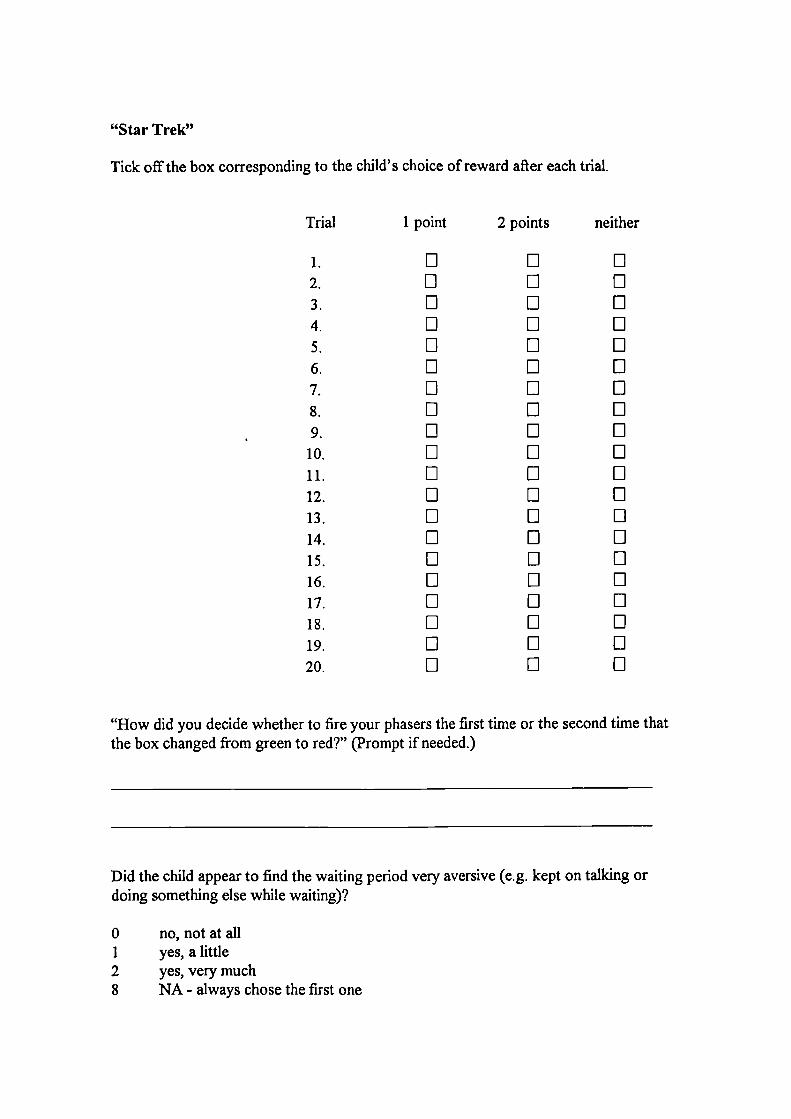
"Star Trek"
Tick off the box corresponding to the child's choice of reward after each trial.
Trial
1.2.3.4.5.6.7.8.9.
10.11.12.13.14.15.16.17.18.19.20.
1 point
LiLiLiLiLiLiLiLiLiLiLiLiULi
Li
Li
Li
Li
Li
Li
2 points
Li
Li
Li
Li
Li
Li
Li
Li
Li
Li
Li
Li
Li
Li
Li
Li
Li
ULi
Li
neither
Li
Li
Li
Li
Li
00Li
Li
Li
Li
UULi
Li
Li
Li
Li
Li
Li
"How did you decide whether to fire your phasers the first time or the second time thatthe box changed from green to red?" (Prompt if needed.)
Did the child appear to find the waiting period very aversive (e.g. kept on talking ordoing something else while waiting)?
0 no, not at all1 yes, a little2 yes, very much8 NA - always chose the first one
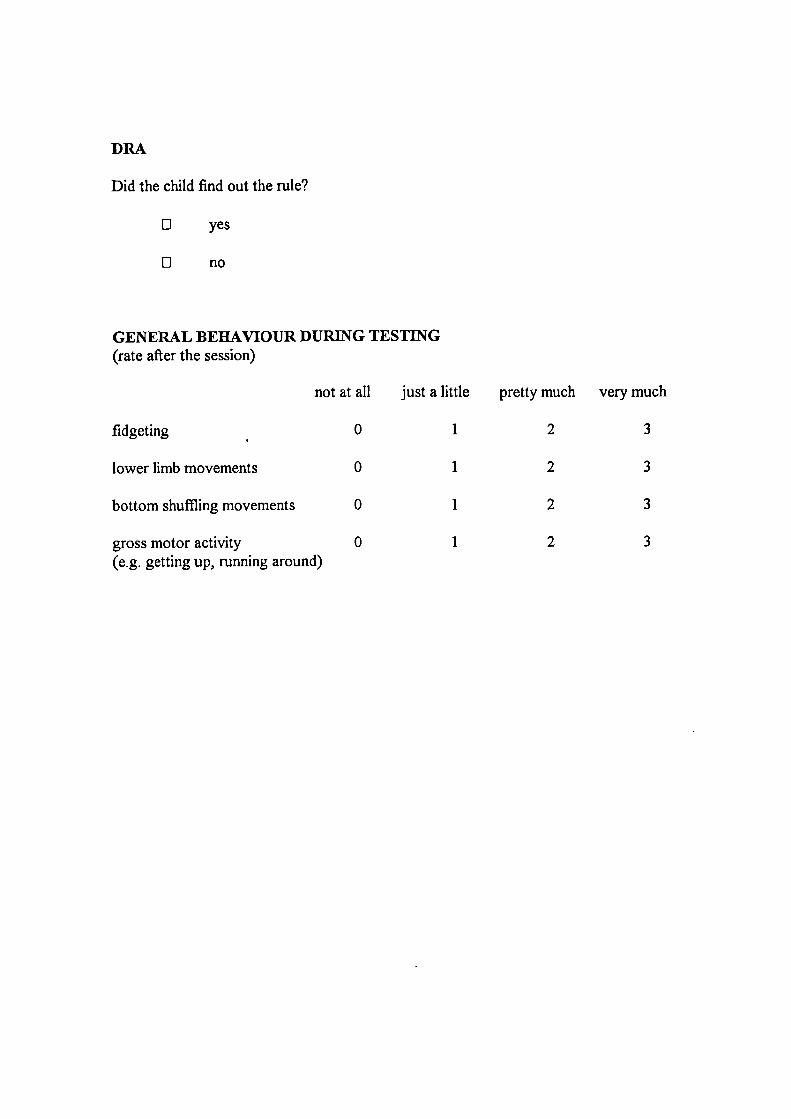
not at all
0
0
0
0
just a little
1
1
1
1
pretty much very much
2 3
2 3
2 3
2 3
fidgeting
lower limb movements
bottom shuffling movements
gross motor activity(e.g. getting up, running around)
DRA
Did the child find out the rule?
0
yes
Ei
no
GENERAL BEHAVIOUR DURING TESTING(rate after the session)

Appendix L
409

Stop task inhibition variables
(Taken from Oosterlaan et a!., 1998.)
Inhibition slope
The inhibition function is generated by plotting the probability of inhibition against
mean go signal reaction time minus stop signal delay (MRT - delay). The
inhibition slope is calculated by fitting a regression line to the individual inhibition
function.
Stop signal reaction time (SSRT)
In theory, we integrate the distribution of go signal reaction times from zero to a
point in time at which the integral equals the probability of responding given a stop
signal (i.e. 1 minus the probability of inhibition). We treat that point as an estimate
of the time at which the stop process finished. This time is defmed relative to the
onset of the go signal (because we use the distribution of go signal reaction times
to define it), thus we subtract out stop signal delay to estimate SSRT.
In practice, SSRT is calculated as follows: first, reaction times on go trials are
rank ordered on a time axis. Second, we pick the nth reaction time, where n is
defined by the product of the number of reaction times in the distribution and the
probability of responding given a stop signal (or 1 minus the probability of
inhibition). For example, if there were 100 reaction times in the distribution and
the probability of responding given a stop signal was .3, the nth reaction time
would be the 30th in the rank-ordered distribution. The nth reaction time is an
estimate of the time at which the stop process runs to completion, relative to the
410
onset of the primary task stimulus. Third, we subtract stop signal delay from the
nth reaction time and estimate SSRT. For example, if the nth reaction time was
545 msec and the stop signal delay was 200 msec, SSRT would be 345 msec.
SSRT is calculated for each stop signal and then averaged.
ZRFT-slope
If there is a group difference on the inhibition slope, the so-called ZRFT
transformation is applied to the inhibition function. The ZRFT transformation
corrects for differences in mean reaction time, go signal reaction time variability
and SSRT. The probability of inhibition is plotted as a function of a z score that
represents the relative fmishing time of the go process and the stop process in
standard deviation units, using the standard deviation of reaction times on the
primary task to define these units. ZRFT is obtained with the following formula:
ZRFT = (MRT - stop signal delay - SSRT)/standard deviation of reaction times on
the primary task. The slope of the inhibition function plotted against ZRFT is
known as the ZRFT-slope.
411
Related Documents