Psych 524 Andrew Ainsworth Data Screening 1

Welcome message from author
This document is posted to help you gain knowledge. Please leave a comment to let me know what you think about it! Share it to your friends and learn new things together.
Transcript

Psych 524
Andrew Ainsworth
Data Screening 1
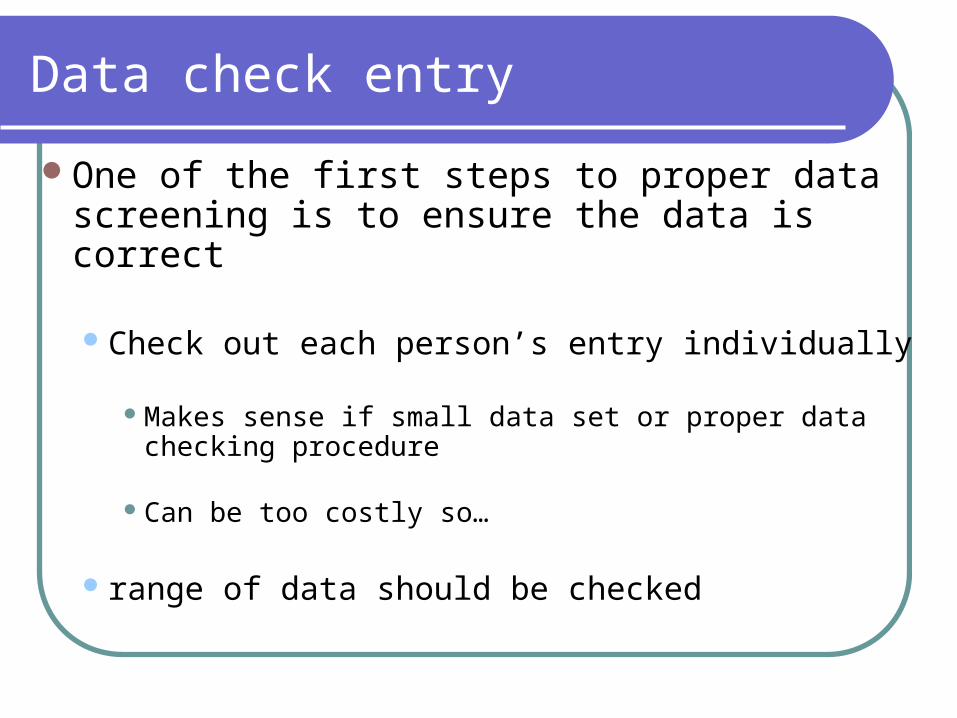
Data check entry
One of the first steps to proper data screening is to ensure the data is correct
Check out each person’s entry individually
Makes sense if small data set or proper data checking procedure
Can be too costly so…
range of data should be checked

Assumption Checking
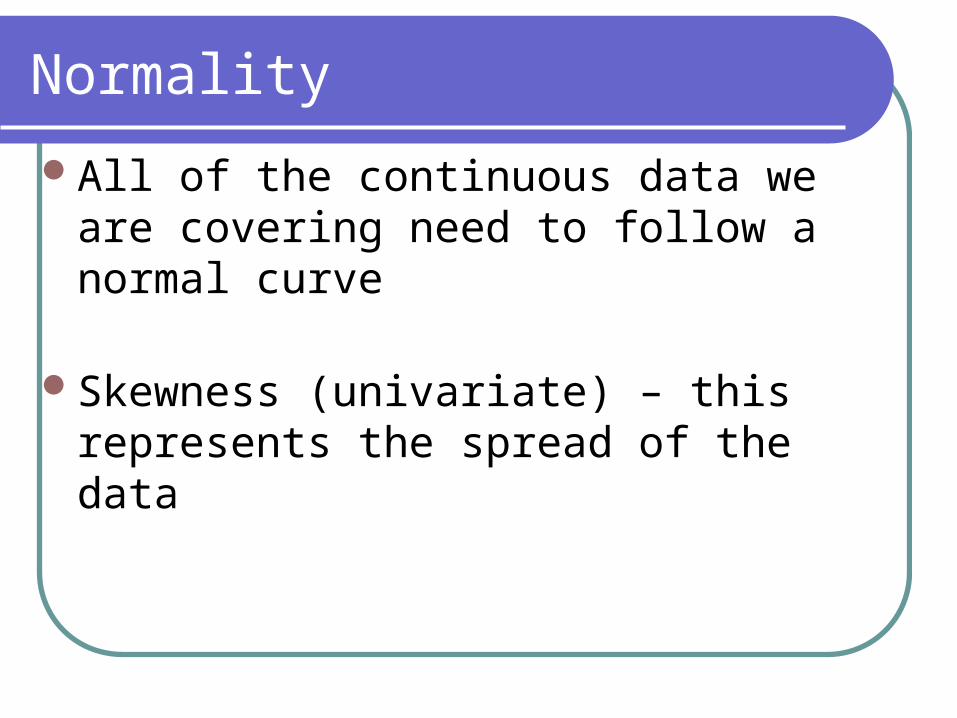
Normality
All of the continuous data we are covering need to follow a normal curve
Skewness (univariate) – this represents the spread of the data

Normality
skewness statistic is output by SPSS and SE skewness is
3.2 violation of skewness assumption
Skewnessskewness
Skewness
skewness
SZ
SE
Z
6
N
Normality
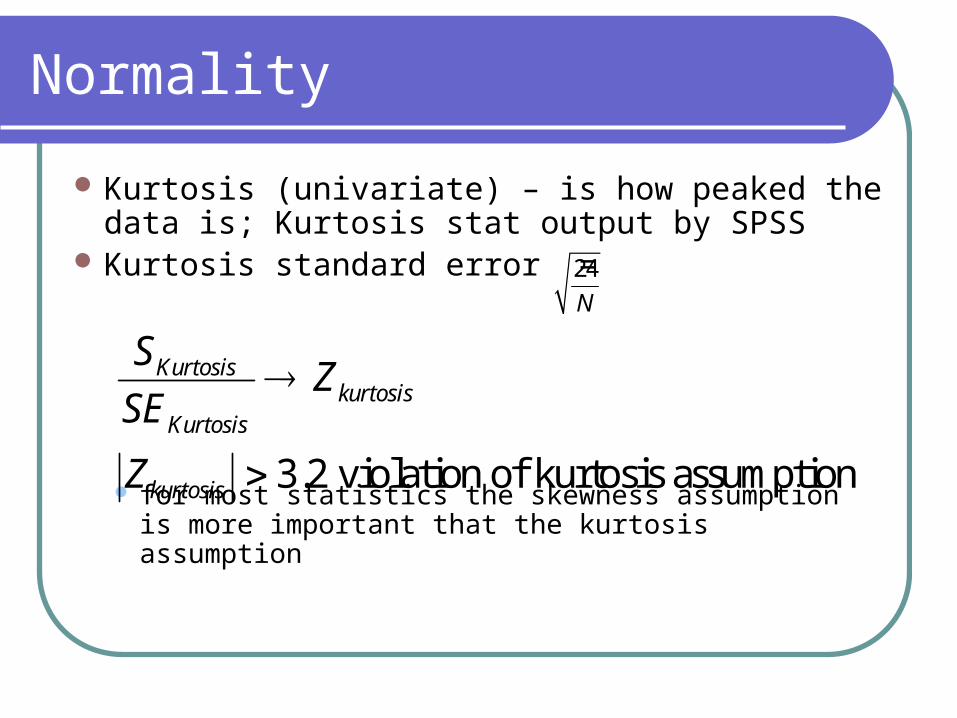
Kurtosis (univariate) – is how peaked the data is; Kurtosis stat output by SPSS
Kurtosis standard error =
for most statistics the skewness assumption is more important that the kurtosis assumption
3.2 violation of kurtosis assumption
Kurtosiskurtosis
Kurtosis
kurtosis
SZ
SE
Z
24
N

Skewness and Kurtosis
Outliers
technically it is a data point outside of you distribution; so potentially detrimental because may have undo effect on distribution

Outliers
Univariate (brains in arc)
Should always check that data is coded correctly
Two ways of looking at it
a data point represents an outlier if it is disconnected from the rest of the distribution
Data is an outlier if it has a Z-score above 3.3
If there is a concern – run data with and without to see if it has any influence on the data

Outliers
Leverage – is how far away a case is from the rest of the data
Discrepancy – is the degree to which a data point lines up with the rest of the data
Influence – amount of change in the regression equation (Bs) when a case is deleted. Calculated as a combination of Leverage and Discrepancy

Outliers

Dealing w/ univariate outliers
Once you find outliersLook into the case to see if there are
indicators that the case is not part of your intended sample
If this is true delete the case Reduce influence of outlier
Move value inward toward the rest of the distribution, while still leaving it extreme

Multivariate Outliers
Subject score may not be an outlier on any single variable; but on a combination of variables the subject is an outlier
“Being a teenager is normal, making $50,000 a year is normal, but a teenager making $50,000 a year is a multivariate outlier”.

Multivariate Outliers
Mahalanobis distance – measurement of deviance from the centroid (center of multivariate distribution created by the means of all the variables)
Computing Mahalanobis distances you get a chi square distribution 2 (df = # variables), Lookup critical value (with α = .001) if MD is above
the CV the participant is a multivariate outlier
If Multivariate outliers found, not much to do except delete the case
Linearity
relationships among variables are linear in nature; assumption in most analyses
Example resptran in arc

Homoscedasticity (geese in arc)
For grouped data this is the same as homogeneity of variance
For ungrouped data – variability for one variables is the same at all levels of another variable (no variance interaction)

Multicollinearity/Singularity
If correlations between two variables are excessive (e.g. .95) then this represents multicollinearity
If correlation is 1 then you have singularity
Often Multicollinearity/Singularity occurs in data because one variable is a near duplicate of another (e.g. variables used plus a composite of the variables)
Related Documents