of February 12, 2014. This information is current as in Psoriasis Patients Genes May Serve as Biomarkers of Response Expressed of Alefacept In Vivo: Differentially Novel Insight into the Agonistic Mechanism Cardinale, Inna Novitskaya and James G. Krueger Kikuchi, Patricia Gilleaudeau, Mary S. Whalen, Irma Bandaru, Kamruz Darabi, Francesca Chamian, Toyoko Asifa S. Haider, Michelle A. Lowes, Humphrey Gardner, Raj http://www.jimmunol.org/content/178/11/7442 2007; 178:7442-7449; ; J Immunol Material Supplementary html http://www.jimmunol.org/content/suppl/2008/03/13/178.11.7442.DC1. References http://www.jimmunol.org/content/178/11/7442.full#ref-list-1 , 13 of which you can access for free at: cites 26 articles This article Subscriptions http://jimmunol.org/subscriptions is online at: The Journal of Immunology Information about subscribing to Permissions http://www.aai.org/ji/copyright.html Submit copyright permission requests at: Email Alerts http://jimmunol.org/cgi/alerts/etoc Receive free email-alerts when new articles cite this article. Sign up at: Print ISSN: 0022-1767 Online ISSN: 1550-6606. Immunologists All rights reserved. Copyright © 2007 by The American Association of 9650 Rockville Pike, Bethesda, MD 20814-3994. The American Association of Immunologists, Inc., is published twice each month by The Journal of Immunology by guest on February 12, 2014 http://www.jimmunol.org/ Downloaded from by guest on February 12, 2014 http://www.jimmunol.org/ Downloaded from

Welcome message from author
This document is posted to help you gain knowledge. Please leave a comment to let me know what you think about it! Share it to your friends and learn new things together.
Transcript
of February 12, 2014.This information is current as
in Psoriasis PatientsGenes May Serve as Biomarkers of Response
Expressedof Alefacept In Vivo: Differentially Novel Insight into the Agonistic Mechanism
Cardinale, Inna Novitskaya and James G. KruegerKikuchi, Patricia Gilleaudeau, Mary S. Whalen, IrmaBandaru, Kamruz Darabi, Francesca Chamian, Toyoko Asifa S. Haider, Michelle A. Lowes, Humphrey Gardner, Raj
http://www.jimmunol.org/content/178/11/74422007; 178:7442-7449; ;J Immunol
MaterialSupplementary
htmlhttp://www.jimmunol.org/content/suppl/2008/03/13/178.11.7442.DC1.
Referenceshttp://www.jimmunol.org/content/178/11/7442.full#ref-list-1
, 13 of which you can access for free at: cites 26 articlesThis article
Subscriptionshttp://jimmunol.org/subscriptions
is online at: The Journal of ImmunologyInformation about subscribing to
Permissionshttp://www.aai.org/ji/copyright.htmlSubmit copyright permission requests at:
Email Alertshttp://jimmunol.org/cgi/alerts/etocReceive free email-alerts when new articles cite this article. Sign up at:
Print ISSN: 0022-1767 Online ISSN: 1550-6606. Immunologists All rights reserved.Copyright © 2007 by The American Association of9650 Rockville Pike, Bethesda, MD 20814-3994.The American Association of Immunologists, Inc.,
is published twice each month byThe Journal of Immunology
by guest on February 12, 2014http://w
ww
.jimm
unol.org/D
ownloaded from
by guest on February 12, 2014
http://ww
w.jim
munol.org/
Dow
nloaded from
Novel Insight into the Agonistic Mechanism of Alefacept InVivo: Differentially Expressed Genes May Serve as Biomarkersof Response in Psoriasis Patients1
Asifa S. Haider,* Michelle A. Lowes,* Humphrey Gardner,† Raj Bandaru,† Kamruz Darabi,*Francesca Chamian,* Toyoko Kikuchi,* Patricia Gilleaudeau,* Mary S. Whalen,*Irma Cardinale,* Inna Novitskaya,* and James G. Krueger2*
Alefacept is an LFA3-Ig fusion protein that binds to CD2 and is thought to inhibit T cell activation by antagonism of CD2 signalingor by lysis of CD2� cells. Alefacept is potential future therapeutic for organ transplant recipients or graft-vs-host disease and isan approved therapeutic for psoriasis vulgaris, which is a T cell-mediated inflammatory disease. However, alefacept improvespsoriasis in only �50% of patients treated for 12 wk. We studied the immunologic effects of alefacept in a group of psoriasispatients during treatment. We found that T cells, especially CD8� T cells, were rapidly decreased in the peripheral circulation.Decreases in circulating T cells were not associated with induced apoptosis. Unexpectedly, in addition to suppression of inflam-matory genes, we found a marked induction of mRNAs for STAT1, IL-8, and monokine induced by IFN-� during the first day oftreatment in PBMC. We confirmed the agonistic effects of alefacept in PBMC in vitro, which were similar to CD3/CD28 ligationon T cells. These data establish that alefacept activates gene expression programs in leukocytes and suggest that its therapeuticaction may be as a mixed agonist/antagonist. Furthermore, responding patients to alefacept treatment show unique patterns ofgene modulation. Whereas alefacept down-regulated TCRs CD3D and CD2 in responders, nonresponders reveal a higher expres-sion of T cell activation genes such as CD69 in pretreatment PBMC. These finding suggest a potential basis for categorizingresponders vs nonresponders at an early time point in treatment or before treatment of a broad range of proinflammatorydiseases. This study 1) establishes alefacept as a novel CD2 agonist molecule for induction of leukocyte activation genes (prior workproposed its mechanism as a CD2 antagonist) and 2) that differential activation of genes may categorize clinical responders to thisagent, critical for cost-effective use of this drug. The Journal of Immunology, 2007, 178: 7442–7449.
L ymphocyte functional Ag-1 and CD2 have emerged asimportant therapeutic targets for the treatment of psoriasisvulgaris, a common immune-mediated inflammatory dis-
ease of the skin that affects �25 million people in North Americaand Europe. Currently approved therapeutics to these targets areefalizumab, a humanized mAb that binds to the CD11a subunit ofLFA-1 (1), and alefacept, a LFA3-Ig fusion protein that binds toCD2 (LFA-2) (2). CD2 is expressed on the surface of all T cells,but at relatively higher levels on memory and activated T cells (3).CD2 binds to its counterreceptor CD58/LFA-3, which is expressedmainly on APCs. This interaction is thought to increase T cellactivation to specific Ags by lowering the required threshold con-centration of Ag presented to T cells by APCs (4). In vitro ligationof CD2 with certain combinations of Abs (such as mAbs againstT112 plus T113) can trigger T cell proliferation, independent of
TCR-mediated signals, so CD2 is considered a T cell surface mol-ecule with the potential for delivering agonist or activation signalsto the T cell (5). However, the biology of CD58:CD2 interactionshas been difficult to study, as expression of CD58 is restricted tohumans and primates. Mouse T cells do express CD2, but thebinding interaction is with CD48, a molecule that has much loweraffinity for CD2 compared with CD58. Even so, Abs to CD2 inmurine models of transplantation or inflammation have been usedsuccessfully to attenuate T cell-mediated effector responses (6, 7).
Alefacept is a human recombinant fusion protein comprised ofthe LFA-3 (CD58) extracellular domain fused to the hinge CH2and CH3 (c-terminal constant) regions of a human IgG1 (8). Likecertain CD2 Abs (9), alefacept was shown to inhibit T cell prolif-erative responses to various Ags or mitogens and was desig-nated a T cell inhibitory protein (LFA3TIP). The Ig domain ofalefacept interacts with cellular FcR, which is critical for invitro T cell inhibition. FcR-mediated bridging of NK cells withT cells has lead to elimination of bound T cells by induced celldeath in vitro (10).
Based on in vitro models, two therapeutic mechanisms havebeen suggested for disease improvement in psoriasis mediated byalefacept: 1) deletion of memory T cells mediated by FcR bridgingwith activated NK cells (11) or 2) inhibition of CD2-mediated Tcell costimulation via interference with CD58 binding on APCs(8). Although these therapeutic mechanisms are both tenable, thereis little evidence to support them in vivo. If NK cells induced deathof memory T cells, there should be a good correlation betweenreduction in memory CD4� T cells and clinical response. In fact,this is a weak correlation (12). Considering the second hypothesis,
*Laboratory for Investigative Dermatology, Rockefeller University, New York, NY10021; and †Biogen Idec, Cambridge, MA 02142
Received for publication November 17, 2006. Accepted for publication March27, 2007.
The costs of publication of this article were defrayed in part by the payment of pagecharges. This article must therefore be hereby marked advertisement in accordancewith 18 U.S.C. Section 1734 solely to indicate this fact.1 This work was supported in part by a General Clinical Research Center Grant(M01RR00102) from the National Center for Research Resources at the NationalInstitutes of Health (NIH). M.A.L. was supported by NIH Grant K23AR052404, andJ.G.K. was supported by NIH Grants R01 AI-49572 and AI-49832. Partial support forthis study came from an unrestricted grant from Biogen Idec.2 Address correspondence and reprint requests to Dr. James G. Krueger, Laboratoryfor Investigative Dermatology, Rockefeller University, 1230 York Ave, New York,NY 10021-6399. E-mail address: [email protected]
The Journal of Immunology
www.jimmunol.org
by guest on February 12, 2014http://w
ww
.jimm
unol.org/D
ownloaded from
T cell responses to neoantigens and recall Ags are actually fullyintact in vivo in psoriasis patients undergoing treatment with ale-facept (13), indicating functional CD2-mediated costimulation.
In this study, we have tested an alternative hypothesis regardingthe biologic activity of alefacept in psoriasis patients, namely thatalefacept might have the ability to directly ligate CD2 moleculeson T cells and thus modify T cell functions by agonist signaling.Our data show marked alterations in gene expression in PBMCinduced by alefacept within 6 h of exposure in vivo in psoriasispatients. Increased expression of many cell-activation and inflam-mation-regulating genes is induced by alefacept in vivo and invitro and there is a significant overlap with genes induced by CD3/CD28 Abs. Second, there is a dichotomous response of psoriasispatients to alefacept, such that some patients have nearly completeclearing of their skin disease, whereas others show little or nobenefit (14). We propose that one basis for differential therapeuticresponses to alefacept might be alternative signaling induced byalefacept in responders vs nonresponders. Clear differences in genemodulation were detected in responders vs nonresponders, sug-gesting a potential explanation for alternative therapeutic benefit indifferent patients.
Materials and MethodsIn vivo assays
Study design. Twenty-two patients with moderate to severe psoriasis (19males, 3 females, and ages 29–68 years, median 49 years) were enrolled inthis study, which was approved by the Rockefeller University HospitalInstitutional Review Board (IRB). The study was powered to producegroups of at least 6 patients that could be designated as good vs poorhistologic responders to alefacept (Biogen Idec). Patients were treated with12 7.5-mg weekly i.v. doses of alefacept. The patients in this study havebeen previously described (14), including methods of classification of re-sponse (12 patients) and nonresponse (10 patients). In a separate IRB-approved study, 13 patients were treated with cyclosporine A 4 mg/kg/dayand skin biopsies were taken at day 1, weeks 2, 6, and 8.Peripheral blood isolation. Peripheral blood draws were taken at 0, 1, 6,and 24 h, and weeks 2, 4, and 13, before alefacept administration. Todetermine the absolute cell numbers for each cell type, the percentage ofevents were adjusted to lymphocyte counts determined by routine completeblood count. PBMC were isolated and stored at �80°C until required aspreviously described (14).Skin samples. Skin punch biopsies were obtained at baseline and duringtreatment with alefacept or cyclosporine A. Skin biopsies were taken froma representative psoriasis plaque selected for large size, so that the samelesion could be assessed repeatedly by biopsy, and for a convenient loca-tion, e.g., abdomen or leg, for easy wound care associated with the biopsy.In general, the plaque selected for biopsy reflected the representativechanges over the rest of the body. We fixed the biopsy location by theinitial selection and did not change it ad hoc as treatment responses becameevident. The biopsies were stained for CD3 and CD11c as described pre-viously (14). Total RNA was isolated and gene expression for inducibleNO synthase (iNOS)3 and IFN-� were measured as described below.PBMC phenotype. PBMC were stained for 15 min at room temperaturewith the following Abs: CD2, CD19, CD45RA (FITC), CD8, CD16, CD27,CD45RO, CD56 (PE), CD3, CD4, CD8 (PerCP), CD3, CD45RO (allophy-cocyanin) (BD Biosciences), LFA-3TIP (PE) (BD Pharmingen, custom de-sign) as previously described (14).
In vitro assays
PBMC apoptosis in the presence of alefacept. The viability and apoptosisassays in isolated PBMC were performed in control vs alefacept (10 �g/107 cell) treatment for 6 h using the Annexin VFITC Apoptosis Detection kit(BD Pharmingen) according to manufacturer’s protocol. In brief, PBMCwere incubated for 15 min with AnnexinFITC, propidium iodide (PI) and
CD3-allophycocyanin. Four hundred microliters of binding buffer wasadded before analysis as above.PBMC activation after treatment with alefacept or anti-CD3/CD28 Absfor gene expression analysis. Nonstimulated PBMC were compared withactivation for 6 h with alefacept (10 �g/107 cell) or anti-CD3/CD28 usinga Dynabeads CD3/CD28 T-Expander (Dynal Biotech, 111.31) according tomanufacturer’s instruction. PBMC were isolated and stored at �80°C untilrequired as previously described (14). Briefly, mRNA was isolated to mea-sure the gene expression with microarray analysis.
In vivo and in vitro assays
Microarray analysis. U95Av2-set GeneChip probe microarrays (Af-fymetrix) were used containing probe sets representing �12,000 genes.Fragmentation and array hybridization were conducted according to man-ufacturer’s instructions (Affymetrix; RiboAmpOA, RNA Amplification kit;Arcturus). Scanning and quality control, GeneChip expression value anal-ysis, hierarchical clustering, and heat maps were performed as previouslydescribed (15). Briefly, for individual transcripts, fold change in expressionwas the ratio of the mean of expression level in each condition in vivopretreated vs 6 h posttreatment: n � 17 for all patients (sufficient goodquality RNA was available for 17 of total 22 patients), n � 9 for respond-ers, and n � 8 for nonresponders. Similarly, in vitro-treated PBMC afteranti-CD3/CD28 activation or alefacept treatment were compared with non-stimulated controls. A heat map of the computed tree represents unsuper-vised hierarchical clustering and is presented as red and green lines. Eachline presents the relatively up-regulated (red) or down-regulated (green)expression value of the genes in fold changes. Complete lists of genes withp values and description of relevant function of genes are provided insupplemental Table I.4 GeneOntology annotations of differentiallyexpressed genes were collected from LocusLink (www.ncbi.nlm.nih.gov/LocusLink).Validation of expression changes in mRNA with real-time RT-PCR anal-ysis. The expression of the following genes was tested in PBMC: IL-8,STAT1, monokine induced by IFN-� (MIG), human acidic ribosomal pro-tein (HARP), granzyme B (GZMB), CD122, CD69, RANTES (CCL5),CD33, CD2, CD8A, TLR5, STAT4, CD3D, IL-7R, forkhead box P3(Foxp3), and MyD88. IFN-� and iNOS were tested in skin biopsies. ThehARP gene, a housekeeping gene, was used to normalize each gene.
The primers and probes for these genes for the TaqMan RT-PCR assayswere generated with the Primer Express algorithm, version 1.0, using pub-lished genetic sequences (National Center for Biotechnology Information-PubMed) for each gene. The primer sequences have been published forIL-8, STAT1, MIG, HARP (14), and GZMB (15). The primers sequencewere as follows for: CD122: forward CAACACCCCGTCGTATACCCT, reverse CTCTCTGTGTGAATGTCAGGCG; CD122 probe: 6FAM-TGGCACCA CCTCGTCTGGGCTC-TAMARA (GenBank accessionnumber NM_000878; CD69: forward GAAAATCTGCACTGTGGGCTTT, reverse TTCTCATTCTTGGGCATGGTTATT; CD69 probe:6FAM-TGCCATGAGCTAGAAGCATCACAGGTTGA-TAMARA(GenBank accession number NM_001781); RANTES (CCL5): forwardCTGCATCTGCCTCCCCATA, CCL5 reverse GCGGGCAATGTAGGCAAA; CCL5 probe: 6FAM-TCCTCGGACACCACACCCTGCTG-TAMRA (GenBank accession number NM_002985); CD33: forward CACAGGCCCAAAATCCTCAT, reverse ACAGAGCAGGTAAGGTTTTTGGA; CD33 probe: 6FAM-CCTGGCACTCTAGAACCCGGCCA-TAMARA (GenBank accession number NM_001772); IFN-�: forwardGGTCTGTGAAGAGCCGTTGTC, reverse TGTTCCACTTTTCCTGGATTGTC; IFN-� probe: 6FAM-CCAGCAACAGTTCCAGGCATGCA-TAMARA (GenBank accession number NM_000619); iNOS: forwardCCTCAAGTCTTATTTCCTCAACGTT, reverse CCGATCAATCCAGGGTGCTA; iNOS probe: 6FAM-CCCCATCAAGCCCTTTACTTGACCTCC-TAMARA (GenBank accession number AB022318).
The primers and probes for CD2 (assay ID Hs00233515_m1), CD8A(assay ID Hs00233520_m1), TLR5 (assay ID Hs00152825_m1), STAT4(assay ID Hs00231372_m1), CD3D (assay ID Hs00174158_m1),IL-7R (assay ID Hs00233682_m1), Foxp3 (assay ID Hs00203958_m1),MyD88 (assay ID Hs0018202_m1), and CXCL11 (IFN-inducible T cell �chemoattractant) (assay ID Hs00171138_m1) were designed by AppliedBiosystems.
The RT-PCR was performed using EZ PCR Core Reagents (AppliedBiosystems) according to the manufacturer’s directions and were previ-ously described (14).
3 Abbreviations used in this paper: iNOS, inducible NO synthase; PI, propidium io-dide; MIG, monokine induced by IFN-�; HARP, human acidic ribosomal protein;GZMB, granzyme B; Foxp3, forkhead box P3; DC, dendritic cell.
Copyright © 20 by The American Association of Immunologists, Inc. 0022-1767//$2.00 4 The online version of this article contains supplemental material.
7443The Journal of Immunology
by guest on February 12, 2014http://w
ww
.jimm
unol.org/D
ownloaded from
Statistical analysis
Statistical comparisons of expression level for flow cytometry and real-time RT-PCR data were pairwise between pretreatment data and duringtreatment. A two-tailed Student t test was used; significance was designatedas p � 0.05.
Statistical comparisons of microarray data involved initially performinga robust multiple chip analysis to normalize the expression, followed byStudent’s t test to assess significantly different genes in pretreatment and6 h posttreatment on all genes present. This generated a biologically in-teresting gene list for further analysis. Due to multiple testing in the anal-ysis of microarray data, we chose to declare those genes with a false dis-covery rate of at most 5% as being significantly affected. Significant levelswere adjusted for multiplicity by the Benjamini-Hoechberg method.
ResultsAlefacept binding parallels CD2 expression on naive andmemory T cells
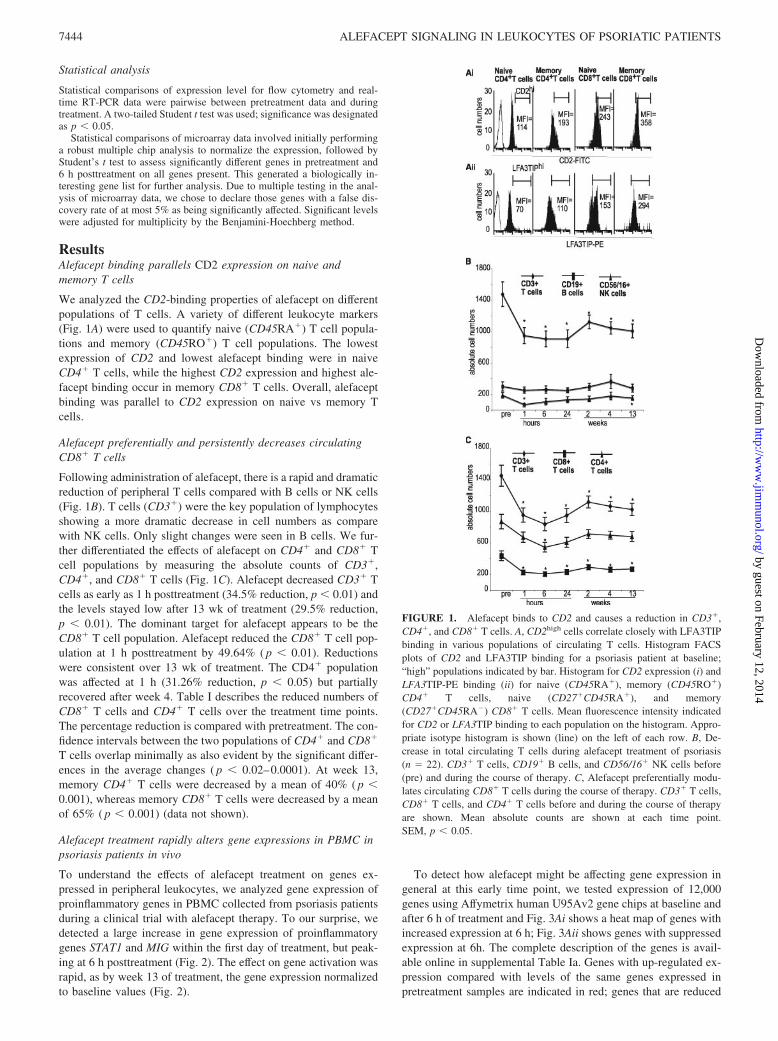
We analyzed the CD2-binding properties of alefacept on differentpopulations of T cells. A variety of different leukocyte markers(Fig. 1A) were used to quantify naive (CD45RA�) T cell popula-tions and memory (CD45RO�) T cell populations. The lowestexpression of CD2 and lowest alefacept binding were in naiveCD4� T cells, while the highest CD2 expression and highest ale-facept binding occur in memory CD8� T cells. Overall, alefaceptbinding was parallel to CD2 expression on naive vs memory Tcells.
Alefacept preferentially and persistently decreases circulatingCD8� T cells
Following administration of alefacept, there is a rapid and dramaticreduction of peripheral T cells compared with B cells or NK cells(Fig. 1B). T cells (CD3�) were the key population of lymphocytesshowing a more dramatic decrease in cell numbers as comparewith NK cells. Only slight changes were seen in B cells. We fur-ther differentiated the effects of alefacept on CD4� and CD8� Tcell populations by measuring the absolute counts of CD3�,CD4�, and CD8� T cells (Fig. 1C). Alefacept decreased CD3� Tcells as early as 1 h posttreatment (34.5% reduction, p � 0.01) andthe levels stayed low after 13 wk of treatment (29.5% reduction,p � 0.01). The dominant target for alefacept appears to be theCD8� T cell population. Alefacept reduced the CD8� T cell pop-ulation at 1 h posttreatment by 49.64% ( p � 0.01). Reductionswere consistent over 13 wk of treatment. The CD4� populationwas affected at 1 h (31.26% reduction, p � 0.05) but partiallyrecovered after week 4. Table I describes the reduced numbers ofCD8� T cells and CD4� T cells over the treatment time points.The percentage reduction is compared with pretreatment. The con-fidence intervals between the two populations of CD4� and CD8�
T cells overlap minimally as also evident by the significant differ-ences in the average changes ( p � 0.02–0.0001). At week 13,memory CD4� T cells were decreased by a mean of 40% ( p �0.001), whereas memory CD8� T cells were decreased by a meanof 65% ( p � 0.001) (data not shown).
Alefacept treatment rapidly alters gene expressions in PBMC inpsoriasis patients in vivo
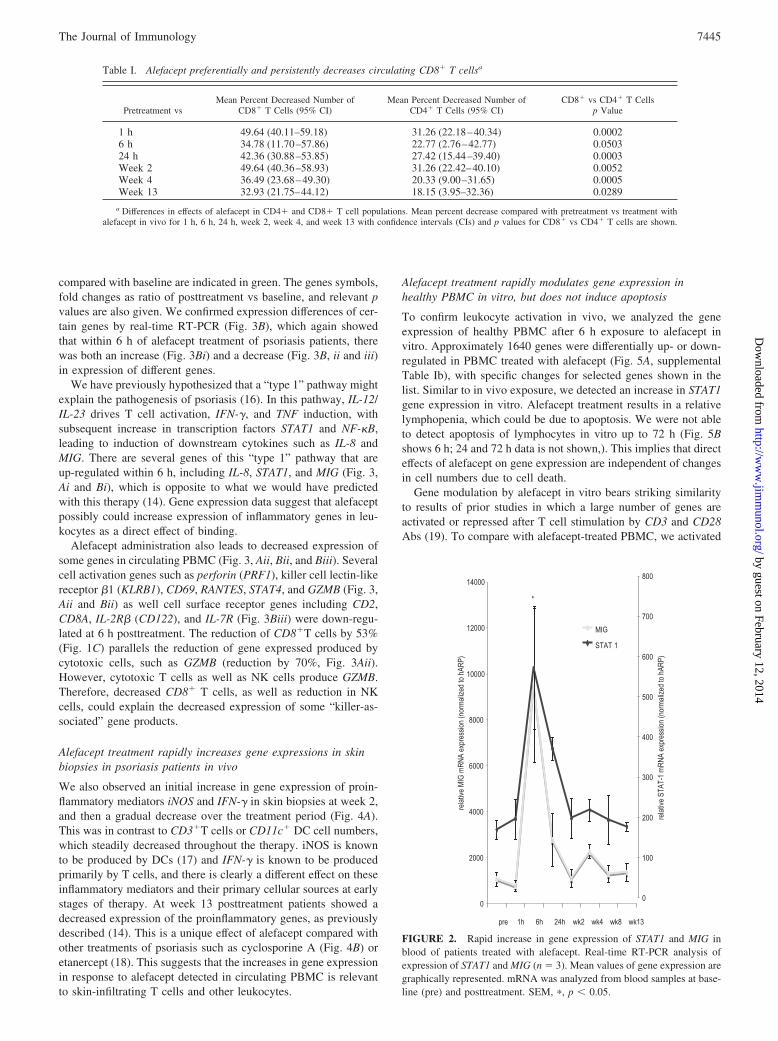
To understand the effects of alefacept treatment on genes ex-pressed in peripheral leukocytes, we analyzed gene expression ofproinflammatory genes in PBMC collected from psoriasis patientsduring a clinical trial with alefacept therapy. To our surprise, wedetected a large increase in gene expression of proinflammatorygenes STAT1 and MIG within the first day of treatment, but peak-ing at 6 h posttreatment (Fig. 2). The effect on gene activation wasrapid, as by week 13 of treatment, the gene expression normalizedto baseline values (Fig. 2).
To detect how alefacept might be affecting gene expression ingeneral at this early time point, we tested expression of 12,000genes using Affymetrix human U95Av2 gene chips at baseline andafter 6 h of treatment and Fig. 3Ai shows a heat map of genes withincreased expression at 6 h; Fig. 3Aii shows genes with suppressedexpression at 6h. The complete description of the genes is avail-able online in supplemental Table Ia. Genes with up-regulated ex-pression compared with levels of the same genes expressed inpretreatment samples are indicated in red; genes that are reduced
FIGURE 1. Alefacept binds to CD2 and causes a reduction in CD3�,CD4�, and CD8� T cells. A, CD2high cells correlate closely with LFA3TIPbinding in various populations of circulating T cells. Histogram FACSplots of CD2 and LFA3TIP binding for a psoriasis patient at baseline;“high” populations indicated by bar. Histogram for CD2 expression (i) andLFA3TIP-PE binding (ii) for naive (CD45RA�), memory (CD45RO�)CD4� T cells, naive (CD27�CD45RA�), and memory(CD27�CD45RA�) CD8� T cells. Mean fluorescence intensity indicatedfor CD2 or LFA3TIP binding to each population on the histogram. Appro-priate isotype histogram is shown (line) on the left of each row. B, De-crease in total circulating T cells during alefacept treatment of psoriasis(n � 22). CD3� T cells, CD19� B cells, and CD56/16� NK cells before(pre) and during the course of therapy. C, Alefacept preferentially modu-lates circulating CD8� T cells during the course of therapy. CD3� T cells,CD8� T cells, and CD4� T cells before and during the course of therapyare shown. Mean absolute counts are shown at each time point.SEM, p � 0.05.
7444 ALEFACEPT SIGNALING IN LEUKOCYTES OF PSORIATIC PATIENTS
by guest on February 12, 2014http://w
ww
.jimm
unol.org/D
ownloaded from
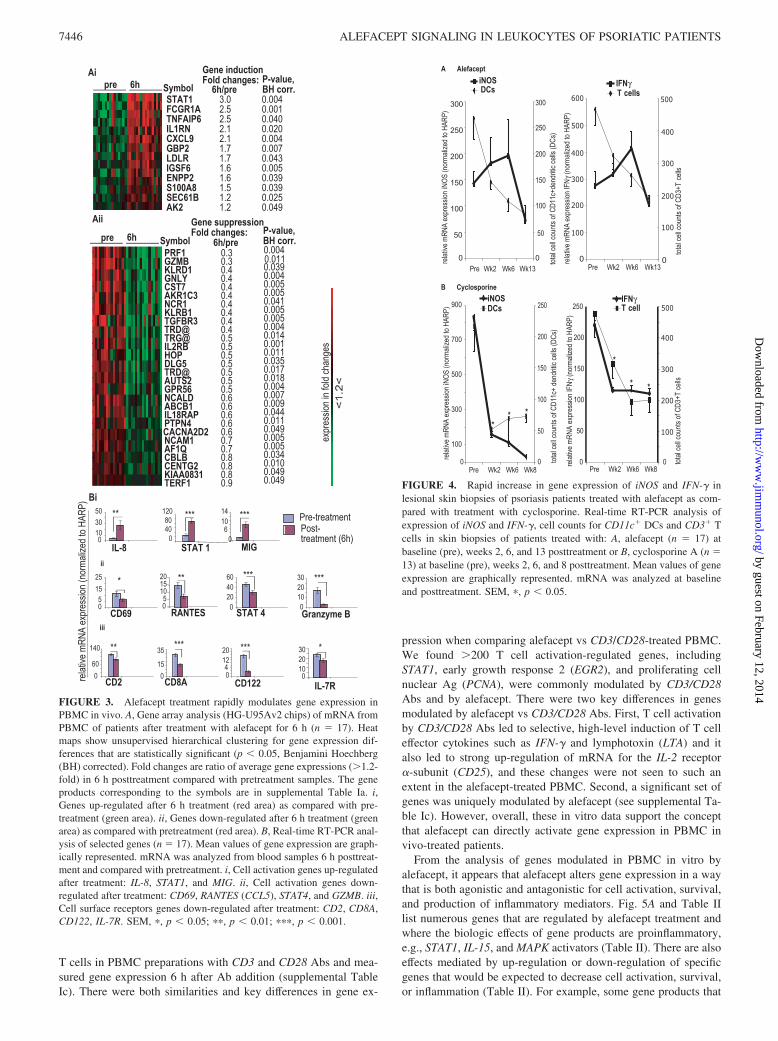
compared with baseline are indicated in green. The genes symbols,fold changes as ratio of posttreatment vs baseline, and relevant pvalues are also given. We confirmed expression differences of cer-tain genes by real-time RT-PCR (Fig. 3B), which again showedthat within 6 h of alefacept treatment of psoriasis patients, therewas both an increase (Fig. 3Bi) and a decrease (Fig. 3B, ii and iii)in expression of different genes.
We have previously hypothesized that a “type 1” pathway mightexplain the pathogenesis of psoriasis (16). In this pathway, IL-12/IL-23 drives T cell activation, IFN-�, and TNF induction, withsubsequent increase in transcription factors STAT1 and NF-�B,leading to induction of downstream cytokines such as IL-8 andMIG. There are several genes of this “type 1” pathway that areup-regulated within 6 h, including IL-8, STAT1, and MIG (Fig. 3,Ai and Bi), which is opposite to what we would have predictedwith this therapy (14). Gene expression data suggest that alefaceptpossibly could increase expression of inflammatory genes in leu-kocytes as a direct effect of binding.
Alefacept administration also leads to decreased expression ofsome genes in circulating PBMC (Fig. 3, Aii, Bii, and Biii). Severalcell activation genes such as perforin (PRF1), killer cell lectin-likereceptor �1 (KLRB1), CD69, RANTES, STAT4, and GZMB (Fig. 3,Aii and Bii) as well cell surface receptor genes including CD2,CD8A, IL-2R� (CD122), and IL-7R (Fig. 3Biii) were down-regu-lated at 6 h posttreatment. The reduction of CD8�T cells by 53%(Fig. 1C) parallels the reduction of gene expressed produced bycytotoxic cells, such as GZMB (reduction by 70%, Fig. 3Aii).However, cytotoxic T cells as well as NK cells produce GZMB.Therefore, decreased CD8� T cells, as well as reduction in NKcells, could explain the decreased expression of some “killer-as-sociated” gene products.
Alefacept treatment rapidly increases gene expressions in skinbiopsies in psoriasis patients in vivo
We also observed an initial increase in gene expression of proin-flammatory mediators iNOS and IFN-� in skin biopsies at week 2,and then a gradual decrease over the treatment period (Fig. 4A).This was in contrast to CD3�T cells or CD11c� DC cell numbers,which steadily decreased throughout the therapy. iNOS is knownto be produced by DCs (17) and IFN-� is known to be producedprimarily by T cells, and there is clearly a different effect on theseinflammatory mediators and their primary cellular sources at earlystages of therapy. At week 13 posttreatment patients showed adecreased expression of the proinflammatory genes, as previouslydescribed (14). This is a unique effect of alefacept compared withother treatments of psoriasis such as cyclosporine A (Fig. 4B) oretanercept (18). This suggests that the increases in gene expressionin response to alefacept detected in circulating PBMC is relevantto skin-infiltrating T cells and other leukocytes.
Alefacept treatment rapidly modulates gene expression inhealthy PBMC in vitro, but does not induce apoptosis
To confirm leukocyte activation in vivo, we analyzed the geneexpression of healthy PBMC after 6 h exposure to alefacept invitro. Approximately 1640 genes were differentially up- or down-regulated in PBMC treated with alefacept (Fig. 5A, supplementalTable Ib), with specific changes for selected genes shown in thelist. Similar to in vivo exposure, we detected an increase in STAT1gene expression in vitro. Alefacept treatment results in a relativelymphopenia, which could be due to apoptosis. We were not ableto detect apoptosis of lymphocytes in vitro up to 72 h (Fig. 5Bshows 6 h; 24 and 72 h data is not shown,). This implies that directeffects of alefacept on gene expression are independent of changesin cell numbers due to cell death.
Gene modulation by alefacept in vitro bears striking similarityto results of prior studies in which a large number of genes areactivated or repressed after T cell stimulation by CD3 and CD28Abs (19). To compare with alefacept-treated PBMC, we activated
FIGURE 2. Rapid increase in gene expression of STAT1 and MIG inblood of patients treated with alefacept. Real-time RT-PCR analysis ofexpression of STAT1 and MIG (n � 3). Mean values of gene expression aregraphically represented. mRNA was analyzed from blood samples at base-line (pre) and posttreatment. SEM, �, p � 0.05.
Table I. Alefacept preferentially and persistently decreases circulating CD8� T cellsa
Pretreatment vsMean Percent Decreased Number of
CD8� T Cells (95% CI)Mean Percent Decreased Number of
CD4� T Cells (95% CI)CD8� vs CD4� T Cells
p Value
1 h 49.64 (40.11–59.18) 31.26 (22.18–40.34) 0.00026 h 34.78 (11.70–57.86) 22.77 (2.76–42.77) 0.050324 h 42.36 (30.88–53.85) 27.42 (15.44–39.40) 0.0003Week 2 49.64 (40.36–58.93) 31.26 (22.42–40.10) 0.0052Week 4 36.49 (23.68–49.30) 20.33 (9.00–31.65) 0.0005Week 13 32.93 (21.75–44.12) 18.15 (3.95–32.36) 0.0289
a Differences in effects of alefacept in CD4� and CD8� T cell populations. Mean percent decrease compared with pretreatment vs treatment withalefacept in vivo for 1 h, 6 h, 24 h, week 2, week 4, and week 13 with confidence intervals (CIs) and p values for CD8� vs CD4� T cells are shown.
7445The Journal of Immunology
by guest on February 12, 2014http://w
ww
.jimm
unol.org/D
ownloaded from
T cells in PBMC preparations with CD3 and CD28 Abs and mea-sured gene expression 6 h after Ab addition (supplemental TableIc). There were both similarities and key differences in gene ex-
pression when comparing alefacept vs CD3/CD28-treated PBMC.We found �200 T cell activation-regulated genes, includingSTAT1, early growth response 2 (EGR2), and proliferating cellnuclear Ag (PCNA), were commonly modulated by CD3/CD28Abs and by alefacept. There were two key differences in genesmodulated by alefacept vs CD3/CD28 Abs. First, T cell activationby CD3/CD28 Abs led to selective, high-level induction of T celleffector cytokines such as IFN-� and lymphotoxin (LTA) and italso led to strong up-regulation of mRNA for the IL-2 receptor�-subunit (CD25), and these changes were not seen to such anextent in the alefacept-treated PBMC. Second, a significant set ofgenes was uniquely modulated by alefacept (see supplemental Ta-ble Ic). However, overall, these in vitro data support the conceptthat alefacept can directly activate gene expression in PBMC invivo-treated patients.
From the analysis of genes modulated in PBMC in vitro byalefacept, it appears that alefacept alters gene expression in a waythat is both agonistic and antagonistic for cell activation, survival,and production of inflammatory mediators. Fig. 5A and Table IIlist numerous genes that are regulated by alefacept treatment andwhere the biologic effects of gene products are proinflammatory,e.g., STAT1, IL-15, and MAPK activators (Table II). There are alsoeffects mediated by up-regulation or down-regulation of specificgenes that would be expected to decrease cell activation, survival,or inflammation (Table II). For example, some gene products that
FIGURE 3. Alefacept treatment rapidly modulates gene expression inPBMC in vivo. A, Gene array analysis (HG-U95Av2 chips) of mRNA fromPBMC of patients after treatment with alefacept for 6 h (n � 17). Heatmaps show unsupervised hierarchical clustering for gene expression dif-ferences that are statistically significant (p � 0.05, Benjamini Hoechberg(BH) corrected). Fold changes are ratio of average gene expressions (�1.2-fold) in 6 h posttreatment compared with pretreatment samples. The geneproducts corresponding to the symbols are in supplemental Table Ia. i,Genes up-regulated after 6 h treatment (red area) as compared with pre-treatment (green area). ii, Genes down-regulated after 6 h treatment (greenarea) as compared with pretreatment (red area). B, Real-time RT-PCR anal-ysis of selected genes (n � 17). Mean values of gene expression are graph-ically represented. mRNA was analyzed from blood samples 6 h posttreat-ment and compared with pretreatment. i, Cell activation genes up-regulatedafter treatment: IL-8, STAT1, and MIG. ii, Cell activation genes down-regulated after treatment: CD69, RANTES (CCL5), STAT4, and GZMB. iii,Cell surface receptors genes down-regulated after treatment: CD2, CD8A,CD122, IL-7R. SEM, �, p � 0.05; ��, p � 0.01; ���, p � 0.001.
FIGURE 4. Rapid increase in gene expression of iNOS and IFN-� inlesional skin biopsies of psoriasis patients treated with alefacept as com-pared with treatment with cyclosporine. Real-time RT-PCR analysis ofexpression of iNOS and IFN-�, cell counts for CD11c� DCs and CD3� Tcells in skin biopsies of patients treated with: A, alefacept (n � 17) atbaseline (pre), weeks 2, 6, and 13 posttreatment or B, cyclosporine A (n �13) at baseline (pre), weeks 2, 6, and 8 posttreatment. Mean values of geneexpression are graphically represented. mRNA was analyzed at baselineand posttreatment. SEM, �, p � 0.05.
7446 ALEFACEPT SIGNALING IN LEUKOCYTES OF PSORIATIC PATIENTS
by guest on February 12, 2014http://w
ww
.jimm
unol.org/D
ownloaded from
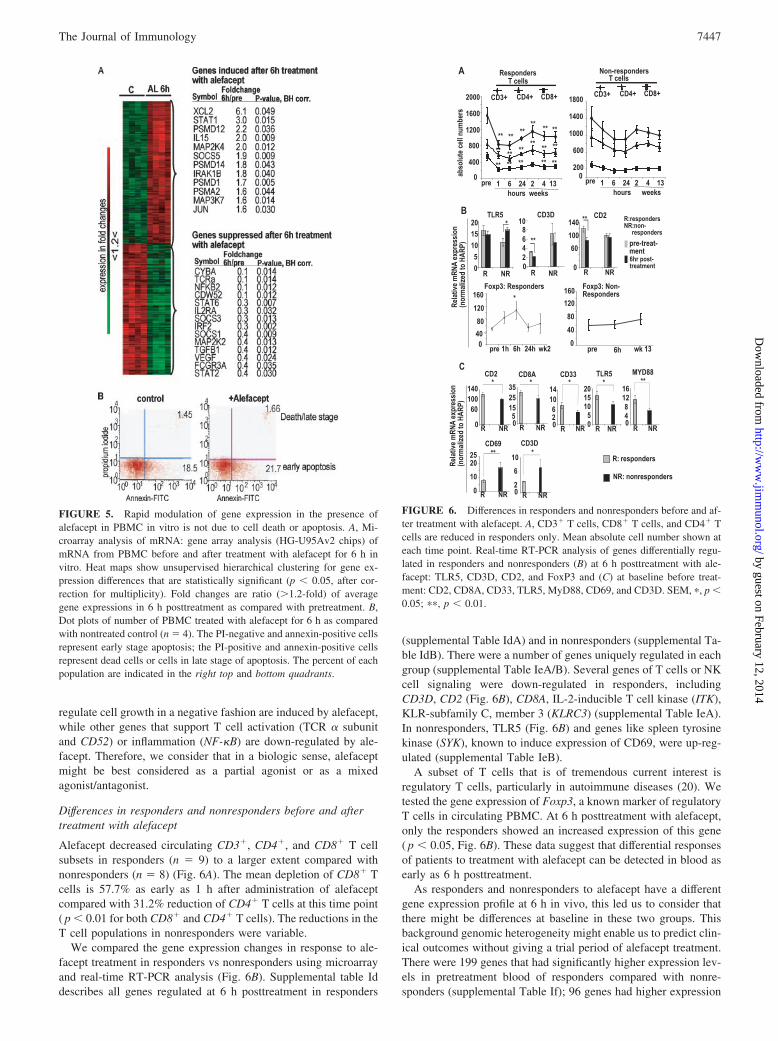
regulate cell growth in a negative fashion are induced by alefacept,while other genes that support T cell activation (TCR � subunitand CD52) or inflammation (NF-�B) are down-regulated by ale-facept. Therefore, we consider that in a biologic sense, alefaceptmight be best considered as a partial agonist or as a mixedagonist/antagonist.
Differences in responders and nonresponders before and aftertreatment with alefacept
Alefacept decreased circulating CD3�, CD4�, and CD8� T cellsubsets in responders (n � 9) to a larger extent compared withnonresponders (n � 8) (Fig. 6A). The mean depletion of CD8� Tcells is 57.7% as early as 1 h after administration of alefaceptcompared with 31.2% reduction of CD4� T cells at this time point( p � 0.01 for both CD8� and CD4� T cells). The reductions in theT cell populations in nonresponders were variable.
We compared the gene expression changes in response to ale-facept treatment in responders vs nonresponders using microarrayand real-time RT-PCR analysis (Fig. 6B). Supplemental table Iddescribes all genes regulated at 6 h posttreatment in responders
(supplemental Table IdA) and in nonresponders (supplemental Ta-ble IdB). There were a number of genes uniquely regulated in eachgroup (supplemental Table IeA/B). Several genes of T cells or NKcell signaling were down-regulated in responders, includingCD3D, CD2 (Fig. 6B), CD8A, IL-2-inducible T cell kinase (ITK),KLR-subfamily C, member 3 (KLRC3) (supplemental Table IeA).In nonresponders, TLR5 (Fig. 6B) and genes like spleen tyrosinekinase (SYK), known to induce expression of CD69, were up-reg-ulated (supplemental Table IeB).
A subset of T cells that is of tremendous current interest isregulatory T cells, particularly in autoimmune diseases (20). Wetested the gene expression of Foxp3, a known marker of regulatoryT cells in circulating PBMC. At 6 h posttreatment with alefacept,only the responders showed an increased expression of this gene( p � 0.05, Fig. 6B). These data suggest that differential responsesof patients to treatment with alefacept can be detected in blood asearly as 6 h posttreatment.
As responders and nonresponders to alefacept have a differentgene expression profile at 6 h in vivo, this led us to consider thatthere might be differences at baseline in these two groups. Thisbackground genomic heterogeneity might enable us to predict clin-ical outcomes without giving a trial period of alefacept treatment.There were 199 genes that had significantly higher expression lev-els in pretreatment blood of responders compared with nonre-sponders (supplemental Table If); 96 genes had higher expression
FIGURE 6. Differences in responders and nonresponders before and af-ter treatment with alefacept. A, CD3� T cells, CD8� T cells, and CD4� Tcells are reduced in responders only. Mean absolute cell number shown ateach time point. Real-time RT-PCR analysis of genes differentially regu-lated in responders and nonresponders (B) at 6 h posttreatment with ale-facept: TLR5, CD3D, CD2, and FoxP3 and (C) at baseline before treat-ment: CD2, CD8A, CD33, TLR5, MyD88, CD69, and CD3D. SEM, �, p �0.05; ��, p � 0.01.
FIGURE 5. Rapid modulation of gene expression in the presence ofalefacept in PBMC in vitro is not due to cell death or apoptosis. A, Mi-croarray analysis of mRNA: gene array analysis (HG-U95Av2 chips) ofmRNA from PBMC before and after treatment with alefacept for 6 h invitro. Heat maps show unsupervised hierarchical clustering for gene ex-pression differences that are statistically significant (p � 0.05, after cor-rection for multiplicity). Fold changes are ratio (�1.2-fold) of averagegene expressions in 6 h posttreatment as compared with pretreatment. B,Dot plots of number of PBMC treated with alefacept for 6 h as comparedwith nontreated control (n � 4). The PI-negative and annexin-positive cellsrepresent early stage apoptosis; the PI-positive and annexin-positive cellsrepresent dead cells or cells in late stage of apoptosis. The percent of eachpopulation are indicated in the right top and bottom quadrants.
7447The Journal of Immunology
by guest on February 12, 2014http://w
ww
.jimm
unol.org/D
ownloaded from
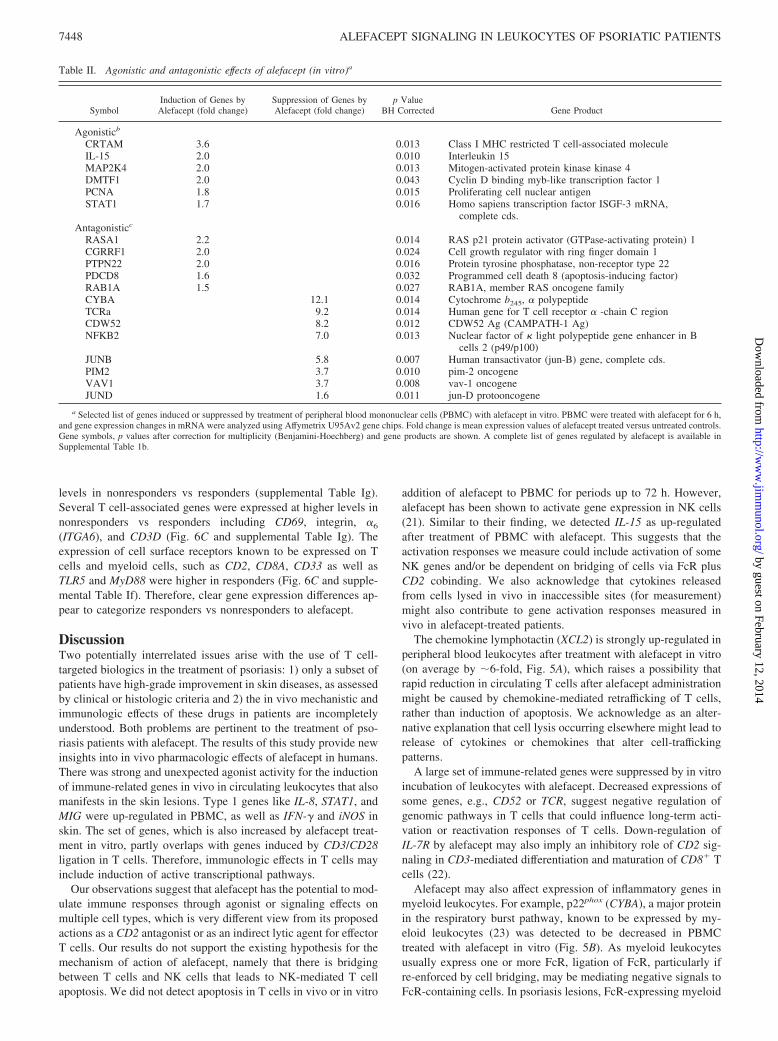
levels in nonresponders vs responders (supplemental Table Ig).Several T cell-associated genes were expressed at higher levels innonresponders vs responders including CD69, integrin, �6
(ITGA6), and CD3D (Fig. 6C and supplemental Table Ig). Theexpression of cell surface receptors known to be expressed on Tcells and myeloid cells, such as CD2, CD8A, CD33 as well asTLR5 and MyD88 were higher in responders (Fig. 6C and supple-mental Table If). Therefore, clear gene expression differences ap-pear to categorize responders vs nonresponders to alefacept.
DiscussionTwo potentially interrelated issues arise with the use of T cell-targeted biologics in the treatment of psoriasis: 1) only a subset ofpatients have high-grade improvement in skin diseases, as assessedby clinical or histologic criteria and 2) the in vivo mechanistic andimmunologic effects of these drugs in patients are incompletelyunderstood. Both problems are pertinent to the treatment of pso-riasis patients with alefacept. The results of this study provide newinsights into in vivo pharmacologic effects of alefacept in humans.There was strong and unexpected agonist activity for the inductionof immune-related genes in vivo in circulating leukocytes that alsomanifests in the skin lesions. Type 1 genes like IL-8, STAT1, andMIG were up-regulated in PBMC, as well as IFN-� and iNOS inskin. The set of genes, which is also increased by alefacept treat-ment in vitro, partly overlaps with genes induced by CD3/CD28ligation in T cells. Therefore, immunologic effects in T cells mayinclude induction of active transcriptional pathways.
Our observations suggest that alefacept has the potential to mod-ulate immune responses through agonist or signaling effects onmultiple cell types, which is very different view from its proposedactions as a CD2 antagonist or as an indirect lytic agent for effectorT cells. Our results do not support the existing hypothesis for themechanism of action of alefacept, namely that there is bridgingbetween T cells and NK cells that leads to NK-mediated T cellapoptosis. We did not detect apoptosis in T cells in vivo or in vitro
addition of alefacept to PBMC for periods up to 72 h. However,alefacept has been shown to activate gene expression in NK cells(21). Similar to their finding, we detected IL-15 as up-regulatedafter treatment of PBMC with alefacept. This suggests that theactivation responses we measure could include activation of someNK genes and/or be dependent on bridging of cells via FcR plusCD2 cobinding. We also acknowledge that cytokines releasedfrom cells lysed in vivo in inaccessible sites (for measurement)might also contribute to gene activation responses measured invivo in alefacept-treated patients.
The chemokine lymphotactin (XCL2) is strongly up-regulated inperipheral blood leukocytes after treatment with alefacept in vitro(on average by �6-fold, Fig. 5A), which raises a possibility thatrapid reduction in circulating T cells after alefacept administrationmight be caused by chemokine-mediated retrafficking of T cells,rather than induction of apoptosis. We acknowledge as an alter-native explanation that cell lysis occurring elsewhere might lead torelease of cytokines or chemokines that alter cell-traffickingpatterns.
A large set of immune-related genes were suppressed by in vitroincubation of leukocytes with alefacept. Decreased expressions ofsome genes, e.g., CD52 or TCR, suggest negative regulation ofgenomic pathways in T cells that could influence long-term acti-vation or reactivation responses of T cells. Down-regulation ofIL-7R by alefacept may also imply an inhibitory role of CD2 sig-naling in CD3-mediated differentiation and maturation of CD8� Tcells (22).
Alefacept may also affect expression of inflammatory genes inmyeloid leukocytes. For example, p22phox (CYBA), a major proteinin the respiratory burst pathway, known to be expressed by my-eloid leukocytes (23) was detected to be decreased in PBMCtreated with alefacept in vitro (Fig. 5B). As myeloid leukocytesusually express one or more FcR, ligation of FcR, particularly ifre-enforced by cell bridging, may be mediating negative signals toFcR-containing cells. In psoriasis lesions, FcR-expressing myeloid
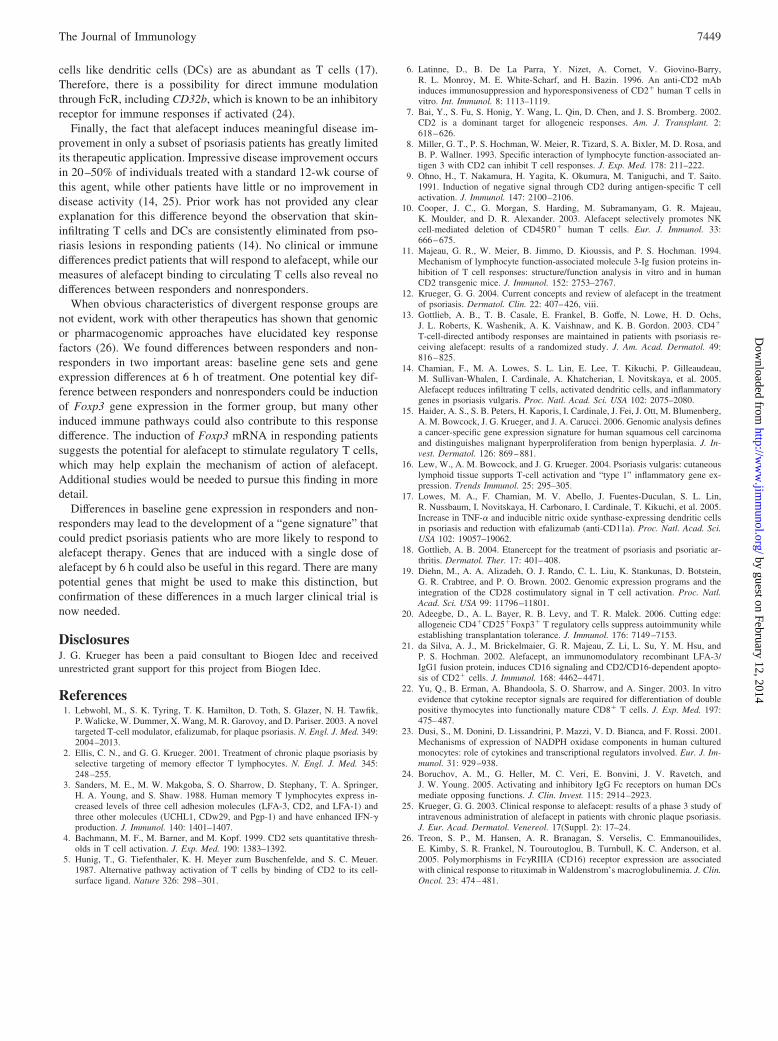
Table II. Agonistic and antagonistic effects of alefacept (in vitro)a
SymbolInduction of Genes byAlefacept (fold change)
Suppression of Genes byAlefacept (fold change)
p ValueBH Corrected Gene Product
Agonisticb
CRTAM 3.6 0.013 Class I MHC restricted T cell-associated moleculeIL-15 2.0 0.010 Interleukin 15MAP2K4 2.0 0.013 Mitogen-activated protein kinase kinase 4DMTF1 2.0 0.043 Cyclin D binding myb-like transcription factor 1PCNA 1.8 0.015 Proliferating cell nuclear antigenSTAT1 1.7 0.016 Homo sapiens transcription factor ISGF-3 mRNA,
complete cds.Antagonisticc
RASA1 2.2 0.014 RAS p21 protein activator (GTPase-activating protein) 1CGRRF1 2.0 0.024 Cell growth regulator with ring finger domain 1PTPN22 2.0 0.016 Protein tyrosine phosphatase, non-receptor type 22PDCD8 1.6 0.032 Programmed cell death 8 (apoptosis-inducing factor)RAB1A 1.5 0.027 RAB1A, member RAS oncogene familyCYBA 12.1 0.014 Cytochrome b245, � polypeptideTCRa 9.2 0.014 Human gene for T cell receptor � -chain C regionCDW52 8.2 0.012 CDW52 Ag (CAMPATH-1 Ag)NFKB2 7.0 0.013 Nuclear factor of � light polypeptide gene enhancer in B
cells 2 (p49/p100)JUNB 5.8 0.007 Human transactivator (jun-B) gene, complete cds.PIM2 3.7 0.010 pim-2 oncogeneVAV1 3.7 0.008 vav-1 oncogeneJUND 1.6 0.011 jun-D protooncogene
a Selected list of genes induced or suppressed by treatment of peripheral blood mononuclear cells (PBMC) with alefacept in vitro. PBMC were treated with alefacept for 6 h,and gene expression changes in mRNA were analyzed using Affymetrix U95Av2 gene chips. Fold change is mean expression values of alefacept treated versus untreated controls.Gene symbols, p values after correction for multiplicity (Benjamini-Hoechberg) and gene products are shown. A complete list of genes regulated by alefacept is available inSupplemental Table 1b.
7448 ALEFACEPT SIGNALING IN LEUKOCYTES OF PSORIATIC PATIENTS
by guest on February 12, 2014http://w
ww
.jimm
unol.org/D
ownloaded from
cells like dendritic cells (DCs) are as abundant as T cells (17).Therefore, there is a possibility for direct immune modulationthrough FcR, including CD32b, which is known to be an inhibitoryreceptor for immune responses if activated (24).
Finally, the fact that alefacept induces meaningful disease im-provement in only a subset of psoriasis patients has greatly limitedits therapeutic application. Impressive disease improvement occursin 20–50% of individuals treated with a standard 12-wk course ofthis agent, while other patients have little or no improvement indisease activity (14, 25). Prior work has not provided any clearexplanation for this difference beyond the observation that skin-infiltrating T cells and DCs are consistently eliminated from pso-riasis lesions in responding patients (14). No clinical or immunedifferences predict patients that will respond to alefacept, while ourmeasures of alefacept binding to circulating T cells also reveal nodifferences between responders and nonresponders.
When obvious characteristics of divergent response groups arenot evident, work with other therapeutics has shown that genomicor pharmacogenomic approaches have elucidated key responsefactors (26). We found differences between responders and non-responders in two important areas: baseline gene sets and geneexpression differences at 6 h of treatment. One potential key dif-ference between responders and nonresponders could be inductionof Foxp3 gene expression in the former group, but many otherinduced immune pathways could also contribute to this responsedifference. The induction of Foxp3 mRNA in responding patientssuggests the potential for alefacept to stimulate regulatory T cells,which may help explain the mechanism of action of alefacept.Additional studies would be needed to pursue this finding in moredetail.
Differences in baseline gene expression in responders and non-responders may lead to the development of a “gene signature” thatcould predict psoriasis patients who are more likely to respond toalefacept therapy. Genes that are induced with a single dose ofalefacept by 6 h could also be useful in this regard. There are manypotential genes that might be used to make this distinction, butconfirmation of these differences in a much larger clinical trial isnow needed.
DisclosuresJ. G. Krueger has been a paid consultant to Biogen Idec and receivedunrestricted grant support for this project from Biogen Idec.
References1. Lebwohl, M., S. K. Tyring, T. K. Hamilton, D. Toth, S. Glazer, N. H. Tawfik,
P. Walicke, W. Dummer, X. Wang, M. R. Garovoy, and D. Pariser. 2003. A noveltargeted T-cell modulator, efalizumab, for plaque psoriasis. N. Engl. J. Med. 349:2004–2013.
2. Ellis, C. N., and G. G. Krueger. 2001. Treatment of chronic plaque psoriasis byselective targeting of memory effector T lymphocytes. N. Engl. J. Med. 345:248–255.
3. Sanders, M. E., M. W. Makgoba, S. O. Sharrow, D. Stephany, T. A. Springer,H. A. Young, and S. Shaw. 1988. Human memory T lymphocytes express in-creased levels of three cell adhesion molecules (LFA-3, CD2, and LFA-1) andthree other molecules (UCHL1, CDw29, and Pgp-1) and have enhanced IFN-�production. J. Immunol. 140: 1401–1407.
4. Bachmann, M. F., M. Barner, and M. Kopf. 1999. CD2 sets quantitative thresh-olds in T cell activation. J. Exp. Med. 190: 1383–1392.
5. Hunig, T., G. Tiefenthaler, K. H. Meyer zum Buschenfelde, and S. C. Meuer.1987. Alternative pathway activation of T cells by binding of CD2 to its cell-surface ligand. Nature 326: 298–301.
6. Latinne, D., B. De La Parra, Y. Nizet, A. Cornet, V. Giovino-Barry,R. L. Monroy, M. E. White-Scharf, and H. Bazin. 1996. An anti-CD2 mAbinduces immunosuppression and hyporesponsiveness of CD2� human T cells invitro. Int. Immunol. 8: 1113–1119.
7. Bai, Y., S. Fu, S. Honig, Y. Wang, L. Qin, D. Chen, and J. S. Bromberg. 2002.CD2 is a dominant target for allogeneic responses. Am. J. Transplant. 2:618–626.
8. Miller, G. T., P. S. Hochman, W. Meier, R. Tizard, S. A. Bixler, M. D. Rosa, andB. P. Wallner. 1993. Specific interaction of lymphocyte function-associated an-tigen 3 with CD2 can inhibit T cell responses. J. Exp. Med. 178: 211–222.
9. Ohno, H., T. Nakamura, H. Yagita, K. Okumura, M. Taniguchi, and T. Saito.1991. Induction of negative signal through CD2 during antigen-specific T cellactivation. J. Immunol. 147: 2100–2106.
10. Cooper, J. C., G. Morgan, S. Harding, M. Subramanyam, G. R. Majeau,K. Moulder, and D. R. Alexander. 2003. Alefacept selectively promotes NKcell-mediated deletion of CD45R0� human T cells. Eur. J. Immunol. 33:666–675.
11. Majeau, G. R., W. Meier, B. Jimmo, D. Kioussis, and P. S. Hochman. 1994.Mechanism of lymphocyte function-associated molecule 3-Ig fusion proteins in-hibition of T cell responses: structure/function analysis in vitro and in humanCD2 transgenic mice. J. Immunol. 152: 2753–2767.
12. Krueger, G. G. 2004. Current concepts and review of alefacept in the treatmentof psoriasis. Dermatol. Clin. 22: 407–426, viii.
13. Gottlieb, A. B., T. B. Casale, E. Frankel, B. Goffe, N. Lowe, H. D. Ochs,J. L. Roberts, K. Washenik, A. K. Vaishnaw, and K. B. Gordon. 2003. CD4�
T-cell-directed antibody responses are maintained in patients with psoriasis re-ceiving alefacept: results of a randomized study. J. Am. Acad. Dermatol. 49:816–825.
14. Chamian, F., M. A. Lowes, S. L. Lin, E. Lee, T. Kikuchi, P. Gilleaudeau,M. Sullivan-Whalen, I. Cardinale, A. Khatcherian, I. Novitskaya, et al. 2005.Alefacept reduces infiltrating T cells, activated dendritic cells, and inflammatorygenes in psoriasis vulgaris. Proc. Natl. Acad. Sci. USA 102: 2075–2080.
15. Haider, A. S., S. B. Peters, H. Kaporis, I. Cardinale, J. Fei, J. Ott, M. Blumenberg,A. M. Bowcock, J. G. Krueger, and J. A. Carucci. 2006. Genomic analysis definesa cancer-specific gene expression signature for human squamous cell carcinomaand distinguishes malignant hyperproliferation from benign hyperplasia. J. In-vest. Dermatol. 126: 869–881.
16. Lew, W., A. M. Bowcock, and J. G. Krueger. 2004. Psoriasis vulgaris: cutaneouslymphoid tissue supports T-cell activation and “type 1” inflammatory gene ex-pression. Trends Immunol. 25: 295–305.
17. Lowes, M. A., F. Chamian, M. V. Abello, J. Fuentes-Duculan, S. L. Lin,R. Nussbaum, I. Novitskaya, H. Carbonaro, I. Cardinale, T. Kikuchi, et al. 2005.Increase in TNF-� and inducible nitric oxide synthase-expressing dendritic cellsin psoriasis and reduction with efalizumab (anti-CD11a). Proc. Natl. Acad. Sci.USA 102: 19057–19062.
18. Gottlieb, A. B. 2004. Etanercept for the treatment of psoriasis and psoriatic ar-thritis. Dermatol. Ther. 17: 401–408.
19. Diehn, M., A. A. Alizadeh, O. J. Rando, C. L. Liu, K. Stankunas, D. Botstein,G. R. Crabtree, and P. O. Brown. 2002. Genomic expression programs and theintegration of the CD28 costimulatory signal in T cell activation. Proc. Natl.Acad. Sci. USA 99: 11796–11801.
20. Adeegbe, D., A. L. Bayer, R. B. Levy, and T. R. Malek. 2006. Cutting edge:allogeneic CD4�CD25�Foxp3� T regulatory cells suppress autoimmunity whileestablishing transplantation tolerance. J. Immunol. 176: 7149–7153.
21. da Silva, A. J., M. Brickelmaier, G. R. Majeau, Z. Li, L. Su, Y. M. Hsu, andP. S. Hochman. 2002. Alefacept, an immunomodulatory recombinant LFA-3/IgG1 fusion protein, induces CD16 signaling and CD2/CD16-dependent apopto-sis of CD2� cells. J. Immunol. 168: 4462–4471.
22. Yu, Q., B. Erman, A. Bhandoola, S. O. Sharrow, and A. Singer. 2003. In vitroevidence that cytokine receptor signals are required for differentiation of doublepositive thymocytes into functionally mature CD8� T cells. J. Exp. Med. 197:475–487.
23. Dusi, S., M. Donini, D. Lissandrini, P. Mazzi, V. D. Bianca, and F. Rossi. 2001.Mechanisms of expression of NADPH oxidase components in human culturedmonocytes: role of cytokines and transcriptional regulators involved. Eur. J. Im-munol. 31: 929–938.
24. Boruchov, A. M., G. Heller, M. C. Veri, E. Bonvini, J. V. Ravetch, andJ. W. Young. 2005. Activating and inhibitory IgG Fc receptors on human DCsmediate opposing functions. J. Clin. Invest. 115: 2914–2923.
25. Krueger, G. G. 2003. Clinical response to alefacept: results of a phase 3 study ofintravenous administration of alefacept in patients with chronic plaque psoriasis.J. Eur. Acad. Dermatol. Venereol. 17(Suppl. 2): 17–24.
26. Treon, S. P., M. Hansen, A. R. Branagan, S. Verselis, C. Emmanouilides,E. Kimby, S. R. Frankel, N. Touroutoglou, B. Turnbull, K. C. Anderson, et al.2005. Polymorphisms in Fc�RIIIA (CD16) receptor expression are associatedwith clinical response to rituximab in Waldenstrom’s macroglobulinemia. J. Clin.Oncol. 23: 474–481.
7449The Journal of Immunology
by guest on February 12, 2014http://w
ww
.jimm
unol.org/D
ownloaded from
Related Documents