Gas Well Deliquification Workshop Sheraton Hotel, Denver, Colorado February 19 – 22, 2012 Pseudo Steady-State Plunger Lift Model Kees Veeken Shell E&P Europe (NAM B.V.)

Welcome message from author
This document is posted to help you gain knowledge. Please leave a comment to let me know what you think about it! Share it to your friends and learn new things together.
Transcript
Gas Well Deliquification Workshop
Sheraton Hotel, Denver, Colorado
February 19 – 22, 2012
Pseudo Steady-State Plunger Lift Model
Kees Veeken
Shell E&P Europe (NAM B.V.)
Feb. 19 – 22, 2012 2012 Gas Well Deliquification Workshop
Denver, Colorado
2
Contents
• Reasons
• Assumptions and equations
• Observations
• Conclusions
Feb. 19 – 22, 2012 2012 Gas Well Deliquification Workshop
Denver, Colorado
3
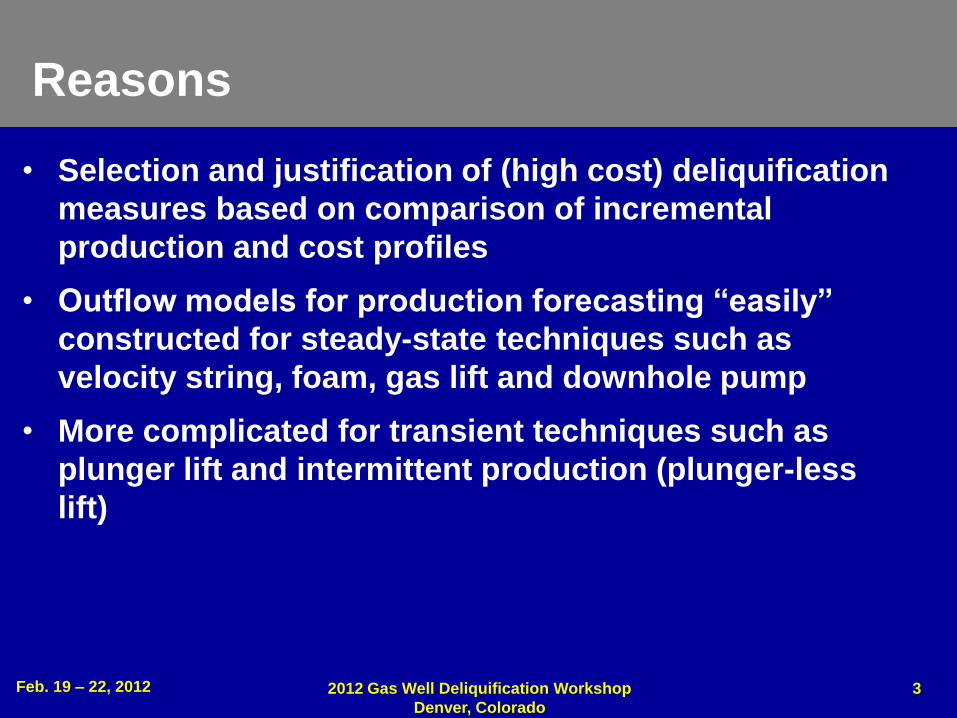
Reasons
• Selection and justification of (high cost) deliquification
measures based on comparison of incremental
production and cost profiles
• Outflow models for production forecasting “easily”
constructed for steady-state techniques such as
velocity string, foam, gas lift and downhole pump
• More complicated for transient techniques such as
plunger lift and intermittent production (plunger-less
lift)
Feb. 19 – 22, 2012 2012 Gas Well Deliquification Workshop
Denver, Colorado
4
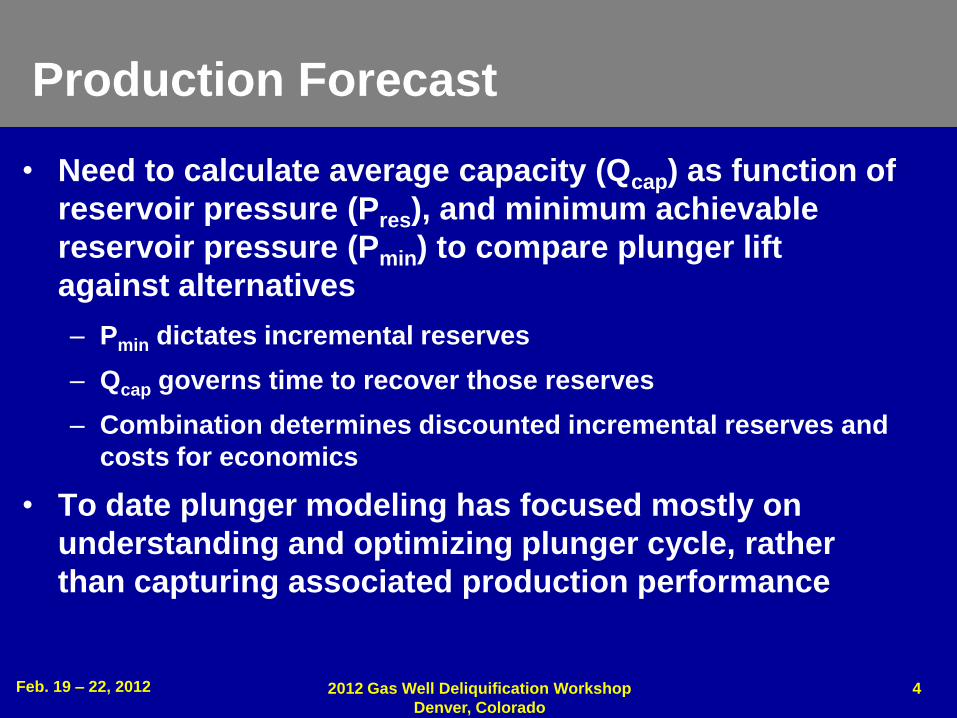
Production Forecast
• Need to calculate average capacity (Qcap) as function of
reservoir pressure (Pres), and minimum achievable
reservoir pressure (Pmin) to compare plunger lift
against alternatives
– Pmin dictates incremental reserves
– Qcap governs time to recover those reserves
– Combination determines discounted incremental reserves and
costs for economics
• To date plunger modeling has focused mostly on
understanding and optimizing plunger cycle, rather
than capturing associated production performance
Feb. 19 – 22, 2012 2012 Gas Well Deliquification Workshop
Denver, Colorado
5
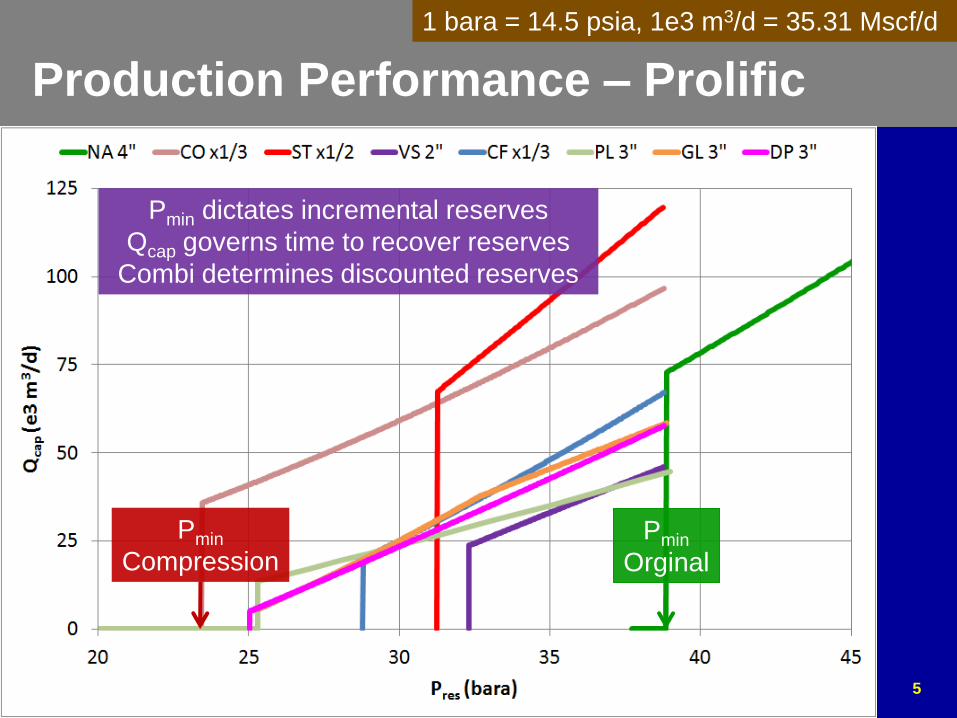
Production Performance – Prolific
Pmin dictates incremental reserves
Qcap governs time to recover reserves
Combi determines discounted reserves
Pmin
Compression
Pmin
Orginal
1 bara = 14.5 psia, 1e3 m3/d = 35.31 Mscf/d
Feb. 19 – 22, 2012 2012 Gas Well Deliquification Workshop
Denver, Colorado
6
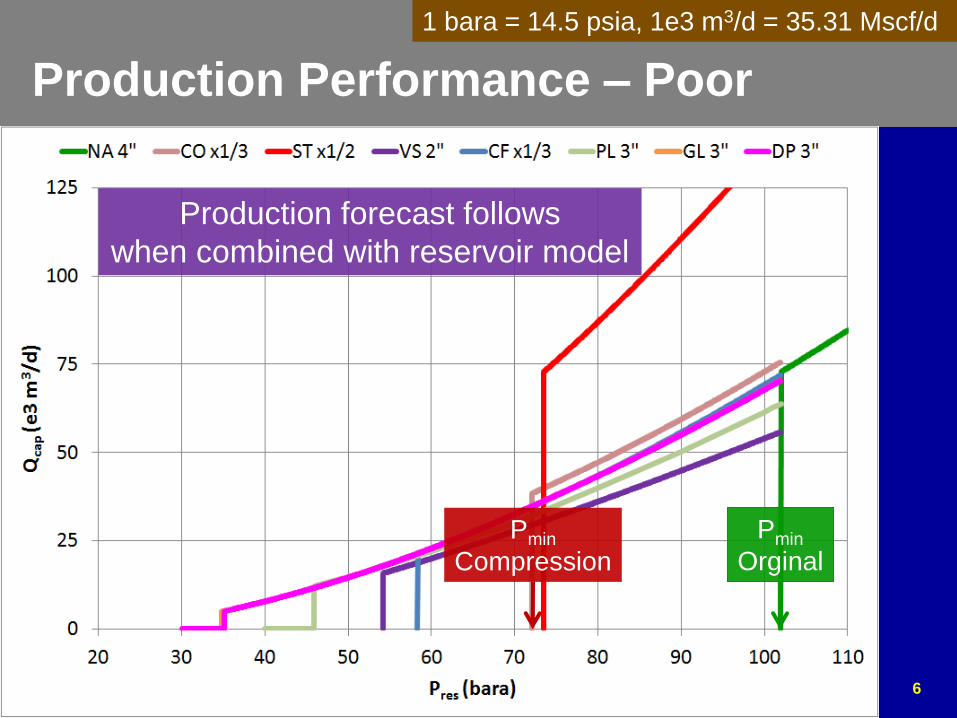
Production Performance – Poor
Production forecast follows
when combined with reservoir model
Pmin
Compression
Pmin
Orginal
1 bara = 14.5 psia, 1e3 m3/d = 35.31 Mscf/d
Feb. 19 – 22, 2012 2012 Gas Well Deliquification Workshop
Denver, Colorado
7
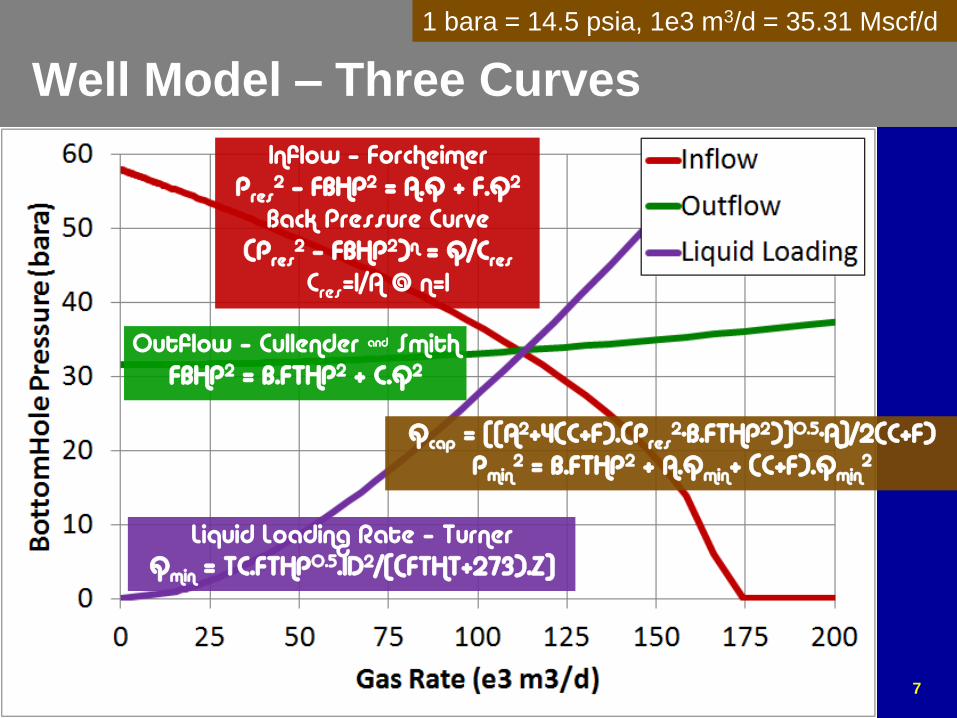
Well Model – Three Curves
Inflow – Forcheimer Pres
2 – FBHP2 = A.Q + F.Q2
Back Pressure Curve (Pres
2 – FBHP2)n = Q/Cres Cres=1/A @ n=1
Outflow – Cullender & Smith FBHP2 = B.FTHP2 + C.Q2
Liquid Loading Rate – Turner Qmin = TC.FTHP0.5.ID2/[(FTHT+273).Z]
Qcap = {[A2+4(C+F).(Pres2-B.FTHP2)]0.5-A}/2(C+F)
Pmin2 = B.FTHP2 + A.Qmin+ (C+F).Qmin
2
1 bara = 14.5 psia, 1e3 m3/d = 35.31 Mscf/d
Feb. 19 – 22, 2012 2012 Gas Well Deliquification Workshop
Denver, Colorado
8
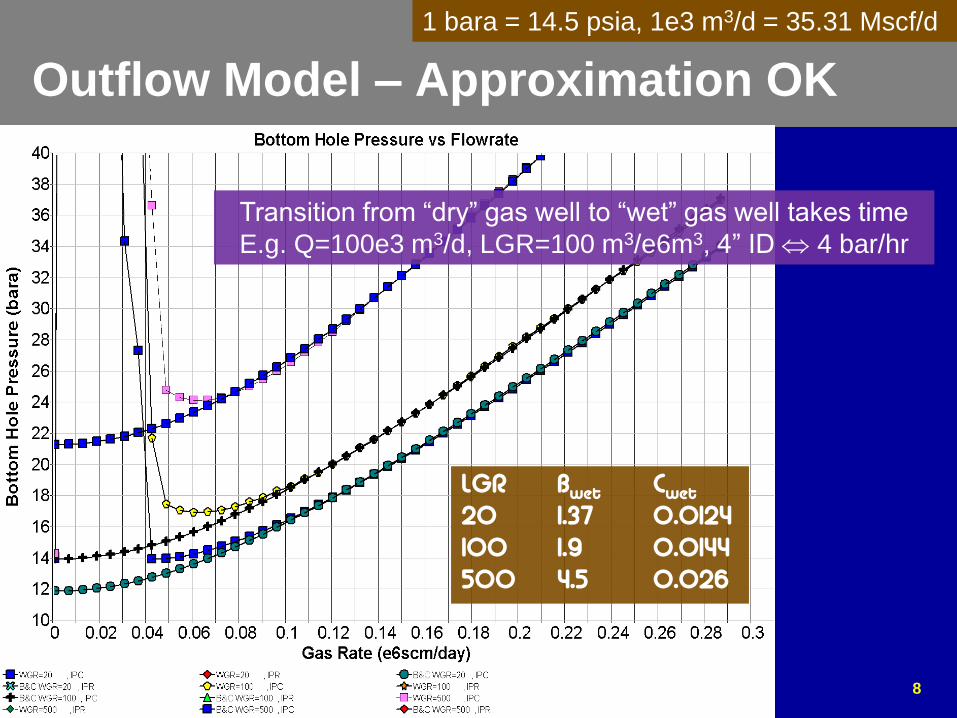
Outflow Model – Approximation OK
LGR Bwet Cwet 20 1.37 0.0124 100 1.9 0.0144 500 4.5 0.026
Transition from “dry” gas well to “wet” gas well takes time
E.g. Q=100e3 m3/d, LGR=100 m3/e6m3, 4” ID 4 bar/hr
1 bara = 14.5 psia, 1e3 m3/d = 35.31 Mscf/d
Feb. 19 – 22, 2012 2012 Gas Well Deliquification Workshop
Denver, Colorado
9
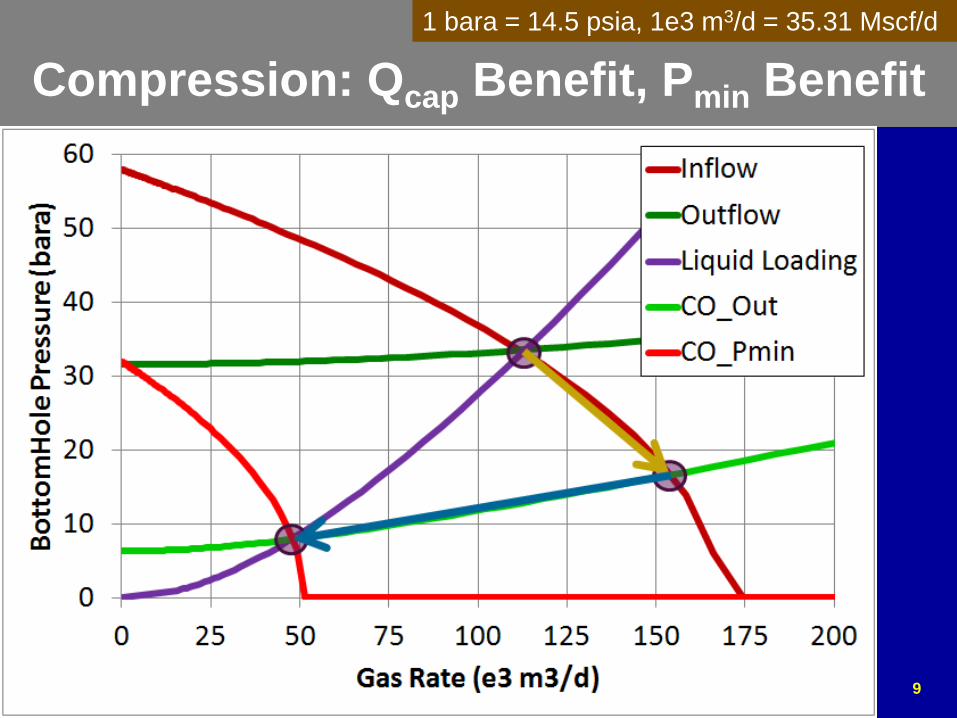
Compression: Qcap Benefit, Pmin Benefit
1 bara = 14.5 psia, 1e3 m3/d = 35.31 Mscf/d
Feb. 19 – 22, 2012 2012 Gas Well Deliquification Workshop
Denver, Colorado
10
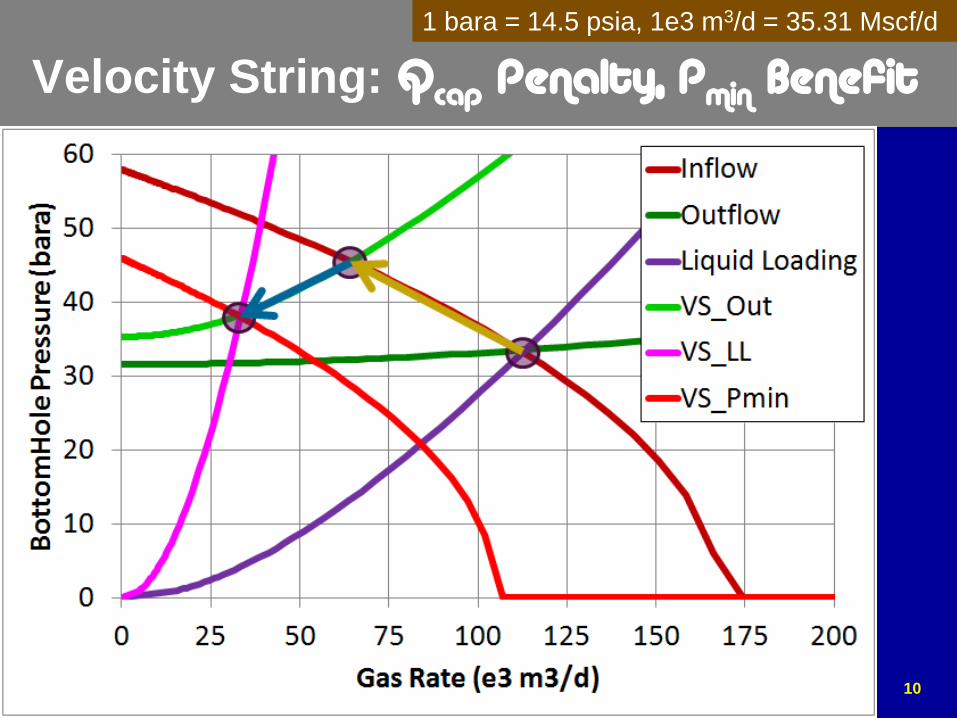
Velocity String: Qcap Penalty, Pmin Benefit
1 bara = 14.5 psia, 1e3 m3/d = 35.31 Mscf/d
Feb. 19 – 22, 2012 2012 Gas Well Deliquification Workshop
Denver, Colorado
11
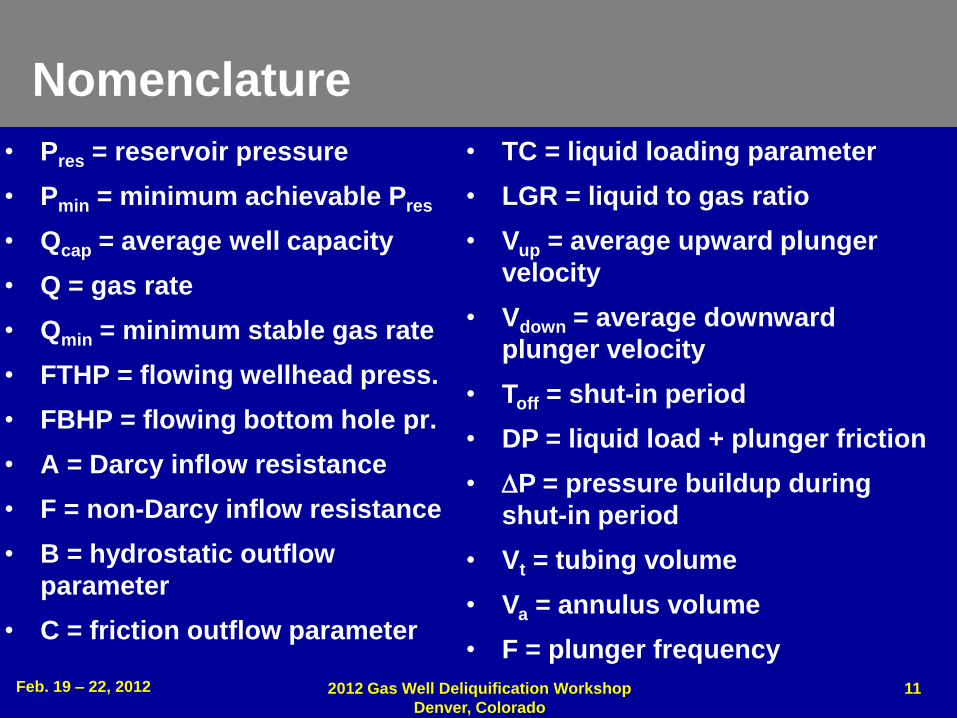
Nomenclature
• Pres = reservoir pressure
• Pmin = minimum achievable Pres
• Qcap = average well capacity
• Q = gas rate
• Qmin = minimum stable gas rate
• FTHP = flowing wellhead press.
• FBHP = flowing bottom hole pr.
• A = Darcy inflow resistance
• F = non-Darcy inflow resistance
• B = hydrostatic outflow
parameter
• C = friction outflow parameter
• TC = liquid loading parameter
• LGR = liquid to gas ratio
• Vup = average upward plunger
velocity
• Vdown = average downward
plunger velocity
• Toff = shut-in period
• DP = liquid load + plunger friction
• P = pressure buildup during
shut-in period
• Vt = tubing volume
• Va = annulus volume
• F = plunger frequency
Plunger Lift Cycle
Feb. 27 - Mar. 2, 2011 2011 Gas Well Deliquification Workshop Denver, Colorado
12
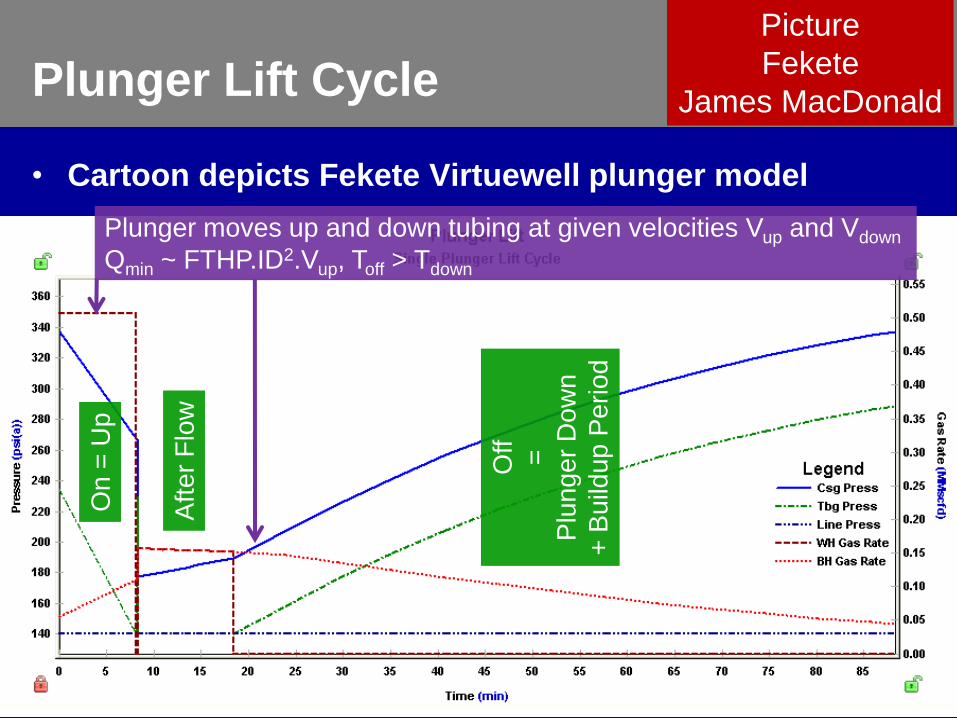
• Cartoon depicts Fekete Virtuewell plunger model
Plunger moves up and down tubing at given velocities Vup and Vdown
Qmin ~ FTHP.ID2.Vup, Toff > Tdown
On
= U
p
Afte
r F
low
Off
=
Plu
ng
er
Do
wn
+ B
uild
up
Pe
rio
d
Picture
Fekete
James MacDonald
Plunger Lift Cycle
Feb. 27 - Mar. 2, 2011 2011 Gas Well Deliquification Workshop Denver, Colorado
13
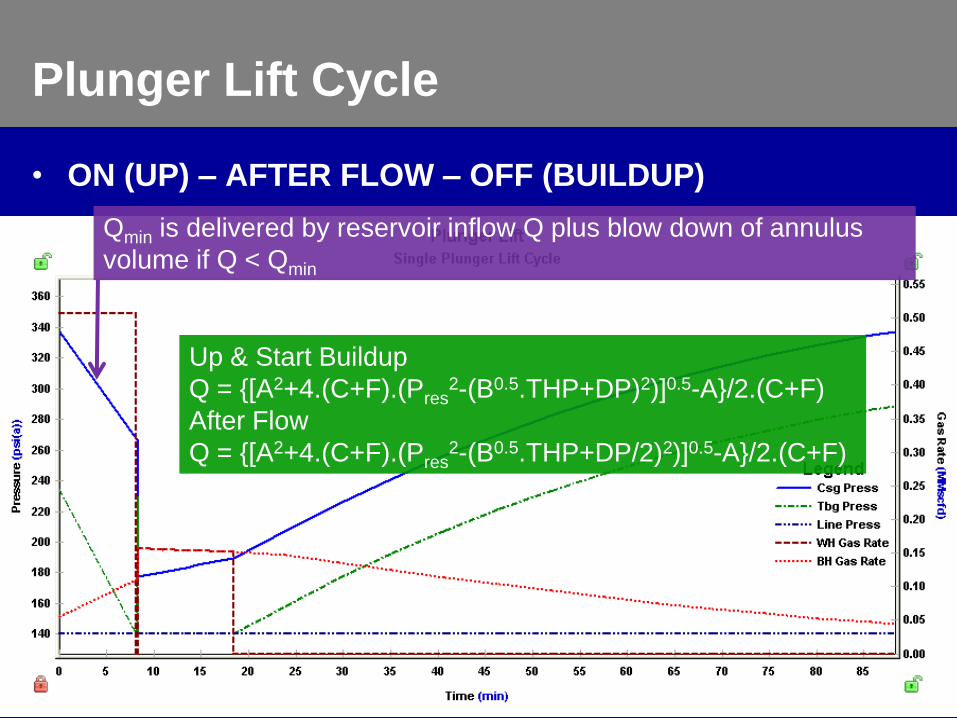
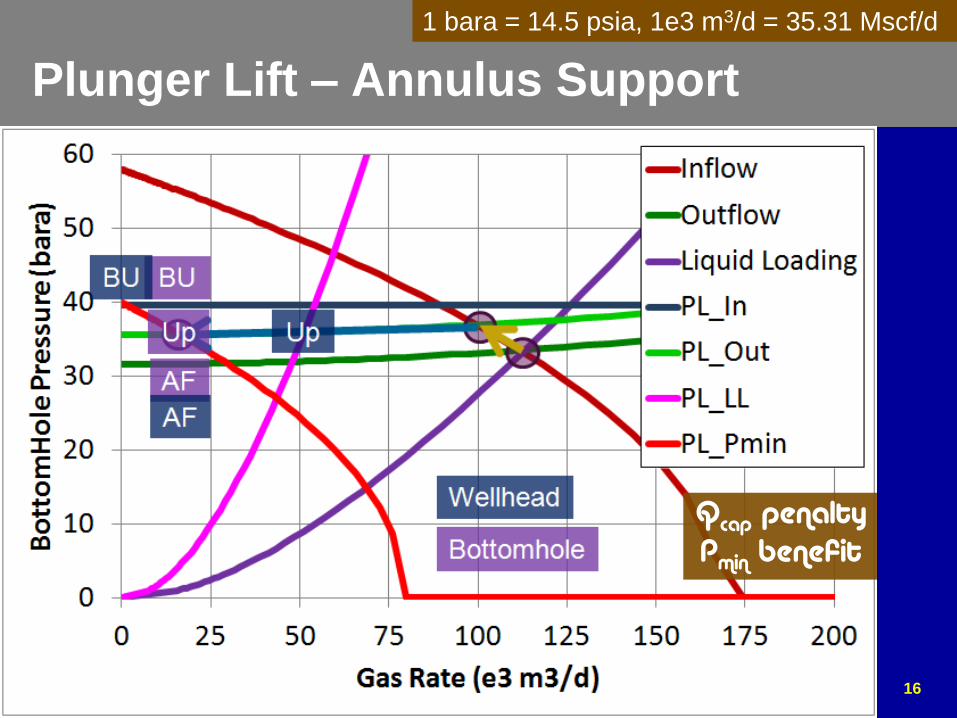
• ON (UP) – AFTER FLOW – OFF (BUILDUP)
Qmin is delivered by reservoir inflow Q plus blow down of annulus
volume if Q < Qmin
Up & Start Buildup
Q = {[A2+4.(C+F).(Pres2-(B0.5.THP+DP)2)]0.5-A}/2.(C+F)
After Flow
Q = {[A2+4.(C+F).(Pres2-(B0.5.THP+DP/2)2)]0.5-A}/2.(C+F)
Plunger Lift Cycle
Feb. 27 - Mar. 2, 2011 2011 Gas Well Deliquification Workshop Denver, Colorado
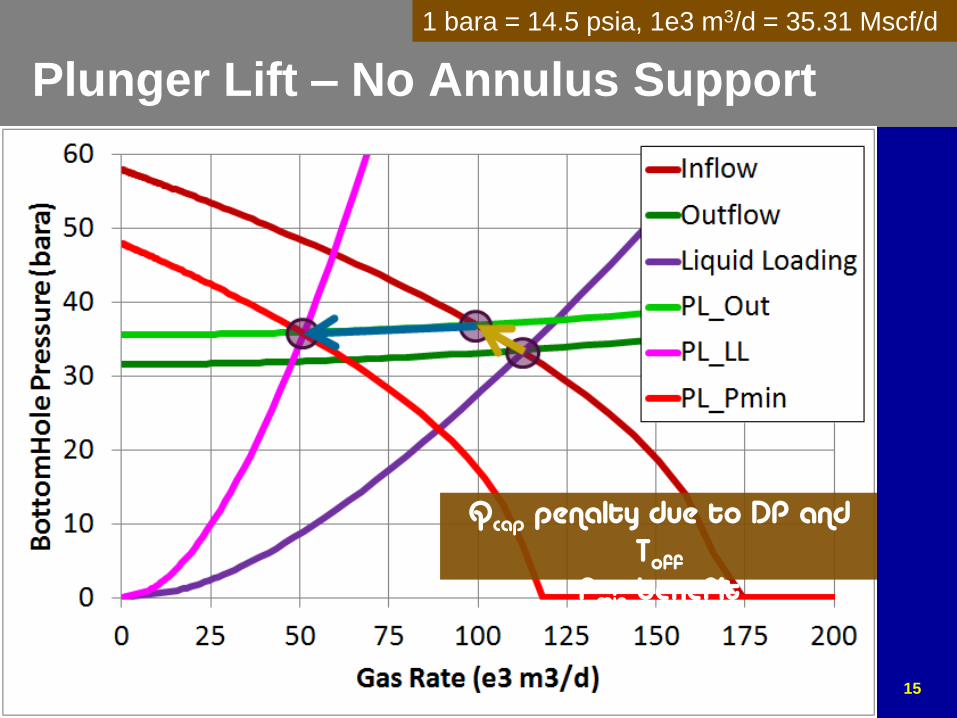
14
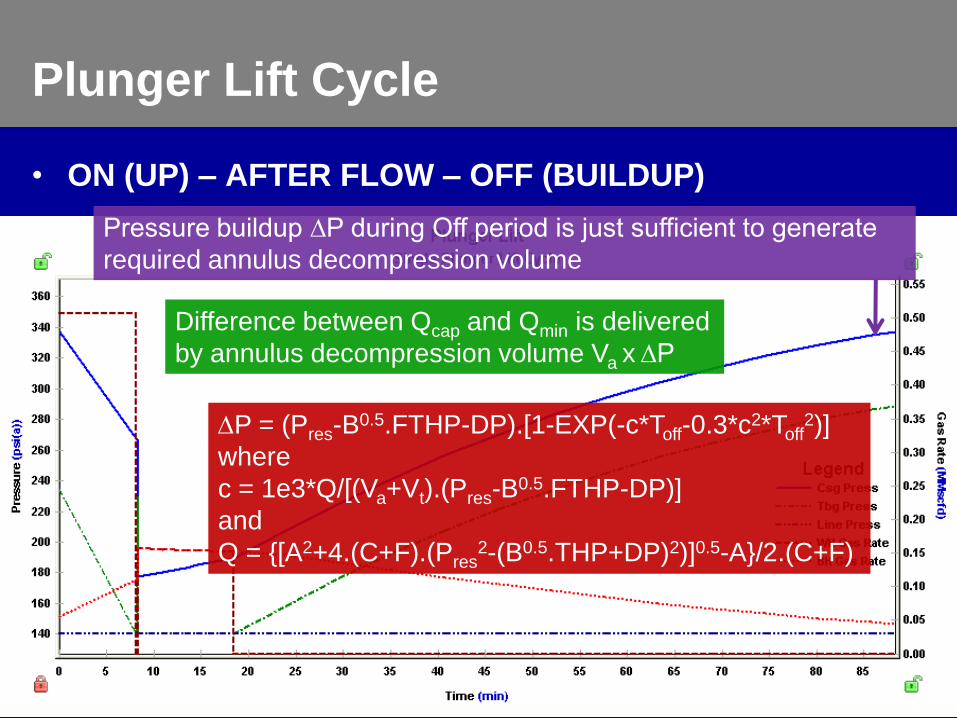
• ON (UP) – AFTER FLOW – OFF (BUILDUP)
Pressure buildup ∆P during Off period is just sufficient to generate
required annulus decompression volume
Difference between Qcap and Qmin is delivered
by annulus decompression volume Va x ∆P
P = (Pres-B0.5.FTHP-DP).[1-EXP(-c*Toff-0.3*c2*Toff
2)]
where
c = 1e3*Q/[(Va+Vt).(Pres-B0.5.FTHP-DP)]
and
Q = {[A2+4.(C+F).(Pres2-(B0.5.THP+DP)2)]0.5-A}/2.(C+F)
Feb. 19 – 22, 2012 2012 Gas Well Deliquification Workshop
Denver, Colorado
15
Plunger Lift – No Annulus Support
Qcap penalty due to DP and Toff
Pmin benefit
1 bara = 14.5 psia, 1e3 m3/d = 35.31 Mscf/d
Feb. 19 – 22, 2012 2012 Gas Well Deliquification Workshop
Denver, Colorado
16
Plunger Lift – Annulus Support
Qcap penalty Pmin benefit
1 bara = 14.5 psia, 1e3 m3/d = 35.31 Mscf/d

Feb. 19 – 22, 2012 2012 Gas Well Deliquification Workshop
Denver, Colorado
17
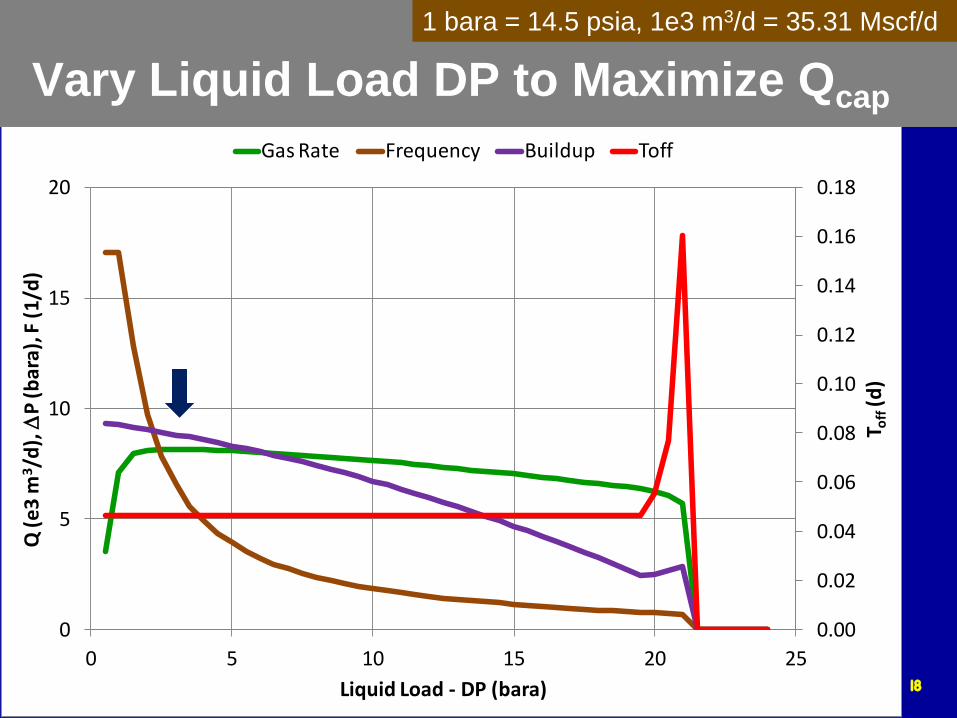
Plunger Modeling
• Liquid load x plunger frequency F equals produced
liquid volume LGR x Qcap
• Calculate maximum Qcap, F, Toff and ∆P by varying DP
• Calculate maximum Qcap, F, ∆P and DP as function of
reservoir pressure Pres
• Show impact of inflow performance, annulus volume,
liquid production, inflow performance and wellhead
pressure
• Ignore complexity and transient nature of plunger
cycle, including plunger friction, plunger by-pass,
annulus friction and varying plunger velocity !
Feb. 27 - Mar. 2, 2011 2011 Gas Well Deliquification Workshop Denver, Colorado
18
0.00
0.02
0.04
0.06
0.08
0.10
0.12
0.14
0.16
0.18
0
5
10
15
20
0 5 10 15 20 25
T off
(d)
Q (e
3 m
3 /d
),
P (b
ara)
, F (
1/d
)
Liquid Load - DP (bara)
Gas Rate Frequency Buildup Toff
Vary Liquid Load DP to Maximize Qcap
1 bara = 14.5 psia, 1e3 m3/d = 35.31 Mscf/d
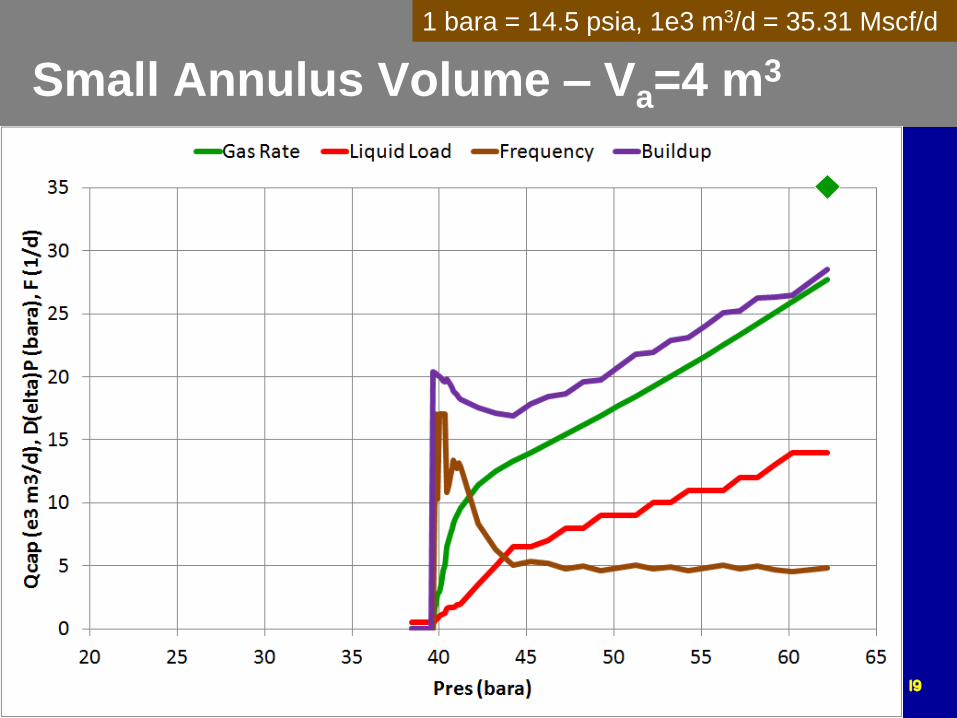
Small Annulus Volume – Va=4 m3
Feb. 27 - Mar. 2, 2011 2011 Gas Well Deliquification Workshop Denver, Colorado
19
1 bara = 14.5 psia, 1e3 m3/d = 35.31 Mscf/d
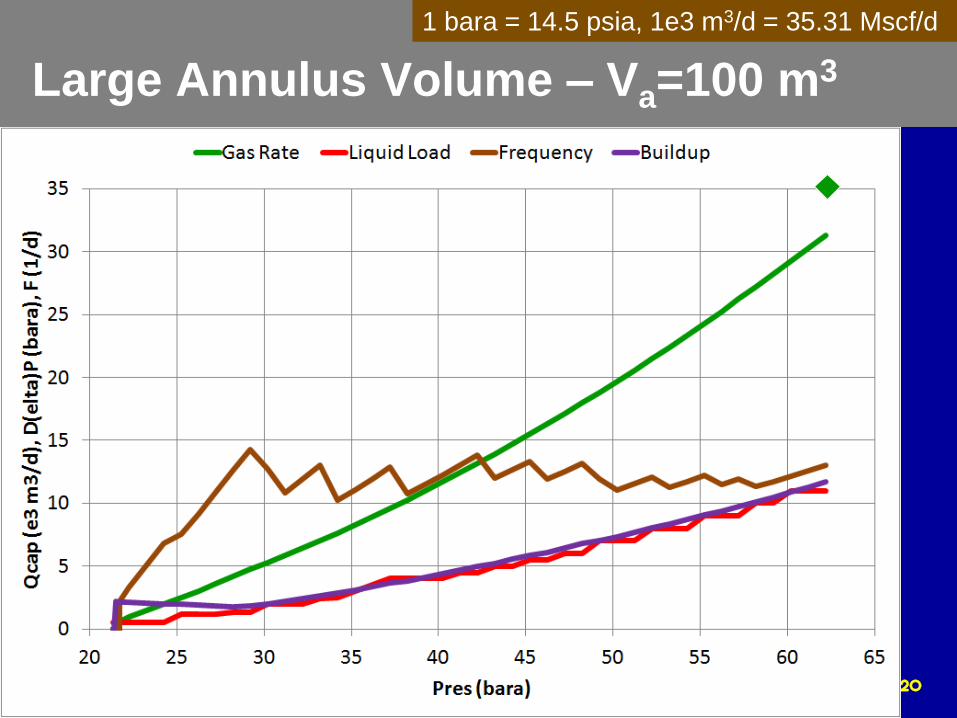
Large Annulus Volume – Va=100 m3
Feb. 27 - Mar. 2, 2011 2011 Gas Well Deliquification Workshop Denver, Colorado
20
1 bara = 14.5 psia, 1e3 m3/d = 35.31 Mscf/d
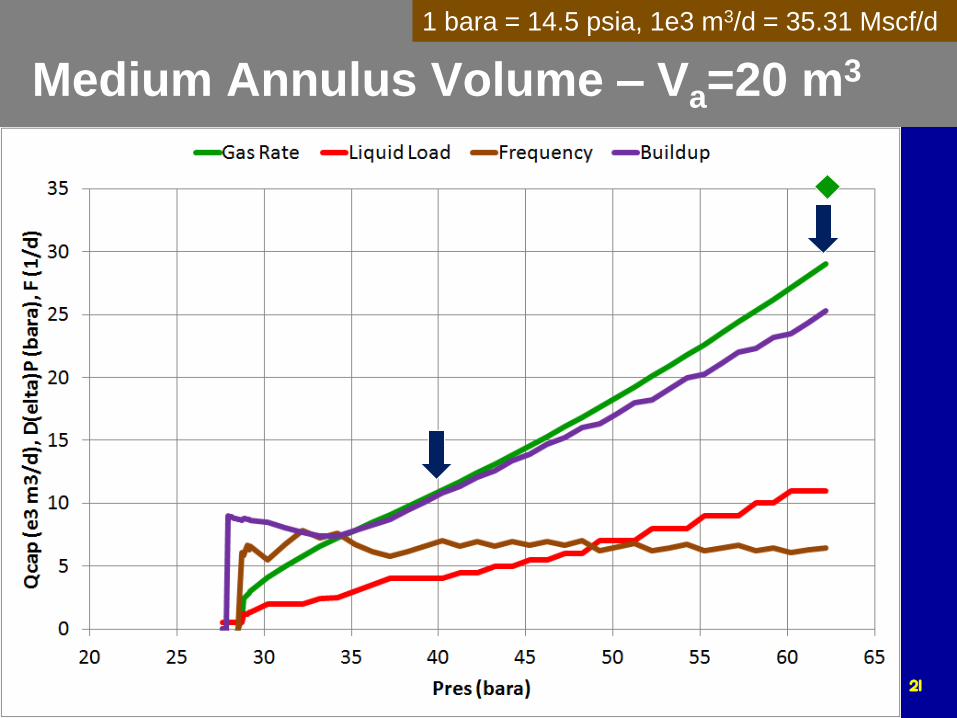
Medium Annulus Volume – Va=20 m3
Feb. 27 - Mar. 2, 2011 2011 Gas Well Deliquification Workshop Denver, Colorado
21
1 bara = 14.5 psia, 1e3 m3/d = 35.31 Mscf/d
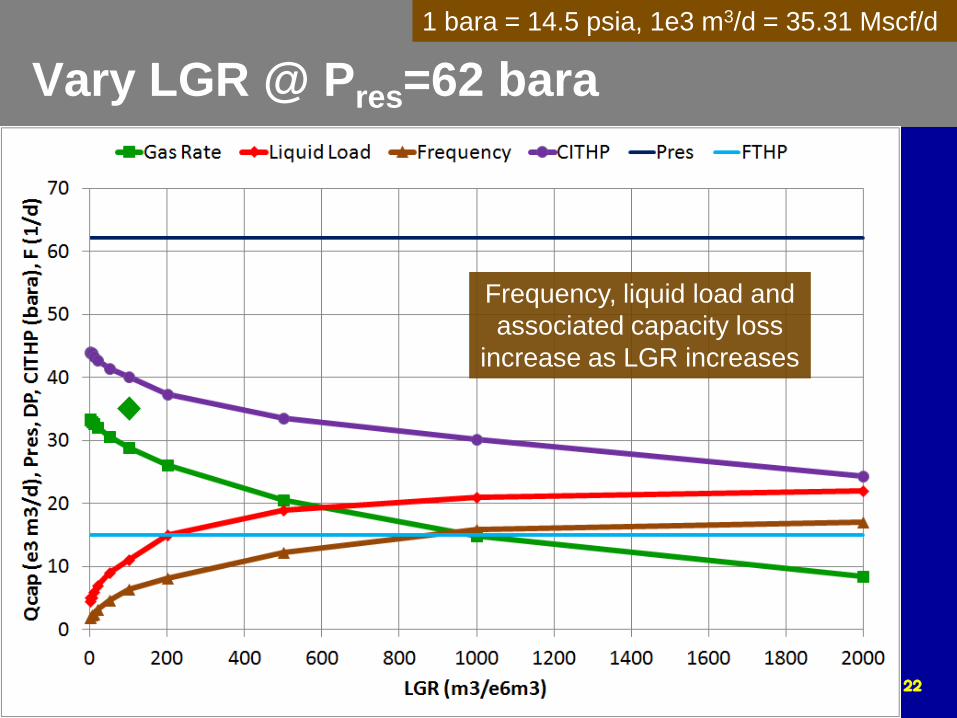
Vary LGR @ Pres=62 bara
Feb. 27 - Mar. 2, 2011 2011 Gas Well Deliquification Workshop Denver, Colorado
22
Frequency, liquid load and
associated capacity loss
increase as LGR increases
1 bara = 14.5 psia, 1e3 m3/d = 35.31 Mscf/d
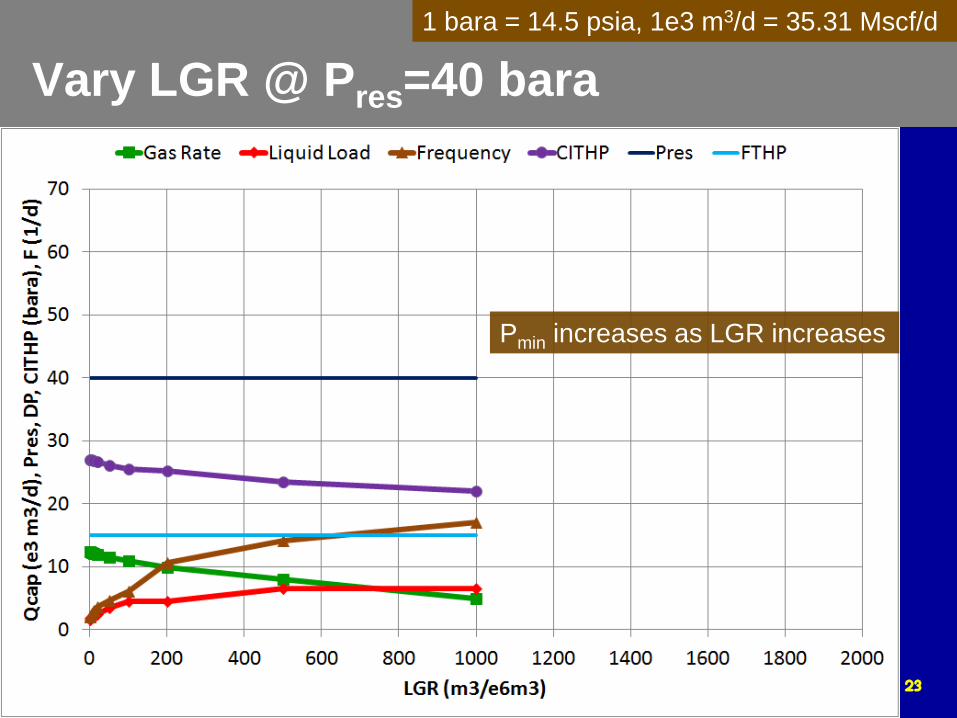
Vary LGR @ Pres=40 bara
Feb. 27 - Mar. 2, 2011 2011 Gas Well Deliquification Workshop Denver, Colorado
23
Pmin increases as LGR increases
1 bara = 14.5 psia, 1e3 m3/d = 35.31 Mscf/d
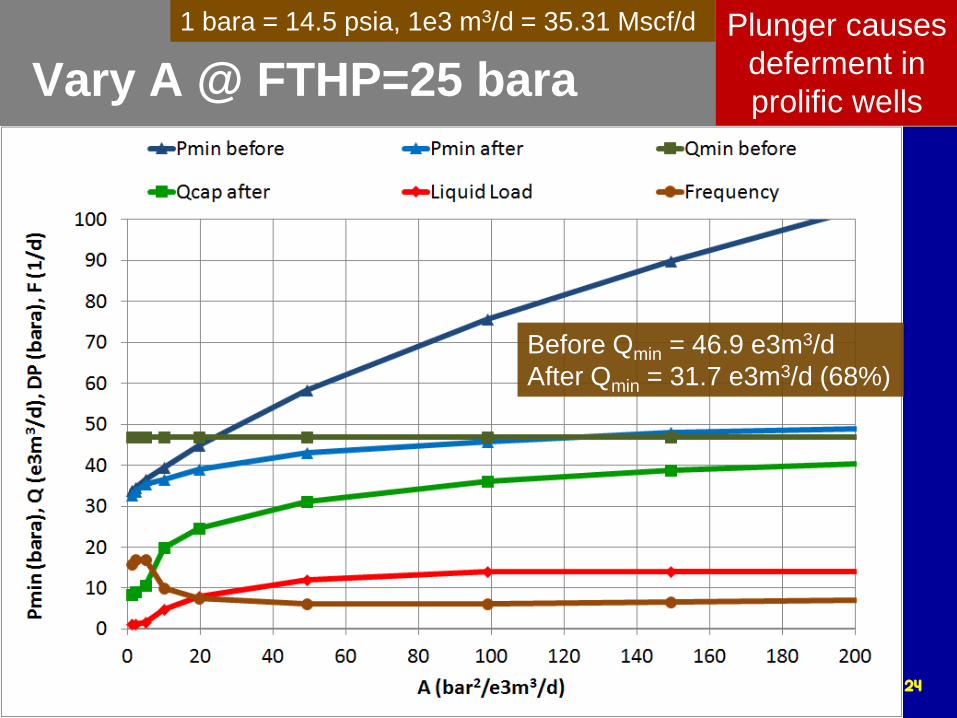
Vary A @ FTHP=25 bara
Feb. 27 - Mar. 2, 2011 2011 Gas Well Deliquification Workshop Denver, Colorado
24
Before Qmin = 46.9 e3m3/d
After Qmin = 31.7 e3m3/d (68%)
Plunger causes
deferment in
prolific wells
1 bara = 14.5 psia, 1e3 m3/d = 35.31 Mscf/d
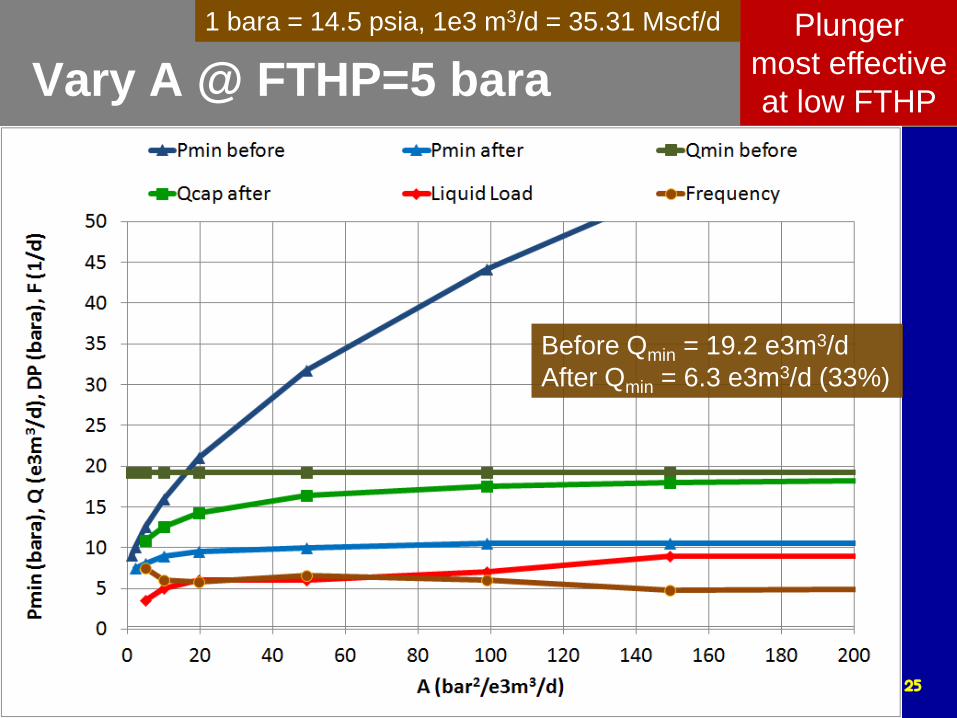
Vary A @ FTHP=5 bara
Feb. 27 - Mar. 2, 2011 2011 Gas Well Deliquification Workshop Denver, Colorado
25
Before Qmin = 19.2 e3m3/d
After Qmin = 6.3 e3m3/d (33%)
Plunger
most effective
at low FTHP
1 bara = 14.5 psia, 1e3 m3/d = 35.31 Mscf/d
Feb. 19 – 22, 2012 2012 Gas Well Deliquification Workshop
Denver, Colorado
26
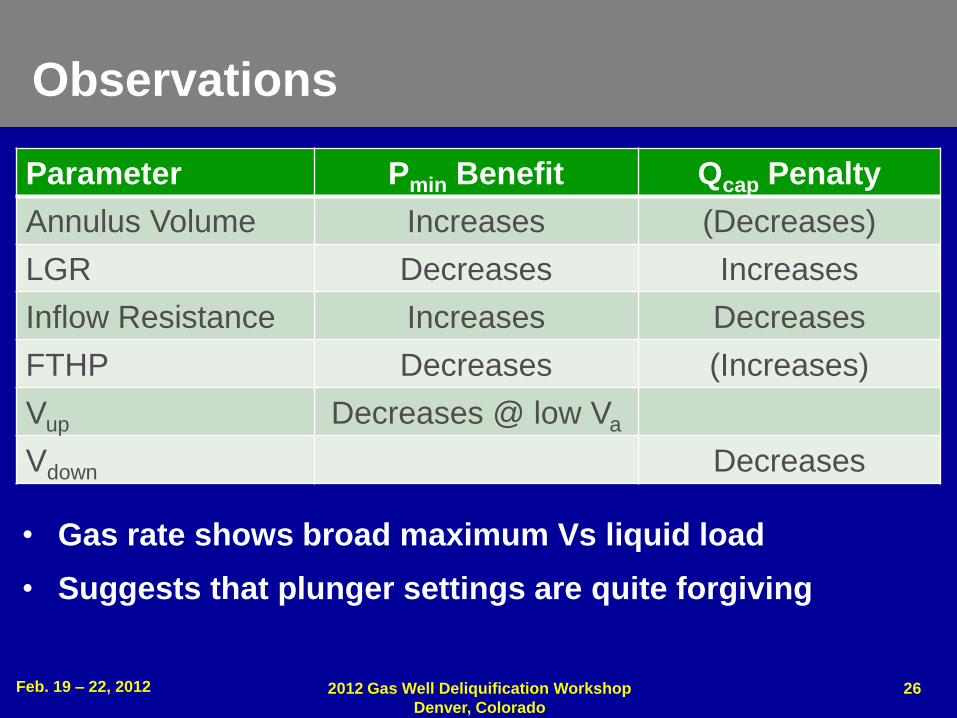
Observations
• Gas rate shows broad maximum Vs liquid load
• Suggests that plunger settings are quite forgiving
Parameter Pmin Benefit Qcap Penalty
Annulus Volume Increases (Decreases)
LGR Decreases Increases
Inflow Resistance Increases Decreases
FTHP Decreases (Increases)
Vup Decreases @ low Va
Vdown Decreases
Feb. 19 – 22, 2012 2012 Gas Well Deliquification Workshop
Denver, Colorado
27
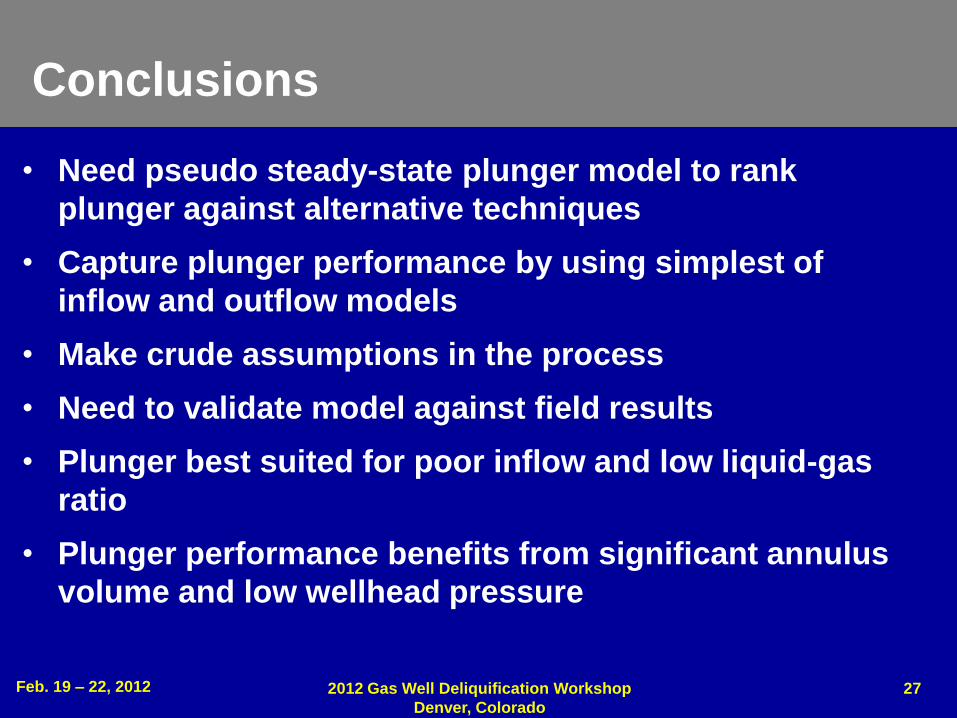
Conclusions
• Need pseudo steady-state plunger model to rank
plunger against alternative techniques
• Capture plunger performance by using simplest of
inflow and outflow models
• Make crude assumptions in the process
• Need to validate model against field results
• Plunger best suited for poor inflow and low liquid-gas
ratio
• Plunger performance benefits from significant annulus
volume and low wellhead pressure
Feb. 19 – 22, 2012 2012 Gas Well Deliquification Workshop
Denver, Colorado
28
Copyright
Rights to this presentation are owned by the company(ies) and/or author(s) listed on the title page. By submitting this presentation to the Gas Well Deliquification Workshop, they grant to the Workshop, the Artificial Lift Research and Development Council (ALRDC), and the Southwestern Petroleum Short Course (SWPSC), rights to:
– Display the presentation at the Workshop.
– Place it on the www.alrdc.com web site, with access to the site to be as directed by the Workshop Steering Committee.
– Place it on a CD for distribution and/or sale as directed by the Workshop Steering Committee.
Other use of this presentation is prohibited without the expressed written permission of the author(s). The owner company(ies) and/or author(s) may publish this material in other journals or magazines if they refer to the Gas Well Deliquification Workshop where it was first presented.
Feb. 19 – 22, 2012 2012 Gas Well Deliquification Workshop
Denver, Colorado
29
Disclaimer
The following disclaimer shall be included as the last page of a Technical Presentation or Continuing Education Course. A similar disclaimer is included on the front page of the Gas Well Deliquification Web Site.
The Artificial Lift Research and Development Council and its officers and trustees, and the Gas Well Deliquification Workshop Steering Committee members, and their supporting organizations and companies (here-in-after referred to as the Sponsoring Organizations), and the author(s) of this Technical Presentation or Continuing Education Training Course and their company(ies), provide this presentation and/or training material at the Gas Well Deliquification Workshop "as is" without any warranty of any kind, express or implied, as to the accuracy of the information or the products or services referred to by any presenter (in so far as such warranties may be excluded under any relevant law) and these members and their companies will not be liable for unlawful actions and any losses or damage that may result from use of any presentation as a consequence of any inaccuracies in, or any omission from, the information which therein may be contained.
The views, opinions, and conclusions expressed in these presentations and/or training materials are those of the author and not necessarily those of the Sponsoring Organizations. The author is solely responsible for the content of the materials.
The Sponsoring Organizations cannot and do not warrant the accuracy of these documents beyond the source documents, although we do make every attempt to work from authoritative sources. The Sponsoring Organizations provide these presentations and/or training materials as a service. The Sponsoring Organizations make no representations or warranties, express or implied, with respect to the presentations and/or training materials, or any part thereof, including any warrantees of title, non-infringement of copyright or patent rights of others, merchantability, or fitness or suitability for any purpose.
Related Documents