LAPS CA -Exendin-4 (efpeglenatide) Enhances Insulin Secretion and Beta Cell Responsiveness in Subjects with Type 2 Diabetes Background and Aims LAPS Exendin-4 (HM11260C) is a glucagon like peptide -1 (GLP-1) receptor agonist being developed for the treatment of type 2 diabetes mellitus (T2DM). In this phase 1B study the effects of different HM11260C regimens on insulin secretion rate (ISR), β-cell responsiveness, and gastric emptying (GE) compared to placebo and to liraglutide were investigated. Materials and Methods Subjects with T2DM received 6 mg HM11260C weekly (cohort A; age: 52.8 years, HbA1c: 8.4, n=13), 16 mg HM11260C monthly (cohort B; age: 50.1 yr, HbA1c: 8.1, n=13), 1.8 mg liraglutide daily (cohort C; age: 54.9 yr, HbA1c: 8.02 n=13), or placebo (age: 54.1 yr, HbA1c: 8.6, n=8). Subjects in cohorts A and C were evaluated at baseline and steady state, and cohort B was evaluated at trough (day[d]82) and peak(d89) drug concentration. Islet β-cell function was assessed during a graded IV glucose infusion (GGI); infusion steps: 2, 4, 6, 8, 12 mg/kg/min of 20% IV glucose for 30 min each. Insulin C-peptide levels, and plasma glucose response to each GGI step were measured. ISR were determined using a population based C-peptide de-convolution model. AUC(insulin) and AUC(C-peptide) as measures of ISR were determined for each treatment. β-cell responsiveness was assessed as the ratio of ISR/ blood glucose (BG) over the duration of the GGI, and the slope of the ISR/BG was compared between the treatments. The rate of GE was determined for 1g of liquid acetaminophen following a mixed meal and a mixed meal tolerance test (MMTT) was performed. For GE, non-inferiority to liraglutide was tested using a margin of 0.8 for the least squares (LS) mean ratio. Results Insulin secretion for all active treatments was increased compared to placebo and for HM11260C 6 mg and 16 mg was greater than for liraglutide (point estimates LS mean ratio: 1.765 mU/L, 90% CI: 1.331, 2.342 mU/L, one-sided p=0.0008, and LS mean ratio: 1.440 mU/L, 90% CI: 1.080, 1.920 mU/L, one-sided p=0.0196). Comparisons of the relationship between ISR and plasma glucose using mixed effects modelling showed an improvement in beta cell responsiveness relative to placebo/baseline which was not different among treatments. In the monthly treatment group, there was a diminution of effect at PK trough (d82). For postprandial glucose following the MMTT the LS means of the Cmax, AUC0-180, and AUC0-360 parameters were significantly (two- sided p < 0.05) reduced in subjects who received either 6 mg HM11260C or 16 mg HM11260C when compared to placebo. Cohort A demonstrated less inhibition of GE and was non-inferior (lower CI limit >0.8) to liraglutide in terms of acetaminophen Cmax, AUC0-120minand AUC0- 180min. While for Cohort B the effect on gastric emptying appeared to be similar or even less when compared to liraglutide, formal non-inferiority could not be established for all parameters. GE was delayed in cohorts A and B compared to placebo. CONCLUSIONS STUDY DESIGN Contact Information: Jahoon Kang, Executive Director, Hanmi Pharma., Co., Ltd e-mail: [email protected] Phone: +82-2-410-9041 PS069-792 51 st European Association for the Study of Diabetes (EASD) Annual Meeting, Stockholm, Sweden; September 14 – 18, 2015 This study was sponsored by Hanmi Pharmaceuticals ABSTRACT REFERENCES Elaine Watkins 1 , Jahoon Kang 2 , Michael Trautmann 1 , Soomin Choi 2 , Oakpil Han 2, Marcus Hompesch 1 1 Profil Institute for Clinical Research, Inc., Chula Vista, CA, USA. 2 Hanmi Pharmaceuticals, Seoul, Republic of Korea. Conclusions HM11260C improved measures of β-cell function significantly compared to placebo, and for the weekly treatment regimen (cohort A), significantly compared to liraglutide. The results of this trial suggest that HM11260C is a safe and efficacious GLP-1 receptor agonist and that with regard to gastric emptying it inhibited less or similarly compared to other known GLP-1 receptor agonists. • LAPS-Exendin-4 (HM11260C) is a novel long- acting form of CA Exendin-4 (an Exendin-4 analog) that has decreased renal and slow vascular endothelial clearance. • LAPS-Exendin-4 is a conjugate of exendin-4 linked to a non-glycosylated Fc molecule • Super-agonist activity at the GLP-1 receptor (Kang J et al. 2013) BACKGROUND • Flexible regimen from weekly to monthly • Low Immunogenicity • GLP-1 receptor agonists such as liraglutide improve aspects of β-cell function including glucose-stimulated insulin secretion and responsiveness to glucose RESULTS Study Population: Demography BMI Body Mass Index Mean + SD Cohort A Cohort B Cohort C HM11260C 6 mg/wk Placebo Hm11260C 16 mg/mo Placebo Liraglutide 1.8 mg/d N 13 4 13 4 13 Age (y) 53+6 51+5 50+12 56+5 55+10 M:F 9:4 3:1 6:7 2:2 7:6 BMI (kg/m 2 ) 34.3+4.3 30.3+4.0 31.6+6.0 28.9+3.1 29.4+5.1 HbA 1c (%) 8.4+1.1 9.3+0.5 8.1+1.1 7.9+1.2 8.0+ 0.7 Mixed meal tolerance test - Compared to placebo, the least square (LS) means for glucose C max , AUC 0-180 , and AUC 0-360 were significantly (two-sided p < 0.05) reduced in subjects who received either 6 mg HM11260C or 16 mg HM11260C at the peak drug concentration (Figure 1a). Similar results were observed at the trough drug concentration for 16 mg HM11260C with the exception of C max which was reduced. Postprandial glucose concentration was higher with 16 mg HM11260C a trough drug concentration compared to peak. Serum insulin concentrations increased in cohorts A and B (Figure 1b). In contrast, postprandial serum insulin concentrations were reduced relative to placebo with liraglutide. Plasma glucagon concentrations were reduced by HM11260C and liraglutide. Figure 1a and 1b. Mean glucose and insulin responses the MMTT Graded glucose infusion (GGI) - Insulin secretion for all treatments was increased significantly compared to placebo over the range of blood glucose concentrations. During GGI the areas under the curve (AUC)-insulin (Figure 2) and AUC-C-peptide (Figure 3) were larger (p<0.05) in cohort A compared to cohort C. Comparisons of the relationship between ISR and plasma glucose using mixed effects modeling showed a significant treatment effect relative to placebo/baseline (p<0.0001) which was not different among the treatments (Figure 4). In the monthly HM11260C treatment group, there was a significant diminution of effect on ISR at PK trough. Figure 2. Mean insulin concentrations during GGI Figure 3. Mean ISR by C-peptide deconvolution • HM11260C improved measures of β-cell function significantly compared to placebo. • For the weekly treatment regimen of HM11260C (cohort A) β-cell function was significantly improved compared to QD liraglutide. • Kang J, Choi S, Choi IY, Kwon S C, Trautmann M, Hompesch M, et al. Activation of GLP-1 Receptor by CA Exendin-4 (exendin-4 analog) with fast dissociation rate constant. Diabetes 2013; 62, Suppl 1 • Hovorka R, Koukkou E, Southerden D, Powrie JK, Young MA. Measuring pre-hepatic insulin secretion using a population model of C-peptide kinetics: accuracy and required sampling schedule. Diabetologia 1998;41:548-54 Safety and tolerability - HM11260C was generally well tolerated. The most common adverse effects considered to be related to the study drugs were transient and intermittent gastrointestinal, i.e. diarrhea, nausea and vomiting. Figure 4. Relationship between plasma glucose and pre-hepatic insulin secretion rates by treatment and occasion. Gastric emptying - Cohort A demonstrated less inhibition of GE and was non-inferior (lower confidence interval limit >0.8) to liraglutide in terms of acetaminophen Cmax, AUC0-120min and AUC0-180min. While for Cohort B the effect on gastric emptying appeared to be similar or even less when compared to liraglutide, formal non-inferiority could not be established for all parameters. GE was delayed in cohorts A and B compared to placebo.

Welcome message from author
This document is posted to help you gain knowledge. Please leave a comment to let me know what you think about it! Share it to your friends and learn new things together.
Transcript

LAPS CA-Exendin-4 (efpeglenatide) Enhances Insulin Secretion and Beta Cell
Responsiveness in Subjects with Type 2 Diabetes
Background and Aims LAPS Exendin-4 (HM11260C) is a glucagon like
peptide -1 (GLP-1) receptor agonist being developed for the treatment of
type 2 diabetes mellitus (T2DM). In this phase 1B study the effects of
different HM11260C regimens on insulin secretion rate (ISR), β-cell
responsiveness, and gastric emptying (GE) compared to placebo and to
liraglutide were investigated.
Materials and Methods Subjects with T2DM received 6 mg HM11260C
weekly (cohort A; age: 52.8 years, HbA1c: 8.4, n=13), 16 mg HM11260C
monthly (cohort B; age: 50.1 yr, HbA1c: 8.1, n=13), 1.8 mg liraglutide
daily (cohort C; age: 54.9 yr, HbA1c: 8.02 n=13), or placebo (age: 54.1
yr, HbA1c: 8.6, n=8). Subjects in cohorts A and C were evaluated at
baseline and steady state, and cohort B was evaluated at trough
(day[d]82) and peak(d89) drug concentration. Islet β-cell function was
assessed during a graded IV glucose infusion (GGI); infusion steps: 2, 4,
6, 8, 12 mg/kg/min of 20% IV glucose for 30 min each. Insulin C-peptide
levels, and plasma glucose response to each GGI step were measured.
ISR were determined using a population based C-peptide de-convolution
model. AUC(insulin) and AUC(C-peptide) as measures of ISR were
determined for each treatment. β-cell responsiveness was assessed as
the ratio of ISR/ blood glucose (BG) over the duration of the GGI, and
the slope of the ISR/BG was compared between the treatments. The rate
of GE was determined for 1g of liquid acetaminophen following a mixed
meal and a mixed meal tolerance test (MMTT) was performed. For GE,
non-inferiority to liraglutide was tested using a margin of 0.8 for the least
squares (LS) mean ratio.
Results Insulin secretion for all active treatments was increased
compared to placebo and for HM11260C 6 mg and 16 mg was greater
than for liraglutide (point estimates LS mean ratio: 1.765 mU/L, 90% CI:
1.331, 2.342 mU/L, one-sided p=0.0008, and LS mean ratio: 1.440 mU/L,
90% CI: 1.080, 1.920 mU/L, one-sided p=0.0196). Comparisons of the
relationship between ISR and plasma glucose using mixed effects
modelling showed an improvement in beta cell responsiveness relative to
placebo/baseline which was not different among treatments. In the
monthly treatment group, there was a diminution of effect at PK trough
(d82). For postprandial glucose following the MMTT the LS means of the
Cmax, AUC0-180, and AUC0-360 parameters were significantly (two-
sided p < 0.05) reduced in subjects who received either 6 mg HM11260C
or 16 mg HM11260C when compared to placebo. Cohort A demonstrated
less inhibition of GE and was non-inferior (lower CI limit >0.8) to
liraglutide in terms of acetaminophen Cmax, AUC0-120minand AUC0-
180min. While for Cohort B the effect on gastric emptying appeared to be
similar or even less when compared to liraglutide, formal non-inferiority
could not be established for all parameters. GE was delayed in cohorts A
and B compared to placebo.
CONCLUSIONS
STUDY DESIGN
Contact Information: Jahoon Kang, Executive Director, Hanmi Pharma., Co., Ltd
e-mail: [email protected]
Phone: +82-2-410-9041
PS069-792
51st European Association for the Study of Diabetes (EASD) Annual Meeting, Stockholm, Sweden; September 14 – 18, 2015
This study was sponsored by Hanmi Pharmaceuticals
ABSTRACT
REFERENCES
Elaine Watkins1, Jahoon Kang2, Michael Trautmann1, Soomin Choi2, Oakpil Han2, Marcus Hompesch1 1Profil Institute for Clinical Research, Inc., Chula Vista, CA, USA. 2Hanmi Pharmaceuticals, Seoul, Republic of Korea.
Conclusions HM11260C improved measures of β-cell function
significantly compared to placebo, and for the weekly treatment
regimen (cohort A), significantly compared to liraglutide. The results
of this trial suggest that HM11260C is a safe and efficacious GLP-1
receptor agonist and that with regard to gastric emptying it inhibited
less or similarly compared to other known GLP-1 receptor agonists.
• LAPS-Exendin-4 (HM11260C) is a novel long-
acting form of CA Exendin-4 (an Exendin-4
analog) that has decreased renal and slow
vascular endothelial clearance.
• LAPS-Exendin-4 is a conjugate of exendin-4
linked to a non-glycosylated Fc molecule
• Super-agonist activity at the GLP-1 receptor
(Kang J et al. 2013)
BACKGROUND
• Flexible regimen from weekly to monthly
• Low Immunogenicity
• GLP-1 receptor agonists such as liraglutide improve aspects
of β-cell function including glucose-stimulated insulin
secretion and responsiveness to glucose
RESULTS Study Population: Demography
BMI Body Mass Index
Mean + SD
Cohort A Cohort B Cohort C
HM11260C
6 mg/wk Placebo
Hm11260C
16 mg/mo Placebo
Liraglutide
1.8 mg/d
N 13 4 13 4 13
Age (y) 53+6 51+5 50+12 56+5 55+10
M:F 9:4 3:1 6:7 2:2 7:6
BMI (kg/m2)
34.3+4.3 30.3+4.0 31.6+6.0 28.9+3.1 29.4+5.1
HbA1c (%)
8.4+1.1 9.3+0.5 8.1+1.1 7.9+1.2 8.0+ 0.7
Mixed meal tolerance test - Compared to placebo, the least square (LS)
means for glucose Cmax, AUC0-180, and AUC0-360 were significantly (two-sided
p < 0.05) reduced in subjects who received either 6 mg HM11260C or 16 mg
HM11260C at the peak drug concentration (Figure 1a). Similar results were
observed at the trough drug concentration for 16 mg HM11260C with the
exception of Cmax which was reduced. Postprandial glucose concentration
was higher with 16 mg HM11260C a trough drug concentration compared to
peak. Serum insulin concentrations increased in cohorts A and B (Figure
1b). In contrast, postprandial serum insulin concentrations were reduced
relative to placebo with liraglutide.
Plasma glucagon concentrations were reduced by HM11260C and
liraglutide.
Figure 1a and 1b. Mean glucose and insulin responses the MMTT
Graded glucose infusion (GGI) - Insulin secretion for all treatments
was increased significantly compared to placebo over the range of
blood glucose concentrations.
During GGI the areas under the curve (AUC)-insulin (Figure 2) and
AUC-C-peptide (Figure 3) were larger (p<0.05) in cohort A compared
to cohort C.
Comparisons of the relationship between ISR and plasma glucose
using mixed effects modeling showed a significant treatment effect
relative to placebo/baseline (p<0.0001) which was not different among
the treatments (Figure 4).
In the monthly HM11260C treatment group, there was a significant
diminution of effect on ISR at PK trough.
Figure 2. Mean insulin concentrations during GGI
Figure 3. Mean ISR by C-peptide deconvolution
• HM11260C improved measures of β-cell function significantly
compared to placebo.
• For the weekly treatment regimen of HM11260C (cohort A) β-cell
function was significantly improved compared to QD liraglutide.
• Kang J, Choi S, Choi IY, Kwon S C, Trautmann M, Hompesch M, et al.
Activation of GLP-1 Receptor by CA Exendin-4 (exendin-4 analog)
with fast dissociation rate constant. Diabetes 2013; 62, Suppl 1
• Hovorka R, Koukkou E, Southerden D, Powrie JK, Young MA.
Measuring pre-hepatic insulin secretion using a population model of
C-peptide kinetics: accuracy and required sampling schedule.
Diabetologia 1998;41:548-54
Safety and tolerability - HM11260C was generally well tolerated.
The most common adverse effects considered to be related to the
study drugs were transient and intermittent gastrointestinal,
i.e. diarrhea, nausea and vomiting.
Figure 4. Relationship between plasma glucose and pre-hepatic
insulin secretion rates by treatment and occasion.
Gastric emptying - Cohort A demonstrated less inhibition of GE and was
non-inferior (lower confidence interval limit >0.8) to liraglutide in terms of
acetaminophen Cmax, AUC0-120min and AUC0-180min.
While for Cohort B the effect on gastric emptying appeared to be similar or
even less when compared to liraglutide, formal non-inferiority could not be
established for all parameters.
GE was delayed in cohorts A and B compared to placebo.
• Table 3. Percent of Patients Achieving HbA1c Targets
• Efpeglenatide demonstrated dose-dependent Glucose-Lowering
effects
3 mg dose fairly similar to the reference Liraglutide
4 mg dose perhaps better than Liraglutide to be further tested
• Body Weight loss with Efpeglenatide 3 and 4 mg was fairly
similar to the reference Liraglutide group
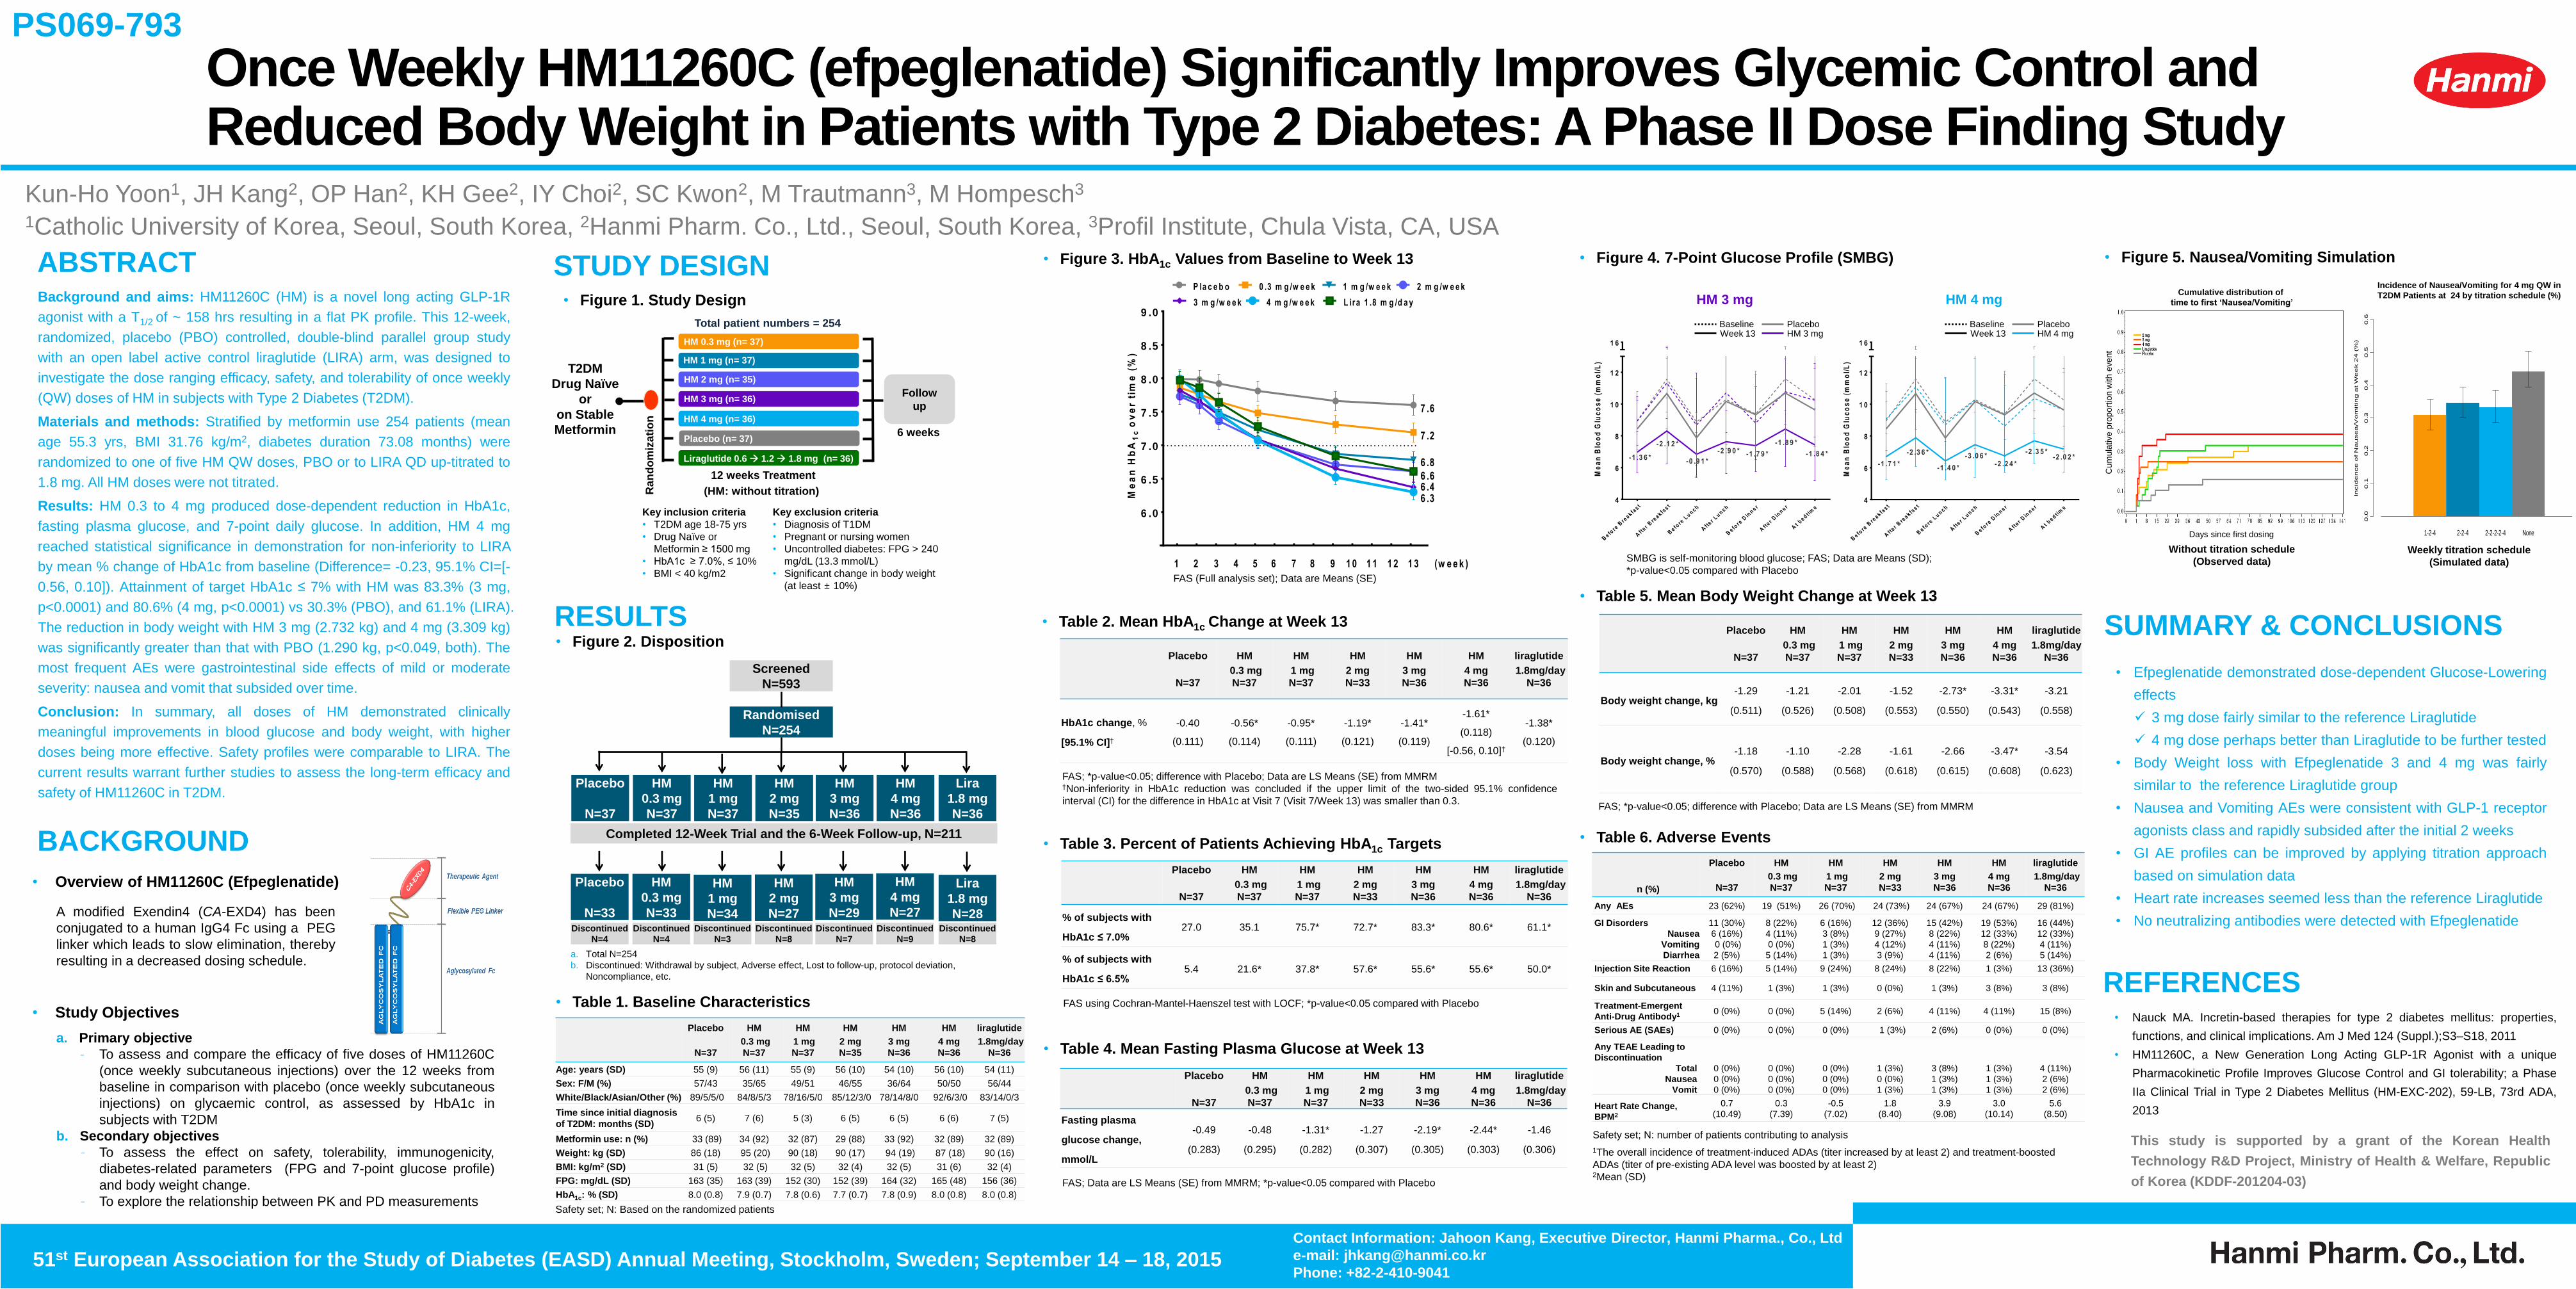
• Nausea and Vomiting AEs were consistent with GLP-1 receptor
agonists class and rapidly subsided after the initial 2 weeks
• GI AE profiles can be improved by applying titration approach
based on simulation data
• Heart rate increases seemed less than the reference Liraglutide
• No neutralizing antibodies were detected with Efpeglenatide
n (%)
Placebo
N=37
HM
0.3 mg
N=37
HM
1 mg
N=37
HM
2 mg
N=33
HM
3 mg
N=36
HM
4 mg
N=36
liraglutide
1.8mg/day
N=36
Any AEs 23 (62%) 19 (51%) 26 (70%) 24 (73%) 24 (67%) 24 (67%) 29 (81%)
GI Disorders
Nausea
Vomiting
Diarrhea
11 (30%)
6 (16%)
0 (0%)
2 (5%)
8 (22%)
4 (11%)
0 (0%)
5 (14%)
6 (16%)
3 (8%)
1 (3%)
1 (3%)
12 (36%)
9 (27%)
4 (12%)
3 (9%)
15 (42%)
8 (22%)
4 (11%)
4 (11%)
19 (53%)
12 (33%)
8 (22%)
2 (6%)
16 (44%)
12 (33%)
4 (11%)
5 (14%)
Injection Site Reaction 6 (16%) 5 (14%) 9 (24%) 8 (24%) 8 (22%) 1 (3%) 13 (36%)
Skin and Subcutaneous 4 (11%) 1 (3%) 1 (3%) 0 (0%) 1 (3%) 3 (8%) 3 (8%)
Treatment-Emergent
Anti-Drug Antibody1 0 (0%) 0 (0%) 5 (14%) 2 (6%) 4 (11%) 4 (11%) 15 (8%)
Serious AE (SAEs) 0 (0%) 0 (0%) 0 (0%) 1 (3%) 2 (6%) 0 (0%) 0 (0%)
Any TEAE Leading to
Discontinuation
Total
Nausea
Vomit
0 (0%)
0 (0%)
0 (0%)
0 (0%)
0 (0%)
0 (0%)
0 (0%)
0 (0%)
0 (0%)
1 (3%)
0 (0%)
1 (3%)
3 (8%)
1 (3%)
1 (3%)
1 (3%)
1 (3%)
1 (3%)
4 (11%)
2 (6%)
2 (6%)
Heart Rate Change,
BPM2
0.7
(10.49)
0.3
(7.39)
-0.5
(7.02)
1.8
(8.40)
3.9
(9.08)
3.0
(10.14)
5.6
(8.50)
6 .0
6 .5
7 .0
7 .5
8 .0
8 .5
9 .0
1 2 3 4 5 6 7 8 9 1 0 1 1 1 2 (w e e k )
Me
an
Hb
A1
co
ve
r ti
me
(%
)
7 .6
7 .2
6 .8
6 .66 .46 .3
1 3
L ira 1 .8 m g /d a y4 m g /w e e k3 m g /w e e k
2 m g /w e e k1 m g /w e e k0 .3 m g /w e e kP la c e b o
Once Weekly HM11260C (efpeglenatide) Significantly Improves Glycemic Control and Reduced Body Weight in Patients with Type 2 Diabetes: A Phase II Dose Finding Study
Kun-Ho Yoon1, JH Kang2, OP Han2, KH Gee2, IY Choi2, SC Kwon2, M Trautmann3, M Hompesch3
1Catholic University of Korea, Seoul, South Korea, 2Hanmi Pharm. Co., Ltd., Seoul, South Korea, 3Profil Institute, Chula Vista, CA, USA
Background and aims: HM11260C (HM) is a novel long acting GLP-1R
agonist with a T1/2 of ~ 158 hrs resulting in a flat PK profile. This 12-week,
randomized, placebo (PBO) controlled, double-blind parallel group study
with an open label active control liraglutide (LIRA) arm, was designed to
investigate the dose ranging efficacy, safety, and tolerability of once weekly
(QW) doses of HM in subjects with Type 2 Diabetes (T2DM).
Materials and methods: Stratified by metformin use 254 patients (mean
age 55.3 yrs, BMI 31.76 kg/m2, diabetes duration 73.08 months) were
randomized to one of five HM QW doses, PBO or to LIRA QD up-titrated to
1.8 mg. All HM doses were not titrated.
Results: HM 0.3 to 4 mg produced dose-dependent reduction in HbA1c,
fasting plasma glucose, and 7-point daily glucose. In addition, HM 4 mg
reached statistical significance in demonstration for non-inferiority to LIRA
by mean % change of HbA1c from baseline (Difference= -0.23, 95.1% CI=[-
0.56, 0.10]). Attainment of target HbA1c ≤ 7% with HM was 83.3% (3 mg,
p<0.0001) and 80.6% (4 mg, p<0.0001) vs 30.3% (PBO), and 61.1% (LIRA).
The reduction in body weight with HM 3 mg (2.732 kg) and 4 mg (3.309 kg)
was significantly greater than that with PBO (1.290 kg, p<0.049, both). The
most frequent AEs were gastrointestinal side effects of mild or moderate
severity: nausea and vomit that subsided over time.
Conclusion: In summary, all doses of HM demonstrated clinically
meaningful improvements in blood glucose and body weight, with higher
doses being more effective. Safety profiles were comparable to LIRA. The
current results warrant further studies to assess the long-term efficacy and
safety of HM11260C in T2DM.
• Figure 1. Study Design
Placebo (n= 37)
Total patient numbers = 254
Ra
nd
om
iza
tio
n
HM 0.3 mg (n= 37)
HM 1 mg (n= 37)
HM 2 mg (n= 35)
Follow
up HM 3 mg (n= 36)
HM 4 mg (n= 36)
Liraglutide 0.6 1.2 1.8 mg (n= 36)
6 weeks
12 weeks Treatment
(HM: without titration)
T2DM
Drug Naïve
or
on Stable
Metformin
SUMMARY & CONCLUSIONS • Figure 2. Disposition
Screened
N=593
Randomised
N=254
Placebo
N=37
HM
0.3 mg
N=37
HM
1 mg
N=37
HM
2 mg
N=35
HM
3 mg
N=36
HM
4 mg
N=36
Lira
1.8 mg
N=36
Placebo
N=33
HM
0.3 mg
N=33
HM
1 mg
N=34
HM
2 mg
N=27
HM
3 mg
N=29
HM
4 mg
N=27
Lira
1.8 mg
N=28 Discontinued
N=4
Discontinued
N=3
Discontinued
N=8
Discontinued
N=7
Discontinued
N=9
Discontinued
N=8
Discontinued
N=4
Completed 12-Week Trial and the 6-Week Follow-up, N=211
• Table 1. Baseline Characteristics
BACKGROUND
STUDY DESIGN • Figure 3. HbA1c Values from Baseline to Week 13
FAS (Full analysis set); Data are Means (SE)
• Figure 4. 7-Point Glucose Profile (SMBG)
SMBG is self-monitoring blood glucose; FAS; Data are Means (SD);
*p-value<0.05 compared with Placebo
FAS using Cochran-Mantel-Haenszel test with LOCF; *p-value<0.05 compared with Placebo
• Table 5. Mean Body Weight Change at Week 13
FAS; *p-value<0.05; difference with Placebo; Data are LS Means (SE) from MMRM
• Table 6. Adverse Events
• Figure 5. Nausea/Vomiting Simulation
Placebo
N=37
HM
0.3 mg
N=37
HM
1 mg
N=37
HM
2 mg
N=35
HM
3 mg
N=36
HM
4 mg
N=36
liraglutide
1.8mg/day
N=36
Age: years (SD) 55 (9) 56 (11) 55 (9) 56 (10) 54 (10) 56 (10) 54 (11)
Sex: F/M (%) 57/43 35/65 49/51 46/55 36/64 50/50 56/44
White/Black/Asian/Other (%) 89/5/5/0 84/8/5/3 78/16/5/0 85/12/3/0 78/14/8/0 92/6/3/0 83/14/0/3
Time since initial diagnosis
of T2DM: months (SD) 6 (5) 7 (6) 5 (3) 6 (5) 6 (5) 6 (6) 7 (5)
Metformin use: n (%) 33 (89) 34 (92) 32 (87) 29 (88) 33 (92) 32 (89) 32 (89)
Weight: kg (SD) 86 (18) 95 (20) 90 (18) 90 (17) 94 (19) 87 (18) 90 (16)
BMI: kg/m2 (SD) 31 (5) 32 (5) 32 (5) 32 (4) 32 (5) 31 (6) 32 (4)
FPG: mg/dL (SD) 163 (35) 163 (39) 152 (30) 152 (39) 164 (32) 165 (48) 156 (36)
HbA1c: % (SD) 8.0 (0.8) 7.9 (0.7) 7.8 (0.6) 7.7 (0.7) 7.8 (0.9) 8.0 (0.8) 8.0 (0.8)
Safety set; N: number of patients contributing to analysis
1The overall incidence of treatment-induced ADAs (titer increased by at least 2) and treatment-boosted
ADAs (titer of pre-existing ADA level was boosted by at least 2) 2Mean (SD)
Contact Information: Jahoon Kang, Executive Director, Hanmi Pharma., Co., Ltd
e-mail: [email protected]
Phone: +82-2-410-9041
This study is supported by a grant of the Korean Health
Technology R&D Project, Ministry of Health & Welfare, Republic
of Korea (KDDF-201204-03)
PS069-793
51st European Association for the Study of Diabetes (EASD) Annual Meeting, Stockholm, Sweden; September 14 – 18, 2015
ABSTRACT
• Overview of HM11260C (Efpeglenatide)
A modified Exendin4 (CA-EXD4) has been
conjugated to a human IgG4 Fc using a PEG
linker which leads to slow elimination, thereby
resulting in a decreased dosing schedule.
• Study Objectives
a. Primary objective
- To assess and compare the efficacy of five doses of HM11260C
(once weekly subcutaneous injections) over the 12 weeks from
baseline in comparison with placebo (once weekly subcutaneous
injections) on glycaemic control, as assessed by HbA1c in
subjects with T2DM
b. Secondary objectives
- To assess the effect on safety, tolerability, immunogenicity,
diabetes-related parameters (FPG and 7-point glucose profile)
and body weight change.
- To explore the relationship between PK and PD measurements
RESULTS
Key inclusion criteria
• T2DM age 18-75 yrs
• Drug Naïve or
Metformin ≥ 1500 mg
• HbA1c ≥ 7.0%, ≤ 10%
• BMI < 40 kg/m2
Key exclusion criteria
• Diagnosis of T1DM
• Pregnant or nursing women
• Uncontrolled diabetes: FPG > 240
mg/dL (13.3 mmol/L)
• Significant change in body weight
(at least ± 10%)
a. Total N=254
b. Discontinued: Withdrawal by subject, Adverse effect, Lost to follow-up, protocol deviation,
Noncompliance, etc.
Safety set; N: Based on the randomized patients
REFERENCES • Nauck MA. Incretin-based therapies for type 2 diabetes mellitus: properties,
functions, and clinical implications. Am J Med 124 (Suppl.);S3–S18, 2011
• HM11260C, a New Generation Long Acting GLP-1R Agonist with a unique
Pharmacokinetic Profile Improves Glucose Control and GI tolerability; a Phase
IIa Clinical Trial in Type 2 Diabetes Mellitus (HM-EXC-202), 59-LB, 73rd ADA,
2013
Placebo
N=37
HM
0.3 mg
N=37
HM
1 mg
N=37
HM
2 mg
N=33
HM
3 mg
N=36
HM
4 mg
N=36
liraglutide
1.8mg/day
N=36
% of subjects with
HbA1c ≤ 7.0% 27.0 35.1 75.7* 72.7* 83.3* 80.6* 61.1*
% of subjects with
HbA1c ≤ 6.5% 5.4 21.6* 37.8* 57.6* 55.6* 55.6* 50.0*
Be fo
re B
rea k fa
s t
Aft
e r B
rea k fa
s t
Be fo
re L
u n c h
Aft
e r L u n c h
Be fo
re D
inn e r
Aft
e r D
inn e r
At b
e d t ime
4
6
8
1 0
1 2
1 6
-1 .3 6 *-2 .9 0 * -1 .7 9 *
Me
an
Blo
od
Glu
co
se
(m
mo
l/L
)
-2 .1 2 *
-0 .9 1 *
-1 .8 9 *
-1 .8 4 *
Be fo
re B
rea k fa
s t
Aft
e r B
rea k fa
s t
Be fo
re L
u n c h
Aft
e r L u n c h
Be fo
re D
inn e r
Aft
e r D
inn e r
At b
e d t ime
4
6
8
1 0
1 2
1 6
-1 .7 1 *-3 .0 6 *
-2 .3 6 *
-1 .4 0 *-2 .2 4 *
Me
an
Blo
od
Glu
co
se
(m
mo
l/L
)
-2 .3 5 *-2 .0 2 *
HM 3 mg HM 4 mg
Placebo
N=37
HM
0.3 mg
N=37
HM
1 mg
N=37
HM
2 mg
N=33
HM
3 mg
N=36
HM
4 mg
N=36
liraglutide
1.8mg/day
N=36
Body weight change, kg -1.29
(0.511)
-1.21
(0.526)
-2.01
(0.508)
-1.52
(0.553)
-2.73*
(0.550)
-3.31*
(0.543)
-3.21
(0.558)
Body weight change, % -1.18
(0.570)
-1.10
(0.588)
-2.28
(0.568)
-1.61
(0.618)
-2.66
(0.615)
-3.47*
(0.608)
-3.54
(0.623)
• Table 2. Mean HbA1c Change at Week 13
Placebo
N=37
HM
0.3 mg
N=37
HM
1 mg
N=37
HM
2 mg
N=33
HM
3 mg
N=36
HM
4 mg
N=36
liraglutide
1.8mg/day
N=36
HbA1c change, %
[95.1% CI]†
-0.40
(0.111)
-0.56*
(0.114)
-0.95*
(0.111)
-1.19*
(0.121)
-1.41*
(0.119)
-1.61*
(0.118)
[-0.56, 0.10]†
-1.38*
(0.120)
FAS; *p-value<0.05; difference with Placebo; Data are LS Means (SE) from MMRM †Non-inferiority in HbA1c reduction was concluded if the upper limit of the two-sided 95.1% confidence
interval (CI) for the difference in HbA1c at Visit 7 (Visit 7/Week 13) was smaller than 0.3.
Incidence of Nausea/Vomiting for 4 mg QW in
T2DM Patients at 24 by titration schedule (%)
Weekly titration schedule
(Simulated data)
FAS; Data are LS Means (SE) from MMRM; *p-value<0.05 compared with Placebo
Placebo
N=37
HM
0.3 mg
N=37
HM
1 mg
N=37
HM
2 mg
N=33
HM
3 mg
N=36
HM
4 mg
N=36
liraglutide
1.8mg/day
N=36
Fasting plasma
glucose change,
mmol/L
-0.49
(0.283)
-0.48
(0.295)
-1.31*
(0.282)
-1.27
(0.307)
-2.19*
(0.305)
-2.44*
(0.303)
-1.46
(0.306)
• Table 4. Mean Fasting Plasma Glucose at Week 13
Without titration schedule
(Observed data)
Days since first dosing
Cumulative distribution of
time to first ‘Nausea/Vomiting’
Cum
ula
tive p
roport
ion w
ith e
vent
1-2-4 2-2-4 2-2-2-2-4 None
0.0
0.1
0.2
0.3
0.4
0.5
0.6
Incidence of Nausea/Vomiting for 4 mg QW in T2DM Patients at Week 24
Weekly Titration Schedule
Incid
en
ce
of N
au
se
a/V
om
itin
g a
t W
ee
k 2
4 (
%)
Baseline Week 13
Placebo HM 3 mg
Baseline Week 13
Placebo HM 4 mg

Significant Effects of HM11260C (efpeglenatide) on Body Weight over 20 weeks in Obese Subjects without Diabetes: a Randomized, Double-blind, Placebo Controlled study
ABSTRACT Background and aims: HM11260C (HM) is a novel long acting GLP-1R
agonist with a T1/2 of ~ 158 hrs resulting in a flat PK profile. This 20-week,
randomized, double-blind, placebo (PBO) controlled, parallel group study
was designed to evaluate the efficacy, safety, and tolerability of once a
week (QW) or every other week (Q2W) doses of HM in obese subjects
without diabetes.
Materials and methods: 297 subjects (mean age 43.4 yrs and BMI 35.5
kg/m2) were randomized to one of four HM doses (4 mg QW, 6 mg QW, 6
mg Q2W, or 8 mg Q2W) or to PBO. HM was administered subcutaneously
for 20 weeks. The diet and exercise regimens remained unchanged during
the study.
Results: The body weight loss with HM 4mg QW, 6 mg QW, 6 mg Q2W
and 8 mg Q2W was 6.2 kg, 7.8 kg, 7.0 kg and 7.1 kg (LS Mean, p<0.0001
all HM treatment groups), whereas body weight gain was observed with
PBO (0.8 kg). More subjects in the HM treatment groups achieved
significant body weight loss ≥5% or ≥10%, and the mean reductions in BMI
from baseline were greater, compared with PBO. Changes from baseline in
waist circumference were -6.00 cm, -9.45 cm, -7.11 cm, -8.00 cm and -
0.21 cm (LS Mean) with HM 4mg QW, 6 mg QW, 6 mg Q2W, 8 mg Q2W
and PBO. The most frequent adverse events were gastrointestinal events
which were observed relatively frequently and increased injection site
reactions which were less common.
Conclusion: All doses of HM meaningfully reduced body weight and were
well tolerated. These results warrant further studies to assess titration
schemes as well as the long-term efficacy and safety of HM in obesity.
STUDY DESIGN
RESULTS
SUMMARY
BACKGROUND
• Figure 1. Disposition
• Table 1. Baseline Characteristics
Mean (SD)
Placebo
N=60
HM
4 mg QW
N=59
HM
6 mg QW
N=59
HM
6 mg Q2W
N=59
HM
8 mg Q2W
N=58
Age: years 43.7 (11.8) 42.9 (12.1) 43.0 (13.0) 43.3 (12.5) 43.9 (9.2)
Sex: F/M (%) 73.3/26.7 69.5/30.5 78.0/22.0 72.9/27.1 87.9/12.1
Race (%)
White/Black/
Asian/Other
65.0/26.7/
5.0/3.4
69.5/20.3/
6.8/3.4
62.7/18.6/
13.6/5.1
76.3/13.6/
8.5/1.7
67.2/22.4/
8.6/1.7
Weight: kg 97.5 (12.1) 100.8 (19.3) 101.7 (19.4) 99.5 (18.4) 95.6 (13.3)
BMI: kg/m2 34.9 (3.2) 35.2 (4.5) 36.3 (4.4) 35.6 (4.8) 35.2 (3.9)
Waist
Circumference: cm 109.3 (10.7) 109.8 (12.2) 111.9 (13.3) 109.6 (11.8) 108.9 (10.9)
Waist/Hip
Circumference 0.9 (0.1) 0.9 (0.1) 0.9 (0.1) 0.9 (0.1) 0.9 (0.1)
• Figure 2. Body Weight Change over 20 weeks
• Figure 3. BMI Change at Week 21
CONCLUSION
• All doses of efpeglenatide meaningfully reduced body weight and
exceeded regulatory requirements for anti-obesity drugs. These
results warrant further studies to assess titration schemes as well as
the long-term efficacy and safety of efpeglenatide in obese
population.
OBJECTIVES
Ran
do
miz
ati
on
HM 4 mg QW (N=59)
HM 6 mg QW (N=59)
Follow-up HM 6 mg Q2W (N=59)
HM 8 mg Q2W (N=60)
Placebo (N=60)
6 weeks
2 weeks Titration + 18 weeks Treatment
Obese subjects
without diabetes
Total patient numbers = 297
20w
eeks
• Table 5. Immunogenicity
N (%)
Placebo
N=60
HM
4 mg QW
N=59
HM
6 mg QW
N=59
HM
6 mg Q2W
N=59
HM
8 mg Q2W
N=58
ADAs at any time a 0 12 (20.3) 12 (20.3) 14 (23.7) 18 (31.0)
Total treatment-
emergent ADAs
(Treatment-induced
and -boosted) b
0 10 (16.9) 10 (16.9) 12 (20.3) 15 (25.9)
Neutralizing ADAs 0 0 0 0 0
PS050-643
Screened
N=509
Randomised
N=297
HM
4 mg QW
N=59
Discontinued
N=13
Completed 20-Week Trial and the 6-Week Follow-up, N=207
Placebo
N=60
HM
6 mg QW
N=59
HM
6 mg Q2W
N=59
HM
8 mg Q2W
N=60
HM
4 mg QW
N=42
Placebo
N=47
HM
6 mg QW
N=41
HM
6 mg Q2W
N=39
HM
8 mg Q2W
N=38
Discontinued
N=17
Discontinued
N=18
Discontinued
N=20
Discontinued
N=22b
a. Discontinued: Withdrawal by subject, Adverse effect, Lost to follow-up, Protocol deviation, Other
b. Two subjects in 8mg Q2W group are excluded from Safety set as they had not received any IP.
0 1 2 3 4 5 6 7 8 9 1 0 1 1 1 2 1 3 1 4 1 5 1 6 1 7 1 8 1 9 2 0
-1 0
-9
-8
-7
-6
-5
-4
-3
-2
-1
0
1
2
W e e k
Ch
an
ge
in
Bo
dy
We
igh
t
fro
m B
as
eli
ne
(K
g)
P la c e b o4 m g Q W
6 m g Q W
6 m g Q 2 W
8 m g Q 2 W
- 6 .4
- 6 .6
- 7 .1
- 7 .3
Safety set; N: number of patients contributing to analysis
a. The number of subjects who were positive for anti-drug antibody at any time
b. The treatment-induced ADAs (titer increased by at least 2) and treatment-boosted ADAs (titer of
pre-existing ADA level was boosted by at least 2)
REFERENCES
• WHO Fact Sheets, “Obesity and Overweight,” (2013).
• Kang J, Choi S, Kwon SC, et al. (2013) HM11260C, a new
generation long acting GLP-1R agonist with a unique
pharmacokinetic profile improves glucose control and GI tolerability;
a phase IIa clinical trial in type 2 diabetes mellitus. Abstract
presented at the 73rd Scientific Session of the American Diabetes
Association, San Diego, CA, USA.
FAS (full analysis set); Data are LS Means (SE) from MMRM (a mixed-effects repeated
measures model, using an unstructured covariance matrix; change from baseline as the
outcome variable; baseline as a covariate; treatment group, visit and their interaction as
factors.)
Safety set; Data are n (%); TEAE, Treatment-Emergent Adverse Event
Key inclusion criteria
• Aged ≥ 18 and < 65 years
• BMI 30 kg/m2 or 27 kg/m2, with treated
or untreated co-morbidity(ies)
• Stable body weight (less than 5% change)
for at least 3 months
Key exclusion criteria
• BMI 42 kg/m2
• Diabetes mellitus (type 1, 2, or other)
• HbA1c 6.5%
• Pregnant or nursing women
Safety set; N: number of patients contributing to analysis
RE Pratley1, JH Kang2, PK Kim2, EH Kwak2, OP Han2, KH Gee2, IY Choi2, SC Kwon2, M Trautmann3, M Hompesch3 1Florida Hospital Translational Research Institute, Orlando, FL, USA, 2Hanmi Pharm. Co., Ltd., Seoul, South Korea, 3Profil Institute, Chula Vista, CA, USA
• The abstract included the results of an interim analysis available at the
time of submission. Since then, the final analysis has been completed
and is reported in the poster.
• Obesity is highly associated with a majority of metabolic diseases (WHO
Obesity and Overweight Fact sheet; updated March 2013).
• Few effective drugs are currently available for the treatment of obesity;
better therapeutic options that are safe and well tolerated and that can
lower the risks associated with obesity are needed.
• 8 weeks of treatment with HM11260C (LAPSCA-Exendin-4, efpeglenatide),
a GLP-1 agonist, resulted in marked weight loss compared with placebo
(Kang et al., 2013). The purpose of this study is to determine the optimal
dose and regimen of efpeglenatide, when administered subcutaneously
weekly or biweekly to reduce weight in obese subjects without diabetes.
• Primary objective
To assess the effect of efpeglenatide on body weight over the 20 weeks
from baseline in obese subjects
• Secondary objectives
To assess the safety, tolerability, and immunogenicity of efpeglenatide
over the 20 weeks from baseline in obese subjects
***p-value <0.0001, **p-value <0.01 compared with Placebo; FAS
• Statistically significant body weight reduction was observed over 20
weeks with once a week (QW) and every other week (Q2W)
treatment of efpeglenatide in all groups.
• Statistically significant increases in heart rate were observed, however,
they were within the expected range for GLP-1 receptor agonists.
Blood pressure decreased within the expected range for GLP-1
receptor agonists, but was only significant at the 6 mg QW dose.
• Most of nausea and vomiting occurred with the first few injections and
subsided over the time.
• Overall treatment emergent anti-efpeglenatide antibodies were
detected in 20.0% (47 out of 235 efpeglenatide-treated subjects).
None of patients with positive drug antibodies showed neutralizing
antibody against efpeglenatide.
AUTHOR DISCLOSURE
Richard E. Pratley, MD
• Research Support: Merck, Novo Nordisk, Takeda, Sanofi, Lilly
• Consultant: GSK, Merck, Novo Nordisk, Takeda, Sanofi, Astra
Zeneca, Hanmi, Janssen, Boehringer-Ingleheim
Contact Information: Jahoon Kang, Executive Director, Hanmi Pharma., Co., Ltd
e-mail: [email protected]
Phone: +82-2-410-9041 51st European Association for the Study of Diabetes (EASD) Annual Meeting, Stockholm, Sweden; September 14 – 18, 2015
• Figure 4. Waist Circumference Change at Week 21
-1 0
-9
-8
-7
-6
-5
-4
-3
-2
-1
0
1
2
Ch
an
ge
in
Wa
ist
Cir
cu
mfe
re
nc
e
fro
m B
as
eli
ne
(c
m)
- 0 .9
- 5 .2
- 6 .7
- 6 .2
- 8 .3
**
*****
***
B a s e l in e (c m ) 1 0 9 .3 1 0 9 .8 1 1 1 .9 1 0 9 .6 1 0 8 .9
P la c e b o 4 m g Q W 6 m g Q W 6 m g Q 2 W 8 m g Q 2 W
***p-value <0.0001 compared with Placebo; FAS; Data are LS Means (SE) from MMRM
• Table 2. Subjects Who Lost at Least 5% and 10%
Body Weight at Week 21
Placebo
N=60
HM
4 mg QW
N=59
HM
6 mg QW
N=59
HM
6 mg Q2W
N=59
HM
8 mg Q2W
N=58
Body weight
change, % a 0.1 (0.6) -6.7 (0.6)*** -7.3 (0.6)*** -6.7 (0.6)*** -7.4 (0.6)***
Subjects with
BW loss ≥ 5% b 2 (3.3) 32 (54.2)*** 33 (55.9)*** 31 (52.5)*** 35 (60.3)***
Subjects with
BW loss ≥ 10% b 1 (1.7) 12 (20.3)** 16 (27.1)*** 12 (20.3)** 13 (22.4)**
***p-value <0.0001, **p-value <0.01 compared with Placebo; FAS; and
Data are LS Means (SE) from MMRM
• Table 4. Adverse Events
Placebo
N=60
HM
4 mg QW
N=59
HM
6 mg QW
N=59
HM
6 mg Q2W
N=59
HM
8 mg Q2W
N=58
Any TEAEs 48 (80.0) 51 (86.4) 54 (91.5) 51 (86.4) 51 (87.9)
GI Disorders 28 (46.7) 43 (72.9) 49 (83.1) 38 (64.4) 44 (75.9)
Nausea 11 (18.3) 32 (54.2) 35 (59.3) 28 (47.5) 36 (62.1)
Vomiting 4 (6.7) 13 (22.0) 13 (22.0) 10 (16.9) 19 (32.8)
Injection Site
Reaction 13 ( 21.7) 11 (18.6) 7 (11.9) 5 (8.5) 8 (13.8)
Serious TEAE
(SAEs) 0 (0) 1 (1.7) 3 (5.1) 0 (0) 2 (3.4)
Any TEAE
Leading to
Discontinuation
4 (6.7) 3 (5.1) 11 (18.6) 7 (11.9) 10 (17.2)
• Table 3. Heart Rate and Blood Pressure Change at Week 21
Placebo
N=60
HM
4 mg QW
N=59
HM
6 mg QW
N=59
HM
6 mg Q2W
N=59
HM
8 mg Q2W
N=58
Heart Rate (BPM)
Baseline a 67.8 (9.3) 67.2 (9.1) 69.2 (8.5) 69.1 (8.1) 68.9 (11.1)
Change b 0.5 (1.1) 4.7 (1.1)** 6.2 (1.1)** 5.2 (1.1)** 3.6 (1.1)*
SBP (mmHg)
Baseline a 124.2 (12.8) 120.5 (10.4) 119.8 (9.3) 121.4 (10.8) 121.8 (10.8)
Change b -0.1 (1.3) -3.5 (1.4) -6.1 (1.4)** -0.3 (1.4) -3.0 (1.4)
DBP (mmHg)
Baseline a 78.7 (8.2) 77.0 (8.0) 76.1 (7.4) 77.7 (7.5) 78.8 (7.1)
Change b 0.1 (0.9) -0.1 (0.9) -1.3 (0.9) 1.8 (0.9) -0.3 (0.9)
a. Data are LS Means (SE) from MMRM.
b. Data are n (%) from LOCF.
-4 .0
-3 .5
-3 .0
-2 .5
-2 .0
-1 .5
-1 .0
-0 .5
0 .0
0 .5
1 .0
Ch
an
ge
in
BM
I fr
om
Ba
se
lin
e
0 .0
- 2 .4
- 2 .6
- 2 .3- 2 .6
******
******
B a s e l in e 3 4 .9 3 5 .2 3 6 .3 3 5 .6 3 5 .2
P la c e b o 4 m g Q W 6 m g Q W 6 m g Q 2 W 8 m g Q 2 W
a. Data are Means (SD).
b. Data are LS Means (SE) from MMRM.
**p-value <0.01, *p-value <0.049 compared with Placebo; Safety set

788-P
1 0 n M 1 0 0 n M
0
2 0 0
4 0 0
6 0 0
8 0 0
1 0 0 0
Inte
rn
ali
ze
d G
LP
-1 r
ec
ep
tor
(% o
f in
itia
l)
E x e n a tid e
C A E x e n d in -4
N o t re a t
Superagonistic mechanism of increased glucodynamic and weight loss effects of LAPSCA-Exendin-4 (efpeglenatide)
IY Choi1, SH Park1, M Trautmann2, SY Hwang1, JY Kim1, SM Bae1, YM Lee1, JH Kang1, SC Kwon1 1Hanmi Pharm. Co., Ltd, Seoul, South Korea, 2Profil Institute, Chula Vista, CA, USA
RESULTS
• Following conjugation to Fc the fast receptor dissociation kinetics of
CA-Exendin-4 were maintained in efpeglenatide. (kd 4.2x10⁻³s-1 vs.
1.0x10⁻³ s-1 for efpeglenatide).
• Efpeglenatide lead to significantly less GLP-1R internalization than
liraglutide and dulaglutide in human GLP-1R transformed cells. This
translated into more potent glucose lowering in db/db mice and
greater body weight loss in DIO mice in comparison to liraglutide
and dulaglutide.
• Efpeglenatide maintained potent glucose lowering efficacy in db/db
mice even at conditions mimicking human dosing.
• CA-Exendin-4 even after conjugation to the human Fc-fragment
seems to achieve more pronounced GLP-1R activation due to
reduced receptor internalization and consequently leads to more
potent effects. These findings may explain the observed efficacy of
efpeglenatide in clinical trials relative to liraglutide.
Less GLP-1R desensitization by efpeglenatide
CONCLUSIONS
REFERENCES • Alan J. Garber et al., Diabetes Care 2011, 34(S2): S279-284
• Briones M, Bajaj M er al., Expert Opin Pharmacother 2006, 7(8): 1055-1064.
• Monika Malm-Erjefält et al., Drug Metabolism and Disposition 2010, 38(11): 1944-1953.
• Scott E. et al., Endocrinol 2011, 152(8): 3103-3112.
• Young Min Cho et al., Pharmacology and Therapeutics 2012, 135: 247-278.
BACKGROUND
Fast dissociating kinetics on the hGLP-1 receptor may lead to superior efficacy via less receptor internalization and subsequent desensitization.
Hypothesis: Superagonistic activation of GLP-1R by efpeglenatide
Exendin-4 CA-Exendin-4
5 fold faster dissociation
(nM)
200
100
50
25
12.5
6.25
Continuous activation
CA-Exendin-4Exendin-4
Receptor
Internalization /
desensitization
Receptor
internalization
/desensitization
More continuous
signaling due to
reduced internalization
Slow dissociation
(kd: 1.1x10⁻³ s-1) (kd: 6.0 x 10⁻³ s-1)
CA-Exendin-4
Exendin-4
Superior glycodynamic effect of CA-Exendin-4
(nM)
200
100
50
25
12.5
6.25
Figure 1. GLP-1R internalization by CA-Exendin-4 and Exendin-4
(a) Receptor internalization in hGLP-1R/U2OS cells
(b) Cell surface receptors in hGLP-1R/CHO cells
0
2 0
4 0
6 0
8 0
1 0 0
1 2 0
0 .5 n M @ 6 0 m (4 /1 3 & 4 /1 4 )
Su
rfa
ce
GL
P-1
re
ce
pto
r
(%
of i
nit
ial) 0 .5 n M C A -E x e n d in -4
N o t r e a t
0 .5 n M E x e n d in -4
***
***
0
2 0
4 0
6 0
8 0
1 0 0
1 2 0
E x d -4 v s . C A -E x d -4
Su
rfa
ce
GL
P-1
re
ce
pto
r
(% o
f in
itia
l) C A -E x e n d in -4 (1 0 n M )
N o tre a tm e n t
E x e n d in -4 (1 0 n M )
*** P<0.001, Paired t-test
CA-Exendin-4 induced less receptor internalization and more cell surface receptors
compared to exendin-4
*** ***
E x d -4 v s C A E x d -4
0 1 2
0
5
1 0
1 5V e h ic l e
E x e n d in - 4 1 n m o l /k g
C A -E x e n d in - 4 1 n m o l/k g
T im e (h r )
Blo
od
Glu
co
se
(m
mo
l/L
)
T ra n s fo rm o f A U C
0 .0 1 1 1 0 0
1 0 0
2 0 0
3 0 0
4 0 0
E x d - 4
C A E x d -4
D o s e (n m o l/k g )
IpG
TT
glu
co
se
AU
C (
hr*
mg
/dL
)
Figure 3. GLP-1 receptor internalization by GLP-1RAs
*** P<0.001, 2-way ANOVA test
Figure 2. Comparison of in vitro and in vivo potencies
(b) Insulin release in RINm5F cells
c A M P in R IN m 5 F
0 .0 0 1 0 .0 1 0 .1 1 1 0 1 0 0 1 0 0 0
0
1 0
2 0
3 0
4 0
5 0C A E x e n d in -4
E x e n d in -4
C o n c e n tra t io n (n M )
Co
nc
. o
f c
AM
P (
nM
)
-4 -2 0 2 4
-4 0
-3 0
-2 0
-1 0
0
E x e n d in -4
C A -E x e n d in -4
lo g p e p tid e c o n c e n tra tio n (n M )
% C
ha
ng
e o
f p
las
ma
glu
co
se
(c) Glucose lowering in C57BL6 mice, 1 nmol/kg, n=5
(a) cAMP accumulation in RINm5F cells
CA-Exendin-4 showed more potent in vitro and in vivo potency compared to exendin-4
Table 1. Dissociation kinetics for GLP-1 receptor
Efeglenatide showed fast dissociation rate for GLP-1R compared to other GLP-1RAs
(a) Receptor internalization in hGLP-1R/U2OS cells
(b) Cell surface receptors in hGLP-1R/CHO cells
Efpeglenatide induced less receptor internalization and retained more cell surface
receptors compared to liraglutide and dulaglutide.
ED50
0.13 nmol/kg
ED50
0.65 nmol/kg
>5 fold
(d) Dose dependencyin ipGTT C57BL6 mice, n=5
-4 -2 0 2 4
-4 0
-3 0
-2 0
-1 0
0
E x e n d in -4
C A -E x e n d in -4
lo g p e p tid e c o n c e n tra tio n (n M )
% C
ha
ng
e o
f p
las
ma
glu
co
se
E x d -4 v s C A E x d -4
0 1 2
0
5
1 0
1 5V e h ic l e
E x e n d in - 4 1 n m o l /k g
C A -E x e n d in - 4 1 n m o l/k g
T im e (h r )
Blo
od
Glu
co
se
(m
mo
l/L
)
Figure 7. Development plan of QUANTUM project
FURTHER INFORMATION [Acknowledgments] This study was supported by a grant of the Korea Drug Development Fund R&D
Project.(KDDF-201204-03)
0 .0 0 0 1 0 .0 1 1 1 0 0 1 0 0 0 0
1 0 0
1 5 0
2 0 0
C A e x e n d in -4
E x e n d in -4
C o n c e n tra t io n (n M )In
su
lin
co
nc
. (%
of
co
ntr
ol)
-4 -2 0 2 4
-4 0
-3 0
-2 0
-1 0
0
E x e n d in -4
C A -E x e n d in -4
lo g p e p tid e c o n c e n tra tio n (n M )
% C
ha
ng
e o
f p
las
ma
glu
co
se
kd (1/s, X10-3)
Liraglutide 2.8 ± 0.2
Dulaglutide 3.5 ±0.01
Efpeglenatide 10.1 ± 0.1
*** ***
Faster kd Slower kd
1 0 n M 1 0 0 n M
0
2 0
4 0
6 0
8 0
1 0 0
1 2 0
1 0 , 1 0 0 n M _ G L P -1 R A s @ 1 h
Su
rfa
ce
GL
P-1
re
ce
pto
r
(% o
f in
itia
l)
N o t r e a t
L ira g lu tid e
D u la g lu tid e
E fp e g le n a tid e
***
***
1 0 n M 1 0 0 n M
0
3 0 0
6 0 0
9 0 0
1 2 0 0
1 5 0 0
Inte
rna
liz
ed
GL
P-1
re
ce
pto
r
(% o
f in
itia
l) L ira g lu tid e
D u la g lu tid e
E fp e g le n a tid e
N o t r e a t
***
***
GLP-1R 0
2 0
4 0
6 0
8 0
1 0 0
1 2 0
E x d -4 v s . C A -E x d -4
Su
rfa
ce
GL
P-1
re
ce
pto
r
(% o
f in
itia
l) C A -E x e n d in -4
N o tre a tm e n t
E x e n d in -4
METHODS • The receptor kinetics were measured by a SPR (Surface Plasmon Resonance) assay using immobilized extracellular domain of the human GLP-1 receptor which is fused to the GST (glutathione S transferase).
• Intracellular cyclic AMP and insulin released to the assay medium were measured, following 1hr treatment with GLP-1RAs in a rat insulinoma cell, RINm5F or GLP-1R overexpressing CHO cells.
• Acute glucose lowering efficacy was investigated by intraperitonial glucose tolerance test following a single dose of various concentrations of exendin-4 analogs in normal C57BL/6 mice.
• Internalization of GLP-1 receptor was assessed in hGLP-1R/U2OS cells using the PathHunter™ eXpress Kit (DiscoveRx Corporation. Ltd., UK). Surface GLP-1 receptors were measured in hGLP-1R/CHO cells after pretreatment with 10 nM or 100 nM GLP-1RAs at 37°C for 5 min to 60 min. The remaining surface receptors were detected by binding of 100 pM125I-GLP-1 at 4°C for 4 h.
• In vitro activity after chronic treatment of GLP-1RAs was determined by measuring intracellular cyclic AMP in GLP-1R/CHO and insulin release in RINm5F cells. The cells were pre-treated with 10 nM of GLP-1RAs for 4 to 24 hours and followed by cAMP or insulinotropic induction by re-challenge with 0-5,000 nM of GLP-1RAs.
• In vivo efficacy between efpeglenatide and other GLP-1RAs was compared by subcutaneous administration in human PK fluctuation mimic condition, Change of blood glucose was monitored during 4 weeks and HbA1c was determined at the end point in db/db mice. Efficacy in body weight lowering and food intake inhibition was compared in DIO mice for 4 weeks.
European Association for the Study of Diabetes (EASD) 51st Annual Meeting, Stockholm, Sweden, 14-18 September 2015
AIMS
• To explore the mechanism of increased glucose lowering and weight loss by efpeglenatide
• To compare the glucose lowering and weight loss with the other GLP-1R agonists in extended dosing intervals
(c) β-arrestin-2 recruitment in hGLP-1R+β-arrestin-2/CHO-K1 cells
1 0 0 0
3 0 0 0
5 0 0 0
7 0 0 0
L ira v s . D U v s . H M 1 1 2 6 0 C (5 /2 1 _ R u n # 2 )_ D a ta 사 용
-a
rre
sti
n-2
re
cru
itm
en
t
(% o
f in
itia
l)
L ira g lu tid e
D u la g lu tid e
N o t r e a t
E fp e g le n a tid e
1 0 n M 1 0 0 n M1 n M 1 0 n M 1 0 0 n M 1 0 0 0 n M
1 0 0 0
3 0 0 0
5 0 0 0
7 0 0 0
L ira v s . D U v s . H M 1 1 2 6 0 C (5 /2 1 _ R u n # 2 )_ D a ta 사 용
-a
rre
sti
n-2
re
cru
itm
en
t
(% o
f in
itia
l)
L ira g lu tid e
D u la g lu tid e
N o tre a tm e n t
E fp e g le n a tid e
***
***
Figure 4. Comparison of DPP-IV susceptibility in long-term digestion
0 2 4 4 8 7 2 9 6 1 2 0
0
2 0
4 0
6 0
8 0
1 0 0
1 2 0
D P P -IV in c u b a tio n t im e (h r )
h G L P -1
L i r a g lu t id e
E x e n d in - 4
Re
lati
ve
cA
MP
ac
tiv
ity
(%v
s.
w/o
DP
P-4
)
C A -E x e n d in - 4
E f p e g le n a t id e
Hydrophobic
1. Exendin-4
8Ala 8Gly substitution
: Reducing affinity to substrate
binding pocket
2. Efpeglenatide
N-terminal modification
: Further reducing affinity
to binding pocket
P1 P2
Binding pocket of DPP-4
H G E G T FN’- H G E G T F
Susceptibility of efpeglenatide to DPP-IV
Figure 6. Glucose lowering by human monthly fluctuation mimic
condition in db/db mice (n=6, 4 weeks)
Efpeglenatide showed superior glucose lowering efficacy in monthly regimen
compared to liraglutide daily.
B W (% )
0 2 4 6 8
-1 5
-1 0
-5
0
5
V e h ic le
L ira g lu t id e 3 0 n m o l/k g , B ID (= 1 .8 m g /d a y in h u m a n )
E fp e g le n a tid e 5 .0 7 n m o l/k g , Q W (= 8 m g /m o n th in h u m a n )
T im e (d a y )
Bo
dy
We
igh
t C
ha
ng
e
(% v
s.
Da
y 0
)
E fp e g le n a tid e 7 .6 0 n m o l/k g , Q W (= 1 2 m g /m o n th in h u m a n )
0 7 1 4 2 1 2 8
0
1 0 0
2 0 0
3 0 0
4 0 0
5 0 0
6 0 0
V e h ic le
T im e (d a y )
Blo
od
Glu
co
se
(m
g/d
L)
L ira 3 0 n m o l/k g , B ID
5 .0 7 , Q W
7 .6 0 , Q W
A1c : 7.1%
A1c : 5.9%
A1c : 8.8%
A1c : 6.1%
5.9
Figure 5. Glucose lowering and body weight loss efficacy at human drug fluctuation
mimicking condition in diabetic and obese animal models
(a) Blood glucose lowering (db/db mice, =6, 4 wks)
(b) Body weight loss (DIO mice, n=6, 4 wks)
Efpeglenatide showed superior glycemic control and weight loss compared to other
long-acting GLP-1RAs.
B W (% )
0 2 4 6 8
-1 5
-1 0
-5
0
5
V e h ic le
L ira g lu t id e 3 0 n m o l/k g , B ID (= 1 .8 m g /d a y in h u m a n )
D u la g lu t id e 0 .9 8 n m o l/k g , Q 2 D (= 1 .5 m g /w k in h u m a n )
A c y la te d G L P -1 9 .4 9 n m o l/k g , Q 2 D (= 1 m g /h e a d in h u m a n )
L A P SC A -E x e n d in -4 1 .4 5 n m o l/k g , Q 2 D (= 2 m g /h e a d in h u m a n )
E fp e g le n a tid e 2 .8 9 n m o l/k g , Q 2 D (= 4 m g /w k in h u m a n )
T im e (d a y )
Bo
dy
We
igh
t C
ha
ng
e
(% v
s.
Da
y 0
)
L A P SC A -E x end in -4 4 .3 5 n m o l/k g , Q 2 D (= 6 m g /h e a d in h u m a n )
B lo o d g lu c o s e
0 7 1 4 2 1 2 8
0
1 0 0
2 0 0
3 0 0
4 0 0
5 0 0
6 0 0
V e h ic le
L ira g lu tid e 3 0 n m o l/k g , B ID (= 1 .8 m g /h e a d in h u m a n )
D u la g lu tid e 0 .9 8 n m o l/k g , Q 2 D (= 1 .5 m g /h e a d in h u m a n )
L A P SC A -E x e n d in -4 2 .8 9 n m o l/k g , Q 2 D (= 4 m g /h e a d in h u m a n )
T im e (d a y )
Blo
od
Glu
co
se
(m
g/d
L)
A1c 7.1% A1c 7.1%
A1c 5.9%
A1c 9.6%
In vivo efficacy of efpeglenatide depend on regimens
B W (% )
0 2 4 6 8
-1 5
-1 0
-5
0
5
V e h ic le
L ira g lu t id e 5 0 n m o l/k g , B ID (= 3 .0 m g /d a y in h u m a n )
D u la g lu t id e 0 .9 8 n m o l/k g , Q 2 D (= 1 .5 m g /w k in h u m a n )
T im e (d a y )
Bo
dy
We
igh
t C
ha
ng
e
(% v
s.
Da
y 0
)
E fp e g le n a tid e 4 .3 5 n m o l/k g , Q 2 D (= 6 m g /w k in h u m a n )
-7.1%
-18.6%
-22.2%
+3.4%
B W (% )
0 7 1 4 2 1 2 8
-2 0
-1 0
0
1 0
V e h ic le
L ira g lu tid e 5 0 n m o l/k g , B ID (= 3 m g /h e a d in h u m a n )
D u la g lu tid e 0 .9 8 n m o l/k g , Q 2 D (= 1 .5 m g /h e a d in h u m a n )
T im e (d a y )
Bo
dy
We
igh
t C
ha
ng
e
(% v
s.
Da
y 0
)
E fp e g le n a tid e 4 .3 5 n m o l/k g , Q 2 D (= 6 m g /h e a d in h u m a n )
Time (day)
Efpeglenatide is almost not susceptible from enzymatic degradation by DPP-IV
compared to liraglutide.
Related Documents