SLIDE 1 PRUDENTIAL STANDARD FRAMEWORK RULE CHANGE REQUEST 14 December 2011 PRESENTED BY RUTH GUEST

Welcome message from author
This document is posted to help you gain knowledge. Please leave a comment to let me know what you think about it! Share it to your friends and learn new things together.
Transcript

SLIDE 1
PRUDENTIAL STANDARD FRAMEWORK
RULE CHANGE REQUEST
14 December 2011
PRESENTED BY RUTH GUEST
SLIDE 2
NEW VERSUS OLD
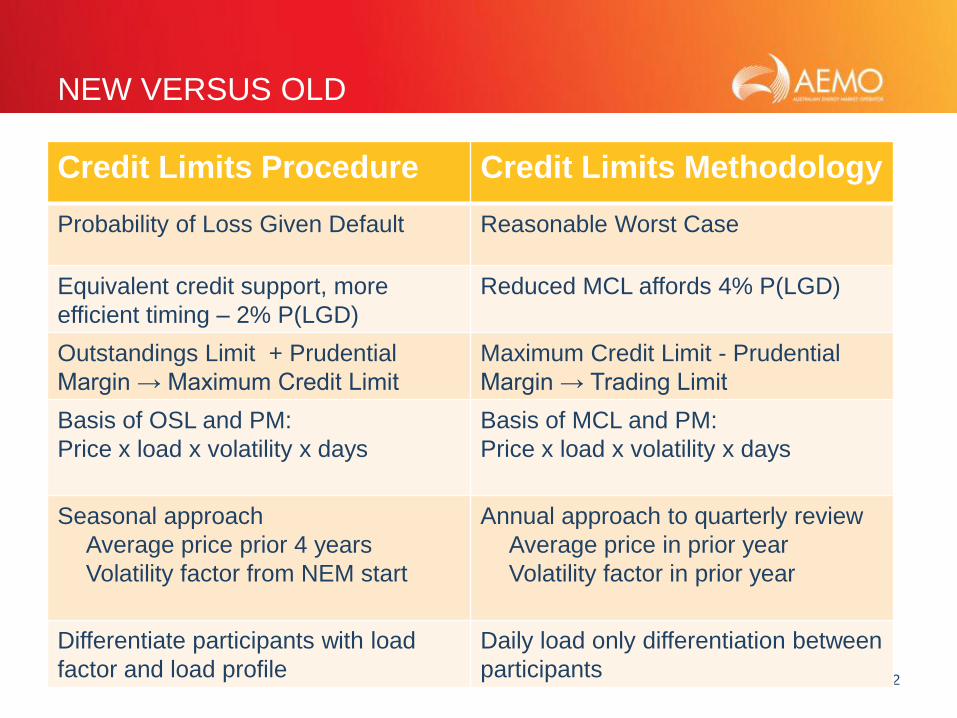
Credit Limits Procedure Credit Limits Methodology
Probability of Loss Given Default Reasonable Worst Case
Equivalent credit support, more
efficient timing – 2% P(LGD)
Reduced MCL affords 4% P(LGD)
Outstandings Limit + Prudential
Margin → Maximum Credit Limit
Maximum Credit Limit - Prudential
Margin → Trading Limit
Basis of OSL and PM:
Price x load x volatility x days
Basis of MCL and PM:
Price x load x volatility x days
Seasonal approach
Average price prior 4 years
Volatility factor from NEM start
Annual approach to quarterly review
Average price in prior year
Volatility factor in prior year
Differentiate participants with load
factor and load profile
Daily load only differentiation between
participants
SLIDE 3
REASONABLE WORST CASE D
aily
Ou
tsta
nd
ings
Days
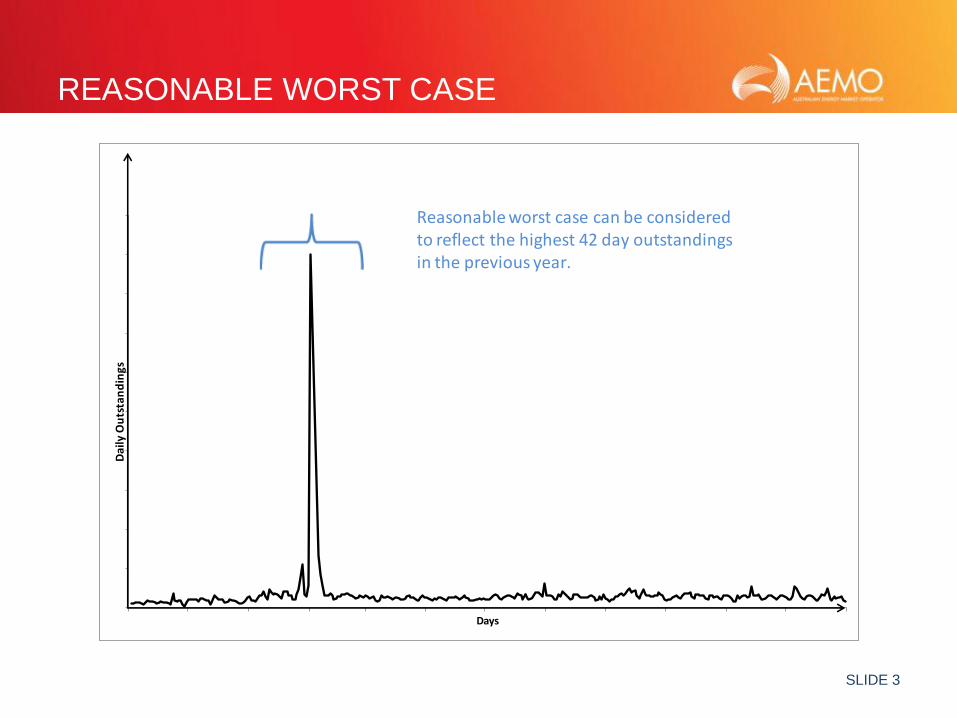
Reasonable worst case can be considered to reflect the highest 42 day outstandings in the previous year.
SLIDE 4
LOSS GIVEN DEFAULT
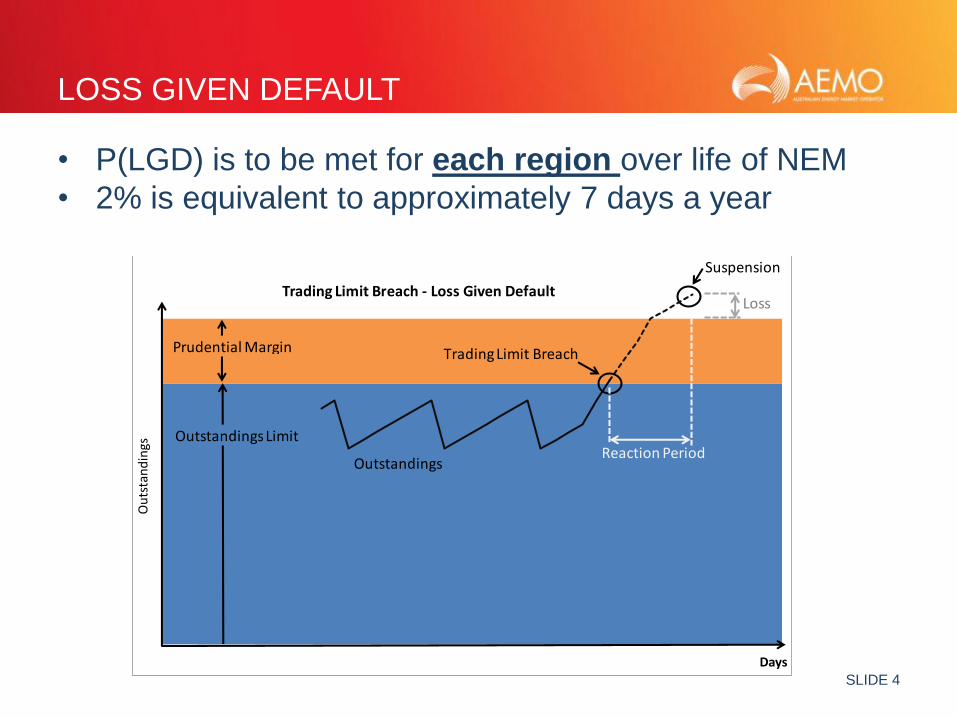
• P(LGD) is to be met for each region over life of NEM
• 2% is equivalent to approximately 7 days a year
Ou
tsta
nd
ings
Days
Trading Limit Breach - Loss Given Default
Reaction PeriodOutstandingsLimit
Outstandings
Prudential Margin Trading Limit Breach
Suspension
Loss

SLIDE 5
MAXIMUM CREDIT LIMIT (NEW)
• MCL = outstandings limit plus prudential margin
o OSL and PM calculated simultaneously to meet P(LGD)
o Daily load x price x volatility factor x (21, 7) days
o Model calibrated for VFs to meet the P(LGD)
o Price and volatility factors are a region parameter
• Outstandings limit is a new term which is distinguishable
from trading limit when credit support > MCL
o Trading limit = credit support – prudential margin
o Outstandings limit ≡ MCL – prudential margin
SLIDE 6
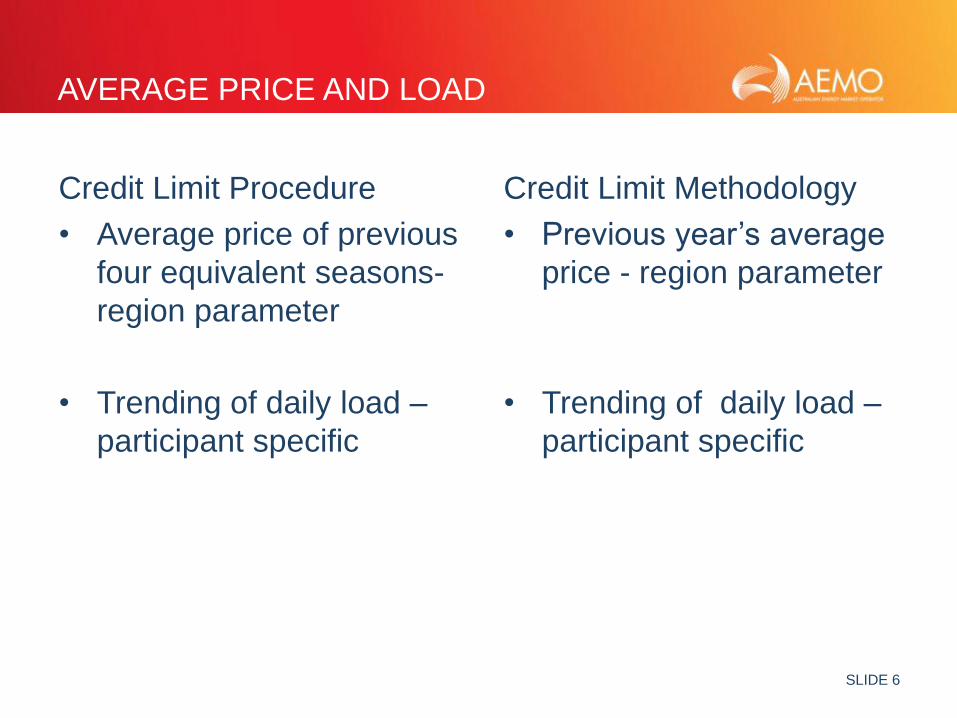
AVERAGE PRICE AND LOAD
Credit Limit Methodology
• Previous year’s average
price - region parameter
• Trending of daily load –
participant specific
Credit Limit Procedure
• Average price of previous
four equivalent seasons-
region parameter
• Trending of daily load –
participant specific
SLIDE 7
VOLATILITY FACTOR
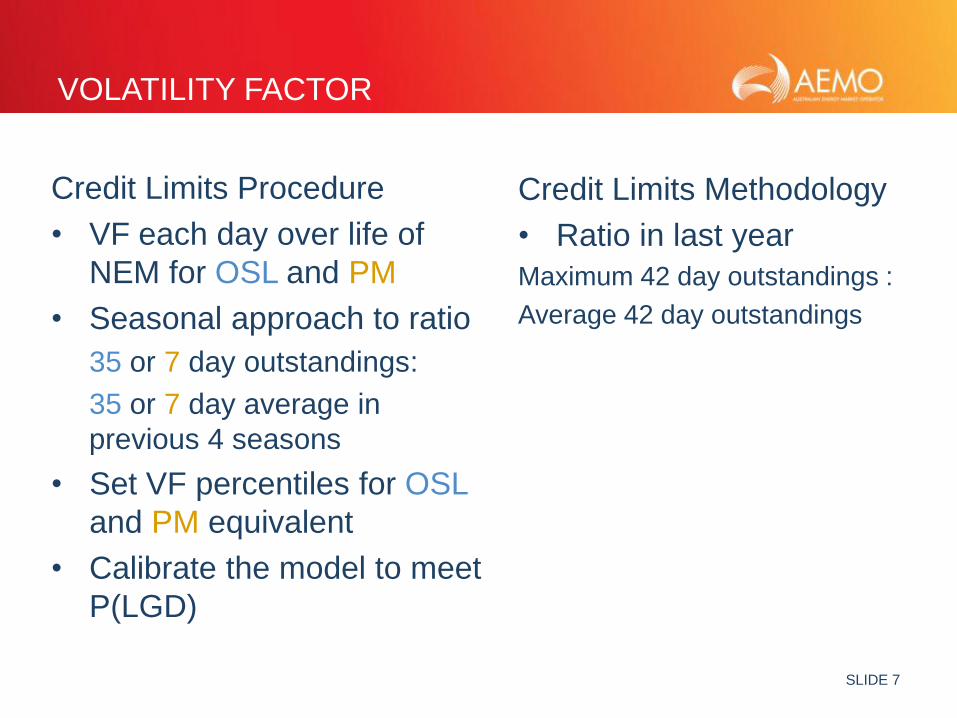
Credit Limits Methodology
• Ratio in last year
Maximum 42 day outstandings :
Average 42 day outstandings
Credit Limits Procedure
• VF each day over life of
NEM for OSL and PM
• Seasonal approach to ratio
35 or 7 day outstandings:
35 or 7 day average in
previous 4 seasons
• Set VF percentiles for OSL
and PM equivalent
• Calibrate the model to meet
P(LGD)
SLIDE 8
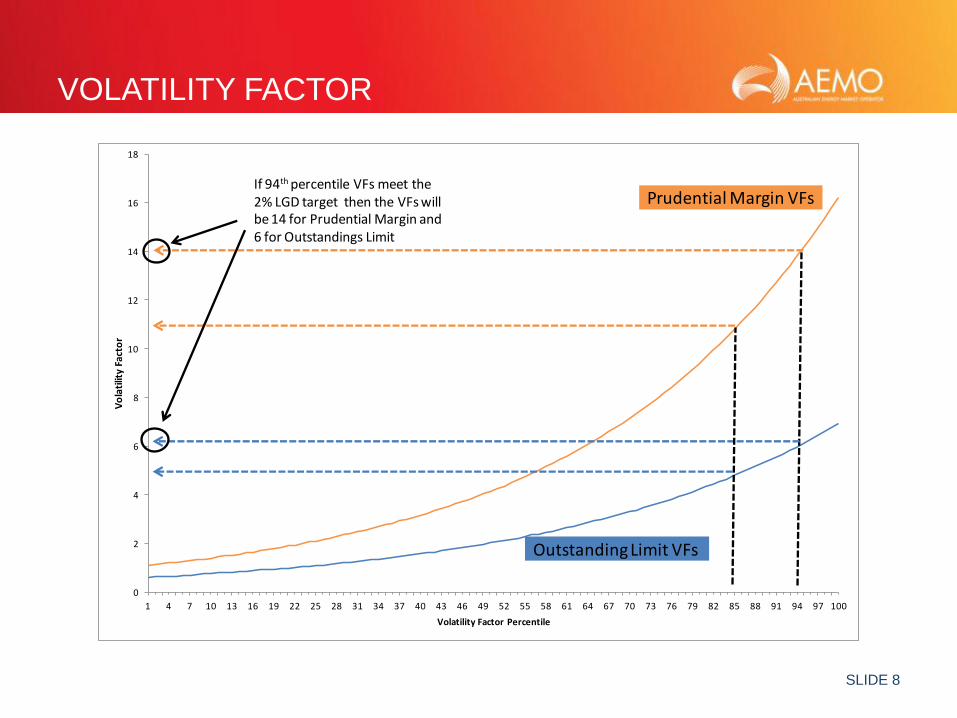
VOLATILITY FACTOR
0
2
4
6
8
10
12
14
16
18
1 4 7 10 13 16 19 22 25 28 31 34 37 40 43 46 49 52 55 58 61 64 67 70 73 76 79 82 85 88 91 94 97 100
Vo
lati
lity
Fact
or
Volatility Factor Percentile
Prudential Margin VFs
OutstandingLimit VFs
If 94th percentile VFs meet the 2% LGD target then the VFs willbe 14 for Prudential Margin and 6 for Outstandings Limit
SLIDE 9
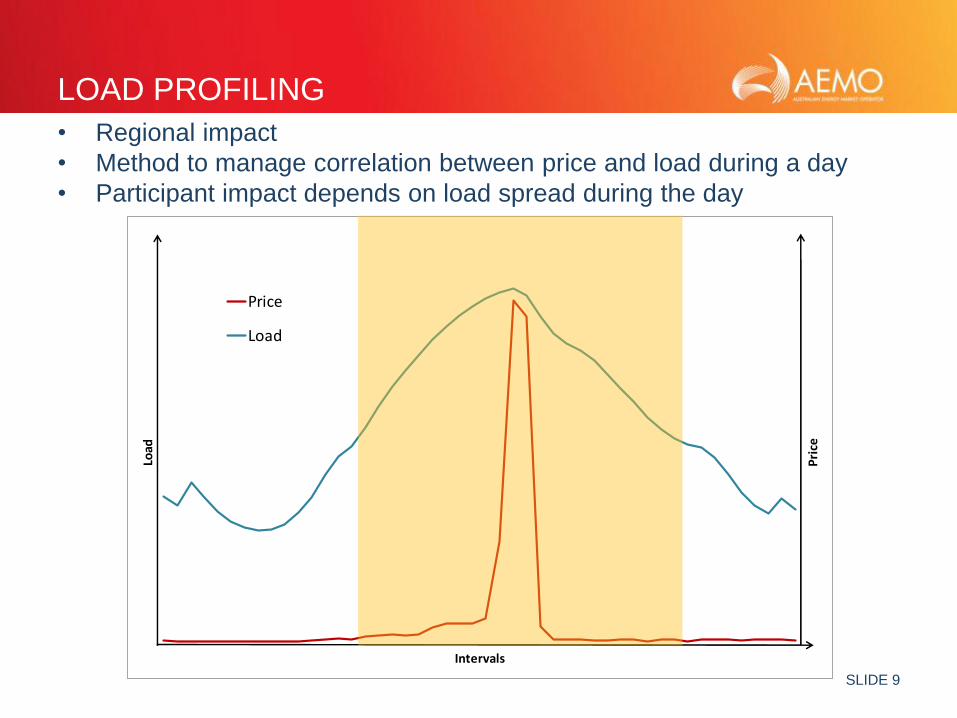
LOAD PROFILING
• Regional impact
• Method to manage correlation between price and load during a day
• Participant impact depends on load spread during the day
Pri
ce
Load
Intervals
Price
Load
SLIDE 10
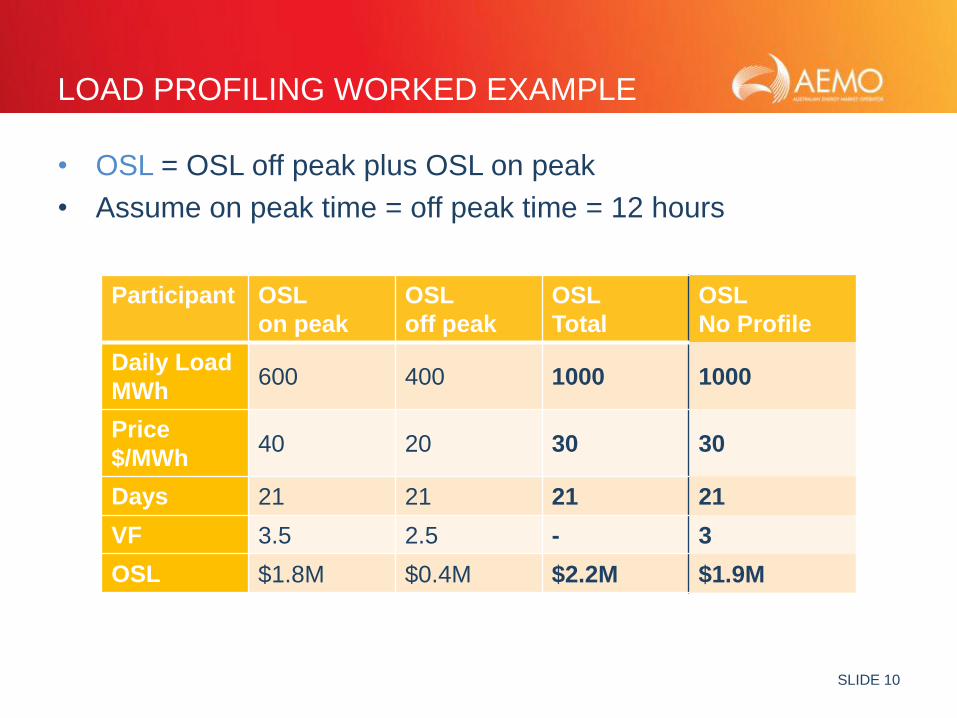
LOAD PROFILING WORKED EXAMPLE
• OSL = OSL off peak plus OSL on peak
• Assume on peak time = off peak time = 12 hours
Participant OSL
on peak
OSL
off peak
OSL
Total
OSL
No Profile
Daily Load
MWh 600 400 1000 1000
Price
$/MWh 40 20 30 30
Days 21 21 21 21
VF 3.5 2.5 - 3
OSL $1.8M $0.4M $2.2M $1.9M

SLIDE 11
LOAD FACTOR
• Participant parameter
• Method to manage participant volatility greater or lower than region
• In general the peakier the load the greater the credit support requirement
• Envisaged to encourage management of load patterns.
Load
Days
Region Peakier Flatter
SLIDE 12
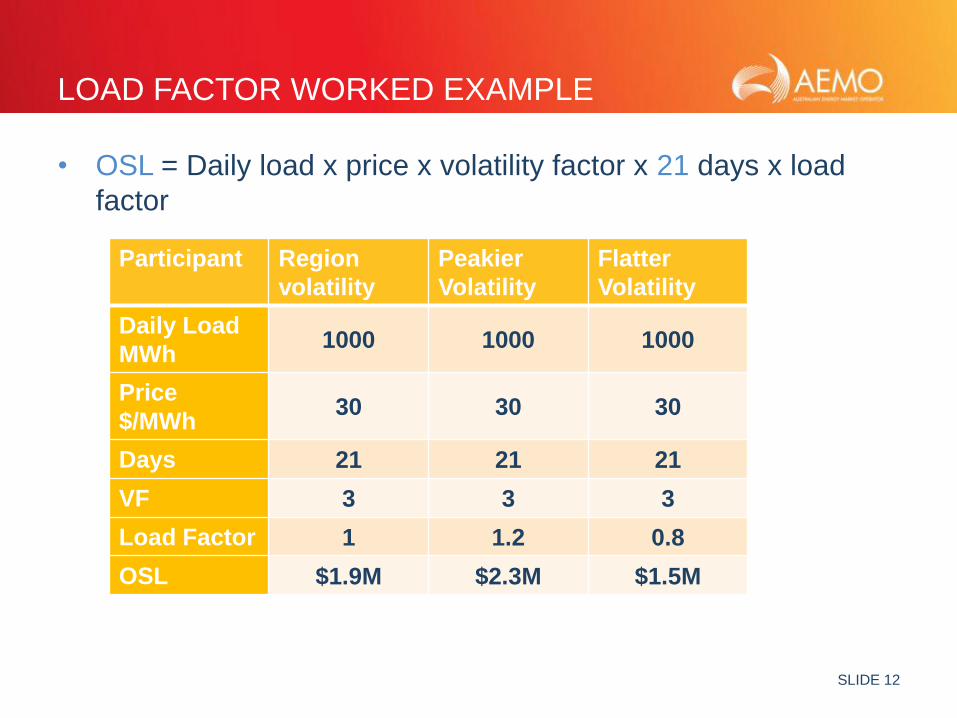
LOAD FACTOR WORKED EXAMPLE
• OSL = Daily load x price x volatility factor x 21 days x load
factor
Participant Region
volatility
Peakier
Volatility
Flatter
Volatility
Daily Load
MWh 1000 1000 1000
Price
$/MWh 30 30 30
Days 21 21 21
VF 3 3 3
Load Factor 1 1.2 0.8
OSL $1.9M $2.3M $1.5M
SLIDE 13
IMPACT OF RULE AND NEW PROCEDURE
• A clear (and previously accepted) target for prudential
surety
• Dramatic changes in credit support lagging a high
outstandings event are avoided.
• Differentiation of more risky profiles
• Provide a driver for managing NEM risk
o Matching load profiles with generation and reallocation
profiles
o Reduce volatility of load

SLIDE 14
Related Documents