Banco de México Documentos de Investigación Banco de México Working Papers N° 2017-21 Prudential Regulation, Currency Mismatches and Exchange Rates in Latin America and the Caribbean December 2017 La serie de Documentos de Investigación del Banco de México divulga resultados preliminares de trabajos de investigación económica realizados en el Banco de México con la finalidad de propiciar el intercambio y debate de ideas. El contenido de los Documentos de Investigación, así como las conclusiones que de ellos se derivan, son responsabilidad exclusiva de los autores y no reflejan necesariamente las del Banco de México. The Working Papers series of Banco de México disseminates preliminary results of economic research conducted at Banco de México in order to promote the exchange and debate of ideas. The views and conclusions presented in the Working Papers are exclusively the responsibility of the authors and do not necessarily reflect those of Banco de México. Martín Tobal Banco de México

Welcome message from author
This document is posted to help you gain knowledge. Please leave a comment to let me know what you think about it! Share it to your friends and learn new things together.
Transcript

Banco de México
Documentos de Investigación
Banco de México
Working Papers
N° 2017-21
Prudential Regulat ion, Currency Mismatches and
Exchange Rates in Latin America and the Caribbean
December 2017
La serie de Documentos de Investigación del Banco de México divulga resultados preliminares de
trabajos de investigación económica realizados en el Banco de México con la finalidad de propiciar elintercambio y debate de ideas. El contenido de los Documentos de Investigación, así como lasconclusiones que de ellos se derivan, son responsabilidad exclusiva de los autores y no reflejannecesariamente las del Banco de México.
The Working Papers series of Banco de México disseminates preliminary results of economicresearch conducted at Banco de México in order to promote the exchange and debate of ideas. Theviews and conclusions presented in the Working Papers are exclusively the responsibility of the authorsand do not necessarily reflect those of Banco de México.
Mart ín TobalBanco de México

Prudent ia l Regulat ion, Currency Mismatches andExchange Rates in Lat in America and the Caribbean*
Abstract: This paper gathers and systemizes self-reported information about exchange rate flexibilityand FX regulation in Latin America and the Caribbean for a period of twenty years beginning in 1992.The results show that, in countries in which the use of limits, liquidity and reserve requirements on FXpositions was more common, the frequency of use of these instruments was particularly high during thetransition towards more flexible exchange rate regimes. The exception refers to economies with a longtradition of financial dollarization in which the prudential policies were more spread out over time,possibly due to countercyclical adjustments of the regulatory instruments. Along these lines, policy-makers reported that the first goal in using the regulation was to reduce currency mismatches, but, in theflexible regimes that were adopted during the 2000s the instruments were also used to dampen volatilityin the exchange rate.Keywords: Prudential Regulation; Exchange Rate Regimes; Foreign Currency PositionsJEL Classification: E58, F31
Resumen: Este documento recaba y sistematiza información auto-reportada sobre flexibilidad deregímenes cambiarios y regulación prudencial en América Latina y el Caribe para un período de veinteaños que comienza en 1992. Los resultados muestran que en aquellas economías en las cuales el uso derequerimientos de reservas y límites a las posiciones en moneda extranjera fue más común, la frecuenciade uso de estos instrumentos fue particularmente elevada durante la transición hacia regímenes de tipode cambio más flexibles. La excepción se refiere a economías con una larga tradición de dolarizaciónfinanciera, en las cuales las políticas prudenciales se encontraron más dispersas en el tiempo,posiblemente debido a ajustes contra-cíclicos en los instrumentos regulatorios. En este sentido, loshacedores de política económica reportaron que el primer objetivo de la regulación fue reducir descalcescambiarios pero que, en los regímenes más flexibles que se adoptaron durante los años 2000, laspolíticas se implementaron también para aminorar volatilidad en el tipo de cambio.Palabras Clave: Políticas Prudenciales; Regímenes Cambiarios; Posiciones en Moneda Extranjera
Documento de Investigación2017-21
Working Paper2017-21
Mart ín Toba l yBanco de México
*Although the survey was run under the auspices of CEMLA, its views do not reflect CEMLA's or Banco deMéxico's opinions. I thank Javier Guzman, Fernando Tenjo, Alessandro Rebucci, Daniel Chiquiar, NicolásMagud, Alberto Ortiz, Gian Maria Milesi-Ferretti, and Alfonso Guerra for support and comments. Above all, Ithank the officials of the central banks that participated actively in this work. y Dirección General de Investigación Económica. Email: [email protected].
1
1. Introduction
The Global Financial Crisis (GFC) has redrawn the attention of policy-makers and the
international community on prudential regulation. In this context, it is frequently argued that
its spirit has changed, that this regulation is currently being used with a new macro-prudential
perspective to contain systemic risk and, through this channel, preserve financial stability
(Terrier et al., 2012). However, little attention has been paid to FX risk. Thus, the present
paper conducts a survey on several dimensions of three regulatory instruments: limits, as well
as liquidity and reserve requirements on FX positions. The survey is conducted across
seventeen central banks from Latin American and the Caribbean and allows investigating
whether the spirit of FX regulation in the private banking sector has changed over time.
The survey contains five sections that study measurement of FX risk, the regulatory
policies used by the Latin American and Caribbean countries to minimize it, and the
flexibility of their exchange rate regimes (for details, see Appendix 1). Using Sections 1 and
3 of this survey, the paper systematizes information on the three regulatory instruments under
consideration and exchange rate regimes. In particular, Section 1 requests policy-makers: i)
To identify the status of the limits, as well as the liquidity and the reserve requirements on
FX positions in 1992; ii) To track all relevant changes implemented from 1992 to 2012, i.e.,
hereafter referred to as policies; iii) To describe the implementation characteristics of the
policies; and iv) To identify their objective in a list of six potential goals.1 Section 3 requests
them to define the exchange rate regimes their central bank adopted from 1992 to 2012.
Interestingly, the fact that the period covered by the survey is 1992-2012 allows me to
perform the investigation in two distinct periods of time: The period preceding the currency
crises of the late 1990s and early 2000s, which were associated with abandonments of fixed
exchange rate regimes, and the period that followed these crises. A potential disadvantage of
the survey is that it does not cover regulatory policies that solely dealt with financial
derivatives markets (see Tobal (In press) for a role of financial derivatives in the region).
1 Refinements and consolidation procedures are not considered as relevant regulatory changes (see Subsection
2.2 for comprehensive explanations of relevant regulatory changes).
2
The study of differences in the number of policies implemented by country and over time
reveals novel facts. Brazil, Colombia, Costa Rica and Peru are the economies that used the
three instruments more intensively over 1992-2012. A common pattern emerges across three
of these economies, in which there was a tendency of the policies to be concentrated over
time. Brazil, Colombia and Costa Rica used the policies more intensively precisely in the
transition towards a more flexible exchange rate regime. This conclusion stands whether the
transition occurred right after the crises of the late 1990s, such as in Brazil and Colombia, or
whether it occurred in the mid-2000s, such as in Costa Rica. Moreover, in Mexico there were
also periods in which the intensity of use of the policies increased. However, unlike in Brazil,
Colombia and Costa Rica, this increase was particularly evident around the time that Mexico
formally adopted its inflation targeting (IT) regime (see Section 3 for further comments).
Turning back to the four economies with the most intensive use, I find that in Peru the
policies were much less concentrated over time than in the remaining countries. Peru is a
highly dollarized economy in which even small fluctuations of the exchange rate have the
potential to create strong balance sheet-effects. In this sense, it could be argued that the lack
of concentration of the policies at a particular moment reflects its attempts to avoid such
fluctuations at different points in time. Indeed, as noted below, this hypothesis is consistent
with self-reported information about the goals of the policies presented in Section 4.
Moreover, one could analyze these results on the frequency of use the instruments from
the perspective of their potential change in spirit. In the post GFC era, it has been accepted
that regulation could be used with a macro-prudential goal, i.e., to contain systemic risk.
Following the FSB, the IMF and the BIS, this risk can be tackled in its cross-sectional or its
time-dimension (FSB, IMF, BIS, 2011). While the former refers to the distribution of risk at
a given point in time, the time-dimension refers to the behavior of system-wide risk over time
and is, therefore, more directly associated with the present paper’s results.
Thus, focusing only on the time-dimension of systemic risk, one could argue that policies
that are more spread out over time, such as those implemented by Peru, are in principle more
consistent with a countercyclical adjustment of the instruments and, therefore, their macro-
prudential use (for macro-prudential use of FX regulation, see Ostry, 2012; Ostry et al.,
2012). Hence, and always considering that the survey does not explicitly ask whether the

3
instruments were used with a macro-prudential goal, the result that in several countries FX
regulation tended to be concentrated at specific moments is consistent with Fernández et al.
(2015). In their seminal work, these authors show that capital controls, i.e., a different forms
of financial regulation, are generally not adjusted in a countercyclical manner.
This paper also presents evidence on common patterns and differences in policy-makers’
concerns and implementation. The most common policy involved a tightening in limits and
requirements rather than a loosening in these instruments. Thus, a common pattern reflects
that, over 1992-2012, FX regulation limited the behavior of banks by imposing additional
constraints on their optimal FX portfolio choice. In this manner, several countries with a long
tradition of financial dollarization tightened the limit on long FX positions, while several of
the remaining ones tightened the limit on short FX position, i.e., in economies with a high
level of financial dollarization, agents tend to hold long FX positions.
In addition, responding to differences in policy-makers’ concerns, countries constrained
different types of FX positions and distinct components of the balance sheet. For instance, a
large amount of the policies taken in Colombia dealt with short-term FX positions, possibly
to avoid maturity mismatches in FX components of the balance sheet. In contrast, a large
amount of the policies taken in Brazil aimed at increasing the overall long FX position of
banks, possibly to correct the short positions held before the unification of its parallel FX
markets in 2005 (see Tobal, 2013).
Furthermore, implementation provides an additional source of heterogeneity across
countries. Thus, even policies that constrained the same relationships in the balance sheet
exhibited substantial differences in terms of implementation characteristics. For example,
while the National Banking and Insurance Commission of Honduras regulated both short and
long FX positions by using one limit for each position type, the Central Bank of Costa Rica
tended to use single limits on open FX positions, i.e., defined as the absolute value of the
difference between FX assets and FX liabilities.
Motivated by this evidence, I study policy-makers’ concerns by using their responses to
the survey. These responses show that reducing currency mismatch was the main goal when
implementing the regulatory instruments under consideration and that achieving exchange
rate stability was the second most important goal. Central banks were also interested in
4
reducing maturity mismatches in FX positions and in reducing financial dollarization to
improve the efficiency of conventional monetary policy and to enhance the central bank’s
power to act as lenders of last resort.
Moreover, two other types of analysis suggest that the instruments under consideration in
this paper may have been implemented with an additional goal. In particular, the historical
analysis undertaken in Section 3, as well as statistics on policy use by exchange rate regimes,
suggests that policy-makers used the policies as a complement to FX controls. In turn, these
controls segment FX markets, frequently creating greater opportunities to benefit from
regulatory arbitrage and generating additional markets to regulate. In turn, these two features
yield further demand for FX regulation and, accordingly, the regulatory instruments
considered in this paper seem to have at least partially satisfied this demand.
Finally, this evidence on policy goals is connected with information on the flexibility of
the exchange rate regimes from the survey and, ultimately, used to investigate the link
between the regulatory instruments, conventional monetary policy and FX market
interventions. In particular, the results suggest that: i) Exchange rate regimes in Latin
America and the Caribbean were effectively more flexible in the 2000s than in the 1990s (I
also check this result using Reinhart and Rogoff’s coarse classification of exchange rate
regimes); ii) The regulatory policies under consideration in this paper were more strongly
motivated by exchange rate stability in the 2000s than in the 1990s; and iii) The higher the
degree of flexibility of an exchange rate regime, the more intensively the limits, as well as
the liquidity and the reserve requirements are used.
The paper is structured as follows. Section 2 presents an overview of the survey,
summarizes the data collection process and presents the final set of countries considered in
the analysis. Section 3 undertakes an historical analysis of the policies implemented in Latin
America and the Caribbean over 1992-2012. Section 4 studies differences in the
implementation characteristics and the theoretical impact of the policies. Section 5 reviews
the literature on potential goals of FX regulation, links these goals with an experience in
Latin America and the Caribbean and presents results on the objectives of the policies.
Finally, Section 6 deals with the interaction between exchange rate flexibility, FX market
interventions, monetary policy and the use of FX regulation, and Section 7 concludes.

5
2. The Survey
2.1. Brief Overview
The survey was run across central banks from Latin and the Caribbean and distributed under
the auspices of the Center for Latin American Monetary Studies (CEMLA). In this regard it
is important to note that, although the central bank of Mexico took an active part in filling
the survey and in providing feedback on its responses, it did not participate in the design of
the survey or of the data collection process. Hence, this bank did not have access to every
piece of collected information, just as any of the other surveyed central banks (for more
information on what central banks did get access to, see Tobal (In press)).
The goal of the survey was twofold. First, it aimed at creating a dataset with comparable
information on FX assets and FX liabilities that would allow undertaking cross-country
comparative studies (a description of this dataset can be found in Tobal (In press)). Second,
the survey aimed at collecting comparable information on financial risks associated with
exchange rate movements, and on the policy responses implemented to mitigate them.
The data collection process comprised two stages that, as explained below, were explicitly
designed to fulfill the goals of the survey. In the first stage, which started in November-
December of 2012, this survey was sent to the heads of the research and the financial stability
departments of every CEMLA’s central bank member. Then, they distributed each question
within their institution so that each question would be answered by the best qualified person
to this end. The second stage of the process comprised a series of contacts made by email or
by phone, as well as personal interactions with officials from the central banks. The feedback
that I obtained in this second stage allowed me to complement the information provided in
the first stage and, therefore, to better understand the context in which policies were taken.
The survey was divided into five sections. Four of these sections covered policies aimed at
mitigating financial risks that arise from movements in the exchange rate, while the
remaining one collected data on FX assets and FX liabilities (for a detailed description of the
survey, see Appendix 1). As noted above, the present paper focuses on the information
collected in Sections 1 and 3, which study prudential policies that regulate FX positions and
exchange rate regimes, respectively.
6
2.2. Data Collection Process
The two stages of the data collection process were designed to ensure that: (i) the collected
data was informative on FX risks and on the policies taken to dampen it; and (ii) I could use
these data to generate information that is comparable across countries. Fulfilling these
conditions required that I specify the set of prudential policies on which the data would be
reported, as well as an exchange rate regime classification that is able to capture all relevant
information provided by the central banks.
2.2.1 Prudential Policies
Defining the set of policies on which the data would be reported brought about important
challenges. On the one hand, this set had to be sufficiently small that the policies thereby
included could be thought of as constraining similar components of the balance sheet and,
ultimately, as having similar economic impacts. Under this condition, policy-makers would
think of a relatively small group of instruments when responding the survey, and this in turn
would facilitate cross-country comparability in the collected data. On the other hand, the set
had to be sufficiently large that the countries would include all instruments that, having
affected similar components of the balance sheet, had been implemented to minimize FX
risks. Under this condition, the data would be comprehensive. Finally, I only considered
policies that, according to the central banks, had had relevant impacts, excluding regulatory
changes associated with consolidation procedures and refinements of existing regulation (see
Appendix 2 for refinements and consolidation procedures).
Joint fulfillment of these conditions was complicated for two reasons. First, defining any
set of policies with common characteristics is difficult because there are numerous
dimensions over which regulatory instruments and their implementation characteristics can
differ. Second, given that countries have different contexts and heterogeneous financial
systems, it is likely that they implement similar regulatory instruments with a different end,
as well as different instruments with a similar end.
In light of this heterogeneity, I decided to count with the two stages of the process to define
the set of policies on which the data would be reported. In the first stage, I requested policy
makers to provide information on a large set of instruments and, in Section1 of the survey,
included a box referred to “Other instruments” used to limit, deter and incentivize any sort

7
of FX position. This ensured that central banks provided information on all instruments they
had used to this end, i.e., and, thus, that the set of policies on which the data would be reported
was sufficiently large. In the second stage the interactions that I maintained with the central
banks allowed better understanding their motivations and, thus, helped me narrow down the
group of instruments under consideration.
To be more precise, in the first stage I requested policy-makers to identify the status of
each instrument in 1992; to track every change they introduced until 2012; to describe their
implementation characteristics and to link each change to one or more objectives in a list of
six potential goals (for this list, see Subsection 4.2). When asking for the data, I considered
a sample that began in June of 1992 and ended in June of 2012, and divided the 20-year
period into 80 quarters. In the first stage, the answers confirmed that countries used
heterogeneous instruments to limit, deter and incentivize FX positions. For instance, Brazil
used reserve requirements on FX positions, Mexico, Chile and Colombia applied liquidity
requirements on them, and Uruguay used deposit insurance premia differentiated by
currency.2
Taking this heterogeneity into account, I used the second stage to narrow down the group
of instruments. I asked policy-makers which of the policies they had mentioned in the first
stage had had relevant impacts according to them, and discarded those policies that were
considered as being non-relevant i.e., policies that induced significant changes in FX
positions were considered as relevant.3 Moreover, given that some of the policies left in the
group were still not sufficiently homogeneous, i.e., the set of policies was still not sufficiently
small, I further cut the sample by imposing an additional condition: I excluded policies that
did not directly affect the two sides of the balance sheet, i.e., FX assets and FX liabilities.
Having imposed all conditions, I came up with a set of policies that included three types
of instruments: direct limits, as well liquidity and reserve requirements. Limits frequently
impose direct constraints on FX positions as a percentage of capital and, thus, significantly
2 Chile and Colombia restricted the difference between short-term FX liabilities and short-term FX assets but
named this instrument as a limit on short current FX positions. However, I refer to them as liquidity
requirements. 3 Whereas I could made that judgement myself, no one was better informed to address this issue than the
officials from the central banks.
8
affect them and consider both sides of the balance sheet. As for the liquidity requirements,
such as those used in Mexico, Chile and Colombia, they restrict the gap between short-term
FX liabilities and short-term FX assets. Moreover, given that they directly constraint the
choice of FX portfolios, their impacts must also be thought of as being relevant. Finally, I
consider reserve requirements on FX positions, which fulfill all conditions mentioned above.
In contrast, some of the policies reported in the first stage were excluded from the final set.
Notably, policies that affected only a single side of the balance sheet, such as the deposit
insurance used by Uruguay or the reserve requirements on FX deposits implemented in Chile,
were not considered. Imposing this condition allowed me to consider policies with an impact
on similar components of the balance sheet at a relatively low costs: it led me to through only
few policies away from the sample, i.e., generating only a small loss of information.
2.2.2 Exchange Rate Regimes
Just as the policies implemented by the Latin American and Caribbean countries differed
over several dimensions, their exchange rate regimes exhibited variability in terms of
flexibility. In turn, this raised the challenge of defining a classification of exchange rate
regimes that could capture the responses of the central banks. On the one hand, the categories
used in this classification had to be sufficiently narrow that they would capture the
heterogeneity contained in these responses. On the other hand, the categories had to be
sufficiently broad that each of them would group a relatively large amount of responses and
I could, thus, make meaningful comparisons both across countries and over time.
Taking this challenge into account, I used the two stages of the process to define the
classification. In the first stage, I requested information on the exchange rate regimes that
central banks had adopted from the second quarter of 1992 to the second quarter of 2012
(hereafter, 1992/Q2 and 2012/Q2, respectively). As expected, the responses referred to
regimes within a wide range of flexibility, going from hard pegs and crawling bands to
managed and fully floating regimes, i.e., see Table 1 for the reported regimes.
In the second stage of the collection process, I used these responses and the interactions
that I maintained with the central banks to define the final classification. In particular, their
feedback allowed me to understand exactly what they meant when referring to a specific
regime. This, in turn, enabled me to group their responses according to the flexibility of their
9
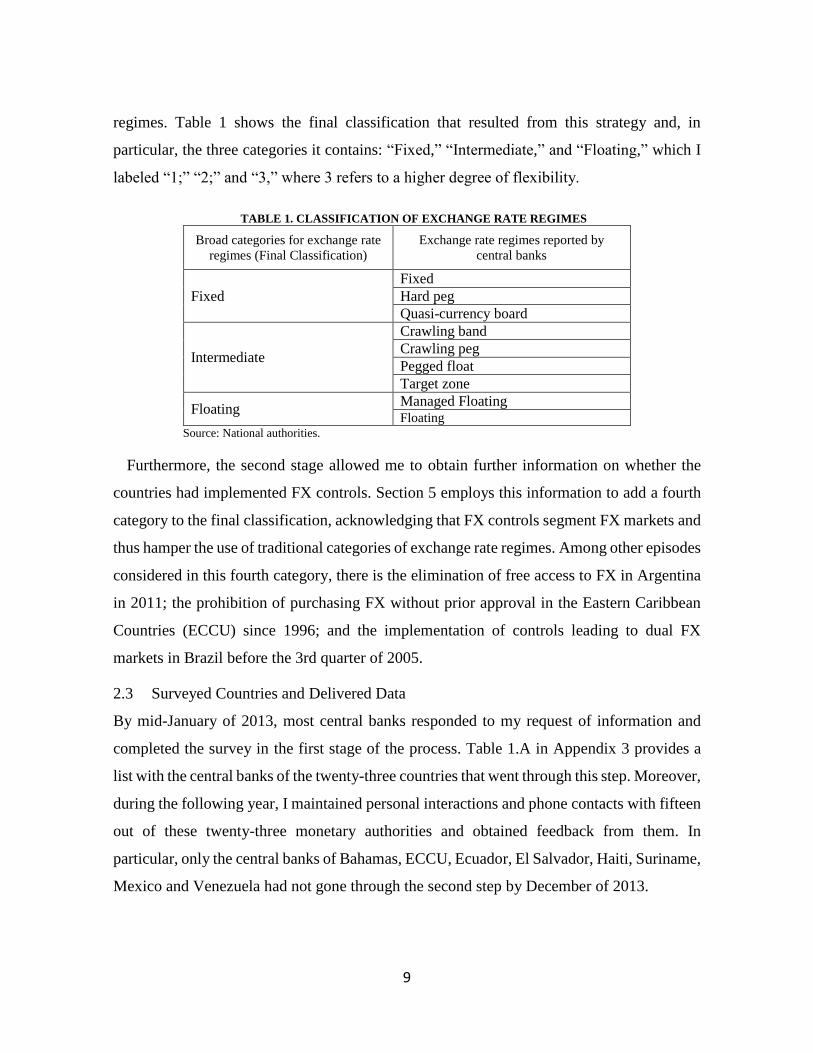
regimes. Table 1 shows the final classification that resulted from this strategy and, in
particular, the three categories it contains: “Fixed,” “Intermediate,” and “Floating,” which I
labeled “1;” “2;” and “3,” where 3 refers to a higher degree of flexibility.
TABLE 1. CLASSIFICATION OF EXCHANGE RATE REGIMES
Broad categories for exchange rate
regimes (Final Classification)
Exchange rate regimes reported by
central banks
Fixed
Fixed
Hard peg
Quasi-currency board
Intermediate
Crawling band
Crawling peg
Pegged float
Target zone
Floating Managed Floating Floating
Source: National authorities.
Furthermore, the second stage allowed me to obtain further information on whether the
countries had implemented FX controls. Section 5 employs this information to add a fourth
category to the final classification, acknowledging that FX controls segment FX markets and
thus hamper the use of traditional categories of exchange rate regimes. Among other episodes
considered in this fourth category, there is the elimination of free access to FX in Argentina
in 2011; the prohibition of purchasing FX without prior approval in the Eastern Caribbean
Countries (ECCU) since 1996; and the implementation of controls leading to dual FX
markets in Brazil before the 3rd quarter of 2005.
2.3 Surveyed Countries and Delivered Data
By mid-January of 2013, most central banks responded to my request of information and
completed the survey in the first stage of the process. Table 1.A in Appendix 3 provides a
list with the central banks of the twenty-three countries that went through this step. Moreover,
during the following year, I maintained personal interactions and phone contacts with fifteen
out of these twenty-three monetary authorities and obtained feedback from them. In
particular, only the central banks of Bahamas, ECCU, Ecuador, El Salvador, Haiti, Suriname,
Mexico and Venezuela had not gone through the second step by December of 2013.
10
However, for different reasons, the information provided by the central banks of ECCU
and Mexico ended up being incorporated in the analysis that I undertake in this paper. In the
case of ECCU, the reason is that in the first stage of the process its central bank provided
information that was sufficiently comprehensive and complete that no additional step was
actually needed. To be more precise, all responses provided by ECCU’s monetary authority
could be easily understood without further information on the economic context, it complied
with the standards initially required in the survey, and it could be easily fit in the set of
prudential policies and classifications of exchange rate regimes defined for the remaining
countries. In the case of Mexico, its central bank provided valuable feedback and interactions
that enabled completion of the second step in 2017.
In contrast with the information delivered by ECCU and Mexico, the information provided
by the remaining central banks considered above, i.e., Bahamas, Ecuador, El Salvador, Haiti,
Suriname, Venezuela, was not incorporated in the analysis. Hence, the final list of countries
considered in the analysis is the following: Argentina, Aruba, Bolivia, Brazil, Chile
Colombia, Costa Rica, Dominican Republic, ECCU, Guatemala, Honduras, Jamaica,
Mexico, Nicaragua, Paraguay, Peru and Uruguay.
3. Historical Perspective
This section reviews the policies implemented over 1992-2012. As noted above, it studies
policies associated with limits, as well as liquidity and reserve requirements on FX positions
taken by the Latin America and the Caribbean countries. In particular, this section deals with
the establishment, the elimination and any change in the level of these limits and
requirements. As in the remaining of the paper, I indistinguishably refer to their
implementation, elimination and to changes in the level of these limits and requirements as
“policies.”
Using these definitions, I study how the number of policies has changed across countries
and over time. This study is motivated by the fact that several countries transitioned towards
exchange rate flexibility after the crises of the late 1990s and early 2000s, enabling me to
distinguish between two meaningful ten-year periods of time. The first period preceded the
currency crises of the early 2000s and was dominated by inflexible regimes (see Frenkel and

11
Rapetti, 2010).4 However, by triggering sudden and large capital outflows, the crises forced
the abandonment of pegs and the transition towards more flexible regimes. Hence, as shown
in Section 5, the second ten-year period of time was dominated by exchange rate flexibility.
Having these two periods in mind is useful when reading the results presented in Table 2.
This table shows that Brazil, Colombia, Costa Rica and Peru are the countries that took
policies the highest number of times. For Brazil, the economy that took the highest number
of measures, the policies were concentrated over two periods of time, between 1993 and 1997
and in 1999. In this regard, it is worth noting that until 2005 Brazil was characterized by FX
controls and the ensuing existence of two FX parallel markets: The free rate foreign exchange
market (MCTL) and the floating rate foreign exchange market (MCTF). In turn, these facts
may explain the increase in the frequency of use of the policies between 1993 and 1997: by
creating two FX parallel markets, and therefore more than a single market to regulate, and
by generating greater opportunities to benefit from regulatory arbitrage, the implementation
of FX controls seems to have increased the need for additional FX regulation in Brazil.
In contrast, the increase in the frequency of use of the policies in 1999 seems to have been
related to the crisis that took place in Brazil during that year and, ultimately, to its transition
towards a more flexible exchange rate regime. Just as in other Latin American and Caribbean
countries, a crisis led Brazil to adopt a more flexible regime in the late 1990s so that,
according to Reinhart and Rogoff’s coarse classification of exchange rate regimes, this
country went from having a category lableed 2 (“Crawling peg/band, band narrower or equal
to +/- 2%”) to a category labeled 3 (“Crawling band, managed floating”) (see Section 6 for
more details about their classification).
In this regard, the case of Colombia, another country that appears in the list of economies
with the highest number of policies, is similar to that of Brazil. Table 2 shows that in
Colombia the year with the highest frequency of use of the policies was 1999, in which a
capital reversal episode generated a crisis and the balance-of-payment collapsed. This crisis
also implied a transition towards a more flexible exchange rate regime and thus, according
4 For the case of Mexico, this country permitted the exchange rate to float within a band which was widened on
a daily basis until December of 1994, right before the crisis broke in.

12
to the Banco de la República, Colombia went from having a regime classified under the
category 2 (“Intermediate”) to a regime classified under the category 3 (“Floating”).
Interestingly, the transition period towards a more flexible exchange rate regime in Costa
Rica is also a period with an increase in the frequency of use of the policies. However, in
contrast with the cases of Brazil and Colombia, this transition did not occur right after the
currency crises of the late 1990s and late 2000s. Costa Rica switched from a crawling peg to
crawling bands at the end of 2006, precisely the beginning of the period in which it took the
bulk of its regulatory measures (see Table 2).5
Along the lines of Brazil, Colombia, and Costa Rica, Mexico featured periods in which the
intensity of use of the policies was particularly high. However, in contrast with these
countries, Mexico featured the most evident increase around the times it formally established
ts IT regime (in 2001) i.e., 2 out of its 4 policies were implemented in that period, while the
remaining ones were implemented before the transition towards a more flexible regime in
1995 and two years afterwards, respectively. In speculating an explanation for this fact, it
cannot go unnoticed that Mexico adopted a pure form of IT in the sense that this monetary
regime weakened the link between the interest and the exchange rates for at least two relevant
reasons: The IT reduced the exchange rate pass-through to domestic currency prices
(Baqueiro et al., 2003; Chiquiar et al., 2010; Capistrán et al., 2012; Cortés Espada, 2013),
and exempted the use of the interest rate to affect exchange rate volatility more than in other
countries, e.g., Brazil (for evidence, see Tobal and Yslas, 2016).6 Given that in the Mexican
IT the interest rate was strongly linked to keeping inflation under control, it is natural to think
that its establishment fostered regulatory measures that are frequently used to dampen FX
risk. This could be the case, for instance, of the tightening in the limit on open FX positions
that the Central Bank of Mexico implemented in the beginning of 2002.
5 Note that, just as Costa Rica, Argentina transitioned towards more exchange rate flexibility during the 2000s,
i.e., in 2002, and took one of its four policies in 2003, i.e., only a few quarters after switching from a fixed
exchange rate to a floating regime. 6 Baqueiro et al. (2003) note that the exchange rate pass-through may have started to fall due to a low and stable
inflation environment over that period. Capistrán et al. (2012) suggest that the Taylor hypothesis (2000) seems
to hold in Mexico given that the change in inflation dynamics documented by Chiquiar et al. (2010) reduced
the level of exchange rate pass-through. Using a SVAR with short run restrictions, Tobal and Yslas (2016)
demonstrate that there is clearer one-to-mapping between the interest and the inflation rate in Mexico than in
Brazil and speculate that this could be due to different models of FX interventions.

13
Turning back to the four economies with the highest number of policies, note in Table 2
that the case of Peru differs from those of Brazil, Colombia and Costa Rica because its
policies did not have a tendency to be concentrated over time. Thus, this country did not
exhibit an increase in the intensity of use the policies that could be associated with its
transition of exchange rate regimes. In attempting to understand this fact, note that Peru is a
highly dollarized economy in which even small fluctuations of the exchange rate could
generate strong balance sheet-effects. In this sense, the lack of concentration could reflect its
attempts to avoid such fluctuations at different points in time. Indeed, this hypothesis is
consistent with the self-reported information on the policy goals presented in Section 4.
Moreover, one could analyze these results on the frequency of use the instruments from
the perspective of their potential change in spirit. In the post GFC era, it has been accepted
that regulation could be used with a macro-prudential goal, i.e., to contain systemic risk.
Following the FSB, the IMF and the BIS, this risk can be tackled in its cross-sectional or its
time-dimension (FSB, IMF, BIS, 2011). While the former refers to the distribution of risk at
a given point in time, the time-dimension refers to the behavior of system-wide risk over time
and is, therefore, more directly associated with the paper’s results.
Thus, focusing only on the time-dimension of systemic risk, one could argue that policies
that are more spread out over time, such as those implemented by Peru, are in principle more
consistent with a countercyclical adjustment of the instruments and, hence, their macro-
prudential use (for macro-prudential use of FX regulation, see Ostry, 2012; Ostry et al.,
2012). Thus, and always considering that the survey does not explicitly ask whether the
instruments were used with a macro-prudential goal, the result that FX regulation tended to
be concentrated in several countries is consistent with the findings of Fernández et al. (2015).
In their seminal work, these authors show that capital controls, i.e., a different forms of
financial regulation, are generally not adjusted in a countercyclical manner.

14
TABLE 2. NUMBER OF POLICIES / 1, 2
Country-year 1992 1993 1994 1995 1996 1997 1998 1999 2000 2001 2002 2003 2004 2005 2006 2007 2008 2009 2010 2011 2012 Total
ARG 1 1 1 1 4
ARU 1 1
BOL 1 1 1 3
BRA 1 2 2 1 2 1 1 10
CHI 1 1
COL 3 1 1 5
CRC 1 1 2 1 5
DOM 0
ECCU 0
GUA 1 1 2
HON 1 1 2 4
JAM 0
MEX 1 1 1 1 4
NIC 0
PAR 1 1 1 3
PER 1 1 1 2 5
URU 0
Total 1 1 3 3 1 4 1 6 2 2 1 1 3 4 3 3 4 1 2 1 0 46
Source: National Authorities.
/1 This table shows the establishment, elimination or any change in the level of limits, as well as liquidity and reserve requirements on FX positions, to which I indistinguishably
refer to “policies.” It includes policies that are considered as relevant regulatory changes and that directly affect both the liability and asset side of the FX balance sheet are
considered (for details, see Subsection 2.2). Policies taken within the same quarter are considered as the same policy.
/2 Notes: ARG (Argentina); ARU (Aruba); BOL (Bolivia); BRA (Brazil); CHI (Chile); COL (Colombia); CRC (Costa Rica); DOM (Dominican Republic); ECCU (Eastern
Caribbean Countries); GUA (Guatemala); HON (Honduras); JAM (Jamaica); MEX (Mexico); NIC (Nicaragua); PAR (Paraguay); PER (Peru) and URU (Uruguay)

15
4. Implementation Characteristics
In spite of the fact that the Latin America and Caribbean countries share threats common
arising from FX risk, their financial systems are heterogeneous. In turn, this heterogeneity
justifies a more detailed investigation of the policy experiences mentioned in Section 3. In
this context, the present section undertakes a cross-country study of differences in terms of
the implementation characteristics of the policies.
Just as in the rest of the paper, in this section I indistinguishably refer to the establishment,
the elimination or to any change in limits, liquidity and reserve requirements as “policies.”
Moreover, I classify these policies according to two different criteria: i) The type and amount
of relations they constrain in the balance sheet; and ii) Their impact on long FX positions and
on their volatility. In thinking about this impact, I simply assume that the policies either
directly constraint the behavior of banks or modify their incentives in choosing their optimal
FX portfolio. Thus, for instance, an increase in the limit on long FX positions will always be
assumed to increase them. Whereas the first criterion refers to technical characteristics of the
implementation, the second criterion is related to the economic impact of the policies.
Using as a criterion the type and amount of relations they constrain in the balance sheet, I
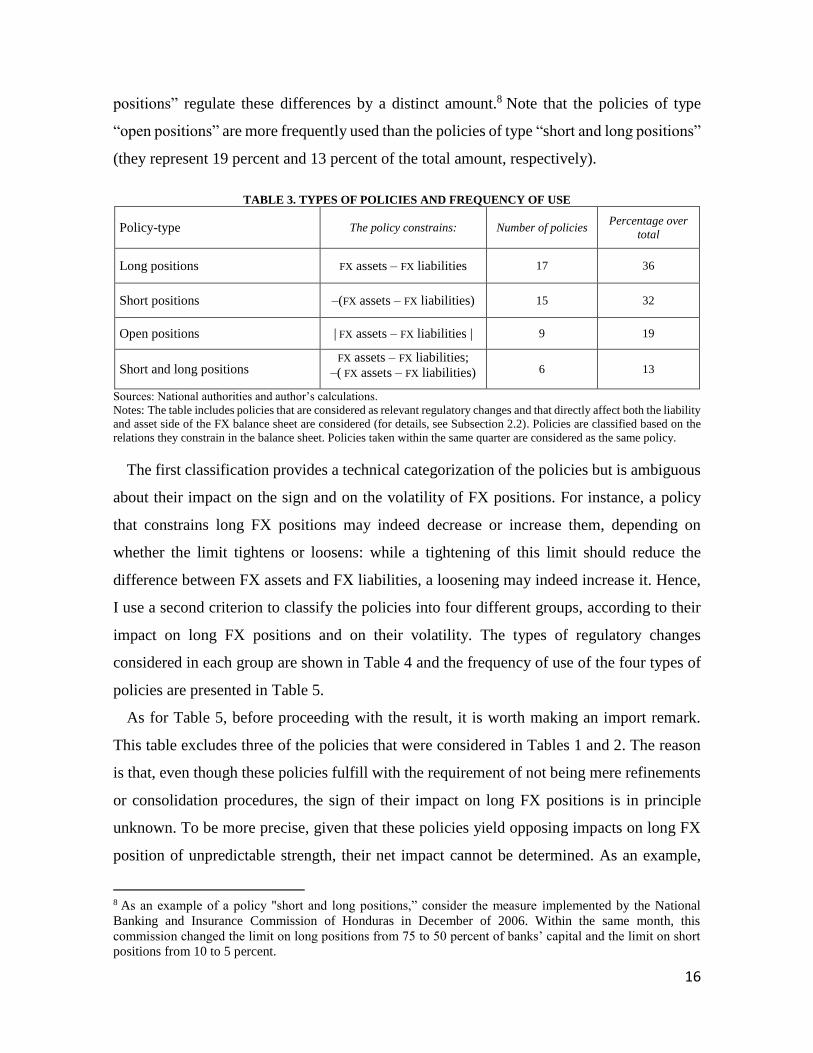
classify the policies into the four groups depicted in Table 3.7 The label “long positions” in
this table refers to policies that regulate long FX positions, i.e., the difference between FX
assets and FX liabilities. Table 3 shows that this type of policy was the most frequently used
by the Latin American and Caribbean economies in the sample over the period 1992/Q2-
2012/Q2 (they represent 36 percent of the total amount of measures).
The second type of policy that was most frequently used considers policies that regulate
short FX positions, that is, the negative difference between FX assets and FX liabilities and
is accordingly labeled “short positions,” i.e., this type represents 32 percent of the total
amount of measures taken over 1992/Q2-2012/Q2. The remaining types of policy in Table 3
constrain both the positive and the negative differences between FX assets and FX liabilities
at the same time. While the policies labeled “open positions” regulate the two differences by
the same amount through limits on their absolute value, the policies labeled “short and long
7 Consider a country that establishes a limit on short and long positions and years later changes only the former
limit. In this case, I compute a policy of type “short and long positions” and a policy of type “short positions.”
16
positions” regulate these differences by a distinct amount.8 Note that the policies of type
“open positions” are more frequently used than the policies of type “short and long positions”
(they represent 19 percent and 13 percent of the total amount, respectively).
TABLE 3. TYPES OF POLICIES AND FREQUENCY OF USE
Policy-type The policy constrains: Number of policies Percentage over
total
Long positions FX assets – FX liabilities 17 36
Short positions –(FX assets – FX liabilities) 15 32
Open positions | FX assets – FX liabilities | 9 19
Short and long positions FX assets – FX liabilities;
–( FX assets – FX liabilities) 6 13
Sources: National authorities and author’s calculations.
Notes: The table includes policies that are considered as relevant regulatory changes and that directly affect both the liability
and asset side of the FX balance sheet are considered (for details, see Subsection 2.2). Policies are classified based on the
relations they constrain in the balance sheet. Policies taken within the same quarter are considered as the same policy.
The first classification provides a technical categorization of the policies but is ambiguous
about their impact on the sign and on the volatility of FX positions. For instance, a policy
that constrains long FX positions may indeed decrease or increase them, depending on
whether the limit tightens or loosens: while a tightening of this limit should reduce the
difference between FX assets and FX liabilities, a loosening may indeed increase it. Hence,
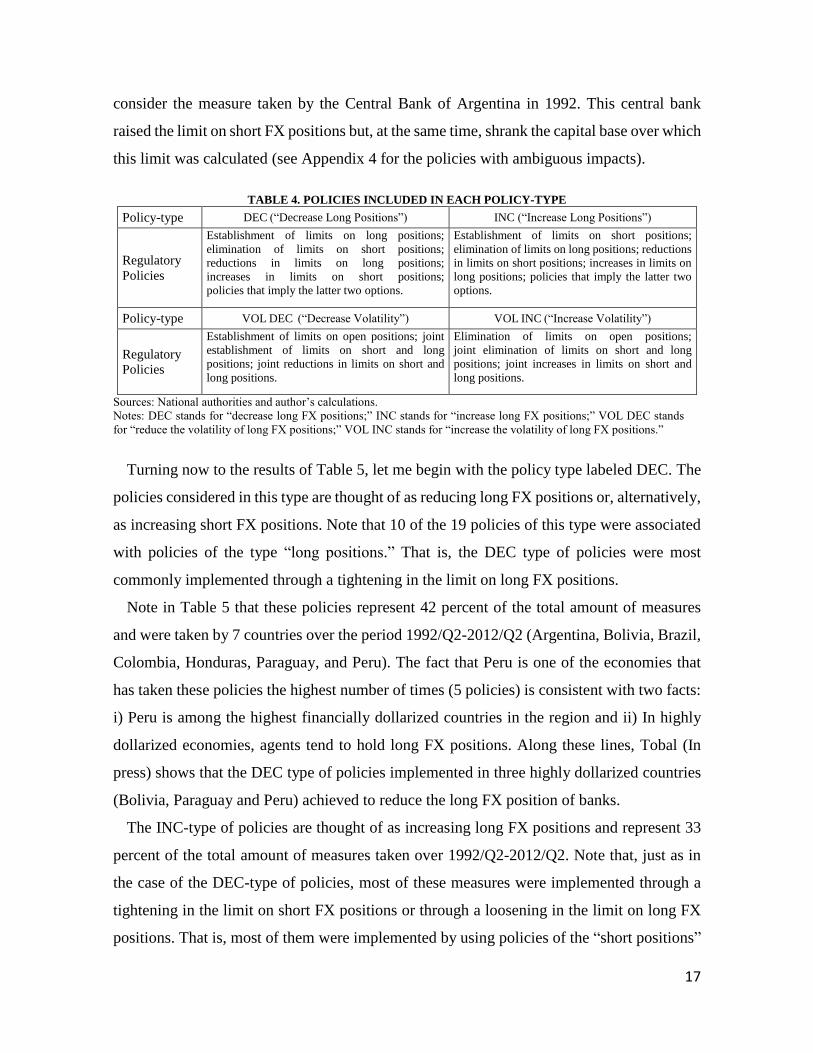
I use a second criterion to classify the policies into four different groups, according to their
impact on long FX positions and on their volatility. The types of regulatory changes
considered in each group are shown in Table 4 and the frequency of use of the four types of
policies are presented in Table 5.
As for Table 5, before proceeding with the result, it is worth making an import remark.
This table excludes three of the policies that were considered in Tables 1 and 2. The reason
is that, even though these policies fulfill with the requirement of not being mere refinements
or consolidation procedures, the sign of their impact on long FX positions is in principle
unknown. To be more precise, given that these policies yield opposing impacts on long FX
position of unpredictable strength, their net impact cannot be determined. As an example,
8 As an example of a policy "short and long positions,” consider the measure implemented by the National
Banking and Insurance Commission of Honduras in December of 2006. Within the same month, this
commission changed the limit on long positions from 75 to 50 percent of banks’ capital and the limit on short
positions from 10 to 5 percent.
17
consider the measure taken by the Central Bank of Argentina in 1992. This central bank
raised the limit on short FX positions but, at the same time, shrank the capital base over which
this limit was calculated (see Appendix 4 for the policies with ambiguous impacts).
TABLE 4. POLICIES INCLUDED IN EACH POLICY-TYPE
Policy-type DEC (“Decrease Long Positions”) INC (“Increase Long Positions”)
Regulatory
Policies
Establishment of limits on long positions;
elimination of limits on short positions;
reductions in limits on long positions;
increases in limits on short positions;
policies that imply the latter two options.
Establishment of limits on short positions;
elimination of limits on long positions; reductions
in limits on short positions; increases in limits on
long positions; policies that imply the latter two
options.
Policy-type VOL DEC (“Decrease Volatility”) VOL INC (“Increase Volatility”)
Regulatory
Policies
Establishment of limits on open positions; joint
establishment of limits on short and long
positions; joint reductions in limits on short and
long positions.
Elimination of limits on open positions;
joint elimination of limits on short and long
positions; joint increases in limits on short and
long positions.
Sources: National authorities and author’s calculations.
Notes: DEC stands for “decrease long FX positions;” INC stands for “increase long FX positions;” VOL DEC stands
for “reduce the volatility of long FX positions;” VOL INC stands for “increase the volatility of long FX positions.”
Turning now to the results of Table 5, let me begin with the policy type labeled DEC. The
policies considered in this type are thought of as reducing long FX positions or, alternatively,
as increasing short FX positions. Note that 10 of the 19 policies of this type were associated
with policies of the type “long positions.” That is, the DEC type of policies were most
commonly implemented through a tightening in the limit on long FX positions.
Note in Table 5 that these policies represent 42 percent of the total amount of measures
and were taken by 7 countries over the period 1992/Q2-2012/Q2 (Argentina, Bolivia, Brazil,
Colombia, Honduras, Paraguay, and Peru). The fact that Peru is one of the economies that
has taken these policies the highest number of times (5 policies) is consistent with two facts:
i) Peru is among the highest financially dollarized countries in the region and ii) In highly
dollarized economies, agents tend to hold long FX positions. Along these lines, Tobal (In
press) shows that the DEC type of policies implemented in three highly dollarized countries
(Bolivia, Paraguay and Peru) achieved to reduce the long FX position of banks.
The INC-type of policies are thought of as increasing long FX positions and represent 33
percent of the total amount of measures taken over 1992/Q2-2012/Q2. Note that, just as in
the case of the DEC-type of policies, most of these measures were implemented through a
tightening in the limit on short FX positions or through a loosening in the limit on long FX
positions. That is, most of them were implemented by using policies of the “short positions”

18
type or of the “long positions” type. Brazil is the country that used these policies the highest
number of times (5 policies). This is consistent with the evidence provided by Tobal (2013),
according to which banks in Brazil held shorter FX positions than in the remaining countries
over the period preceding 2005, at the time its two parallel FX markets were unified.
TABLE 5. TWO-WAY CLASIFICATION AND FREQUENCY OF USE
Impact on: Long FX Positions Volatility of FX positions
Relation
constrained in
balance sheet
DEC INC VOL DEC VOL INC
Long positions 10 7 0 0
Short positions 6 7 0 0
Open positions 0 0 3 6
Short and long positions 3 1 2 0
Total 19 15 5 6
Percentage 42% 33% 11% 13%
Country with larger use Peru/1 Brazil Mexico/2 Costa Rica
Sources: National authorities and author’s calculations.
Notes: DEC stands for “decrease long FX positions;” INC stands for “increase long FX positions;” VOL DEC stands for
“reduce the volatility of long FX positions;” VOL INC stands for “increase the volatility of long FX positions.” The table
includes policies that are considered as relevant regulatory changes and that directly affect both the liability and asset sides
of the FX balance sheet (for details, see Subsection 2.2). Policies taken within the same quarter are considered as the same
policy. Moreover, three of the policies included in Tables 1 and 2 are not considered in this table because, even though
they could have had a relevant economic impact, the direction of this impact is in principle ambiguous; i.e., whether the
policy increased or reduced long FX positions depends on the magnitude of opposing impacts (see Appendix 4). /1 Brazil
has taken policies of type DEC the same number of times as Peru. 2/ Bolivia, Costa Rica, Guatemala and Honduras have
taken policies of type VOL DEC the same number of times as Mexico.
The remaining two types of policies regulate both the excess of FX assets over FX
liabilities and viceversa at the same time, having an impact on the volatility of FX positions.
The VOL DEC type of policies reduce this volatility and was implemented by eliminating or
reducing the limit on open FX positions and by jointly tightening the limits on both the short
and the long positions of banks (3 and 2 times, respectively). They represent 11 percent of
the total amount of policies and were taken by 5 countries over 1992/Q2-2012/Q2 (Bolivia,
Guatemala, Costa Rica, Honduras and Mexico). For instance, in the aftermath of the formal
adoption of an inflation targeting regime, in the beginning of 2002, Mexico tightened the
limit on open FX positions (for the context in which the policy was taken, see Section 3).9
9 As a reference, see Section M.6 Posiciones del Mercado de Divisas of Circular 2008/94 and Section M.61
Posiciones de Riesgo Cambiario of Circular-Telefax 7/2002. These circulars are publicly available at
http://www.banxico.org.mx/disposiciones/normativa/normativa-vigente-agrupada-po.html.
19
Finally, the VOL INC type of policies increases the volatility of FX positions and were
implemented only through increases in the limit on open FX positions (The 6 measures
implied policies of the type “open positions”). Almost all the policies were implemented by
Costa Rica. Beginning in 2006, when this country transitioned towards a more flexible
exchange rate regime, the Central Bank of Costa Rica adopted a series of related policies;
i.e., it started to gradually increase the limit on the variation of daily FX positions.
5. Potential and Actual Uses of the Policies
This section studies potential and actual goals of the policies under study. The first subsection
performs a literature review on potential goals of the regulatory policies. The second
subsection links these potential goals to policy-makers’ responses in the survey and,
ultimately, to an experience in the Latin American and Caribbean countries.
5.1. Potential Uses of Limits
The literature acknowledges that policy-makers may have at least the following five potential
goals when implementing the policies under study in this paper.
1. Reducing Solvency Problems.
In the presence of open FX positions, adjustments in the exchange rate modify the value of
net FX assets, i.e., or net FX liabilities, and this may trigger negative effects on banks’
balance sheets. In turn, these effects may risk banks’ solvency by undermining their capacity
to meet FX obligations. Thus, by reducing open FX positions, the instruments under study
may help diminish solvency problems in the banking sector, and dampen non-repayment
risks (Hartmann, 1994; Goldstein and Turner, 2004; Zettelmeyer et. al., 2011 Lee, 2012).
2. Reducing FX Liquidity Risks.
Even when banks’ total FX assets and FX liabilities are matched, they may be exposed to FX
liquidity risks. In particular, banks may fund long-term FX assets with short-term FX
liabilities. In this context, the policies considered in the present paper can be specifically
designed to account for the maturity of assets and liabilities and, therefore, to dampen
liquidity risks (Goldstein and Turner, 2004; Lee, 2012).
3. Avoiding Large and Sudden Fluctuations in the Exchange Rate.
Policies that constrain FX positions and/or modify incentives to take them restrict bank’s
purchases and sales of FX assets and FX liabilities and, though this channel, affect FX market

20
conditions. Therefore, central banks and financial supervisors can constrain the short or the
long FX positions of banks to alter the supply of and demand for foreign currency and,
through this channel, enhance exchange rate stability (Canales-Kriljenko and Habermeier,
2004; Lee, 2012; Rodriguez and Wu, 2013).
4. Encouraging De-Dollarization to Improve the Transmission Mechanism of
Monetary Policy.
The greater the degree of financial dollarization is, the more difficult it becomes for monetary
authorities to affect domestic liquidity conditions by means of conventional monetary policy
(Ize and Levy-Yeyati, 2003; Rennhack and Nozaki, 2006). Thus, by deterring financial
dollarization, policies that constrain FX positions or alter incentives to take them may help
central banks improve the transmission mechanisms of conventional monetary policy.
5. Encouraging De-Dollarization to Recover the Role of Lender of Last Resort.
Financial dollarization dampens the capacity of central banks to counteract banking
difficulties by using lender-of-last-resort financing activities. In this context, by diminishing
the degree of financial dollarization, the regulatory instruments considered in the present
paper may help monetary authorities recover their role as a lender of last-resort and, through
this channel, enhance financial stability in times of stress (Rennhack and Nozaki, 2006).
5.2. Actual Uses of Limits on Foreign Currency Positions
In the survey, central banks were asked what goals they pursued when implementing the
policies. In particular, they were asked to associate each of the policies with one or more of
the objectives included within the following list of six possible actual goals: 1) Controlling
Credit Growth; 2) Achieving Exchange Rate Stability; 3) Reducing Currency Mismatches;
4) Reducing Maturity Mismatches in Foreign Currency Positions; 5) Correcting Current
Account Imbalances and 6) Others. Moreover, they were requested to specify which goals
they pursued when choosing the option “Other.”
Eight out of the twelve countries having taken policies over 1992/Q2-2012/Q2 answered
to this question. In recording these answers, I proceeded in the following manner: for each
policy, I assigned a value equal to 1 to the goal or to the goals that policy-makers mentioned
in their responses and a value equal to 0 to those that they did not. Then, I took the mean
across all policies corresponding to the same country and obtained a mean per country-goal

21
pair that I displayed in Table 6. Finally, I took the cross-country average of all means
associated with the same goal and displayed the results in the last row of this table.
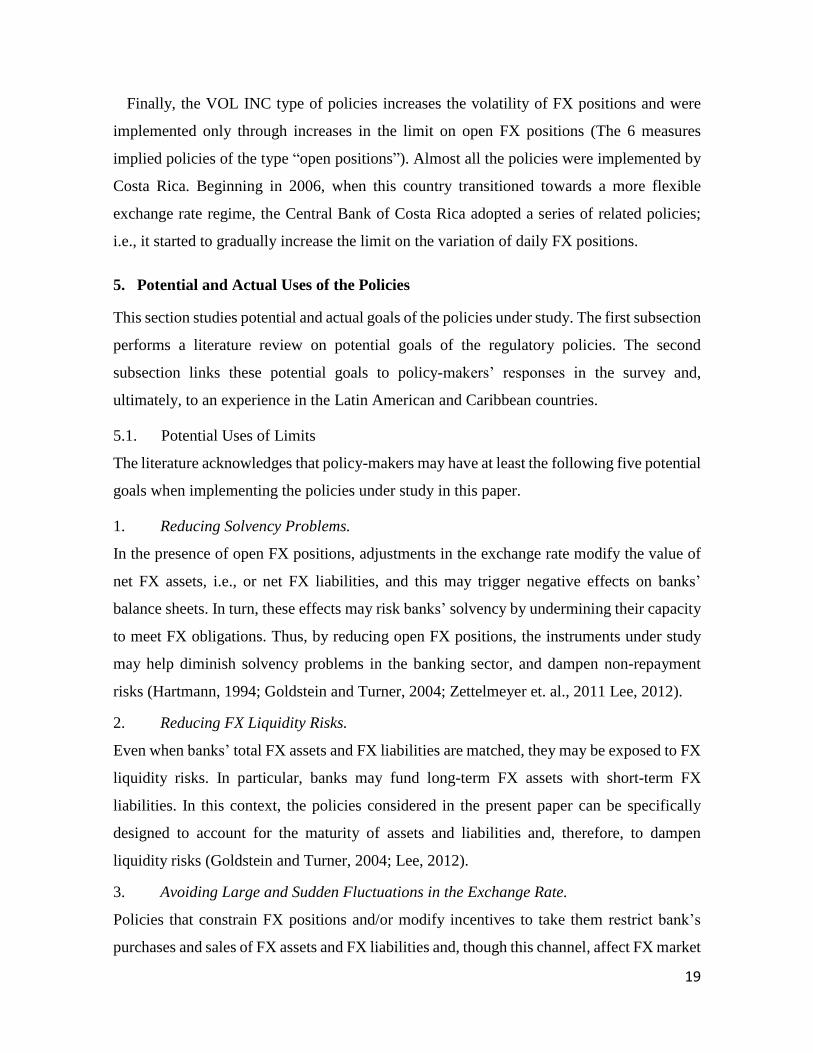
Regarding this table, note in the second column that “Reducing Currency Mismatches”
was the main purpose when establishing, eliminating or changing limits, as well as liquidity
and reserve requirements on FX positions: policy-makers mentioned this goal on average 51
percent of the times. Argentina, Honduras and Bolivia are the economies that more
intensively pursued this objective; moreover, the former two countries implemented these
regulatory measures exclusively to achieve this goal. Thus, for instance, the Central Bank of
Argentina eliminated the limits on long FX positions in 2005. In contrast, Bolivia
implemented the policies to reduce currency mismatches only 60 percent of the times. Note
that to the extent that “Reducing Currency Mismatches” was considered by the policy-makers
as one of their objectives when implementing the policies it can be considered as an “actual
goal.” Moreover, as for its connection with the list given in Subsection 5.1, “Reducing
Currency Mismatches” most closely relates to the potential goal number 1, i.e., “Reducing
Solvency Problems.”
The second most important purpose when implementing the policies was “Achieving
Exchange Rate Stability,” as evidenced by the third column in Table 6. Policy-makers
pursued this objective on average 36 percent of the times, with Aruba, Costa Rica, Paraguay
and Peru being the countries that more intensively pursued this objective. As noted above,
Peru, a financially dollarized economy whose policies are spread out over time, appears in
this list. In terms of the goals of Subsection 5.1, the actual objective “Achieving Exchange
Rate Stability” most closely resembles the potential goal number 3: “Avoiding Large and
Sudden Fluctuations in the Exchange Rate.” Therefore, the experience of Paraguay in 1997
illustrates the pursuit of this goal. After a period of relative stability, the Guarani depreciated
by 5.4 percent in December of 1997 and, in response, the Central Bank of Paraguay reduced
the limits on long FX positions from 100 to 50 percent of banks’ effective patrimony.
The fourth column in Table 6 shows that the third goal that I proposed to policy-makers,
“Controlling Credit Growth,” was not pursued any of the times, as it was not the goal of
“Correcting Current Account Imbalances” (see the sixth column in Table 6). In contrast, the
objective “Reducing Maturity Mismatches in FX Positions” was mentioned on average 6
22
percent of the times. In terms of the list of Subsection 5.1, “Reducing Maturity Mismatches
in FX Positions” most likely resembles the goal “Reducing FX Liquidity Risks.”
TABLE 6. POLICY GOALS
COUNTRY
GOALS
Reducing
currency
mismatches
Achieving
exchange rate
stability
Controlling
credit growth
Reducing maturity
mismatches in FX
positions
Correcting
current account
imbalances
Others
ARG 100% 0% 0% 0% 0% 0%
ARU 0% 100% 0% 0% 0% 0%
BOL 60% 0% 0% 0% 0% 40%
BRA NA NA NA NA NA NA
CHI NA NA NA NA NA NA
COL 56% 0% 0% 44% 0% 0%
CRC 17% 67% 0% 0% 0% 17%
DOM _ _ _ _ _ _
ECCU _ _ _ _ _ _
GUA NA NA NA NA NA NA
HON 100% 0% 0% 0% 0% 0%
JAM _ _ _ _ _ _
MEX NA NA NA NA NA NA
NIC _ _ _ _ _ _
PAR 25% 75% 0% 0% 0% 0%
PER 50% 50% 0% 0% 0% 0%
URU _ _ _ _ _ _
AVERAGE 51% 36% 0% 6% 0% 7%
Sources: National authorities and author’s calculations.
Notes: The table includes policies that are considered as relevant regulatory changes and that directly affect both the liability
and asset sides of the FX balance sheet (for details, see Subsection 2.2). Policies taken within the same quarter are considered
as the same policy. For each policy, I assigned a value equal to 1 to the goal or to the goals that policy-makers mentioned
in their responses and a value equal to 0 to those that they did not. Then, I took the mean across all policies corresponding
to the same country and obtained a mean per country-goal pair. ARG (Argentina); ARU (Aruba); BOL (Bolivia); BRA
(Brazil); CHI (Chile); COL (Colombia); CRC (Costa Rica); DOM (Dominican Republic); ECCU (Eastern Caribbean
Countries); GUA (Guatemala); HON (Honduras); JAM (Jamaica); MEX (Mexico); NIC (Nicaragua); PAR (Paraguay); PER
(Peru) and URU (Uruguay)
Among the central banks that provided information on their goals, Banco de la República,
Colombia, was the only having mentioned “Reducing Maturity Mismatches in FX Positions.”
However, research by other central banks seems to suggest that they may have also attempted
23
to reduce maturity mismatches in FX positions. For instance, O’Dogherty and Schwartz
(2001) argue that the establishment of liquidity requirements on FX operations by the Central
Bank of Mexico in 1997 attempted to strengthen the liquidity position of banks by compelling
them to maintain adequate liquid assets and by promoting long-term FX financing.10
Finally, the seventh column labeled “Others” considers the answers provided by the
Central Bank of Bolivia. This central bank claimed to have implemented policies to reduce
banks’ FX positions and referred to this goal as “remonetization of the banking system.”
According to the monetary authority, the goals of this remonetization process were primarily
three a) to improve the efficiency of the central bank as a lender of last resort and b) to
promote financial stability by reducing currency mismatches; c) to facilitate the conduct of
monetary policy. In terms of the list of potential goals in 5.1, these goals resemble the most
the objectives of “Encouraging De-Dollarization to Improve the Transmission Mechanism of
Monetary Policy;” “Encouraging De-Dollarization to Recover the Role of Lender of Last
Resort;” and “Reducing Solvency Risks.”
6. Advantages and Disadvantages of the Regulatory Policies: Interaction with
Conventional Monetary Policy and FX Market Interventions
This section studies advantages and disadvantages of using the three regulatory instruments
under consideration, with a focus on their interaction with conventional monetary policy, FX
market interventions and exchange rate flexibility. The first subsection reviews the literature
on potential advantages and disadvantages. The second subsection uses the information
contained in the survey to investigate the relationship between the policies and exchange rate
flexibility in Latin America and the Caribbean.
6.1. Potential Advantages, Disadvantages and Interactions
When referring to the potential advantages of using limits, or liquidity and reserve
requirements on FX positions, the literature mentions at least the following three items:
1. Substituting for Conventional Monetary Policy in Dampening Imbalances
To dampen the build-up of financial imbalances, such as excessive leverage or maturity
mismatches, central banks could tighten monetary conditions. In contrast, they could use any
10 On the basis of its implementation characteristics, one could argue that the limits differentiated by the
maturity of FX positions put in place by Chile in 1999 may have been implemented with the same goal.
24
of the three regulatory instruments considered in this paper. These instrument have the
advantage that they can be tailored to dampen risks of specific sectors or loan portfolios
without causing a generalized reduction of economic activity (Lim et al., 2011).
2. Substituting for Conventional Monetary Policy in Curbing Credit
In countries with inflation targeting, the policy rate is tied up with anchoring expectations on
future inflation (Park, 2011). In this context, and particularly in financially dollarized
economies in which credit is granted in foreign currency and/or their expansions are largely
financed with foreign financial resources, the three regulatory instruments considered in this
paper can serve at curbing its pro-cyclical behaviour freeing the interest rate to anchor
inflation expectations.
3. Substituting for FX Market Interventions in Avoiding Large and Frequent
Fluctuations in the Exchange Rate
When performing sterilized FX market interventions to mitigate currency appreciations,
central banks purchase foreign currency with domestic currency and, then, withdraw the
excess liquidity by selling government securities This entails costs because the monetary
authority acquires relatively low-yield foreign exchange reserves and issue relatively high-
yield sterilization bonds, and these costs for them rise over time. In fact, the rise in the relative
supply of government bonds could lead to a rise in domestic interest rates, potentially
inducing further capital inflows and appreciation pressures, magnifying the initial impact
(Reinhart and Reinhart, 1998; Magud et. al., 2011). In this context, the regulation studied in
this paper could replace FX market interventions in the pursuit of exchange rate stability.
Regarding the potential disadvantages of the regulatory instruments under consideration, the
literature mentions at least the following three items.
1. Conflict of Goals with Exchange Rate Target.
There could exist a fundamental goal conflict between the implementation of prudential FX
regulations and certain exchange policies. If, for example, domestic currency depreciation is
more likely than appreciation, then prudential considerations require limiting the short FX
position of banks. However, this strategy gives them more scope to sell the domestic
currency, possibly implying depreciation pressures on the former (Hartmann, 1994).
25
2. Limiting the Development of FX Markets and Dampening Economic Growth.
By constraining economic agents’ activities, prudential regulations may hamper the
development of FX markets. For instance, limits on FX positions increase the costs of holding
FX assets and FX liabilities, discouraging their acquisition and/or their maintenance in the
balance sheet. This, in turn, could diminish the supply of FX credit and dry-up liquidity in
FX markets, thereby preventing its development and, through this channel, dampening
economic growth. In the long run, however, limits on FX positions could have benefits. By
making the financial sector more resilient, limits could provide FX markets with a sounder
ground for its development and therefore promote economic growth (Ranciere et. al., 2010).
3. Distorting Resource Allocation.
Compliance with FX regulation may induce disproportionately large FX lending to those
with revenues denominated in foreign currency, among which firms in the tradable sector
stand out. Under these circumstances, regulation could exclude customers whose income is
denominated in local currency from FX borrowing. This, in turn, may distort resource
allocation and retard the development of the non-tradable sector (Park, 2011).
6.2. Regulatory Instruments and Exchange Rate Regimes
Motivated by the historical analysis, this subsection uses the survey and Reinhart and
Rogoff’s classification of exchange rate regimes to validate the statement that several Latin
American and Caribbean countries transitioned towards exchange rate flexibility. Moreover,
using the results, it explores the relationship of limits, as well as reserve and liquidity
requirements with other policies by investigating whether they were more intensively used
over the last ten years of the sample period, when countries adopted flexible regimes.
The classification of exchange rate regimes that resulted from the survey contains the three
categories mentioned in Section 3: “Fixed,” “Intermediate,” and “Floating.” I also consider
an extension with the additional category for FX controls. Regarding Reinhart and Rogoff’s
classification, I retrieved monthly data until 2010 from Professor Reinhart’s webpage
(http://www.carmenreinhart.com/data/browse-by-topic/). Thus, I transformed this monthly
classification into a quarterly one by assigning to each quarter the regime that was in place
for a higher number of months.11 Their classification features the following six categories:
11 Only a few quarters had months with two regimes, and there was no quarter with more than two regimes.
26
“Peg;” “Crawling Peg/Band, Band Narrower or Equal to +/- 2%;” “Crawling Band, Managed
Floating;” “Freely Floating;” “Freely Falling” and “Dual Parallel Markets.”
Using the survey, Tables 7 calculates the percentage of quarters with “Floating” regimes
in the two periods (1992-2001 and 2002-2012). Table 8 repeats the exercise but reclasifying
some quarters as FX controls.12 Tables 9 and 10 perform the same exercises as Table 7 and
8 by considering as “floating” the regimes “Crawling Band and Managed Floating Regimes”
in Reinhart and Rogoff’s classification.13 Table 9 includes the quarters classified as “Freely
Falling” and Table 10 excludes this group (no quarters is classified as “Dual Parallel
Markets”). Note that in all tables the percentage of quarters with flexible exchange rate
regimes is greater in 2002-2012 than in 1992-2001. In turn, this suggests that there was a
tendency to transition towards exchage rate flexibility, as speculated above.
Having established differences in exchange rate flexibility between the two periods, I
investigate the sign of the relationship between this flexibility and the intensity with which
FX regulation was used. Given that FX regulation was used to reduce currency mismatches,
as noted in the previous section, one could search in the literature how these mismatches and
exchange rate flexibility are linked and, on this basis, draw inference on the relevant sign.
Thus, for instance, if exchange rate flexibility were negatively linked to currency
mismatches, one could argue that it is also expected to be negatively linked to the frequency
of use of the policies. However, a problem with this strategy is that the literature does not
have a clear prediction for how currency mismatches and exchange rate flexibility are linked.
On the one hand, there is a strand of research arguing that currency mismatches are greater
in rigid exchange rate regimes (see Mishkin, 1996; Obstfeld, 1998; Burnside et al., 2001;
Goldstein, 2002; and Areta, 2005 for a review). The argument is that a central bank’s
commitment to defend a peg makes agents believe themselves immune to FX risk, generating
moral hazard. On the other hand, a different strand claims that currency mismatches increase
with the flexibility of an eachange rate regime. The argument is that currency mismatches
12 The following events are considered as FX controls: the elimination of free access to FX by non-residents in
Argentina in the 4th quarter of 2011, the prohibition of purchasing foreign currency without prior approval in
the Eastern Caribbean Countries after the 1st quarter of 1996, the existence of two regulated FX markets in
Brazil prior to the 3rd quarter of 2005, and the restrictions on foreign exchange transactions prior to the approval
of the Law for the Free Negotiation of Foreing Exchange in Guatemala in the 4th quarter of 2000. 13 See Ilzetzki, E., Reinhart, C., and Rogoff, K. (2008) for further use of the coarse classification of regimes.

27
rise with insurance costs, which are in turn increasing in exchange rate volatility and therefore
greater in flexible regimes (e.g. Eichengreen and Hausmann, 1999; McKinnon, 2001).
TABLE 7. EXCHANGE RATE FLEXIBIBLITY OVER TIME (I)
Period Quarters with
“floating”
Quarters with
available data
Percentage of quarters
with “floating”
1992-2001 159 608 26%
2002-2012 472 743 64%
Sources: National authorities and author’s calculations.
Note: The exchange rate systems result from central banks’ answers to the survey.
TABLE 8. EXCHANGE RATE FLEXIBIBLITY OVER TIME (II)
Period Quarters with
“floating”
Quarters with
available data
Percentage of quarters
with “floating”
1992-2001 127 624 20%
2002-2012 454 743 61%
Sources: National authorities and author’s calculations.
Notes: The exchange rate systems result from central banks’ answers to the survey.
Some quarters were reclassified as FX controls base (for details, see Subsection 2.2 ).
TABLE 9. EXCHANGE RATE FLEXIBIBLITY OVER TIME (III)
Period
Quarters with
“crawling band and
managed floating”
Quarters with
available data
Percentage of quarters
with “crawling band
and managed floating”
1992-2001 150 680 22%
2002-2010 239 612 39%
Sources: National authorities and author’s calculations.
Notes: The exchange rate systems result from Reinhart and Rogoff’s coarse classification.
“Freely Falling” is considered. No quarter is classified as “Dual Parallel Markets.”
TABLE 10. EXCHANGE RATE FLEXIBIBLITY OVER TIME (IV)
Period
Quarters with
“crawling band and
managed floating”
Quarters with
available data
Percentage of quarters
with “crawling band
and managed floating”
1992-2001 150 636 24%
2002-2010 239 601 40%
Sources: National authorities and author’s calculations.
Notes: The exchange rate systems result from Reinhart and Rogoff’s coarse classification.
“Freely falling” is not considered. No quarter is classified as “Dual Parallel Markets.”
In understanding the link between exchange rate flexibility and the frequency of use of the
policies, one could also rely on their second most important goal. In particular, as noted in
Section 5, the second most important goal when implementing the policies was to achieve
exchange rate stability. In this regard, it is useful to note that, as mentioned in the list of
potential advantages of the instruments provided in Subsection 6.1, the policies can also
substitute for FX market interventions in affecting the exchange rate. Following this logic,
one could at first argue that, given that flexible regimes feature higher exchange rate
volatility, they give greater incentives to implement FX regulation. Nonetheless, one could

28
also argue in the opposite direction and claim that, under some circumstances, conventional
monetary policy is not strong enough to sustain pegs and that this may, in turn, create a
greater demand for FX regulation in fixed exchange rate regimes.
TABLE 11. FX FLEXIBILITY AND LIMITS ON FX POSITIONS (I)
Exchange rate regime Total policies Total quarters Frequency of use
Fixed 2 257 0.008
Intermediate 21 463 0.045
Floating 22 631 0.035 Sources: National authorities and author’s calculations.
Notes: The exchange rate systems result from central banks’ answers to the survey. The table considers
relevant regulatory changes and policies that directly affect both the liability and asset sides of the balance
sheet denominated in foreign currency (see Subsection 2.2). Policies taken within the same quarter are
considered as the same policy.
TABLE 12. FX FLEXIBILITY AND LIMITS ON FX POSITIONS (II)
Exchange rate regime Total policies Total quarters Frequency of use
Fixed 2 190 0.011
Intermediate 15 435 0.034
Floating 20 581 0.034
FX controls 8 161 0.050 Sources: National authorities and author’s calculations.
Notes: The exchange rate systems result from central banks’ answers to the survey. It considers relevant
regulatory changes and policies that directly affect both the liability and asset sides of the balance sheet
denominated in foreign currency (see Subsection 2.2). Policies taken within the same quarter are considered
as the same policy.
Tables 11 and 12 explores empirically the relationship between exchange rate flexibility
and the frequency of use of the policies. These tables use the survey to calculate the frequency
with which the limits, as well as the liquidity and the reserve requirements on FX positions
were used across different regimes, i.e., by dividing the total number of policies taken in a
regime through the total number of quarters with available data. Table 11 considers the three
categories mentioned in Section 2 and Table 12 adds to these categories “FX controls.”
The results in both tables show that the policies were more frequently used in the
“Intermediate” and the “Floating” regimes than in the “Fixed” regimes. That is, the evidence
suggests that the most flexible regimes are associated with a more frequent use of the
regulatory instruments under consideration. In addition, the results in Table 12 suggest that
FX controls were frequently implemented in hand with the regulatory instruments under
consideration, reinforcing the evidence in this regard provided in the historical analysis
undertaken in Section 3.
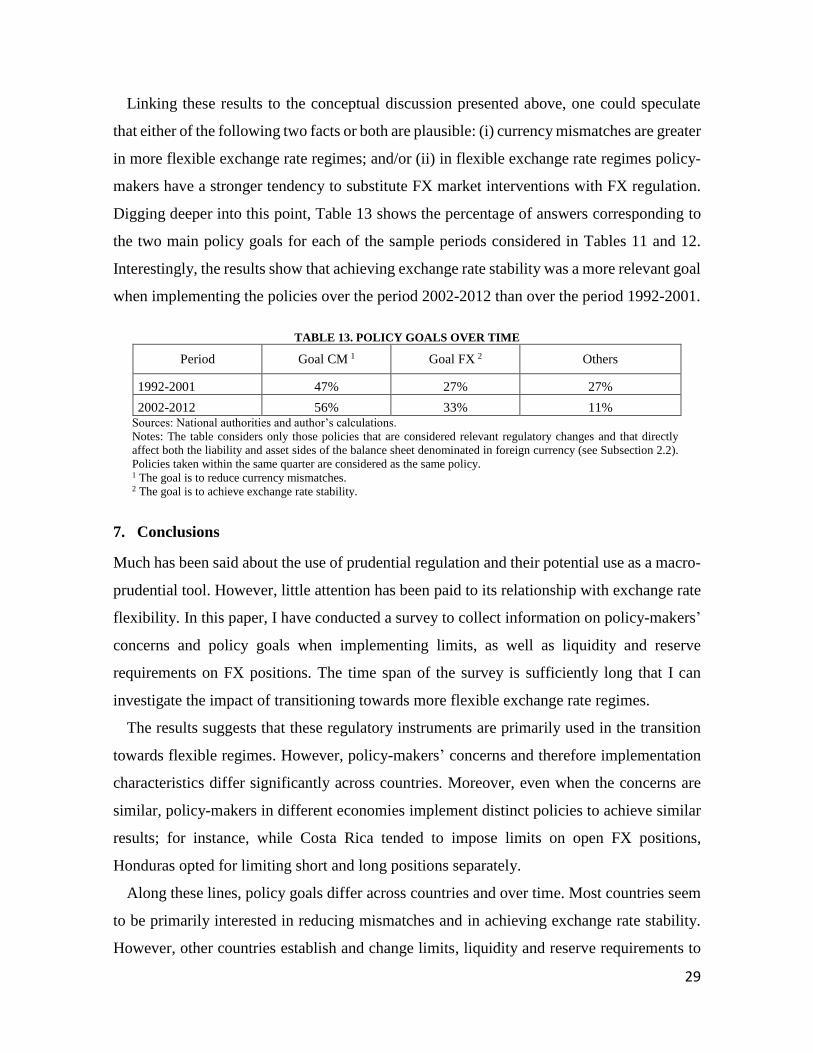
29
Linking these results to the conceptual discussion presented above, one could speculate
that either of the following two facts or both are plausible: (i) currency mismatches are greater
in more flexible exchange rate regimes; and/or (ii) in flexible exchange rate regimes policy-
makers have a stronger tendency to substitute FX market interventions with FX regulation.
Digging deeper into this point, Table 13 shows the percentage of answers corresponding to
the two main policy goals for each of the sample periods considered in Tables 11 and 12.
Interestingly, the results show that achieving exchange rate stability was a more relevant goal
when implementing the policies over the period 2002-2012 than over the period 1992-2001.
TABLE 13. POLICY GOALS OVER TIME
Period Goal CM 1 Goal FX 2 Others
1992-2001 47% 27% 27%
2002-2012 56% 33% 11% Sources: National authorities and author’s calculations.
Notes: The table considers only those policies that are considered relevant regulatory changes and that directly
affect both the liability and asset sides of the balance sheet denominated in foreign currency (see Subsection 2.2). Policies taken within the same quarter are considered as the same policy. 1 The goal is to reduce currency mismatches. 2 The goal is to achieve exchange rate stability.
7. Conclusions
Much has been said about the use of prudential regulation and their potential use as a macro-
prudential tool. However, little attention has been paid to its relationship with exchange rate
flexibility. In this paper, I have conducted a survey to collect information on policy-makers’
concerns and policy goals when implementing limits, as well as liquidity and reserve
requirements on FX positions. The time span of the survey is sufficiently long that I can
investigate the impact of transitioning towards more flexible exchange rate regimes.
The results suggests that these regulatory instruments are primarily used in the transition
towards flexible regimes. However, policy-makers’ concerns and therefore implementation
characteristics differ significantly across countries. Moreover, even when the concerns are
similar, policy-makers in different economies implement distinct policies to achieve similar
results; for instance, while Costa Rica tended to impose limits on open FX positions,
Honduras opted for limiting short and long positions separately.
Along these lines, policy goals differ across countries and over time. Most countries seem
to be primarily interested in reducing mismatches and in achieving exchange rate stability.
However, other countries establish and change limits, liquidity and reserve requirements to

30
reduce financial dollarization and, therefore, to improve the efficiency of conventional
monetary policy and regain their role as lenders of last resort. At the same time, some
countries seem to have used prudential FX regulation as a complement to FX controls.
Interestingly, there seems to have been a change in policy-makers’ goals after the late 1990s:
after have transitioned towards exchange rate flexibility, policy-makers seems to be more
concerned about exchange rate volatility.

31
References
Arteta, C. O. (2005). “Exchange rate regimes and financial dollarization: Does flexibility
reduce currency mismatches in bank intermediation?” Topics in
Macroeconomics, 5(1).
Baqueiro, A., A. Díaz de León y A. Torres (2003). “¿Temor a la Flotaciónn o a la Inflación?
La Importancia del Traspaso del Tipo de Cambio a los Precios,” Banco de Mexico’s
Working Paper No. 2003-02. Burnside, C., M. Eichenbaum, and S. Rebelo (2001). “Hedging and Financial Fragility in
Fixed Exchange Rate Regimes,” European Economic Review 45, pp. 1151-1193. Canales-Kriljenko, J. I., and K. Habermeier (2004). “Structural Factors Affecting Exchange
Rate Volatility: A Cross-Section Study.” IMF Working Paper No. WP/04/147.
Capistrán, C., R. Ibarra y M. Ramos-Francia (2012). “El Traspaso de Movimientos del Tipo
de Cambio a los Precios: Un Análisis para México”, El Trimestre Económico, vol. 74,
n 316, pp. 813-838.
Chiquiar, D., E. A. Noriega y M. Ramos-Francia (2010). “A Time Series Approach to Test a
Change in Inflation Persistence: The Mexican Experience,” Applied Economics, vol.
42, pp. 3067-3075.
Cortés Espada, J. F. (2013). “Una Estimación del Traspaso de las Variaciones en el Tipo de
cambio a los Precios en México.” Banco de Mexico’s Working Paper No. 2013-02.
Eichengreen, B., and R. Hausmann (1999). “Exchange Rates and Financial Fragility.”
National Bureau of Economic Research Working Paper 7418 (November).
Fernández, A., A. Rebucci, and M. Uribe (2015). “Are Capital Controls Countercyclical?”
Journal of Monetary Economics, 76, 1-14.
Frankel, R., and M. Repetti (2010). “A Concise History of Exchange Rate Regimes in Latin
America.” Center for Economic Policy and Research, Washington D.C.
Goldstein, M. (2002). “Managed Floating Plus.” Policy Analyses in International Economics
66, Washington, D.C.: Institute for International Economics (March).
Goldstein, M., and P. Turner (2004). “Controlling Currency Mismatches in Emerging
Markets.” Peterson Institute Press: All Books.
Hartmann, P. (1994). “Foreign Exchange Risk Regulation: Issues for Industrial and
Developing Countries.” IMF Working Paper No. WP/94/141.
Ilzetzki, E., C. Reinhart, and K. Rogoff (2008). “Exchange Rate Arrangements entering the
21st Century: Which Anchor will Hold?” Unpublished manuscript and data available
online: http://personal. lse. ac. uk/ilzetzki/data. htm.
Ize, A., and E. L. Yeyati (2003). “Financial Dollarization.” Journal of International
Economics, 59(2), 323-347.
Kraay, A. (1998). "In Search of the Macroeconomic Effects of Capital Account
Liberalization." The World Bank (October).Lee, J. K. (2012). “The Operation of
Macro Prudential Policy Measures.” Mimeo (Seoul: Bank of Korea).
Lim, C., F. Columba, A. Costa, P. Kongsamut, A. Otani, M. Saiyid, T. Wezel, and X. Wu.
2011. “Macroprudential Policy: What Instruments and How to Use Them? Lessons
from Country Experiences.” IMF No. Working Paper WP/11/238.
Magud, N. E., C. Reinhart, and K. Rogoff (2011). “Capital Controls: Myth and Reality-A
Portfolio Balance Approach.” NBER Working Paper.w16805.
32
McKinnon, R. (2001). “The East Asian Dollar Standard, Life after Death?” in Joseph Stiglitz
and Shahid Yusuf (eds.), Rethinking the East Asian Miracle, World Bank and Oxford
University Press.
Mishkin, F. (1996). “Understanding Financial Crises: A Developing Country Perspective,”
in Michael Bruno and Boris Pleskovic (eds.), Annual World Bank Conference on
Development Economics 1996, Washington, D.C., pp. 29-62.
Obstfeld, M. (1998). “The Global Capital Market: Benefactor or Menace?” Journal of
Economic Perspectives 12, pp. 9-30.
O’Dogherty, P., and M. Schwartz (2001). “Prudential Regulation of Foreign Exchange: The
Mexican Experience.” BIS Background Paper, 285.
Ostry, J. (2012). “Managing Capital Flows: What Tools to Use?” Asian Development Review,
29(1), 82.
Ostry, J., A. Ghosh, M. Chamon, and M. Qureshi (2012). “Tools for Managing Financial-
Stability Risks from Capital Inflows.” Journal of International Economics, 88(2),
407-421.
Park, Y. C. (2011). “The Role of Macro-Prudential Policy for Financial Stability in East
Asia’s Emerging Economies.” ADBI Working Paper Series, May.Ranciere, R., A.
Tornell, and A. Vamvakidis. 2010. “A New Index of Currency Mismatch and
Systemic Risk.” IMF Working Paper No. WP/10/263.
Reinhart, C. and V. Reinhart (1998). “Some Lessons for Policy Makers Who Deal with the
Mixed Blessing of Capital Inflows,” in Miles Kahler, ed. Capital Flows and Financial
Crises, Council on Foreign Relations Book, Ithaca, NY: Cornell University Press, 93-
127.
Rennhack, R., and, M. Nozacki. 2006. “Financial Dollarization in Latin America.” IMF
Working Paper No. WP/06/7.
Rodriguez, M., and T. Wu (2013). “The Effect of Capital Controls and Prudential FX
Measures on Options-Implied Exchange Rate Stability.” Federal Reserve Bank of San
Francisco Working Paper No. 2013-20.
Tamirisa, N. (1999). "Exchange and Capital Controls as Barriers to Trade." IMF Staff Papers:
69-88.
Terrier G., R. Valdés, C. E. Tovar, J. Chan-Lau, C. Fernández-Valdovinos, M. García-
Escribano, C. Medeiros, Man-Keung Tang, M. Vera Martin, and C. Walker. (2011).
“Policy Instruments To Lean against the Wind in Latin America.” IMF Working
Paper No. WP/11/159.
Taylor, J. (2000). “Low Inflation, Pass-through and the Pricing Power of Firms,” European
Economic Review, vol. 44.
Tobal, Martín. (2013). "Currency Mismatch: New Database and Indicators for Latin America
and the Caribbean." Working Paper at CEMLA.
Tobal, Martín. (In press). "Currency Mismatch in the Banking Sector in Latin America and
the Caribbean-” International Journal of Central Banking.
Tobal, M., and R. Yslas (2016). “Two Models of FX Market Interventions: The Cases of
Brazil and Mexico.” Banco de Mexico’s Working Paper No. 2016-14.
Update to G20 Finance Ministers and Central Bank Governors (2011), Financial Stability
Borad, International Monetary Fund, and Bank for International Settlements.
Zettelmeyer, J., P. M. Nagy, and S. Jeffrey (2011). “Addressing Private Sector Currency
Mismatches in Emerging Europe,” in Financial Market Regulation and Reforms in
Emerging Markets.” Brookings Institution Press: Washington DC.
33
Appendix Section
Appendix 1: Survey Description
The survey was split up into five sections, four of which deal with prudential regulation and
capital flow management measures, and the remaining one collects data on FX assets and FX
liabilities. I proceed by describing each section in detail.
Section 1 focuses on prudential policies aimed at regulating FX positions such as, for
instance, limits, liquidity and reserve requirements. In particular, this section requested
information about four different dimensions of these policies. First, the status of the
regulatory measures at the beginning of the sample, set at June of 1992. Second, all the
changes that occurred in these measures over the entire sample, spanning from June 1992 to
June 2012. Third, the implementation characteristics of the regulatory measures such as, for
instance, if limits on foreign currency positions were established as a percentage of banks’
capital. Fourth, the implementation goals of the prudential policies. Regarding these goals,
central banks were requested to identify them within a list that included the following six
potential goals: Controlling Credit Growth, Achieving Exchange Rate Stability, Reducing
Currency Mismatches, Reducing Maturity Mismatches in Foreign Currency Positions,
Correcting Currency Account Imbalances, and Other. When choosing the option “Other”, the
section requested to provide a brief explanation about the goals of the policy.
Section 2 covers regulatory policies dealing with capital flows such as, for example, taxes,
reserve requirements and limits to external assets and liabilities or to capital flows. As in the
case of Section 1, the information requested in this section focused on four dimensions of the
capital management measures; i.e., their initial status at the beginning of the sample (i.e. June
1992), all their changes until June 2012, their implementation characteristics, and their
implementation goals. With respect to these goals, the section requested, for each policy, to
select one or more of the following potential goals: Managing Capital Flows to Control Credit
Growth; Achieving Exchange Rate Stability; Tilting the Composition of Inflows towards
Longer Maturity; Correcting Current Account Imbalances; and Other. Again, when choosing
the option “Other”, the section asked for a brief explanation.
Section 3 deals with FX market interventions and exchange rate regimes. In particular, this
section requested the number of operations in the FX market performed by central banks (or

34
the corresponding authority) each quarter between 1992/Q2-2012/Q2. In addition, the section
requested central banks to identify the exchange rate regime under which these operations
were performed, the type of these interventions and their goals. Regarding the type of the
interventions, the section requested to choose between two options; i.e., Following a Pre-
established Rule and Discretionary Interventions. With respect to goals, the section requested
to select one or more of the following potential goals: Achieving Exchange Rate Stability to
Avoid Sudden Stops; Achieving Exchange Rate Stability to Reduce the Impact of its
Variations on Financial Wealth; Changing Exchange Rate to Correct Current Account
Imbalances; Achieving Exchange Rate Stability for Others Reasons; and Other. As in the
cases of Section 1 and 2, this last option should be accompanied by a brief explanation.
Section 4 studies policies aimed at regulating credit and deposits denominated in foreign
currency such as, for instance, reserve and capital requirements over these credits/deposits.
As in Sections 1 and 2 of the survey, this section requested to identify the initial status of
each of these prudential measures at the beginning of the period (i.e. June 1992) and, from
that date, to track all the changes in these measures until the end of the sample (i.e. June
1992). The implementation characteristics and the implementation goals of the policies were
also requested. To identify these policy goals, the section asked central banks to select one
or more goals of a list conformed by five potential goals; i.e. Reducing the Volatility of the
Credit Cycle; Achieving Exchange Rate Stability; Reducing Loans to Borrowers Un-hedged
from Exchange Rate Variations; Correcting Current Account Imbalances; and Other. A brief
explanation should be provided when choosing the option “Other.”
Finally, Section 5 requested data on foreign currency assets and liabilities which was used
to construct a comprehensive dataset available only to the cooperating central banks. The
data were requested on a quarterly frequency, only for the banking sector (excluding the
government), and disaggregated by asset/liability category. For the disaggregation of the data
at the category level, central banks were provided with a table listing the categories in which
data should be provided. Being aware that the information required is not available for a long
period of time, the beginning of the sample was set at the “earliest date for which the data is
available.” Furthermore, when the information requested was not available at the quarterly
frequency and/or disaggregated by asset/liability type, central banks were asked to provide
the data at the highest frequency available and/or for many categories as possible.

35
Appendix 2: Refinements and Consolidation Procedures
This section describes in detail the policies that were considered as relevant regulatory
changes but, rather, as part of refinements and consolidation procedures. Two countries
implemented this type of policies: Brazil and Mexico
Brazil
Unification of foreign currency positions held in the two parallel markets
The Central Bank of Brazil determined, as from February 1st of 1999, to unify FX positions
held by banks in the two parallel markets; the positions held by banks in the floating exchange
rate market (MCTF) and in the free rate foreign exchange market (MCTL) were unified and
calculated as the sum of both. Notwithstanding, this unification did not alter the level of limits
on banks’ short or long foreign currency positions. Indeed, for instance, the limit on short
positions for banks which operated in both markets was set equal to the sum of the limit in
the MCTF and the limit in the MCTL in force at the time.
However, this change was part of a more comprehensive policy taken on February 1st of
1999. More precisely, the unification of foreign currency positions in both markets was
accompanied by the establishment of new limits on long positions; on that date, the central
bank tightened these limits both for banks that operated in both markets and for banks that
operated only in the MCTF. In this sense, even though the unification did not alter the level
of limits and the constraints faced by banks per se, it was considered implicitly as part of a
more comprehensive policy that tightened the limits on long positions on February 1st of
1999. Since this last policy changed limits on long positions and thus modified bank’s
constraints, it was considered economically relevant and included in the final set of policies
systemized in the present paper.
Consolidation of the rules for limits on foreign currency positions
On May 25th of 1999, there were already in place limits on both short and long foreign
currency positions in Brazil. Regarding short positions, the limit was equal to 100% of
adjusted bank’s net worth. The limit on long positions, in turn, was set depending on whether
the bank was authorized or not to operate in the two parallel FX markets existent at that time.
In particular, for banks operating in both the MCTF and the MCTL, the excess amount to 6
36
million US dollars in long positions had to be deposited in the central bank. For banks
operating only in the MCTF, this limit was equal to 1 million US dollars.
The Central Bank of Brazil consolidated the rules concerning the abovementioned limits
on May 25th of 1999. Regarding the limits on long foreign currency positions, for instance,
the central bank specified the accounting rules to determine these positions, as well as the
rules and conditions under which deposits in the central bank had to be made. As for the
limits on short positions, the central bank specified the penalties for not complying with the
limits. However, this consolidation procedure did not include any change in the level of limits
on foreign currency positions and, as a result, it did not modify banks’ constraints. Hence,
this regulatory change was not considered economically relevant and it was excluded from
the final set of regulatory policies the present paper focuses on.
Refinement and consolidation of the rules for reserve requirements on FX positions
The Central Bank of Brazil introduced, on January 6th of 2011, a reserve requirement on short
foreign currency positions of banks that exceeded the smaller between 3 billion US dollars
and their capital base. This requirement could reach 60% of the excess amount in short
positions.
On July 8th of 2011, the Brazilian authorities decided to redefine and consolidate the rules
regarding these reserve requirements. This redefinition and consolidation of the regulation,
however, focused only on the way in which the requirements on short positions were
calculated. In contrast to the previous regulation, for instance, this new regulation stipulated
that the requirement should be calculated over the five-day moving average of short
positions. Given that this regulatory change did not change the level of limits, it did not alter
banks’ constraints and, therefore, it was not considered economically relevant. Thus, it was
not included in the final set of policies.
Mexico
Refinement of liquidity requirements for foreign currency operations
By October 31st of 2000, there was already in place a liquidity requirement on foreign
currency operations in Mexico. According to this regulation, the weighted sum of foreign
currency liabilities with maturity equal to or shorter than 60 days could not be larger than
foreign currency liquid assets. In addition, the regulation stablished that banks’ foreign

37
currency liabilities with a maturity equal to or shorter than 60 days could not surpass foreign
currency assets of the same maturity. In this sense, the regulation implicitly imposed a limit
on short foreign currency positions which involved only short-term components of the
balance sheet; i.e., these short positions were not allowed by the regulation.
The Central Bank of Mexico refined this liquidity requirement on October 31st of 2000.
This refinement changed the way in which the requirement should be determined. In contrast
to the previous regulation, for instance, the central bank determined that foreign currency
liabilities with maturity equal to or shorter than 60 days that had no corresponding assets of
the same or shorter maturity must be entirely matched by liquid foreign currency assets. In
addition, the weighted sum of liabilities with maturity equal to or shorter than 60 days that
were not covered by liquid or non-liquid foreign currency assets of the same or shorter
maturity must be entirely matched by liquid foreign currency assets.
However, the refinement did not change the level of the limit on short positions implicitly
imposed by the requirement; short positions which involved short-term components of the
balance sheet denominated in foreign currency was still prohibited. In this sense, this
regulatory change did not modify banks’ constraints and, therefore, it was not considered
economically relevant. Moreover, this change in the regulation was implemented on the same
date as other policies; i.e., on the same date as the limit on net foreign currency liabilities was
established. Given that the refinement of the liquidity requirement on October 31st of 2000
was not considered economically relevant and that it was taken on the same date as other
regulatory measures, it was excluded from the final set of regulatory policies on which the
present paper focuses.

38
Appendix 3: Additional Tables
TABLE A1. COUNTRIES THAT DELIVERED INFORMATION
Country
Stages of the information collection process
First stage Second stage
Argentina Yes Yes
Aruba Yes Yes
Bahamas Yes No
Bolivia Yes Yes
Brazil Yes Yes
Chile Yes Yes
Colombia Yes Yes
Costa Rica Yes Yes
Dominican Republic Yes Yes
Eastern Caribbean Countries Yes No
Ecuador Yes No
El Salvador Yes No
Guatemala Yes Yes
Haiti Yes No
Honduras Yes Yes
Jamaica Yes Yes
Mexico Yes Yes
Nicaragua Yes Yes
Paraguay Yes Yes
Peru Yes Yes
Suriname Yes No
Uruguay Yes Yes
Venezuela Yes No
Source: National authorities.

39
Appendix 4: Policies with Ambiguous Impact on Long FX Positions
This subsection describes the policies that exerted ambiguous impacts on the FX position of
banks and, as a result, were considered in all tables of the manuscript but Table 5.
Argentina, 1992
In 01/12/1992, limits on short positions in foreign currency changed relative to previous
regulation. Before December 1992, the positive difference between short global positions
and the “financial” net sell positions could not exceed the larger between 5 percent of
computable equity capital and 15 percent of the non-immobilized own resources. The
regulation of December 1992 established that short global positions could not be greater than
25 percent of computable equity. Therefore, there were two changes in 01/12/1992. First, it
were no longer allowed to subtract the “financial” sell position from global short positions.
In this sense, this change make the limit more restrictive. Second, given that non-immobilized
own resources represent a component of computable equity, the limit increased in absolute
terms. Because the two changes pointed out in different directions, it could not be determined
the direction of the change; i.e. if the limit became more or less restrictive. Hence, this policy
were not taken into account in the elaboration of Table 5.
Brazil, 1994
In contrast to the previous regulation, the Central Bank of Brazil did not allow neither short
nor long foreign currency positions solely on July 29th and 30th of 1994. Although it could
argued that this policy is relevant, the direction of its impact is not clear since it entailed two
opposite changes within the same quarter; i.e., in the third quarter of 1994 the central bank
reduced, first, limits to zero and, then, it increased them to its previous level. Hence, it is not
clear whether the policy taken in the third quarter of 1994 turned out the limits more or less
restrictive. Furthermore, this policy was taken along other policies within the same quarter.
Given that policies taken within the same quarter are considered as the same policy and that
the policy taken on July 29th and 30th of 1994 has an ambiguous impact, this last policy was
not considered in the elaboration of the tables presented in this paper.
Mexico, 2000
In 31/10/2000 Mexico introduced a limit equal to 1.83 times the Tier 1 capital on net foreign
currency liabilities, defined as the positive difference between the sum of foreign currency
40
liabilities weighted by its term and the sum of liquid foreign currency assets weighted by
their credit risk. This change could be interpreted as the introduction of a limit on foreign
currency positions that consider the weighted sums of assets and liabilities abovementioned
and, therefore, as a tightening of these limits. However, the potential effect of this limit on
foreign currency positions is not clear.
The previous regulation imposed a limit equal to 1.83 times Tier 1 capital on the weighted
foreign currency liabilities; i.e. on the sum of all FX obligations weighted by its term. Under
this regulation, banks’ foreign currency short positions must have been between zero and the
equivalent to 1.83 times their Tier 1 capital (if the bank acquired foreign currency obligations
equal to the 183 percent of their Tier 1 capital and it did hold liquid foreign currency assets).
In this sense, the change in the regulation on 31/10/2000 did not modify the limits relative to
the previous regulation.
Notwithstanding, this policy is in principle economically relevant. By allowing banks to
subtract liquid foreign currency assets from their weighted sum of foreign currency liabilities,
this regulatory change relaxed the restriction on foreign currency liabilities faced by banks,
potentially increasing their demand for these liabilities.
Related Documents