arXiv:cond-mat/0205518v1 [cond-mat.supr-con] 24 May 2002 Proximity effects and characteristic lengths in ferromagnet-superconductor structures Klaus Halterman † and Oriol T. Valls ∗ School of Physics and Astronomy and Minnesota Supercomputer Institute, University of Minnesota, Minneapolis, Minnesota 55455-0149 (December 31, 2013) We present an extensive theoretical investigation of the proximity effects that occur in Ferro- magnet/Superconductor (F/S) systems. We use a numerical method to solve self consistently the Bogoliubov-de Gennes equations in the continuum. We obtain the pair amplitude and the local density of states (DOS), and use these results to extract the relevant lengths characterizing the leakage of superconductivity into the magnet and to study spin splitting into the superconductor. These phenomena are investigated as a function of parameters such as temperature, magnet polar- ization, interfacial scattering, sample size and Fermi wavevector mismatch, all of which turn out to have important influence on the results. These comprehensive results should help characterize and analyze future data and are shown to be in agreement with existing experiments. 74.50.+r, 74.25.Fy, 74.80.Fp I. INTRODUCTION The importance of understanding the characteristic length scales and geometrical effects inherent to het- erostructures consisting of ferromagnets in electrical contact with superconductors has received a consider- able reinforcement from the ever increasing advances in nanofabrication technology. These advances have made it possible (see e.g. Refs. 1–3) to fabricate high quality nanostructures involving ferromagnets, as well as normal metals, and superconductors. In parallel, there has been significant progress in the development and refinement in tunneling spectroscopy techniques. Scanning tunnel- ing microscopy (STM) allows one to locally probe the electronic density of states (DOS) of hybrid systems over atomic length scales with sub-meV sensitivity. When a normal metal is in good electrical contact with a superconductor, superconductivity is weakened in the superconductor and induced in the normal metal. When the normal metal is not magnetic, this phenomenon is the traditional 4 proximity effect which is described quantita- tively via the pair amplitude, F (r), which encompasses the spatial dependence of pair correlations in the both the superconductor and the normal metal. If the non- superconductor is a ferromagnet, the superconducting proximity effect is drastically modified by the finite ex- change field. Furthermore, the magnetic material can induce spin polarization in the superconductor, resulting in a magnetic proximity effect. The study of the spatial variation of both the pair amplitude and the local DOS are fundamental to the understanding of these nanostruc- tures. When considering such inhomogeneous systems, there are multiple length scales involved that must be eluci- dated. At T = 0 the phase coherence in a clean nor- mal metal in contact with a superconductor decays in- versely with distance from the interface, with a character- istic length, ξ N (0), that is essentially infinite. 5 At finite temperatures, the phase coherence decays exponentially over a much reduced distance ξ N (T ). 4 Conversely, at low temperature, the pair correlations in the superconductor become depleted near the interface over a length scale given by the zero temperature superconducting coherence length ξ 0 , while for temperatures close to T c , Ginzburg Landau theory 6 predicts that the depletion is governed by a length scale ξ S (T ) that diverges at T c . Although the essentials of the standard proximity effect have been well understood for a long time, 4 the length scales in the intermediate temperature regimes have not been sys- tematically or consistently studied for a normal metal- superconductor bilayer system, although self consistent microscopic calculations exist for layered structures, 7 and results within the quasiclassical 8 description have been obtained. Other predictions are limited by being based on phenomenological or non-self consistent approaches. If the nonmagnetic normal metal is replaced with a ferromagnet (F/S junctions and structures), the rele- vant length scales in the problem are altered significantly. Naively, one would expect that all phase coherence would be lost in the magnet, since the superconductor and fer- romagnet have opposite types of long-range ordering: a ferromagnet favors parallel spin alignment and acts as an effective pair-breaker, while a superconductor is com- prised of Cooper pairs with (in the ordinary s-wave pair- ing considered here) antiparallel spin alignment. How- ever, a stable superconducting state can arise in the fer- romagnet in which the Cooper pairs have a net center of mass momentum. 9 The spin splitting in the ferromag- net introduces a new length scale ξ 2 set by the differ- ence in the spin up and spin down Fermi wavevectors, ξ 2 ∝ (k F ↑ − k F ↓ ) −1 , which is typically much smaller than ξ 0 . An interesting manifestation of this effect is the π phase junction comprised of a ferromagnetic material sandwiched between superconductors. 10–12 This partic- ular interplay of ferromagnetism and superconductivity has been studied for some time. 13–15 The peculiar os- cillatory state (originally introduced in the context of a 1

Welcome message from author
This document is posted to help you gain knowledge. Please leave a comment to let me know what you think about it! Share it to your friends and learn new things together.
Transcript
arX
iv:c
ond-
mat
/020
5518
v1 [
cond
-mat
.sup
r-co
n] 2
4 M
ay 2
002
Proximity effects and characteristic lengths in ferromagnet-superconductor structures
Klaus Halterman† and Oriol T. Valls∗
School of Physics and Astronomy and Minnesota Supercomputer Institute, University of Minnesota, Minneapolis, Minnesota
55455-0149
(December 31, 2013)
We present an extensive theoretical investigation of the proximity effects that occur in Ferro-magnet/Superconductor (F/S) systems. We use a numerical method to solve self consistently theBogoliubov-de Gennes equations in the continuum. We obtain the pair amplitude and the localdensity of states (DOS), and use these results to extract the relevant lengths characterizing theleakage of superconductivity into the magnet and to study spin splitting into the superconductor.These phenomena are investigated as a function of parameters such as temperature, magnet polar-ization, interfacial scattering, sample size and Fermi wavevector mismatch, all of which turn out tohave important influence on the results. These comprehensive results should help characterize andanalyze future data and are shown to be in agreement with existing experiments.
74.50.+r, 74.25.Fy, 74.80.Fp
I. INTRODUCTION
The importance of understanding the characteristiclength scales and geometrical effects inherent to het-erostructures consisting of ferromagnets in electricalcontact with superconductors has received a consider-able reinforcement from the ever increasing advances innanofabrication technology. These advances have madeit possible (see e.g. Refs. 1–3) to fabricate high qualitynanostructures involving ferromagnets, as well as normalmetals, and superconductors. In parallel, there has beensignificant progress in the development and refinementin tunneling spectroscopy techniques. Scanning tunnel-ing microscopy (STM) allows one to locally probe theelectronic density of states (DOS) of hybrid systems overatomic length scales with sub-meV sensitivity.
When a normal metal is in good electrical contact witha superconductor, superconductivity is weakened in thesuperconductor and induced in the normal metal. Whenthe normal metal is not magnetic, this phenomenon is thetraditional4 proximity effect which is described quantita-tively via the pair amplitude, F (r), which encompassesthe spatial dependence of pair correlations in the boththe superconductor and the normal metal. If the non-superconductor is a ferromagnet, the superconductingproximity effect is drastically modified by the finite ex-change field. Furthermore, the magnetic material caninduce spin polarization in the superconductor, resultingin a magnetic proximity effect. The study of the spatialvariation of both the pair amplitude and the local DOSare fundamental to the understanding of these nanostruc-tures.
When considering such inhomogeneous systems, thereare multiple length scales involved that must be eluci-dated. At T = 0 the phase coherence in a clean nor-mal metal in contact with a superconductor decays in-versely with distance from the interface, with a character-istic length, ξN (0), that is essentially infinite.5 At finitetemperatures, the phase coherence decays exponentially
over a much reduced distance ξN (T ).4 Conversely, at lowtemperature, the pair correlations in the superconductorbecome depleted near the interface over a length scalegiven by the zero temperature superconducting coherencelength ξ0, while for temperatures close to Tc, GinzburgLandau theory6 predicts that the depletion is governedby a length scale ξS(T ) that diverges at Tc. Althoughthe essentials of the standard proximity effect have beenwell understood for a long time,4 the length scales inthe intermediate temperature regimes have not been sys-tematically or consistently studied for a normal metal-superconductor bilayer system, although self consistentmicroscopic calculations exist for layered structures,7 andresults within the quasiclassical8 description have beenobtained. Other predictions are limited by being basedon phenomenological or non-self consistent approaches.
If the nonmagnetic normal metal is replaced with aferromagnet (F/S junctions and structures), the rele-vant length scales in the problem are altered significantly.Naively, one would expect that all phase coherence wouldbe lost in the magnet, since the superconductor and fer-romagnet have opposite types of long-range ordering: aferromagnet favors parallel spin alignment and acts asan effective pair-breaker, while a superconductor is com-prised of Cooper pairs with (in the ordinary s-wave pair-ing considered here) antiparallel spin alignment. How-ever, a stable superconducting state can arise in the fer-romagnet in which the Cooper pairs have a net centerof mass momentum.9 The spin splitting in the ferromag-net introduces a new length scale ξ2 set by the differ-ence in the spin up and spin down Fermi wavevectors,ξ2 ∝ (kF↑−kF↓)
−1, which is typically much smaller thanξ0.
An interesting manifestation of this effect is the πphase junction comprised of a ferromagnetic materialsandwiched between superconductors.10–12 This partic-ular interplay of ferromagnetism and superconductivityhas been studied for some time.13–15 The peculiar os-cillatory state (originally introduced in the context of a
1
new superconducting state that arises in when magneticimpurities are present16,17) leads, in the sandwich geom-etry, to a nonmonotonic dependence of the critical tem-perature on the ferromagnet layer thickness.18–21 Otherworks22 have focused on the variation of the Josephsoncurrent with temperature. For certain values of the ex-change field, spontaneous currents23 may arise in F/Sheterostructures.
For heterostructure configurations in which any of thematerial thicknesses are of order of or smaller than thelargest of the relevant intrinsic lengths, size effects willplay a role, and the finite thicknesses of the layers be-come important geometric lengths in the proximity ef-fects. It is then clearly preferable to tackle the prob-lem using a theory which does not involve coarse grain-ing over atomic length scales. It has been shown thatin thin superconductor-normal metal bilayers, the inter-layer resistance plays a key part.24 Variations in the lo-cal DOS were calculated as a function of ferromagnetthickness.25,26 These calculations were all based on thequasiclassical Usadel27 or Eilenberger28 equations. Theuse of quasiclassical techniques may not be appropriatewhen the thickness of the materials is only of a few atomiclayers. Also, the Usadel equations are restricted to thelimit when the mean free path is much smaller than anyother relevant length scale in the problem, and thereforetheir use in these situations is questionable. It is there-fore desirable to study finite-sized systems using a micro-scopic, self-consistent theory that can accurately accountfor these geometrical effects.
We are aware of no work that addresses the influ-ence on the proximity effect of the mismatch betweenthe three Fermi energies (or Fermi wave vectors) presentin F/S junctions (corresponding to the superconductor,and to the up and down spin bands in the magnet). Pre-vious work29 on this question was limited to the caseof nonmagnetic metal, at temperatures near Tc. It wasfound that when the Fermi wave vector in the normalside is smaller than that in the superconductor, a strongsuppression of the pair amplitude in the normal metalensues. Also for nonmagnetic materials, the DOS wasstudied7 using a microscopic formalism that allowed fordifferent Fermi wavevectors, in the context of layeredshort-coherence length superconducting structures, butthere was no systematic study. Therefore this influenceis still an open question in the full parameter range. ForF/S junctions, the influence of Fermi wave vector mis-matches on the proximity effect is virtually unchartedterritory. Spectroscopy studies30 revealed a nontrivialdependence of the conductance spectrum on Fermi wavevector mismatch, however the proximity effect was ig-nored there and the calculation was not self consistent.
Another relevant quantity that has a strong influ-ence on the proximity effects and which has been in-sufficiently studied, is the interfacial scattering strength.The variation of Tc with interface scattering strength wascalculated,31 and the influence of interface scattering wasinvestigated experimentally32,33 for S/F/S structures.
High-sensitivity transport measurements32 revealed thatinterface barrier strength was an important parameter. Itis thus desirable to study the effects of varying degrees ofbarrier strength on the characteristic proximity lengths.Since appreciable scattering at the interface should leadto a reduction in F (r) near the interface, this is anotherexample where a systematic, self-consistent solution tothis problem is needed.
The main aim of this paper is therefore to presentan extensive theoretical investigation of the influence ofthese many relevant parameters on the F/S proximityeffects. We will use for these purposes a very recentlydeveloped numerical method that allows for the exactself consistent solution of the relevant microscopic equa-tions. The approach is based on numerically solving thecontinuum Bogoliubov de Gennes (BdG) equations6 forthe quasiparticle amplitudes. The method of numeri-cal self consistent solution has been described in Ref. 34where results for particular cases (zero temperature, nobarrier or mismatch, and semi-infinite geometry) weregiven. These procedures allow for the study of coherencelengths much longer than those one can consider in lat-tice real-space models.35,36. It was shown34 that for F/Sjunctions there is, besides the usual characteristic spatialperiod ξ2, another length scale ξ1 ≈ ξ2 which describesthe fast decay of F (r) very near the interface. The abovecalculations were performed only at T = 0. Finding thetemperature dependence of the F/S proximity effects willthus be a part of our task here.
Our objective is to investigate the length scales charac-terizing the F/S proximity effects in both bulk and finitesized junctions consisting of a ferromagnet of varying po-larization, (including the nonmagnetic limit) in contactwith a superconductor. As alluded to above, the often ex-treme differences in length scales in the problem requirea self consistent microscopic theory that can deal withthem simultaneously without the approximations inher-ent to quasiclassical and dirty-limit equations. We shallexplore the whole of the parameter range including theeffects of temperature, Fermi energy mismatch, interfa-cial scattering, and finite sample size. Results will begiven for the pair amplitude and for the local DOS forboth bulk and finite heterostructures, and thus we willanalyze the various length scales involved.
Although the objective of this comprehensive study isto stimulate new experiments and to help analyze andcharacterize the resulting data, we aim also to makecontact with existing experimental work. Recent STMmeasurements37 indicate a clear modification to the nor-mal metal density of states for a Nb-Au junction, as afunction of superconductor width. We compare our re-sults with this data using a bilayer model in which boththe normal metal and superconductor have widths of or-der ξ0. We also compare our theoretical results with tun-neling data3 from a F/S (Ni-Al) junction in which localDOS measurements were taken in the superconductor.The relatively large exchange energy of Ni makes it anideal candidate for investigating the effect of magnetism
2
on the pairing correlations in the superconductor. Inboth cases, we find, using relevant values of the param-eters describing the materials used and the geometry ofthe experimental set up, very good agreement betweentheory and experiment.
The rest of this paper is organized as follows. In Sec. II,we outline the method of self consistent solution to theproblem. In Sec. III, we present our results for the numer-ous parameters discussed above for different geometries,and compare our results with recent tunnel spectroscopydata. Finally in Sec. IV we summarize our conclusions.
II. METHOD
In this section we briefly outline our basic equationsand methods. We begin with a brief review of the spindependent microscopic BdG equations in our geometry,and then outline the numerical method used for solv-ing them. We also explain the procedure for calculatingphysical quantities paramount in the study of proximityeffects, namely the pair amplitude and the local DOS.Most of the techniques used here follow those of Ref.34. We will omit many of the details given there andwe focus our attention below on those points where themethods employed depart from those developed in thatwork, such as the inclusion of an insulating barrier andof finite temperatures.
The BdG equations6 are a conceptually simple andconvenient set of microscopic equations used for study-ing inhomogeneous superconducting systems, in our casestructures involving, in addition to the superconductor,a ferromagnet or a non-magnetic normal metal. We con-sider a particular slab-like geometry where the materialsare assumed to extend to infinity in the x− y plane, andhave a total arbitrary thickness d along the z direction,where the only geometrical variation occurs. We denotethe thicknesses of the ferromagnetic and superconductinglayers by d′ and d−d′ respectively. These materials are ingeneral separated by a thin insulating barrier at z = d′.Since in this geometry the system is translationally in-variant in the x − y plane, some aspects of the problemare effectively one-dimensional. For this configuration,we then have two sets of coupled equations, one for thespin-up and spin-down quasiparticle and quasihole wavefunctions (u↑
n, v↓n), and another for (u↓n, v↑n). The first
takes the form6,34 (h = kB = 1),
[
− 1
2m
∂2
∂z2+ ε⊥ + U(z) − EF (z) − h0(z)
]
u↑n(z)
+∆(z)v↓n(z) = ǫnu↑n(z), (1a)
−[
− 1
2m
∂2
∂z2+ ε⊥ + U(z) − EF (z) + h0(z)
]
v↓n(z)
+∆(z)u↑n(z) = ǫnv↓n(z), (1b)
where ε⊥ is the transverse kinetic energy, ǫn are thequasiparticle energy eigenvalues (the index n labels the
relevant quantum numbers), h0(z) = h0Θ(z − d′) is themagnetic exchange energy. Scattering at the interface(assumed to be spin independent) is accounted for bythe potential U(z) = Hδ(z − d′), where H is the bar-rier strength parameter. The pair potential ∆(z) satis-fies a self-consistency condition as discussed below, andsince we will assume that there is no current flowing inthe system, we can take it to be real. In general, wemust allow for the possibility of having up to three dif-ferent Fermi wavevectors or band widths30 in the prob-lem. The quantity EF (z) equals EFM in the magneticside, 0 < z < d′, so that EF↑ = EFM + h0, andEF↓ = EFM − h0, while in the superconducting side,d′ < z < d, EF (z) = EFS . We will be assuming parabolicbands so that ε⊥ = 1/2m(k2
x + k2y) and there are three
Fermi wave vectors, corresponding to EF↑, EF↓ and EFS .The solutions for the other set of wavefunctions (u↓
n, v↑n)are easily obtained from those of Eqns. (1) by allowingfor both positive and negative energies, and then usingthe transformation: u↑
n → v↑n, v↓n → −u↓n, ǫn → −ǫn.
Equations (1) must be solved in conjunction with theself consistency condition for the pair potential,
∆(z) =g(z)
2
∑
n
′ [
u↑n(z)v↓n(z) + u↓
n(z)v↑n(z)]
tanh(ǫn/2T ),
(2)
where T is the temperature, and g(z) is the effective BCScoupling constant, which will be taken to be zero outsidethe superconductor and a constant within it. The primeon the sum in (2) indicates that the sum is restrictedto eigenstates with |ǫn| ≤ ωD, where ωD is the Debyeenergy.
We now solve Eq. (1) by expanding the quasiparticleamplitudes in terms of a complete set of functions φq(z),
u↑n(z) =
N∑
q
u↑nqφq(z), v↓n(z) =
N∑
q
v↓nqφq(z). (3)
We will use the normalized particle in a box wavefunc-tions, φq(z) =
√
2/d sin(kqz), as our choice for the com-plete set. Here kq = q/πd, and q is a positive integer.The finite range of the pairing interaction ωD permits thesums in (3) to be cutoff at an integer N as discussed inRef. 34, in a way that depends on the maximum wavevec-tor present. Upon inserting the expansions (3) into (1),and making use of the orthogonality of the φq(z), we ar-rive at the following 2N × 2N matrix eigensystem,
[
H+ DD H−
]
Ψn = ǫn Ψn, (4)
where Ψn is the column vector corresponding to ΨTn =
(u↑n1, . . . , u
↑nN , v↓n1, . . . , v
↓nN ). The matrix elements are
given by
H+
qq′ =
[
k2q
2m+ ε⊥
]
δqq′ +
∫ d
0
dz φq(z)U(z)φq′(z)
3
−EF↑
∫ d′
0
dz φq(z)φq′ (z) − EFS
∫ d
d′
dz φq(z)φq′ (z), (5a)
H−qq′ = −
[
k2q
2m+ ε⊥
]
δqq′ −∫ d
0
dz φq(z)U(z)φq′(z)
+EF↓
∫ d′
0
dz φq(z)φq′ (z) + EFS
∫ d
d′
dz φq(z)φq′ (z), (5b)
Dqq′ =
∫ d
d′
dz φq(z)∆(z)φq′ (z). (5c)
The self-consistency condition is now transformed into,
∆(z) =g(z)
2
∑
p,p′
∑
n
′tanh(ǫn/2T )×
[
u↑npv
↓np′φp(z)φp′(z) + u↓
npv↑np′φp(z)φp′ (z)
]
. (6)
where the sum over the quantum numbers n encompassesa sum over the continuous transverse energy ε⊥ and aquantized longitudinal momentum index q,
∑
n
′→
∑
ε⊥
′∑
q
′. (7)
The matrix eigensystem Eqn. (4) and the self-consistency condition (6) constitute the primary equa-tions drawn upon in this paper. They are solved numer-ically, using the algorithm developed and described inprevious work34. The iterative computational process iscompleted when the maximum relative error in ∆(z) be-tween successive iterations is less than a prescribed valueas explained below.
Once we have the self-consistently calculated eigenval-ues and eigenvectors, we can then construct all relevantphysical quantities. For example, the usual penetrationdepths are conveniently obtained from the pair amplitudeF (z),
F (z) = ∆(z)/g(z). (8)
The pair amplitude, unlike ∆(z), is therefore not re-stricted by the coupling constant to vanish in the non-superconductor. F (z) gives a quantitative measure of thesuperconducting correlations in both the superconductorand non-superconductor where there may exist phase co-herence between particle and hole wave functions. Thevalue of F (z) in the non-superconducting region however,does not affect the quasiparticle dynamics since it is only∆(z) that enters into the BdG equations.
We can also use our numerical results for the excita-tion spectra to calculate the experimentally accessible lo-cal single particle properties via the thermally broadeneddensity of states (DOS)
N(z, ε) = N↑(z, ε) + N↓(z, ε), (9)
where the local DOS for each spin state is given by,38
TABLE I. Dimensionless variables
Physical quantity Dimensionless form
Exchange energy I ≡ h0/EF M
Fermi wavevector mismatch Λ ≡ (kF M/kF S)2
Temperature t ≡ T/Tc
Coherence length Ξ0 ≡ kF Sξ0
Debye energy ω ≡ ωD/EF S
Barrier strength HB ≡ mH/kF M
Distance relative to interface Z ≡ kF S(z − d′)
N↑(z, ǫ) = −∑
p,p′
∑
n
′[u↑
npu↑np′φp(z)φp′ (z)f ′(ǫ − ǫn)
+v↑npv↑np′φp(z)φp′ (z)f ′(ǫ + ǫn)], (10a)
N↓(z, ǫ) = −∑
p,p′
∑
n
′[u↓
npu↓np′φp(z)φp′ (z)f ′(ǫ − ǫn)
+v↓npv↓np′φp(z)φp′(z)f ′(ǫ + ǫn)]. (10b)
Here f ′(ǫ) = ∂f/∂ǫ is the derivative of the Fermi func-tion. We will also be interested in the quantity
δN(z, ε) = N↑(z, ε) − N↓(z, ε), (11)
which will be used to characterize the effective leakage ofmagnetism into the superconductor.
III. RESULTS
In this Section, we present numerical results for thepair amplitude and local DOS, and discuss other phys-ically meaningful quantities arising from the self con-sistent excitation spectra. We will analyze the variouslength scales characterizing the influence of the super-conductor on the ferromagnet and vice versa. Since wewill consider systems with a wide range of superconduc-tor and ferromagnet widths and physical parameters, wedivide this section into four different subsections dealingwith the following topics: (1) systematics of the temper-ature, exchange field, Fermi wave vector mismatch andbarrier height for bulk F/S systems. (2) dependence ofthe results on the finite thickness of either the F or theS layer, and finally (3) a comparison with experimentalresults.
Most of the results are conveniently expressed in termsof the dimensionless quantities compactly defined andlisted in Table I. Unless otherwise indicated, we useω= 0.1 for the Debye cutoff in units of EFS and Ξ0 ≡kFSξ0=50 in this work. All lengths z are measured inunits of the inverse of kFS . For example the widths ofthe ferromagnet or superconductor layers are representedas, DF = kFSd′, and DS = kFS(d − d′). The bulk caseis studied by choosing values of DS and DF sufficientlylarge so that the results become independent of thesequantities.
4
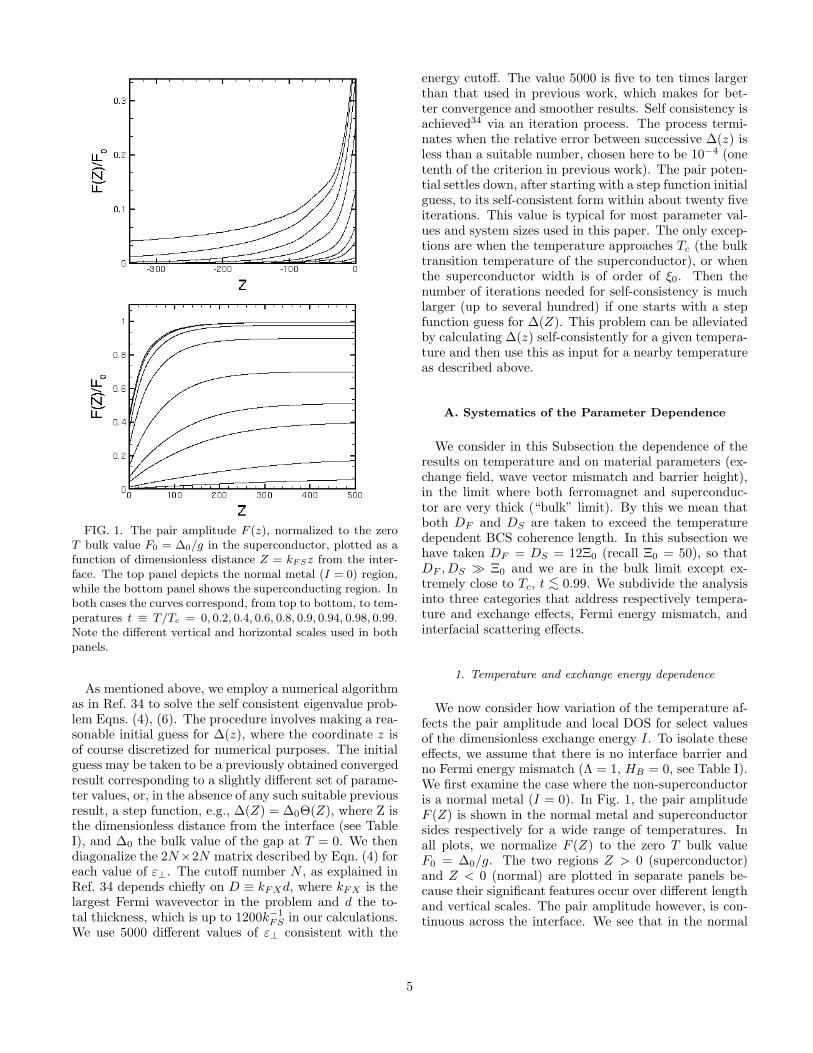
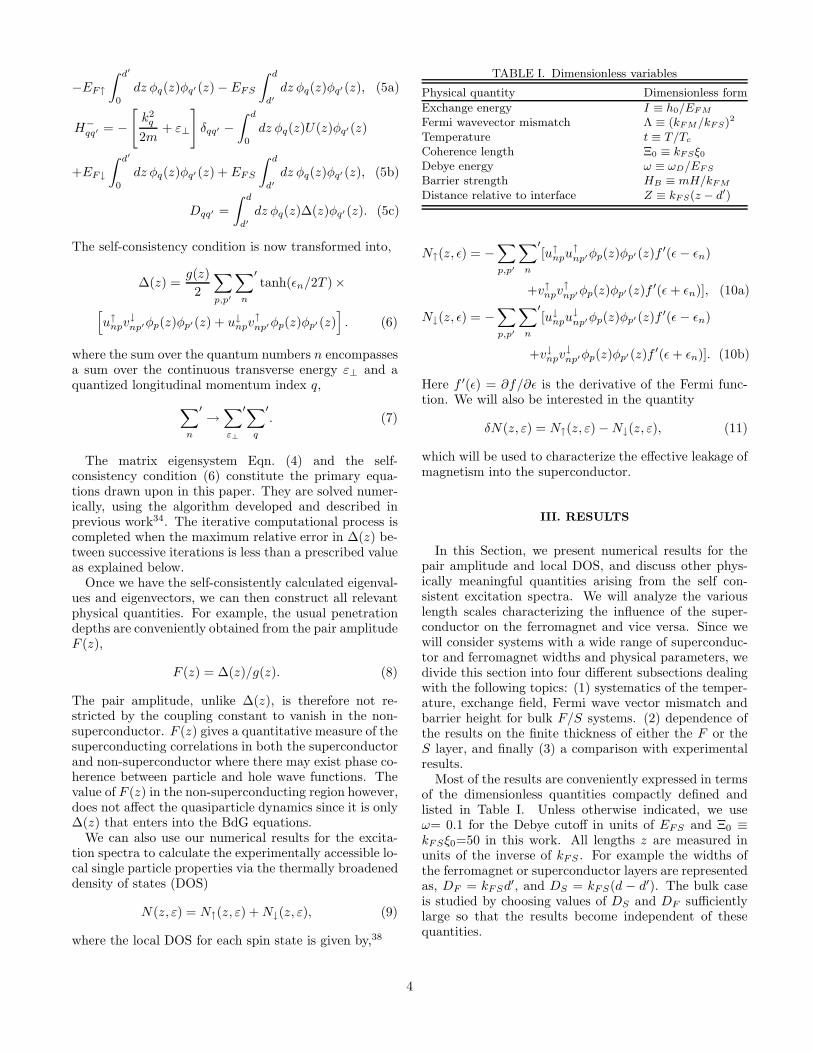
FIG. 1. The pair amplitude F (z), normalized to the zeroT bulk value F0 = ∆0/g in the superconductor, plotted as afunction of dimensionless distance Z = kF Sz from the inter-face. The top panel depicts the normal metal (I = 0) region,while the bottom panel shows the superconducting region. Inboth cases the curves correspond, from top to bottom, to tem-peratures t ≡ T/Tc = 0, 0.2, 0.4, 0.6, 0.8, 0.9, 0.94, 0.98, 0.99.Note the different vertical and horizontal scales used in bothpanels.
As mentioned above, we employ a numerical algorithmas in Ref. 34 to solve the self consistent eigenvalue prob-lem Eqns. (4), (6). The procedure involves making a rea-sonable initial guess for ∆(z), where the coordinate z isof course discretized for numerical purposes. The initialguess may be taken to be a previously obtained convergedresult corresponding to a slightly different set of parame-ter values, or, in the absence of any such suitable previousresult, a step function, e.g., ∆(Z) = ∆0Θ(Z), where Z isthe dimensionless distance from the interface (see TableI), and ∆0 the bulk value of the gap at T = 0. We thendiagonalize the 2N×2N matrix described by Eqn. (4) foreach value of ε⊥. The cutoff number N , as explained inRef. 34 depends chiefly on D ≡ kFXd, where kFX is thelargest Fermi wavevector in the problem and d the to-tal thickness, which is up to 1200k−1
FS in our calculations.We use 5000 different values of ε⊥ consistent with the
energy cutoff. The value 5000 is five to ten times largerthan that used in previous work, which makes for bet-ter convergence and smoother results. Self consistency isachieved34 via an iteration process. The process termi-nates when the relative error between successive ∆(z) isless than a suitable number, chosen here to be 10−4 (onetenth of the criterion in previous work). The pair poten-tial settles down, after starting with a step function initialguess, to its self-consistent form within about twenty fiveiterations. This value is typical for most parameter val-ues and system sizes used in this paper. The only excep-tions are when the temperature approaches Tc (the bulktransition temperature of the superconductor), or whenthe superconductor width is of order of ξ0. Then thenumber of iterations needed for self-consistency is muchlarger (up to several hundred) if one starts with a stepfunction guess for ∆(Z). This problem can be alleviatedby calculating ∆(z) self-consistently for a given tempera-ture and then use this as input for a nearby temperatureas described above.
A. Systematics of the Parameter Dependence
We consider in this Subsection the dependence of theresults on temperature and on material parameters (ex-change field, wave vector mismatch and barrier height),in the limit where both ferromagnet and superconduc-tor are very thick (“bulk” limit). By this we mean thatboth DF and DS are taken to exceed the temperaturedependent BCS coherence length. In this subsection wehave taken DF = DS = 12Ξ0 (recall Ξ0 = 50), so thatDF , DS ≫ Ξ0 and we are in the bulk limit except ex-tremely close to Tc, t <∼ 0.99. We subdivide the analysisinto three categories that address respectively tempera-ture and exchange effects, Fermi energy mismatch, andinterfacial scattering effects.
1. Temperature and exchange energy dependence
We now consider how variation of the temperature af-fects the pair amplitude and local DOS for select valuesof the dimensionless exchange energy I. To isolate theseeffects, we assume that there is no interface barrier andno Fermi energy mismatch (Λ = 1, HB = 0, see Table I).We first examine the case where the non-superconductoris a normal metal (I = 0). In Fig. 1, the pair amplitudeF (Z) is shown in the normal metal and superconductorsides respectively for a wide range of temperatures. Inall plots, we normalize F (Z) to the zero T bulk valueF0 = ∆0/g. The two regions Z > 0 (superconductor)and Z < 0 (normal) are plotted in separate panels be-cause their significant features occur over different lengthand vertical scales. The pair amplitude however, is con-tinuous across the interface. We see that in the normal
5
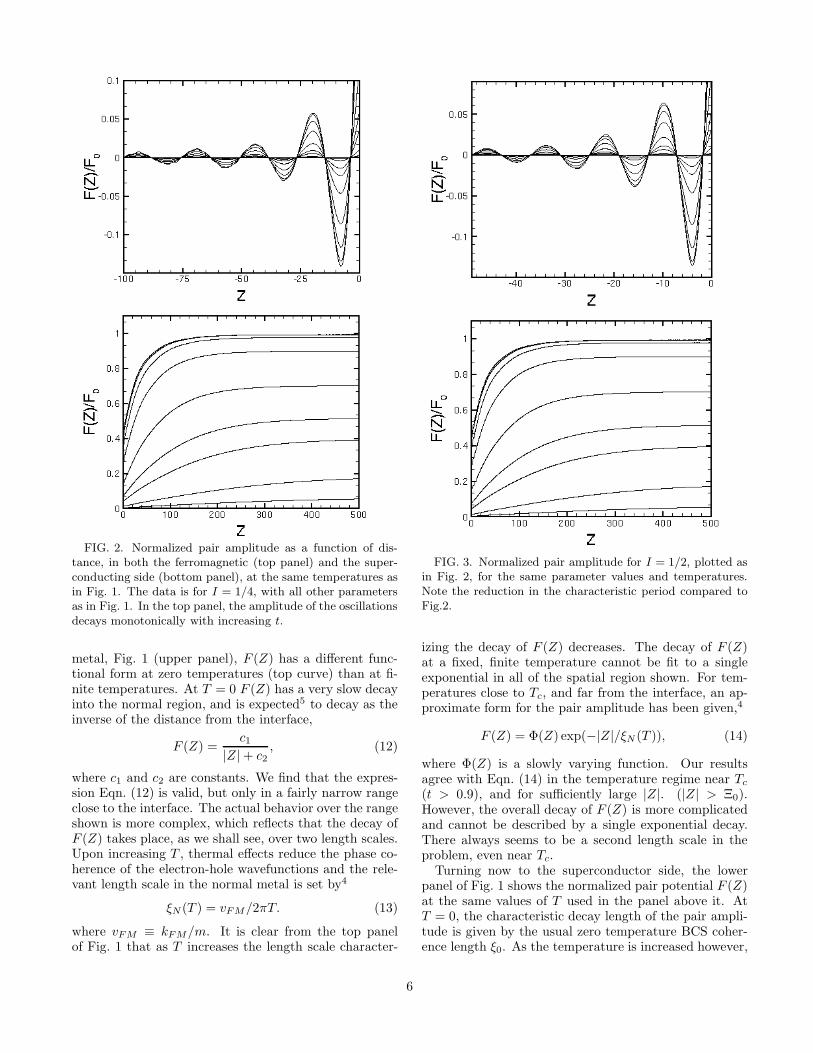
FIG. 2. Normalized pair amplitude as a function of dis-tance, in both the ferromagnetic (top panel) and the super-conducting side (bottom panel), at the same temperatures asin Fig. 1. The data is for I = 1/4, with all other parametersas in Fig. 1. In the top panel, the amplitude of the oscillationsdecays monotonically with increasing t.
metal, Fig. 1 (upper panel), F (Z) has a different func-tional form at zero temperatures (top curve) than at fi-nite temperatures. At T = 0 F (Z) has a very slow decayinto the normal region, and is expected5 to decay as theinverse of the distance from the interface,
F (Z) =c1
|Z| + c2
, (12)
where c1 and c2 are constants. We find that the expres-sion Eqn. (12) is valid, but only in a fairly narrow rangeclose to the interface. The actual behavior over the rangeshown is more complex, which reflects that the decay ofF (Z) takes place, as we shall see, over two length scales.Upon increasing T , thermal effects reduce the phase co-herence of the electron-hole wavefunctions and the rele-vant length scale in the normal metal is set by4
ξN (T ) = vFM/2πT. (13)
where vFM ≡ kFM/m. It is clear from the top panelof Fig. 1 that as T increases the length scale character-
FIG. 3. Normalized pair amplitude for I = 1/2, plotted asin Fig. 2, for the same parameter values and temperatures.Note the reduction in the characteristic period compared toFig.2.
izing the decay of F (Z) decreases. The decay of F (Z)at a fixed, finite temperature cannot be fit to a singleexponential in all of the spatial region shown. For tem-peratures close to Tc, and far from the interface, an ap-proximate form for the pair amplitude has been given,4
F (Z) = Φ(Z) exp(−|Z|/ξN (T )), (14)
where Φ(Z) is a slowly varying function. Our resultsagree with Eqn. (14) in the temperature regime near Tc
(t > 0.9), and for sufficiently large |Z|. (|Z| > Ξ0).However, the overall decay of F (Z) is more complicatedand cannot be described by a single exponential decay.There always seems to be a second length scale in theproblem, even near Tc.
Turning now to the superconductor side, the lowerpanel of Fig. 1 shows the normalized pair potential F (Z)at the same values of T used in the panel above it. AtT = 0, the characteristic decay length of the pair ampli-tude is given by the usual zero temperature BCS coher-ence length ξ0. As the temperature is increased however,
6
the depletion of superconducting correlations occur overa length scale which increases with T . We denote thisscale (in units of inverse kFS) by ξS(T ). For tempera-tures close to Tc the profile for the pair amplitude is wellknown from standard Ginzburg-Landau theory6, and hasthe following form
F (Z) = F0(T ) tanh
[
Z + Z0√2 ξS(T )
]
, (15)
where Z0 is a parameter to be determined by the condi-tion
(
1
F
dF
dz
)
Z=0
=1
b, (16)
and b is an extrapolation length, which in our dimen-sionless units is of order Ξ2
0. These expressions holdprovided39 that Ξ0 is not too small. Our results fitEq.(15) adequately for temperatures T <∼ Tc over theentire Z range shown. As the temperature is decreased,the expression in Eqn. (15) ceases to be correct for theentire range of Z, but remains an adequate fit withina region of at least one coherence length from the in-terface. We use this expression, therefore as a fittingfunction even at lower temperatures in order to extractthe dimensionless length scale ξS characterizing the de-cay away from the interface. We find that for most of thetemperature range, the characteristic length ξS fits wellto the Ginzburg-Landau expression
ξS(T ) = 0.74 Ξ0
(
1
1 − t
)1/2
. (17)
After having shown the dependence of F (z) on inter-mediate temperatures 0 < T <∼ TC for I = 0, and havingverified that our limiting results are in agreement withprevious theory and expectations for the standard (non-magnetic) proximity effect, we turn to the more inter-esting case where the exchange energy parameter I isfinite. We found above that when I = 0, the supercon-ducting correlations extend well within the normal metalat T = 0, but decay more rapidly as the temperature isincreased. When an exchange field is present, the spindegeneracy that existed for I = 0, is removed. The re-sult is that the Fermi wave vectors of the spin up andspin down electrons, kF↑, kF↓, are different, and conse-quently a Cooper pair entering the ferromagnet acquiresa net center of mass momentum. The superconductingorder induced in the ferromagnet arises from the prod-uct of particle and hole wave functions (e.g., u↑
n(z)v↓n(z))summed over all quantum numbers n. It is the super-position of these wavefunctions that causes the super-conducting wavefunction to oscillate9 on a length scaleset by the difference in the spin up and spin down wavevectors, ξ2 ≈ (kF↑ − kF↓)
−1. We have
kFSξ2 =1
(Λ(1 + I))1/2kF↑ξ2 (18)
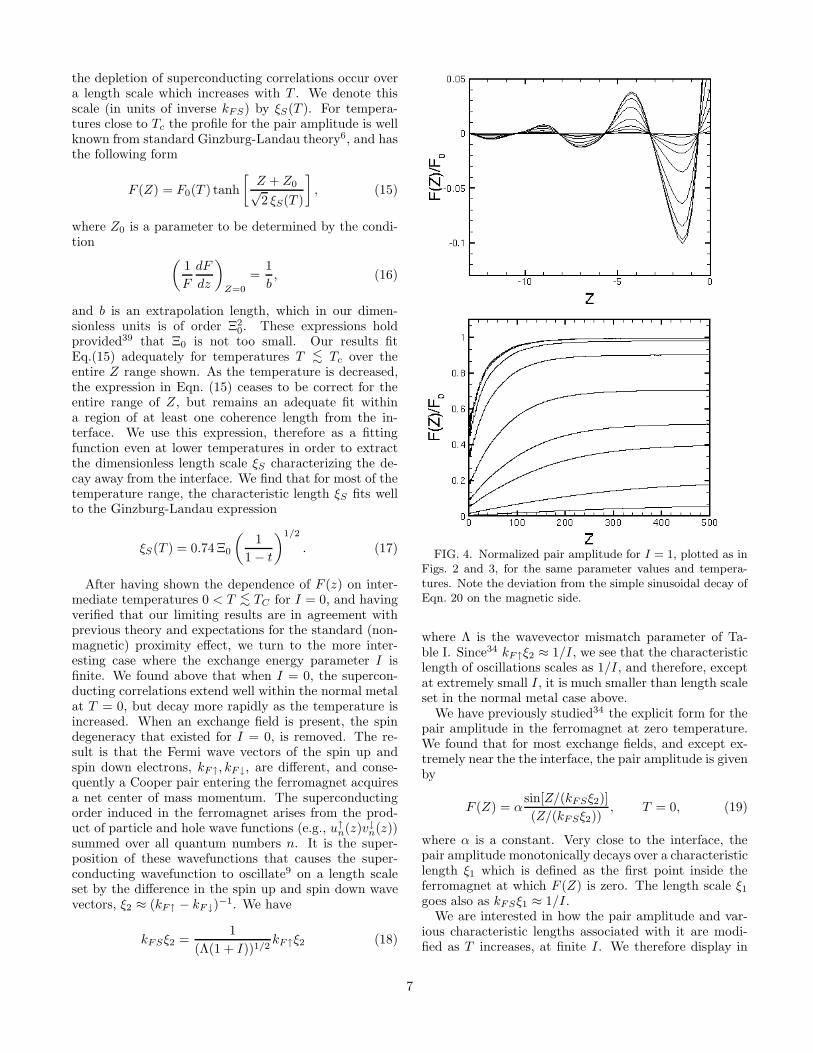
FIG. 4. Normalized pair amplitude for I = 1, plotted as inFigs. 2 and 3, for the same parameter values and tempera-tures. Note the deviation from the simple sinusoidal decay ofEqn. 20 on the magnetic side.
where Λ is the wavevector mismatch parameter of Ta-ble I. Since34 kF↑ξ2 ≈ 1/I, we see that the characteristiclength of oscillations scales as 1/I, and therefore, exceptat extremely small I, it is much smaller than length scaleset in the normal metal case above.
We have previously studied34 the explicit form for thepair amplitude in the ferromagnet at zero temperature.We found that for most exchange fields, and except ex-tremely near the the interface, the pair amplitude is givenby
F (Z) = αsin[Z/(kFSξ2)]
(Z/(kFSξ2)), T = 0, (19)
where α is a constant. Very close to the interface, thepair amplitude monotonically decays over a characteristiclength ξ1 which is defined as the first point inside theferromagnet at which F (Z) is zero. The length scale ξ1
goes also as kFSξ1 ≈ 1/I.We are interested in how the pair amplitude and var-
ious characteristic lengths associated with it are modi-fied as T increases, at finite I. We therefore display in
7
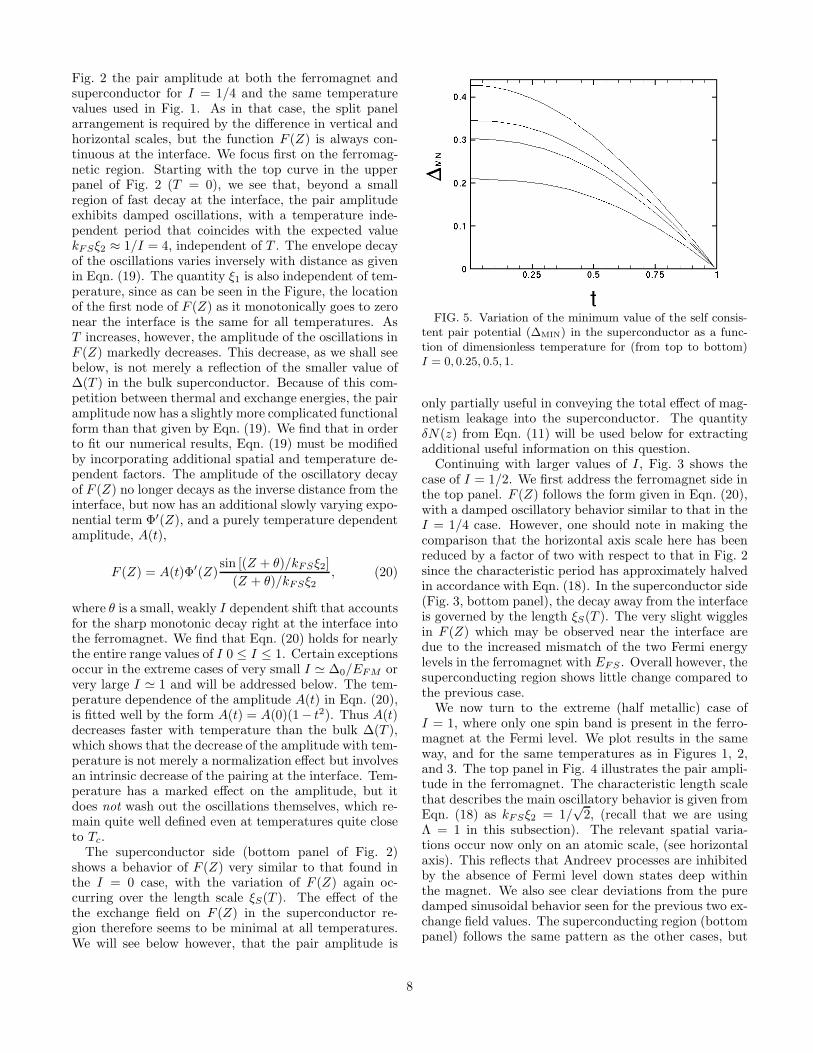
Fig. 2 the pair amplitude at both the ferromagnet andsuperconductor for I = 1/4 and the same temperaturevalues used in Fig. 1. As in that case, the split panelarrangement is required by the difference in vertical andhorizontal scales, but the function F (Z) is always con-tinuous at the interface. We focus first on the ferromag-netic region. Starting with the top curve in the upperpanel of Fig. 2 (T = 0), we see that, beyond a smallregion of fast decay at the interface, the pair amplitudeexhibits damped oscillations, with a temperature inde-pendent period that coincides with the expected valuekFSξ2 ≈ 1/I = 4, independent of T . The envelope decayof the oscillations varies inversely with distance as givenin Eqn. (19). The quantity ξ1 is also independent of tem-perature, since as can be seen in the Figure, the locationof the first node of F (Z) as it monotonically goes to zeronear the interface is the same for all temperatures. AsT increases, however, the amplitude of the oscillations inF (Z) markedly decreases. This decrease, as we shall seebelow, is not merely a reflection of the smaller value of∆(T ) in the bulk superconductor. Because of this com-petition between thermal and exchange energies, the pairamplitude now has a slightly more complicated functionalform than that given by Eqn. (19). We find that in orderto fit our numerical results, Eqn. (19) must be modifiedby incorporating additional spatial and temperature de-pendent factors. The amplitude of the oscillatory decayof F (Z) no longer decays as the inverse distance from theinterface, but now has an additional slowly varying expo-nential term Φ′(Z), and a purely temperature dependentamplitude, A(t),
F (Z) = A(t)Φ′(Z)sin [(Z + θ)/kFSξ2]
(Z + θ)/kFSξ2
, (20)
where θ is a small, weakly I dependent shift that accountsfor the sharp monotonic decay right at the interface intothe ferromagnet. We find that Eqn. (20) holds for nearlythe entire range values of I 0 ≤ I ≤ 1. Certain exceptionsoccur in the extreme cases of very small I ≃ ∆0/EFM orvery large I ≃ 1 and will be addressed below. The tem-perature dependence of the amplitude A(t) in Eqn. (20),is fitted well by the form A(t) = A(0)(1− t2). Thus A(t)decreases faster with temperature than the bulk ∆(T ),which shows that the decrease of the amplitude with tem-perature is not merely a normalization effect but involvesan intrinsic decrease of the pairing at the interface. Tem-perature has a marked effect on the amplitude, but itdoes not wash out the oscillations themselves, which re-main quite well defined even at temperatures quite closeto Tc.
The superconductor side (bottom panel of Fig. 2)shows a behavior of F (Z) very similar to that found inthe I = 0 case, with the variation of F (Z) again oc-curring over the length scale ξS(T ). The effect of thethe exchange field on F (Z) in the superconductor re-gion therefore seems to be minimal at all temperatures.We will see below however, that the pair amplitude is
FIG. 5. Variation of the minimum value of the self consis-tent pair potential (∆MIN) in the superconductor as a func-tion of dimensionless temperature for (from top to bottom)I = 0, 0.25, 0.5, 1.
only partially useful in conveying the total effect of mag-netism leakage into the superconductor. The quantityδN(z) from Eqn. (11) will be used below for extractingadditional useful information on this question.
Continuing with larger values of I, Fig. 3 shows thecase of I = 1/2. We first address the ferromagnet side inthe top panel. F (Z) follows the form given in Eqn. (20),with a damped oscillatory behavior similar to that in theI = 1/4 case. However, one should note in making thecomparison that the horizontal axis scale here has beenreduced by a factor of two with respect to that in Fig. 2since the characteristic period has approximately halvedin accordance with Eqn. (18). In the superconductor side(Fig. 3, bottom panel), the decay away from the interfaceis governed by the length ξS(T ). The very slight wigglesin F (Z) which may be observed near the interface aredue to the increased mismatch of the two Fermi energylevels in the ferromagnet with EFS . Overall however, thesuperconducting region shows little change compared tothe previous case.
We now turn to the extreme (half metallic) case ofI = 1, where only one spin band is present in the ferro-magnet at the Fermi level. We plot results in the sameway, and for the same temperatures as in Figures 1, 2,and 3. The top panel in Fig. 4 illustrates the pair ampli-tude in the ferromagnet. The characteristic length scalethat describes the main oscillatory behavior is given fromEqn. (18) as kFSξ2 = 1/
√2, (recall that we are using
Λ = 1 in this subsection). The relevant spatial varia-tions occur now only on an atomic scale, (see horizontalaxis). This reflects that Andreev processes are inhibitedby the absence of Fermi level down states deep withinthe magnet. We also see clear deviations from the puredamped sinusoidal behavior seen for the previous two ex-change field values. The superconducting region (bottompanel) follows the same pattern as the other cases, but
8
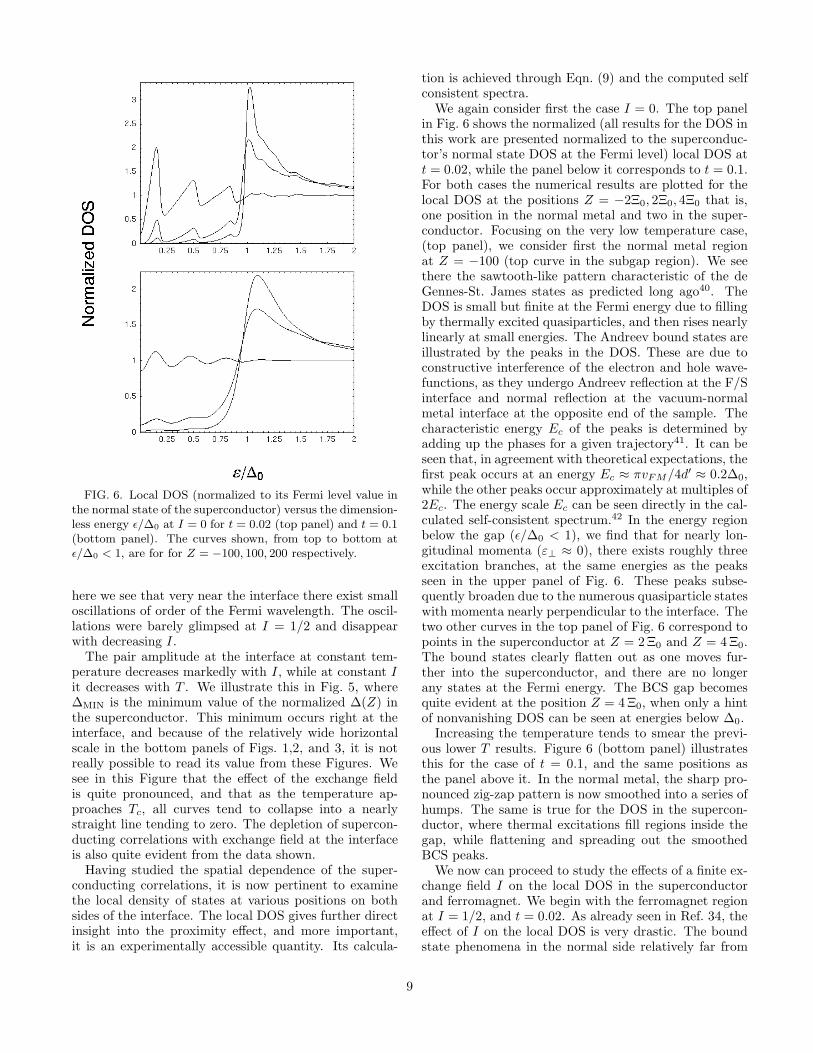
FIG. 6. Local DOS (normalized to its Fermi level value inthe normal state of the superconductor) versus the dimension-less energy ǫ/∆0 at I = 0 for t = 0.02 (top panel) and t = 0.1(bottom panel). The curves shown, from top to bottom atǫ/∆0 < 1, are for for Z = −100, 100, 200 respectively.
here we see that very near the interface there exist smalloscillations of order of the Fermi wavelength. The oscil-lations were barely glimpsed at I = 1/2 and disappearwith decreasing I.
The pair amplitude at the interface at constant tem-perature decreases markedly with I, while at constant Iit decreases with T . We illustrate this in Fig. 5, where∆MIN is the minimum value of the normalized ∆(Z) inthe superconductor. This minimum occurs right at theinterface, and because of the relatively wide horizontalscale in the bottom panels of Figs. 1,2, and 3, it is notreally possible to read its value from these Figures. Wesee in this Figure that the effect of the exchange fieldis quite pronounced, and that as the temperature ap-proaches Tc, all curves tend to collapse into a nearlystraight line tending to zero. The depletion of supercon-ducting correlations with exchange field at the interfaceis also quite evident from the data shown.
Having studied the spatial dependence of the super-conducting correlations, it is now pertinent to examinethe local density of states at various positions on bothsides of the interface. The local DOS gives further directinsight into the proximity effect, and more important,it is an experimentally accessible quantity. Its calcula-
tion is achieved through Eqn. (9) and the computed selfconsistent spectra.
We again consider first the case I = 0. The top panelin Fig. 6 shows the normalized (all results for the DOS inthis work are presented normalized to the superconduc-tor’s normal state DOS at the Fermi level) local DOS att = 0.02, while the panel below it corresponds to t = 0.1.For both cases the numerical results are plotted for thelocal DOS at the positions Z = −2Ξ0, 2Ξ0, 4Ξ0 that is,one position in the normal metal and two in the super-conductor. Focusing on the very low temperature case,(top panel), we consider first the normal metal regionat Z = −100 (top curve in the subgap region). We seethere the sawtooth-like pattern characteristic of the deGennes-St. James states as predicted long ago40. TheDOS is small but finite at the Fermi energy due to fillingby thermally excited quasiparticles, and then rises nearlylinearly at small energies. The Andreev bound states areillustrated by the peaks in the DOS. These are due toconstructive interference of the electron and hole wave-functions, as they undergo Andreev reflection at the F/Sinterface and normal reflection at the vacuum-normalmetal interface at the opposite end of the sample. Thecharacteristic energy Ec of the peaks is determined byadding up the phases for a given trajectory41. It can beseen that, in agreement with theoretical expectations, thefirst peak occurs at an energy Ec ≈ πvFM/4d′ ≈ 0.2∆0,while the other peaks occur approximately at multiples of2Ec. The energy scale Ec can be seen directly in the cal-culated self-consistent spectrum.42 In the energy regionbelow the gap (ǫ/∆0 < 1), we find that for nearly lon-gitudinal momenta (ε⊥ ≈ 0), there exists roughly threeexcitation branches, at the same energies as the peaksseen in the upper panel of Fig. 6. These peaks subse-quently broaden due to the numerous quasiparticle stateswith momenta nearly perpendicular to the interface. Thetwo other curves in the top panel of Fig. 6 correspond topoints in the superconductor at Z = 2 Ξ0 and Z = 4 Ξ0.The bound states clearly flatten out as one moves fur-ther into the superconductor, and there are no longerany states at the Fermi energy. The BCS gap becomesquite evident at the position Z = 4 Ξ0, when only a hintof nonvanishing DOS can be seen at energies below ∆0.
Increasing the temperature tends to smear the previ-ous lower T results. Figure 6 (bottom panel) illustratesthis for the case of t = 0.1, and the same positions asthe panel above it. In the normal metal, the sharp pro-nounced zig-zap pattern is now smoothed into a series ofhumps. The same is true for the DOS in the supercon-ductor, where thermal excitations fill regions inside thegap, while flattening and spreading out the smoothedBCS peaks.
We now can proceed to study the effects of a finite ex-change field I on the local DOS in the superconductorand ferromagnet. We begin with the ferromagnet regionat I = 1/2, and t = 0.02. As already seen in Ref. 34, theeffect of I on the local DOS is very drastic. The boundstate phenomena in the normal side relatively far from
9
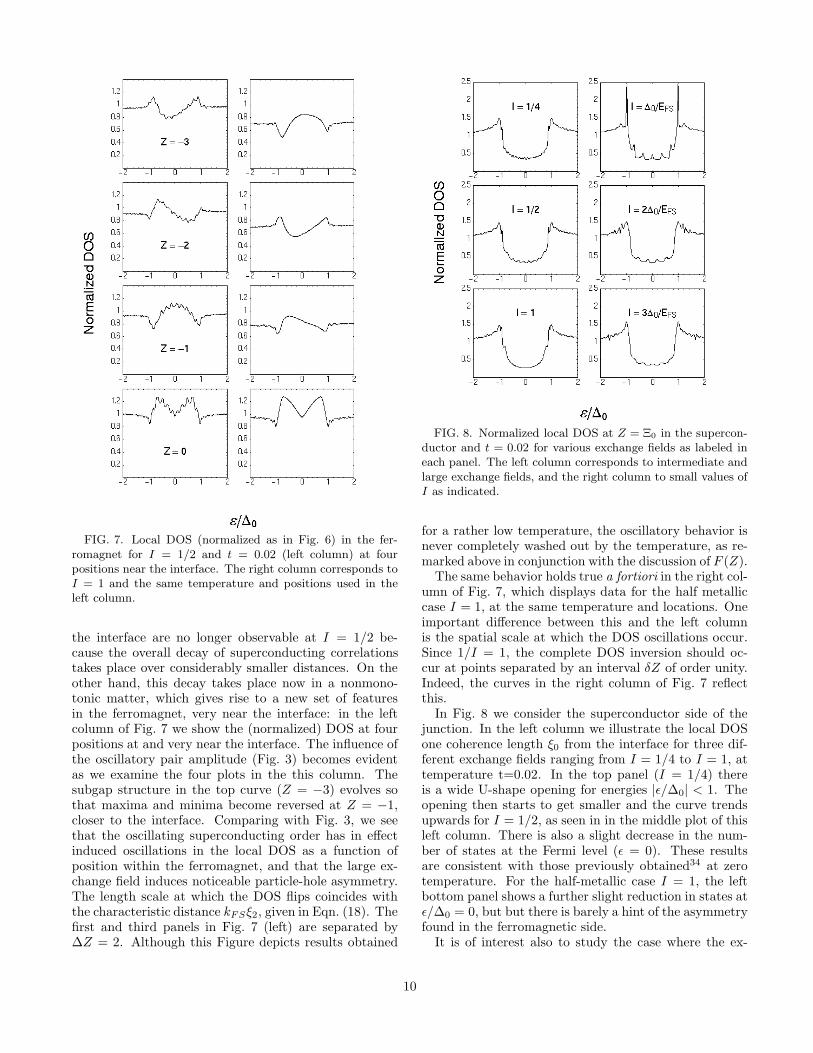
FIG. 7. Local DOS (normalized as in Fig. 6) in the fer-romagnet for I = 1/2 and t = 0.02 (left column) at fourpositions near the interface. The right column corresponds toI = 1 and the same temperature and positions used in theleft column.
the interface are no longer observable at I = 1/2 be-cause the overall decay of superconducting correlationstakes place over considerably smaller distances. On theother hand, this decay takes place now in a nonmono-tonic matter, which gives rise to a new set of featuresin the ferromagnet, very near the interface: in the leftcolumn of Fig. 7 we show the (normalized) DOS at fourpositions at and very near the interface. The influence ofthe oscillatory pair amplitude (Fig. 3) becomes evidentas we examine the four plots in the this column. Thesubgap structure in the top curve (Z = −3) evolves sothat maxima and minima become reversed at Z = −1,closer to the interface. Comparing with Fig. 3, we seethat the oscillating superconducting order has in effectinduced oscillations in the local DOS as a function ofposition within the ferromagnet, and that the large ex-change field induces noticeable particle-hole asymmetry.The length scale at which the DOS flips coincides withthe characteristic distance kFSξ2, given in Eqn. (18). Thefirst and third panels in Fig. 7 (left) are separated by∆Z = 2. Although this Figure depicts results obtained
FIG. 8. Normalized local DOS at Z = Ξ0 in the supercon-ductor and t = 0.02 for various exchange fields as labeled ineach panel. The left column corresponds to intermediate andlarge exchange fields, and the right column to small values ofI as indicated.
for a rather low temperature, the oscillatory behavior isnever completely washed out by the temperature, as re-marked above in conjunction with the discussion of F (Z).
The same behavior holds true a fortiori in the right col-umn of Fig. 7, which displays data for the half metalliccase I = 1, at the same temperature and locations. Oneimportant difference between this and the left columnis the spatial scale at which the DOS oscillations occur.Since 1/I = 1, the complete DOS inversion should oc-cur at points separated by an interval δZ of order unity.Indeed, the curves in the right column of Fig. 7 reflectthis.
In Fig. 8 we consider the superconductor side of thejunction. In the left column we illustrate the local DOSone coherence length ξ0 from the interface for three dif-ferent exchange fields ranging from I = 1/4 to I = 1, attemperature t=0.02. In the top panel (I = 1/4) thereis a wide U-shape opening for energies |ǫ/∆0| < 1. Theopening then starts to get smaller and the curve trendsupwards for I = 1/2, as seen in in the middle plot of thisleft column. There is also a slight decrease in the num-ber of states at the Fermi level (ǫ = 0). These resultsare consistent with those previously obtained34 at zerotemperature. For the half-metallic case I = 1, the leftbottom panel shows a further slight reduction in states atǫ/∆0 = 0, but but there is barely a hint of the asymmetryfound in the ferromagnetic side.
It is of interest also to study the case where the ex-
10
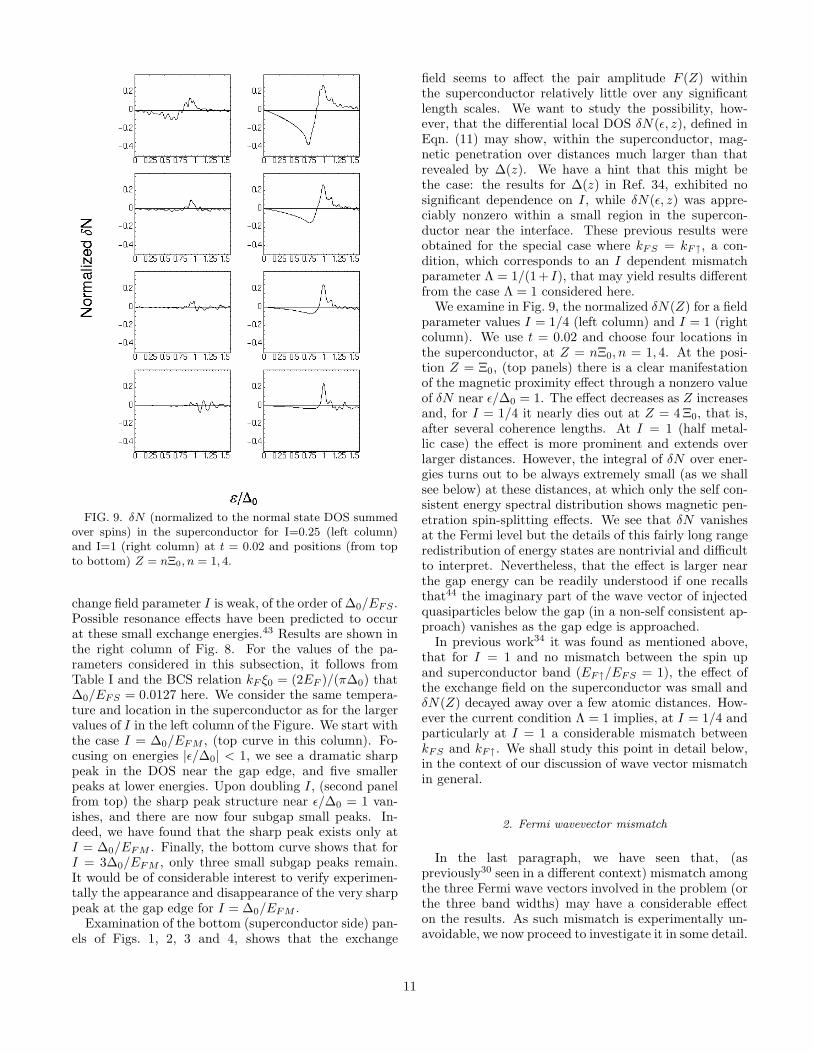
FIG. 9. δN (normalized to the normal state DOS summedover spins) in the superconductor for I=0.25 (left column)and I=1 (right column) at t = 0.02 and positions (from topto bottom) Z = nΞ0, n = 1, 4.
change field parameter I is weak, of the order of ∆0/EFS .Possible resonance effects have been predicted to occurat these small exchange energies.43 Results are shown inthe right column of Fig. 8. For the values of the pa-rameters considered in this subsection, it follows fromTable I and the BCS relation kF ξ0 = (2EF )/(π∆0) that∆0/EFS = 0.0127 here. We consider the same tempera-ture and location in the superconductor as for the largervalues of I in the left column of the Figure. We start withthe case I = ∆0/EFM , (top curve in this column). Fo-cusing on energies |ǫ/∆0| < 1, we see a dramatic sharppeak in the DOS near the gap edge, and five smallerpeaks at lower energies. Upon doubling I, (second panelfrom top) the sharp peak structure near ǫ/∆0 = 1 van-ishes, and there are now four subgap small peaks. In-deed, we have found that the sharp peak exists only atI = ∆0/EFM . Finally, the bottom curve shows that forI = 3∆0/EFM , only three small subgap peaks remain.It would be of considerable interest to verify experimen-tally the appearance and disappearance of the very sharppeak at the gap edge for I = ∆0/EFM .
Examination of the bottom (superconductor side) pan-els of Figs. 1, 2, 3 and 4, shows that the exchange
field seems to affect the pair amplitude F (Z) withinthe superconductor relatively little over any significantlength scales. We want to study the possibility, how-ever, that the differential local DOS δN(ǫ, z), defined inEqn. (11) may show, within the superconductor, mag-netic penetration over distances much larger than thatrevealed by ∆(z). We have a hint that this might bethe case: the results for ∆(z) in Ref. 34, exhibited nosignificant dependence on I, while δN(ǫ, z) was appre-ciably nonzero within a small region in the supercon-ductor near the interface. These previous results wereobtained for the special case where kFS = kF↑, a con-dition, which corresponds to an I dependent mismatchparameter Λ = 1/(1+ I), that may yield results differentfrom the case Λ = 1 considered here.
We examine in Fig. 9, the normalized δN(Z) for a fieldparameter values I = 1/4 (left column) and I = 1 (rightcolumn). We use t = 0.02 and choose four locations inthe superconductor, at Z = nΞ0, n = 1, 4. At the posi-tion Z = Ξ0, (top panels) there is a clear manifestationof the magnetic proximity effect through a nonzero valueof δN near ǫ/∆0 = 1. The effect decreases as Z increasesand, for I = 1/4 it nearly dies out at Z = 4 Ξ0, that is,after several coherence lengths. At I = 1 (half metal-lic case) the effect is more prominent and extends overlarger distances. However, the integral of δN over ener-gies turns out to be always extremely small (as we shallsee below) at these distances, at which only the self con-sistent energy spectral distribution shows magnetic pen-etration spin-splitting effects. We see that δN vanishesat the Fermi level but the details of this fairly long rangeredistribution of energy states are nontrivial and difficultto interpret. Nevertheless, that the effect is larger nearthe gap energy can be readily understood if one recallsthat44 the imaginary part of the wave vector of injectedquasiparticles below the gap (in a non-self consistent ap-proach) vanishes as the gap edge is approached.
In previous work34 it was found as mentioned above,that for I = 1 and no mismatch between the spin upand superconductor band (EF↑/EFS = 1), the effect ofthe exchange field on the superconductor was small andδN(Z) decayed away over a few atomic distances. How-ever the current condition Λ = 1 implies, at I = 1/4 andparticularly at I = 1 a considerable mismatch betweenkFS and kF↑. We shall study this point in detail below,in the context of our discussion of wave vector mismatchin general.
2. Fermi wavevector mismatch
In the last paragraph, we have seen that, (aspreviously30 seen in a different context) mismatch amongthe three Fermi wave vectors involved in the problem (orthe three band widths) may have a considerable effecton the results. As such mismatch is experimentally un-avoidable, we now proceed to investigate it in some detail.
11
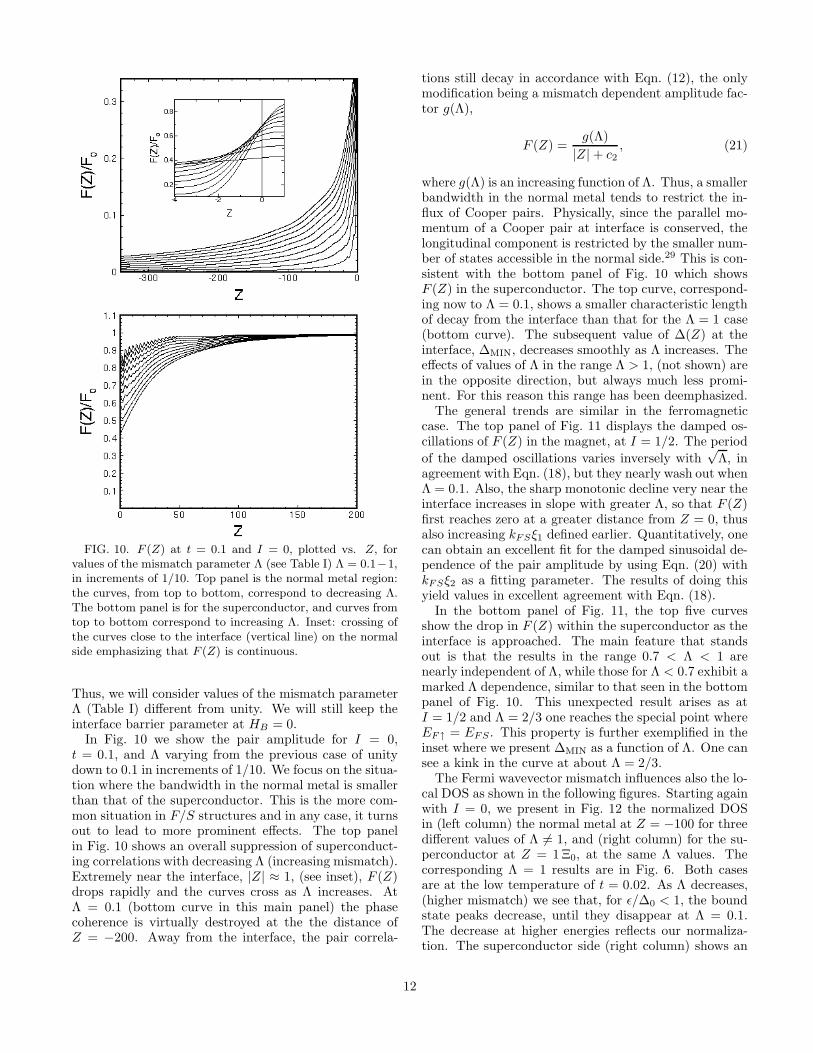
FIG. 10. F (Z) at t = 0.1 and I = 0, plotted vs. Z, forvalues of the mismatch parameter Λ (see Table I) Λ = 0.1−1,in increments of 1/10. Top panel is the normal metal region:the curves, from top to bottom, correspond to decreasing Λ.The bottom panel is for the superconductor, and curves fromtop to bottom correspond to increasing Λ. Inset: crossing ofthe curves close to the interface (vertical line) on the normalside emphasizing that F (Z) is continuous.
Thus, we will consider values of the mismatch parameterΛ (Table I) different from unity. We will still keep theinterface barrier parameter at HB = 0.
In Fig. 10 we show the pair amplitude for I = 0,t = 0.1, and Λ varying from the previous case of unitydown to 0.1 in increments of 1/10. We focus on the situa-tion where the bandwidth in the normal metal is smallerthan that of the superconductor. This is the more com-mon situation in F/S structures and in any case, it turnsout to lead to more prominent effects. The top panelin Fig. 10 shows an overall suppression of superconduct-ing correlations with decreasing Λ (increasing mismatch).Extremely near the interface, |Z| ≈ 1, (see inset), F (Z)drops rapidly and the curves cross as Λ increases. AtΛ = 0.1 (bottom curve in this main panel) the phasecoherence is virtually destroyed at the the distance ofZ = −200. Away from the interface, the pair correla-
tions still decay in accordance with Eqn. (12), the onlymodification being a mismatch dependent amplitude fac-tor g(Λ),
F (Z) =g(Λ)
|Z| + c2
, (21)
where g(Λ) is an increasing function of Λ. Thus, a smallerbandwidth in the normal metal tends to restrict the in-flux of Cooper pairs. Physically, since the parallel mo-mentum of a Cooper pair at interface is conserved, thelongitudinal component is restricted by the smaller num-ber of states accessible in the normal side.29 This is con-sistent with the bottom panel of Fig. 10 which showsF (Z) in the superconductor. The top curve, correspond-ing now to Λ = 0.1, shows a smaller characteristic lengthof decay from the interface than that for the Λ = 1 case(bottom curve). The subsequent value of ∆(Z) at theinterface, ∆MIN, decreases smoothly as Λ increases. Theeffects of values of Λ in the range Λ > 1, (not shown) arein the opposite direction, but always much less promi-nent. For this reason this range has been deemphasized.
The general trends are similar in the ferromagneticcase. The top panel of Fig. 11 displays the damped os-cillations of F (Z) in the magnet, at I = 1/2. The period
of the damped oscillations varies inversely with√
Λ, inagreement with Eqn. (18), but they nearly wash out whenΛ = 0.1. Also, the sharp monotonic decline very near theinterface increases in slope with greater Λ, so that F (Z)first reaches zero at a greater distance from Z = 0, thusalso increasing kFSξ1 defined earlier. Quantitatively, onecan obtain an excellent fit for the damped sinusoidal de-pendence of the pair amplitude by using Eqn. (20) withkFSξ2 as a fitting parameter. The results of doing thisyield values in excellent agreement with Eqn. (18).
In the bottom panel of Fig. 11, the top five curvesshow the drop in F (Z) within the superconductor as theinterface is approached. The main feature that standsout is that the results in the range 0.7 < Λ < 1 arenearly independent of Λ, while those for Λ < 0.7 exhibit amarked Λ dependence, similar to that seen in the bottompanel of Fig. 10. This unexpected result arises as atI = 1/2 and Λ = 2/3 one reaches the special point whereEF↑ = EFS . This property is further exemplified in theinset where we present ∆MIN as a function of Λ. One cansee a kink in the curve at about Λ = 2/3.
The Fermi wavevector mismatch influences also the lo-cal DOS as shown in the following figures. Starting againwith I = 0, we present in Fig. 12 the normalized DOSin (left column) the normal metal at Z = −100 for threedifferent values of Λ 6= 1, and (right column) for the su-perconductor at Z = 1 Ξ0, at the same Λ values. Thecorresponding Λ = 1 results are in Fig. 6. Both casesare at the low temperature of t = 0.02. As Λ decreases,(higher mismatch) we see that, for ǫ/∆0 < 1, the boundstate peaks decrease, until they disappear at Λ = 0.1.The decrease at higher energies reflects our normaliza-tion. The superconductor side (right column) shows an
12
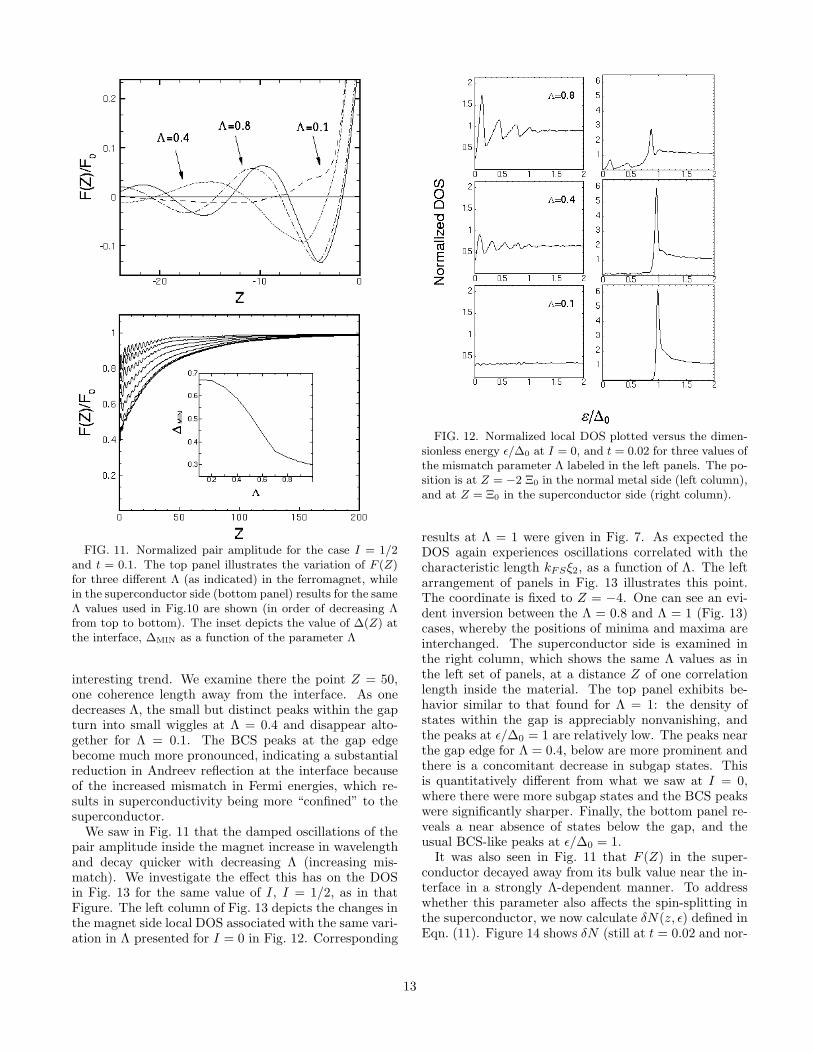
FIG. 11. Normalized pair amplitude for the case I = 1/2and t = 0.1. The top panel illustrates the variation of F (Z)for three different Λ (as indicated) in the ferromagnet, whilein the superconductor side (bottom panel) results for the sameΛ values used in Fig.10 are shown (in order of decreasing Λfrom top to bottom). The inset depicts the value of ∆(Z) atthe interface, ∆MIN as a function of the parameter Λ
interesting trend. We examine there the point Z = 50,one coherence length away from the interface. As onedecreases Λ, the small but distinct peaks within the gapturn into small wiggles at Λ = 0.4 and disappear alto-gether for Λ = 0.1. The BCS peaks at the gap edgebecome much more pronounced, indicating a substantialreduction in Andreev reflection at the interface becauseof the increased mismatch in Fermi energies, which re-sults in superconductivity being more “confined” to thesuperconductor.
We saw in Fig. 11 that the damped oscillations of thepair amplitude inside the magnet increase in wavelengthand decay quicker with decreasing Λ (increasing mis-match). We investigate the effect this has on the DOSin Fig. 13 for the same value of I, I = 1/2, as in thatFigure. The left column of Fig. 13 depicts the changes inthe magnet side local DOS associated with the same vari-ation in Λ presented for I = 0 in Fig. 12. Corresponding
FIG. 12. Normalized local DOS plotted versus the dimen-sionless energy ǫ/∆0 at I = 0, and t = 0.02 for three values ofthe mismatch parameter Λ labeled in the left panels. The po-sition is at Z = −2 Ξ0 in the normal metal side (left column),and at Z = Ξ0 in the superconductor side (right column).
results at Λ = 1 were given in Fig. 7. As expected theDOS again experiences oscillations correlated with thecharacteristic length kFSξ2, as a function of Λ. The leftarrangement of panels in Fig. 13 illustrates this point.The coordinate is fixed to Z = −4. One can see an evi-dent inversion between the Λ = 0.8 and Λ = 1 (Fig. 13)cases, whereby the positions of minima and maxima areinterchanged. The superconductor side is examined inthe right column, which shows the same Λ values as inthe left set of panels, at a distance Z of one correlationlength inside the material. The top panel exhibits be-havior similar to that found for Λ = 1: the density ofstates within the gap is appreciably nonvanishing, andthe peaks at ǫ/∆0 = 1 are relatively low. The peaks nearthe gap edge for Λ = 0.4, below are more prominent andthere is a concomitant decrease in subgap states. Thisis quantitatively different from what we saw at I = 0,where there were more subgap states and the BCS peakswere significantly sharper. Finally, the bottom panel re-veals a near absence of states below the gap, and theusual BCS-like peaks at ǫ/∆0 = 1.
It was also seen in Fig. 11 that F (Z) in the super-conductor decayed away from its bulk value near the in-terface in a strongly Λ-dependent manner. To addresswhether this parameter also affects the spin-splitting inthe superconductor, we now calculate δN(z, ǫ) defined inEqn. (11). Figure 14 shows δN (still at t = 0.02 and nor-
13
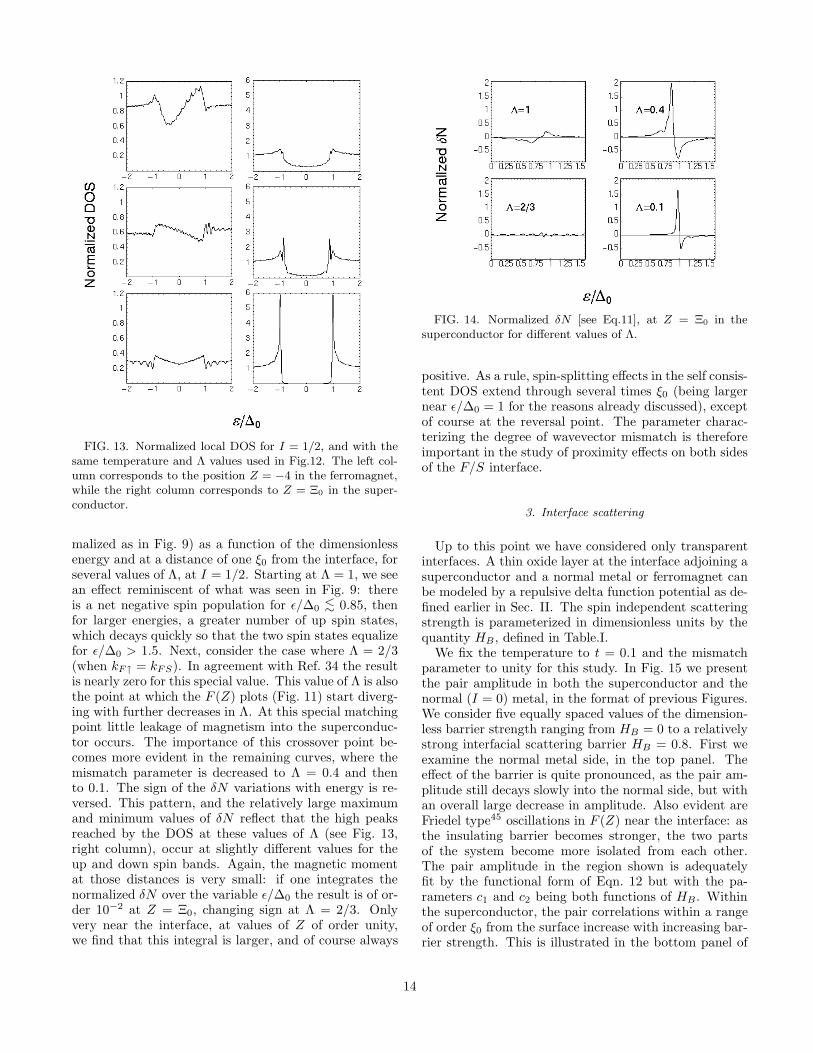
FIG. 13. Normalized local DOS for I = 1/2, and with thesame temperature and Λ values used in Fig.12. The left col-umn corresponds to the position Z = −4 in the ferromagnet,while the right column corresponds to Z = Ξ0 in the super-conductor.
malized as in Fig. 9) as a function of the dimensionlessenergy and at a distance of one ξ0 from the interface, forseveral values of Λ, at I = 1/2. Starting at Λ = 1, we seean effect reminiscent of what was seen in Fig. 9: thereis a net negative spin population for ǫ/∆0
<∼ 0.85, thenfor larger energies, a greater number of up spin states,which decays quickly so that the two spin states equalizefor ǫ/∆0 > 1.5. Next, consider the case where Λ = 2/3(when kF↑ = kFS). In agreement with Ref. 34 the resultis nearly zero for this special value. This value of Λ is alsothe point at which the F (Z) plots (Fig. 11) start diverg-ing with further decreases in Λ. At this special matchingpoint little leakage of magnetism into the superconduc-tor occurs. The importance of this crossover point be-comes more evident in the remaining curves, where themismatch parameter is decreased to Λ = 0.4 and thento 0.1. The sign of the δN variations with energy is re-versed. This pattern, and the relatively large maximumand minimum values of δN reflect that the high peaksreached by the DOS at these values of Λ (see Fig. 13,right column), occur at slightly different values for theup and down spin bands. Again, the magnetic momentat those distances is very small: if one integrates thenormalized δN over the variable ǫ/∆0 the result is of or-der 10−2 at Z = Ξ0, changing sign at Λ = 2/3. Onlyvery near the interface, at values of Z of order unity,we find that this integral is larger, and of course always
FIG. 14. Normalized δN [see Eq.11], at Z = Ξ0 in thesuperconductor for different values of Λ.
positive. As a rule, spin-splitting effects in the self consis-tent DOS extend through several times ξ0 (being largernear ǫ/∆0 = 1 for the reasons already discussed), exceptof course at the reversal point. The parameter charac-terizing the degree of wavevector mismatch is thereforeimportant in the study of proximity effects on both sidesof the F/S interface.
3. Interface scattering
Up to this point we have considered only transparentinterfaces. A thin oxide layer at the interface adjoining asuperconductor and a normal metal or ferromagnet canbe modeled by a repulsive delta function potential as de-fined earlier in Sec. II. The spin independent scatteringstrength is parameterized in dimensionless units by thequantity HB, defined in Table.I.
We fix the temperature to t = 0.1 and the mismatchparameter to unity for this study. In Fig. 15 we presentthe pair amplitude in both the superconductor and thenormal (I = 0) metal, in the format of previous Figures.We consider five equally spaced values of the dimension-less barrier strength ranging from HB = 0 to a relativelystrong interfacial scattering barrier HB = 0.8. First weexamine the normal metal side, in the top panel. Theeffect of the barrier is quite pronounced, as the pair am-plitude still decays slowly into the normal side, but withan overall large decrease in amplitude. Also evident areFriedel type45 oscillations in F (Z) near the interface: asthe insulating barrier becomes stronger, the two partsof the system become more isolated from each other.The pair amplitude in the region shown is adequatelyfit by the functional form of Eqn. 12 but with the pa-rameters c1 and c2 being both functions of HB. Withinthe superconductor, the pair correlations within a rangeof order ξ0 from the surface increase with increasing bar-rier strength. This is illustrated in the bottom panel of
14
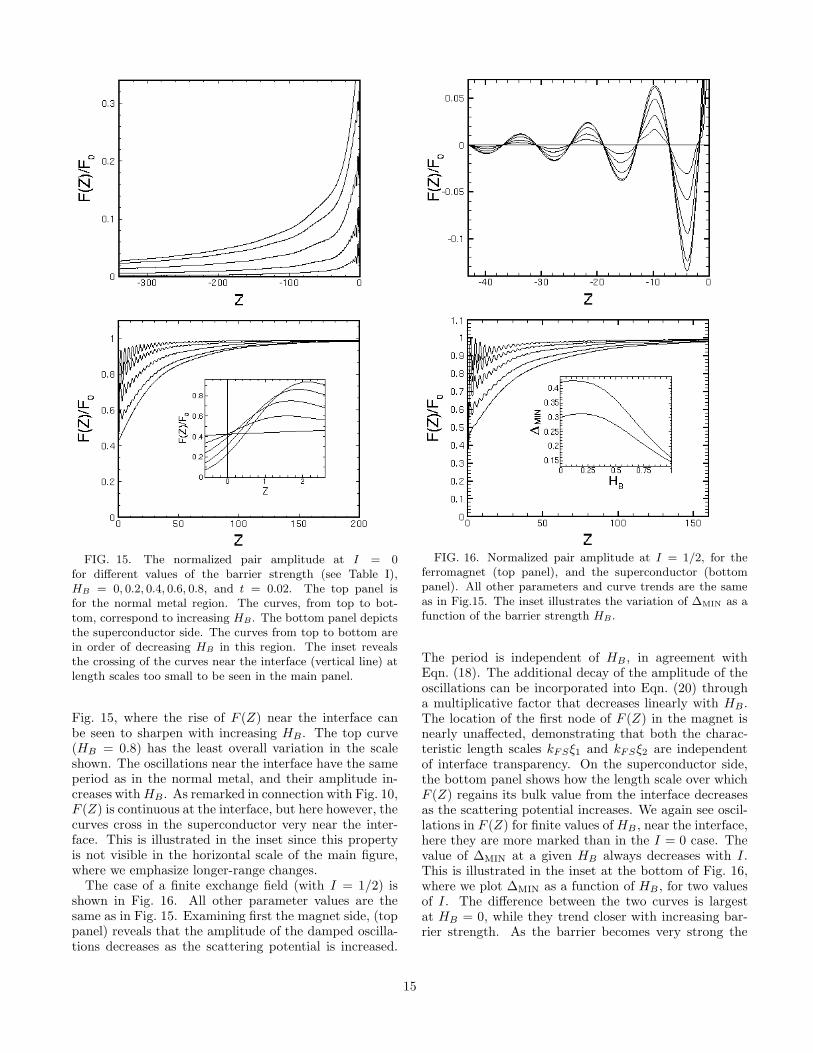
FIG. 15. The normalized pair amplitude at I = 0for different values of the barrier strength (see Table I),HB = 0, 0.2, 0.4, 0.6, 0.8, and t = 0.02. The top panel isfor the normal metal region. The curves, from top to bot-tom, correspond to increasing HB. The bottom panel depictsthe superconductor side. The curves from top to bottom arein order of decreasing HB in this region. The inset revealsthe crossing of the curves near the interface (vertical line) atlength scales too small to be seen in the main panel.
Fig. 15, where the rise of F (Z) near the interface canbe seen to sharpen with increasing HB. The top curve(HB = 0.8) has the least overall variation in the scaleshown. The oscillations near the interface have the sameperiod as in the normal metal, and their amplitude in-creases with HB. As remarked in connection with Fig. 10,F (Z) is continuous at the interface, but here however, thecurves cross in the superconductor very near the inter-face. This is illustrated in the inset since this propertyis not visible in the horizontal scale of the main figure,where we emphasize longer-range changes.
The case of a finite exchange field (with I = 1/2) isshown in Fig. 16. All other parameter values are thesame as in Fig. 15. Examining first the magnet side, (toppanel) reveals that the amplitude of the damped oscilla-tions decreases as the scattering potential is increased.
FIG. 16. Normalized pair amplitude at I = 1/2, for theferromagnet (top panel), and the superconductor (bottompanel). All other parameters and curve trends are the sameas in Fig.15. The inset illustrates the variation of ∆MIN as afunction of the barrier strength HB.
The period is independent of HB , in agreement withEqn. (18). The additional decay of the amplitude of theoscillations can be incorporated into Eqn. (20) througha multiplicative factor that decreases linearly with HB.The location of the first node of F (Z) in the magnet isnearly unaffected, demonstrating that both the charac-teristic length scales kFSξ1 and kFSξ2 are independentof interface transparency. On the superconductor side,the bottom panel shows how the length scale over whichF (Z) regains its bulk value from the interface decreasesas the scattering potential increases. We again see oscil-lations in F (Z) for finite values of HB , near the interface,here they are more marked than in the I = 0 case. Thevalue of ∆MIN at a given HB always decreases with I.This is illustrated in the inset at the bottom of Fig. 16,where we plot ∆MIN as a function of HB , for two valuesof I. The difference between the two curves is largestat HB = 0, while they trend closer with increasing bar-rier strength. As the barrier becomes very strong the
15
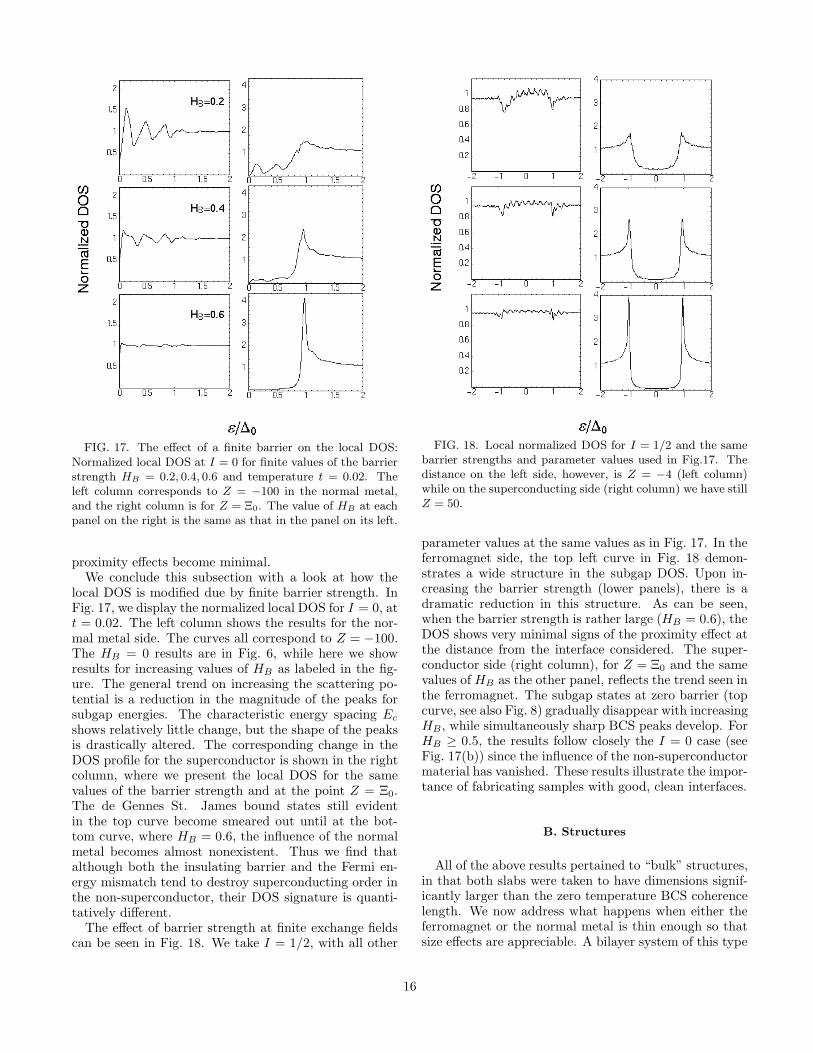
FIG. 17. The effect of a finite barrier on the local DOS:Normalized local DOS at I = 0 for finite values of the barrierstrength HB = 0.2, 0.4, 0.6 and temperature t = 0.02. Theleft column corresponds to Z = −100 in the normal metal,and the right column is for Z = Ξ0. The value of HB at eachpanel on the right is the same as that in the panel on its left.
proximity effects become minimal.We conclude this subsection with a look at how the
local DOS is modified due by finite barrier strength. InFig. 17, we display the normalized local DOS for I = 0, att = 0.02. The left column shows the results for the nor-mal metal side. The curves all correspond to Z = −100.The HB = 0 results are in Fig. 6, while here we showresults for increasing values of HB as labeled in the fig-ure. The general trend on increasing the scattering po-tential is a reduction in the magnitude of the peaks forsubgap energies. The characteristic energy spacing Ec
shows relatively little change, but the shape of the peaksis drastically altered. The corresponding change in theDOS profile for the superconductor is shown in the rightcolumn, where we present the local DOS for the samevalues of the barrier strength and at the point Z = Ξ0.The de Gennes St. James bound states still evidentin the top curve become smeared out until at the bot-tom curve, where HB = 0.6, the influence of the normalmetal becomes almost nonexistent. Thus we find thatalthough both the insulating barrier and the Fermi en-ergy mismatch tend to destroy superconducting order inthe non-superconductor, their DOS signature is quanti-tatively different.
The effect of barrier strength at finite exchange fieldscan be seen in Fig. 18. We take I = 1/2, with all other
FIG. 18. Local normalized DOS for I = 1/2 and the samebarrier strengths and parameter values used in Fig.17. Thedistance on the left side, however, is Z = −4 (left column)while on the superconducting side (right column) we have stillZ = 50.
parameter values at the same values as in Fig. 17. In theferromagnet side, the top left curve in Fig. 18 demon-strates a wide structure in the subgap DOS. Upon in-creasing the barrier strength (lower panels), there is adramatic reduction in this structure. As can be seen,when the barrier strength is rather large (HB = 0.6), theDOS shows very minimal signs of the proximity effect atthe distance from the interface considered. The super-conductor side (right column), for Z = Ξ0 and the samevalues of HB as the other panel, reflects the trend seen inthe ferromagnet. The subgap states at zero barrier (topcurve, see also Fig. 8) gradually disappear with increasingHB, while simultaneously sharp BCS peaks develop. ForHB ≥ 0.5, the results follow closely the I = 0 case (seeFig. 17(b)) since the influence of the non-superconductormaterial has vanished. These results illustrate the impor-tance of fabricating samples with good, clean interfaces.
B. Structures
All of the above results pertained to “bulk” structures,in that both slabs were taken to have dimensions signif-icantly larger than the zero temperature BCS coherencelength. We now address what happens when either theferromagnet or the normal metal is thin enough so thatsize effects are appreciable. A bilayer system of this type
16
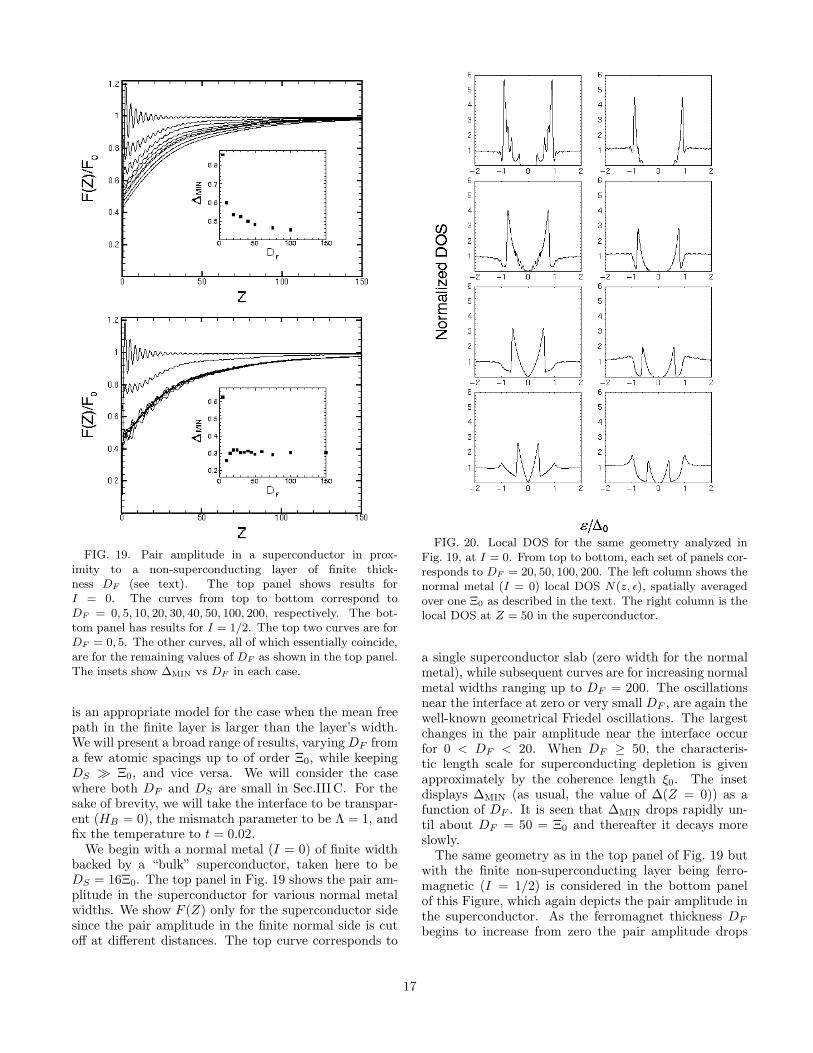
FIG. 19. Pair amplitude in a superconductor in prox-imity to a non-superconducting layer of finite thick-ness DF (see text). The top panel shows results forI = 0. The curves from top to bottom correspond toDF = 0, 5, 10, 20, 30, 40, 50, 100, 200, respectively. The bot-tom panel has results for I = 1/2. The top two curves are forDF = 0, 5. The other curves, all of which essentially coincide,are for the remaining values of DF as shown in the top panel.The insets show ∆MIN vs DF in each case.
is an appropriate model for the case when the mean freepath in the finite layer is larger than the layer’s width.We will present a broad range of results, varying DF froma few atomic spacings up to of order Ξ0, while keepingDS ≫ Ξ0, and vice versa. We will consider the casewhere both DF and DS are small in Sec.III C. For thesake of brevity, we will take the interface to be transpar-ent (HB = 0), the mismatch parameter to be Λ = 1, andfix the temperature to t = 0.02.
We begin with a normal metal (I = 0) of finite widthbacked by a “bulk” superconductor, taken here to beDS = 16Ξ0. The top panel in Fig. 19 shows the pair am-plitude in the superconductor for various normal metalwidths. We show F (Z) only for the superconductor sidesince the pair amplitude in the finite normal side is cutoff at different distances. The top curve corresponds to
FIG. 20. Local DOS for the same geometry analyzed inFig. 19, at I = 0. From top to bottom, each set of panels cor-responds to DF = 20, 50, 100, 200. The left column shows thenormal metal (I = 0) local DOS N(z, ǫ), spatially averagedover one Ξ0 as described in the text. The right column is thelocal DOS at Z = 50 in the superconductor.
a single superconductor slab (zero width for the normalmetal), while subsequent curves are for increasing normalmetal widths ranging up to DF = 200. The oscillationsnear the interface at zero or very small DF , are again thewell-known geometrical Friedel oscillations. The largestchanges in the pair amplitude near the interface occurfor 0 < DF < 20. When DF ≥ 50, the characteris-tic length scale for superconducting depletion is givenapproximately by the coherence length ξ0. The insetdisplays ∆MIN (as usual, the value of ∆(Z = 0)) as afunction of DF . It is seen that ∆MIN drops rapidly un-til about DF = 50 = Ξ0 and thereafter it decays moreslowly.
The same geometry as in the top panel of Fig. 19 butwith the finite non-superconducting layer being ferro-magnetic (I = 1/2) is considered in the bottom panelof this Figure, which again depicts the pair amplitude inthe superconductor. As the ferromagnet thickness DF
begins to increase from zero the pair amplitude drops
17
very rapidly, as in the I = 0 limit. A notable distinc-tion exists here however. When DF is larger than aboutDF = 10, the characteristic length scale over which F (Z)rises to its bulk value becomes approximately indepen-dent of DF . This behavior is also seen in more detail inthe inset of the same Figure where we plot ∆MIN as afunction of DF . The decay of ∆MIN occurs nearly en-tirely in the region DF ≤ 10, while for I = 0 it takesplace over a much more extended range. This of coursereflects that the superconducting penetration (at low T )into the normal metal is very large, while for a magnetwith I = 1/2 it is characterized by a length of order ξ2.Once DF reaches that limit, further increases are ineffec-tive.
We have also calculated the DOS for the geometriesused in Fig. 19. Since the non-superconductor layer is insome cases quite thin (DF < Ξ0), the local DOS in thenormal region exhibits strong oscillations as a functionof Z. For this reason, we present results for the spa-tial average of N(Z, ǫ) over a distance in the Z directionequal to the layer thickness DF if DF < Ξ0, or over onedimensionless coherence length, Ξ0, if DF > Ξ0. In thelatter case this average is centered at Z = −DF + Ξ0/2.We present in the left column of Fig. 20, the averagedDOS within the normal (I = 0) metal for four differentthicknesses, at t = 0.02. The top left panel correspondsto a thin film with DF = 20 (recall the superconductoris in the bulk limit). A clear “mini gap” structure ispresent. As DF is increased to DF = 50, a much smallergap remains, and multiple ripples rise to two larger boundstate peaks. If DF is doubled again to DF = 100, the gapdisappears. Upon increasing DF further to DF = 200,we see another peak emerge and form the initial stagesof the sawtooth-like profile seen earlier in bulk systems(see Fig. 6). Thus we find that there exists a maximumthickness for the normal metal DF ≈ Ξ0, such that, if ex-ceeded, the gap in the normal side DOS disappears. Theobserved filling in of the states originates from quasi-particles with relatively large momenta parallel to theinterface (k⊥ ≈ kFS).
In the right column of Fig. 20, the local DOS in thesuperconductor at a distance Z = Ξ0 from the inter-face is shown. Here we do not spatially average the localDOS, since we are in the bulk regime and the DOS variessmoothly. We present the local DOS at Z = Ξ0, while allother parameters take the values used previously in theleft column. The top curve (DF = 20) shows a widen-ing of the gap, while the main peaks still remain belowǫ/∆0 = 1. The panel below demonstrates the boundstate peaks being pushed further towards the Fermi level.For DF = 100, the single pair of peaks has moved inwardeven further as a marked through develops at ǫ/∆0 ≈ 1.The effect is more pronounced in the bottom curve, whereDF = 4Ξ0, and the de Gennes St. James states havebecome smaller than the main peaks that have formednear the gap edge, which eventually develop into BCS-like peaks deeper within the superconductor.
We consider next the DOS when the non supercon-
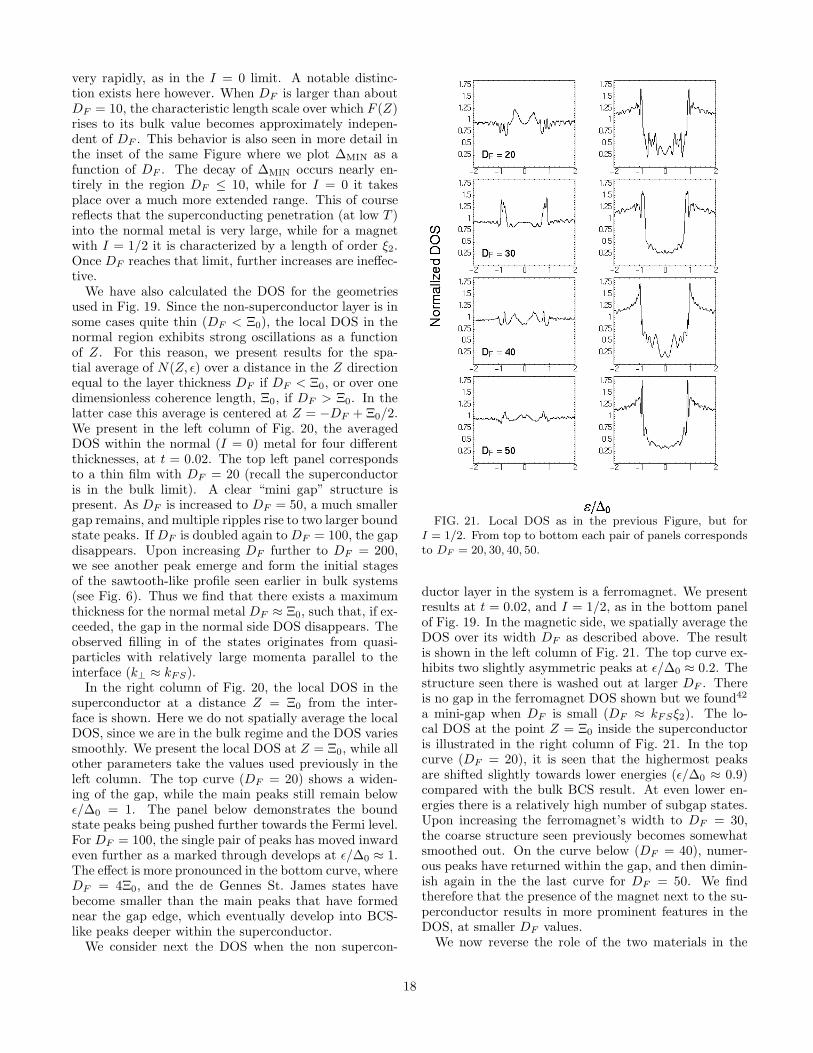
FIG. 21. Local DOS as in the previous Figure, but forI = 1/2. From top to bottom each pair of panels correspondsto DF = 20, 30, 40, 50.
ductor layer in the system is a ferromagnet. We presentresults at t = 0.02, and I = 1/2, as in the bottom panelof Fig. 19. In the magnetic side, we spatially average theDOS over its width DF as described above. The resultis shown in the left column of Fig. 21. The top curve ex-hibits two slightly asymmetric peaks at ǫ/∆0 ≈ 0.2. Thestructure seen there is washed out at larger DF . Thereis no gap in the ferromagnet DOS shown but we found42
a mini-gap when DF is small (DF ≈ kFSξ2). The lo-cal DOS at the point Z = Ξ0 inside the superconductoris illustrated in the right column of Fig. 21. In the topcurve (DF = 20), it is seen that the highermost peaksare shifted slightly towards lower energies (ǫ/∆0 ≈ 0.9)compared with the bulk BCS result. At even lower en-ergies there is a relatively high number of subgap states.Upon increasing the ferromagnet’s width to DF = 30,the coarse structure seen previously becomes somewhatsmoothed out. On the curve below (DF = 40), numer-ous peaks have returned within the gap, and then dimin-ish again in the the last curve for DF = 50. We findtherefore that the presence of the magnet next to the su-perconductor results in more prominent features in theDOS, at smaller DF values.
We now reverse the role of the two materials in the
18
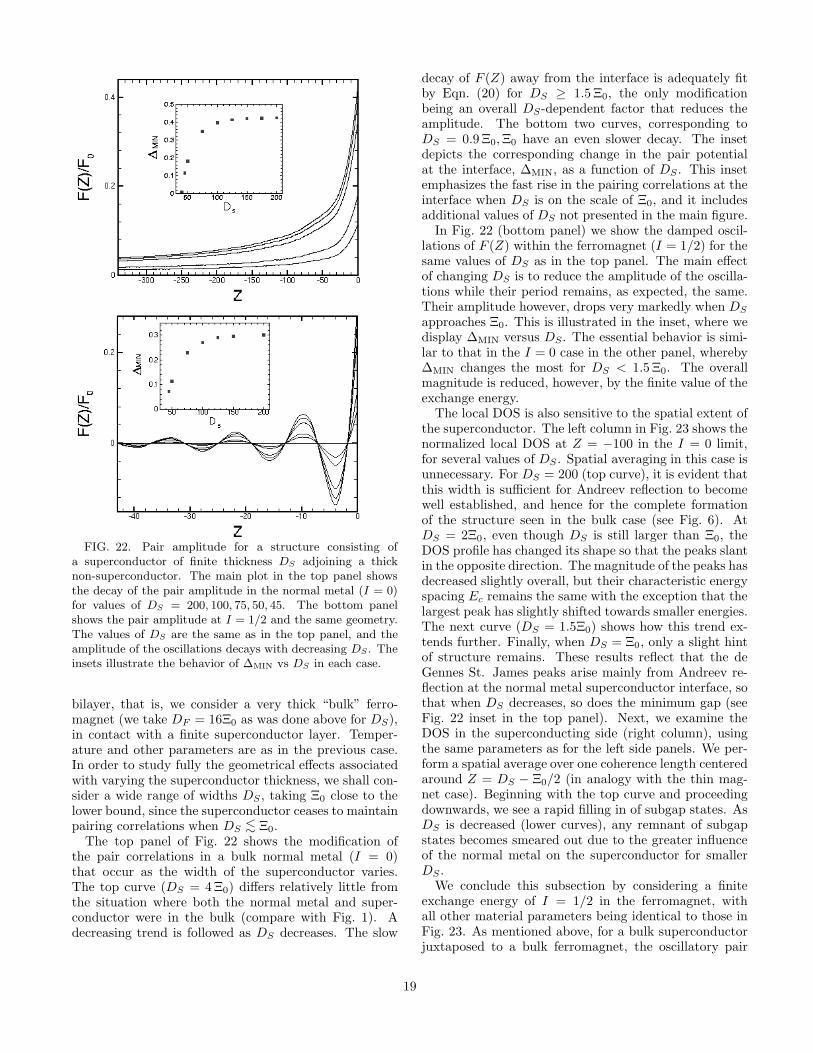
FIG. 22. Pair amplitude for a structure consisting ofa superconductor of finite thickness DS adjoining a thicknon-superconductor. The main plot in the top panel showsthe decay of the pair amplitude in the normal metal (I = 0)for values of DS = 200, 100, 75, 50, 45. The bottom panelshows the pair amplitude at I = 1/2 and the same geometry.The values of DS are the same as in the top panel, and theamplitude of the oscillations decays with decreasing DS. Theinsets illustrate the behavior of ∆MIN vs DS in each case.
bilayer, that is, we consider a very thick “bulk” ferro-magnet (we take DF = 16Ξ0 as was done above for DS),in contact with a finite superconductor layer. Temper-ature and other parameters are as in the previous case.In order to study fully the geometrical effects associatedwith varying the superconductor thickness, we shall con-sider a wide range of widths DS , taking Ξ0 close to thelower bound, since the superconductor ceases to maintainpairing correlations when DS
<∼ Ξ0.The top panel of Fig. 22 shows the modification of
the pair correlations in a bulk normal metal (I = 0)that occur as the width of the superconductor varies.The top curve (DS = 4 Ξ0) differs relatively little fromthe situation where both the normal metal and super-conductor were in the bulk (compare with Fig. 1). Adecreasing trend is followed as DS decreases. The slow
decay of F (Z) away from the interface is adequately fitby Eqn. (20) for DS ≥ 1.5 Ξ0, the only modificationbeing an overall DS-dependent factor that reduces theamplitude. The bottom two curves, corresponding toDS = 0.9 Ξ0, Ξ0 have an even slower decay. The insetdepicts the corresponding change in the pair potentialat the interface, ∆MIN, as a function of DS . This insetemphasizes the fast rise in the pairing correlations at theinterface when DS is on the scale of Ξ0, and it includesadditional values of DS not presented in the main figure.
In Fig. 22 (bottom panel) we show the damped oscil-lations of F (Z) within the ferromagnet (I = 1/2) for thesame values of DS as in the top panel. The main effectof changing DS is to reduce the amplitude of the oscilla-tions while their period remains, as expected, the same.Their amplitude however, drops very markedly when DS
approaches Ξ0. This is illustrated in the inset, where wedisplay ∆MIN versus DS. The essential behavior is simi-lar to that in the I = 0 case in the other panel, whereby∆MIN changes the most for DS < 1.5 Ξ0. The overallmagnitude is reduced, however, by the finite value of theexchange energy.
The local DOS is also sensitive to the spatial extent ofthe superconductor. The left column in Fig. 23 shows thenormalized local DOS at Z = −100 in the I = 0 limit,for several values of DS . Spatial averaging in this case isunnecessary. For DS = 200 (top curve), it is evident thatthis width is sufficient for Andreev reflection to becomewell established, and hence for the complete formationof the structure seen in the bulk case (see Fig. 6). AtDS = 2Ξ0, even though DS is still larger than Ξ0, theDOS profile has changed its shape so that the peaks slantin the opposite direction. The magnitude of the peaks hasdecreased slightly overall, but their characteristic energyspacing Ec remains the same with the exception that thelargest peak has slightly shifted towards smaller energies.The next curve (DS = 1.5Ξ0) shows how this trend ex-tends further. Finally, when DS = Ξ0, only a slight hintof structure remains. These results reflect that the deGennes St. James peaks arise mainly from Andreev re-flection at the normal metal superconductor interface, sothat when DS decreases, so does the minimum gap (seeFig. 22 inset in the top panel). Next, we examine theDOS in the superconducting side (right column), usingthe same parameters as for the left side panels. We per-form a spatial average over one coherence length centeredaround Z = DS − Ξ0/2 (in analogy with the thin mag-net case). Beginning with the top curve and proceedingdownwards, we see a rapid filling in of subgap states. AsDS is decreased (lower curves), any remnant of subgapstates becomes smeared out due to the greater influenceof the normal metal on the superconductor for smallerDS .
We conclude this subsection by considering a finiteexchange energy of I = 1/2 in the ferromagnet, withall other material parameters being identical to those inFig. 23. As mentioned above, for a bulk superconductorjuxtaposed to a bulk ferromagnet, the oscillatory pair
19
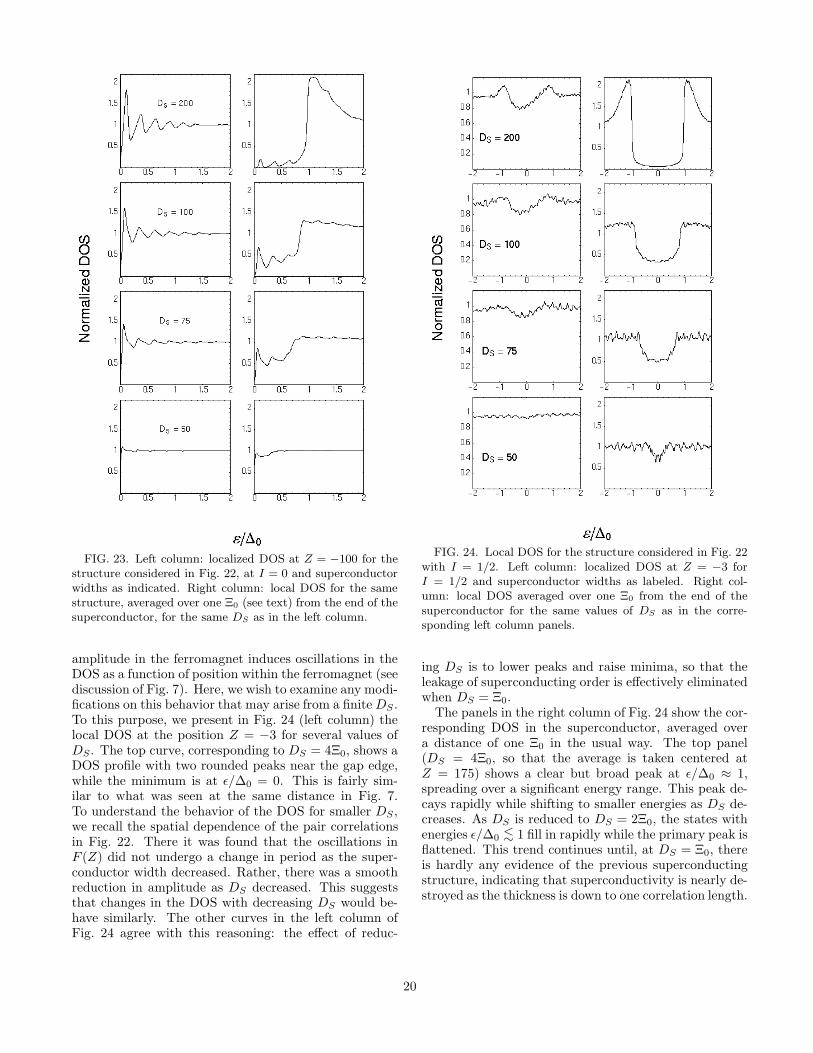
FIG. 23. Left column: localized DOS at Z = −100 for thestructure considered in Fig. 22, at I = 0 and superconductorwidths as indicated. Right column: local DOS for the samestructure, averaged over one Ξ0 (see text) from the end of thesuperconductor, for the same DS as in the left column.
amplitude in the ferromagnet induces oscillations in theDOS as a function of position within the ferromagnet (seediscussion of Fig. 7). Here, we wish to examine any modi-fications on this behavior that may arise from a finite DS .To this purpose, we present in Fig. 24 (left column) thelocal DOS at the position Z = −3 for several values ofDS . The top curve, corresponding to DS = 4Ξ0, shows aDOS profile with two rounded peaks near the gap edge,while the minimum is at ǫ/∆0 = 0. This is fairly sim-ilar to what was seen at the same distance in Fig. 7.To understand the behavior of the DOS for smaller DS ,we recall the spatial dependence of the pair correlationsin Fig. 22. There it was found that the oscillations inF (Z) did not undergo a change in period as the super-conductor width decreased. Rather, there was a smoothreduction in amplitude as DS decreased. This suggeststhat changes in the DOS with decreasing DS would be-have similarly. The other curves in the left column ofFig. 24 agree with this reasoning: the effect of reduc-
FIG. 24. Local DOS for the structure considered in Fig. 22with I = 1/2. Left column: localized DOS at Z = −3 forI = 1/2 and superconductor widths as labeled. Right col-umn: local DOS averaged over one Ξ0 from the end of thesuperconductor for the same values of DS as in the corre-sponding left column panels.
ing DS is to lower peaks and raise minima, so that theleakage of superconducting order is effectively eliminatedwhen DS = Ξ0.
The panels in the right column of Fig. 24 show the cor-responding DOS in the superconductor, averaged overa distance of one Ξ0 in the usual way. The top panel(DS = 4Ξ0, so that the average is taken centered atZ = 175) shows a clear but broad peak at ǫ/∆0 ≈ 1,spreading over a significant energy range. This peak de-cays rapidly while shifting to smaller energies as DS de-creases. As DS is reduced to DS = 2Ξ0, the states withenergies ǫ/∆0
<∼ 1 fill in rapidly while the primary peak isflattened. This trend continues until, at DS = Ξ0, thereis hardly any evidence of the previous superconductingstructure, indicating that superconductivity is nearly de-stroyed as the thickness is down to one correlation length.
20
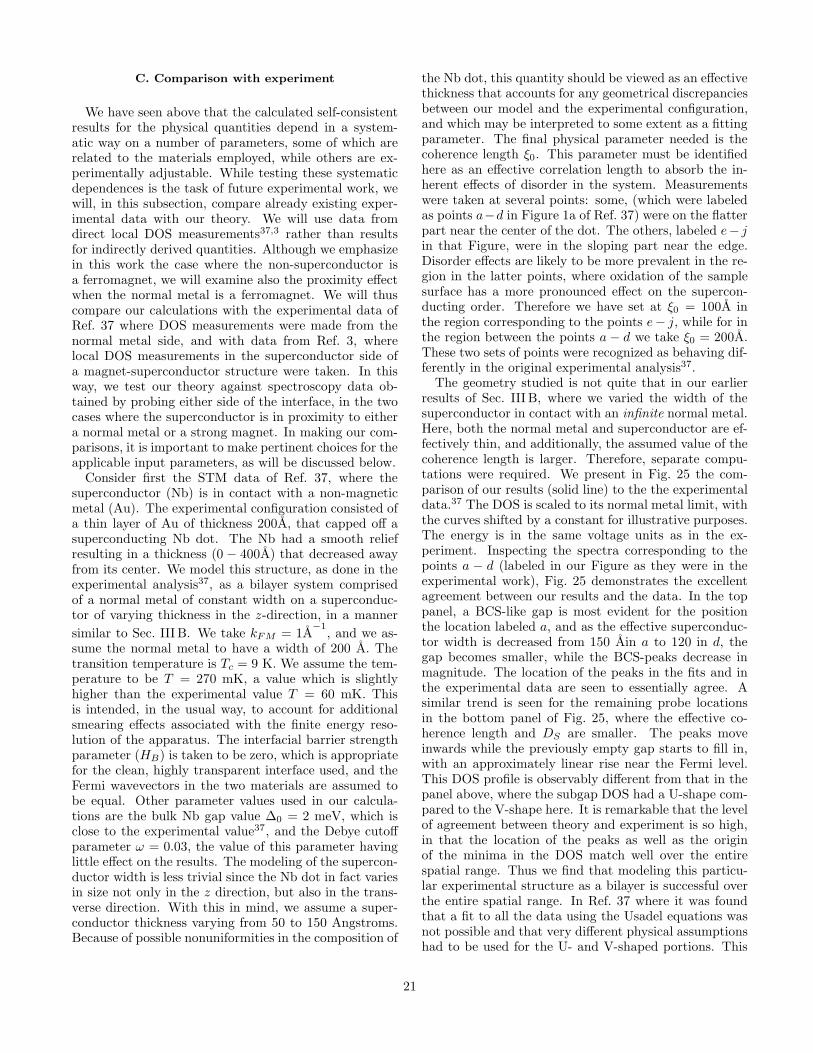
C. Comparison with experiment
We have seen above that the calculated self-consistentresults for the physical quantities depend in a system-atic way on a number of parameters, some of which arerelated to the materials employed, while others are ex-perimentally adjustable. While testing these systematicdependences is the task of future experimental work, wewill, in this subsection, compare already existing exper-imental data with our theory. We will use data fromdirect local DOS measurements37,3 rather than resultsfor indirectly derived quantities. Although we emphasizein this work the case where the non-superconductor isa ferromagnet, we will examine also the proximity effectwhen the normal metal is a ferromagnet. We will thuscompare our calculations with the experimental data ofRef. 37 where DOS measurements were made from thenormal metal side, and with data from Ref. 3, wherelocal DOS measurements in the superconductor side ofa magnet-superconductor structure were taken. In thisway, we test our theory against spectroscopy data ob-tained by probing either side of the interface, in the twocases where the superconductor is in proximity to eithera normal metal or a strong magnet. In making our com-parisons, it is important to make pertinent choices for theapplicable input parameters, as will be discussed below.
Consider first the STM data of Ref. 37, where thesuperconductor (Nb) is in contact with a non-magneticmetal (Au). The experimental configuration consisted ofa thin layer of Au of thickness 200A, that capped off asuperconducting Nb dot. The Nb had a smooth reliefresulting in a thickness (0 − 400A) that decreased awayfrom its center. We model this structure, as done in theexperimental analysis37, as a bilayer system comprisedof a normal metal of constant width on a superconduc-tor of varying thickness in the z-direction, in a manner
similar to Sec. III B. We take kFM = 1A−1
, and we as-sume the normal metal to have a width of 200 A. Thetransition temperature is Tc = 9 K. We assume the tem-perature to be T = 270 mK, a value which is slightlyhigher than the experimental value T = 60 mK. Thisis intended, in the usual way, to account for additionalsmearing effects associated with the finite energy reso-lution of the apparatus. The interfacial barrier strengthparameter (HB) is taken to be zero, which is appropriatefor the clean, highly transparent interface used, and theFermi wavevectors in the two materials are assumed tobe equal. Other parameter values used in our calcula-tions are the bulk Nb gap value ∆0 = 2 meV, which isclose to the experimental value37, and the Debye cutoffparameter ω = 0.03, the value of this parameter havinglittle effect on the results. The modeling of the supercon-ductor width is less trivial since the Nb dot in fact variesin size not only in the z direction, but also in the trans-verse direction. With this in mind, we assume a super-conductor thickness varying from 50 to 150 Angstroms.Because of possible nonuniformities in the composition of
the Nb dot, this quantity should be viewed as an effectivethickness that accounts for any geometrical discrepanciesbetween our model and the experimental configuration,and which may be interpreted to some extent as a fittingparameter. The final physical parameter needed is thecoherence length ξ0. This parameter must be identifiedhere as an effective correlation length to absorb the in-herent effects of disorder in the system. Measurementswere taken at several points: some, (which were labeledas points a−d in Figure 1a of Ref. 37) were on the flatterpart near the center of the dot. The others, labeled e− jin that Figure, were in the sloping part near the edge.Disorder effects are likely to be more prevalent in the re-gion in the latter points, where oxidation of the samplesurface has a more pronounced effect on the supercon-ducting order. Therefore we have set at ξ0 = 100A inthe region corresponding to the points e− j, while for inthe region between the points a − d we take ξ0 = 200A.These two sets of points were recognized as behaving dif-ferently in the original experimental analysis37.
The geometry studied is not quite that in our earlierresults of Sec. III B, where we varied the width of thesuperconductor in contact with an infinite normal metal.Here, both the normal metal and superconductor are ef-fectively thin, and additionally, the assumed value of thecoherence length is larger. Therefore, separate compu-tations were required. We present in Fig. 25 the com-parison of our results (solid line) to the the experimentaldata.37 The DOS is scaled to its normal metal limit, withthe curves shifted by a constant for illustrative purposes.The energy is in the same voltage units as in the ex-periment. Inspecting the spectra corresponding to thepoints a − d (labeled in our Figure as they were in theexperimental work), Fig. 25 demonstrates the excellentagreement between our results and the data. In the toppanel, a BCS-like gap is most evident for the positionthe location labeled a, and as the effective superconduc-tor width is decreased from 150 Ain a to 120 in d, thegap becomes smaller, while the BCS-peaks decrease inmagnitude. The location of the peaks in the fits and inthe experimental data are seen to essentially agree. Asimilar trend is seen for the remaining probe locationsin the bottom panel of Fig. 25, where the effective co-herence length and DS are smaller. The peaks moveinwards while the previously empty gap starts to fill in,with an approximately linear rise near the Fermi level.This DOS profile is observably different from that in thepanel above, where the subgap DOS had a U-shape com-pared to the V-shape here. It is remarkable that the levelof agreement between theory and experiment is so high,in that the location of the peaks as well as the originof the minima in the DOS match well over the entirespatial range. Thus we find that modeling this particu-lar experimental structure as a bilayer is successful overthe entire spatial range. In Ref. 37 where it was foundthat a fit to all the data using the Usadel equations wasnot possible and that very different physical assumptionshad to be used for the U- and V-shaped portions. This
21
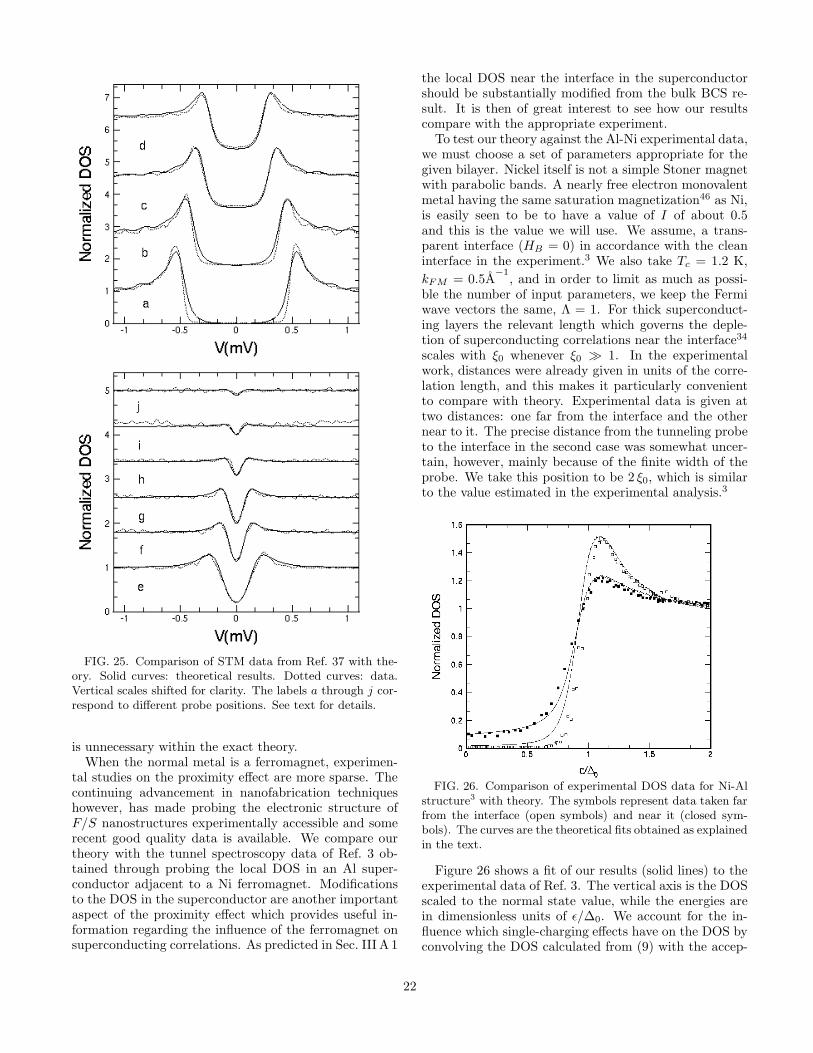
FIG. 25. Comparison of STM data from Ref. 37 with the-ory. Solid curves: theoretical results. Dotted curves: data.Vertical scales shifted for clarity. The labels a through j cor-respond to different probe positions. See text for details.
is unnecessary within the exact theory.When the normal metal is a ferromagnet, experimen-
tal studies on the proximity effect are more sparse. Thecontinuing advancement in nanofabrication techniqueshowever, has made probing the electronic structure ofF/S nanostructures experimentally accessible and somerecent good quality data is available. We compare ourtheory with the tunnel spectroscopy data of Ref. 3 ob-tained through probing the local DOS in an Al super-conductor adjacent to a Ni ferromagnet. Modificationsto the DOS in the superconductor are another importantaspect of the proximity effect which provides useful in-formation regarding the influence of the ferromagnet onsuperconducting correlations. As predicted in Sec. III A 1
the local DOS near the interface in the superconductorshould be substantially modified from the bulk BCS re-sult. It is then of great interest to see how our resultscompare with the appropriate experiment.
To test our theory against the Al-Ni experimental data,we must choose a set of parameters appropriate for thegiven bilayer. Nickel itself is not a simple Stoner magnetwith parabolic bands. A nearly free electron monovalentmetal having the same saturation magnetization46 as Ni,is easily seen to be to have a value of I of about 0.5and this is the value we will use. We assume, a trans-parent interface (HB = 0) in accordance with the cleaninterface in the experiment.3 We also take Tc = 1.2 K,
kFM = 0.5A−1
, and in order to limit as much as possi-ble the number of input parameters, we keep the Fermiwave vectors the same, Λ = 1. For thick superconduct-ing layers the relevant length which governs the deple-tion of superconducting correlations near the interface34
scales with ξ0 whenever ξ0 ≫ 1. In the experimentalwork, distances were already given in units of the corre-lation length, and this makes it particularly convenientto compare with theory. Experimental data is given attwo distances: one far from the interface and the othernear to it. The precise distance from the tunneling probeto the interface in the second case was somewhat uncer-tain, however, mainly because of the finite width of theprobe. We take this position to be 2 ξ0, which is similarto the value estimated in the experimental analysis.3
FIG. 26. Comparison of experimental DOS data for Ni-Alstructure3 with theory. The symbols represent data taken farfrom the interface (open symbols) and near it (closed sym-bols). The curves are the theoretical fits obtained as explainedin the text.
Figure 26 shows a fit of our results (solid lines) to theexperimental data of Ref. 3. The vertical axis is the DOSscaled to the normal state value, while the energies arein dimensionless units of ǫ/∆0. We account for the in-fluence which single-charging effects have on the DOS byconvolving the DOS calculated from (9) with the accep-
22
tance function P (E) (as described in Ref. 3) that givesthe probability for the junction to absorb an energy E.48
The curve with the more prominent peak correspondsto the DOS in the bulk, away from the influence of themagnet, while the other curve is the DOS two coherencelengths from the interface. The open and closed symbolsare the experimental results, the former ones being forthe bulk DOS. The procedure employed to obtain thesefits was the following: first we determined the effectivetemperature (to account for instrument resolution) byfitting our results to the experimental DOS near the in-terface, (closed symbols, solid curve). This resulted in aslightly raised effective temperature T = 980 mK (in con-trast with the experimental value of T = 100 mK). Then,without any further changes, we calculated the DOS at adistance of 4 ξ0 from the interface (dashed curve). Thisposition should represent well the bulk characteristics inthe DOS, since as we have seen previously, at that point,the influence of the ferromanget on the superconductingDOS is minimal. No additional parameters were used toobtain this second fit. The results are clearly excellent:they have the correct peak positions and relative magni-tudes. We therefore find again, good overall agreementwith experiment in this more difficult case.
IV. CONCLUSIONS
We have in this work presented extensive results for thepair amplitude and local DOS in heterostructures involv-ing superconductors and magnetic materials. These re-sults were obtained from numerical, self-consistent solu-tion of the Bogoliubov-deGennes equations, without ap-proximations. We also discussed the length scales char-acterizing the influence of the superconductor on the fer-romagnet and vice versa.
For heterostructures with geometric dimensions largerthan the relevant intrinsic lengths, we have shown in de-tail how variation of parameters such as temperature T ,Fermi wave vector mismatch Λ, interfacial and scatter-ing strength HB , (see Table I) affected the pair amplitudeand local DOS for a wide range of exchange energies I.For I = 0, and low T , we find that the pair amplitudein the normal metal decays approximately as the inverseof the distance from the interface, with the overall pref-actor depending on Λ and HB. At higher temperatures,and for Λ = 1, HB = 0, the decay markedly increases,and is set by a smaller length scale ξN (T ). The exactspatial decay of F (r) was found to be more complicatedthan a single exponential. On the superconductor side,we tested our results for temperatures near Tc and foundagreement with standard Ginzburg Landau theory. Wealso extracted the characteristic length of depletion ξS(T )for intermediate and lower temperatures, something notpreviously done in a systematic way. The length scale(at low temperatures) characterizing the decline of F (r)near the interface was found to decrease with smaller Λ
or larger HB. The local DOS correlates with these re-sults and displays a functional dependence on T , Λ, andHB as well. We also systematically investigated the ge-ometrical effects associated with the finite size of eitherthe normal metal or superconductor and discovered thata small gap develops in the normal metal DOS when itswidth is small. This “mini-gap” decreases to zero whenthe metal width is close to the coherence length, i.e.,DF ≈ Ξ0.
At finite values of I, there are two characteristic prox-imity length scales ξ2 and ξ1 in the ferromagnet, gov-erning respectively the spatial period of the damped os-cillations in F (r), and the sharp decay at the interface.Both lengths vary approximately inversely with I, inde-pendent of temperature. The amplitude of the dampedoscillations however, decreases with increasing tempera-ture. Mismatch of the Fermi energies increases the decayof the oscillations. A finite barrier strength has no effecton the period either, but does reduce the amplitude by afactor that scales linearly with HB.
The damped oscillatory behavior in the ferromagnetinduces a corresponding spatial modulation in the localDOS. For a transparent interface, the DOS in the su-perconductor side (for I > 1/4), exhibited a reductionin the usual BCS peaks, with a finite number of stateswithin the gap, the number depending on the exchangefield and location within the superconductor. For smallexchange fields of order of I ≃ ∆0/EFS , a significantsubgap structure emerged and at exactly I = ∆0/EFS , aresonance phenomenon occurred in which the BCS peaksbecame significantly enhanced. We found there exists along range spin splitting in the superconductor, extend-ing over several coherence lengths. A nontrivial behaviorof δN was found as a function of I and the mismatchparameter Λ: when the point EF↑ = EFS is crossed, thespin splitting becomes very short ranged, as found in Ref.34.
Finally, we have compared our results with two sets ofexperimental data for the local DOS, corresponding totwo different values of I and to measurements taken ei-ther from the superconductor or the non-superconductorside of the heterostructure. In both cases we found, usingreasonable values for the material and geometric param-eters, very good agreement between theory and experi-ment.
The number of relevant parameters involved is so large,and the variety of behaviors so rich, that even an exten-sive study such as this one must concentrate on the high-lights and leave most of parameter space unexplored. Itis clear however that the machinery developed here canbe readily applied to most actual experimental situations.We hope that this paper will stimulate future experimen-tal work and facilitate the analysis of the resulting data.
23
ACKNOWLEDGMENTS
We thank H. Courtois and M.A Sillanpaa for providingus with their data.
† Electronic address: [email protected]∗ Electronic address: [email protected] P.A. Kraus, A. Bhattacharya and A. M. Goldman, Phys.Rev. B 64, 220505 (2001).
2 A. N. Grogorenko et al. Phys. Rev. B 63, 052504 (2001).3 M.A. Sillanpaa, T.T. Heikkila, R.K. Lindell, and P.J. Hako-nen, Europhys Lett 56, 590 (2001).
4 G. Deutscher and P.G. de Gennes, in Superconductivity,edited by R.D. Parks (Marcel Dekker, New York, 1969), p.1005.
5 D.S. Falk, Phys. Rev. 132, 1576 (1963).6 P.G. de Gennes, Superconductivity of Metals and Alloys
(Addison-Wesley, Reading, MA, 1989).7 B.P. Stojkovic, and O.T. Valls, Phys. Rev. B 50, 3374(1994).
8 J. Hara, M. Ashida, and K. Nagai, Phys. Rev. B 47, 11263(1993).
9 E.A. Demler, G.B. Arnold, and M.R. Beasley, Phys. Rev.B 55,15 174 (1997).
10 Y. Blum, A. Tsukernik, M. Karpovski, A. Palevski cond-mat/0203408.
11 V. Prokic, A.I. Buzdin, and L.Dobrosavljevic-Grujic, Phys.Rev. B bf 59 587 (1999).
12 F.S. Bergeret, A.F. Volkov, and K.B. Efetov, cond-mat/0106510.
13 L.N. Bulaevskii, V. V. Kuzii JETP Lett. 25, 290 (1977).14 A.I. Buzdin, L.N. Bulaevskii, S.V. Panyukov, JETP Lett.
35, 178 (1982).15 A.I. Buzdin, B. Bujicic, M. Yu Kupriyanov, JETP Lett.
74, 124 (1992).16 P. Fulde and A. Ferrell, Phys. Rev. 135, A550 (1964).17 A. Larkin and Y. Ovchinnikov, Sov. Phys. JETP 20, 762
(1965).18 Z. Radovic, et al. Phys. Rev. B 44, 759 (1991).19 L.R. Tagirov, Physica C 307, 145 (1998).20 Y.V. Fominov, N.M. Chtchelkatchev, and A.A. Golubov,
cond-mat/0202280.21 T. Kontos et al. cond-mat/0201104 (2002).22 V.V. Ryazanov it et al Phys. Rev. Lett. bf 86, 2427 (2001).23 M. Krawiec, B.L. Gyorffy, and J.F. Annett, cond-
mat/0203184.24 Ya. V. Fominov and M.V. Feigelman, Phys. Rev. B 63,
094518 (2001).25 I. Baladie and A. Buzdin, Phys. Rev. B 64 224514.26 M. Zareyan, W. Belzig, and Yu. V. Nazarov, cond-
mat/0107252.27 K.D. Usadel, Phys. Rev. Lett. 25, 507 (1970).28 G. Eilenberger, Z. Phys. 214, 195 (1968).29 Y. Tanaka and M. Tsukada, Phys. Rev. B 42,2066 (1990).30 I. Zutic and O.T. Valls, Phys. Rev. B 61, 1555 (2000).
31 B.P. Vodopyanov, it et al Physica C, 366,31 (2001).32 O. Bourgeois, et al, Phys. Rev. B 63, 064517 (2001).33 J. Aarts, et al, Phys. Rev. B 56, 2779 (1997).34 K. Halterman and O.T. Valls, Phys. Rev. B 65, 014509
(2002).35 J-X. Zhu and C.S. Ting, Phys. Rev. B 61, 1456, (2000).36 E. Vecino, A. Martin-Rodero and A. Levy Yeyati, Phys.
Rev. B 64, 184502 (2001).37 N. Moussy, H. Courtois, and B. Pannetier, Europhys. Lett.
(2001).38 J.B. Ketterson and S.N. Song, Superconductivity, Cam-
bridge University Press, (1999). See Ch. 41.39 S.W. Pierson and O.T. Valls , Phys. Rev. B45, 2458 (1992).40 P.G. de Gennes and D. St.-James, Phys. Lett. 4, 151
(1963).41 S. Pilgram, W. Belzig, and C. Bruder, Phys. Rev. B 62,
12462 (2000).42 K. Halterman, Ph.D. thesis, University of Minnesota,
(2002).43 R. Fazio, and C. Lucheroni, Europhys. Lett. 45, 707 (1999).44 G.E. Blonder, M. Tinkham, and T.M. Klapwijk, Phys. Rev.
B 25, 4415 (1982).45 B.P. Stojkovic, and O.T. Valls, Phys. Rev. B 47, 5922
(1993).46 See Chapter 15 in C. Kittel Introduction to Solid State
Physics, 7th edition, Wiley, New York (1996).47 S. Gueron, et al, Phys. Rev. Lett. 77, 3025 (1996).48 G.-L. Ingold and Yu. Nazarov, in Single Charge Tunneling,
ed. by M.H. Devoret and H. Grabert, Plenum, N.Y. (1992).49 W. Belzig, C. Bruder, and G. Schon, Phys. Rev. B 54, 9443
(1996).50 A.A. Golubov, Physica C, 326, 46 (1999).
24
Related Documents