Proximal Femur Mechanical Adaptation to Weight Gain in Late Adolescence: A Six-Year Longitudinal Study Moira A Petit, 1 Thomas J Beck, 2 Julie M Hughes, 1 Hung-Mo Lin, 3 Christy Bentley, 3 and Tom Lloyd 3 ABSTRACT: The effect of weight gain in late adolescence on bone is not clear. Young women who consistently gained weight (n = 23) from 17 to 22 yr of age had increased BMD but a lack of subperiosteal expansion compared with stable weight peers (n = 48). Bone strength increased appropriately for lean mass in both groups but decreased relative to body weight in weight gainers, suggesting increased bone fragility in weight gainers. Introduction: Weight gain leading to obesity often starts in adolescence, yet little is known about its effects on bone. We used longitudinal data to examine the effects of weight gain in late adolescence (from 17 to 22 yr of age) on proximal femur BMD, geometry, and estimates of bending strength. Materials and Methods: Participants were classified as either weight gainers (WG, n 23) or stable weight (SW, n 48) using a random coefficients model. Weight gainers had positive increases in weight (p < 0.05) at each clinic visit from age 17 onward. Proximal femur DXA scans (Hologic QDR 2000) taken annually from 17 to 22 yr of age were analyzed for areal BMD (g/cm 2 ), subperiosteal width (cm), and bone cross-sectional area (CSA) at the proximal femoral shaft. Cortical thickness was measured, and section modulus (Z, cm 3 ) was calculated as a measure of bone bending strength. Total body lean (g) and fat (g) mass were measured from DXA total body scans. Results: Over ages 17–22, height remained stable in both groups. Weight remained static in the SW group but increased 14% on average in the WG group (p < 0.05). After controlling for age 17 baseline values, WG had higher BMD (+2.6%), thicker cortices (+3.6%), and greater bone CSA (+2.3%). Increased BMD did not translate to greater increases in bone bending strength (Z). The SW group achieved similar gains in Z by greater subperiosteal expansion. Bone strength index (SI Z/height) normalized for body weight remained constant in the SW group but decreased significantly in the WG group. In contrast, SI normalized to lean mass did not change over time in either group. Other variables including physical activity, nutrition, and hormone levels (estradiol, testosterone, cortisol) did not differ significantly between groups. Conclusions: These data suggest that weight gain in late adolescence may inhibit the periosteal expansion known to normally occur throughout life in long bones, resulting in decreased bone strength relative to body weight. J Bone Miner Res 2008;23:180–188. Published online on March 16, 2007; doi: 10.1359/JBMR.071018 Key words: adolescence, obesity, mechanostat, bone strength, bone geometry INTRODUCTION U NDERSTANDING HOW BONES adapt in mass, geometry, and strength to weight gain in late adolescence is of interest from both a public health perspective and for un- derstanding basic bone biology. From a public health stand- point, chronic weight gain that leads to adult obesity often begins in adolescence. Although high body weight is thought to be protective against osteoporotic fractures, obese adults have increased risk of lower limb fractures, (1,2) and obese children may have a higher incidence of forearm fractures. (3,4) Weight loss is associated with significant de- creases in areal BMD (aBMD) and increased fracture risk in adults (5) and with inadequate bone gain in children. (6) However, little is known about the effects of weight gain in late adolescence on bone geometry or estimated bone strength, because studies to date have exclusively used aBMD (g/cm 2 ) or BMC as outcomes. It is often implied in the literature that a higher aBMD associated with body weight coincides with an increased bone mechanical strength. However, bone can, and does, Dr Beck’s Institution, the Johns Hopkins University, has li- censed the HSA methodology to Hologic and Dr Beck will share in potential royalties. All other authors state that they have no con- flicts of interest. 1 University of Minnesota School of Kinesiology, Minneapolis, Minnesota, USA; 2 Department of Radiology, The Johns Hopkins University School of Medicine, Baltimore, Maryland, USA; 3 Department of Health Evaluation Sciences, Pennsylvania State University, College of Medicine, Hershey, Pennsylvania, USA. JOURNAL OF BONE AND MINERAL RESEARCH Volume 23, Number 2, 2008 Published online on March 16, 2007; doi: 10.1359/JBMR.071018 © 2008 American Society for Bone and Mineral Research 180

Welcome message from author
This document is posted to help you gain knowledge. Please leave a comment to let me know what you think about it! Share it to your friends and learn new things together.
Transcript
Proximal Femur Mechanical Adaptation to Weight Gain in LateAdolescence: A Six-Year Longitudinal Study
Moira A Petit,1 Thomas J Beck,2 Julie M Hughes,1 Hung-Mo Lin,3 Christy Bentley,3 and Tom Lloyd3
ABSTRACT: The effect of weight gain in late adolescence on bone is not clear. Young women who consistentlygained weight (n = 23) from 17 to 22 yr of age had increased BMD but a lack of subperiosteal expansioncompared with stable weight peers (n = 48). Bone strength increased appropriately for lean mass in bothgroups but decreased relative to body weight in weight gainers, suggesting increased bone fragility in weightgainers.
Introduction: Weight gain leading to obesity often starts in adolescence, yet little is known about its effects onbone. We used longitudinal data to examine the effects of weight gain in late adolescence (from 17 to 22 yrof age) on proximal femur BMD, geometry, and estimates of bending strength.Materials and Methods: Participants were classified as either weight gainers (WG, n � 23) or stable weight(SW, n � 48) using a random coefficients model. Weight gainers had positive increases in weight (p < 0.05)at each clinic visit from age 17 onward. Proximal femur DXA scans (Hologic QDR 2000) taken annually from17 to 22 yr of age were analyzed for areal BMD (g/cm2), subperiosteal width (cm), and bone cross-sectionalarea (CSA) at the proximal femoral shaft. Cortical thickness was measured, and section modulus (Z, cm3) wascalculated as a measure of bone bending strength. Total body lean (g) and fat (g) mass were measured fromDXA total body scans.Results: Over ages 17–22, height remained stable in both groups. Weight remained static in the SW group butincreased 14% on average in the WG group (p < 0.05). After controlling for age 17 baseline values, WG hadhigher BMD (+2.6%), thicker cortices (+3.6%), and greater bone CSA (+2.3%). Increased BMD did nottranslate to greater increases in bone bending strength (Z). The SW group achieved similar gains in Z bygreater subperiosteal expansion. Bone strength index (SI � Z/height) normalized for body weight remainedconstant in the SW group but decreased significantly in the WG group. In contrast, SI normalized to lean massdid not change over time in either group. Other variables including physical activity, nutrition, and hormonelevels (estradiol, testosterone, cortisol) did not differ significantly between groups.Conclusions: These data suggest that weight gain in late adolescence may inhibit the periosteal expansionknown to normally occur throughout life in long bones, resulting in decreased bone strength relative to bodyweight.J Bone Miner Res 2008;23:180–188. Published online on March 16, 2007; doi: 10.1359/JBMR.071018
Key words: adolescence, obesity, mechanostat, bone strength, bone geometry
INTRODUCTION
UNDERSTANDING HOW BONES adapt in mass, geometry,and strength to weight gain in late adolescence is of
interest from both a public health perspective and for un-derstanding basic bone biology. From a public health stand-point, chronic weight gain that leads to adult obesity oftenbegins in adolescence. Although high body weight is
thought to be protective against osteoporotic fractures,obese adults have increased risk of lower limb fractures,(1,2)
and obese children may have a higher incidence of forearmfractures.(3,4) Weight loss is associated with significant de-creases in areal BMD (aBMD) and increased fracture riskin adults(5) and with inadequate bone gain in children.(6)
However, little is known about the effects of weight gain inlate adolescence on bone geometry or estimated bonestrength, because studies to date have exclusively usedaBMD (g/cm2) or BMC as outcomes.
It is often implied in the literature that a higher aBMDassociated with body weight coincides with an increasedbone mechanical strength. However, bone can, and does,
Dr Beck’s Institution, the Johns Hopkins University, has li-censed the HSA methodology to Hologic and Dr Beck will share inpotential royalties. All other authors state that they have no con-flicts of interest.
1University of Minnesota School of Kinesiology, Minneapolis, Minnesota, USA; 2Department of Radiology, The Johns HopkinsUniversity School of Medicine, Baltimore, Maryland, USA; 3Department of Health Evaluation Sciences, Pennsylvania State University,College of Medicine, Hershey, Pennsylvania, USA.
JOURNAL OF BONE AND MINERAL RESEARCHVolume 23, Number 2, 2008Published online on March 16, 2007; doi: 10.1359/JBMR.071018© 2008 American Society for Bone and Mineral Research
180
JO703169 180 188 February
adapt its geometry in ways that may not be apparent inaBMD outcomes.(7) Furthermore, increases in aBMD donot necessarily translate to a reduced fracture risk.(8) Froma functional standpoint, bone should adapt its strength (butnot necessarily its mass or “density”) to the customarystimulus from peak voluntary loads.
There is some confusion over what constitutes a “load”on bone. Body weight is often used as a covariate with therationale that weight is a dominant osteogenic load onbone. Although it is true that weight induces a load onbone, that load is fairly static unless that weight is moved.Static strains are no more osteogenic to bone than noload.(9) On the other hand, muscle forces move limbsthrough the mechanical disadvantage of “short-arm” levers,so the resulting strains are several times larger than those ofbody weight alone and those strains are dynamic. With thisrationale, some researchers suggest correcting bonestrength (either bone cross-sectional area [CSA], BMC, orsection modulus) for surrogates of muscle force (eithermuscle CSA by pQCT or total body lean mass byDXA).(10,11) Although it remains unclear how best to scalebone geometry, these relative bone strength (RBS) or bonemuscle-strength indices (BMSI) have been useful for dis-tinguishing healthy from sick children(12) and for under-standing bone adaptation to loading.(13)
However, the idea that body weight is the dominant os-teogenic load prevails in the literature. The findings thatBMC or BMD are altered with weight change are nearlyalways explained as an effect of decreasing or increasingbody weight—without consideration for the composition ofthat weight. If muscle forces dominate as an osteogenicstimulus, increased body weight in the form of fat massshould lead to reduced bone strength relative to weight. Ifweight gain is entirely in the form of lean mass, bone shouldadapt to that increased load. We recently showed that over-weight children had high bone strength—but that strengthwas adequately adapted to their higher lean mass.(14) Nostudies, to our knowledge, have explored the change inbone geometry and structural strength that occur withweight gain in late adolescence in a longitudinal study. Wetherefore used data from the longitudinal Penn StateYoung Women’s Health Study to examine changes inproximal femur bone geometry with weight gain in lateadolescence (17–22 yr of age). We hypothesized that indi-viduals who gained weight in late adolescence would havegreater gains in BMD but that bending strength wouldadapt to changes in lean mass (rather than body weight).
MATERIALS AND METHODS
Participants
The Penn State Young Women’s Health Study is a pro-spective epidemiological study that was started in 1990 withthe enrollment of 112 healthy, premenarcheal girls, 11.9 ±0.5 yr of age at entry. The study population is representativeof white adolescent girls attending public school in centralPennsylvania. Details of the recruitment, baseline measure-ments, the effects of the calcium supplementation on bonegain, and changes in bone geometry overall have been re-
ported.(15–19) The study was approved by the PennsylvaniaState University College of Medicine Institutional ReviewBoard. Participants and their parents provided informedconsent. Proximal femur scans were introduced in the last 6yr of the study when participants were 17–22 yr. We useddata from a total of 71 participants who remained in thestudy until at least age 21 and had more than three visitssince age 17. No differences in baseline age, height orweight, or bone measurements were observed between par-ticipants who dropped out and those who remained in thecohort. The same two clinical research coordinators saw allparticipants throughout the study.
Weight groups
None of the participants in this cohort lost weight from 17to 22 yr of age; all remained stable weight or gained weight.Using a random effects model for longitudinal data,(20) par-ticipants were partitioned into two groups, based onwhether the age trend in weight slope was significantly posi-tive (p < 0.05), into either weight gainers (WG; n � 23) orstable weight (SW; n � 48) groups.
Body composition and bone measurements
The same Hologic QDR-2000W DXA bone densitom-eter was used throughout this study. The manufacturer’slumbar spine phantom was scanned daily for quality controland to correct for any instrument drift. In our laboratory,the CV was <0.7% for the day-to-day quality control scans.Total body scans were made in the pencil beam mode in thepresence of the manufacturer’s three-step acrylic and alu-minum tissue phantom. Scans were analyzed for total bodybone and lean and fat mass. Bilateral proximal femur scanswere made in the array mode, using an Osteodyne hip po-sitioner (Osteodyne, Research Triangle Park, NC, USA).Average values from the left and right proximal femurscans are reported.
Hip structure analysis
The Hip Structure Analysis (HSA) program uses a prin-ciple first described by Martin and Burr(21,22) to derivecross-sectional geometry from images acquired from bonemineral scanners. The HSA software version (v2.1) used inthis study averages geometry measurements for a series offive parallel pixel mass profiles spaces ∼1 mm apart alongthe bone axis. We report analysis from the narrow neck(NN) region across the narrowest point of the femoral neckand the proximal femoral shaft region located at a distanceof 1.5 times the width of the femoral neck distal to theintersection of the NN and femoral shaft axes as describedpreviously.(23–26)
The main structural parameters derived by HSA are thebone cross-sectional area (bone CSA) and the sectionmodulus (Z, cm3), which are inversely related to stressescaused by axial and bending loads, respectively.(27,28) Load-ing forces on bones are distributed over the surface of bonematerial in cross-sections; the soft tissues within bonyspaces do not contribute significantly to the strength ofbone. Therefore, the bone CSA measured by HSA includesonly the surface material and not the soft tissue spaces
BONE ADAPTATION TO WEIGHT GAIN 181
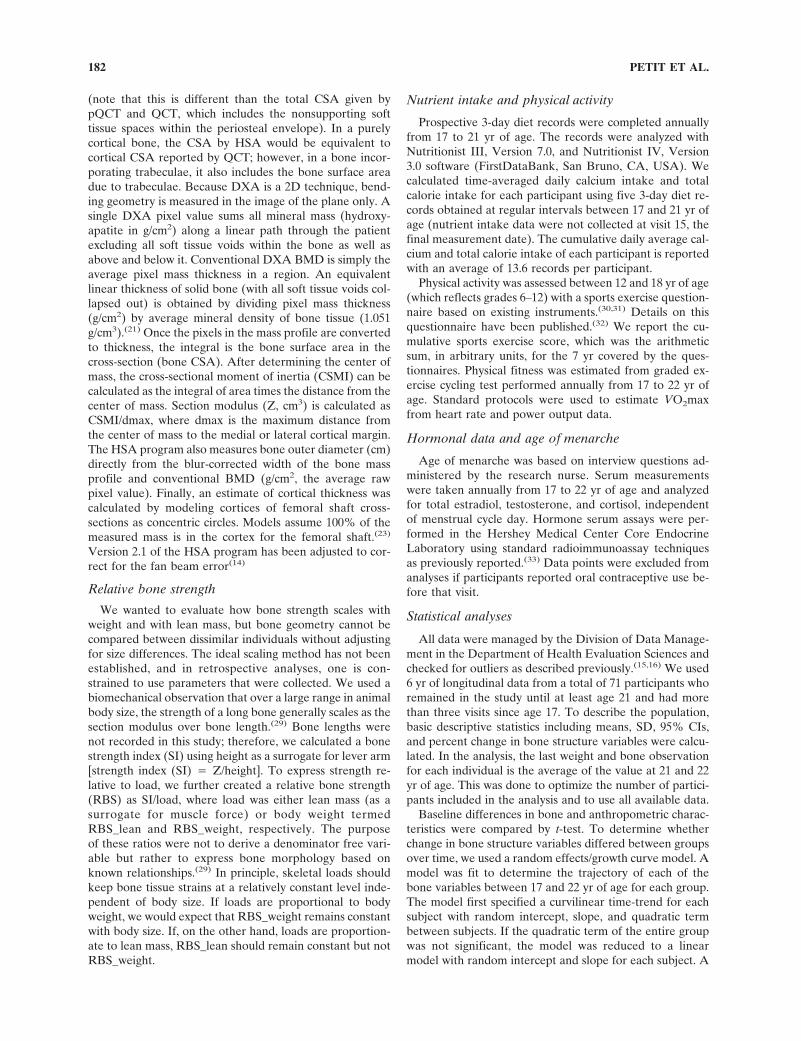
(note that this is different than the total CSA given bypQCT and QCT, which includes the nonsupporting softtissue spaces within the periosteal envelope). In a purelycortical bone, the CSA by HSA would be equivalent tocortical CSA reported by QCT; however, in a bone incor-porating trabeculae, it also includes the bone surface areadue to trabeculae. Because DXA is a 2D technique, bend-ing geometry is measured in the image of the plane only. Asingle DXA pixel value sums all mineral mass (hydroxy-apatite in g/cm2) along a linear path through the patientexcluding all soft tissue voids within the bone as well asabove and below it. Conventional DXA BMD is simply theaverage pixel mass thickness in a region. An equivalentlinear thickness of solid bone (with all soft tissue voids col-lapsed out) is obtained by dividing pixel mass thickness(g/cm2) by average mineral density of bone tissue (1.051g/cm3).(21) Once the pixels in the mass profile are convertedto thickness, the integral is the bone surface area in thecross-section (bone CSA). After determining the center ofmass, the cross-sectional moment of inertia (CSMI) can becalculated as the integral of area times the distance from thecenter of mass. Section modulus (Z, cm3) is calculated asCSMI/dmax, where dmax is the maximum distance fromthe center of mass to the medial or lateral cortical margin.The HSA program also measures bone outer diameter (cm)directly from the blur-corrected width of the bone massprofile and conventional BMD (g/cm2, the average rawpixel value). Finally, an estimate of cortical thickness wascalculated by modeling cortices of femoral shaft cross-sections as concentric circles. Models assume 100% of themeasured mass is in the cortex for the femoral shaft.(23)
Version 2.1 of the HSA program has been adjusted to cor-rect for the fan beam error(14)
Relative bone strength
We wanted to evaluate how bone strength scales withweight and with lean mass, but bone geometry cannot becompared between dissimilar individuals without adjustingfor size differences. The ideal scaling method has not beenestablished, and in retrospective analyses, one is con-strained to use parameters that were collected. We used abiomechanical observation that over a large range in animalbody size, the strength of a long bone generally scales as thesection modulus over bone length.(29) Bone lengths werenot recorded in this study; therefore, we calculated a bonestrength index (SI) using height as a surrogate for lever arm[strength index (SI) � Z/height]. To express strength re-lative to load, we further created a relative bone strength(RBS) as SI/load, where load was either lean mass (as asurrogate for muscle force) or body weight termedRBS_lean and RBS_weight, respectively. The purposeof these ratios were not to derive a denominator free vari-able but rather to express bone morphology based onknown relationships.(29) In principle, skeletal loads shouldkeep bone tissue strains at a relatively constant level inde-pendent of body size. If loads are proportional to bodyweight, we would expect that RBS_weight remains constantwith body size. If, on the other hand, loads are proportion-ate to lean mass, RBS_lean should remain constant but notRBS_weight.
Nutrient intake and physical activity
Prospective 3-day diet records were completed annuallyfrom 17 to 21 yr of age. The records were analyzed withNutritionist III, Version 7.0, and Nutritionist IV, Version3.0 software (FirstDataBank, San Bruno, CA, USA). Wecalculated time-averaged daily calcium intake and totalcalorie intake for each participant using five 3-day diet re-cords obtained at regular intervals between 17 and 21 yr ofage (nutrient intake data were not collected at visit 15, thefinal measurement date). The cumulative daily average cal-cium and total calorie intake of each participant is reportedwith an average of 13.6 records per participant.
Physical activity was assessed between 12 and 18 yr of age(which reflects grades 6–12) with a sports exercise question-naire based on existing instruments.(30,31) Details on thisquestionnaire have been published.(32) We report the cu-mulative sports exercise score, which was the arithmeticsum, in arbitrary units, for the 7 yr covered by the ques-tionnaires. Physical fitness was estimated from graded ex-ercise cycling test performed annually from 17 to 22 yr ofage. Standard protocols were used to estimate VO2maxfrom heart rate and power output data.
Hormonal data and age of menarche
Age of menarche was based on interview questions ad-ministered by the research nurse. Serum measurementswere taken annually from 17 to 22 yr of age and analyzedfor total estradiol, testosterone, and cortisol, independentof menstrual cycle day. Hormone serum assays were per-formed in the Hershey Medical Center Core EndocrineLaboratory using standard radioimmunoassay techniquesas previously reported.(33) Data points were excluded fromanalyses if participants reported oral contraceptive use be-fore that visit.
Statistical analyses
All data were managed by the Division of Data Manage-ment in the Department of Health Evaluation Sciences andchecked for outliers as described previously.(15,16) We used6 yr of longitudinal data from a total of 71 participants whoremained in the study until at least age 21 and had morethan three visits since age 17. To describe the population,basic descriptive statistics including means, SD, 95% CIs,and percent change in bone structure variables were calcu-lated. In the analysis, the last weight and bone observationfor each individual is the average of the value at 21 and 22yr of age. This was done to optimize the number of partici-pants included in the analysis and to use all available data.
Baseline differences in bone and anthropometric charac-teristics were compared by t-test. To determine whetherchange in bone structure variables differed between groupsover time, we used a random effects/growth curve model. Amodel was fit to determine the trajectory of each of thebone variables between 17 and 22 yr of age for each group.The model first specified a curvilinear time-trend for eachsubject with random intercept, slope, and quadratic termbetween subjects. If the quadratic term of the entire groupwas not significant, the model was reduced to a linearmodel with random intercept and slope for each subject. A
PETIT ET AL.182
slope that differed from zero (p < 0.05) was considered asignificant change. Models were tested for age, group(stable weight versus weight gainers), and age × group in-teractions. Age changes in bone geometry in the YWHSpopulation as a group have been previously reported.(19)
The group estimate represents the absolute average differ-ence between the WG and SW groups where a positivevalue means a higher value, whereas the age × group esti-mate represents the average annual increase in the WGversus SW group with a positive value equals a greaterincrease in the WG group. Age estimate is the averageannual increase in the SW group where the change in theWG group can be calculated as the age estimate + the age× group estimate. For simplicity and ease of interpretation,we also report the baseline, final bone geometry values(adjusted for baseline), and percent difference betweengroups.
RESULTS
Descriptive characteristics
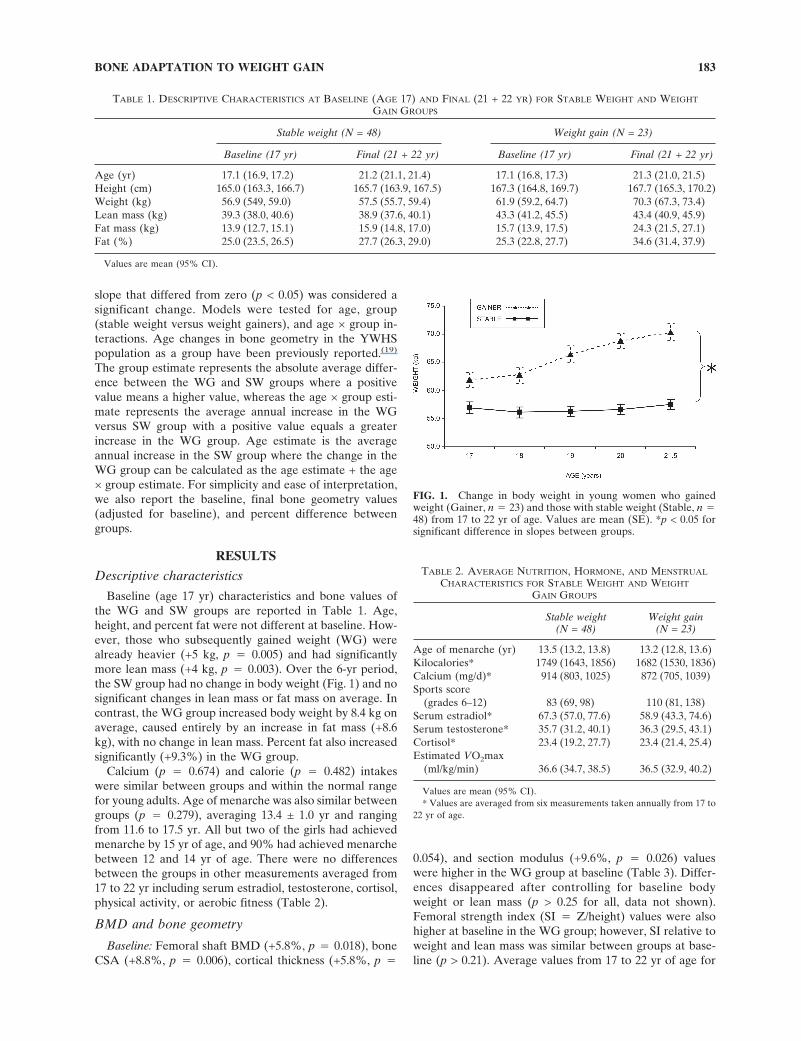
Baseline (age 17 yr) characteristics and bone values ofthe WG and SW groups are reported in Table 1. Age,height, and percent fat were not different at baseline. How-ever, those who subsequently gained weight (WG) werealready heavier (+5 kg, p � 0.005) and had significantlymore lean mass (+4 kg, p � 0.003). Over the 6-yr period,the SW group had no change in body weight (Fig. 1) and nosignificant changes in lean mass or fat mass on average. Incontrast, the WG group increased body weight by 8.4 kg onaverage, caused entirely by an increase in fat mass (+8.6kg), with no change in lean mass. Percent fat also increasedsignificantly (+9.3%) in the WG group.
Calcium (p � 0.674) and calorie (p � 0.482) intakeswere similar between groups and within the normal rangefor young adults. Age of menarche was also similar betweengroups (p � 0.279), averaging 13.4 ± 1.0 yr and rangingfrom 11.6 to 17.5 yr. All but two of the girls had achievedmenarche by 15 yr of age, and 90% had achieved menarchebetween 12 and 14 yr of age. There were no differencesbetween the groups in other measurements averaged from17 to 22 yr including serum estradiol, testosterone, cortisol,physical activity, or aerobic fitness (Table 2).
BMD and bone geometry
Baseline: Femoral shaft BMD (+5.8%, p � 0.018), boneCSA (+8.8%, p � 0.006), cortical thickness (+5.8%, p �
0.054), and section modulus (+9.6%, p � 0.026) valueswere higher in the WG group at baseline (Table 3). Differ-ences disappeared after controlling for baseline bodyweight or lean mass (p > 0.25 for all, data not shown).Femoral strength index (SI � Z/height) values were alsohigher at baseline in the WG group; however, SI relative toweight and lean mass was similar between groups at base-line (p > 0.21). Average values from 17 to 22 yr of age for
TABLE 1. DESCRIPTIVE CHARACTERISTICS AT BASELINE (AGE 17) AND FINAL (21 + 22 YR) FOR STABLE WEIGHT AND WEIGHT
GAIN GROUPS
Stable weight (N = 48) Weight gain (N = 23)
Baseline (17 yr) Final (21 + 22 yr) Baseline (17 yr) Final (21 + 22 yr)
Age (yr) 17.1 (16.9, 17.2) 21.2 (21.1, 21.4) 17.1 (16.8, 17.3) 21.3 (21.0, 21.5)Height (cm) 165.0 (163.3, 166.7) 165.7 (163.9, 167.5) 167.3 (164.8, 169.7) 167.7 (165.3, 170.2)Weight (kg) 56.9 (549, 59.0) 57.5 (55.7, 59.4) 61.9 (59.2, 64.7) 70.3 (67.3, 73.4)Lean mass (kg) 39.3 (38.0, 40.6) 38.9 (37.6, 40.1) 43.3 (41.2, 45.5) 43.4 (40.9, 45.9)Fat mass (kg) 13.9 (12.7, 15.1) 15.9 (14.8, 17.0) 15.7 (13.9, 17.5) 24.3 (21.5, 27.1)Fat (%) 25.0 (23.5, 26.5) 27.7 (26.3, 29.0) 25.3 (22.8, 27.7) 34.6 (31.4, 37.9)
Values are mean (95% CI).
FIG. 1. Change in body weight in young women who gainedweight (Gainer, n � 23) and those with stable weight (Stable, n �48) from 17 to 22 yr of age. Values are mean (SE). *p < 0.05 forsignificant difference in slopes between groups.
TABLE 2. AVERAGE NUTRITION, HORMONE, AND MENSTRUAL
CHARACTERISTICS FOR STABLE WEIGHT AND WEIGHT
GAIN GROUPS
Stable weight(N = 48)
Weight gain(N = 23)
Age of menarche (yr) 13.5 (13.2, 13.8) 13.2 (12.8, 13.6)Kilocalories* 1749 (1643, 1856) 1682 (1530, 1836)Calcium (mg/d)* 914 (803, 1025) 872 (705, 1039)Sports score
(grades 6–12) 83 (69, 98) 110 (81, 138)Serum estradiol* 67.3 (57.0, 77.6) 58.9 (43.3, 74.6)Serum testosterone* 35.7 (31.2, 40.1) 36.3 (29.5, 43.1)Cortisol* 23.4 (19.2, 27.7) 23.4 (21.4, 25.4)Estimated VO2max
(ml/kg/min) 36.6 (34.7, 38.5) 36.5 (32.9, 40.2)
Values are mean (95% CI).* Values are averaged from six measurements taken annually from 17 to
22 yr of age.
BONE ADAPTATION TO WEIGHT GAIN 183
femoral shaft BMD, bone CSA, cortical thickness, Z, andouter diameter were also higher in the WG (group esti-mates in Table 4 show the average difference betweengroups).
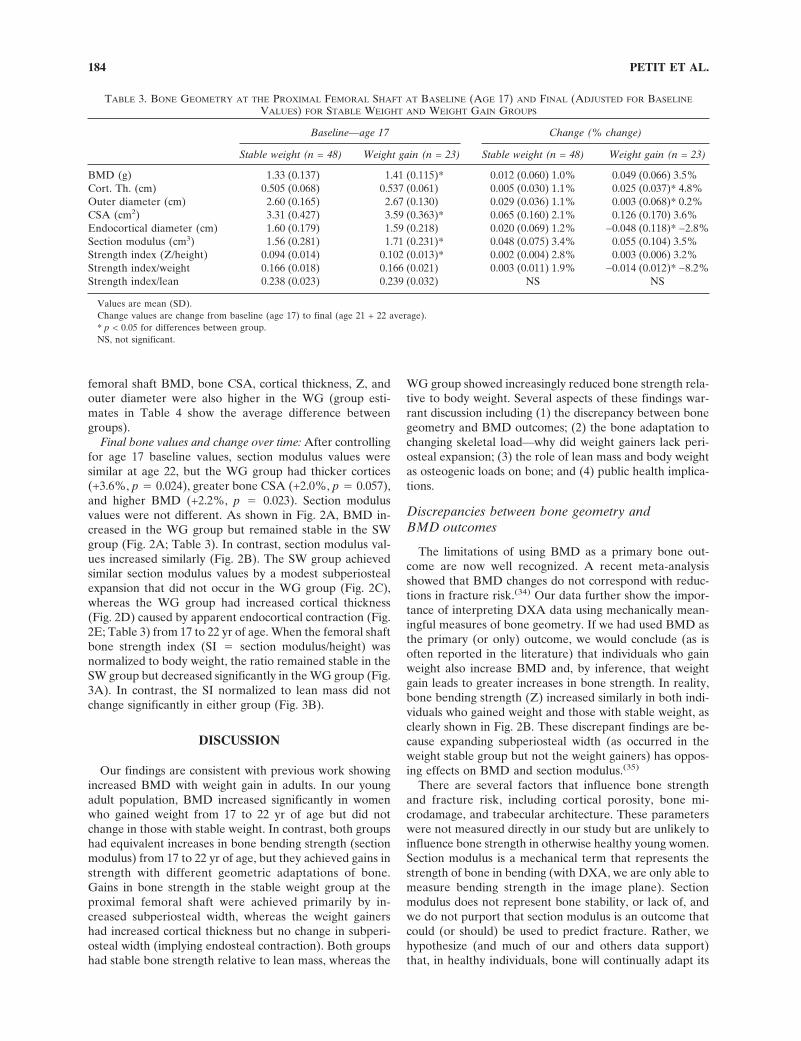
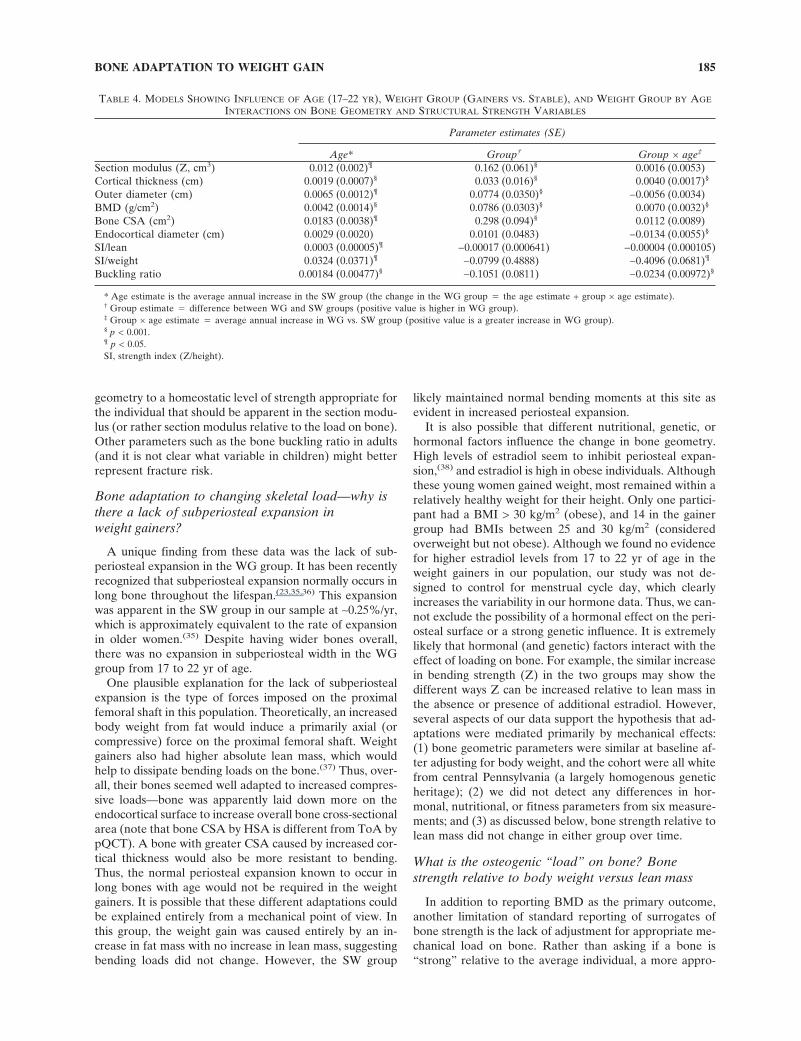
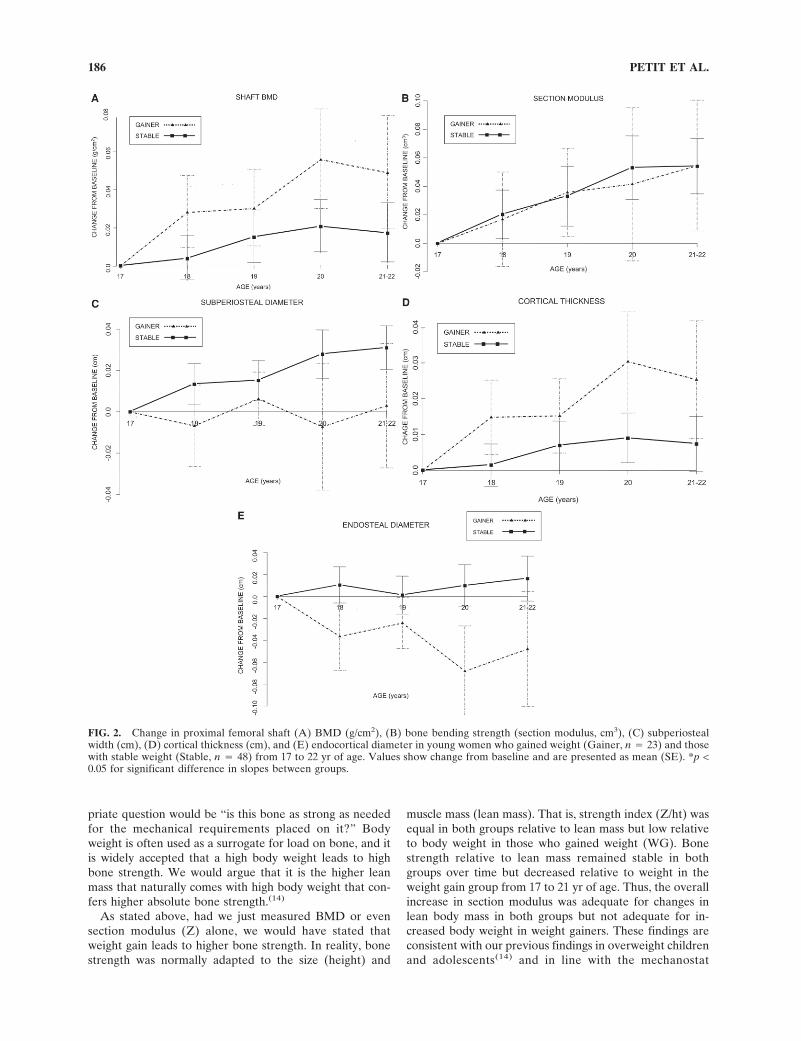
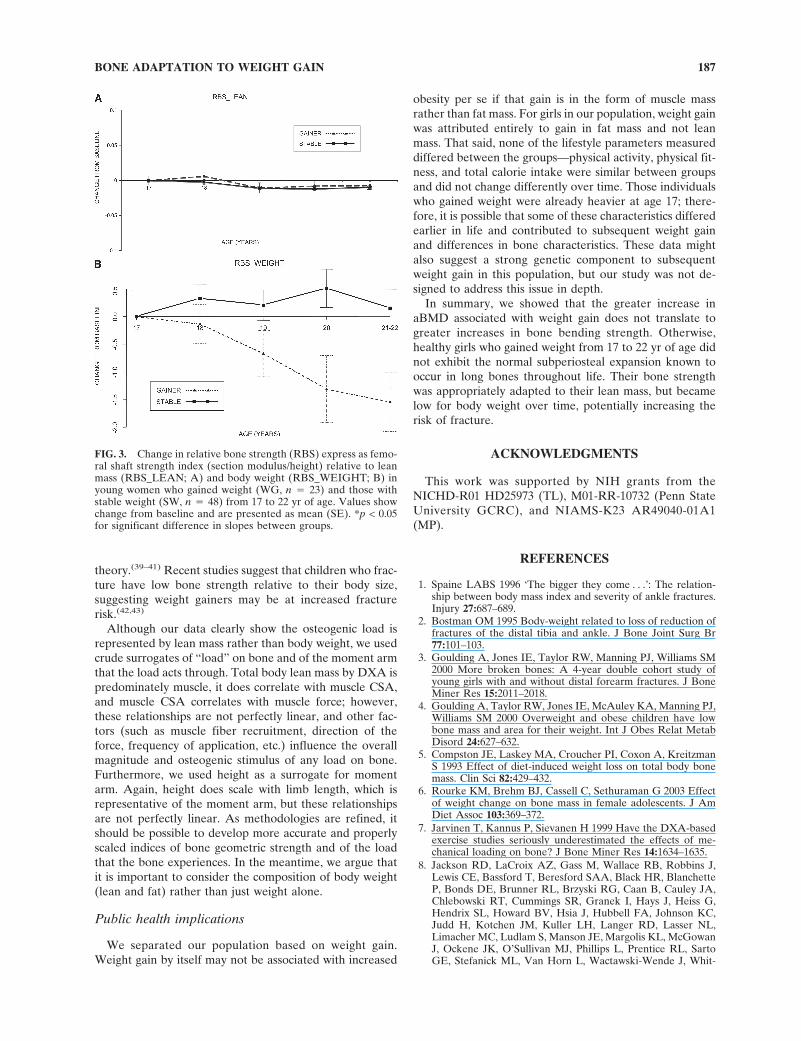
Final bone values and change over time: After controllingfor age 17 baseline values, section modulus values weresimilar at age 22, but the WG group had thicker cortices(+3.6%, p � 0.024), greater bone CSA (+2.0%, p � 0.057),and higher BMD (+2.2%, p � 0.023). Section modulusvalues were not different. As shown in Fig. 2A, BMD in-creased in the WG group but remained stable in the SWgroup (Fig. 2A; Table 3). In contrast, section modulus val-ues increased similarly (Fig. 2B). The SW group achievedsimilar section modulus values by a modest subperiostealexpansion that did not occur in the WG group (Fig. 2C),whereas the WG group had increased cortical thickness(Fig. 2D) caused by apparent endocortical contraction (Fig.2E; Table 3) from 17 to 22 yr of age. When the femoral shaftbone strength index (SI � section modulus/height) wasnormalized to body weight, the ratio remained stable in theSW group but decreased significantly in the WG group (Fig.3A). In contrast, the SI normalized to lean mass did notchange significantly in either group (Fig. 3B).
DISCUSSION
Our findings are consistent with previous work showingincreased BMD with weight gain in adults. In our youngadult population, BMD increased significantly in womenwho gained weight from 17 to 22 yr of age but did notchange in those with stable weight. In contrast, both groupshad equivalent increases in bone bending strength (sectionmodulus) from 17 to 22 yr of age, but they achieved gains instrength with different geometric adaptations of bone.Gains in bone strength in the stable weight group at theproximal femoral shaft were achieved primarily by in-creased subperiosteal width, whereas the weight gainershad increased cortical thickness but no change in subperi-osteal width (implying endosteal contraction). Both groupshad stable bone strength relative to lean mass, whereas the
WG group showed increasingly reduced bone strength rela-tive to body weight. Several aspects of these findings war-rant discussion including (1) the discrepancy between bonegeometry and BMD outcomes; (2) the bone adaptation tochanging skeletal load—why did weight gainers lack peri-osteal expansion; (3) the role of lean mass and body weightas osteogenic loads on bone; and (4) public health implica-tions.
Discrepancies between bone geometry andBMD outcomes
The limitations of using BMD as a primary bone out-come are now well recognized. A recent meta-analysisshowed that BMD changes do not correspond with reduc-tions in fracture risk.(34) Our data further show the impor-tance of interpreting DXA data using mechanically mean-ingful measures of bone geometry. If we had used BMD asthe primary (or only) outcome, we would conclude (as isoften reported in the literature) that individuals who gainweight also increase BMD and, by inference, that weightgain leads to greater increases in bone strength. In reality,bone bending strength (Z) increased similarly in both indi-viduals who gained weight and those with stable weight, asclearly shown in Fig. 2B. These discrepant findings are be-cause expanding subperiosteal width (as occurred in theweight stable group but not the weight gainers) has oppos-ing effects on BMD and section modulus.(35)
There are several factors that influence bone strengthand fracture risk, including cortical porosity, bone mi-crodamage, and trabecular architecture. These parameterswere not measured directly in our study but are unlikely toinfluence bone strength in otherwise healthy young women.Section modulus is a mechanical term that represents thestrength of bone in bending (with DXA, we are only able tomeasure bending strength in the image plane). Sectionmodulus does not represent bone stability, or lack of, andwe do not purport that section modulus is an outcome thatcould (or should) be used to predict fracture. Rather, wehypothesize (and much of our and others data support)that, in healthy individuals, bone will continually adapt its
TABLE 3. BONE GEOMETRY AT THE PROXIMAL FEMORAL SHAFT AT BASELINE (AGE 17) AND FINAL (ADJUSTED FOR BASELINE
VALUES) FOR STABLE WEIGHT AND WEIGHT GAIN GROUPS
Baseline—age 17 Change (% change)
Stable weight (n = 48) Weight gain (n = 23) Stable weight (n = 48) Weight gain (n = 23)
BMD (g) 1.33 (0.137) 1.41 (0.115)* 0.012 (0.060) 1.0% 0.049 (0.066) 3.5%Cort. Th. (cm) 0.505 (0.068) 0.537 (0.061) 0.005 (0.030) 1.1% 0.025 (0.037)* 4.8%Outer diameter (cm) 2.60 (0.165) 2.67 (0.130) 0.029 (0.036) 1.1% 0.003 (0.068)* 0.2%CSA (cm2) 3.31 (0.427) 3.59 (0.363)* 0.065 (0.160) 2.1% 0.126 (0.170) 3.6%Endocortical diameter (cm) 1.60 (0.179) 1.59 (0.218) 0.020 (0.069) 1.2% −0.048 (0.118)* −2.8%Section modulus (cm3) 1.56 (0.281) 1.71 (0.231)* 0.048 (0.075) 3.4% 0.055 (0.104) 3.5%Strength index (Z/height) 0.094 (0.014) 0.102 (0.013)* 0.002 (0.004) 2.8% 0.003 (0.006) 3.2%Strength index/weight 0.166 (0.018) 0.166 (0.021) 0.003 (0.011) 1.9% −0.014 (0.012)* −8.2%Strength index/lean 0.238 (0.023) 0.239 (0.032) NS NS
Values are mean (SD).Change values are change from baseline (age 17) to final (age 21 + 22 average).* p < 0.05 for differences between group.NS, not significant.
PETIT ET AL.184
geometry to a homeostatic level of strength appropriate forthe individual that should be apparent in the section modu-lus (or rather section modulus relative to the load on bone).Other parameters such as the bone buckling ratio in adults(and it is not clear what variable in children) might betterrepresent fracture risk.
Bone adaptation to changing skeletal load—why isthere a lack of subperiosteal expansion inweight gainers?
A unique finding from these data was the lack of sub-periosteal expansion in the WG group. It has been recentlyrecognized that subperiosteal expansion normally occurs inlong bone throughout the lifespan.(23,35,36) This expansionwas apparent in the SW group in our sample at ∼0.25%/yr,which is approximately equivalent to the rate of expansionin older women.(35) Despite having wider bones overall,there was no expansion in subperiosteal width in the WGgroup from 17 to 22 yr of age.
One plausible explanation for the lack of subperiostealexpansion is the type of forces imposed on the proximalfemoral shaft in this population. Theoretically, an increasedbody weight from fat would induce a primarily axial (orcompressive) force on the proximal femoral shaft. Weightgainers also had higher absolute lean mass, which wouldhelp to dissipate bending loads on the bone.(37) Thus, over-all, their bones seemed well adapted to increased compres-sive loads—bone was apparently laid down more on theendocortical surface to increase overall bone cross-sectionalarea (note that bone CSA by HSA is different from ToA bypQCT). A bone with greater CSA caused by increased cor-tical thickness would also be more resistant to bending.Thus, the normal periosteal expansion known to occur inlong bones with age would not be required in the weightgainers. It is possible that these different adaptations couldbe explained entirely from a mechanical point of view. Inthis group, the weight gain was caused entirely by an in-crease in fat mass with no increase in lean mass, suggestingbending loads did not change. However, the SW group
likely maintained normal bending moments at this site asevident in increased periosteal expansion.
It is also possible that different nutritional, genetic, orhormonal factors influence the change in bone geometry.High levels of estradiol seem to inhibit periosteal expan-sion,(38) and estradiol is high in obese individuals. Althoughthese young women gained weight, most remained within arelatively healthy weight for their height. Only one partici-pant had a BMI > 30 kg/m2 (obese), and 14 in the gainergroup had BMIs between 25 and 30 kg/m2 (consideredoverweight but not obese). Although we found no evidencefor higher estradiol levels from 17 to 22 yr of age in theweight gainers in our population, our study was not de-signed to control for menstrual cycle day, which clearlyincreases the variability in our hormone data. Thus, we can-not exclude the possibility of a hormonal effect on the peri-osteal surface or a strong genetic influence. It is extremelylikely that hormonal (and genetic) factors interact with theeffect of loading on bone. For example, the similar increasein bending strength (Z) in the two groups may show thedifferent ways Z can be increased relative to lean mass inthe absence or presence of additional estradiol. However,several aspects of our data support the hypothesis that ad-aptations were mediated primarily by mechanical effects:(1) bone geometric parameters were similar at baseline af-ter adjusting for body weight, and the cohort were all whitefrom central Pennsylvania (a largely homogenous geneticheritage); (2) we did not detect any differences in hor-monal, nutritional, or fitness parameters from six measure-ments; and (3) as discussed below, bone strength relative tolean mass did not change in either group over time.
What is the osteogenic “load” on bone? Bonestrength relative to body weight versus lean mass
In addition to reporting BMD as the primary outcome,another limitation of standard reporting of surrogates ofbone strength is the lack of adjustment for appropriate me-chanical load on bone. Rather than asking if a bone is“strong” relative to the average individual, a more appro-
TABLE 4. MODELS SHOWING INFLUENCE OF AGE (17–22 YR), WEIGHT GROUP (GAINERS VS. STABLE), AND WEIGHT GROUP BY AGE
INTERACTIONS ON BONE GEOMETRY AND STRUCTURAL STRENGTH VARIABLES
Parameter estimates (SE)
Age* Group† Group × age‡
Section modulus (Z, cm3) 0.012 (0.002)¶ 0.162 (0.061)§ 0.0016 (0.0053)Cortical thickness (cm) 0.0019 (0.0007)§ 0.033 (0.016)§ 0.0040 (0.0017)§
Outer diameter (cm) 0.0065 (0.0012)¶ 0.0774 (0.0350)§ −0.0056 (0.0034)BMD (g/cm2) 0.0042 (0.0014)§ 0.0786 (0.0303)§ 0.0070 (0.0032)§
Bone CSA (cm2) 0.0183 (0.0038)¶ 0.298 (0.094)§ 0.0112 (0.0089)Endocortical diameter (cm) 0.0029 (0.0020) 0.0101 (0.0483) −0.0134 (0.0055)§
SI/lean 0.0003 (0.00005)¶ −0.00017 (0.000641) −0.00004 (0.000105)SI/weight 0.0324 (0.0371)¶ −0.0799 (0.4888) −0.4096 (0.0681)¶
Buckling ratio 0.00184 (0.00477)§ −0.1051 (0.0811) −0.0234 (0.00972)§
* Age estimate is the average annual increase in the SW group (the change in the WG group � the age estimate + group × age estimate).† Group estimate � difference between WG and SW groups (positive value is higher in WG group).‡ Group × age estimate � average annual increase in WG vs. SW group (positive value is a greater increase in WG group).§ p < 0.001.¶ p < 0.05.SI, strength index (Z/height).
BONE ADAPTATION TO WEIGHT GAIN 185
priate question would be “is this bone as strong as neededfor the mechanical requirements placed on it?” Bodyweight is often used as a surrogate for load on bone, and itis widely accepted that a high body weight leads to highbone strength. We would argue that it is the higher leanmass that naturally comes with high body weight that con-fers higher absolute bone strength.(14)
As stated above, had we just measured BMD or evensection modulus (Z) alone, we would have stated thatweight gain leads to higher bone strength. In reality, bonestrength was normally adapted to the size (height) and
muscle mass (lean mass). That is, strength index (Z/ht) wasequal in both groups relative to lean mass but low relativeto body weight in those who gained weight (WG). Bonestrength relative to lean mass remained stable in bothgroups over time but decreased relative to weight in theweight gain group from 17 to 21 yr of age. Thus, the overallincrease in section modulus was adequate for changes inlean body mass in both groups but not adequate for in-creased body weight in weight gainers. These findings areconsistent with our previous findings in overweight childrenand adolescents(14) and in line with the mechanostat
FIG. 2. Change in proximal femoral shaft (A) BMD (g/cm2), (B) bone bending strength (section modulus, cm3), (C) subperiostealwidth (cm), (D) cortical thickness (cm), and (E) endocortical diameter in young women who gained weight (Gainer, n � 23) and thosewith stable weight (Stable, n � 48) from 17 to 22 yr of age. Values show change from baseline and are presented as mean (SE). *p <0.05 for significant difference in slopes between groups.
PETIT ET AL.186
theory.(39–41) Recent studies suggest that children who frac-ture have low bone strength relative to their body size,suggesting weight gainers may be at increased fracturerisk.(42,43)
Although our data clearly show the osteogenic load isrepresented by lean mass rather than body weight, we usedcrude surrogates of “load” on bone and of the moment armthat the load acts through. Total body lean mass by DXA ispredominately muscle, it does correlate with muscle CSA,and muscle CSA correlates with muscle force; however,these relationships are not perfectly linear, and other fac-tors (such as muscle fiber recruitment, direction of theforce, frequency of application, etc.) influence the overallmagnitude and osteogenic stimulus of any load on bone.Furthermore, we used height as a surrogate for momentarm. Again, height does scale with limb length, which isrepresentative of the moment arm, but these relationshipsare not perfectly linear. As methodologies are refined, itshould be possible to develop more accurate and properlyscaled indices of bone geometric strength and of the loadthat the bone experiences. In the meantime, we argue thatit is important to consider the composition of body weight(lean and fat) rather than just weight alone.
Public health implications
We separated our population based on weight gain.Weight gain by itself may not be associated with increased
obesity per se if that gain is in the form of muscle massrather than fat mass. For girls in our population, weight gainwas attributed entirely to gain in fat mass and not leanmass. That said, none of the lifestyle parameters measureddiffered between the groups—physical activity, physical fit-ness, and total calorie intake were similar between groupsand did not change differently over time. Those individualswho gained weight were already heavier at age 17; there-fore, it is possible that some of these characteristics differedearlier in life and contributed to subsequent weight gainand differences in bone characteristics. These data mightalso suggest a strong genetic component to subsequentweight gain in this population, but our study was not de-signed to address this issue in depth.
In summary, we showed that the greater increase inaBMD associated with weight gain does not translate togreater increases in bone bending strength. Otherwise,healthy girls who gained weight from 17 to 22 yr of age didnot exhibit the normal subperiosteal expansion known tooccur in long bones throughout life. Their bone strengthwas appropriately adapted to their lean mass, but becamelow for body weight over time, potentially increasing therisk of fracture.
ACKNOWLEDGMENTS
This work was supported by NIH grants from theNICHD-R01 HD25973 (TL), M01-RR-10732 (Penn StateUniversity GCRC), and NIAMS-K23 AR49040-01A1(MP).
REFERENCES
1. Spaine LABS 1996 ‘The bigger they come . . .’: The relation-ship between body mass index and severity of ankle fractures.Injury 27:687–689.
2. Bostman OM 1995 Body-weight related to loss of reduction offractures of the distal tibia and ankle. J Bone Joint Surg Br77:101–103.
3. Goulding A, Jones IE, Taylor RW, Manning PJ, Williams SM2000 More broken bones: A 4-year double cohort study ofyoung girls with and without distal forearm fractures. J BoneMiner Res 15:2011–2018.
4. Goulding A, Taylor RW, Jones IE, McAuley KA, Manning PJ,Williams SM 2000 Overweight and obese children have lowbone mass and area for their weight. Int J Obes Relat MetabDisord 24:627–632.
5. Compston JE, Laskey MA, Croucher PI, Coxon A, KreitzmanS 1993 Effect of diet-induced weight loss on total body bonemass. Clin Sci 82:429–432.
6. Rourke KM, Brehm BJ, Cassell C, Sethuraman G 2003 Effectof weight change on bone mass in female adolescents. J AmDiet Assoc 103:369–372.
7. Jarvinen T, Kannus P, Sievanen H 1999 Have the DXA-basedexercise studies seriously underestimated the effects of me-chanical loading on bone? J Bone Miner Res 14:1634–1635.
8. Jackson RD, LaCroix AZ, Gass M, Wallace RB, Robbins J,Lewis CE, Bassford T, Beresford SAA, Black HR, BlanchetteP, Bonds DE, Brunner RL, Brzyski RG, Caan B, Cauley JA,Chlebowski RT, Cummings SR, Granek I, Hays J, Heiss G,Hendrix SL, Howard BV, Hsia J, Hubbell FA, Johnson KC,Judd H, Kotchen JM, Kuller LH, Langer RD, Lasser NL,Limacher MC, Ludlam S, Manson JE, Margolis KL, McGowanJ, Ockene JK, O’Sullivan MJ, Phillips L, Prentice RL, SartoGE, Stefanick ML, Van Horn L, Wactawski-Wende J, Whit-
FIG. 3. Change in relative bone strength (RBS) express as femo-ral shaft strength index (section modulus/height) relative to leanmass (RBS_LEAN; A) and body weight (RBS_WEIGHT; B) inyoung women who gained weight (WG, n � 23) and those withstable weight (SW, n � 48) from 17 to 22 yr of age. Values showchange from baseline and are presented as mean (SE). *p < 0.05for significant difference in slopes between groups.
BONE ADAPTATION TO WEIGHT GAIN 187
lock E, Anderson GL, Assaf AR, Barad D 2006 Calcium plusvitamin D supplementation and the risk of fractures. N Engl JMed 354:669–683.
9. Lanyon LE, Rubin CT 1984 Static vs dynamic loads as aninfluence on bone remodelling. J Biomech 17:897–905.
10. Rauch F, Bailey D, Baxter-Jones A, Mirwald R, Faulkner R2004 The �muscle-bone unit’ during the pubertal growth spurt.Bone 34:771–775.
11. Neu CM, Rauch G, Manz F, Schoenau E 2001 Modeling ofcross-sectional bone size, mass and geometry at the proximalradius: A study of normal bone development using peripheralquantitative computed tomography. Osteoporos Int 12:538–547.
12. Crabtree NJ, Kibirige MS, Fordham JN, Banks LM, Mutoni F,Chinn D, Boivin CM, Shaw NJ 2004 The relationship betweenlean body mass and bone mineral content in paediatric healthand disease. Bone 35:965–972.
13. Rittweger J, Beller G, Ehrig J, Jung C, Koch U, Ramolla J,Schmidt F, Newitt D, Majumdar S, Schiessl H, Felsenberg D2000 Bone-muscle strength indices for the human lower leg.Bone 27:319–326.
14. Petit MA, Beck TJ, Shults J, Zemel BS, Foster B, Leonard MB2005 Proximal femur bone geometry is appropriately adaptedto lean mass in overweight children and adolescents. Bone36:568–576.
15. Lloyd T, Rollings N, Andon MB, Demers LM, Eggli DF, Kie-selhorst K, Kulin H, Landis JR, Martel JK, Orr G, Smith P1992 Determinants of bone density in young women I: Rela-tionships among pubertal development, total body bone mass,and total body bone density in premenarchal females. J ClinEndocrinol Metab 75:383–387.
16. Lloyd T, Andon MB, Rollings N, Martel JK, Landis JR, De-mers LM, Eggli DF, Kieselhorts K, Kulin HE 1993 Calciumsupplementation and bone mineral density in adolescent girls.JAMA 270:841–844.
17. Lloyd T, Johnson-Rollings N, Chinchilli V 1997 The effect ofenhanced bone gain achieved with calcium supplemantationduring ages 12–16 does not persist in late adolescence. In:Burckhardt P, Dawson-Hughes B, Heaney RP (eds.) TheThird International Symposium of Nutritional Aspects of Os-teoporosis. Springer-Verlag, Boston, MA, USA, pp. 11–25.
18. Lloyd T, Johnson-Rollings N, Martel JK, Chinchilli VM 1999Retention of healthy teenage women in a longitudinal study:The Penn State Young Women’s Health Study. J Clin ResPract 1:33–39.
19. Petit MA, Beck TJ, Lin HM, Bentley C, Legro RS, Lloyd T2004 Femoral bone structural geometry adapts to mechanicalloading and is influenced by sex steroids: The Penn StateYoung Women’s Health Study. Bone 35:750–759.
20. Laird NM, Ware JH 1982 Random-effects models for longitu-dinal data. Biometrics 38:963–974.
21. Martin RB, Burr DB 1984 Non-invasive measurement of longbone cross-sectional moment of inertia by photon absorptiom-etry. J Biomech 17:195–201.
22. Beck TJ, Ruff CB, Warden KE, Scott WW Jr, Rao GU 1990Predicting femoral neck strength from bone mineral data: Astructural approach. Invest Radiol 25:6–18.
23. Beck T, Looker A, Ruff C, Sievanen H, Wahner H 2000 Struc-tural trends in the aging femoral neck and proximal shaft:Analysis of the Third National Health and Nutrition Exami-nation Survey (NHANES) dual-energy X-ray absorptiometrydata. J Bone Miner Res 15:2297–2304.
24. Petit MA, McKay HM, MacKelvie KJ, Heinonen A, KhanKM, Beck TJ 2002 A randomized school-based jumping inter-vention confers site and maturity specific benefits on bonestructural properties in girls: A Hip Structural Analysis (HSA)Study. J Bone Miner Res 17:363–372.
25. Looker AC, Beck TJ, Orwoll ES 2001 Does body size accountfor gender differences in femur bone density and geometry? JBone Miner Res 16:1291–1299.
26. Duan Y, Beck TJ, Wang XF, Seeman E 2003 Structural and
biomechanical basis of sexual dimorphism in femoral neck fra-gility has its origins in growth and aging. J Bone Miner Res18:1766–1774.
27. Wainright S, Biggs W, Currey J, Gosline J 1982 MechanicalDesign in Organisms, 2nd ed. Princeton University Press, Prin-ceton, NJ, USA.
28. Lieberman D, Polk J, Demes B 2004 Predicting long boneloading from cross-sectional geometry. Am J Phys Anthropol123:156–171.
29. Selker F, Carter DR 1989 Scaling of long bone fracturestrength with animal mass. J Biomech 22:1175–1183.
30. Slemenda CW, Reister TK, Hui SL, Miller JZ, Christian JC,Johnston CC 1994 Influences on skeletal mineralization in chil-dren and adolescents: Evidence for varying effects of sexualmaturation and physical activity. J Pediatr 125:201–207.
31. Kriska AM, Caspersen CJ 1997 Introduction to a collection ofphysical activity questionnaires. Med Sci Sports Exerc29(Suppl 6):S5–S9.
32. Lloyd T, Chinchilli VM, Johnson-Rollings N, Kieselhorst K,Eggli DF, Marcus R 2000 Proximal femur bone density (BMD)of young women reflects their sports-exercise histories but nottheir teenage calorie intake. An Pediatr (Barc) 106:40–44.
33. Legro RS, Lin HM, Demers LM, Lloyd T 2000 Rapid matu-ration of the reproductive axis during perimenarche indepen-dent of body composition. J Clin Endocrinol Metab 85:1–5.
34. Delmas P, Seeman E 2004 Changes in bone mineral densityexplain little of the reduction in vertebral or non-vertebralfracture risk with anti-resorptive therapy. Bone 34:599–604.
35. Beck TJ, Orekovic TL, Stone KL, Ruff CB, Ensrud K, NevittMC, Genant HK, Cummings SR 2001 Structural adaptation tochanging skeletal load in the progression toward hip fragility:The Study of Osteoporotic Fractures. J Bone Miner Res16:1108–1119.
36. Ahlborg HK, Johnell O, Turner CH, Rannevik G, KarlssonMK 2003 Bone loss and bone size after menopause. N Engl JMed 349:327–334.
37. Duda GN, Heller M, Albinger J, Schulz O, Schneider E, ClaesL 1998 Influence of muscle forces on femoral strain distribu-tion. J Biomech 31:841–846.
38. Vanderschueren D, Venken K, Ophoff J, Bouillon R, BoonenS 2006 Clinical Review: Sex steroids and the periosteum–reconsidering the roles of androgens and estrogens in perios-teal expansion. J Clin Endocrinol Metab 91:378–382.
39. Rauch F, Schoenau E 2001 The developing bone: Slave ormaster of its cells and molecules? Pediatr Res 50:309–314.
40. Frost HM 1997 Obesity, and bone strength and “mass”: Atutorial based on insights from a new paradigm. Bone 21:211–214.
41. Frost HM, Schoenau E 2000 The “muscle-bone unit” in chil-dren and adolescents: A 2000 overview. J Pediatr EndocrinolMetab 13:571–590.
42. Skaggs DL, Loro ML, Pitukcheewanont P, Tolo V, Gilsanz V2001 Increased body weight and decreased radial cross-sectional dimensions in girls with forearm fractures. J BoneMiner Res 16:1337–1342.
43. Clark EM, Ness AR, Bishop NJ, Tobias JH 2006 Associationbetween bone mass and fractures in children: A prospectivecohort study. J Bone Miner Res 21:1489–1495.
Address reprint requests to:Moira Petit, PhD
University of MinnesotaSchool of Kinesiology
1900 University Ave SE, 110 Cooke HallMinneapolis, MN 55455, USA
E-mail: [email protected]
Received in original form March 16, 2007; revised form October 1,2007; accepted October 10, 2007.
PETIT ET AL.188
Related Documents