SERIES-6 e-EN-SUS OF INDIA.2001· - UTTARANCHAL PROVISIONAL POPULATION TOTALS- Paper -3 of 2001 DISTRIBUTION OF WORKERS AND NON-WORKERS t:!Il Cfjl !£& PEOPLE ORJENTED Dr. RANBIR SINGH DIRECTOR OF CENSUS OPERATIONS, UTTARANCHAL

Welcome message from author
This document is posted to help you gain knowledge. Please leave a comment to let me know what you think about it! Share it to your friends and learn new things together.
Transcript
SERIES-6
e-EN-SUS OF INDIA.2001· -
UTTARANCHAL
PROVISIONAL POPULATION
TOTALS-
Paper - 3 of 2001
DISTRIBUTION OF WORKERS AND NON-WORKERS
~~~ ~.Af 3&so~~""
t:!Il Cfjl ~ !£& PEOPLE ORJENTED
Dr. RANBIR SINGH
DIRECTOR OF CENSUS OPERATIONS, UTTARANCHAL
PREFACE , Census is the most comprehensive source of data on socio-economic, cultural and demographic
characte(istics of the population at various levels of administrative upits. Maintaining customary practice of
previous censuses, ProvIsional Population T~tals Paper - 1 of 2001, cont~ini'ng data on P9P'ulation, 0-6 age-group ," . '.
population by sex, decadal growth rate, sex ratio, density of population, at state and district levels and Provisional
Population Totals Paper - 2 of 2001 Rural - Urban Distribution presenting almost similar set of data for rural and
urban areas separately at state, district, tahsil and town levels have already been brought out by this office.
I feel pleasure now in bringing out Provisional Population Totals, Paper - 3 of 2001-Distribution of
Workers and Non-Workers. This is third and last publication in the series of Provisional Population Totals brought
out for 2001 Census. This publication gives data related to labour force participation in various economic activities.
Economic activities are one of the basic aspects of human life. It is the sign of progress and the reflection of
economic environment in the country. The human history shows that where the people have been more active,
have been more prosperous than those who were less active. It is the working population, which supports rest of
the population in the country. The present paper gives broadly the distribution of population between workers and
non-workers. Workers are further distributed between main and marginal workers. The working population has
been classified by four main industrial categories - Cultivators, Agricultural'Labourers, Workers engaged in
Household Industry and 9t~er Workers at district, tahsil and town levels by sex and residence.
I hope this publication will cater to the immediate needs of data users basically working in the field of
economic and social planning, women's empowerment, gender issue related matters, manpower planning and
research and employment generation programme, besides administrators, students, demographer and research
scholars.
1 gratefully acknowledge the necessary assistance and valuable guidance which 1 received from Sri J.K. ".
Banthia, Registrar General and Census Commissioner, India and other officers of the-O/o the Registrar General
India, New Delhi in preparation of the manuscript of this publication.
LUCKNOW
(Iii)
Dr. RANBIR SINGH Director of Census OperatiQns,
Uttaranchal


ACKNOWLEDGEMENTS
Overall SuperVision
Sri R.K. Singh, Joint Director Census Operations, UP
Census Division
Map Section
Sri R.K. Ram, Deputy Director Census Operatjons, UP
Sri P.C. Tewari, Assistant Director Census Operations, UP
Sri 0.1. Lyall, Statistical Investigator-lil
Sri U.G. Jhingran, Statistical Investigator-III
Sri Vinod Solomon, Statistical Investigator-III
Km. Sonia Jethwani, Compiler
Sri J.C._SIivasta~a, Research Officer (Map)
Sri N:C. Bose, Senior Drawing Assistant
Sri H.C. Tewari, Senior Draughtsman
Sri J.P. Verma, Senior Draughtsman
. (v)
4,
Figures at a glance
Highlights of t~e report
Chapter-1 -'Introduction
CONTENTS
Rural and Urban Areas, Urban Agglomerations, Concept of Work, Reference Period for I
Econo.mic Activities, Historical Perspectives of Economic Questions in Indian Censuses.
Chapter - 2 - Analysis of Data
Work Participation Rate 2001, National Scenario, Proportion of Main Workers in 1991 and
2001, Workers at District Level, Workers at Tahsil Level, Workers in CitiesfTowns.
STATEMENTS Statement 1: Total population, Total Workers, Main Workers, Marginal Workers and Non
workers: India and State/Union Territory by residence and sex: 2001
Statement 2: Total workers and their categories: India and State~Union Territory by
Page No,
ix
x.-xi
1-9
11-17
21-28
residence and sex; 2001 29-36
Inset Statement 2: Percentage of Cultivators. Agricultural Labourers, Workers Engaged !n . H\>usehold Industry and Other Workers to Total Workers in 1991 and 2001
Censuses 37
Statement 3: Percentage of Total Workers, Main Workers. Marginal Workers and Non
Workers to total population by residence and Sex: State/Union Territory and
Districts: 1991 and 2001 38-40
Statement 4:
Statement 5:
Statement 6:
Statement 7:-
Statement 8:
Ranking of Districts by Work Participation Rate: 1991 and 2001
Ranking of Districts by Male Work Participation Rate: 1991 and 2001
Ranking of Districts by Female Work Participation Rate: 1991 and 2001 ./
Ranking of Districts by percentage of workers engaged in NOn-Agricultural
Activities 2001
Percentage distribution of Total Workers (Main and Marginal) by category of
Workers by Sex: 2001
(vii)
41
42
43
44
45

Table 1:
Table 2:
Table 3:
Table 4:
(1 )
(2)
(3)
(4)
(5)
(1 )
(2)
(3)
(4)
(5)
(1 )
(2)
TABLES
Total Population, Workers and Non-Workers in State/Union Territory, Districts,
Tahsils, Urban Agglomerations, Cities and Town~ by Residence and Sex: 2001
Percentage of Workers and Non-Workers to Total ):lopulation State/Union
Territory, Districts, Tahsils, Urban Agglomerations, Cities and Towns by Residence
Page No.
46-62
and Sex: 2001 63-79
Distribution of Total Workers (Main and Marginal) as Cultivators, Agricultural
Labourers, Workers in Household Industry and Other Workers in StatefUnion
Territory, Districts, Tahsils, Urban Agglomerations, Cities and Towns by Residence
and Sex: 2001.
Percentage distribution of Total Workers (Main and Marginal) as Cultivators,
Agricultural Labourers, Workers in Household Industry and Other Workers in
State/Union Territory, Districts, Tahsil, Urban Agglomerations, Cities and Towns by
Residence and Sex: 2001
Total work participatiol) rates 2001
Male work participation rates 2001
Female work participation rates 2001
MAPS
Percentage of agricultural workers (cultivators and agricultural labourers) to total workers
2001
Percentage of non-agricultural workers 2001
CHARTS AND DIAGRAMS
Work participation rates 2901 Female work participation rates 2001
Work participation rates by sex 1961.-2001
Percentage distribution of main workers, marginal workers and non-workers by sex 1991
and 2001
Percentage distribution of workers by category 196.1-2001 by sex
ANNEXURE-A
Specimen of Household Schedule
Diagram Showing the Economic Distribution of Population
(viii)
80-96
97-113
117
119
121
123
125
129
131
133
135
137
141-142
143

FIGURES AT A GLANCE P/M/F Total Rural Urban
Persons 8,479,562 6,309,317 2,170,245 1 POPULATION
Males 4,316,401 3.143,380 1,173.021
Females 4.163,161 3,165.937 997.224
Absolute Peg:entage
2 DECADAL POPULATION GROWTH 1991-2001 1,366,079 19.20
Total Rural Urban
3 SEX RAnO (FEMALES PER 1000 MALES) 964 1007 850
. Total Rural Urban
4 LITERACY RATE Persons 72.28 68.95 81.50
Males 84.01 82.74 87.21
Females 60.26 55.52 74.77
5 WORKERS AND NON-WORKERS Absolute Percentage to Total Population
TOTAL WORKERS (MAIN AND MARGINAL) Persons 3t..133,281 36.93
Males 2,005,858 46.42
Females 1,127,423 27.09
a) MAIN WORKERS Persons 2,323,518 27.39
Males 1,647,759 38.13
Females 675,759 16.24
b) MARGINAL WORKERS Persons 809,763 9.55 -
Males 358,099 8.29
Females 451,664 10.85
NON-WORKERS Persons 5,350.074 63.07
Males 2,'315,183 53.58 " Females 3.034,89'; 72.91
6 CATEGORY OF WORKERS (MAIN AND MARGINAL) Absolute Percentage to Total Wnrkp.rs
I. CULTIVATORS Persons 1,559,415 49.77
Males '685,921 34.?0
Femal~s 873,494 77.48
II. AGRICULTURAL LABOURERS Persons 258.752 8.26
Males 190,836 9.51
Females 67,916 6.02
III. WORKERS IN HOUSEHOLD INDUSTRY Persons 69,996 2.23
M,les 42,964 2.14
Females 27,032 2.40 _ ......
IV. OTHER WORKERS Persons· 1,245,118 --_ 39.74
Males 1,086,137 54.15
Females /' -158.981 14.10 . .
Note: 1. Since the source of compilation of Paper-31S different from that of Paper-l & 2. therefore. data on 1st four parameters are maintained as per Paper·l & 2 .
2. Various formats were designed for quick tabulation on different population characteristics. out of which some were compiled in the field itself. ~n
the final tabulations these figures are likely to be changed.
(LX)
1574 RG1/2003-2


HIGHLIGHTS Of' THE REPORT 1. Out of a total population of 8483355 persons, 4321041 are males (50.93 percent) and 4162314
females (49.07 percent).
2. There are 3133281 totGII workers out of which 2005858 are males (64.02) and 1127423 females
(35.98).
3. The work participation rate of males is 46.62 and that of females is 27.09,
4. Among the total workers of 3133281, main workers are 2323518 (74.16) and marginal workers are
809763 (25.84).
5. Among the males 38.13 are main worke~s, 8.29 marginal workers and 53.58 non-workers. Among the
females, 16.24 are main workers, 10.85 marginal workers and 72.9'1 non-workers.
6. Out of total workers, 49.77 are engaged as Cultivators, 8.26 as Agricultural Labourers, 2.23· in 1;:1"'-1
while 39.74 are absorbed in Other Works.
7. The highest work participation rate (47.67) is found in Bageshwar district whereas the lowest· (29.51 ) in
Hardwar district.
8. The highest proportion of male workers (54.15) has adopted Other Works as means of .livelihood while
the highest proportion of female workers (77.48) adopted CultivatiooJor a living.
9. The highest male work participation rate (48.58) is recorded in Udham Singh Nagar siistrict and the
lowest.(40.83) in Garhwal district. The corresponding figures for females have been returned in district
Bageshwar (49.92) and Hardwar district (8.42) respectively.
10. The work participation rate for rural areas is 39.6 (males 46.0, females 33.3) as against the
corresponding TIgures of 29.1 (males 47.6, females 7.3) for the urban areas.
11. Highest percentage of workers (74.35) engaged in non-agricultural activities is recorded In Dehradun
district while the lowest (22.26) in Bagesflwar district.
12. The highest growth of workers (188.30) is observed in industrial category of HHI and the lowest
(15.35) in Agricultural Labourers.
13. 4 districts, viz.,.Nainital (36.70), Udham Singh Nagar (31.88), Dehradun (31.20ya'nd Hardwar (29.51)
-have recorded the lower work participation rate and remaining 9 districts received higher worJ<
participation rate than the sta~e average (36.9).
14. Among the tahsils, the highest work participation rate (51.25) is recorded in Bhikiya Sain tahsil of
Almora district and the lowest (28.21) in Hardwar tahsil of Hardwar district.
15. The highest proportion of workers (77.74) engaged in agricultural activities jn district Bageshwar
whereas the highest proportion of workers (74.35) engaged in non-agricultural activities in district
Dehradun.
16. The average size of the district in terms of population is 652566 and that of working population is
241022.
17. The population grew by 20.32 as against the working population growth of 11.28 during 1991-2001. -.... 18. The work participation rate of Uttaranchal is 36.9 and the country as a whole is'39.3-
(x)
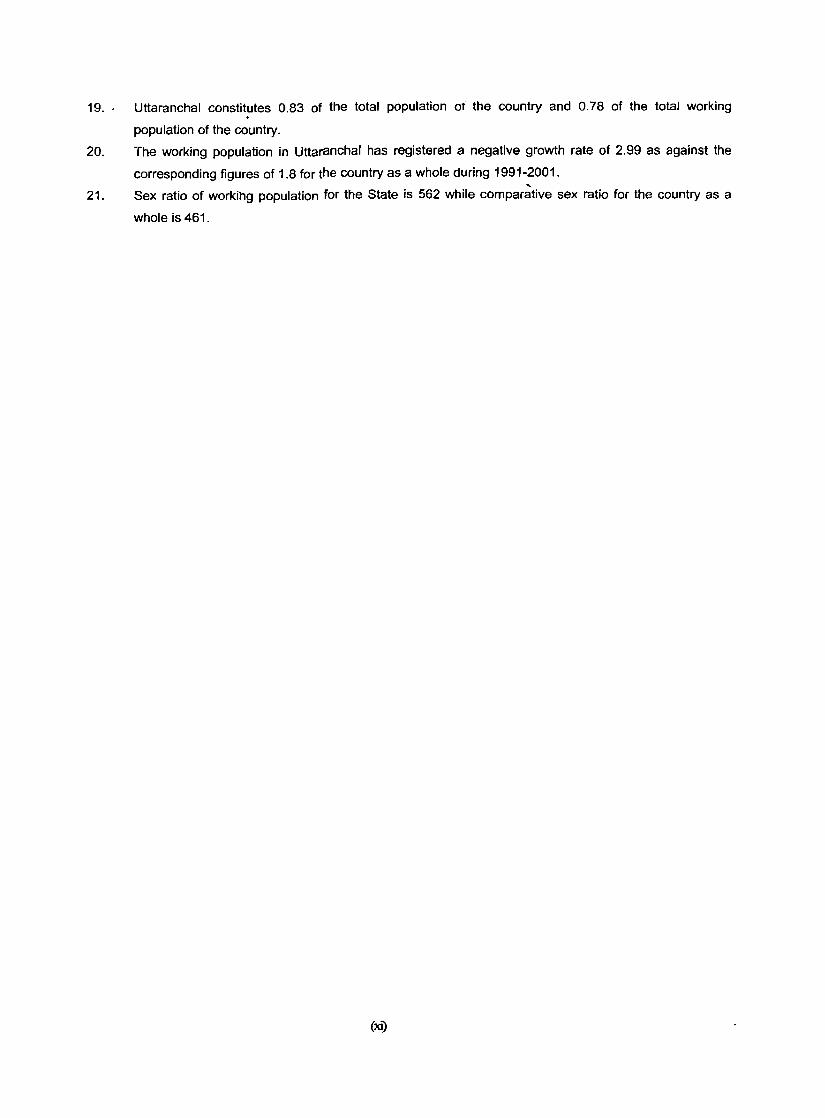
19., Utlaranchal constitutes 0.83 of the total population aT the country and 0.78 of the total working
population of the country.
20. The working population in Uttaranchal has registered a negative growth rate of 2.99 as against the
corresponding figures of 1.8 for the country as a whole during 1991-2001.
21. Sex ratio of workihg population for the State is 562 while compar~tive sex ratio for the country as a
whole is 461.
(XI)

~NTRODUCTION

CHAPTER-1
INTRODUCTION
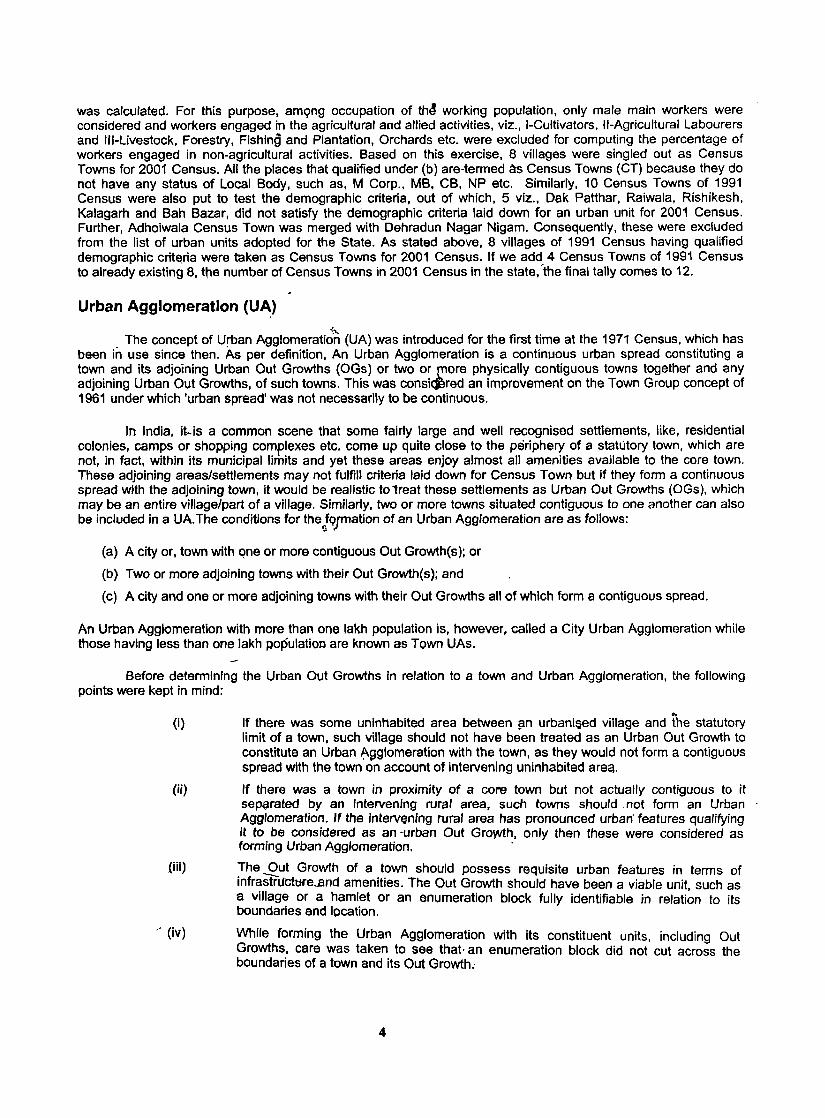
The'~current publication is the third in series of publications of Uttaranchal State relating to provisional re~ults of the 'Census of India 2001. In the first publication, Le., Provisional Population Totals, Paper-1 of 2001, figures were provided at the district level. The level of present publication has been extended up to..J:he rural-urban break up of the population. Uttaranchal is a newly created state after 1991 Census. Twenty new districts were created in erstwhile Uttar Pradesh after 1991 Census and before the creation of Uttaranchal. FoW of these newly created districts, yiz.: Rudraprayag, Bageshwar, Champ~'Nat and Udham Singh ,Nagar lie in Uttaranchal. Seven new tahsils and one town have also been created in the state. Consequent, upon creation of these dis~ricts anq tahsils, administrative boundaries of 6' districts and 7 'ta1,sils'-in' tlie '.state . were 'affected. Details of these newly created administrative units are as under: .
LiSt'of New TahsiisITowns
51. No, Tahsilrrown District 1 Pokhari Tahsil Chamoli 2 Gair Sain Tahsil Chamoli 3 Ghansali Tahsil Tehri Garhwal 4 Vikas Nagar Tahsil Oehradun 5 Rishikesh Tahsil Oehradun 6 Sri Nagar Tahsil Garhwal 7 Kapkot Tahsil Bageshwar 'B Chamba NP Tehri Garhwal
Rural and Urban Areas -
It is customary in Census. to present rural and urban components of the population separateIY'.,for each administrative unit. However, there is no uniform definition of rural 'and urban areas throughout the world, Urban nomenclature, in fact, depends upon various factors, such as, developmental level, economic, social. politiCal ard cultural situations prevailing in the country. Taking into consideration all these factors, and to e'}Pure comparability of 2001 Cen~us data with previous Censuses and to provide the basis for analys~g trends of ufb~nisation, definition of urban unit of 1991 Cens\Js was retained as such. Following criteria were evolved for tre~ting a place as urban at the 1991 Census which have been adopted as such for 2001 Census as well:
(a) All places with a Municipal Corporation, Municipality, Cantonment Board or Notified Town Area Committee etc.,
(b) All other places which satisfied the following criteria:
(i) A minimum population of 5,000:
(ii) At least 75% of the male working population enga,ged in non agricultural pursuits: and
(iii) A density of population of at least 400 per sq. km.
Besides obtaining list of statutory towns, demographic profiles in respect of 8 villages having 4,000 or more population in 1991 were tested in accordance with instructions of the Registrar Gener-a~dia because a place having a population of 4,000 or thereabout in 1991 Census might have crossedAhe mark of 5,000 population during the span of last 10 years at the 2001 Census. For.such cases, the composition of work force and density of population were examined to see whether these places could qualify to be categorized as urban, While applying the test, first of all, density of population was calculated and villages, which satisfied the criterion of density, were further put to another test. Thereafter proportion of male working population engaged in non-agricultural pursuits
3
was calculated. For this purpose, am9ng occupation of tht! working population, only male main workers were considered and workers engaged in the agricultural and allied activities, viz., I-Cultivators, II-Agricultural Labourers and III-Livestock, Forestry, Fishing and Plantation, Orchards etc. were excluded for computing the percentage of workers engaged in non-agricultural activities. Based on this exercise, 8 viffages were singled out as Census Towns for 2001 Census. All the places that qualified under (b) are-termed ~ Census Towns (CT) because they do not have any status of Local Body, such as, M Corp., MB, CB, NP etc. Similarly, 10 Census Towns of 1991 Census were also put to test the demographic criteria, out of which, 5 viz., Oak Patthar, Raiwala, Rishikesh, Kalagarh and Bah Bazar, did not satiSfy the demographic criteria laid down for an urban unit for 2001 Census. Further, Adhoiwala Census Town was merged with Oehradun Nagar Nigam. Consequently, these were excluded from the list of urban units adopted for the State. As stated above, 8 villages of 1991 Census having qualified demographic crit~ria were taken as Census Towns for 2001 Census. If we add 4 Census Towns of 1991 Census to already existing 8, tile number of Census Towns in 2001 Census in the state, "the final tally comes to 12.
Urban Agglomeration (UA)
~ The concept of Urban Agglomeration (UA) was introduced for the first time at the 1971 Census, which has
been in use since then. As per definition, An Urban Agglomeration is a continuous urban spread constituting a town and its adjoining Urban Out Growths (OGs) or two or (Tlore physically contiguous towns together and any adjoining Urban Out Growths, of such towns. This was consiqered an improvement on the Town Group concept of 1961 under which 'urban spread' was not necessarily to be continuous.
In India, it..is a common scene that some fairly large and well recognised settlements, like, residential colonies, camps or shopping complexes etc. come up quite close to the periphery of a statutory town, which are not, in fact, within its municipal limits and yet these areas enjoy almost all amenities available to the core town. These adjoining areas/settlements may not fulfill criteria laid down for Census Town but if they form a continuous spread with the adjoining town, it would be realistic tolreat these settlements as Urban Out Growths (OGs), which may be an entire village/part of a village. Similarly, two or more towns situated contiguous to one another can also be included in a UA. The conditions for the JQrnation of an Urban Agglomeration are as follows:
(a) A city or, town with qne or more contiguous Out Growth(s); or
(b) Two or more adjoining towns with their Out Growth(s); and
(c) A city and one or more adjoining towns with their Out Growths all of which form a contiguous spread.
An Urban Agglomeration with more than one lakh population is, however, called a City Urban Agglomeration while those having less than one lakh population are known as Town UAs.
Before determining the Urban Out Growths in relation to a town and Urban Agglomeration, the following points were kept in mind:
(i)
(ii)
(iii)
" (iv)
If there was some uninhabited area between §In urbani~ed village and the statutory limit of a town, such village should not have been treated as an Urban Out Growth to constitute an Urban f'.~l9lomeration with the town, as they would not form a contiguous spread with the town on account of intervening uninhabited areq.
If there was a town in proximity of a core town but not actually contiguous to it sep~rated by an intervening rural area, such towns should. not form an Urban Agglomeration. If the intervening rural area has pronounced urban' features qualifying it to be considered as an -urban Out Growth, only then these were considered as forming Urban Agglomeration. .
The Out Growth of a town should possess requisite urban features in terms of infraSinIctttre...and amenities. The Out Growth should have been -a viable unit such as a village or a hamlet or an enumeration block fully identifiable in relati~n to its boundaries and location.
While forming the Urban Agglomeration with its constituent units, including Out Growths, care was taken to see that· an enumeration block did not cut across the boundaries of a town and its Out Growth.
4
The Urban Agglomeration was to be finalised on the above lines. prescribed by Registrar General. India. Accordingly, Instructions from the Registrar General. India were received for the formation of Urban Agglomerations in the state. As a sequel to the instructions. a circular was sent to all the Districts Magistrates of State requesting them to send their proposals for Urban Agglomeration(s) on the lines of the instructions in consultat,ion, with the authorities of local bodies and other subordinate district authorities concerned. The District Magistrates were a/so requested to have on-th~-spot checking, should the ni?ed arise. Along with their proposals. a notion~1 map waS also requireq to be sent to facilitate scrutiny of the proposal. .'
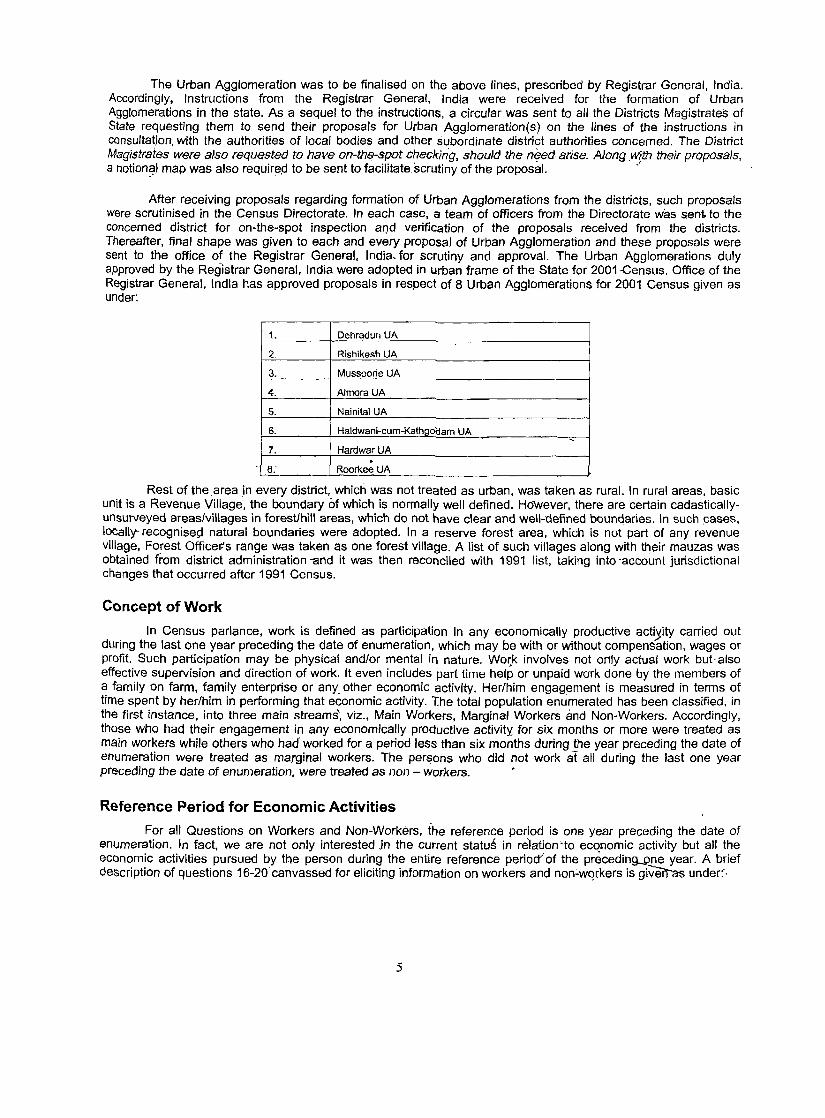
After receiving proposals regarding formation of Urban Agglomerations from the districts. such proposals were scrutinised in the Census Directorate. In each case, a team of officers from the Directorate was sen~ to the concerned district for on-the-spot inspection aDd verification of the proposals received from the districts. Thereafter. final shape was given to each and every proposal of Urban Agglomeration and these proposals were sent to the office of the Registrar General, India. for scrutiny and approval. The Urban Agglomerations duly approved by the Reg"islrar General, India were adopted in urban frame of the State for 2001-Gensus. Office of the Registrar General, India has approved proposals in respect of 8 Urban Agglomerations for 2001 Census given as under:
1. Dehradun UA
2. Rishikesh UA
3. Mussoorie UA
4. Almora UA
5. Nainital UA
6. Haldwani-cum-Kathgoaam UA -7. Hardwar UA . 8: Roorkee UA
Rest of the.area in every district, which was not treated as urban, was taken as rural. In rural areas, basic unit is a Revenue Village, the boundary of which is normally well defined. However, there are certain cadasticallyunsurveyed areas/villages in forest/hill areas. which do not have clear and well-defined boundaries. In such ,cases. locally- recognise9 natural boundaries were adopted. In a reserve forest area. which is not part of any revenue village, Fo~est Officer;'s range was taken as one forest village. A list of such villages along with their mauzas was obtained from district administration -and it was then reconciled with 1991 list, taking into -account jurisdictional changes that occurred after 1991 Census.
Concept of Work
In Census parlance. work is defined as participation in any economically productive acti~ity carried out during the last one year preceding the date of enumeration, which may be with or without compensation. wages or profit. Such participation may be physical and/or mental in nature. Wo~k involves not only actual work but-also effective supervision and direction of work. It even includes part time help or unpaid work done by the members of a family on farm. family enterprise or any. other economic activity. Her/him engagement is measured in terms of time spent by her/him in performing that economic activity. The total population enumerated has been classified, in the first instance. into three mair:l streams'. viz .• Main Workers. Marginal Workers and Non-Workers. Accordingly. those who had their engagement in any economically productive activity- for six months or more were treated as main workers while others who had worked for a period less than six months during the year preceding the date of enumeration were treated as marginal workers. The persons who did not work at all during the last one year preceding the date of enumeration, were treated as non - workers. •
Reference Period for Economic Activities
For all Questions on Workers and Non-Workers, the reference period is one year preceding the date of enumeration. In fact. we are not only interested jn the current status in relation'to ec~nomic activity but all the economic activities pursued by the person during the entire reference perioeY of the precedinQ._Qne year. A brief description of questions 16-20 canvassed for eliciting information on workers and non~wqrkers is giverr:as under:',
5

Question 16: Did the person work any time last year? (Includes even part time help or unpaid work in farm, family enterprise or in any other economic activity)
If answer was yes and the person had worked for 6 months or more, he/she was treated as Main Worker. If his/her engagement in any economic activity was less than 6 months, the person was put under category of Marginal Workers and finaffy if he/she did not work at all, the enumerator had to categorise the person as nonworker.
• Question 17: Economic Activity of the Main or Marginal Worker • This question had 4 sub-parts.
17 (i): Category of the economic activity of the Main or Marginal Worker under this sub part. The person was categorised as Cultivator or Agricultural Labourer or engaged in HHI or Other Worker. 17 (ii): Occupation of the person (describe the actual work of the person).
This Question was applicable to persons under categories - Workers in Household Industry and Other Worker. In reply to this question, actual work done by a person was to be recorded. 17 (iii): Nature of Industry, Trade or Service where the person works/worked or of self employment
In reply to this question, the nature of industry in which a person was working had to be recorded. 17 (iv): Class of Worker: Employer/Employee/Single Worker/Family Worker .
A person who got his/her main or marginal work recorded as HHI or OW was classified into four above mentioned groups.
Question 18: If the person was recorded as Marginal Worker or Non-Worker, his/her Non-economic activity as student/household dutiesldependent/pensionerlbeggarlother
The non-economic activities of Marginal Workers and Non-Workers were grouped into 6 categories and assigned code numbers, which were later to be used to record the responses under this question.
Question 19: If Marginal Worker or Non-Worker, is the person seeking/available for work. If an individual in reply to Question 16 had replied that sheille had worked for less than 6 months or did not
work at all the Enumerator had to ask from her/him whether she or he was seeking work or available for work.
Question 20: Travel to place of work This Question was applicable to person categorized as Other Worker in Question 17 (i) and was asked for
the first time in 2001 Census. Based on this criterion, the information on economic activity of every person was recorded through a set of
five questions (16-20) and their parts contained in Household Schedule. These questions are almost similar to those in nature as canvassed in 1991 Census. However, apart from simplifying, some conceptual improvements have also been done. For example, question on seeking or available for work was enquired not only from NonWorkers but Marginal Workers as well. During the Census of India 2001, a new question (20) on the commutation of 'Other Workers' to their place otwork has been introduced for the first time.
Historical Perspective of Economic Questions in Indian Censuses
The information on economic activity of the individual was collected right from the 1872 Census. In the Censuses of 1872 and 1881, only one question relating to 'occupation' was asked from the individuals and the persons were classified according to various occupations. In 1891, the concept of 'means of subsistence' was introduced. The occupation or means of SUbsistence was recorded in case of every individual. In case of dependents, the occupation of the person on whom they were dependent was recorded. From 1901 to 1921, the information on principal and subsidiary oc.cupation or means of subsistence of actual workers was recorded. In all these Censuses, the term 'actual worker" also included persons who were in receipt of income without doing work, such as rentiers and pensioners etc. In 1931 Census, the term 'actual worker' was replaced by the 'earner'. The population was classified as earners, working dependents and non-working dependents. The Principal and subsidiary occupation of each worker was recorded. Occupation of dependents was recorded under the caption 'subsidiary occupation. 'Besides, the Industry in which a person was employed was also noted. .
In 1941 Census, 'Means of Livelihood in order of importance' was recorded in respect of each worker. It was also enquired whether a padicular means of livelihood existed throughout the year, if not, for what part of the year. If a person was employed by someone else, the information about his business was also noted. In case of 'dependent' if was enquired whether he was wholly or partly dependent on anyone else. If so, means of livelihood of person on whom dependent was recorded. The information relating to the employment of: (a) paid assistant (b) member of household was also collected. The question on 'Are you in employment now?' was also asked in regard to means of livelihood of a person shown as partly dependent.
6
Owing to World War II, the tabulation of 1941 Census was greatly curtailed and a 2 random sample of the original individual census slips was retained for each state. On the recommendations of the Population Data Committee, the Government of India decided to entrust the Y-sample slips in 1945 'to the Indian .Statistical Institute 'Calcutta where the information in the slips was transferred to Hollerith Cards. From these cards, Means of livelih!=l0d and Industry Tables W(:lre prepared for the states for which n9 such tables had been prepared at the time of'1941 Census. ':~ : '
, The 195~ Censu~ ascertained the two economic characteristics of every individual - his economic status aria his means of livelihood. According to economic status, every person was classified as 'a self supporting person' or 'an earning dependent' or'a non-earning dependent'.
It was found that the concept of dependency adopted in 1951 Census had a tendency to suppress the important sector of workers as a consequeflce of which the number of economically active persons engaged in agriculture and traditional cottage industries and services where women were mainly employed showed very little increase compared to increase in general population. It was felt that by the introduction of income, persons who worked in family enterprises without wages in cash or kind but who shared the profits were likely to be omitted. This was especially in the case of families who partake in household cultivation.
Keeping into consideration the above-mentioned shortcoming in 1951 data, it was decided that the economic data for 1961 Census Should be collected on the basis of work, Le., the population should be divided into two classes - Workers and Non-workers. The basis of work adopted in 1961 Census was as follows:
In case of seasonal work like cultivation,' livestock, dairying, household' industries etc., if a person had some regular work of more than one hour a day throughout the greater part of the working season; he was to be regarded as a worker. In the case of regular employment in any trade, profession, service, business or commerce, the basis of work would be satisfied if the persons were employed during period of the 15 days preceding the day on which he was enumerated. A person who was working but was absent from hJs work during the fifteen days preceding the day of enlimeration due to illness or other cause was a worker. A person who was offered work but had not actually joined was treated as a non-worker. A person under training-as apprentice with or without stipend/wages was regarded as a worker. An adult woman engaged in household duties but not doing any productive work to augment the family resources was considered as non-worker. Persons like beggars; penSioners etc. who received incomE) without doing any work were regarded as .non-workers. A public or social s~rvice·worker who was actively engaged in public service activity or a political activity of his/her party was regarded as a 'worker'. The workers were further classified into four broad industrial categories - (1) Cultivators (2) Agricultural Labourers (3) Workers engaged in Household Industry and (4) Other workers {other than (1), (2) and (3)}.
At the 1971 Census, cOhsiderable departure was made in respect of the economic questions. The main activity of a person was asceltained accordingly as he/she spent his/her time bClsically as a worker producing goods and services or as a non-Worker. For regular work in Industry, Trade or Services, the reference penoa was the week prior to the enumeration and for seasonal work such as agriculture, the last one-year work involved not only the actual work but also effective supervision and direction of work. Categorization of econoll~.ic activity followed the same pattern as adopted in 1961 Census.
In case of Household Industry or Other Work, the information relating to place of work (Name of Village or Town), Name of establishment, Nature of Industry, Trade, Profession or Service, Description of wOrk and class of worker were also recorded.
Secondary- work was also recorded in respect of persons who had returned some work as their main activity. Where a"person, who was basically a non-worker such as a student or housewife, but did make some. marginal contribution to work; it was recorded under secondary work.
1981 Census
,At the 1981 Census, instead of dichotomy of workers and non-workers; a--trichotomy of-main (full time) workers, marginal workers and non-workers was adopted. The "work" concept of 1961 and 1971 Censuses, as apposed to the "income" or "economic independence" concept of earlier Censuses, was continued.-Work had been defined as participation in any economical productive activity. Such partiCipation may be physical or mental in nature. Work involves not only' actual work but also effective supervision and direction of work. But the criterion for classification of persons as workers was changed. 'At the t!il61 Census, a person qualified as worker if he or she had wor~ed regularly d~ring th~ last season or if he'or she had workpd at least a day in regular (non-seasonal) work dunng the precedmg fortnrght. At the 1971 Census, a person was treateg as worker only if he or she spent his/her time mainly in work or if he/she worked at least a day in regular (non-seasonal) work cfUling...t@_preceding week. In the 1981 Census, for main workers, a time criterion of engagement in work for major part of preceding year, Le., at least 6 months or 183 days, was adopted. Thos~ who worked for some time during the preceding year but not for the major part were treated as marginal workers. -Non-workers were those who had not worked anytime at all during the preceding year.
7

For all the economic questions canvassed during 1981, the reference period was the year preceding the date of enumeration.
The main workers had been classified into four broad categories, viz., I - Cultivators; II - Agricultural Labourers; III - Household Industry and IV - Other Workers unlike 1961 and 1971 CenstJses wherein main, workers were classified into 9 broad industrial categories for presentation of data in Primary Census Abstract.
1991 Census •
The concepts regarding work adopted in the 1991 Census are as under: Work was defined as participation in any economically productive activity. Such partiCipation may be
physical or mental in nature. Work involved not only actual work but also effective supervision and direction of ~ork. It also included unpaid work on farm or in family enterprise.
Main Workers
Those who had worked for the major part of the year were termed as main workers. By major part of the year was meant 6 months (183 days) or more.
Marginal Workers
Those who had not worked for the major part of the year, i.e., those who had worked for less than 6 months (183 days) in the year were termed as marginal workers.
Main workers/marginal workers were further distributed into 10 broad industrial categories.
2001 Census
Definition of work as adopted during 1991 Census has been retained as such in 2001 Census. In Census, a person is categorized as "Worker" when she/he has participated in any economically productive activity at anytiine during the reference period. Having found out that such a person is a worker it had to be ascertained whether she or he had worked for 6 months or more or less than 6 montns. A person wh_o had worked for 6 months or more during the last one year was termed as "Main Worker" otherwise she/he was categorized as a "Marginal Worker".
Unlike 1991 Census, workers were classified into one of the four broad industrial categories of the economic activity, viz., cultivators, agricultural labourers, workers engaged in' household industry and other workers.
Definitions of the four categories of workers are, given as under:
1. Cultivators
For purposes of the census a person is classified as cultivator if he or she is engaged in cultivation of land owned or held from Government or held from private persons or Institutions for payment in money, kind or share, Cultivation includes effective supervision or direction in cultivation.
Cultivation involves ploughing, sowing, harvesting and production of cereals and millet crops such as wheat, paddy, jowar, bajra, ragi, etc., and other crops such as sugarcane, tobacco, groundnuts, tapioca, etc., and pulses, raw jute and .kindred fibre crop, cotton, cinchona and other medicinal plants, fruit growing, vegetable growing or keeping orchards or groves, etc. C-ulfivation does not include plantation crops like tea, coffee, rubber, coconut and betel-nuts (areca).
2. AgriculturSiI Labourers
A person who works on anot.her person's land for wages in money or kind or share will be regarded as an agricultural labourer. She or he has no risk in the cultivation, but merely works on another person's land for wages. An agricultural labourer has no right of lease or contract on land on which she/he works.
Persons engaged in cultivation of plantation crops like tea, coffee, rubber, coconut, betel-nuts (areca) have been clubbed in the category of "Other Workers".
Milk production f6r home consumption only has also been treated as work with a view that in previous census~s, those who were engaged in milk production for self consumption only were left out and treated as nonworkers. This may rflsult in work participation rate in general and for females in particular going up for rural areas. -- -~
3. Workers engaged in Household Industry
Household Industry is defined as an industry conducted by one or more members of the household at home or within the village in rural areas and only within the precincts of the house where the household lives in
8
urban areas. The larger proportion of workers in the household industry should consist of members of the household. The industry should not be run on the scale of a registered factory, which would qualify or has to be registered under the Indian Factories Act 1948.
. Certain activities even though conducted by members of the same household will not constitute a Household Industry. These are indicated below and therefore the members of the family working in such industries will be classified as "Other Wor~ers" and not "Household Indu§try.:':
(i) Plantation wQrk"' ~: "~ .' (ii) Livestock maintenance and productiqn such as cattle, goats, sheep breeding, poultry farms, bee
keeping; rearing of silk worm and production of cocoons and raw silk, production of milk, eggs, honey, wax, bones, etc.
(iii) Hunting, trapping and selling of the catch. (iv) Forestry and logging: log, fuel, charcoal production, gathering and selling of fodder and other forest
produce, etc. (v) Fishing including rearing of fish, collection of pearls, shells, sea products, etc. (vi) Mining and quarrying
The main characteristics of the Household Industry are the following: (a) One or more members of the household must participate and the component of hired
labour should be minimum. (b) The activity should relate to production, processing, servicing, repairing or making and selling of
goods. . (c) The goods produced should not be for consumption by the household itself but should be ,wholly or
partly for sale. (d) In an urban area the industry must be carried out in the precincts of the house in which the
household lives. In the rural areas, the industry may be carried out anywhere within the limits of the village.
(e) The activity should not be on the scale of the Registered Factory.
4. Other Workers
All workers, i.e., those who have been engaged in some economic activity during the last one-year, but are not Cultivators or Agricultural Labourers or in Household Industry, are "Other Workers".
The type of workers that come' under this category of 'Other Worker" include all government servants, municipal employees, teachers, factory workers, plantation workers, those engaged in trade, commerce, business, transport, banking, mining, construction, political or social work, priests, entertainment artists, etc. .
9

ANALYSIS OF DATA
11

CHAPTER·2
ANALYSIS OF DATA
The data on economic activities of the pMple collected through Questions 16 to 20 of the Household Schedule of 2001 Census have been compiled to give quick results on the Work Participation Rates. The Work Participation Rate. may be defined as the percentage of workers to the total population. The data so generated have been briefly analysed in foregoing paragraphs.
An overview of National Scenario
Out of total population (1025.25 million) of the country netted at the 2001 Census, 402.51 million (39.26 percent) are workers and 622.74 million (61.74 percent) are non-workers. There ,has been an increase of 1'.8 percent points over number of total workers (756623) in 1991 Census (37.5).
Among States and Union Territories, Work Participation Rate varies between 25.33 in Lakshadweep to 52.70 in Mizoram. In fact, 18 States/Union Territories have recorded higher Work Participation Rate (WPR) than the National average. Uttaranchal with a WPR of 36.93-does not fall in this category and ranks 25th among States/Union Territories of the country. ~
The male WPR has gone up marginally from 51.6 in 1991 to 51.9 in 2001 Census. However, female WPR has shown significant increase of 3.40 percent points (from 22.3 in 1991 to 25.7 in 2001). Daman & Diu has recorded the highest male WPR (65.6) while Lakshadweep the lowest (42.5). UUaranchal (46.42), in this respect, ranks 34th. Regarding female WPR, Mizoram is at the top with 47.6 WPR among the list while Lakshadweep with 7.2 WPR is at the bottom. Uttaranchal with female WPR of 27.09, ranks 18th.
It is worthwhile to mention here the fact that Uttaranchal, in 1991 Census, had female WPR as 30.49, which-stands at 27.09 in 2001 Census. Evidently, it has shown decrease in the female WPR during '1991-2001.
Non-workers constituteoO.7 of the population of the country. While the proportion of male non-workers is 48.1, the corresponding figure for female-is 74.3. Proportion of non-workers is gradually decreasing since 1981 Census, i.e., from 63.3 in 1981 to 62.5 in 1991 -to 60.7 in 2001 Census. This shows the expansion and diversification of our economy employing more and more people. Thepercentage of non-workers in Rural and Urban areas of the country is 58.0 and 67.8 respectively.
The main and marginal workers constitute 30.5 and 8.7 of the population of the country respectively. The corresponding figures at the 1991 Census were 34.1 and 3.4 respectively. While there is a perceptible increase in the proportion of marginal workers, the share of ·main workers has declined in the country __during this decade. The decline in the propdrtion of male main workers is more striking as compared to female main workers. The proportion of male main workers in the country has fallen from 50.9 in 1991 to 45.3 at 2001 Census while !3mong the females; the decline is marginal (from 15.9 in 1991 to 14.7 in 2001).
Out of total workers in the country, 31.7 percent are Cultivators; 26.-7 Agricultural Labourers; 4.1 Household Industry workers and 37.5 Other Workers. In other words, 58.4 of the workers are engaged in Agriculture sector while 41.6 are in non-Agriculture sector of the national economy. In case of Uttaranchal, proportion of workers in these broad categories is 49.8, 8.3, 2.? and 39.7 respectively as against national average quoted above. If these figures are clubbed together for agriculture and non-agriculture sectors, the outcome is 58.0 and 42.0 respectively, which are almost identical with national figures. In the national perspective, Bihar-with 77.4 workers in agriculture sector is at the top of the list of States/Union Territories.
State Scenario
In so far as overall Work Participation Ra~e of UUaranchal is iconcerned, it has gone down from 39.93 in 1991 to 36.94 at the 2001 Census. When we considerlhe proportion of Main and Marginal WorkelS.§eparately, it is found that substantial decrease of 7.78 percent points is recorded in case of Main WorkE;lrs during 1'Ss1.-2001. It has come down from 37.17 percent in 1991 to 27.39 percent in 2001.
Contrary to this trend the Marginal Workers have (egistered an increase of 4.78 percent points, i.e., from 4.77 percent in 1991 to 9.55 percent at 2001 Census. /
13
1574 h'GI/?OO3-4
Analysis of Data at Dis.lrict Level
Analysis of district level data on working popuiation reveals that 8ageshwar district has the highesl percentage (47.67) of total workers while Hardwar with WPR of 29.51 stands at the lowest rung of the ladder. Other districts following in the close proximity of 8ageshwar are Almora (46.52). Uttarkashi (45.99) and Rudraprayag (44.41). On the other hand, Dehradun (31.20) and Udham Singh Nagar (31.88) are the two other districts of the state where WPR is below 35 percent.
District Uttarkashi with 38.92 percent main workers (who were engaged in any economically productive activity for more than 183 days in the preceding year) stands at the top of the ladder followed by 8ageshwar (34.44), Almora (32.67) and Rudraprayag (32.65). Percentage of main workers in otRer districts of the state is below 30. Among these districts, Udham Singh Nagar has the lowest WPR (24.20).
Chamoli district has recorded the highest percentage of marginal WOI: ... ,S (17.26) and is closely followed by Pithoragarh (16.16) and Champawat (15.14). Dehradun (4.91) and Hardwar (4.98) are the two districts, which have recorded percentage of marginal workers below 5. Other districts fall in the range 7-15.
Industrial Categories of Workers at District Level
Cultivators
Highest percentage (75.78) of cultivators has been returned from Rudraprayag dis.trict. Other districts, where cultivators account for more than 70 percent of total workers are UUarkashi (75.10), Almora (74.77) and 8ageshwar (74.67). Dehradun with 18.64 percent cultivators among total workers stands at the bottom in this category of workers closely preceded by Hardwar (22.63), Udham Singh Nagar (29.72) and Nainital (42.03). Incidentally, Dehradun, Hardwar and Udham Singh Nagar form plains area of the state.
Agricultural Labourers
Udham Singh Nagar (25.63) and Hardwar (19.06) have recorded highest percentage of Agricultural Labourers among all the districts of Uttaranchal. In other districts, percentage of Agricultural Labourers is below 10. Rudraprayag has registered merely 0.53 percent Agricultural Labourers among its working population.
Household Industry Workers
As against state average of 2.23 percent HHI workers, three districts, viz., Hardwar (3.98), Pithoragarh (3.86) and Udham Singh Nagar (3.30) have registered higher percentage of workers in Household Industries. Dehradun (2.22) has returned almost identical percentage of this category with state average. Other 9 districts 01 the state are down with less than 2 percent workers engaged in this category .•
Other Workers
Dehradun (72.13), the state capital tops in this category. The other district where other workers are more than 50 percent of the work force is Hardwar (54.33), closely followed by Nainital district (47.52). Newly created 8ageshwar district (20.38) stands at the lower rung of the ladder closely· preceded by Uttarkashi (21.57), Almora (22.67) and Rudraprayag (22.77).
Rural - UI~ban Scenario at District Level
RURAL AREAS
Total Workers
8ageshwar district with Work Participation Rate lWPR) of 48.19 tops the list of districts in terms of rural areas of the state. Other two districts in close proximity of this percentage are - Almora (47.87) and Uttarkashi (47.07). On the other hand, Hardwar (30.07) has the lowest WPR as against state average of 39.63.
Main Workers
In terms of main workers, UUarkashi (39.53) has the highest percentage in contrast to the lowest (23.91: recorded in Hardwar'district as compared to state average of 27.77 percent.
Marginal Workers
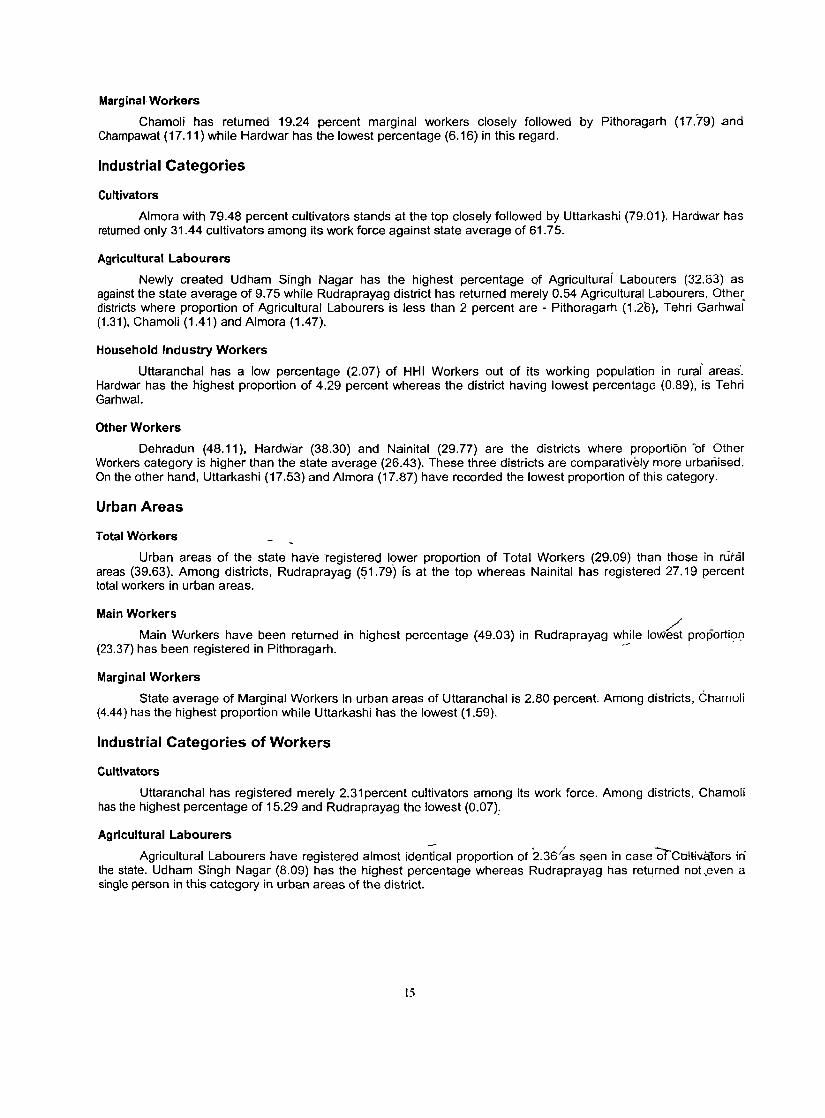
Chamoli has returned 19.24 percent marginal workers closely followed by Pithoragarh (17.79) .and Champawat (17.11) while Hardwar has the lowest percentage (6.16) in this regard.
Industrial Categories
Cultivators
Almora with 79.48 percent cultivators stands at the top closely followed by Uttarkashi (79.01). Hardwar has returned only 31.44 cultivators among its work force against state average of 61.75.
Agricultural Labourers
Newly created Udham Singh Nagar has the highest percentage of Agriculturai Labourers (32.83) as against the state average of 9.75 while Rudraprayag district has returned merely 0.54 Agricultural Labourers. Othe~ districts where proportion of Agricultural Labourers is less than 2 percent are - Pithoragarh (1.2t3). Tehri Garhwal (1.31), Chamoli (1.41) and Almora (1.47).
Household Industry Workers
Uttaranchal has a low percentage (2.07) of HHI Workers out of its working population in rurai areas'. Hardwar has the highest proportion of 4.29 percent whereas the district having lowest percentage (0,89), is Tehri Garhwal.
Other Workers
Dehradun (48.11), Hardwar (38.30) and Nainital (29.77) are the districts where proportion of Other Workers category is higher than the state average (26.43). These three districts are comparatively more urbanised. On the other hand, Uttarkashi (17.53) and Almora (17.87) have recorded the lowest proportion of this category.
Urban Areas
Total Workers
Urban areas of the state have registered lower proportion of Total Workers (29.09) than those in rtiral areas (39.63). Among districts, Rudraprayag (~1.79) IS at the top whereas Nainital has registered 27.19 percent total workers in urban areas.
Main Workers /'
Main Wurkers have been returned in highest percentage (49.03) in Rudraprayag while lowest proporti91} (23.37) has been registered in Pithoragarh. -
Marginal Workers
State average of Marginal Workers in urban areas of Uttaranchal is 2.80 percel'lt. Among districts. Chamoli (4.44) has the highest proportion while UUarkashi has the lowest (1.59).
Industrial Categories of Workers
Cultivators
UUaranchal has registered merely 2.31 percent cultivators among its work force. Among districts, Chamoli has the highest percentage of 15.29 and Rudraprayag the lowest (0.07):
Agricultural Labourers
Agricultural Labourers have registered almost identical proportion of 2.36'~s seen in case QrColtiva1ors in' the state. Udham Singh Nagar (8.09) has the highest percentage whereas Rudraprayag has returned noL"even a single person in this category in urban areas of the district.
15

tious8hoWfndustJyWol'kers
Pithoragarh has returned 6.69 percent HH~ Workers among its working population closely followed by _ 'Udham 'Singh 'Nagar (5.97) where as three districts, viz. Tehri Garhwal (0.46), Rudraprayag (0.64) and Uttarkasbi • (D.96)aave less than 1 percent HAl Workers in their urban segment.
QtherWoriters
Rudraprayag (99.29) and Tehri Garhwal (99.08) are the two districts where proportion of Other Workers in mban areas is very high. There are 6 other districts, viz_, Almora (97.64), Nainital (97.45), Dehradun (96.74), Garhwal (96.39), Bageshwar (94.16) and Hardwar (92.56), which have higher proportion of this category of workers than 'State average (92.45). Remaining 5 districts, though having lower percentage than state average (92:ff5), still nave returned proportion of this category above 80.
Wor.Ja:s.at Tabsil t.evel
There are only 2 tahsils viz.; Bhikiya Sa in (Almora district) (51.25 percent) and Kapkot (Bageshwar district) .(;50.78) ()tit of 'total 49, which have more than 50 percent workers among total population. 2 other tahsils, viz., Munsiar:i (Pithoragarh district) (49.65) and Puraula (Uttarkashi district) (49.17) follow the suit to some extent. There are 5 other tahsils, viz., Hardwar (28.21), Rishikesh (Dehradun district) (28.29), Kashipur (Udham Singh Nagar district) (28.44), Dehradun (29.28) and Roorkee (Hardwar district) (29.63) where share of workers is below 30 percent of total population. All these 5 tahsils fall in the plains area of the state. There are further 8 tahsils of plains area of.the state, which have recorded work participation rate below state average (36.94).
Main Workers Main workers constitute highest proportion of the working population in Rajgarhi Tahsil (43.98) of
lJttaA(ashi district .while Kapkot (41.27) of Bageshwar district follows closely. At the lowest rung of the ladder stands Dhoomakot tahsil (Garhwal district) with only 19.86 percent main workers among total workers of the tahsil. There are two othertahsils, viz., Kotdwara (Garhwal district) (20.72) and Gair Sain (Chamoli district) (20.88), which are in the oIose proximity of lowest percentage of main workers among all the tahsils of the state.
t«arginal Workers Marginal Workers have been returned in Gair Sain Tahsil (Chamoli district) with highest percentage (25.43)
among all the Tahsils of the State. Other Tahsils, which follow closely are Pokhari (Chamoli district) (22.97), Didihat (Pithoragarh district) (21.59), Pratapnagar (Tehri Garhwal district) (21.10) and Lansdowne (Garhwal district) (20.4'5). Dehradun Tahsil (Oehradun distHct) has recorded the lowest percentage (3.34) of Marginal Workers among -all the tahsils of the State and is closely preceded by Rajgarhi (Uttarkashi district) (3.46), Bhatwari (Uttatkashi district) (3.74), Hardwar (4.36) and Roorkee (Hardwar district) (4.91).
Industrial Categories of Workers at Tahsil Level ,/
Cultivators
Cultivators form 87.69 percent of total workers in Bhikiya Sain Tahsil (Almora district). Likewise, percentage of cultivators is more than 80 in Thali Sain (Garhwal district) (86.06), Rajgarhi (Uttarkashi district) (84.91), Dhari (Nainital district) (84.25), Gair Sain (Chamoli district) (83.65), Gangolihat (Pithori3garh district) (83.14), Ghansali (Tehri Garhwal district) (82.66), Dhoomakot (Garhwal district) (82.50), Kapkot (Bageshwar district) (82.48) and Puraula (Uttarkashi district) (80.11).
Jt is surprising to note -that Dehradun Tahsil of Dehradun district has returned only 3.78 percent cultivators among its workers. There are 3 other tahsils, which have percentage of cultivators below 20. These are - Hardwar (Hardwar district) (14.69), Rishikesh (Dehradun district) (17.23) and Kichha (Udham Singh Nagar district) (17.34).
Avdcultural1.abour.rs
Three Tahsils, viz., Kashipur (28.21), Kichha (27.48) and Sitarganj (26.55) of Udham Singh Nagar district falling in plains area of1he state, have more than 25 percent Agricultural Labourers in their working population.
'fhere are 16 tahsils in Uttaranchal Where share of Agricultural Labourers in the work force is less than 1 ·percent. There .ar~ lurther ., 4 tahsiis .. wbic'h ha'le less than 2 percent Agricultural Labourers. InCidentally, Ukhimath Tahsil (Rudra /prayag district) has recorded merely 0.28 percent Agricultural Labourers closely followed by Bhatwari (Uttarkashi district) (0.31) and. Ghansali (Tehri Garhwal district) (0.37).
16
Workers in Household Industry
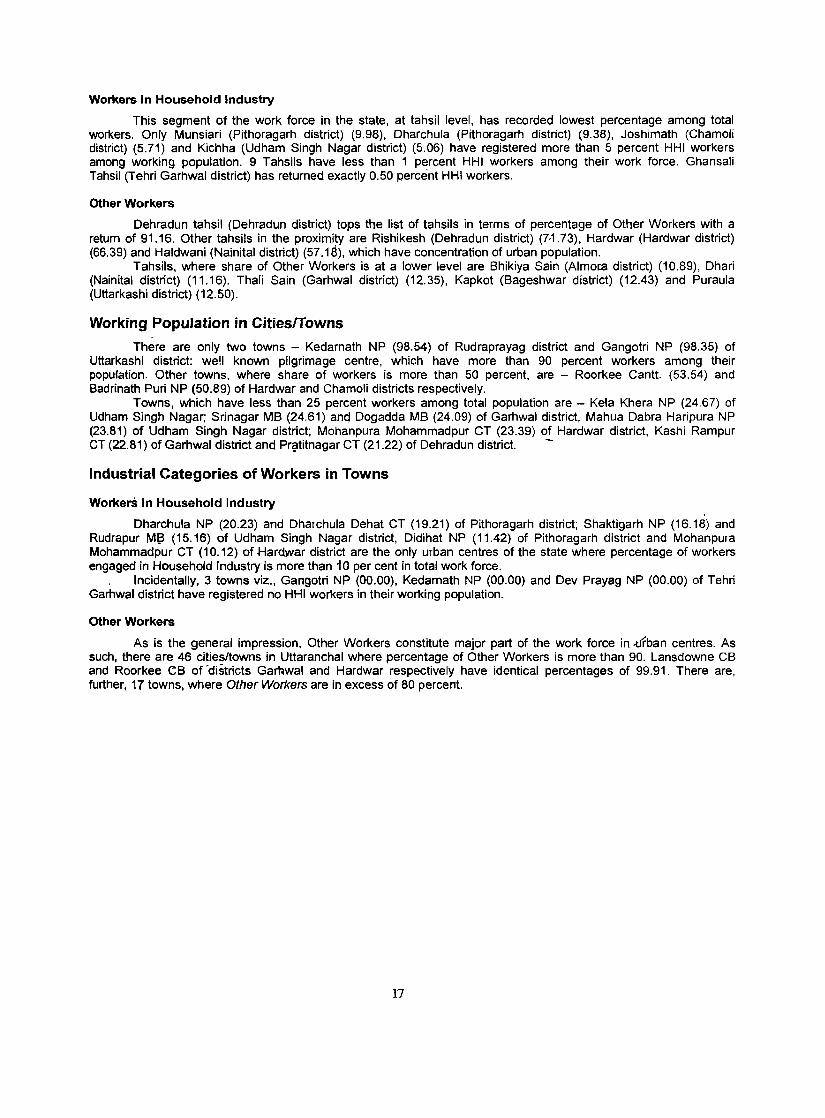
This segment of the work force in the state, at tahsil level, has recorded lowest percentage among total workers. Only Munsiari (Pithoragarh district) (9.9B), Oharchula (Pithoragarh district) (9.3B), Joshimath (Chamoli district) (S.71) and Kichha (Udham Singh Nagar district) (5.06) have registered more than 5 percent HHI workers among working population. 9 Tahsils have less than 1 percent HHI workers among their work force. Ghansali Tahsil (Tehri Garhwal district) has returned exactly 0.50 percent HHI workers.
Other Workers
Oehradun tahsil (Oehradun district) tops the list of tahsils in terms of percentage of Other Workers with a return of 91.16. Other tahsils in the proximity are Rishikesh (Oehradun district) (7,1.73), Hardwar (Hardwar district) (66.39) and Haldwani (Nainital district) (57.18), which have concentration of urban population.
Tahsils, where share of Other Workers is at a lower level are Bhikiya Sain (Almo[8 district) (10.89), Ohari (Nainital district) (11.16). ThaIi Sain (Garhwal district) (12.35), Kapkot (Bageshwar district) (12.43) and Puraula (Uttarkashi district) (12.50).
Working Population in Cities[fowns
There are only two towns - Kedarnath NP (98.54) of Rudraprayag district and Gangotri NP (98.35) of Uttarkashi district: we!1 known pilgrimage centre, which have more than 90 percent workers among their population. Other towns, where share of workers is more than 50 percent, are - Roorkee Cantt. (53.54) and Badrinath Puri NP (50.89) of Hardwar and Chamoli districts respectively.
Towns, which have less than 25 percent workers among total population are - Kela Khera NP (24.67) of Udham Singh Nagar; Srinagar MB (24.61) ancj Oogadda MB (24.09) of Garhwal district, Mahua Dabra Haripura NP (23.81) of Udham Singh Nagar district; Mohanpura Mohammadpur CT (23.39) of Hardwar district. Kashi Rampur CT (22.81) of Garhwal district and Pr~titnagar CT (21.22) of Oehradun district. -
Industrial Categories of Workers in Towns
WorkerS in Household Industry
Dharchula NP (20.23) and Dharchula Dehat CT (19.21) of Pithoragarh district; Shaktigarh NP (16.18) and Rudrapur M~ (1S.16) of Udham Singh Nagar district, Oidihat NP (11.42) of Pithoragarh district and Mohanpura Mohammadpur CT (10.12) of Hardwar district are the only urban centres of the state where percentage of workers engaged in Household Industry is more than 10 per cent in total work force.
Incidentally, 3 towns viz., Gangotri NP (00.00), Kedarnath NP (00.00) and Dev Prayag NP (00.00) of Tehri Garhwal district have registered no HHI workers in their working population.
Other Workers
As is the general impression, Other Workers constitute major part of the work force in-tl'fban centres. As such, there are 46 cities/towns in Uttaranchal where percentage of Other Workers is more than 90. Lansdowne CB and Rciorkee CB of 'districts Gar~wal and Hardwar respectively have identical percentages of 99.91. There are, further, 17 towns, where Other Workers are in excess of 80 percent.
17

PROVISIONAL POPULATION
STATEMENTS -& TABLES
19


Statement 1 Total population, total workers, main workers, marginal wor~ers and non-workers: India and State/Union T~rritory by residence
and sex: 2001
51. India/State/Union Territory Total/ Persons/ Total Workers NonWorkers No. Rurall Malesl Population Total Workers Main Workers Marginal
Urban Females Workers 1 2 3 4 5 6 7 8 9
INDIA Total Person~ 1,025,251,059 402,512,190 313,173,394 89,338,796 622,738,869
Males 530,422,415 275,463,736 240,520,672 34,943,064 254,958,679
Females 494,828,644 ~27,048,454 72,652,722 54~395,732 367,780,190
Rural Persons 740,255,371 310,655,339 229,672,348 80,982,991 429,600,032
Males 380,438,194 199,199,602 169,333,233 29,866,369 181 ,238,592
Females 359,817,177 111,455,737 60,339,115 51,116,622 248,361,440
Urban Persons 284,995,688 91,856,851 83,501,046 .8,355,805 193,138,837
Males 149,984,221 76,264,134 71,187,439 5,076,695 73,720,087
Females 135,011,467 15,592,717 12,313,607 3,279,110 119,418,750
1 Jammu & Kashmir Total Persons 10,069,917 3,688,875 2,536,509 1,152,366 6,381,042
Males 5,300,574 2,641,348 2,189,225 452,123 2,659,226
Females 4,769,343 1,047,527 347,284 700.243 3,721,816
Rural Persons 7,564,608 2,869,319 1,798;722 1,070,597 4,695,289
M13les 3,925,846 1,929,238 1,520,448 408,790 1,996,608
Females 3,638,762 940,081 278,274 661,807 2,698,681
Urban Persons 2,505,309 819,556 737,787 81,769 1,685,753
Males 1,374,728 712,110 668,777 43,333 662,618
Females 1,130,581 107,446 69,010 38,436 1,023;135
2 Himachal Prad_esh Total Persons 6,070,305 2,991,448 1,964,141 1,027,307 3,078,857
- Males 3,080,781 1,685,310 1,334,033 351,277 't,395,471
Females 2,969,524 1,306,138 630,108 676,030 1,683,366
Rural Persons 5,475,424 2,771,978 1,759,474 1,012,504 2,703,446
- Males 2,749,776 1,505,312 1,163,098 342,214 - 1 ;244,464
Females 2,725,648 1,266,666 596,376 670,290 1,458,982
Urban Persons 594,881 219,470 204,667 14$3 375,411
Males 331,005 179,998 170,935 - 9,063 151.007
Females 263,876 39,472 33,732 5,740 224,404
3 Punjab Total Persons 24,324,749 9,141,760 7,639,111 1,302,649 15,182',969
Males 12,963,996 7,023,757 6,487,568 536,169 5,960,239
Females 11,340,753 2,118,003 1,351,523 766,480 9,222,750
Rural Persons le,064,238 6,362,662 5,252,672 1,129,990 9,681,576 '
Males 8,508,757 4,633,197 4,199,057 434,140 3,875,560
Females 7,555,481 1,749,485 1,053,615 695,850 ,5,806,016
Urban Persons 8,260,511 2,759,098 2,586,439 172,659 5,501,413
Mal •• 4,475,239 2,390,560 2,268,531 102,029 2,084,679
Fomal .. 3,785,272 368;538 297,908 70,630 3,416,734
4 Chandlgarh • Total Per.ons 900,914 339,021 328,906 10,115 561,893
Males 508,224 285,136 /'278,377 8,25_9 223,088
Females 392,690 53,885 50,529 3,356 -- 33B,805
Rural Persons 92,11B 39,993 38,202 1,791 52,125
Males 56,837 36,352 "
?;i,109 1,243 20,485
Females 35,281 3,641 3,093 548 31,640
Urban Persons 808,796 299,028 290,704 8,324 509,768
Males 451,387 248,784 243,268 5,516 202,603
Females 357,409 50,244 47,436 2,808 307,165
21
1574 RGI/2003-5
Statement 1 Total population, total workers, main workers, marginal workers and non-workers: India and State/Union Territory by residence
and seX: 2001
SI. JndialState/Union Territory Total! Persons! Total Workers Non Workers No. Rural! Males! Population Total Workers Main Workers Marginal
Urban . Females - Worlters
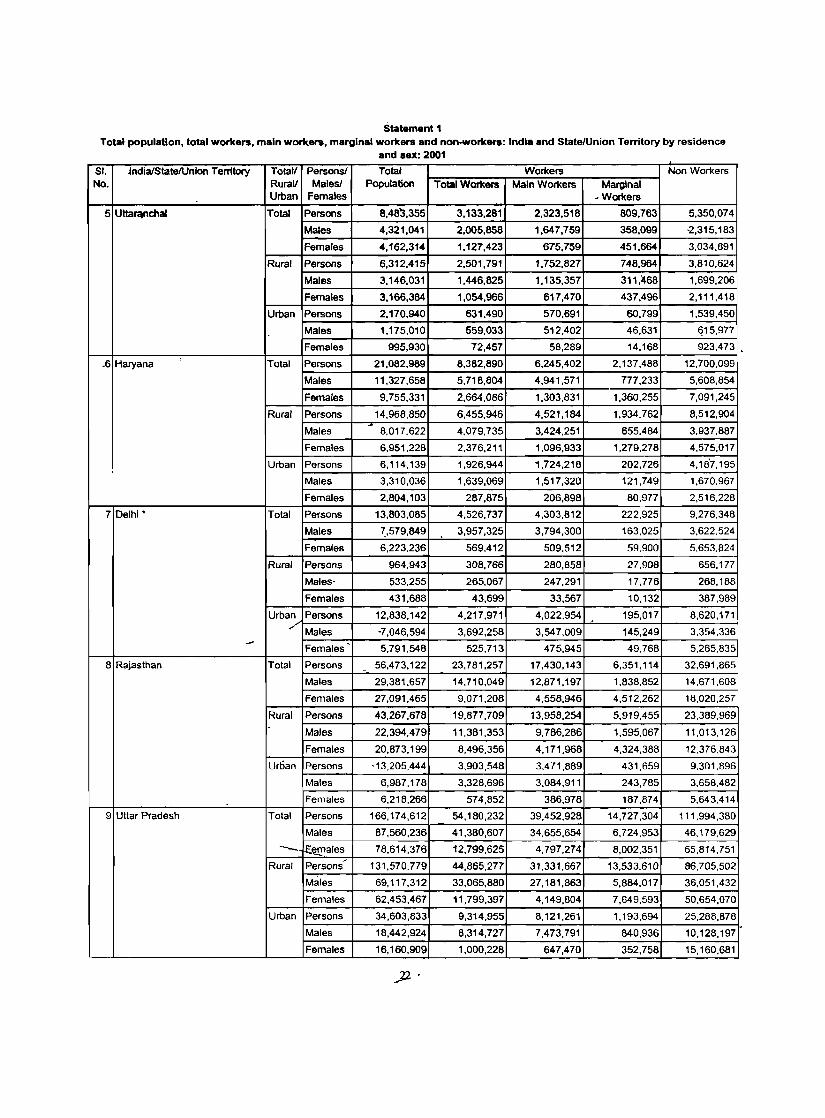
5 Uttal'ltnchal Total Persons 8,48'3.355 3,133,281 2,323,518 809,763 5,350,074
Males 4,321,041 2,005,858 1,647,759 358,099 '2,315,183
Females 4,162,314 1,127,423 675,759 451,664 3,034,891
Rural Persons 6,312,415 2,501,791 1,752,827 748,964 3,810,624
Males 3,146,031 1,446,825 1,135,357 311,~68 1,699,206
Females 3,166,384 1,054,966 617,470 437,496 2,111,418
Urban Persons 2,170,940 631,490 570,691 60,799 1,539,450
Males 1,175,010 559,033 512,402 46,631 ey15,977
Females 995,930 72,457 58,289 14,168 923,473 ,
..6 Haryana Total Persons 21,082,989 8,382,890 6,245,402 2,137,488 12,700,099
Males 11,327,658 5,718,804 4,941,571 777,233 5,608,854
Females 9,755,331 2,664,086 1,303,831 1,360,255 7,091,245
Rural Persons 14,968,850 6,455,946 4,521,184 1,934,762 8,512,904
Males 8,017,622 4,079,735 3,424,251 655,484 3,937,887
Females 6,951,228 2,376,211 1,096,933 1,279,278 4,575,017
Urban Persons 6,114,139 1,926,944 1,724,218 202,726 4,187,195
Males 3,310,036 1,639,069 1,517,320 121,749 1,670,967
Females 2,804,103 287,875 206,898 80,977 2,516,228
7 Delhi· Total Persons 13,803,085 4,526,737 4,303,812 222,925 9,276,348
Males 7,579,849 . 3,957,325 3,794,300 163,025 3,622,524
Females 6,223,236 569,412 509,512 59,900 5,653.tl24
Rural Persons 964,943 308,766 280,858 27,908 656,177
Males' 533,255 265,067 247,291 17,776 268,188
Females 431,688 43,699 33,567 10,132 387,989
Urban Persons 12,838,142 4,217,971 4,022,954 195,017 8,620,171 ,,-
Males -7,046,594 3,692,258 3,547,009 145,249 3,354,336 - Females .
5,791,548 525,713 475,945 49,768 5,265,835
8 Rajasthan Total Persons 56,473,122 - 23,781,257 17,430,143 6,351,114 32,691,865
Males 29,381,657 14,710,049 12,871,197 1,838,852 14,671,608
Females 27,091,465 9,071,208 4,558,946 4,512,262 18,020,257
Rural Persons 43,267,678 19,877,709 13,958,254 5,919,455 23,389,969 .
Males 22,394,479 11,381,353 9,786,286 1,595,067 11,013,126
Females 20,873,199 8,496,356 4,171,968 4,324,388 12,376.843
Urban Persons '13,205,444 3,903,548 3.471,889 431,659 9.301,896
Males 6,987,178 3,328,696 3,084,911 243,785 3.658,482
Females 6,218,266 574,852 386,978 187,874 5,643,414
9 Uttar Pradesh Total Persons 166,174,612 54,180,232 39,452,928 14,727,304 111,994,380
Males 87,560,236 41,380,607 34,655,654 6,724,953 46,179,629
--- ~ales 78,614,376 12,799,625 4,797,274 8,002,351 65,814,751 ,
Rural Persons 131,570,779 44,865,277 31,331,667 13,533,610 86.705,502
Males 69,117,312 33,065,880 27,181,863 5,884,017 36,051,432
Females 62,453,467 11,799,397 4,149,804 7,649,593 50,654,070
Urban Persons 34,603,833 9,314,955 8,121,261 1,193,694 25,288,878 . Males 18,442,924 8,314,727 7,473,791 840,936 10,128,197
Females 16,160,909 1,000,228 647,470 352,758 15,160,681
Statement 1 Total population, total workers, main workers, marginal workers and non-workers: India and State/Union Territory by residence
and sex: 2001
51. India/State!Union Territory Total! Persons! Total Workers Non Workers No. Rural! Males! Population Total Workers Main Workers Marginal
Urban Females Workers
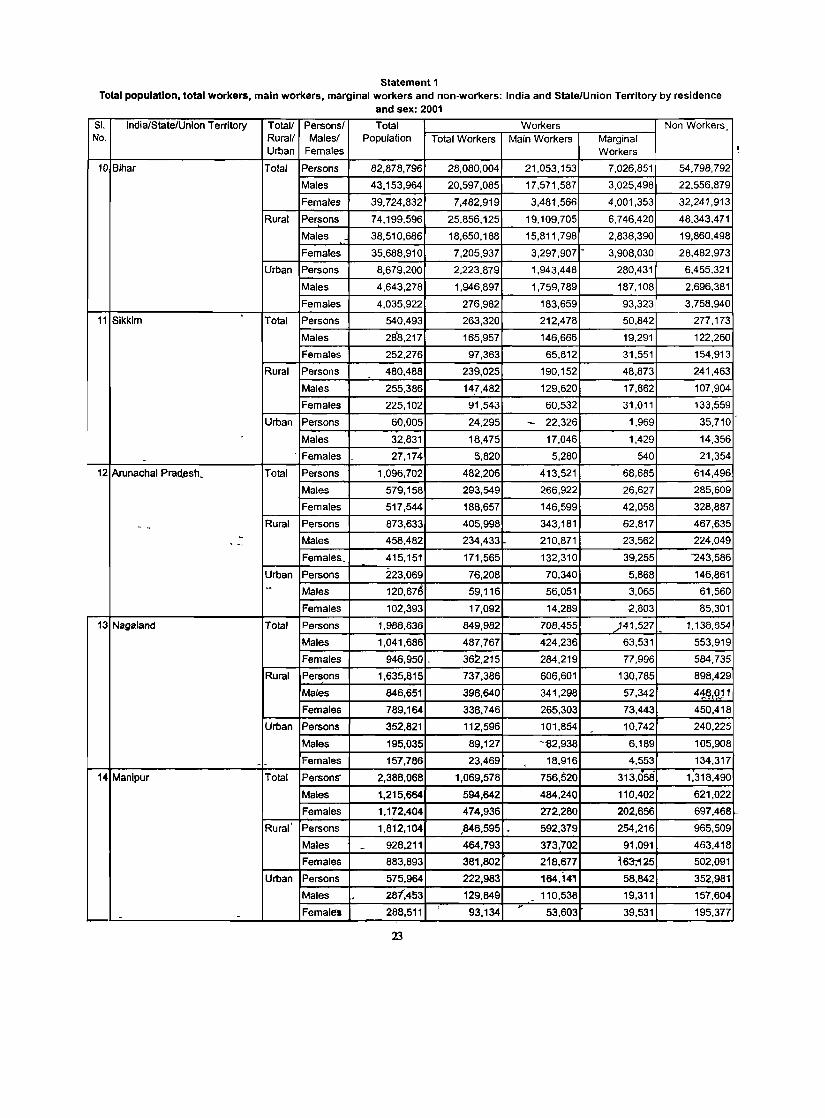
10 Bihar Total Persons 82,878,796 28,080,004 21,053,153 7,026,851 54,798,792
Males 43,153,964 20,597,085 17,571,587 3,025,498 22,556,879
Females 39,724,832 7,482,919 3,481,566 4,001,353 32,241,913
Rural Persons 74,199,596 25,856,125 19,109,705 6,746,420 48,343.471
Males 38,510,686 18,650,188 15,811,798 2,838,390 19,860,498
Females 35,688,910 7,205,937 3,297,907 3,908,030 28,482,973
Urban Persons 8,679,200 2,223,879 1,943,448 280,431 6,455,321
Males 4,643,278 1,946,897 1,759,789 187,108 2,696,381
Females 4,035,922 276,982 183,659 93,323 3,758,940
11 Sikkim Total Persons 540,493 263,320 212,478 50,842 277,173
Males 288,217 165,957 146,666 19,291 122,260
Females 252,276 97,363 65,812 31,551 154,913
Rural Persons 480,488 239,025 190,152 48,873 241,463
Males 255,386 14.1,482 129,620 17,862 107,904
Females 225,102 91,543 60,532 31,011 133,559
Urban Persons 60,005 24,295 - 22,326 1,969 35,710
Males 32,831 18,475 17,046 1,429 14,356
. Females - 27,174 5,820 5,280 540 21,354
12 Arunachal Prac1.esh_ Total Persons 1,096,702 482,206 413,521 68,685 614,496
Males 579,158 293,549 266,922 26,627 285,609
Females 517,544 188,657 146,599 42,058 328,887
- - Rural Persons 873,633 405,998 343,181 62,817 467,635
- Males 458,482 234,433 _ 210,871 23,562 224,049 -~
Females.. 415,151 171,565 132,310 39,255 '"243,586
Urban Persons 223,069 76,208 70,340 5,868 146,861
- Males 120,67G 59,116 56,051 3,065 61,560
Females 102,393 17,092 14,289 2,803 85,301
13 Nagaland Total Persons 1,988,636 849,982 708,455 )41,527 1,138,654
Males 1,041,686 487,767 424,236 63,531 553,919
Females 946,950 _ 3~,215 284,219 77,996 584,735
Rural Persons 1,635,815 737,386 606,601 130,785 898,429
Males 846,651 398,640 341,298 57,342 41~ Ojl
Females 789,164 338,746 265,303 73,443 450,418
Urban Persons 352,821 112,596 101,854 10,742 240,225
Males 195.035 89,127 -a2,938 6,189 105,908
-- Females 157,786 23,469 18,916 4,553 134,317
14 Manipur Total PersonS' 2,388,068 1,069,578 756,520 313,058 1,318,490
Males 1,215,664 594,642 484,240 110,402 621,022
Females 1,172,404 474,936 272,280 202,656 697,468
Rural' Persons 1,812,104 ,846,595 ~ 592,379 254,216 965,509
Males - 928,211 464,793 373,'702 91,091 463,418
Females 883,893 381,802 218,677 i63;125 502,091
Urban Persons 575,964 222,983 164,1~ 58,842 352,981
Males - 281,453 129,849 - 110,538 19,311 157,604
Females 288,511 93,134 ~.
53,603 39,531 195,377 - -23
•

Statement 1 Total population, total workers, main workers, marginal workers and non-workers: India and State/Union Territory by residence
and sex: 2001
SI. India/State!Union Territory Totall Persons! Total Workers Non Workers No. Rural! Males! Population Total Workers Main Workers Marginal
Urban Females Workers
15 Mizoram Total Persons 891.058 469,597 363,858 105,739 421,461
-- Males 459,783 264,162 226,637 37,525 195,621
Females 431,275 205,435 137,221 68,214 225,840
Rural Persons 450,018 257,488 202,257 55,231 192,530
Males 233,718 139,111 120,915 18,196 94,607
Females 216,300 118,377 81,342 37,035 97,923
Urban Persons 441,040 212,109 161,601 50,508 228,931
Males 226,065 125,051 105,722 19,329 101,014
Females 214,975 87,058 55,879 31,179 127,917
16 Tripura Total Persons 3,191,168 1,158,190 906,487 251,703 2,032,978
Males 1,636,138 831,318 740,153 91,165 804,820
Females 1,555,030 326,872 166,334 160,538 1,228,158
Rural Persons 2,648,074 982,035 743,447 239,188 1,665,439
Males' 1,359,288 687,956 604,711 83,245 671,332
Females 1,288,786 294,679 138,736 155,943 994,107
Urban Persons 543,094 175,555 163,040 12,515 367,539
Males 276,850 143,362 135,442 7,920 133,488
Females 266,244 32,193 27,598 4,595 234,051
17 Meghalaya Total Persons 2,306,069 956,425 742,762 213,663 1,349,644
Males 1,167,840 557,807 471,830 85,977 610,033
Females 1,138,229 398,618 270,932 127,686 739,611
Rural Persons 1,853,457 826,334 629,401 _196,933 1,027,123
Males 939,803 470,712 392,511 78,201 469,091
Females - 913,654 355,622 236,890 118,732 558,032
Urban Persons 452,612 130,091 113,361 16,730 322,521
Males 228,037 87,095 79,319 7,776 140,942
Females 224,575 42,996 34,042 8,954 181,579
18 Assam Total Persons 26,638,407 9,557,064 7,083,046 2,474,018 17,081,343
__ IMales - 13,787,799 6,884,451 5,839,050 1,045,401 6,903,348
- Females 12,850,608 2,672,613 1,243,996 1,428,617 10,177,995
Rural Persons 23,248,994 8,473,127 6,078,938 2,394,189 14,775,867
Males 11,983,157 5,963,601 4,968,101 995,500 6,019,556
Females 11,265,837 2,509,526 1,110,837 1,398,689 8,756,311
Urban Persons 3,389,413 1,083,937 1,004,108 79,829 2,305,476
Males 1,804,642 920,850 870,949 49,901 883,792
Females 1,584,771 163,087 133,159 29,928 1,421,684
19 West Bengal Total Persons_ 80,221,171 29,503,278 23,063,800 6,439,478 50,717,893
Males 41,487,694 22,500,480 19,632,549 2,867,931 18,987,214
Females 38,733,477 7,002,798 3,431,251 3,571,547 31,730,679
Rural Persons 57,734,690 21,897,521 16,115,110 5,782,411 35,837,169
, Males 29,606,028 16,075,548 13,619,407 2,456,141 13,530,480
- F~males 28,128,662 5,821,973 2,495,703 3,326,270 22,306,689
Urban Persons 22,486,481 7,605,757 6,948,690 657,067 14,880,724
Males 11,881,666 6,424J}32 6,013,142 411,790 5,456,734
Females 10,604,815 1,180,825 935,548 245,277 9,423,990
24
Statement 1 Total population, total workers, main workers, marginal workers and non-workers: India and State/Union Territory by residence
and sex: 2001
SI. India/State/Union Territory Totall Personsl Total Workers Non Workers No. Rurall Malesl Population Total Workers Main Workers Marginal
Urban Females Workers
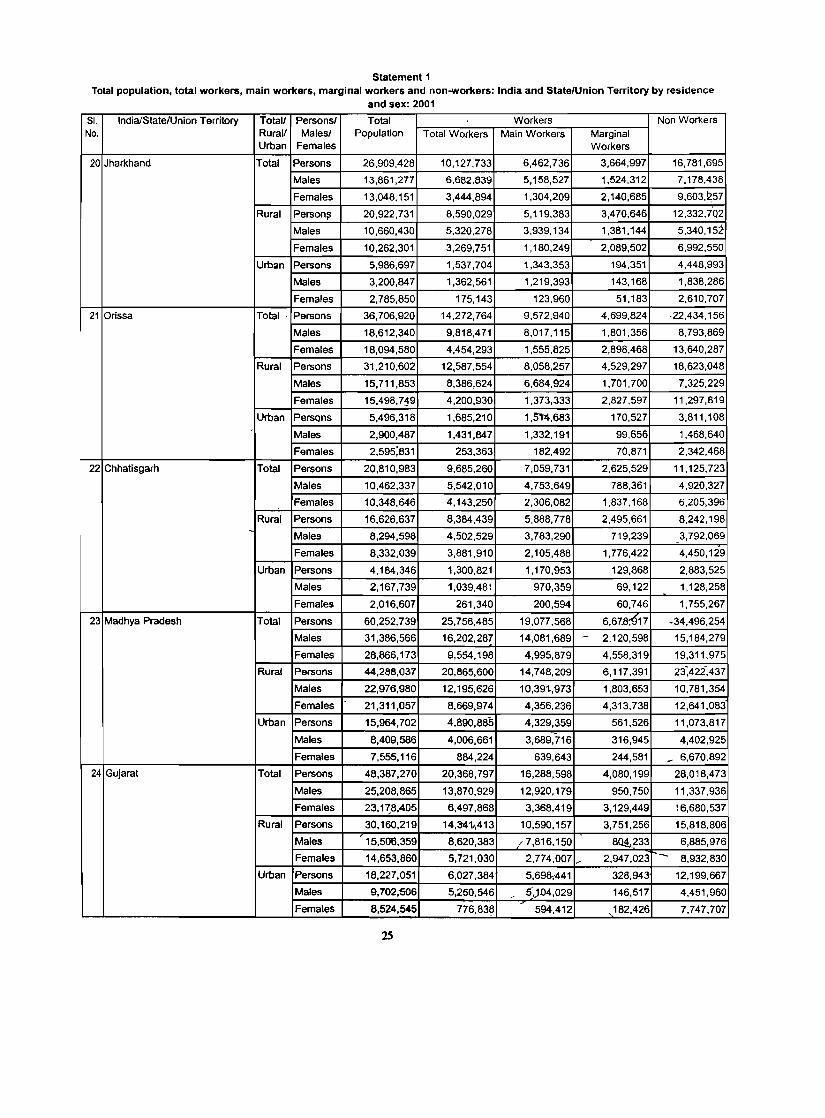
20 Jharkhand Total Persons 26,909,428 10,127,733 6,462,736 3,664,997 16,781,695
Males 13,861,277 6,682,839 5,158,527 1,524,312 7,178.438
Females 13,048.151 3,444.894 1.304,209 2.140,685 9.603.~57
Rural Person;; 20,922,731 8.590.029 5,119.383 3,470,646 12,332.702
Males 10.660,430 5,320,278 3.939.134 1.381,144 5.340.152 -
Females 10.262,301 3.269.751 1.180.249 2.089,502 6,992.550
Urban Persons 5.986.697 1,537,704 1,343,353 194,351 4,448,993
Males 3,200,847 1,362.561 1,219,393 143,168 1,838.286
Females 2,785,850 175,143 123,960 51.183 2,610.707
21 Orissa Total· Persons 36,706.920 14,272,764 9.572,940 4,699,824 ·22,434.156
Males 18.612,340 9,818,471 8,017,115 1.801,356 8.793.869
Females 18,094,580 4,454,293 1,555,825 2,898,468 13.640,287
Rural Persons 31,210,602 12,587,554 8.058,257 4.529,297 18,623.048
Males 15.711,853 8,386,624 6,684.924 1,701,700 7,325.229
Females 15,498,759 4,200,930 1.373,333 2.827.597 11,297,819
Urban Persons 5,496,318 1,685,210 1,5'1'4,683 170,527 3,811,108
Males 2,900,487 1,431,847 1.332,191 99.656 1,468,640
Females 2,595;831 253,363 182,492 70,871 2.342,468
22 Chhatisgarh Total Persons 20,810,983 9,685,260 7,059.731 2,625.529 11.125,723
Males 10,462,337 5,542,010 4,753,649 788.361 4.920.327
Females 10,348,646 4,143,250 2,306,082 1,837,168 6,205,396
Rural Persons 16,626,637 8,384,439 5,888,778 2,495.661 8,242,198
Males 8.294,598 4,502.529 3,783,290 719.239 3,792.069 -
Females 8.332.039 3,881,910 2,105,488 1,776,422 4,450,129
Urban Persons 4,184,346 1.300,821 1.170,953 129,868 2.883,525
Males 2,167,739 1.039,481 970.359 69.122 1,128,258
Females 2,016,607 261.340 200,594 60,746 1.755.267
23 Madhya Pradesh Total Persons 60,252.739 25,756.485 19.077.568 6.67.8:917 -34,496.254
Males 31,386,566 16,202,287 14,081,689 - 2,120,598 15.184.279
Females 28,866,173 9,554.198 4,995,879 4,558,319 19,311,975
Rural Persons 44,288,037 20,865,600 14.748.209 6,117,391 23~422,437
Males 22.976,980 12.195,626 10,391-,973 1.803.653 10.781.354
Females <
21,311,057 8,669,974 4.356,236 4,313,738 12,641,083
Urban Persons 15.964.702 4,890,885 4,329.359 561,526 11,073,817
Males 8,409,586 4,006,661 3,689,716 316.945 4,402,925
Females 7,555.116 884.224 639,643 244,581 _ 6,670,892
24 Gujarat Total Persons 48,387,270 20,368,797 16,288,598 4,080,199 28,018,473
Males 25,208,865 13,870.929 12,920,179 950.750 11.337,936
Females 23.1~8.405 6,497,868 3,368,419 3,129,449 16,680,537
Rural Persons 30.160,219 14,341t,413 10,590,157 3,751.256 15,818.806 ,
Males 15.500,359 8,620,383 ? 7,816,150 sot~33 6,885,976
Females 14,653,860 5.721,030 2,774,007 ___ 2,947.023 - 8,932,830
Urban Persons 18,227.051 6,027.384 5,6980441 328.943 12,199.667
Males 9.702.506 5.250.546 .- 5,;04.029 146,517 4,451,960
Females 8.524.P45 776,838 594,412 ,182,426 7.747,707
25

Statement 1 TO.tal population, total workers, main workers, marginal workers and non-workers: India and State/Union Terrifory by residencl\
and sex: 2001
SI. India/State/Union Territory Total! Persons/ Total Workers Non Workers No; Rural! Males/ Population Total Workers Main Workers Marginal
Urban Females Workers . 25 Daman & Diu' Total Persons 158,059 72,654 67,603 5,051 85,405
Males 92,478 60,627 59,034 1,593 31,851
Females 65,581 12,027 8,569 3,458 53,554
Rural Persons 100,740 52,413 48,521 3,892 48,327
Males 63,576 45,069 43,857 1,212 18,507
Females 37,164 7,344 4,664 2,680 29,820
Urban Persons 57,319 20,241 19,082 1,159 37,078
Males 28,902 15,558 15,177 381 13,344
Females 28,417 4,683 3,905 778 23,734
26 Dadra & Nagar Haveli * Total Persons 220,451 114,121 96,333 17,788 106,330
Males 121,731 75,939 71,355 4,584 45,792
Females 98,720 38,182 24,978 13,204 60,538
Rural Persons 169,995 91,545 75,136 16,409 78,450
Males 91,887 56,320 52,161 4,159 35,567
Females 78,108 35,225 22,975 12,250 42,883
Urban Persons 50,456 22,576 21,197 1,379 27,880
Males 29,844 19,619 19,194 425 10,225
Females 20,612 2,957 2;003 954 17,655
27 Maharashtra Total Persons 96,752,247 42,053,330 35,670,836 6,382,494 54,698,917
Males 50,334,270 26,924,764 24,485,209 2,439,555 23,409,506 "
Females 46,417,977 15,128,566 11,185,627 3,942,939 31,289,411
Rural Persons 55,732,513 28,1b6,602 22,752,088 5,354,514 27,625,911
Males~ 28,443,238 15,410,854 13,589,736 1,621,118 13,032,384
Females 27,289,275 12,695,748 9,162,352 3,533,396 14,593,527
Urban Persons 41,019,734 13,946,728 12,918,748 1,027,980 27,073,006
Males 21,891,032 11,513,910 10,895,473 618,437 10,377,122
/ Females 19,128,702 2,432,818 2,023,275 409,543 16,695,884
28 Andhra Pradesh Total Persons 76,111,243 34,865,117 29,001,326 5,863,791 41,246,126 - Males 38,490,506 21,725,810 19,517,524 2,208,286 16,764,696
Femal~s 37,620,737 13,139,307 9,483,802 3,655,505 24,481,430
Rural Persons 55,296,875 28,159,160 22,943,260 5,215,900 27,137,715
Males 27,890,340 16,309,047 14,484,219 1,824,828 11,581,293
Females 27,406,535 11,850,113 8,459,041 3,391,072 15,556,422
Ur:.ban Persons 20,814,368 6,705,957 6,058,066 647,891 14,108,411
Males 10,600,166 5,416,763 5,033,305 383,458 5,183,403
Females 10,214,202 1,289,194 1,024,761 264,433 8,925,008
29 Kamataka Total Persons 52,733,958 23,521,533 19,357,600 4,163,933 29,212,425
Males 26,856,343 15,272,725 13,944,187 1,3~8,538 11,583,618
Females 25,877,615 8,248,808 5,413,413 2,835,395 17,628,807
Rural Persons 34,814,100 17,129,318 13,458,918 3,670,400 17,684,782
- Males 17,618,593 10,274,566 9,218,896 1,055,670 7,344,027
l'emales 17,195,507 6,854,752 4,240,022 2,614,730 10,340,755
Urban Persons 17,919,858 6,392,215 5,898,682 493,533 11,527,643
t-o Males 9,237,750 4,998,159 4,725,291 272,868 4,239,591
. Females 8,682,108 1,394,056 1,173,391 220,665 7,288,052
26
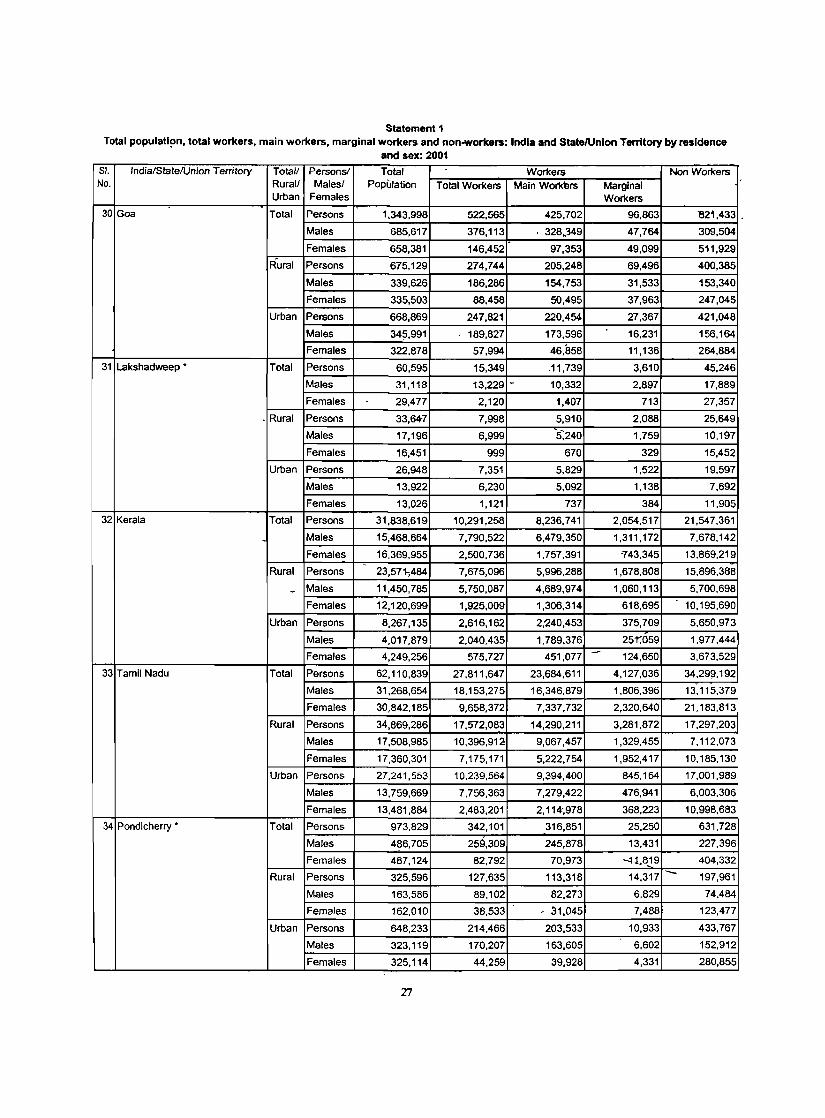
Statement 1 Total populati!,n, total workers, main workers, marginal workers and non-workers: India and StatefUnlon Territory by residence
and sex: 2001
SI. India/StatelUnion Territory Total! Personsl Total Workers Non Workers No. Rural! Males! Population Total Workers Main Workllrs Marginal
Urban Females Workers
30 Goa Total PerSons 1,343,998 522,565 425,702 96,863 '821,433 .
Males 685,617 376,113 . 328~'349 47,764 309,504
Females 658,381 146,452 97,353 49,099 511,929 R-ural Persons 675,129 274,744 205,248 69,496 400,385
Males 339,626 186,286 154,753 31,533 153,340
Females 335,503 88,458 50,495 37,963 247,045
Urban Persons 668,869 247,821 220,454 27,367 421,048
Males 34?,991 189,827 173,596 16,231 156,164
Females 322,878 57,994 46,858 11,136 264,884
31 Lakshadweep • Total Persons 60,595 15,349 .11,739 3,610 45,246
Males 31,118 13,229 ~ 10,332 2,897 17,889
Females 29,477 2,120 1,407 713 27,357
. Rural Persons 33,647 7,998 5,910 2,088 25,649
Males 17,196 6,999 5~240 1,759 10,197
Females 16,451 999 670 329 15,452
Urban Persons 26,948 7,351 5,829 1,522 19,597
Males 13,922 6,230 5,092 1,138 7,692
Females 13,026 1,121 737 384 11,905
32 Kerala Total Persons 31,838,619 10,291,258 8,236,741 2,054,517 21,547,361
Males 15,468,664 7,790,522 6,479,350 1,311,172 7,678,142
Females 16.369,955 2,500,736 1,757,391 -743.345 13.869.219 -
Rural Persons 23.571;484 7,675,096 5,996,288 1,678,808 15,896,388
- Males 11,450,785 5,750,087 4,689,974 1,060.113 5.700,698
Females 12.120,699 1,925.009 1,306,314 618,695 10.195,690
Urban Persons 8,267,135 2,616,162 2,'.!40,453 375,709 5,650,973
Males 4.017.879 2.040,435 1,789,376 251';059 1.977,444
Females 4,249,256 575,727 451,077 .- 124.650 3.673,529
33 Tamil Nadu Total Persons 62,110,839 27,811,647 23,684,611 4,127.036 34.299,192 - -
Males 31,268,654 18,153,275 16,346,879 1,806,396 13.115.379
Females 30,842,185 9,658,372 7,337,732 2,320,640 21,183,813
Rural Persons 34,869,286 17,572,083 14,290,211 3,281.872 17,297,203
Males 17,508,985 10,396,912 9,067,457 1,329,455 7,112,073
Females 17,360,301 7,175,171 5,222,754 1,952,417 10.185,130
Urban Persons 27,241,553 10,239,564 9,394,400 845,164 17,001,989 -
Males 13,759,669 7,756,363 7,279,422 476,941 6,003,306
Females 13,481,884 2,483,201 2,114-,978 368.223 10,998,683
34 Pondicherry • Total Persons 973,829 342,101 316,851 25,250 631,728
Males 486,705 259,309 245,878 13,431 227.396
Females 487,124 82,792 70,973 ~j.819 404,332
Rural Persons 325,596 127,635 113,318 14,317 - 197,961
Males 163,586 89,102 82,273 6,829 74.484
Females 162,010 38,533 ' 31,045 7,488 123,477
Urban Persons 648,233 214,466 203,533 10,933 433,767
Males 323,119 170,207 163,605 6,602 152,912
Females 325,114 44,259 39,928 4,331 280,855
27
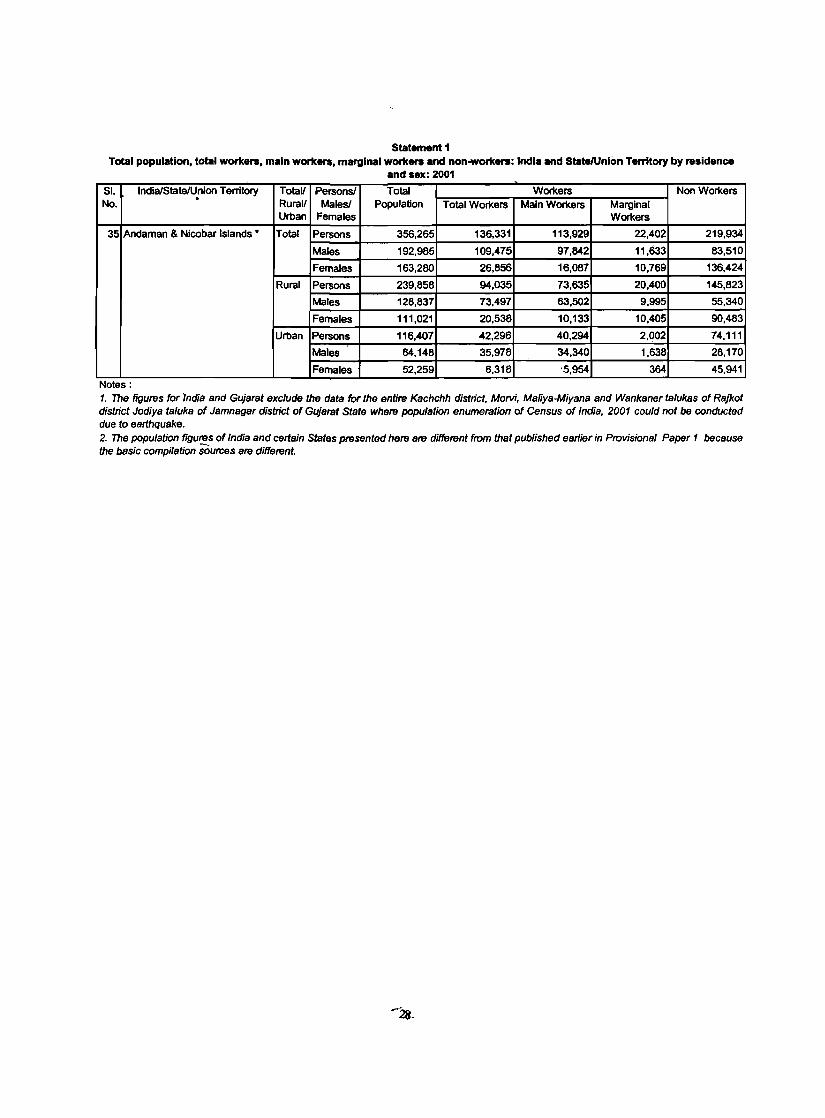
Statement 1 Total population, total workers, main workers, marginal workers and non-workers: India and StateiUnlon Territory by residence
and sex: 2001
51. Indial5tatelUnion Territory Totail Persons! Total Workers Non Workers No.
0
Rurall Males! Population Total Workers Main Workers Marginal Urban Females Workers
35 Andaman & Nicobar Islands • Total Persons 356,265 136,331 113,929 22,402 219,934
Males 192,985 109,475 97,842 11,633 83,510
Females 163,280 26,856 16,087 10,769 136,424
Rural Persons 239,858 94,035 73,635 20,400 145,823
Males 128,837 73,497 63,502 9,995 55,340
Females 111,021 20,538 10,133 10,405 90,483
Urban Persons 116,407 42,296 40,294 2,002 74,111
Males 64,148 35,978 34,340 1,638 28,170
Females 52,259 6,318 '5,954 364 45,941 Notes: 1. The figures for India and Gujarat exclude the data for the entire Kachchh district, Morvi, Maliya-Miyana and Wankaner talukas of Rajkot district Jodiya taluka of Jamnagar district of Gujarat State where population enumeration of Census of India, 2001 could not be conducted due to earthquake. 2. The population figures of India and certain States presented here are different from that published earlier in Provisional Paper 1 because the basic compilation sources are different.

Statement 2 Total workers and their categorie$' India and State/Union Territory by residence and sex' 2001
SI. India/State/Union Territory Total! PersonsJ Total Population Category of Workers
No. Rural! Males' Cultivators Agricultural _..-.
Workers in (j:r,Gr Workers
Urban' Females Labourers Household Industry
1 2 . 3 4 5 6 7 S 9 I
INDIA Total Persons 402,512,190 127,628,287 107,447,725 16,395,870 1 ~ I ~,.10 ""le
Males 275,463,736 86,328,447 57,354,281 8,312,191 I 23,46SJ317 -Females 127,048,454 41,299,840 50,093,444 8,083,679 27,571\491
Rural Persons 310,655,339 124,682,055 103,122,139 11,70&,533 7'1,141,5'62
Mares 199,199,602 ~046,644 54,749,291 5,642,112 54,761',,555
Females 111,455,737 40,635.411 48,372,898 6,067 ALI 16,380,007
Urban Persons 91,856,851 2,946,232 4,325,536 4,686,?.l' 79,898,746
Males 76,264,134 2,281,803 2,604,990 2,670,019 68,707,262
Females 15,592,717 664,429 1,720,546 2,016,258 11,19'1,484
1 Jammu & Kashmir Total Persons 3,688,875 1,599,656 248,577 '229,610 1,611,032
Males 2,641,348 1,023,149 194,887 118,995 1,304,317
females 1,Q47,527 576,507 53,690 110,615 306,715
Rural Persons 2,869,319 1,56'1,798 229,740 174,675 903,106
Males 1,929,238 994,104 178,980 86,454 669,700
Females 9~,<l81 56i,694 50,760 88,221 233,406
h .. Urban Persons 819,556 37,858 18,837 54;935 707,926
Males 712,110 29,045 15,907 32,541 634,617
Females 107,446 8,8"!} 2,930 22,394 73,309
2 Himachal Pradesh Total Persons 2,991.4~ 1,960,840 92,761 50.380 887,467
Males 1,685,310 e35,574 55,116 32,342 762,278
Females 1,306,138 ' 1,125,26? 37,6~5 18,038 125,189
Rural Persons 2,771,978 1,952,202 91.333. - - 47,213 681;17Q
Maies 1,505,312 831,519, 54.045 30,069 589.679
Females 1,266,666 1,120,683 37,288 17,204 91,491
Urban Persons 219,470 8,6~8 1,428 3;107 206;297
Males 179,998 4.055 1,071 2,273 172,599
Females 39,472 4,583 357 ,..._S34 33,698
3 Punjab Total Persons 9,141,760 2,099,330 1,498,976 306,980 5,236,474
Males 7,Q23,757 1,823,594 1,119,558 158,349 3,922~256
Females 2,11(l,003 275,736 379.418 148,631 ..1,314,218
Rural Persons 6,382,662 2,011,368 1,404,035 199.909 2,7B7,350
Males 4,633,197 1,742,355 1,040,346 82,775 1,767,721
Females 1,749,465 269,013 363,689 117,134 999,629
Urban Persons 2,759,098 87,962 94,941 107,071 2,469,124 '
Males 2,390,560 61,23-9 79,212 75,574 2,154,535
Females - 368,538 6,723 ~ 15,729 31,497 314,589
4 Chandigarh .. Total Persons 339,021 1,585 387 3,538 333,511
Males 285,136 1,472 333 2,248 281,083
Females 53,8ll5 113 54 1,290 52.428
Rural Persons 39,993 969 258 704 38,062
Males 36,352 905 237 434 34,776
Females 3,641 64 21 270 3,286
Urban Persons 299,028 616 129 2,834 295,449
Males 248,784 567 96 1,814 246,307
Females 50,244 49 33 1,020 49,142
29
1574 RGIJ2003-6

Statement 2 Total workers and their categories' India and State/Union Territory by residence and sex' 2001
SI. India!State!Union Territory Total! Persons! Total Population Category of Workers No. Rural! Males! Cultivators Agricultural Workers in Other Workers
Urban Females Labourers Household Industry
5 Uttaranchal Total Persons 3,133,281 1,559,415 258,752 69,996 1,245,118
Males 2,005,858 685,921 190,836 42,964 1,086,137
Females 1,127,423 873,494 67,916 27,032 158,981
Rural Persons 2,501,791 1,544,824 243,877 51,808 661,282
Males 1,446,825 676,240 178,618 30,016 561,9!i1
Females 1,054,966 868,584 65,259 21,792 99,331
Urban Persons 631,490 14,591 14,875 18,188 583,836
Males 559,033 9,681 12,218 12,948 524,186
Females 72,457 4,910 2,657 5,240 59,650
6 Haryana Total Persons 8,382,890 3,046,091 1,276,143 207,135 3,853,521
Males 5,718,804 1,873,479 712,404 125,524 3,007,397
Females 2,664,086 1,172,612 563,739 81,611 846,124
Rural Persons 6,455,946 2,975,648 1,222,279 134,639 2,123,380
Males 4,079,735 1,820,096 • 679,191 74,640 1,505,808
Females 2,376,211 1,155,552 543,088 59.999 617,572
Urban Persons 1,926,944 70,443 53,864 72,496 1,730,141
Males 1,639,069 53,383 33,213 50,884 1,501,589
Females 287,875 17,060 20,651 21,612 228,552
7 Delhi· Total Persons 4,526,737 36,588 13,559 133,720 4,342,870
Males 3,957,325 26.584 9,613 107,401 3,813,727
Females 569,412 10,004 3,946 26,319 529,143
Rural Persons 308,766 25,969 8,510 6,989 261,298
Males 265,067 18,317 6,027 4,936 235,787
Females 43,699 7,652 2,483 2,053 31,511
Urban Persons 4,217,971 10,619 5,049 126,731 4,075,572
Males 3,692,258 8,267 3,586 102,465 3,577,940 ,,/
Femares 525,713 2,352 1,463 24,266 497,632
8 Rajasthan .-
Total Persons 23,781.257 13,166,777 2,529,225 651,421 7,433,834
Males 14,710,049 7,086,876 1,038,287 401,191 6,183,695 -Females 9,071,208 6,079,901 1,490,938 250,230 1,250,139
Rural Persons 19,877,709 12,923,353 2,442,347 424,927 4,087,082
Males 11,381,353 6,936,535 993,343 254,954 3.196,521
Females 8,496,356 5,986,818 1,449,004 169,973 890,561
Uruan Persons 3,903,548 243,424 86,878 226,494 3,346,752
Males- 3,328,696 150,341 44,944 146,237 2,987,174
Females 574,852 93,083 41,934 80,257 359,578
9 Uttar Pradesh Total Persons 54,180,232 22,172,563 13,604,812 2,885,596 15,517,261
Males 41,380,607 17,779,985 8,329,123 1,818,419 13,453,080
Females 12,799,625 4,392,578 5,275,689 1,067,177 2,064,181
Rl1ta1 ~rsons" 44,865,277 21,724,771 13,141,632 2,036,660 7,962,214
Males 33,065,880 17,379,801 7,957,247 1,225,312 6.503,520
Females 11,799,397 4,34.4,970 5,184,385 811,348 1,458,694
Urban Persons 9,314,955 447,792 463,180 848,936 7,555,047
Males 8,314,727 400,184 371,876 593,107 6,949,560
- Females 1,000,228 47,608 91,304 255,829 605,487
30
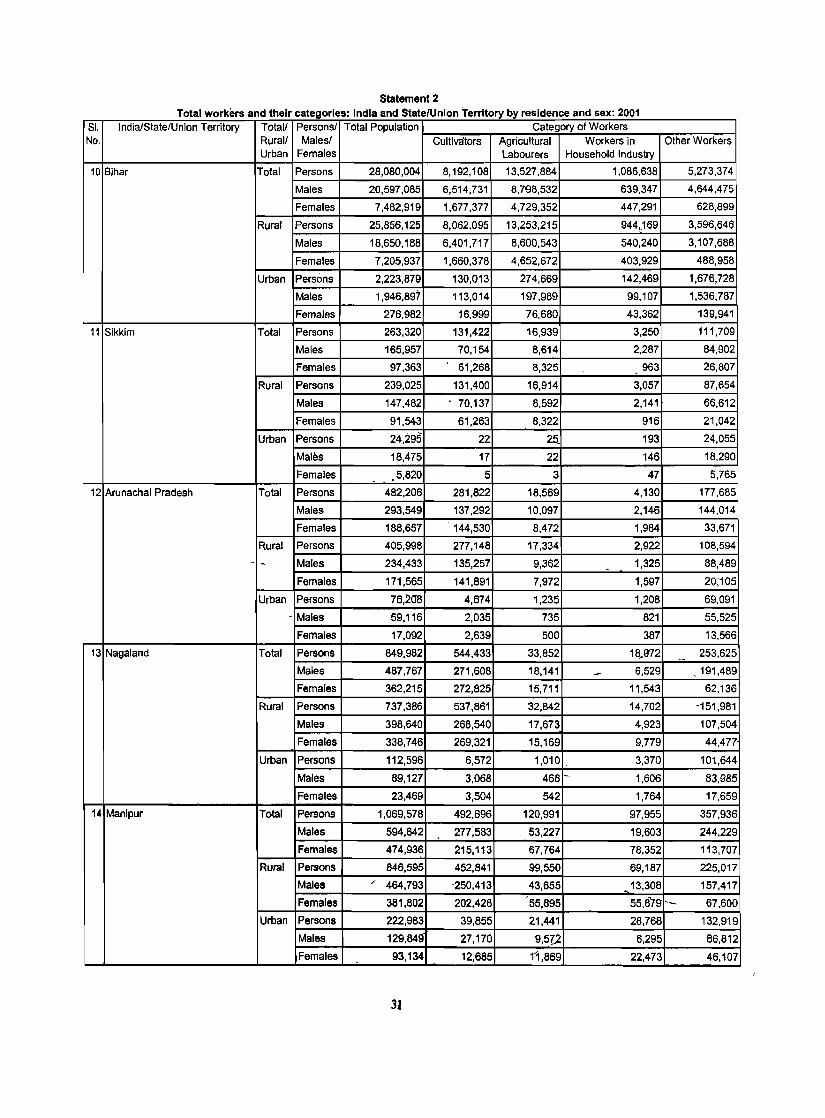
Statement 2 Total workers and their categories: India and State/Union Territory by residence and sex: 2001
SI. India/State/Union Territory Total/ Persons! Total Population Category of Workers No. Rural! Males/ Cultivators Agricultural Workers in Other Workers
Urban Females labourers Household Industry
10 Bjhar Total Persons 28,080,004 8,192,108 13,527,884 1,086,638 5,273,374
Males 20,597,085 6,514,731 8,798,532 639,347 4,644,475
Females 7,482,919 1,677,377 4,729,352 447,291 628,899
Rural Persons 25,856,125 8,062,095 13,253,215 944,,169 3,596,646
Males 18,650,188 6,401,717 8,600,543 540,240 3,107,688
Females 7,205,937 1,660,378 4,652,672 403,929 488,958
Urban Persons 2,223,879 130,013 274,669 142,469 1,676,728
Males 1,946,897 113,014 197,989 99,107 1,536,787
Females 276,982 16,999 76,680 43,362 139,941
11 Sikkim Total Persons 263,320 131,422 16,939 3,250 111,709
Males 165,957 70,154 8,614 2,287 84,902
Females 97,363 61,268 8,325 963 26,807
Rural Persons 239,025 131,400 16,914 3,057 87,654
Males 147,482 70,137 8,592 2,141 66,612
Females 91,543 61,263 8,322 916 21,042
Urban Persons 24,295 22 25. 193 24,055
Males 18,475 17 22 146 18,290
Females .5,820 5 3 47 5,765
12 Arunachal Pradesh Total Persons 482,206 281,822 18,569 4,130 177,685
Males 293,549 137,292 10,097 2,146 144,014
Females 188,657 144,530 8,472 1,984 33,671
Rural Persons 405,998 277,148 17,334 2,922 108,594
, - Males 234,433 135,257 9,362 ,
1,325 88,489
Females 171,565 141,891 7,972 1,597 20;-105
Urban Persons 76,208 4,674 1,235 1,208 69,091
- Males 59,116 2,035 735 821 55,525
Females 17,092 2,639 500 387 13,566
13 Nagaland Total Persons 849,982 544,433 33,852 18)372 253,625 ,-Males 487,767 271,608 18,141 - 6,529 , 191,489
Females 362,215 272,825 15,711 11,543 62,136
Rural Persons 737,386 537,861 32,842 14,702 -151,981
Males 398,640 268,540 17,673 4,923 107,504
Females 338,746 269,321 15,169 9,779 44,477
Urban Persons 112,596 6,572 1,010 . 3,370 101,644
Males 89,127 3,068 468 - 1,606 83,985
Females 23,469 3,504 542 1,764 17,659
14 Manipur Total Persons 1,069,578 492,696 120,991 97,955 357,936
Males 594,642 277;583 53,227 19,603 244,229
Females 474,93~ 215,113 67,764 78,352 113,707
Rural Persons 846,595 452,841 99,550 69,187 225,017
Males / 464,793 '250,413 43,655 13,308 157,417
Females 381,802 202,428 55,895 55,879 -- 67,600
Urban Persons 222,983 39,855 21,441 28,768 132,919
Males 129,849' 27,170 9,5I2 6,295 86,812
Females 93,134 12,685 11.869 22,473 46.107
31
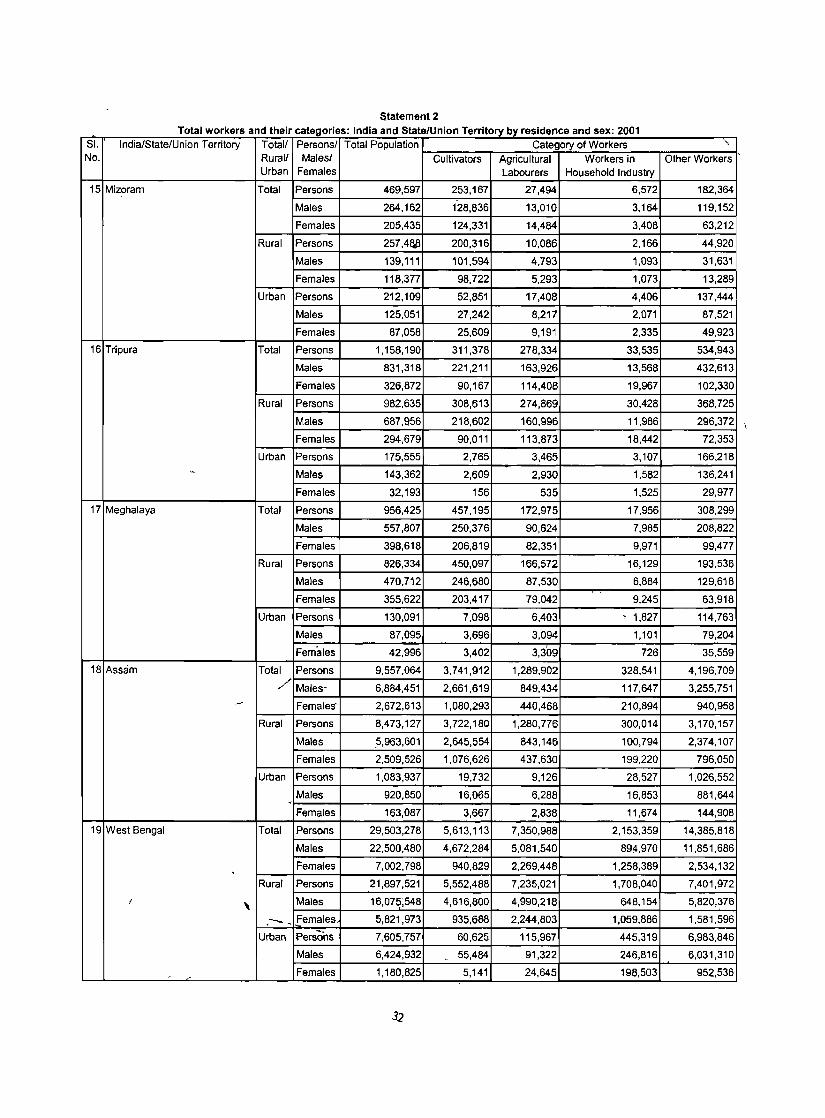
Statement 2
Total workers and their categories: India and State/Union Territory by residence and sex: 2001 SI. India/State/Union Territory Total/ Persons/ Total Population Category of Workers " No, Rural/ Males/ Cultivators Agricultural Workers in Other Workers
Urban Females Labourers Household Industry
15 Mizoram Total Persons 469,597 253,167 27,494 6,572 182,364
Males 264,162 128,836 13,010 3,164 119,152
Females 205,435 124,331 14,484 3,408 63,212
Rural Persons 257,4at! 200,316 10,086 2,166 44,920
Males 139,111 101,594 4,793 1,093 31,631
Females 118,377 98,722 5,293 1,073 13,289
Urban Persons 212,109 52,851 17,408 4,406 137,444
Males 125,051 27,242 8,217 2,071 87,521
Females 87,058 25,609 9,191 2,335 49,923
16 Tripura Total Persons 1,158,190 311,378 278,334 33,535 534,943
Males 831,318 221,211 163,926 13,568 432,613
Females 326,872 90,167 114,408 19,967 102,330
Rural Persons 982,635 308,613 274,869 30,428 368,725
Males 687,956 218,602 160,996 11,986 296,372
Females 294,679 90,011 113,873 18,442 72,353
Urban Persons 175,555 2,765 3,465 3,107 166,218
- Males 143,362 2,609 2,930 1,582 136,241
Females 32,193 156 535 1,525 29,977
17 Meghalaya Total Persons 956,425 457,195 172,975 17,956 308,299
Males 557,807 250,376 90,624 7,985 208,822
Females 398,618 206,819 82,351 9,971 99,477
Rural Persons 826,334 450,097 166,572 16,129 193,536
Males 470,712 246,680 87,530 6,884 129,618
Females 355,622 203,417 79,042 9,245 63,918
Urban Persons 130,091 7,098 6,403 ' 1,827 114,763
Males 87,095 3,696 3,094 1,101 79,204
Females 42,996 3,402 3,309 726 35,559
18 Assam Total Persons 9,557,064 3,741,912 1,289,902 328,541 4,196,709 // Males· 6,884,451 2,661,619 849,434 117,647 3,255,751 - Females' 2,672,613 1,080,293 440,468 210,894 940,958
Rural Persons 8,473,127 3,722,180 1,280,776 300,014 3,170,157
Males ,5,963,601 2,645,554 843,146 100,794 2,374,107
Females 2,509,526 1,076,626 437,630 199,220 796,050
Urban Persons 1,083,937 19,732 9,126 28,527 1,026,552
Males 920,850 16,065 6,288 16,853 881,644 <
Females 163,087 3,667 2,838 11,674 144,908
19 West Bengal Total Persons 29,503,278 5,613,113 7,350,988 2,153,359 14,385,818
Males 22,500,480 4,672,284 5,081,540 894,970 11,851,686
. Females 7,002,798 940,829 2,269,448 1,258,389 2,534,132
Rural Persons 21,897,521 5,552,488 7,235,021 1,708,040 7,401,972
I , Males 16,075~548 4,616,800 4,990,218 648,154 5,820,376 ,- ~ Females 5,821,973 935,688 2,244,803 1,059,886 1,581,596
Urban Persons 7,605,757 60,625 115,967 445,319 6,983,846
Males 6,424,932 . 55,484 91,322 246,816 6,031,310
, Females 1,180,825 5,141 24,645 198,503 952,536
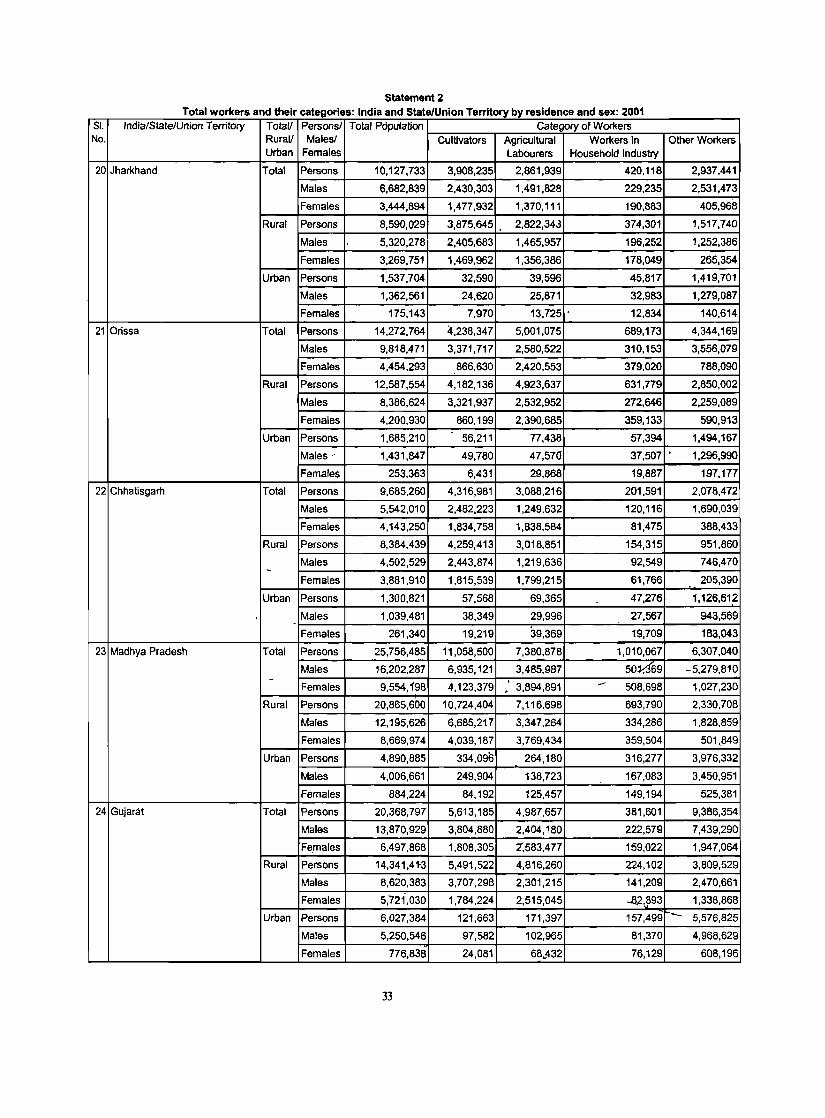
Statement 2 Total workers and their categories' India and State/Union Territory by residence and sex' 2001
SI. India/State/Union Territory Total! Persons/ Total Population Category of Workers No. Rural! Malesl Cultivators Agricultural Workers in Other Workers
Urban Females Labourers Household Industry
20 Jharkhand Total Persons 10,127,733 3,908,235 2,861,939 420,118 2,937,441
Males 6,682,839 2,430,303 1,491,828 229,235 2,531,473
Females 3,444,894 1,477,932 1,370,111 190,883 405,968
Rural Persons 8,590,029 3,875,645 . 2,822,343 374,301 1,517,740
Males , 5,320,278 2,405,683 1,465,957 196,252 1,252,386
Females 3,269,751 1,469,962 1,356,386 178,049 265,354
Urban Persons 1,537,704 32,590 39,596 45,817 1,419,701
Males 1,362,561 24,620 25,871 32,983 1,279,087
Females 175,143 7,970 13,725 ' 12,834 140,614
21 Orissa Total Persons 14,272,764 4,238,347 5,001,075 689,173 4,344,169
Males 9,818,471 3,371,717 2,580,522 310,153 3,556,079
Females 4,454,293 866,630 2,420,553 379,020 788,090
Rural Persons 12,587,554 4,182,136 4,923,637 631,779 2,850,002
Males 8,386,624 3,321,937 2,532,952 272,646 2,259,089
Females 4,200,930 860,199 2,390,685 359,133 590,913
Urban Persons 1,685,210 56,211 77,438 57,394 1,494,167
Males' 1,431,847 49,780 47,57(} 37,507 ' 1,296,990
Females 253,363 6,431 29,868 19,887 197,177
22 Chhatisgarh Total Persons 9,685,260 4,316,981 3,088,216 201,591 2,078,472
Males 5,542,010 2,482,223 1,249,632 120,116 1,690,039
Females 4,143,250 1,834,758 1,838,584 81,475 388,433
Rural Persons 8,384,439 4,259,413 3,018,851 154,315 951,860
Males 4,502,529 2,443,874 1,219,636 92,549 746,470 -Females 3,881,910 1,815,539 1,799,215 61,766 205,390 -
Urban Persons 1,300,821 57,568 69,365 47,276 1,126,612
Males 1,039,481 38,349 29,996 27,567 943,569 -
Females 261,340 19,219 39,369 19,709 183,043
23 Madhya Pradesh Total Persons 25,756,485 11,058,500 7,380,878 1,010,067 6,307,040
Males 16,202,287 6,935,121 3,485,987 50Y,369 -5,279,810 -
9,554,1\98 .-Females 4,123,379 , 3,894,891 508,698 1,027,230
Rural Persons 20,865,6bo 10,724,404 7,116,698 693,790 2,330,708
Males 12,195,626 6,685,217 3,347,264 334,286 1,828,859
Females 8,669,974 4,039,187 3,769,434 359,504 501,849
Urban Persons 4,890,885 334,096 264,180 316,277 3,976,332
Males 4,006,661 249,904 138,723 167,083 3,450,951
Females 884,224 84,192 125,457 149,194 525,381
24 Gujarat Total Persons 20,368,797 5,613,185 4,987,657 381,601 9,386,354
Males 13,870,929 3,804,880 2,404,180 222,579 7,439,290
Females 6,497,868 1,808,305 2;583,477 159,022 1,947,064
Rural Persons 14,341,41-3 5,491,522 4,816,260 224,102 3,809,529
Males 8,620,383 3,707,298 2,301,215 141,209 2,470,661
Females 5,72{030 1,784,224 2,515,045 -1l2,893 1,338,868
Urban Persons 6,027,384 121,663 171,397 157,499 - 5,576,825
Males 5,250,546 97,582 102,965 81,370 4,968,629
Females 776,838 24,081 6M32 76,129 608,196
33
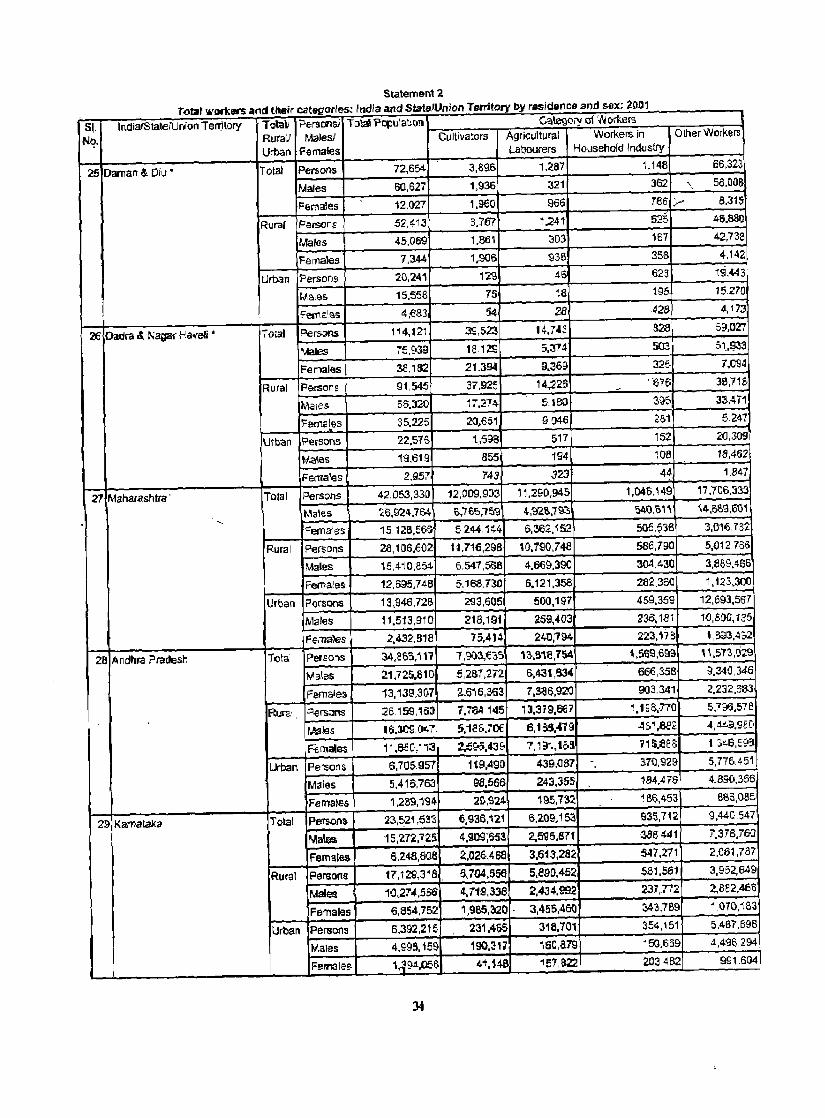
Statement 2 .
51. IndialStal€tUfiion Terrjtory Tolali ?ersoosi Total Pq:m\at.l(ln Category 01 Wolters
Ni? RuraL' Males! Cultivators Agricultural Workers in Other Workers
Urban Females Ulboorers Household Industry
rolllr ..... ari:ers and tltair categories' India and State'Union TlHritQIj' by residence and sex' 2001
25 Daman & Diu' Total Persons 72,654 3,896 1.287 1,148 00,323
Males 60,627 1,936 321 382 \ 58,008
Females 12.1)27 1,960 966 i'B6 ;..- 6,315
Rural Persons 52,413 3,767 i,241 52& 46,88l:l
Males 45,069 1,861 303 161 42,738
Females 7,344 1,906 938 358 4,142
Urban Persons 20,241 rZ9 45 62J 19.443
Males 15,55£ 75 18 195 15,270
Fetn:::.'es 4,~e.l 54 28 428 4,173
2E Oacra &. Nagar /'i.atfeli • "Toml F'ersoans 114,'21 ~,523 14-,74;3 S28 59.027
\tales 7:5,839 1812S 5.314 503 51 .• S3:3
Females Ja"S2 21.394 9,:369 325- 1,004
Rural Persons 91,54:5 37,925 14,:225 - . 676 35,71S
Maies. 55,320 11,214 5,1&1 3&5 33,411
Ferna~es 35.:225 20,651 9,046 251 5247
lIrban Persons 22,575 1.,598 511 152 2(),309
Males 19,619 855 194 108 18,462
Females 2.957 743 -323 44 1,84.1
27 Ma.hB.r.ashtra . Total Persons 4;2,053,330 12,009,903 11,290.945 1.046,149 17,706,3~
Males 26.924,764 &,71)5,15'9 ~;9'2t,1~ 540,61" '\ 4 ,6e.9 ,61)1 .....
Ferna'es 15,126,S65 So 244,1~4 5,362.,152 5Q5,?3B 3,016,7S.2
Rural Persons 2a,106,602 11,71Ei,29B 10,700,748 586,790 5,012,755
Males 1S. .. ~ '\0,854- 6,547,558 4.66S1.390 304,430 3,889,466
Females 12,695,748 5.168,130 6,121,358 282,36() 1,123,300
Urbal\ Persons 13,946,726 293,605 500,191 459,359 12.693,567
Males 11.513,910 218.191 259,403 236,181 1(),800, 135
F&males 2,4:32,818 ,5.414 240,794 223,17B 1,3",3,4202
28 Andhrn Pradesh T(Jtal Persons 34,-865.111 1,OO3,fj35 15,61(1,754 ',569,699 , 1,573,QZ9
~a\es 21,725,810 5,287,272 5,431,634 600,358 9,340346
Females 13,139,307 2..6i6,363 7,366,92'3 903.341 2,:232,683
RlJr2.' ?-€rs::x1S 2e..1~,'6::t 1,~,145 11,3i'e,66 i ~ ,1ge,77() 5,795,57e
I 1)3les 'S,~.C1 .. 7 5,1.ee.7OE 6, '3S.oC79 4S',ee~ 4,~3,9H'
Females 11 .13:5 C· Y1:3 2.:5!:o5,~g. 1,19",,1&:1 i 1 S_flES 1 ~"6,~93
Urban Persons 6,705,957 119,490 439,067 - 510,929 5,175.451
Males 5,416,763 98,566 243,355 184,475 4,890,555
Females 1,289,194 20,924- 1~,732 1BE),453 B86,085
29 Kamataka Total ~f!rs.ons 23,521,53-3 6,936,~21 6,209,153 935,712 9,440,541
Males 15,212,125 4,900;tS53 2,5'95,871 381:\.441 7,378,700
Females 6,Z48,80:8 2,D2a,4S8 3,613.2132 547,211 2,061,787
Rural PersOTls 17,12G,316. 6,704,656 5,8ea,452 5B1,561 3,952,649
Males 10,274,556 4,719,336 2,434.992 .2.37,n2 2,.eS2,466
Females 6,854,752 1,985,~O . 3,455,46{J M3,7B9 ~,070,"'i83
Urban Persons 6,392,2t5 231,4&5 318,701 354,151 5.487,698
t,.',alas 4,9911,159 190,311 '\60,819 15(1,669 4,496294
F91N1eg. QSlA.C56. 4:t ,148 151,822 203,482 991.6()4
34

Statement 2 Total workers and their categories' India and State/Union Territory by residence and sex' 2001
51. India/State/Union Territory Total/ Persons/ Total Population Category of Workers No. Rural/ Males/ Cultivators Agricultural Workers in Other Workers
Urban Females Labourers Household Industry
30 Goa Total Persons 522,565 50,663 36,150 14,094 421,658
Males 376,113 26,008 16,211 8,551 325,343
Females 146,452 24,655 19,939 5,543 96,315
Rural Persons 274,744 45,258 31,510 8,317 189,659
Males 186,286 23,340 13,867 4,869 144,210
Females 88,458 21,918 17,643 - 3,448 45,449
Urban Persons 247,821 5,405 4,640 5,777 231,999
Males 189,827 2,668 2,344 3,682 181,133
Females 57,994 2,737 2,296 2,095 50,866
31 Lakshadweep • Total Persons 15,349 0 0 910 14,439
Males 13,229 0 0 542 12,687
Females 2,120 0 0 368 1,752
Rural Persons 7,998 0 0 441 7,557
Males 6,999 0 0 283 6,716
Females 999 0 0 158 841
Urban Persons 7,351 0 - 0 469 6,882 ,
Males 6,230 0 0 259 5,971
Females 1,121 0 0 210 911
32 Kerala Total Persons 10,291,258 740,403 1,653,601 364,770 7,532,484
Males 7,790,522 622,724 1,103,317 181,935 5,882,546
Females 2,500,736 117,679 550,284 182,835 1,649,938
Rural Persons 7,675,096 685,163 1,514,706 262,066 5,213,161 - Males 5,750,087 578,665 1,009,620 125,224 4,036,578
-Females 1,925,009 106,498 505,086 136,842 1,176,583
Urban Persons 2,616,162 55,240 138,895 102,704 2,319,323 4
Males 2,040,435 44,059 93,697 56,711 : 1.,845,968
Females 575,727 11,181 45,198 45,993 473,355
33 Tamil Nadu Total Persons 27,811,647 5,114,384 8,665,020 1,158,546 - 12,573,697
Males 18,153,275 3,305,413 4,277,140 ~ 619,096 9,951,626
Females 9,658,372 1,808,971 4,387,880 839,450 2,622,071
Rural Persons 17,572,083 4,725,890 7,565,439 815,009 -4,465,745
Males 10,396,912 3,028,113 3,667,853 324,381 3,376,565
Females 7,175,171 1,697,777 3,897,586 490,628 1,089,180
Urban Persons 10,239,564 388,494 1,099,581 643,537 8,107,952
Males 7,756,363 277,300 609,287 294,715 6,575,061
Females 2,483,201 111,194 490,294 348,822 1,532,891
34 Pondicherry • Total Persons 342,101 11,284 72,095 6,096 252,626
Males 259,309 10,186 41,990 3,097 204,036
Females 8U92 1,098 30,105 2,999 48,590
Rural Persons 127,635 8{774 60,251 2,103 56,507
Males ,
89,102 7,826 /
34,174 .... 1,051 46,051
Females 38,533 948 26,077 1,os:;- 10,456
Urban Persons 214,466 2,510 11,844 3,993 196,119
Males 170,207 2,360 7~816 2,046 157,985
Females 44,259 150 4,028 1,947 38,134
35
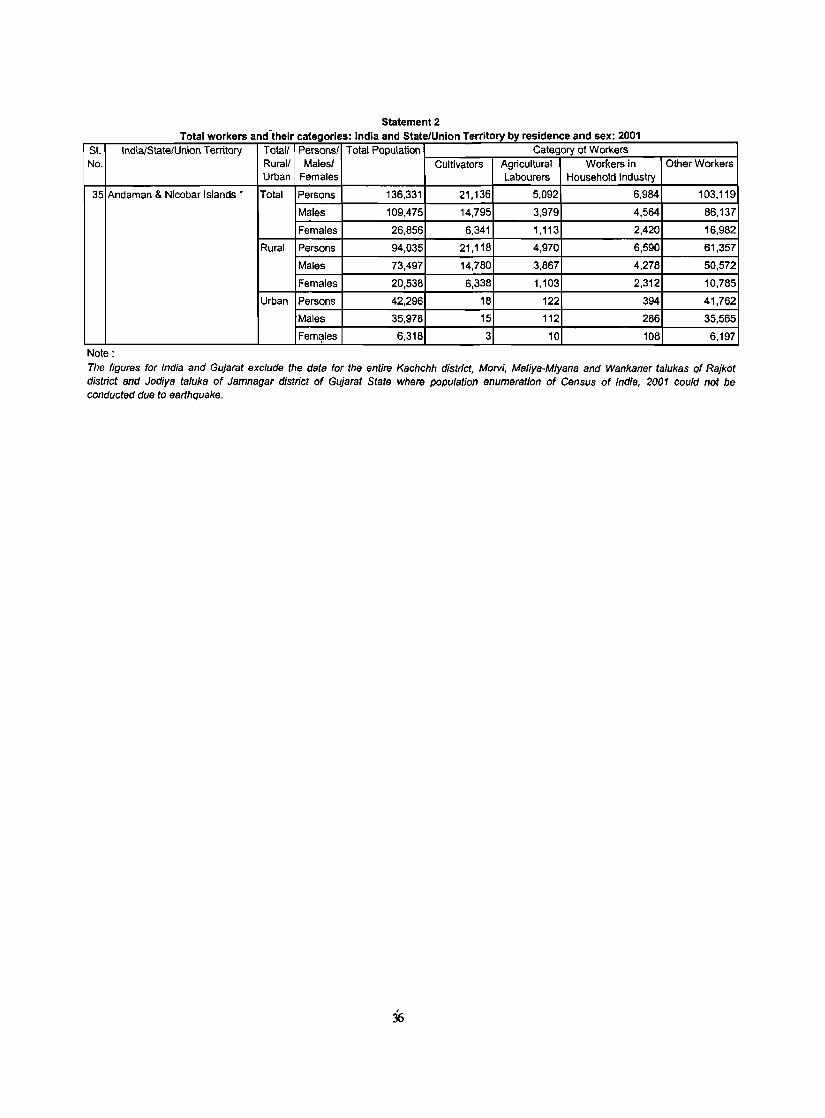
Statement 2 Total workers and their categories: India and State/Union Territory by residence and sex: 2001
SI. India/State/Union Territory Total! Persons/ Total Population Category of Workers No. Rural! Males/ Cultivators Agricultural Workers in Other Workers
Urban Females Labourers Household Industry
35 Andaman & Nicobar Islands' Total Persons 136,331 21,136 5,092 6,984 103,119
Males 109,475 14,795 3,979 4,564 86,137
Females 26,856 6,341 1,113 2,420 16,982
Rural Persons 94,035 21,118 4,970 6,590 61,357
Males 73,497 14,780 3,867 4,278 50,572
Females 20,538 6,338 1,103 2,312 10,785
Urban Persons 42,296 18 122 394 41,762
Males 35,978 15 112 286 35,565
Fem~les 6,318 3 10 108 6,197
Note:
The figures for India and Gujarat exclude the data for the entire Kachchh district, Morvi, Mafiya-Miyana and Wankaner talukas of Rajkot district and Jodiya taluka of Jamnagar district of Gujarat State where population enumeration of Census of India, 2001 could not be conducted due to earthquake.
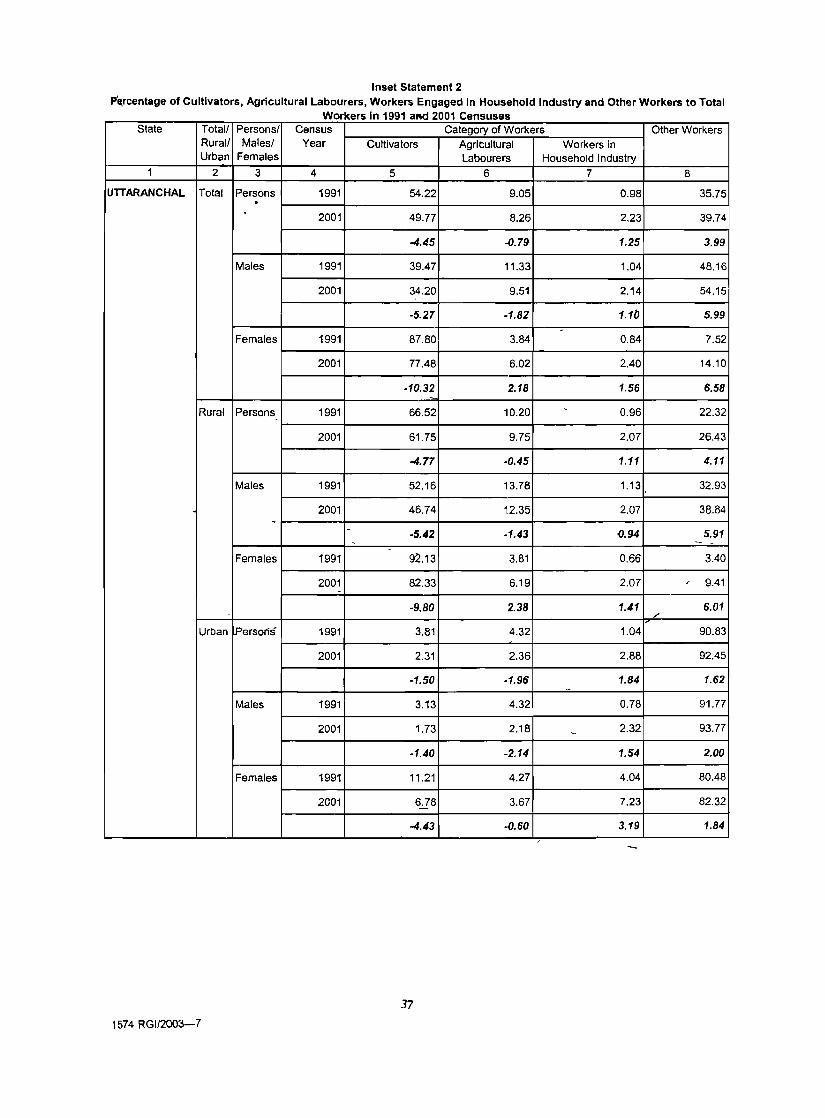
Inset Statement 2 pe.rcentage of Cultivators, Agricultural Labourers, Workers Engaged in Household Industry and Other Workers to Total
Workers In 1991 aMI 2001 Censuses State Total! Personsl Census Category of Workers Other Workers
Rural! Males! Year Cultivators Agricultural Workers in Urban Females Labourers Household Industry
1 2 3 4 5 6 7 8
UTTARANCHAL Total Persons 1991 54.22 9.05 0.98 35.75 . 2001 49.77 8.26 2.23 39.74
-4.45 -0.79 1.25 3.99
Males 1991 39.47 11.33 1.04 48.16
2001 34.20 9.51 2.14 54.15
-5.27 -1.82 1.1lJ 5.99 ,
Females 1991 87.80 3.84 0.84 7.52
2001 77.48 6.02 2.40 14.10
-10.32 2.18 1.56 6.58
Rural Persons 1991 66.52 10.20 . 0.96 22.32
2001 61.75 9.75 2.07 26.43
-4.77 -0.45 1.11 4.11
Males 1991 52.16 13.78 1.13 32.93
2001 46.74 12.35 2.07 38.84 - - -5.42 -1.43 ~.94 5.91 - - --
Females 1991 92.13 3.81 0.66 3.40
2001 82.33 6.19 2.07 ~ 9.41 ,
-9.80 2.38 1.41 6.01
'" Urban !persons 1991 3.81 4.32 1.04 90.83
2001 2.31 2.36 2.88 92.45
-1.50 -1.96 1.84 1.62
Males 1991 3.13 4.32 0.78 91.77
2001 1.73 2.18 - 2.32 93.77
-1.40 -2.14 1.54 2.00
Females 1991 11.21 4.27 4.04 80.48
2001 6.78 3.67 7.23 82.32
-4.43 -0.60 3.19 1.84 /
37
1574 RG1/2003-7
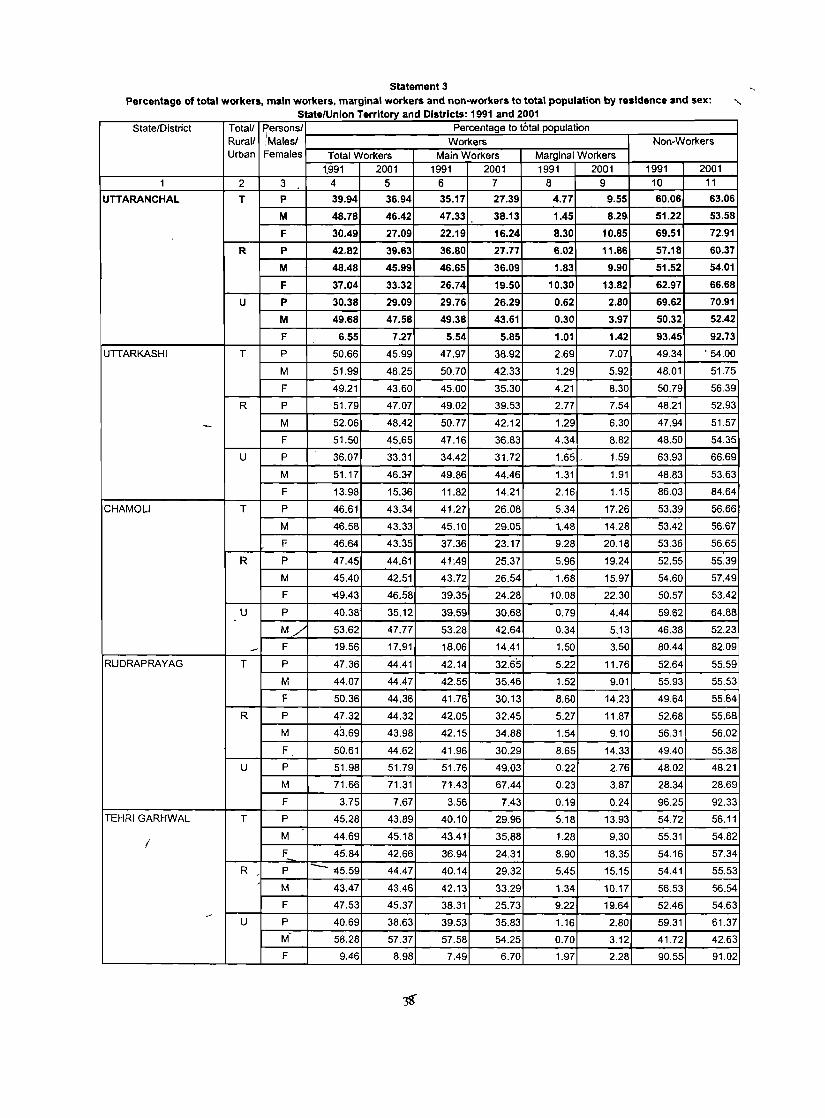
Statement 3 Percentage of total workers, main workers, marginal workers and non-workers to total population by residence and sex: "
State/Union Territory and Districts· 1991 and 2001 State/District Total! ~ersons/ Percentage to total population
Rural! : Malesl Workers Non-Workers Urban Females Total Workers Main Workers Marginal Workers
1.991 2001 1991 2001 1991 2001 1991 2001 1 2 3 4 5 6 7 8 9 10 11
UTTARANCHAL T P 39.94 36.94 35.17 27.39 4.77 9.55 60.06 63.06
M 48.78 46.42 47.33 38.13 1.45 8.29- 51.22 53.58
F 30.49 27.09 22.19 16.24 8.30 10.85 69.51 72.91
R P 42.82 39.63 36.80 27.77 6.02 11.86 57.18 60.37
M 48.48 45.99 46.65 36.09 1.83 9.90 51.52 54.01
F 37.04 33.32 26.74 19.50 10.30 13.82 62.97 66.68
U P 30.38 29.09 29.76 26.29 0.62 2.80 69.62 70.91
M 49.68 47.58 49.38 43.61 0.30 3.97 50.32 52.42
F 6.55 7.27 5.54 5.85 1.01 1.42 93.45 92.73
UTTARKASHI T P 50.66 45.99 47.97 38.92 2.69 7.07 49.34 ' 54.00
M 51.99 48.25 50.70 42.33 1.29 5.92 48.01 51.75
F 49.21 43.60 45.00 35.30 4.21 8.30 50.79 56.39
R P 51.79 47.07 49.02 39.53 2.77 7.54 48.21 52.93
- M 52.06 48.42 50.77 42.12 1.29 6.30 47.94 51.57
F 51.50 45.65 47.16 36.83 4.34 8.82 48.50 54.35
U P 36.07 33.31 34.42 31.72 1.65 1.59 63.93 66.69
M 51.17 46.31 49.86 44.46 1.31 1.91 48.83 53.63
F 13.98 15.36 11.82 14.21 2.16 1.15 86.03 84.64
CHAMOLI T P 46.61 43.34 41.27 26.08 5.34 17.26 53.39 56.66
M 46.58 43.33 45.10 29.05 1..48 14.28 53.42 56.67
F 46.64 43.35 37.36 23.17 9.28 20.18 53.36 56.65
R P 47.45 44.61 41~49 25.37 5.96 19.24 52.55 55.39
M 45.40 42.51 43.72 26.54 1.68 15.97 54.60 57.49
F "'19.43 46.58 39.35 24.28 10.08 22.30 50.57 53.42
U P 40.38 35.12 39.59 30.68 0.79 4.44 59.62 64.88
M// 53.62 47.77 53.28 42.64 0.34 5.13 46.38 52.23
- F 19.56 17.91 18.06 14.41 1.50 3.50 80.44 82.09
RUDRAPRAYAG T P 47.36 44.41 42.14 32.65 5.22 11.76 52.64 55.59
M 44.07 44.47 42.55 35.46 1.52 9.01 55.93 55.53
F 50.36 44.36 41.76 30.13 8.60 14.23 49.64 55.64
R P 47.32 44.32 42.05 32.45 5.27 11.87 52.68 55.68
M 43.69 43.98 42.15 34.88 1.54 9.10 56.31 56.02
F 50.61 44.62 41.96 30.29 8.65 14.33 49.40 55.38
U P 51.98 51.79 51.76 49.03 0.22 2.76 48.02 48.21
M 71.66 71.31 71.43 67.44 0.23 3.87 28.34 28.69
F 3.75 7.67 3.56 7.43 0.19 0.24 96.25 92.33
TEHRI GARHWAL T P 45.28 43.89 40.10 29.96 5.18 13.93 54.72 56.11
I M 44.69 45.18 43.41 35.88 1.28 9.30 55.31 54.82
F 45.84 42.66 36.94 24.31 8.90 18.35 54.16 57.34
R , P - '45.59 44.47 40.14 29.32 5.45 15.15 54.41 55.53 f M 43.47 43.46 42.13 33.29 1.34 10.17 56.53 56.54
-F 47.53 45.37 38.31 25.73 9.22 19.64 52.46 54.63
,.-U P 40.69 38.63 39.53 35.83 1.16 2.80 59.31 61.37
M' 58.28 57.37 57.58 54.25 0.70 3.12 41.72 42.63
F 9.46 8.98 7.49 6.70 1.97 2.28 90.55 91.02
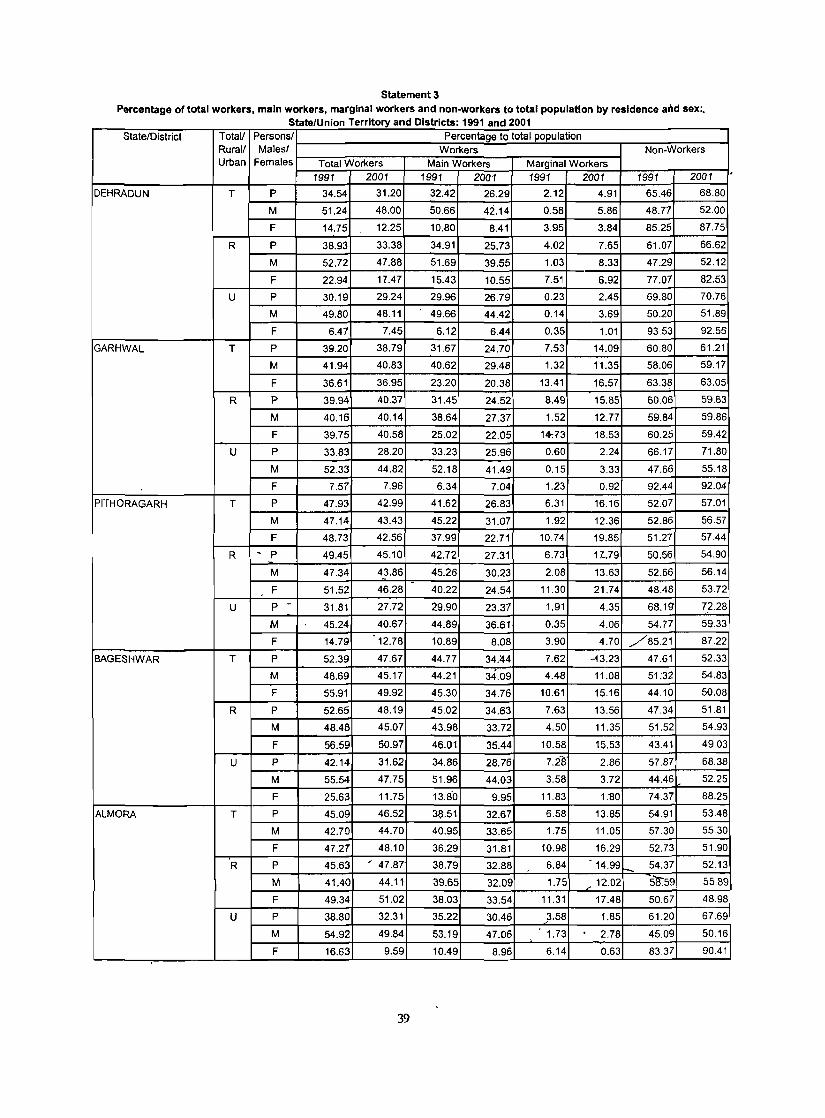
Statement 3 Percentage of total workers, main workers, marginal workers and non-workers to total population by residence and sex:.
State/Union Territory and Districts· 1991 and 2001 State/District Totall Persons/ Percentage to total population
Rural! Males/ Workers Non-Workers Urban Females Total Workers Main Workers Marginal Workers
1991 2001 1991 2001 1991 2001 1991 2001 . DEHRADUN T P 34.54 31.20 32.42 26.29 2.12 4.91 65.46 68.80
M 51.24 48.00 50.66 42.14 0.58 5.86 48.77 52.00
F 14.75 12.25 10.80 8.41 3.95 3.84 85.25 87.75
R P 38.93 33.38 34.91 25.73 4.02 7.65 61.07 66.62
M 52.72 47.88 51.69 39.55 1.03 8.33 47.29 52.12
F 22.94 17.47 15.43 10.55 7.51 6.92 77.07 82.53
U P 30.19 29.24 29.96 26.79 0.23 2.45 69.80 70.76
M 49.80 48.11 49.66 44.42 0.14 3.69 50.20 51.89
F 6.47 7.45 6.12 6.44 0.35 1.01 93.53 92.55
GARHWAL T P 39.20 38.79 31.67 24.70 7.53 14.09 60.80 61.21
M 41.94 40.83 40.62 29.48 1.32 11.35 58.06 59.17
F 36.61 36.95 23.20 20.38 13.41 16.57 63.38 63.05
R P 39.94 40.37 31.45 24.52 8.49 15.85 60.06 59.63
M 40.16 40.14 38.64 27.37 1.52 12.77 59.84 59.86
F 39.75 40.58 25.02 22.05 14-:73 18.53 60.25 59.42
U P 33.83 28.20 33.23 25.96 0.60 2.24 66.17 71.80
M 52.33 44.82 52.18 41.49 0.15 3.33 47.66 55.18
F 7.57 7.96 6.34 7.04 1.23 0.92 92.44 92.04
PITHORAGARH T P 47.93 42.99 41.62 26.83 6.31 16.16 52.07 57.01
M 47.14 43.43 45.22 31.07 1.92 12.36 52.86 56.57
F 48.73 42.56 37.99 22.71 10.74 19.85 51.27 57.44
R - P 49.45 45.10 42.72 27.31 6.73 17-..79 50.56 54.90
M 47.34 43.86 45.26 30.23 2.08 13.63 52.66 56.14
F 51.52 46.28 40.22 24.54 11.30 21.74 48.48 5372
U P - 31.81 27.72 29.90 23.37 1.91 4.35 68.19 72.28 . M 45.24 40.67 44.89 36.61 0.35 4.06 54.77 59.33
F 14.79 12.78 10.89 8.08 3.90 4.70 //85.21 87.22
BAGESHWAR T P 52.39 47.67 44.77 34A4 7.62 -13.23 47.61 52.33
M 48.69 45.17 44.21 34.09 4.48 11.08 51 :32 54.83
F 55.91 49.92 45.30 34.76 10.61 15.16 44.10 50.08
R P 52.65 48.19 45.02 34.63 7.63 13.56 47.34 51.81
M 48.48 45.07 43.98 33.72 4.50 11.35 51.52 54.93
F 56.59 50.97 46.01 35.44 10.58 15.53 43.41 49.03
U p 42.14 31.62 34.86 28.76 7.28 2.86 57.87 68.38
M 55.54 47.75 51.96 44.03 3.58 3.72 44.46 52.25
F 25.63 11.75 13.80 9.95 11.83 1:80 74.37 88.25
ALMORA T P 45.09 46.52 38.51 32.67 6.58 13.85 54.91 53.48
M 42.70 44.70 40.95 33.65 1.75 11.05 57.30 55.30
F 47.27 48.10 36.29 31.81 10.98 16.29 52.73 51.90
R P 45.63 / 47.87 38.79 32.88 6.84 14.99 54.37 52.13
M 41.40 44.11 39.65 32.09 1.75 12.02 58':'59 55.89
F 49.34 51.02 38.03 33.54 11.31 17.48 50.67 48.98
U P 38.80 32.31 35.22 30.46 3..58 1.85 61.20 67.69
M 54.92 49.84 53.19 47.06 ' 1.73 2.78 45.09 50.16
F 16.63 9.59 10.49 8.96 6.14 0.63 83.37 90.41
39
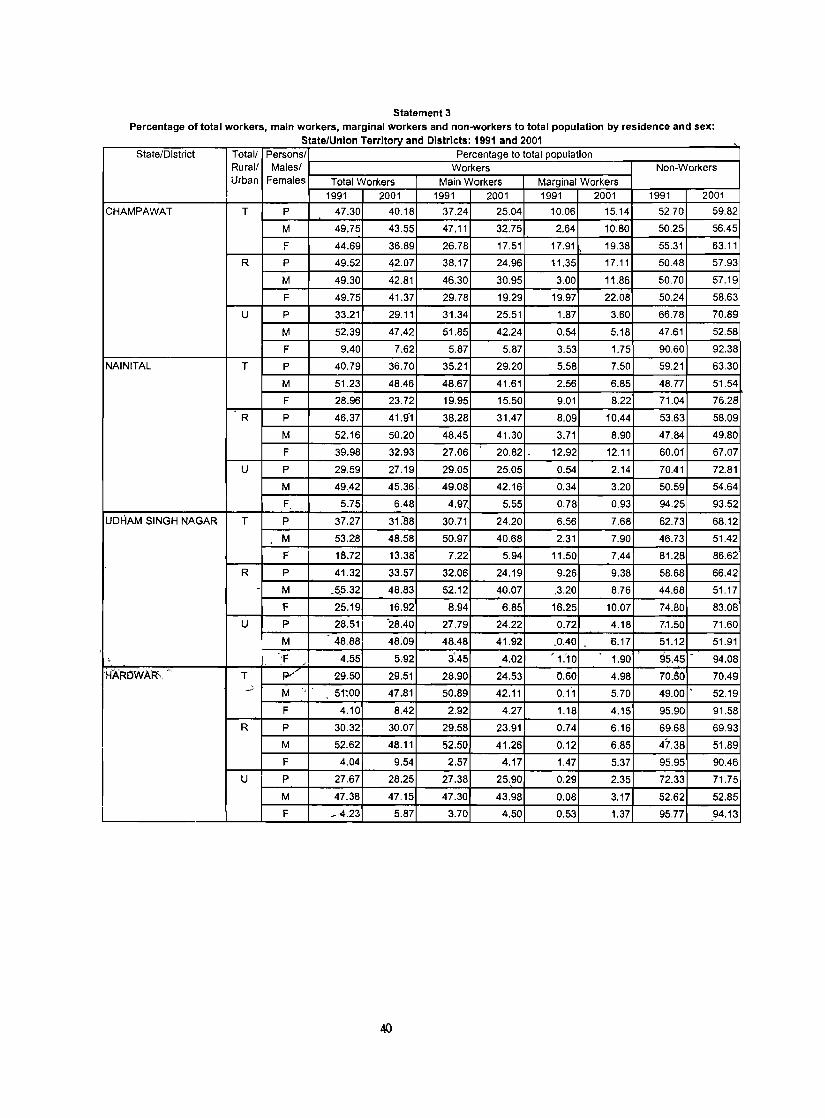
Statement 3 Percentage of total workers, main workers, marginal WOrkers and non-workers to total population by residence and sex:
State/Union Territory and Districts' 1991 and 2001 State!District Total! Persons! Percentage to total population
Rural! Males! Workers Non-Workers Urban Females Total Workers Main Workers Marginal Workers
1991 2001 1991 2001 1991 2001 1991 2001
CHAMPAWAT T P 47.30 40.18 37.24 25.04 10.06 15.14 52.70 59.82
M 49.75 43.55 47.11 32.75 2.64 10.80 50.25 56.45
F 44.69 36.89 26.78 17.51 17.91 . 19.38 55.31 63.11
R P 49.52 42.07 38.17 24.96 11.35 17.11 50.48 57.93
M 49.30 42.81 46.30 30.95 3.00 11.86 50.70 57.19
F 49.75 41.37 29.78 19.29 19.97 22.08 50.24 58.63
U P 33.21 29.11 31.34 25.51 1.87 3.60 66.78 70.89
M 52.39 47.42 51.85 42.24 0.54 5.18 47.61 52.58
F 9.40 7.62 5.87 5.87 3.53 1.75 90.60 92.38
NAINITAL T P 40.79 36.70 35.21 29.20 5.58 7.50 59.21 63.30
M 51.23 48.46 48.67 41.61 2.56 6.85 48.77 51.54
F 28.96 23.72 19.95 15.50 9.01 8.22 71.04 76.28
R P 46.37 41.9"1 38.28 31.47 8.09 10.44 53.63 58.09
M 52.16 50.20 48.45 41.30 3.71 8.90 47.84 49.80
F 39.98 32.93 27.06 20.82 . 12.92 12.11 60.01 67.07
U P 29.59 27.19 29.05 25.05 0.54 2.14 70.41 72.81
M 49.42 45.36 49.08 42.16 0.34 3.20 50.59 54.64
F 5.75 6.48 4.97 5.55 0.78 0.93 94.25 93.52
UDHAM SINGH NAGAR T P 37.27 31.-88 30.71 24.20 6.56 7.68 62.73 68.12
M 53.28 48.58 50.97 40.68 2.31 7.90 46.73 51.42
F 18.72 13.38 7.22 5.94 11.50 7.44 81.28 86.62
R P 41.32 33.57 32.06 24.19 9.26 9.38 58.68 66.42 . M _5.5.32 48.83 52.12 40.07 ,3.20 8.76 44.68 51.17
f 25.19 16.92 8.94 6.85 16.25 10.07 74.80 83.08
U P 28.51 28.40 27.79 24.22 0.72 4.18 7,1.50 71.60 . M 48.88 48;09 48.48 41.92 .. 0.40 6.17 51.12 51.91
I :F , 4.55 5.92 3.45 4.02 1.10 1.90 95.45 94.08
H'AROWAR\ ' T p" .... 29.50 29.51 28.90 24.53 0.60 4.98 70.50 70.49 _k
M 51:00 47.81 50.89 42.11 0.11 5.70 49.00 . 52.19
F 4.10 8.42 2.92 4.27 1.18 4.15 95.90 91.58
R P 30.32 30.07 29.58 23.91 0.74 6.16 69.68 69.93
M 52.62 48.11 52.50 41.26 0.12 6.85 47.38 51.89
F 4.04 9.54 2.57 4.17 1.47 5.37 95.95 90.46
U P 27.67 28.25 27.38 25.90 0.29 2.35 72.33 71.75
M 47.38 47.15 47.30 43.98 0.08 3.17 52.62 52.85
F _-4.23 5.87 3.70 4.50 0.53 1.37 95.77 94.13
40
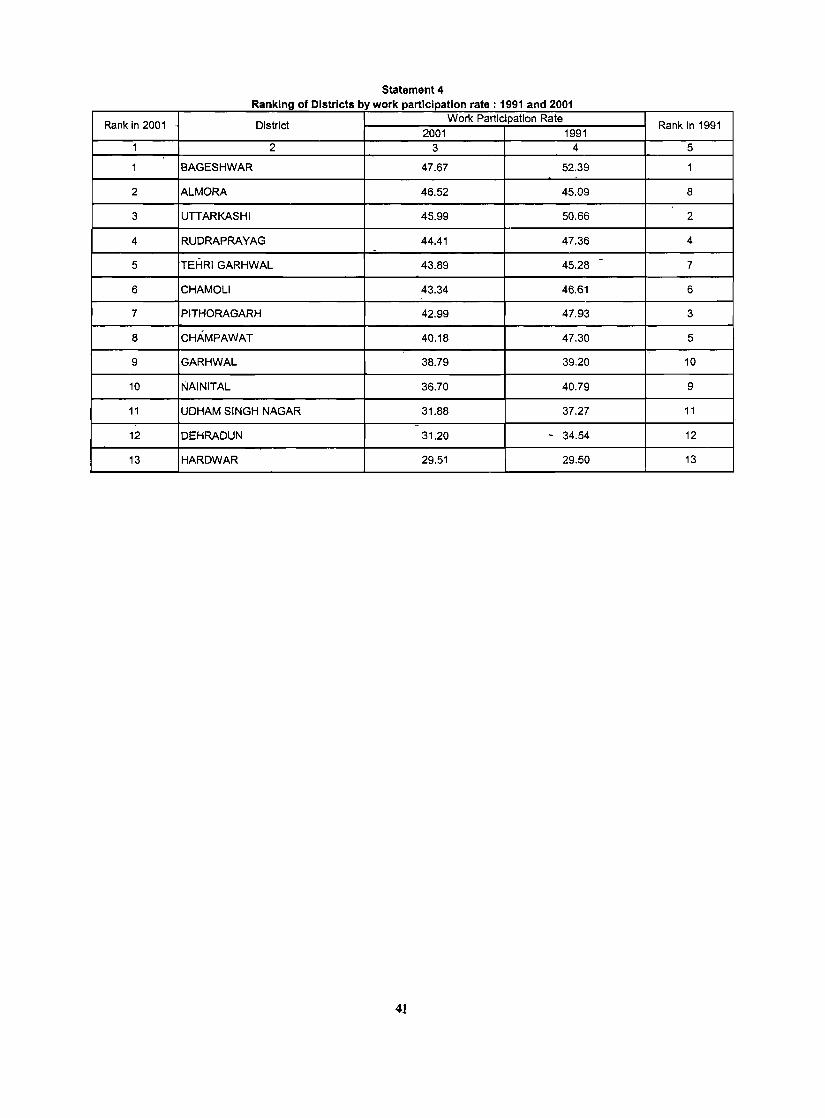
Statement 4 Ranking of Districts by work participation rate' 1991 and 2001
Rank in 2001 District 2001
Work Participation Rate Rank in 1991
1991 1 2 3 4 5
1 BAGESHWAR 47.67 52.39 1
2 ALMORA 46.52 45.09 8
3 UTTARKASHI 45.99 50.66 2
4 RUDRAPRAYAG 44.41 47.36 4 - -5 TEHRI GARHWAL 43.89 45.28 7
6 CHAMOLI 43.34 46.61 6
7 PITHORAGARH 42.99 47.93 3
8 CHAMPAWAT 40.18 47.30 5
9 GARHWAL 38.79 39.20 10
10 NAINITAL 36.70 40.79 9
11 UDHAM SINGH NAGAR 31.88 37.27 11
-12 DEHRADUN 31.20 - 34.54 12
13 HARDWAR 29.51 29.50 13
41
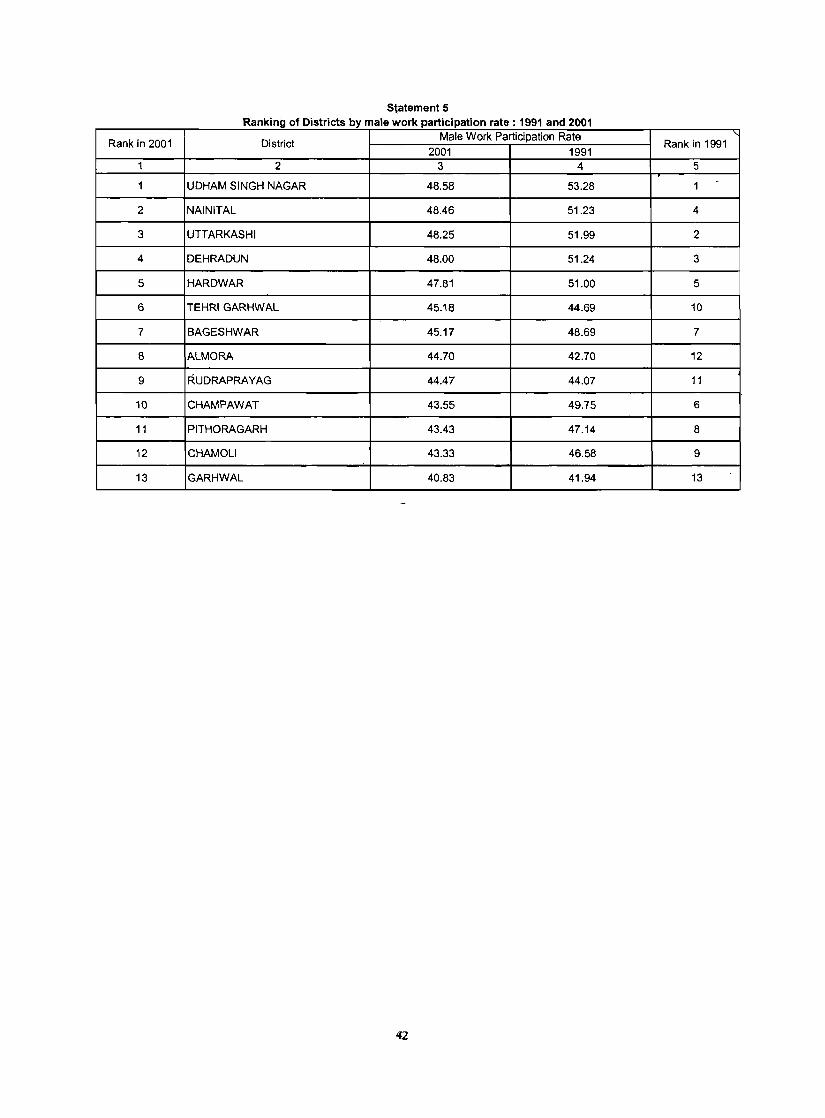
Statement 5 Ranking of Districts by male work participation rate' 1991 and 2001
Rank in 2001 District Male Work Participation Rate
Rank in 1991 2001 1991
1 2 3 4 5
1 UDHAM SINGH NAGAR 48.58 53.28 1 -
2 NAINITAL 48.46 51.23 4
3 UTTARKASHI 48.25 51.99 2
4 DEHRADUN 48.00 51.24 3
5 HARDWAR 47.81 51.00 5
6 TEHRI GARHWAL 45.18 44.69 10
7 BAGESHWAR 45.17 48.69 7
8 ALMORA 44.70 42.70 12
9 RUDRAPRAYAG 44.47 44.07 11
10 CHAMPAWAT ~3.55 49.75 6
11 PITHORAGARH 43.43 47.14 8
12 CHAMOLI 43.33 46.58 9
13 GARHWAL 40.83 41.94 13
42
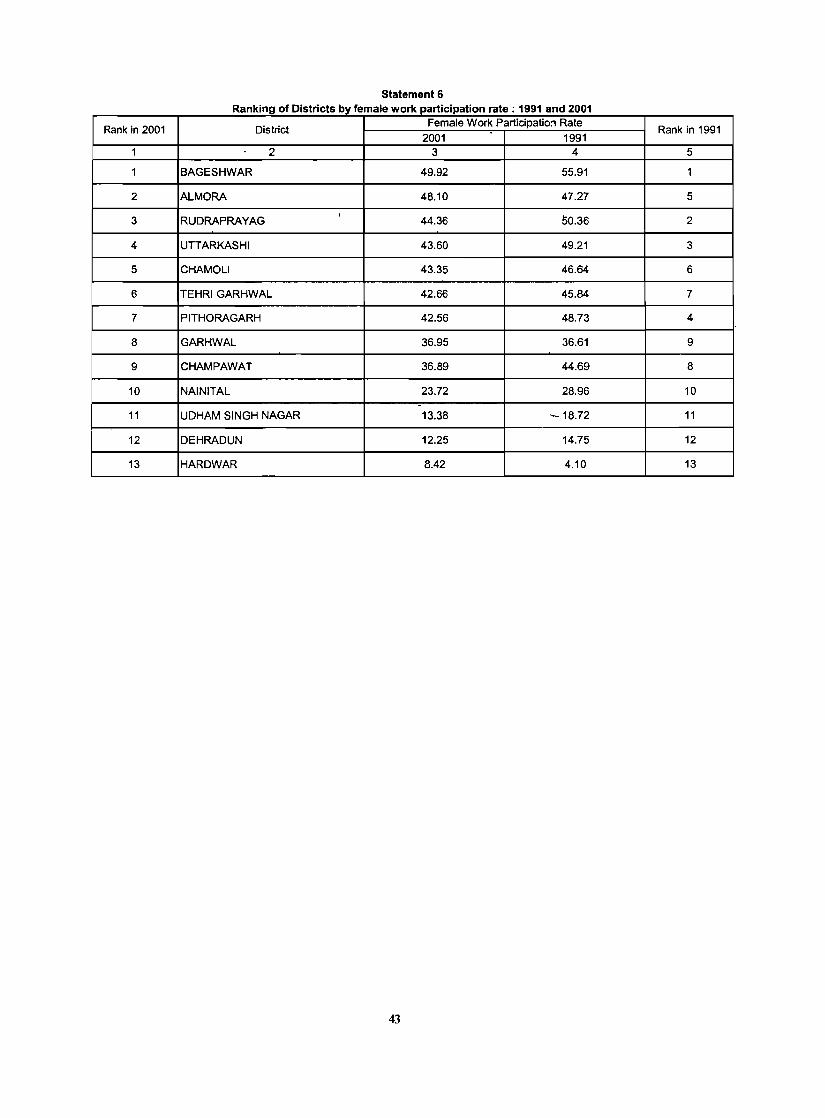
Statement 6 Ranking of Districts by female work participation rate: 1991 and 2001
Rank in 2001 District Female Work Participatio:1 Rate
Rank in 1991 2001 1991
1 2 3 4 5
1 BAGESHWAR 49.92 55.91 1
2 ALMORA 48.10 47.27 5
3 RUDRAPRAYAG I
44.36 50.36 2
4 UTTARKASHI 43.60 49.21 3
5 CHAMOLI 43.35 46.64 6
6 TEHRI GARHWAL 42.66 45.84 7
7 PITHORAGARH 42.56 48.73 4
8 GARHWAL 36.95 36.61 9
9 CHAMPAWAT 36.89 44.69 8
10 NAINITAL 23.72 28.96 10 ~-
11 UDHAM SINGH NAGAR 13.38 ~ 18.72 11
12 DEHRADUN 12.25 14.75 12
13 HARDWAR 8.42 4.10 13
43

Statement 7 Ranking of Districts by percentage of workers engaged in non-agricultural activities: 2001
Rank District Percentage of workers engaged in non-agricultural activities 1 2 3 -1 DEHRADUN 74.35
2 HARDWAR 58.31
3 NAINITAL 49.36
4 UDHAM SINGH NAGAR 44.65
5 CHAMOLI 34.26
6 GARHWAL 31.39
7 PITHORAGARH 31.13
8 TEHRI GARHWAL 28.95
9 CHAMPAWAT 28.07
10 ALMORA 23.84 \ I
11 RUDRAPRAYAG 23.69 I
12 UTTARKASHI 22.99
13 BAGESHWAR 22.26
44
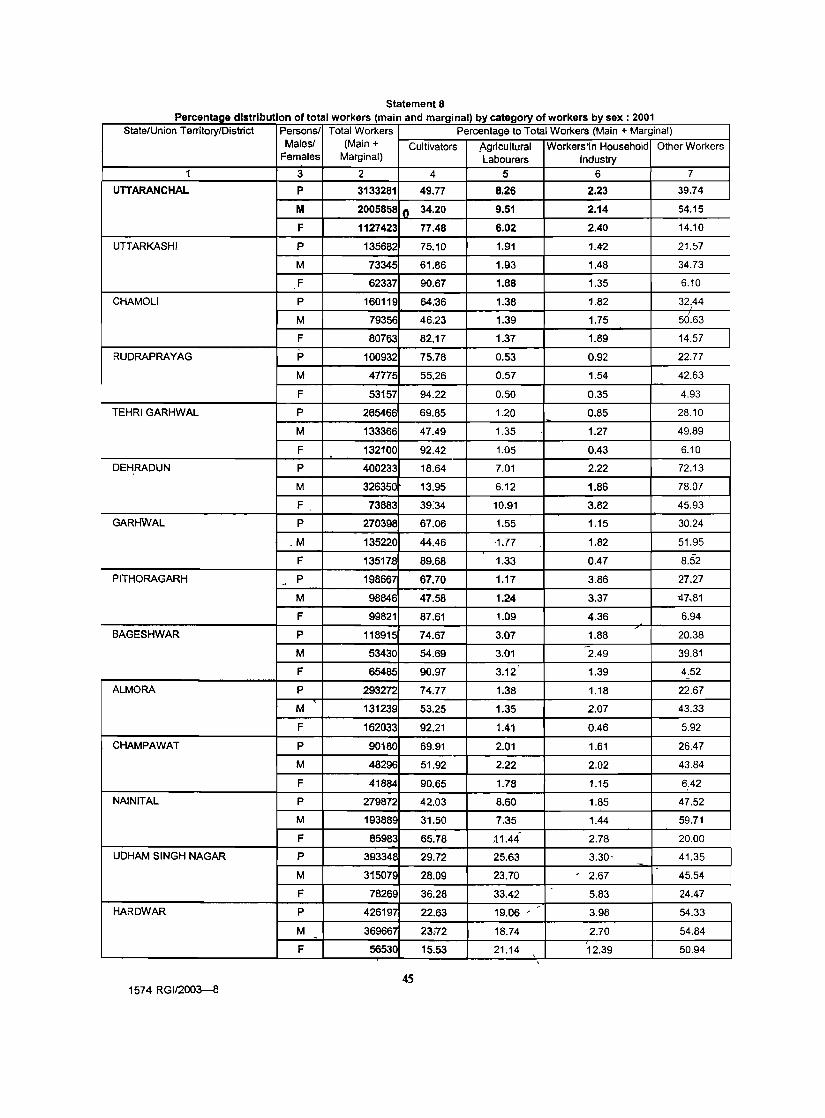
Statement 8 Percentage distribution of total workers (main and marginal) I:}y category of workers by sex' 2001
State/Union Territory/District Persons/ Total Workers Percentage to Total Workers (Main + Marginal) Males/ (Main + Cultivators Agricultural Workers'in Household Other Workers
Females Marginal) Labourers Industry 1 3 2 4 5 6 7
UTTARANCHAL P 3133281 49.77 8.26 2.23 39.74
M 2005858 IQ 34.20 9.51 2.14 54.15
F 1127423 77.48 6.02 2.40 14.10
UTTARKASHJ P 135682 75.10 1.91 1.4-2 21.57
M 73345 61.86 1.93 1.48 34.73
F 62337 90.67 1.88 1.35 6.10
CHAMOLI P 160119 64.'36 1.38 1.82 32.44
M 79356 46.23 1.39 1.75 50.63
F 80763 82.17 1.37 1.89 14.57
RUDRAPRAYAG P 100932 75.78 0.53 0.92 22.77
M 47775 55.26 0.57 1.54 42.63
F 53157 94.22 0.50 0.35 4.93
TEHRI GARHWAL P 265466 69.85 1.20 0.85 28.10
M 133366 47.49 1.35 1.27 49.89
F 132100 92.42 1.05 0.43 6.10
DEHRADUN P 400233 18.64 7.01 2.22 72.13
M 326350 13.95 6.12 1.86 78.07
F 73883 39:34 10.91 3.82 45.93
GARHWAL P 270398 67.06 1.55 1.15 30.24
.M 135220 44.46 '1.77 1.82 51.95
F 135178 89.68 1.33 0.47 8.52
PITHORAGARH - P 198667 67.70 1.17 3.86 27.27
M 98846 47.58 1.24 3.37 '47,81
F 99821 87.61 1.09 4.36 6.94
BAGESHWAR P 118915 74.67 3.07 1.88 20.38
M 53430 54.69 3.01 2.49 39.81
F 65485 90.97 3.12 1.39 4.52 -
ALMORA P 293272 74.77 1.38 1.18 22.67
M 131239 53.25 1.35 2.07 43.33
F 162033 92.21 1.41 0.46 5.92
CHAMPAWAT p 90180 69.91 2.01 1.61 26.47
M 48296 51.92 2.22 2.02 43.84
F 41884 90.65 1.78 1.15 6.42
NAINITAL P 279872 42.03 8.60 1.85 47.52
M 193889 31.50 7.35 1.44 59.71
F 85983 65.78 ,11.44 2.78 20.00
UDHAM SINGH NAGAR P 393348 29.72 25.63 3.30- 41.35
M 315079 28.09 23.70 , 2.67 45.54
F 78269 36.28 33.42 5.83 24.47
HARDWAR P 426197 22.63 ,
19.06 3.98 54.33
M 369667 23:72 18.74 2.70 54.84 -F 56530 15-53 21.14 12.39 50.94 ,
,
4S 1574 RG1I2003--S
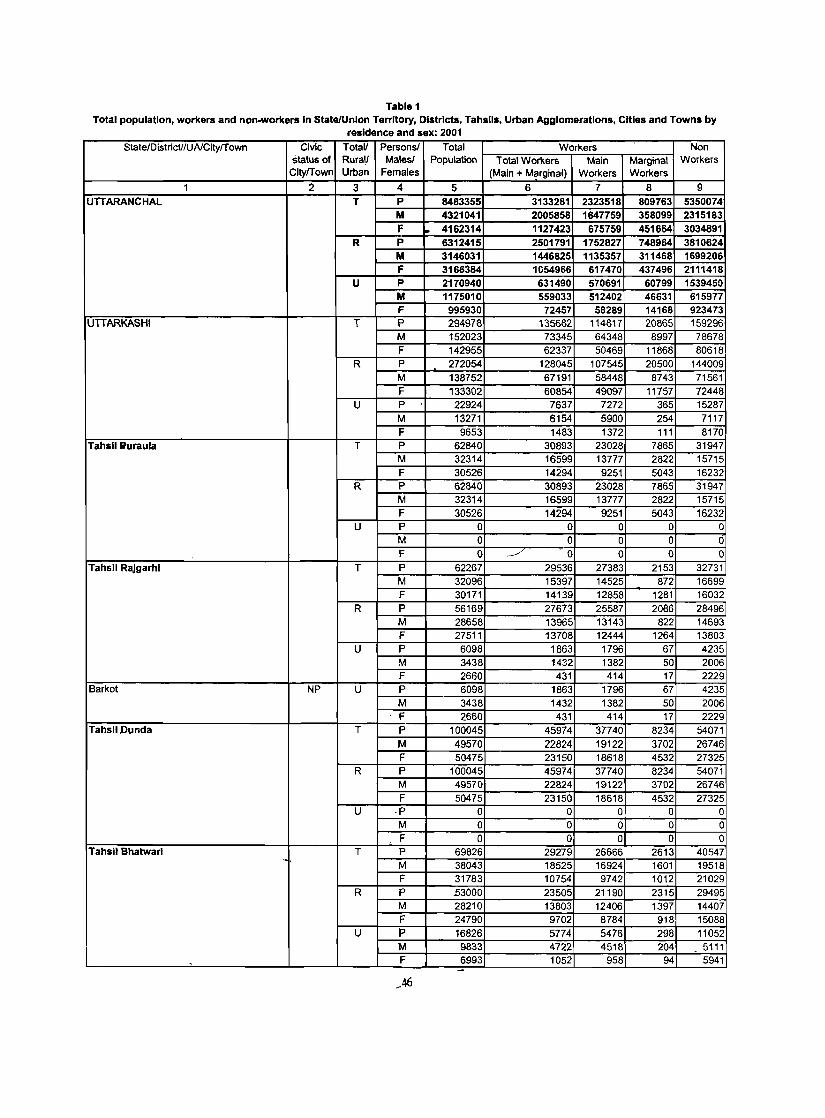
Table 1 Total population, workers and non-workers In StatefUnlon Territory, Districts, Tahslls, Urban Agglomerations, Cities and Towns by
residence and sex: 2001 State/Districtl/UNCitylTown Civic Totall Personsl Total Workers Non
status of Rural! Malesl Population Total Workers Main Marginal Workers CitylTown Urban Females (Main + Marginal) Workers Workers
1 2 3 4 5 6 7 8 9 UTIARANCHAL T P 8483355 3133281 2323518 809763 5350074
M 4321041 2005858 1647759 358099 2315183 F 4162314 1127423 675759 451664 3034891
R p 6312415 2501791 1752827 748964 3810624 M 3146031 1446825 1135357 311468 1699206 F 3166384 1054966 617470 437496 2111418
U P 2170940 631490 570691 60799 1539450 M 1175010 559033 512402 46631 615977 F 995930 72457 58289 14168 923473
UTTARKASHI T P 294978 135682 114817 20865 159296 M 152023 73345 64348 8997 78678 F 142955 62337 50469 11868 80618
R P 272054 128045 107545 20500 144009 M 138752 67191 58448 8743 71561 F 133302 60854 49097 11757 72448
U P 22924 7637 7272 365 15287 M 13271 6154 5900 254 7117 F 9653 1483 1372 111 8170
Tahsil Wuraula T P 62840 30893 23028 7865 31947 M 32314 16599 13777 2822 15715 F 30526 14294 9251 5043 16232
R P 62840 30893 23028 7865 31947 M 32314 16599 13777 2822 15715 F 30526 14294 9251 5043 16232
U P 0 0 0 0 0 M 0 0 0 0 0 F 0 _./ ~O 0 0 0
Tahsil Rajgarhl T P 62267 29536 27383 2153 32731 M 32096 15397 14525 872 16699 F 30171 14139 12858 1281 16032
R P 56169 27673 25587 2086 28496 M 28658 13965 13143 822 14693 F 27511 13708 12444 1264 13803
U P 6098 1863 1796 67 4235 M 3438 1432 1382 50 2006 F 2660 431 414 17 2229
Barkot NP U P 6098 1863 1796 67 4235 M 3438 1432 1382 50 2006 F 2660 431 414 17 2229
Tahsil,Dunda T P 100045 45974 37740 8234 54071 M 49570 22824 19122 3702 26746 F 50475 23150 18618 4532 27325
R P 100045 45974 37740 8234 54071 M 49570 22824 19122 3702 26746 F 50475 23150 18618 4532 27325
U -p 0 0 0 0 0 M 0 0 0 0 0 F 0 0 0 0 0
Tahsil Bhatwarl T P 69826 29279 26666 2613 40547 M 38043 18525 16924 1601 19518 F 31783 10754 9742 1012 21029
R P .53000 23505 21190 2315 29495 M 28210 13803 12406 1397 14407 F 24790 9702 8784 918 15088
U P 16826 5774 5476 298 11052 M 9833 4722 4518 204 5111
, F 6993 1052 958 94 5941 -
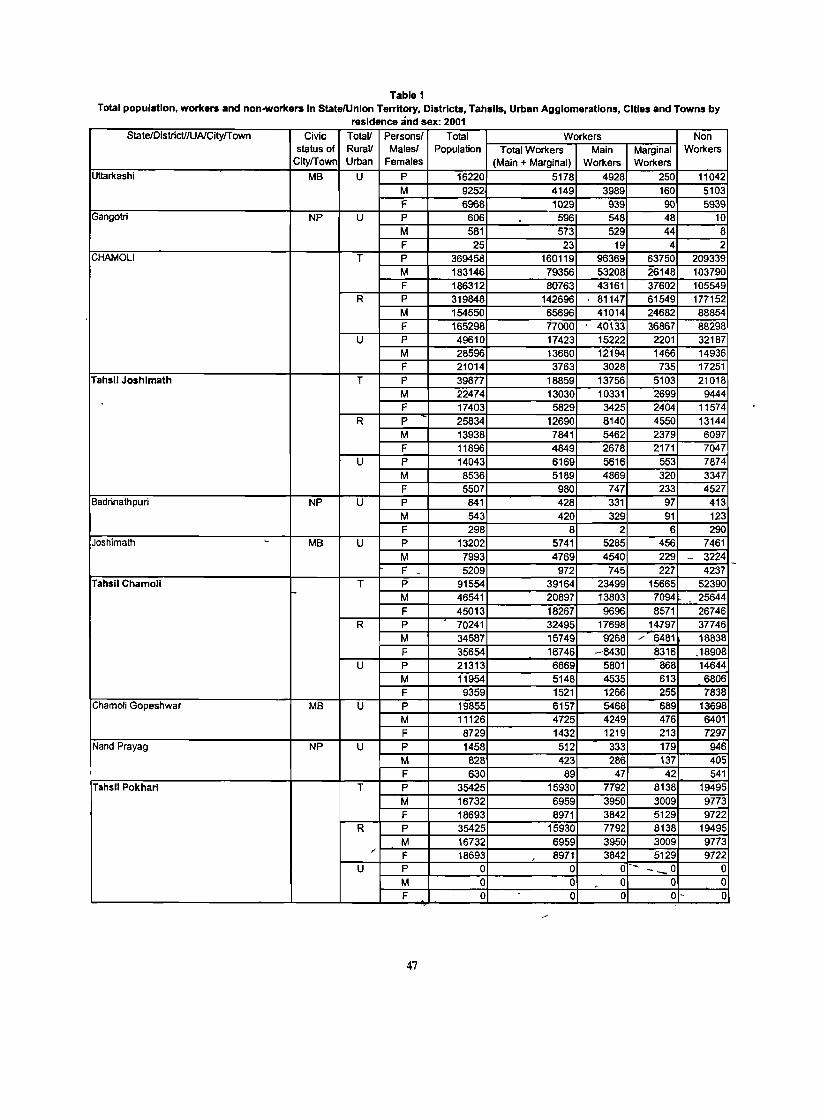
Table 1 Total population. workers and non-workers In StatefUnlon Territory, Districts, Tahslls, Urban Agglomerations, Cities and Towns by
residence and sex: 2001
StatefDistrictlfUAlCityfT own Civic TotaU Persons! Total Workers Non status of RuraU Malesf Population Total Workers Main Marginal Workers
CityfTown Urban Females (Main + Marginal) Workers Workers Ultarkashi MB U P 16220 5178 4928 250 11042
M 9252 4149 3989 160 5103 F 6968 1029 939 90 5939
Gangotri NP U P 606 596 548 48 10 M 581 573 529 44 8 F 25 23 19 4 2
CHAMOLI T P 369458 160119 96369 63750 209339 M 183146 79356 53208 26148 103790 F 186312 80763 43161 37602 105549
R P 319848 142696 81147 61549 177152 M 154550 65696 41014 24682 88854 F 165298 77000 40133 36867 88298
U P 49610 17423 15222 2201 32187 M 28596 13660 12194 1466 14936 F 21014 3763 3028 735 17251
Tahsil Joshlmath T P 39877 18859 13756 5103 21018 M 22474 13030 10331 2699 9444 F 17403 5829 3425 2404 11574
R P 25834 12690 8140 4550 13144 M 13938 7841 5462 2379 6097 F 11896 4849 2678 2171 7047
U P 14043 6169 5616 553 7874 M 8536 5189 4869 320 3347 F 5507 980 747 233 4527
Badrinathpuri NP U P 841 428 331 97 413 M 543 420 329 91 123 F 298 8 2 6 290
Joshimath - MB U P 13202 5741 5285 456 7461 M 7993 4769 4540 229 _ 3224 F _ 5209 972 745 227 4237
Tahsil Chamoll T P 91554 39164 23499 15665 52390 M 46541 20897 13803 7094 25644 -F 45013 18267 9696 8571 26746
R P 70241 32495 17698 14197 37746 M 34587 15749 9268 / 6481 18838 F 35654 16746 -8430 8316 ,18908
U P 21313 6669 5801 868 14644 M 11954 5148 4535 613 6806 F 9359 1521 1266 255 7838
Chamoli Gopeshwar MB U P 19855 6157 5468 689 13698 M 11126 4725 4249 476 6401 F 8729 1432 1219 213 7297
Nand Prayag NP U P 1458 512 333 179 946 M 828 423 286 137 405 F 630 89 47 42 541
Tahsil Pokharl T P 35425 15930 7792 8138 19495 M 16732 6959 3950 3009 9773 F 18693 8971 3842 5129 9722
R P 35425 15930 7792 8138 19495 M 16732 6959 3950 3009 9713
,-F 18693 8971 3842 5129 9722 ,
U P 0 0 0-- - __ 0 0 M 0 0 0 0 0 F 0 0 0 0- 0
47
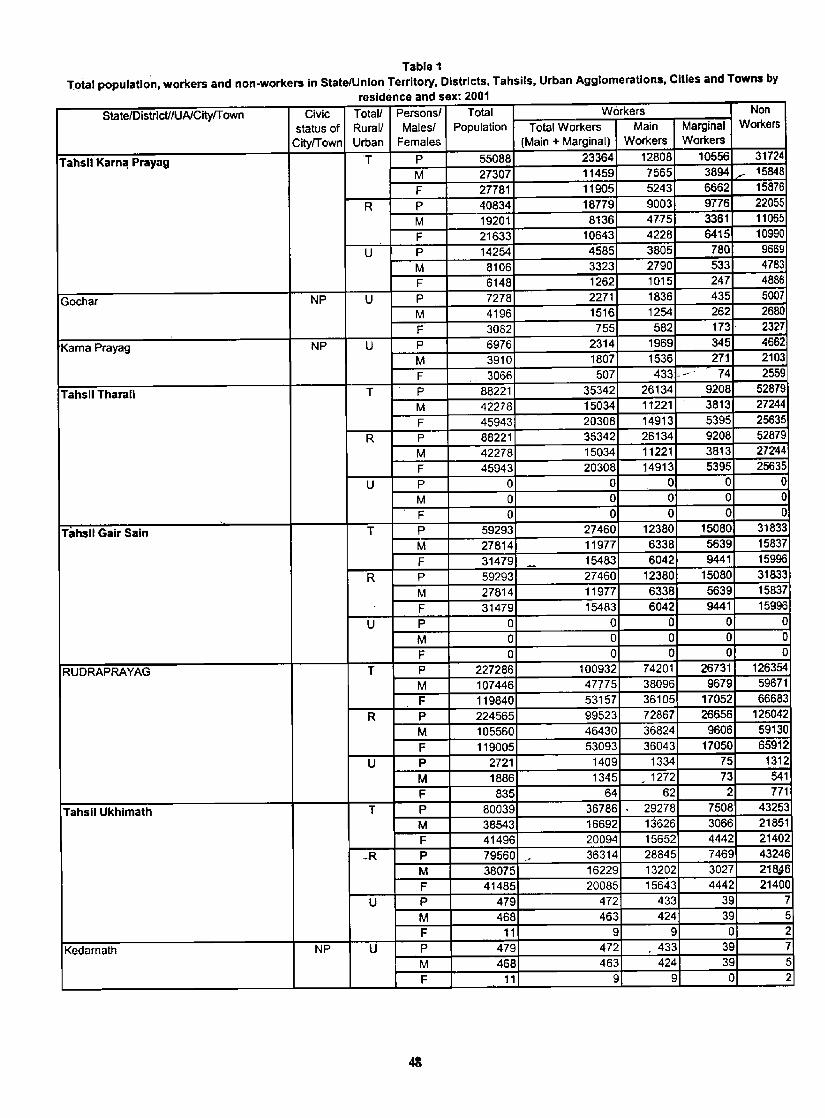
Table 1 Total population, workers and non-workers in State/Union Territory, Districts, Tahsils, Urban Agglomerations, CIties and Towns by
residence and sex: 2001
State/Districtl/UAICityfT own Civic Totall Personsl Total Workers Non
status of Rural! Matesl Population Total Workers Main Marginal Workers
CitylTown Urban Females (Main + Marginal) Workers Workers
Tahsil Karn~ Prayag T P 55088 23364 12808 10556 31724
M 27307 11459 7565 3894 /' 15848
F 27781 11905 5243 6662 15876
R P 40834 18779 9003 9776 22055
M 19201 8136 4775 3361 11065
F 21633 10643 4228 6415 10990
U P 14254 4585 3805 780 9669
M 8106 3323 2790 533 4783
F 6148 1262 1015 247 4886
Gochar NP U P 7278 2271 1836 435 5007
M 4196 1516 1254 262 2680
F 3082 755 582 173· 2327
Kama Prayag NP U P 6976 2314 1969 345 4662
M 3910 1807 1536 271 2103
F 3066 507 433 ,..-"' 74 2559
Tahsil Tharall T P 88221 35342 26134 9208 52879
M 42278 15034 11221 3813 27244
F 45943 20308 14913 5395 25635
R P 88221 35342 26134 9208 52879
M 42278 15034 11221 3813 27Z44
F 45943 20308 14913 5395 25635
U P 0 0 0 0 0
M 0 0 0 0 0 F 0 0 0 0 0
Tahsil Galr Sa In T P 59293 27460 12380 15080 31833 M 27814 11977 6338 5639 15837 F 31479 15483 6042 9441 15996
R P 59293 27460 12380 15080 31833 M 27814 11977 6338 5639 15837 F 31479 15483 6042 9441 15996
U P 0 0 0 0 0 M 0 0 0 0 0 F 0 0 0 0 0
RUDRAPRAYAG T P 227286 100932 74201 26731 126354
M 107446 47775 38096 9679 59671 F 119840 53157 36105 17052 66683
R P 224565 99523 72867 26656 125042 M 105560 46430 36824 9606 59130 F 119005 53093 36043 17050 65912
U P 2721 1409 1334 75 1312
M 1886 1345 - 1272 73 541 F 835 64 62 2 771
Tahsil Ukhlmath T p 80039 36786 29278 7508 43253 M 38543 16692 13626 3066 21851 F 41496 20094 15652 4442 21402
_R P 79560 ~ 36314 28845 7469 43246
M 38075 16229 13202 3027 21~6
F 41485 20085 15643 4442 21400 U P 479 472 433 39 7
M 468 463 424 39 5
F 11 9 9 0 2
Kedarnath NP U P 479 472 . 433 39 7
M 468 463 424 39 5 F 11 9 9 0 2
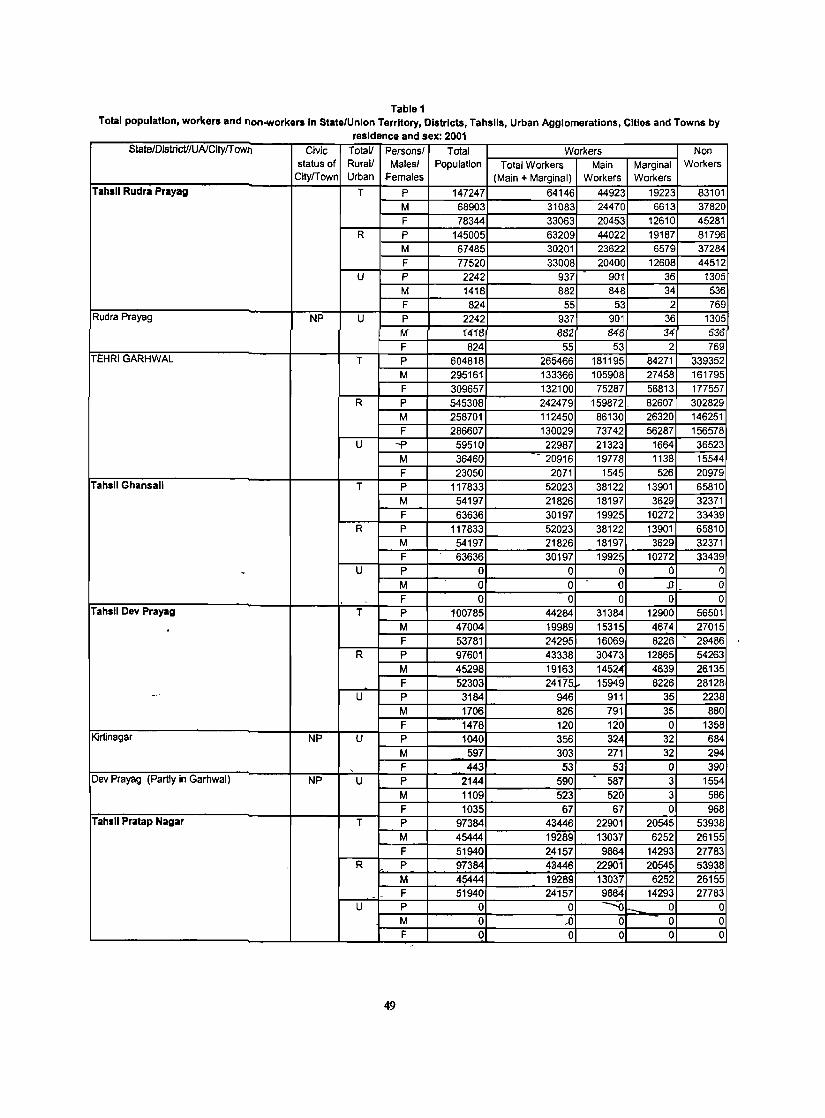
Table 1 Total population, workers and non-workers In State/Union Territory, Districts, Tahslls, Urban Agglomerations, Cltlos and Towns by
residence and sex' 2001 StateJDistrictl!UAlCityfT OWl') Civic Totall Persons! Total Workers Non
status of Rural! Males! Population Total Workers Main Marginal Workers CityfTown Urban -Females (Main + Marginal) Workers Workers
Tahsil Rudra Prayag T P 147247 64146 44923 19223 83101 M 68903 31083 24470 6613 37820 F 78344 33063 20453 12610 45281
R P 145005 63209 44022 19187 81796 M 67485 30201 23622 6579 37284 F 77520 33008 20400 12608 44512
U P 2242 937 901 36 1305 M 1418 882 848 34 536 F 824 55 53 2 769
Rudra Prayag NP U P 2242 937 901 36 1305 M 1'41'8 682 848 34 536 F 824 55 53 2 769
TEHRI GARHWAL T P 604818 265466 181195 84271 339352 M 295161 133366 105908 27458 161795 F 309657 132100 75287 56813 177557
R P 545308 242479 159872 . 82607 302829 M 258701 112450 86130 26320 146251 F 286607 130029 73742 56287 156578
U -.p 59510 22987 21323 1664 36523 M 36460 - 20916 19778 1138 15544 F 23050 2071 1545 526 20979
Tahsil Ghansall T P 117833 52023 38122 13901 65810 M 54197 21826 18197 3629 32371 F 63636 30197 19925 10272 33439
R P 117833 52023 38122 13901 65810 M 54197 21826 18197 3629 32371 F 63636 30197 19925 10272 33439
- U P 0 0 0 0 I)
M 0 0 - 0 ..D 0 -- F 0 0 0 0 0
Tahsil Dev Prayag T P 100785 44284 31384 12900 56501 M 47004 19989 15315 4674 27015 F 53781 24295 16069 8226 - 29486
R P 97601 43338 30473 12865 54263 M 45298 19163 1452-4 4639 26135 F 52303 24175 15949 8226 28128
- U P 3184 946 911 35 2238 M 1706 826 791 35 880 F 1478 120 120 0 1358
Kirtinagar NP U P 1040 356 324 32 684 M 597 303 271 32 294 F 443 53 53 0 390
Dev Prayag (Partly in Garhwal) NP U P 2144 590 .
587 3 1554 M 1109 523 520 3 586 F 1035 67 67 0 968
Tahsil Pratap Nagar T P 97384 43446 22901 20545 53938 M 45444 19289 13037 6252 26155 F 51940 24157 9864 14293 27783
R P 97384 43446 22901 20545 53938 M 4~44 19289 13037 6252 26155
.. F 51940 24157 9864 14293 27783 U P 0 0 ~ r-.. 0 0
M 0 ,-{) 0 0 0 F 0 0 0 0 0 .
49
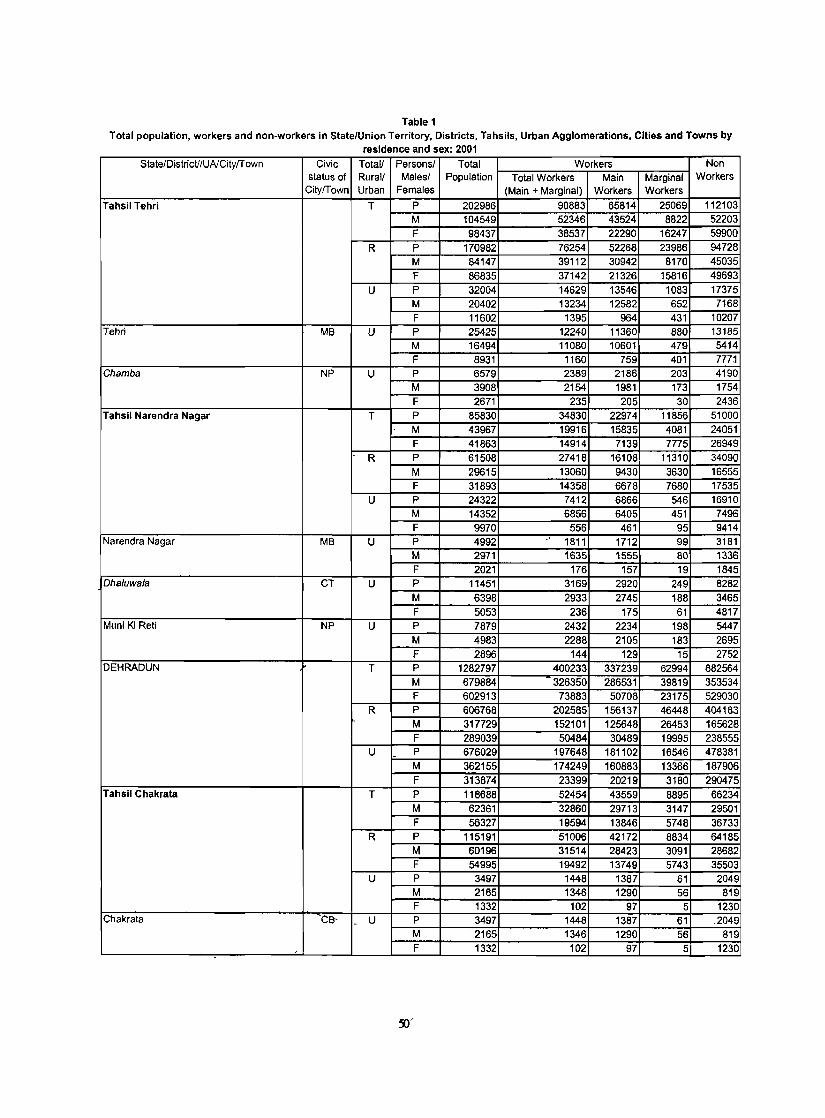
Table 1 Total population, workers and non-workers in State/Union Territory, Districts, Tahsils, Urban Agglomerations, Cities and Towns by
residence and sex: 2001
State/DistrictllUAlCitylT own Civic Totall Personsl Total Workers Non status of Rurall Malesl Population Total Workers Main Marginal Workers
CitylTown Urban Females (Main + Marginal) Workers Workers
Tahsil Tehri T P 202986 90883 65814 25069 112103 M 104549 52346 43524 8822 52203 F 98437 38537 22290 16247 59900
R P 170982 76254 52268 23986 94728 M 84147 39112 30942 8170 45035 F 86835 37142 21326 15816 49693
U P 32004 14629 13546 1083 17375 M 20402 13234 12582 652 7168 F 11602 1395 964 431 10207
Tehr; MB U P 25425 12240 11360 880 13185 M 16494 11080 10601 479 5414 F 8931 1160 759 401 7771
Chamba NP U P 6579 2389 2186 203 4190 M 3908 2154 1981 173 1754 F 2671 235 205 30 2436
Tahsil Narendra Nagar T P 85830 34830 22974 11856 51000 M 43967 19916 15835 4081 24051 F 41863 14914 7139 7775 26949
R P 61508 27418 16108 11310 34090 M 29615 13060 9430 3630 16555 F 31893 14358 6678 7680 17535
U P 24322 7412 6866 546 16910 M 14352 6856 6405 451 7496 F 9970 556 461 95 9414
Narendra Nagar MB U P 4992 1811 1712 99 3181 M 2971 1635 1555 80 1336 F 2021 176 157 19 1845
Dhaluwala Ci U P 11451 3169 2920 249 8282 M 6398 2933 2745 188 3465 F 5053 236 175 61 4817
Muni Ki Ret; NP U P 7879 2432 2234 198 5447 M 4983 2288 2105 183 2695 F 2896 144 129 15 2752
DEHRADUN T P 1282797 400233 337239 62994 882564 M 679884 326350 286531 39819 353534 F 602913 73883 50708 23175 529030
R P 606768 202585 156137 46448 404183 M 317729 152101 125648 26453 165628 F 289039 50484 30489 19995 238555
U - P 676029 197648 181102 16546 478381 M 362155 174249 160883 13366 187906 F 313874 23399 20219 3180 290475
Tahsil Chakrata T P 118688 52454 43559 8895 66234 M 62361 32860 29713 3147 29501 F 56327 19594 13846 5748 36733
R P 115191 51006 42172 8834 64185 M 60196 31514 28423 3091 28682 F 54995 19492 13749 5743 35503
U P 3497 1448 1387 61 2049 M 2165 1346 1290 56 819 F 1332 102 97 5 1230
Chakrata Ca- - U P 3497 1448 1387 61 .2049 M 2165 1346 1290 56 819 F 1332 102 97 5 1230

Table 1 Total population, workers and non-workers In StatelUnlon Territory, Districts, T.ahslls, Urban Agglomerations, Cities and Towns by
residence and sex: 2001 State!Districtl!UAlCitylTown Civic Totat! Persons! Total Wor~rs Non
status of Rurat! Males! Population Total Workers Main Marginal Workers CitylTown Urban Females (Main + Marginal) Workers Workers
. Tahsil Vlkasnagar T P 232149 75694 56660 19034 156455
M 121668 59033 47985 11048 62635 F 110481 16661 8675 7986 93820
R P 210422 69445 51505 17940 140977 M 110231 53476 _43292 10184 56755 F 100191 15969 8213 7756 84222
U P 21727 6249 5155 1094 15478 M 11437 5557 4693 864 5880 F 10290 692 462 230 9598
Vika~nagar MB U P 12485 3803 2911 892 8682 M 6571 3390 2672 718 3181 F 5914 413 239 174 5501
Herbertpur NP U P 9242 2446 2244 202 6796 M 4866 2167 2021 146 2699 F 4376 279 223 56 4097
Tahsil Dehradun T P 741126 217018 192256 24762 524108 M 394562 187646 168606 19240 206716 F 346564 .29172 23650 5522 317392
R P 174923 . 50145 38834 11311 124778 M 91432 41397 33080 8317 50035 F 83491 8748 5754 2994 74743
U P 561525 167246 153790 13456 400279 ·M 303912 146814 135888 10926 157098 F 263613 20432 17902 2530 243181
Dehradun UA U P 530159 155587 142987 12600 374572 M 283050 136436 126257 10179 146614 - F 241109 19151 .16730 2421 227958
(a) Dehradun M.Corp. U P 425790 121263 110761 10502 -304527 M 224045 104727 96275 8452 119318 F 201745 16536 14486 2050 185209
(b) FRI and College Area CT U P 5428 1509 1439 fO 3919 M 2861 1314 1249 65 1547
, F 2567 195 190 .- 5 2372 (c) Dehradun CB U P 54399 19588 18758 830 34811
M 31785 18270 - 17595 675 13515 F 22614 1318 1163 155 21296
(d) Clement Tpwn CB U P 19634 6810 6448 362 12824 M 11470 6486 6171 315 4984 F 8164 324 277 47 7840
(e) Raipur CT U P 24908 6417 5581 836 18491 M 12889 - 5639 4967 672 7250 F 12019 -778 614 164 11241
Mussoori UA U P 29319 9438 9105 333 19881 M 16523 8353 8087 266 8170 F 12796 1085 1018 67 11711
(a) Mussoori MB U P 26069 8392 8061 331 17677 M 14726 7414 7149 265 7312 F . 11343 978 912 66 10365
(b) Landour CB U P 3250 1046 1044 2 2204 - M 1797 939 938 1 858
F 1453 107 106 -_1 1346 Doiwaia NP U P 8047 2221 1698 523 5826
M..- 4339 2025 1544 481 2314 F 3708 ,. 196 154 42 3512
51
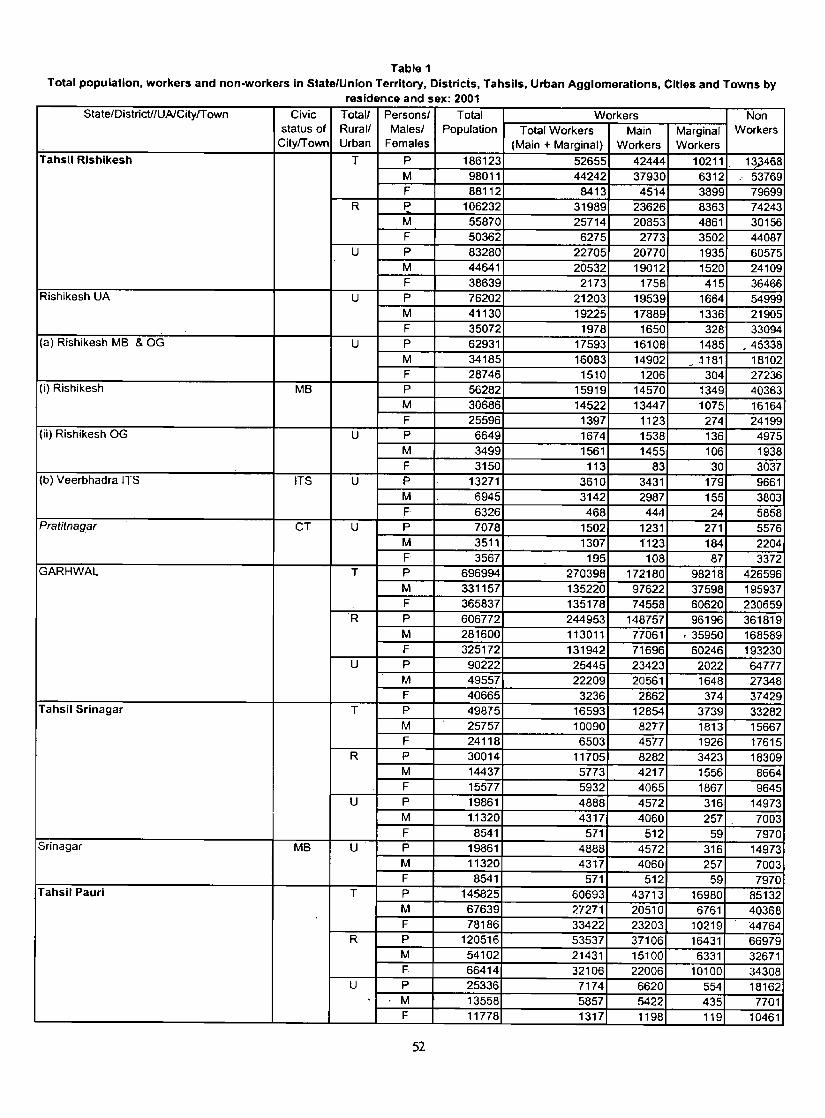
Table 1 Total population, workers and non-workers in State/Union Territory, Districts, Tahsils, Urban Agglomerations, CIties and Towns by
residence and sex; 2001 State/DistricUlUAICityfTown Civic Totall Persons/ Total Workers Non
status of Rural! Males! Population Total Workers Main Marginal Workers CityfTown Urban Females (Main + Marginal) Workers Workers
Tahsil Rishikesh T P 186123 52655 42444 10211 13;3468 M 98011 44242 37930 6312 53769 F 88112 8413 4514 3899 79699
R P 106232 31989 23626 8363 74243 M 55870 25714 20853 4861 30156 F 50362 6275 2773 3502 44087
U P 83280 22705 20770 1935 60575 M 44641 20532 19012 1520 24109 F 38639 2173 1758 415 36466
Rishikesh UA U P 76202 21203 19539 1664 54999 M 41130 19225 17889 1336 21905 F 35072 1978 1650 328 33094
(a) Rishikesh MB & OG U P 62931 17593 16108 1485 ,45338 M 34185 16083 14902 ~181 - 18102 F 28746 1510 1206 304 27236
(i) Rishikesh MB p 56282 15919 14570 1349 40363 M 30686 14522 13447 1075 1"6164 F 25596 1397 1123 274 24199
(ii) Rishikesh OG U P 6649 1674 1538 136 4975 M 3499 1561 1455 106 1938 F 3150 113 83 30 3037
(b) Veerbhadra ITS ITS U P 13271 3610 3431 179 9661 M 6945 3142 2987 155 3803 F 6326 468 444 24 5858
Pratitnagar CT U P 7078 1502 1231 271 5576 M 3511 1307 1"123 184 2204 F 3567 195 108 87 3372
GARHWAL T P 696994 270398 172180 98218 426596 M 331157 135220 97622 37598 195937 F 365837 135178 74558 60620 230659
R P 606772 244953 148757 96196 361819 M 281600 113011 77061 ' 35950 168589 F 325172 131942 71696 60246 193230
U P 90222 25445 23423 2022 64777 M 49557 22209 20561 1648 27348 F 40665 3236 2862 374 37429
Tahsil Sri nagar T P 49875 16593 12854 3739 33282 M 25757 10090 8277 1813 15667 F 24118 6503 4577 1926 17615
R P 30014 11705 8282 3423 18309 M 14437 5773 4217 1556 8664 F 15577 5932 4065 1867 9645
U P 19861 4888 4572 316 14973 M 11320 4317 4060 257 7003 F 8541 571 512 59 7970
Srinagar MB U P 19861 4888 4572 316 14973 M 11320 4317 4060 257 7003 F 8541 571 512 59 7970
Tahsil Pauri T P 145825 60693 43713 16980 85132 M 67639 27271 20510 6761 40368 F 78186 33422 23203 10219 44764
R P 120516 53537 37106 16431 66979 M 54102 21431 15100 6331 32671 F 66414 32106 22006 10100 34308
U P 25336 7174 6620 554 18162 M 13558 5857 5422 435 7701 F 11778 1317 1198 119 10461
52
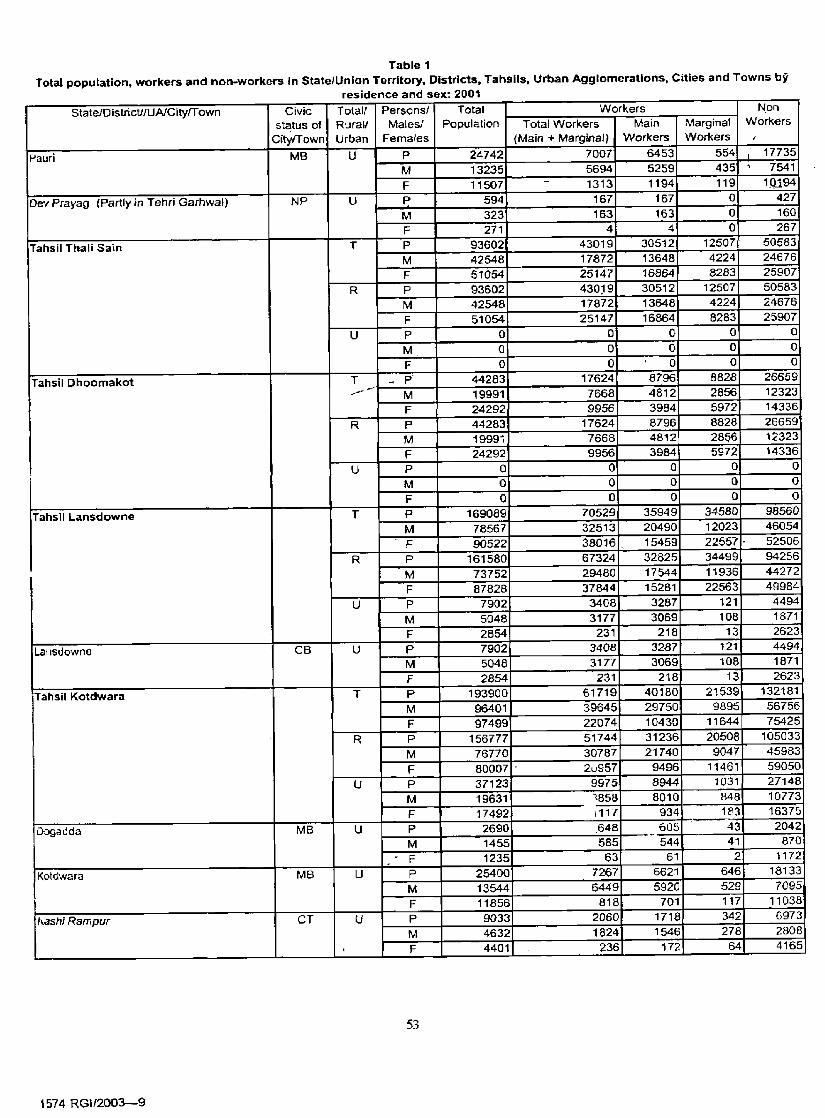
Table 1 Total population, workers and non*workers In StatelUnion Territory. Districts, Tahsils, Urban Agglomerations, Cities and Towns by
residence and sex: 2001
State/DistrictllUAJCityfTown Civic Total! Personsl Total Workers N,on
status of Rurall Malesl Population Total Workers Main Marginal Workers
CitylTown Urban Females (Main -+ Marginal) Workers Workers i
f'auri MB U P 24742 7007 6453 554 I 17735
M 13235 5694 5259 435 ; 7541
F 11507 1313 1194 119 1.Q.194
Dev Prayag (Partly in Tehri Garhwaf) NP U ~ 594 167 167 0 427
M 323 163 163 0 160
F 271 4 4 0 267
Tahsil Thall Sain T p 93602 43019 30512 12507 50583
M 42548 17872 13648 4224 24676
F 51054 25147 16864 8283 25907
R P 93602 430,9 30512 12507 50583
M 42548 17872 13648 4224 24676
F 51054 25147 16864 8283 25907
U P {) 0 0 0 0
M 0 0 0 0 0
F 0 0 0 0 0
Tahsil Ohoomakot T ~ P 44283 17624 8796 8828 26659
. --- ~ . 19991 7668 4812 2856 12323 M F 24292 9956 3984 5972 1433.6
R P 44283 17624 8796 8828 26659
M 19991 7668 4812 2896 12323
F 24292 9956 3984 5972 14336
U P 0 0 0 0 0
M 0 0 0 0 0
F a 0 0 0 0
Tahsil Lansdowne T P 169089 70529 35949 34580 98560
M 78567 32513 20490 12023 46054
F 90522 38016 15459 22557· 52506
R P 161580 67324 32825 34499 94256
M 73752 29480 17544 11936 44272
F 87828 37844 15281 22563 49984
U P 7902 3408 3287 121 4494
M 5048 3177 3069 108 1871
F 2854 231 218 13 2623
Lallsdowne CB U P 7902 3408 3287 121 4494
M 5048 3177 3069 108 1871
F 2854 231 218 13 2623
Tahsil Kotdwara T p 193900 61719 40180 21539 132181
M 96401 39645 29750 9895 56756
F 97499 22074 10430 11644 75425
R P 156777 51744 31236 20508 105033
M 76770 30787 21740 9047 45983
F 80007 . 2u957 9496 11461 59050
U P 37123 9975 8944 1031 27148
M 19631 1858 8010 848 10773
F 17492 ;117 934 183 16375
Dogadda ~-43 MB U P 2690 .648 605 2042
M 1455 585 544 41 870 . F 1235 63 61 2 1172 .
Kotdwara MB U P 25400 7267 6621 646 18133
M 13544 6449 5920 529 7095
I F 11856 818 701 117 11038
has hi Rampur CT U P 9033 2060 1718 342 6973
M 4632 1824 1546 278 2808
F 4401 236 172 64 4165
53
1574 RG1f2003-9
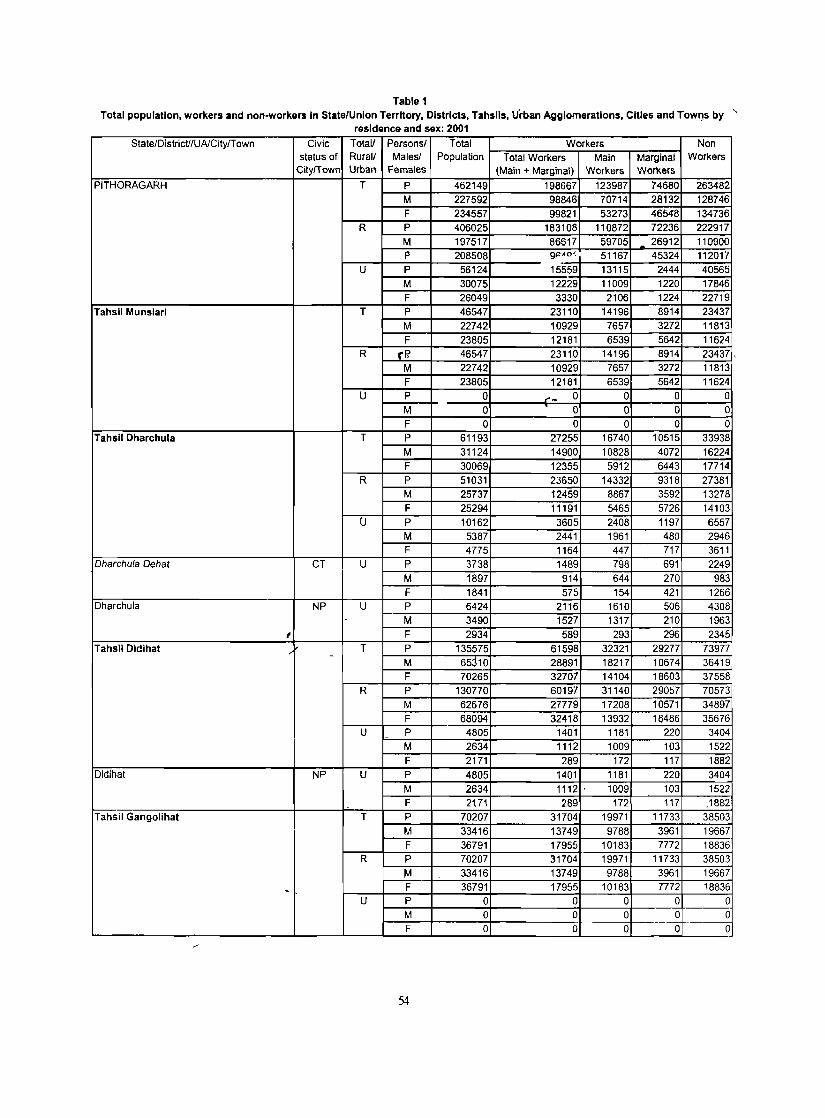
Table 1 Total population, workers and non-workers In StatelUnlon Territory, Districts, Tahsils, Urban Agglomerations, Cities and TowlJS by "
residence and sex: 2001
State/DistricU/UAlCitylT own Civic Total! Persons! Total Workers Non status of Rural! Males! Population Total Workers Main Marginal Workers
CitylTown Urban Females (Main + Marginal) Workers Workers
PITHORAGARH T P 462149 198667 123987 74680 263482 M 227592 98846 70714 28132 128746 F 234557 99821 53273 46548 134736
R P 406025 183108 110872 72236 222917 M 197517 86517 59705 26912 110900 P 208508 9"'AO~ 51167 45324 112017
U P 56124 15559 13115 2444 40565 M 30075 12229 11009 1220 17846 F 26049 3330 2106 1224 22719
Tahsil Munsiari T P 46547 23110 14196 8914 23437 M 22742 10929 7657 3272 11813 F 23805 12181 6539 5642 11624
R C'I? 46547 23110 14196 8914 23437, M 22742 10929 7657 3272 11813 F 23805 12181 6539 5642 11624
U P 0 .. ~ 0 0 0 0 M 0 0 0 0 0 F 0 0 0 0 0
Tahsil Dharchula T P 61193 27255 16740 10515 33938 M 31124 14900 10828 4072 16224 F 30069 12355 5912 6443 17714
R P 51031 23650 14332 9318 27381 M 25737 12459 8867 3592 13278 F 25294 11191 5465 5726 14103
U P 10162 3605 2408 1197 6557 M 5387 2441 1961 480 2946 F 4775 1164 447 717 3611
Oharchula Oehal CT U P 3738 1489 798 691 2249 M 1897 914 644 270 983 F 1841 575 154 421 1266
Dharchula NP U P 6424 2116 1610 506 4308 - M 3490 1527 1317 210 1963
I F 2934 589 293 296 2345 Tahsil Dic:!ihat T P 135575 61598 32321 29277 73977 -
M 65310 28891 18217 10674 36419 F 70265 32707 14104 18603 37558
R P 130770 60197 31140 29057 70573 M 62676 27779 17208 10571 34897 F 68094 32418 13932 18486 35676
U P 4805 1401 1181 220 3404 -M 2634 1112 1009 103 1522 F 2171 289 172 117 1882
Didihat NP U P 4805 1401 1181 220 3404 M 2634 1112 . 1009 103 1522 F 2171 289 172 117 J882
Tahsil Gangolihat T P 70207 31704 19971 11733 38503 M 33416 13749 9788 3961 19667 F 36791 17955 10183 7772 18836
R P 70207 31704 19971 11733 38503 M 33416 13749 9788 3961 19667
~ F 36791 17955 10183 7772 18836
U P 0 0 0 0 0 M 0 0 0 0 0 F 0 0 0 0 0
54
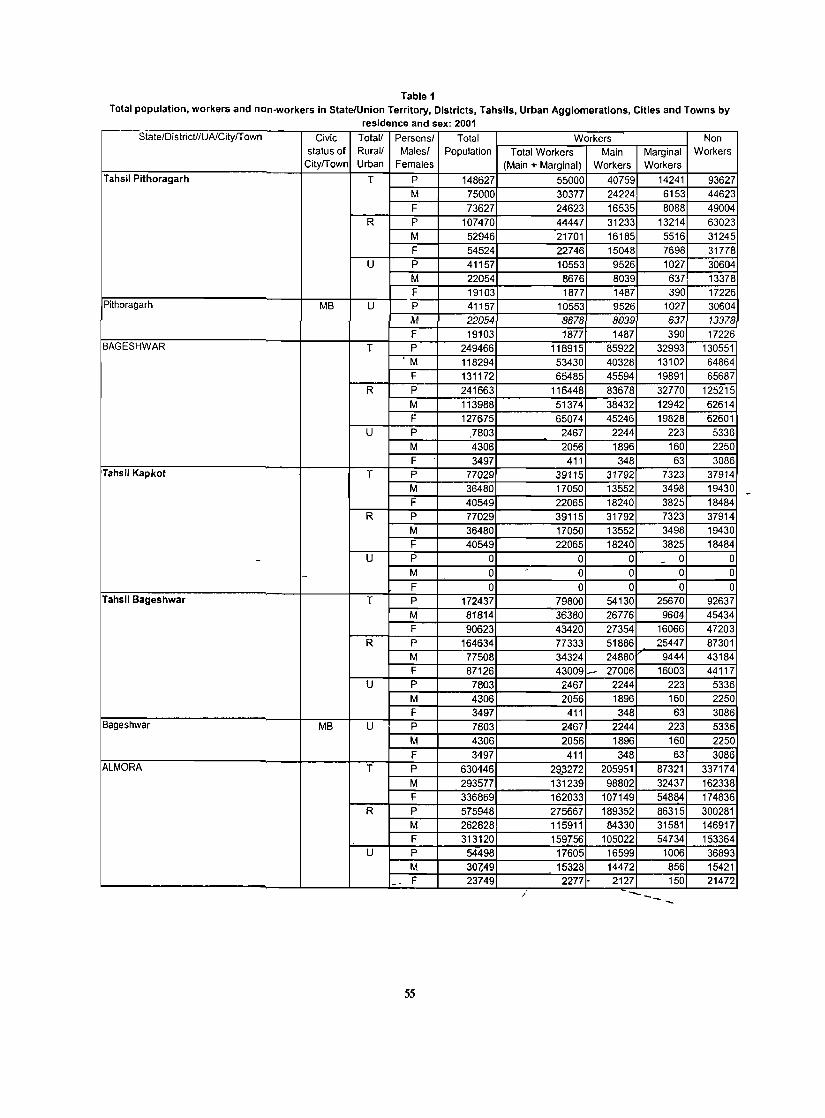
Table 1 Total population, workers and non-workers In State/Union Territory, Districts, Tahsils, Urban Agglomerations, Cities and Towns by
residence and sex' 2001 State/Dis tricUIUAlCity/T own Civic Totall Personsl Total Workers Non
status of Rurall Malesl Population Total Workers Main Marginal Workers City/Town Urban Females (Main + Marginal) Workers Workers
Tahsil Pithoragarh T P 148627 55000 40759 14241 93627 M 75000 30377 24224 6153 44623 F 73627 24623 16535 8088 49004
R P 107470 44447 31233 13214 63023 M 52946 21701 16185 5516 31245 F 54524 22746 15048 7698 31778
U P 41157 10553 9526 1027 30604 M 22054 8676 8039 637 13378 F 19103 1877 1487 390 17226
Pithoragarh MB U P 41157 10553 9526 1027 30604 M 22054 8878 8039 837 13378 F 19103 1877 1487 390 17226
BAGESHWAR T P 249466 118915 85922 32993 130551 'M 118294 53430 40328 13102 64864
F 131172 65485 45594 19891 65687 R P 241663 116448 83678 32770 125215
M 113988 51374 38432 12942 62614 F 127675 65074 45246 19828 62601
U P }803 2467 2244 223 5336 M 4306 2056 1896 160 2250 F 3497 411 348 63 3086
Tahsil Kapkot T P 77029 39115 31792 7323 37914 M 36480 17050 13552 3498 19430 F 40549 22065 18240 3825 18484
R P 77029 39115 31792 7323 37914 M 36480 17050 13552 3498 19430 F 40549 22065 18240 3825 18484
- U P 0 0 0 - 0 0
- M 0 0 0 0 0 F 0 0 0 0 0
Tahsil Bageshwar T p 172437 79800 54130 25670 92637 M 81814 36380 26776 9604 45434 F 90623 43420 27354 16066 47203
R P 164634 77333 51886 25447 87301 M 77508 34324 24880 9444 43184 F 87126 43009 -- 27006 16003 44117
U P 7803 2467 2244 223 5336 M 4306 2056 1896 160 2250 F 3497 411 348 63 3086
Bageshwar MB U P 7803 2467 2244 223 5336 M 4306 2056 1896 160 2250 F 3497 411 348 63 3086
ALMORA T P 630446 29.3272 205951 87321 337174 M 293577 131239 98802 32437 162338 F 336869 162033 107149 54884 174836
R P 575948 275667 189352 86315 300281 M 262828 115911 84330 31581 146917 F 313120 159756 105022 54734 153364
U P 54498 17605 16599 1006 36893 M 307:49 15328 14472 856 15421
- F 23749 2277 • 2127 150 21472 / --... __
55
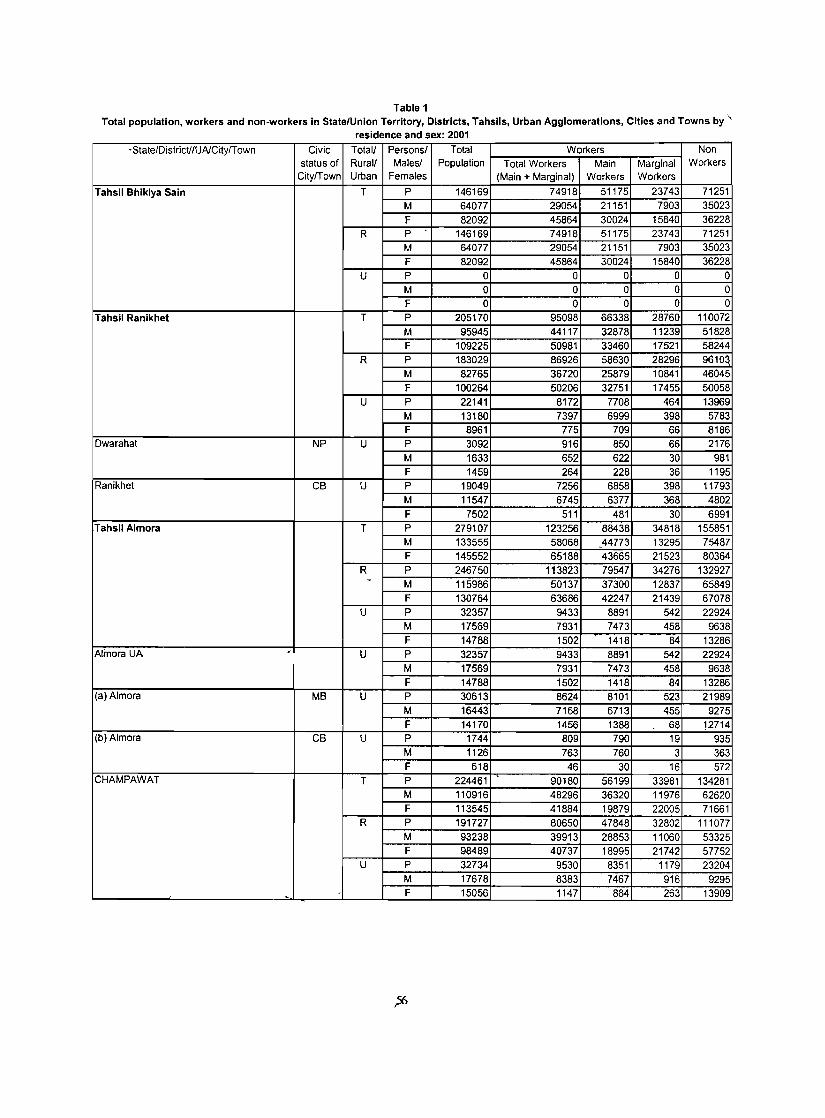
Table 1 Total population, workers and non-workers in State/Union Territory, Districts, Tahslls, Urban Agglomerations, Cities and Towns by"
residence and sex: 2001
-State/DistrictilUAICitylTown Civic Totall Personsl Total Workers Non status of Rurall Malesl Population Total Workers Main Marginal Workers
CitylTown Urban Females (Main + Marginal) Workers Workers
Tahsil Bhikiya Sain T P 146169 74918 51175 23743 71251 M 64077 29054 21151 7903 35023 F 82092 45864 30024 15840 36228
R P 146169 74918 51175 23743 71251 M 64077 29054 21151 7903 35023 F 82092 45864 30024 15840 36228
U P 0 0 0 0 0 M 0 0 0 0 0 F 0 0 0 0 0
Tahsil Ranikhet T P 205170 95098 66338 28760 110072 M 95945 44117 32878 11239 51828 F 109225 50981 33460 17521 58244
R P 183029 86926 58630 28296 96104, M 82765 36720 25879 10841 46045 F 100264 50206 32751 17455 50058
U P 22141 8172 7708 464 13969 M 13180 7397 6999 398 5783 F 8961 775 709 66 8186
Dwarahat NP U P 3092 916 850 66 2176 M 1633 652 622 30 981 F 1459 264 228 36 1195
Ranikhet CB U P 19049 7256 6858 398 11793 M 11547 6745 6377 368 4802 F 7502 511 481 30 6991
Tahsil Almora T P 279107 123256 88438 34818 155851 M 133555 58068 44773 13295 75487 -F 145552 65188 43665 21523 80364
R P 246750 113823 79547 34276 132927 - M 115986 50137 37300 12837 65849 F 130764 63686 42247 21439 67078
U P 32357 9433 8891 542 22924 M 17569 7931 7473 458 9638 F 14788 1502 1418 84 13286
Almora UA , U P 32357 9433 8891 542 22924
M 17569 7931 7473 458 9638 F 14788 1502 1418 84 13286
(a) Almora MB U P 30613 8624 8101 523 21989 M 16443 7168 6713 455 9275 F 14170 1456 1388 68 12714
(b)Almora CB U P 1744 809 790 19 935 M 1126 763 760 3 363 F 618 46 30 16 572
CHAMPAWAT T P 224461 ,
90180 56199 33981 134281 M 110916 48296 36320 11976 62620 F 113545 41884 19879 22005 71661
R P 191727 80650 47848 32802 111077 M 93238 39913 28853 11060 53325 F 98489 40737 18995 21742 57752
U P 32734 9530 8351 1179 23204 M 17678 8383 7467 916 9295
- - F 15056 1147 884 263 13909
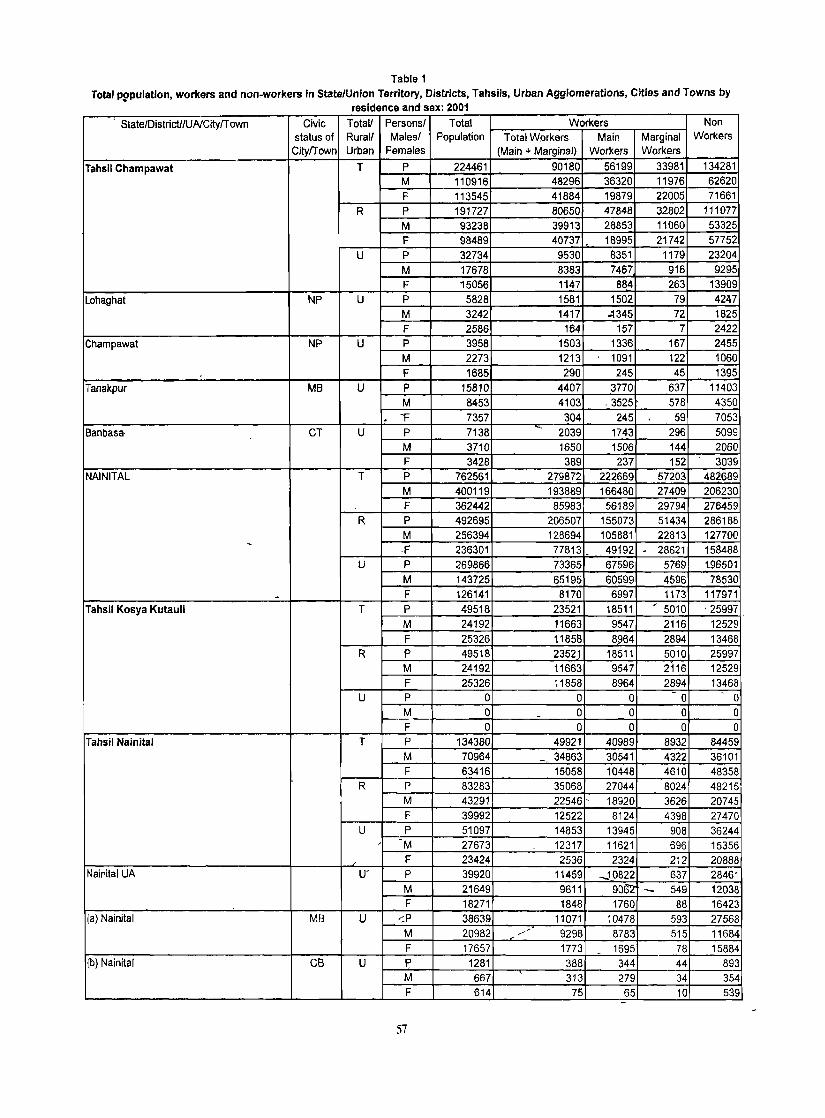
Table 1
Total p~pulation, workers and non-workers In State/Union Territory, Districts, Tahsils, Urban Agglomerations, Cities and Towns by residence and sex' 2001
State/Districtl/UNCitylT own Civic Totall Personsl Total Workers Non
status of Rurall Malesl Population Total Workers Main Marginal Workers
CitylTown Urban Females (Main + Marginal) Workers Workers
Tahsil Champawat T P 224461 90180 56199 33981 134281 -
M 110916 48296 36320 11976 62620 F 113545 41884 19879 22005 71661
R P 191727 80650 47848 32802 111077 M 93238 39913 28853 11060 53325 F 98489 40737 . 18995 21742 57752
U P 32734 9530 8351 1179 23204 M 17678 8383 7467 916 9295 F 15056 1147 884 263 13909
Lohaghat NP U P 5828 1581 1502 79 42~7
M 3242 1417 ..:1345 72 1825 F 2586 164 157 7 2422
Champawat NP U P 3958 1503 1336 167 2455 M 2273 1213 1091 122 1060 F 1685 290 245 45 1395
Tanakpur MB U P 15810 4407 3770 637 11403 M 8453 4103 .3525 578 4350
. r- 7357 304 245 59 7053 6anbasa· CT U P 7138 2039 1743 296 5099
M 3710 1650 1506 144 2060 F 3428 389 237 152 3039
NAINITAL T P 762561 279872 222669 57203 48~689 M 400119 193889 166480 27409 206230 F 362442 85983 56189 29794 276459
R P 492695 206507 155073 51434 286188 M 256394 128694 105881 22813 127700
- F 236301 77813 - . 49192 - 28621 158488 U P 269866 73365 67596 5169 196501
M 143725 65195 60599 4596 78530
- F 126141 8170 6997 1173 117971 Tahsil Kosya Kutauli T P 49518 23521 18511 ' 5010 . 25997
M 24192 11663 9547 2116 12529 F 25326 11858 8964 2894 13468
R P 49518 23521 18511 5010 25997 M 24192 11663 9547 2116 12529 F 25326 11858 8964 2894 13468
U P 0 0 0 - 0 ,
0 M 0 0 0 0 0 F 0 0 0 0 0
Tahsil Nainital T P 134380 49921 40989 8932 84459 M 70964 _ 34863 30541 4322 36101 F 63416 15058 10448 4610 48358
R P 83283 35068 27044 8024 48215 M 43291 22546 . 18920 3626 20745 F 39992 12522 8124 4398 27470
U P 51097 14853 13945 908 36244 -, M 27673 12317 11621 696 15356 F 23424 2536 2324 212 20888
Nainital UA U- P 39920 11459 ...j0822 637 28461 M 21649 9611 9® - 549 12038 F 18271 1848 1760 88 16423
(a) Nainital MB U -::P 38639 11071 10478 593 27568 M 20982 ,./ 9298 8783 515 11684 F 17657 1773 1695 78 15884 -
(b) Nainital CB U P 1281 388 344 44 893 M 667 313 279 34 354 F 614 75 65 10 539
57
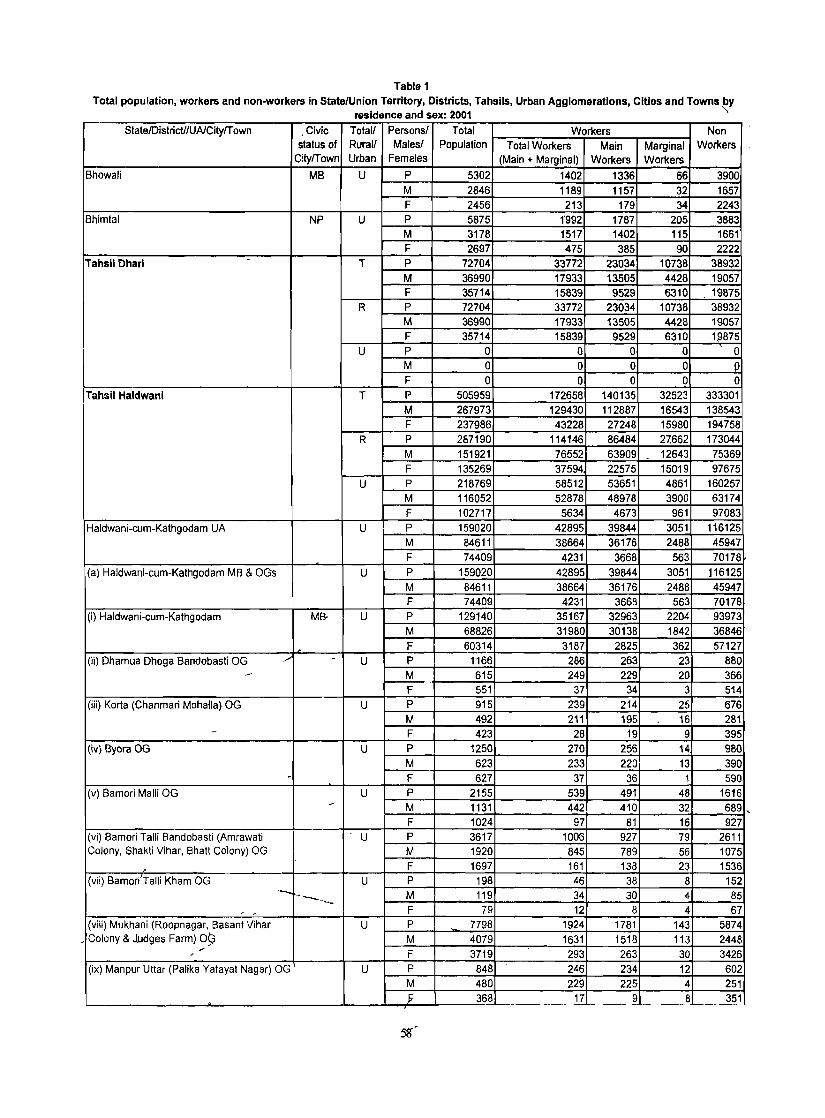
Table 1
Total population, workers and non-workers in State/Union Territory, Districts, Tahsils, Urban Agglomerations, Cities and Towns by residence and sex: 2001 "
Slate/DistricU!UNCitylT own
Bhowali
Shimtal
Tahsil Dhari
Tahsil Haldwani
Haldwani-cum-Kathgodam UA
(a) Haldwani-cum-Kathgodam MB & OGs
(i) Haldwani-cum-Kalhgodam
(ii) Dhamua Dhoga Bandobasti OG
(iii) Korta (Chanmari Mohalia) OG
(iv) Byora OG
(v) Bamori Malli OG
(vi) Bamori Talli Bandobasti (Amrawati Colony, Shakti Vihar, Bhall Colony) OG
(vii) Bamori Talli Kham OG
(viii) Mukhani (Roopnagar, Basant Vihar • Colony & Judges Farm) O~
/'
-(ix) Manpur Uttar (Palika Yatayat Na9ar) OG
,Civic status of
CitylTown
MB
NP
M&
Tolal! Persons! Rural! Males! Urban Females
U P M F
u P M F
T p
M F
R p
M F
U p
M
F
T P M
F R P
M
F
U p
M
F U p
M F
U p
M F
U P M F
U p
M F
U p
M
F
U p
M F
U p
M F
. U p
M F
U p
M F
U p
M F
U P M
Total Population
5302 2846 2456 5875 3178 2697
72704 36990 35714 72704 36990 35714
o o o
505959 267973 237986 287190 151921 135269 218769 116052 102717 159020 84611 74409
159020 84611 74409
129140 68826 60314
1166 615 551 915 492 423
1250 623 627
2155 1131 1024 3617 1920 1697
198 119
79 7798 4079 3719 848 480
Workers Tolal Workers Main
(Main + Marginal) Workers
1402 1336 1189 1157 213 179
1"992 1787 1517 1402 475 385
33772 23034 17933 13505 15839 9529 33772 23034 17933 13505 15839 9529
o o o o o o
172658 140135 129430 112887 43228 27248
Non
Marginal Workers Workers
66 3900 32 1657 34 2243
205 3883 115 1661 90 2222
10738 38932 4428 19057 6310 19875
10738 38932 4428 19057 6310 19875
o o o p o o
32523 333301 16543 138543 15980 194758
114146 86484 27.662 173044 76552 63909 _ 12643 75369 37594 22575 15019 97675 58512 53651 4861 160257 52878 48978 3900 63174
5634 4673 961 97083 42895 39844 3051 116125 38664 36176 2488 45947
4231 3668 563 70178· 42895 39844 3051 116125 38664 36176 2488 45947
4231 3666 563 70178 35167 32963 2204 93973 31980 30136 1842 36846 3187 2825 362 57127
286 263 23 880 249 229 20 366
37 34 3 514 239 214 25 676 211 195 16 281
28 19 9 395 270 256 14 980 233 220 13 390
37 36 590 539 491 48 1616 442 410 32 689
97 81 16 927 1006 927 79 2611 845 789 56 1075 161 138 23 1536 46 38 8 152 34 30 4 85 12 8 4 67
1924 1781 143 5874 1631 1518 113 2448 293 263 30 3426 246 234 12 602 229 225 4 251
L.-_____________ ....I... __ --L __ ..J...---rl:;...___.~-----"36=-§-~ __ ____ 11_ 9 _. 8~ _ _l51
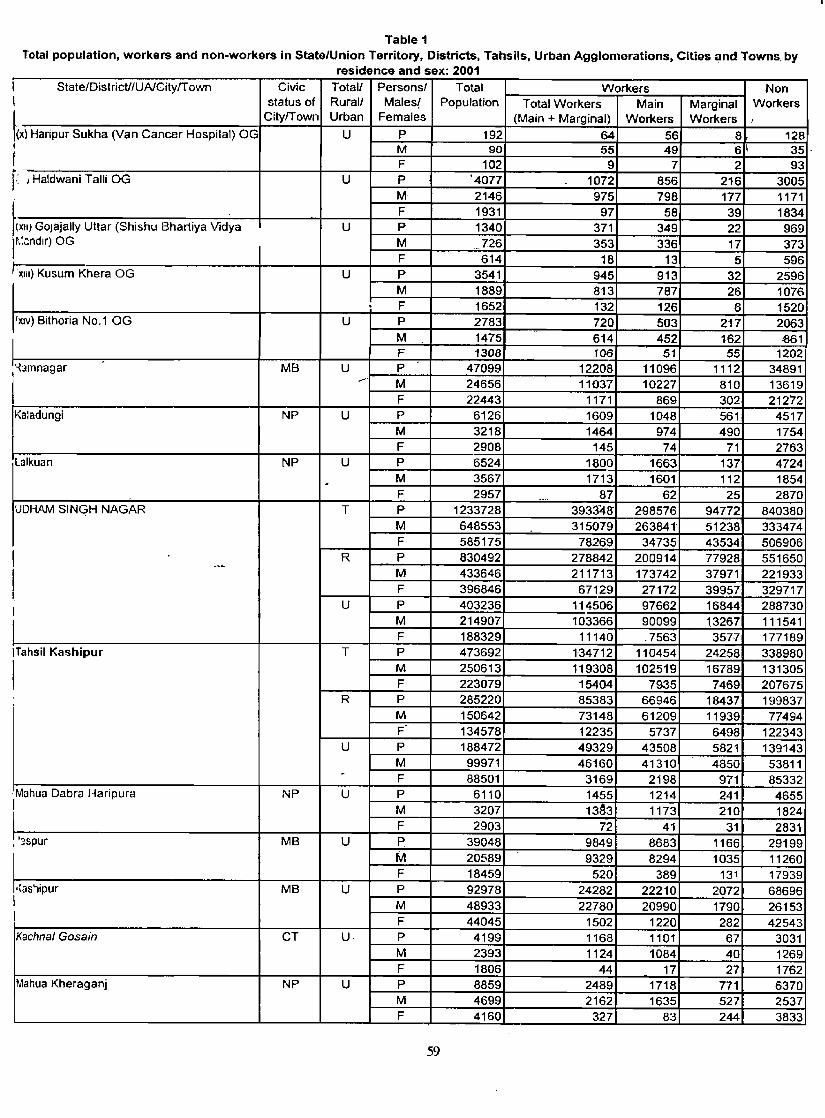
Table 1 Total population, workers and non-workers in State/Union Territory, Districts, Tahsils, Urban Agglomerations, Cities and Towns, by
residence and sex' 2001 I State/DistrictilUNCitylTown Civic Total! Persons! Total Workers Non I status of Rural! Males! Population T atal Workers Main Marginal Workers
~Xl Haripur Sukha (Van Cancer Hospital) OG CilylTown Urban Females (Main + Marginal) Workers Workers I
U P 192 64 56 8 128 ~ M 90 55 49 6 1 35· I F 102 9 7 2 93 f.: I Haldwani Talli OG U P '4077 1072 856 216 3005
M 2146 975 798 177 1171
~(XU) GOJajally Uttar (Shishu Bhartiya Vid~a F 1931 97 58 39 1834 U P 1340 371 349 22 969
r:.::nd,r) OG M - 726 353 336 17 373 F 614 18 13 5 596
1)(111) Kusum Khera OG U P 3541 945 913 32 2596 M 1889 813 787 26 1076 F 1652 132 126 6 1520
!XIV) Bithoria No,1 OG U P 2783 720 503 217 2063
I M 1475 614 452 162 861 F 1308 106 51 55 1202
:'-{lmnagar MB U P 47099 12208 11096 1112 34891
I -- M 24656 11037 10227 810 13619 F 22443 1171 869 302 21272
Kaladungi NP U P 6126 1609 1048 561 4517 M 3218 1464 974 490 1754 F 2908 145 74 71 2763
lalkuan NP U P 6524 1800 1663 137 4724 M . 3567 1713 1601 112 1854 F 2957
~ --- 87 62 25 2870 UDHAM SINGH NAGAR T P 1233728 39334a 298576 94772 840380
M 648553 315079 26384" 51238 333474 F 585175 78269 34735 43534 506906
I R P 830492 278842 200914 77928 551650 -I M 433646 211713 173742 37971 221933
F 396846 67129 27172 39957 329717
I U P 403236 114506 97662 16844 288730
1 M 214907 103366 90099 1,3267 111541 F 188329 11140 .7563 3577 177189
lTahsil Kashipur T P 473692 134712 110454 24258 338980
I M 250613 119308 102519 16789 131305 F 223079 15404 7935 7469 207675
R P 285220 85383 66946 18437 199837 M 150642 73148 61209 11939 77494 F 134578 12235 5737 6498 122343
U P 188472 49329 43508 5821 139143 M 99971 46160 41310 4850 53811 - F 88501 3169 2198 971 85332
Mahua Dabra Haripura NP U P 6110 1455 1214 241 4655 I M 3207 13~3 1173 210 1824
f '.,spur F 2903 72 41 31 2831
MB U ~ 39048 9849 8683 1166 29199 M 20589 9329 8294 1035 11260 F 18459 520 389 131 17939
.(as'1ipur MB U P 92978 24282 22210 2072 68696 I M 48933 22780 20990 1790 26153
F 44045 1502 1220 282 42543 Kachnal Gosain CT U. P 4199 1168 1101 67 3031
M 2393 1124 1084 40 1269 F 1806 44 17 27 1762 -
Mahua Kheraganj NP U P 8859 2489 1718 771 6370 M 4699 2162 1635 527 2537 F 4160 327 83 244 3833
59
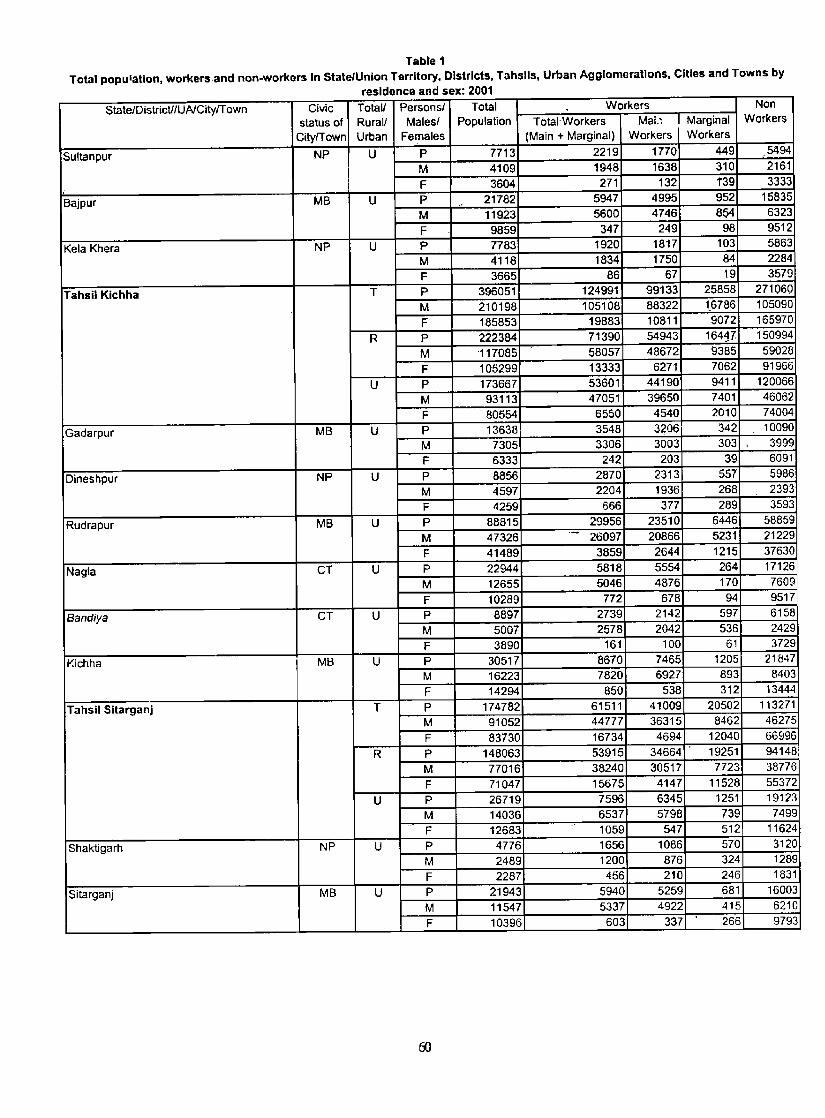
Tabte 1 Total popu'atlon, workers and non-workers In State/Union Territory. Districts, Tahslls, Urban Agglomerations, Cities and Towns by
residence and sex: 2001
State/DislricUlUNCityrT own Civic Totall Personsl Total Workers Non
status of Rurall ,Males I Population Total'Workers Mai.~ I Marginal Workers
CityrTown Urban Females (Main + Marginal) Workers Workers
Sultan pur NP U P 7713 2219 1770 449 ,5494
M 4109 1948 1638 310 2161
F 3604 271 132 1'39 3333 I
Bajpur MB U P - 21782 5947 4995 952 15835
M 11923 5600 4746 8~ 6323
F 9859 347 249 98 9512
Kela Khera NP U P 7783 1920 1817 103 5863
M 4118 1834 1750 84 2284
F 3665 86 67 19 3579
Tahsil Kichha T P 396051 124991 99133 25858 271060
M 210198 105108 88322 16786 105090
F 185853 19883 10811 9072 165970
R P 222384 71390 54943 16447, 150994
M '117085 58057 48672 9385 59028
F 105299 13333 6271 7062 91966
U P 173667 53601 44190 9411 120066
M 93113 47051 39650 7401 46062
F 80554 6550 4540 2010 74004
Gadarpur MB U P 13638 3548 3206 342 10090
M 7305 3306 3003 303 I 3999
F 6333 242 203 39 6091
Dineshpur NP U P 8856 2870 2313 557 5986
M 4597 2204 1936 268 2393
F 4259 666 377 289 3593
Rudrapur MB U P 88815 29956 23510 6446 58859
M 47326 26097 20866 5231 21229
F 41489 3859 2644 1215 37630
Nagla CT U P 22944 5818 5554 264 17126
M 12655 5046 4876 170 7609
F 10289 772 678 94 9517
Bandiya CT U P 8897 2739 2142 597 6158
M 5007 2578 2042 536 2429 F 3890 161 100 61 3729
Kichha MB U P 30517 8670 7465 1205 21B47
M 16223 7820 6927 893 8403 F 14294 850 538 312 13444
Tahsil Sitarganj T P 174782 61511 41009 20502 113271
M 91052 44777 36315 8462 46275
F 83730 16734 4694 12040 66996
R P 148063 53915 34664 . 19251 94148
M 77016 38240 30517 7723 38776 F 71047 15675 4147 11528 55372
U P 26719 7596 6345 1251 19123 M 14036 6537 5798 739 7499 F 12683 1059 547 512 11624
Shaktigarh NP U P 4776 1656 1086 570 3120
M 2489 1200 876 324 1289 F 2287 456 210 246 1831
Sitarganj MB U P 21943 5940 5259 681 16003 M 11547 5337 4922 415 6210
F 10396 603 337 ,
266 9793
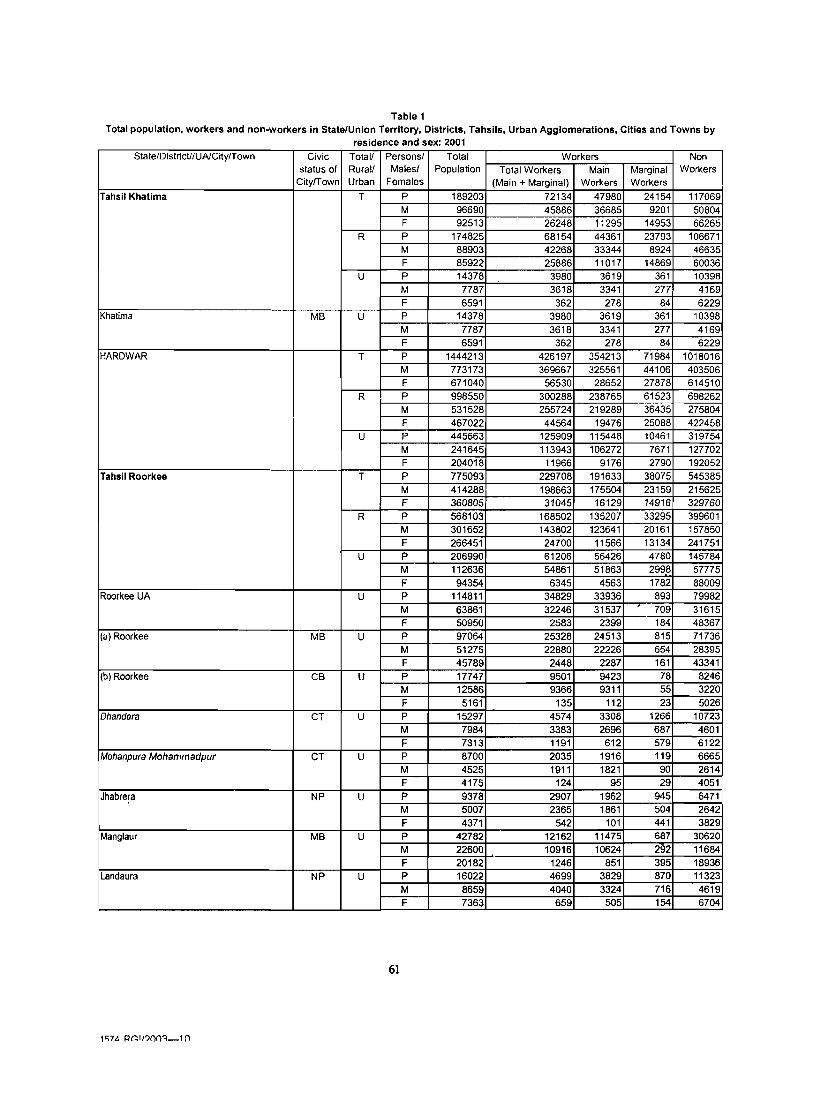
Table 1 Total population, workers and non-workers in State/Union Territory, Districts, Tahsils, Urban Agglomerations, Cities and Towns by
residence and sex: 2001 State/DistrictllUNCitylTown Civic Totall Personsl Total Workers Non
status of Rurall Malesl Population Total Workers Main Marginal Workers City/Town Urban Females (Main + Marginal) Workers Workers
Tahsil Khatima T P 189203 72134 47980 24154 117069 M 96690 45886 36685 9201 50804 F 92513 26248 11295 14953 66265
R P 174825 68154 44361 23793 106671 M 88903 42268 33344 8924 46635 F 85922 25886 11017 14869 60036
U P 14378 3980 3619 361 10398 M 7787 3618 3341 277 4169 F 6591 362 278 84 6229
Khatima MB U P 14378 3980 3619 361 10398 M 7787 3618 3341 277 4169 F 6591 362 278 84 6229
HARDWAR T P 1444213 426197 354213 71984 1018016 M 773173 369667 325561 44106 403506 F 671040 56530 28652 27878 614510
R P 998550 300288 238765 61523 698262 M 531528 255724 219289 36435 275804 F 467022 44564 19476 25088 422458
U P 445663 125909 115448 10461 319754 M 241645 113943 106272 7671 127702 F 204018 11966 9176 2790 192052
Tahsil Roorkee T P 775093 229708 191633 38075 545385 M 414288 198663 175504 23159 215625 F 360805 31045 16129 14916 329760
R P 568103 168502 135207 33295 399601 M 301652 143802 123641 20161 157850 F 266451 24700 11566 13134 241751
U P 206990 61206 56426 4780 145784 M 112636 54861 51863 2998 57775 F 94354 6345 4563 1782 88009
Roorkee UA U P 114811 34829 33936 893 79982 M 63861 32246 31537 709 31615 F 50950 2583 2399 184 48367
(a) Roorkee MB U P 97064 25328 24513 815 71736 M 51275 22880 22226 654 28395 F 45789 2448 2287 161 43341
(b) Roorkee CB U P 17747 9501 9423 78 8246 M 12586 9366 9311 55 3220 F 5161 135 112 23 5026
Dhandera CT U P 15297 4574 3308 1266 10723 M 7984 3383 2696 687 4601 F 7313 1191 612 579 6122
Mohanpura Mohammadpur CT U P 8700 2035 1916 119 6665 M 4525 1911 1821 90 2614 F 4175 124 95 29 4051
Jhabrera NP U P 9378 2907 1962 945 6471 M 5007 2365 1861 504 2642 F 4371 542 101 441 3829
Manglaur MB U P 42782 12162 11475 687 30620 M 22600 10916 10624 292 11684 F 20182 1246 851 395 18936
Landaura NP U P 16022 4699 3829 870 11323 M 8659 4040 3324 716 4619 F 7363 659 505 154 6704
61

Table 1 Total population. workers and non-workers In'State/Unlon Territory, Dlstrlcts, Tahslls, Urban Agglomerations, Cities and Towns by
residence and sex: 2001
StateJDistricU/UAlCitylTown Civic TolaV Persons! Total Workers Non
status of Rural! Males! Population Total Workers Main Marginal Workers
CityfTown Urban Females (Main + Marginal) Workers Workers -Tahsil Hardwar T p 478966 135123 114228 20895 343843
M 257016 119800 104769 15031 137215 F 221950 15323 9459 5864 206627
R P 258533 75475 59695 15780 183058 M 137857 65235 54466 10769 72622 F 120676 10240 5229 5011 110436
U p 220433 59648 54533 5115 160785
M 119159 54565 5030"8 4262 64594 F 101274 5083 4230 853 96191
Hardwar UA U P 220433 59648 54533 5115 '160785
M 119159 54555 50303 4262 64594 F 101274 5083 4230 ~.853 96191
"
(a) Hardwar MB and OGs U P 177181 48505 -43841 4664 128676 M 96107 44360 40500 3860 51747 F 81074 4145 3341 804 76929
(i) Hardwar MB U P 175010 48062 43402 4660 126948 M 94650 43987 40130 3857 50663 F 80360 4075 3272 803 76285
(ii) Gurukul Kangri OG U P 1899 411 408 3 1488 M 1220 344 342 2 876 F 679 67 66 1 612
(ili) Jwa[apur Mahavidyala OG _ U P 272 32 31 1 240 M 237 29 28 1 208 F ~ 35 3 3 0 32
(b) Bharat Heavy Elerical LilT)ited Ranipur ITS U P 43252 - 11143 10692 451 32109 M 23052 10205 9803 402 12847
F 20200 938 889 49 19262 TahsH Laks1u T p 190154 61366 48352 13014 128788
M 101869 51204 45288 5916 50665 F 88285 10162 3064 7098 78123
R P 171914 56311 43863 12448 115603
M 92019 46687 41182 5505 45332 F 79895 9624 2681 6943 70271
U P 18240 5055 4489 566 13185 M 9850 4517 4106 411 5333 F 8390 538 383 155 7852 -Laksar NP U P 18240 . 5055 4489 566 13185
M 9850 4517 4106 411 5333
F 8390 538 - 383 155 7852
62

Table 2 Percentage of workers and non-workers to total population State/Union Territory, Districts, Tahslls, Urban Agglomerations, Cities
and Towns by residence and sex: 2001
StatelOistrict/T ahsillUAICitylT own Civic Totall Persons/ Total Percentage to total population Non status of Rural! Males/ Population Total Workers Main Marginal Workers
CitylTown Urban Females (Main + Marginal) Workers Workers 1 2 3 4 5 6 7 8 9
UTTARANCHAL T P 8483355 36.94 27.39 9.55 63.06 M 4321041 46.42 38.13 8.29 53.58 F 4162314 27.09 16.24 10.85 72.91
R P 6312415 39.63 27.77 11.86 60.37 M 3146031 45.99 36.09 !l.90 54.01 F 3166384 33.32 19.50 13.82 66.68
U P 2170940 29.09 26.29 2.80 70.91 M 1175010 47.58 43.61 3.97 52.42 F 995930 7.27 5.85 1.42 92.73
UTTARKASHI T P 294978 45.99 38.92 7.07 54.01 M 152023 48.25 42.33 5.92 51.75 F 142955 43.60 35.30 8.30 56.40
R P 272054 47.07 39.53 7.54 52.93 M 138752 48.42 42.12 6.30 51.58 F 133302 45.65 36.83 8.82 54.35
U P 22924 33.31 31.72 1.59 66.69 M 1'3271 46.37 44.46 1.91 53.63 F 9653 15.36 14.21 1.15 84.64
Tahsil Puraula T p 62840 49.17 36.65 12.52 50.83 M 32314 51.36 42.63 8.73 48.64 F 30526 46.83 30.31 16.52 53.17
R P 62840 49.17 36.65 12.52 50.83 M 32314 51.36 42.63 8.73 48.64 F 30526 46.83 30.31 16.52 53.17
U P 0 0.00 0.00 0.00 0.00 M 0 0.00 0.00 0.00 0.00 F 0 0.00 0.00 0.00 0.00
Tahsil RaJgarhl - T P 62267 47-44 43.98 3.46 52.56 M 32096 47.97 45.25 2.72 52.03 F 30171 46.87 42.62 4.25 53.13
R P 56169 49.26 45.55 3.71 50.74 M 28658 48.73 45.86 2.87 51.27 F 27511 49.82 45.23 4.59 50.18
U P 6098 30.55 29.45 1.10 69.45 M 3438 41.65 40.?O 1.45 58.35 F 2660 16.20 15.56 0.64 83.80
Barko! NP U P 6098 30.55 29.45 1.10 69.45 M 3438 41.65 40.20 1.45 58.35 F 2660 16.20 15.56 0.64 83.80
Tahsil Dunda T p 100045 45.95 37.72 8.23 54.05 M 49570 46.05 38.58 7.47 53.95 F 50475 45.87 36.89 8.98 54.13
R P 100045 45.95 37.72 8.23 54.05 M 49570 46.05 38.58 7.47 53.95 F 50475 45.87 36.89 8.98 54.13
U P 0 0.00 0.00 0.00 0.00 M 0 0.00 0.00 0.00 0.00 F 0 0.00 0.00 0.00 0.00
Tahsil Bhatwarl T p 69826 41.93 38.19 3.74 58.07 . M 38043 48.70 44.49 4.21 51.30
, F 31783 33.83 30.65 3.18 66.17 R P 53000 44.35 "39.98 4.37 55.65
M 28210 4&93 43.98 -'4.95 51.07 F 24790 39.13 35.43 3.70 60.87
U P 16826 34.31 32.54 1.77 65.69 M 9833
, 48.02 45.95 2.07 51.98
F 6993 15.04 13.70 1.34 84.96
63
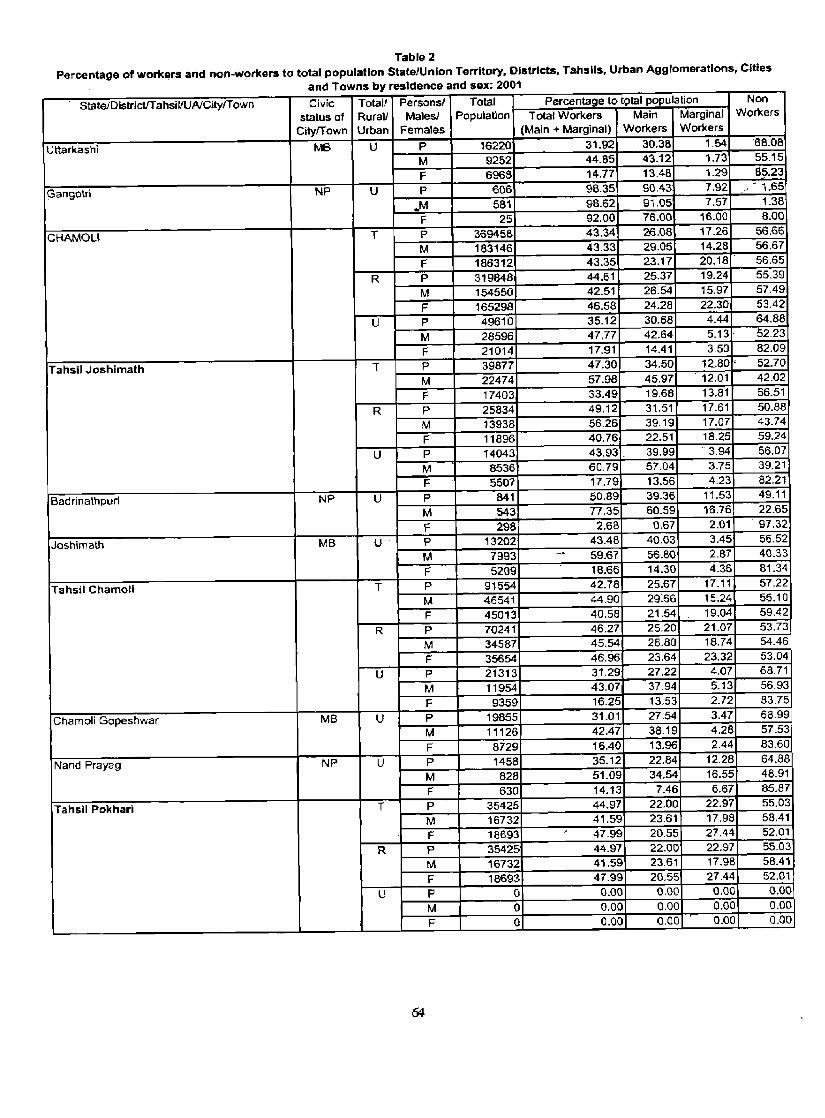
Table 2 Percentage of workers and non-w9rkers to total population State/Union Territory. Districts, Tahslls. Urban Agglomerations, Cities
and Towns by residence and sex: 2001
StateJDislricUTahsil/UNCityfTown Civic Total! Personsl Total Percentage to tt;ltal population Non
status of Rurall Malesl Population Total Workers Main Marginal Workers
CityfTown Urban Females (Main + Marginal) Workers Workers
Ut1:arkashi Me U P 16220 31.92 30.38 1.54 68.08
M 9252 44.85 43.12 1.73 55.15
F 6968 14.77 13.48 1.29 85.23
Gangotri NP U P 606 98.35 90.43 7.92 , - 1.65
.M 581 98.62 91.05 7.57 1.38
F 25 92.00 76.00 16.00 8.00
CHAMOLI T P 369458 43.34 26.08 17.26 56.66
M 183146 43.33 29.05 14.28 56.67
F 186312 43.35 23.17 20.18 56.65
R P 319848 44.61 25.37 19.24 55.39
M 154550 42.51 26.54 15.97 57.49
F 165298 46.58 24.28 22.30 53.42
U P 49610 35.12 30.68 4.44 64.88
M 28596 47.77 42.64 5.13 52.23
F 21014 17.91 14.41 3.50 82.09
Tahsil Joshimath T p 39877 47.30 34.50 12-80 ' 52.70
M 22474 57.98 45.97 . 12.01 42.02
F 17403 33.49 19.66 13.81 66.51
R P 25834 49.12 31.51 17.61 50.88
M 13938 56.26 39.19 17.07 43.74
F 11896 40.76 22.51 18.25 59.24
U P 14043 43.93. 39.99 3.94 56.07
M 8536 60.79 57.04 3.75 39.21
F 5507 17.79 13.56 4.23 82.21
Badrinathpuri NP U P 841 50.89 39.36 11.53 49.11
M 543 77.35 60.59 16.76 22.65
F 298 2.6B 0.67 2.01 97.32
Joshimath MB U P 13202 43.48 40.03 3.45 56.52
M 7993 -- 59.67 56.80 2.67 40.33
F 5209 18.6fj 14.30 4.36 81.34
Tahsil Chamoti T p 91554 42.78 25.67 17.11 57.22
M 46541 44.90 29:66 15.24 55.10
F 45013 40.58 21.54 19.04 59.42
R P 70241 46.27 25.20 21.07 53.73
M 34587 45.54 26.80 18.74 54.46
F 35654 46.96 23.64 23.32 53.04
U P 21313 31.29 27.22 4.07 68.71
M 11954 43.07 37.94 5.13 56.93
F 9359 16.25 13.53 2.72 83.75
Chamoli Gopeshwar MB U P 19855 31.01 27.54 3.47 68.99
M 11126 42.47 38.19 4.28 57.53
F 8729 16.40 13.96 2.44 83.60
Nand Prayag NP U P 1458 35.12 22.84 12.28 64.88
M 828 51.09 34.54 16.55 48.91
F 630 14.13 7.46 6.67 85.87
Tahsil Pokhari T P 35425 44.97 22.00 22.97 55.03
M 16732 41.59 23.61 17.98 58,41
F 18693 , 47.99 20.55 27.44 52.01
R P 35425 44.97 22.00 22.97 55.03
M 16732 41.59 23.61 17.9B 5B.41
F 18693 47.99 20.55 27.44 52.01
U P a 0.00 0.00 0.00 0.00
M 0 0.00 0.00 0.00 0.00
F 0 0.00 0.00 0.00 0.00
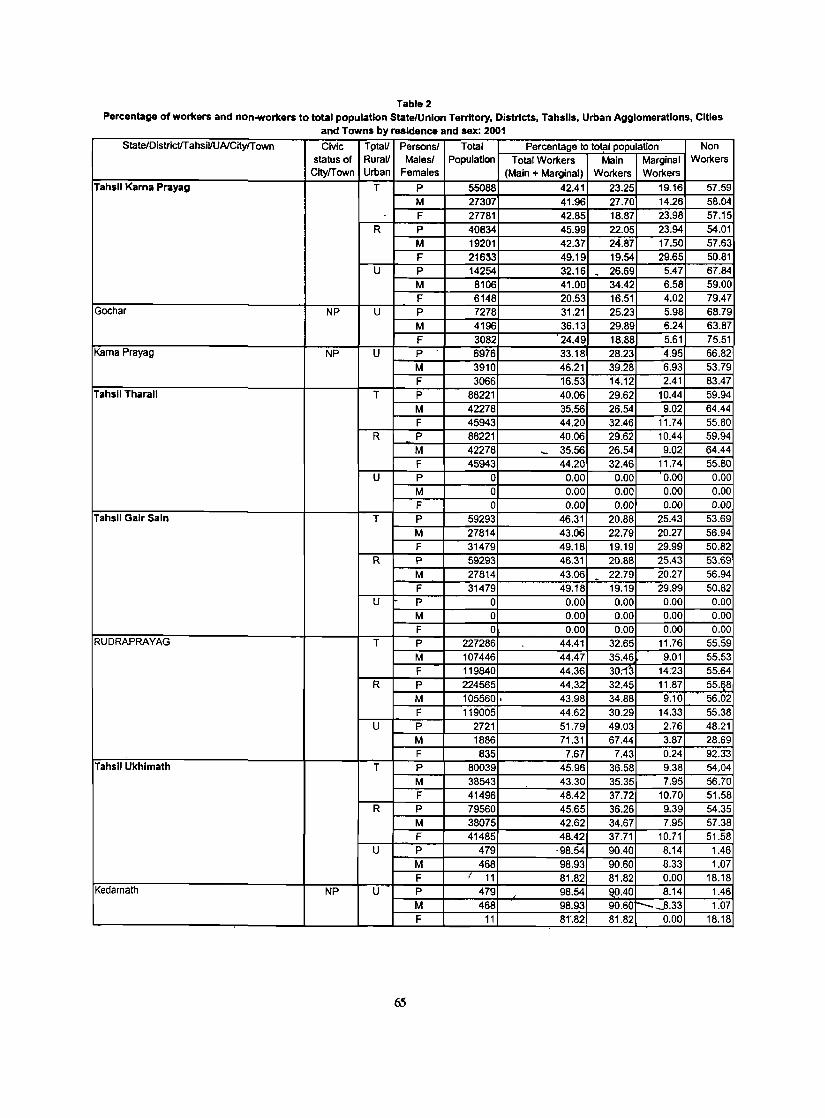
Table 2 Percentage of workers and non-workers to total population StatelUnlon Territory. Districts. Tahslls. Urban Agglomerations. Cities
and Towns by residence and sex: 2001
StateiOistrictIT ahsillUAlCitylT own Civic T9tall Persons! Total Percentage to total population Non status of Rurall Malesl Population Total Workers Main Marginal Workers
CitylTown Urban Females (Main + Marginal) Workers Workers Tahsil Karna Prayag T P 55088 42.41 23.25 19.16 57.59
M 27307 41.96 27.70 14.26 58.04 F 27781 42.85 18.87 23.98 57.15
R P 40834 45.99 22.05 23.94 54.01 M 19201 42.37 24.87 17.50 57.63 F 21633 49.19 19.54 29.65 50.81
U P 14254 32.16 - 26.69 5.47 67.84 M 8106 41.00 34.42 6.58 59.00 F 6148 20.53 16.51 4.02 79.47
Gochar NP U P 7278 31.21 25.23 5.98 68.79 M 4196 36.13 29.89 6.24 63.87 F 3082 '24.49 18.88 5.61 75.51
Karna Prayag NP U P 6976 33.18 28.23 4.95 66.82 M 3910 46.21 39.28 6.93 53.79 F 3066 16.53 14.12 2.41 83.47
Tahsil Tharali T P 88221 40.06 29.62 10.44 59.94 M 42278 35.56 26.54 9.02 64.44 F 45943 44.20 32.46 11.74 55.80
R P 88221 40.06 29.62 10.44 59.94 M 42278 - 35.56 26.54 9.02 64.44 F 45943 44.20 32.46 11.74 55.80
U P 0 0.00 0.00 0.00 0.00 M 0 0.00 0.00 0.00 0.00 F 0 0.00 0.00 0.00 0.00
Tahsil Galr Saln T P 59293 46.31 20.88 25.43 53.69 M 27814 43.06 22.79 20.27 56.94 F 31479 49.18 19.19 29.99 50.82
R P 59293 46.31 20.88 25.43 53.69 M 27814 43.06 22.79 20.27 56.94 -F 31479 49.18 19.19 29.99 50..82
U - P a 0.00 0.00 0.00 0.00 M a 0.00 0.00 0.00 0.00 F O. 0.00 0.00 0.00 0.00
RUDRAPRAYAG T P 227286 44.41 32.65 11.76 55.59 M 107446 44.47 35.46 9.01 55.53 F 119840 44.36 30:-n 14:23 55.64
R P 224565 44.32 32.45 11.87 55.§8 M 105560 • 43.98 34.88 9.10 56.02 F 119005 44.62 30.29 14.33 55.38
U P 2721 51.79 49.03 2.76 48.21 M 1886 71.31 67.44 3.87 28.69 F 835 7.67 7.43 0.24 92.33
Tahsil Ukhlmath T P 80039 45.96 36.58 9.38 54,04 M 38543 43.30 35.35 7.95 56.70 F 41496 48.42 37.72 10.70 51.58
R P 79560 45.65 36.26 9.39 54.35 M 38075 42.62 34.67 7.95 57.38 F 41485 48.42 37.71 10.71 51.58
U P 479 -98.54 90.40 8.14 1.46 M 468 98.93 90.60 8.33 1.07 F I 11 81.82 81.82 0.00 18.18
Kedarnath NP U P 479 98.54 ~0.40 8.14 1.46 M 468 98.93 90.60 -_8.33 1.07 F 11 81'.82 81.82 0.00 18.18
65
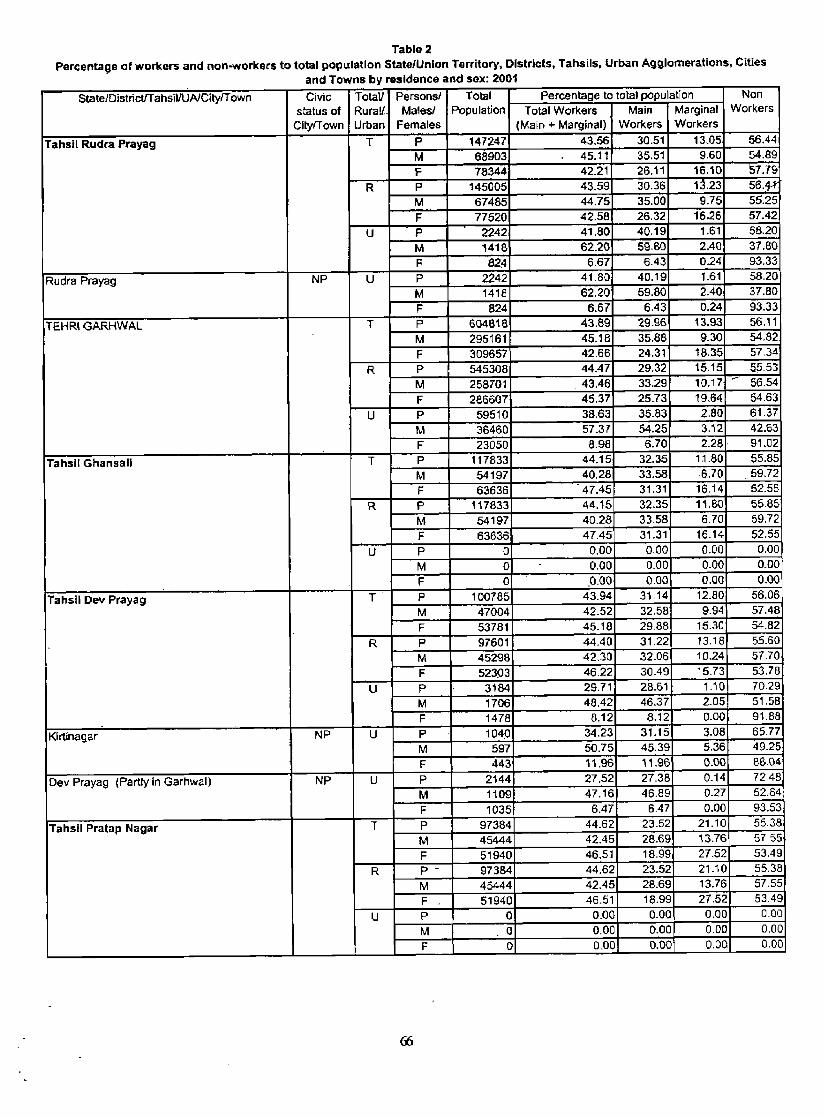
Table 2 Percenta90 of workers and non·workers to total population State/Union Territory, Districts, Tahsils. Urban Agglomerations, Cities
and Towns by residence and sox: 2001
StateJDistriclfT ahsil/UNCitylT own Civic TotaV PersonsJ Total Percentage to total population Non
status of Rurall Malesl Population Total Workers Main Marginal Workers
CitylTown Urban Females (Ma~n + Marginal) Workers Workers
Tahsil Rudra Prayag T p 147247 43.56 30.51 13.05 56.44
M 68903 45.11 35.51 9.60 54.89
F 78344 42.21 26.11 16.10 57.79
R P 145005 43.59 30.36 13.23 56·4-t M 67485 44.75 35.00 9.75 55.25
F 77520 42.58 26.32 16.26 57.42
U p 2242 41.80 40,19 1.61 58.20
M 141B 62.20 59,BO 2.40 37.80
F 824 6.67 6.43 0.24 93.33
Rudra Prayag NP U P 2242 41.80 40.19 1.61 58.20
M 1418 62.20 59.80 2.40 37.80
F 824 6.67 6.43 0.24 93.33
TEHRtGARHWAl T P 604818 43.89 29.96 13.93 56.11
M 295161 45.18 35.88 9.30 54.82
F 309657 42.66 24.31 18.35 57,34
R P 545308 44.47 29.32 15.15 55.53
M 258701 43.46 33.29 10.17 ~
56.54
F 286607 45.37 25.73 19.64 54,63
U P 59510 38,63 35.83 2.80 61.37
M 36460 57.37 54.25 3.12 42.63
F 23050 8.98 6.70 2.28· 91.02
Tahsil Ghansall T p 117833 44.15 32.35 11.80 55.85
M 54197 4().28 33.58 6.70 59.72 ~~
F 63636 47.45 31.31 16.14 52.55
R P 117S33 44.15 32.35 11,80 55.85
M 54197 40.28 33.58 6.70 59.72
F 63636 47.45 31.31 16.14 52.55
U P 0 0.00 0.00 0.00 0.00
M 0 0.00 0.00 0.00 0.00
F 0 0.00 0.00 0.00 0.00
Tahsil Dev Prayag T p 100785 43.94 31.14 12.80 56.06
M 47004 42.52 32,58 9.94 57.48
F 53781 45.18 29.88 15.30 54.82
R P 97601 44.40 31.22 13.18 55.60
M 45298 42.30 32.06 10.24 57.70
F 52303 46.22 30.49 15.73 53.78
U P 3184 29,71 28.61 1.10 70.29
M 1706 48.42 46.37 2.05 51.58
F 1478 8.12 8.12 0.00 91.88
Kirtinagar NP U P 104:0 34.23 31.15 3.08 65.77
M 597 50.75 45.39 5.36 49.25
F 443 11.96 11.96 0.00 SSM
Dev Prayag (Partly in Garhwal) NP U P 2144 27.52 27.38 0.14 72A8
M 1109 47.16 46.89 0.27 52.84
F 1035 6.47 6.47 0.00 93.53
Tahsil Pratap Nagar T P 97384 44.62 23.52 21.10 55.38
M 45444 42.45 28.69 13.76 5755
F 51940 46.51 18.99 27.52 53.49
R P - 97384 44.62 23.52 21.10 55.38
M 45444 42.45 28.69 13.76 57,55
F 51940 46.51 18.99 27.52 53.49
U P 0 0.00 0.00 0.00 0.00
M . 0 0,00 0.00 0.00 0,00
F 0 0,00 0.00 0,00 0.00
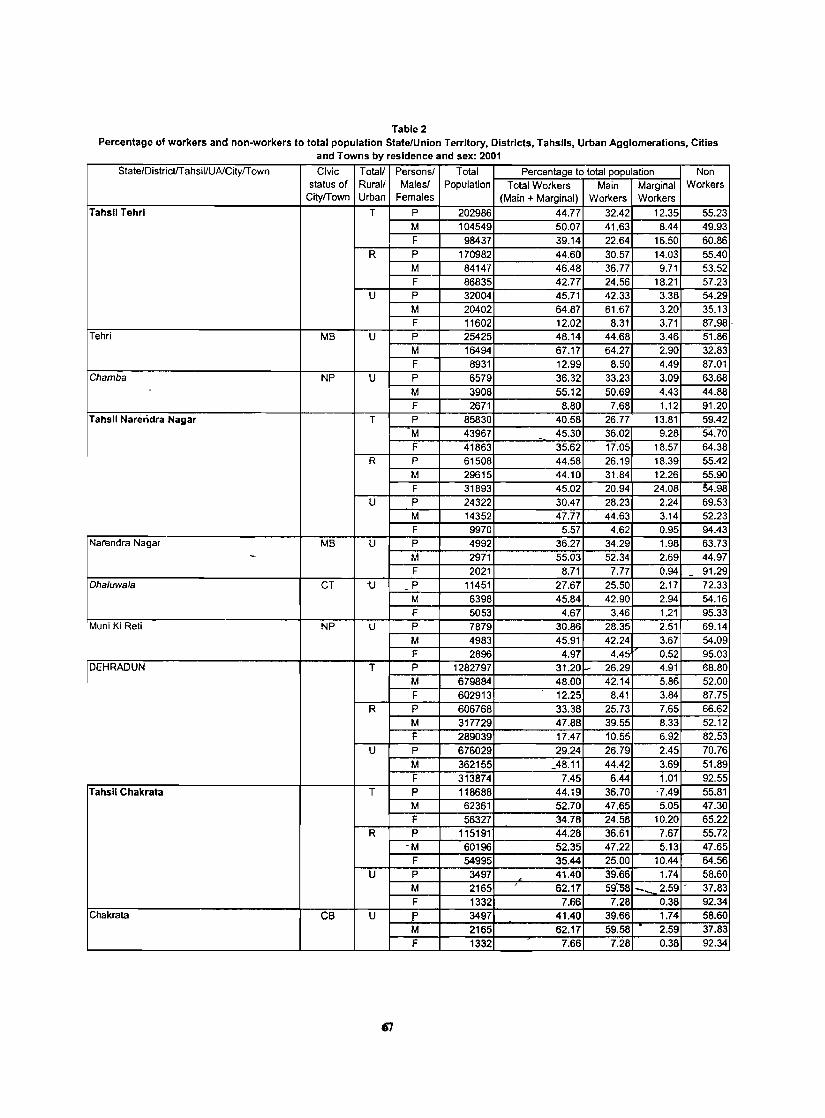
Table 2 Percentage of workers and non-workers to total population State/Union Territory, Districts, Tahslls, Urban Agglomerations, Cities
and Towns by residence and sex: 2001
State/DistricVT ahsil/UAlCity/T own Civic Totall Personsl Total Percentage to total population Non status of Rural! Males/ Population Total Workers Main Marginal Workers
CityfTown Urban Females (Main + Marginal) Workers Workers
Tahsil Tehrl T P 202986 44.77 32.42 12.35 55.23 M 104549 50.07 41.63 8.44 49.93 F 98437 39.14 22.64 16.50 60.86
R P 170982 44.60 30.57 14.03 55.40 M 84147 46.48 36.77 9.71 53.52 F 86835 42.77 24.56 18.21 57.23
U P 32004 45.71 42.33 3.38 54.29 M 20402 64.87 61.67 3.20 35.13 F 11602 12.02 8.31 3.71 87.98·
Tehri MB U P 25425 48.14 44.68 3.46 51.86 M 16494 67.17 64.27 2.90 32.83 F 8931 12.99 8.50 4.49 87.01
Chamba NP U P 6579 36.32 33.23 3.09 63.68 M 3908 55.12 50.69 4.43 44.88 F 2671 8.80 7.68 1.12 91.20
Tahsil Nareridra Nagar T P 85830 40.58 26.77 13.81 59.42 -M 43967 45.30 36.02 9.28 54.70 F 41863 35.62 17.05 18.57 64.38
R p 61508 44.58 26.19 18.39 55.42 M 29615 44.10 31.84 12.26 55.90 F 31893 45.02 20.94 24.08 54.98
U p 24322 30.47 28.23 2.24 69.53 M 14352 47.77 44.63 3.14 52.23 F 9970 5.57 4.62 0.95 94.43
Narendra Nagar MB U P 4992 36.27 34.29 1.98 63.73 - M 2971 55.03 52.34 2.69 44.97
F 2021 8.71 7.77 0.94 - 91.29 Dhaluwala CT "U - P 11451 27.67 25.50 2.17 72.33
M 6398 45.84 42.90 2.94 54.16 F 5053 4.67 3.46 121 95.33
Muni Ki Rell NP U P 7879 30.86 28.35 2.51 69.14 M 4983 45.91 42.24 3.67 54.09 F 2896 4.97 4.45 0.52 95.03
DEHRADUN T P 1282797 31.20 - 26.29 4.91 68.80 M 679884 48.00 42.14 5.86 52.00 F 602913 12.25 8.41 3.84 87.75
R P 606768 33.38 25.73 7.65 66.62 M 317729 47.88 39.55 8.33 52.12 F 289039 17.47 10.55 6.92 82.53
U P 676029 29.24 26.79 2.45 70.76 M 362155 _48.11 44.42 3.69 51.89 F 313874 7.45 6.44 1.01 92.55
Tahsil Chakrata T P 118688 44.19 36.70 ·7.49 55.81 M 62361 52.70 47.65 5.05 47.30 F 56327 34.78 24.58 10.20 65.22
R P 115191 44.28 36.61 7.67 55.72 -M 60196 52.35 47.22 5.13 47.65
F 54995 35.44 25.00 10.44 64.56 U P 3497 41.40 39.66 1.74 58.60
M 2165 /
62.17 59:08 2.59 - 37.83 ...... ~ F 1332 7.66 7.28 0.38 92.34
Chakrata CB U P 3497 41.40 39.66 1.74 58.60 M 2165 62.17 59.58 2.59 37.83 F 1332 7.66 7.28 0.38 92.34

Table 2 Percentage of workers and non·w.orkers to total population StatelUnion Territory, Districts, Tahsils, Urban Agglomerations, Cities
and Towns by residence and sex: 2001
StatelDistricVTahsillUAlCityfTown Civic Totall Personsl Total Percentage to total population Non status of Rurall Males/ Population Total Workers Main Marginal Workers
CitytTown Urban Females (Main + Marginal) Workers Workers
Tahsil Vlkasnagar T P 232149 32.61 24.41 8.20 67.39
M 121668 48.52 39.44 9.08 51.48
F 110481 15.08 7.85 7.23 84.92
R P 210422 33.01 24.48 8.53 66.99
M 110231 48.51 39.27 9.24 51.49
F 100191 15.94 8.20 7.74 84.06
U P 21727 28.77 23.73 5.04 71.23
M 11437 48.58 41.03 7.55 51.42
- '. F 10290 6.73 4.49 2.24 93.27
Vikasnagar MB U P 12485 30A6 23.32 7.14 69.54 J M 6571 51.59 40.66 10.93 48.41
• F 5914 6.98 4.04 2.94 93.02 Herbertpur NP U P 9242 26.47 24.28 2.19 73.53
M 4866 44.53 41.53 3.00 55.47
F 4376 6.38 5.10 1.28 93.62 Tahsil Dehradun T P 741126 29.28 25.94 3.34 70.72
- M 394562 47.61 42.73 4.88 52.39
F 346564 8.41 6.82 1.59 91.59
R P 174923 28.67 22.20 6.47 71.33
M 91432 . 45.28, 36.18 9.10 54.72 '. F 83491 10.48 6.89 3.59 89.52
U P 567525 29.47 27.10 2.37, 70.53 M, 303912 48.31 44.71 3.60 51.69
F 263613 7.75 6.79 0.96 92.25 Dehradun UA U P 530159 29.35 26.97 2.38 70.65
M 283050 48.21 44.61 ' 3.60 51.79 -
F 247109 7.75 6.77 0,98 92.25 (a) Dehradun M.Corp. U P 425790 28.48 ,26.01 2.47 71.52
M 224045 46.74 42.97 3.77 53.26 F 201745 8.20 7.18 1.02 91.80
(b) FRI and College Area CT U P 5428 27.80 26.51 1.29 72.20
/ M 2861 45.93 43.66 2.27 54.07 -F 2567 7.59 7.40 0.19 92.41
(c) Dehradun CB U P 54399 36.01 34.48 1.53 63.99 M 31785 57.48 55.36 2.12 42.52 F 22614 5.83 5.14 0.69 94.17
(d) Clement Town CB U P 19634 34.68 32.84 _ 1.84 65.32 M 11470 56.55 53.80 2.75 43.45 F 8164 3.97 3.39 0.58 96.03
(e) Raipur CT U P 24908 25.77 22.41 3.36 74.23 M 12889 43.75 38.54 5.21 56.25
• F 12019 6.47 5.11 1.36 93.53 Mussoori UA ..- U P 29319 32.19 31.05 1.14 _67.81
M 16523 50.55 48.94 1.61 49.45 F 12796 8.48 7.96 0.52 91.52
(a) Mussoori MB U - P 26069 32.19 30.92 1.27 67.81 M 14726 50.35 48.55 1.80 49.65
! , F 11343 8.62 8.04 0.58 91.38 ,
(b) Landour , - CB U P 3250 32.18 32.12 0.06 67.82 "'-r- _ M 1797 52.26 52.20 0.06 47.74 F 1453 7.37 7.30 0.07 92.63
Doiwala NP U P 8047 27.60 21.10 6.50 72.40
'" M 4339 46.67 35.58 11.09 53.33 F 3708 5.28 4.15 1.13 94.72
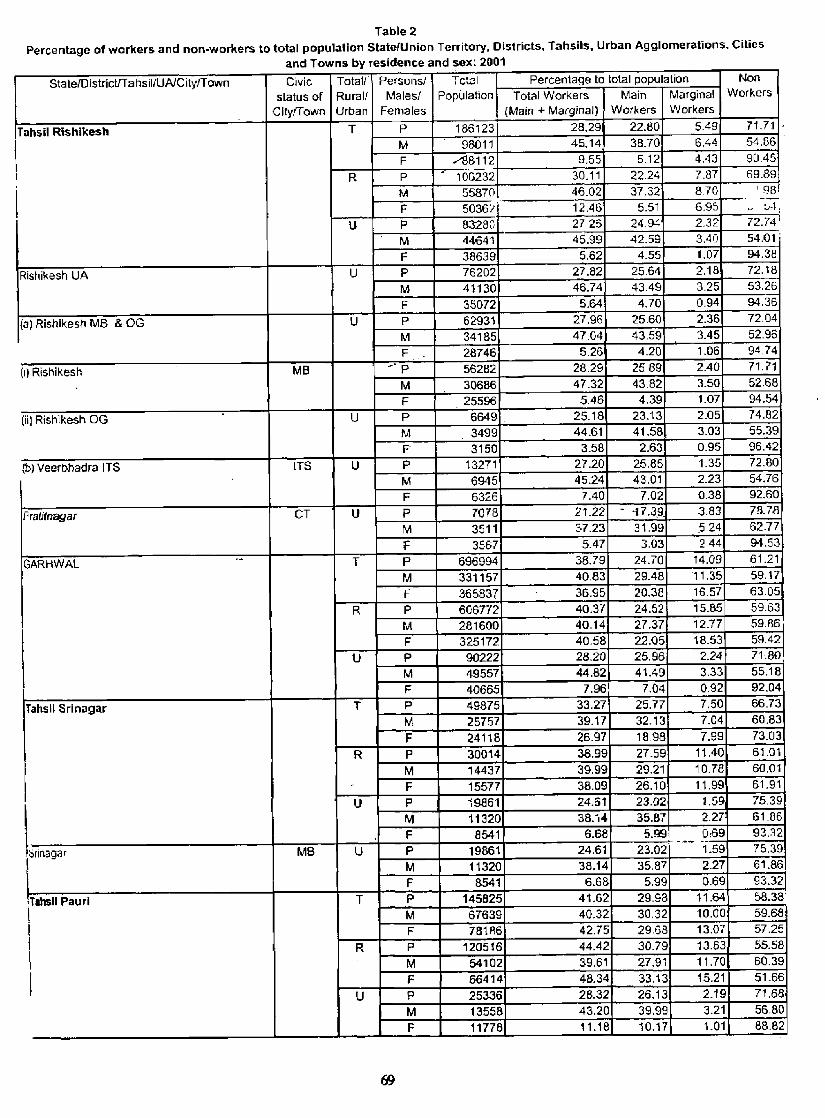
Table 2 Percentage of workers and non-workers to total population StatefUnion Territory, Oistricts, Tahsils, Urban Agglomerations, Cities
and Towns by residence and sex: 2001
StatelDistricUTahsillUAfCitylTown Civic Total! Persons! Tc~l Percentage to lotal population Non
status of Rural! Males! Population Total Workers Main Marginal Workers
CitylTown Urban Females (Main + Marginal) Workers Workers
Tahsil Rishikesh T p 186123 28.29 22.80 5.49 71.71
M 98011 45.14 38.70 6.44 54.86
F ,......g8112 9.55 5.12 4.43 90.45
R p . 106232 30.11 22.24 7.87 69.89
M 55870 46.02 37,32 8.70 198 -F 5036:! 12.45 5.51 6.9~ Lo :A
U p 8328G 2726 24,94- 2.32 72.74
M 44641 45.99 42.59 3.40 54.01
F 38639 5.62 4.55 1.07 94.38
Rishikesh UA U P 76202 27.82 25.54 2.18 72.18
M 41130 46.74 43.49 3.25 53.26
F 35072 5.64 4.70 0.94 94,36
ta) Rishikesh MB & OG U p 6293. 27.96 25.6{) 2.35 72.04
M 34185 47.04 43.59 3.45 52,96
F 28746 5.26 4.20 1.06 94,74
(I} Rishikesh MB _. P
56282 28.29 25.89 2.40 71.71
M 30686 47.32 43.82 3.50 52.68
F 25596 5.46 4.39 1.07 94.54
(ii) Rishlkesh OG U P £649 25.18 23.13 2.05 74.82
M 3499 44.61 41.58 3.03 55.39
F 3150 3.58 2.63 0.95 96.42
It) Veerbhadra ITS lTS U P 13271 27.20 25.85 1.35 72.80
M 6945 45.24 43.01 2.23 54.76
F 6326 7.40 7.02 0.38 92.60
Pratitnagar CT U P 7078 21.22 - -17.39 3.83 78.78
M 3511 37.23 31.99 .5.24 52.'17
f 3567 5.47 3.03 2.44 94.53
GARHWAL ~~. T P 696994 38.79 24.70 14.09 61.21
M 331157 40.83 29.48 11.35 59.17
F 365837 36.95 20.38 16.57 63.05
R P 606772 40.37 24.52 15.85 59.63
M 2816QO 40.14 27.37 12.77 59.86
F 325172 40.58 22.05 18.53 59.42
U P 90222 28.20 25.96 2.24 71.BO
M 49557 44.82 41.49 3.33 55.18
F 40665 7.96 7.04 0,92 92.04
Tahsil Sri nagar T p 49875 33.27 25.77 7.50 66.73
M 25757 39.17 32.13 7.04 60.83
F 24118 26.97 18.98 7.99 73.03
R p 30014 38.99 27.59 11.40 61.01
M 14437 39.99 29.21 10.78 60.01 .~ F 15577 38.09 26.10 11.99 61.91
Lna"",
U p i9861 24.61 23.02 1.59 75.39
M 11320 38.14 35.87 2.27 61.86
F 8541 6.68 5.99 0,59 93.12
MB U P 19861 24.61 23.02 1.59 75.3D
M 11320 38.14 35.87 2.27 61.86
F 8541 6.68 5.99 0.69 93.32
~Tlhsil Pauri T p 145825 41.62 29.98 1'1.64 58.38
I M 67639 40.32 30.32 10.00 59.68
F 781R6 42.75 29.68 13.07 57.25
R P 120516 44.42 30.79 13.53 55.58
M 54102 39.61 27.91 11.70 60.39
I F 66414 48.34 33.13 15.21 51.66
U P 25336 2B.32 26.13 2.19 71.68
M 13558 43.20 39.99 3.21 56.80
F 11778 11.18 10.17 1.01 88.82
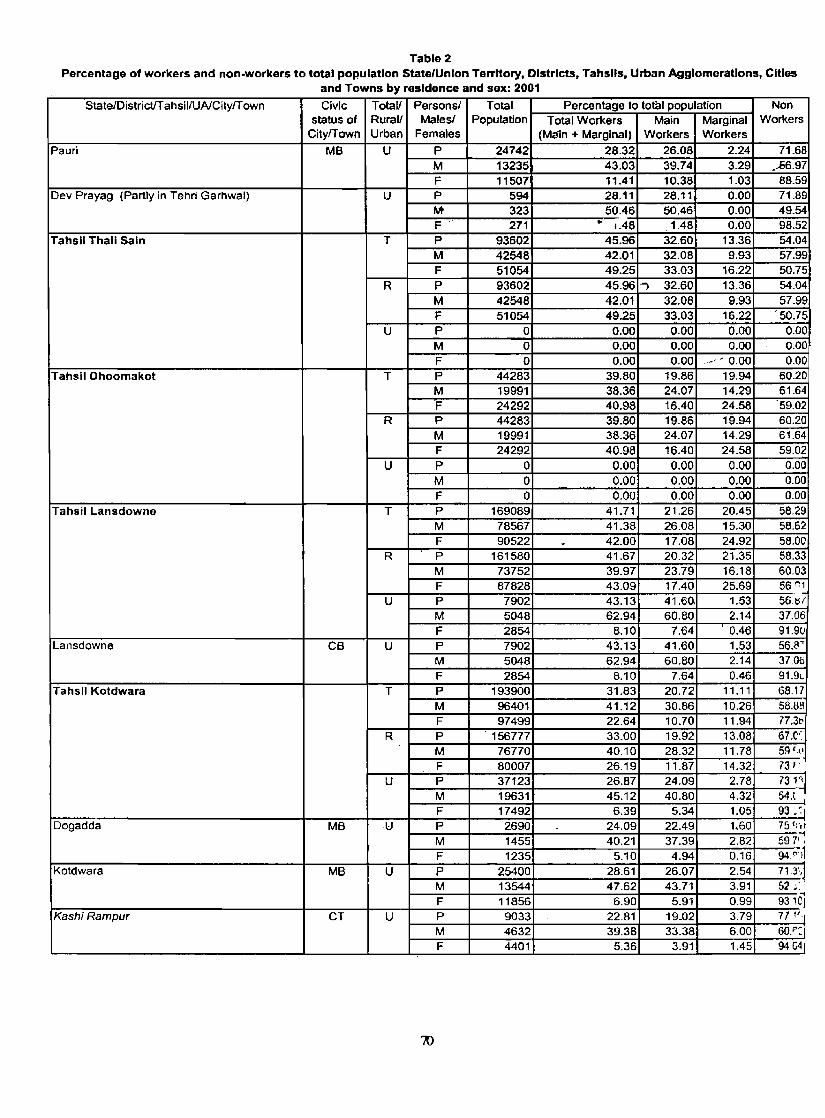
Table 2 Percentage of workers and non-workers to total population State/Union TerrHory, Districts, Tahslls, Urban Agglomerations, Cities
and Towns by residence and sex: 2001
State/DistrictIT ahsil/UNCitylT own Civic Totall Personsl Total Percentage to total population Non status of Rurall Males! Population Total Workers Main Marginal Workers
CitylTown Urban Females (Main + Marginal) Workers Workers
Pauri MB U P 24742 28.32 26.08 2.24 71.68 M 13235 43.03 39.74 3.29 .-66.97 F 11507 11.41 10.38 1.03 88.59
Dev Prayag (Partly in Tehri Garhwal) U P 594 26.11 28.11 0.00 71.89 M 323 50.46 50.46 0.00 49.54 F 271 .. 1,48 1,48 0.00 98.52
Tahsil Thall Saln T P 93602 45.96 32.60 13.36 54.04 M 42548 42.01 32.08 9.93 57.99 F 51054 49.25 33.03 16.22 50.75
R P 93602 45.96 'J 32.60 13.36 54.04 M 42548 42.01 32.08 9.93 57.99 F 51054 49.25 33.03 16.22 '50.75
U p 0 0.00 0.00 0.00 0.00 M 0 0.00 0.00 0.00 0.00 F 0 0.00 0.00 __ - 0.00 0.00
Tahsil Dhoomakot T P 44283 39.80 19.86 19.94 60.20 M 19991 38.36 24.07 14.29 61.64 F 24292 40.98 16,40 24.58 59.02
R P 44283 39.80 19.86 19.94 60.20 M 19991 38.36 24.07 14.29 61.64 F 24292 40.98 16.40 24.58 59.02
U P 0 0.00 0.00 0.00 0.00 M 0 0.00 0.00 0.00 0.00 F 0 0.00 0.00 0.00 0.00
Tahsil Lansdowne T P 169089 41.71 21.26 20.45 58.29 M 78567 41.38 26.08 15.30 58.62 F 90522 - 42.00 17.08 24.92 58.00
R P 161580 41.67 20.32 21.35 58.33 M 73752 39.97 23.79 16.18 60.03 F 87828 43.09 17.40 25.69 56 ~1
U P 7902 43.13 41.60. 1.53 56,l;S(
M 5048 62.94 60.80 2.14 37.06 F 2854 8.10 7.64 0.46 91.90
Lansdowne CB U P 7902 43.13 41.60 1.53 56.B~
M 5048 62.94 60.80 2.14 37.06 F 2854 8.10 7.64 0.46 91.9L
Tahsil Kotdwara T P 193900 31.63 20.72 11.11 6817 M 96401 41.12 30.86 10.26 58.utl F 97499 22.64 10.70 11.94 77.3to
R P , 156777 33.00 19.92 13.08 67.(" M 76770 40.10 28.32 11,78 Sql."
F 80007 26.19 11.87 14.32 731 '
U P 37123 26.87 24.09 2.78 731'" M 19631 45.12 40.80 4.32 54.( 'l
F 17492 6.39 5.34 1.05 93 . ~I Dogadda MB U P 2690 24.09 22.49 1.60 75 (,',1
M 1455 40.21 37.39 2.82 597'; F 1235 5.10 4.94 0.16 94,0:>-)1
Kotdwara M8 U P 25400 28.61 26.07 2.54 7U'~~ M 13544 47.62 43.71 3.91 5:L. .. F 11856 6.90 5.91 0.99 931Cl
Kashi Rampur CT U P 9033 22,81 19.02 3.79 71 "j M 4632 39.38 33.38 6.00 60,1':1 F 4401 5.36 3.91 1,45 94 C41
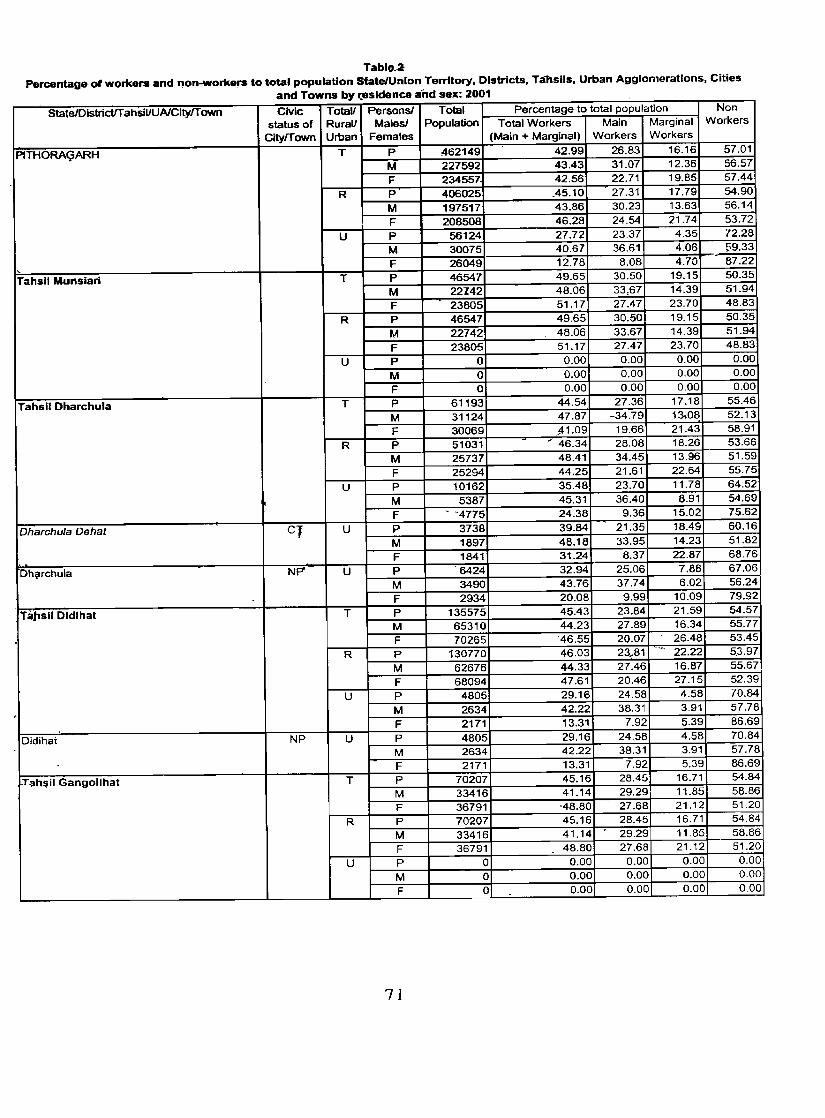
Tablo2 Percentage of workers and non-workers to total population State/Union Territory, Districts, Tanslls, Urban Agglomerations, Cities
and Towns by residence and sex: 2001 . StatelDistrictIT ahsillUAiCitylT own Civic Total! Persons! Total Percentage to total population Non
status of RuraV Males! Population Total Workers Main Marginal Workers
CityfTown Urban Females (Main + Marginal) Workers Workers
PITHORA<;;ARH T P 462149 42.99 26.83 16.16 57.01
M 227592 43.43 31.07 12.36 56.57
F 234557, 42.56 22.71 19.85 57.44
R P 406025 A5.10 27.31 17.79 54.90
M 197517 43.86 30.23 13.63 56.14
F 208508 46.28 24.54 21.74 53.72
U P 56124 27.72 23.37 4.35 72.28
M 30075 40.67 36.61 4.06 59.33
F 26049 12.78 8.08 4.70 87.22 , Tahsil Munsiari T P 46547 49.65 30.50 19.15 50.35
M 22142 48.06 33,67 14.39 51.94
F 23805 51.17 27.47 23.70 48.83
R P 46547 49.65 30.50 19.15 50.35
M 22742 48.06 33.67 14.39 51.94
F 23805 51.17 27.47 23.70 48.83
U P 0 0.00 0.00 0.00 0.00
M 0 0.00 0.00 0.00 0.00
F 0 0.00 0.00 0.00 0.00
Tahsil Dharchula T P 61193 44.54 27.36 17.18 55.46
M 31124 47.87 -34.79 13.08 52.13
F 30069 ft 1.09 19.66 21.43 58.91
R P 51031 ' 46.34 28.08 18.26 53.66
M 25737 48.41 34.45 13.96 51.59
F 25294 44.25 21.61 22.64 55.75
U P 10162 35.48 23.70 11.78 64.52
M 5387 45.31 36.40 8.91 54.69
F - -4775 24.38 9.36 15.02 75.62
Dharchuta Dshat Cl U P 3738 39.84 21.35 18.49 60.16
M 1897 48.18 33.95 14.23 51.82
F 1841 31.24 8.37 22.87 68.76
. Ohi(lrchula NP' U P 6424 32.94 25.06 7.88 67.06
M 3490 43.76 37.74 6.02 56.24
F 2934 20.08 9.99 10.09 79.92
T;ijlsll Dldlhat T p 135575 45.43 23.84 21.59 54.57
M 65310 44.23 27.89 16.34 55.77
F 70265 '46.55 20.07 26.48 53.45
R P 130770 46.03 23..81 - 22.22 5.3.97
M 62676 44.33 27.46 16.87 55.67
F 68094 47.61 20.46 27.15 52.39
U P 4805 29.16 24.58 4.58 70.84
M 2634 42.22 38.31 3.91 57.78
F 2171 13.31 7.92 5.39 86.69
Didihat NP U P 4805 29.16 24.58 4.58 70.84
M 2634 42.22 38.31 3.91 57.78
F 2171 13.31 7.92 5.39 86.69
~'lh$iI Gangolihat T P 70207 45.16 28.45 16.71 54.84
M 33416 41.14 29.29 11.85 58.86
F 36791 '48.80 27.68 21.12 51.20
R P 70207 45.16 28.45 16.71 54.84
M 33416 41.14 - 29.29 11.85 58.86
F 36791 48.80 27.68 21.12 51.20
U P 0 0.00 0.00 0.00 0.00
M 0 0.00 0.00 0.00 0.00
F 0 0.00 0.00 0.00 0.00
71
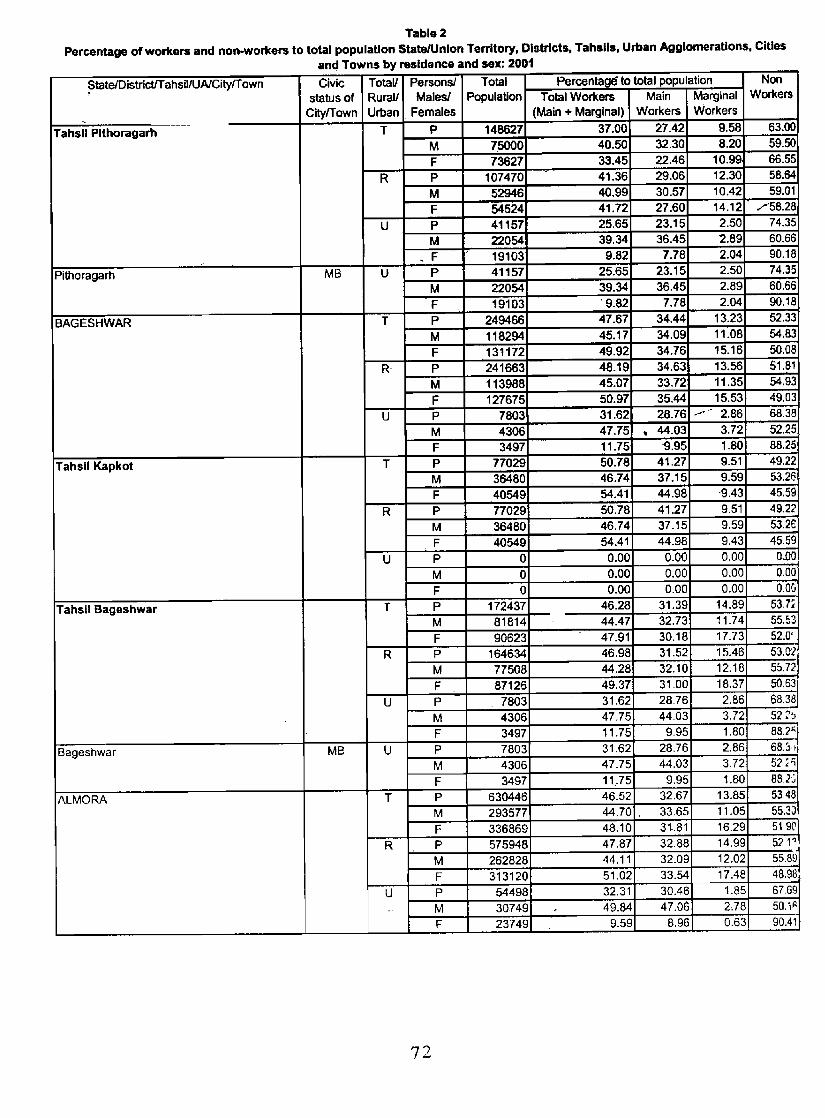
Table 2 Percentage of workers and non-workers to total population State/Union Territory, Districts, Tahslls, Urban Agglomerations. Cities
and Towns by residence and sex: 2001
~tatelDistricUT ahsillUA/CityfT own Civic Totall Persons! Total Percentage to total population Non
status 6f Rural! Malesl Population Total Workers Main Marginal Workers
City/Town Urban Females (Main + Marginal) Workers Workers -
Tahsil Pithoragarh T P 148627 37.00 27.42 9.58 63.00
M 7,5000 40.50 32.30 8.20 59.50
F 73627 33.45 22.46 10.99 66.55
R P 107470 41.36 29.06 12.30 58.64
M 52946 40.99 30.57 10.42 59.01
F 54524 41.72 27.60 14.12 /58.28
U P 41157 25.65 23.15 2.50 74.35
M 22054 39.34 36.45 2.89 60.66
• F 19103 9.82 7.78 2.04 90.18 -
Pithoragarh MB U P 41157 25.65 23.15 2.50 74.35
M 22054 39.34 36.45 2.89 60.66
F 19103 '9.82 7.78 2.04 90.18
BAGESHWAR T P 249466 47.67 34.44 13.23 52.33
M 118294 45.17 34.09 11.08 54.83
F 131172 49.92 34.76 15.16 50.08
R P 241663 48.19 34.63 13.56 51.81
M 113988 45.07 33.72 11.35 54.93
F 127675 50.97 35.44 15.53 49.03
U P 7803 31.62 28.76 ,......~ 2.86 68.38
M 4306 47.75 ~ 44.03 3.72 52.25
F 3497 11.75 -9.95 1.80 88.25
Tahsil Kapkot T P 77029 50.78 41.27 9.51 49.22
M 36480 46.74 37.15 9.59 53.26
F 40549 54.41 44.98 '9.43 45.59
R P 77029 50.78 41.27 9.51 49.22
M 36480 46.74 37.15 9.59 SJ.2e
F 40549 54.41 44.98 9.43 45.59
U P 0 0.00 0.00 0.00 OllO M 0 0.00 0.00 0.00 0.00
F 0 0.00 0.00 0.00 O.oCr
Tahsil Bageshwar T p 172437 46.28 31.39 14.89 53.7~
M 81814 -
44.47 32.73 11.74 55.53
F 90623 47.91 30.18 17.73 52.0'
R P 164634 46.98 31.52 1!).46 53.0(1
M 77508 44.28 32.10 12.18 55.72
F 87126 49.37 31.00 18.37 50.63
U P 7803 31.62 28.76 2.86 68.38
M 4306 47.75 44.03 3.72 5:n'!J
F 3497 11.75 9.95 1.80 88./"
8ageshwar MB U P 7803 31.62 28.76 2.86 68.J·t
M 4306 47.75 44.03 3.72 52 -'Ii F 3497 11..75 9.95 1.80 88.2:'
ALMORA T P 630446 46.52 32.67 13.85 53.48
M 293577 44.70 . 33.65 1.1.05 55.3J
F 336869 48.10 31-.81 16.29 5190
R P 575948 47.87 32.88 14.99 521"
M 262828 44.11 32.09 12.02 55.891 F 313120 51.02 33.54 17.48 48.981
U P 54498 32.31 30.46 1.85 67.69
.- M 30749 . 49.84 47.00 2.78 50.11'.
F 23749 9.59 8.96 0.63 90.41
72
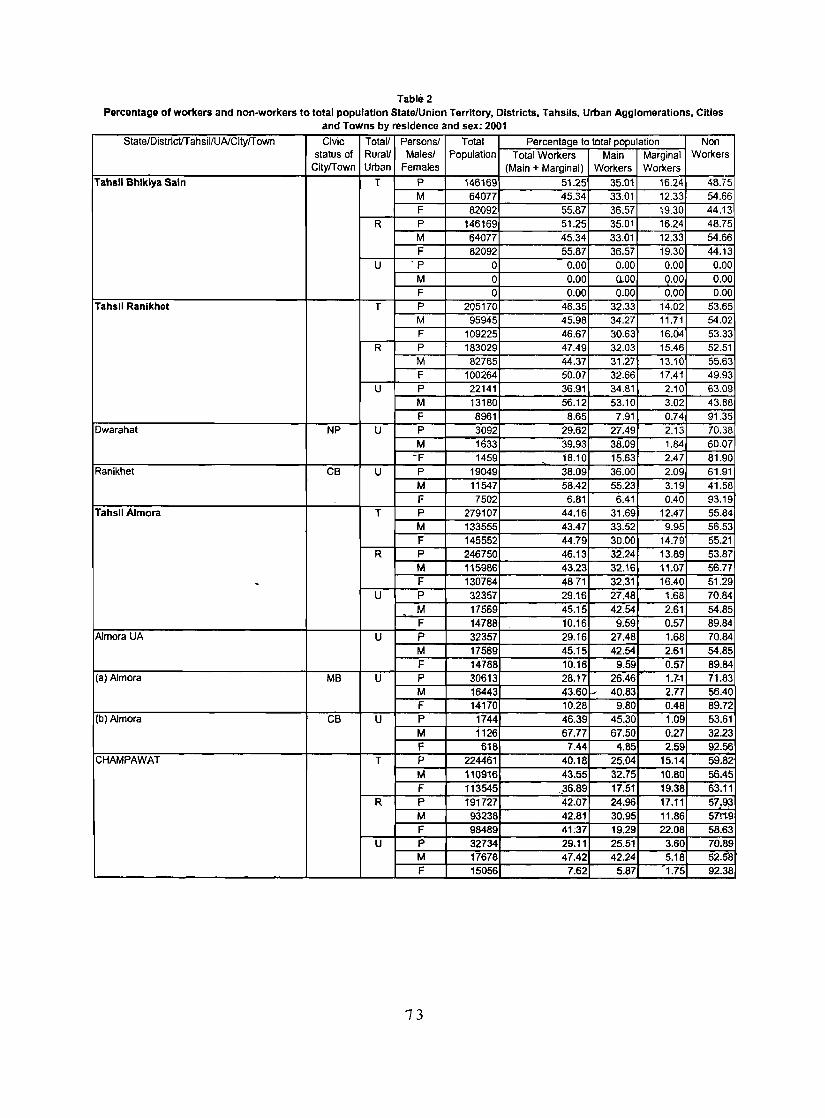
Table 2 Percentage of workers and non-workers to total population State/Union Territory, Districts, Tahsils, Urban Agglomerations. Cities
and Towns by residence and sex: 2001
State/DistrlctIT ahsll/UAICitylT own Civic Totall Personsl Total Percentage to total population Non status of Rurall Malesl Population Total Workers Main Marginal Workers
CitylTown Urban Females (Main + Marginal) Workers Workers Tahsil Bhlklya Saln T P 146169 51.25 35.01 16.24 48.75
M 64077 45.34 33.01 12.33 54.66 F 82092 55.87 36.57 19.30 44.13
R P 146169 51.25 35.01 16.24 48.75 M 64077 45.34 33.01 12.33 54.66 F 82092 55.87 36.57 19.30 44.13
U 'P 0 0.00 0.00 0.00 0.00 M 0 0.00 a.oo Q.OO 0.00 F 0 0.00 0.00 0.00 0.00
Tahsil Ranlkhet T P 205170 46.35 32.33 14.02 53.65 M 95945 45.98 34.27 11.71 54.02 F 109225 46.67 30.63 16.04 53.33
R P 183029 47.49 32.03 15.46 52.51 M 82765 44.37 31.27 13.10 55.63 F 100264 50.07 32.66 17.41 49.93
U P 22141 36.91 34.81 2.10 63.09 M 13180 56.12 53.10 3.02 43.88 F 8961 8.65 7.91 0.74 91.35
Dwarahat NP U P 3092 29.62 27.49 2.13 70.38 M 1633 39.93 38.09 1.84 60.07
-F 1459 18.10 15.63 2.47 81.90 Ranikhet CB U P 19049 38.09 36.00 2.09 61.91
M 11547 58.42 55.23 3.19 41.58 F 7502 6.81 6.41 0.40 93.19
Tahsil Almora T P 279107 44.16 31.69 12.47 55.84 M 133555 43.47 33.52 9.95 56.53 F 145552 44.79 30.00 14.79 55.21
R P 246750 46.13 32.24 13.89 53.87 M 115986 43.23 32.16 11.07 56.77
- F 130764 4871 32.31 16.40 51.29 U P 32357 29.16 27.48 1.68 70.84
M 17569 45.15 42.54 2.61 54.85 F 14788 10.16 9.59 0.57 89.84
AJmora UA U P 32357 29.16 27.48 1.68 70.84 M 17569 45.15 42.54 2.61 54.85 F 14788 10.16 9.59 0.57 89.84
(a) Almora MB U P 30613 28.17 26.46 1.7-1 71.83 M 16443 43.60 I- 40.83 2.77 56.40 F 14170 10.28 9.80 0.48 89.72
(b) AJmora CB U P 1744 46.39 45.30 1.09 53.61 M 1126 67.77 67.50 0.27 32.23 F 618 7.44 4.85 2.59 92.56
CHAMPAWAT T P 224461 40.18 25.04 15.14 59.82 M 110916 43.55 32.75 10.80 56.45 F 113545 _36.89 17.51 19.38 63.11
R P 191727 42.07 24.96 17.11 57.9;3 M 93238 42.81 30.95 11.86 57ft9 F 98489 41:37 19.29 22.08 58.63
U P 32734 29.11 25.51 3.60 70.89 M 17678 47.42 42.24 5.18 52.sa F 15056 7.62 5.87 1.75 92.38
13
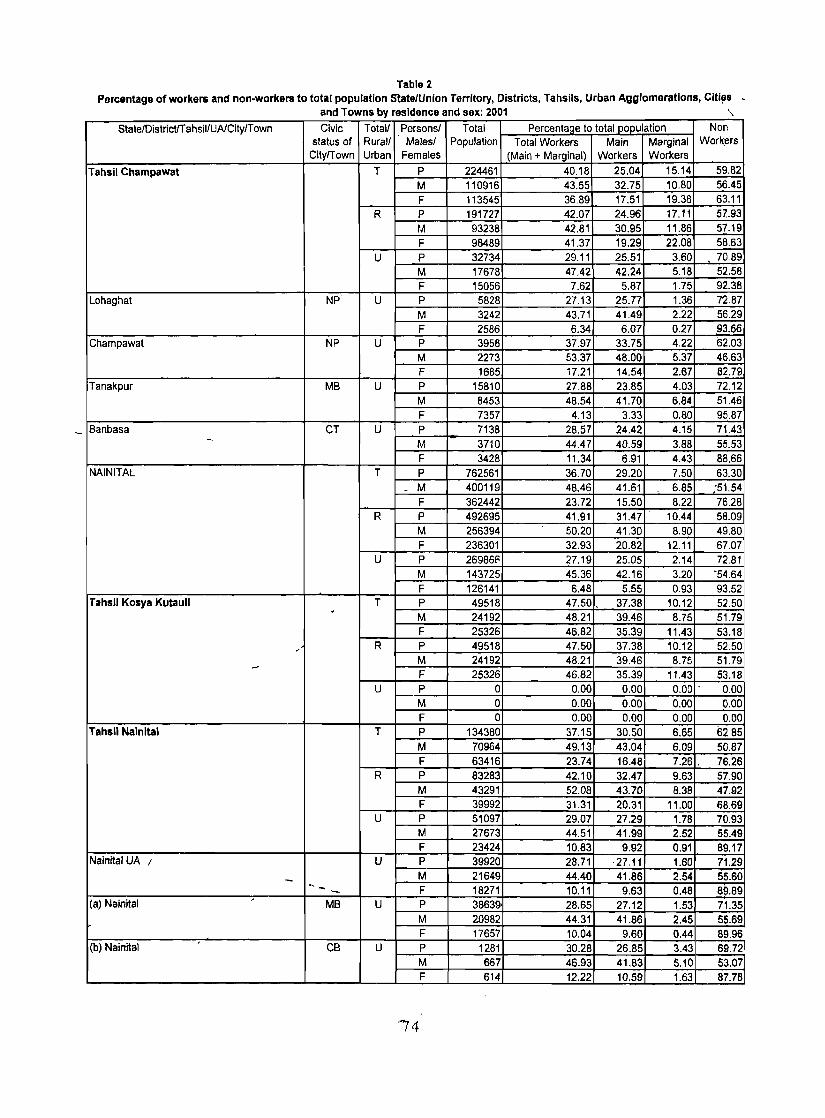
Table 2 Percentage of workers and non-workers to total population State/Union Territory, Districts, Tahsils, Urban Agglomerations, Citif;iB -
and Towns by residence and sex: 2001 "
State/DistrietIT ahsil/UAICitylT own Civic Total/ Personsl Total Percenta~e to total population Non status of Rural! Malesl Population Total Workers Main Marginal Work;ers
CilylTown Urban Females (Main + Marginal) Workers Workers
Tahsil Champawat T P 224461 40.18 25.04 15.14 59.82
M 110916 43.55 32.75 10.80 56.45
F 113545 36.89 17.51 19.38 63.11
R P 191727 42.07 24.96 17.11 57..93
M 93238 42.81 30.95 11.86 57.19
F 98489 41.37 19.29 22.08 58.63 U P 32734 29.11 25.51 3.60 70.89
M 17678 47.42 42.24 5.18 52.58 F 15056 7.62 5.87 1.75 92.38
Lohaghat NP U P 5828 2'1.13 25.77 1.36 72.87 M 3242 43.71 41.49 2.22 56.29 F 2586 6.34 6.07 0.27 93.66
Champawat NP U P 3958 37.97 33.75 4.22 62.03 M 2273 53.37 48.00 5.37 46.63 F 1685 17.21 14.54 2.67 82.79
Tanakpur MB U P 15810 27.88 23.85 4.03 72.12 M 8453 48.54 41.70 6.84 51.46 F 7357 4.13 3.33 0.80 95.87
Banbasa CT U P 7138 28.57 24.42 4.15 71.43 - M 3710 44.47 40.59 3.88 55.53 F 3428 11.34 6.91 4.43 88.66
NAINITAL T P 762561 36.70 29.20 7.50 63.30 _ M 400119 48.46 41.61 6.85 '51.54
F 362442 23.72 15.50 8.22 76.28 R P 492695 41.91 31.47 10.44 58.09
M 256394 50.20 41.30 8.90 49.80 F 236301 32.93 20.82 12.11 67.07
U P 26986p 27.19 25.05 2.14 72.81 M 143725 45.36 42.16 3.20 -54.64 F 126141 6.48 5.55 0.93 93.52
Tahsil Kosya KutauJi T P 49518 47.50. 37.38 10.12 52.50 . M 24192 48.21 39.46 8.75 51.79 F 25326 46.82 35.39 11.43 53.18
? R P 49518 47.50 37.38 10.12 52.50
M 24192 48.21 39.46 8.75 51.79 - F 25326 46.82 35.39 11.43 53.18 U P 0 0.00 0.00 0.00 . 0.00
M 0 0.00 0.00 0.00 0.00 F 0 0.00 0.00 0.00 0.00
Tahsil Nainital T P 134380 37.15 30.50 6.65 6285 M 70964 49.13 43.04 6.09 50.87 F 63416 23.74 16.48 7.26. 76.26
R P 83283 42.10 32.47 9.63 57.90 M 43291 52.08 43.70 8.38 47.92 F 39992 31.31 20.31 11.00 68.69
U P 51097 29.07 27.29 1.78 70.93 M 27673 44.51 41.99 2.52 55.49 F 23424 10.83 9.92 0.91 89.17
Nainital UA I U P 39920 28.71 ·27.11 1.60 71.29
- M 21649 44.40 41.86 2.54 55.60 -- F 18271 10.11 9.63 0.48 ·8~.89 -(a) Nainital
, MB U P 38639' 28.65 27.12 1.53 71.35
M 20982 44.31 41.86 2.45 55.69 F 17657 10.04 9.60 0.44 89.96
(b) Nainital ,
CB U P 1281 30.28 26.85 3.43 69.72 M 667 46.93 41.83 5.10 53.07 F 614 12.22 10.59 1.63 87.78
74
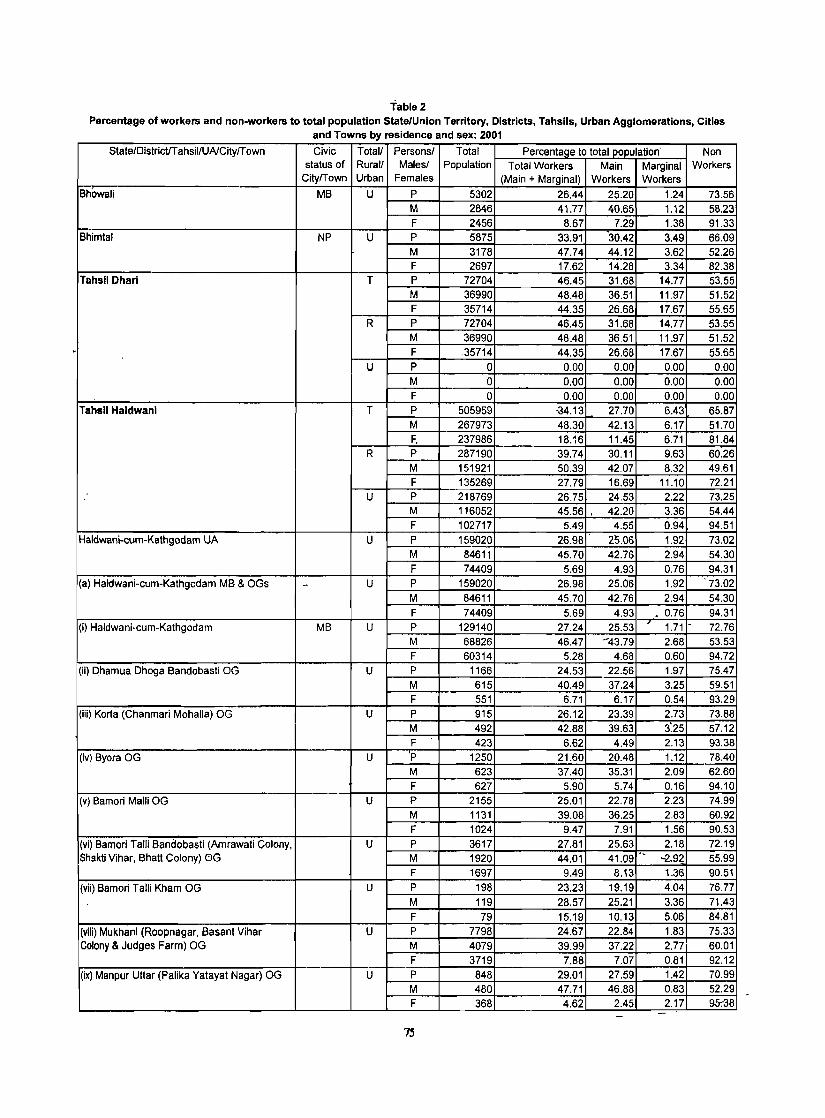
.
Table 2 PercentcJge of workers and non-workers to total population State/Union Territory, Districts, Tahsils, Urban Agglomerations, Cities
and Towns by residence and sex: 2001
State/Dislrict/T ahsillUNCilyfT own Civic Totall Personsl Total Percenlage 10 lolal populalion' Non status of Rural! Malesl Population Total Workers Main Marginal Workers
CityfTown Urban Females (Main + Marginal) Workers Workers Bhowali MB U P 5302 26.44 25.20 1.24 73.56
M 2846 41.77 40.65 1.12 58.23 F 2456 8.67 7.29 1.38 91.33
Bhimlal NP U P 5875 33.91 -30.42 3.49 66.09 M 3178 47.74 44.12 3.62 52.26 F 2697 17.62 14.28 3.34 82.38
Tahsil Chari T P 72704 46.45 31.68 14.77 53.55 M 36990 48.48 36.51 11.97 51.52 F 35714 44.35 26.68 17.67 55.65
R P 72704 46.45 31.68 14.77 53.55 M 36990 48.48 36.51 11.97 51.52 F 35714 44.35 26.68 17.67 55.55
U P 0 0.00 0.00 0.00 0.00 M 0 0.00 0.00 0.00 0.00 F 0 0.00 0.00 0.00 0.00
Tahsil Haldwanl T P 505959 -a4.13 27.70 6.43 65.87 M 267973 48.30 42.13 6.17 51.70 F. 237986 18.16 11.45 6.71 81.84
R P 287190 39.74 30.11 9.63 60'.26 M 151921 50.39 42.07 8.32 49.61 F 135269 27.79 16.69 11.10 72.21
U P 218769 26.75 24.53 2.22 73.25 M 116052 45.56 42.20 3.36 54.44 F 102717 5.49 4.55 0.94 94.51
Haldwani-cum-Kathgodam UA U P 159020 26.98 2'5.06 1.92 73.02 M 84611 45.70 42.76 2.94 54.30 F 74409 5.69 4.93 0.76 94.31
(a) Haldwani-cum-Kalhgodam MB & OGs - U P 159020 26.98 25.06 1.92 . 73.02
M 84611 45.70 42.76 2.94 54.30 F 74409 5.69 4.93 • 0.76 94.31
(i) Haldwani-cum-Kathgodam MB U P 129140 27.24 25.53 1.71 - 72.76 M 68826 46.47 -43.79 2.68 53.53 F 60314 5.28 4.68 0.60 94.72
(ii) Qhamua Dhoga Bandobasti OG U P 1166 24.53 22.56 1.97 75.47 M 615 40.49 37.24 3.25 59.51 F 551 6.71 6.17 0.54 93.29
(iii) Korta (Chanmari Mohalla) OG U P 915 26.12 23.39 2.73 73.88 M 492 42.88 39.63 3:25 57.12 F 423 6.62 4.49 2.13 93.38
(iv) Byora OG U P 1250 21.60 20.48 1.12 78.40 M 623 37.40 35.31 2.09 62.60 F 627 5.90 5.74 0.16 94.10
(v) Bamori Malli OG U P 2155 25.01 22.78 2.23 74.99 M 1131 39.08 36.25 2.83 60.92 F 1024 9.47 7.91 1.56 90.53
(vi) Bamori Talli BandQbasti (Amrawati Colony, U P 3617 27.81 25.63 2.18 72.19 Shakli Vihar, Bhatt Colony) 0G M 1920 44.01 41.09 -. '"12..92 '55.99
F 1697 9.49 8.13 1.36 90.51
(vii) Bamori Talli Kham OG U P 198 23.23 19.19 4.04 76.77 M 119 28.57 25.21 3.36 71.43 F 79 15.19 10.13 5.06 84.81
(viii) Mukhani (Roopnagar, Basant Vihar U P 7798 24.67 22.84 1.83 75.33 Colony & Judges Farm) OG M 4079 39.99 37.22 2.77 60.01
F 3719 7.88 7.07 0.81 92.12 (ix) Manpur Uttar (Palika Yatayal Nagar) OG U P 848 29.01 27.59 1.42 70.99
M 480 47.71 46.88 0.83 52.29 F 368 4.62 2.45 2.17 95:"38
.
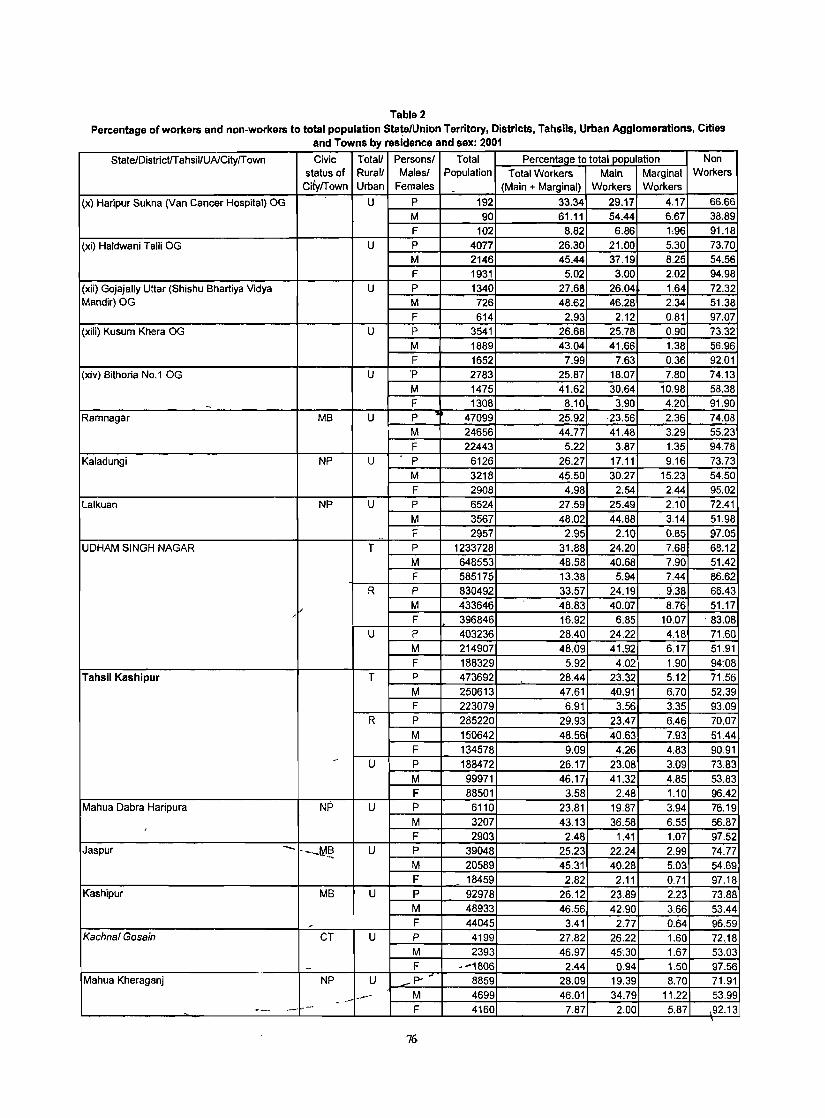
Table 2 Percentage of workers and non-workers to total population State/Union Territory, Districts, Tahsils, Urban Agglomerations, Cities
and Towns by resi'dence and sex: 2001
State/District/T ahsil/UNCitylT own Civic Totall Personsl Total Percentage to total population Non status of Rural! Malesl Population Total Workers Main Marginal Workers
CiiylTown Urban Females - (Main + Marginal) Workers Workers
(x) Haripur Sukha (Van Cancer Hospital) OG U P 192 33.34 29.17 4.17 66.66
M 90 61.11 54.44 6.67 38.89
F 102 8.82 6.86 1,96 91.18
(xi) Haldwani Talli OG U P 4077 26.30 21.00 5.30 73.70
M 2146 45.44 37.19 8.25 54.56
F 1931 5.02 3.00 2.02 94.98
(xii) Gojajally Uttar (Shishu Bhartiya Vidya U P 1340 27.68 26.04 1.64 72.32 Mandir) OG M 726 48.62 46.28 2.34 51.38
F 614 2.93 2.12 0.81 97~07
(xiii) Kusum Khera OG U P 3541 26.68 25.78 0.90 73.32
M 1889 43.04 41.66 1,38 56.96
F 1652 7.99 7.63 0.36 92.01
(xiv) Bithoria No.1 OG U P 2783 25.87 18.07 7.80 74.13
M 1475 41.62 30.64 10.98 58.38
- F 1308 8.10 3.90 4.20 91.90
Ramnagar MB U P 47099 25.92 23.56 2.36 74.08 M 24656 44.77 41.48 3.29 55.23
F 22443 5.22 3.87 1.35 94.78 -Kaladungi NP U P 6126 26.27 17.11 9,16 73.73
M 3218 45.50 30.27 15.23 54.50
F 2908 4.98 2.54 2.44 95.02
Lalkuan NP U P 6524 27.59 25.49 2.10 72.41
M 3567 48.02 44.88 3.14 51.98
F 2957 2.95 2.10 0.85 97.05 UDHAM SINGH NAGAR T P 1233728 31.88 24.20 7,68 68:12
M 648553 48.58 40.68 7.90 51.42 F 585175 13.38 5.94 7.44 86.62 -
R P 830492 33.57 24.19 9.38 66.43
), M 433646 48.83 40.07 8.76 51.17 F 396846 16.92 6.85 10.07 . 83.08
U P 403236 28.40 24.22 4.18 71.60 M 214907 48.09 41.92 6.17 51.91 F 188329 5.92 4.02 1.90 94:08
Tahsil Kashipur T P 473692 28.44 23.32 5.12 71.56 M 250613 47.61 40.91 6.70 52.39 F 223079 6.91 3.56 3.35 93.09
R P 285220 29.93 23.47 6.46 70.07 M 150642 48.56 40.63 7.93 51.44 F 134578 9.09 4.26 4.83 90.91 - U P 188472 26.17 23.08 3.09 73.83 M 99971 46.17 41.32 4.85 53.83 F 88501 3.58 2.48 1.10 96.42
Mahua Dabra Haripura NP U P 6110 23.81 19.87 3.94 76.19 M 3207 43.13 36.58 6.55 56.87 , F 2903 2.48 1.41 1.07 97.52
Jaspur - ---li:1~ u P 39048 25.23 22.24 2.99 74.77 M 20589 45.31 40.28 5.03 54.69 F - 18459 2.82 2.11 0.71 97.18
Kashipur MB U P 92978 26.12 23.89 2.23 73.88 M 48933 46.56 42.90 3.66 53.44
,- F 44045 3.41 2.77 0.64 96.59 Kachnal Gosain CT U p 4199 27.82 26.22 1.60 72.18
M 2393 46.97 45:30 1.67 53.03
- F • oM1806 2.44 0.94 1.50 97.56 Mahua Kheraganj NP U -po ~ 8859 28.09 19.39 8.70 71.91
- -- _....- M 4699 46.01 34.79 11.22 53.99 -_ - - F 4160 7.87 2.00 5.87 ,92.13
76
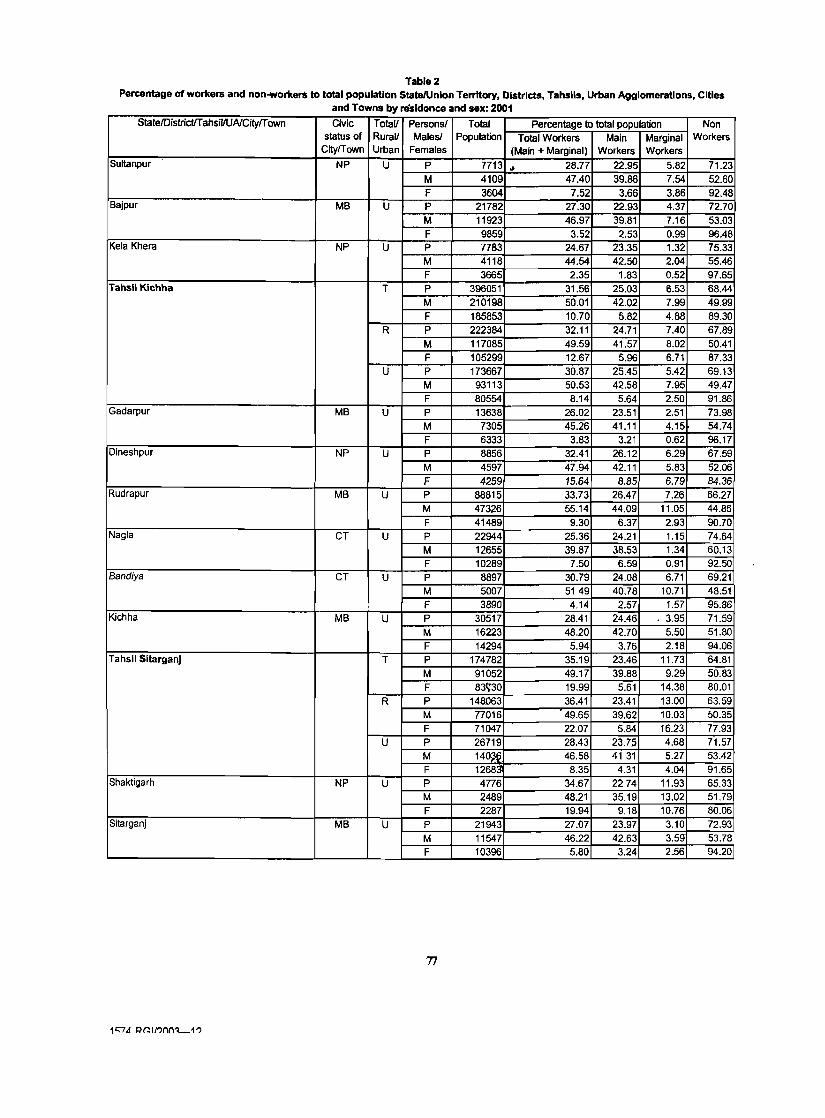
Table 2 Percentage of workers and non-workerS to total population StatelUnlon Territory, Districts, Tahslls, Urban Agglomerations, Cities
and Towns by nisldonce and sex: 2001
StalelDistrictlTahsiVUAlCityfTown Civic TotaV Persons! Total Percentage 10 total population Non status of RuraV Males! Population Total Workers Main Marginal Workers
CityfTown Urban Females (Main + Marginal) Workers Workers Sultanpur NP U P 7713 .. 28.77 22.95 5.82 71.23
M 4109 47.40 39.86 7.54 52.60 F 3604 7.52 3.66 3.86 92.48
Bajpur MB U P 21782 27.30 22.93 4.37 72.70 M 11923 46.97 39.81 7.16 53.03 F 9859 3.52 2.53 0.99 96.48
Kela Khera NP U P 7783 24.67 23.35 1.32 75.33 M 4118 44.54 42.50 2.04 55.46 F 3665 2.35 1.83 0.52 97.65
Tahsil Klchha T P 396051 31.56 25.03 6.53 68.44 M 210198 50.01 42.02 7.99 49.99 F 185853 10.70 5.82 4.88 89.30
R P 222384 32.11 24.71 7.40 67.89 M 117085 49.59 41.57 8.02 50.41 F 105299 12.67 5.96 6.71 87.33
U P 173667 30.87 25.45 5.42 69.13 M 93113 50.53 42.58 7.95 49.47 F 80554 8.14 5.64 2.50 91.86
Gadarpur MB U P 13638 26.02 23.51 2.51 73.98 M 7305 45.26 41.11 4.15 54.74 F 6333 3.83 3.21 0.62 96.17
Dineshpur NP U P 8856 32.41 26.12 6.29 67.59 M 4597 47.94 42.11 5.83 52.06 F 4259 15.64 8.85 6.79 84.36
Rudrapur MB U P 88815 33.73 26.47 7.26 66.27 M 473;26 55.14 44.09 11.05 44.86 F 41489 9.30 6.37 2.93 90.70
Nagla CT U P 22944 25.36 24.21 1.15 74.64 M 12655 39.87 38.53 1.34 60.13 F 10289 7.50 6.59 0.91 92.50
8andiya CT U P 8897 30.79 24.08 6.71 69.21 M 5007 5149 40.78 10.71 48.51 F 3890 4.14 2.57 1.57 95.86
Kichha MB U P 30517 28.41 24.46 3.95 71.59 M 16223 48.20 42.70 5.50 51.80 F 14294 5.94 3.76 2.18 94.06
Tahsil Sitarganj T P 174782 35.19 23.46 11.73 64.81 M 91052 49.17 39.88 9.29 50.83 F 831;30 19.99 5.61 14.38 80.01
R P 148063 36.41 23.41 13.00 63.59 M 77016 49.65 39.62 10.03 50.35 F 71047 22.07 5.84 16.23 . 77.93
U P 26719 28.43 23.75 4.68 71.57 M 140~~ 46.58 4131 5.27 53.42 F 12683: 8.35 4.31 4.04 91.65
Shaktigarh NP U P 4776 34.67 2274 11.93 65.33 M 2489 48.21 35.19 13.02 51.79 F 2287 19.94 9.18 10.76 80.06
Sitarganj MB U P 21943 27.07 23.97 3.10 72.93 M 11547 46.22 42.63 3.59 53.78 F 10396 5.80 3.24 2.56 94.20
77
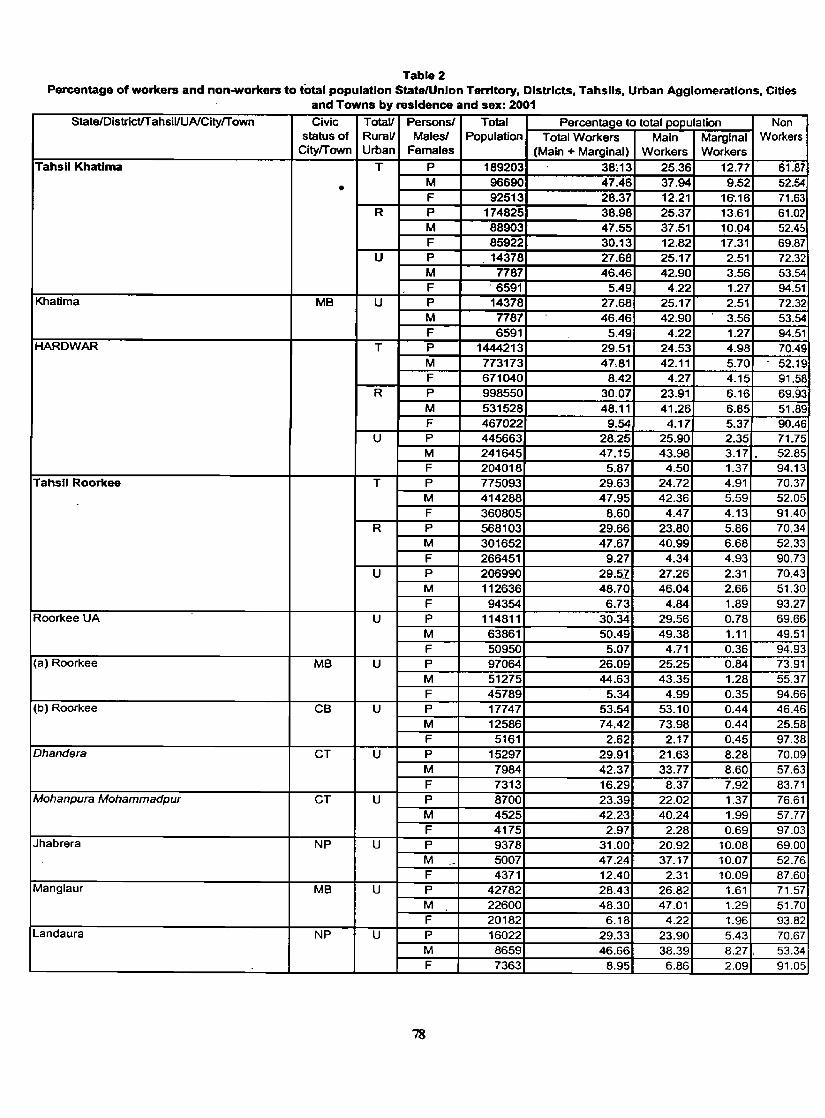
Table 2 Percentage of workers and non-workers to total population State/Unlon Territory, Districts, Tahslls, Urban Agglomerations, Cities
and Towns by residence and sex: 2001
StateiDistrictIT ahsillUAiCityfT own Civic Total! Persons! Total Percentage to total population Non status of Rural! Males! Population Total Workers Main Marginal Workers
Cityrrown Urban Females (Main + Marginal) Workers Workers Tahsil Khatlma T P 189203 38:13 25.36 12.77 61.87
• M 96690 47.46 37.94 9.52 52.54 F 92513 28.37 12.21 16".16 71.63
R P 174825 38.98 25.37 13.61 61.02 M 88903 47.55 37.51 10·94 52.45 F 85922 30.13 12.82 17.31 69.87
U P 14378 27.68 25.17 2.51 72.32 M 7787 46.46 42.90 3.56 53.54 F . 6591 5.49 4.22 1.27 94.51
Khatima MB U P 14378 27.68 25.17 2.51 72.32 M 7787 46.46 42.90 3.56 53.54 F 6591 5.49 4.22 1.27 94.51
HARDWAR T P 1444213 29.51 24.53 4.98 70.49 M 773173 47.81 42.11 5.70 52.19 F 671040 8.42 4.27 4.15 91.58
R P 998550 30.07 23.91 6.16 69.93 M 531528 48.11 41.26 6.85 51.89 F 467022 9.54 4.17 5.37 90.46
U P 445663 28.25 25.90 2.35 71.75 M 241645 47.15 43.98 3.17 . 52.85 F 204018 5.87 4.50 1.37 94.13
Tahsil Roorkee T P 775093 29.63 24.72 4.91 70.37 M 414288 47.95 42.36 5.59 52.05 F 360805 8.60 4.47 4.13 91.40
R P 568103 29.66 23.80 5.86 70.34 M 301652 47.67 40.99 6.68 52.33 F 266451 9.27 4.34 4.93 90.73
U P 206990 29.51 27.26 2.31 70.43 M 112636 48.70 46.04 2.66 51.30 F 94354 6.73 4.84 1.89 93.27
Roorkee UA U P 114811 30.34 29.56 0.78 69.66 M 63861 50.49 49.38 1.11 49.51 F 50950 5.07 4.71 0.36 94.93
(a) Roorkee MB U P 97064 26.09 25.25 0.84 73.91 M 51275 44.63 43.35 1.28 55.37 F 45789 - 5.34 4.99 0.35 94.66
(b) Roorkee CB U P 17747 53.54 53.10 0.44 46.46 M 12586 74.42 73.98 0.44 25.58 F 5161 2.62 2.17 0.45 97.38
Dhandera CT U P 15297 29.91 21.63 8.28 70.09 M 7984 42.37 33.77 8.60 57.63 F 7313 16.29 8.37 7.92 83.71
Mohanpura Mohammadpur CT U P 8700 23.39 22.02 1.37 76.61 M 4525 42.2-3 40.24 1.99 57.77 F 4175 2.97 2.28 0.69 97.03
Jhabrera NP U P 9378 31.00 20.92 10.08 69.00 M 5007 47.2~ 37.17 10.07 52.76 F 4371 12.40 2.31 10.09 87_60
Manglaur MB U P 42782 28.43 26.82 1.61 71.57 M 22600 48.30 47.01 1.29 51.70 F 20182 6.18 4.22 1.96 93.82
Landaura NP U P 16022 29.33 23.90 5.43 70.67 M 8659 46.66 38.39 8.27. 53.34 F 7363 8.95 6.86 2.09 91.05
78

Table 2 Percentage of workers and non-workers to total population State/Union Territory, Districts, Tahsils, Urban Agglomerations, Cities
and Towns by residence and sex: 2001
I State/DistricUTahsillUAlCitylTown Civic Total! Persons! Total Percentage to total population Non
status of Rural! Males! Population Total Workers Main Marginal Workers
CitylTown Urban Females (Main + Marginal) Workers Workers
[Tahsil Hardwar T P 478966 28:21 23.85 4.36 71.79
M 257016 46.61 40.76 5.85 53.39
F 221950 6.90 4.26 2.64 93.10
R P 258533 29.19 23.09 6.10 70.81
M 137857 47.32 39.51 7.81 52.68
F 120676 8.48 "-4.33 4.15 91.52
U P 220433 27.06 24.74 2.32 72.94
M .,~~9159 45.80 42.22 3.58 54.20
F 101274 5.02 4.18 0.84 94.98
Hardwar UA U P 220433 27.06 24.74 2.32 72.94
M 119159 45.80 42.22 3.58 54.20
F 101274 5.02 4.18 0.84 94.98
(a) Hardwar MB and OGs U P 177181 27.37 24.74 2.63 72.63
M 96107 46.16 42.14 4.02 53.84
F 81074 5.11 4.12 0.99 94.89
Ii) Hardwar MB U P 175010 27.46 24.80 2.66 72.54
M 94650 46.48 42.40 4.08 53.52
F .80360 5.07 4.07 1.00 94.93
(ii) G(Jrukul Kangri OG U P 1899 21.64 21.48 0.16 78.36
M_, 1220 28.19 28.03 0.16 71.81
I 'F 679 9.87 9.72 0.15 90.13
(~) Jwalapur Mahavidyala OG U P 272 11.77 11.40 0.37 88.23
M - 237 12.23 11.81 0.42 '87.77
F 35 8.57 8.57 0.00 91.43
j{b) Bharat Heavy Elerical Limited Ranipur ITS U P 43252 ~ 25.76 24.72 1.04 74.24
1 M 23052 44.27 42.53 1.74 55.73
F 20200 4.64 4.40 0.24 95.36
Tahtlll Laksar T P 190154 32.27 25.43 6.84 67.73
M 101869 50.27- 44.46 5.81 49.73
F 88285 11.51 3.47 8.04 88.49
R P 171914 32.75 25.51 7.24 67.25
M 92019 50.73 44.75 5.98 49.27
F 79895 12.05 3.36 8.69 87.95
U P 18240 27.71 24.61 3.10 72.29
M 9850 45.86 41.69 4.17 54.14
F 8390 6.41 4.56 1.85 93.59
Laksar NP U P 18240 27.71 24.61 3.10 72.29
M 9850 45.86 41.69 4.17 54.14
F 8390 6.41 4.56 1.85 93.59
79
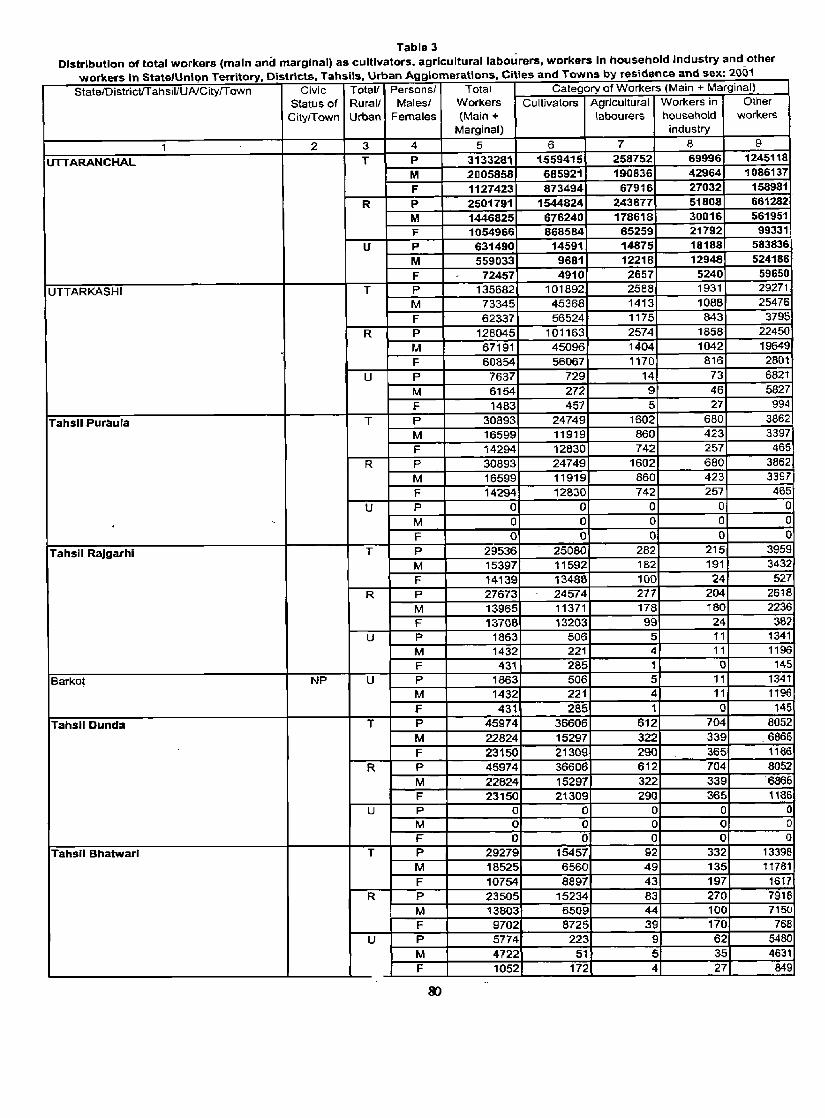
Table 3 Distribution of total workers (main and marginal) as cultivators. agricultural labourers. workers In household Industry and other
workers In StatelUniQn Territory Districts Tahsils Urban Agglomerations Cities and Towns by residence and sex: 24)01 . . . . State/DistrictlTahsil/UNCitylTown Civic Total! Personsl Total Category of Workers (Main + Marginal)
Status of Rurall Malesl Workers Cultivators Agricultural Workers in Other
CitylTown Urban Females (Main + labourers household workers Marginal) industry
1 2 3 4 5 6 7 8 9
UTTARANCHAL T P 3133281 1559415 258752 69996 1245118
M 2005858 685921 190836 42964 1086137 F 1127423 873494 67916 27032 158981
R P 2501791 1544824 243877 51808 661282 M 1446825 676240 178618 30016 561951 F 1054966 868584 65259 21792 99331
U P 631490 14591 14875 18188 583836 M 559033 9681 12218 12948 524186 F - 72457 4910 2657 5240 59650
UTTARKASHI T P 135682 101892 2588 1931 29271
M 73345 45368 1413 1088 25476 F 62337 56524 1175 843 3795
R P 128045 101163 2574 1858 22450 M 67191 45096 1404 1042 19649 F 60854 . 56067 1170 816 2801
U P 7637 729 14 73 6821 M 6154 272 9 46 5827 F 1483 457 5 27 994
Tahsil Puraula T P 30893 24749 1602 680 3862 M 16599 11919 860 423 3397 F 14294 12830 742 257 465
R P 30893 24749 1602 680 3862 M 16599 11919 860 423 3397 F 14294 12830 742 257 465
U P a 0 0 a 0 , M 0 0 0 0 a
F 0 0 0 a 0
Tahsil Rajgarhi T P 29536 25080 282 215 3959 M 15397 11592 182 191 3432 F 14139 13486 100 24 527
R P 27673 24574 277 204 2618 M 13965 11371 178 180 2236 F 13708 13203 99 24 381
U P 1863 506 5 11 1341 M 1432 221 4 11 1196 F 431 285 1 0 145
Barkot NP U P 1863 506 5 11 1341 M 1432 221 4 11 1196 F 431 285 1 a 145
Tahsil Dunda T P 45974 36606 612 704 8052 M 22824 15297 322 339 .6866 F 23150 21309 290 365 1186
R p 45974 36606 612 704 8052
M 22824 15297 322 339 ·6866 F 23150 21309 290 365 1186
U p 0 0 0 0 0 M 0 0 0 0 0 F 0 0 0 0 0
Tahsil Bhatwarl T P 29279 15457 92 332 13398 M 18525 6560 49 135 11781 F 10754 8897 43 197 1617
R P 23505 15234 83 270 7918 M 13803 6509 44 100 715{J
F 9702 8725 39 170 768 U P 5774 223 9 62 5480
M 4722 51 5 35 4631
F 1052 172 4 27 849

Table 3 Distribution of total workers (main and marginal) as cultivators, agricultural labourers, workers In household Industry and other
workers in StatefUnlon Territory, Districts, Tahslls, Urban Agglomerations, Cities and Towns by residence and sex: 2001 State/DistrictfTahsillUAlCityfT own Civic Total/ Personsl Total Category of Workers (Main + Marginal)
Status of Rural! Malesf Workers Cultivators Agricultural Workers in Other CityfTown Urban Females (Main + labourers household workers
Marginal) industry
Uttarkashi MB U P 5178 223 9 62 4884 M 4149 51 5 35 4058 F 1029 172 4 27 826
Gangotri NP U P 596 0 0 0 596 M 573 0 0 , 0 573 F 23 0 0 0 23
CHAMOLI T P 160119 103051 2214 2915 51939 M 79356 36685 1107 1387 40177 F 80763 66366 1107 1528 11762
R P 142696 100387 2019 2429 37861 M 65696 35961 963 1220 27552 F 77000 64426 1056 1209 10309
U P 17423 2664 195 486 14078 M 13660 724 144 167 12625 F 3763 1940 51 319 1453
Tahsil Joshlmath T P 18859 7751 208 1076 9824 M 13030 3439 159 214 9218 F 5829 4312 49 862 606
R P 12690 6810 44 995 4841 M 7841 3108 - 35 194 4504 F 4849 3702 9 801 337
U P 6169 941 164 81 4983 M 5189 331 124 20 4714 F 980 610 40 61 269
Badrlnathpuri NP U P 4f,_8 9 65 8 346 M 420 9 65 4 342
- - F 8 0 0 4 4 Joshimath - MB U P 5741 932 99 73 4637
- M 4769 322 59 - 16 _ 4372 - - F 972 610 40 57 265
Tahsil Chamoll T P 39164 26047 1288 497 11332 ,. M 20897 10061 573 171 - 10072
F 18267 .15966 715 , 326 1260 R p' 32495 25400 1280 170 ' 5645
M 15749 9930 570 //90 5159 F 16746 15470 71.0 80 486
U P 6669 647 8 327 5687 M 5148 151 3 81 4913 F 1521 496 5 246 774
Chamoli Gopeshwar MB U P 6157 647 - 8 279 5223 M 4725 151 3 74 4497 F 1432 496 5 205 726
Nand Prayag NP U P 512 0 0 48 464 M 423 0 0 7 416 F 89 ·0 0 41 48
Tahsil Pokhari T P 15930 12384 130 323 3093 M 6959 3833 41 274 2811 F 8971 8551 89 49 282
R P 15930 12384 130 323 3093 M 6959 3833 41 274 2811 F 8971 8551 89 49 282
U P 0 / 0 0 ----0 0 M 0 0 0 0 0 F 0 0 0 0 0
81
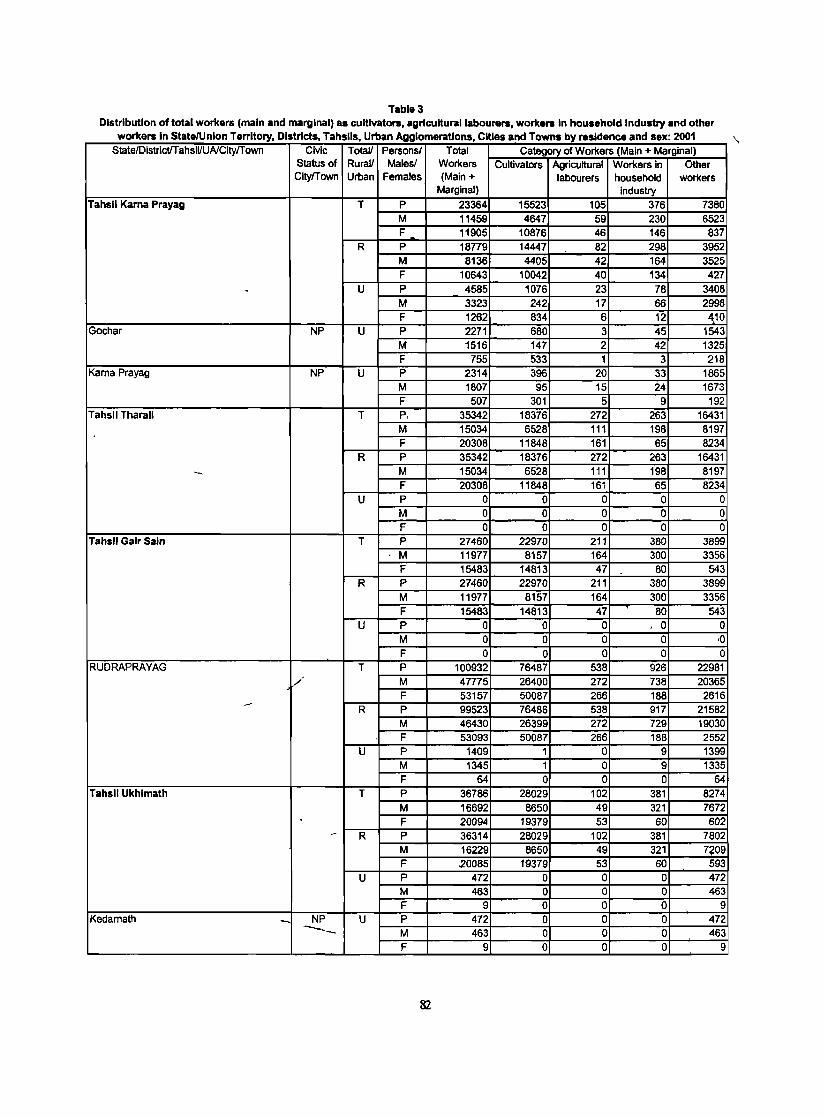
Table 3 Distribution of total workers (main and marginal) as cultivators, agricultural labourers, workers In household Industry and other
workers In State/Union Territory Districts Tahslls Urban Agglomerations Cities and Towns by residence and sex· 2001 \ , . . . State/DlstricVTahsiVUNCltyfTown Civic TotaV Personsi Total Category of Workers (Main + Marginal)
Status of RuraV Males/ Workers Cultivators Agricultural Workers in Other CityfTown Urban Females (Main + labourers household workers
Marginal) Industry Tahsil Karna Prayag T P 23364 15523 105 376 7360
M 11459 4647 59 230 6523 F 11905 10876 46 146 837
R P 18779 14447 82 298 3952 M 8136 4405 42 164 3525 F 10643 10042 40 134 427
- U P 4585 1076 23 78 3408 M 3323 242 17 66 2998 F 1262 834 6 12 410
Gochar NP U P 2271 680 3 45 1543 M 1516 147 2 42 1325 F 755 533 1 3 218
Kama Prayag NP U P 2314 396 20 33 1865 M 1807 95 15 24 1673 F 507 301 5 9 192
Tahsil Tharall T p. 35342 18376 272 263 16431 M 15034 6528 111 198 8197 F 20308 11848 161 65 8234
R P 35342 18376 272 263 16431
- M 15034 6528 111 198 8197 F 20308 11848 161 65 8234
U P 0 0 0 0 0 M 0 0 0 0 0 F 0 0 0 0 0
Tahsil Galr Sal" T P 27460 22970 211 380 3899 M 11977 8157 164 300 3356 F 15483 14813 47 80 543
R P 27460 22970 211 380 3899 M 11977 8157 164 300 3356 F 15483 14813 47 80 543
U p 0 0 0 0 0 M 0 0 0 0 0()
F 0 0 0 0 0 RUDRAPRAYAG T P 100932 76487 538 926 22981
/ M 47775 26400 272 738 20365 F 53157 50087 266 188 2616
~
R P 99523 76486 538 917 21582 M 46430 26399 272 729 19030 F 53093 50087 266 188 2552
U P 1409 1 0 9 1399 M 1345 1 0 9 1335 F 64 0 0 0 64
Tahsil Ukhlmath T P 36786 28029 102 381 8274 M 16692 8650 49 321 7672 F 20094 19379 53 60 602
- R P 36314 28029 102 381 7802 M 16229 8650 49 321 7?09 F 20085 19379 53 60 593
U P 472 0 0 0 472 M 463 0 0 0 463 F 9 0 0 0 9
Kedarnath -- NP U P 472 0 0 0 472 .--_ M 463 0 0 0 463 F 9 0 0 0 9
82
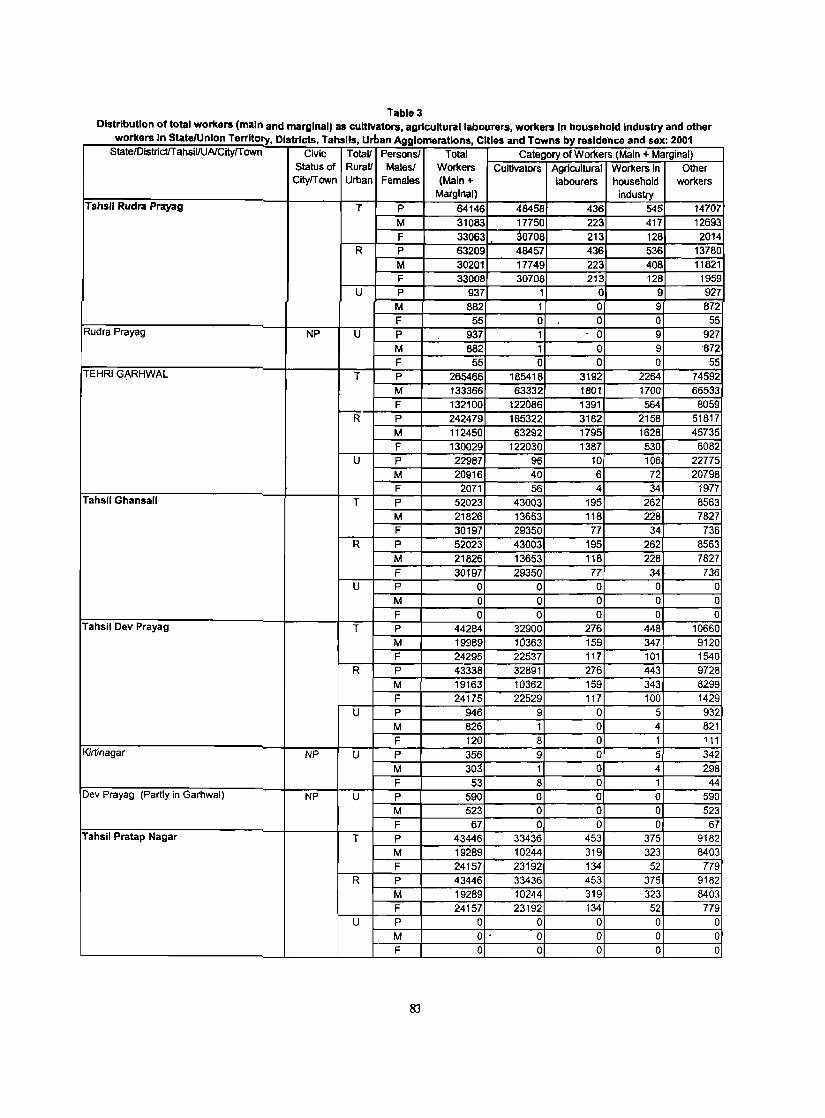
Table 3 Distribution of total workers (main and marginal) as cultivators, agricultural labourers, workers In household Industry and other
workers In State/Union Terrlto!y Districts Tahslls Urban Agglomerations Cities and Towns by residence and sex· 2001 , , , , State/DistricUT ahsiVUAlCltyff own Civic TotaV Persons! Total Category of Workers (Main + Marginal)
Status of RuraV Males! Workers Cultivators Agricultural Workers in Other Cityffown Urban Females (Main + labourers household workers
Marginal) industry Tahsil Rudra Prayag T p 64146 48458 436 545 14707
M 31083 17750 223 417 12693 F 33063 . 30708 213 128 2014
R P 63209 48457 436 536 13780 M 30201 17749 223 408 11821 F 33008 30708 213 128 1959
U P 937 1 0 9 927 M 882 1 0 9 872 F 55 0 0 0 55
Rudra Prayag NP U P 937 1 0 9 927 M 882 1 0 9 '872 F 55 0 0 0 55
TEHRI G~RHWAL T P 265466 185418 3192 2264 74592 M 133366 63332 1801 1700 66533 F 132100 122086 1391 564 8059
"""R" P 242479 185322 3182 2158 51817 M 112450 63292 1795 1628 45735 F 130029 122030 1387 530 6082
U P 22987 96 10 106 22775 M 20916 40 6 72 20798 F 2071 56 4 34 1977
Tahsil Ghansall T p 52023 43003 195 262 8563 M 21826 13653 118 228 7827 F 30197 29350 77 34 736
R P 52023 43003 195 262 8563 M 21826 13653 118 228 7827 F 30197 29350 77 34 736
U P 0 0 0 0 0 M 0 0 0 0 0 F 0 0 0 0 0
Tahsil Dev Prayag T P 44284 32900 276 448 10660 M 19989 10363 159 347 9120 F 24295 22537 117 101 1540
R P 43338 32891 276 443 9728 M 19163 10362 159 343 8299 F 24175 22529 117 100 1429
U P 946 9 0 5 932 M 826 1 0 4 821 F 120 8 0 1 111
Kirtinagar NP U P 356 9 0 5 342 M 303 1 0 4 298 F 53 8 0 1 44
Dev Prayag (Partly in Garhwal) NP U P 590 0 0 0 590 M 523 0 0 0 523 F 67 0 0 0 67
Tahsil Pratap Nagar T P 43446 33436 453 375 9182 M 19289 10244 319 323 8403 F 24157 23192 134 52 779
R P 43446 33436 453 375 9182 M 19289 10244 319 323 8403 F 24157 23192 134 52 779
U P 0 0 0 0 0 M o . 0 0 0 0 F 0 0 0 0 0
83
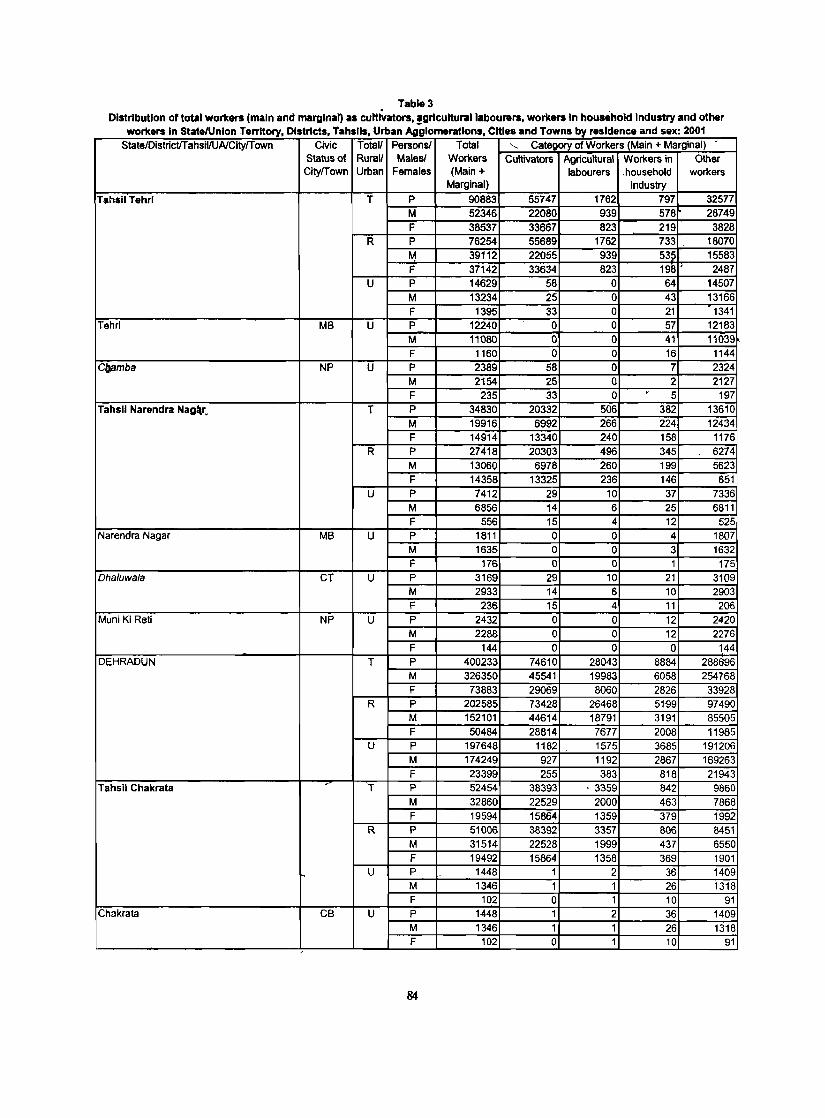
Tabla 3 Distribution of total workers (main and marginal) as cultWators, ,grlculturallabourers, workers In household Industry and other
rk 1St /U I T It 01 trt t T h II Urb Ai I tl Cltl d T b Id d 2001 wo ers n tae non. err ory, s c S, ass, an gomera ons, esan owns )y res ence an sex:
State/DistrictlTahsiVUAlCityrrown Civic Total! Persons! Total "- Category of Workers (Main + Marginal) -Status of Rural! Males! Workers Cultivators Agricultural Workers in Other Cityrrown Urban Females (Main + labourers . household workers
Marginal) industry Tahsil Tehrl T P 90883 55747 1762 797 32577
M 52346 22080 939 578 28749 F 38537 33667 823 219 3828
R P 76254 55689 1762 733 18070 M 39112 22055 939 535 15583 F 37142 33634 823 198 2487
U P 14629 58 0 64 14507 M 13234 25 0 43 13166 F 1395 33 0 21 1341
Tehri MB U P 12240 0 0 57 12183 M 11080 0 0 41 11039 F 1160 0 0 16 1144
C/Jamba NP U P 2389 58 0 7 2324 M 2154 25 0 2 2127 F 235 33 0 >. 5 197
Tahsil Narendra Nag •• T P 34830 20332 506 382 13610 M 19916 6992 266 224 12434 F 14914 13340 240 158 1176
R p 27418 20303 496 345 6274 M 13060 6978 260 199 5623 F 14358 13325 236 146 651
U P 7412 29 10 37 7336 M 6856 14 6 25 6811 F 556 15 4 12 525
Narendra Nagar MB U P 1811 0 0 4 1807 M 1635 0 0 3 1632 F 176 0 0 1 175
Dhaluwala CT U P 3169 29 10 21 3109 M 2933 14 6 10 2903 F 236 15 4 11 206
Muni Ki Reti NP U P 2432 0 0 12 2420 M 2288 0 0 12 2276 F 144 0 0 0 144
DEHRADUN T P 400233 74610 28043 8884 288696 M 326350 45541 19983 6058 254768 F 73883 29069 8060 2826 33928
R P 202585 73428 26468 51'99 97490 M 152101 44614 18791 3191 85505 F 50484 28814 7677 2008 11985
U P 197648 1182 1575 3685 191206 M 174249 927 1192 2867 169263 F 23399 255 383 818 21943
Tahsil Chakrata T P 52454 38393 . 3359 842 9860 M 32860 22529 2000 463 7868 F 19594 15864 1359 379 1992
R P 51006 38392 3357 806 8451 M 31514 22528 1999 437 6550 F 19492 15864 1358 369 1901
~ U P 1448 1 2 36 1409 M 1346 1 1 26 1318 F 1q2 0 1 10 91
Chakrata CB U P 1448 1 2 36 1409 M 1346 1 1 26 1318 F 102 0 1 10 91 ,
84

Table 3 Distribution of total workers (main and marginal) as cultivators, agricultural labourers, workers in household Industry and other
workers In State/Union Territory, Districts Tahsils Urban Agglomerations Cities and Towns by residence and sex' 2001 , , , State!Dlstnct/T ahsil!UNCityfT own Civic Total! Persons! Total Category of Workers (Main + Marginal)
Status of Rural! Males! Workers Cultivators Agricultural Workers in Other CityfTown Urban Females (Main + labourers household workers
Marginal) industry Tahsil Vikasnagar T P 75694 18941 13978 1889 40886
M 59033 11653 9996 1239 36145 F 16661 7288 3982 650 4741
R P 69445 18668 13727 1675 35375 M 53476 11422 9783 1072 31199 F 15969 7246 3944 603 4176
U P 6249 273 251 214 5511 M 5557 231 213 167 4946 F 692 42 38 47 565
Vikasnagar MB U P 3803 47 82 143 3531 M 3390 46 60 106 3178 F 413 1 22 37 353
Herbertpur NP U P 2446 226 169 71 1980 M 2167 185 153 61 1768 F 279 41 16 10 212
Tahsil Dehradun T P 217018 8204 6131 4848 197835 M 187846 5631 4794 3376 174045 F 29172 2573 1337 1472 23790
R P 50145 7434 4945 1932 35834 M 41397 5013 3930 1134 31320 F 8748 2421 1015 798 4514
U P 167246 770 1186 2918 162372 M 146814 618 864 2243 143089 F 20432 152 322 675 19283
Dehradun UA U P 155587 640 1134 2706 151107 M 136436 501 816 2059 133060 F 19151 139 "118 647 18047
(a) Dehradun M.Corp. U P 121263 404 987 2541 117331 M 104727 361 710 1935 101721 F 16536 43 .!.77 606 15610
(b) FRI and College Area CT U P 1509 0 2 5 1502 M 1314 0 2 4 1308 F 195 0 0 1 194
(c) Dehradun CB U P 19588 27 51 38 19472 M 18270 23 40 28 18179 F 1318 4 11 10 1293
(d) Clement Town CB U P 6810 74 25 35 6676 M 6486 41 6 28 6411 F 324 33 19 7 265
(e) Raipur CT U P 6417 135 69 87 6126 M 5639 76 58 64 5441 F 778 59 11 23 685
Mussoori UA U P 9438 57 8 164 9209 M 8353 4. 8 140 8156 F 1085 8 " 24 1053
(a) Mussoon MB U P 8392 57 ar-- ':;4 8163 M 7414 49 8 140 7217 F 978 8 0 24 946
(b) Landour CB U P 1046 0 0 0 1046 M 939 0 0 0 939 F 107 0 0 0 107
Doiwala NP U P 2221 73 44 48 2056 M 2025 68 40 44 1873 F 196 5 4 4 183
85
1574 RG1/2003-13
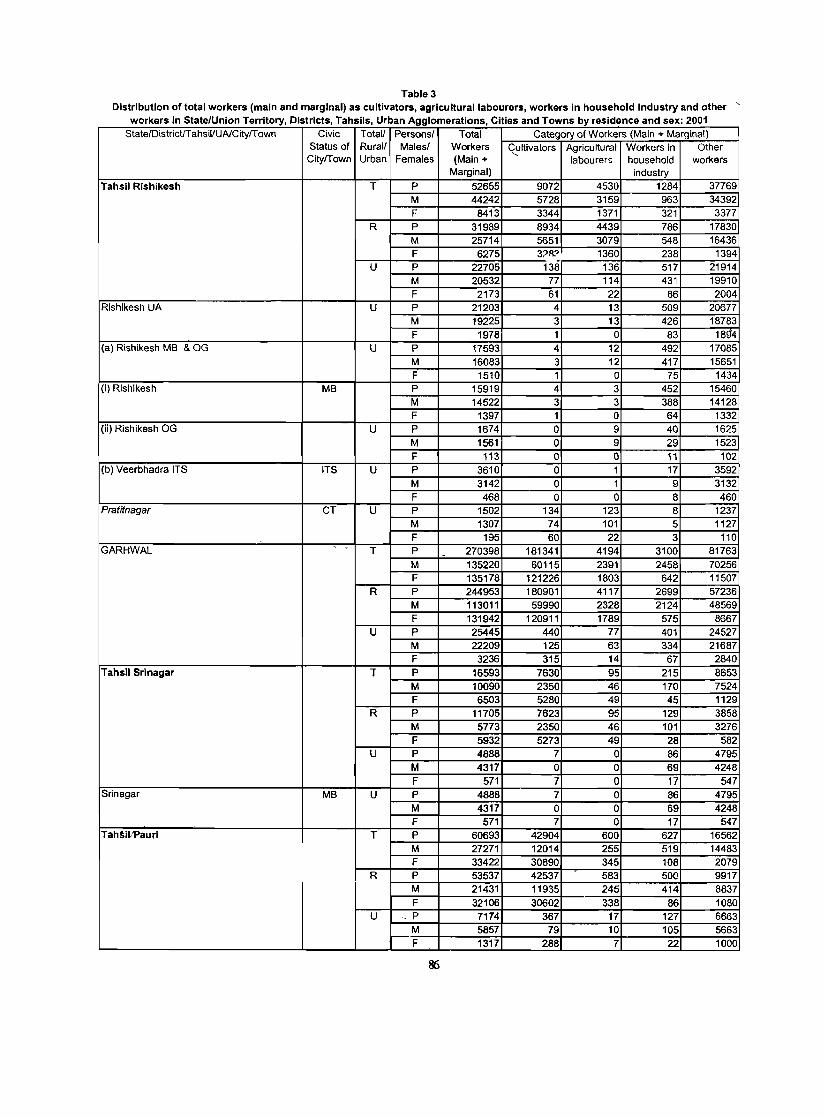
Table 3 Distribution of total workers (main and marginal) as cultivators, agricultural labourers, workers in household industry and other '
workers in State/Union Territory, Districts, Tahsils, Urban Agglomerations Cities and Towns by residence and sex: 2001 , StatefDistricUT ahsilfUAlCityfT own Civic Totall Persons! Total Category of Workers (Main + Marginal)
Status of Rurall Malesl Workers Cultivators Agricultural Workers in Other CilylTown Urban Females (Main + "-
labourers household workers Marginal) industry
Tahsil Rishikesh T P 52655 9072 4530 1284 37769 M 44242 5728 3159 963 34392 F 8413 3344 1371 321 3377
R P 31989 8934 4439 786 17830 M 25714 5651 3079 548 16436 F 6275 3?R? 1360 238 1394
U P 22705 138 136 517 21914 M 20532 77 114 431 19910 F 2173 61 22 86 2004
Rishikesh UA U P 21203 4 13 509 20677 M 19225 3 13 426 18783 F 1978 1 0 83 1894
(a) Rishikesh MB & OG U P 17593 4 12 492 17085 M 16083 3 12 417 15651 F 1510 1 0 75 1434
(i) Rishikesh MB P 15919 4 3 452 15460 M 14522 3 3 388 14128 F 1397 1 0 64 1332
(ii) Rishikesh OG U p 1674 0 9 40 1625 M 1561 0 9 29 1523 F 113 0 0 11 102
(b) Veerbhadra ITS ITS U P 3610 0 1 17 3592 M 3142 0 1 9 3132 F 468 0 0 8 460
Prafifnagar CT U P 1502 134 123 8 1237 M 1307 74 101 5 1127 F 195 60 22 3 110
GARHWAL - - T P 270398 181341 4194 3100 81763 M 135220 60115 2391 2458 70256 F 135178 121226 1803 642 11507
R P 244953 180901 4117 2699 57236 M 113011 59990 2328 2124 48569 F 131942 120911 1789 575 8667
U P 25445 440 77 401 24527 M 22209 125 63 334 21687 F 3236 315 14 67 2840
Tahsil Srlnagar T P 16593 7630 95 215 8653 M 10090 2350 46 170 7524 F 6503 5280 49 45 1129
R p 11705 7623 95 129 3858 M 5773 2350 46 101 3276 F 5932 5273 49 28 582
U P 4888 7 0 86 4795 M 4317 0 0 69 4248 F 571 7 0 17 547
Srinagar MB U P 4888 7 0 86 4795 M 4317 0 0 69 4248 F 571 7 0 17 547
TaMit'Pauri T P 60693 42904 600 627 16562 M 27271 12014 255 519 14483 F 33422 30890 345 108 2079
R P 53537 42537 583 500 9917 M 21431 11935 245 414 8837 F 32106 30602 338 86 1080
U - P 7174 367 17 127 6663 M 5857 79 10 105 5663 F 1317 288 7 22 1000
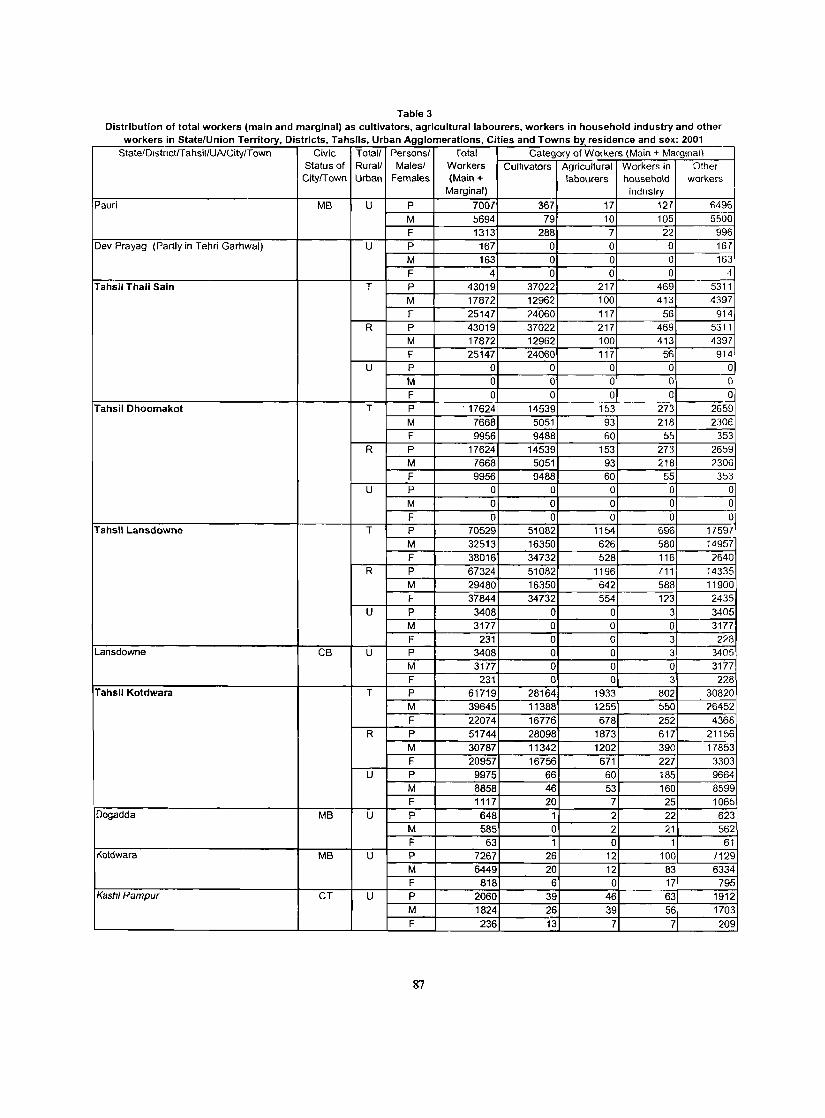
Table 3 Distribution of total workers (main and marginal) as cultivators, agricultural labourers. workers in household industry and other
workers in StatelUnion Territory Districts Tahsils, Urban Agglomerations Cities and Towns by residence and sex: 2001 , State/DlstnctlTahsillUAlCity/Town Civic Totall Personsl Total Category of Workers (Main + Marginal)
Status of Rurall Malesl Workers Cultivators Agricultural Workers in Other CitylTown Urban Females (Main + labourers household workers
Marginal) industry
Pauri MB U P 7007 367 17 127 6496
M 5694 79 10 105 5500 F 1313 288 7 22 996
Dev Prayag (Partly in Tehri Garhwal) U P 167 0 0 0 167
M 163 0 0 0 163
F 4 0 0 0 4
Tahsil Thali Sain T P 43019 37022 217 469 5311
M 17872 12962 100 413 4397
F 25147 24060 117 56 914 R P 43019 37022 217 469 5311
M 17872 12962 100 413 4397
F 25147 24060 117 56 914
U P 0 0 0 0 0
M 0 0 0 0 0 F 0 0 0 0 0
Tahsil Dhoomakot T P . 17624 14539 lb3 273 2659
M 7668 5051 93 218 2306
F 9956 9488 60 55 353 R P 17624 14539 153 273 2659
M 7668 5051 93 218 ;>306
F 9956 9488 60 55 353 U P 0 0 0 a 0
M 0 0 0 0 0
F 0 0 0 0 0 Tahsil Lansdowne T P 70529 51082 1154 696 17597
M 32513 16350 626 580 14957 F 38016 34732 528 116 ;>640
R p 67324 51082 1196 711 143:15
M 29480 16350 642 588 11900 f- 37844 34732 554 123 2435
U P 3408 0 0 3 3405 M 3177 0 0 0 3177 F 231 0 C 3 2?8
Lansdowne CB U P 3408 0 0 3 3405 M 3177 0 0 0 3177 F 231 0 0 3 228
Tahsil Kotdwara T P 61719 28164 1933 802 30820 M 39645 11388 1255 550 26452
F 22074 16776 678 252 4368 R P 51744 28098 1873 617 21156
M 30787 11342 1202 390 17853 F 20957 16756 671 227 3303
U P 9975 66 60 185 9664 M 8858 46 53 160 8599 F 1117 20 7 25 1065
Dogadda MB U P 648 1 2 22 623 M 585 0 2 21 562 F 63 1 0 1 61
i'(otdwara MB U P 7267 26 12 100 {129 M 6449 20 12 83 6334 F 818 6 0 17 795
Kashi Rampur CT U P 2060 39 46 63 1912 M 1824 26 39 56 1703 F 236 13 7 7 209

Tabl.3 Distribution of total workers (main and marginal) aa cultivators, agricultural labourers, workers In household Industry and other
workers In State/Union Territory Districts Tahslls Urban Agglomerations. Cltle. and Towns by residence and sex: 2001 , , , StatelDistricUTahsiVUNCityfT own Civic TotaV Persons! Total Category of Workers (Main + Marginal)
Status of RuraV Malesl Workers Cultivators Agricultural Workers in Other CityfTown Urban Females (Main + labourers household workers
Marginal) "- industry PITHORAGARH ... T P 198667 134489 2322 7676 54180
M 98846 47034 1229 3328 47255 F 99821 87455 1093 4348 6925
R p. 163106 133564 2302 6635 40607 M 86617 46746 1218 3060 35593 F 96491 86818 1084 3575 5014
U P 15559 925 20 1041 13573 M 12229 288 11 268 11662 F 3330 637 9 773 1911
Tahsil Munsiarl T P 23110 15792 313 2306 4699 M 10929 6098 156 687 3988 F 12181 9694 157 1619 711
R P 23110 15792 313 2306 4699 M 10929 6098 156 687 3988 ' F _ 12181 9694 157 1619 711
U P 0 0 0 0 0 M 0 0 0 0 0 F 0 0 0 0 0
Tahsil Dharchu.la T P 27255 14880 410 2556 9409 M 14900 6210 273 675 7742 F 12355 6670 137 1881 1667
R P 23650 14460 407 1842 6941 M 12459 6037 272 537 5613 F 11191 8423 135 1305 1328
U p 3605 420 3 714 2468 M 2441 173 1 138 2129 F 1164 247 2 576 339
DhlilfChula Dahet CT U P 1489 381 1 286 821 M 914 151 0 35 .726 F 575 230 1 251 93
DhatCtluia NP U P 2116 39 2 428 1647 M 1527 22 1 '103 1401 F 589 17 1 325 246
Tah$W Dldihtl& T P 61598 46246 733 1567 13052 M 28891 15915 366 973 11637 F 32707 30331 367 594 1415
R P 60197 46246 733 1407 11811 M 27779 15915 366 943 10555 F 32418 30331 367 464 1256
U P 1401 0 0 160 1241 -M 1112 0 0 30 1082 F 289 0 0 130 159
Didillat NP U p 1401 0 0 160 1241 M 1112 0 0 30 1082 F 269 0 0 130 159
Tahsil Gangolihat T P 31704 26360 130 393 4821 M 13749 9166 87 324 4172 F 17955 17194 43 69 649
R P 31704 26360 130 393 4821 M 13749 9166 87 324 4172 F 17955 17194 43 69 649
U P 0 0 0 0 0 M 0 0 0 0 0 F 0 0 0 0 0
88

Table 3 Distribution of total workers (main and marginal) as cultivators, agricultural labourers, workers in household industry and other
workers In State/Union Territory Districts Tahslls Urban Agglomerations Cities and Towns by residence and sex' 2001 , , , , State/DistricVT ahsiVUNCitylT own Civic Totall Personsl lotal Category of Workers (Main + Marginal)
Status of RuraV Malesl Workers Cultivators Agricultural Workers In Other CitylTown Urban Females (Main + labourers household workers
Marginal) industry Tahsil Pithoragarh T P 55000 31211 736 854 22199
M 30377 9645 347 669 19716 F 24623 21556 389 185 2483
R P 44447 30706 719 687 12335 M 21701 9530 337 569 11265 F 22746 21176 382 118 1070
U P 10553 505 17 167 9864 M 8676 115 10 100 8451 F 1877 390 7 67 1413
Pithoragarh MB U P 10553 505 17 167 9864 M 8676 115 10 100 8451 F 1877 390 7 67 1413
BAGESHWAR T P 118915 88795 3648 2241 24231 M 53430 29223 1607 1332 21268 F 65485 59572 2041 909 2963
R P 116448 88729 3630 2181 21908 M 51374 29209 1605 1306 19254 F 65074 59520 2025 875 2654
U P 2467 66 18 60 2323 M 2056 14 2 26 . 2014 F 411 52 16 34 309
Tahsil Kapkot T P 39115 32262 710 1280 4863 M 17050 11842 351 636 4221 F 22065 20420 359 644 642
R P 39115 32262 710 1280 4863 M 17050 11842 351 636 4221 F 22065 20420 359 644 642
U P 0 0 0 0 0 M 0 0 0 0 0 F 0 0 0 0 0
Tahsil Bageshwar T P 79800 56533 2938 961 19368 M 36380 17381 1256 696 17047 F 43420 39152 1682 265 2321
R P 77333 56467 2920 901 17045 M 34324 17367 1254 670 15033 F 43009 39100 1666 231 2012
U P 2467 66 18 60 2323 M 2056 14 2 26 2014 F 411 52 16 34 309
Bageshwar MB U P 2467 66 18 60 2323 M 2056 14 2 26 2014 F 411 52 16 34 309
ALMORA T P 293272 219292 4059 3468 66453 M 131239 69884 1769 2721 56865 F 162033 149408 2290 747 9588
R p 275667 219097 4055 3251 49264 M 115911 69862 1768 2526 41755 F 159756 149235 2281 725 7509
U P 17605 195 4 217 17189 M 15328 22 1 195 15110 F 2277 173 3 22 2079
89
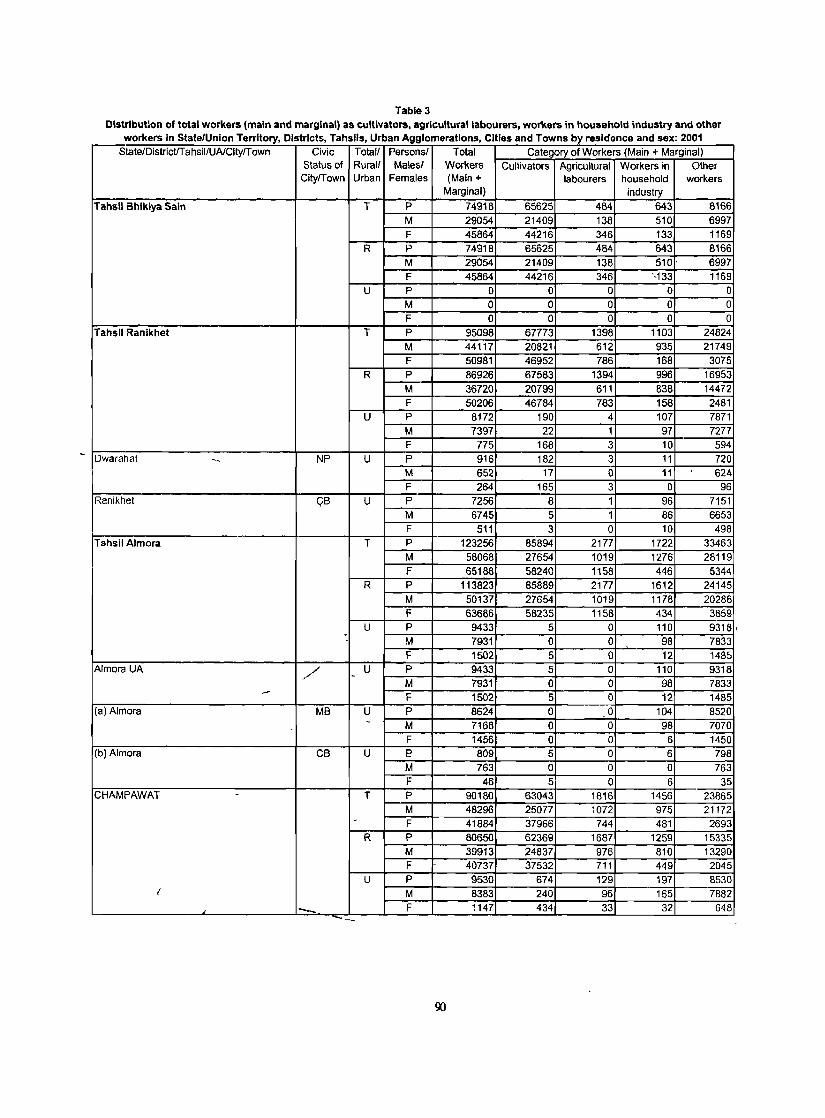
Table 3
DistributIon of total workers (main and marginal) as cultivators. agricultural labourers. workers in household industry and other workers In State/Union Territory. Districts, Tahslls, Urban Agglomerations, Cities and Towns by residence and sex: 2001
State/DistricUT ahsil/UAlCltylT own Civic Totall Personsl Total Category of Workers (Main + Marginal) Status of Rural/ Males/ Workers Cultivators Agricultural Workers in Other CitylTown Urban Females (Main + labourers household workers
Marginal) industry
Tahsil Bhikiya Saln T P 74918 65625 484 643 8166 M 29054 21409 138 510 6997 F 45864 44216 346 133 1169
R P 74918 65625 484 643 8166 M 29054 21409 138 510 ' 6997 F 45864 44216 346 '-133 1169
U P 0 0 0 0 0 M 0 0 0 0 0 F 0 0 0 0 0
Tahsil Ranikhet T P 95098 67773 1398 1103 24824 M 44117 20821 612 935 21749 F 50981 46952 786 168 3075
R P 86926 67583 1394 996 16953 M 36720 20799 611 838 14472 F 50206 46784 783 158 2481
U P 8172 190 4 107 7871 M 7397 22 1 97 7277 F 775 168 3 10 594
Dwarahat - NP U P 916 182 3 11 720 M 652 17 0 11 624 F 264 165 3 0 96
Ranikhet CiB U P 7256 8 1 96 7151 M 6745 5 1 86 6653 F 511 3 0 10 498
Tahsil Almora T P 123256 85894 2177 1722 33463 M 58068 27654 1019 1276 28119 F 65188 58240 1158 446 5344
R P 113823 85889 2177 1612 24145 M 50137 27654 1019 1178 20286 F 63686 58235 1158 434 3859
U P 9433 5 0 110 9318, . M 7931 0 0 98 7833 F 1502 5 0 12 1485
Almora UA / U P 9433 5 0 110 9318 -M 7931 0 0 98 7833 .-F 1502 5 0 12 1485
(a) AJmora MB U P 8624 0 0 104 8520 - M 7168 0 0 98 7070
F 1456 0 0 6 1450 (b)Almora CB U E' 809 5 0 6 798
M 763 0 0 0 763 F 46 5 0 6 35
CHAMPAWAT - T P 90180 63043 1816 1456 23865 M 48296 25077 1072 975 21172
- F 41884 37966 744 481 2693 R P 80650 62369 1687 1259 15335
M 39913 24837 976 810 13290 F 40737 37532 711 449 2045
U P 9530 674 129 197 8530 I M 8383 240 96 165 7882 - F 1147 434 33 32 648 -
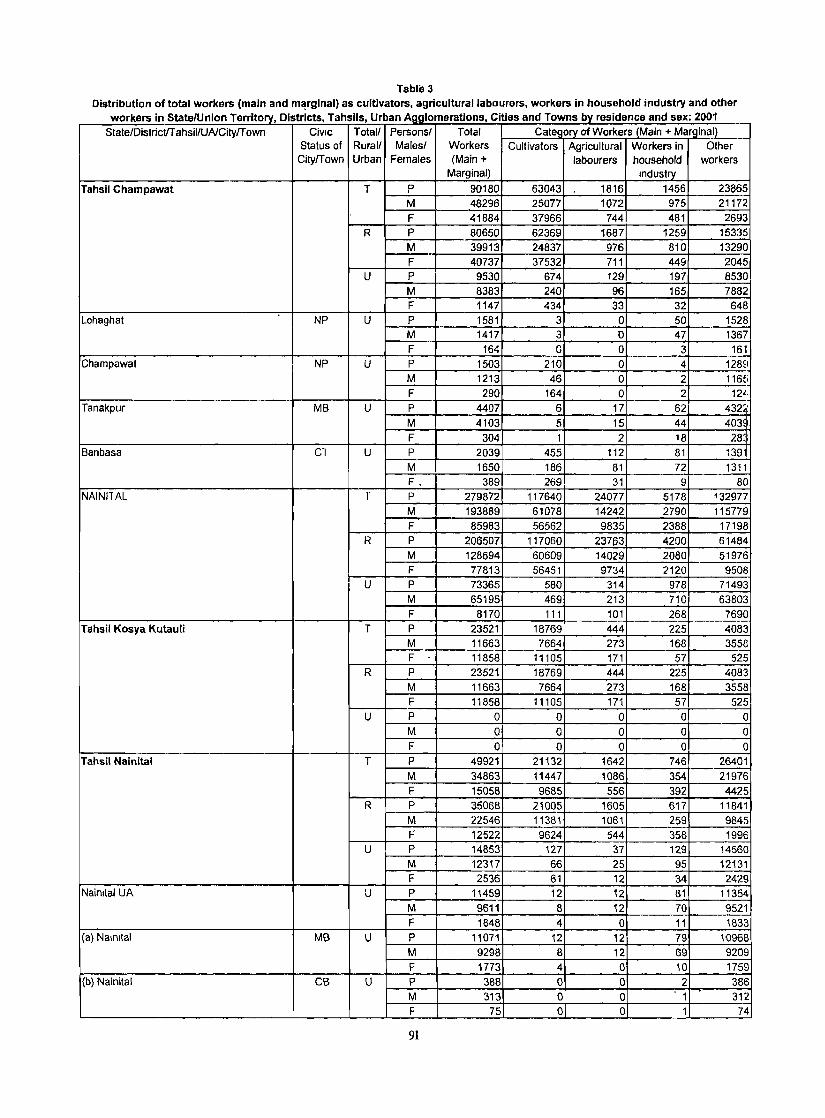
Table 3 Distribution of total workers (main and m~rginal) as cultivators, agricultural labourers, workers in household industry and other
k I S IU 0 T 0 DO tOts T h 01 U b A I r cor d T b °d d 2001 wor ers n tate mon emtory, IS riC , a 51 s, r an ~gglomera Ions, lies an owns ,y resl ence an sex:
State/OistrictfT ahsillUNCityrr own CivIC Totall Personsl Total Cat~~ry of Workers (Main + Marginal) Status of Rural! Malesl Workers Cultivators Agricultural Workers in Other
Cityrrown Urban Females (Main + labourers household workers Marginal) Industry
Tahsil Champawat T P 90180 63043 1816 1456 23865 M 48296 25077 1072 975 21172 F 41884 37966 744 481 2693
R P 80650 62369 1687 1259 15335 M 39913 24837 976 810 13290 F 40737 37532 711 449 2045
U P 9530 674 129 197 8530 M 8383 240 96 165 7882 F 1147 434 33 32 648
Lohaghat NP U P 1581 3 0 50 1528 M 1417 3 0 47 1367 F 164 G 0 3 161
Champawat NP U P 1503 210 0 4 1289 M 1213 46 0 2 1165 F 290 164 0 2 124
Tanakpur MB U P 4407 6 17 62 4322 M 4103 5 15 44 4039 F 304 1 2 18 283
Banbasa CT U P 2039 455 112 81 1391 M 1650 186 81 72 1311 F 0 389 269 31 9 80
NAINITAL T P 279872 117640 24077 5178 132977 M 193889 61078 14242 2790 115779 F 85983 56562 9835 2388 17198
R P 206507 117060 23763 4200 61484 M 128694 60609 14029 2080 51976 F 77813 56451 9734 2120 9508
U P 73365 580 314 978 71493 M 65195 469 213 710 63803 F 8170 111 101 268 7690
Tahsil Kosya Kutauli T P 23521 18769 444 225 4083
~. 11663 7664 273 168 3558 F 11858 11105 171 57 525
R P 23521 18769 444 225 4083 M 11663 7664 273 168 3558 F 11858 11105 171 57 525
U P 0 0 0 0 0 M 0 0 0 0 0 F 0 0 0 0 0
Tahsil Nainital T P 49921 21132 1642 746 26401 M 34863 11447 1086 354 21976 F 15058 9685 556 392 4425
R P 35068 21005 1605 617 11841 M 22546 11381 1061 259 9845 F 12522 9624 544 358 1996
U P 14853 127 37 129 14560 M 12317 66 25 95 12131 F 2536 61 12 34 2429
Naimtal UA U P 11459 12 12 81 11354 M 9611 8 12 70 9521 F 1848 4 0 11 1833
(a) Nalmtal MB U P 11071 12 12 79 10968 M 9298 8 12 69 9209 F 1773 4 0 10 1759
(b) Nainital CB U P 388 0 0 2 386 M 313 0 0 - 1 312 F 75 0 0 1 74
91
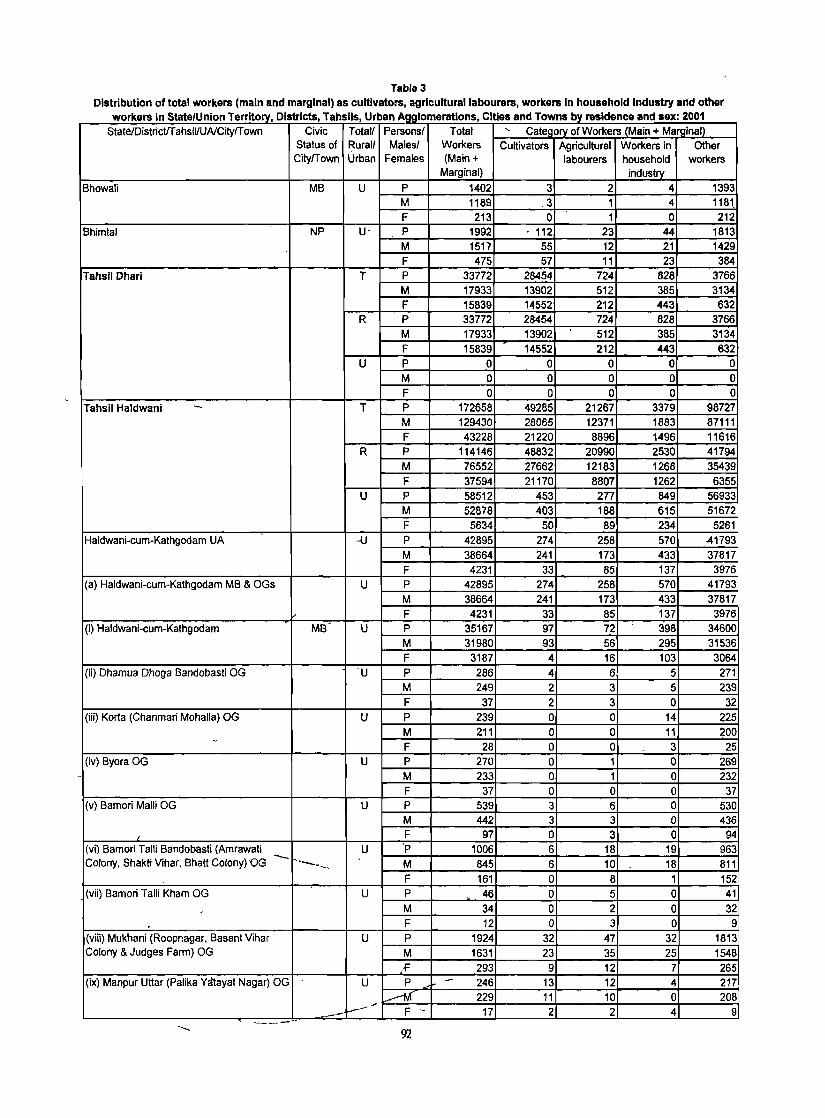
Tabla 3 Distribution of total workers (main and marginal) as cultivators. agricultural labourers. workers In household Industry arid other
. T U CI d T Id 2001 workers In StatelUnlon Territory. Districts. ahsils. rban Agglomerations. ties an owns b:t res ence and sex: StatelDistricUT ahsiVUAlCitylT own Civic Total! Personsl Total "- Categ ory of Workers (Main + Marginal)
Status of Rurall Malesl Workers Cultivators Agricultural Workers in' Other CitylTown Urban Females (Main + labourers household workers
Marginal) industry
Bhowali MB U P 1402 3 2 4 1393 M 1189 .3 1 4 1181. F 213 0 1 0 212
Bhim!al NP U· P 1992 . 112 23 44 1813 M 1517 55 12 21 1429 F 475 57 11 23 384
Tahsil Dhari T P 33772 28454 724 828 3766 M 17933 13902 512 385 3134 F 15839 14552 212 443 632
R P 33772 28454 724 828 3766 M 17933 13902 512 385 3134 F 15839 14552 212 443 632
U P 0 0 0 0 0 M 0 0 0 0 0 F 0 0 0 0 0
Tahsil Haldwani - T P 172658 49285 21267 3379 98727 M 129430 28065 12371 1883 87111 F 43228 21220 8896 1496 11616
R P 114146 48832 20990 2530 41794 M 76552 27662 12183 1268 35439 F 37594 21170 8807 1262 6355
U P 58512 453 277 849 56933 M 52878 403 188 615 51672 F 5634 50 89 234 5261
Haldwani-cum-Kathgodam UA ...lJ P 42895 274 258 570 41793 M 38664 241 173 433 37817 F 4231 33 85 137 3976
(a) Haldwani~cum-Kathgodam MB & OGs U P 42895 274 258 570 41793 M 38664 241 173 433 37817 F 4231 33 85 137 3976
(i) Haldwani-cum-Kathgodam MB - U P 35167 97 72 398 34600 M 31980 93 56 295 31536 F 3187 4 16 103 3064
(ii) Dhamua Dhoga Bandobasti OG -U P 286 4 6 5 271 M 249 2 3 5 239 F 37 2 3 0 32
(iii) Korta (Chanmari MohaUa) OG U P 239 0 0 14 225 M 211 0 0 11 200 -F 28 0 0 3 25
(iv) Byora OG U P 270 0 1 0 269 .. M 233 0 1 0 232
F 37 0 0 0 37 (v) Bamori Malli OG U P 539 3 6 0 530
M 442 3 3 0 436 F 97 0 3 0 94
(vi) Bamori Talli Bandobasti (Amrawati U 'p 1006 6 18 19 963 Colony, Shakti Vihar, Bhatt Colony) 'OG - 845 --~ M 6 10 18 811
F 161 0 8 1 152 (vii) Bamori Talli Kham OG U P - 46 0 5 0 41
, M 34 0 2 0 32 . F 12 0 3 0 9
(viii) Mukhani (Roopnagar, Basant Vihar U P 1924 32 47 32 1813 Colony & Judges Farm) OG M 1631 23 35 25 1548
oF 293 9 12 7 265 (ix) Manpur Uttar (Palika ycttayat Nagar) OG - U P - 246 13 12 4 217
_.-tv( 229 11 10 0 208 --~- F - 17 2 2 4 9 _--92

Table 3
[J;stribution of total workers (main and marginal) as cultivators, agricultural labourers, workers in household industry and other o SIT 0 Do T h oJ U workers In tate Union emtory, IStrlctS, a Sl s, rban Agglomerations, Cities and Towns by residence and sex: 2001
State/DlstncliT ahsil/UNCity/T own Civic Totall Personsl Total Category of Workers (Main t Marginal) Status of Rural! Malesl Workers Cultivators Agricultural Workers in Other I City/Town Urban Females (Main + labourers household workers
Marginal) industry
(x) Haripur Sukha (Van Cancer HospItal) OG U P 134 8 1 1 54
M 55 7 1 1 46
F 9 1 0 0 8
(xi) Haldwani Talli OG U P 1072 45 44 23 960
M 975 43 31 11 890
F 97 2 13 12 70 (xli) GOJajally Uttar (ShIshu Bhartiya Vidya U P 371 5 5 39 322 Mandlr) OG M 353 5 3 38 307
F 18 0 2 1 15 (xiII) Kusum Khera OG U P 945 48 27 25 845
M 813 39 15 24 735
F 132 9 12 1 110
(XIV) Bllhoria No.1 OG U P 720 13 14 10 683
M 614 9 3 5 597
F 106 4 11 5 86
Ramnagar MB U P 12208 76 10 197 11925
M 11037 70 10 119 10838
F 1171 6 0 78 1087
Kaladungi NP U P 1609 103 9 59 1438
M 1464 92 5 48 1319
F 145 11 4 11 119
Lalkuan NP U P 1800 0 0 23 1777
M 1713 0 0 15 1698
F 87 0 0 8 79
UDHAM SINGH NAGAR T P 393348 116905 100824 12984 162635
M 315379 88512 74666 8422 143479
F 78269 28393 26158 4562 19156
R P 278842 111898 91556 6146 69242
M 211713 83892 66948 2844 58029
F 67129 28006 24608 3302 11213
U P 114506 5007 9268 6838 93393
M 103366 4620 7718 5578 85450
F 11140 387 1550 1260 7943
Tahsil Kashipur T P 134712 30601 37998 2338 63775
M 119308 27598 30773 1643 59294
F 15404 3003 7225 695 4481
R P 85383 27631 33964 1214 22574
M 73148 24757 27194 857 20340
F 12235 2874 6770 357 2234
U P 49329 2970 4034 1124 41201
M 46160 2841 3579 786 38954 -F 3169 129 455 .38 2247
Nlahua Dabra Haripura NP U P 1455 435 :{44 63 613
M 1383 430 318 48 'i87
F 72 5 26 15 26 Jaspur MB U P 9849 556 301 227 8765
M 9329 543 277 148 8361
F 520 13 24 79 404 Kashipur MB U P 24282 501 471 452 22858
M 22780 470 442 340 21528
F 1502 31 29 112 1330
Kachna/ Cosain CT U p 1168 91 80 19 978 °
M 1124 89 60 15 960
F 44 2 20 4 18 Mahua Kheraganj Nt' U P 2489 583 783 218 905
M 2162 544 653 135 830
f' 327 39 130 83 75
93 1574 RG'/2003-- 1 ..l
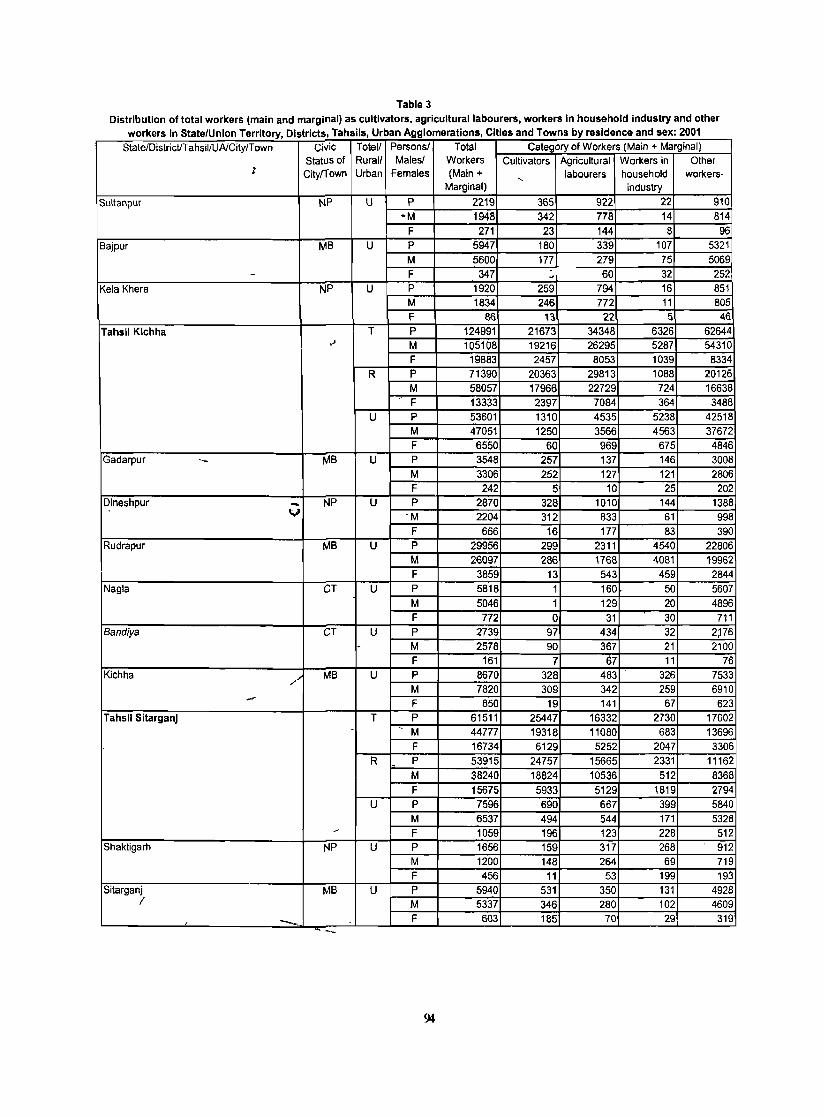
Table 3
Distribution oHotal workers (main and marginal) as cultivators, agricultural labourers, workers in household industry and other workers in State/Union Territory Districts Tahsils Urban Agglomerations Cities and Towns by residence and sex· 2001 , , , ,
State/DistrictIT ahsiliUNCity/T own Chtic Tolell Persons! Total Category of Workers (Main + Marginal) StaWs of Rurall Malesl Workers Cultivators Agricultural Workers in Other
~ Cityrfown Urban Females (Main + "-
labourers household workers-Marginal) industry
Sultanpur NP U P 2219 365 922 22 910 ·M 1948 342 778 14 814
F 271 23 144 8 96 Bajpur MB U P 5947 180 339 107 5321
M 5600 177 279 75 5069 - F 347 0 60 32 252 J
Kela Khera NP U P 1920 259 794 16 851 M 1834 246 772 11 805 f 00 '\l 22 5 46
Tahsil Klchha T P 124991 21673 34348 6326 62644 ,~ M 105108 19216 26295 5287 54310
F 19883 2457 8053 1039 8334 R P 71390 20363 29813 1088 20126
M 58057 17966 22729 724 16638 -- F 13333 2397 7084 364 3488
U P 53601 1310 4535 5238 42518 M 47051 1250 3566 4563 37672 F 6550 60 969 675 4846
Gadarpur -- MB U P 3548 257 137 146 3008 M 3306 252 127 121 2806 F 242 5 10 25 202
Dineshpur - NP U P 2870 328 1010 144 1388 V oM 2204 312 833 61 998
F 666 16 177 83 390 Rudrapur MB U P 29956 299 2311 4540 22806
M 26097 286 1768 4081 19962 F 3859 13 543 459 2844
Nagla CT U P 5818 1 160 50 5607 M 5046 1 129 20 4896 F 772 0 31 30 711
Bandiya CT U P 2739 97 434 32 2F6 - M 2578 90 367 21 2100
F 161 7 67 11 76 Kichha
/ MB U P 8670 328 483 326 7533 M 7820 309 342 259 6910 - F 850 19 141 67 623
Tahsil SitarganJ T P 61511 25447 16332 2730 17002 - , M 44777 19318 11080 683 13696
F 16734 6129 5252 2047 3306 R P 53915 24757 15665 2331 11162 -
M 38240 18824 10536 512 8368 F 15675 5933 5129 1819 2794
U P 7596 690 667 399 5840 M 6537 494 544 171 5328
r F 1059 196 123 228 512 Shaktigarh NP U P 1656 159 317 268 912
M 1200 148 264 69 719 F 456 11 53 199 193
Sitarganj MB U P 5940 531 350 131 4928 I M 5337 346 280 102 4609
/ -... - F 603 185 70 29 319 -
94
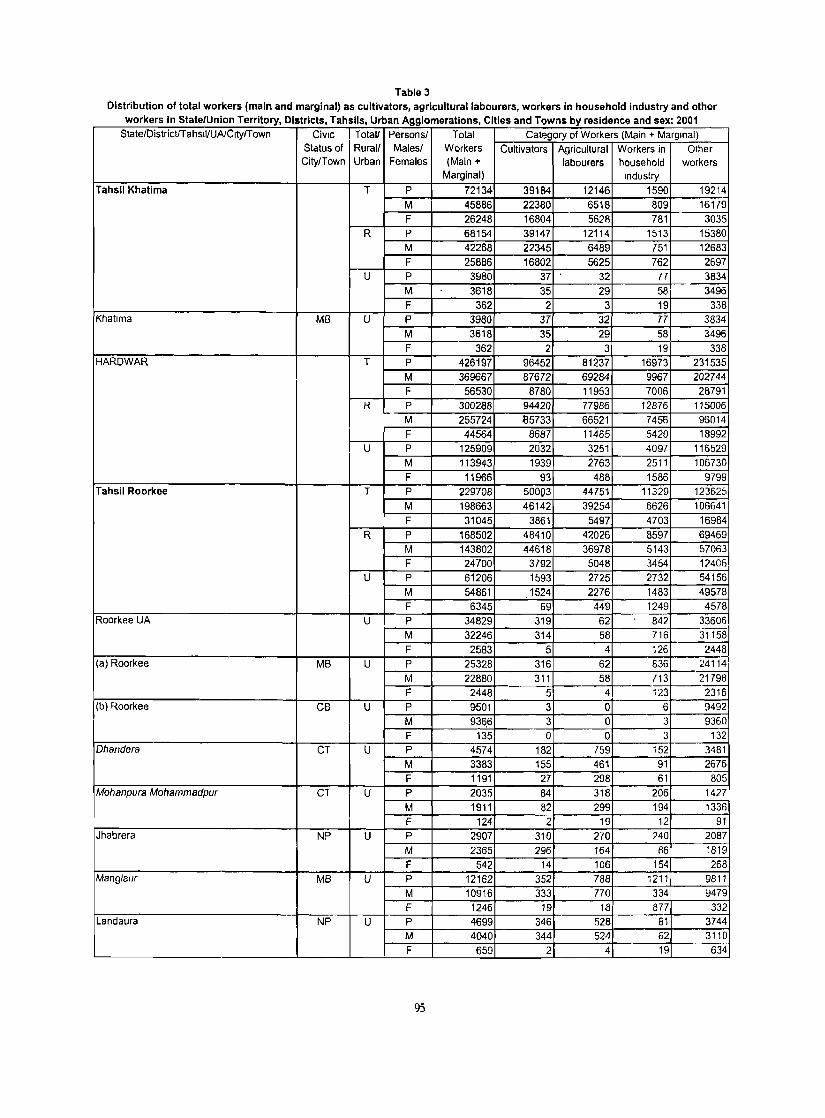
Table 3
Distribution of total workers (main and marginal) as cultivators, agricultural labourers, workers in household industry and other workers in State/Union Territory, Districts, Tahsils, Urban Agglomerations, Cities and Towns by residence and sex: 2001
State!DistricUTahsii!UAlCityrrown CiVIC Total! Persons! Total Category of Workers (Main + Marginal) Status of Rural! Males! Workers Cultivators Agricultural Workers in Other Cityrrown Urban Females (Main + labourers household workers
Marginal) Industry
Tahsil Khatima T P 72134 39184 12146 1590 19214 M 45886 22380 6518 809 16119 F 26248 16804 5628 781 3035
R P 68154 39147 12114 1513 15380 M 42268 22345 6489 151 12683 F 25886 16802 5625 762 2697
U P 3980 37 32 77 3834 M 3618 35 29 58 3496 F 362 2 3 19 338
Khatlma MB U P 3980 37 32 77 3834 M 3618 35 29 58 3496 F 362 2 3 19 338
HARDWAR T P 426197 96452 81237 16973 231535 M 369667 67672 69264 9967 202744 F 56530 8760 11953 7006 28791
R P 300288 94420 77986 12676 115006 f-'
M 255724 M733 66521 7456 96014 F 44564 8687 11465 5420 18992
U P 125909 2032 3251 4097 116529 M 113943 1939 2763 2511 106730 F 11966 93 488 1586 9799
Tahsil Roorkee T P 229706 50003 44751 11329 123625 M 198663 46142 39254 6626 106641 F 31045 3861 5497 4703 16984
R P 168502 48410 42026 8597 69469 M 143802 44618 36978 5143 57063 F 24700 3792 5048 3454 17406
U P 61206 1593 2725 2732 54156 M 54861 1524 2276 1483 49578 F 6345 69 449 1249 4578
Roorkee UA U P 34829 319 62 847 33606 M 32246 314 58 716 31158 F 2583 5 4 126 2448
(a) Roorkee MB U P 25328 316 62 836 24114 M 22880 311 58 113 21798 F 2448 5 4 123 2316
(b) Roorkee CB U P 9501 3 0 6 9492 M 936,6 3 0 3 9360 F 135 0 0 3 132
Dhandera CT U P 4574 182 159 152 3481 M 3383 155 461 91 2676 F 1191 27 298 61 805
Mohanpura Mohammadpur CT U P 2035 84 318 206 1427 M 1911 82 299 194 1336 F 124 2 19 12 91
Jhabrera NP U P 2907 310 270 240 2087 M 2365 296 164 86 1819 F 542 14 106 154 268
Mang/aur MB U P 12162 352 788 1211 9811 M 10916 333 770 334 9479 F 1246 19 18 877 332
Landaura NP U P 4699 346 528 81 3744 M 4040 344 524 62 3110 F 659 2 4 19 634
95
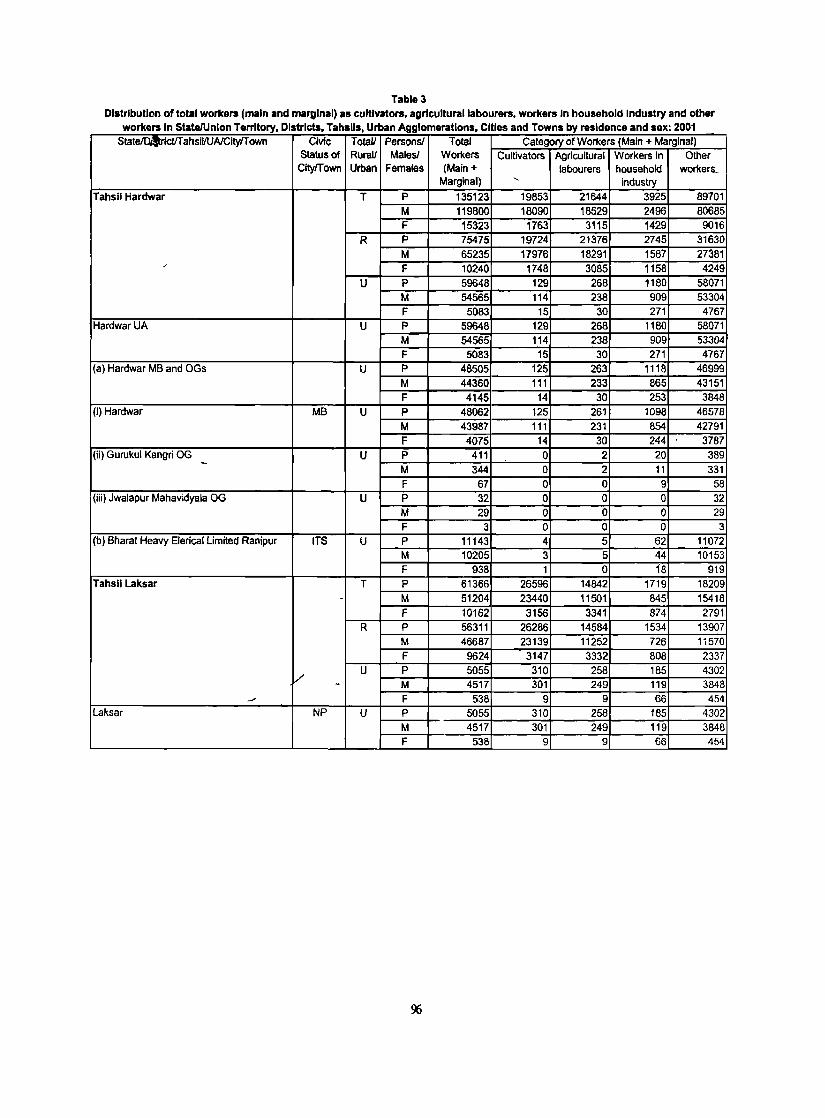
Tabla 3 Distribution of total workers (main and marginal) as cultivators, agricultural labourers, workers In household Industry and other
workers In State/Union Territory, DistrIcts, Tahslls Urban Agglomerations, CIties and Towns by residence and sex· 2001 . State/DI'tricUTahsiVUAlCityfT own Civic TotaV Persons! Total Category of Workers (Main + Marginal)
Status of RuraU Males! Workers Cultivators Agricultural Workers in Other City/Town Urban Females (Main + labourers household workers..
Marginal) " industry Tahsil Hardwar T P 135123 19853 21644 3925 89701
M 119800 18090 18529 2496 80685 F 15323 1763 3115 1429 9016
R P 75475 19724 21376 2745 31630 M 65235 17976 18291 1587 27381
, F 10240 1748 3085 1158 4249
U P 59648 129 268 1180 58071 M 54565 114 238 909 53304 F 5083 15 30 271 4767
Hardwar UA U P 59648 129 268 1180 58071 M 54565 114 238 909 53304 F 5083 15 30 271 4767
(a) Hardwar MB and OGs U P 48505 125 263 1118 46999 M 44360 1'1 233 865 43151 F 4145 14 30 253 3848
(i) Hardwar MB U P 48062 125 261 1098 46578 M 43987 111 231 854 42791 F 4075 14 30 244 3787
(ii) Gurukul Kangri OG U P 411 0 2 20 389 - M 344 0 2 11 331 F 67 0 0 9 58
(iii) JWalapur Mahavidyala OG U P 32 0 a a 32 M 29 0 a 0 29 F 3 a a 0 3
(b) Bharat Heavy Elerical Limited Ranipur ITS U P 11143 4 5 62 11072 M 10205 3 5 44 10153 F 938 1 0 18 919
Tahsil Laksar T P 61366 26596 14842 1719 18209 - M 51204 23440 11501 845 15418
F 10162 3156 3341 874 2791 R P 56311 26286 14584 1534 13907
M 46687 23139 11252 726 11570 F 9624 3147 3332 808 2337
V U P 5055 310 258 185 4302
- M 4517 301 249 119 3848 __. F 538 9 9 66 454
Laksar NP U P 5055 310 258 185 4302 M 4517 301 249 119 3848 F 538 9 9 66 454
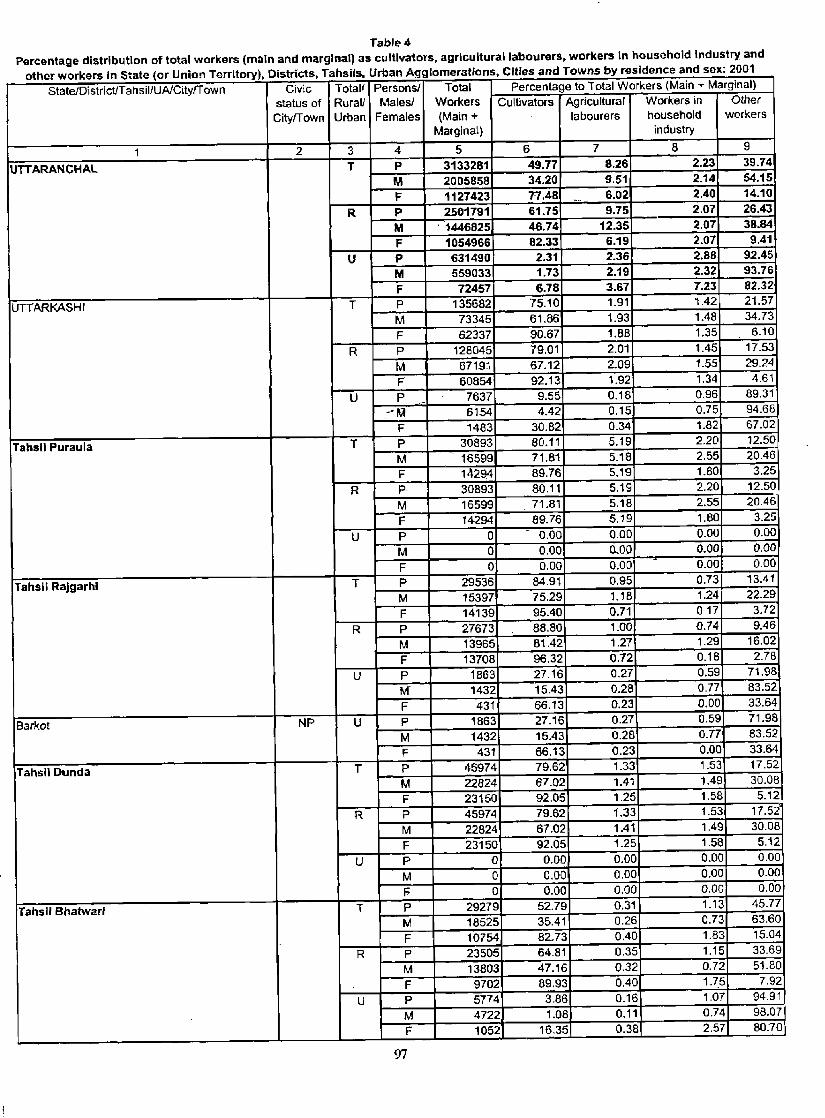
Table 4 Percentage distribution of total workers (main and marginal) as cultivators, agricultural labourers. workers in household Industry and
other workers in State (or Union TerrItory) Districts Tahsils Urban Agglomerations Cities and Towns by residence and sex' 2001 , , , . Percentage to Total Workers (Main + Marginal) StateJDistricUTahsil/UA/Cityrrown Civic Total! Personsl Total
status of RuraU Males! Workers Cultivators Agricultural Workers in Other
CityfTown Urban Females (Main + labourers household workers
Marginal) industry
1 2 3 4 5 6 7 8 9
UTT ARANCHAL T P 3133281 49.77 8.26 2.23 39.74
M 2005858 34.20 9.51 2.14 54.15
F 1127423 77.48 -- 6.02 2.40 14.10
R P 2561791 61.75 9.75 2.07 26.4'3
M ' 1446825 46.74 12.35 2.07 38.84
F 1054966 82.33 6.19 2.07 9.41
U P 631490 2.31 2.36 2.88 92.45
M 559033 1.73 2.19 2.32 93.76
F 72457 6.78 3.67 1.23 82.32
UTTARKASHI T P 135682 '75.10 1.91 1.42 21.57
M 73345 61.86 1.93 1.48 34.73
F 62337 90.67 1.88 1.35 6.10
R P 128045 79.01 2.01 1.45 17.53
M 07t91 67.12 2.09 1.55 29.24
F 60854 92.13 1.92 1.34 4.61
U P 7637 9.55 0.18 0.96 89.31
--r.;t 6154 4.42 0.15 0.75 94.68
F 1483 30.82 0.34 1.82 67.02
Tahsil Puraula T p 30893 80.11 5.19 2.20 12.50
M 16599 71.81 5.18 2.55 20.46
F 14294 89.76 5.19 1.80 3.25
R P 30893 80.11 5.19 2.20 12.50
M 16599 71.81 5.18 2.55 20.46
F 14294 89.76 5.19 1.80 3.25
U P 0 - 0.00 0.00 0.00 0.00
M 0 0.00 0.00 0.00 0.00
F 0 0.00 0.00 0.00 0.00
Tahsil Rajgarhl T p 29536 84.91 0.95 0.73 13.41
M 15397 75.29 1.18 1.24 22.29
F 14139 95.40 0.71 017 3.72
R P 27673 88.80 1.00 0.74 9,46
M 13965 81.42 1.27 1.29 16.02
F 13708 96.32 0.72 0.18 2.78
U P 1863 27.16 0.27 0.59 71.98
M 1432 15.43 0.28 0.77 83.52
F 431 66.13 0.23 0.00 33.64
Barkot NP U P 1863 27.16 0.27 0.59 71.98
M 1432 15.43 0.28 0.77 83.52
F 431 66.13 0.23 0.00 33.64
Tahsil Dunda T p 45974 79.62 1.33 1.53 17.52
M 22824 67.02 1.41 1.49 30.08
F 23150 92.05 1.25 1.58 5.12
R P 45974 79.62 1.33 1.53 17.52
M 22824 67.02 1.41 1.49 30.08
F 23150 92.05 1.25 1.58 5.12
U P Q 0.00 0.00 0.00 0.00
M 0 0.00 0.00 0.00 0.00
F 0 0.00 0.00 0.00 0.00
Tahsil Bhatwarl T P 29279 52.79 0.31 1.13 45.77
M 18525 35.41 0.26 0.73 63.60
F 10754 82.73 0.40 1.83 15.04
R P 23505 64.81 0.35 1.15 33.69
M 13803 47.16 0.32 0.72 51.80
F 9702 89.93 0.40 1.75 7.92
U P 5774 3.86 0.16 1.07 94.91
M 4722 1.08 0.11 0.74 98.07
F 1052 16.35 0.38 2.57 80.70
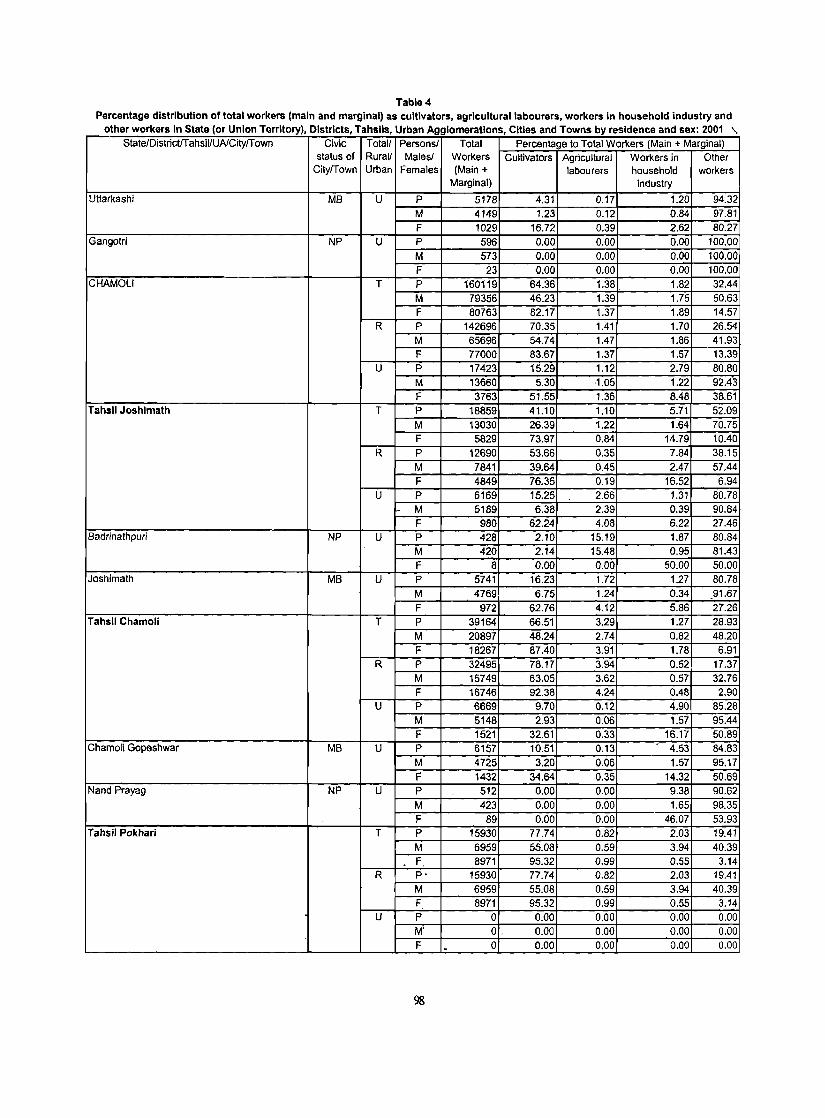
Table 4 Percentage distribution of total workers (main and marginal) as cultivators, agricultural labourers, workers In household industry and
other workers In State (or Union Territory), Districts, Tahslls Urban Agglomerations Cities and Towns by residence and sex: 2001 " , , State/DistricUTahsiUUNCity/T own Civic Totall Personsl Total Percentage to Total Workers (Main + Marginal)
status of RuraU Malesl Workers Cultivators Agricultural Workers in Other City/Town Urban Females (Main + labourers household workers
Marginal) industry
Uttarkashi MB U P 5178 4.31 0.17 1.20 94.32
M 4149 1.23 0.12 0.84 97.81
F 1029 16.72 0.39 2.62 80.27 Gangotri NP U P 596 0.00 0.00 0.00 100.00
M 573 0.00 0.00 0.00 100.00 F 23 0.00 0.00 0.00 100.00
CHAMOLI T P 160119 64.36 1.38 1.82 32.44
M 79356 46.23 1.39 1.75 50.63
F 80763 82.17 1.37 1.89 14.57
R P 142696 70.35 1.41 1.70 26.54
M 65696 54.74 1.47 1.86 41.93 F 77000 83.67 1.37 1.57 13.39
U P 17423 15.29 1.12 2.79 80.80
M 13660 5.30 1.05 1.22 92.43 F 3763 51.55 1.36 8.48 38.61
Tahsil Joshlmath T P 18859 41.10 1.10 5.71 52.09
M 13030 26.39 1.22 1.64 70.75 F 5829 73.97 0.84 14.79 10.40
R P 12690 53.66 0.35 7.84 38.15
M 7841 39.64 0.45 2.47 57.44
F 4849 76.35 0.19 16.52 6.94
U P 6169 15.25 - 2.66 1.31 80.78
M 5189 6.38 2.39 0.39 90.84 F 980 62.24 4.08 6.22 27.46
Badrinathpuri NP U P 428 2.10 15.19 1.87 80.84
M 420 2.14 15.48 0.95 81.43
F 8 0.00 0.00 50.00 50.00 Joshimath MB U P 5741 16.23 1.72 1.27 80.78
M 4769 6.75 1.24 0.34 91.67 -F 972 62.76 4.12 5.86 27.26
Tahsil Chamoli T P 39164 66.51 3.29 1.27 28.93
M 20897 48.24 2.74 0.82 48.20
F 18267 87.40 3.91 1.78 6.91
R P 32495 78.17 3.94 0.52 17.37
M 15749 63.05 3.62 0.57 32.76
F 16746 92.38 4.24 0.48 2.90 U P 6669 9.70 0.12 4.90 85.28
M 5148 2.93 0.06 1.57 95.44
F 1521 32.61 0.33 16.17 50.89 Chamoli Gopeshwar MB U P 6157 10.51 0.13 - 4.53 84.83
M 4725 3.20 0.06 1.57 95.17
F 1432 34.64 0.35 14.32 50.69 Nand Prayag NP U P 512 0.00 0.00 9.38 90.62
M 423 0.00 0.00 1.65 98.35
F 89 0.00 0.00 46.07 53.93 Tahsil Pokhari T P 15930 77.74 0.82 2.03 19.41
M 6959 55.08 0.59 3.94 40.39
. F 8971 95.32 0.99 0.55 3.14 R p. 15930 77.74 0.B2 2.03 19.41
M 6959 55.0B 0.59 3.94 40.39 F 8971 95.32 0.99 0.55 3.14
U P 0 0.00 0.00 0.00 0.00 M' O. 0.00 0.00 0.00 0.00
F . a 0.00 0.00 0.00 0.00
98
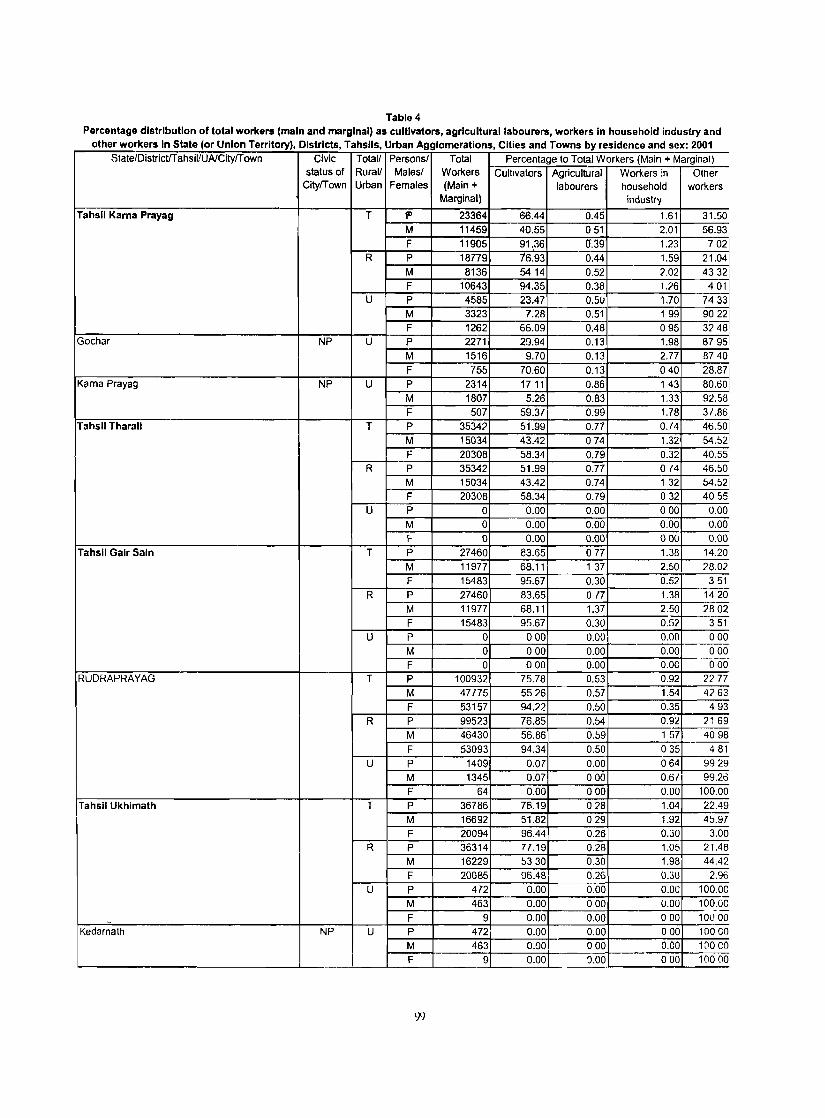
Table 4 Percentage distribution of total workers (main and marginal) as cultivators, agricultural labourers, workers In household industry and
other workers In State (or Union Territory) Districts Tahslls Urban Agglomerations Cities and Towns by residence and sex' 2001 . . . . State/Oistrictrrahsil/UAlCitylT own Civic Total! Persons/ Total Percentage to Total Workers (Main + Marginal)
status of Rural/ Males/ Workers Cultivators Agricultural Workers in Other CitylTown Urban Females (Main + labourers household workers
Marginal) industry
Tahsil Karna Prayag T 11' 23364 66.44 0.45 1.61 31.50 M 11459 40.55 051 2.01 56.93 F 11905 91.36 tr.39 1.23 702
R P 18779, 26.93 0.44 1.59 21.04 M 8136 54 14 0.52 2.02 4332 F 10643 94.35 0.38 1.26 401
U P 4585 23.47 0.50 1.70 7433 M 3323 7.28 0.51 199 9022 F 1262 66.09 0.48 095 3248
Gochar NP U P 2271 29.94 0.13 1.98 6795 M 1516 9.70 0.13 2.77 8740 F 755 70.60 0.13 040 28.87i
Kama Prayag NP U P 2314 1711 0.86 143 80.60 M 1807 5.26 0.83 1.33 92.58 F 507 59.31 0.99 1.78 31.86
Tahsil Tharall T P 35342 51.99 0.77 0.14 46.50 M 15034 43.42 074 1.32 54.52 1
F 20308 58.34 0.79 0.32 40.55 R P 35342 51.99 0.77 o {4 46.50
M 15034 43.42 0.74 132 54.521 F 20308 58.34 0.79 032 40 55
U P 0 0.00 0.00 000 0.00 M 0 0.00 0.00 0.00 0.00 F- a 0.00 0.00 000 0.00
Tahsil Galr Saln T P 27460 83.65 077 1.38 14.20 M 11977 68.11 137 2.50 1'8.01' F 15483 95.67 0.30 0.51' 351
R P 27460 83.65 017 1.38 1420 M 11977 68.11 1.37 2.50 2802 F 15483 95.67 0.30 0.52 351
U p a 000 0.00 0.00 000 M 0 000 0.00 0.00 000 F 0 000 0.00 o.oc 000
RUDRAPRAYAG T P 100932 75.78 0.53 0.92 21' 77 M 47175 5526 0.57 1.54 4763 F 53157 94.22 0.50 0.35 493
R P 99523 76.85 0.54 0.92 2169 M 46430 56.86 0.59 157 4098 F 53093 94.34 0.50 035 481
U P 1409 0.07 0.00 064 9929 M 1345 0.07 000 0.61 99.26 F 64 0.00 000 0.00 100.00
Tahsil Ukhlmath T P 36786 76.19 028 1.04 22.49 M 16692 51.82 029 1.92 45.97 F 20094 96.44 0.26 0.30 3.00
R P 36314 71.19 0.28 1.05 21.48 M 16229 5330 0.30 1.98 44.42 F 20085 96.48 0.26 0.30 2.96
U P 472 0.00 0.00 O.OC 100.0C M 463 0.00 000 0.00 100.0C --
,. F 9 0.00 0.00 000 100 00 Kedarnath NP U P 472 0.00 0.00 000 100 CO
M 463 0.00 000 0.00 10000 F 9 0.00 0.00 000 10000
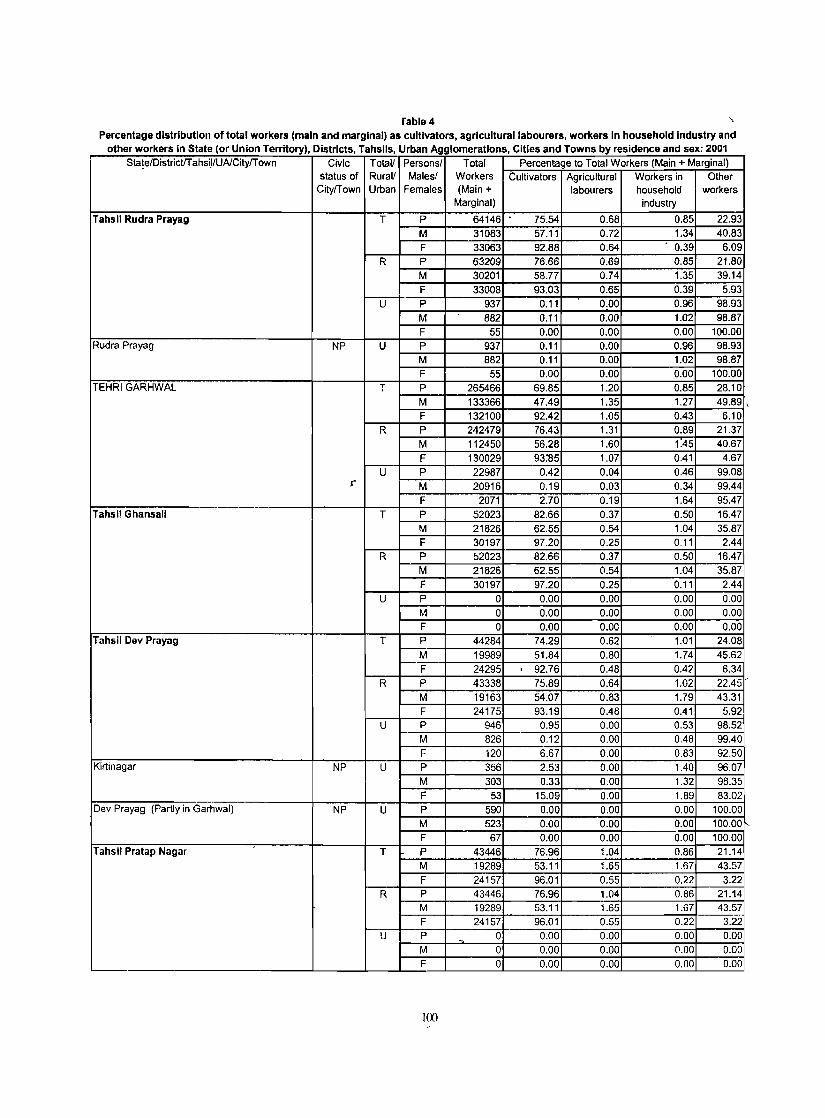
rable4 Percentage distribution of total workers (main and marginal) as cultivators, agricultural labourers, workers in household industry and
other workers in State (or Union Territory) Districts Tahsils Urban Agg!omerations Cities and Towns by residence and sex: 2001 , , , , Sta!e/DistrictfT ahs\I/UAlCitylT own Civic Total! Personsl Total Percentage to Total Workers (Main + Marginal)
status of Rural! Malesl Workers Cultivators Agricultural Workers in Other CitylTown Urban Females (Main + labourers household workers
Marginal) industry
Tahsil Rudra Prayag T P 64146 75.54 0.68 0.85 22.93 M 31083 57.11 0.72 1.34 40.83 F 33063 92.88 0.64 0.39 6.09
R P 63209 76.66 0.69 0.85 21.80 M 30201 58.77 0.74 1.35 39.14 F 33008 93.03 0.65 0.39 5.93
U P 937 0.11 0.00 0.96 98.93 M 882 0.11 0.00 1.02 98.87 F 55 0.00 0.00 0.00 100.00
Rudra Prayag NP U P 937 0.11 0.00 0.96 98.93 M 882 0.11 0.00 1.02 98.87 F 55 0.00 0.00 0.00 100.00
TEHRI GARHWAL T P 265466 69.85 1.20 0.85 28.10 M 133366 47.49 1.35 1.27 49.89 \ F 132100 92.42 1.05 0.43 6.10
R P 242479 76.43 1.31 0.89 21.37 M 112450 56.28 1.60 1.45 40.67 F 130029 93:'85 1.07 0.41 4.67
U P 22987 0.42 0.04 0.46 99.08 r' M 20916 0.19 0.03 0.34 99.44
F 2071 2.70 0.19 1.64 95.47 Tahsil Ghansali T P 52023 82.66 0.37 0.50 16.47
M 21826 62.55 0.54 1.04 35.87 F 30197 97.20 0.25 0.11 2.44
R P 52023 82.66 0.37 0.50 16.47 M 21826 62.55 0.54 1.04 35.87 F 30197 97.20 0.25 0.11 2.44
U P 0 0.00 0.00 0.00 0.00 M 0 0.00 0.00 0.00 0.00 F 0 0.00 0.00 0.00 0.00
Tahsil Dev Prayag T P 44284 74.29 0.62 1.01 24.08 M 19989 51.84 0.80 1.74 45.62 F 24295 , 92.76 0.48 0.42 6.34
R P 43338 75.89 0.64 1.02 22.45 ' M 19163 54.07 0.83 1.79 43.31 F 24175 93.19 0.48 0.41 5.92
U P 946 0.95 0.00 0.53 98.52 M 826 0.12 0.00 0.48 99.40 F 120 6.67 0.00 0.83 92.50
Kirtinagar NP U P 356 2'.53 0.00 1.40 96.07 M 303 0.33 0.00 1.32 98.35 F 53 15.09 0.00 1.89 83.02
Dev Prayag (Partly in Garhwal) NP U P 590 0.00 0.00 0.00 100.00 M 523 0.00 0.00 0.00 100.00 F 67 0.00 0.00 0.00 100.00
Tahsil Pratap Nagar ,
T P 43446 76.96 1.04 0.86 21.14 M 19289 53.11 1.65 1.67 43.57 F 24157 96.01 0.55 0.22 3.22
R P 43446 76.96 1.04 0.86 21.14 M 19289 53.11 1.65 1.67 43.57 F 24157 96.01 0.55 0.22 3.22
U P 0 0.00 0.00 0.00 0.00 M 0 0.00 0.00 0.00 0,00 F 0 0.00 0.00 0.00 0.00
1m
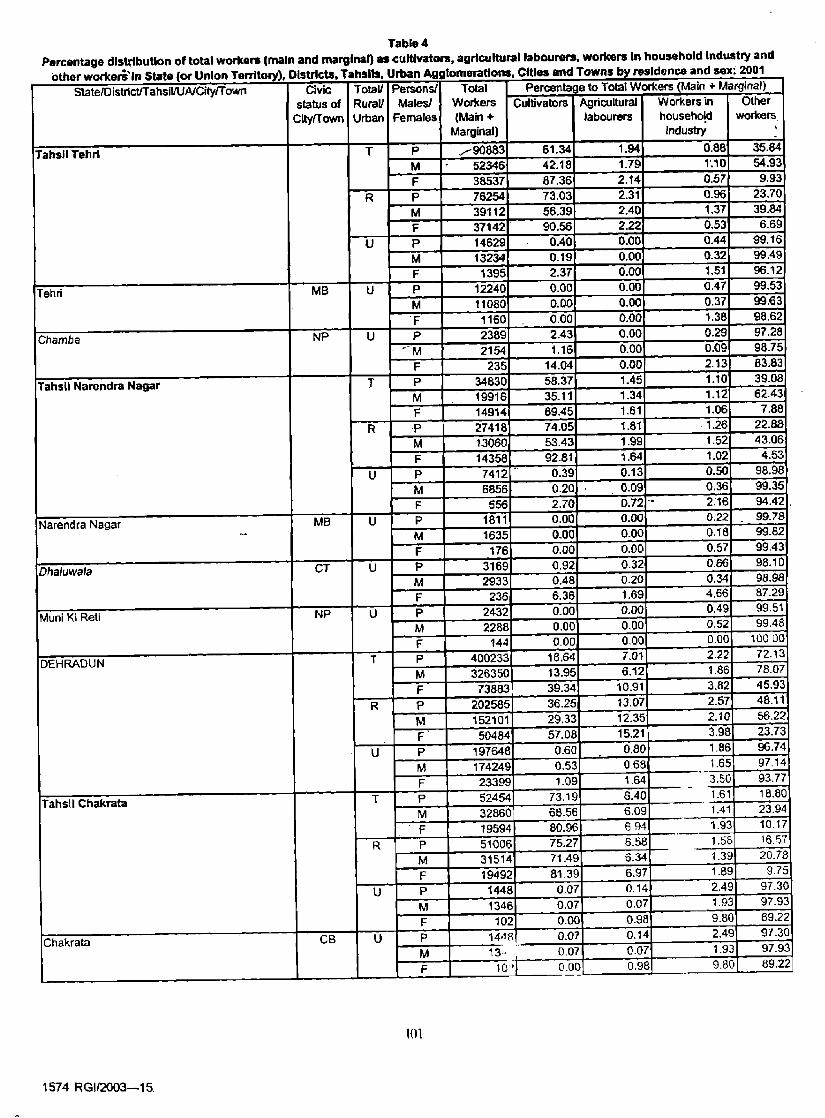
Table 4 Percentage dlslribuUon of total workers (main and marginal) as cultivators, agricultural labourers. workers In household Industry and
ether workeri'in State (or Union Territory), DIstricts. Tahslls, Urban Agglomerations Cffies and Towns by residence and sex' 2001 , Per<:entage to Total Workers (Main + Marginal) StatefD istrictlTahsillUAiCityfTown Civic Tetall Persons! Total
status of Rural! Males! Workers Cultivators Agricultural Workers in Other
CityfTown Urban Females (Main + labourers household workers
Marginal) industry ,
Tahsil Tehrl T p /90883 61.34 1.94 0.88 35.84
M . 52346 42.18 1.79 1'.10 54.93
F 38537 87.36 2.14 0.57 9.93
R P 76254 73.03 2.31 0.96 23.70
M 39112 56.39 2.40 1.37 39.84
F 37142 90.56 2.22 0.53 6.69
U P 14629 0040 0.00 0.44 99.16
M 13234 0.19 0.00 0.32 99.49
F 1395 2.37 0.00 1.51 96.12
Tehri MB U P 12240 0.00 0.00 0.47 99.53
M 11080 0.00 0.00· 0.37 99.63
·F 1160 0.00 0.00 1.38 98.62
Chamba NP U P 2389 2.43 0.00 0.29 97.28
"M 2154 1.16 0.00 0.09 98.75
F 235 14.04 0.00 2.13 83.83
Tahsil Narendra Nagar T P 34830 58.37 1045 1.10 39.08
M 19916 35.11 1.34 1.12 62.43
F 14914 89.45 1.61 1.06 7.88
R .p 27418 74.05 1.81 ·1.26 22.88
M 13060 53.43 1.99 1.52 43.06
F 14358 92.81 1.64 1.02 4.53
U P 7412 0.39 0.13 0.50 98.98
M 6856 0.20 0.09 0.36 99.35
F 556 2.70 0.72 .• 2:16 94.42 .
Narendra Nagar MB U P 1811 0.00 0.00 0,22 99.78
- M 1635 0.00 0.00 0.18 99.82
F 176 0.00 0.00 0.57 99,43
Dhaiuwala CT U P 3169 0.92 0.32 0.66 98.10
M 2933 0.48 0.20 0.34 98.98
F 236 6.36 1.69 4.66 87.29
Muni Ki Reti NP U P 2432 0.00 0.00 0,49 99.51
M 2288 0.00 0.00 0,52 99.48
F 144 0.00 0,00 0.00 10000
DEHRADUN T P 400233 18.64 7.01 2.22 72.13
M 326350 13.95 6.12 1,86 78.07
F 73883 39.34 10.91 3.82 45.93
R P 202585 36.25 13.07 2.57 48.11
M 152101 29.33 12.35 2.10 56.22
F 50484 57.08 15.21 3.98 23.73
U p 197648 0.60 0.80 1.86 96.74
M 174249 0.53 0.68 1.65 97.14 '.
F 23399 1.09 1.64 3.50 93.77 -Tahsil Chakrata T P 52454 73.19 6.40 1.61 18.80
M 32860 68.56 6.09 1.41 23.94
F 19594 80.96 6.94 1.93 10.17
R P 51006 75.27 6.58 1.58 16.57
M 31514 71.49 6.34 1.39 20.78
F 19492 81.39 6.97 1.89 9.75
U P 1448 0,07 0.14 2.49 97.30
M 1346 0.07 0.07 1.93 97.93
F 102 0.00 0.98 9.80 89.22
Chakrata CB U P 14.1ft 0.07 0.14 2.49 97.30
M 13·, , 0.Q7 0.07 1.93 97.93
F 10 ;, 0.00 0.98 9.80 89.22
101
1574 RGIf2003-15
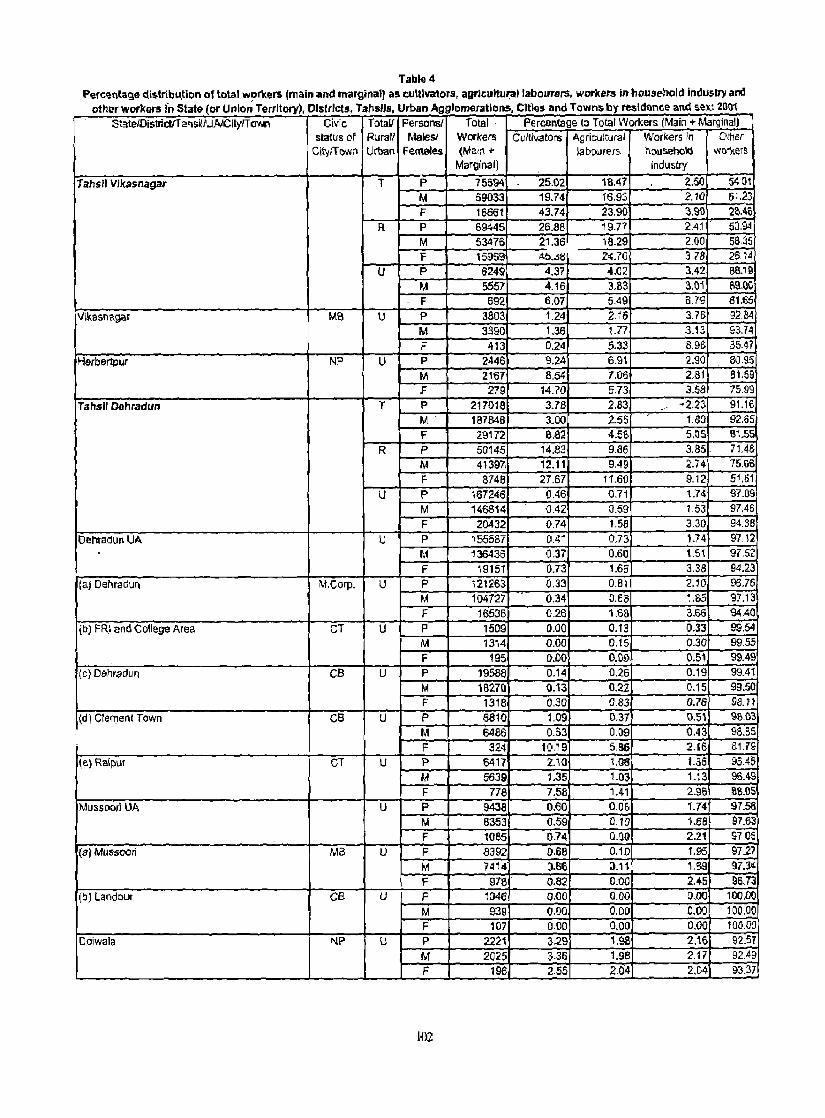
Tabl~ 4 Pefc'!nt;lge d\$trtbu.tion of total workers (main ;and marginal) as wltlmars, agrlclJttur:allaboUTers. workers in hOLlsfcnold indusl1)l and
other workers In State (or Union Territory) Districts Ta11s115 Urban Agglomeratlon$ Cltl(Js ano Towns by resldfmce and s-ex.: 2D01 . , . , StateJDistricl/T ehsi!/UAlCityfT cwn Cillie Totalf Personsl Total Percentage to Total Workers (Main + fo.'larg1nai)
status of Rurall Males.! Workers Cuttivators AgriCUltural Workers in Other Cit'jJT()Wn Urban females (Main + )aDl)lJf€rs- houSehold workers
Marginal) industry
Tahsil Ylkasnagar T p 75694 25.02 is.41 2.50 54 01 M 59033 19.74 16.93 2.10 51.23
F 16661 43.74 23.90 ~.OO 2MIl R P 59445 26.88 19.77 2.4j • 51).94
M 53476 21.36 18.29 2.00 56.35 F 15959 4~ . .jti ZU(J 3.78 26.14
U P 6249 4.37 4.02 3.42 B8.19
M 5557 4.16 3.83 3.01 B9J)Q . F 692 6.07 5.49 6.79 81.135
Vikasnagar MB U P 3803 1.24 2.16 3.76 92.84 M 3390 1.36 1.77 3.13 93.74
F 413 0.24 5.33 B.9oB SM? Herbertpur NP U P 2446 9.24 6.91 2.90 SQ.g5
M 2167 8.54 7.06 2.81 81.59 F 279 14.70 5.73 3.58 75.99
Tahslll)(fhradlln T P 217018 3.78 2.83 - ""2.2:> 91.16 M 1e1846 3.00 2.55
," 1. sa 92.66
F 2.9172 6.82 4.5e. 5.ns Bi.55
R P 5a145 14.83 9.86 3.85. 71.46
M 41397, 12.11 9,49 2.74- 7S.SS
F 8748 27.67 11.6{l 9.12 51.61
U P 167246 0.46 0.71 1.74 97.09
M 146814 {I,42 0.59 1.53 97.46
F 20432 0.74 1.58 3.30 94.38
OehtadunUA U P 155587 0.41 0,73 1.74 97.'2 , M 136436 0.37 0.60 1.51 97.52
F 19151 0.73 1.66 3.38 94.23 (aJ Dehradull M.Corp, U P '121263 0.33 0.B1 2.10 96.76
M 104727 0.34 0.6'8 US 97,13
F 16536 0.26 1.6a 3.66 94.40
(tl) FR! and College Area GT U P 1509 0.00 0.13 0.33 99.54 M 1314 0.00 0.15 0.30 99.55 F 195 O.DO 0.0£1 0.51 99.49
(c) Dehradur] CB U P 19586 0.14 0.26 0.19 99Al
M 1827Q 0.13 0.22 0.15 99.50
F 1318 0.30 0.83 0.76 98.?~
(d) Clemenl Town CB U P 6810 1.09 0.37 0.51 95.03
M 6486 0.83 D.ll9 0.43 98.85 F :32.4- 10.19 5.85 2.16 eti'~
(e) Raipuf GT U P 6417 2.10 1.08 1.36 95.40. M 5639 1.35 1.03 1.13 96.49
F 778 7.58 1.41 2.96 88.05 MUSSDOTiUA U P 9438 0.60 0.0& i.74 97.58
M 8353 0.59 0.10 1.68 97.63 F 1065 0.14 Q.OO 2.21 97.05
(a~ Musscor; M8 U P 8392 0.68 0.10 1.95 97.27 M 7414 (Uill 0.11 1.69 9l.3~
F 918 0.82 0.00 2.45 96.73 (b) landouf CB U P 1046 O.()O 0.00 0.00 100.00
M 939 0.00 O.DO 0.00 100.00 F 107 0.00 0.00 0.00 100.00
Doiwala NP U P 2221 3.29 1.98 2:\6 92.57 M 2025 30.36 1.9B 2.17 92.49 F 196 2.55 2.04 2.04 93.37
102

Table 4 Percentage distribution of total workers (main and marginal) as cultivators, agricultural labourers, workers in household industry and
other workers in State (or Union Territory), Districts, Tahsils, Urban Agglomerations, Cities and Towns by residence and sex: 2001 StatelDistricUTahsil/UAlCityfT own Civic Total/ Persons/ Total Percentage to Total Workers (Main + Marginal)
statl"s of Rural/ Males! Workers Cultivators Agricultural Workers In Other CltyITown Urban Females (Main + labourers household workers
Marginal) industry
Tahsil Rishlkesh T P 52655 11.23 860 2.44 71.73 M 44242 12.95 f 14 2.18 11.13 F 8413 39.75 16.30 3.82 40.13
R P 31989 27.93 13.88 246 55.73 M 25714 21.98 11.97 2.13 63.92 F 6275 52.32 21.67 379 22.22
U P 22705 0.61 0.60 2.28 9651 M 20532 038 0.56 2 10 9696 F 2173 281 1.01 396 9222
R,shikesh UA U P 21203 002 0.06 2.40 97.52 M 19225 002 0.07 2.22 97.69 F 1978 0.05 000 4.20 95.75
(a) Rishikesh MB & OG U P 17593 0.02 007 2.80 97.1" M 16083 0.02 007 2.59 9737 F 1510 0.07 0.00 4.91 94.96
(i) Ris'likesh MB P 15919 0.03 0.02 2.84 97.11 M 14522 0.02 0.02 767 9729 F 1397 0.07 0.00 458 9535
(ii) Rishikesh OG U P 1674 000 0.54 239 97.07 M 1561 000 0.58 Hi6 97.56 F 113 000 0.00 9.73 90.27
(b) Veerbhadra ITS ITS U P 3610 000 003 0.47 99.50 M 3142 0.00 003 0.29 99.68 F 468 0.00 0.00 1.71 98.29
Pratitnagar CT U P 1502 8.92 8.19 0.53 8236 M 1307 5.66 7.73 0.38 8623 F 195 30.17 11.28 154 5641
GARhWAL T P 270398 67.06 1.55 115 3024 M 135220 44.46 1.77 1.82 01.95 F 135178 89.68 1.33 047 8.52
R P 244953 73.85 1.68 1 10 23.31 M 113011 5308 2.06 188 42.98 F 131942 9164 1.36 044 6.56
U P 25445 173 0.30 158 96.39 M 22209 0.56 0.28 1.50 97.66 F 3236 9.73 043 207 87.77
Tahsil Srlnagar T P 16593 45.98 057 1.30 52.15 M 10090 23.29 046 168 7457 F 6503 81.19 075 069 1737
R P 11705 65.13 0.81 1 10 3296 M 5773 40.71 0.80 1.75 5674 F 5932 88.89 0.83 0.47 9.81
U P 4888 014 0.00 1.76 98.10 M 4317 000 0.00 160 98.40 F 571 1.23 0.00 298 95.79
Srinagar MB U P 4888 0.14 0.00 176 98.10 M 4317 0.00 o.oe '60 9840 F 571 1.23 0.00 298 95.79
Tahsil Paurl T P 60693 70.69 0.99 103 27.29 M 27271 44.05 0.94 190 53.11 F 33422 92.42 1.03 0.3? 6.23
R P 53537 1945 1.09 0.93 18.03 M 21431 0569 1 14 1.93 41.24 F 32106 95.32 105 0.27 3.16
U P 7174 5.12 0.24 1.r7 9? 87 M 5857 1.35 017 1.19 9n 69 F 1317 21.87 053 1.67 7593
103
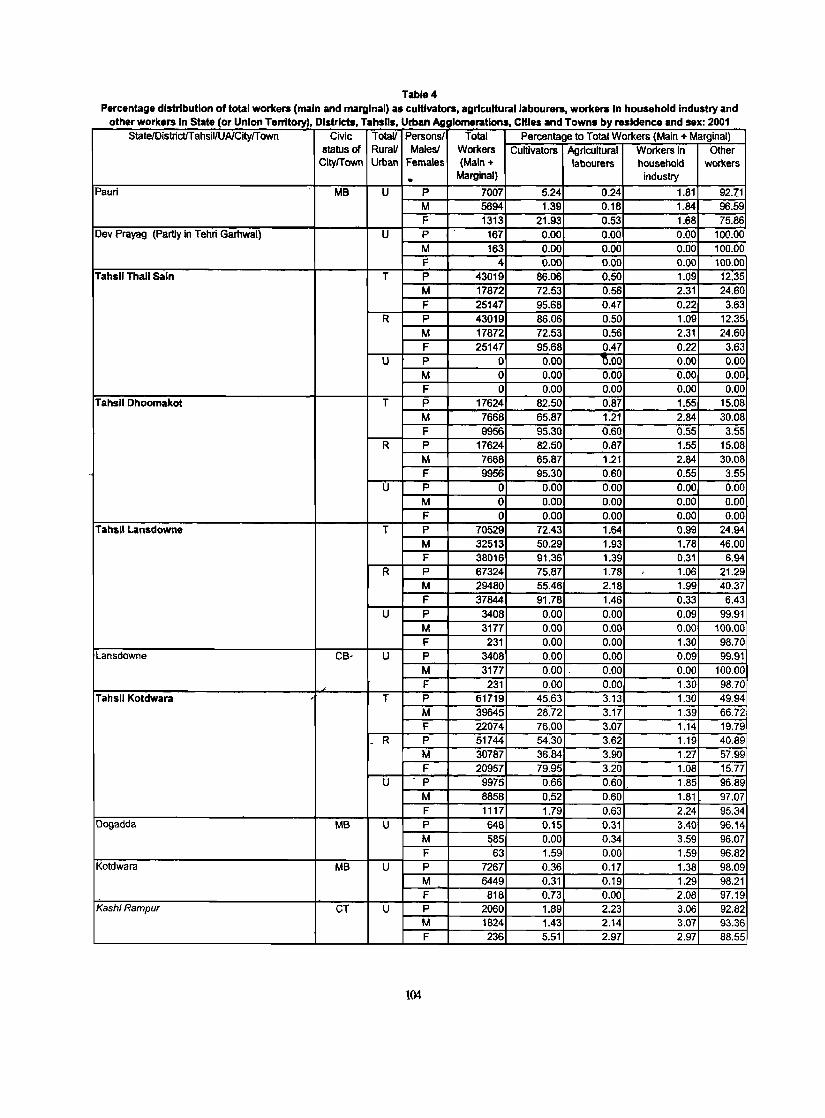
Table 4 Percentage distribution of total workers (main and marginal) as cultivators, agricultural labourers, workers In household Industry and
other workers In State (or Union Territory), Districts, Tahslls Urban Agglomerations Cities and Towns by residence and sex' 2001 , , StateJDistrictlTahsil/UAICityfT own Civic TotaV Personsl Total Percentage to Total Workers (Main + Marginal)
status of RuraV Malest Workers Cultivators Agricultural Workers in Other CityfTown Urban Females (Main + labourers household workers . Marginal) industry
Pauri MB U P 7007 5.24 0.24 1.81 92.1.1 M 5694 1.39 0.18 1.84 96.59 F 1313 21.93 0.53 1.68 75.86
Dev Prayag (Partly in TeM Garhwal) U P 167 0.00 0.00 0.00 100.00 M 163 0.00 0.00 0.00 100.00 F 4 0.00 0.00 0.00 100.00
Tahsil Thall Saln T P 43019 86.06 0.50 1.09 12.35 M 17872 72.53 0.56 2.31 24.60 F 25147 95.68 0.47 0.22 3.63
R p 43019 86.06 0.50 1.09 12.35 M 17872 72.53 0.56 2.31 24.60 F 25147 95.68 0.47 0.22 3.63
U P 0 0.00 _].OO 0.00 0.00 M 0 0.00 0.00 0.00 0.00 F 0 0.00 0.00 0.00 0.00
Tahsil Dhoomakot T P 17624 82.50 0.87 1.55 15.08 M 7666 65.87 1.21 2.84 30.08 F 9956 95.30 0.60 0.55 3.55
R P 17624 82.50 0.87 1.55 15.08 M 7666 65.67 1.21 2.84 30.08 F 9956 95.30 0.60 0.55 3.55
U P 0 0.00 0.00 0.00 0.00 M a 0.00 0.00 0.00 0.00 F a 0.00 0.00 0.00 0.00
Tahsil lansdowne T P 70529 72.43 1.64 0.99 24.94 M 32513 50.29 1.93 1.78 46.00 F 38016 91.36 1.39 0.31 6.94
R p 67324 75.87 1.78 1.06 21.29 M 29480 55.46 2.18 1.99 40.37 F 37844 91.78 1.46 0.33 6.43
U P 3408 0.00 0.00 0.09 99.91 M 3177 0.00 0.00 0.00 100.00 F 231 0.00 0.00 1.30 98.70
Lansdowne CB- U P 3408 0.00 0.00 0.09 99.91 M 3177 0.00 . 0.00 0.00 100.00
-' F 231 0.00 0.00 1.30 98.70 Tahsil Kotdwara T P 61719 45.63 3.13 1.30 49.94
M 39645 28.72 3.17 1.39 66.72 F 22074 76.00 3.07 1.14 19.79
. R P 51744 54.30 3.62 1.19 40.89 M 30787 36.84 3.90 1.27 57.99 F 20957 79.95 3.20 1.08 15.77
U p 9975 0.66 0.60 1.85 96.89 M 8858 0.52 0.60 1.81 97.07 F 1117 1.79 0.63 2.24 95.34
Dogadda MB U P 648 0.15 0.31 3.40 96.14 M 585 0.00 0.34 3.59 96.07 F 63 1.59 0.00 1.59 96.82
Kotdwara MB U P 7267 0.36 0.17 1.38 98.09 M 6449 0.31 0.19 1.29 98.21 F 818 0.73 0.00 2.08 97.19 .
Kashi Rampur CT U P 2060 1.89 2.23 3.06 92.82 M 1824 1.43 2.14 3.07 93.36 F 236 5.51 2.97 2.97 88.55
104
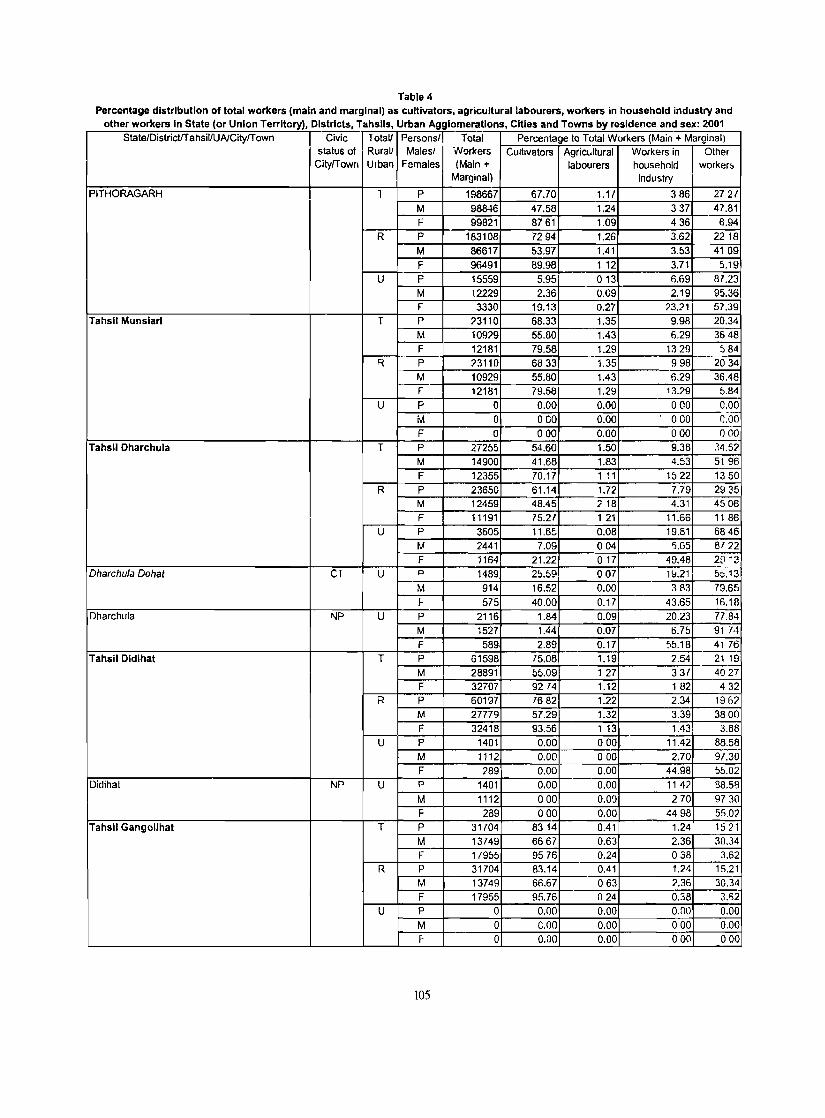
Table 4 Percentage distribution of total workers (main and marginal) as cultivators, agricultural labourers, workers in household industry and
other workers In State (or Union Territory), Districts, Tahsils, Urban Agglomerations, CIties and Towns by residence and sex: 2001 Stale/DistrictfT ahsiVUAlCitylT own I ';~"Ol TotaV Persons/! Total Percentage 10 Totai Workers (Main + Marginal)
RuraU Malesl Workers CUltivators AgriCultural Workers in Other CitylTown Urban Females (Main + labourers household worker~
Marginal) industry
PITHORAGARH T P 198667 67.70 1.11 386 272(
M 98846 47.58 1.24 337 47.81
F 99821 8761 1.09 436 6.94 R P 183108 7294 1.26 3.62 2218
M 86617 53.97 1.41 3.53 4109
F 96491 89.98 1 12 3.71 5.19
U P 15559 5.95 013 6.69 81.23
M 12229 2.36 0.09 2.19 95.36 F 3330 19.13 0.27 ::>3.21 57.39
Tahsil Munslarl T P 23110 68.33 1.35 9.98 20.34 M 109::>9 55.80 1.43 6.29 3648 F 12181 79.58 1.29 1329 584
q P 73110 6833 1.35 998 2034 M 10929 55.80 1.43 6.29 36.48 r 12181 79.58 1.29 13.79 5.84
U P 0 0.00 0.00 000 0.00 M 0 000 0.00 000 ~= C.DO F 0 000 0.00 000 000
Tahsil Dharchula T P 27255 54.60 1.50 9.38 34.57
M 14900 41.68 1.83 4.53 5196
F 12355 70.17 111 1022 1350 R P 23650 61.14 1.72 7.79 2935
M 12459 48.45 ::> 18 4.31 4506 F 11191 15.21 121 11.66 1186
U P 3605 11.6~ 0.08 19.81 6846 M 2441 7.09 004 5.65 8122 F 1164 21.22 017 49.48 29 ·3
Dharchula Dehat CT U 0 1489 20.09 007 1~.21 otl.13
M 914 16.52 0.00 353 79.65
I- 575 40.00 0.17 43.65 16.18 Dharchula I\lP U P 2116 1.84 0.09 20.23 77.84
M 1527 1.44 0.07 6.75 91 74 F 589 2.89 0.17 55.18 4176
Tahsil Didihat T P 61598 15.08 1.19 2.54 21 19
M 28891 55.09 1 27 331 4027 F 32707 9214 1.12 182 432
R P 60197 7682 1.22 2.34 1962 M 27779 57.29 1.32 3.39 3800 F 32418 93.56 1 13 1.43 3.88
U P 1401 0.00 000 11.42 88.58 M 1112 0.00 000 2.70 91.30 F ::>89 0.00 0.00 44.98 05.02
Didihat NP U p 1401 0.00 0.00 1147 88.58
M 1112 000 o.oa 270 9730 F 289 000 0.00 4498 55.02
Tahsil Gangolihat T P 31104 8314 0.41 1.24 1521 M 13149 6667 0.63 2.36 30.34 F 11955 9576 0.24 038 3.62
R P 31704 83.14 0.41 1.24 15.21 M 13749 66.67 063 2.36 30.34 F 17955 95.76 024 0.38 3.62
U P 0 0.00 0.00 0.00 0.00 M 0 0.00 0.00 000 0.00 F- 0 0.00 0.00 000 000
105
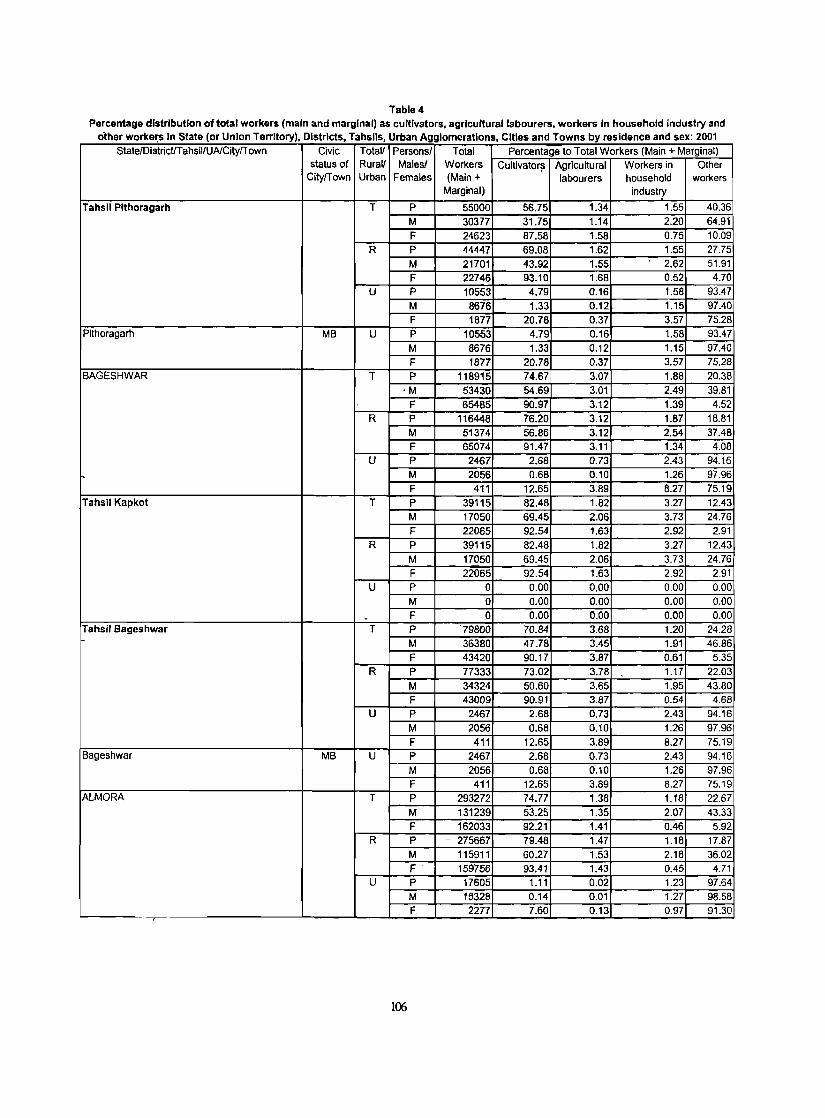
Table 4 Percentage distribution oftotal workers (main and marginal) as cultivators. agricultural labourers. workers In household industry and
olher workers In State (or Union Territory). Districts, Tahslls, Urban Agglomerations, Cities and Towns by residence and sex: 2001 StatelDistrictITahsillUAlCityfT own Civic Totall Personsl Total Percentage to Total Workers (Main + Marginal)
status of Rurall Malesl Workers Cultivator~ Agricultural Workers in Other CityfTown Urban Females (Main + labourers household workers
Marginal) industry
Tahsil Pithoragarh T P 55000 56.75 1.34 1.55 40.36
M 30377 31.75 1.14 2.20 64.91
F 24623 87.58 1.58 0.75 10.09
R P 44447 69.08 1.62 1.55 27.75
M 21701 43.92 1.55 2.62 51.91
F 22746 93.10 1.68 0.52 4.70
U P 10553 4.79 0.16 1.58 93.47
M 8676 1.33 0.12 1.15 97.40
F 1877 20.78 0.37 3.57 75.28 Pithoragarh MB U P 10553 4.79 0.16 1.58 93.47
M 8676 1.33 0.12 1.15 97.40
F 1877 20.78 0.37 3.57 75.28 BAGESHWAR T p 118915 74.67 3.07 1.88 20.38
'M 53430 54.69 3.01 2.49 39.81
F 65485 90.97 3.12 1.39 4.52
R P 116448 76.20 3.12 1.87 18.81
M 51374 56.86 3.12 2.54 37.48
F 65074 91.47 3.11 1.34 4.08
U P 2467 2.68 0.73 2,43 94.16
M 2056 0.68 0.10 1.26 97.96
F 411 12.65 3.89 8.27 75.19 Tahsil Kapkot T P 39115 82.48 1.82 3.27 12.43
M 17050 69.45 2.06 3.73 24.76 F 22065 92.54 1.63 2.92 2.91
R P 39115 82,48 1.82 3.27 12.43
M 17050 69.45 2.06 3.73 24.76
F 22065 92.54 1.63 2.92 2.91 U P 0 0.00 0.00 0.00 0.00
M 0 0.00 0.00 0.00 0.00
~ F 0 0.00 0.00 0.00 0.00 Tahsil Bageshwar T P '79800 70.84 3.68 1.20 24.28 - M 36380 47.78 3.45 1.91 46.86
F 43420 90.17 3.87 0.61 5.35 R P 77333 73.02 3.78 1.17 22.03
M 34324 50.60 3.65 1.95 43.80
F 43009 90.91 3.87 0.54 4.68
U P 2467 2.68 0.73 2,43 94.16
M 2056 0.68 0.10 1.26 97.96
F 411 12.65 3.89 8.27 75.19 Bageshwar MB U P 2467 2.68 0.73 2.43 94.16
M 2056 0.68 0.10 1.26 97.96 F 411 12.65 3.89 8.27 75.19
ALMORA T P 293272 74.77 1.38 1.18 22.67
M 131239 53.25 1.35 2.07 43.33 F 162033 92.21 1.41 0.46 5.92
R P - 275667 79.48 1.47 1.18 17.87
M 115911 60.27 1.53 2.18 36.02 F' 159756 93.41 1.43 0.45 4.71
U P 17605 1.11 0.02 1.23 97.64
M 15328 0.14 0.01 1.27 98.58 F 2277 7.60 0.13 0.97 91.30 -,-
1~

Table 4 Percentage distribution of total workers (main and marginal) as cultivators, agricultural labourers, workers in household industry and
other workers In State (or Union Territory). Districts. Tahsils. Urban Agglomerations. Cities and Towns by residence and sex: 2001 State!DistricUTahsil!UNCityfTown Civic Total! Persons! Total Percentage to Total Workers (Main + Marginal)
'status of Rural! Males! Workers Cultivators Agricultural Workers in Other CityfTown Urban Females (Main + labourers household workers
Marginal) industry
Tahsil Bhlklya Saln T P 74918 87.60 0.65 0.86 10.89
• M 29054 73.69 0.47 1.76 24.08
F 45864 96.41 0.75 0.29 2.55
R P 74918 87.60 0.65 _ 0.86 10.89
M 29054 73.69 0.47 1.76 24.08
F 45864 96.41 0.75 0.29 2.55
U P a 0.00 0.00 0.00 0.00
M 0 0.00 0.00 0.00 0.00
F 0 0.00 0.00 0.00 0.00
Tahsil Ranlkhet T P 95098 71.27 1.47 1.16 26.10
M 44117 47.19 1.39 2.12 49.30
F 50981 92.10 1.54 0.33 6.03 R P 86926 77.75 1.60 1.15 19.50
M 36720 56.64 1.66 2.28 39.42 F 50206 93.18 1.56 0.31 4.95
U P 8172 2.33 0.05 1.31 96.31
M 7397 0.30 - 0.01 1.31 98.38
F 775 21.68 0.39 1.29 76.64 Dwarahat NP U P 916 19.87 0.33 1.20 78.60
M 652 2.61 0.00 1.69 95.70
F 264 62.50 1.14 0.00 36.36 Ranikhet CB U P 7256 0.11 0.01 1.32 98.56
M 6745 0.07 0.01 1.28 98.64
F 511 0.59 0.00 1.96 97.45
Tahsil Almora T P 1232~ 69.69 1.77 1.40 27.14 - M 58068' 47.62 1.75 2.20 48.43
F 65188 89.34 1.78 0.68 -8.20
R -p - 113823 75.46 1.91 1.42 21.21
M 50137 55.16 2.03 2.35 40.46
~, 63686 91.44 1.82 0.68 - _6.06
U p- 9433 0.05 0.00 1.17 98.78
M 7931 0.00 0.00 ,1.24 98.76
F 1502 0.33 0.00 ,
0.80 98.87 , Aimora UA U P 9433 0.05 0.00 1.17 98.78
M 7931 0.00 0.00 1.24 98.76
F 1502 0.33 0.00 0.80 98.87 (a)Almora MB U P 8624 0.00 0.00 1.21 98.79
M 7168 0.00 0.00 1.37 98.63
F 1456 0.00 0.00 0.41 99.59 (b) Ahnora CB U P 809 0.62 0.00 0.74 98.64
M 763 0.00 _ 0.00 0.00 100.00
F 46 10.87 0.00 13.04 76.09 CHAMPAWAT T P 90180 69.91 2.01 1.61 .- 26.47
M 48296 51.92 2.22 2.02 43.84
F 41884 90.65 1.78 1.15 6.42
R P 80650 77.33 2.09 1.56 19.02
M 39913 62.23 2.45 2.03 33.29
F 40737 r 92.13 1.75 1.10 5.02
U -p 9530 7.07 1.35 2.07 89.51
M 8383 2:86 1.15 - -4.,9I 94.02
F 1147 37.84 2.88 . 2.79 56.49
107

Table 4 Percentage distribution of total workers (main and marginal) as cultivators, agricultural labourers, workers in household Industry and
other workers in State (or Union Torritory), Districts,'Tahsils, Urban Ag illomerations, Cities and Towns by_ residence and sex: 2001 StatelDistrict!T ahsiUUAlCitylT own Civic TotaU Persons! Total Percenta e to Total Workers_{Main + Marginal)
status of Rural! Males! Workers Cultivators Agricultural Workers in Other' CitylTown Urban Females (Main + labourers household workers
Marginal) industry
Tahsil Champawat T P 90180 69.91 2.01 1.61 26.47 M 48296 51.92 2.22 2.02 43.84 F 41884 90.65 178 1.15 6.42
R P 80650 77.33 2.09 1.56 19.02 M 39913 62.23 2.45 2.03 33.29 F 40737 92.13 1.75 1.10 5.02
U P 9530 7.07 1.35 2.07 89.51 M 8383 2.86 1.15 1.97 94.02 F 1147 37.84 2.88 2.79 56.49
Lotiaghat NP U P 1581 0.19 0.00 3.16 96.65 M 1417 0.21 0.00 3.32 96.47 F 164 0.00 0.00 1.83 98.17
Champawat NP U PJ 1503 13.97 0.00 0.27 85.76 M 1213 3.79 0.00 0.16 96.05
, - F 290 56.55 0.00 0.69 42.76 Tanakpur MB U P 4407 0.14 0.39 1.41 98.06
'M 4103 0.12 0.37 1.07 98.44 F 304 0.33 0.66 5.92 93.09
Banbasa CT U P 2039 22.31 5.49 3.97 68.23 M 1650 11.27 4.91 4.36 79.46 F 389 69.15 7.97 2.31 20.57
NAINITAL T P 279872 42.03 8.60 1.85 47.52
M 193889 31.50 7.35 1.44 59.71 F 85983 65.78 11.44 2.78 20.00
R P 206507 56.69 11.51 2.03 29.77 M 128694 47.10 10.90 1.62 40.38
F 77813 72.55 12.51 2.72 12.22
U p 73365 0.79 0.43 1.33 97.45
M 65195 0.72 0.33 1.09 97.86
./ F 8170 1.36 1.24 3.28 94.12
Tahsil Kosya Kutauli T P 23521 79.80 1.89 0.96 17.35 M 11663 65.71 2.34 1.44 30.51
- F 11858 93.65 1.44 0.48 4.43
R P 23521 79.80 1.89 0.96 17:35
M 11663 65.71 2.34 1."4 30.51
F 11858 93.65 1.44 0.48 4.43
U P 0 0.00 0.00 0.00 0.00 I M 0 0.00 0.00 0.00 0.00
F 0 0.00 0.00 0.00 0.00
Tahsil Nainital T P 49921 42~33 3.29 1.49 52.89
M 34863 32.83 3.12 1.02 63.03
F 15058 64.32 3.69 2.60 29.39 R P , 35068 59.90 4.58 1.76 33.76
M 22546 50.48 4.71 1.15 43.66 F 12522 76.86 4.34 2.86 15.94
U P 14853 0.86 0.25 0.87 98.02 M 12317 0.54 0.20 0.77 98.49
F 2536 2.41 0.47 1.34 95.78
Nainital UA U P 11459 0.10 0.10 0.71 99.09
M 9611 0.08 0.12 0.73 99.07
F 1848 0.22 0.00 0.60 99.18
(a) Nainital MB U P 11071 0.11 0.11 0.71 99.07
M 9298 0.09 0.13 0.74 99.04 F 1773 0.23 0.00 0.56 99.21
(b) Nainital CB U P 388 0.00 0.00 0.52 99.48
M 313 0.00 0.00 0.32 99.68
F 75 0.00 0.00 1.33 98.67
lOS
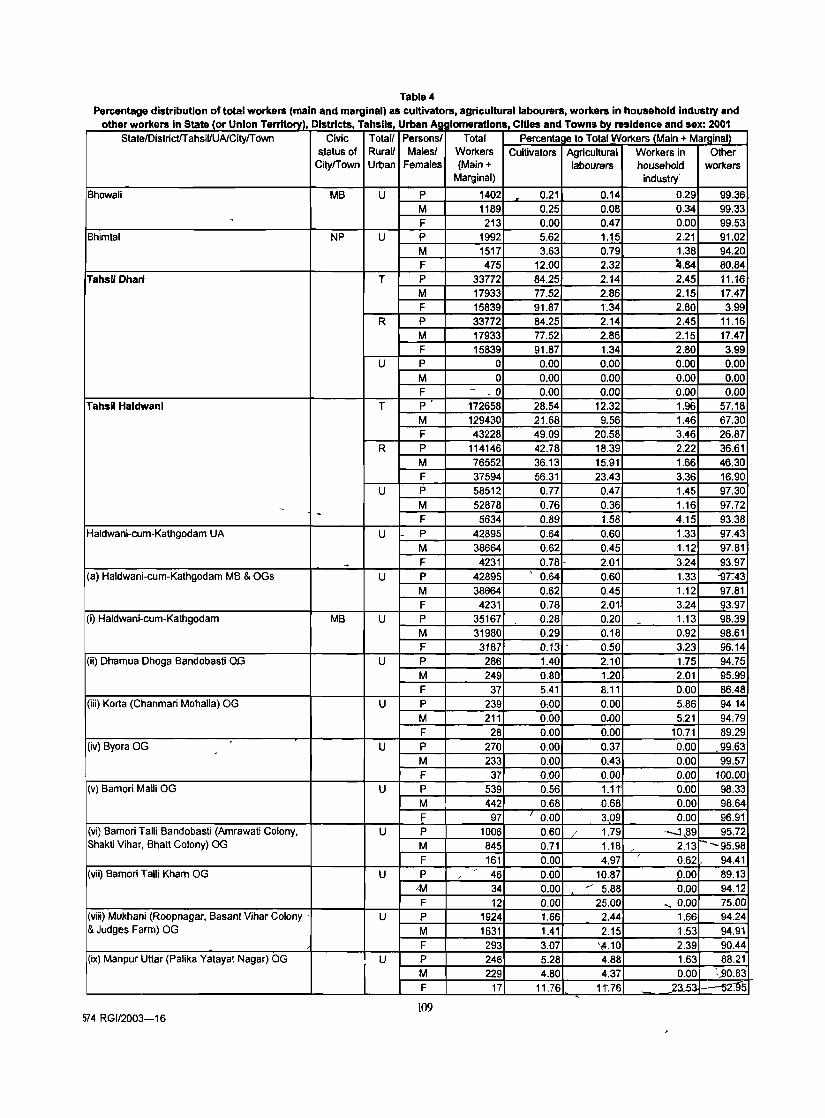
Table 4 Percentage distribution of total workers (main and marginal) as cultivators, agricultural labourers, workers in household industry and
other workers in Statelor Union Territory), Districts, Tahslls, Urban Ag lomerations, Cities and Towns by residence and sex: 2001 StatelDistrictIT ahsiflUA/CitylT own Civic Total! Persons! Total Percenta e to Total Workers (Main + Marginal)
status of RuraV Males! Workers Cultivators Agricultural Workers in Other CitylTown Urban Females (Main + labourers household workers
Marginal) industry
Bhowali MB U P 1402 0.21 0.14 0.29 99.36 M 1189 0.25 0.08 0.34 99.33
, F 213 0.00 0.47 0.00 99.53
Bhimtal NP U P 1992 5.62 1.15 2.21 91.02 M 1517 3.63 0.79 1.38 94.20 F 475 12.00 2.32 ~.84 80.84
Tahsil Dhari T P 33772 84.25 2.14 2.45 11.16 M 17933 77.52 2.86 2.15 17.47 F 15839 91.87 1.34 2.80 3.99
R P 33772 84.25 2.14 2.45 11.16 M 17933 77.52 2.86 2.15 17.47 F 15839 91.87 1.34 2.80 3.99
U P 0 0.00 0.00 0.00 0.00 M 0 0.00 0.00 0.00 0.00 F - .0 0.00 0.00 0.00 0.00
Tahsil Haldwanl T P 172658 28.54 12.32 1.96 57.18 M 129430 21.68 9.56 1.46 67.30 F 43228 49.09 20.58 3.46 26.87
R P 114146 42.78 18.39 2.22 36.61 M 76552 36.13 15.91 1.66 46.30 F 37594 56.31 23.43 3.36 16.90
U P 58512 0.77 0.47 1.45 97.30
- M 52878 0.76 0.36 1.16 97.72 - - F 5634 0.89 1.58 4.15 93.38 Haldwani-cum-Kathgodam UA U P 42895 0.64 0.60 1.33 91.43
M 38664 0.62 0.45 1.12 97.81
- F 4231 0.78· 2.01 3.24 93.97 (a) Haldwani-cum-Kathgodam MB & OGs U P 42895
, 0.64 0.60 1.33 -9"(.43
M 38664 0.62 0.45 1.12 97.81 F 4231 0.78 2.01 3.24 93.97
(i) Haldwani-cum-Kathgodam MB U P 35167 0.28 0.20 - 1.13 98.39 M 31980 0.29 0.18 0.92 98.61 F 3187 0.13 . 0.50 3.23 96.14
(ii) Dhamua Dhoga Bandobasti O,G U P 286 1.40 2.10 1.75 94.75 M 249 0.80 1.20 2.01 95.99 F 37 5.41 8.11 0.00 86.48
(iii) Korta (Chanmari Mohalla) OG U P 239 0:00 0.00 5.86 9414 M 211 0.00 0.00 5.21 94.79 F 28 0.00 0.00 10.71 89.29
(iv) Byora OG U P 270 0.00 0.37 0.00 -99.63 M 233 0.00 0.43 0.00 99.57 F 37 0.00 0.00 0.00 100.00
(v) Bamori Malli OG U P 539 0.56 1.11" 0.00 98.33 M 442 0.68 -0.68 0.00 98.64
F 97 ' 0.00 3.09 0.00 96.91 (vi) Bamori Talli Bandobasti (Amrawati Colony, U P 1006 0.60 , 1.79 -.1.89 95.72 Shakti Vihar, Bhatt Colony) OG M 845 0.71 1.18 2.13 :--"'95.98
F 161 0.00 4.97 ,
0.62 94.41 (viij Bamori Talfi Kham OG U P - 46 0.00 10.87 0.00 89.13 ,
'M 34 0.00 /' 5.88 0.00 94.12 F 12 0.00 25.00 ..... 0.00 75.00
(viii) Mukhani (Roopnagar, Basanl Vihar Colony . U P 1924 1.66 2.44 1.66 94.24 & Judges Farm) OG M 1631 1.41 2.15 1.53 94.91
F 293 3.07 ';4.10 2.39 90.44 (ix) Manpur Uttar (Palika Yatayat Nagar) OG
I U P 246 5.28 4.88 1.63 88.21
M 229 4.80 4.37 0.00 ~<90.83
F 17 11.76 11".76 23...53 -SZ§5
109 574 RG1I2003-16

Table 4
Pen;entagoG distribution of total workers (main and marg!nal) as culliyators, agrlculturallabour01'$, work&1'$ in household ind'_!",tJ)' and other workers in State (or Union Territorv), Districts, Tahsils, Urban Ag ~lomeratjDns, Cities and Towns by residence and sex; 2001
State{Di strict/TansiUUNCitylT own Cillic Total! Personsl Totar Percenla e to Total Workers (Main l' Marginal) status of Rurall Males! Workers Cultivators Agricultural Workers in Olher
CilyfTown Urban Females (Main + labo;.r€rs household worker, Marginal} industry
(x) Haripur Sukha (Van Cancer Hospital) OG U P 64 t2~50 1.56 1.56 M~ M 55 12.73 1.82 1.82 836'1 F 9 11.11 0.00 OJJO 888'J
(xii Halclwani Talli OG U P '072 4.20 4.10 2.15 S9~_
M 975 4.41 3.18 1.13 91.£" F 97 l.06 13.40 12.37 72 101
(Xii) Gojajally Uttar (Shishu Bhart'lya Vidya U P .371 1.35 1.35 10.51 86 r ' Mandir) OG M 353 1A2 0.85 10.76
-, 86' .
-~ -F 18 O.DO 11.11 5.56 83.;j (xiii) Kusum Khera OG U P 945 5.08 2.86 2.65 89'\i M 813 4.80 1.85 2.95 90.~r,
F 132 6.82 9.09 0.76 a3~ 12, (xiv) Bithoria No.1 OG U P 720 1.81 1.94 1.39 94 :&~
M 614 1.47 O.4~ 0.81 97d F 106 3.77 10.38 .-'
~- 4.72 Bi 13 Ramnagar MB U P 12208 0.62 CI.08 1.61 9769
M 11037 0.153 0.0'9 1.08 91.1ZlJ F 1171 0.51 0.00 6.66 92.83
Kaladungi NP U P 1609 6.40 0.56 3.67 8937 M 1464 6.28 0.34 3.28 9010 F 145 7.59 2.76 7.59 82Q6
Lalkuan NP U P ,1800 0.00 0.00 1,28 981'; M 1113 0.00 0.00 0.88 99.12 F 87 0.00 0.00 9.20 90.80
UDHAM SINGH NAGAR T P 393348 29.12 25.63 3.30 4135 M 315079 28.09 23.70 2.67 4554 F 78269 3628 :33.42 5j33 2447
R P 278842 40.13 32.83 2.20 24.84 M 211713 39.6.3 31.62 1.34 2741 F 61129 41.72 36.66 4.92 16.70
U p 114500 4.37 8.09 5.97 81 51 M 103366 4.47 7.47 5.40 82.6& F 11140 3,47 13.91 11.31 71.31
Tahsil Kashipur T p 1347'12 22.72 28.21 1.74 47.33 M 119308 23.13 25.79 1.38 49.70 F' 15404 1949 46.90 4.51 29.10
R P 85383 32.36 39.78 1.42 2644 M 73148 33.85 37.18 T .i7 27.M F 12235 23.49 55.33 2.92 18.26
U P 49329 6:02 8.18 - 2.2S 83.52 M 46160 6.15 7.75 1.70 84.40 F 3169 4.07 14.36 10.67 7Q 90
-AallUa Dabra Harlpura NP U P 1455 29.00 23.64 4.33 42.13 M 1383 31.09 22.99 3.47 4245 F 72 /£:94 36.; 1 2lJ.83 3612
Jaspur MB U P 9849 5.65 3.06 2.30 88% M 9329 5.82 2.97 1.59 89.62 F 520 250 4.62 15.19 n6~
I(ashipuf MB U P 24282 2.{]6 194 1.86 94.1~
M 22780 2.06 1.94 1.49 9451 F 15Q2 2.06 1.93
, 7.46 88 5~
:achtJal Gosain CT, U P 1168 7.79 6.85 1.63 83.73 M 1124 7.92 5.34 U3 85.4' F 44 455 45.45 !HJ9· 40.01
lhua Kheragarlj NP U P 2489 23.42 31.46 8.76 3(i3(i
M 2162 25.16 30.20 6.24 18.40 F 327 11.93 39.76 25.38 ?~
lllJ
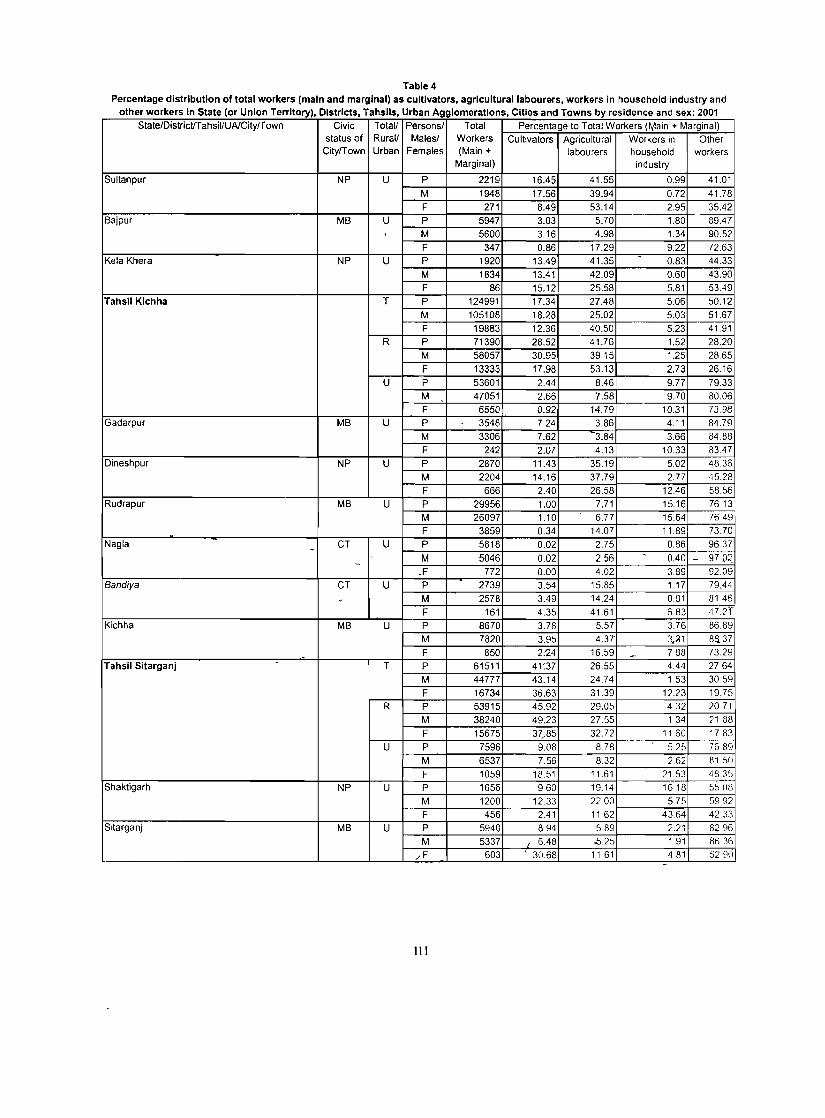
Table 4 Percentage distribution of total workers (main and marginal) as cultivators, agricultural labourers, workers in household industry and
other workers in State (or Union Territory) Districts Tahsils Urban Agglomerations Cities and Towns by residence and sex' 2001 , , , , State!DistrictIT ahsillUAICityfT own Civic Totall Persons! Total Percentage to Total Workers (f-;1ain + Marginal)
status of Rurall Males! Workers Cultivators Agricultural Workers in Other CityfTown Urban Females (Main + labourers household workers
Marginal) industry
Sultan pur NP U P 2219 16.45 41.55 0.99 41.01 M 1948 17.56 39.94 0.72 41.78 F 271 8.49 53.14 2.95 35.42
Bajpur MB U P 5947 3.03 5.70 1.80 89.47 I M 5600 3.16 4.98 1.34 90.52
F 347 0.86 17.29 9.22 72.63 Kela Khera NP U P 1920 13.49 41.35 - 0.83 44.33
M 1834 13.41 42.09 0.60 43.90 F 86 15.12 25.58 5.81 53.49
Tahsil Kichha T P 124991 17.34 27.48 5.06 50.12 M 105108 18.28 25.02 5.03 51.67 F 19883 12.36 40.50 5.23 41.91
R P 71390 28.52 41.76 1.52 28.20 M 58057 30.95 39.15 1.25 28.65 F 13333 17.9a 53.13 2.73 26.16
U P 53601 2.44 8.46 9.77 79.33 M 47051 2.66 7.58 9.70 80.06 F 6550 0.92 14.79 10.31 73.98
Gadarpur MB U P - 3548 7.24 3.86 4.11 84.79 M 3306 7.62 3.84 3.66 84.88 F 242 2.07 4.13 10.33 83.47
Dineshpur NP U P 28"10 11.43 35.19 502 48.36 M 2204 14.16 37.79 2.77 45.28 F 666 2.40 26.58 12.46 58.56
Rudrapur MB U P 29956 1.00 7.71 15.16 76.13 M 26097 1.10 6.77 15.64 76.49 F 3859 0.34 14.07 11.89 73.70 _
Nagla - CT U P 5818 0.02 2.75 0.86 96.37
M 5046 0.02 2.56 - 0.40 - 97.02 -_F 772 0.00 4.02 3.89 9209
8andiya CT U P 2739 3.54 15.85 1.17 79.44
- M 2578 3.49 14.24 0.81 814G
F 161 4.35 41.61 6.83 472;-Kichha MB U P 8670 3.78 5.57 3.76 86.89
M 7820 3.95 4.37 3,~1 88. 37 F 850 2.'24 16.59 - 788 73.29
Tahsil Sitarganj .
T P 61511 4U7 26.55 4.44 2764 M 44777 43.14 24.74 153 30.59
F 16734 36.63 31.39 12.23 19.75 R P 53915 45.92 29.05 432 20.71
M 38240 49.23 27.55 134 21 88
F 15675 37_.85 32.72 1160 1783
U P 7596 9.08 8.78 5.25 7689 M 6537 7.56 8.32 2.62 81 SO
F 1059 18.51 lL61 21.53 48.35 Shaktigarh NP U P 1656 960 19.14 1618 55 (18
M 1200 12.33 2200 5.75 5992 F 456 2.41 1162 43.64 42.33
Sitarganj MB U P 5940 8.94 589 2.21 8296 M 5337 1 6.48 .5.25 191 863fi
,IF 603 ; 30.68 11 61 481 ~2 9ci -
111
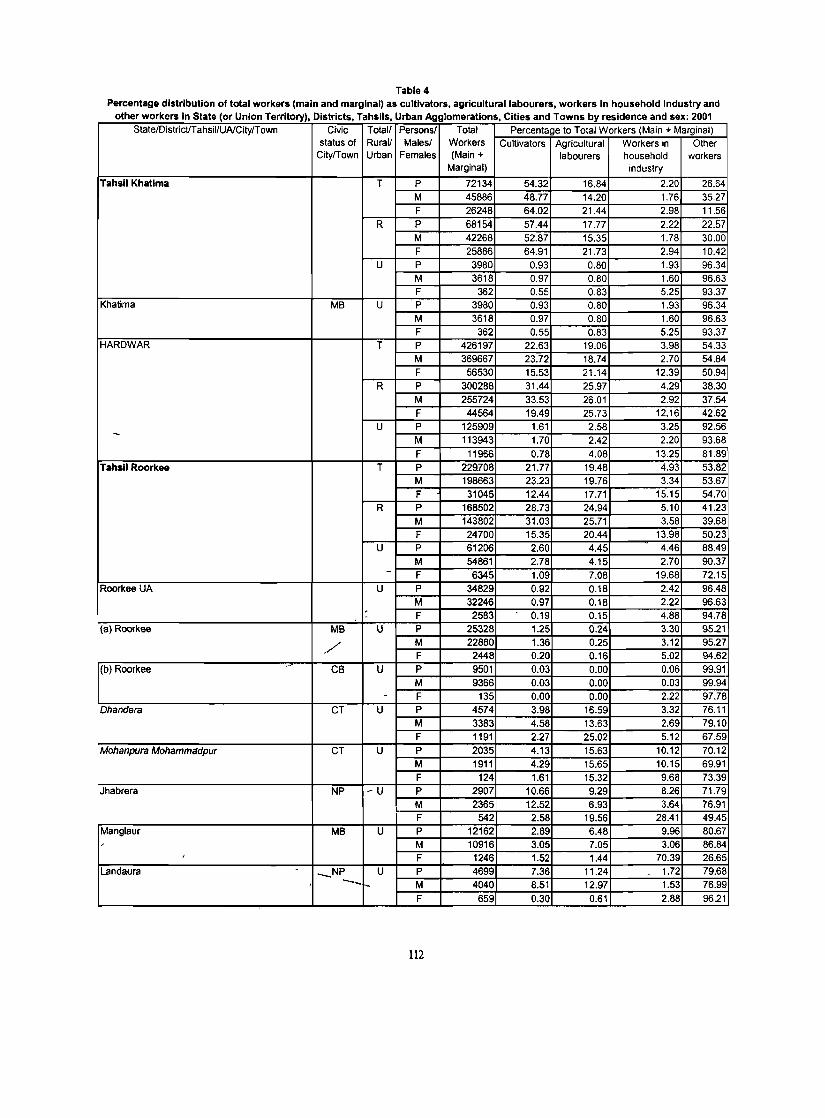
Table 4 Percentage distribution of total workers (main and marginal) as cultivators, agricultural labourers, workers In household Industry and
other workers In State (or Union Territory) Districts Tahsils Urban Agglomerations Cities and Towns by residence and sex' 2001 , , , , State/DistricVTahsil/UAlCity/Town Civic Totall Personsl Total Percentage to Total Workers (Main + Marginal)
status of Rurall Malesl Workers Cultivators Agricultural Workers in Other CitylTown Urban Females (Main + labourers household workers
Marginal) industry
Tahsil Khatima T P 72134 54.32 16.84 2.20 26.64
M 45886 48.77 14.20 1.76 35.27 F 26248 64.02 21.44 2.98 11.56
R P 68154 57.44 17.77 2.22 22.57 M 42268 52.87 15.35 1.78 30.00 F 25886 64.91 21.73 2.94 10.42
U P 3980 0.93 0.80 1.93 96.34
M 3618 0.97 0.80 1.60 96.63 F 362 0.55 0.83 5.25 93.37
Khatima MB U P 3980 0.93 0.80 1.93 96.34
M 3618 0.97 0.80 1.60 96.63 F 362 0.55 0.83 5.25 93.37
HARDWAR T P 426197 22.63 19.06 3.98 54.33 M 369667 23.72 18.74 2.70 54.84 F 56530 15.53 21.14 12.39 50.94
R P 300288 31.44 25.97 4.29 38.30
M 255724 33.53 26.01 2.92 37.54
F 44564 19.49 25.73 12.16 42.62
U P 125909 1.61 2.58 3.25 92.56 - M 113943 1.70 2.42 2.20 93.68
F 11966 0.78 4.08 13.25 81.89
Tahsil Roorkae T P 229.708 21.77 19.48 4.93 53.82 M 198663 23.23 19.76 3.34 53.67
F 31045 12.44 17.71 15.15 54.70
R P 168502 28.73 24.94 5.10 41.23
M 143802 31.03 25.71 3.58 39.68 F 24700 15.35 20.44 13.98 50.23
U P 61206 2.60 4.45 4.46 88.49
M 54861 2.78 4.15 2.70 90.37 - F 6345 1.09 7.08 19.68 72.15
Roorkee UA U P 34829 0.92 0.18 2.42 96.48 M 32246 0.97 0.18 2.22 96.63
, - F 2583 0.19 0.15 4.88 94.78
(a) Roorkee MB U P 25328 1.25 0.24 3.30 95.21
./ M 22880 1.36 0.25 3.12 95.27
F 2448 0.20 0.16 5.02 94.62
(b) Roorkee CB U P 9501 0.03 0.00 0.06 99.91
M 9366 0.03 0.00 0.03 99.94 - F 135 0.00 0.00 2.22 97.78
Dhandera CT U P 4574 3.98 16.59 3.32 76.11
M 3383 4.58 13.63 2.69 79.10
F 1191 2.27 25.02 5.12 67.59
Mohanpura Mohammadpur CT U P 2035 4.13 15.63 10.12 70.12
M 1911 4.29 15.65 10.15 69.91
F 124 1.61 15.32 9.68 73.39 Jhabrera NP ~U P 2907 10.66 9.29 8.26 71.79
L M 2365 12.52 6.93 3.64 76.91
F 542 2.58 19.56 28.41 49.45 Manglaur MB U P 12162 2.89 6.48 9.96 80.67 , M 10916 3.05 7.05 3.06 86.84
, F 1246 1.52 1.44 70.39 26.65
Landaura - _NP U P 4699 7.36 11.24 1.72 79.68 -_ M 4040 8.51 12.97 1.53 76.99
F 659 0.30 0.61 2.88 96.21
112
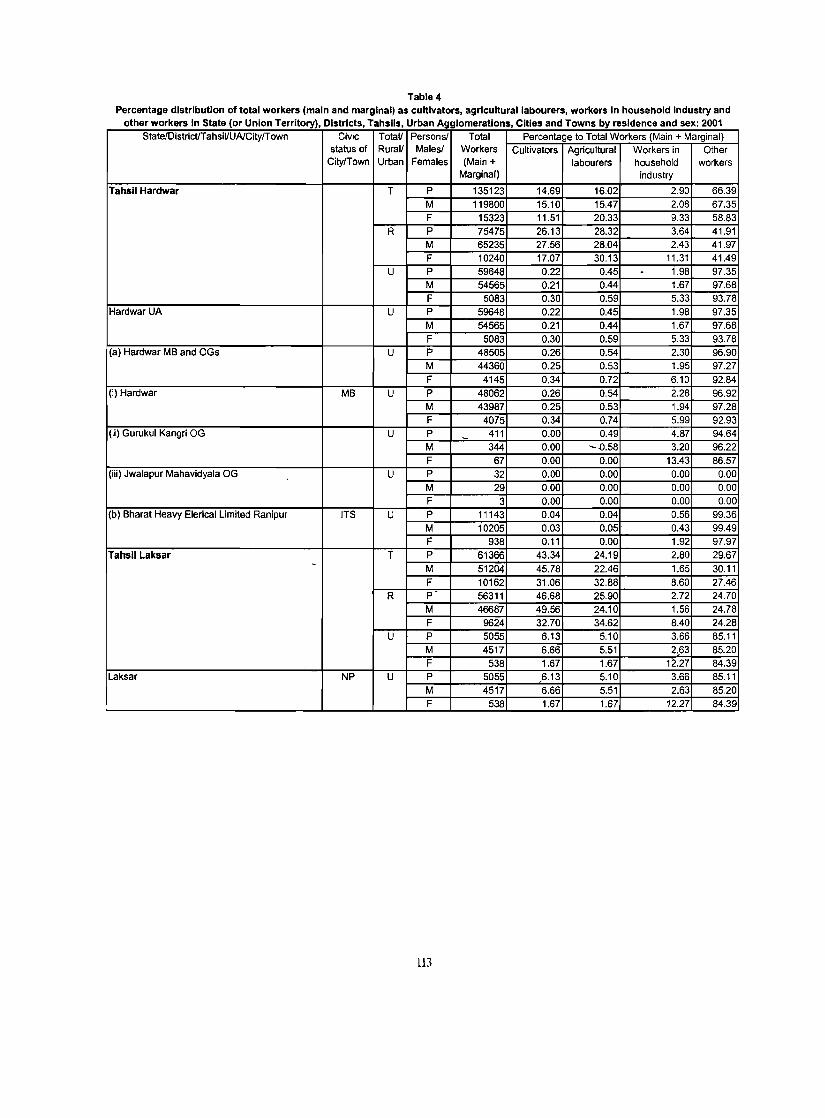
Table 4 Percentage distribution of total workers (main and marginal) as cultivators. agricultural labourers. workers In household industry and
other workers In State (or Union Territory). Districts. Tahsils. Urban Agglomerations Cities and Towns by residence and sex: 2001 . State/District/Tahsil!UAlCitylTown Civic Total! Persons! Total Percentage to Total Workers (Main + Marginal)
status of Rural! Males! Workers Cultivators Agricultural Workers in Other CitylTown Urban Females (Main + labourers household workers
Marginal) industry
Tahsil Hardwar T P 135123 14.69 16.02 2.90 66.39 M 119800 15.10 15.47 2.08 67.35 F 15323 11.51 20.33 9.33 58.83
R P 75475 26.13 28.32 3.64 41.91 M 65235 27.56 28.04 2.43 41.97 F 10240 17.07 30.13 11.31 41.49
U P 59648 0.22 0.45 - 1.9B 97.35 M 54565 0.21 0.44 1.67 97.68 F 5083 0.30 0.59 5.33 93.78
Hardwar UA U P 59648 0.22 0.45 1.9B 97.35 M 54565 0.21 0.44 1.67 97.68 F 5083 0.30 0.59 5.33 93.78
(a) Hardwar MB and OGs U P 48505 0.26 0.54 2.30 96.90 M 44360 0.25 0.53 1.95 97.27 F 4145 0.34 0.72 6.10 92.84
(i) Hardwar MB U P 48062 0.26 0.54 2.2B 96.92 M 43987 0.25 0.53 1.94 97.28 F 4075 0.34 0.74 5.99 92.93
(ii) Gurukul Kangri OG U P - 411 0.00 0.49 4.B7 94.64 M 344 0.00 --0.58 3.20 96.22 F 67 0.00 0.00 13.43 86.57
(iii) Jwalapur Mahavidyala OG U P 32 0.00 0.00 0.00 0.00 M 29 0.00 0.00 0.00 0.00 F 3 0.00 0.00 0.00 0.00
(b) Bharat Heavy Elerical Limited Ranipur ITS U P 11143 0.04 0.04 0.56 99.36 M 10205 0.03 0.05 0.43 99.49 F 938 0.11 0.00 1.92 97.97
Tahsil Laksar T P 61366 43.34 24.19 2.80 29.67 - M 51204 45.78 22.46 1.65 30.11 F 10162 31.06 32.88 B.60 27.46
R P- 56311 46.68 25.90 2.72 24.70 M 46687 49.56 24.10 1.56 24.78 F 9624 32.70 34.62 B.40 24.28
U P 5055 6.13 5.10 3.66 85.11 M 4517 6.66 5.51 2.63 85.20 F 538 1.67 1.67 1'2.27 84.39
Laksar NP U P 5055 6.13 5.10 3.66 85.11 M 4517 6.66 5.51 2.63 85.20 F 538 1.67 1.67 12.27 84.39
113


MAPS
115

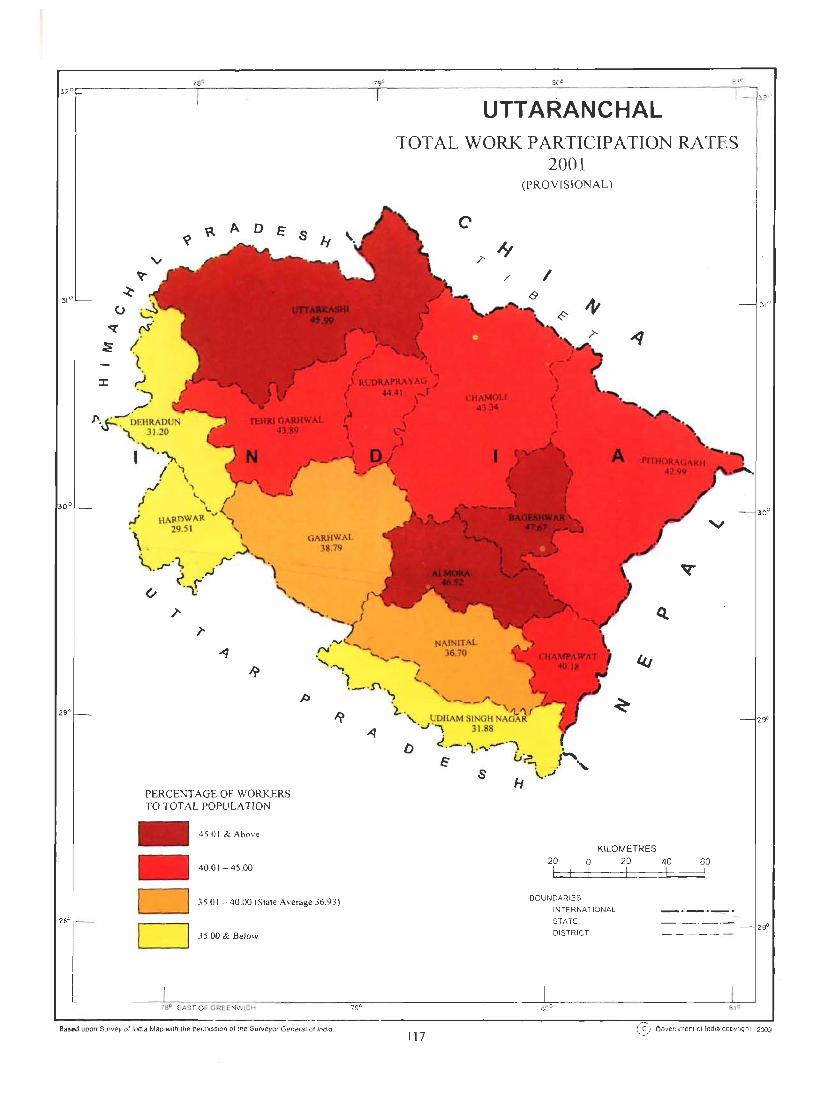
PERCENT AGE OF WORKERS TO TOTAL POPULA nON
45.0 1 & Above
40.0 I - 45.00
GARHWAL 38.79
D 35 .0 1 - 40.00 (State Average 36.93)
D 35.00 & Below
8ued upon Surve y of IndIa Map with rhe permIssIon of :he SUf\leyof General of India
UTTA NCHAL TOTAL WORK PARTICIPATION RATES
2001
D
117
NAINITAL 36.70
(PROVISIONAL)
KILOMETRES 20 o
BOUNDARIE S
INTERNATIONAL
STATE
DISTRIC T
20 40 60
6~vemment of )ndla copyllghl 2003

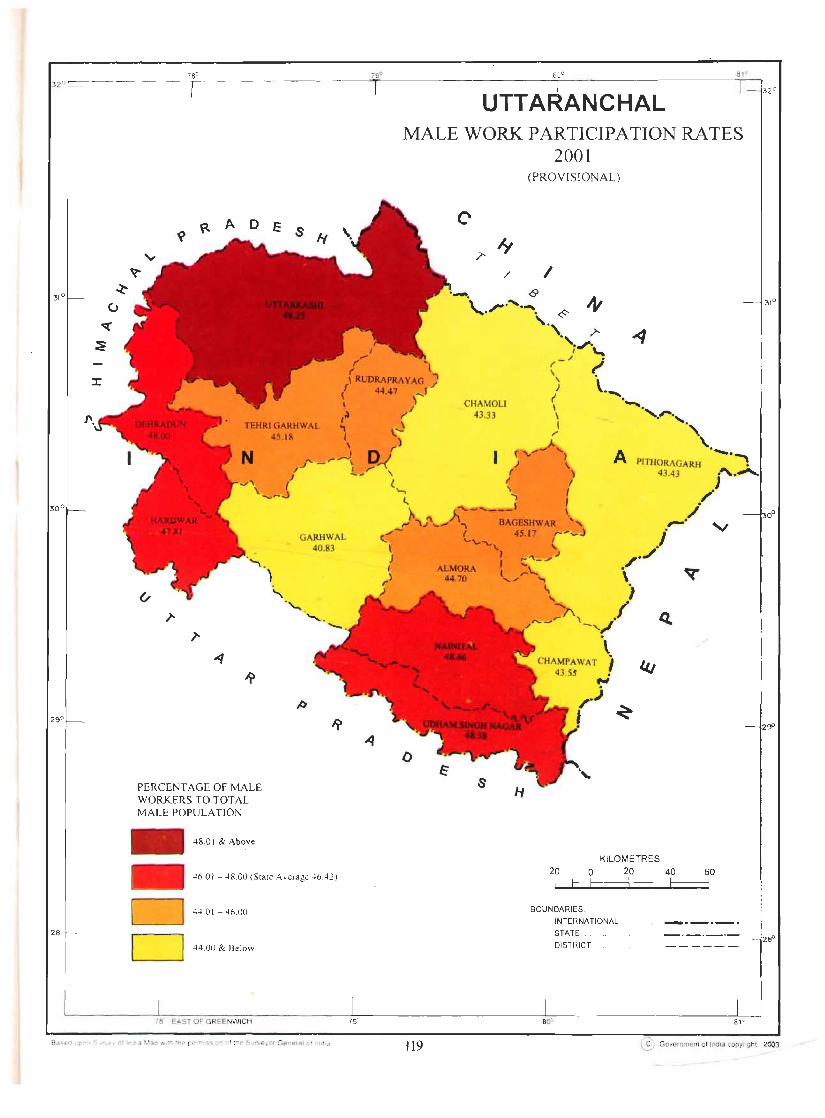
:r
~ 8'
PERCENTAGE OF MALE WORKERS TO TOTAL MALE POPULATION
48.01 & Above
6eo
UTTARANCHAL MALE WORK PARTICIPATION RATES
2001 (PROVISIONAL)
l' ~ / I
.9 \.,."".. ...... "'. ~ ~ ,.,
., l' i.;"·~
"., _./ . ~ ~ r
( \ . \ RUDRAPRA Y AG , \
{ 44.47 _f / ''''. I \ CHAMOLI \ -... ~ / , (~ f' 43.33 \ '.,... ..... ., I.....) ) " I, r} ). \. •
.....J 0 (""' .... -' " A -. " -,... \ ~ ), PITHORAGARH !
,J I ".- () 43.43 .~ • ......__
" -~ ~ I I J "-~...} '--, \., I ~.
GARHWAL 40.83
t.. , .' ~ 1...'" _ ..... _--, \ /
'"' "'\,J'\ .. ... ./\ BAGESHWAR " " _. V ~- (_ 45.17 r· -~j i , '\,.."\..\." .
J : ~,,\_/.J / .. /
f) ALMORA l ,...\.... '\ r 44.70 '-",."
o
" . " I ~>\ .1
~"I \
CHAMPAWAT ; 43.55 •
~
KILOMETRES
46.0 I - 48.00 (S tate Average 46.42) 20 o 20 40 60
D 44.0 1 - 46.00
D 44.00 & Below
78 EAST OF GREENWICH
119
BOUNDARIES:
80'
INTERNATIONAL
STATE
DISTRICT
@ Government of India copyright . 2003


PERCENT AGE OF FEMALE WORKERS TO TOTAL FEMALE POPULA nON
45.01 & Above
40.0 1 - 45 .00
GARHWAL 36.9S
D 20.01 - 40.00 (State Average 27.09)
. D 20.00 & Below
Based upon Survey of India Map w4th the permission of the Surveyor General of India
UTTARANCHAL FEMALE WORK PARTICIPATION RATES
2001
o
121
(PROVISIONAL)
KILOMETRES
20 o 20
BOUNDARIES:
INTERNATIONAL ...
STATE ..
DISTRIG-T
40 60
Government of India copyngh1 :200"3

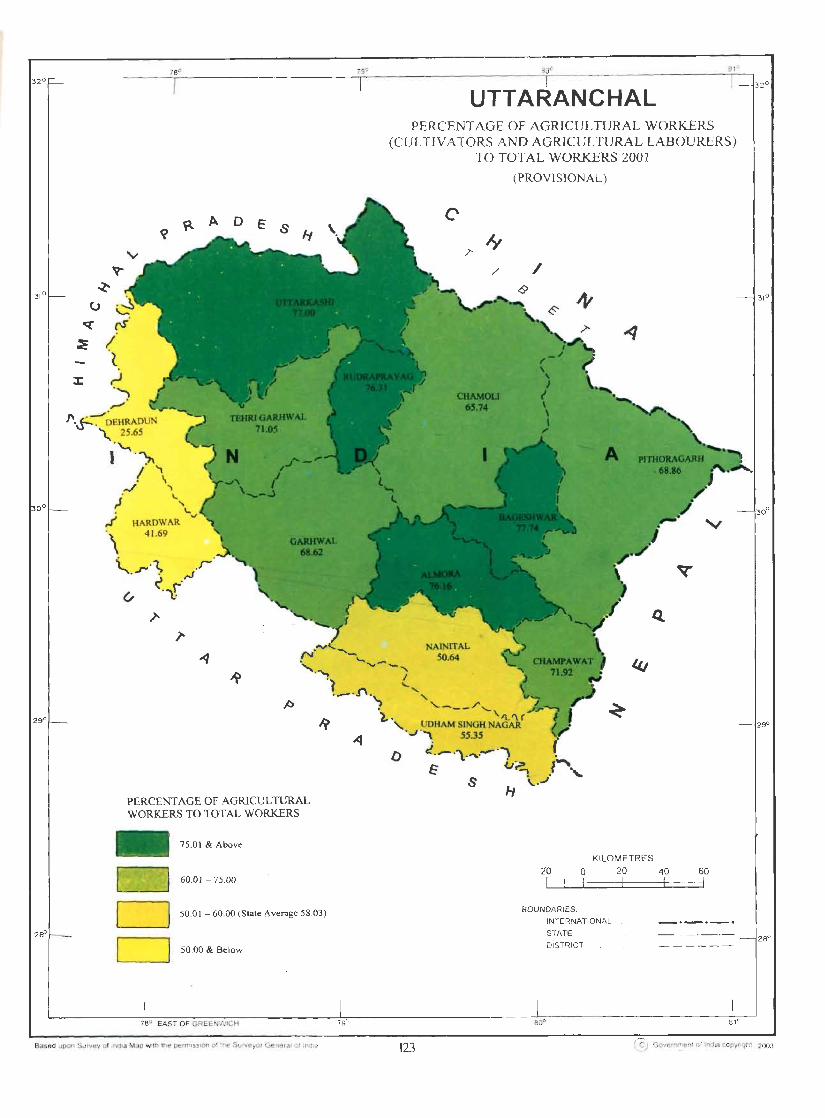
PERCENTAGE OF AGRICULTURAL WORKERS TO TOTAL WORKERS
75.01 & Above
I I 60.01 - 75.00
D 50.01 - 60.00 (State Average 58.03)
l I 50.00 & Below
Based upon Survey of IndIa Map With the permisSion of :he Surveyor General of lndla
"'"'
UTTARANCHAL PERCENTAGE OF AGRICULTURAL WORKERS
(CULTIVATORS AND AGRICULTURAL LABOURERS) TO TOTAL WORKERS 2001
(PROVISIONAL )
'-.........,.- ...... " NAINlTAL
50.64
I ..... ,
"-'-~ __ .r'-
'11..,\( UDHAM SINGH NAGAR
',.J"", 55.35
D
123
d._ .", .",._,,,,\ . I. • __
~ (.It;.l '" s \. . ...1 H
KILOMETRES
20 o 20 40
BOUNDARIES:
INTERNATIONAL
STATE
DISTRICT
60
Government of India copynght 2003

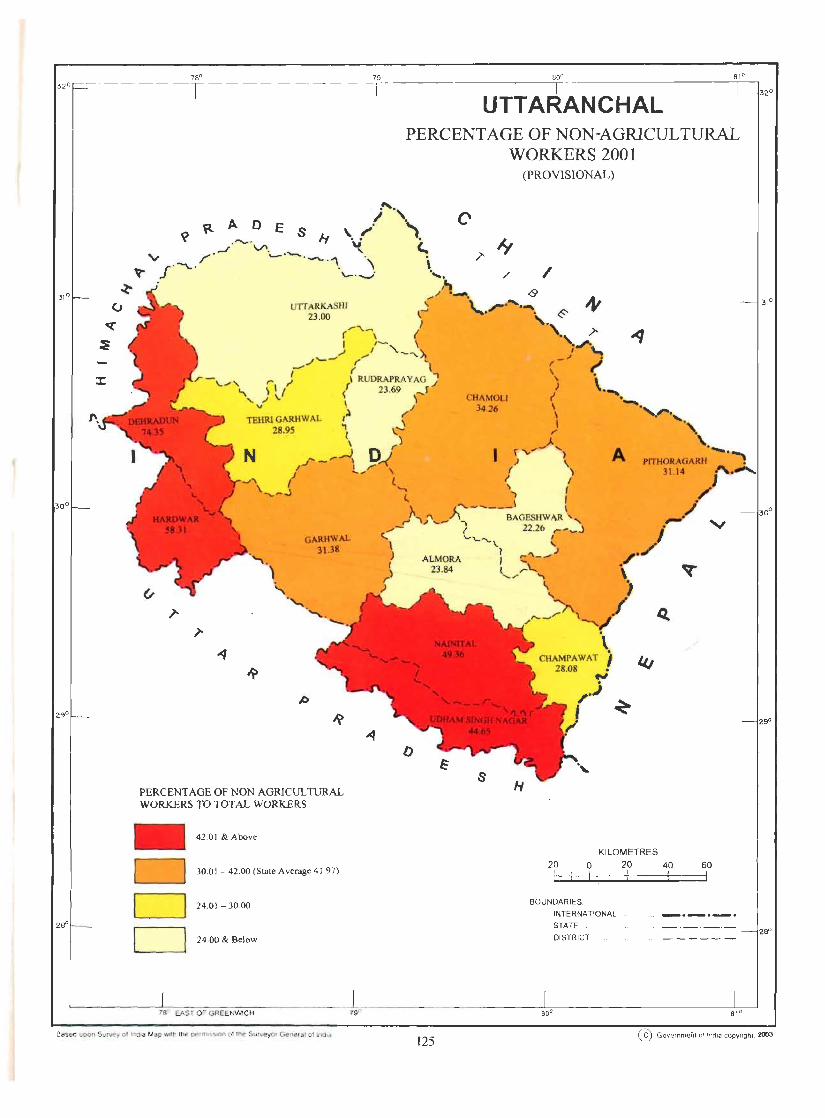
320.-______________ ~7B~O ----------------------~79-" ----------------------~B~OO------------____________ ;81~C_,
UTTARANCHAL PERCENTAGE OF NON-AGRICULTURAL
WORKERS 2001
UTTARKASHI 23.00
\
(PROVISIONAL)
\ ..... . I / ,., ,I . _ 0> .; \ _ ....... _
1..-..1 , . ..... •
} ( ... ",\~\ I • I I~, \ , • ./" .. _ '" ,... ' '--""'~ -_,/....__".. ~ ... - "" J
....... (' r r ,... ) \ RUDRAPRAYAG J \'\ \ I I l 23.69._f ) .....
" \. \ \ CHAMOLI ~ • v .I 34.26 \ - .
TEHRlGARHWAL ,~ r' \ ......_,.. a~ , ~ ) " I, r) ~
{" "'\, ... ~ ') _,- _,..--{ D_..( ) \
j L"- \ (\ I {....... ~,'
GARHWAL 31.38
" ') I ~ l"'------\ \ ~ , ... " .... _/'.., BAGESHWAR .',
,...- t 22.26 r-,-J c:.. ..... '-'" I
\ '-? ':, ) ALMORA J ~'\_ ..... I) 23.84 l r'--r ,/ ~
) "
\.. A -.~ PITHORAGARH •
31.14 J"'" /
,... .. / j "
/ . ./
'> " ':-7\ .1 ~ -'I
\ j
D
s PERCENTAGE OF NON AGRICULTURAL WORKERS TO TOTAL WORKERS
I I D
42.01 & Above
30.0 I - 42.00 (State Average 41.97)
24.01 - 30.00
24.00 & Bel()w
KILOMETRES 20 0 20
BOUNDARIES:
INTERNATIONAL
STATE
DISTRICT
40 60
L-----------~7~80~~~S=T=O~FG~R=E=EN=~~C~H~-----------vb---------------·-----------JBO~O-------------------------J61~O-J
320
26"
Based upon Survey of InOla Map with the permission of the Surveyor Genera l 01 india 125
(C) Governmei'1 1 of India copynght. 2OD3


~"'~ §'~~ ~~(l6 ~3tJso~~"" (:~'1Cf>1f":i ~'& PEOPLE ORIeNTED
CHARTS AND
DIAGRAMS


UTTARKASHI
CHAMOLI
RUDRAPRAYAG
TEHRI GARHWAL
DEHRADUN
GARHWAL
(/) f-0 a: PITHORAGARH f-(/)
is
BAGESHWAR
ALMORA
CHAMPAWAT
NA'INITAL
UDHAM SINGH NAGAR
HARDWAR
UTIARANCHAL WORK PARTICIPATION RATES, 2001
(PROVISIONAL)
o 10 20 30 40
47 .67
50
PERCENTAGE OF WORKERS TO TOTAL POPULATION
129
60


U) I(.)
UTTARANCHAL FEMALE WORK PARTICIPATION RATES, 2001
(PROVISIONAL)
UTTARKASHI 143.61
CHAMOLJ 143.35
RUDRAPRAYAG 144.36
TEHRI GARHWAL 142.66
DEHRADUN 112.25
GARHWAL 136.95
a: PITHORAGARH 142.56 li; Q
BAGESHWAR
ALMORA
CHAMPAWAT
NAINITAL
UDHAM SINGH NAGAR
HARDWAR
o
149.92
148.10
-' 36.89
123.72
113.38
18.42
10 20 30 40 50
PERCENTAGE OF FEMALE WORKERS TO TOTAL POPULATION
131
60

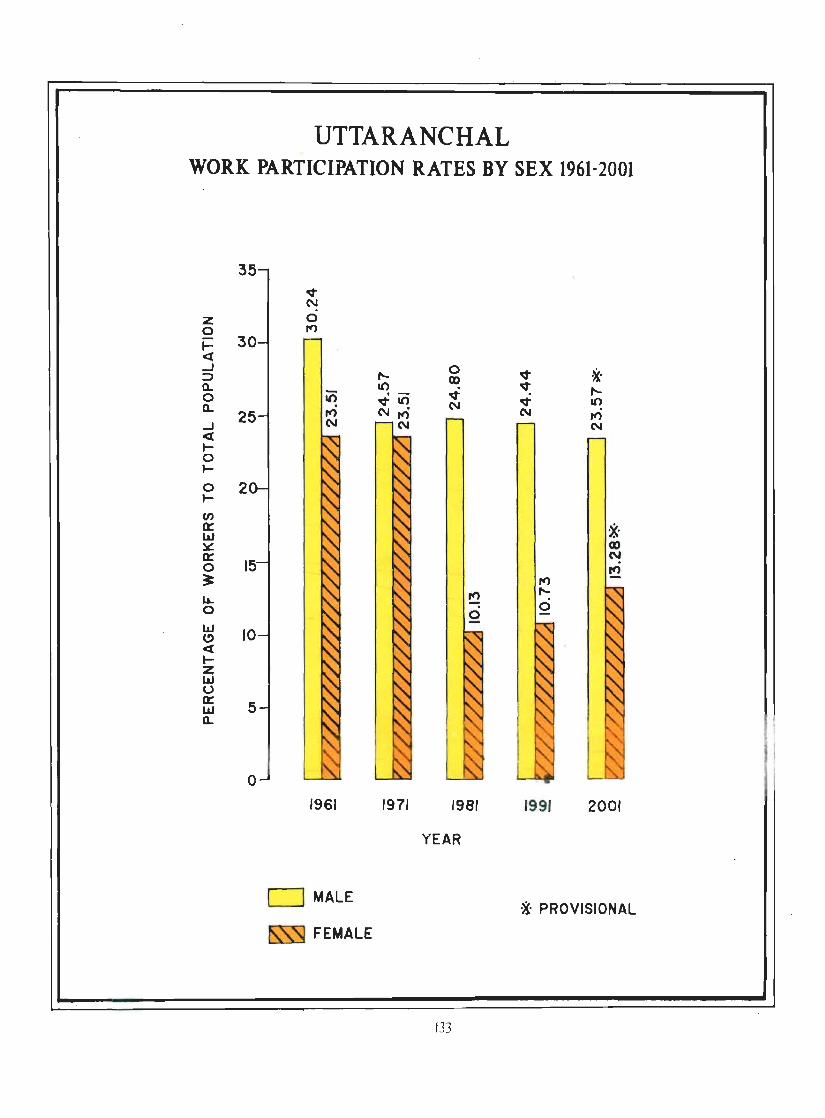
UTTARANCHAL WORK PARTICIPATION RATES BY SEX 1961-2001
35
Z 0 .... ct ..J ::> Q.. 0 Q..
..J ct .... 0 .... 0 2 .... (f)
0:: 1&1 ~ 0:: 0 ~ ~ 0
w 10 C) ct t-Z L&J U 0:: 5 w Q..
o
v N 0 rtl
it; rtl N
1961
o MALE
~ FEMALE
1971
0 V ~. Q) V ,.._ v V 10 C\I N .
rtl N
*. Q) N ttl
ttl rtl
,.._ . 0
0
1981 1991 2001
YEAR
* PROVISIONAL
133

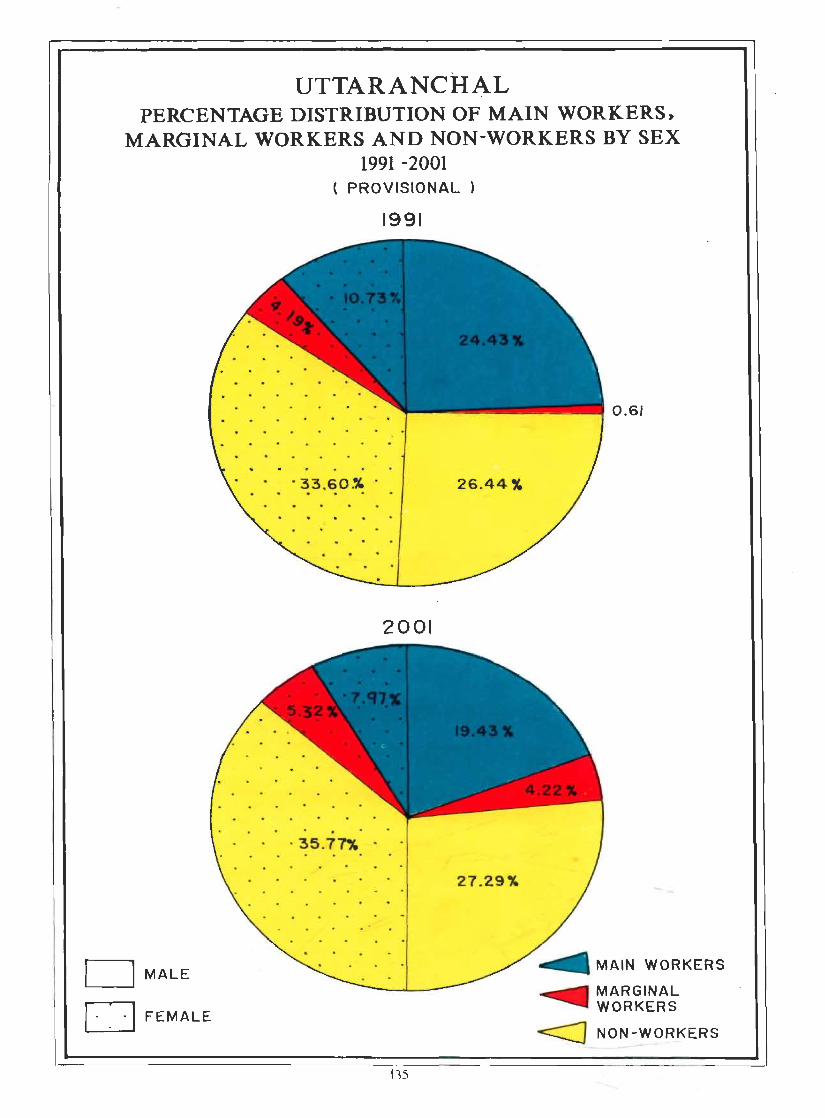
UTTARANCHAL PERCENTAGE DISTRIBUTION OF MAIN WORKERS.
MARGINAL WORKERS AND NON-WORKERS BY SEX 1991 -2001
DMALE
o FEMALE
( PROVISIONAL )
1991
. . .
. 33.60.% . 26.44%
2001
. . 35.7~· .
27.29%
135
0 .6 '
MAIN WORKERS
MARGINAL WORKERS
<J NON-WORK~RS

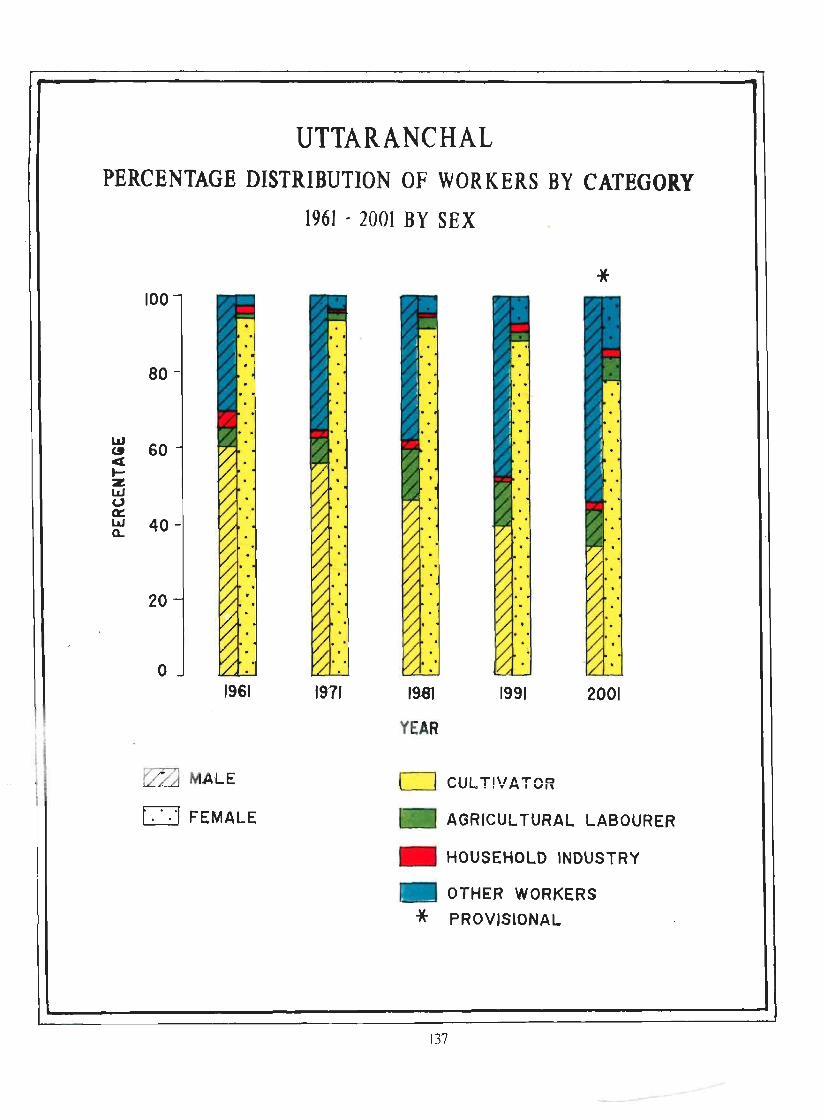
UTTARANCHAL PERCENTAGE DISTRIBUTION OF WORKERS BY CATEGORY
1961 - 2001 BY SEX
100
80 -
~ 60 c( tZ lJJ (,) 0: lJJ 40 -Q..
20
o 1961
~ MALE
o FEMALE
1911 1981
YEAR
1991
c=J CUL T!VATOR
*
2001
AGRICUL rURAL LABOURER
_ HOUSEHOLD INDUSTRY
OTHER WORKERS
* PROVISlONAL
137
- _--


139
t~~ 'ill-. ~crgSOf~ ~CfSI~ !i<Sl PEOPLE ORIENTED
ANNEXURES


(::, ..
"
. .,
J 'j; ,,. '" ~ 0
,j
L ~,: \
j
I I
j i I I
J ~ ,j :z 5 1 1 a:
~ 5
'I j
- -
.s
i l~ _ll ~ 6J . ~ ~.~
8 l}~
i~
a ~~ 001
;Ii

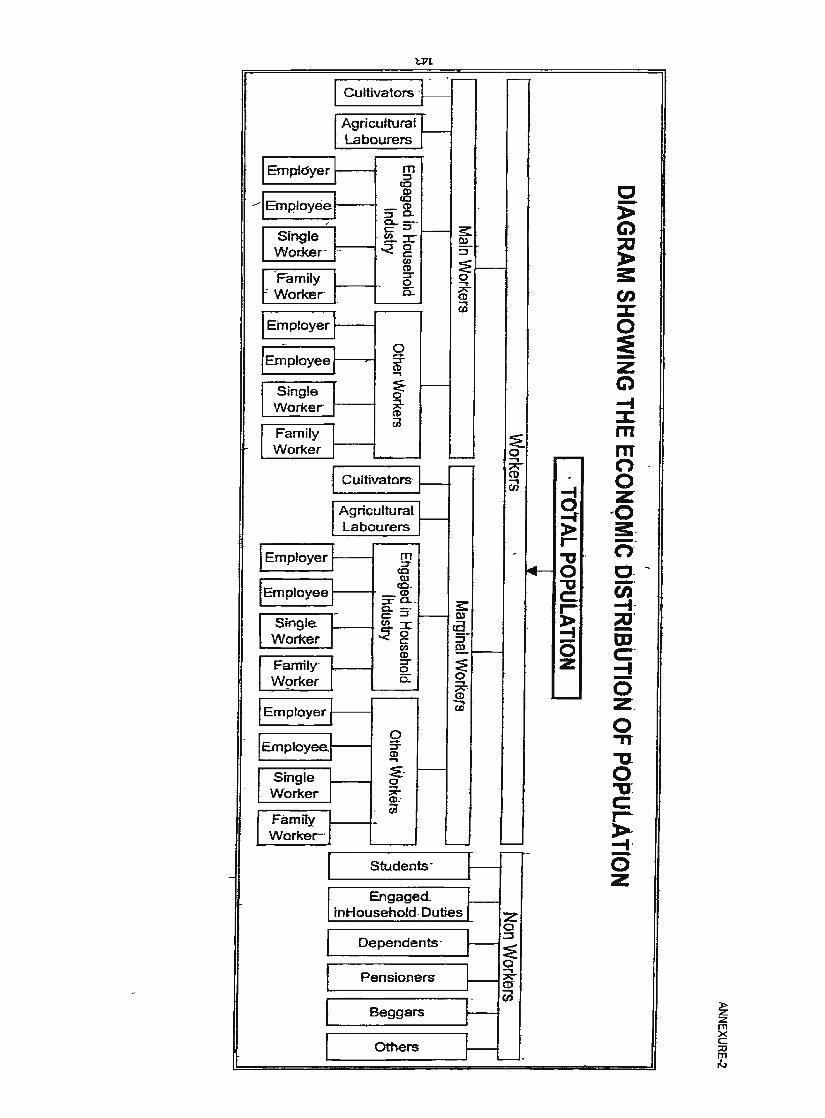
'U7l
- -r---I Cultivators l-- ..--
I Agricultural}--Labourers
I Emptdyer ~ m ~
(0
~IEmp.loyeel II) to
::;-~ / 0.....--I Single I
c::~ f-- ~ ~r ~-
Wori<er- ,-- -<0 :::;, c:: (/} :E
J: -Family I CD I---:::::r- 0 Q_ ......
- Worker I ~ .,.-en .... (b
I EmPloyer:
0 !EmPloyee!
..... :::::r CD ..,
I Single I :E- -0
Worker I ;;_L (I)
U1 I Family I ~ Worker I '-- 0 po---..., r-- =" I Cultivators ~ CD ...,
en -f I AQncultural!-- 0 -f
Labourers » r-IEmPloyer} m - "'0-
~ +-(0 0 III
IEmPloyeel <0- "'0
_CD c:. ::r: 0-_ ~ a. _. r-
t Single f c;:::J - Q)
~ ~::c . ..., co
Worker r -< 0 ~ c -CIJ Q) 0 CD -~ Family- I ~
~ Z 0
Worker r 0: ..... s- --IEmployer~ Cd
0 lEmPloyee.~ -:::::r
CD ... f Single I ~- -
0 . Worker I ....
~ (b:
en I Family I -Worker-,
---..I --'
f 1-r-r
Students-- I En gaged_ 'r-
in Househofd-Duties Z a
J Dependents' ~ .::::s
::E
I "1--a
Pensioners ..., 6f
J 1-(iJ
Beggars
I Others 1--_-
C -» Ci)
~ !: en :r 0 :e -Z Q -I X m m n 0 Z -0 3:---0-c- --. (I) -1-:::0' -OJ C--I -0 Z _ 0 -n "'tl 0 "'0-c: ,...... >---I--0 Z
~ :z m X c: ::c m N
Related Documents