PROVISIONAL COAL STATISTICS 2018-19 GOVERNMENT OF INDIA MINISTRY OF COAL COAL CONTROLLER’S ORGANISATION KOLKATA Provisional Coal Statistics 2018-19 Coal Controller's Organisation, 1,Council House Street, Kolkata, W.B., India

Welcome message from author
This document is posted to help you gain knowledge. Please leave a comment to let me know what you think about it! Share it to your friends and learn new things together.
Transcript
PROVISIONAL COAL STATISTICS
2018-19
GOVERNMENT OF INDIA
MINISTRY OF COAL
COAL CONTROLLER’S ORGANISATION
KOLKATA
Provisional Coal Statistics 2018-19Coal Controller's Organisation, 1,Council House Street, Kolkata, W.B., India
Provisional Coal Statistics 2018-19
Any suggestions for improvement are most welcome
For any enquiry regarding coal statistics please write to
Joint Director (ISS)
Coal Controller’s Organisation
1, Council House Street
Kolkata - 700 001
Tel: 91-33-2248-9616, 91-33-2248-8225, Fax: 91-33-2248-2459
E-mail: [email protected]
Provisional Coal Statistics 2018-19Coal Controller's Organisation, 1,Council House Street, Kolkata, W.B., India
Provisional Coal Statistics 2018-19Coal Controller's Organisation, 1,Council House Street, Kolkata, W.B., India
Team Associated with the Publication
Sri Anjani Kumar Coal Controller
Sri Vishwanath Pratap Singh Joint Director, I.S.S.
Sri Indradeep Roy Chowdhury Deputy Director, I.S.S.
Sri Sukumar Das Administrative Officer
Dr. Sujoy Majumder Dy. G. M. (SCCL)/OSD
Sri Kingshuk Mukhopadhyay Sr. Manager (ECL)/OSD
Sri Sumanta Biswas Assistant
Sri Chandan Bandopadhyay Assistant
Sri Manoj Karmakar Assistant
Mrs Sima Guha Ray Assistant
Sri Avijit Sur UDC
Mrs Ruma Nayak UDC
Miss Manashi Goswami Jr. Computor Operator
Sri Amit Kumar LDC
**************
~ Provisional Coal Statistics 2018-19 ~
Coal Controller's Organisation, 1,Council House Street, Kolkata, W.B., India
i
Table No. Page No.
Highlights 1-3
Introductory Notes 4-12
Chart - I to VI 13-14
1.1 All India Overall Coal Demand (BE) & Supply – Sector- wise: 2018-19 15
1.2 Supply Plan – Source wise in 2018-19 15
1.3 Indigenous Coal Supply Plan (BE) & Achievement : 2018-19 16
1.4 Balance Sheet of Availability & Supply of Raw Coal & Lignite: 2017-18 & 2018-19 17
1.5 Total Primary Supply of Coal & Lignite: 2009-10 to 2018-19 18
1.6 Inventory of Geological Reserve of Coal by Type as on 1st April 2017, 2018 & 2019 19
1.7 State-wise Inventory of Geological Reserve of Coal as on 1st April 2017, 2018 & 2019 20
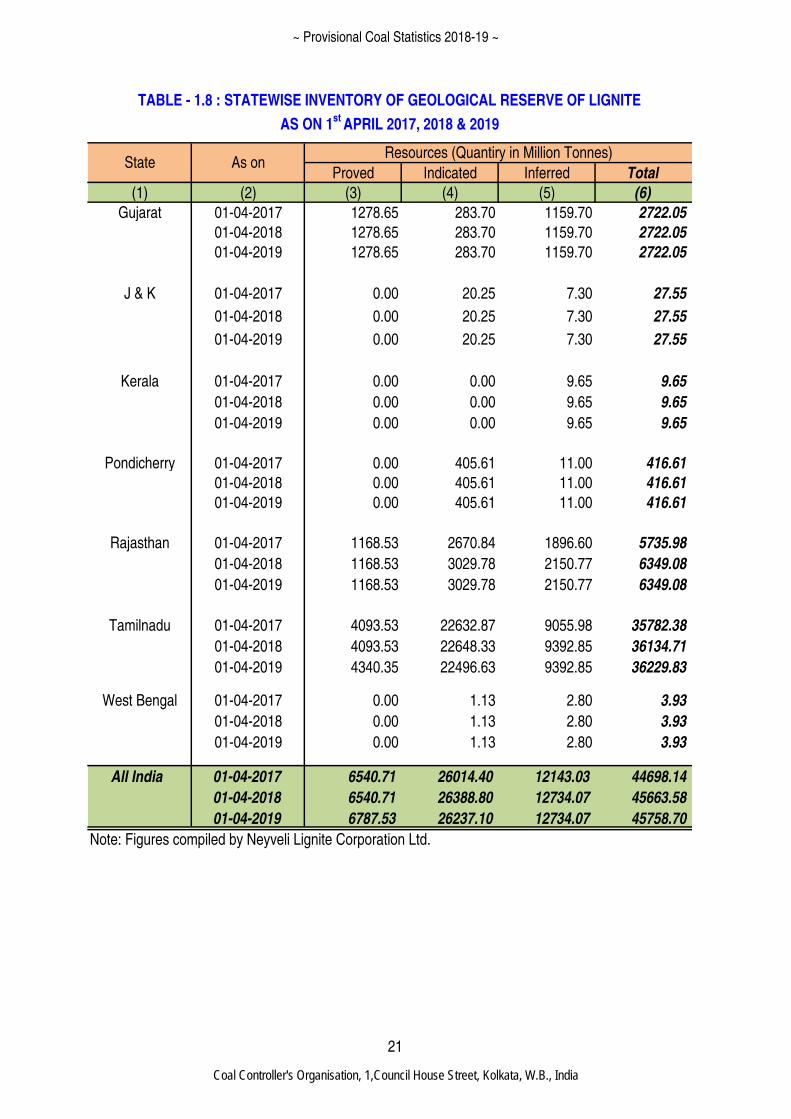
1.8 State-wise Inventory of Geological Reserve of Lignite as on 1st April 2017, 2018 & 2019 21
1.9 Percentage Change in Actual Over Provisional During Last Five Years 22
Production
2.1 Trend of Production of Raw Coal and Lignite during last ten years 23
2.2 Trend of Production of Coal by type during last ten years 23
2.3 Trend of Production of Coal Products by type during last ten years 24
2.4 Monthly Production of Coal by type and Lignite during 2018-19 25
2.5 Monthly Production of Coal Products by type during 2018-19 26
2.6 Share of Raw Coal Production by States during last ten years 27-28
2.7 Share of Lignite Production by States during last ten years 29
2.8 State wise Production of Raw Coal by Type in last five years 30
2.9 State wise Production of Lignite in last five years 30
2.10 Trends of Company wise Production of Coal and Lignite in last three years 31
2.11 State wise and Company wise Production of Raw Coal by types in last three years 32
2.12 Captive Block wise Production of Raw Coal by types in last two years 33
2.13 Grade wise Production of Coking Coal by Companies in 2018-19 34
~ Provisional Coal Statistics 2018-19 ~
Coal Controller's Organisation, 1,Council House Street, Kolkata, W.B., India
ii
Table No. Page No.
2.14 Grade wise Production of Non-Coking Coal by Companies in 2018-19 35
2.15 Trend of Production of Raw Coal from Open cast and Underground mines in last ten years 36
2.16 Company wise Production of Raw Coal from Opencast and Underground mines in last two
years
37
2.17 Trend of OMS in OC & UG Mines (CIL & SCCL) during last ten years 38
2.18 Company wise Production, Manshift & OMS (CIL & SCCL) By Type of Mines during last three
years
39
2.19 Company wise Over Burden Removal and Stripping Ratio in revenue mines in last three years 40
Despatches
3.1 Trend of Despatches of Raw Coal and Lignite during last ten years 41
3.2 Trend of Despatches of Coal by type during last ten years 41
3.3 Trend of Despatches of Coal Products by type during last ten years 42
3.4 Monthly Despatches of Coal by type and Lignite during 2018-19 43
3.5 Monthly Despatches of Coal Products by type during 2018-19 44
3.6 Share of Raw Coal Despatches by States during last ten years 45-46
3.7 Share of Lignite Despatches by States during last ten years 47
3.8 Trend of Despatches of Raw Coal & Lignite by Companies during last three years 48
3.9 State wise and Company wise Despatches of Raw Coal by type In last three years 49
3.10 Captive Block wise Despatch of Raw Coal by types in last two years 50
3.11 Grade wise Despatch of Coking Coal by Companies in 2018-19 51
3.12 Grade wise Despatch of Non-coking Coal by Companies in 2018-19 52
3.13
Mode wise Despatches of Raw Coal by Companies in 2018-19 ( External & Internal) 53
3.14
Company wise Off-take of Raw Coal and Lignite to Different Priority Sectors in 2018-19 54
3.15
Availability and Off-take Raw Coal by Companies during last two years 55
Pit-head Closing Stock
4.1 Trend of Pit-head Closing Stock of Raw Coal and Lignite during last ten years 56
4.2 Monthly Pit-head Closing Stock of Coal, Lignite & Various Coal Products during 2018-19 57
4.3 Trend of Pit-Head Closing Stock of Raw Coal & Lignite by Companies during last three years 58
4.4 Captive Block wise Pit Head Closing Stock of Raw Coal (Coking & Non-coking) during 2018-19 59
~ Provisional Coal Statistics 2018-19 ~
Coal Controller's Organisation, 1,Council House Street, Kolkata, W.B., India
iii
Table No.
Page No.
Import & Export
5.1 Year wise Import of Coal, Coke and Lignite to India during last ten years 60
5.2 Year wise Export Coal, Coke and Lignite from India during last ten years 60
5.3 Source Country wise Import of Coal, Coke and Lignite to India during 2018-19 61
5.4 Destination Country wise Export of Coal, Coke and Lignite from India during 2018-19 62
5.5 Port wise Import of Coal, Coke and Lignite to India during 2018-19 63
5.6 Port wise Export of Coal, Coke and Lignite from India during 2018-19 64
Captive Blocks
6.1 Summary of Allocation of Coal Blocks Stand Allocated During 2018-19 65
6.2 Yearwise and Sectorwise Allotment of Captive Coal Blocks During 2018-19 66
6.3 Statewise and Sectorwise Allotment of Captive Coal Blocks during 2018-19 67
6.4 Coal Production from Captive Blocks Since 1997-98, Projection for XIth Five Year Plan and
CCO Estimates
68
6.5 Lignite Blocks Stand Allocated Till 31/03/2019 69
6.6 Statewise List Of Schedule - I, Ii And Schedule - Iii Captive Coal Blocks Stand Vested/Allocated
During 2018-19
70-71
6.7 Sectorwise List of Schedule - I, II and Schedule - III captive coal blocks stand vested/allocated
during 2018-19
72-73
6.8 Coal Blocks allotted under Auction by competitive Bidding Rules,2012 74
6.9 List of coal blocks under Custodian during 2018-19 75
6.10 List of coal blocks not cancelled by Hon'ble Supreme Court 76
Appendix - A 77-81
Annexure -I (Abbreviations) 82
~ Provisional Coal Statistics 2018-19 ~
Coal Controller's Organisation, 1,Council House Street, Kolkata, W.B., India
1
(A) Production
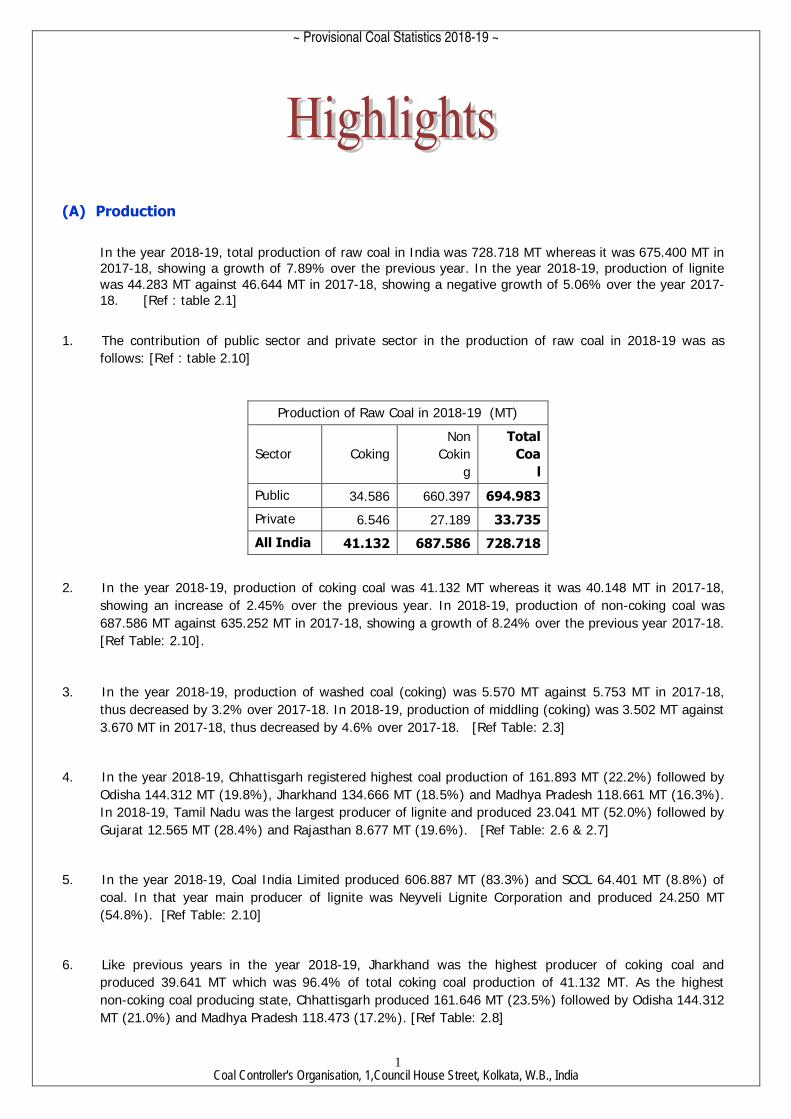
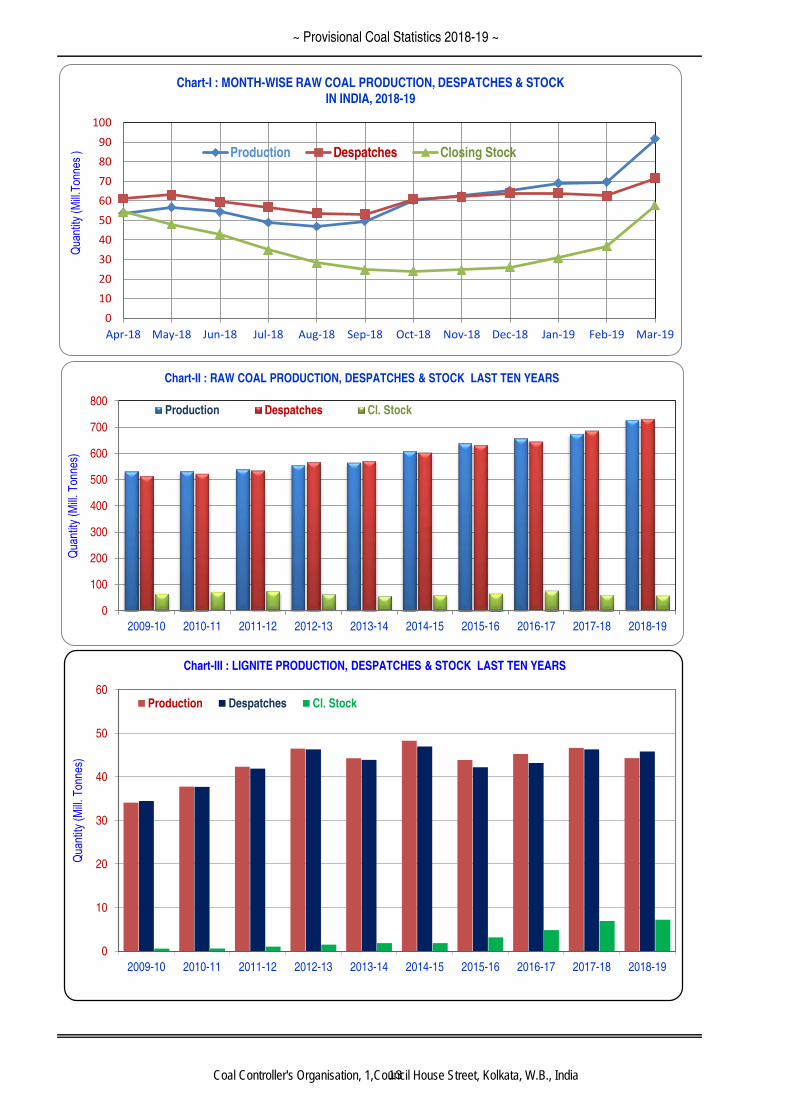
In the year 2018-19, total production of raw coal in India was 728.718 MT whereas it was 675.400 MT in 2017-18, showing a growth of 7.89% over the previous year. In the year 2018-19, production of lignite
was 44.283 MT against 46.644 MT in 2017-18, showing a negative growth of 5.06% over the year 2017-18. [Ref : table 2.1]
1. The contribution of public sector and private sector in the production of raw coal in 2018-19 was as
follows: [Ref : table 2.10]
Production of Raw Coal in 2018-19 (MT)
Sector Coking
Non
Cokin
g
Total
Coa
l
Public 34.586 660.397 694.983
Private 6.546 27.189 33.735
All India 41.132 687.586 728.718
2. In the year 2018-19, production of coking coal was 41.132 MT whereas it was 40.148 MT in 2017-18,
showing an increase of 2.45% over the previous year. In 2018-19, production of non-coking coal was
687.586 MT against 635.252 MT in 2017-18, showing a growth of 8.24% over the previous year 2017-18.
[Ref Table: 2.10].
3. In the year 2018-19, production of washed coal (coking) was 5.570 MT against 5.753 MT in 2017-18,
thus decreased by 3.2% over 2017-18. In 2018-19, production of middling (coking) was 3.502 MT against
3.670 MT in 2017-18, thus decreased by 4.6% over 2017-18. [Ref Table: 2.3]
4. In the year 2018-19, Chhattisgarh registered highest coal production of 161.893 MT (22.2%) followed by
Odisha 144.312 MT (19.8%), Jharkhand 134.666 MT (18.5%) and Madhya Pradesh 118.661 MT (16.3%).
In 2018-19, Tamil Nadu was the largest producer of lignite and produced 23.041 MT (52.0%) followed by
Gujarat 12.565 MT (28.4%) and Rajasthan 8.677 MT (19.6%). [Ref Table: 2.6 & 2.7]
5. In the year 2018-19, Coal India Limited produced 606.887 MT (83.3%) and SCCL 64.401 MT (8.8%) of
coal. In that year main producer of lignite was Neyveli Lignite Corporation and produced 24.250 MT
(54.8%). [Ref Table: 2.10]
6. Like previous years in the year 2018-19, Jharkhand was the highest producer of coking coal and
produced 39.641 MT which was 96.4% of total coking coal production of 41.132 MT. As the highest
non-coking coal producing state, Chhattisgarh produced 161.646 MT (23.5%) followed by Odisha 144.312
MT (21.0%) and Madhya Pradesh 118.473 (17.2%). [Ref Table: 2.8]
~ Provisional Coal Statistics 2018-19 ~
Coal Controller's Organisation, 1,Council House Street, Kolkata, W.B., India
2
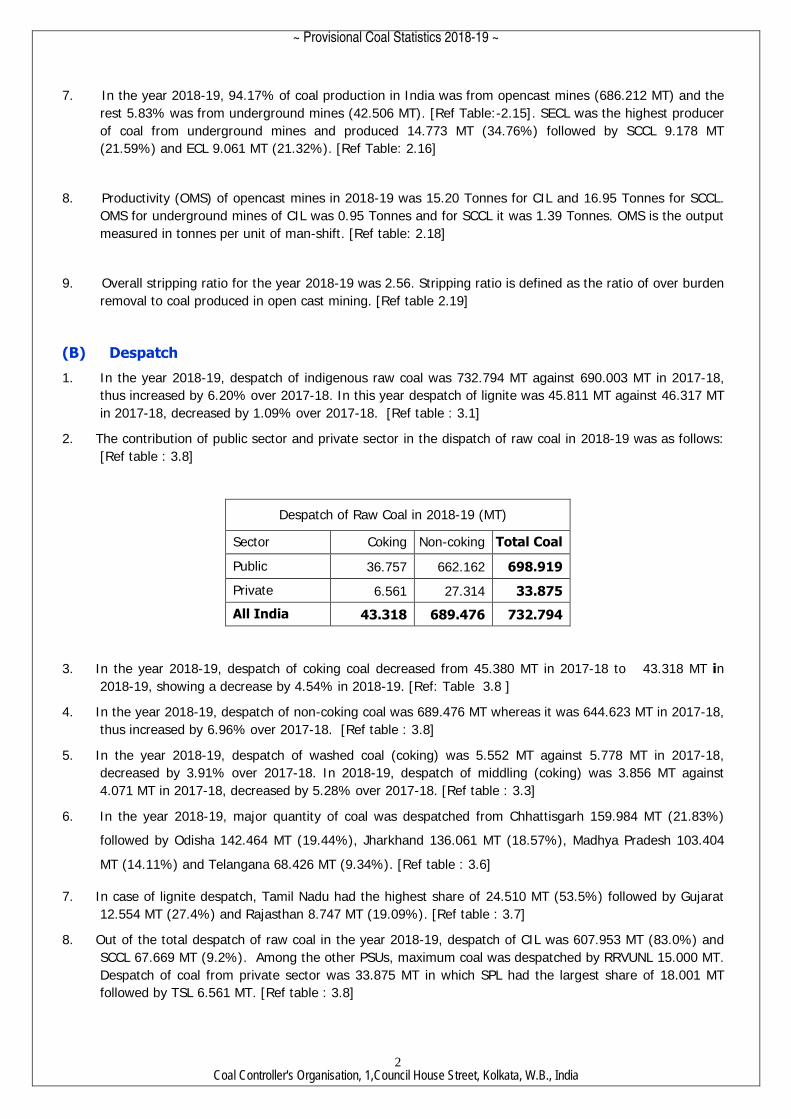
7. In the year 2018-19, 94.17% of coal production in India was from opencast mines (686.212 MT) and the
rest 5.83% was from underground mines (42.506 MT). [Ref Table:-2.15]. SECL was the highest producer
of coal from underground mines and produced 14.773 MT (34.76%) followed by SCCL 9.178 MT
(21.59%) and ECL 9.061 MT (21.32%). [Ref Table: 2.16]
8. Productivity (OMS) of opencast mines in 2018-19 was 15.20 Tonnes for CIL and 16.95 Tonnes for SCCL.
OMS for underground mines of CIL was 0.95 Tonnes and for SCCL it was 1.39 Tonnes. OMS is the output
measured in tonnes per unit of man-shift. [Ref table: 2.18]
9. Overall stripping ratio for the year 2018-19 was 2.56. Stripping ratio is defined as the ratio of over burden
removal to coal produced in open cast mining. [Ref table 2.19]
(B) Despatch
1. In the year 2018-19, despatch of indigenous raw coal was 732.794 MT against 690.003 MT in 2017-18,
thus increased by 6.20% over 2017-18. In this year despatch of lignite was 45.811 MT against 46.317 MT
in 2017-18, decreased by 1.09% over 2017-18. [Ref table : 3.1]
2. The contribution of public sector and private sector in the dispatch of raw coal in 2018-19 was as follows:
[Ref table : 3.8]
Despatch of Raw Coal in 2018-19 (MT)
Sector Coking Non-coking Total Coal
Public 36.757 662.162 698.919
Private 6.561 27.314 33.875
All India 43.318 689.476 732.794
3. In the year 2018-19, despatch of coking coal decreased from 45.380 MT in 2017-18 to 43.318 MT in
2018-19, showing a decrease by 4.54% in 2018-19. [Ref: Table 3.8 ]
4. In the year 2018-19, despatch of non-coking coal was 689.476 MT whereas it was 644.623 MT in 2017-18,
thus increased by 6.96% over 2017-18. [Ref table : 3.8]
5. In the year 2018-19, despatch of washed coal (coking) was 5.552 MT against 5.778 MT in 2017-18,
decreased by 3.91% over 2017-18. In 2018-19, despatch of middling (coking) was 3.856 MT against
4.071 MT in 2017-18, decreased by 5.28% over 2017-18. [Ref table : 3.3]
6. In the year 2018-19, major quantity of coal was despatched from Chhattisgarh 159.984 MT (21.83%)
followed by Odisha 142.464 MT (19.44%), Jharkhand 136.061 MT (18.57%), Madhya Pradesh 103.404
MT (14.11%) and Telangana 68.426 MT (9.34%). [Ref table : 3.6]
7. In case of lignite despatch, Tamil Nadu had the highest share of 24.510 MT (53.5%) followed by Gujarat
12.554 MT (27.4%) and Rajasthan 8.747 MT (19.09%). [Ref table : 3.7]
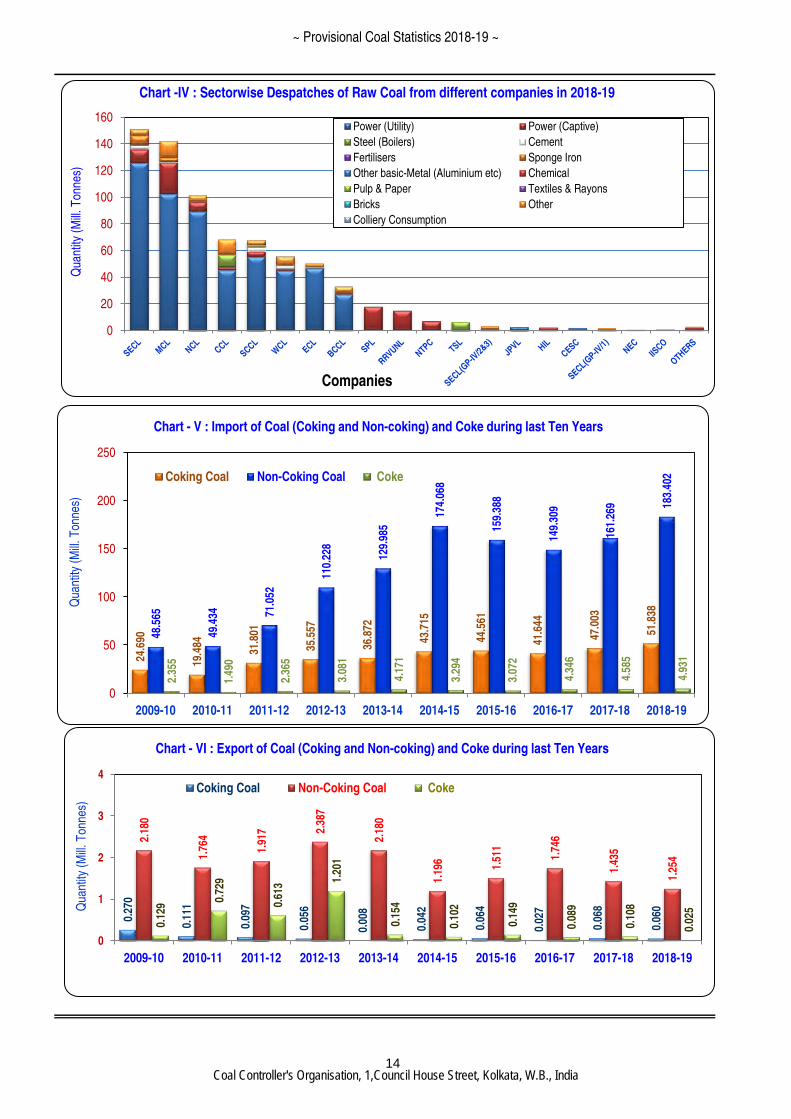
8. Out of the total despatch of raw coal in the year 2018-19, despatch of CIL was 607.953 MT (83.0%) and
SCCL 67.669 MT (9.2%). Among the other PSUs, maximum coal was despatched by RRVUNL 15.000 MT.
Despatch of coal from private sector was 33.875 MT in which SPL had the largest share of 18.001 MT
followed by TSL 6.561 MT. [Ref table : 3.8]
~ Provisional Coal Statistics 2018-19 ~
Coal Controller's Organisation, 1,Council House Street, Kolkata, W.B., India
3
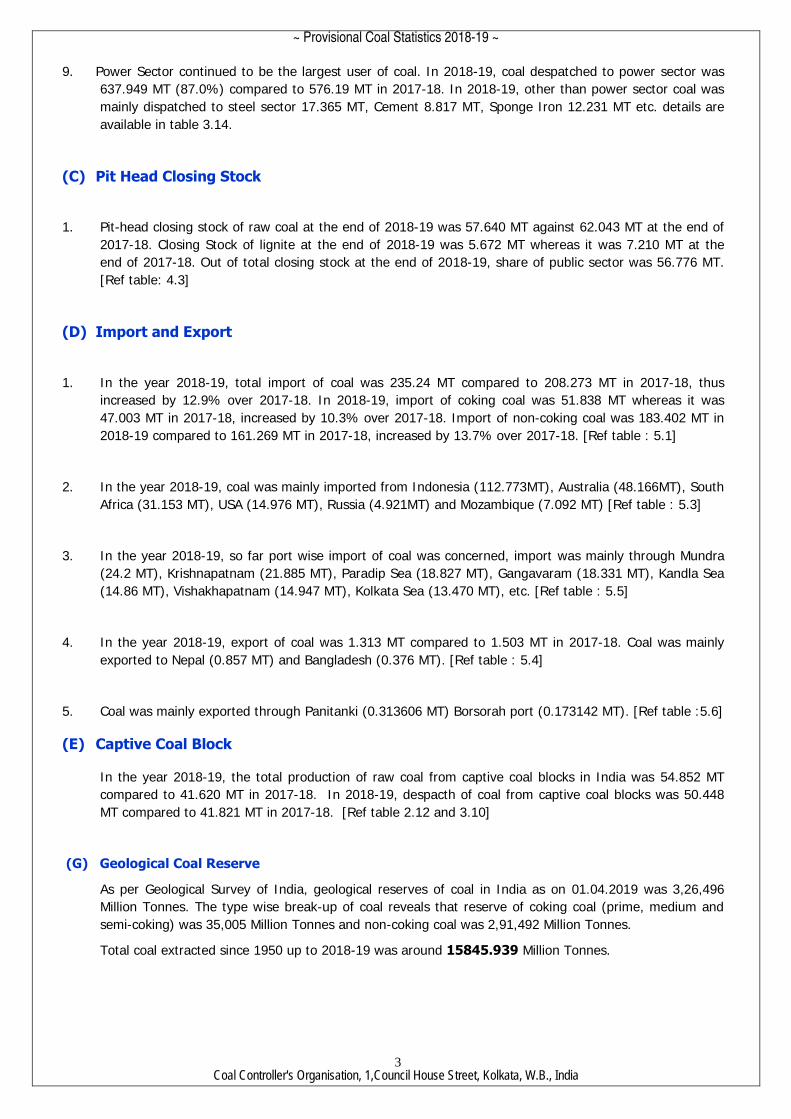
9. Power Sector continued to be the largest user of coal. In 2018-19, coal despatched to power sector was
637.949 MT (87.0%) compared to 576.19 MT in 2017-18. In 2018-19, other than power sector coal was
mainly dispatched to steel sector 17.365 MT, Cement 8.817 MT, Sponge Iron 12.231 MT etc. details are
available in table 3.14.
(C) Pit Head Closing Stock
1. Pit-head closing stock of raw coal at the end of 2018-19 was 57.640 MT against 62.043 MT at the end of
2017-18. Closing Stock of lignite at the end of 2018-19 was 5.672 MT whereas it was 7.210 MT at the
end of 2017-18. Out of total closing stock at the end of 2018-19, share of public sector was 56.776 MT.
[Ref table: 4.3]
(D) Import and Export
1. In the year 2018-19, total import of coal was 235.24 MT compared to 208.273 MT in 2017-18, thus
increased by 12.9% over 2017-18. In 2018-19, import of coking coal was 51.838 MT whereas it was
47.003 MT in 2017-18, increased by 10.3% over 2017-18. Import of non-coking coal was 183.402 MT in
2018-19 compared to 161.269 MT in 2017-18, increased by 13.7% over 2017-18. [Ref table : 5.1]
2. In the year 2018-19, coal was mainly imported from Indonesia (112.773MT), Australia (48.166MT), South
Africa (31.153 MT), USA (14.976 MT), Russia (4.921MT) and Mozambique (7.092 MT) [Ref table : 5.3]
3. In the year 2018-19, so far port wise import of coal was concerned, import was mainly through Mundra
(24.2 MT), Krishnapatnam (21.885 MT), Paradip Sea (18.827 MT), Gangavaram (18.331 MT), Kandla Sea
(14.86 MT), Vishakhapatnam (14.947 MT), Kolkata Sea (13.470 MT), etc. [Ref table : 5.5]
4. In the year 2018-19, export of coal was 1.313 MT compared to 1.503 MT in 2017-18. Coal was mainly
exported to Nepal (0.857 MT) and Bangladesh (0.376 MT). [Ref table : 5.4]
5. Coal was mainly exported through Panitanki (0.313606 MT) Borsorah port (0.173142 MT). [Ref table :5.6]
(E) Captive Coal Block
In the year 2018-19, the total production of raw coal from captive coal blocks in India was 54.852 MT
compared to 41.620 MT in 2017-18. In 2018-19, despacth of coal from captive coal blocks was 50.448
MT compared to 41.821 MT in 2017-18. [Ref table 2.12 and 3.10]
(G) Geological Coal Reserve
As per Geological Survey of India, geological reserves of coal in India as on 01.04.2019 was 3,26,496
Million Tonnes. The type wise break-up of coal reveals that reserve of coking coal (prime, medium and
semi-coking) was 35,005 Million Tonnes and non-coking coal was 2,91,492 Million Tonnes.
Total coal extracted since 1950 up to 2018-19 was around 15845.939 Million Tonnes.
~ Provisional Coal Statistics 2018-19 ~
Coal Controller's Organisation, 1,Council House Street, Kolkata, W.B., India

4
Introductory Note
1.1 Provisional Coal Statistics 2018-19 is the latest Statistical Report on Coal in India based on
the data received from various Indian coal companies. As the data provided here are based on pre -
audited reports of the companies for the year 2018-19, the coal statistics has been termed as
provisional. However, to provide a glimpse of the variation between the provisional statistics and the
final one, present below the corresponding figures for last five years along with the provisional figures
for 2018-19.
1.2
1.3 Provisional Coal Statistics 2018-19, apart from providing data on production, despatch and
stock of coal and lignite in India for the year 2018-19 also provides data on coal reserves in India as
on 01-04-2019, import and export of coal, performance of captive mining etc. during 2018-19.
Statement 1: Difference between Provisional and Final Figures of Production and Despatch of Coal
Year Type of Data
Production [Million Tonnes] Despatch [Million Tonnes]
Coking Coal
Non-Coking
Coal
Coal Total
Lignite Coking
Coal
Non-Coking
Coal
Coal Total
Lignite
2012-13 Provisional 51.834 505.873 557.707 46.598 55.212 514.555 569.767 46.312
Final 51.582 504.82 556.402 46.453 55.859 511.277 567.136 46.313
Change (F-P) -0.49% -0.21% -0.23% -0.31% 1.17% -0.64% -0.46% 0.00%
2013-14 Provisional 56.818 508.948 565.766 44.271 58.302 512.949 571.251 43.897
Final 56.818 508.947 565.765 44.271 58.464 513.596 572.06 43.897
Change (F-P) 0.00% 0.00% 0.00% 0.00% 0.28% 0.13% 0.14% 0.00%
2014-15 Provisional 57.451 554.984 612.435 48.257 56.614 551.016 607.63 46.941
Final 57.446 551.733 609.179 48.27 56.438 547.334 603.772 46.954
Change (F-P) -0.01% -0.59% -0.53% 0.03% -0.31% -0.67% -0.63% 0.03%
2015-16 Provisional 60.887 578.347 639.234 43.843 59.213 572.956 632.169 42.212
Final 60.887 578.343 639.23 43.842 59.213 573.229 632.442 42.211
Change (F-P) 0.00% 0.00% 0.00% 0.00% 0.00% 0.05% 0.04% 0.00%
2016-17 Provisional 61.661 601.131 662.792 45.230 59.545 590.774 650.319 43.155
Final 61.661 596.207 657.868 45.230 59.308 586.670 645.978 43.155
Change (F-P) 0.00% -0.82% -0.74% 0.00% -0.40% -0.69% -0.67% 0.00%
2017-18
Provisional 40.147 635.253 675.400 46.255 45.380 642.451 687.831 45.929
Final 40.148 635.252 675.400 46.644 45.38 644.623 690.003 46.317
Change (F-P) 0.00% 0.00% 0.00% 0.84% 0.00% 0.34% 0.32% 0.84%
2018-19
Provisional 41.132 687.586 728.718 44.283 43.318 689.476 732.794 45.811
Final
Change (F-P)
N.B12: P = Provisional Data; F = Final Data; D = % Differences between the Final Data and the Provisional Data.
N.B 2: The difference between the final and provisional figures is in general negligible and less than 0.5%.
~ Provisional Coal Statistics 2018-19 ~
Coal Controller's Organisation, 1,Council House Street, Kolkata, W.B., India
5
1.4 In this report of 2018-19, like previous years, specific information has been provided regarding
performance of captive coal blocks so far production, despatch and closing stock are concerned.
Segregation has been made between the coal blocks in public sector and private sector on the basis
of the original allotment made between public sector and private sector. Performance of coal blocks
so far production, despatch and closing stock is concerned is shown in the corresponding tables of
this publication.
1.5 As the purpose of the publication of the Provisional Coal Statistics 2018-19 is to provide quick
results to all stakeholders, users, planners, etc., a detailed analysis like the one attempted in the Coal
Directory has not been preferred here. Therefore, the report contains only an Introductory Note
followed by Tables and Charts depicting various aspects of Coal Statistics.
Indian Coal and Lignite Deposits
1.6 The Indian coal deposits are primarily concentrated in the Gondwana sediments (Upper
Paleozoic to Mesozoic systems) located in the Eastern and Central parts of Peninsular India and also
in parts of North Eastern Regions viz., Sikkim, Assam and Arunachal Pradesh. The coal is of
bituminous to sub-bituminous rank and is restricted to the sediments of Permian age. Indian lignite
deposits are in the Tertiary sediments in the Southern & Western parts of the peninsular shield,
particularly in Tamil Nadu, Pondicherry, Gujarat, Rajasthan and Jammu & Kashmir. It is also available,
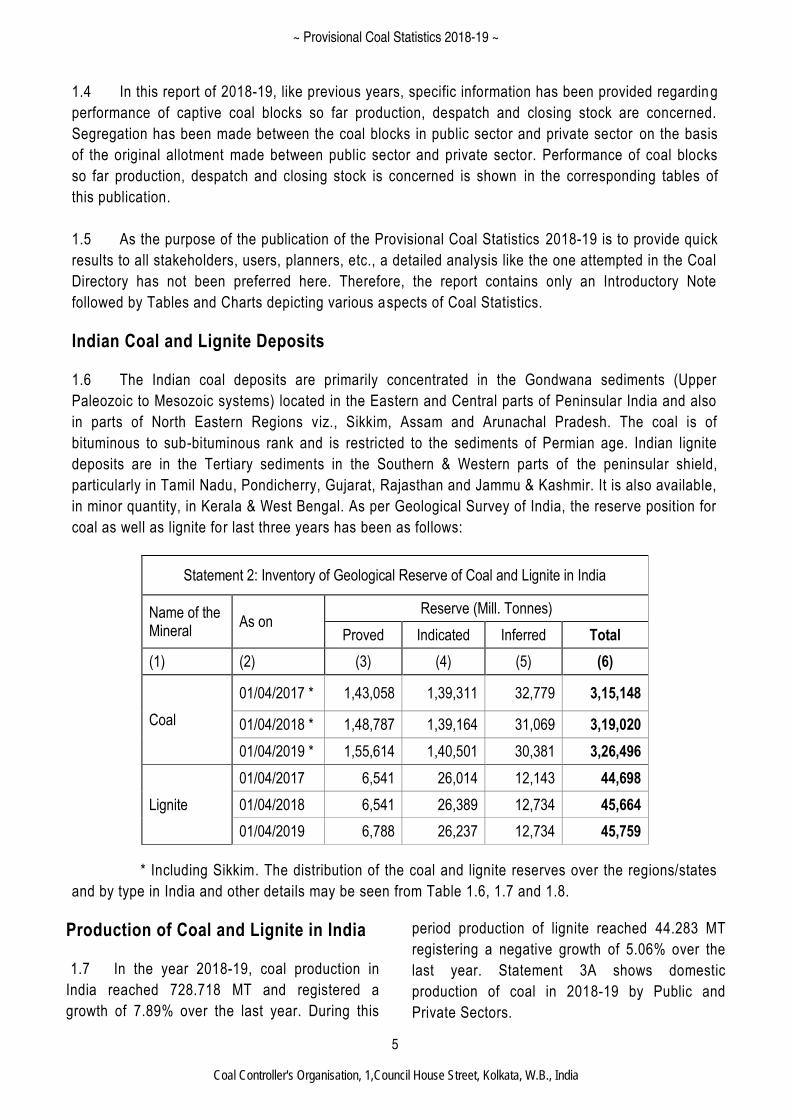
in minor quantity, in Kerala & West Bengal. As per Geological Survey of India, the reserve position for
coal as well as lignite for last three years has been as follows:
Statement 2: Inventory of Geological Reserve of Coal and Lignite in India
Name of the Mineral
As on Reserve (Mill. Tonnes)
Proved Indicated Inferred Total
(1) (2) (3) (4) (5) (6)
Coal
01/04/2017 * 1,43,058 1,39,311 32,779 3,15,148
01/04/2018 * 1,48,787 1,39,164 31,069 3,19,020
01/04/2019 * 1,55,614 1,40,501 30,381 3,26,496
Lignite
01/04/2017 6,541 26,014 12,143 44,698
01/04/2018 6,541 26,389 12,734 45,664
01/04/2019 6,788 26,237 12,734 45,759
* Including Sikkim. The distribution of the coal and lignite reserves over the regions/states
and by type in India and other details may be seen from Table 1.6, 1.7 and 1.8.
Production of Coal and Lignite in India
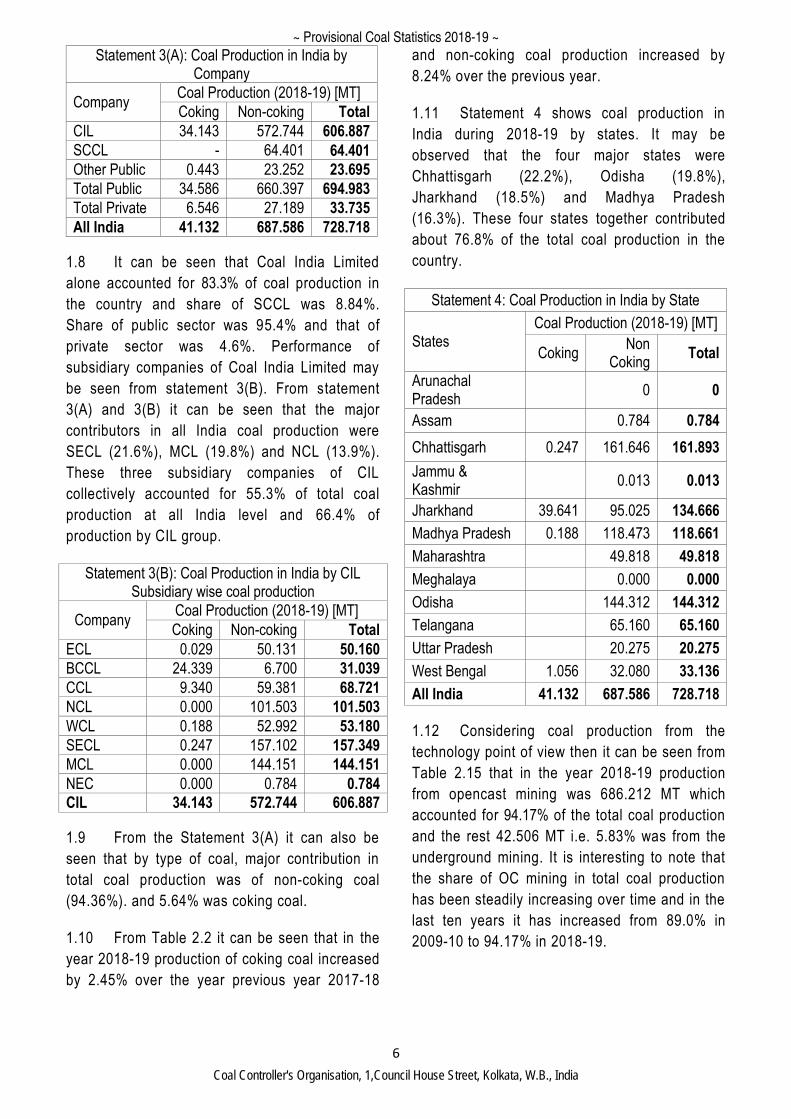
1.7 In the year 2018-19, coal production in
India reached 728.718 MT and registered a
growth of 7.89% over the last year. During this
period production of lignite reached 44.283 MT
registering a negative growth of 5.06% over the
last year. Statement 3A shows domestic
production of coal in 2018-19 by Public and
Private Sectors.
~ Provisional Coal Statistics 2018-19 ~
Coal Controller's Organisation, 1,Council House Street, Kolkata, W.B., India
6
Statement 3(A): Coal Production in India by Company
Company Coal Production (2018-19) [MT]
Coking Non-coking Total
CIL 34.143 572.744 606.887
SCCL - 64.401 64.401
Other Public 0.443 23.252 23.695
Total Public 34.586 660.397 694.983
Total Private 6.546 27.189 33.735
All India 41.132 687.586 728.718
1.8 It can be seen that Coal India Limited
alone accounted for 83.3% of coal production in
the country and share of SCCL was 8.84%.
Share of public sector was 95.4% and that of
private sector was 4.6%. Performance of
subsidiary companies of Coal India Limited may
be seen from statement 3(B). From statement
3(A) and 3(B) it can be seen that the major
contributors in all India coal production were
SECL (21.6%), MCL (19.8%) and NCL (13.9%).
These three subsidiary companies of CIL
collectively accounted for 55.3% of total coal
production at all India level and 66.4% of
production by CIL group.
Statement 3(B): Coal Production in India by CIL Subsidiary wise coal production
Company Coal Production (2018-19) [MT]
Coking Non-coking Total
ECL 0.029 50.131 50.160
BCCL 24.339 6.700 31.039
CCL 9.340 59.381 68.721
NCL 0.000 101.503 101.503
WCL 0.188 52.992 53.180
SECL 0.247 157.102 157.349
MCL 0.000 144.151 144.151
NEC 0.000 0.784 0.784
CIL 34.143 572.744 606.887
1.9 From the Statement 3(A) it can also be
seen that by type of coal, major contribution in
total coal production was of non-coking coal
(94.36%). and 5.64% was coking coal.
1.10 From Table 2.2 it can be seen that in the
year 2018-19 production of coking coal increased
by 2.45% over the year previous year 2017-18
and non-coking coal production increased by
8.24% over the previous year.
1.11 Statement 4 shows coal production in
India during 2018-19 by states. It may be
observed that the four major states were
Chhattisgarh (22.2%), Odisha (19.8%),
Jharkhand (18.5%) and Madhya Pradesh
(16.3%). These four states together contributed
about 76.8% of the total coal production in the
country.
Statement 4: Coal Production in India by State
States Coal Production (2018-19) [MT]
Coking Non
Coking Total
Arunachal Pradesh
0 0
Assam 0.784 0.784
Chhattisgarh 0.247 161.646 161.893
Jammu & Kashmir
0.013 0.013
Jharkhand 39.641 95.025 134.666
Madhya Pradesh 0.188 118.473 118.661
Maharashtra 49.818 49.818
Meghalaya 0.000 0.000
Odisha 144.312 144.312
Telangana 65.160 65.160
Uttar Pradesh 20.275 20.275
West Bengal 1.056 32.080 33.136
All India 41.132 687.586 728.718
1.12 Considering coal production from the
technology point of view then it can be seen from
Table 2.15 that in the year 2018-19 production
from opencast mining was 686.212 MT which
accounted for 94.17% of the total coal production
and the rest 42.506 MT i.e. 5.83% was from the
underground mining. It is interesting to note that
the share of OC mining in total coal production
has been steadily increasing over time and in the
last ten years it has increased from 89.0% in
2009-10 to 94.17% in 2018-19.
~ Provisional Coal Statistics 2018-19 ~
Coal Controller's Organisation, 1,Council House Street, Kolkata, W.B., India
7
1.13 It can be seen from Table 2.3 that
production of coal products increased from
37.291 MT in the year 2017-18 to 40.878 MT in
the year 2018-19. Out of total coal products in
2018-19, production of washed coal (coking) was
5.570 MT and washed coal (non-coking) was 19.363
MT.
1.14 Table 2.13 and 2.14 show details of coal
production by type (coking and non-coking) and grade
by each company for the year 2018-19.
1.15 Stripping Ratio defined as the ratio of
OBR (over burden removal) to coal produced in
open cast mining has been of interest to the
researchers and planners. From Table 2.19 it can
be seen that in the year 2018-19, the stripping
ratio at all India level was 2.56, the
corresponding figure for the year 2017-18 was
2.74. Stripping ratio of CIL for 2018-19 was 2.02
and 2.19 in the year 2017-18. In the year 2018-
19, stripping ratio for the public sector as a whole
was 2.04 and for the private sector it was 4.96. In
case of CIL companies, NEC reported the highest
stripping ratio of 10.84 against coal production
(OC) of 0.784 MT whereas MCL reported the
lowest stripping ratio of 0.91 against coal
production (OC) of 143.280 MT.
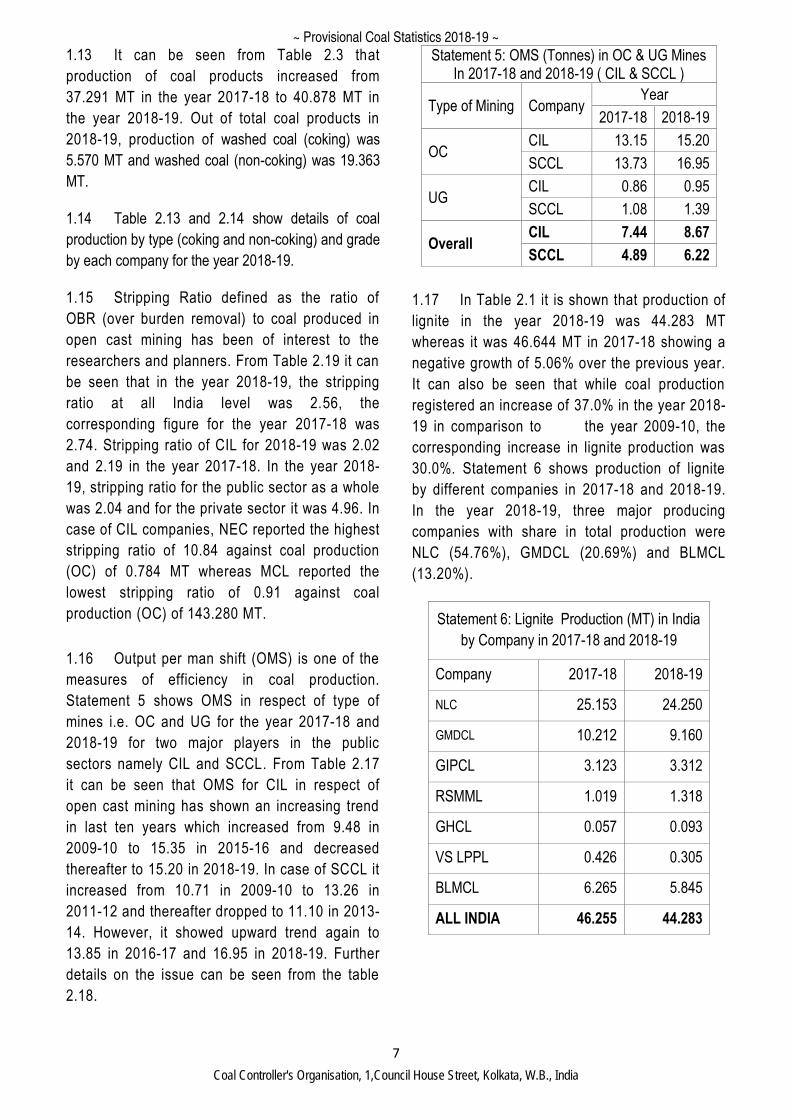
1.16 Output per man shift (OMS) is one of the
measures of efficiency in coal production.
Statement 5 shows OMS in respect of type of
mines i.e. OC and UG for the year 2017-18 and
2018-19 for two major players in the public
sectors namely CIL and SCCL. From Table 2.17
it can be seen that OMS for CIL in respect of
open cast mining has shown an increasing trend
in last ten years which increased from 9.48 in
2009-10 to 15.35 in 2015-16 and decreased
thereafter to 15.20 in 2018-19. In case of SCCL it
increased from 10.71 in 2009-10 to 13.26 in
2011-12 and thereafter dropped to 11.10 in 2013-
14. However, it showed upward trend again to
13.85 in 2016-17 and 16.95 in 2018-19. Further
details on the issue can be seen from the table
2.18.
Statement 5: OMS (Tonnes) in OC & UG Mines In 2017-18 and 2018-19 ( CIL & SCCL )
Type of Mining Company Year
2017-18 2018-19
OC CIL 13.15 15.20
SCCL 13.73 16.95
UG CIL 0.86 0.95
SCCL 1.08 1.39
Overall CIL 7.44 8.67
SCCL 4.89 6.22
1.17 In Table 2.1 it is shown that production of
lignite in the year 2018-19 was 44.283 MT
whereas it was 46.644 MT in 2017-18 showing a
negative growth of 5.06% over the previous year.
It can also be seen that while coal production
registered an increase of 37.0% in the year 2018-
19 in comparison to the year 2009-10, the
corresponding increase in lignite production was
30.0%. Statement 6 shows production of lignite
by different companies in 2017-18 and 2018-19.
In the year 2018-19, three major producing
companies with share in total production were
NLC (54.76%), GMDCL (20.69%) and BLMCL
(13.20%).
Statement 6: Lignite Production (MT) in India
by Company in 2017-18 and 2018-19
Company 2017-18 2018-19
NLC 25.153 24.250
GMDCL 10.212 9.160
GIPCL 3.123 3.312
RSMML 1.019 1.318
GHCL 0.057 0.093
VS LPPL 0.426 0.305
BLMCL 6.265 5.845
ALL INDIA 46.255 44.283
~ Provisional Coal Statistics 2018-19 ~
Coal Controller's Organisation, 1,Council House Street, Kolkata, W.B., India
8
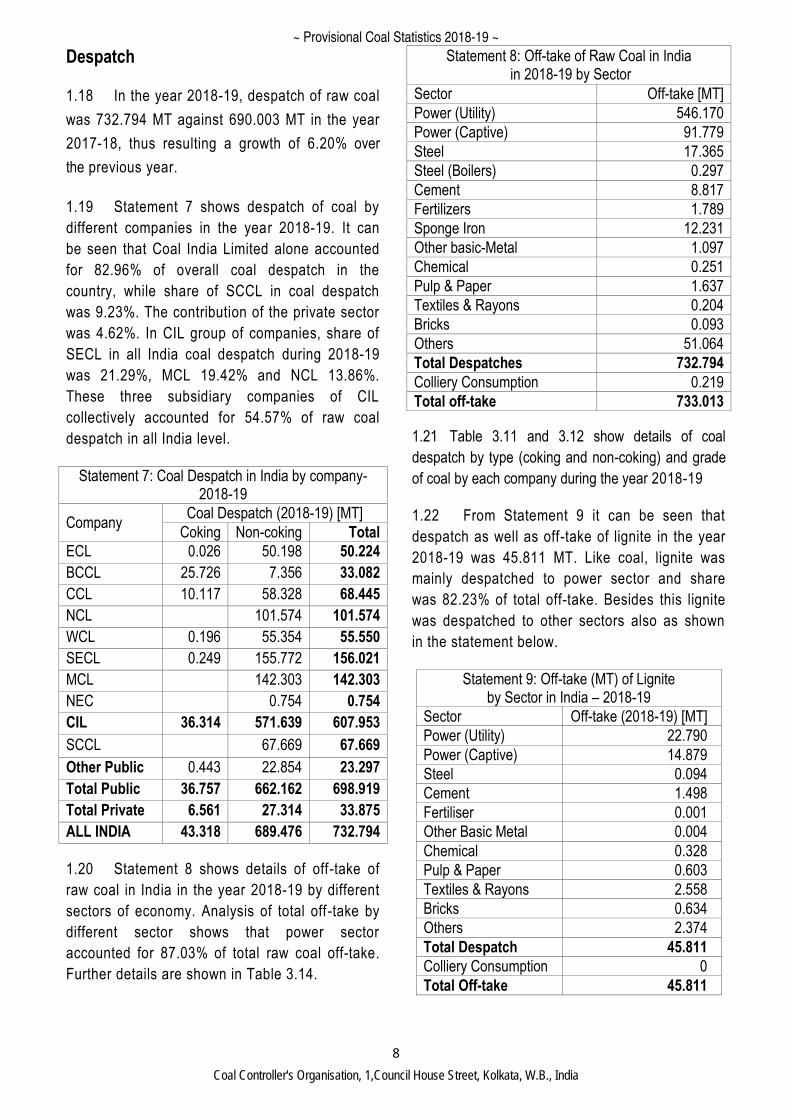
Despatch
1.18 In the year 2018-19, despatch of raw coal
was 732.794 MT against 690.003 MT in the year
2017-18, thus resulting a growth of 6.20% over
the previous year.
1.19 Statement 7 shows despatch of coal by
different companies in the year 2018-19. It can
be seen that Coal India Limited alone accounted
for 82.96% of overall coal despatch in the
country, while share of SCCL in coal despatch
was 9.23%. The contribution of the private sector
was 4.62%. In CIL group of companies, share of
SECL in all India coal despatch during 2018-19
was 21.29%, MCL 19.42% and NCL 13.86%.
These three subsidiary companies of CIL
collectively accounted for 54.57% of raw coal
despatch in all India level.
Statement 7: Coal Despatch in India by company- 2018-19
Company Coal Despatch (2018-19) [MT]
Coking Non-coking Total
ECL 0.026 50.198 50.224
BCCL 25.726 7.356 33.082
CCL 10.117 58.328 68.445
NCL 101.574 101.574
WCL 0.196 55.354 55.550
SECL 0.249 155.772 156.021
MCL 142.303 142.303
NEC 0.754 0.754
CIL 36.314 571.639 607.953
SCCL 67.669 67.669
Other Public 0.443 22.854 23.297
Total Public 36.757 662.162 698.919
Total Private 6.561 27.314 33.875
ALL INDIA 43.318 689.476 732.794
1.20 Statement 8 shows details of off-take of
raw coal in India in the year 2018-19 by different
sectors of economy. Analysis of total off -take by
different sector shows that power sector
accounted for 87.03% of total raw coal off-take.
Further details are shown in Table 3.14.
Statement 8: Off-take of Raw Coal in India in 2018-19 by Sector
Sector Off-take [MT]
Power (Utility) 546.170
Power (Captive) 91.779
Steel 17.365
Steel (Boilers) 0.297
Cement 8.817
Fertilizers 1.789
Sponge Iron 12.231
Other basic-Metal 1.097
Chemical 0.251
Pulp & Paper 1.637
Textiles & Rayons 0.204
Bricks 0.093
Others 51.064
Total Despatches 732.794
Colliery Consumption 0.219
Total off-take 733.013
1.21 Table 3.11 and 3.12 show details of coal
despatch by type (coking and non-coking) and grade
of coal by each company during the year 2018-19
1.22 From Statement 9 it can be seen that
despatch as well as off-take of lignite in the year
2018-19 was 45.811 MT. Like coal, lignite was
mainly despatched to power sector and share
was 82.23% of total off-take. Besides this lignite
was despatched to other sectors also as shown
in the statement below.
Statement 9: Off-take (MT) of Lignite by Sector in India – 2018-19
Sector Off-take (2018-19) [MT]
Power (Utility) 22.790
Power (Captive) 14.879
Steel 0.094
Cement 1.498
Fertiliser 0.001
Other Basic Metal 0.004
Chemical 0.328
Pulp & Paper 0.603
Textiles & Rayons 2.558
Bricks 0.634
Others 2.374
Total Despatch 45.811
Colliery Consumption 0
Total Off-take 45.811
~ Provisional Coal Statistics 2018-19 ~
Coal Controller's Organisation, 1,Council House Street, Kolkata, W.B., India
9
Pit Head Closing Stock
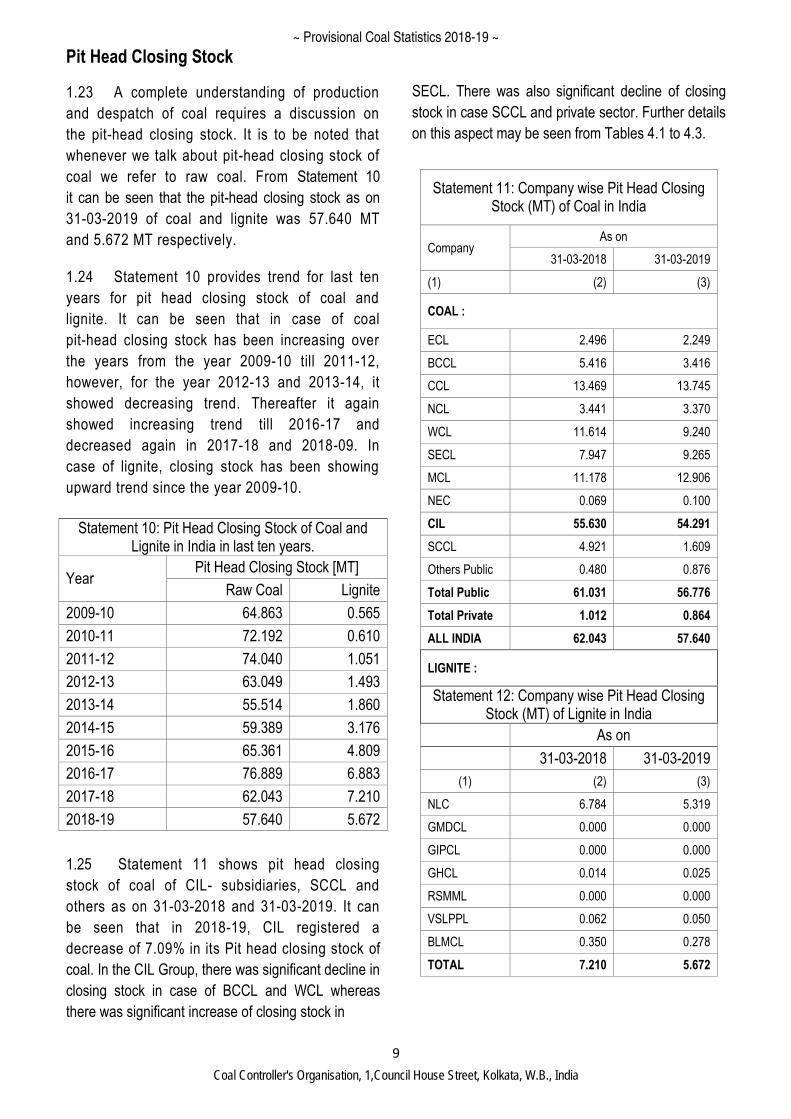
1.23 A complete understanding of production
and despatch of coal requires a discussion on
the pit-head closing stock. It is to be noted that
whenever we talk about pit-head closing stock of
coal we refer to raw coal. From Statement 10
it can be seen that the pit-head closing stock as on
31-03-2019 of coal and lignite was 57.640 MT
and 5.672 MT respectively.
1.24 Statement 10 provides trend for last ten
years for pit head closing stock of coal and
lignite. It can be seen that in case of coal
pit-head closing stock has been increasing over
the years from the year 2009-10 till 2011-12,
however, for the year 2012-13 and 2013-14, it
showed decreasing trend. Thereafter it again
showed increasing trend till 2016-17 and
decreased again in 2017-18 and 2018-09. In
case of lignite, closing stock has been showing
upward trend since the year 2009-10.
1.25 Statement 11 shows pit head closing
stock of coal of CIL- subsidiaries, SCCL and
others as on 31-03-2018 and 31-03-2019. It can
be seen that in 2018-19, CIL registered a
decrease of 7.09% in its Pit head closing stock of
coal. In the CIL Group, there was significant decline in
closing stock in case of BCCL and WCL whereas
there was significant increase of closing stock in
SECL. There was also significant decline of closing
stock in case SCCL and private sector. Further details
on this aspect may be seen from Tables 4.1 to 4.3.
Statement 11: Company wise Pit Head Closing Stock (MT) of Coal in India
Company As on
31-03-2018 31-03-2019
(1) (2) (3)
COAL :
ECL 2.496 2.249
BCCL 5.416 3.416
CCL 13.469 13.745
NCL 3.441 3.370
WCL 11.614 9.240
SECL 7.947 9.265
MCL 11.178 12.906
NEC 0.069 0.100
CIL 55.630 54.291
SCCL 4.921 1.609
Others Public 0.480 0.876
Total Public 61.031 56.776
Total Private 1.012 0.864
ALL INDIA 62.043 57.640
LIGNITE :
Statement 12: Company wise Pit Head Closing Stock (MT) of Lignite in India
As on
31-03-2018 31-03-2019
(1) (2) (3)
NLC 6.784 5.319
GMDCL 0.000 0.000
GIPCL 0.000 0.000
GHCL 0.014 0.025
RSMML 0.000 0.000
VSLPPL 0.062 0.050
BLMCL 0.350 0.278
TOTAL 7.210 5.672
Statement 10: Pit Head Closing Stock of Coal and Lignite in India in last ten years.
Year Pit Head Closing Stock [MT]
Raw Coal Lignite
2009-10 64.863 0.565
2010-11 72.192 0.610
2011-12 74.040 1.051
2012-13 63.049 1.493
2013-14 55.514 1.860
2014-15 59.389 3.176
2015-16 65.361 4.809
2016-17 76.889 6.883
2017-18 62.043 7.210
2018-19 57.640 5.672
~ Provisional Coal Statistics 2018-19 ~
Coal Controller's Organisation, 1,Council House Street, Kolkata, W.B., India
10
Import & Export
1.26 In spite of sufficient coal reserve, we
have not been able to meet our demand from our
own production. Moreover, the supply of high
quality coal (low-ash coal) in the country has
been limited. Therefore, to bridge the demand
and supply gap as well as to provide high quality
coal for use in various industries the country has
no option but to resort to import of coal,
especially low-ash coal.
1.27 As per our Import Policy 1993-94, coal
has been put under Open General License (OGL)
and therefore consumers are free to import coal
based on their requirement. Superior quality non-
coking coal is imported mainly by coast-based
power plants and other industrial users viz.,
paper, sponge iron, cements and captive power
plants, on consideration of transport logistics,
commercial prudence, export entitlements and
inadequate availability of such superior coal from
indigenous sources.
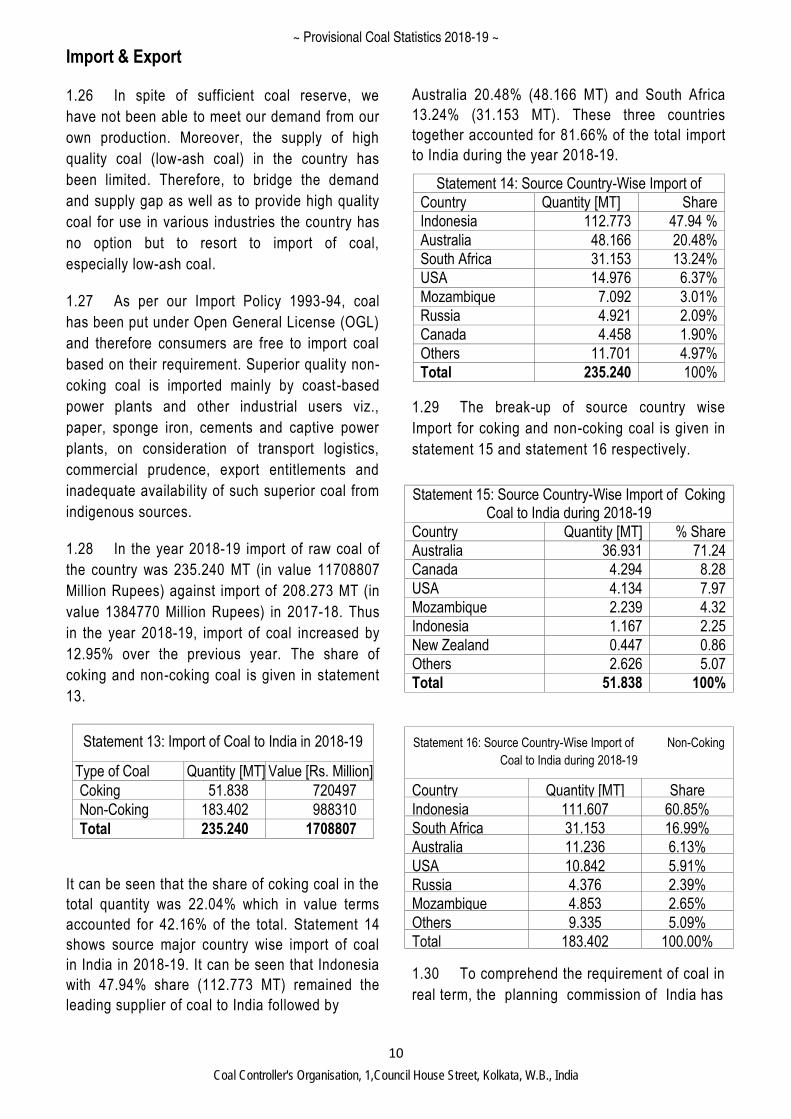
1.28 In the year 2018-19 import of raw coal of
the country was 235.240 MT (in value 11708807
Million Rupees) against import of 208.273 MT (in
value 1384770 Million Rupees) in 2017-18. Thus
in the year 2018-19, import of coal increased by
12.95% over the previous year. The share of
coking and non-coking coal is given in statement
13.
Statement 13: Import of Coal to India in 2018-19
Type of Coal Quantity [MT] Value [Rs. Million]
Coking 51.838 720497
Non-Coking 183.402 988310
Total 235.240 1708807
It can be seen that the share of coking coal in the
total quantity was 22.04% which in value terms
accounted for 42.16% of the total. Statement 14
shows source major country wise import of coal
in India in 2018-19. It can be seen that Indonesia
with 47.94% share (112.773 MT) remained the
leading supplier of coal to India followed by
Australia 20.48% (48.166 MT) and South Africa
13.24% (31.153 MT). These three countries
together accounted for 81.66% of the total import
to India during the year 2018-19.
Statement 14: Source Country-Wise Import of
Coal to India during 2018-19 Country Quantity [MT] Share
Indonesia 112.773 47.94 %
Australia 48.166 20.48%
South Africa 31.153 13.24%
USA 14.976 6.37%
Mozambique 7.092 3.01%
Russia 4.921 2.09%
Canada 4.458 1.90%
Others 11.701 4.97%
Total 235.240 100%
1.29 The break-up of source country wise
Import for coking and non-coking coal is given in
statement 15 and statement 16 respectively.
Statement 15: Source Country-Wise Import of Coking Coal to India during 2018-19
Country Quantity [MT] % Share
Australia 36.931 71.24
Canada 4.294 8.28
USA 4.134 7.97
Mozambique 2.239 4.32
Indonesia 1.167 2.25
New Zealand 0.447 0.86
Others 2.626 5.07
Total 51.838 100%
Statement 16: Source Country-Wise Import of Non-Coking
Coal to India during 2018-19
Country Quantity [MT] Share
Indonesia 111.607 60.85%
South Africa 31.153 16.99%
Australia 11.236 6.13%
USA 10.842 5.91%
Russia 4.376 2.39%
Mozambique 4.853 2.65%
Others 9.335 5.09%
Total 183.402 100.00%
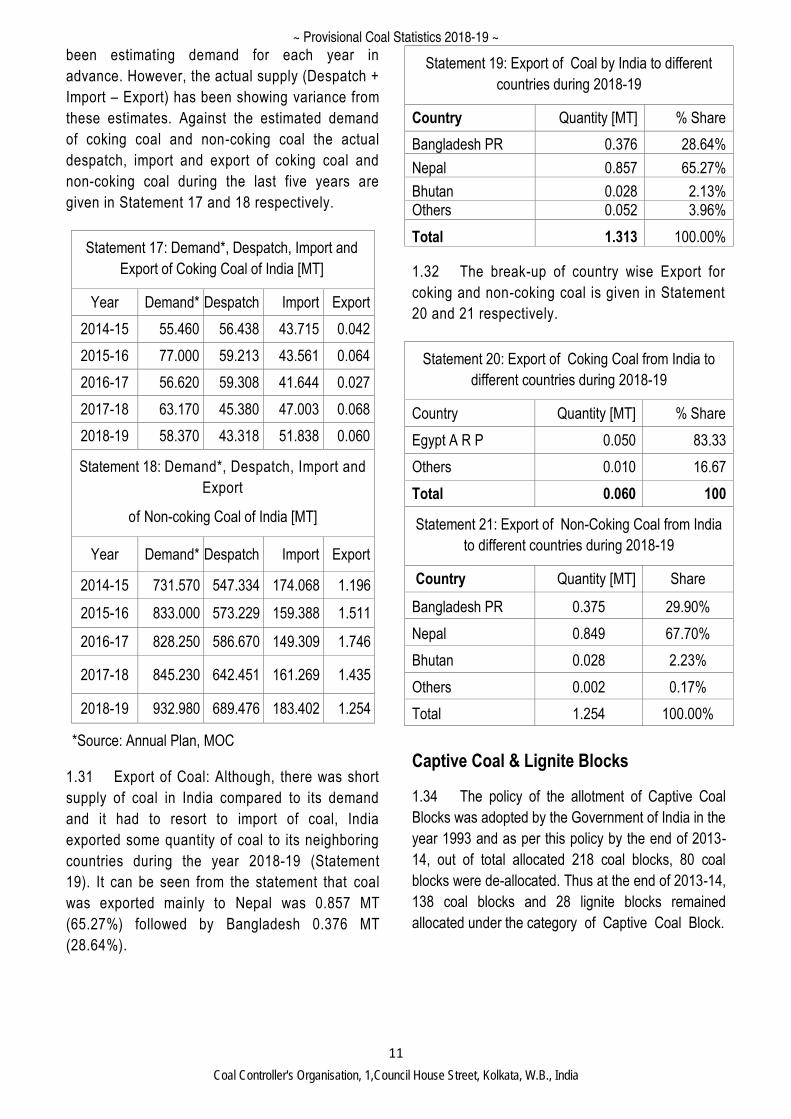
1.30 To comprehend the requirement of coal in
real term, the planning commission of India has
~ Provisional Coal Statistics 2018-19 ~
Coal Controller's Organisation, 1,Council House Street, Kolkata, W.B., India
11
been estimating demand for each year in
advance. However, the actual supply (Despatch +
Import – Export) has been showing variance from
these estimates. Against the estimated demand
of coking coal and non-coking coal the actual
despatch, import and export of coking coal and
non-coking coal during the last five years are
given in Statement 17 and 18 respectively.
Statement 17: Demand*, Despatch, Import and
Export of Coking Coal of India [MT]
Year Demand* Despatch Import Export
2014-15 55.460 56.438 43.715 0.042
2015-16 77.000 59.213 43.561 0.064
2016-17 56.620 59.308 41.644 0.027
2017-18 63.170 45.380 47.003 0.068
2018-19 58.370 43.318 51.838 0.060
Statement 18: Demand*, Despatch, Import and
Export
of Non-coking Coal of India [MT]
Year Demand* Despatch Import Export
2014-15 731.570 547.334 174.068 1.196
2015-16 833.000 573.229 159.388 1.511
2016-17 828.250 586.670 149.309 1.746
2017-18 845.230 642.451 161.269 1.435
2018-19 932.980 689.476 183.402 1.254
*Source: Annual Plan, MOC
1.31 Export of Coal: Although, there was short
supply of coal in India compared to its demand
and it had to resort to import of coal, India
exported some quantity of coal to its neighboring
countries during the year 2018-19 (Statement
19). It can be seen from the statement that coal
was exported mainly to Nepal was 0.857 MT
(65.27%) followed by Bangladesh 0.376 MT
(28.64%).
Statement 19: Export of Coal by India to different
countries during 2018-19
Country Quantity [MT] % Share
Bangladesh PR 0.376 28.64%
Nepal 0.857 65.27%
Bhutan 0.028 2.13% Others 0.052 3.96%
Total 1.313 100.00%
1.32 The break-up of country wise Export for
coking and non-coking coal is given in Statement
20 and 21 respectively.
Statement 20: Export of Coking Coal from India to
different countries during 2018-19
Country Quantity [MT] % Share
Egypt A R P 0.050 83.33
Others 0.010 16.67
Total 0.060 100
Statement 21: Export of Non-Coking Coal from India
to different countries during 2018-19
Country Quantity [MT] Share
Bangladesh PR 0.375 29.90%
Nepal 0.849 67.70%
Bhutan 0.028 2.23%
Others 0.002 0.17%
Total 1.254 100.00%
Captive Coal & Lignite Blocks
1.34 The policy of the allotment of Captive Coal
Blocks was adopted by the Government of India in the
year 1993 and as per this policy by the end of 2013-
14, out of total allocated 218 coal blocks, 80 coal
blocks were de-allocated. Thus at the end of 2013-14,
138 coal blocks and 28 lignite blocks remained
allocated under the category of Captive Coal Block.
~ Provisional Coal Statistics 2018-19 ~
Coal Controller's Organisation, 1,Council House Street, Kolkata, W.B., India
12
During the year 2014-15 by virtue of judgment dated
25.08.2014 read with the order dated 24.09.2014 of
the Hon’ble Supreme Court of India, out of 218
captive coal blocks, allocation of 204 coal blocks were
cancelled except allocation of 12 coal blocks for
UMPPs and one coal block each allocated to NTPC
and SAIL.
1.35 Further, allocation of four coal blocks for
UMPPs, namely, Chhatrasal coal block cancelled on
07.05.2015 and Meenakshi, Meenakshi B and Dip
side of Meenakshi blocks of UMPP cancelled on
15.12.2015. As such as on date 10 coal blocks
allocated through earlier dispensations stand
allocated.
1.36 Subsequent to the order of the Hon’ble
Supreme Court of India, 42 nos. of producing coal
blocks [Schedule II coal mines as per the Coal Mines
(Special Provisions) Ordinance, 2014 replaced by the
Coal Mines (Special Provision) Act, 2015] were
allowed to produce coal up to 31.03.2015. Thus total
number of blocks stand allocated from 25.09.2014 to
31.03.2015 was 52 [42 + 10 earlier coal blocks].
1.37 In 2018-19, 20 captive coal blocks
vested/allocated including 3 blocks under CIL
custodian produced coal. From these total 23 coal
blocks production of coal was 54.852 MT in 2018-19.
1.38 Under the “Auction by Competitive Bidding
Rules, 2012”, 13 regionally explored coal blocks have
been allotted to Central/State Government
companies.
1.39 In 2017-18 CMDPA of 5 coal blocks have
been terminated.
1.40 In 2018-19, 3 coal blocks have been
allocated. Therefore, as on 31.03.2019, number of
coal blocks stand exist was 110 = (vested/allotted 80
+ Custodian 7 + Under Auction by Competitive
Bidding Rules, 2012-13 -13 and blocks not cancelled
– 10).
1.41 As on 31.03.2019, number of lignite blocks
stand allocated are 23.
~ Provisional Coal Statistics 2018-19 ~
Coal Controller's Organisation, 1,Council House Street, Kolkata, W.B., India
0
100
200
300
400
500
600
700
800
2009-10 2010-11 2011-12 2012-13 2013-14 2014-15 2015-16 2016-17 2017-18 2018-19
Qua
ntity
(M
ill.
Ton
nes)
Chart-II : RAW COAL PRODUCTION, DESPATCHES & STOCK LAST TEN YEARS
Production Despatches Cl. Stock
0
10
20
30
40
50
60
2009-10 2010-11 2011-12 2012-13 2013-14 2014-15 2015-16 2016-17 2017-18 2018-19
Qua
ntity
(M
ill. T
onne
s)
Chart-III : LIGNITE PRODUCTION, DESPATCHES & STOCK LAST TEN YEARS
Production Despatches Cl. Stock
0
10
20
30
40
50
60
70
80
90
100
Apr-18 May-18 Jun-18 Jul-18 Aug-18 Sep-18 Oct-18 Nov-18 Dec-18 Jan-19 Feb-19 Mar-19
Qua
ntity
(M
ill.T
onne
s )
Chart-I : MONTH-WISE RAW COAL PRODUCTION, DESPATCHES & STOCK
IN INDIA, 2018-19
Production Despatches Closing Stock
13
~ Provisional Coal Statistics 2018-19 ~
Coal Controller's Organisation, 1,Council House Street, Kolkata, W.B., India
0
20
40
60
80
100
120
140
160
Qua
ntity
(M
ill. T
onne
s)
Companies
Chart -IV : Sectorwise Despatches of Raw Coal from different companies in 2018-19
Power (Utility) Power (Captive)
Steel (Boilers) Cement
Fertilisers Sponge Iron
Other basic-Metal (Aluminium etc) Chemical
Pulp & Paper Textiles & Rayons
Bricks Other
Colliery Consumption
24.6
90
19.4
84
31.8
01
35.5
57
36.8
72
43.7
15
44.5
61
41.6
44
47.0
03
51.8
38
48.5
65
49.4
34
71.0
52
110.
228
129.
985
174.
068
159.
388
149.
309
161.
269 18
3.40
2
2.35
5
1.49
0
2.36
5
3.08
1
4.17
1
3.29
4
3.07
2
4.34
6
4.58
5
4.93
1 0
50
100
150
200
250
2009-10 2010-11 2011-12 2012-13 2013-14 2014-15 2015-16 2016-17 2017-18 2018-19
Qua
ntity
(M
ill. T
onne
s)
Chart - V : Import of Coal (Coking and Non-coking) and Coke during last Ten Years
Coking Coal Non-Coking Coal Coke
0.27
0
0.11
1
0.09
7
0.05
6
0.00
8
0.04
2
0.06
4
0.02
7
0.06
8
0.06
0
2.18
0
1.76
4
1.91
7 2.38
7
2.18
0
1.19
6
1.51
1
1.74
6
1.43
5
1.25
4
0.12
9
0.72
9
0.61
3 1.20
1
0.15
4
0.10
2
0.14
9
0.08
9
0.10
8
0.02
5
0
1
2
3
4
2009-10 2010-11 2011-12 2012-13 2013-14 2014-15 2015-16 2016-17 2017-18 2018-19
Qua
ntity
(M
ill. T
onne
s)
Chart - VI : Export of Coal (Coking and Non-coking) and Coke during last Ten Years
Coking Coal Non-Coking Coal Coke
14
~ Provisional Coal Statistics 2018-19 ~
Coal Controller's Organisation, 1,Council House Street, Kolkata, W.B., India
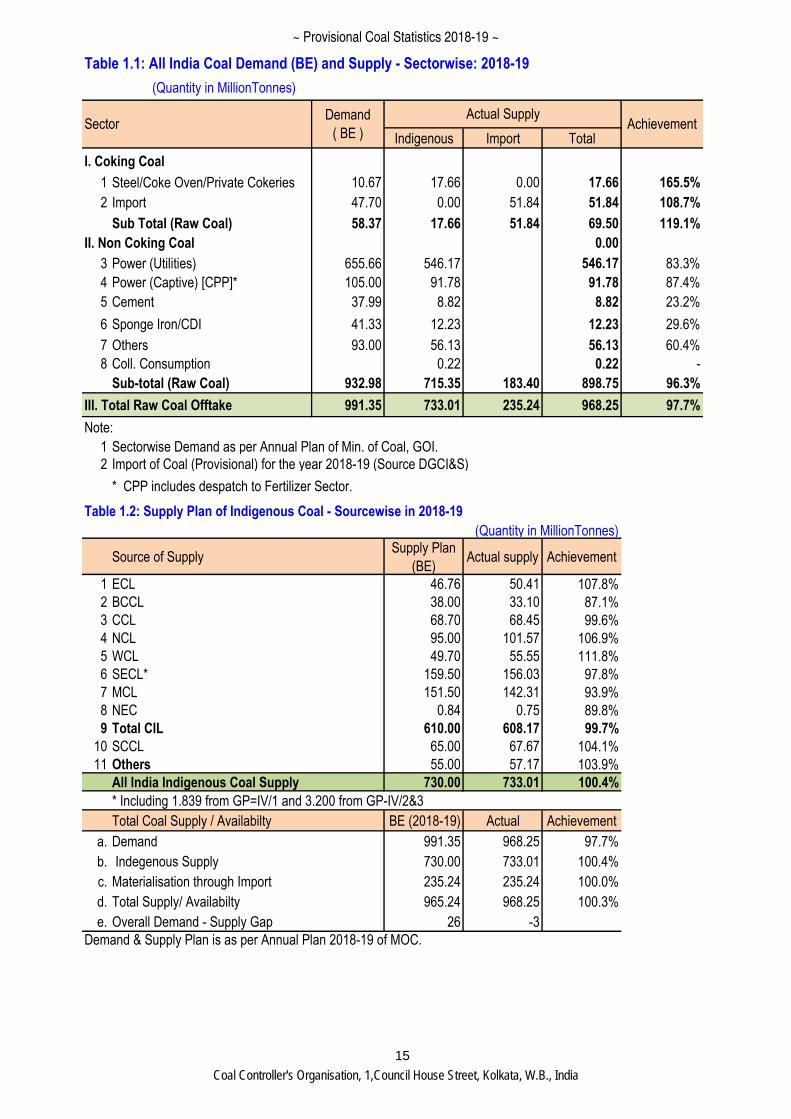
Table 1.1: All India Coal Demand (BE) and Supply - Sectorwise: 2018-19
Indigenous Import Total
I. Coking Coal
1 Steel/Coke Oven/Private Cokeries 10.67 17.66 0.00 17.66 165.5%
2 Import 47.70 0.00 51.84 51.84 108.7%
Sub Total (Raw Coal) 58.37 17.66 51.84 69.50 119.1%
II. Non Coking Coal 0.00
3 Power (Utilities) 655.66 546.17 546.17 83.3%
4 Power (Captive) [CPP]* 105.00 91.78 91.78 87.4%
5 Cement 37.99 8.82 8.82 23.2%
6 Sponge Iron/CDI 41.33 12.23 12.23 29.6%
7 Others 93.00 56.13 56.13 60.4%
8 Coll. Consumption 0.22 0.22 -
Sub-total (Raw Coal) 932.98 715.35 183.40 898.75 96.3%
III. Total Raw Coal Offtake 991.35 733.01 235.24 968.25 97.7%
Note:
1 Sectorwise Demand as per Annual Plan of Min. of Coal, GOI.
2 Import of Coal (Provisional) for the year 2018-19 (Source DGCI&S)
* CPP includes despatch to Fertilizer Sector.
Table 1.2: Supply Plan of Indigenous Coal - Sourcewise in 2018-19
(Quantity in MillionTonnes)
Source of SupplySupply Plan
(BE)Actual supply Achievement
1 ECL 46.76 50.41 107.8%
2 BCCL 38.00 33.10 87.1%
3 CCL 68.70 68.45 99.6%
4 NCL 95.00 101.57 106.9%
5 WCL 49.70 55.55 111.8%
6 SECL* 159.50 156.03 97.8%
7 MCL 151.50 142.31 93.9%
8 NEC 0.84 0.75 89.8%
9 Total CIL 610.00 608.17 99.7%
10 SCCL 65.00 67.67 104.1%
11 Others 55.00 57.17 103.9%
All India Indigenous Coal Supply 730.00 733.01 100.4%
* Including 1.839 from GP=IV/1 and 3.200 from GP-IV/2&3
Total Coal Supply / Availabilty BE (2018-19) Actual Achievement
a. Demand 991.35 968.25 97.7%
b. Indegenous Supply 730.00 733.01 100.4%
c. Materialisation through Import 235.24 235.24 100.0%
d. Total Supply/ Availabilty 965.24 968.25 100.3%
e. Overall Demand - Supply Gap 26 -3
Demand & Supply Plan is as per Annual Plan 2018-19 of MOC.
(Quantity in MillionTonnes)
SectorDemand
( BE )
Actual SupplyAchievement
15
~ Provisional Coal Statistics 2018-19 ~
Coal Controller's Organisation, 1,Council House Street, Kolkata, W.B., India
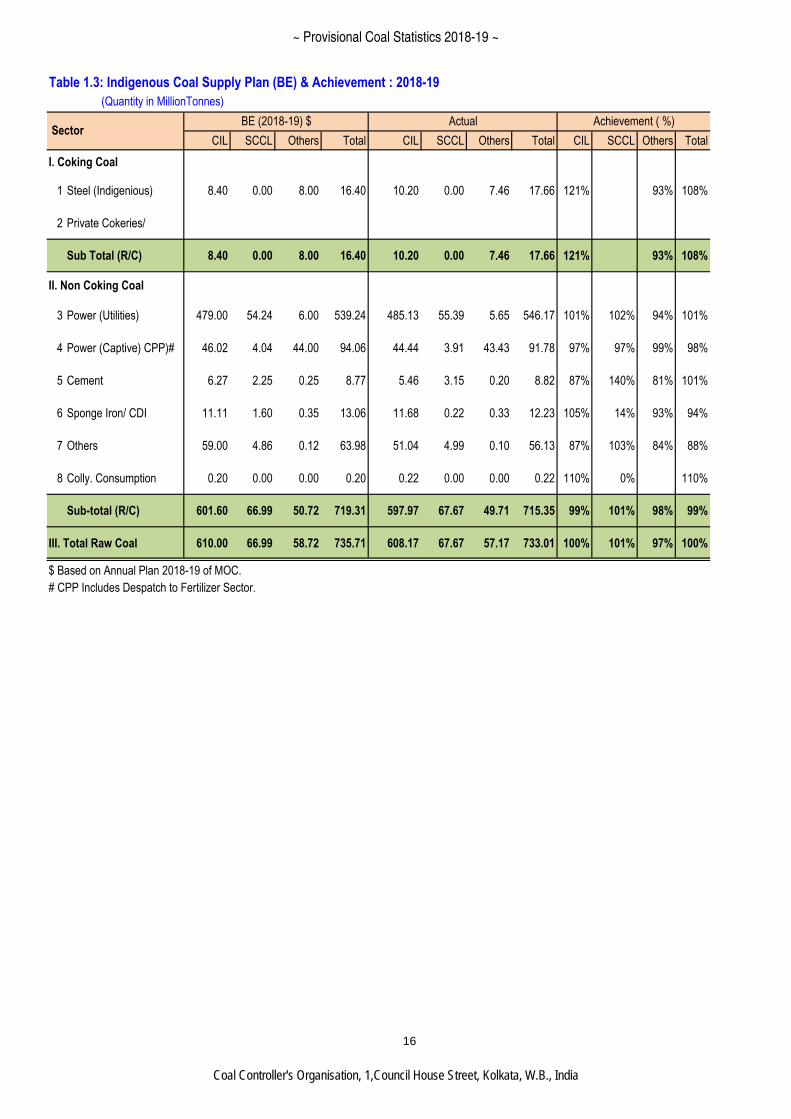
Table 1.3: Indigenous Coal Supply Plan (BE) & Achievement : 2018-19
(Quantity in MillionTonnes)
CIL SCCL Others Total CIL SCCL Others Total CIL SCCL Others Total
I. Coking Coal
1 Steel (Indigenious) 8.40 0.00 8.00 16.40 10.20 0.00 7.46 17.66 121% 93% 108%
2 Private Cokeries/
Sub Total (R/C) 8.40 0.00 8.00 16.40 10.20 0.00 7.46 17.66 121% 93% 108%
II. Non Coking Coal
3 Power (Utilities) 479.00 54.24 6.00 539.24 485.13 55.39 5.65 546.17 101% 102% 94% 101%
4 Power (Captive) CPP)# 46.02 4.04 44.00 94.06 44.44 3.91 43.43 91.78 97% 97% 99% 98%
5 Cement 6.27 2.25 0.25 8.77 5.46 3.15 0.20 8.82 87% 140% 81% 101%
6 Sponge Iron/ CDI 11.11 1.60 0.35 13.06 11.68 0.22 0.33 12.23 105% 14% 93% 94%
7 Others 59.00 4.86 0.12 63.98 51.04 4.99 0.10 56.13 87% 103% 84% 88%
8 Colly. Consumption 0.20 0.00 0.00 0.20 0.22 0.00 0.00 0.22 110% 0% 110%
Sub-total (R/C) 601.60 66.99 50.72 719.31 597.97 67.67 49.71 715.35 99% 101% 98% 99%
III. Total Raw Coal 610.00 66.99 58.72 735.71 608.17 67.67 57.17 733.01 100% 101% 97% 100%
$ Based on Annual Plan 2018-19 of MOC.
# CPP Includes Despatch to Fertilizer Sector.
SectorBE (2018-19) $ Actual Achievement ( %)
16
~ Provisional Coal Statistics 2018-19 ~
Coal Controller's Organisation, 1,Council House Street, Kolkata, W.B., India
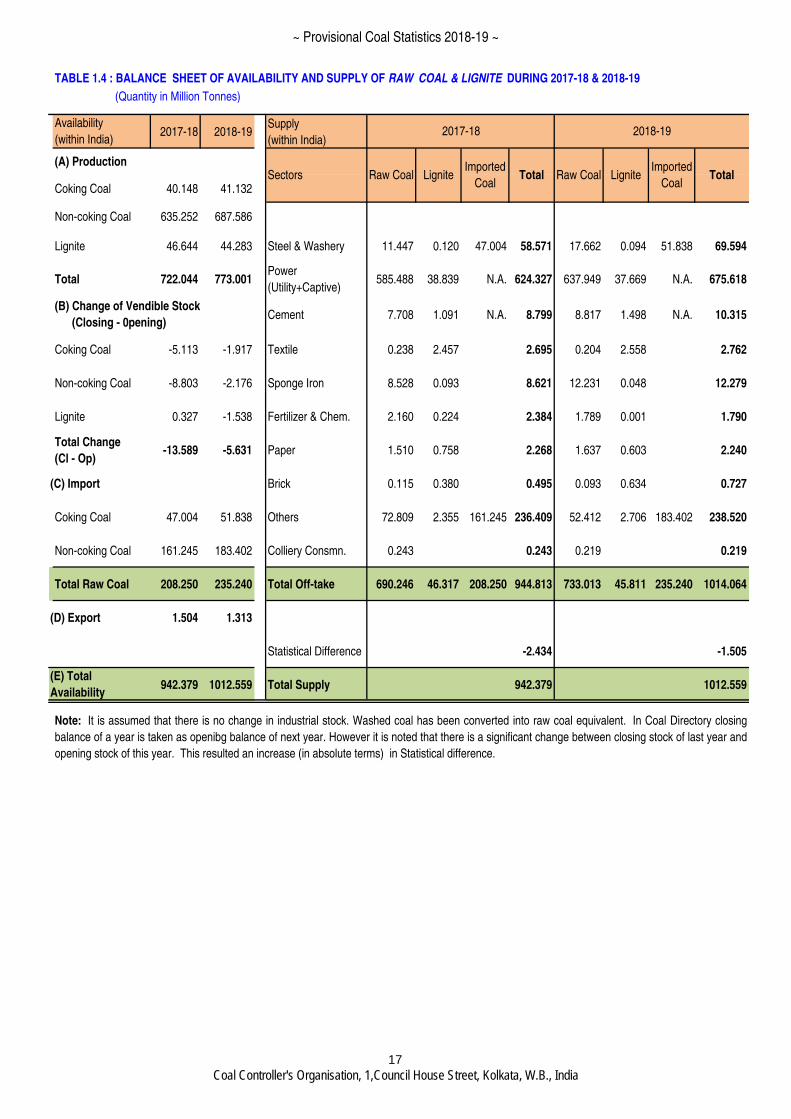
TABLE 1.4 : BALANCE SHEET OF AVAILABILITY AND SUPPLY OF RAW COAL & LIGNITE DURING 2017-18 & 2018-19
(Quantity in Million Tonnes)
2017-18 2018-19Supply
(within India)
(A) Production
Coking Coal 40.148 41.132
Non-coking Coal 635.252 687.586
Lignite 46.644 44.283 Steel & Washery 11.447 0.120 47.004 58.571 17.662 0.094 51.838 69.594
Total 722.044 773.001Power
(Utility+Captive)585.488 38.839 N.A. 624.327 637.949 37.669 N.A. 675.618
Cement 7.708 1.091 N.A. 8.799 8.817 1.498 N.A. 10.315
Coking Coal -5.113 -1.917 Textile 0.238 2.457 2.695 0.204 2.558 2.762
Non-coking Coal -8.803 -2.176 Sponge Iron 8.528 0.093 8.621 12.231 0.048 12.279
Lignite 0.327 -1.538 Fertilizer & Chem. 2.160 0.224 2.384 1.789 0.001 1.790
Total Change
(Cl - Op)-13.589 -5.631 Paper 1.510 0.758 2.268 1.637 0.603 2.240
(C) Import Brick 0.115 0.380 0.495 0.093 0.634 0.727
Coking Coal 47.004 51.838 Others 72.809 2.355 161.245 236.409 52.412 2.706 183.402 238.520
Non-coking Coal 161.245 183.402 Colliery Consmn. 0.243 0.243 0.219 0.219
Total Raw Coal 208.250 235.240 Total Off-take 690.246 46.317 208.250 944.813 733.013 45.811 235.240 1014.064
(D) Export 1.504 1.313
Statistical Difference -2.434 -1.505
942.379 1012.559 Total Supply 942.379 1012.559
Note: It is assumed that there is no change in industrial stock. Washed coal has been converted into raw coal equivalent. In Coal Directory closing
balance of a year is taken as openibg balance of next year. However it is noted that there is a significant change between closing stock of last year and
opening stock of this year. This resulted an increase (in absolute terms) in Statistical difference.
(B) Change of Vendible Stock
(Closing - 0pening)
2018-19
Raw Coal LigniteImported
CoalTotal
2017-18
Raw Coal LigniteImported
CoalTotal
(E) Total
Availability
Sectors
Availability
(within India)
17
~ Provisional Coal Statistics 2018-19 ~
Coal Controller's Organisation, 1,Council House Street, Kolkata, W.B., India
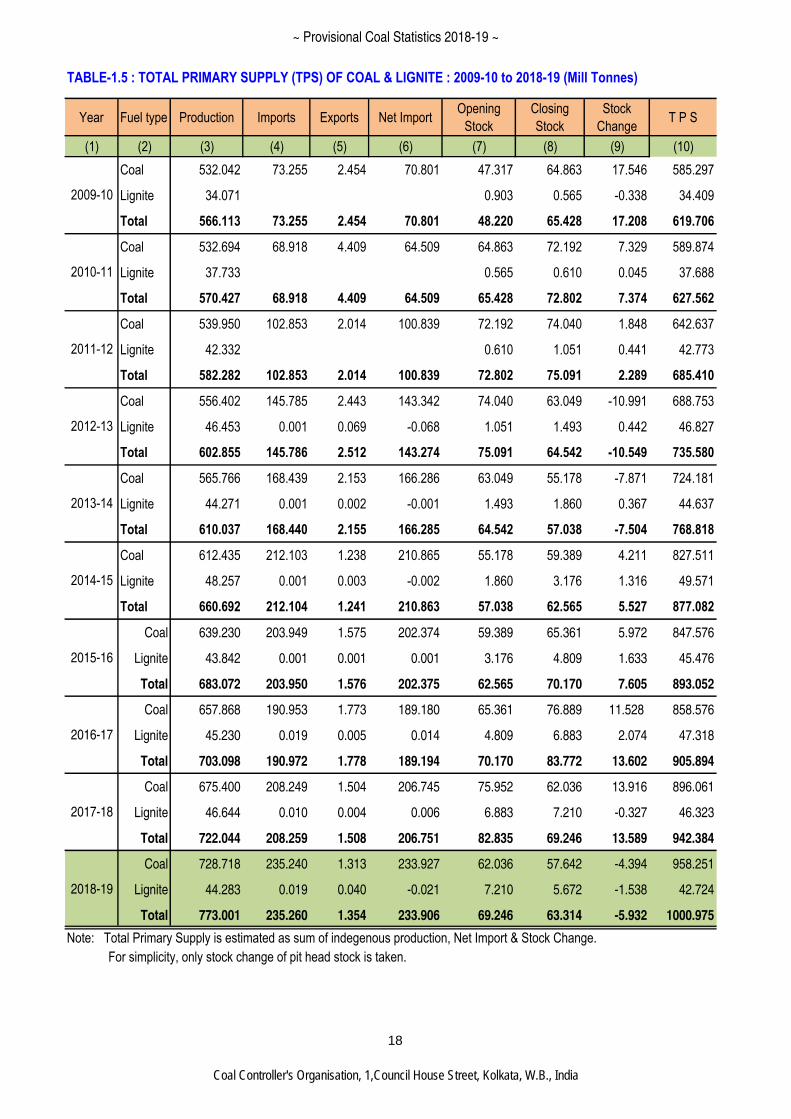
TABLE-1.5 : TOTAL PRIMARY SUPPLY (TPS) OF COAL & LIGNITE : 2009-10 to 2018-19 (Mill Tonnes)
Year Fuel type Production Imports Exports Net ImportOpening
Stock
Closing
Stock
Stock
ChangeT P S
(1) (2) (3) (4) (5) (6) (7) (8) (9) (10)
Coal 532.042 73.255 2.454 70.801 47.317 64.863 17.546 585.297
Lignite 34.071 0.903 0.565 -0.338 34.409
Total 566.113 73.255 2.454 70.801 48.220 65.428 17.208 619.706
Coal 532.694 68.918 4.409 64.509 64.863 72.192 7.329 589.874
Lignite 37.733 0.565 0.610 0.045 37.688
Total 570.427 68.918 4.409 64.509 65.428 72.802 7.374 627.562
Coal 539.950 102.853 2.014 100.839 72.192 74.040 1.848 642.637
Lignite 42.332 0.610 1.051 0.441 42.773
Total 582.282 102.853 2.014 100.839 72.802 75.091 2.289 685.410
Coal 556.402 145.785 2.443 143.342 74.040 63.049 -10.991 688.753
Lignite 46.453 0.001 0.069 -0.068 1.051 1.493 0.442 46.827
Total 602.855 145.786 2.512 143.274 75.091 64.542 -10.549 735.580
Coal 565.766 168.439 2.153 166.286 63.049 55.178 -7.871 724.181
Lignite 44.271 0.001 0.002 -0.001 1.493 1.860 0.367 44.637
Total 610.037 168.440 2.155 166.285 64.542 57.038 -7.504 768.818
Coal 612.435 212.103 1.238 210.865 55.178 59.389 4.211 827.511
Lignite 48.257 0.001 0.003 -0.002 1.860 3.176 1.316 49.571
Total 660.692 212.104 1.241 210.863 57.038 62.565 5.527 877.082
Coal 639.230 203.949 1.575 202.374 59.389 65.361 5.972 847.576
Lignite 43.842 0.001 0.001 0.001 3.176 4.809 1.633 45.476
Total 683.072 203.950 1.576 202.375 62.565 70.170 7.605 893.052
Coal 657.868 190.953 1.773 189.180 65.361 76.889 11.528 858.576
Lignite 45.230 0.019 0.005 0.014 4.809 6.883 2.074 47.318
Total 703.098 190.972 1.778 189.194 70.170 83.772 13.602 905.894
Coal 675.400 208.249 1.504 206.745 75.952 62.036 13.916 896.061
Lignite 46.644 0.010 0.004 0.006 6.883 7.210 -0.327 46.323
Total 722.044 208.259 1.508 206.751 82.835 69.246 13.589 942.384
Coal 728.718 235.240 1.313 233.927 62.036 57.642 -4.394 958.251
Lignite 44.283 0.019 0.040 -0.021 7.210 5.672 -1.538 42.724
Total 773.001 235.260 1.354 233.906 69.246 63.314 -5.932 1000.975
Note: Total Primary Supply is estimated as sum of indegenous production, Net Import & Stock Change.
For simplicity, only stock change of pit head stock is taken.
2009-10
2018-19
2017-18
2016-17
2015-16
2010-11
2011-12
2012-13
2013-14
2014-15
18
~ Provisional Coal Statistics 2018-19 ~
Coal Controller's Organisation, 1,Council House Street, Kolkata, W.B., India
~ Provisional Coal Statistics 2018-19 ~
Coal Controller's Organisation, 1,Council House Street, Kolkata, W.B., India
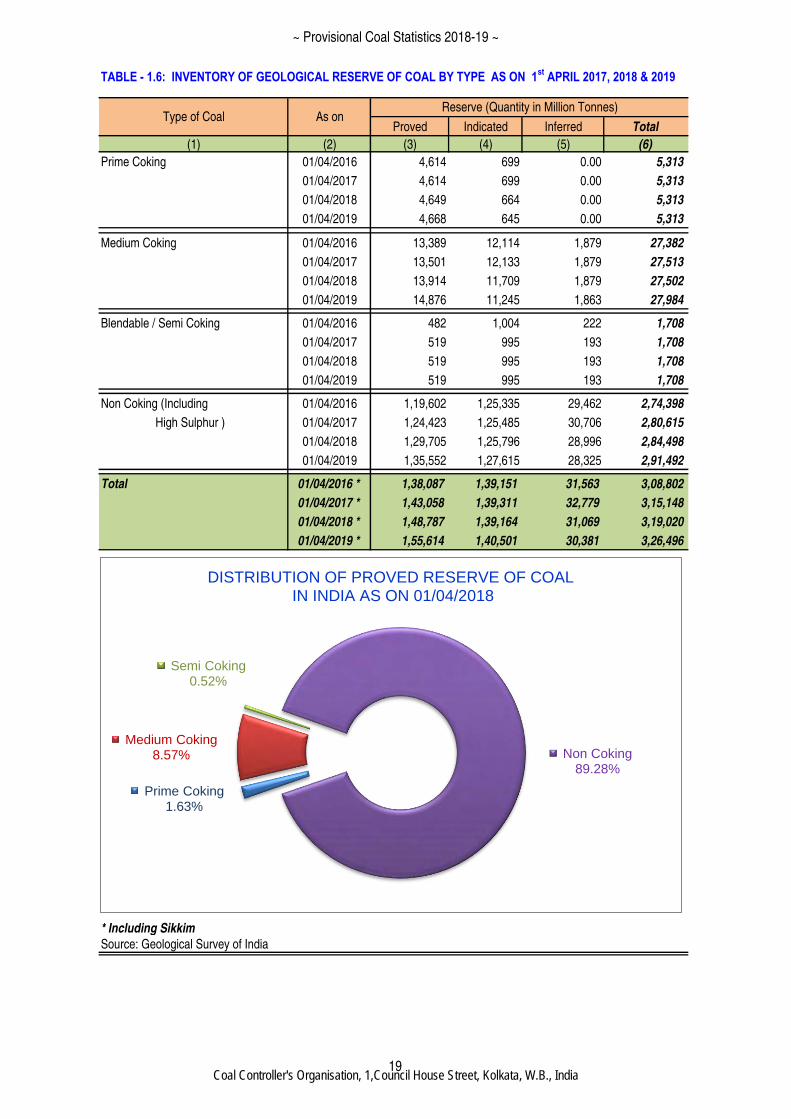
TABLE - 1.6: INVENTORY OF GEOLOGICAL RESERVE OF COAL BY TYPE AS ON 1st
APRIL 2017, 2018 & 2019
Proved Indicated Inferred Total
(1) (2) (3) (4) (5) (6)
Prime Coking 01/04/2016 4,614 699 0.00 5,313
01/04/2017 4,614 699 0.00 5,313
01/04/2018 4,649 664 0.00 5,313
01/04/2019 4,668 645 0.00 5,313
Medium Coking 01/04/2016 13,389 12,114 1,879 27,382
01/04/2017 13,501 12,133 1,879 27,513
01/04/2018 13,914 11,709 1,879 27,502
01/04/2019 14,876 11,245 1,863 27,984
Blendable / Semi Coking 01/04/2016 482 1,004 222 1,708
01/04/2017 519 995 193 1,708
01/04/2018 519 995 193 1,708
01/04/2019 519 995 193 1,708
Non Coking (Including 01/04/2016 1,19,602 1,25,335 29,462 2,74,398
High Sulphur ) 01/04/2017 1,24,423 1,25,485 30,706 2,80,615
01/04/2018 1,29,705 1,25,796 28,996 2,84,498
01/04/2019 1,35,552 1,27,615 28,325 2,91,492
Total 01/04/2016 * 1,38,087 1,39,151 31,563 3,08,802
01/04/2017 * 1,43,058 1,39,311 32,779 3,15,148
01/04/2018 * 1,48,787 1,39,164 31,069 3,19,020
01/04/2019 * 1,55,614 1,40,501 30,381 3,26,496
* Including Sikkim
Source: Geological Survey of India
Type of Coal As onReserve (Quantity in Million Tonnes)
Prime Coking 1.63%
Medium Coking 8.57%
Semi Coking 0.52%
Non Coking 89.28%
DISTRIBUTION OF PROVED RESERVE OF COAL IN INDIA AS ON 01/04/2018
19
~ Provisional Coal Statistics 2018-19 ~
Coal Controller's Organisation, 1,Council House Street, Kolkata, W.B., India
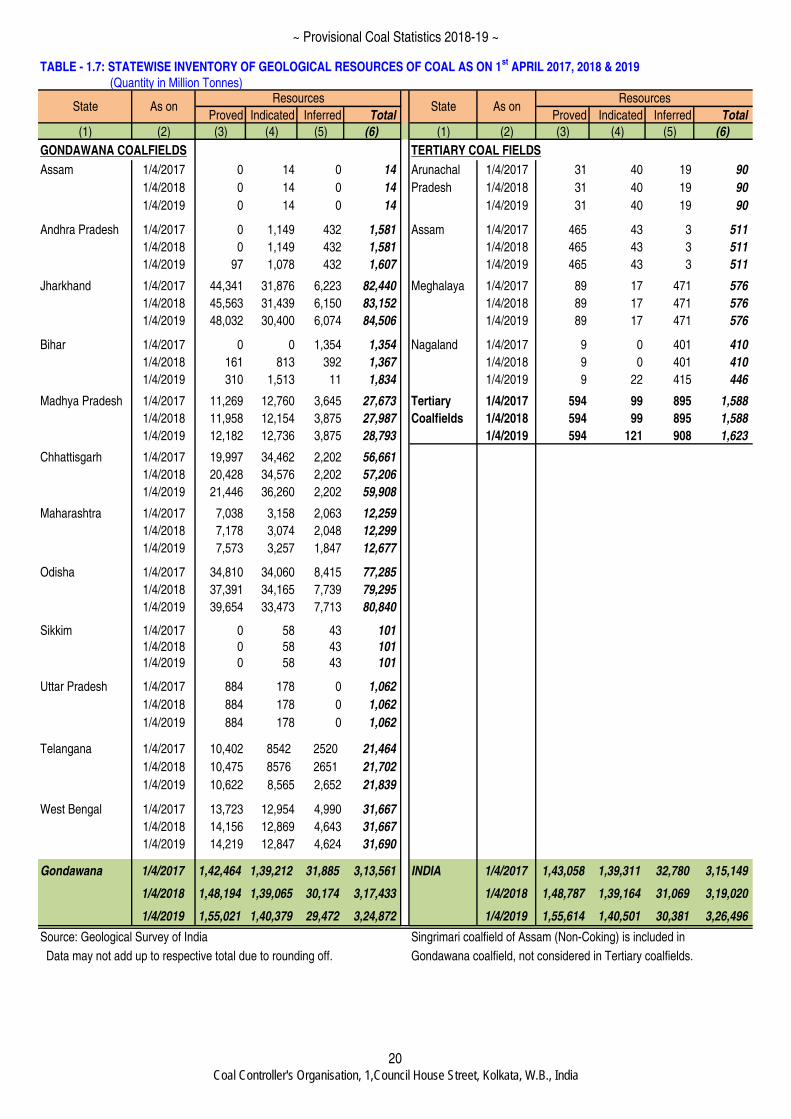
TABLE - 1.7: STATEWISE INVENTORY OF GEOLOGICAL RESOURCES OF COAL AS ON 1st
APRIL 2017, 2018 & 2019
(Quantity in Million Tonnes)
Proved Indicated Inferred Total Proved Indicated Inferred Total
(1) (2) (3) (4) (5) (6) (1) (2) (3) (4) (5) (6)
GONDAWANA COALFIELDS TERTIARY COAL FIELDS
Assam 1/4/2017 0 14 0 14 Arunachal 1/4/2017 31 40 19 90
Assam 1/4/2018 0 14 0 14 Pradesh 1/4/2018 31 40 19 90
Assam 1/4/2019 0 14 0 14 1/4/2019 31 40 19 90
Andhra Pradesh 1/4/2017 0 1,149 432 1,581 Assam 1/4/2017 465 43 3 511
Andhra Pradesh 1/4/2018 0 1,149 432 1,581 1/4/2018 465 43 3 511
Andhra Pradesh 1/4/2019 97 1,078 432 1,607 1/4/2019 465 43 3 511
Jharkhand 1/4/2017 44,341 31,876 6,223 82,440 Meghalaya 1/4/2017 89 17 471 576
Jharkhand 1/4/2018 45,563 31,439 6,150 83,152 1/4/2018 89 17 471 576
Jharkhand 1/4/2019 48,032 30,400 6,074 84,506 1/4/2019 89 17 471 576
Bihar 1/4/2017 0 0 1,354 1,354 Nagaland 1/4/2017 9 0 401 410
Bihar 1/4/2018 161 813 392 1,367 1/4/2018 9 0 401 410
Bihar 1/4/2019 310 1,513 11 1,834 1/4/2019 9 22 415 446
Madhya Pradesh 1/4/2017 11,269 12,760 3,645 27,673 Tertiary 1/4/2017 594 99 895 1,588
Madhya Pradesh 1/4/2018 11,958 12,154 3,875 27,987 Coalfields 1/4/2018 594 99 895 1,588
Madhya Pradesh 1/4/2019 12,182 12,736 3,875 28,793 1/4/2019 594 121 908 1,623
Chhattisgarh 1/4/2017 19,997 34,462 2,202 56,661
Chhattisgarh 1/4/2018 20,428 34,576 2,202 57,206
Chhattisgarh 1/4/2019 21,446 36,260 2,202 59,908
Maharashtra 1/4/2017 7,038 3,158 2,063 12,259
1/4/2018 7,178 3,074 2,048 12,299
Maharashtra 1/4/2019 7,573 3,257 1,847 12,677
Odisha 1/4/2017 34,810 34,060 8,415 77,285
1/4/2018 37,391 34,165 7,739 79,295
Odisha 1/4/2019 39,654 33,473 7,713 80,840
Sikkim 1/4/2017 0 58 43 101
1/4/2018 0 58 43 101
Sikkim 1/4/2019 0 58 43 101
Uttar Pradesh 1/4/2017 884 178 0 1,062
1/4/2018 884 178 0 1,062
Uttar Pradesh 1/4/2019 884 178 0 1,062
Telangana 1/4/2017 10,402 8542 2520 21,464
1/4/2018 10,475 8576 2651 21,702
Telangana 1/4/2019 10,622 8,565 2,652 21,839
West Bengal 1/4/2017 13,723 12,954 4,990 31,667
1/4/2018 14,156 12,869 4,643 31,667
West Bengal 1/4/2019 14,219 12,847 4,624 31,690
Gondawana 1/4/2017 1,42,464 1,39,212 31,885 3,13,561 INDIA 1/4/2017 1,43,058 1,39,311 32,780 3,15,149
1/4/2018 1,48,194 1,39,065 30,174 3,17,433 1/4/2018 1,48,787 1,39,164 31,069 3,19,020
1/4/2019 1,55,021 1,40,379 29,472 3,24,872 1/4/2019 1,55,614 1,40,501 30,381 3,26,496
Source: Geological Survey of India Singrimari coalfield of Assam (Non-Coking) is included in
Data may not add up to respective total due to rounding off. Gondawana coalfield, not considered in Tertiary coalfields.
ResourcesState As on
ResourcesState As on
20
~ Provisional Coal Statistics 2018-19 ~
Coal Controller's Organisation, 1,Council House Street, Kolkata, W.B., India
Proved Indicated Inferred Total
(1) (2) (3) (4) (5) (6)
Gujarat 01-04-2017 1278.65 283.70 1159.70 2722.05
01-04-2018 1278.65 283.70 1159.70 2722.05
01-04-2019 1278.65 283.70 1159.70 2722.05
J & K 01-04-2017 0.00 20.25 7.30 27.55
01-04-2018 0.00 20.25 7.30 27.55
01-04-2019 0.00 20.25 7.30 27.55
Kerala 01-04-2017 0.00 0.00 9.65 9.65
01-04-2018 0.00 0.00 9.65 9.65
01-04-2019 0.00 0.00 9.65 9.65
Pondicherry 01-04-2017 0.00 405.61 11.00 416.61
01-04-2018 0.00 405.61 11.00 416.61
01-04-2019 0.00 405.61 11.00 416.61
Rajasthan 01-04-2017 1168.53 2670.84 1896.60 5735.98
01-04-2018 1168.53 3029.78 2150.77 6349.08
01-04-2019 1168.53 3029.78 2150.77 6349.08
Tamilnadu 01-04-2017 4093.53 22632.87 9055.98 35782.38
01-04-2018 4093.53 22648.33 9392.85 36134.71
01-04-2019 4340.35 22496.63 9392.85 36229.83
West Bengal 01-04-2017 0.00 1.13 2.80 3.93
01-04-2018 0.00 1.13 2.80 3.93
01-04-2019 0.00 1.13 2.80 3.93
All India 01-04-2017 6540.71 26014.40 12143.03 44698.14
01-04-2018 6540.71 26388.80 12734.07 45663.58
01-04-2019 6787.53 26237.10 12734.07 45758.70
Note: Figures compiled by Neyveli Lignite Corporation Ltd.
TABLE - 1.8 : STATEWISE INVENTORY OF GEOLOGICAL RESERVE OF LIGNITE
AS ON 1st
APRIL 2017, 2018 & 2019
State As onResources (Quantiry in Million Tonnes)
21
~ Provisional Coal Statistics 2018-19 ~
Coal Controller's Organisation, 1,Council House Street, Kolkata, W.B., India
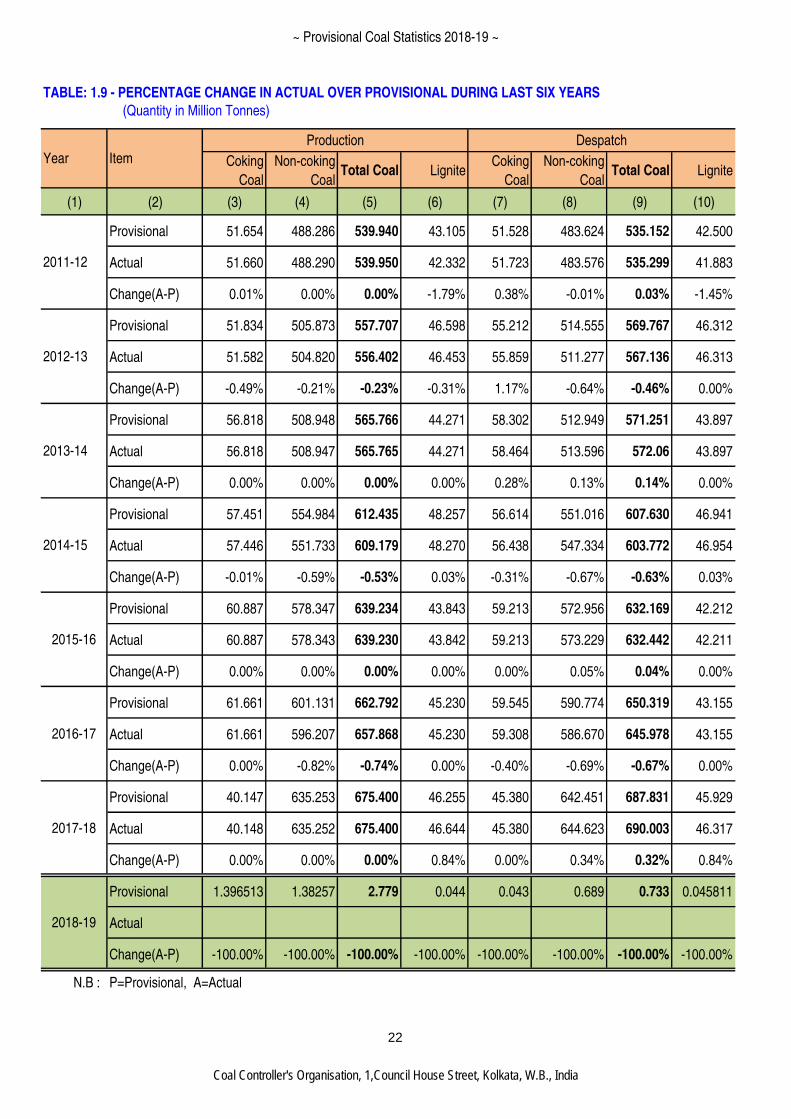
TABLE: 1.9 - PERCENTAGE CHANGE IN ACTUAL OVER PROVISIONAL DURING LAST SIX YEARS
(Quantity in Million Tonnes)
Coking
Coal
Non-coking
CoalTotal Coal Lignite
Coking
Coal
Non-coking
CoalTotal Coal Lignite
(1) (2) (3) (4) (5) (6) (7) (8) (9) (10)
Provisional 51.654 488.286 539.940 43.105 51.528 483.624 535.152 42.500
Actual 51.660 488.290 539.950 42.332 51.723 483.576 535.299 41.883
Change(A-P) 0.01% 0.00% 0.00% -1.79% 0.38% -0.01% 0.03% -1.45%
Provisional 51.834 505.873 557.707 46.598 55.212 514.555 569.767 46.312
Actual 51.582 504.820 556.402 46.453 55.859 511.277 567.136 46.313
Change(A-P) -0.49% -0.21% -0.23% -0.31% 1.17% -0.64% -0.46% 0.00%
Provisional 56.818 508.948 565.766 44.271 58.302 512.949 571.251 43.897
Actual 56.818 508.947 565.765 44.271 58.464 513.596 572.06 43.897
Change(A-P) 0.00% 0.00% 0.00% 0.00% 0.28% 0.13% 0.14% 0.00%
Provisional 57.451 554.984 612.435 48.257 56.614 551.016 607.630 46.941
Actual 57.446 551.733 609.179 48.270 56.438 547.334 603.772 46.954
Change(A-P) -0.01% -0.59% -0.53% 0.03% -0.31% -0.67% -0.63% 0.03%
Provisional 60.887 578.347 639.234 43.843 59.213 572.956 632.169 42.212
Actual 60.887 578.343 639.230 43.842 59.213 573.229 632.442 42.211
Change(A-P) 0.00% 0.00% 0.00% 0.00% 0.00% 0.05% 0.04% 0.00%
Provisional 61.661 601.131 662.792 45.230 59.545 590.774 650.319 43.155
Actual 61.661 596.207 657.868 45.230 59.308 586.670 645.978 43.155
Change(A-P) 0.00% -0.82% -0.74% 0.00% -0.40% -0.69% -0.67% 0.00%
Provisional 40.147 635.253 675.400 46.255 45.380 642.451 687.831 45.929
Actual 40.148 635.252 675.400 46.644 45.380 644.623 690.003 46.317
Change(A-P) 0.00% 0.00% 0.00% 0.84% 0.00% 0.34% 0.32% 0.84%
Provisional 1.396513 1.38257 2.779 0.044 0.043 0.689 0.733 0.045811
Actual
Change(A-P) -100.00% -100.00% -100.00% -100.00% -100.00% -100.00% -100.00% -100.00%
N.B : P=Provisional, A=Actual
Production Despatch
ItemYear
2018-19
2016-17
2017-18
2015-16
2014-15
2011-12
2013-14
2012-13
22
~ Provisional Coal Statistics 2018-19 ~
Coal Controller's Organisation, 1,Council House Street, Kolkata, W.B., India
~ Provisional Coal Statistics 2018-19 ~
Coal Controller's Organisation, 1,Council House Street, Kolkata, W.B., India
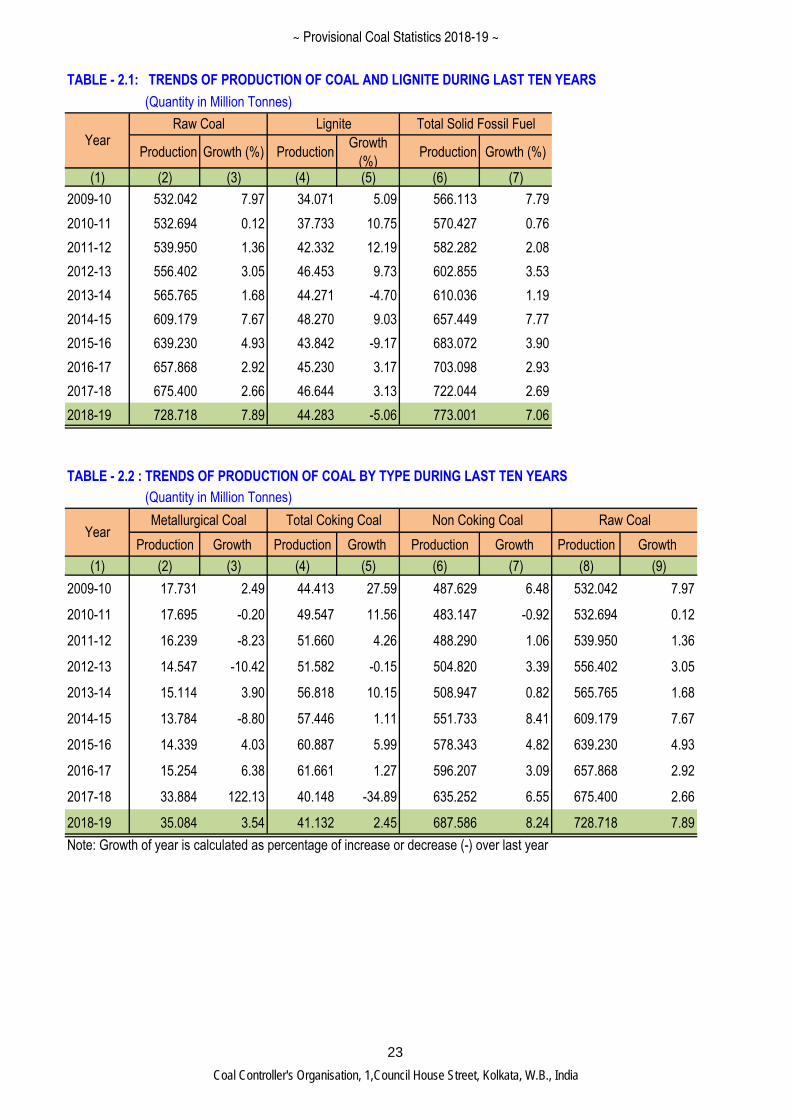
TABLE - 2.1: TRENDS OF PRODUCTION OF COAL AND LIGNITE DURING LAST TEN YEARS
(Quantity in Million Tonnes)
Production Growth (%) ProductionGrowth
(%)Production Growth (%)
(1) (2) (3) (4) (5) (6) (7)
2009-10 532.042 7.97 34.071 5.09 566.113 7.79
2010-11 532.694 0.12 37.733 10.75 570.427 0.76
2011-12 539.950 1.36 42.332 12.19 582.282 2.08
2012-13 556.402 3.05 46.453 9.73 602.855 3.53
2013-14 565.765 1.68 44.271 -4.70 610.036 1.19
2014-15 609.179 7.67 48.270 9.03 657.449 7.77
2015-16 639.230 4.93 43.842 -9.17 683.072 3.90
2016-17 657.868 2.92 45.230 3.17 703.098 2.93
2017-18 675.400 2.66 46.644 3.13 722.044 2.69
2018-19 728.718 7.89 44.283 -5.06 773.001 7.06
TABLE - 2.2 : TRENDS OF PRODUCTION OF COAL BY TYPE DURING LAST TEN YEARS
(Quantity in Million Tonnes)
Production Growth Production Growth Production Growth Production Growth
(1) (2) (3) (4) (5) (6) (7) (8) (9)
2009-10 17.731 2.49 44.413 27.59 487.629 6.48 532.042 7.97
2010-11 17.695 -0.20 49.547 11.56 483.147 -0.92 532.694 0.12
2011-12 16.239 -8.23 51.660 4.26 488.290 1.06 539.950 1.36
2012-13 14.547 -10.42 51.582 -0.15 504.820 3.39 556.402 3.05
2013-14 15.114 3.90 56.818 10.15 508.947 0.82 565.765 1.68
2014-15 13.784 -8.80 57.446 1.11 551.733 8.41 609.179 7.67
2015-16 14.339 4.03 60.887 5.99 578.343 4.82 639.230 4.93
2016-17 15.254 6.38 61.661 1.27 596.207 3.09 657.868 2.92
2017-18 33.884 122.13 40.148 -34.89 635.252 6.55 675.400 2.66
2018-19 35.084 3.54 41.132 2.45 687.586 8.24 728.718 7.89
Note: Growth of year is calculated as percentage of increase or decrease (-) over last year
Raw CoalYear
Raw Coal LigniteYear
Total Solid Fossil Fuel
Metallurgical Coal Total Coking Coal Non Coking Coal
23
~ Provisional Coal Statistics 2018-19 ~
Coal Controller's Organisation, 1,Council House Street, Kolkata, W.B., India
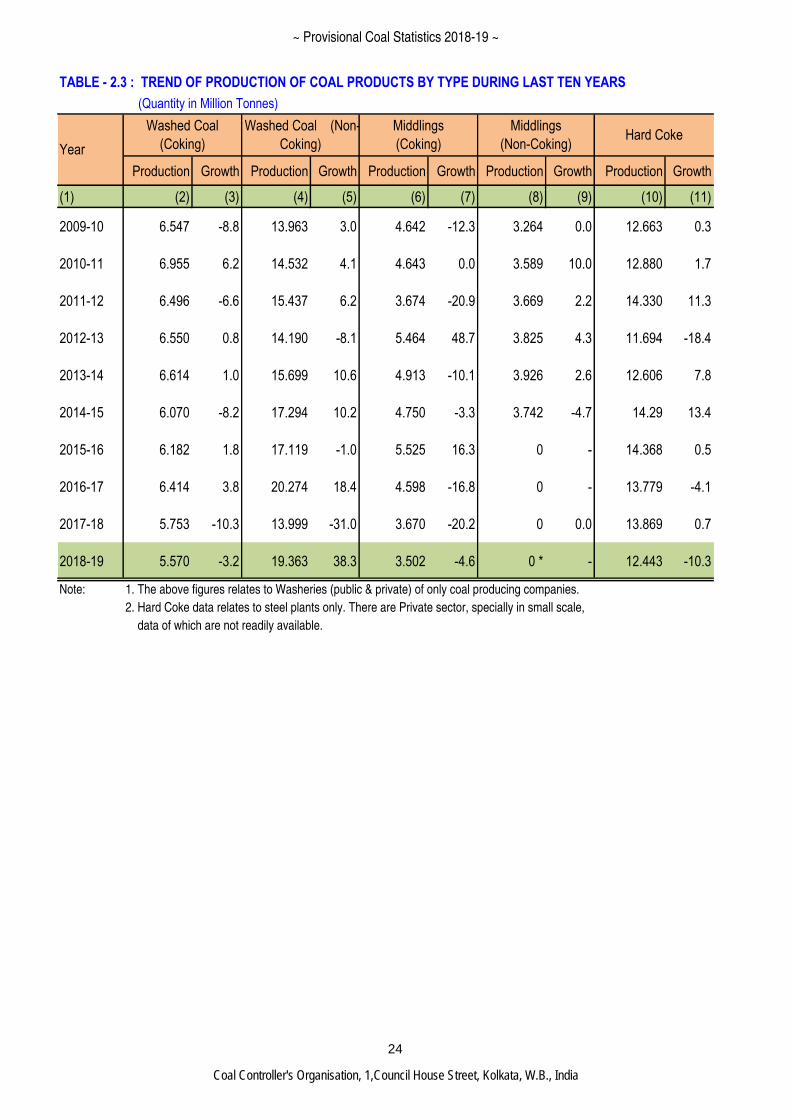
TABLE - 2.3 : TREND OF PRODUCTION OF COAL PRODUCTS BY TYPE DURING LAST TEN YEARS
(Million Tonnes) (Quantity in Million Tonnes)
Production Growth Production Growth Production Growth Production Growth Production Growth
(1) (2) (3) (4) (5) (6) (7) (8) (9) (10) (11)
2009-10 6.547 -8.8 13.963 3.0 4.642 -12.3 3.264 0.0 12.663 0.3
2010-11 6.955 6.2 14.532 4.1 4.643 0.0 3.589 10.0 12.880 1.7
2011-12 6.496 -6.6 15.437 6.2 3.674 -20.9 3.669 2.2 14.330 11.3
2012-13 6.550 0.8 14.190 -8.1 5.464 48.7 3.825 4.3 11.694 -18.4
2013-14 6.614 1.0 15.699 10.6 4.913 -10.1 3.926 2.6 12.606 7.8
2014-15 6.070 -8.2 17.294 10.2 4.750 -3.3 3.742 -4.7 14.29 13.4
2015-16 6.182 1.8 17.119 -1.0 5.525 16.3 0 - 14.368 0.5
2016-17 6.414 3.8 20.274 18.4 4.598 -16.8 0 - 13.779 -4.1
2017-18 5.753 -10.3 13.999 -31.0 3.670 -20.2 0 0.0 13.869 0.7
2018-19 5.570 -3.2 19.363 38.3 3.502 -4.6 0 * - 12.443 -10.3
Note: 1. The above figures relates to Washeries (public & private) of only coal producing companies.
2. Hard Coke data relates to steel plants only. There are Private sector, specially in small scale,
data of which are not readily available.
Hard CokeYear
Washed Coal
(Coking)
Washed Coal (Non-
Coking)
Middlings
(Coking)
Middlings
(Non-Coking)
24
~ Provisional Coal Statistics 2018-19 ~
Coal Controller's Organisation, 1,Council House Street, Kolkata, W.B., India
TABLE 2.4: MONTHLY PRODUCTION OF DIFFERENT TYPES OF RAW COAL AND LIGNITE IN 2018-19
( Million Tonnes)
Prdn Growth* Share** Prdn Growth* Share** Prdn Growth* Share** Prdn Growth* Share**
(1) (2) (3) (4) (5) (6) (7) (8) (9) (10) (11) (12) (13)
2018-19
Apr-18 2.879 -6.6 7.0 50.795 18.2 7.4 53.674 16.6 7.4 1.879 -12.6 4.2
May-18 3.378 11.2 8.2 53.305 13.9 7.8 56.683 13.8 7.8 2.929 -2.6 6.6
Jun-18 2.943 -2.3 7.2 51.517 13.6 7.5 54.460 12.6 7.5 4.871 17.6 11.0
1st Quarter 9.200 0.7 22.4 155.617 15.2 22.6 164.817 14.3 22.6 9.679 4.1 21.9
Jul-18 3.161 24.6 7.7 45.769 8.7 6.7 48.930 9.6 6.7 3.371 103.9 7.6
Aug-18 3.429 16.3 8.3 43.442 1.4 6.3 46.871 2.3 6.4 2.721 -24.1 6.1
Sep-18 3.430 29.3 8.3 46.243 5.0 6.7 49.673 6.4 6.8 3.267 -23.0 7.4
2nd Quarter 10.020 23.1 24.4 135.454 5.0 19.7 145.474 6.1 20.0 9.359 -1.3 21.1
Oct-18 3.183 11.0 7.7 57.041 11.5 8.3 60.224 11.5 8.3 3.250 -6.7 7.3
Nov-18 3.012 -2.7 7.3 59.700 5.7 8.7 62.712 5.3 8.6 3.405 -4.1 7.7
Dec-18 3.516 -7.7 8.5 61.752 1.7 9.0 65.268 1.1 9.0 4.362 -11.6 9.9
3rd Quarter 9.711 -0.6 23.6 178.493 6.0 26.0 188.204 5.7 25.8 11.017 -7.9 24.9
Jan-19 3.795 -8.1 9.2 65.114 3.0 9.5 68.909 2.3 9.5 4.630 -8.6 10.5
Feb-19 3.654 -8.7 8.9 66.024 8.6 9.6 69.678 7.5 9.6 4.599 -3.4 10.4
Mar-19 4.752 -4.4 11.6 86.884 10.3 12.6 91.636 9.4 12.6 4.999 -17.6 11.3
4th Quarter 12.201 -6.9 29.7 218.022 7.5 31.7 230.223 6.6 31.6 14.228 -10.5 32.1
2018-19 41.132 2.5 100.0 687.586 8.2 100.0 728.718 7.9 100.0 44.283 -5.1 100.0
Note: (1) *Growth (%) is calculated over similar period of last year.
(2) **Share (%) is caculated as ratio to yearly production.
Contd….
MonthCoking Coal Non-coking Coal Raw Coal Lignite
25
~ Provisional Coal Statistics 2018-19 ~
Coal Controller's Organisation, 1,Council House Street, Kolkata, W.B., India
TABLE 2.5: MONTHLY PRODUCTION OF DIFFERENT TYPES OF COAL PRODUCTS IN 2018-19
Prdn Growth* Share** Prdn Growth* Share** Prdn Growth* Share** Prdn Growth* Share** Prdn Growth* Share**
(14) (15) (16) (17) (18) (19) (20) (21) (22) (23) (24) (25) (26) (27) (28) (29)
2018-19
Apr-18 0.485 6.6 8.7 1.490 106.1 7.7 0.305 -5.6 8.7 0 - - 1.045 -7.4 8.4
May-18 0.443 -5.1 8.0 1.552 78.8 8.0 0.261 -22.8 7.5 0 - - 1.035 -5.0 8.3
Jun-18 0.418 -8.9 7.5 1.236 3.3 6.4 0.276 -2.8 7.9 0 - - 1.009 -4.8 8.1
1st Quarter 1.346 -2.5 24.2 4.278 53.5 22.1 0.842 -10.9 24.0 0 - - 3.089 -5.8 24.8
Jul-18 0.406 -4.7 7.3 1.162 -8.8 6.0 0.225 -21.3 6.4 0 - - 0.973 -15.2 7.8
Aug-18 0.413 -9.8 7.4 1.462 12.0 7.6 0.298 0.7 8.5 0 - - 1.049 -12.9 8.4
Sep-18 0.383 -15.3 6.9 1.367 20.4 7.1 0.249 -4.6 7.1 0 - - 1.020 -13.2 8.2
2nd Quarter 1.202 -10.0 21.6 3.991 7.5 20.6 0.772 -8.4 22.0 0 - - 3.042 -13.8 24.4
Oct-18 0.455 7.1 8.2 1.687 45.8 8.7 0.302 6.7 8.6 0 - - 1.096 -6.8 8.8
Nov-18 0.451 -5.5 8.1 1.581 12.2 8.2 0.301 4.9 8.6 0 - - 1.073 -7.8 8.6
Dec-18 0.506 0.2 9.1 1.796 72.4 9.3 0.301 9.9 8.6 0 - - 1.020 -8.8 8.2
3rd Quarter 1.412 0.4 25.4 5.064 40.4 26.2 0.904 7.1 25.8 0 - - 3.189 -7.8 25.6
Jan-19 0.526 -3.7 9.4 1.963 51.5 10.1 0.320 8.5 9.1 0 - - 1.102 -9.4 8.9
Feb-19 0.527 -1.7 9.5 1.923 67.1 9.9 0.323 -8.5 9.2 0 - - 0.907 -13.8 7.3
Mar-19 0.557 1.8 10.0 2.144 48.6 11.1 0.341 -12.6 9.7 0 - - 1.114 -16.6 9.0
4th Quarter 1.610 -1.2 28.9 6.030 55.0 31.1 0.984 -5.2 28.1 0 - - 3.123 -13.4 25.1
2018-19 5.570 -3.2 100.0 19.363 38.3 100.0 3.502 -4.6 100.0 0 - - 12.443 -10.3 100.0
Note: (1) *Growth (%) is calculated over similar period of last year.
(2) **Share (%) is caculated as ratio to yearly production.
(3) The above figures relates to Washeries (public & private) of only coal producing companies.
Private washeries ( only washeries, having no coal blocks ) are not included here.
(4) Hard Coke data relate to steel plants only.
MonthWashed Coal(Coking) Washed Coal(N-coking) Middlings(coking) Middlings(N-coking) Hard Coke
( Quantity in Million Tonnes )
26
~ Provisional Coal Statistics 2018-19 ~
Coal Controller's Organisation, 1,Council House Street, Kolkata, W.B., India
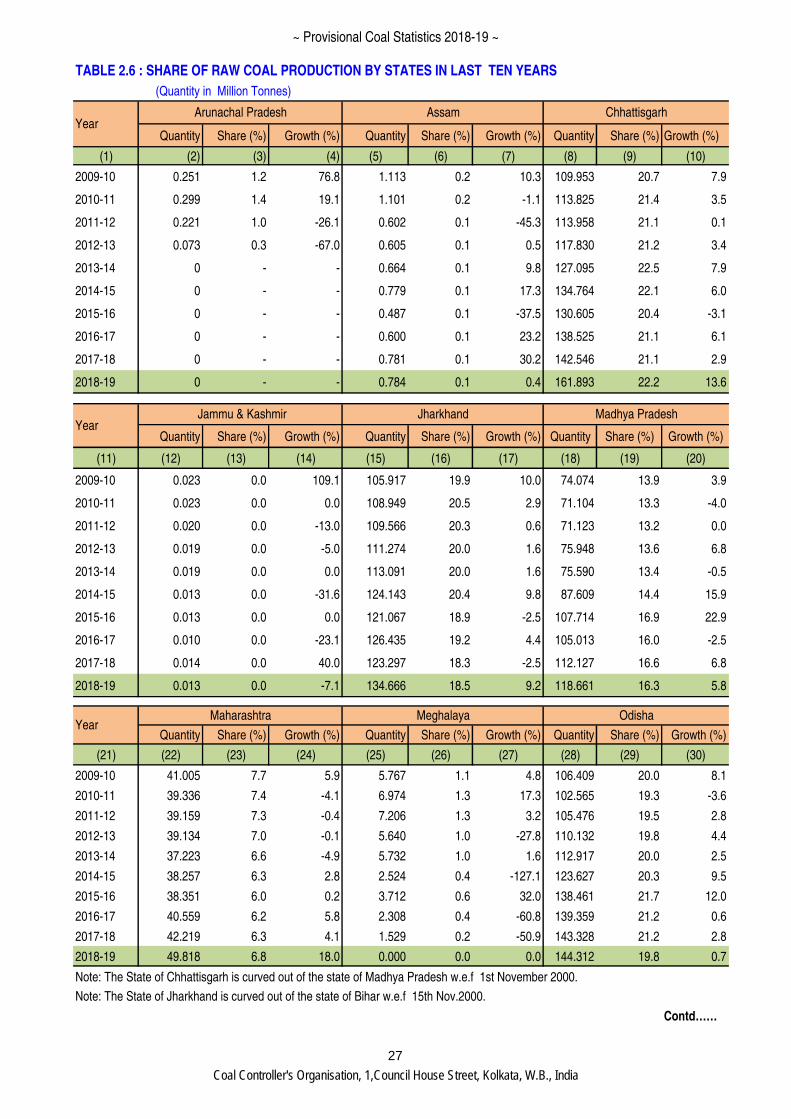
TABLE 2.6 : SHARE OF RAW COAL PRODUCTION BY STATES IN LAST TEN YEARS
(Quantity in Million Tonnes)
Quantity Share (%) Growth (%) Quantity Share (%) Growth (%) Quantity Share (%) Growth (%)
(1) (2) (3) (4) (5) (6) (7) (8) (9) (10)
2009-10 0.251 1.2 76.8 1.113 0.2 10.3 109.953 20.7 7.9
2010-11 0.299 1.4 19.1 1.101 0.2 -1.1 113.825 21.4 3.5
2011-12 0.221 1.0 -26.1 0.602 0.1 -45.3 113.958 21.1 0.1
2012-13 0.073 0.3 -67.0 0.605 0.1 0.5 117.830 21.2 3.4
2013-14 0 - - 0.664 0.1 9.8 127.095 22.5 7.9
2014-15 0 - - 0.779 0.1 17.3 134.764 22.1 6.0
2015-16 0 - - 0.487 0.1 -37.5 130.605 20.4 -3.1
2016-17 0 - - 0.600 0.1 23.2 138.525 21.1 6.1
2017-18 0 - - 0.781 0.1 30.2 142.546 21.1 2.9
2018-19 0 - - 0.784 0.1 0.4 161.893 22.2 13.6
Quantity Share (%) Growth (%) Quantity Share (%) Growth (%) Quantity Share (%) Growth (%)
(11) (12) (13) (14) (15) (16) (17) (18) (19) (20)
2009-10 0.023 0.0 109.1 105.917 19.9 10.0 74.074 13.9 3.9
2010-11 0.023 0.0 0.0 108.949 20.5 2.9 71.104 13.3 -4.0
2011-12 0.020 0.0 -13.0 109.566 20.3 0.6 71.123 13.2 0.0
2012-13 0.019 0.0 -5.0 111.274 20.0 1.6 75.948 13.6 6.8
2013-14 0.019 0.0 0.0 113.091 20.0 1.6 75.590 13.4 -0.5
2014-15 0.013 0.0 -31.6 124.143 20.4 9.8 87.609 14.4 15.9
2015-16 0.013 0.0 0.0 121.067 18.9 -2.5 107.714 16.9 22.9
2016-17 0.010 0.0 -23.1 126.435 19.2 4.4 105.013 16.0 -2.5
2017-18 0.014 0.0 40.0 123.297 18.3 -2.5 112.127 16.6 6.8
2018-19 0.013 0.0 -7.1 134.666 18.5 9.2 118.661 16.3 5.8
Quantity Share (%) Growth (%) Quantity Share (%) Growth (%) Quantity Share (%) Growth (%)
(21) (22) (23) (24) (25) (26) (27) (28) (29) (30)
2009-10 41.005 7.7 5.9 5.767 1.1 4.8 106.409 20.0 8.1
2010-11 39.336 7.4 -4.1 6.974 1.3 17.3 102.565 19.3 -3.6
2011-12 39.159 7.3 -0.4 7.206 1.3 3.2 105.476 19.5 2.8
2012-13 39.134 7.0 -0.1 5.640 1.0 -27.8 110.132 19.8 4.4
2013-14 37.223 6.6 -4.9 5.732 1.0 1.6 112.917 20.0 2.5
2014-15 38.257 6.3 2.8 2.524 0.4 -127.1 123.627 20.3 9.5
2015-16 38.351 6.0 0.2 3.712 0.6 32.0 138.461 21.7 12.0
2016-17 40.559 6.2 5.8 2.308 0.4 -60.8 139.359 21.2 0.6
2017-18 42.219 6.3 4.1 1.529 0.2 -50.9 143.328 21.2 2.8
2018-19 49.818 6.8 18.0 0.000 0.0 0.0 144.312 19.8 0.7
Note: The State of Chhattisgarh is curved out of the state of Madhya Pradesh w.e.f 1st November 2000.
Note: The State of Jharkhand is curved out of the state of Bihar w.e.f 15th Nov.2000.
Contd……
YearMaharashtra Meghalaya Odisha
YearArunachal Pradesh Assam Chhattisgarh
Year Jammu & Kashmir Jharkhand Madhya Pradesh
27
~ Provisional Coal Statistics 2018-19 ~
Coal Controller's Organisation, 1,Council House Street, Kolkata, W.B., India
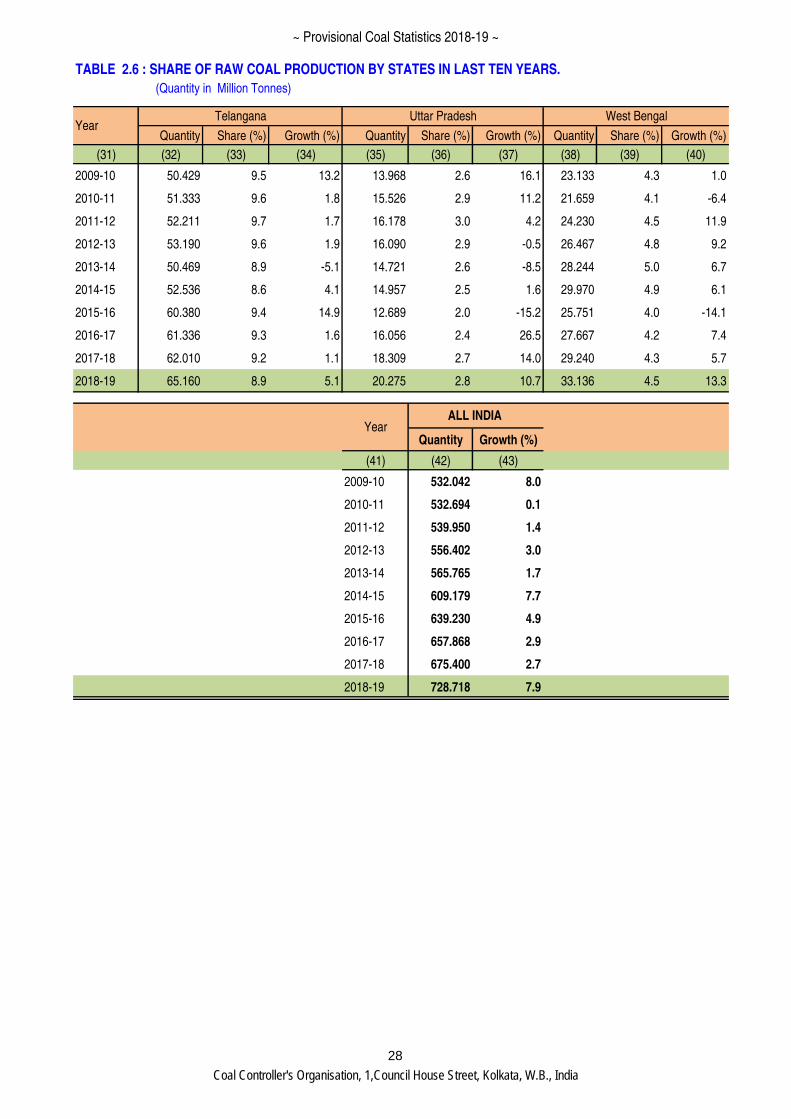
TABLE 2.6 : SHARE OF RAW COAL PRODUCTION BY STATES IN LAST TEN YEARS.
(Quantity in Million Tonnes)
Quantity Share (%) Growth (%) Quantity Share (%) Growth (%) Quantity Share (%) Growth (%)
(31) (32) (33) (34) (35) (36) (37) (38) (39) (40)
2009-10 50.429 9.5 13.2 13.968 2.6 16.1 23.133 4.3 1.0
2010-11 51.333 9.6 1.8 15.526 2.9 11.2 21.659 4.1 -6.4
2011-12 52.211 9.7 1.7 16.178 3.0 4.2 24.230 4.5 11.9
2012-13 53.190 9.6 1.9 16.090 2.9 -0.5 26.467 4.8 9.2
2013-14 50.469 8.9 -5.1 14.721 2.6 -8.5 28.244 5.0 6.7
2014-15 52.536 8.6 4.1 14.957 2.5 1.6 29.970 4.9 6.1
2015-16 60.380 9.4 14.9 12.689 2.0 -15.2 25.751 4.0 -14.1
2016-17 61.336 9.3 1.6 16.056 2.4 26.5 27.667 4.2 7.4
2017-18 62.010 9.2 1.1 18.309 2.7 14.0 29.240 4.3 5.7
2018-19 65.160 8.9 5.1 20.275 2.8 10.7 33.136 4.5 13.3
Quantity Growth (%)
(41) (42) (43)
2009-10 532.042 8.0
2010-11 532.694 0.1
2011-12 539.950 1.4
2012-13 556.402 3.0
2013-14 565.765 1.7
2014-15 609.179 7.7
2015-16 639.230 4.9
2016-17 657.868 2.9
2017-18 675.400 2.7
2018-19 728.718 7.9
YearALL INDIA
YearTelangana Uttar Pradesh West Bengal
28
~ Provisional Coal Statistics 2018-19 ~
Coal Controller's Organisation, 1,Council House Street, Kolkata, W.B., India
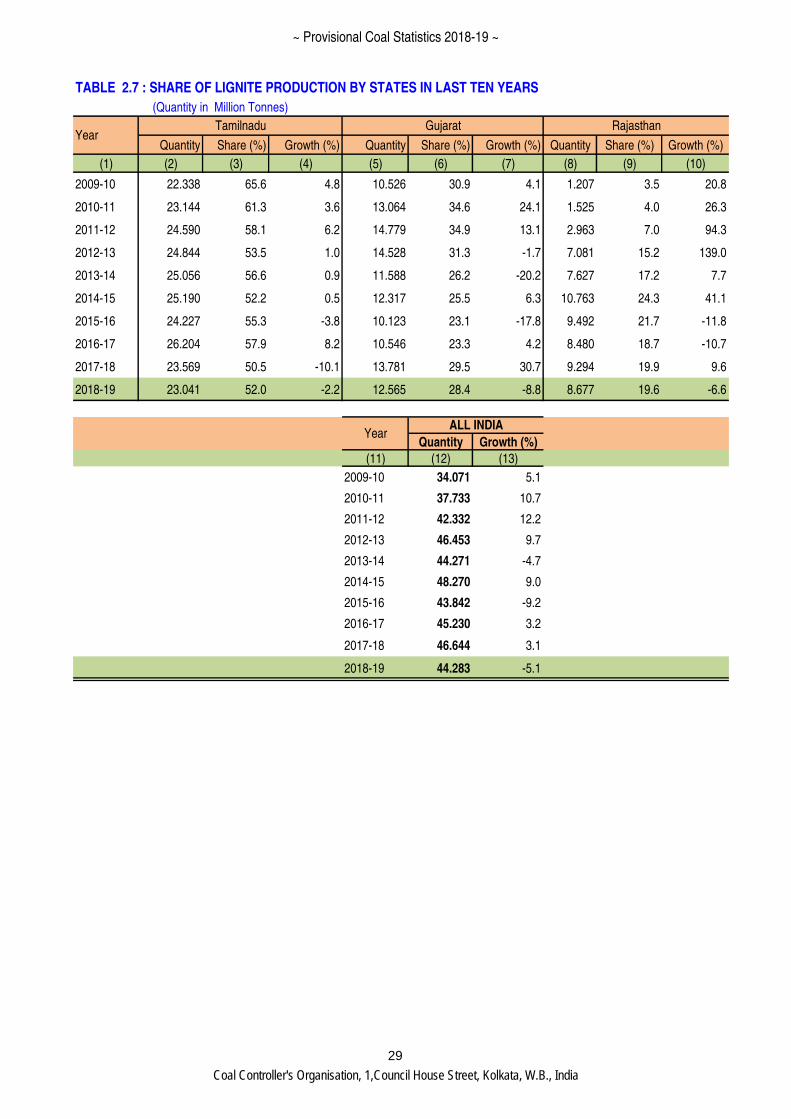
TABLE 2.7 : SHARE OF LIGNITE PRODUCTION BY STATES IN LAST TEN YEARS
(Quantity in Million Tonnes)
Quantity Share (%) Growth (%) Quantity Share (%) Growth (%) Quantity Share (%) Growth (%)
(1) (2) (3) (4) (5) (6) (7) (8) (9) (10)
2009-10 22.338 65.6 4.8 10.526 30.9 4.1 1.207 3.5 20.8
2010-11 23.144 61.3 3.6 13.064 34.6 24.1 1.525 4.0 26.3
2011-12 24.590 58.1 6.2 14.779 34.9 13.1 2.963 7.0 94.3
2012-13 24.844 53.5 1.0 14.528 31.3 -1.7 7.081 15.2 139.0
2013-14 25.056 56.6 0.9 11.588 26.2 -20.2 7.627 17.2 7.7
2014-15 25.190 52.2 0.5 12.317 25.5 6.3 10.763 24.3 41.1
2015-16 24.227 55.3 -3.8 10.123 23.1 -17.8 9.492 21.7 -11.8
2016-17 26.204 57.9 8.2 10.546 23.3 4.2 8.480 18.7 -10.7
2017-18 23.569 50.5 -10.1 13.781 29.5 30.7 9.294 19.9 9.6
2018-19 23.041 52.0 -2.2 12.565 28.4 -8.8 8.677 19.6 -6.6
Quantity Growth (%)
(11) (12) (13)
2009-10 34.071 5.1
2010-11 37.733 10.7
2011-12 42.332 12.2
2012-13 46.453 9.7
2013-14 44.271 -4.7
2014-15 48.270 9.0
2015-16 43.842 -9.2
2016-17 45.230 3.2
2017-18 46.644 3.1
2018-19 44.283 -5.1
YearALL INDIA
YearTamilnadu Gujarat Rajasthan
29
~ Provisional Coal Statistics 2018-19 ~
Coal Controller's Organisation, 1,Council House Street, Kolkata, W.B., India
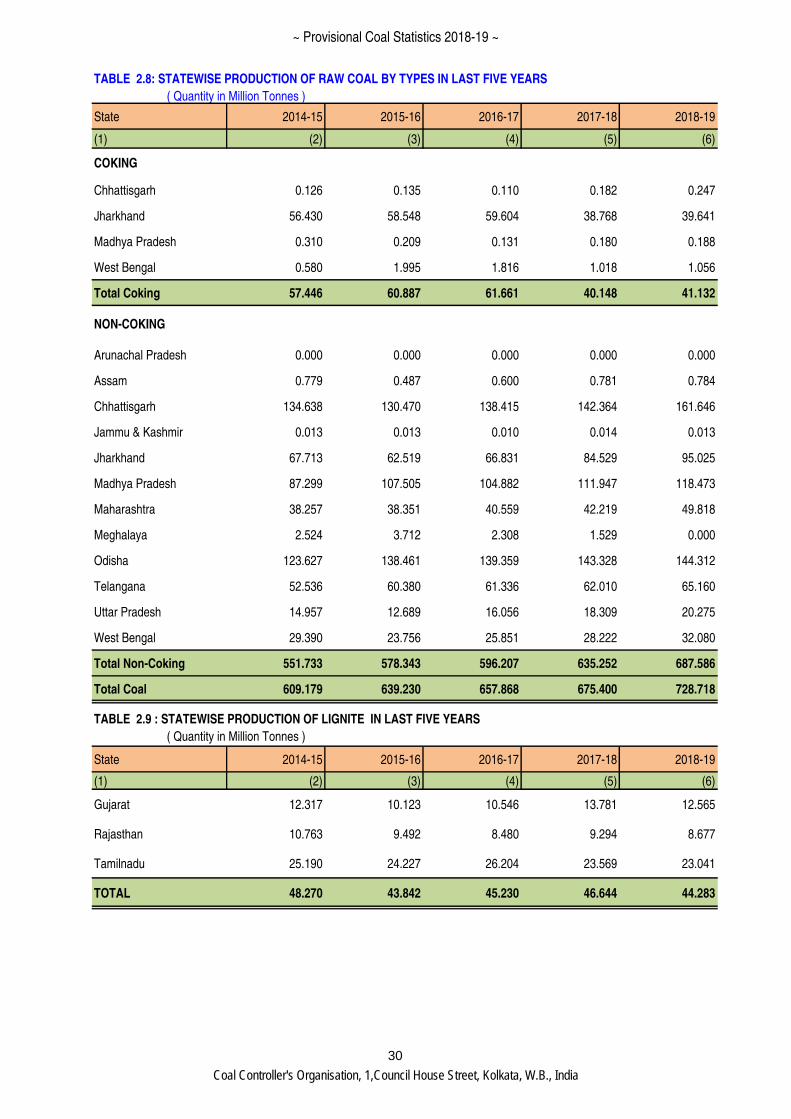
TABLE 2.8: STATEWISE PRODUCTION OF RAW COAL BY TYPES IN LAST FIVE YEARS
( Quantity in Million Tonnes )
State 2014-15 2015-16 2016-17 2017-18 2018-19
(1) (2) (3) (4) (5) (6)
COKING
Chhattisgarh 0.126 0.135 0.110 0.182 0.247
Jharkhand 56.430 58.548 59.604 38.768 39.641
Madhya Pradesh 0.310 0.209 0.131 0.180 0.188
West Bengal 0.580 1.995 1.816 1.018 1.056
Total Coking 57.446 60.887 61.661 40.148 41.132
NON-COKING
Arunachal Pradesh 0.000 0.000 0.000 0.000 0.000
Assam 0.779 0.487 0.600 0.781 0.784
Chhattisgarh 134.638 130.470 138.415 142.364 161.646
Jammu & Kashmir 0.013 0.013 0.010 0.014 0.013
Jharkhand 67.713 62.519 66.831 84.529 95.025
Madhya Pradesh 87.299 107.505 104.882 111.947 118.473
Maharashtra 38.257 38.351 40.559 42.219 49.818
Meghalaya 2.524 3.712 2.308 1.529 0.000
Odisha 123.627 138.461 139.359 143.328 144.312
Telangana 52.536 60.380 61.336 62.010 65.160
Uttar Pradesh 14.957 12.689 16.056 18.309 20.275
West Bengal 29.390 23.756 25.851 28.222 32.080
Total Non-Coking 551.733 578.343 596.207 635.252 687.586
Total Coal 609.179 639.230 657.868 675.400 728.718
TABLE 2.9 : STATEWISE PRODUCTION OF LIGNITE IN LAST FIVE YEARS
( Quantity in Million Tonnes )
State 2014-15 2015-16 2016-17 2017-18 2018-19
(1) (2) (3) (4) (5) (6)
Gujarat 12.317 10.123 10.546 13.781 12.565
Rajasthan 10.763 9.492 8.480 9.294 8.677
Tamilnadu 25.190 24.227 26.204 23.569 23.041
TOTAL 48.270 43.842 45.230 46.644 44.283
30
~ Provisional Coal Statistics 2018-19 ~
Coal Controller's Organisation, 1,Council House Street, Kolkata, W.B., India
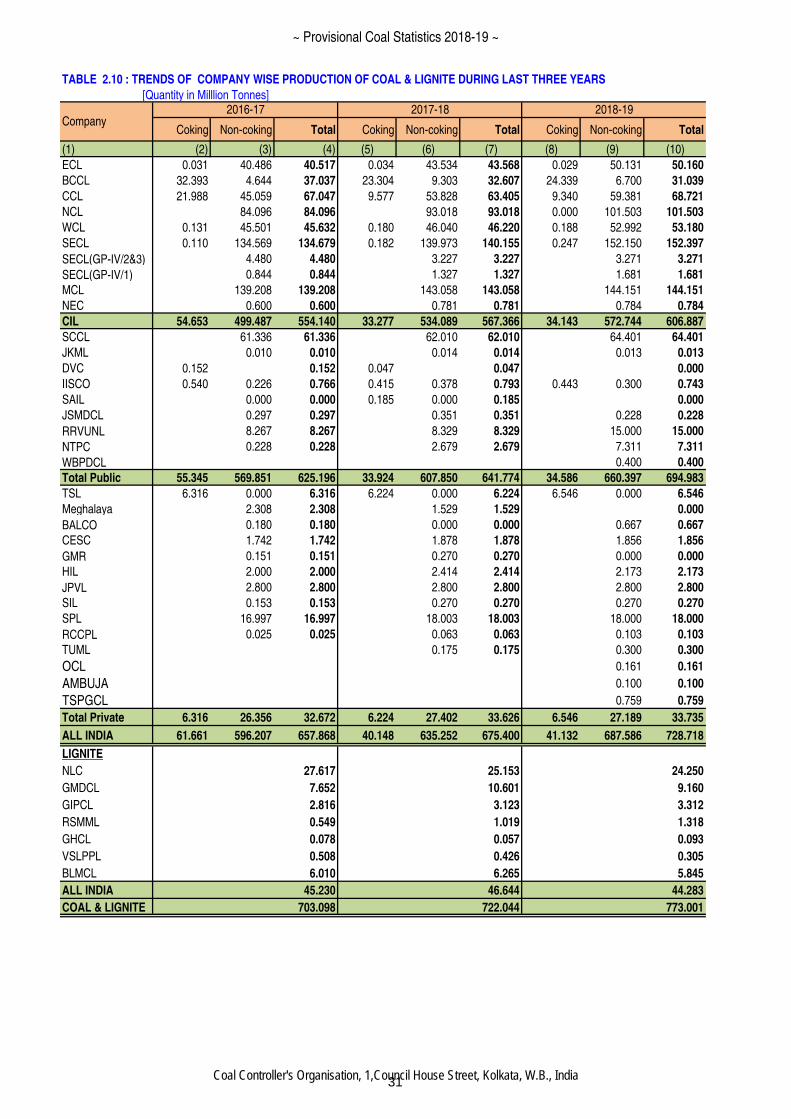
TABLE 2.10 : TRENDS OF COMPANY WISE PRODUCTION OF COAL & LIGNITE DURING LAST THREE YEARS
[Quantity in Milllion Tonnes]
Coking Non-coking Total Coking Non-coking Total Coking Non-coking Total
(1) (2) (3) (4) (5) (6) (7) (8) (9) (10)
ECL 0.031 40.486 40.517 0.034 43.534 43.568 0.029 50.131 50.160
BCCL 32.393 4.644 37.037 23.304 9.303 32.607 24.339 6.700 31.039
CCL 21.988 45.059 67.047 9.577 53.828 63.405 9.340 59.381 68.721
NCL 84.096 84.096 93.018 93.018 0.000 101.503 101.503
WCL 0.131 45.501 45.632 0.180 46.040 46.220 0.188 52.992 53.180
SECL 0.110 134.569 134.679 0.182 139.973 140.155 0.247 152.150 152.397
SECL(GP-IV/2&3) 4.480 4.480 3.227 3.227 3.271 3.271
SECL(GP-IV/1) 0.844 0.844 1.327 1.327 1.681 1.681
MCL 139.208 139.208 143.058 143.058 144.151 144.151
NEC 0.600 0.600 0.781 0.781 0.784 0.784
CIL 54.653 499.487 554.140 33.277 534.089 567.366 34.143 572.744 606.887
SCCL 61.336 61.336 62.010 62.010 64.401 64.401
JKML 0.010 0.010 0.014 0.014 0.013 0.013
DVC 0.152 0.152 0.047 0.047 0.000
IISCO 0.540 0.226 0.766 0.415 0.378 0.793 0.443 0.300 0.743
SAIL 0.000 0.000 0.185 0.000 0.185 0.000
JSMDCL 0.297 0.297 0.351 0.351 0.228 0.228
RRVUNL 8.267 8.267 8.329 8.329 15.000 15.000
NTPC 0.228 0.228 2.679 2.679 7.311 7.311
WBPDCL 0.400 0.400
Total Public 55.345 569.851 625.196 33.924 607.850 641.774 34.586 660.397 694.983
TSL 6.316 0.000 6.316 6.224 0.000 6.224 6.546 0.000 6.546
Meghalaya 2.308 2.308 1.529 1.529 0.000
BALCO 0.180 0.180 0.000 0.000 0.667 0.667
CESC 1.742 1.742 1.878 1.878 1.856 1.856
GMR 0.151 0.151 0.270 0.270 0.000 0.000
HIL 2.000 2.000 2.414 2.414 2.173 2.173
JPVL 2.800 2.800 2.800 2.800 2.800 2.800
SIL 0.153 0.153 0.270 0.270 0.270 0.270
SPL 16.997 16.997 18.003 18.003 18.000 18.000
RCCPL 0.025 0.025 0.063 0.063 0.103 0.103
TUML 0.175 0.175 0.300 0.300
OCL 0.161 0.161
AMBUJA 0.100 0.100
TSPGCL 0.759 0.759
Total Private 6.316 26.356 32.672 6.224 27.402 33.626 6.546 27.189 33.735
ALL INDIA 61.661 596.207 657.868 40.148 635.252 675.400 41.132 687.586 728.718
LIGNITE
NLC 27.617 25.153 24.250
GMDCL 7.652 10.601 9.160
GIPCL 2.816 3.123 3.312
RSMML 0.549 1.019 1.318
GHCL 0.078 0.057 0.093
VSLPPL 0.508 0.426 0.305
BLMCL 6.010 6.265 5.845
ALL INDIA 45.230 46.644 44.283
COAL & LIGNITE 703.098 722.044 773.001
2018-19Company
2017-182016-17
31
~ Provisional Coal Statistics 2018-19 ~
Coal Controller's Organisation, 1,Council House Street, Kolkata, W.B., India
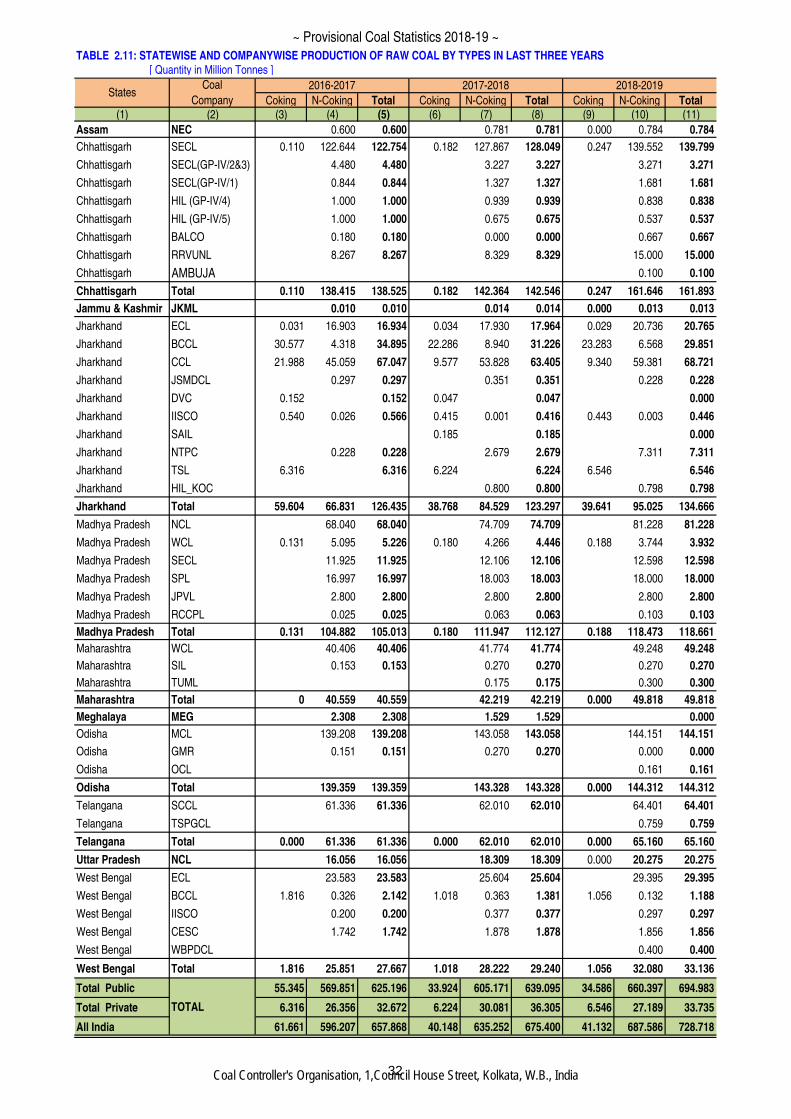
TABLE 2.11: STATEWISE AND COMPANYWISE PRODUCTION OF RAW COAL BY TYPES IN LAST THREE YEARS
[ Quantity in Million Tonnes ]
Coking N-Coking Total Coking N-Coking Total Coking N-Coking Total
(1) (2) (3) (4) (5) (6) (7) (8) (9) (10) (11)
Assam NEC 0.600 0.600 0.781 0.781 0.000 0.784 0.784
Chhattisgarh SECL 0.110 122.644 122.754 0.182 127.867 128.049 0.247 139.552 139.799
Chhattisgarh SECL(GP-IV/2&3) 4.480 4.480 3.227 3.227 3.271 3.271
Chhattisgarh SECL(GP-IV/1) 0.844 0.844 1.327 1.327 1.681 1.681
Chhattisgarh HIL (GP-IV/4) 1.000 1.000 0.939 0.939 0.838 0.838
Chhattisgarh HIL (GP-IV/5) 1.000 1.000 0.675 0.675 0.537 0.537
Chhattisgarh BALCO 0.180 0.180 0.000 0.000 0.667 0.667
Chhattisgarh RRVUNL 8.267 8.267 8.329 8.329 15.000 15.000
Chhattisgarh AMBUJA 0.100 0.100
Chhattisgarh Total 0.110 138.415 138.525 0.182 142.364 142.546 0.247 161.646 161.893
Jammu & Kashmir JKML 0.010 0.010 0.014 0.014 0.000 0.013 0.013
Jharkhand ECL 0.031 16.903 16.934 0.034 17.930 17.964 0.029 20.736 20.765
Jharkhand BCCL 30.577 4.318 34.895 22.286 8.940 31.226 23.283 6.568 29.851
Jharkhand CCL 21.988 45.059 67.047 9.577 53.828 63.405 9.340 59.381 68.721
Jharkhand JSMDCL 0.297 0.297 0.351 0.351 0.228 0.228
Jharkhand DVC 0.152 0.152 0.047 0.047 0.000
Jharkhand IISCO 0.540 0.026 0.566 0.415 0.001 0.416 0.443 0.003 0.446
Jharkhand SAIL 0.185 0.185 0.000
Jharkhand NTPC 0.228 0.228 2.679 2.679 7.311 7.311
Jharkhand TSL 6.316 6.316 6.224 6.224 6.546 6.546
Jharkhand HIL_KOC 0.800 0.800 0.798 0.798
Jharkhand Total 59.604 66.831 126.435 38.768 84.529 123.297 39.641 95.025 134.666
Madhya Pradesh NCL 68.040 68.040 74.709 74.709 81.228 81.228
Madhya Pradesh WCL 0.131 5.095 5.226 0.180 4.266 4.446 0.188 3.744 3.932
Madhya Pradesh SECL 11.925 11.925 12.106 12.106 12.598 12.598
Madhya Pradesh SPL 16.997 16.997 18.003 18.003 18.000 18.000
Madhya Pradesh JPVL 2.800 2.800 2.800 2.800 2.800 2.800
Madhya Pradesh RCCPL 0.025 0.025 0.063 0.063 0.103 0.103
Madhya Pradesh Total 0.131 104.882 105.013 0.180 111.947 112.127 0.188 118.473 118.661
Maharashtra WCL 40.406 40.406 41.774 41.774 49.248 49.248
Maharashtra SIL 0.153 0.153 0.270 0.270 0.270 0.270
Maharashtra TUML 0.175 0.175 0.300 0.300
Maharashtra Total 0 40.559 40.559 42.219 42.219 0.000 49.818 49.818
Meghalaya MEG 2.308 2.308 1.529 1.529 0.000
Odisha MCL 139.208 139.208 143.058 143.058 144.151 144.151
Odisha GMR 0.151 0.151 0.270 0.270 0.000 0.000
Odisha OCL 0.161 0.161
Odisha Total 139.359 139.359 143.328 143.328 0.000 144.312 144.312
Telangana SCCL 61.336 61.336 62.010 62.010 64.401 64.401
Telangana TSPGCL 0.759 0.759
Telangana Total 0.000 61.336 61.336 0.000 62.010 62.010 0.000 65.160 65.160
Uttar Pradesh NCL 16.056 16.056 18.309 18.309 0.000 20.275 20.275
West Bengal ECL 23.583 23.583 25.604 25.604 29.395 29.395
West Bengal BCCL 1.816 0.326 2.142 1.018 0.363 1.381 1.056 0.132 1.188
West Bengal IISCO 0.200 0.200 0.377 0.377 0.297 0.297
West Bengal CESC 1.742 1.742 1.878 1.878 1.856 1.856
West Bengal WBPDCL 0.400 0.400
West Bengal Total 1.816 25.851 27.667 1.018 28.222 29.240 1.056 32.080 33.136
Total Public 55.345 569.851 625.196 33.924 605.171 639.095 34.586 660.397 694.983
Total Private 6.316 26.356 32.672 6.224 30.081 36.305 6.546 27.189 33.735
All India 61.661 596.207 657.868 40.148 635.252 675.400 41.132 687.586 728.718
TOTAL
2018-20192016-2017 2017-2018States
Coal
Company
32
~ Provisional Coal Statistics 2018-19 ~
Coal Controller's Organisation, 1,Council House Street, Kolkata, W.B., India
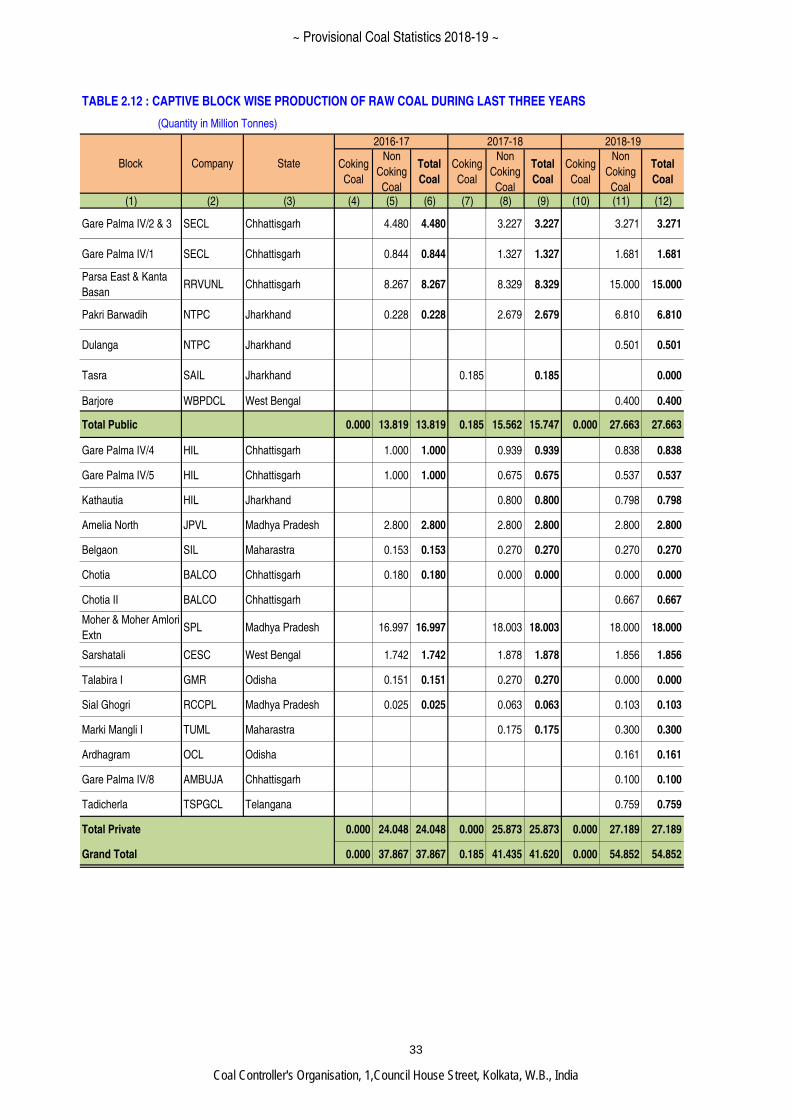
TABLE 2.12 : CAPTIVE BLOCK WISE PRODUCTION OF RAW COAL DURING LAST THREE YEARS
(Quantity in Million Tonnes)
Coking
Coal
Non
Coking
Coal
Total
Coal
Coking
Coal
Non
Coking
Coal
Total
Coal
Coking
Coal
Non
Coking
Coal
Total
Coal
(1) (2) (3) (4) (5) (6) (7) (8) (9) (10) (11) (12)
Gare Palma IV/2 & 3 SECL Chhattisgarh 4.480 4.480 3.227 3.227 3.271 3.271
Gare Palma IV/1 SECL Chhattisgarh 0.844 0.844 1.327 1.327 1.681 1.681
Parsa East & Kanta
BasanRRVUNL Chhattisgarh 8.267 8.267 8.329 8.329 15.000 15.000
Pakri Barwadih NTPC Jharkhand 0.228 0.228 2.679 2.679 6.810 6.810
Dulanga NTPC Jharkhand 0.501 0.501
Tasra SAIL Jharkhand 0.185 0.185 0.000
Barjore WBPDCL West Bengal 0.400 0.400
Total Public 0.000 13.819 13.819 0.185 15.562 15.747 0.000 27.663 27.663
Gare Palma IV/4 HIL Chhattisgarh 1.000 1.000 0.939 0.939 0.838 0.838
Gare Palma IV/5 HIL Chhattisgarh 1.000 1.000 0.675 0.675 0.537 0.537
Kathautia HIL Jharkhand 0.800 0.800 0.798 0.798
Amelia North JPVL Madhya Pradesh 2.800 2.800 2.800 2.800 2.800 2.800
Belgaon SIL Maharastra 0.153 0.153 0.270 0.270 0.270 0.270
Chotia BALCO Chhattisgarh 0.180 0.180 0.000 0.000 0.000 0.000
Chotia II BALCO Chhattisgarh 0.667 0.667
Moher & Moher Amlori
ExtnSPL Madhya Pradesh 16.997 16.997 18.003 18.003 18.000 18.000
Sarshatali CESC West Bengal 1.742 1.742 1.878 1.878 1.856 1.856
Talabira I GMR Odisha 0.151 0.151 0.270 0.270 0.000 0.000
Sial Ghogri RCCPL Madhya Pradesh 0.025 0.025 0.063 0.063 0.103 0.103
Marki Mangli I TUML Maharastra 0.175 0.175 0.300 0.300
Ardhagram OCL Odisha 0.161 0.161
Gare Palma IV/8 AMBUJA Chhattisgarh 0.100 0.100
Tadicherla TSPGCL Telangana 0.759 0.759
Total Private 0.000 24.048 24.048 0.000 25.873 25.873 0.000 27.189 27.189
Grand Total 0.000 37.867 37.867 0.185 41.435 41.620 0.000 54.852 54.852
2017-18 2018-19
Block Company State
2016-17
33
~ Provisional Coal Statistics 2018-19 ~
Coal Controller's Organisation, 1,Council House Street, Kolkata, W.B., India
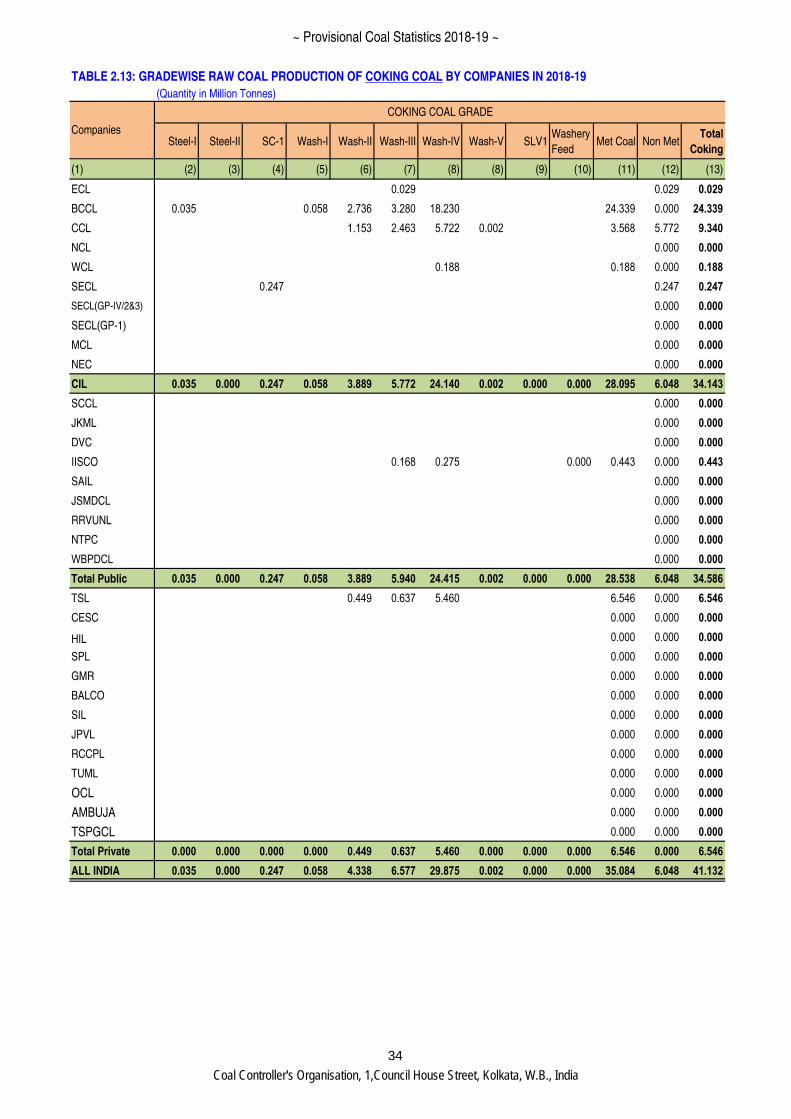
TABLE 2.13: GRADEWISE RAW COAL PRODUCTION OF COKING COAL BY COMPANIES IN 2018-19
(Quantity in Million Tonnes)
Steel-I Steel-II SC-1 Wash-I Wash-II Wash-III Wash-IV Wash-V SLV1Washery
FeedMet Coal Non Met
Total
Coking
(1) (2) (3) (4) (5) (6) (7) (8) (8) (9) (10) (11) (12) (13)
ECL 0.029 0.029 0.029
BCCL 0.035 0.058 2.736 3.280 18.230 24.339 0.000 24.339
CCL 1.153 2.463 5.722 0.002 3.568 5.772 9.340
NCL 0.000 0.000
WCL 0.188 0.188 0.000 0.188
SECL 0.247 0.247 0.247
SECL(GP-IV/2&3) 0.000 0.000
SECL(GP-1) 0.000 0.000
MCL 0.000 0.000
NEC 0.000 0.000
CIL 0.035 0.000 0.247 0.058 3.889 5.772 24.140 0.002 0.000 0.000 28.095 6.048 34.143
SCCL 0.000 0.000
JKML 0.000 0.000
DVC 0.000 0.000
IISCO 0.168 0.275 0.000 0.443 0.000 0.443
SAIL 0.000 0.000
JSMDCL 0.000 0.000
RRVUNL 0.000 0.000
NTPC 0.000 0.000
WBPDCL 0.000 0.000
Total Public 0.035 0.000 0.247 0.058 3.889 5.940 24.415 0.002 0.000 0.000 28.538 6.048 34.586
TSL 0.449 0.637 5.460 6.546 0.000 6.546
CESC 0.000 0.000 0.000
HIL 0.000 0.000 0.000
SPL 0.000 0.000 0.000
GMR 0.000 0.000 0.000
BALCO 0.000 0.000 0.000
SIL 0.000 0.000 0.000
JPVL 0.000 0.000 0.000
RCCPL 0.000 0.000 0.000
TUML 0.000 0.000 0.000
OCL 0.000 0.000 0.000
AMBUJA 0.000 0.000 0.000
TSPGCL 0.000 0.000 0.000
Total Private 0.000 0.000 0.000 0.000 0.449 0.637 5.460 0.000 0.000 0.000 6.546 0.000 6.546
ALL INDIA 0.035 0.000 0.247 0.058 4.338 6.577 29.875 0.002 0.000 0.000 35.084 6.048 41.132
Companies
COKING COAL GRADE
34
~ Provisional Coal Statistics 2018-19 ~
Coal Controller's Organisation, 1,Council House Street, Kolkata, W.B., India
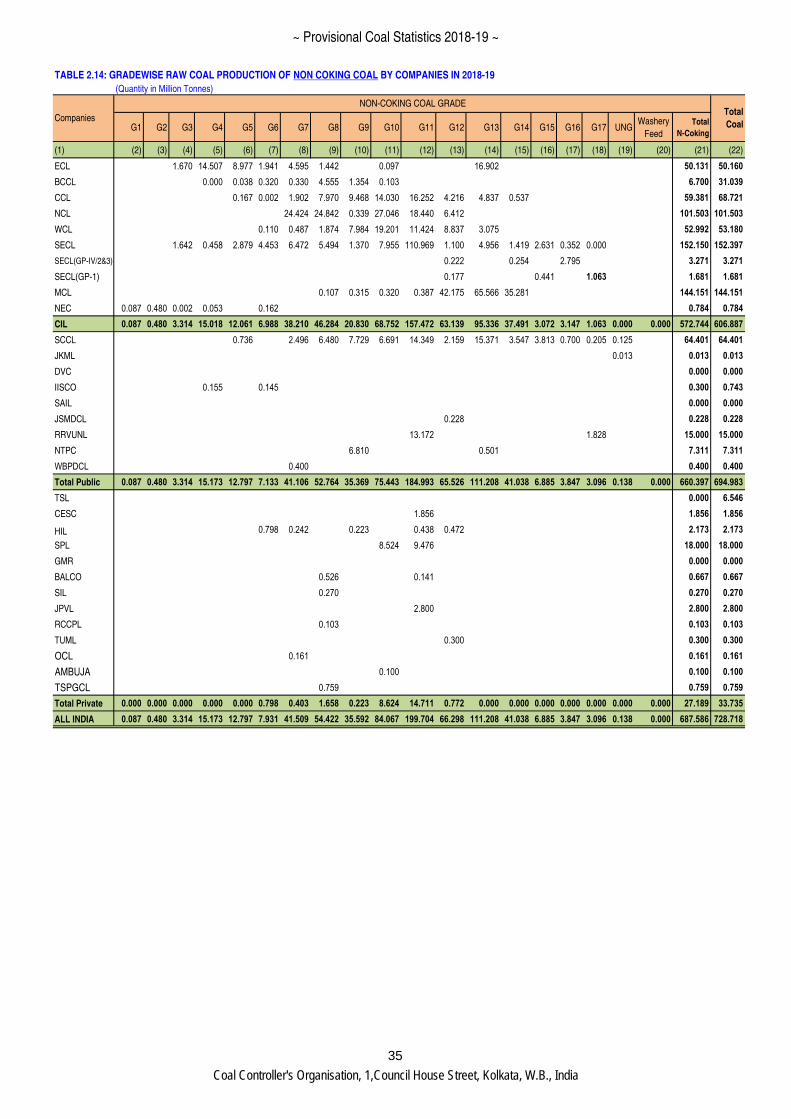
TABLE 2.14: GRADEWISE RAW COAL PRODUCTION OF NON COKING COAL BY COMPANIES IN 2018-19
(Quantity in Million Tonnes)
G1 G2 G3 G4 G5 G6 G7 G8 G9 G10 G11 G12 G13 G14 G15 G16 G17 UNGWashery
Feed
Total
N-Coking
(1) (2) (3) (4) (5) (6) (7) (8) (9) (10) (11) (12) (13) (14) (15) (16) (17) (18) (19) (20) (21) (22)
ECL 1.670 14.507 8.977 1.941 4.595 1.442 0.097 16.902 50.131 50.160
BCCL 0.000 0.038 0.320 0.330 4.555 1.354 0.103 6.700 31.039
CCL 0.167 0.002 1.902 7.970 9.468 14.030 16.252 4.216 4.837 0.537 59.381 68.721
NCL 24.424 24.842 0.339 27.046 18.440 6.412 101.503 101.503
WCL 0.110 0.487 1.874 7.984 19.201 11.424 8.837 3.075 52.992 53.180
SECL 1.642 0.458 2.879 4.453 6.472 5.494 1.370 7.955 110.969 1.100 4.956 1.419 2.631 0.352 0.000 152.150 152.397
SECL(GP-IV/2&3) 0.222 0.254 2.795 3.271 3.271
SECL(GP-1) 0.177 0.441 1.063 1.681 1.681
MCL 0.107 0.315 0.320 0.387 42.175 65.566 35.281 144.151 144.151
NEC 0.087 0.480 0.002 0.053 0.162 0.784 0.784
CIL 0.087 0.480 3.314 15.018 12.061 6.988 38.210 46.284 20.830 68.752 157.472 63.139 95.336 37.491 3.072 3.147 1.063 0.000 0.000 572.744 606.887
SCCL 0.736 2.496 6.480 7.729 6.691 14.349 2.159 15.371 3.547 3.813 0.700 0.205 0.125 64.401 64.401
JKML 0.013 0.013 0.013
DVC 0.000 0.000
IISCO 0.155 0.145 0.300 0.743
SAIL 0.000 0.000
JSMDCL 0.228 0.228 0.228
RRVUNL 13.172 1.828 15.000 15.000
NTPC 6.810 0.501 7.311 7.311
WBPDCL 0.400 0.400 0.400
Total Public 0.087 0.480 3.314 15.173 12.797 7.133 41.106 52.764 35.369 75.443 184.993 65.526 111.208 41.038 6.885 3.847 3.096 0.138 0.000 660.397 694.983
TSL 0.000 6.546
CESC 1.856 1.856 1.856
HIL 0.798 0.242 0.223 0.438 0.472 2.173 2.173
SPL 8.524 9.476 18.000 18.000
GMR 0.000 0.000
BALCO 0.526 0.141 0.667 0.667
SIL 0.270 0.270 0.270
JPVL 2.800 2.800 2.800
RCCPL 0.103 0.103 0.103
TUML 0.300 0.300 0.300
OCL 0.161 0.161 0.161
AMBUJA 0.100 0.100 0.100
TSPGCL 0.759 0.759 0.759
Total Private 0.000 0.000 0.000 0.000 0.000 0.798 0.403 1.658 0.223 8.624 14.711 0.772 0.000 0.000 0.000 0.000 0.000 0.000 0.000 27.189 33.735
ALL INDIA 0.087 0.480 3.314 15.173 12.797 7.931 41.509 54.422 35.592 84.067 199.704 66.298 111.208 41.038 6.885 3.847 3.096 0.138 0.000 687.586 728.718
Companies
NON-COKING COAL GRADETotal
Coal
35
~ Provisional Coal Statistics 2018-19 ~
Coal Controller's Organisation, 1,Council House Street, Kolkata, W.B., India
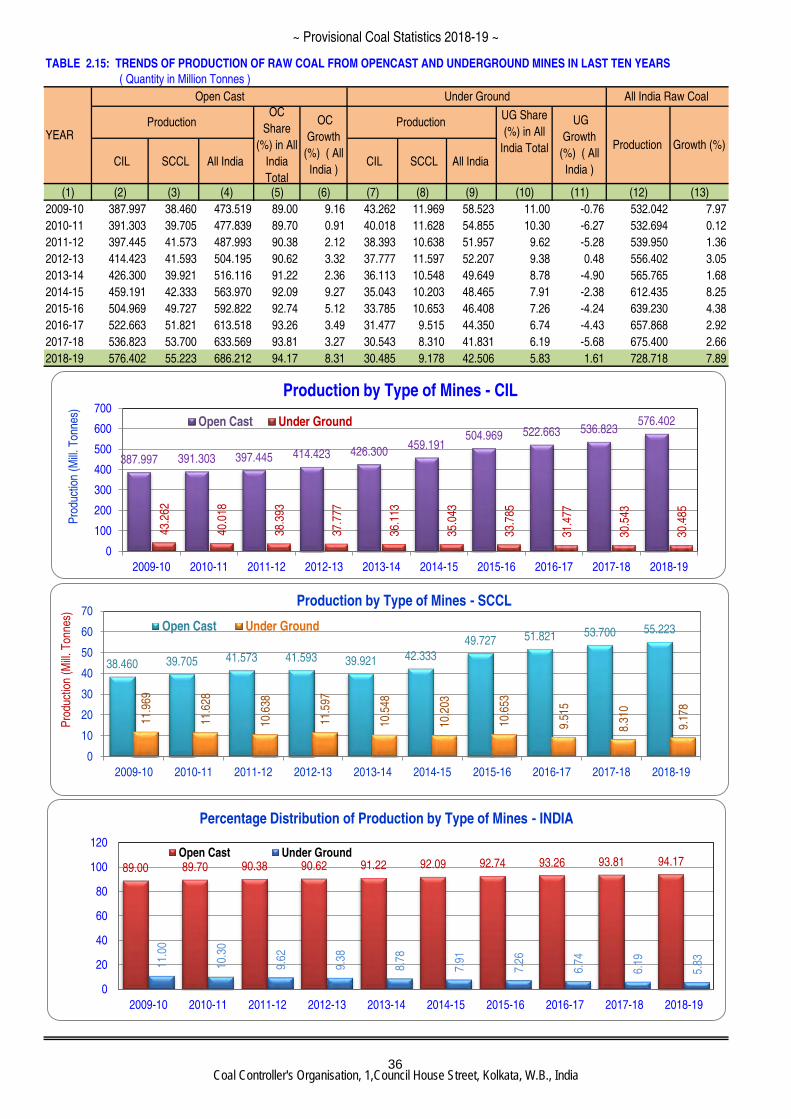
TABLE 2.15: TRENDS OF PRODUCTION OF RAW COAL FROM OPENCAST AND UNDERGROUND MINES IN LAST TEN YEARS
( Quantity in Million Tonnes )
CIL SCCL All India CIL SCCL All India
(1) (2) (3) (4) (5) (6) (7) (8) (9) (10) (11) (12) (13)
2009-10 387.997 38.460 473.519 89.00 9.16 43.262 11.969 58.523 11.00 -0.76 532.042 7.97
2010-11 391.303 39.705 477.839 89.70 0.91 40.018 11.628 54.855 10.30 -6.27 532.694 0.12
2011-12 397.445 41.573 487.993 90.38 2.12 38.393 10.638 51.957 9.62 -5.28 539.950 1.36
2012-13 414.423 41.593 504.195 90.62 3.32 37.777 11.597 52.207 9.38 0.48 556.402 3.05
2013-14 426.300 39.921 516.116 91.22 2.36 36.113 10.548 49.649 8.78 -4.90 565.765 1.68
2014-15 459.191 42.333 563.970 92.09 9.27 35.043 10.203 48.465 7.91 -2.38 612.435 8.25
2015-16 504.969 49.727 592.822 92.74 5.12 33.785 10.653 46.408 7.26 -4.24 639.230 4.38
2016-17 522.663 51.821 613.518 93.26 3.49 31.477 9.515 44.350 6.74 -4.43 657.868 2.92
2017-18 536.823 53.700 633.569 93.81 3.27 30.543 8.310 41.831 6.19 -5.68 675.400 2.66
2018-19 576.402 55.223 686.212 94.17 8.31 30.485 9.178 42.506 5.83 1.61 728.718 7.89
UG
Growth
(%) ( All
India )
Production Growth (%)YEAR
Open Cast Under Ground All India Raw Coal
Production OC
Share
(%) in All
India
Total
OC
Growth
(%) ( All
India )
Production UG Share
(%) in All
India Total
387.997 391.303 397.445 414.423 426.300 459.191
504.969 522.663 536.823 576.402
43.2
62
40.0
18
38.3
93
37.7
77
36.1
13
35.0
43
33.7
85
31.4
77
30.5
43
30.4
85
0
100
200
300
400
500
600
700
2009-10 2010-11 2011-12 2012-13 2013-14 2014-15 2015-16 2016-17 2017-18 2018-19
Pro
duct
ion
(Mill
. Ton
nes)
Production by Type of Mines - CIL
Open Cast Under Ground
89.00 89.70 90.38 90.62 91.22 92.09 92.74 93.26 93.81 94.17
11.0
0
10.3
0
9.62
9.38
8.78
7.91
7.26
6.74
6.19
5.83
0
20
40
60
80
100
120
2009-10 2010-11 2011-12 2012-13 2013-14 2014-15 2015-16 2016-17 2017-18 2018-19
Percentage Distribution of Production by Type of Mines - INDIA
Open Cast Under Ground
38.460 39.705 41.573 41.593 39.921 42.333
49.727 51.821 53.700 55.223
11.9
69
11.6
28
10.6
38
11.5
97
10.5
48
10.2
03
10.6
53
9.51
5
8.31
0
9.17
8
0
10
20
30
40
50
60
70
2009-10 2010-11 2011-12 2012-13 2013-14 2014-15 2015-16 2016-17 2017-18 2018-19
Pro
duct
ion
(Mill
. Ton
nes)
Production by Type of Mines - SCCL
Open Cast Under Ground
36
~ Provisional Coal Statistics 2018-19 ~
Coal Controller's Organisation, 1,Council House Street, Kolkata, W.B., India
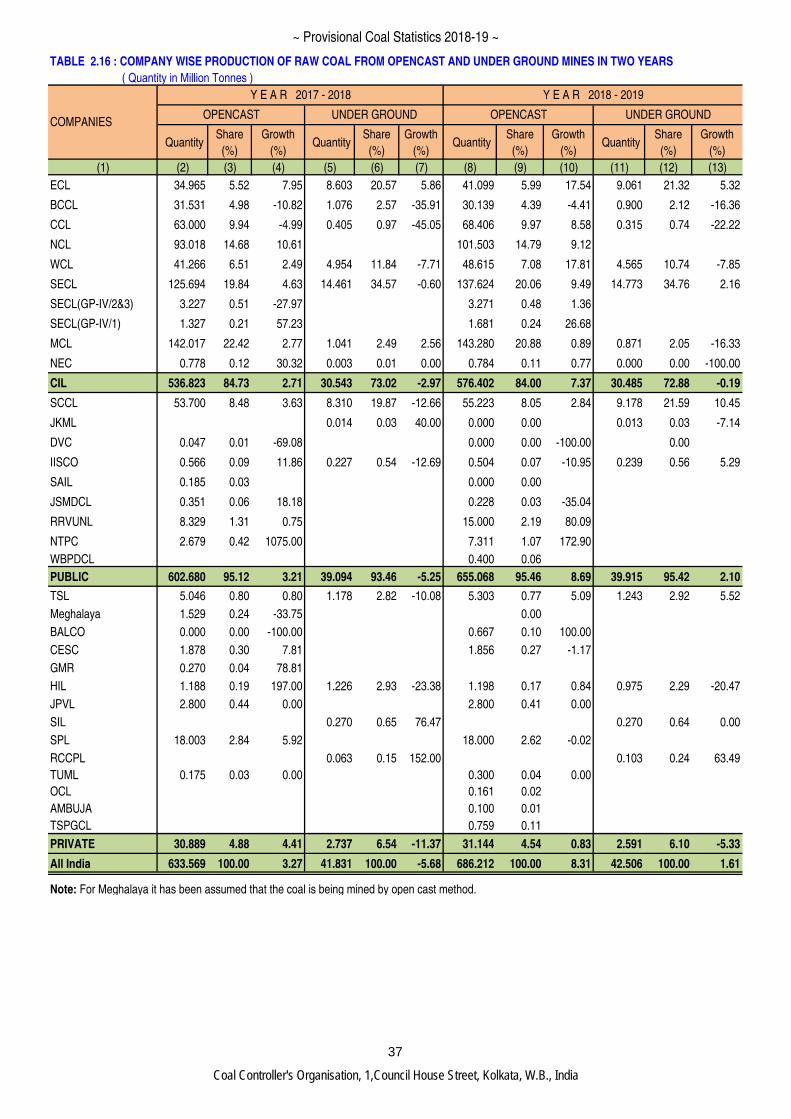
TABLE 2.16 : COMPANY WISE PRODUCTION OF RAW COAL FROM OPENCAST AND UNDER GROUND MINES IN TWO YEARS
( Quantity in Million Tonnes )
QuantityShare
(%)
Growth
(%) Quantity
Share
(%)
Growth
(%) Quantity
Share
(%)
Growth
(%) Quantity
Share
(%)
Growth
(%)
(1) (2) (3) (4) (5) (6) (7) (8) (9) (10) (11) (12) (13)
ECL 34.965 5.52 7.95 8.603 20.57 5.86 41.099 5.99 17.54 9.061 21.32 5.32
BCCL 31.531 4.98 -10.82 1.076 2.57 -35.91 30.139 4.39 -4.41 0.900 2.12 -16.36
CCL 63.000 9.94 -4.99 0.405 0.97 -45.05 68.406 9.97 8.58 0.315 0.74 -22.22
NCL 93.018 14.68 10.61 101.503 14.79 9.12
WCL 41.266 6.51 2.49 4.954 11.84 -7.71 48.615 7.08 17.81 4.565 10.74 -7.85
SECL 125.694 19.84 4.63 14.461 34.57 -0.60 137.624 20.06 9.49 14.773 34.76 2.16
SECL(GP-IV/2&3) 3.227 0.51 -27.97 3.271 0.48 1.36
SECL(GP-IV/1) 1.327 0.21 57.23 1.681 0.24 26.68
MCL 142.017 22.42 2.77 1.041 2.49 2.56 143.280 20.88 0.89 0.871 2.05 -16.33
NEC 0.778 0.12 30.32 0.003 0.01 0.00 0.784 0.11 0.77 0.000 0.00 -100.00
CIL 536.823 84.73 2.71 30.543 73.02 -2.97 576.402 84.00 7.37 30.485 72.88 -0.19
SCCL 53.700 8.48 3.63 8.310 19.87 -12.66 55.223 8.05 2.84 9.178 21.59 10.45
JKML 0.014 0.03 40.00 0.000 0.00 0.013 0.03 -7.14
DVC 0.047 0.01 -69.08 0.000 0.00 -100.00 0.00
IISCO 0.566 0.09 11.86 0.227 0.54 -12.69 0.504 0.07 -10.95 0.239 0.56 5.29
SAIL 0.185 0.03 0.000 0.00
JSMDCL 0.351 0.06 18.18 0.228 0.03 -35.04
RRVUNL 8.329 1.31 0.75 15.000 2.19 80.09
NTPC 2.679 0.42 1075.00 7.311 1.07 172.90
WBPDCL 0.400 0.06
PUBLIC 602.680 95.12 3.21 39.094 93.46 -5.25 655.068 95.46 8.69 39.915 95.42 2.10
TSL 5.046 0.80 0.80 1.178 2.82 -10.08 5.303 0.77 5.09 1.243 2.92 5.52
Meghalaya 1.529 0.24 -33.75 0.00
BALCO 0.000 0.00 -100.00 0.667 0.10 100.00
CESC 1.878 0.30 7.81 1.856 0.27 -1.17
GMR 0.270 0.04 78.81
HIL 1.188 0.19 197.00 1.226 2.93 -23.38 1.198 0.17 0.84 0.975 2.29 -20.47
JPVL 2.800 0.44 0.00 2.800 0.41 0.00
SIL 0.270 0.65 76.47 0.270 0.64 0.00
SPL 18.003 2.84 5.92 18.000 2.62 -0.02
RCCPL 0.063 0.15 152.00 0.103 0.24 63.49
TUML 0.175 0.03 0.00 0.300 0.04 0.00
OCL 0.161 0.02
AMBUJA 0.100 0.01
TSPGCL 0.759 0.11
PRIVATE 30.889 4.88 4.41 2.737 6.54 -11.37 31.144 4.54 0.83 2.591 6.10 -5.33
All India 633.569 100.00 3.27 41.831 100.00 -5.68 686.212 100.00 8.31 42.506 100.00 1.61
Note: For Meghalaya it has been assumed that the coal is being mined by open cast method.
Y E A R 2018 - 2019
OPENCAST UNDER GROUNDOPENCAST UNDER GROUND
Y E A R 2017 - 2018
COMPANIES
37
~ Provisional Coal Statistics 2018-19 ~
Coal Controller's Organisation, 1,Council House Street, Kolkata, W.B., India
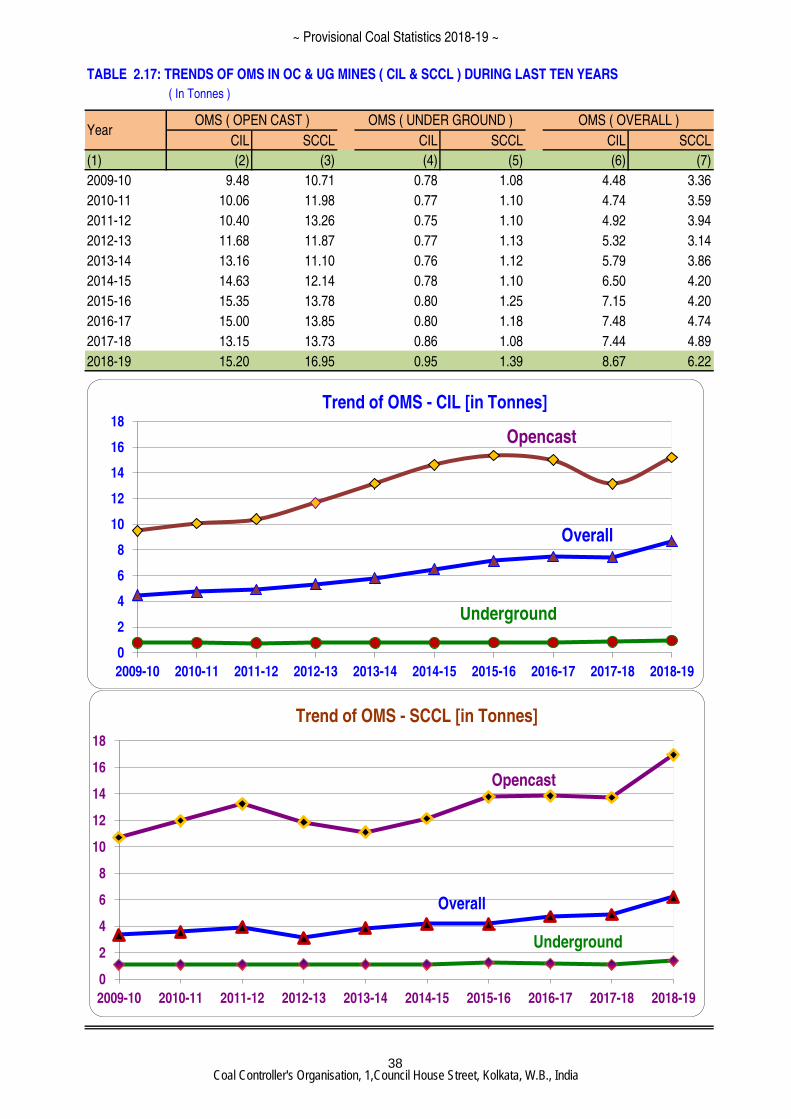
TABLE 2.17: TRENDS OF OMS IN OC & UG MINES ( CIL & SCCL ) DURING LAST TEN YEARS
( In Tonnes )
CIL SCCL CIL SCCL CIL SCCL
(1) (2) (3) (4) (5) (6) (7)
2009-10 9.48 10.71 0.78 1.08 4.48 3.36
2010-11 10.06 11.98 0.77 1.10 4.74 3.59
2011-12 10.40 13.26 0.75 1.10 4.92 3.94
2012-13 11.68 11.87 0.77 1.13 5.32 3.14
2013-14 13.16 11.10 0.76 1.12 5.79 3.86
2014-15 14.63 12.14 0.78 1.10 6.50 4.20
2015-16 15.35 13.78 0.80 1.25 7.15 4.20
2016-17 15.00 13.85 0.80 1.18 7.48 4.74
2017-18 13.15 13.73 0.86 1.08 7.44 4.89
2018-19 15.20 16.95 0.95 1.39 8.67 6.22
YearOMS ( OPEN CAST ) OMS ( UNDER GROUND ) OMS ( OVERALL )
0
2
4
6
8
10
12
14
16
18
2009-10 2010-11 2011-12 2012-13 2013-14 2014-15 2015-16 2016-17 2017-18 2018-19
Trend of OMS - CIL [in Tonnes]
Opencast
Overall
Underground
0
2
4
6
8
10
12
14
16
18
2009-10 2010-11 2011-12 2012-13 2013-14 2014-15 2015-16 2016-17 2017-18 2018-19
Trend of OMS - SCCL [in Tonnes]
Opencast
Overall
Underground
38
~ Provisional Coal Statistics 2018-19 ~
Coal Controller's Organisation, 1,Council House Street, Kolkata, W.B., India
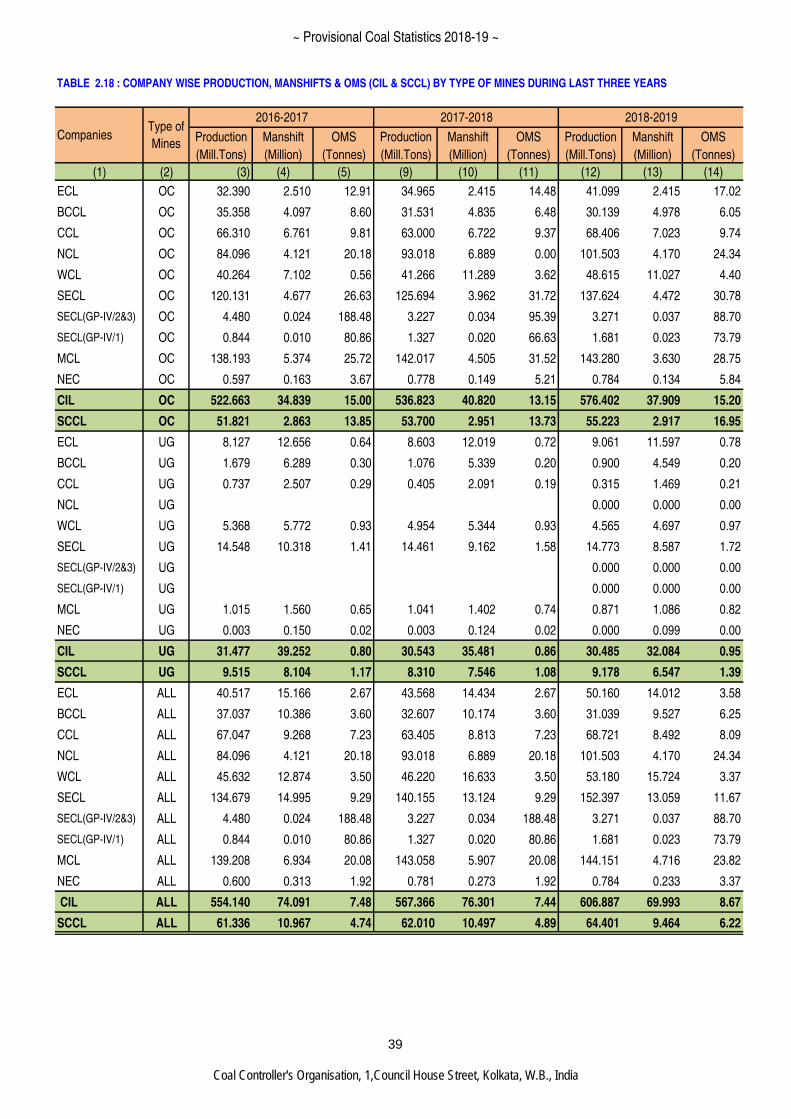
TABLE 2.18 : COMPANY WISE PRODUCTION, MANSHIFTS & OMS (CIL & SCCL) BY TYPE OF MINES DURING LAST THREE YEARS
Production Manshift OMS Production Manshift OMS Production Manshift OMS
(Mill.Tons) (Million) (Tonnes) (Mill.Tons) (Million) (Tonnes) (Mill.Tons) (Million) (Tonnes)
(1) (2) (3) (4) (5) (9) (10) (11) (12) (13) (14)
ECL OC 32.390 2.510 12.91 34.965 2.415 14.48 41.099 2.415 17.02
BCCL OC 35.358 4.097 8.60 31.531 4.835 6.48 30.139 4.978 6.05
CCL OC 66.310 6.761 9.81 63.000 6.722 9.37 68.406 7.023 9.74
NCL OC 84.096 4.121 20.18 93.018 6.889 0.00 101.503 4.170 24.34
WCL OC 40.264 7.102 0.56 41.266 11.289 3.62 48.615 11.027 4.40
SECL OC 120.131 4.677 26.63 125.694 3.962 31.72 137.624 4.472 30.78
SECL(GP-IV/2&3) OC 4.480 0.024 188.48 3.227 0.034 95.39 3.271 0.037 88.70
SECL(GP-IV/1) OC 0.844 0.010 80.86 1.327 0.020 66.63 1.681 0.023 73.79
MCL OC 138.193 5.374 25.72 142.017 4.505 31.52 143.280 3.630 28.75
NEC OC 0.597 0.163 3.67 0.778 0.149 5.21 0.784 0.134 5.84
CIL OC 522.663 34.839 15.00 536.823 40.820 13.15 576.402 37.909 15.20
SCCL OC 51.821 2.863 13.85 53.700 2.951 13.73 55.223 2.917 16.95
ECL UG 8.127 12.656 0.64 8.603 12.019 0.72 9.061 11.597 0.78
BCCL UG 1.679 6.289 0.30 1.076 5.339 0.20 0.900 4.549 0.20
CCL UG 0.737 2.507 0.29 0.405 2.091 0.19 0.315 1.469 0.21
NCL UG 0.000 0.000 0.00
WCL UG 5.368 5.772 0.93 4.954 5.344 0.93 4.565 4.697 0.97
SECL UG 14.548 10.318 1.41 14.461 9.162 1.58 14.773 8.587 1.72
SECL(GP-IV/2&3) UG 0.000 0.000 0.00
SECL(GP-IV/1) UG 0.000 0.000 0.00
MCL UG 1.015 1.560 0.65 1.041 1.402 0.74 0.871 1.086 0.82
NEC UG 0.003 0.150 0.02 0.003 0.124 0.02 0.000 0.099 0.00
CIL UG 31.477 39.252 0.80 30.543 35.481 0.86 30.485 32.084 0.95
SCCL UG 9.515 8.104 1.17 8.310 7.546 1.08 9.178 6.547 1.39
ECL ALL 40.517 15.166 2.67 43.568 14.434 2.67 50.160 14.012 3.58
BCCL ALL 37.037 10.386 3.60 32.607 10.174 3.60 31.039 9.527 6.25
CCL ALL 67.047 9.268 7.23 63.405 8.813 7.23 68.721 8.492 8.09
NCL ALL 84.096 4.121 20.18 93.018 6.889 20.18 101.503 4.170 24.34
WCL ALL 45.632 12.874 3.50 46.220 16.633 3.50 53.180 15.724 3.37
SECL ALL 134.679 14.995 9.29 140.155 13.124 9.29 152.397 13.059 11.67
SECL(GP-IV/2&3) ALL 4.480 0.024 188.48 3.227 0.034 188.48 3.271 0.037 88.70
SECL(GP-IV/1) ALL 0.844 0.010 80.86 1.327 0.020 80.86 1.681 0.023 73.79
MCL ALL 139.208 6.934 20.08 143.058 5.907 20.08 144.151 4.716 23.82
NEC ALL 0.600 0.313 1.92 0.781 0.273 1.92 0.784 0.233 3.37
CIL ALL 554.140 74.091 7.48 567.366 76.301 7.44 606.887 69.993 8.67
SCCL ALL 61.336 10.967 4.74 62.010 10.497 4.89 64.401 9.464 6.22
2018-2019
CompaniesType of
Mines
2016-2017 2017-2018
39
~ Provisional Coal Statistics 2018-19 ~
Coal Controller's Organisation, 1,Council House Street, Kolkata, W.B., India
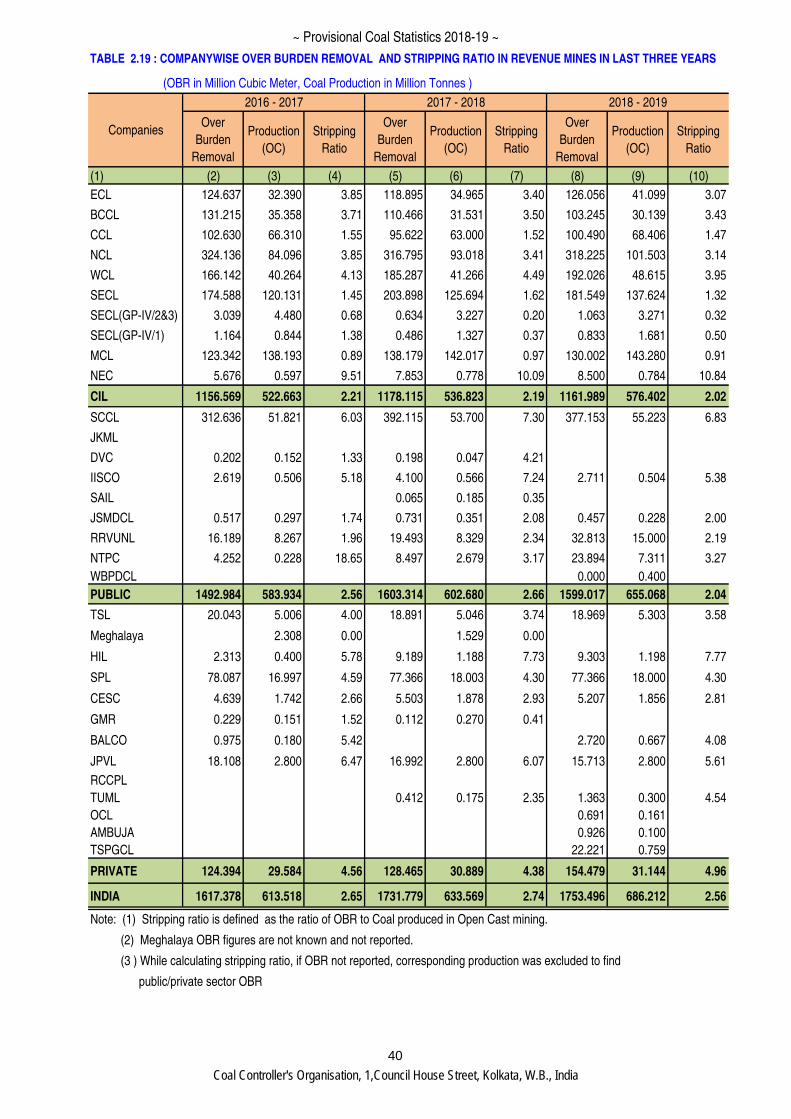
TABLE 2.19 : COMPANYWISE OVER BURDEN REMOVAL AND STRIPPING RATIO IN REVENUE MINES IN LAST THREE YEARS
(OBR in Million Cubic Meter, Coal Production in Million Tonnes )
Over
Burden
Removal
Production
(OC)
Stripping
Ratio
Over
Burden
Removal
Production
(OC)
Stripping
Ratio
Over
Burden
Removal
Production
(OC)
Stripping
Ratio
(1) (2) (3) (4) (5) (6) (7) (8) (9) (10)
ECL 124.637 32.390 3.85 118.895 34.965 3.40 126.056 41.099 3.07
BCCL 131.215 35.358 3.71 110.466 31.531 3.50 103.245 30.139 3.43
CCL 102.630 66.310 1.55 95.622 63.000 1.52 100.490 68.406 1.47
NCL 324.136 84.096 3.85 316.795 93.018 3.41 318.225 101.503 3.14
WCL 166.142 40.264 4.13 185.287 41.266 4.49 192.026 48.615 3.95
SECL 174.588 120.131 1.45 203.898 125.694 1.62 181.549 137.624 1.32
SECL(GP-IV/2&3) 3.039 4.480 0.68 0.634 3.227 0.20 1.063 3.271 0.32
SECL(GP-IV/1) 1.164 0.844 1.38 0.486 1.327 0.37 0.833 1.681 0.50
MCL 123.342 138.193 0.89 138.179 142.017 0.97 130.002 143.280 0.91
NEC 5.676 0.597 9.51 7.853 0.778 10.09 8.500 0.784 10.84
CIL 1156.569 522.663 2.21 1178.115 536.823 2.19 1161.989 576.402 2.02
SCCL 312.636 51.821 6.03 392.115 53.700 7.30 377.153 55.223 6.83
JKML
DVC 0.202 0.152 1.33 0.198 0.047 4.21
IISCO 2.619 0.506 5.18 4.100 0.566 7.24 2.711 0.504 5.38
SAIL 0.065 0.185 0.35
JSMDCL 0.517 0.297 1.74 0.731 0.351 2.08 0.457 0.228 2.00
RRVUNL 16.189 8.267 1.96 19.493 8.329 2.34 32.813 15.000 2.19
NTPC 4.252 0.228 18.65 8.497 2.679 3.17 23.894 7.311 3.27
WBPDCL 0.000 0.400
PUBLIC 1492.984 583.934 2.56 1603.314 602.680 2.66 1599.017 655.068 2.04
TSL 20.043 5.006 4.00 18.891 5.046 3.74 18.969 5.303 3.58
Meghalaya 2.308 0.00 1.529 0.00
HIL 2.313 0.400 5.78 9.189 1.188 7.73 9.303 1.198 7.77
SPL 78.087 16.997 4.59 77.366 18.003 4.30 77.366 18.000 4.30
CESC 4.639 1.742 2.66 5.503 1.878 2.93 5.207 1.856 2.81
GMR 0.229 0.151 1.52 0.112 0.270 0.41
BALCO 0.975 0.180 5.42 2.720 0.667 4.08
JPVL 18.108 2.800 6.47 16.992 2.800 6.07 15.713 2.800 5.61
RCCPL
TUML 0.412 0.175 2.35 1.363 0.300 4.54
OCL 0.691 0.161
AMBUJA 0.926 0.100
TSPGCL 22.221 0.759
PRIVATE 124.394 29.584 4.56 128.465 30.889 4.38 154.479 31.144 4.96
INDIA 1617.378 613.518 2.65 1731.779 633.569 2.74 1753.496 686.212 2.56
Note: (1) Stripping ratio is defined as the ratio of OBR to Coal produced in Open Cast mining.
(2) Meghalaya OBR figures are not known and not reported.
(3 ) While calculating stripping ratio, if OBR not reported, corresponding production was excluded to find
public/private sector OBR
2017 - 20182016 - 2017 2018 - 2019
Companies
40
~ Provisional Coal Statistics 2018-19 ~
Coal Controller's Organisation, 1,Council House Street, Kolkata, W.B., India
~ Provisional Coal Statistics 2018-19 ~
Coal Controller's Organisation, 1,Council House Street, Kolkata, W.B., India

TABLE 3.1: TREND OF DESPATCHES OF COAL AND LIGNITE DURING LAST TEN YEARS
( Quantity in Million Tonnes )
DespatchesGrowth
(%)Despatches
Growth
(%)Despatches
Growth
(%)
(1) (2) (3) (4) (5) (6) (7)
2009-10 513.792 5.03 34.43 8.29 548.222 5.23
2010-11 523.465 1.88 37.685 9.45 561.15 2.36
2011-12 535.299 2.26 41.883 11.14 577.182 2.86
2012-13 567.136 5.95 46.313 10.58 613.449 6.28
2013-14 572.060 0.87 43.897 -5.22 615.957 0.41
2014-15 603.772 5.54 46.954 6.96 650.726 5.64
2015-16 632.442 4.75 42.211 -10.10 674.653 3.68
2016-17 645.978 2.14 43.155 2.24 689.133 2.15
2017-18 690.003 6.82 46.317 7.33 736.320 6.85
2018-19 732.794 6.20 45.811 -1.09 778.605 5.74
TABLE 3.2 : TRENDS OF DESPATCHES OF COAL BY TYPE DURING LAST TEN YEARS
( Quantity in Million Tonnes )
DespatchesGrowth
(%)Despatches
Growth
(%)Despatches
Growth
(%)Despatches
Growth
(%)
(1) (2) (3) (4) (5) (6) (7) (8) (9)
2009-10 15.173 0.74 42.469 18.88 471.323 3.94 513.792 5.03
2010-11 16.075 5.94 48.95 15.26 474.515 0.68 523.465 1.88
2011-12 15.903 -1.07 51.723 5.66 483.576 1.91 535.299 2.26
2012-13 14.799 -6.94 55.859 8.00 511.277 5.73 567.136 5.95
2013-14 15.236 2.95 58.464 4.66 513.596 0.45 572.060 0.87
2014-15 13.264 -12.94 56.438 -3.47 547.334 6.57 603.772 5.54
2015-16 13.866 4.54 59.213 4.92 573.229 4.73 632.442 4.75
2016-17 14.039 1.25 59.308 0.16 586.670 2.34 645.978 2.14
2017-18 34.199 143.60 45.380 -23.48 644.623 9.88 690.003 6.82
2018-19 35.255 3.09 43.318 -4.54 689.476 6.96 732.794 6.20
Raw Coal
Year
Raw Coal Lignite Total solid fossil fuel
Year
Metallurgical Coal Total Coking Coal Non Coking Coal
41
~ Provisional Coal Statistics 2018-19 ~
Coal Controller's Organisation, 1,Council House Street, Kolkata, W.B., India
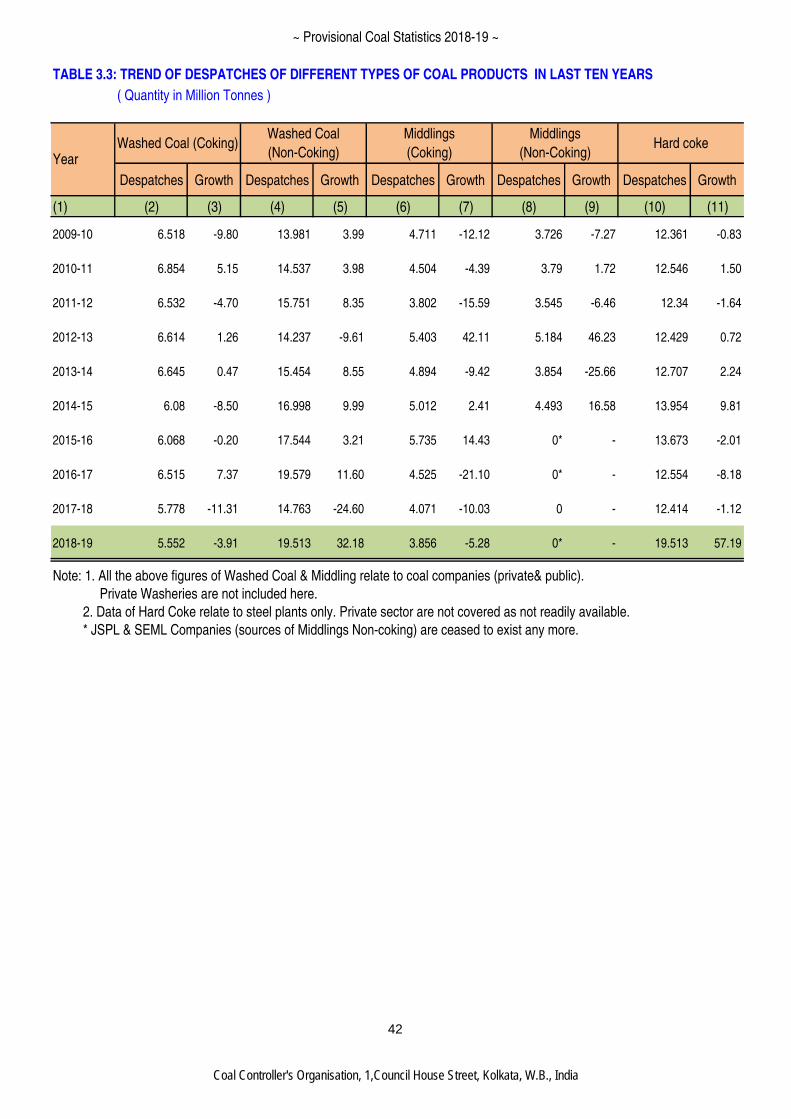
TABLE 3.3: TREND OF DESPATCHES OF DIFFERENT TYPES OF COAL PRODUCTS IN LAST TEN YEARS
( Quantity in Million Tonnes )
Despatches Growth Despatches Growth Despatches Growth Despatches Growth Despatches Growth
(1) (2) (3) (4) (5) (6) (7) (8) (9) (10) (11)
2009-10 6.518 -9.80 13.981 3.99 4.711 -12.12 3.726 -7.27 12.361 -0.83
2010-11 6.854 5.15 14.537 3.98 4.504 -4.39 3.79 1.72 12.546 1.50
2011-12 6.532 -4.70 15.751 8.35 3.802 -15.59 3.545 -6.46 12.34 -1.64
2012-13 6.614 1.26 14.237 -9.61 5.403 42.11 5.184 46.23 12.429 0.72
2013-14 6.645 0.47 15.454 8.55 4.894 -9.42 3.854 -25.66 12.707 2.24
2014-15 6.08 -8.50 16.998 9.99 5.012 2.41 4.493 16.58 13.954 9.81
2015-16 6.068 -0.20 17.544 3.21 5.735 14.43 0* - 13.673 -2.01
2016-17 6.515 7.37 19.579 11.60 4.525 -21.10 0* - 12.554 -8.18
2017-18 5.778 -11.31 14.763 -24.60 4.071 -10.03 0 - 12.414 -1.12
2018-19 5.552 -3.91 19.513 32.18 3.856 -5.28 0* - 19.513 57.19
Note: 1. All the above figures of Washed Coal & Middling relate to coal companies (private& public).
Private Washeries are not included here.
2. Data of Hard Coke relate to steel plants only. Private sector are not covered as not readily available.
* JSPL & SEML Companies (sources of Middlings Non-coking) are ceased to exist any more.
Hard cokeYear
Washed Coal (Coking)Washed Coal
(Non-Coking)
Middlings
(Coking)
Middlings
(Non-Coking)
42
~ Provisional Coal Statistics 2018-19 ~
Coal Controller's Organisation, 1,Council House Street, Kolkata, W.B., India
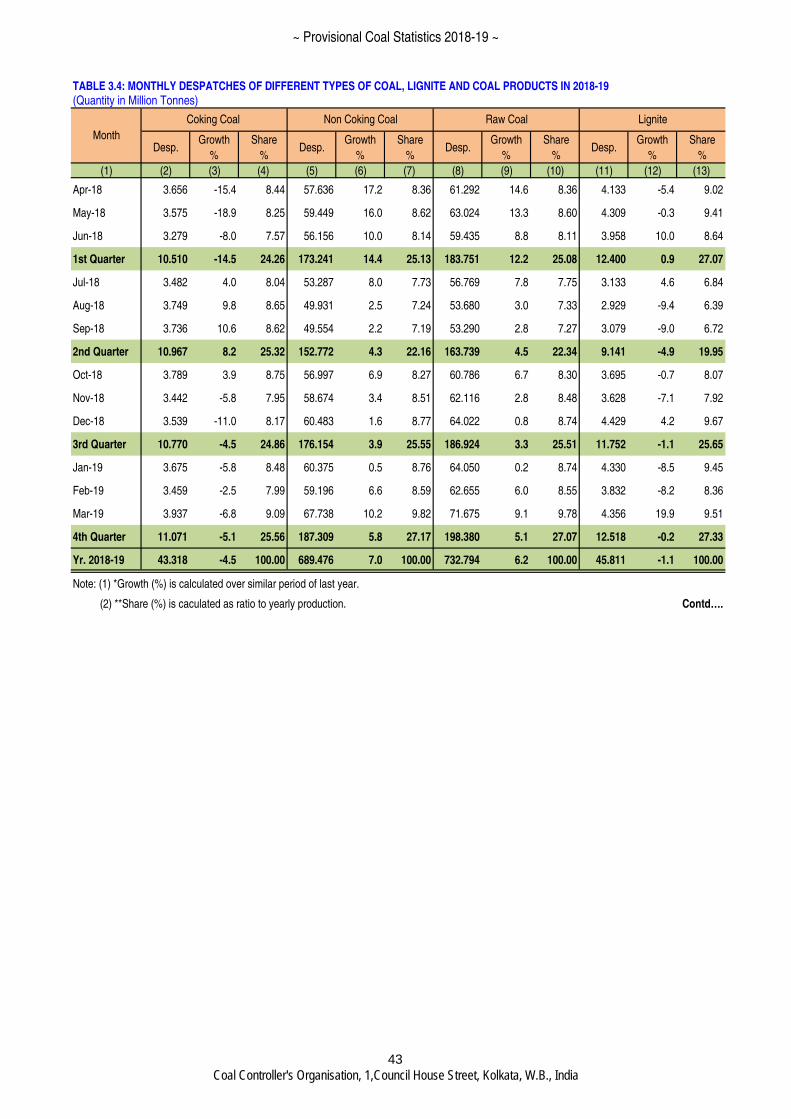
TABLE 3.4: MONTHLY DESPATCHES OF DIFFERENT TYPES OF COAL, LIGNITE AND COAL PRODUCTS IN 2018-19
(Quantity in Million Tonnes)
Desp.Growth
%
Share
%Desp.
Growth
%
Share
%Desp.
Growth
%
Share
%Desp.
Growth
%
Share
%
(1) (2) (3) (4) (5) (6) (7) (8) (9) (10) (11) (12) (13)
Apr-18 3.656 -15.4 8.44 57.636 17.2 8.36 61.292 14.6 8.36 4.133 -5.4 9.02
May-18 3.575 -18.9 8.25 59.449 16.0 8.62 63.024 13.3 8.60 4.309 -0.3 9.41
Jun-18 3.279 -8.0 7.57 56.156 10.0 8.14 59.435 8.8 8.11 3.958 10.0 8.64
1st Quarter 10.510 -14.5 24.26 173.241 14.4 25.13 183.751 12.2 25.08 12.400 0.9 27.07
Jul-18 3.482 4.0 8.04 53.287 8.0 7.73 56.769 7.8 7.75 3.133 4.6 6.84
Aug-18 3.749 9.8 8.65 49.931 2.5 7.24 53.680 3.0 7.33 2.929 -9.4 6.39
Sep-18 3.736 10.6 8.62 49.554 2.2 7.19 53.290 2.8 7.27 3.079 -9.0 6.72
2nd Quarter 10.967 8.2 25.32 152.772 4.3 22.16 163.739 4.5 22.34 9.141 -4.9 19.95
Oct-18 3.789 3.9 8.75 56.997 6.9 8.27 60.786 6.7 8.30 3.695 -0.7 8.07
Nov-18 3.442 -5.8 7.95 58.674 3.4 8.51 62.116 2.8 8.48 3.628 -7.1 7.92
Dec-18 3.539 -11.0 8.17 60.483 1.6 8.77 64.022 0.8 8.74 4.429 4.2 9.67
3rd Quarter 10.770 -4.5 24.86 176.154 3.9 25.55 186.924 3.3 25.51 11.752 -1.1 25.65
Jan-19 3.675 -5.8 8.48 60.375 0.5 8.76 64.050 0.2 8.74 4.330 -8.5 9.45
Feb-19 3.459 -2.5 7.99 59.196 6.6 8.59 62.655 6.0 8.55 3.832 -8.2 8.36
Mar-19 3.937 -6.8 9.09 67.738 10.2 9.82 71.675 9.1 9.78 4.356 19.9 9.51
4th Quarter 11.071 -5.1 25.56 187.309 5.8 27.17 198.380 5.1 27.07 12.518 -0.2 27.33
Yr. 2018-19 43.318 -4.5 100.00 689.476 7.0 100.00 732.794 6.2 100.00 45.811 -1.1 100.00
Note: (1) *Growth (%) is calculated over similar period of last year.
(2) **Share (%) is caculated as ratio to yearly production. Contd….
Month
Coking Coal Non Coking Coal Raw Coal Lignite
43
~ Provisional Coal Statistics 2018-19 ~
Coal Controller's Organisation, 1,Council House Street, Kolkata, W.B., India
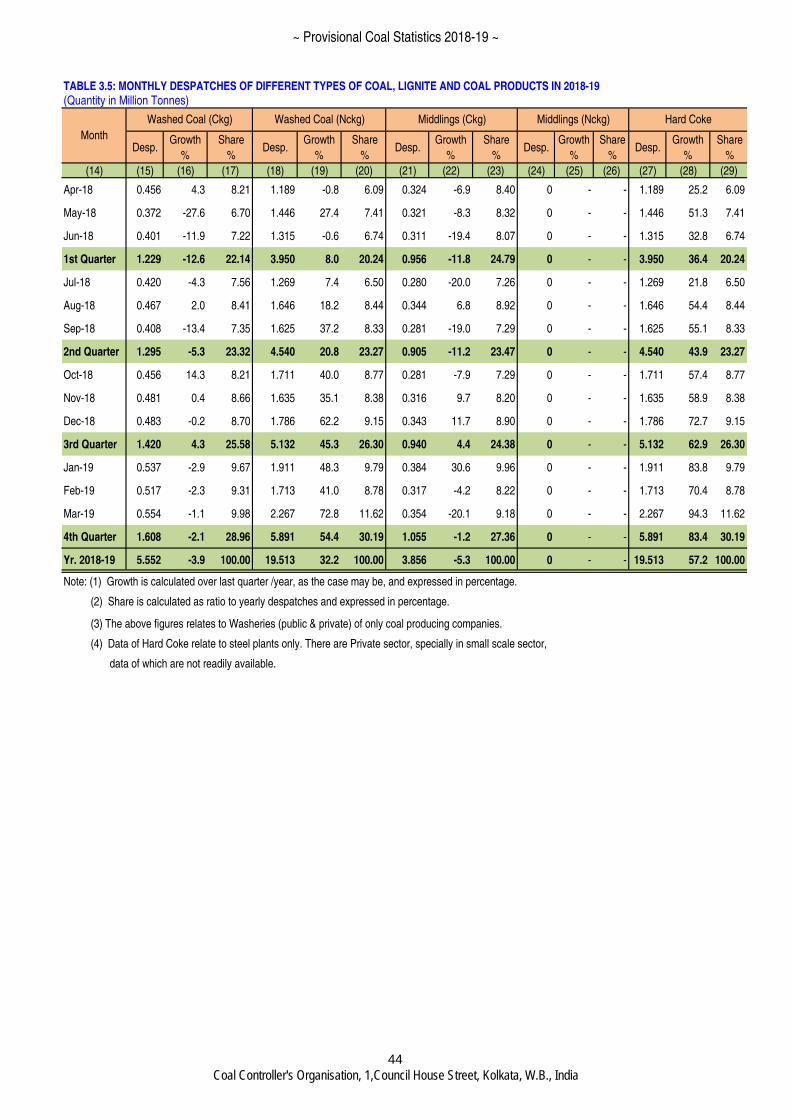
TABLE 3.5: MONTHLY DESPATCHES OF DIFFERENT TYPES OF COAL, LIGNITE AND COAL PRODUCTS IN 2018-19
(Quantity in Million Tonnes)
Desp.Growth
%
Share
%Desp.
Growth
%
Share
%Desp.
Growth
%
Share
%Desp.
Growth
%
Share
%Desp.
Growth
%
Share
%
(14) (15) (16) (17) (18) (19) (20) (21) (22) (23) (24) (25) (26) (27) (28) (29)
Apr-18 0.456 4.3 8.21 1.189 -0.8 6.09 0.324 -6.9 8.40 0 - - 1.189 25.2 6.09
May-18 0.372 -27.6 6.70 1.446 27.4 7.41 0.321 -8.3 8.32 0 - - 1.446 51.3 7.41
Jun-18 0.401 -11.9 7.22 1.315 -0.6 6.74 0.311 -19.4 8.07 0 - - 1.315 32.8 6.74
1st Quarter 1.229 -12.6 22.14 3.950 8.0 20.24 0.956 -11.8 24.79 0 - - 3.950 36.4 20.24
Jul-18 0.420 -4.3 7.56 1.269 7.4 6.50 0.280 -20.0 7.26 0 - - 1.269 21.8 6.50
Aug-18 0.467 2.0 8.41 1.646 18.2 8.44 0.344 6.8 8.92 0 - - 1.646 54.4 8.44
Sep-18 0.408 -13.4 7.35 1.625 37.2 8.33 0.281 -19.0 7.29 0 - - 1.625 55.1 8.33
2nd Quarter 1.295 -5.3 23.32 4.540 20.8 23.27 0.905 -11.2 23.47 0 - - 4.540 43.9 23.27
Oct-18 0.456 14.3 8.21 1.711 40.0 8.77 0.281 -7.9 7.29 0 - - 1.711 57.4 8.77
Nov-18 0.481 0.4 8.66 1.635 35.1 8.38 0.316 9.7 8.20 0 - - 1.635 58.9 8.38
Dec-18 0.483 -0.2 8.70 1.786 62.2 9.15 0.343 11.7 8.90 0 - - 1.786 72.7 9.15
3rd Quarter 1.420 4.3 25.58 5.132 45.3 26.30 0.940 4.4 24.38 0 - - 5.132 62.9 26.30
Jan-19 0.537 -2.9 9.67 1.911 48.3 9.79 0.384 30.6 9.96 0 - - 1.911 83.8 9.79
Feb-19 0.517 -2.3 9.31 1.713 41.0 8.78 0.317 -4.2 8.22 0 - - 1.713 70.4 8.78
Mar-19 0.554 -1.1 9.98 2.267 72.8 11.62 0.354 -20.1 9.18 0 - - 2.267 94.3 11.62
4th Quarter 1.608 -2.1 28.96 5.891 54.4 30.19 1.055 -1.2 27.36 0 - - 5.891 83.4 30.19
Yr. 2018-19 5.552 -3.9 100.00 19.513 32.2 100.00 3.856 -5.3 100.00 0 - - 19.513 57.2 100.00
Note: (1) Growth is calculated over last quarter /year, as the case may be, and expressed in percentage.
(2) Share is calculated as ratio to yearly despatches and expressed in percentage.
(3) The above figures relates to Washeries (public & private) of only coal producing companies.
(4) Data of Hard Coke relate to steel plants only. There are Private sector, specially in small scale sector,
data of which are not readily available.
Washed Coal (Ckg) Washed Coal (Nckg) Middlings (Ckg) Middlings (Nckg) Hard Coke
Month
44
~ Provisional Coal Statistics 2018-19 ~
Coal Controller's Organisation, 1,Council House Street, Kolkata, W.B., India
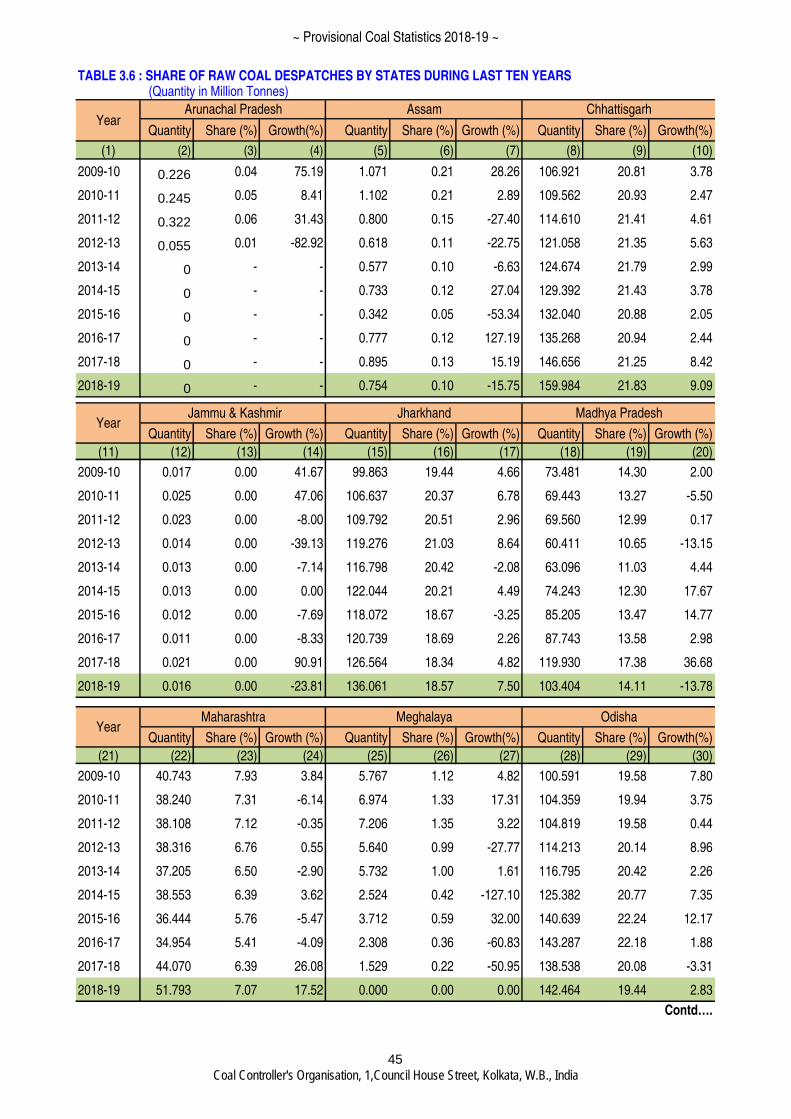
TABLE 3.6 : SHARE OF RAW COAL DESPATCHES BY STATES DURING LAST TEN YEARS (Quantity in Million Tonnes)
Quantity Share (%) Growth(%) Quantity Share (%) Growth (%) Quantity Share (%) Growth(%)
(1) (2) (3) (4) (5) (6) (7) (8) (9) (10)
2009-10 0.226 0.04 75.19 1.071 0.21 28.26 106.921 20.81 3.78
2010-11 0.245 0.05 8.41 1.102 0.21 2.89 109.562 20.93 2.47
2011-12 0.322 0.06 31.43 0.800 0.15 -27.40 114.610 21.41 4.61
2012-13 0.055 0.01 -82.92 0.618 0.11 -22.75 121.058 21.35 5.63
2013-14 0 - - 0.577 0.10 -6.63 124.674 21.79 2.99
2014-15 0 - - 0.733 0.12 27.04 129.392 21.43 3.78
2015-16 0 - - 0.342 0.05 -53.34 132.040 20.88 2.05
2016-17 0 - - 0.777 0.12 127.19 135.268 20.94 2.44
2017-18 0 - - 0.895 0.13 15.19 146.656 21.25 8.42
2018-19 0 - - 0.754 0.10 -15.75 159.984 21.83 9.09
Quantity Share (%) Growth (%) Quantity Share (%) Growth (%) Quantity Share (%) Growth (%)
(11) (12) (13) (14) (15) (16) (17) (18) (19) (20)
2009-10 0.017 0.00 41.67 99.863 19.44 4.66 73.481 14.30 2.00
2010-11 0.025 0.00 47.06 106.637 20.37 6.78 69.443 13.27 -5.50
2011-12 0.023 0.00 -8.00 109.792 20.51 2.96 69.560 12.99 0.17
2012-13 0.014 0.00 -39.13 119.276 21.03 8.64 60.411 10.65 -13.15
2013-14 0.013 0.00 -7.14 116.798 20.42 -2.08 63.096 11.03 4.44
2014-15 0.013 0.00 0.00 122.044 20.21 4.49 74.243 12.30 17.67
2015-16 0.012 0.00 -7.69 118.072 18.67 -3.25 85.205 13.47 14.77
2016-17 0.011 0.00 -8.33 120.739 18.69 2.26 87.743 13.58 2.98
2017-18 0.021 0.00 90.91 126.564 18.34 4.82 119.930 17.38 36.68
2018-19 0.016 0.00 -23.81 136.061 18.57 7.50 103.404 14.11 -13.78
Quantity Share (%) Growth (%) Quantity Share (%) Growth(%) Quantity Share (%) Growth(%)
(21) (22) (23) (24) (25) (26) (27) (28) (29) (30)
2009-10 40.743 7.93 3.84 5.767 1.12 4.82 100.591 19.58 7.80
2010-11 38.240 7.31 -6.14 6.974 1.33 17.31 104.359 19.94 3.75
2011-12 38.108 7.12 -0.35 7.206 1.35 3.22 104.819 19.58 0.44
2012-13 38.316 6.76 0.55 5.640 0.99 -27.77 114.213 20.14 8.96
2013-14 37.205 6.50 -2.90 5.732 1.00 1.61 116.795 20.42 2.26
2014-15 38.553 6.39 3.62 2.524 0.42 -127.10 125.382 20.77 7.35
2015-16 36.444 5.76 -5.47 3.712 0.59 32.00 140.639 22.24 12.17
2016-17 34.954 5.41 -4.09 2.308 0.36 -60.83 143.287 22.18 1.88
2017-18 44.070 6.39 26.08 1.529 0.22 -50.95 138.538 20.08 -3.31
2018-19 51.793 7.07 17.52 0.000 0.00 0.00 142.464 19.44 2.83
Contd….
YearMaharashtra Meghalaya Odisha
YearArunachal Pradesh Assam Chhattisgarh
Year Jammu & Kashmir Jharkhand Madhya Pradesh
45
~ Provisional Coal Statistics 2018-19 ~
Coal Controller's Organisation, 1,Council House Street, Kolkata, W.B., India
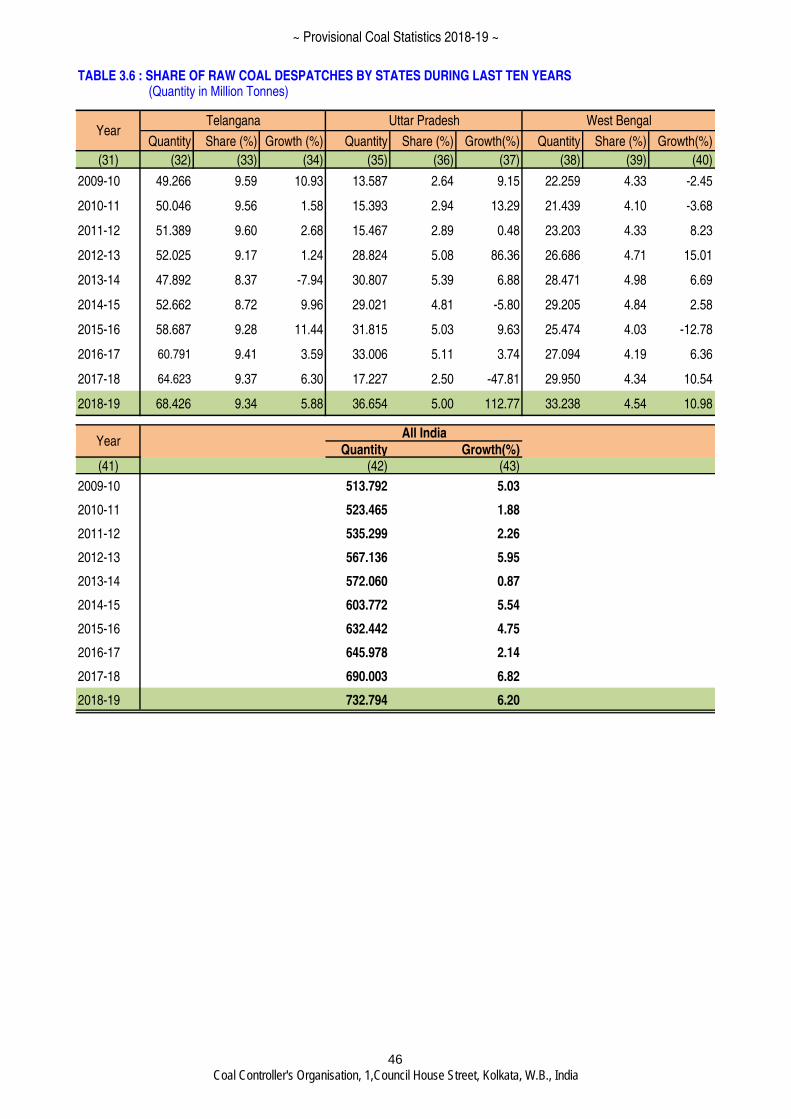
TABLE 3.6 : SHARE OF RAW COAL DESPATCHES BY STATES DURING LAST TEN YEARS (Quantity in Million Tonnes)
Quantity Share (%) Growth (%) Quantity Share (%) Growth(%) Quantity Share (%) Growth(%)
(31) (32) (33) (34) (35) (36) (37) (38) (39) (40)
2009-10 49.266 9.59 10.93 13.587 2.64 9.15 22.259 4.33 -2.45
2010-11 50.046 9.56 1.58 15.393 2.94 13.29 21.439 4.10 -3.68
2011-12 51.389 9.60 2.68 15.467 2.89 0.48 23.203 4.33 8.23
2012-13 52.025 9.17 1.24 28.824 5.08 86.36 26.686 4.71 15.01
2013-14 47.892 8.37 -7.94 30.807 5.39 6.88 28.471 4.98 6.69
2014-15 52.662 8.72 9.96 29.021 4.81 -5.80 29.205 4.84 2.58
2015-16 58.687 9.28 11.44 31.815 5.03 9.63 25.474 4.03 -12.78
2016-17 60.791 9.41 3.59 33.006 5.11 3.74 27.094 4.19 6.36
2017-18 64.623 9.37 6.30 17.227 2.50 -47.81 29.950 4.34 10.54
2018-19 68.426 9.34 5.88 36.654 5.00 112.77 33.238 4.54 10.98
Quantity Growth(%)(41) (42) (43)
2009-10 513.792 5.03
2010-11 523.465 1.88
2011-12 535.299 2.26
2012-13 567.136 5.95
2013-14 572.060 0.87
2014-15 603.772 5.54
2015-16 632.442 4.75
2016-17 645.978 2.14
2017-18 690.003 6.82
2018-19 732.794 6.20
YearTelangana Uttar Pradesh West Bengal
YearAll India
46
~ Provisional Coal Statistics 2018-19 ~
Coal Controller's Organisation, 1,Council House Street, Kolkata, W.B., India
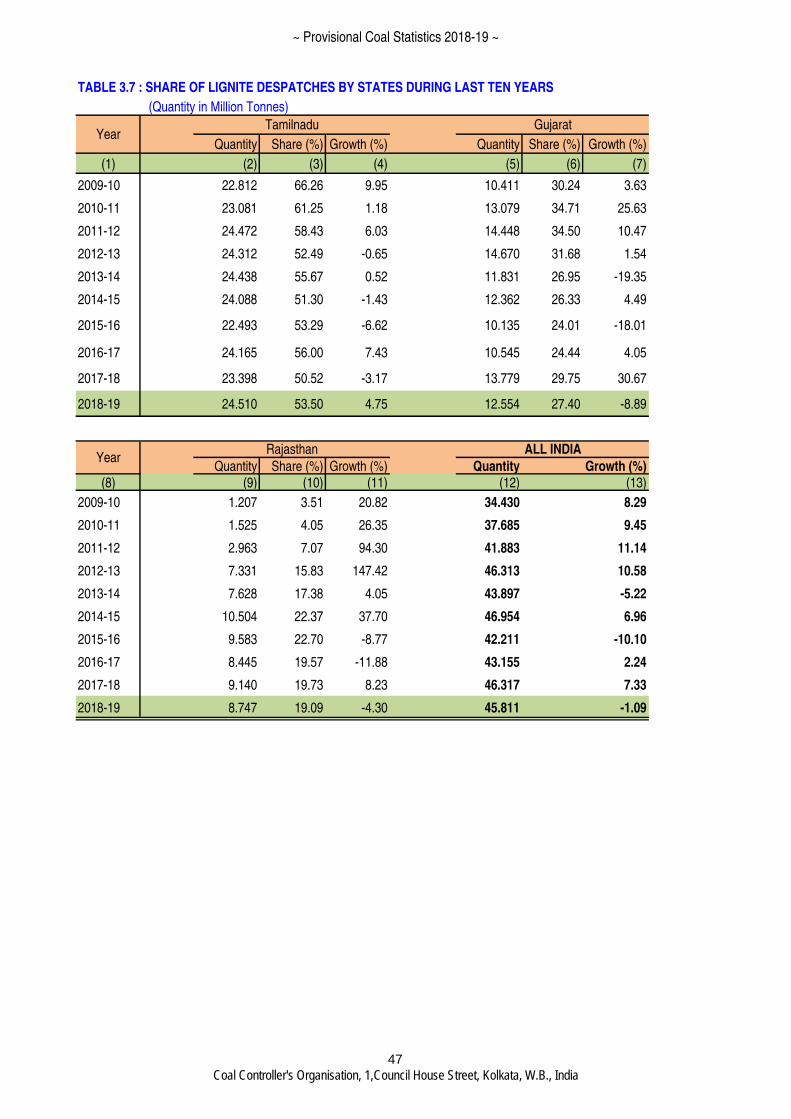
TABLE 3.7 : SHARE OF LIGNITE DESPATCHES BY STATES DURING LAST TEN YEARS
(Quantity in Million Tonnes)
Quantity Share (%) Growth (%) Quantity Share (%) Growth (%)
(1) (2) (3) (4) (5) (6) (7)
2009-10 22.812 66.26 9.95 10.411 30.24 3.63
2010-11 23.081 61.25 1.18 13.079 34.71 25.63
2011-12 24.472 58.43 6.03 14.448 34.50 10.47
2012-13 24.312 52.49 -0.65 14.670 31.68 1.54
2013-14 24.438 55.67 0.52 11.831 26.95 -19.35
2014-15 24.088 51.30 -1.43 12.362 26.33 4.49
2015-16 22.493 53.29 -6.62 10.135 24.01 -18.01
2016-17 24.165 56.00 7.43 10.545 24.44 4.05
2017-18 23.398 50.52 -3.17 13.779 29.75 30.67
2018-19 24.510 53.50 4.75 12.554 27.40 -8.89
Quantity Share (%) Growth (%) Quantity Growth (%)(8) (9) (10) (11) (12) (13)
2009-10 1.207 3.51 20.82 34.430 8.29
2010-11 1.525 4.05 26.35 37.685 9.45
2011-12 2.963 7.07 94.30 41.883 11.14
2012-13 7.331 15.83 147.42 46.313 10.58
2013-14 7.628 17.38 4.05 43.897 -5.22
2014-15 10.504 22.37 37.70 46.954 6.96
2015-16 9.583 22.70 -8.77 42.211 -10.10
2016-17 8.445 19.57 -11.88 43.155 2.24
2017-18 9.140 19.73 8.23 46.317 7.33
2018-19 8.747 19.09 -4.30 45.811 -1.09
YearRajasthan ALL INDIA
YearTamilnadu Gujarat
47
~ Provisional Coal Statistics 2018-19 ~
Coal Controller's Organisation, 1,Council House Street, Kolkata, W.B., India
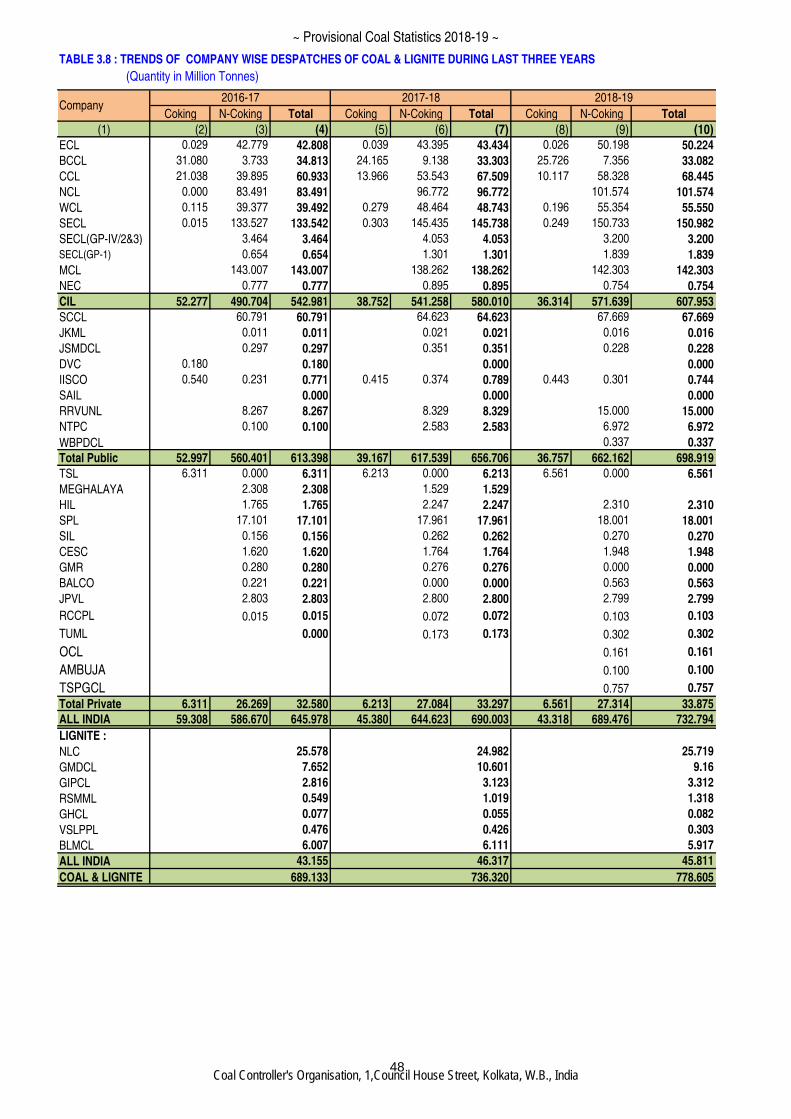
TABLE 3.8 : TRENDS OF COMPANY WISE DESPATCHES OF COAL & LIGNITE DURING LAST THREE YEARS
(Quantity in Million Tonnes)
Coking N-Coking Total Coking N-Coking Total Coking N-Coking Total
(1) (2) (3) (4) (5) (6) (7) (8) (9) (10)ECL 0.029 42.779 42.808 0.039 43.395 43.434 0.026 50.198 50.224
BCCL 31.080 3.733 34.813 24.165 9.138 33.303 25.726 7.356 33.082
CCL 21.038 39.895 60.933 13.966 53.543 67.509 10.117 58.328 68.445
NCL 0.000 83.491 83.491 96.772 96.772 101.574 101.574
WCL 0.115 39.377 39.492 0.279 48.464 48.743 0.196 55.354 55.550
SECL 0.015 133.527 133.542 0.303 145.435 145.738 0.249 150.733 150.982
SECL(GP-IV/2&3) 3.464 3.464 4.053 4.053 3.200 3.200
SECL(GP-1) 0.654 0.654 1.301 1.301 1.839 1.839
MCL 143.007 143.007 138.262 138.262 142.303 142.303
NEC 0.777 0.777 0.895 0.895 0.754 0.754
CIL 52.277 490.704 542.981 38.752 541.258 580.010 36.314 571.639 607.953
SCCL 60.791 60.791 64.623 64.623 67.669 67.669
JKML 0.011 0.011 0.021 0.021 0.016 0.016
JSMDCL 0.297 0.297 0.351 0.351 0.228 0.228
DVC 0.180 0.180 0.000 0.000
IISCO 0.540 0.231 0.771 0.415 0.374 0.789 0.443 0.301 0.744
SAIL 0.000 0.000 0.000
RRVUNL 8.267 8.267 8.329 8.329 15.000 15.000
NTPC 0.100 0.100 2.583 2.583 6.972 6.972
WBPDCL 0.337 0.337
Total Public 52.997 560.401 613.398 39.167 617.539 656.706 36.757 662.162 698.919
TSL 6.311 0.000 6.311 6.213 0.000 6.213 6.561 0.000 6.561
MEGHALAYA 2.308 2.308 1.529 1.529
HIL 1.765 1.765 2.247 2.247 2.310 2.310
SPL 17.101 17.101 17.961 17.961 18.001 18.001
SIL 0.156 0.156 0.262 0.262 0.270 0.270
CESC 1.620 1.620 1.764 1.764 1.948 1.948
GMR 0.280 0.280 0.276 0.276 0.000 0.000
BALCO 0.221 0.221 0.000 0.000 0.563 0.563
JPVL 2.803 2.803 2.800 2.800 2.799 2.799
RCCPL 0.015 0.015 0.072 0.072 0.103 0.103
TUML 0.000 0.173 0.173 0.302 0.302
OCL 0.161 0.161
AMBUJA 0.100 0.100
TSPGCL 0.757 0.757
Total Private 6.311 26.269 32.580 6.213 27.084 33.297 6.561 27.314 33.875
ALL INDIA 59.308 586.670 645.978 45.380 644.623 690.003 43.318 689.476 732.794
LIGNITE :
NLC 25.578 24.982 25.719
GMDCL 7.652 10.601 9.16
GIPCL 2.816 3.123 3.312
RSMML 0.549 1.019 1.318
GHCL 0.077 0.055 0.082
VSLPPL 0.476 0.426 0.303
BLMCL 6.007 6.111 5.917
ALL INDIA 43.155 46.317 45.811
COAL & LIGNITE 689.133 736.320 778.605
2016-17 2017-18 2018-19Company
48
~ Provisional Coal Statistics 2018-19 ~
Coal Controller's Organisation, 1,Council House Street, Kolkata, W.B., India
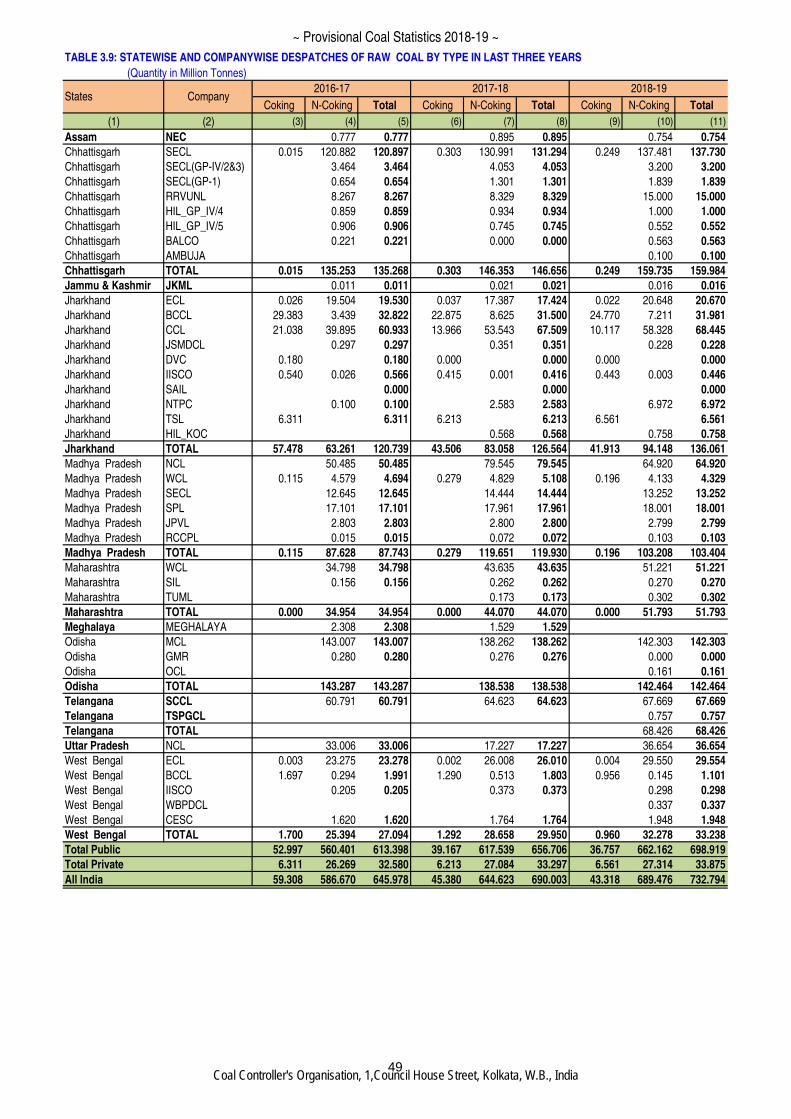
TABLE 3.9: STATEWISE AND COMPANYWISE DESPATCHES OF RAW COAL BY TYPE IN LAST THREE YEARS
(Quantity in Million Tonnes)
Coking N-Coking Total Coking N-Coking Total Coking N-Coking Total
(1) (2) (3) (4) (5) (6) (7) (8) (9) (10) (11)
Assam NEC 0.777 0.777 0.895 0.895 0.754 0.754
Chhattisgarh SECL 0.015 120.882 120.897 0.303 130.991 131.294 0.249 137.481 137.730
Chhattisgarh SECL(GP-IV/2&3) 3.464 3.464 4.053 4.053 3.200 3.200
Chhattisgarh SECL(GP-1) 0.654 0.654 1.301 1.301 1.839 1.839
Chhattisgarh RRVUNL 8.267 8.267 8.329 8.329 15.000 15.000
Chhattisgarh HIL_GP_IV/4 0.859 0.859 0.934 0.934 1.000 1.000
Chhattisgarh HIL_GP_IV/5 0.906 0.906 0.745 0.745 0.552 0.552
Chhattisgarh BALCO 0.221 0.221 0.000 0.000 0.563 0.563
Chhattisgarh AMBUJA 0.100 0.100
Chhattisgarh TOTAL 0.015 135.253 135.268 0.303 146.353 146.656 0.249 159.735 159.984
Jammu & Kashmir JKML 0.011 0.011 0.021 0.021 0.016 0.016
Jharkhand ECL 0.026 19.504 19.530 0.037 17.387 17.424 0.022 20.648 20.670
Jharkhand BCCL 29.383 3.439 32.822 22.875 8.625 31.500 24.770 7.211 31.981
Jharkhand CCL 21.038 39.895 60.933 13.966 53.543 67.509 10.117 58.328 68.445
Jharkhand JSMDCL 0.297 0.297 0.351 0.351 0.228 0.228
Jharkhand DVC 0.180 0.180 0.000 0.000 0.000 0.000
Jharkhand IISCO 0.540 0.026 0.566 0.415 0.001 0.416 0.443 0.003 0.446
Jharkhand SAIL 0.000 0.000 0.000
Jharkhand NTPC 0.100 0.100 2.583 2.583 6.972 6.972
Jharkhand TSL 6.311 6.311 6.213 6.213 6.561 6.561
Jharkhand HIL_KOC 0.568 0.568 0.758 0.758
Jharkhand TOTAL 57.478 63.261 120.739 43.506 83.058 126.564 41.913 94.148 136.061
Madhya Pradesh NCL 50.485 50.485 79.545 79.545 64.920 64.920
Madhya Pradesh WCL 0.115 4.579 4.694 0.279 4.829 5.108 0.196 4.133 4.329
Madhya Pradesh SECL 12.645 12.645 14.444 14.444 13.252 13.252
Madhya Pradesh SPL 17.101 17.101 17.961 17.961 18.001 18.001
Madhya Pradesh JPVL 2.803 2.803 2.800 2.800 2.799 2.799
Madhya Pradesh RCCPL 0.015 0.015 0.072 0.072 0.103 0.103
Madhya Pradesh TOTAL 0.115 87.628 87.743 0.279 119.651 119.930 0.196 103.208 103.404
Maharashtra WCL 34.798 34.798 43.635 43.635 51.221 51.221
Maharashtra SIL 0.156 0.156 0.262 0.262 0.270 0.270
Maharashtra TUML 0.173 0.173 0.302 0.302
Maharashtra TOTAL 0.000 34.954 34.954 0.000 44.070 44.070 0.000 51.793 51.793
Meghalaya MEGHALAYA 2.308 2.308 1.529 1.529
Odisha MCL 143.007 143.007 138.262 138.262 142.303 142.303
Odisha GMR 0.280 0.280 0.276 0.276 0.000 0.000
Odisha OCL 0.161 0.161
Odisha TOTAL 143.287 143.287 138.538 138.538 142.464 142.464
Telangana SCCL 60.791 60.791 64.623 64.623 67.669 67.669
Telangana TSPGCL 0.757 0.757
Telangana TOTAL 68.426 68.426
Uttar Pradesh NCL 33.006 33.006 17.227 17.227 36.654 36.654
West Bengal ECL 0.003 23.275 23.278 0.002 26.008 26.010 0.004 29.550 29.554
West Bengal BCCL 1.697 0.294 1.991 1.290 0.513 1.803 0.956 0.145 1.101
West Bengal IISCO 0.205 0.205 0.373 0.373 0.298 0.298
West Bengal WBPDCL 0.337 0.337
West Bengal CESC 1.620 1.620 1.764 1.764 1.948 1.948
West Bengal TOTAL 1.700 25.394 27.094 1.292 28.658 29.950 0.960 32.278 33.238
Total Public 52.997 560.401 613.398 39.167 617.539 656.706 36.757 662.162 698.919
Total Private 6.311 26.269 32.580 6.213 27.084 33.297 6.561 27.314 33.875
All India 59.308 586.670 645.978 45.380 644.623 690.003 43.318 689.476 732.794
States Company2017-18 2018-192016-17
49
~ Provisional Coal Statistics 2018-19 ~
Coal Controller's Organisation, 1,Council House Street, Kolkata, W.B., India
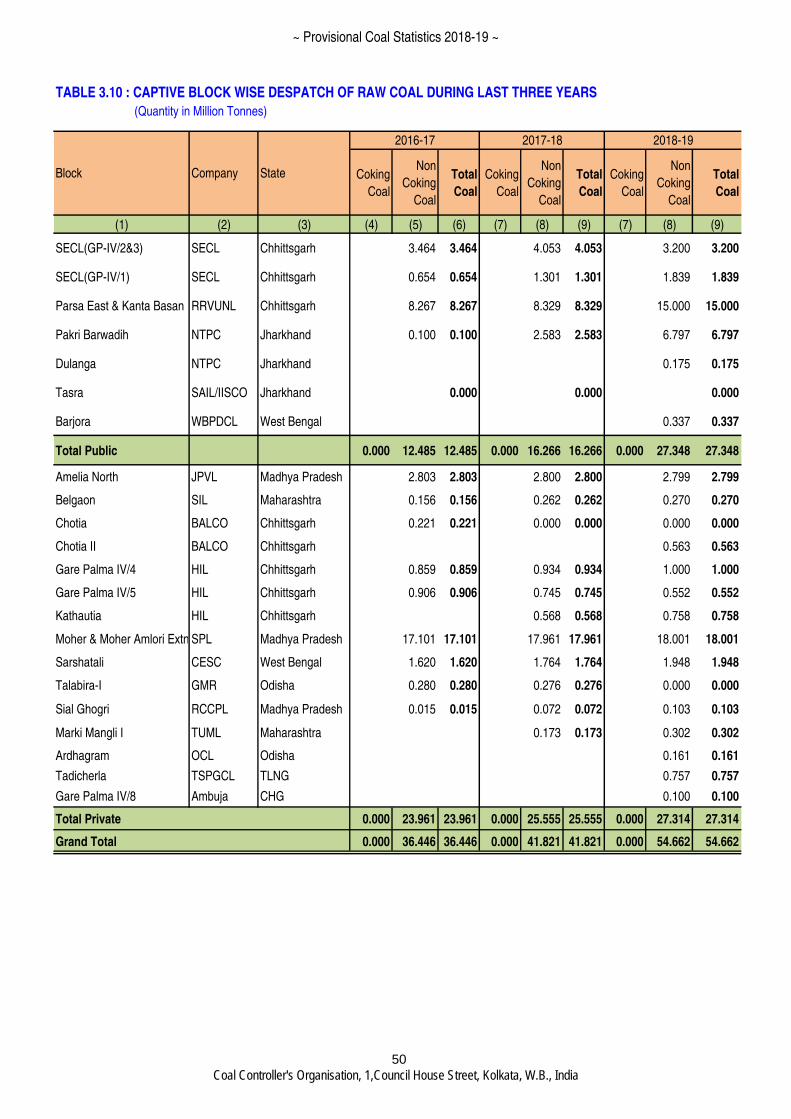
TABLE 3.10 : CAPTIVE BLOCK WISE DESPATCH OF RAW COAL DURING LAST THREE YEARS
(Quantity in Million Tonnes)
Coking
Coal
Non
Coking
Coal
Total
Coal
Coking
Coal
Non
Coking
Coal
Total
Coal
Coking
Coal
Non
Coking
Coal
Total
Coal
(1) (2) (3) (4) (5) (6) (7) (8) (9) (7) (8) (9)
SECL(GP-IV/2&3) SECL Chhittsgarh 3.464 3.464 4.053 4.053 3.200 3.200
SECL(GP-IV/1) SECL Chhittsgarh 0.654 0.654 1.301 1.301 1.839 1.839
Parsa East & Kanta Basan RRVUNL Chhittsgarh 8.267 8.267 8.329 8.329 15.000 15.000
Pakri Barwadih NTPC Jharkhand 0.100 0.100 2.583 2.583 6.797 6.797
Dulanga NTPC Jharkhand 0.175 0.175
Tasra SAIL/IISCO Jharkhand 0.000 0.000 0.000
Barjora WBPDCL West Bengal 0.337 0.337
Total Public 0.000 12.485 12.485 0.000 16.266 16.266 0.000 27.348 27.348
Amelia North JPVL Madhya Pradesh 2.803 2.803 2.800 2.800 2.799 2.799
Belgaon SIL Maharashtra 0.156 0.156 0.262 0.262 0.270 0.270
Chotia BALCO Chhittsgarh 0.221 0.221 0.000 0.000 0.000 0.000
Chotia II BALCO Chhittsgarh 0.563 0.563
Gare Palma IV/4 HIL Chhittsgarh 0.859 0.859 0.934 0.934 1.000 1.000
Gare Palma IV/5 HIL Chhittsgarh 0.906 0.906 0.745 0.745 0.552 0.552
Kathautia HIL Chhittsgarh 0.568 0.568 0.758 0.758
Moher & Moher Amlori Extn SPL Madhya Pradesh 17.101 17.101 17.961 17.961 18.001 18.001
Sarshatali CESC West Bengal 1.620 1.620 1.764 1.764 1.948 1.948
Talabira-I GMR Odisha 0.280 0.280 0.276 0.276 0.000 0.000
Sial Ghogri RCCPL Madhya Pradesh 0.015 0.015 0.072 0.072 0.103 0.103
Marki Mangli I TUML Maharashtra 0.173 0.173 0.302 0.302
Ardhagram OCL Odisha 0.161 0.161
Tadicherla TSPGCL TLNG 0.757 0.757
Gare Palma IV/8 Ambuja CHG 0.100 0.100
Total Private 0.000 23.961 23.961 0.000 25.555 25.555 0.000 27.314 27.314
Grand Total 0.000 36.446 36.446 0.000 41.821 41.821 0.000 54.662 54.662
2016-17 2017-18 2018-19
Block Company State
50
~ Provisional Coal Statistics 2018-19 ~
Coal Controller's Organisation, 1,Council House Street, Kolkata, W.B., India
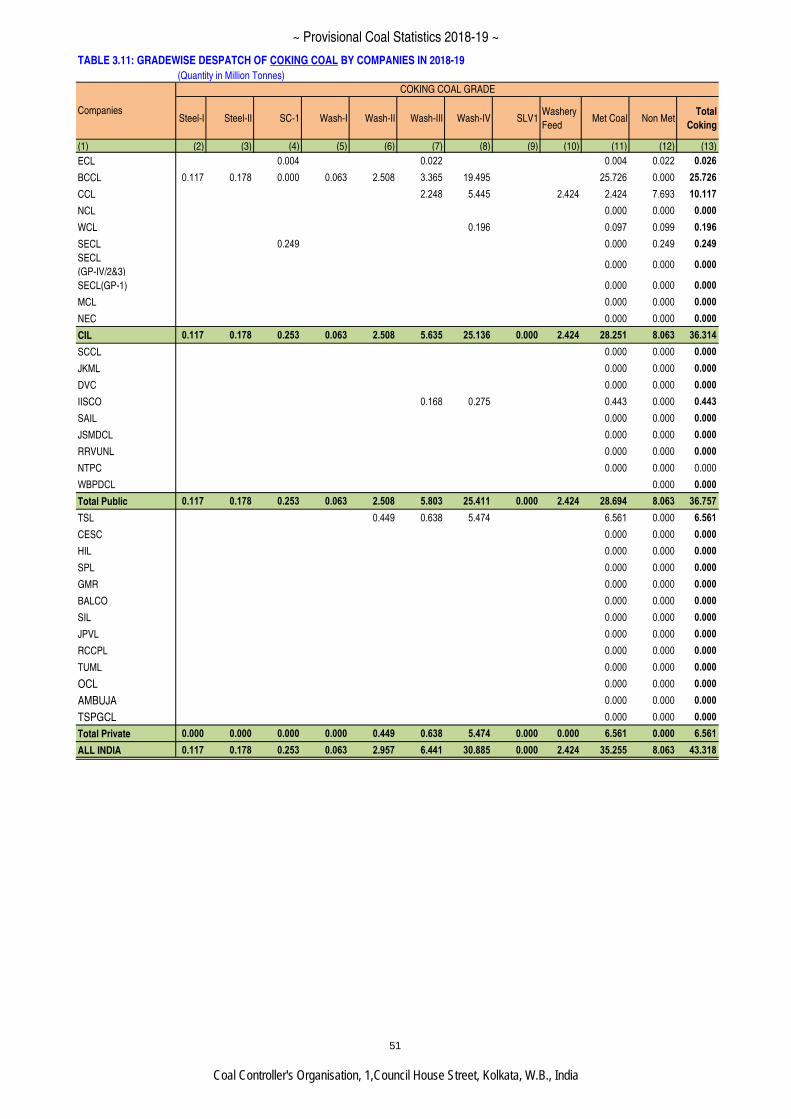
TABLE 3.11: GRADEWISE DESPATCH OF COKING COAL BY COMPANIES IN 2018-19
(Quantity in Million Tonnes)
Steel-I Steel-II SC-1 Wash-I Wash-II Wash-III Wash-IV SLV1Washery
FeedMet Coal Non Met
Total
Coking
(1) (2) (3) (4) (5) (6) (7) (8) (9) (10) (11) (12) (13)
ECL 0.004 0.022 0.004 0.022 0.026
BCCL 0.117 0.178 0.000 0.063 2.508 3.365 19.495 25.726 0.000 25.726
CCL 2.248 5.445 2.424 2.424 7.693 10.117
NCL 0.000 0.000 0.000
WCL 0.196 0.097 0.099 0.196
SECL 0.249 0.000 0.249 0.249
SECL
(GP-IV/2&3)0.000 0.000 0.000
SECL(GP-1) 0.000 0.000 0.000
MCL 0.000 0.000 0.000
NEC 0.000 0.000 0.000
CIL 0.117 0.178 0.253 0.063 2.508 5.635 25.136 0.000 2.424 28.251 8.063 36.314
SCCL 0.000 0.000 0.000
JKML 0.000 0.000 0.000
DVC 0.000 0.000 0.000
IISCO 0.168 0.275 0.443 0.000 0.443
SAIL 0.000 0.000 0.000
JSMDCL 0.000 0.000 0.000
RRVUNL 0.000 0.000 0.000
NTPC 0.000 0.000 0.000
WBPDCL 0.000 0.000
Total Public 0.117 0.178 0.253 0.063 2.508 5.803 25.411 0.000 2.424 28.694 8.063 36.757
TSL 0.449 0.638 5.474 6.561 0.000 6.561
CESC 0.000 0.000 0.000
HIL 0.000 0.000 0.000
SPL 0.000 0.000 0.000
GMR 0.000 0.000 0.000
BALCO 0.000 0.000 0.000
SIL 0.000 0.000 0.000
JPVL 0.000 0.000 0.000
RCCPL 0.000 0.000 0.000
TUML 0.000 0.000 0.000
OCL 0.000 0.000 0.000
AMBUJA 0.000 0.000 0.000
TSPGCL 0.000 0.000 0.000
Total Private 0.000 0.000 0.000 0.000 0.449 0.638 5.474 0.000 0.000 6.561 0.000 6.561
ALL INDIA 0.117 0.178 0.253 0.063 2.957 6.441 30.885 0.000 2.424 35.255 8.063 43.318
Companies
COKING COAL GRADE
51
~ Provisional Coal Statistics 2018-19 ~
Coal Controller's Organisation, 1,Council House Street, Kolkata, W.B., India
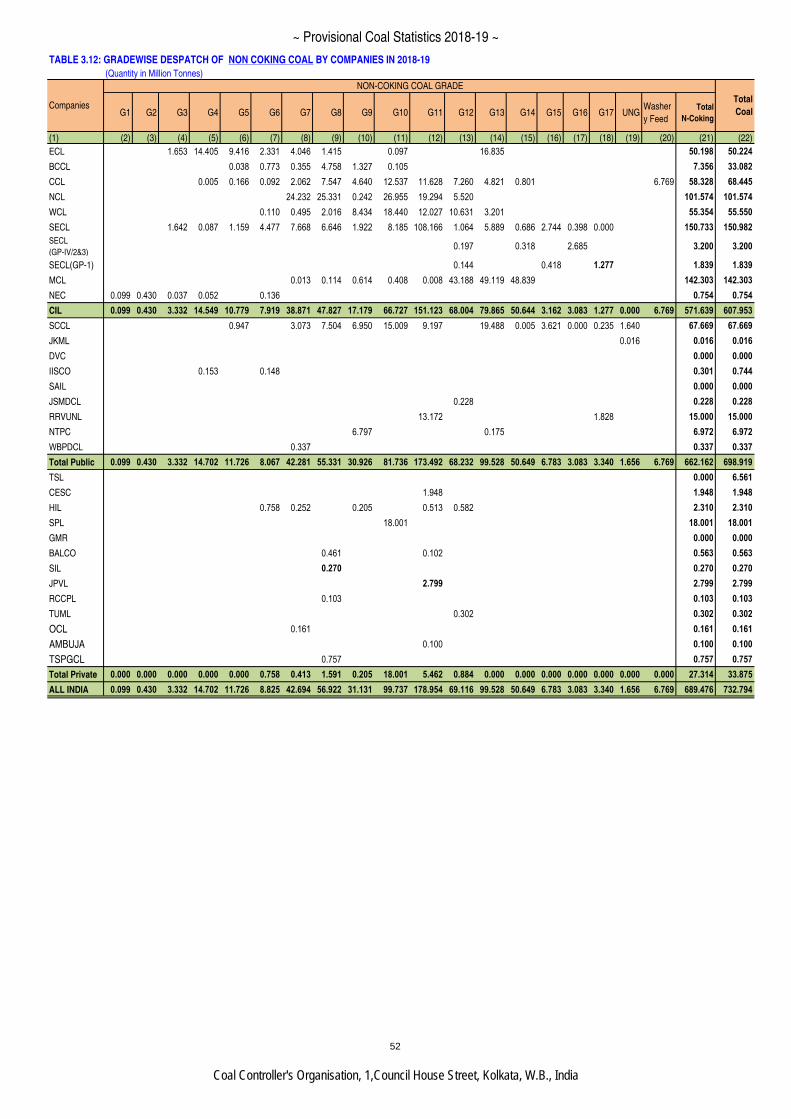
TABLE 3.12: GRADEWISE DESPATCH OF NON COKING COAL BY COMPANIES IN 2018-19
(Quantity in Million Tonnes)
G1 G2 G3 G4 G5 G6 G7 G8 G9 G10 G11 G12 G13 G14 G15 G16 G17 UNGWasher
y Feed
Total
N-Coking
(1) (2) (3) (4) (5) (6) (7) (8) (9) (10) (11) (12) (13) (14) (15) (16) (17) (18) (19) (20) (21) (22)
ECL 1.653 14.405 9.416 2.331 4.046 1.415 0.097 16.835 50.198 50.224
BCCL 0.038 0.773 0.355 4.758 1.327 0.105 7.356 33.082
CCL 0.005 0.166 0.092 2.062 7.547 4.640 12.537 11.628 7.260 4.821 0.801 6.769 58.328 68.445
NCL 24.232 25.331 0.242 26.955 19.294 5.520 101.574 101.574
WCL 0.110 0.495 2.016 8.434 18.440 12.027 10.631 3.201 55.354 55.550
SECL 1.642 0.087 1.159 4.477 7.668 6.646 1.922 8.185 108.166 1.064 5.889 0.686 2.744 0.398 0.000 150.733 150.982
SECL
(GP-IV/2&3)0.197 0.318 2.685 3.200 3.200
SECL(GP-1) 0.144 0.418 1.277 1.839 1.839
MCL 0.013 0.114 0.614 0.408 0.008 43.188 49.119 48.839 142.303 142.303
NEC 0.099 0.430 0.037 0.052 0.136 0.754 0.754
CIL 0.099 0.430 3.332 14.549 10.779 7.919 38.871 47.827 17.179 66.727 151.123 68.004 79.865 50.644 3.162 3.083 1.277 0.000 6.769 571.639 607.953
SCCL 0.947 3.073 7.504 6.950 15.009 9.197 19.488 0.005 3.621 0.000 0.235 1.640 67.669 67.669
JKML 0.016 0.016 0.016
DVC 0.000 0.000
IISCO 0.153 0.148 0.301 0.744
SAIL 0.000 0.000
JSMDCL 0.228 0.228 0.228
RRVUNL 13.172 1.828 15.000 15.000
NTPC 6.797 0.175 6.972 6.972
WBPDCL 0.337 0.337 0.337
Total Public 0.099 0.430 3.332 14.702 11.726 8.067 42.281 55.331 30.926 81.736 173.492 68.232 99.528 50.649 6.783 3.083 3.340 1.656 6.769 662.162 698.919
TSL 0.000 6.561
CESC 1.948 1.948 1.948
HIL 0.758 0.252 0.205 0.513 0.582 2.310 2.310
SPL 18.001 18.001 18.001
GMR 0.000 0.000
BALCO 0.461 0.102 0.563 0.563
SIL 0.270 0.270 0.270
JPVL 2.799 2.799 2.799
RCCPL 0.103 0.103 0.103
TUML 0.302 0.302 0.302
OCL 0.161 0.161 0.161
AMBUJA 0.100 0.100 0.100
TSPGCL 0.757 0.757 0.757
Total Private 0.000 0.000 0.000 0.000 0.000 0.758 0.413 1.591 0.205 18.001 5.462 0.884 0.000 0.000 0.000 0.000 0.000 0.000 0.000 27.314 33.875
ALL INDIA 0.099 0.430 3.332 14.702 11.726 8.825 42.694 56.922 31.131 99.737 178.954 69.116 99.528 50.649 6.783 3.083 3.340 1.656 6.769 689.476 732.794
Companies
NON-COKING COAL GRADE
Total
Coal
52
~ Provisional Coal Statistics 2018-19 ~
Coal Controller's Organisation, 1,Council House Street, Kolkata, W.B., India
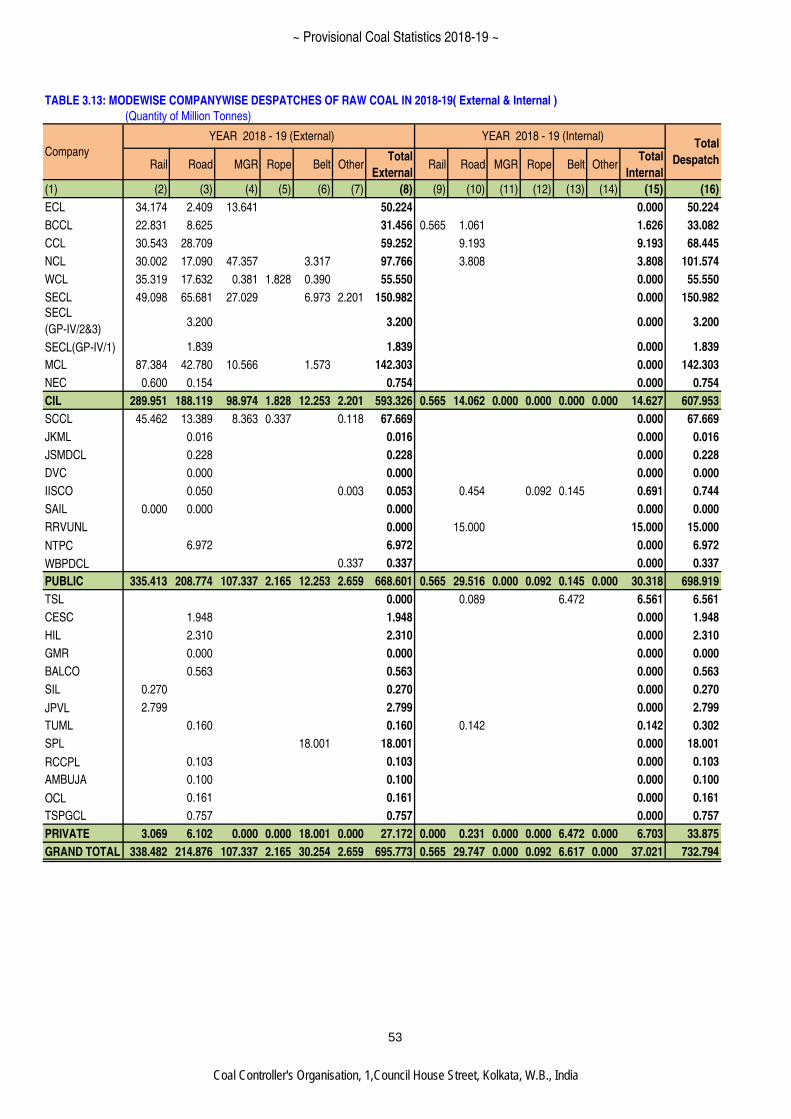
TABLE 3.13: MODEWISE COMPANYWISE DESPATCHES OF RAW COAL IN 2018-19( External & Internal )
(Quantity of Million Tonnes)
Rail Road MGR Rope Belt OtherTotal
ExternalRail Road MGR Rope Belt Other
Total
Internal
(1) (2) (3) (4) (5) (6) (7) (8) (9) (10) (11) (12) (13) (14) (15) (16)
ECL 34.174 2.409 13.641 50.224 0.000 50.224
BCCL 22.831 8.625 31.456 0.565 1.061 1.626 33.082
CCL 30.543 28.709 59.252 9.193 9.193 68.445
NCL 30.002 17.090 47.357 3.317 97.766 3.808 3.808 101.574
WCL 35.319 17.632 0.381 1.828 0.390 55.550 0.000 55.550
SECL 49.098 65.681 27.029 6.973 2.201 150.982 0.000 150.982
SECL
(GP-IV/2&3)3.200 3.200 0.000 3.200
SECL(GP-IV/1) 1.839 1.839 0.000 1.839
MCL 87.384 42.780 10.566 1.573 142.303 0.000 142.303
NEC 0.600 0.154 0.754 0.000 0.754
CIL 289.951 188.119 98.974 1.828 12.253 2.201 593.326 0.565 14.062 0.000 0.000 0.000 0.000 14.627 607.953
SCCL 45.462 13.389 8.363 0.337 0.118 67.669 0.000 67.669
JKML 0.016 0.016 0.000 0.016
JSMDCL 0.228 0.228 0.000 0.228
DVC 0.000 0.000 0.000 0.000
IISCO 0.050 0.003 0.053 0.454 0.092 0.145 0.691 0.744
SAIL 0.000 0.000 0.000 0.000 0.000
RRVUNL 0.000 15.000 15.000 15.000
NTPC 6.972 6.972 0.000 6.972
WBPDCL 0.337 0.337 0.000 0.337
PUBLIC 335.413 208.774 107.337 2.165 12.253 2.659 668.601 0.565 29.516 0.000 0.092 0.145 0.000 30.318 698.919
TSL 0.000 0.089 6.472 6.561 6.561
CESC 1.948 1.948 0.000 1.948
HIL 2.310 2.310 0.000 2.310
GMR 0.000 0.000 0.000 0.000
BALCO 0.563 0.563 0.000 0.563
SIL 0.270 0.270 0.000 0.270
JPVL 2.799 2.799 0.000 2.799
TUML 0.160 0.160 0.142 0.142 0.302
SPL 18.001 18.001 0.000 18.001
RCCPL 0.103 0.103 0.000 0.103
AMBUJA 0.100 0.100 0.000 0.100
OCL 0.161 0.161 0.000 0.161
TSPGCL 0.757 0.757 0.000 0.757
PRIVATE 3.069 6.102 0.000 0.000 18.001 0.000 27.172 0.000 0.231 0.000 0.000 6.472 0.000 6.703 33.875
GRAND TOTAL 338.482 214.876 107.337 2.165 30.254 2.659 695.773 0.565 29.747 0.000 0.092 6.617 0.000 37.021 732.794
Company
YEAR 2018 - 19 (External) YEAR 2018 - 19 (Internal)Total
Despatch
53
~ Provisional Coal Statistics 2018-19 ~
Coal Controller's Organisation, 1,Council House Street, Kolkata, W.B., India
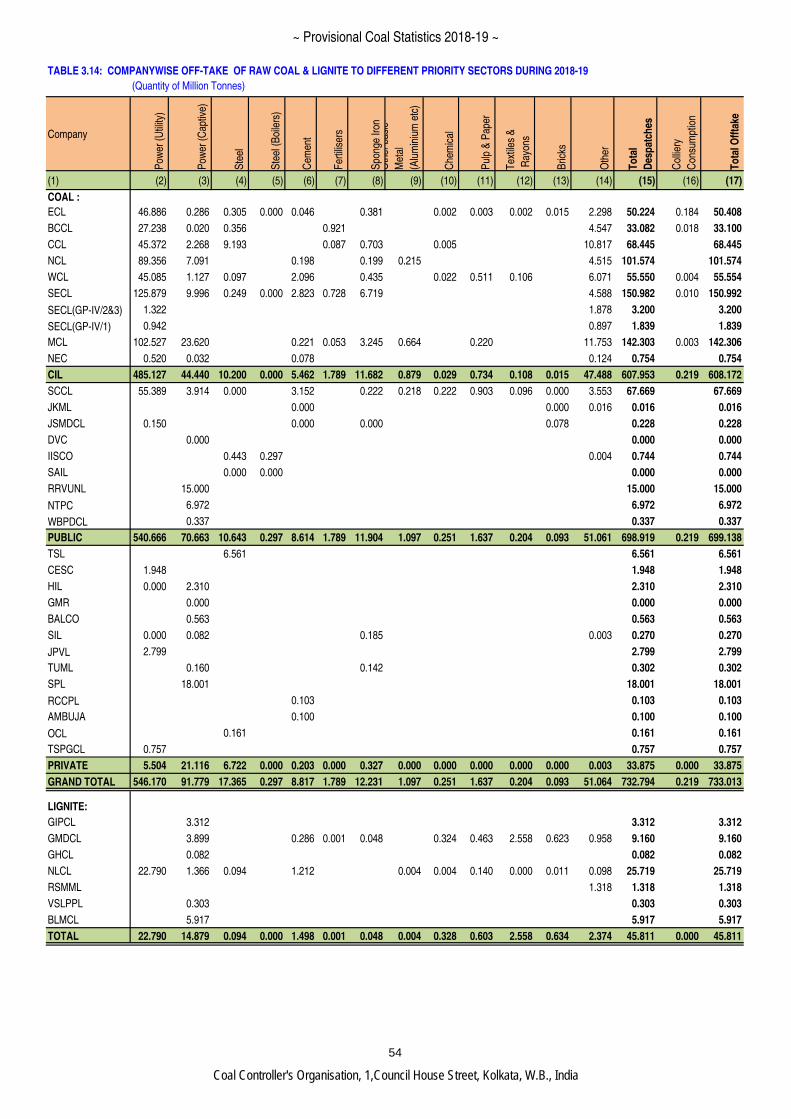
TABLE 3.14: COMPANYWISE OFF-TAKE OF RAW COAL & LIGNITE TO DIFFERENT PRIORITY SECTORS DURING 2018-19
(Quantity of Million Tonnes)
Company
Pow
er (
Util
ity)
Pow
er (
Cap
tive)
Ste
el
Ste
el (
Boi
lers
)
Cem
ent
Fer
tilis
ers
Spo
nge
Iron
Oth
er b
asic
-
Met
al
(Alu
min
ium
etc
)
Che
mic
al
Pul
p &
Pap
er
Tex
tiles
&
Ray
ons
Bric
ks
Oth
er
To
tal
Des
pat
ches
Col
liery
Con
sum
ptio
n
To
tal O
ffta
ke
(1) (2) (3) (4) (5) (6) (7) (8) (9) (10) (11) (12) (13) (14) (15) (16) (17)
COAL :
ECL 46.886 0.286 0.305 0.000 0.046 0.381 0.002 0.003 0.002 0.015 2.298 50.224 0.184 50.408
BCCL 27.238 0.020 0.356 0.921 4.547 33.082 0.018 33.100
CCL 45.372 2.268 9.193 0.087 0.703 0.005 10.817 68.445 68.445
NCL 89.356 7.091 0.198 0.199 0.215 4.515 101.574 101.574
WCL 45.085 1.127 0.097 2.096 0.435 0.022 0.511 0.106 6.071 55.550 0.004 55.554
SECL 125.879 9.996 0.249 0.000 2.823 0.728 6.719 4.588 150.982 0.010 150.992
SECL(GP-IV/2&3) 1.322 1.878 3.200 3.200
SECL(GP-IV/1) 0.942 0.897 1.839 1.839
MCL 102.527 23.620 0.221 0.053 3.245 0.664 0.220 11.753 142.303 0.003 142.306
NEC 0.520 0.032 0.078 0.124 0.754 0.754
CIL 485.127 44.440 10.200 0.000 5.462 1.789 11.682 0.879 0.029 0.734 0.108 0.015 47.488 607.953 0.219 608.172
SCCL 55.389 3.914 0.000 3.152 0.222 0.218 0.222 0.903 0.096 0.000 3.553 67.669 67.669
JKML 0.000 0.000 0.016 0.016 0.016
JSMDCL 0.150 0.000 0.000 0.078 0.228 0.228
DVC 0.000 0.000 0.000
IISCO 0.443 0.297 0.004 0.744 0.744
SAIL 0.000 0.000 0.000 0.000
RRVUNL 15.000 15.000 15.000
NTPC 6.972 6.972 6.972
WBPDCL 0.337 0.337 0.337
PUBLIC 540.666 70.663 10.643 0.297 8.614 1.789 11.904 1.097 0.251 1.637 0.204 0.093 51.061 698.919 0.219 699.138
TSL 6.561 6.561 6.561
CESC 1.948 1.948 1.948
HIL 0.000 2.310 2.310 2.310
GMR 0.000 0.000 0.000
BALCO 0.563 0.563 0.563
SIL 0.000 0.082 0.185 0.003 0.270 0.270
JPVL 2.799 2.799 2.799
TUML 0.160 0.142 0.302 0.302
SPL 18.001 18.001 18.001
RCCPL 0.103 0.103 0.103
AMBUJA 0.100 0.100 0.100
OCL 0.161 0.161 0.161
TSPGCL 0.757 0.757 0.757
PRIVATE 5.504 21.116 6.722 0.000 0.203 0.000 0.327 0.000 0.000 0.000 0.000 0.000 0.003 33.875 0.000 33.875
GRAND TOTAL 546.170 91.779 17.365 0.297 8.817 1.789 12.231 1.097 0.251 1.637 0.204 0.093 51.064 732.794 0.219 733.013
LIGNITE:
GIPCL 3.312 3.312 3.312
GMDCL 3.899 0.286 0.001 0.048 0.324 0.463 2.558 0.623 0.958 9.160 9.160
GHCL 0.082 0.082 0.082
NLCL 22.790 1.366 0.094 1.212 0.004 0.004 0.140 0.000 0.011 0.098 25.719 25.719
RSMML 1.318 1.318 1.318
VSLPPL 0.303 0.303 0.303
BLMCL 5.917 5.917 5.917
TOTAL 22.790 14.879 0.094 0.000 1.498 0.001 0.048 0.004 0.328 0.603 2.558 0.634 2.374 45.811 0.000 45.811
54
~ Provisional Coal Statistics 2018-19 ~
Coal Controller's Organisation, 1,Council House Street, Kolkata, W.B., India
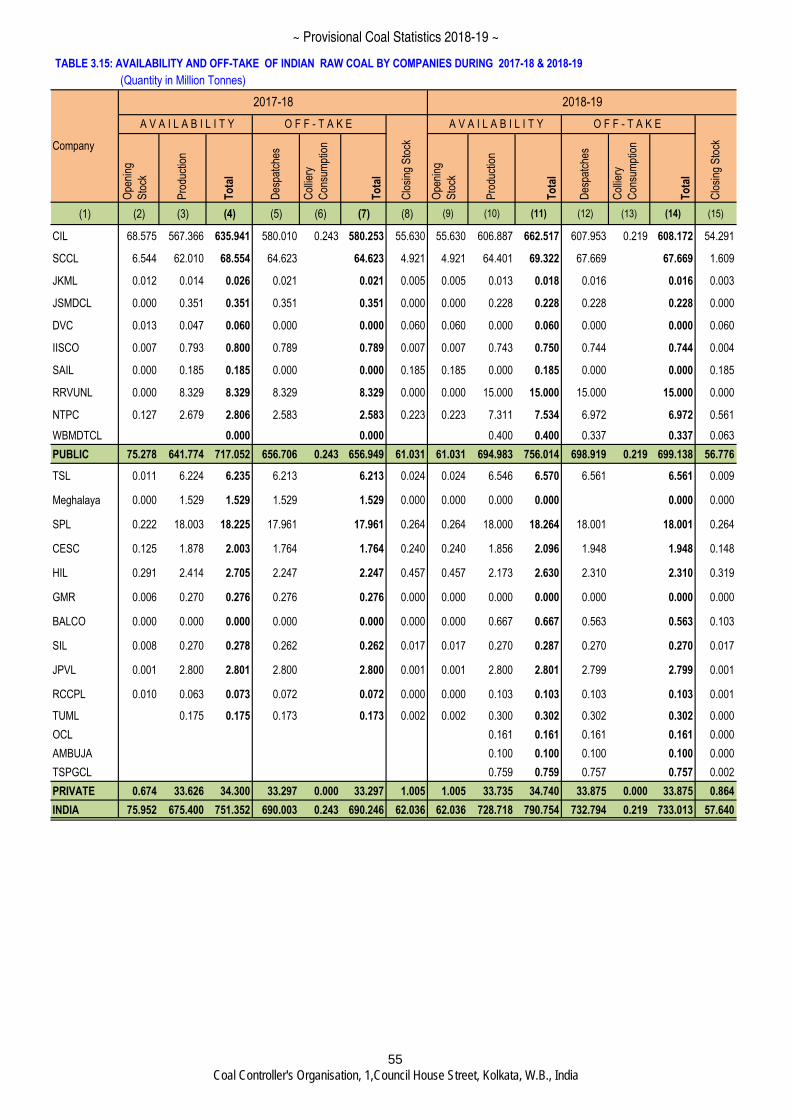
TABLE 3.15: AVAILABILITY AND OFF-TAKE OF INDIAN RAW COAL BY COMPANIES DURING 2017-18 & 2018-19
(Quantity in Million Tonnes)
(1) (2) (3) (4) (5) (6) (7) (8) (9) (10) (11) (12) (13) (14) (15)
CIL 68.575 567.366 635.941 580.010 0.243 580.253 55.630 55.630 606.887 662.517 607.953 0.219 608.172 54.291
SCCL 6.544 62.010 68.554 64.623 64.623 4.921 4.921 64.401 69.322 67.669 67.669 1.609
JKML 0.012 0.014 0.026 0.021 0.021 0.005 0.005 0.013 0.018 0.016 0.016 0.003
JSMDCL 0.000 0.351 0.351 0.351 0.351 0.000 0.000 0.228 0.228 0.228 0.228 0.000
DVC 0.013 0.047 0.060 0.000 0.000 0.060 0.060 0.000 0.060 0.000 0.000 0.060
IISCO 0.007 0.793 0.800 0.789 0.789 0.007 0.007 0.743 0.750 0.744 0.744 0.004
SAIL 0.000 0.185 0.185 0.000 0.000 0.185 0.185 0.000 0.185 0.000 0.000 0.185
RRVUNL 0.000 8.329 8.329 8.329 8.329 0.000 0.000 15.000 15.000 15.000 15.000 0.000
NTPC 0.127 2.679 2.806 2.583 2.583 0.223 0.223 7.311 7.534 6.972 6.972 0.561
WBMDTCL 0.000 0.000 0.400 0.400 0.337 0.337 0.063
PUBLIC 75.278 641.774 717.052 656.706 0.243 656.949 61.031 61.031 694.983 756.014 698.919 0.219 699.138 56.776
TSL 0.011 6.224 6.235 6.213 6.213 0.024 0.024 6.546 6.570 6.561 6.561 0.009
Meghalaya 0.000 1.529 1.529 1.529 1.529 0.000 0.000 0.000 0.000 0.000 0.000
SPL 0.222 18.003 18.225 17.961 17.961 0.264 0.264 18.000 18.264 18.001 18.001 0.264
CESC 0.125 1.878 2.003 1.764 1.764 0.240 0.240 1.856 2.096 1.948 1.948 0.148
HIL 0.291 2.414 2.705 2.247 2.247 0.457 0.457 2.173 2.630 2.310 2.310 0.319
GMR 0.006 0.270 0.276 0.276 0.276 0.000 0.000 0.000 0.000 0.000 0.000 0.000
BALCO 0.000 0.000 0.000 0.000 0.000 0.000 0.000 0.667 0.667 0.563 0.563 0.103
SIL 0.008 0.270 0.278 0.262 0.262 0.017 0.017 0.270 0.287 0.270 0.270 0.017
JPVL 0.001 2.800 2.801 2.800 2.800 0.001 0.001 2.800 2.801 2.799 2.799 0.001
RCCPL 0.010 0.063 0.073 0.072 0.072 0.000 0.000 0.103 0.103 0.103 0.103 0.001
TUML 0.175 0.175 0.173 0.173 0.002 0.002 0.300 0.302 0.302 0.302 0.000
OCL 0.161 0.161 0.161 0.161 0.000
AMBUJA 0.100 0.100 0.100 0.100 0.000
TSPGCL 0.759 0.759 0.757 0.757 0.002
PRIVATE 0.674 33.626 34.300 33.297 0.000 33.297 1.005 1.005 33.735 34.740 33.875 0.000 33.875 0.864
INDIA 75.952 675.400 751.352 690.003 0.243 690.246 62.036 62.036 728.718 790.754 732.794 0.219 733.013 57.640
To
tal
Des
patc
hes
Col
liery
Con
sum
ptio
n
To
tal
2018-19
A V A I L A B I L I T Y O F F - T A K E
Clo
sing
Sto
ck
Ope
ning
Sto
ck
Ope
ning
Sto
ck
O F F - T A K E
Clo
sing
Sto
ck
Pro
duct
ion
To
tal
Des
patc
hes
Col
liery
Con
sum
ptio
n
To
tal
Pro
duct
ion
2017-18
A V A I L A B I L I T Y
Company
55
~ Provisional Coal Statistics 2018-19 ~
Coal Controller's Organisation, 1,Council House Street, Kolkata, W.B., India
~ Provisional Coal Statistics 2018-19 ~
Coal Controller's Organisation, 1,Council House Street, Kolkata, W.B., India
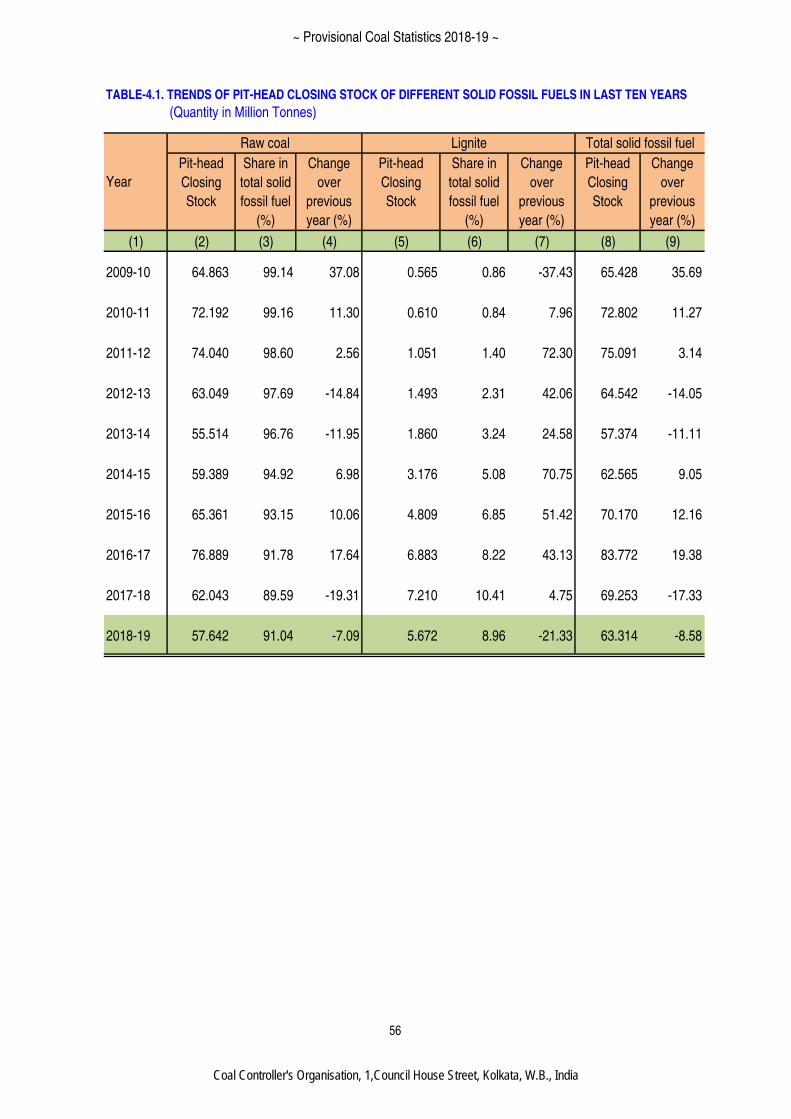
(Quantity in Million Tonnes)
Pit-head
Closing
Stock
Share in
total solid
fossil fuel
(%)
Change
over
previous
year (%)
Pit-head
Closing
Stock
Share in
total solid
fossil fuel
(%)
Change
over
previous
year (%)
Pit-head
Closing
Stock
Change
over
previous
year (%)
(1) (2) (3) (4) (5) (6) (7) (8) (9)
2009-10 64.863 99.14 37.08 0.565 0.86 -37.43 65.428 35.69
2010-11 72.192 99.16 11.30 0.610 0.84 7.96 72.802 11.27
2011-12 74.040 98.60 2.56 1.051 1.40 72.30 75.091 3.14
2012-13 63.049 97.69 -14.84 1.493 2.31 42.06 64.542 -14.05
2013-14 55.514 96.76 -11.95 1.860 3.24 24.58 57.374 -11.11
2014-15 59.389 94.92 6.98 3.176 5.08 70.75 62.565 9.05
2015-16 65.361 93.15 10.06 4.809 6.85 51.42 70.170 12.16
2016-17 76.889 91.78 17.64 6.883 8.22 43.13 83.772 19.38
2017-18 62.043 89.59 -19.31 7.210 10.41 4.75 69.253 -17.33
2018-19 57.642 91.04 -7.09 5.672 8.96 -21.33 63.314 -8.58
TABLE-4.1. TRENDS OF PIT-HEAD CLOSING STOCK OF DIFFERENT SOLID FOSSIL FUELS IN LAST TEN YEARS
Year
Raw coal Lignite Total solid fossil fuel
56
~ Provisional Coal Statistics 2018-19 ~
Coal Controller's Organisation, 1,Council House Street, Kolkata, W.B., India
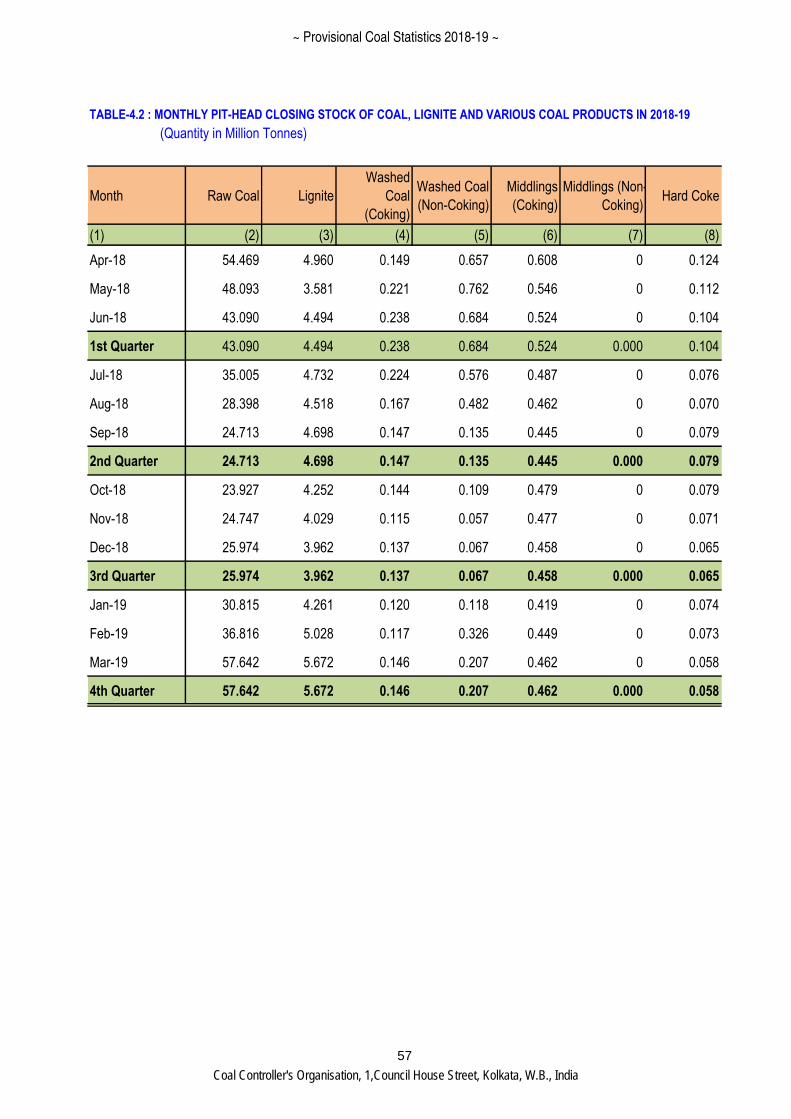
TABLE-4.2 : MONTHLY PIT-HEAD CLOSING STOCK OF COAL, LIGNITE AND VARIOUS COAL PRODUCTS IN 2018-19
(Quantity in Million Tonnes)
Month Raw Coal Lignite
Washed
Coal
(Coking)
Washed Coal
(Non-Coking)
Middlings
(Coking)
Middlings (Non-
Coking)Hard Coke
(1) (2) (3) (4) (5) (6) (7) (8)
Apr-18 54.469 4.960 0.149 0.657 0.608 0 0.124
May-18 48.093 3.581 0.221 0.762 0.546 0 0.112
Jun-18 43.090 4.494 0.238 0.684 0.524 0 0.104
1st Quarter 43.090 4.494 0.238 0.684 0.524 0.000 0.104
Jul-18 35.005 4.732 0.224 0.576 0.487 0 0.076
Aug-18 28.398 4.518 0.167 0.482 0.462 0 0.070
Sep-18 24.713 4.698 0.147 0.135 0.445 0 0.079
2nd Quarter 24.713 4.698 0.147 0.135 0.445 0.000 0.079
Oct-18 23.927 4.252 0.144 0.109 0.479 0 0.079
Nov-18 24.747 4.029 0.115 0.057 0.477 0 0.071
Dec-18 25.974 3.962 0.137 0.067 0.458 0 0.065
3rd Quarter 25.974 3.962 0.137 0.067 0.458 0.000 0.065
Jan-19 30.815 4.261 0.120 0.118 0.419 0 0.074
Feb-19 36.816 5.028 0.117 0.326 0.449 0 0.073
Mar-19 57.642 5.672 0.146 0.207 0.462 0 0.058
4th Quarter 57.642 5.672 0.146 0.207 0.462 0.000 0.058
57
~ Provisional Coal Statistics 2018-19 ~
Coal Controller's Organisation, 1,Council House Street, Kolkata, W.B., India
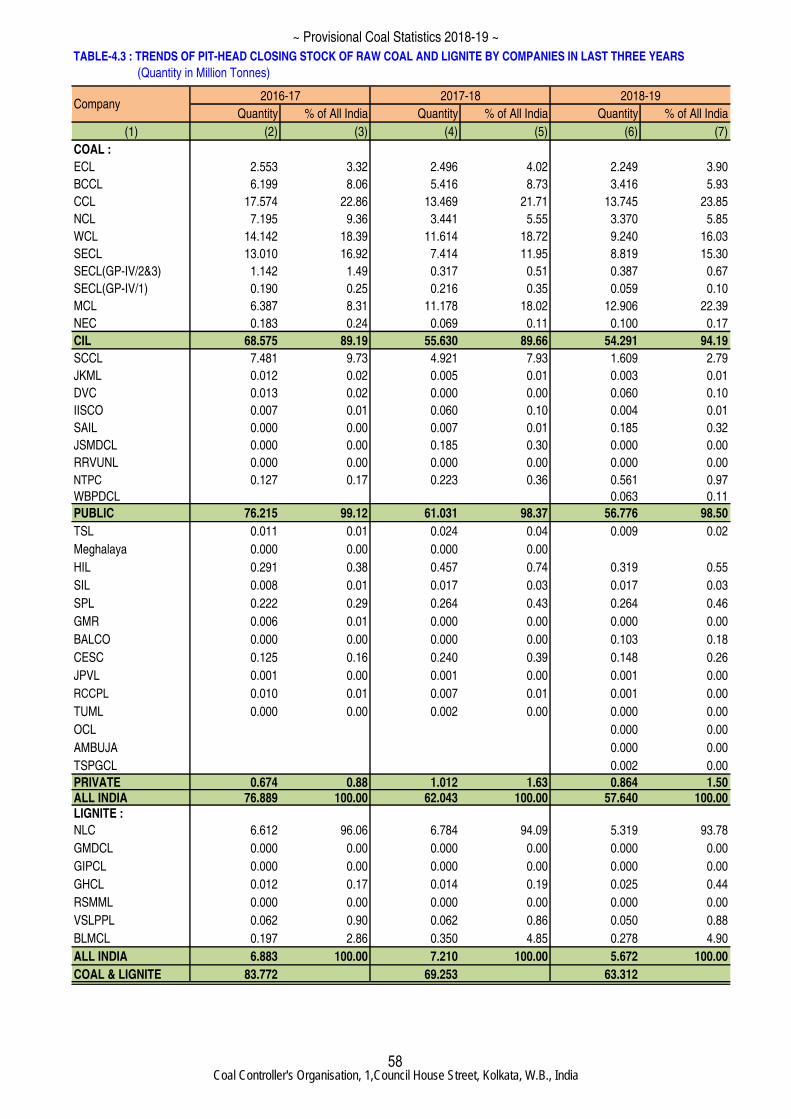
TABLE-4.3 : TRENDS OF PIT-HEAD CLOSING STOCK OF RAW COAL AND LIGNITE BY COMPANIES IN LAST THREE YEARS
(Quantity in Million Tonnes)
Quantity % of All India Quantity % of All India Quantity % of All India
(1) (2) (3) (4) (5) (6) (7)
COAL :
ECL 2.553 3.32 2.496 4.02 2.249 3.90
BCCL 6.199 8.06 5.416 8.73 3.416 5.93
CCL 17.574 22.86 13.469 21.71 13.745 23.85
NCL 7.195 9.36 3.441 5.55 3.370 5.85
WCL 14.142 18.39 11.614 18.72 9.240 16.03
SECL 13.010 16.92 7.414 11.95 8.819 15.30
SECL(GP-IV/2&3) 1.142 1.49 0.317 0.51 0.387 0.67
SECL(GP-IV/1) 0.190 0.25 0.216 0.35 0.059 0.10
MCL 6.387 8.31 11.178 18.02 12.906 22.39
NEC 0.183 0.24 0.069 0.11 0.100 0.17
CIL 68.575 89.19 55.630 89.66 54.291 94.19
SCCL 7.481 9.73 4.921 7.93 1.609 2.79
JKML 0.012 0.02 0.005 0.01 0.003 0.01
DVC 0.013 0.02 0.000 0.00 0.060 0.10
IISCO 0.007 0.01 0.060 0.10 0.004 0.01
SAIL 0.000 0.00 0.007 0.01 0.185 0.32
JSMDCL 0.000 0.00 0.185 0.30 0.000 0.00
RRVUNL 0.000 0.00 0.000 0.00 0.000 0.00
NTPC 0.127 0.17 0.223 0.36 0.561 0.97
WBPDCL 0.063 0.11
PUBLIC 76.215 99.12 61.031 98.37 56.776 98.50
TSL 0.011 0.01 0.024 0.04 0.009 0.02
Meghalaya 0.000 0.00 0.000 0.00
HIL 0.291 0.38 0.457 0.74 0.319 0.55
SIL 0.008 0.01 0.017 0.03 0.017 0.03
SPL 0.222 0.29 0.264 0.43 0.264 0.46
GMR 0.006 0.01 0.000 0.00 0.000 0.00
BALCO 0.000 0.00 0.000 0.00 0.103 0.18
CESC 0.125 0.16 0.240 0.39 0.148 0.26
JPVL 0.001 0.00 0.001 0.00 0.001 0.00
RCCPL 0.010 0.01 0.007 0.01 0.001 0.00
TUML 0.000 0.00 0.002 0.00 0.000 0.00
OCL 0.000 0.00
AMBUJA 0.000 0.00
TSPGCL 0.002 0.00
PRIVATE 0.674 0.88 1.012 1.63 0.864 1.50ALL INDIA 76.889 100.00 62.043 100.00 57.640 100.00LIGNITE :
NLC 6.612 96.06 6.784 94.09 5.319 93.78
GMDCL 0.000 0.00 0.000 0.00 0.000 0.00
GIPCL 0.000 0.00 0.000 0.00 0.000 0.00
GHCL 0.012 0.17 0.014 0.19 0.025 0.44
RSMML 0.000 0.00 0.000 0.00 0.000 0.00
VSLPPL 0.062 0.90 0.062 0.86 0.050 0.88
BLMCL 0.197 2.86 0.350 4.85 0.278 4.90
ALL INDIA 6.883 100.00 7.210 100.00 5.672 100.00
COAL & LIGNITE 83.772 69.253 63.312
2018-192017-182016-17Company
58
~ Provisional Coal Statistics 2018-19 ~
Coal Controller's Organisation, 1,Council House Street, Kolkata, W.B., India
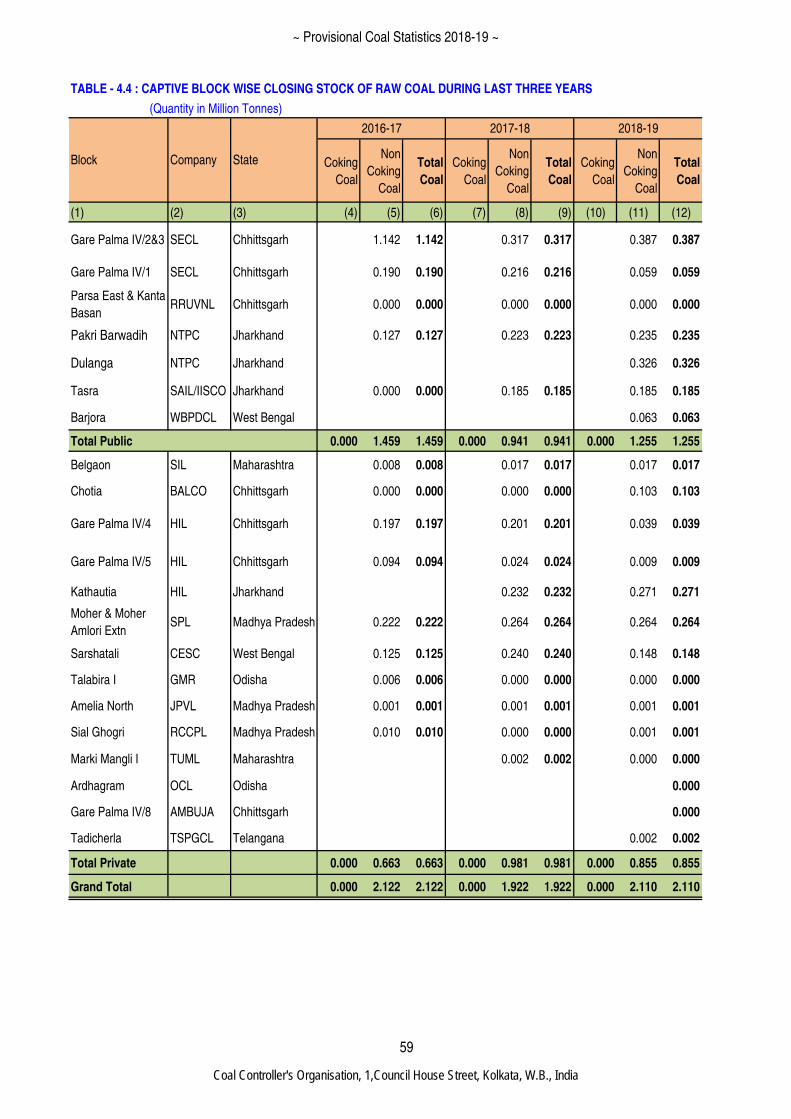
TABLE - 4.4 : CAPTIVE BLOCK WISE CLOSING STOCK OF RAW COAL DURING LAST THREE YEARS
(Quantity in Million Tonnes)
Coking
Coal
Non
Coking
Coal
Total
Coal
Coking
Coal
Non
Coking
Coal
Total
Coal
Coking
Coal
Non
Coking
Coal
Total
Coal
(1) (2) (3) (4) (5) (6) (7) (8) (9) (10) (11) (12)
Gare Palma IV/2&3 SECL Chhittsgarh 1.142 1.142 0.317 0.317 0.387 0.387
Gare Palma IV/1 SECL Chhittsgarh 0.190 0.190 0.216 0.216 0.059 0.059
Parsa East & Kanta
BasanRRUVNL Chhittsgarh 0.000 0.000 0.000 0.000 0.000 0.000
Pakri Barwadih NTPC Jharkhand 0.127 0.127 0.223 0.223 0.235 0.235
Dulanga NTPC Jharkhand 0.326 0.326
Tasra SAIL/IISCO Jharkhand 0.000 0.000 0.185 0.185 0.185 0.185
Barjora WBPDCL West Bengal 0.063 0.063
Total Public 0.000 1.459 1.459 0.000 0.941 0.941 0.000 1.255 1.255
Belgaon SIL Maharashtra 0.008 0.008 0.017 0.017 0.017 0.017
Chotia BALCO Chhittsgarh 0.000 0.000 0.000 0.000 0.103 0.103
Gare Palma IV/4 HIL Chhittsgarh 0.197 0.197 0.201 0.201 0.039 0.039
Gare Palma IV/5 HIL Chhittsgarh 0.094 0.094 0.024 0.024 0.009 0.009
Kathautia HIL Jharkhand 0.232 0.232 0.271 0.271
Moher & Moher
Amlori ExtnSPL Madhya Pradesh 0.222 0.222 0.264 0.264 0.264 0.264
Sarshatali CESC West Bengal 0.125 0.125 0.240 0.240 0.148 0.148
Talabira I GMR Odisha 0.006 0.006 0.000 0.000 0.000 0.000
Amelia North JPVL Madhya Pradesh 0.001 0.001 0.001 0.001 0.001 0.001
Sial Ghogri RCCPL Madhya Pradesh 0.010 0.010 0.000 0.000 0.001 0.001
Marki Mangli I TUML Maharashtra 0.002 0.002 0.000 0.000
Ardhagram OCL Odisha 0.000
Gare Palma IV/8 AMBUJA Chhittsgarh 0.000
Tadicherla TSPGCL Telangana 0.002 0.002
Total Private 0.000 0.663 0.663 0.000 0.981 0.981 0.000 0.855 0.855
Grand Total 0.000 2.122 2.122 0.000 1.922 1.922 0.000 2.110 2.110
2016-17 2017-18 2018-19
Block Company State
59
~ Provisional Coal Statistics 2018-19 ~
Coal Controller's Organisation, 1,Council House Street, Kolkata, W.B., India
~ Provisional Coal Statistics 2018-19 ~
Coal Controller's Organisation, 1,Council House Street, Kolkata, W.B., India
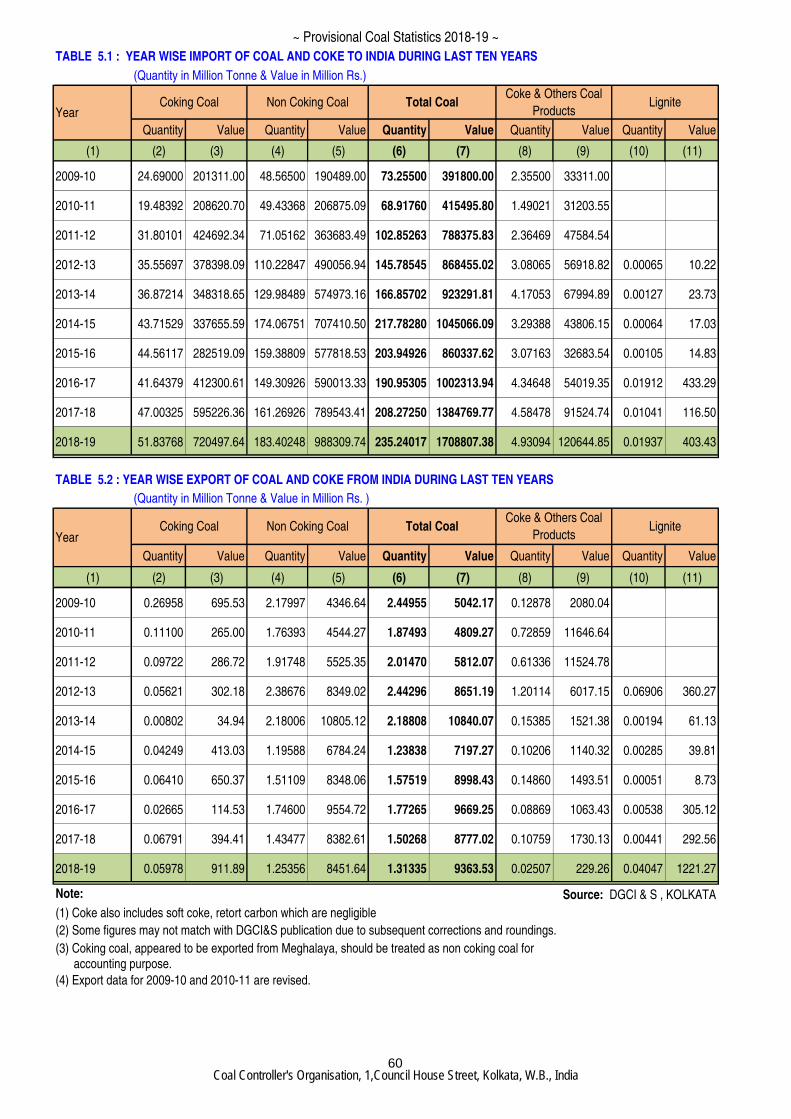
TABLE 5.1 : YEAR WISE IMPORT OF COAL AND COKE TO INDIA DURING LAST TEN YEARS
(Quantity in Million Tonne & Value in Million Rs.)
Quantity Value Quantity Value Quantity Value Quantity Value Quantity Value
(1) (2) (3) (4) (5) (6) (7) (8) (9) (10) (11)
2009-10 24.69000 201311.00 48.56500 190489.00 73.25500 391800.00 2.35500 33311.00
2010-11 19.48392 208620.70 49.43368 206875.09 68.91760 415495.80 1.49021 31203.55
2011-12 31.80101 424692.34 71.05162 363683.49 102.85263 788375.83 2.36469 47584.54
2012-13 35.55697 378398.09 110.22847 490056.94 145.78545 868455.02 3.08065 56918.82 0.00065 10.22
2013-14 36.87214 348318.65 129.98489 574973.16 166.85702 923291.81 4.17053 67994.89 0.00127 23.73
2014-15 43.71529 337655.59 174.06751 707410.50 217.78280 1045066.09 3.29388 43806.15 0.00064 17.03
2015-16 44.56117 282519.09 159.38809 577818.53 203.94926 860337.62 3.07163 32683.54 0.00105 14.83
2016-17 41.64379 412300.61 149.30926 590013.33 190.95305 1002313.94 4.34648 54019.35 0.01912 433.29
2017-18 47.00325 595226.36 161.26926 789543.41 208.27250 1384769.77 4.58478 91524.74 0.01041 116.50
2018-19 51.83768 720497.64 183.40248 988309.74 235.24017 1708807.38 4.93094 120644.85 0.01937 403.43
TABLE 5.2 : YEAR WISE EXPORT OF COAL AND COKE FROM INDIA DURING LAST TEN YEARS
(Quantity in Million Tonne & Value in Million Rs. )
Quantity Value Quantity Value Quantity Value Quantity Value Quantity Value
(1) (2) (3) (4) (5) (6) (7) (8) (9) (10) (11)
2009-10 0.26958 695.53 2.17997 4346.64 2.44955 5042.17 0.12878 2080.04
2010-11 0.11100 265.00 1.76393 4544.27 1.87493 4809.27 0.72859 11646.64
2011-12 0.09722 286.72 1.91748 5525.35 2.01470 5812.07 0.61336 11524.78
2012-13 0.05621 302.18 2.38676 8349.02 2.44296 8651.19 1.20114 6017.15 0.06906 360.27
2013-14 0.00802 34.94 2.18006 10805.12 2.18808 10840.07 0.15385 1521.38 0.00194 61.13
2014-15 0.04249 413.03 1.19588 6784.24 1.23838 7197.27 0.10206 1140.32 0.00285 39.81
2015-16 0.06410 650.37 1.51109 8348.06 1.57519 8998.43 0.14860 1493.51 0.00051 8.73
2016-17 0.02665 114.53 1.74600 9554.72 1.77265 9669.25 0.08869 1063.43 0.00538 305.12
2017-18 0.06791 394.41 1.43477 8382.61 1.50268 8777.02 0.10759 1730.13 0.00441 292.56
2018-19 0.05978 911.89 1.25356 8451.64 1.31335 9363.53 0.02507 229.26 0.04047 1221.27
Note: Source: DGCI & S , KOLKATA
(1) Coke also includes soft coke, retort carbon which are negligible
(2) Some figures may not match with DGCI&S publication due to subsequent corrections and roundings.
(3) Coking coal, appeared to be exported from Meghalaya, should be treated as non coking coal for accounting purpose.
(4) Export data for 2009-10 and 2010-11 are revised.
Lignite
YearCoking Coal Non Coking Coal Total Coal
Coke & Others Coal
ProductsLignite
YearCoking Coal Non Coking Coal Total Coal
Coke & Others Coal
Products
60
~ Provisional Coal Statistics 2018-19 ~
Coal Controller's Organisation, 1,Council House Street, Kolkata, W.B., India
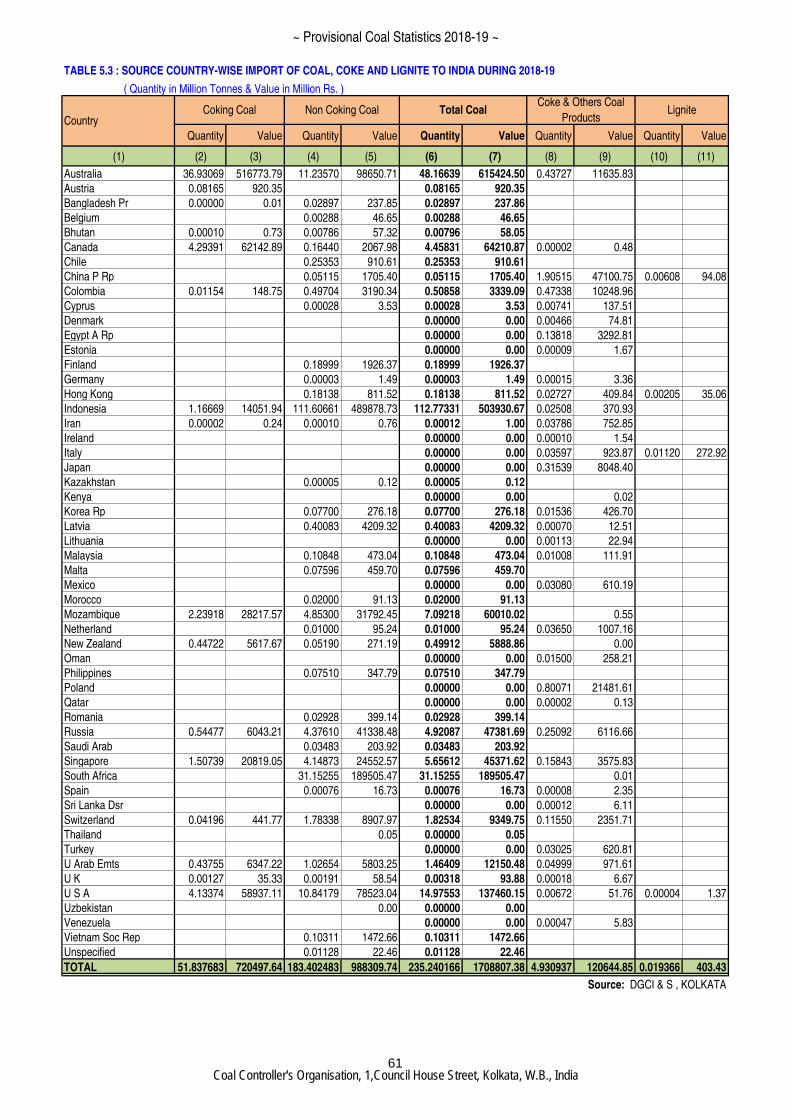
TABLE 5.3 : SOURCE COUNTRY-WISE IMPORT OF COAL, COKE AND LIGNITE TO INDIA DURING 2018-19
( Quantity in Million Tonnes & Value in Million Rs. )
Quantity Value Quantity Value Quantity Value Quantity Value Quantity Value
(1) (2) (3) (4) (5) (6) (7) (8) (9) (10) (11)
Australia 36.93069 516773.79 11.23570 98650.71 48.16639 615424.50 0.43727 11635.83
Austria 0.08165 920.35 0.08165 920.35
Bangladesh Pr 0.00000 0.01 0.02897 237.85 0.02897 237.86
Belgium 0.00288 46.65 0.00288 46.65
Bhutan 0.00010 0.73 0.00786 57.32 0.00796 58.05
Canada 4.29391 62142.89 0.16440 2067.98 4.45831 64210.87 0.00002 0.48
Chile 0.25353 910.61 0.25353 910.61
China P Rp 0.05115 1705.40 0.05115 1705.40 1.90515 47100.75 0.00608 94.08
Colombia 0.01154 148.75 0.49704 3190.34 0.50858 3339.09 0.47338 10248.96
Cyprus 0.00028 3.53 0.00028 3.53 0.00741 137.51
Denmark 0.00000 0.00 0.00466 74.81
Egypt A Rp 0.00000 0.00 0.13818 3292.81
Estonia 0.00000 0.00 0.00009 1.67
Finland 0.18999 1926.37 0.18999 1926.37
Germany 0.00003 1.49 0.00003 1.49 0.00015 3.36
Hong Kong 0.18138 811.52 0.18138 811.52 0.02727 409.84 0.00205 35.06
Indonesia 1.16669 14051.94 111.60661 489878.73 112.77331 503930.67 0.02508 370.93
Iran 0.00002 0.24 0.00010 0.76 0.00012 1.00 0.03786 752.85
Ireland 0.00000 0.00 0.00010 1.54
Italy 0.00000 0.00 0.03597 923.87 0.01120 272.92
Japan 0.00000 0.00 0.31539 8048.40
Kazakhstan 0.00005 0.12 0.00005 0.12
Kenya 0.00000 0.00 0.02
Korea Rp 0.07700 276.18 0.07700 276.18 0.01536 426.70
Latvia 0.40083 4209.32 0.40083 4209.32 0.00070 12.51
Lithuania 0.00000 0.00 0.00113 22.94
Malaysia 0.10848 473.04 0.10848 473.04 0.01008 111.91
Malta 0.07596 459.70 0.07596 459.70
Mexico 0.00000 0.00 0.03080 610.19
Morocco 0.02000 91.13 0.02000 91.13
Mozambique 2.23918 28217.57 4.85300 31792.45 7.09218 60010.02 0.55
Netherland 0.01000 95.24 0.01000 95.24 0.03650 1007.16
New Zealand 0.44722 5617.67 0.05190 271.19 0.49912 5888.86 0.00
Oman 0.00000 0.00 0.01500 258.21
Philippines 0.07510 347.79 0.07510 347.79
Poland 0.00000 0.00 0.80071 21481.61
Qatar 0.00000 0.00 0.00002 0.13
Romania 0.02928 399.14 0.02928 399.14
Russia 0.54477 6043.21 4.37610 41338.48 4.92087 47381.69 0.25092 6116.66
Saudi Arab 0.03483 203.92 0.03483 203.92
Singapore 1.50739 20819.05 4.14873 24552.57 5.65612 45371.62 0.15843 3575.83
South Africa 31.15255 189505.47 31.15255 189505.47 0.01
Spain 0.00076 16.73 0.00076 16.73 0.00008 2.35
Sri Lanka Dsr 0.00000 0.00 0.00012 6.11
Switzerland 0.04196 441.77 1.78338 8907.97 1.82534 9349.75 0.11550 2351.71
Thailand 0.05 0.00000 0.05
Turkey 0.00000 0.00 0.03025 620.81
U Arab Emts 0.43755 6347.22 1.02654 5803.25 1.46409 12150.48 0.04999 971.61
U K 0.00127 35.33 0.00191 58.54 0.00318 93.88 0.00018 6.67
U S A 4.13374 58937.11 10.84179 78523.04 14.97553 137460.15 0.00672 51.76 0.00004 1.37
Uzbekistan 0.00 0.00000 0.00
Venezuela 0.00000 0.00 0.00047 5.83
Vietnam Soc Rep 0.10311 1472.66 0.10311 1472.66
Unspecified 0.01128 22.46 0.01128 22.46
TOTAL 51.837683 720497.64 183.402483 988309.74 235.240166 1708807.38 4.930937 120644.85 0.019366 403.43
Source: DGCI & S , KOLKATA
LigniteCountry
Coking Coal Non Coking Coal Total CoalCoke & Others Coal
Products
61
~ Provisional Coal Statistics 2018-19 ~
Coal Controller's Organisation, 1,Council House Street, Kolkata, W.B., India
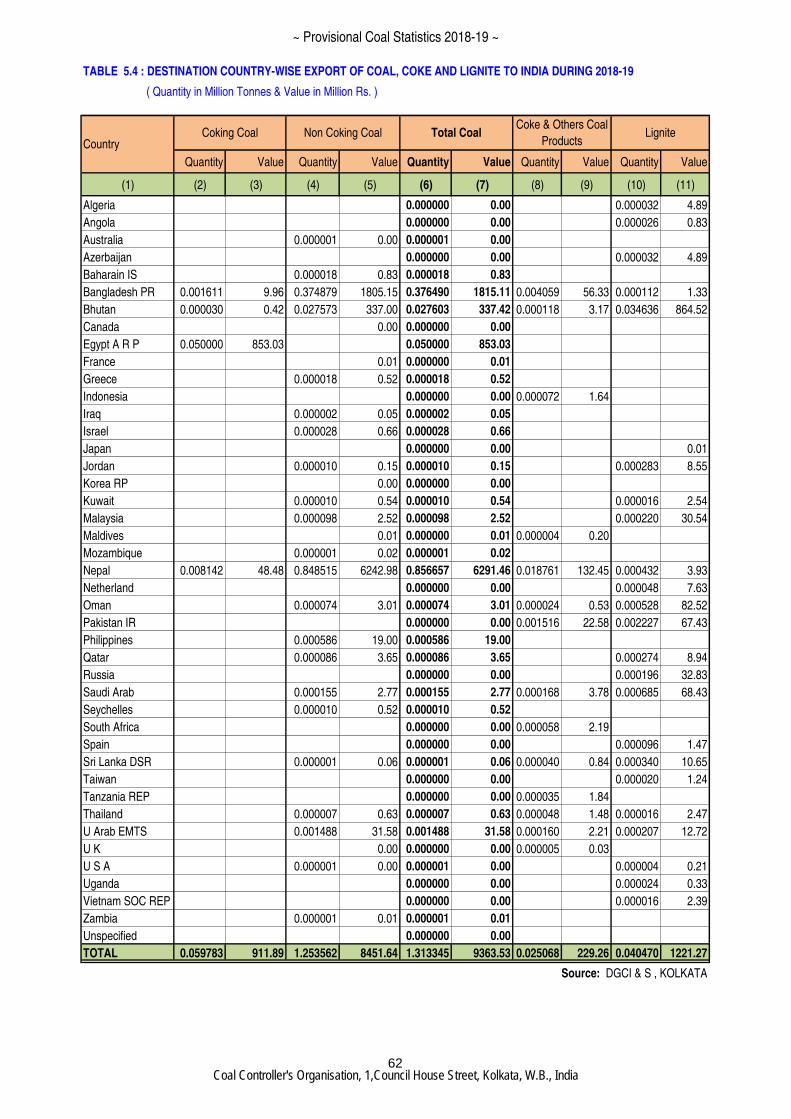
TABLE 5.4 : DESTINATION COUNTRY-WISE EXPORT OF COAL, COKE AND LIGNITE TO INDIA DURING 2018-19
( Quantity in Million Tonnes & Value in Million Rs. )
Quantity Value Quantity Value Quantity Value Quantity Value Quantity Value
(1) (2) (3) (4) (5) (6) (7) (8) (9) (10) (11)
Algeria 0.000000 0.00 0.000032 4.89
Angola 0.000000 0.00 0.000026 0.83
Australia 0.000001 0.00 0.000001 0.00
Azerbaijan 0.000000 0.00 0.000032 4.89
Baharain IS 0.000018 0.83 0.000018 0.83
Bangladesh PR 0.001611 9.96 0.374879 1805.15 0.376490 1815.11 0.004059 56.33 0.000112 1.33
Bhutan 0.000030 0.42 0.027573 337.00 0.027603 337.42 0.000118 3.17 0.034636 864.52
Canada 0.00 0.000000 0.00
Egypt A R P 0.050000 853.03 0.050000 853.03
France 0.01 0.000000 0.01
Greece 0.000018 0.52 0.000018 0.52
Indonesia 0.000000 0.00 0.000072 1.64
Iraq 0.000002 0.05 0.000002 0.05
Israel 0.000028 0.66 0.000028 0.66
Japan 0.000000 0.00 0.01
Jordan 0.000010 0.15 0.000010 0.15 0.000283 8.55
Korea RP 0.00 0.000000 0.00
Kuwait 0.000010 0.54 0.000010 0.54 0.000016 2.54
Malaysia 0.000098 2.52 0.000098 2.52 0.000220 30.54
Maldives 0.01 0.000000 0.01 0.000004 0.20
Mozambique 0.000001 0.02 0.000001 0.02
Nepal 0.008142 48.48 0.848515 6242.98 0.856657 6291.46 0.018761 132.45 0.000432 3.93
Netherland 0.000000 0.00 0.000048 7.63
Oman 0.000074 3.01 0.000074 3.01 0.000024 0.53 0.000528 82.52
Pakistan IR 0.000000 0.00 0.001516 22.58 0.002227 67.43
Philippines 0.000586 19.00 0.000586 19.00
Qatar 0.000086 3.65 0.000086 3.65 0.000274 8.94
Russia 0.000000 0.00 0.000196 32.83
Saudi Arab 0.000155 2.77 0.000155 2.77 0.000168 3.78 0.000685 68.43
Seychelles 0.000010 0.52 0.000010 0.52
South Africa 0.000000 0.00 0.000058 2.19
Spain 0.000000 0.00 0.000096 1.47
Sri Lanka DSR 0.000001 0.06 0.000001 0.06 0.000040 0.84 0.000340 10.65
Taiwan 0.000000 0.00 0.000020 1.24
Tanzania REP 0.000000 0.00 0.000035 1.84
Thailand 0.000007 0.63 0.000007 0.63 0.000048 1.48 0.000016 2.47
U Arab EMTS 0.001488 31.58 0.001488 31.58 0.000160 2.21 0.000207 12.72
U K 0.00 0.000000 0.00 0.000005 0.03
U S A 0.000001 0.00 0.000001 0.00 0.000004 0.21
Uganda 0.000000 0.00 0.000024 0.33
Vietnam SOC REP 0.000000 0.00 0.000016 2.39
Zambia 0.000001 0.01 0.000001 0.01
Unspecified 0.000000 0.00
TOTAL 0.059783 911.89 1.253562 8451.64 1.313345 9363.53 0.025068 229.26 0.040470 1221.27
Source: DGCI & S , KOLKATA
LigniteCountry
Coking Coal Non Coking Coal Total CoalCoke & Others Coal
Products
62
~ Provisional Coal Statistics 2018-19 ~
Coal Controller's Organisation, 1,Council House Street, Kolkata, W.B., India
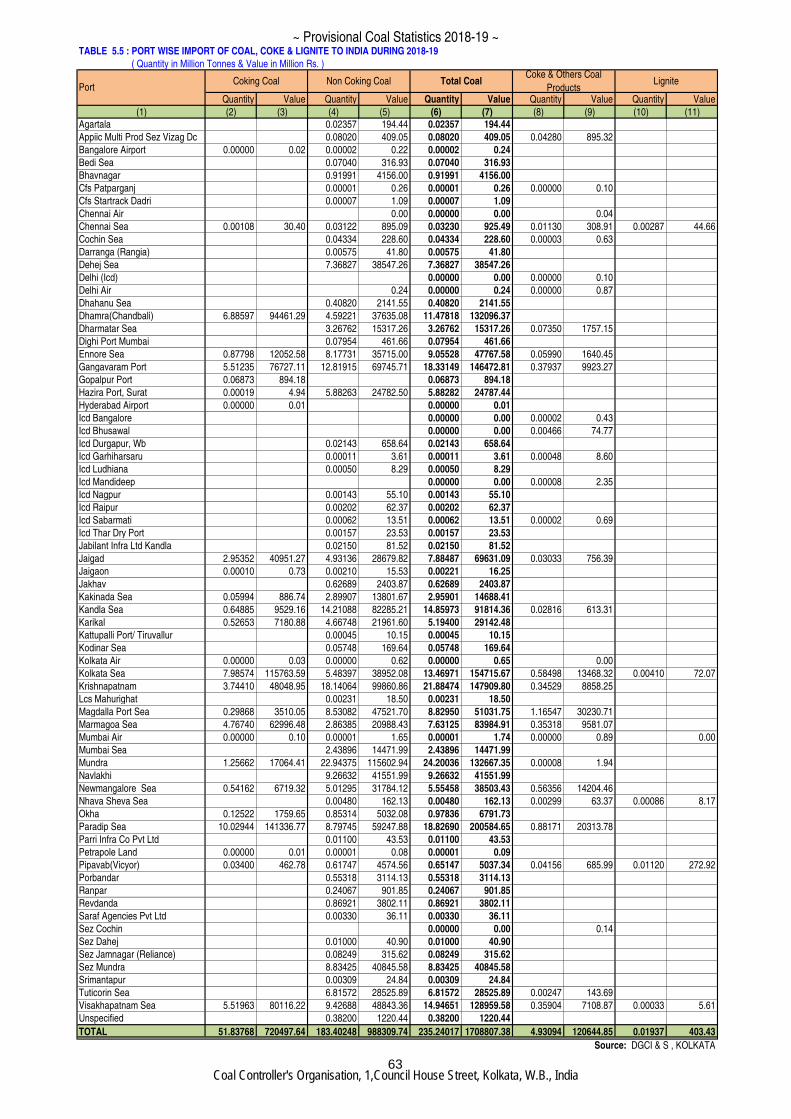
TABLE 5.5 : PORT WISE IMPORT OF COAL, COKE & LIGNITE TO INDIA DURING 2018-19
( Quantity in Million Tonnes & Value in Million Rs. )
Quantity Value Quantity Value Quantity Value Quantity Value Quantity Value
(1) (2) (3) (4) (5) (6) (7) (8) (9) (10) (11)
Agartala 0.02357 194.44 0.02357 194.44
Appiic Multi Prod Sez Vizag Dc 0.08020 409.05 0.08020 409.05 0.04280 895.32
Bangalore Airport 0.00000 0.02 0.00002 0.22 0.00002 0.24
Bedi Sea 0.07040 316.93 0.07040 316.93
Bhavnagar 0.91991 4156.00 0.91991 4156.00
Cfs Patparganj 0.00001 0.26 0.00001 0.26 0.00000 0.10
Cfs Startrack Dadri 0.00007 1.09 0.00007 1.09
Chennai Air 0.00 0.00000 0.00 0.04
Chennai Sea 0.00108 30.40 0.03122 895.09 0.03230 925.49 0.01130 308.91 0.00287 44.66
Cochin Sea 0.04334 228.60 0.04334 228.60 0.00003 0.63
Darranga (Rangia) 0.00575 41.80 0.00575 41.80
Dehej Sea 7.36827 38547.26 7.36827 38547.26
Delhi (Icd) 0.00000 0.00 0.00000 0.10
Delhi Air 0.24 0.00000 0.24 0.00000 0.87
Dhahanu Sea 0.40820 2141.55 0.40820 2141.55
Dhamra(Chandbali) 6.88597 94461.29 4.59221 37635.08 11.47818 132096.37
Dharmatar Sea 3.26762 15317.26 3.26762 15317.26 0.07350 1757.15
Dighi Port Mumbai 0.07954 461.66 0.07954 461.66
Ennore Sea 0.87798 12052.58 8.17731 35715.00 9.05528 47767.58 0.05990 1640.45
Gangavaram Port 5.51235 76727.11 12.81915 69745.71 18.33149 146472.81 0.37937 9923.27
Gopalpur Port 0.06873 894.18 0.06873 894.18
Hazira Port, Surat 0.00019 4.94 5.88263 24782.50 5.88282 24787.44
Hyderabad Airport 0.00000 0.01 0.00000 0.01
Icd Bangalore 0.00000 0.00 0.00002 0.43
Icd Bhusawal 0.00000 0.00 0.00466 74.77
Icd Durgapur, Wb 0.02143 658.64 0.02143 658.64
Icd Garhiharsaru 0.00011 3.61 0.00011 3.61 0.00048 8.60
Icd Ludhiana 0.00050 8.29 0.00050 8.29
Icd Mandideep 0.00000 0.00 0.00008 2.35
Icd Nagpur 0.00143 55.10 0.00143 55.10
Icd Raipur 0.00202 62.37 0.00202 62.37
Icd Sabarmati 0.00062 13.51 0.00062 13.51 0.00002 0.69
Icd Thar Dry Port 0.00157 23.53 0.00157 23.53
Jabilant Infra Ltd Kandla 0.02150 81.52 0.02150 81.52
Jaigad 2.95352 40951.27 4.93136 28679.82 7.88487 69631.09 0.03033 756.39
Jaigaon 0.00010 0.73 0.00210 15.53 0.00221 16.25
Jakhav 0.62689 2403.87 0.62689 2403.87
Kakinada Sea 0.05994 886.74 2.89907 13801.67 2.95901 14688.41
Kandla Sea 0.64885 9529.16 14.21088 82285.21 14.85973 91814.36 0.02816 613.31
Karikal 0.52653 7180.88 4.66748 21961.60 5.19400 29142.48
Kattupalli Port/ Tiruvallur 0.00045 10.15 0.00045 10.15
Kodinar Sea 0.05748 169.64 0.05748 169.64
Kolkata Air 0.00000 0.03 0.00000 0.62 0.00000 0.65 0.00
Kolkata Sea 7.98574 115763.59 5.48397 38952.08 13.46971 154715.67 0.58498 13468.32 0.00410 72.07
Krishnapatnam 3.74410 48048.95 18.14064 99860.86 21.88474 147909.80 0.34529 8858.25
Lcs Mahurighat 0.00231 18.50 0.00231 18.50
Magdalla Port Sea 0.29868 3510.05 8.53082 47521.70 8.82950 51031.75 1.16547 30230.71
Marmagoa Sea 4.76740 62996.48 2.86385 20988.43 7.63125 83984.91 0.35318 9581.07
Mumbai Air 0.00000 0.10 0.00001 1.65 0.00001 1.74 0.00000 0.89 0.00
Mumbai Sea 2.43896 14471.99 2.43896 14471.99
Mundra 1.25662 17064.41 22.94375 115602.94 24.20036 132667.35 0.00008 1.94
Navlakhi 9.26632 41551.99 9.26632 41551.99
Newmangalore Sea 0.54162 6719.32 5.01295 31784.12 5.55458 38503.43 0.56356 14204.46
Nhava Sheva Sea 0.00480 162.13 0.00480 162.13 0.00299 63.37 0.00086 8.17
Okha 0.12522 1759.65 0.85314 5032.08 0.97836 6791.73
Paradip Sea 10.02944 141336.77 8.79745 59247.88 18.82690 200584.65 0.88171 20313.78
Parri Infra Co Pvt Ltd 0.01100 43.53 0.01100 43.53
Petrapole Land 0.00000 0.01 0.00001 0.08 0.00001 0.09
Pipavab(Vicyor) 0.03400 462.78 0.61747 4574.56 0.65147 5037.34 0.04156 685.99 0.01120 272.92
Porbandar 0.55318 3114.13 0.55318 3114.13
Ranpar 0.24067 901.85 0.24067 901.85
Revdanda 0.86921 3802.11 0.86921 3802.11
Saraf Agencies Pvt Ltd 0.00330 36.11 0.00330 36.11
Sez Cochin 0.00000 0.00 0.14
Sez Dahej 0.01000 40.90 0.01000 40.90
Sez Jamnagar (Reliance) 0.08249 315.62 0.08249 315.62
Sez Mundra 8.83425 40845.58 8.83425 40845.58
Srimantapur 0.00309 24.84 0.00309 24.84
Tuticorin Sea 6.81572 28525.89 6.81572 28525.89 0.00247 143.69
Visakhapatnam Sea 5.51963 80116.22 9.42688 48843.36 14.94651 128959.58 0.35904 7108.87 0.00033 5.61
Unspecified 0.38200 1220.44 0.38200 1220.44
TOTAL 51.83768 720497.64 183.40248 988309.74 235.24017 1708807.38 4.93094 120644.85 0.01937 403.43
Source: DGCI & S , KOLKATA
LignitePort
Coking Coal Non Coking Coal Total CoalCoke & Others Coal
Products
63
~ Provisional Coal Statistics 2018-19 ~
Coal Controller's Organisation, 1,Council House Street, Kolkata, W.B., India
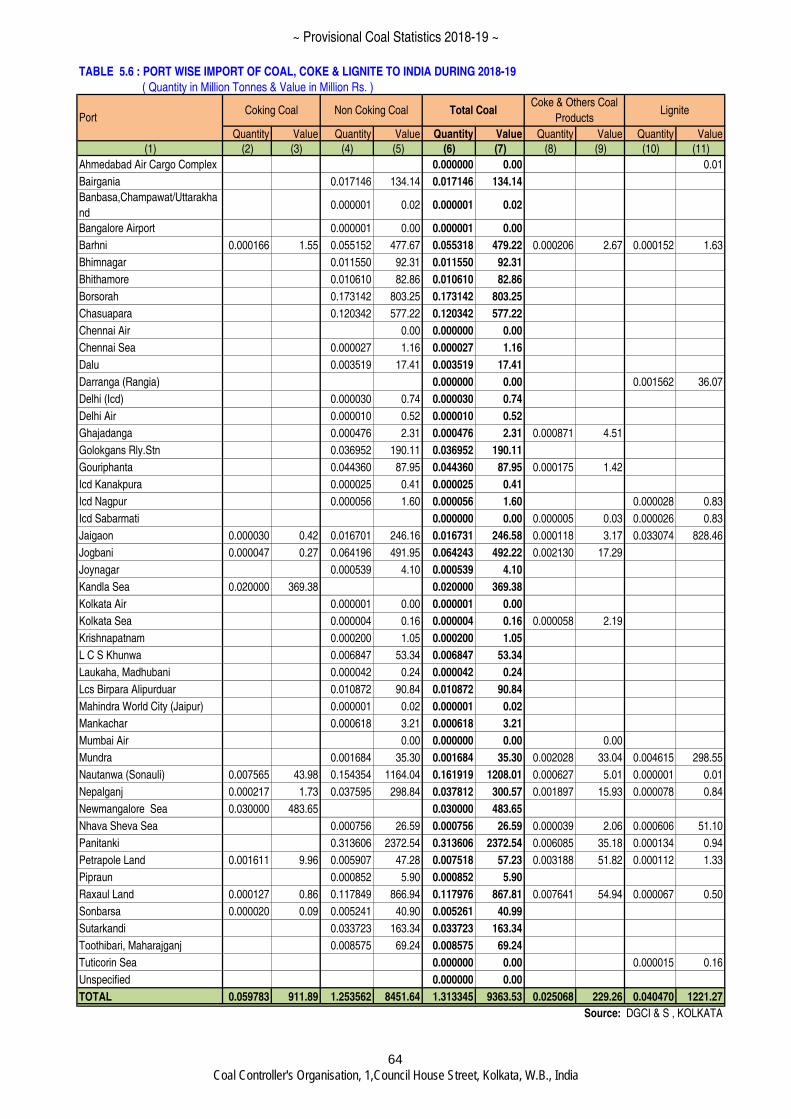
TABLE 5.6 : PORT WISE IMPORT OF COAL, COKE & LIGNITE TO INDIA DURING 2018-19
( Quantity in Million Tonnes & Value in Million Rs. )
Quantity Value Quantity Value Quantity Value Quantity Value Quantity Value
(1) (2) (3) (4) (5) (6) (7) (8) (9) (10) (11)
Ahmedabad Air Cargo Complex 0.000000 0.00 0.01
Bairgania 0.017146 134.14 0.017146 134.14
Banbasa,Champawat/Uttarakha
nd0.000001 0.02 0.000001 0.02
Bangalore Airport 0.000001 0.00 0.000001 0.00
Barhni 0.000166 1.55 0.055152 477.67 0.055318 479.22 0.000206 2.67 0.000152 1.63
Bhimnagar 0.011550 92.31 0.011550 92.31
Bhithamore 0.010610 82.86 0.010610 82.86
Borsorah 0.173142 803.25 0.173142 803.25
Chasuapara 0.120342 577.22 0.120342 577.22
Chennai Air 0.00 0.000000 0.00
Chennai Sea 0.000027 1.16 0.000027 1.16
Dalu 0.003519 17.41 0.003519 17.41
Darranga (Rangia) 0.000000 0.00 0.001562 36.07
Delhi (Icd) 0.000030 0.74 0.000030 0.74
Delhi Air 0.000010 0.52 0.000010 0.52
Ghajadanga 0.000476 2.31 0.000476 2.31 0.000871 4.51
Golokgans Rly.Stn 0.036952 190.11 0.036952 190.11
Gouriphanta 0.044360 87.95 0.044360 87.95 0.000175 1.42
Icd Kanakpura 0.000025 0.41 0.000025 0.41
Icd Nagpur 0.000056 1.60 0.000056 1.60 0.000028 0.83
Icd Sabarmati 0.000000 0.00 0.000005 0.03 0.000026 0.83
Jaigaon 0.000030 0.42 0.016701 246.16 0.016731 246.58 0.000118 3.17 0.033074 828.46
Jogbani 0.000047 0.27 0.064196 491.95 0.064243 492.22 0.002130 17.29
Joynagar 0.000539 4.10 0.000539 4.10
Kandla Sea 0.020000 369.38 0.020000 369.38
Kolkata Air 0.000001 0.00 0.000001 0.00
Kolkata Sea 0.000004 0.16 0.000004 0.16 0.000058 2.19
Krishnapatnam 0.000200 1.05 0.000200 1.05
L C S Khunwa 0.006847 53.34 0.006847 53.34
Laukaha, Madhubani 0.000042 0.24 0.000042 0.24
Lcs Birpara Alipurduar 0.010872 90.84 0.010872 90.84
Mahindra World City (Jaipur) 0.000001 0.02 0.000001 0.02
Mankachar 0.000618 3.21 0.000618 3.21
Mumbai Air 0.00 0.000000 0.00 0.00
Mundra 0.001684 35.30 0.001684 35.30 0.002028 33.04 0.004615 298.55
Nautanwa (Sonauli) 0.007565 43.98 0.154354 1164.04 0.161919 1208.01 0.000627 5.01 0.000001 0.01
Nepalganj 0.000217 1.73 0.037595 298.84 0.037812 300.57 0.001897 15.93 0.000078 0.84
Newmangalore Sea 0.030000 483.65 0.030000 483.65
Nhava Sheva Sea 0.000756 26.59 0.000756 26.59 0.000039 2.06 0.000606 51.10
Panitanki 0.313606 2372.54 0.313606 2372.54 0.006085 35.18 0.000134 0.94
Petrapole Land 0.001611 9.96 0.005907 47.28 0.007518 57.23 0.003188 51.82 0.000112 1.33
Pipraun 0.000852 5.90 0.000852 5.90
Raxaul Land 0.000127 0.86 0.117849 866.94 0.117976 867.81 0.007641 54.94 0.000067 0.50
Sonbarsa 0.000020 0.09 0.005241 40.90 0.005261 40.99
Sutarkandi 0.033723 163.34 0.033723 163.34
Toothibari, Maharajganj 0.008575 69.24 0.008575 69.24
Tuticorin Sea 0.000000 0.00 0.000015 0.16
Unspecified 0.000000 0.00
TOTAL 0.059783 911.89 1.253562 8451.64 1.313345 9363.53 0.025068 229.26 0.040470 1221.27
Source: DGCI & S , KOLKATA
LignitePort
Coking Coal Non Coking Coal Total CoalCoke & Others Coal
Products
64
~ Provisional Coal Statistics 2018-19 ~
Coal Controller's Organisation, 1,Council House Street, Kolkata, W.B., India
~ Provisional Coal Statistics 2018-19 ~
Coal Controller's Organisation, 1,Council House Street, Kolkata, W.B., India
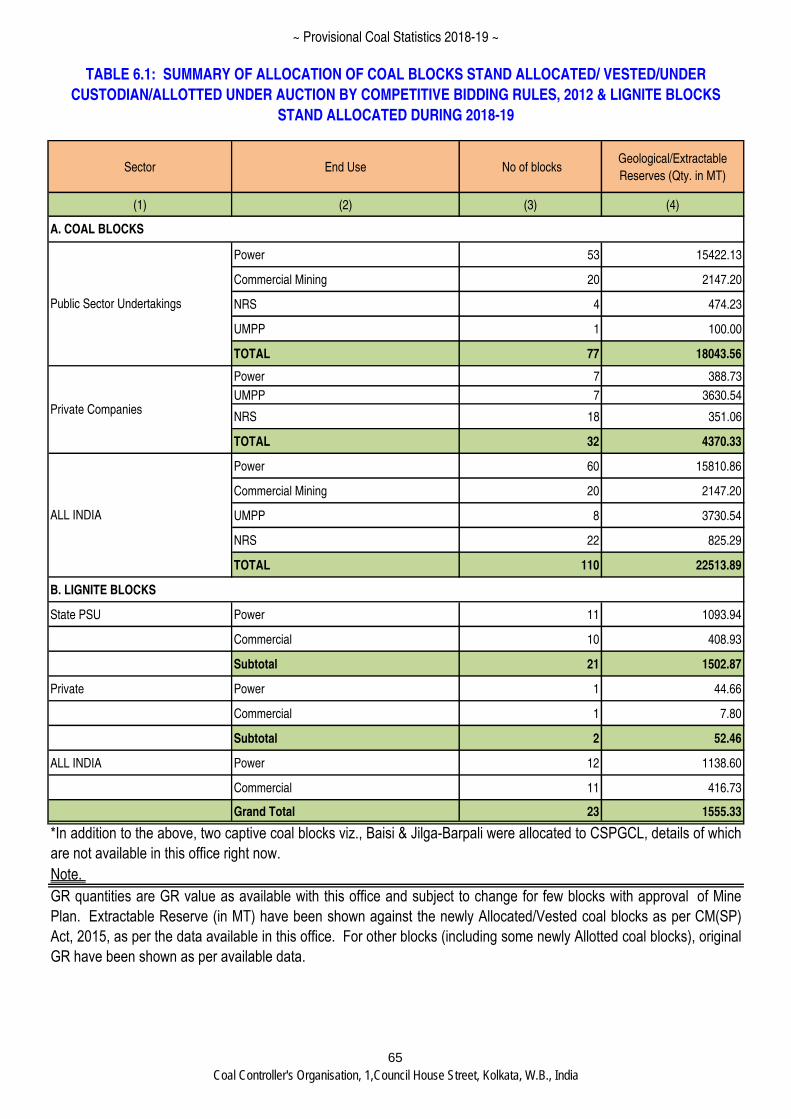
Sector End Use No of blocks Geological/Extractable
Reserves (Qty. in MT)
(1) (2) (3) (4)
Power 53 15422.13
Commercial Mining 20 2147.20
NRS 4 474.23
UMPP 1 100.00
TOTAL 77 18043.56
Power 7 388.73
UMPP 7 3630.54
NRS 18 351.06
TOTAL 32 4370.33
Power 60 15810.86
Commercial Mining 20 2147.20
UMPP 8 3730.54
NRS 22 825.29
TOTAL 110 22513.89
B. LIGNITE BLOCKS
State PSU Power 11 1093.94
Commercial 10 408.93
Subtotal 21 1502.87
Private Power 1 44.66
Commercial 1 7.80
Subtotal 2 52.46
ALL INDIA Power 12 1138.60
Commercial 11 416.73
Grand Total 23 1555.33
Note.
GR quantities are GR value as available with this office and subject to change for few blocks with approval of Mine
Plan. Extractable Reserve (in MT) have been shown against the newly Allocated/Vested coal blocks as per CM(SP)
Act, 2015, as per the data available in this office. For other blocks (including some newly Allotted coal blocks), original
GR have been shown as per available data.
*In addition to the above, two captive coal blocks viz., Baisi & Jilga-Barpali were allocated to CSPGCL, details of which
are not available in this office right now.
TABLE 6.1: SUMMARY OF ALLOCATION OF COAL BLOCKS STAND ALLOCATED/ VESTED/UNDER
CUSTODIAN/ALLOTTED UNDER AUCTION BY COMPETITIVE BIDDING RULES, 2012 & LIGNITE BLOCKS
STAND ALLOCATED DURING 2018-19
A. COAL BLOCKS
Public Sector Undertakings
Private Companies
ALL INDIA
65
~ Provisional Coal Statistics 2018-19 ~
Coal Controller's Organisation, 1,Council House Street, Kolkata, W.B., India
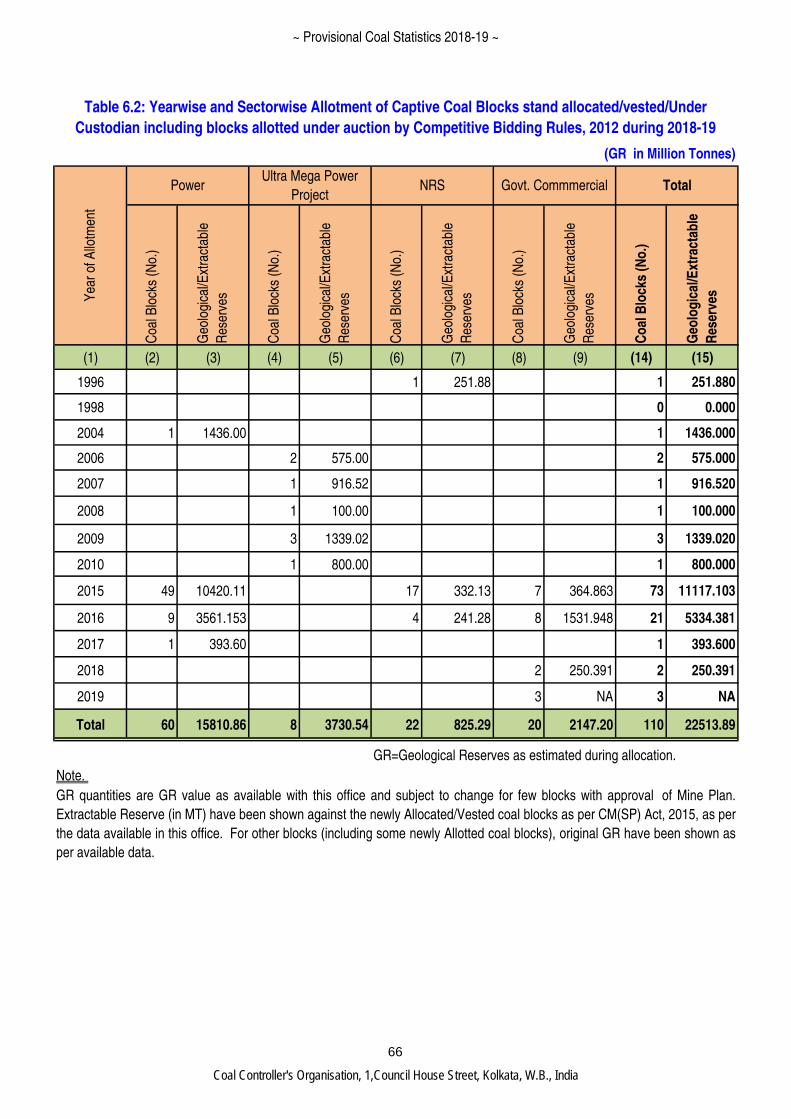
Coa
l Blo
cks
(No.
)
Geo
logi
cal/E
xtra
ctab
le
Res
erve
s
Coa
l Blo
cks
(No.
)
Geo
logi
cal/E
xtra
ctab
le
Res
erve
s
Coa
l Blo
cks
(No.
)
Geo
logi
cal/E
xtra
ctab
le
Res
erve
s
Coa
l Blo
cks
(No.
)
Geo
logi
cal/E
xtra
ctab
le
Res
erve
s
Co
al B
lock
s (N
o.)
Geo
log
ical
/Ext
ract
able
Res
erve
s
(1) (2) (3) (4) (5) (6) (7) (8) (9) (14) (15)
1996 1 251.88 1 251.880
1998 0 0.000
2004 1 1436.00 1 1436.000
2006 2 575.00 2 575.000
2007 1 916.52 1 916.520
2008 1 100.00 1 100.000
2009 3 1339.02 3 1339.020
2010 1 800.00 1 800.000
2015 49 10420.11 17 332.13 7 364.863 73 11117.103
2016 9 3561.153 4 241.28 8 1531.948 21 5334.381
2017 1 393.60 1 393.600
2018 2 250.391 2 250.391
2019 3 NA 3 NA
Total 60 15810.86 8 3730.54 22 825.29 20 2147.20 110 22513.89
GR=Geological Reserves as estimated during allocation.
Note.
GR quantities are GR value as available with this office and subject to change for few blocks with approval of Mine Plan.
Extractable Reserve (in MT) have been shown against the newly Allocated/Vested coal blocks as per CM(SP) Act, 2015, as per
the data available in this office. For other blocks (including some newly Allotted coal blocks), original GR have been shown as
per available data.
Table 6.2: Yearwise and Sectorwise Allotment of Captive Coal Blocks stand allocated/vested/Under
Custodian including blocks allotted under auction by Competitive Bidding Rules, 2012 during 2018-19
(GR in Million Tonnes)
Yea
r of
Allo
tmen
t
PowerUltra Mega Power
ProjectNRS Govt. Commmercial Total
66
~ Provisional Coal Statistics 2018-19 ~
Coal Controller's Organisation, 1,Council House Street, Kolkata, W.B., India
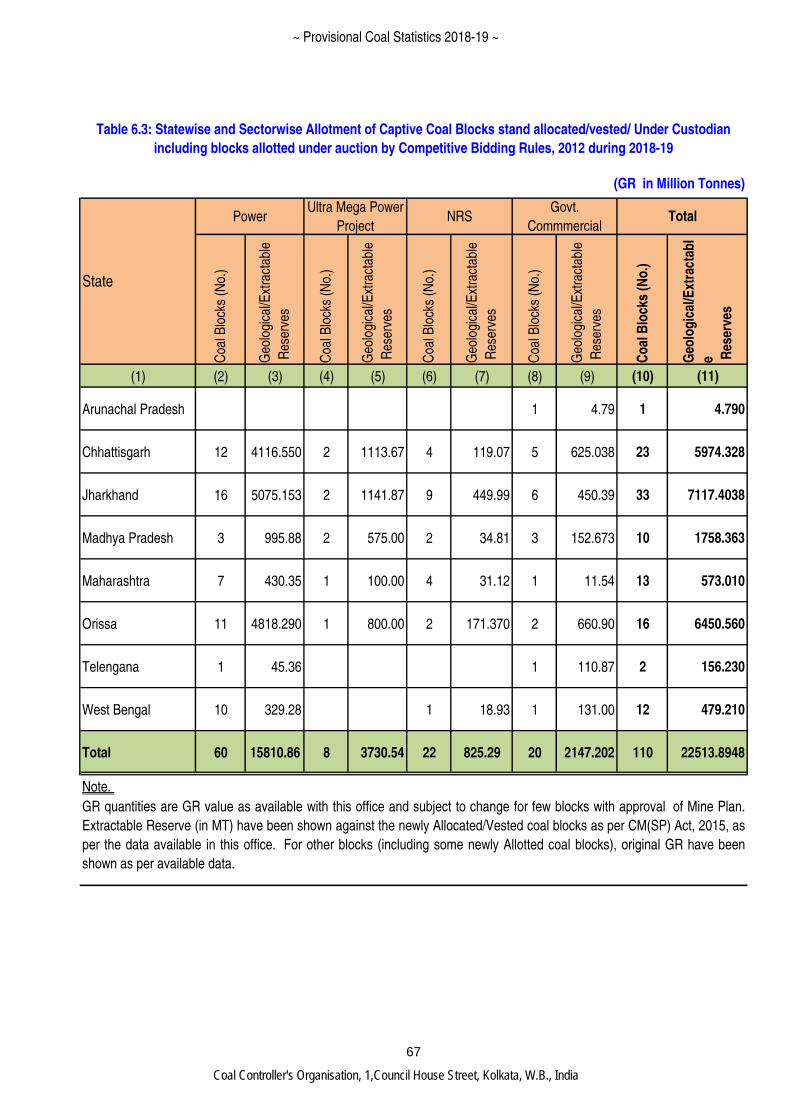
(GR in Million Tonnes)
Coa
l Blo
cks
(No.
)
Geo
logi
cal/E
xtra
ctab
le
Res
erve
s
Coa
l Blo
cks
(No.
)
Geo
logi
cal/E
xtra
ctab
le
Res
erve
s
Coa
l Blo
cks
(No.
)
Geo
logi
cal/E
xtra
ctab
le
Res
erve
s
Coa
l Blo
cks
(No.
)
Geo
logi
cal/E
xtra
ctab
le
Res
erve
s
Co
al B
lock
s (N
o.)
Geo
log
ical
/Ext
ract
abl
e Res
erve
s
(1) (2) (3) (4) (5) (6) (7) (8) (9) (10) (11)
Arunachal Pradesh 1 4.79 1 4.790
Chhattisgarh 12 4116.550 2 1113.67 4 119.07 5 625.038 23 5974.328
Jharkhand 16 5075.153 2 1141.87 9 449.99 6 450.39 33 7117.4038
Madhya Pradesh 3 995.88 2 575.00 2 34.81 3 152.673 10 1758.363
Maharashtra 7 430.35 1 100.00 4 31.12 1 11.54 13 573.010
Orissa 11 4818.290 1 800.00 2 171.370 2 660.90 16 6450.560
Telengana 1 45.36 1 110.87 2 156.230
West Bengal 10 329.28 1 18.93 1 131.00 12 479.210
Total 60 15810.86 8 3730.54 22 825.29 20 2147.202 110 22513.8948
Note.
GR quantities are GR value as available with this office and subject to change for few blocks with approval of Mine Plan.
Extractable Reserve (in MT) have been shown against the newly Allocated/Vested coal blocks as per CM(SP) Act, 2015, as
per the data available in this office. For other blocks (including some newly Allotted coal blocks), original GR have been
shown as per available data.
Table 6.3: Statewise and Sectorwise Allotment of Captive Coal Blocks stand allocated/vested/ Under Custodian
including blocks allotted under auction by Competitive Bidding Rules, 2012 during 2018-19
State
PowerUltra Mega Power
ProjectNRS
Govt.
CommmercialTotal
67
~ Provisional Coal Statistics 2018-19 ~
Coal Controller's Organisation, 1,Council House Street, Kolkata, W.B., India
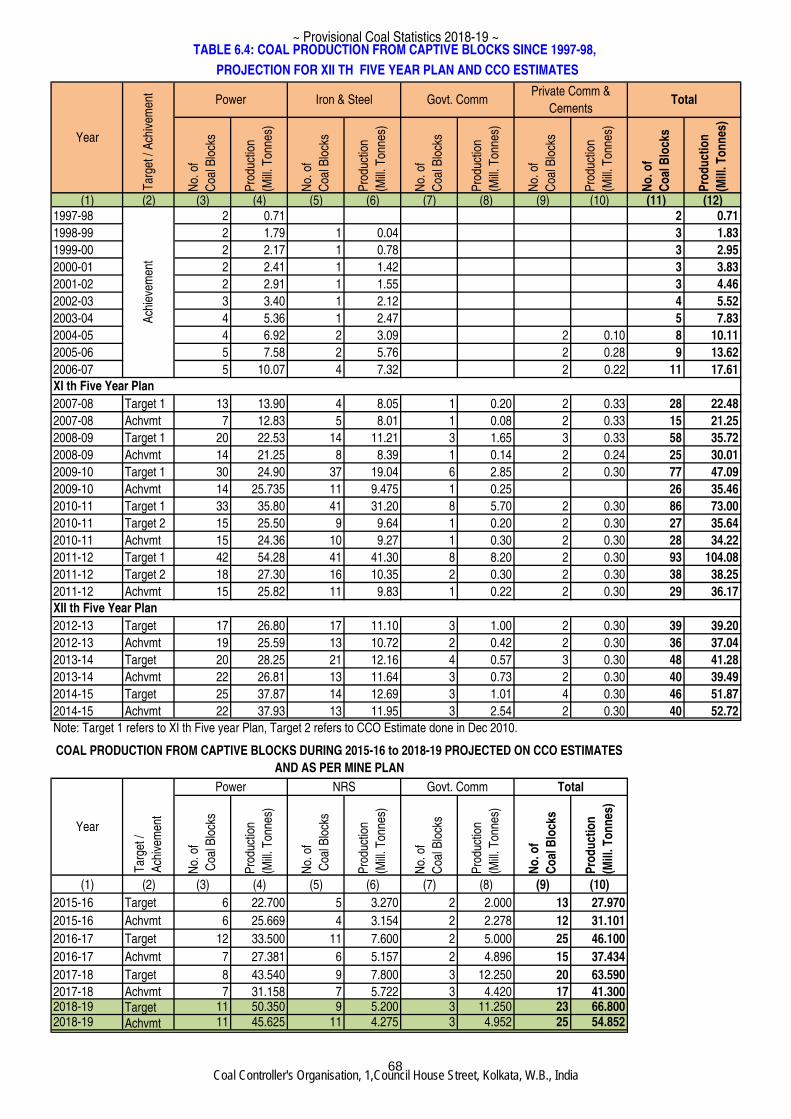
No.
of
Coa
l Blo
cks
Pro
duct
ion
(Mill
. Ton
nes)
No.
of
Coa
l Blo
cks
Pro
duct
ion
(Mill
. Ton
nes)
No.
of
Coa
l Blo
cks
Pro
duct
ion
(Mill
. Ton
nes)
No.
of
Coa
l Blo
cks
Pro
duct
ion
(Mill
. Ton
nes)
No
. of
Co
al B
lock
s
Pro
du
ctio
n
(Mill
. To
nn
es)
(1) (2) (3) (4) (5) (6) (7) (8) (9) (10) (11) (12)1997-98 2 0.71 2 0.71
1998-99 2 1.79 1 0.04 3 1.83
1999-00 2 2.17 1 0.78 3 2.95
2000-01 2 2.41 1 1.42 3 3.83
2001-02 2 2.91 1 1.55 3 4.46
2002-03 3 3.40 1 2.12 4 5.52
2003-04 4 5.36 1 2.47 5 7.83
2004-05 4 6.92 2 3.09 2 0.10 8 10.11
2005-06 5 7.58 2 5.76 2 0.28 9 13.62
2006-07 5 10.07 4 7.32 2 0.22 11 17.61
2007-08 Target 1 13 13.90 4 8.05 1 0.20 2 0.33 28 22.48
2007-08 Achvmt 7 12.83 5 8.01 1 0.08 2 0.33 15 21.25
2008-09 Target 1 20 22.53 14 11.21 3 1.65 3 0.33 58 35.72
2008-09 Achvmt 14 21.25 8 8.39 1 0.14 2 0.24 25 30.01
2009-10 Target 1 30 24.90 37 19.04 6 2.85 2 0.30 77 47.09
2009-10 Achvmt 14 25.735 11 9.475 1 0.25 26 35.46
2010-11 Target 1 33 35.80 41 31.20 8 5.70 2 0.30 86 73.00
2010-11 Target 2 15 25.50 9 9.64 1 0.20 2 0.30 27 35.64
2010-11 Achvmt 15 24.36 10 9.27 1 0.30 2 0.30 28 34.22
2011-12 Target 1 42 54.28 41 41.30 8 8.20 2 0.30 93 104.08
2011-12 Target 2 18 27.30 16 10.35 2 0.30 2 0.30 38 38.25
2011-12 Achvmt 15 25.82 11 9.83 1 0.22 2 0.30 29 36.17
2012-13 Target 17 26.80 17 11.10 3 1.00 2 0.30 39 39.20
2012-13 Achvmt 19 25.59 13 10.72 2 0.42 2 0.30 36 37.04
2013-14 Target 20 28.25 21 12.16 4 0.57 3 0.30 48 41.28
2013-14 Achvmt 22 26.81 13 11.64 3 0.73 2 0.30 40 39.49
2014-15 Target 25 37.87 14 12.69 3 1.01 4 0.30 46 51.87
2014-15 Achvmt 22 37.93 13 11.95 3 2.54 2 0.30 40 52.72
Note: Target 1 refers to XI th Five year Plan, Target 2 refers to CCO Estimate done in Dec 2010.
No.
of
Coa
l Blo
cks
Pro
duct
ion
(Mill
. Ton
nes)
No.
of
Coa
l Blo
cks
Pro
duct
ion
(Mill
. Ton
nes)
No.
of
Coa
l Blo
cks
Pro
duct
ion
(Mill
. Ton
nes)
No
. of
Co
al B
lock
s
Pro
du
ctio
n
(Mill
. To
nn
es)
(1) (2) (3) (4) (5) (6) (7) (8) (9) (10)
2015-16 Target 6 22.700 5 3.270 2 2.000 13 27.970
2015-16 Achvmt 6 25.669 4 3.154 2 2.278 12 31.101
2016-17 Target 12 33.500 11 7.600 2 5.000 25 46.100
2016-17 Achvmt 7 27.381 6 5.157 2 4.896 15 37.434
2017-18 Target 8 43.540 9 7.800 3 12.250 20 63.590
2017-18 Achvmt 7 31.158 7 5.722 3 4.420 17 41.3002018-19 Target 11 50.350 9 5.200 3 11.250 23 66.8002018-19 Achvmt 11 45.625 11 4.275 3 4.952 25 54.852
Iron & Steel Govt. CommPrivate Comm &
CementsTotal
TABLE 6.4: COAL PRODUCTION FROM CAPTIVE BLOCKS SINCE 1997-98,
PROJECTION FOR XII TH FIVE YEAR PLAN AND CCO ESTIMATES
YearT
arge
t / A
chiv
emen
t
Power
Total
XII th Five Year Plan
XI th Five Year Plan
Ach
ieve
men
t
COAL PRODUCTION FROM CAPTIVE BLOCKS DURING 2015-16 to 2018-19 PROJECTED ON CCO ESTIMATES
AND AS PER MINE PLAN
Year
Tar
get /
Ach
ivem
ent
Power NRS Govt. Comm
68
~ Provisional Coal Statistics 2018-19 ~
Coal Controller's Organisation, 1,Council House Street, Kolkata, W.B., India
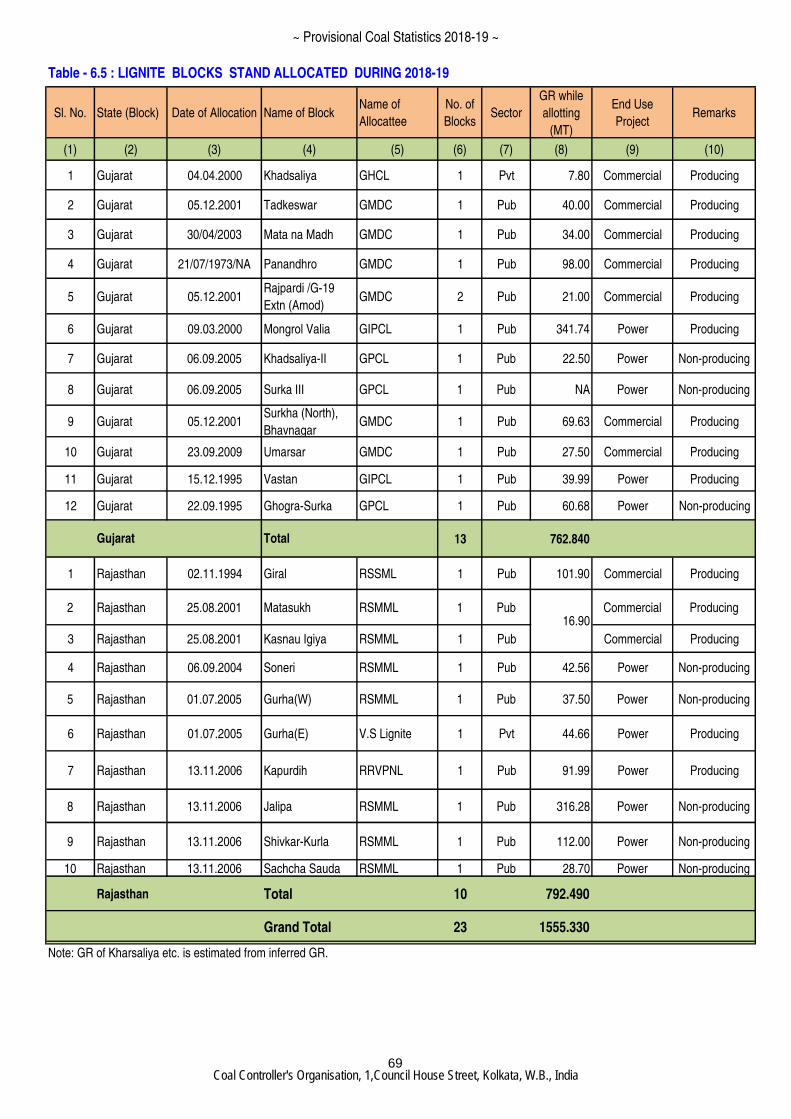
Sl. No. State (Block) Date of Allocation Name of BlockName of
Allocattee
No. of
BlocksSector
GR while
allotting
(MT)
End Use
ProjectRemarks
(1) (2) (3) (4) (5) (6) (7) (8) (9) (10)
1 Gujarat 04.04.2000 Khadsaliya GHCL 1 Pvt 7.80 Commercial Producing
2 Gujarat 05.12.2001 Tadkeswar GMDC 1 Pub 40.00 Commercial Producing
3 Gujarat 30/04/2003 Mata na Madh GMDC 1 Pub 34.00 Commercial Producing
4 Gujarat 21/07/1973/NA Panandhro GMDC 1 Pub 98.00 Commercial Producing
5 Gujarat 05.12.2001Rajpardi /G-19
Extn (Amod)GMDC 2 Pub 21.00 Commercial Producing
6 Gujarat 09.03.2000 Mongrol Valia GIPCL 1 Pub 341.74 Power Producing
7 Gujarat 06.09.2005 Khadsaliya-II GPCL 1 Pub 22.50 Power Non-producing
8 Gujarat 06.09.2005 Surka III GPCL 1 Pub NA Power Non-producing
9 Gujarat 05.12.2001Surkha (North),
BhavnagarGMDC 1 Pub 69.63 Commercial Producing
10 Gujarat 23.09.2009 Umarsar GMDC 1 Pub 27.50 Commercial Producing
11 Gujarat 15.12.1995 Vastan GIPCL 1 Pub 39.99 Power Producing
12 Gujarat 22.09.1995 Ghogra-Surka GPCL 1 Pub 60.68 Power Non-producing
13 762.840
1 Rajasthan 02.11.1994 Giral RSSML 1 Pub 101.90 Commercial Producing
2 Rajasthan 25.08.2001 Matasukh RSMML 1 Pub Commercial Producing
3 Rajasthan 25.08.2001 Kasnau Igiya RSMML 1 Pub Commercial Producing
4 Rajasthan 06.09.2004 Soneri RSMML 1 Pub 42.56 Power Non-producing
5 Rajasthan 01.07.2005 Gurha(W) RSMML 1 Pub 37.50 Power Non-producing
6 Rajasthan 01.07.2005 Gurha(E) V.S Lignite 1 Pvt 44.66 Power Producing
7 Rajasthan 13.11.2006 Kapurdih RRVPNL 1 Pub 91.99 Power Producing
8 Rajasthan 13.11.2006 Jalipa RSMML 1 Pub 316.28 Power Non-producing
9 Rajasthan 13.11.2006 Shivkar-Kurla RSMML 1 Pub 112.00 Power Non-producing
10 Rajasthan 13.11.2006 Sachcha Sauda RSMML 1 Pub 28.70 Power Non-producing
Rajasthan Total 10 792.490
Grand Total 23 1555.330
Table - 6.5 : LIGNITE BLOCKS STAND ALLOCATED DURING 2018-19
16.90
Note: GR of Kharsaliya etc. is estimated from inferred GR.
Gujarat Total
69
~ Provisional Coal Statistics 2018-19 ~
Coal Controller's Organisation, 1,Council House Street, Kolkata, W.B., India
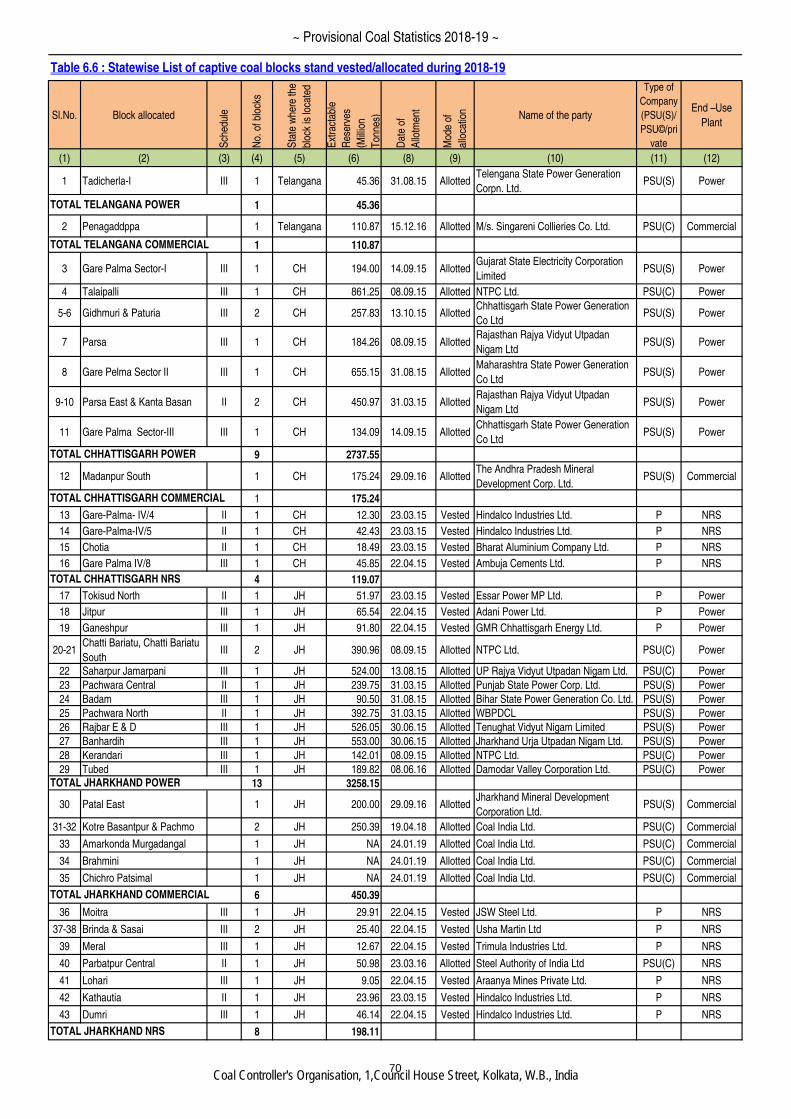
Sl.No. Block allocated
Sch
edul
e
No.
of b
lock
s
Sta
te w
here
the
bloc
k is
loca
ted
Ext
ract
able
Res
erve
s
(Mill
ion
Ton
nes)
Dat
e of
Allo
tmen
t
Mod
e of
allo
catio
n Name of the party
Type of
Company
(PSU(S)/
PSU©/pri
vate
End –Use
Plant
(1) (2) (3) (4) (5) (6) (8) (9) (10) (11) (12)
1 Tadicherla-I III 1 Telangana 45.36 31.08.15 AllottedTelengana State Power Generation
Corpn. Ltd.PSU(S) Power
1 45.36
2 Penagaddppa 1 Telangana 110.87 15.12.16 Allotted M/s. Singareni Collieries Co. Ltd. PSU(C) Commercial
1 110.87
3 Gare Palma Sector-I III 1 CH 194.00 14.09.15 AllottedGujarat State Electricity Corporation
LimitedPSU(S) Power
4 Talaipalli III 1 CH 861.25 08.09.15 Allotted NTPC Ltd. PSU(C) Power
5-6 Gidhmuri & Paturia III 2 CH 257.83 13.10.15 AllottedChhattisgarh State Power Generation
Co LtdPSU(S) Power
7 Parsa III 1 CH 184.26 08.09.15 AllottedRajasthan Rajya Vidyut Utpadan
Nigam LtdPSU(S) Power
8 Gare Pelma Sector II III 1 CH 655.15 31.08.15 AllottedMaharashtra State Power Generation
Co LtdPSU(S) Power
9-10 Parsa East & Kanta Basan II 2 CH 450.97 31.03.15 AllottedRajasthan Rajya Vidyut Utpadan
Nigam LtdPSU(S) Power
11 Gare Palma Sector-III III 1 CH 134.09 14.09.15 AllottedChhattisgarh State Power Generation
Co LtdPSU(S) Power
9 2737.55
12 Madanpur South 1 CH 175.24 29.09.16 AllottedThe Andhra Pradesh Mineral
Development Corp. Ltd.PSU(S) Commercial
1 175.24
13 Gare-Palma- IV/4 II 1 CH 12.30 23.03.15 Vested Hindalco Industries Ltd. P NRS
14 Gare-Palma-IV/5 II 1 CH 42.43 23.03.15 Vested Hindalco Industries Ltd. P NRS
15 Chotia II 1 CH 18.49 23.03.15 Vested Bharat Aluminium Company Ltd. P NRS
16 Gare Palma IV/8 III 1 CH 45.85 22.04.15 Vested Ambuja Cements Ltd. P NRS
4 119.07
17 Tokisud North II 1 JH 51.97 23.03.15 Vested Essar Power MP Ltd. P Power
18 Jitpur III 1 JH 65.54 22.04.15 Vested Adani Power Ltd. P Power
19 Ganeshpur III 1 JH 91.80 22.04.15 Vested GMR Chhattisgarh Energy Ltd. P Power
20-21Chatti Bariatu, Chatti Bariatu
SouthIII 2 JH 390.96 08.09.15 Allotted NTPC Ltd. PSU(C) Power
22 Saharpur Jamarpani III 1 JH 524.00 13.08.15 Allotted UP Rajya Vidyut Utpadan Nigam Ltd. PSU(C) Power
23 Pachwara Central II 1 JH 239.75 31.03.15 Allotted Punjab State Power Corp. Ltd. PSU(S) Power
24 Badam III 1 JH 90.50 31.08.15 Allotted Bihar State Power Generation Co. Ltd. PSU(S) Power
25 Pachwara North II 1 JH 392.75 31.03.15 Allotted WBPDCL PSU(S) Power
26 Rajbar E & D III 1 JH 526.05 30.06.15 Allotted Tenughat Vidyut Nigam Limited PSU(S) Power
27 Banhardih III 1 JH 553.00 30.06.15 Allotted Jharkhand Urja Utpadan Nigam Ltd. PSU(S) Power
28 Kerandari III 1 JH 142.01 08.09.15 Allotted NTPC Ltd. PSU(C) Power
29 Tubed III 1 JH 189.82 08.06.16 Allotted Damodar Valley Corporation Ltd. PSU(C) Power
13 3258.15
30 Patal East 1 JH 200.00 29.09.16 AllottedJharkhand Mineral Development
Corporation Ltd.PSU(S) Commercial
31-32 Kotre Basantpur & Pachmo 2 JH 250.39 19.04.18 Allotted Coal India Ltd. PSU(C) Commercial
33 Amarkonda Murgadangal 1 JH NA 24.01.19 Allotted Coal India Ltd. PSU(C) Commercial
34 Brahmini 1 JH NA 24.01.19 Allotted Coal India Ltd. PSU(C) Commercial
35 Chichro Patsimal 1 JH NA 24.01.19 Allotted Coal India Ltd. PSU(C) Commercial
6 450.39
36 Moitra III 1 JH 29.91 22.04.15 Vested JSW Steel Ltd. P NRS
37-38 Brinda & Sasai III 2 JH 25.40 22.04.15 Vested Usha Martin Ltd P NRS
39 Meral III 1 JH 12.67 22.04.15 Vested Trimula Industries Ltd. P NRS
40 Parbatpur Central II 1 JH 50.98 23.03.16 Allotted Steel Authority of India Ltd PSU(C) NRS
41 Lohari III 1 JH 9.05 22.04.15 Vested Araanya Mines Private Ltd. P NRS
42 Kathautia II 1 JH 23.96 23.03.15 Vested Hindalco Industries Ltd. P NRS
43 Dumri III 1 JH 46.14 22.04.15 Vested Hindalco Industries Ltd. P NRS
8 198.11
TOTAL TELANGANA COMMERCIAL
TOTAL CHHATTISGARH COMMERCIAL
TOTAL CHHATTISGARH NRS
TOTAL JHARKHAND COMMERCIAL
TOTAL JHARKHAND POWER
Table 6.6 : Statewise List of captive coal blocks stand vested/allocated during 2018-19
TOTAL JHARKHAND NRS
TOTAL TELANGANA POWER
TOTAL CHHATTISGARH POWER
70
~ Provisional Coal Statistics 2018-19 ~
Coal Controller's Organisation, 1,Council House Street, Kolkata, W.B., India
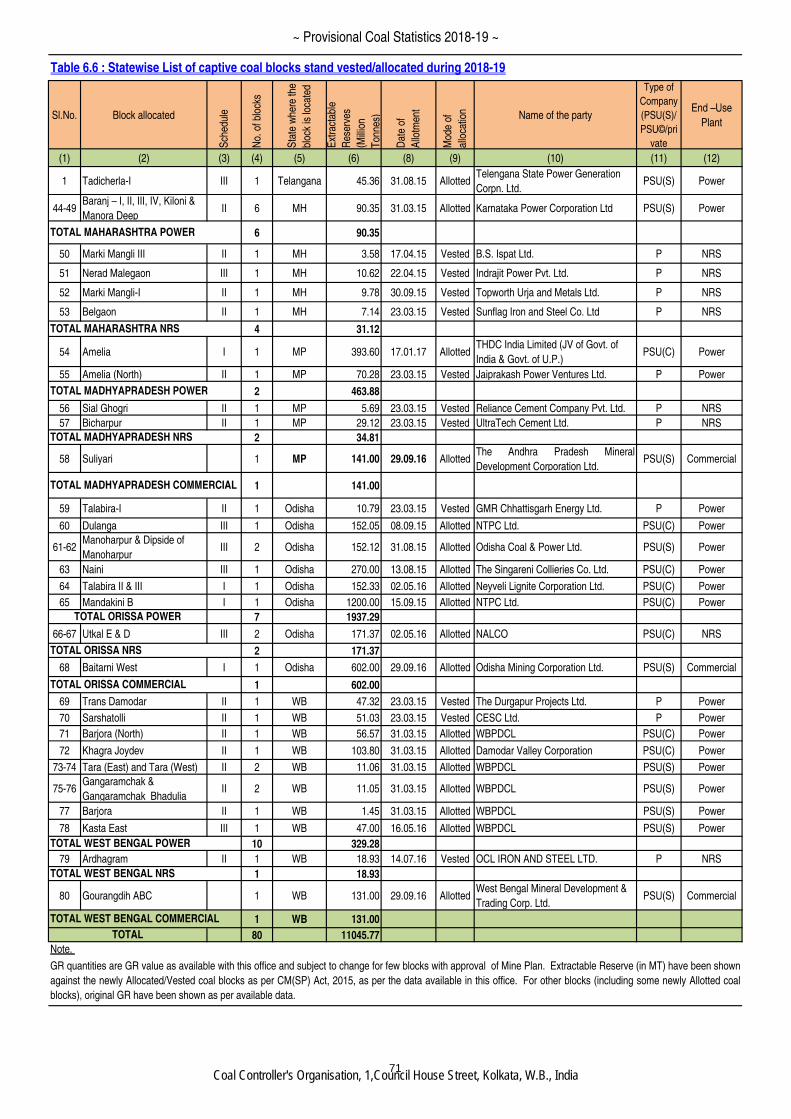
Sl.No. Block allocated
Sch
edul
e
No.
of b
lock
s
Sta
te w
here
the
bloc
k is
loca
ted
Ext
ract
able
Res
erve
s
(Mill
ion
Ton
nes)
Dat
e of
Allo
tmen
t
Mod
e of
allo
catio
n Name of the party
Type of
Company
(PSU(S)/
PSU©/pri
vate
End –Use
Plant
(1) (2) (3) (4) (5) (6) (8) (9) (10) (11) (12)
1 Tadicherla-I III 1 Telangana 45.36 31.08.15 AllottedTelengana State Power Generation
Corpn. Ltd.PSU(S) Power
Table 6.6 : Statewise List of captive coal blocks stand vested/allocated during 2018-19
44-49Baranj – I, II, III, IV, Kiloni &
Manora DeepII 6 MH 90.35 31.03.15 Allotted Karnataka Power Corporation Ltd PSU(S) Power
6 90.35
50 Marki Mangli III II 1 MH 3.58 17.04.15 Vested B.S. Ispat Ltd. P NRS
51 Nerad Malegaon III 1 MH 10.62 22.04.15 Vested Indrajit Power Pvt. Ltd. P NRS
52 Marki Mangli-I II 1 MH 9.78 30.09.15 Vested Topworth Urja and Metals Ltd. P NRS
53 Belgaon II 1 MH 7.14 23.03.15 Vested Sunflag Iron and Steel Co. Ltd P NRS
4 31.12
54 Amelia I 1 MP 393.60 17.01.17 AllottedTHDC India Limited (JV of Govt. of
India & Govt. of U.P.)PSU(C) Power
55 Amelia (North) II 1 MP 70.28 23.03.15 Vested Jaiprakash Power Ventures Ltd. P Power
2 463.88
56 Sial Ghogri II 1 MP 5.69 23.03.15 Vested Reliance Cement Company Pvt. Ltd. P NRS
57 Bicharpur II 1 MP 29.12 23.03.15 Vested UltraTech Cement Ltd. P NRS
2 34.81
58 Suliyari 1 MP 141.00 29.09.16 AllottedThe Andhra Pradesh Mineral
Development Corporation Ltd.PSU(S) Commercial
1 141.00
59 Talabira-I II 1 Odisha 10.79 23.03.15 Vested GMR Chhattisgarh Energy Ltd. P Power
60 Dulanga III 1 Odisha 152.05 08.09.15 Allotted NTPC Ltd. PSU(C) Power
61-62Manoharpur & Dipside of
ManoharpurIII 2 Odisha 152.12 31.08.15 Allotted Odisha Coal & Power Ltd. PSU(S) Power
63 Naini III 1 Odisha 270.00 13.08.15 Allotted The Singareni Collieries Co. Ltd. PSU(C) Power
64 Talabira II & III I 1 Odisha 152.33 02.05.16 Allotted Neyveli Lignite Corporation Ltd. PSU(C) Power
65 Mandakini B I 1 Odisha 1200.00 15.09.15 Allotted NTPC Ltd. PSU(C) Power
7 1937.29
66-67 Utkal E & D III 2 Odisha 171.37 02.05.16 Allotted NALCO PSU(C) NRS
2 171.37
68 Baitarni West I 1 Odisha 602.00 29.09.16 Allotted Odisha Mining Corporation Ltd. PSU(S) Commercial
1 602.00
69 Trans Damodar II 1 WB 47.32 23.03.15 Vested The Durgapur Projects Ltd. P Power
70 Sarshatolli II 1 WB 51.03 23.03.15 Vested CESC Ltd. P Power
71 Barjora (North) II 1 WB 56.57 31.03.15 Allotted WBPDCL PSU(C) Power
72 Khagra Joydev II 1 WB 103.80 31.03.15 Allotted Damodar Valley Corporation PSU(C) Power
73-74 Tara (East) and Tara (West) II 2 WB 11.06 31.03.15 Allotted WBPDCL PSU(S) Power
75-76Gangaramchak &
Gangaramchak Bhadulia II 2 WB 11.05 31.03.15 Allotted WBPDCL PSU(S) Power
77 Barjora II 1 WB 1.45 31.03.15 Allotted WBPDCL PSU(S) Power
78 Kasta East III 1 WB 47.00 16.05.16 Allotted WBPDCL PSU(S) Power
10 329.28
79 Ardhagram II 1 WB 18.93 14.07.16 Vested OCL IRON AND STEEL LTD. P NRS
1 18.93
80 Gourangdih ABC 1 WB 131.00 29.09.16 AllottedWest Bengal Mineral Development &
Trading Corp. Ltd.PSU(S) Commercial
1 WB 131.00
80 11045.77
Note.
TOTAL MADHYAPRADESH NRS
TOTAL
GR quantities are GR value as available with this office and subject to change for few blocks with approval of Mine Plan. Extractable Reserve (in MT) have been shown
against the newly Allocated/Vested coal blocks as per CM(SP) Act, 2015, as per the data available in this office. For other blocks (including some newly Allotted coal
blocks), original GR have been shown as per available data.
TOTAL ORISSA POWER
TOTAL WEST BENGAL NRS
TOTAL WEST BENGAL COMMERCIAL
TOTAL MADHYAPRADESH COMMERCIAL
TOTAL ORISSA NRS
TOTAL ORISSA COMMERCIAL
TOTAL WEST BENGAL POWER
TOTAL MAHARASHTRA POWER
TOTAL MAHARASHTRA NRS
TOTAL MADHYAPRADESH POWER
71
~ Provisional Coal Statistics 2018-19 ~
Coal Controller's Organisation, 1,Council House Street, Kolkata, W.B., India
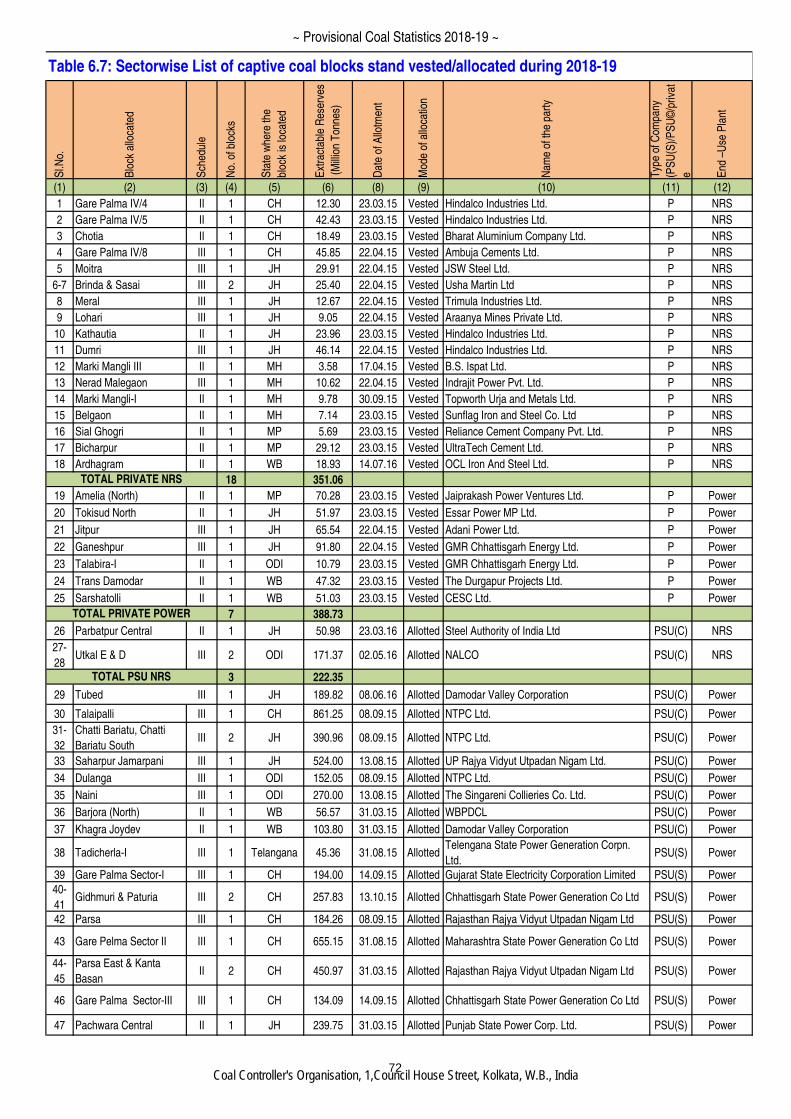
Sl.N
o.
Blo
ck a
lloca
ted
Sch
edul
e
No.
of b
lock
s
Sta
te w
here
the
bloc
k is
loca
ted
Ext
ract
able
Res
erve
s
(M
illio
n T
onne
s)
Dat
e of
Allo
tmen
t
Mod
e of
allo
catio
n
Nam
e of
the
part
y
Typ
e of
Com
pany
(PS
U(S
)/P
SU
©/p
rivat
e End
–U
se P
lant
(1) (2) (3) (4) (5) (6) (8) (9) (10) (11) (12)
1 Gare Palma IV/4 II 1 CH 12.30 23.03.15 Vested Hindalco Industries Ltd. P NRS
2 Gare Palma IV/5 II 1 CH 42.43 23.03.15 Vested Hindalco Industries Ltd. P NRS
3 Chotia II 1 CH 18.49 23.03.15 Vested Bharat Aluminium Company Ltd. P NRS
4 Gare Palma IV/8 III 1 CH 45.85 22.04.15 Vested Ambuja Cements Ltd. P NRS
5 Moitra III 1 JH 29.91 22.04.15 Vested JSW Steel Ltd. P NRS
6-7 Brinda & Sasai III 2 JH 25.40 22.04.15 Vested Usha Martin Ltd P NRS
8 Meral III 1 JH 12.67 22.04.15 Vested Trimula Industries Ltd. P NRS
9 Lohari III 1 JH 9.05 22.04.15 Vested Araanya Mines Private Ltd. P NRS
10 Kathautia II 1 JH 23.96 23.03.15 Vested Hindalco Industries Ltd. P NRS
11 Dumri III 1 JH 46.14 22.04.15 Vested Hindalco Industries Ltd. P NRS
12 Marki Mangli III II 1 MH 3.58 17.04.15 Vested B.S. Ispat Ltd. P NRS
13 Nerad Malegaon III 1 MH 10.62 22.04.15 Vested Indrajit Power Pvt. Ltd. P NRS
14 Marki Mangli-I II 1 MH 9.78 30.09.15 Vested Topworth Urja and Metals Ltd. P NRS
15 Belgaon II 1 MH 7.14 23.03.15 Vested Sunflag Iron and Steel Co. Ltd P NRS
16 Sial Ghogri II 1 MP 5.69 23.03.15 Vested Reliance Cement Company Pvt. Ltd. P NRS
17 Bicharpur II 1 MP 29.12 23.03.15 Vested UltraTech Cement Ltd. P NRS
18 Ardhagram II 1 WB 18.93 14.07.16 Vested OCL Iron And Steel Ltd. P NRS
18 351.06
19 Amelia (North) II 1 MP 70.28 23.03.15 Vested Jaiprakash Power Ventures Ltd. P Power
20 Tokisud North II 1 JH 51.97 23.03.15 Vested Essar Power MP Ltd. P Power
21 Jitpur III 1 JH 65.54 22.04.15 Vested Adani Power Ltd. P Power
22 Ganeshpur III 1 JH 91.80 22.04.15 Vested GMR Chhattisgarh Energy Ltd. P Power
23 Talabira-I II 1 ODI 10.79 23.03.15 Vested GMR Chhattisgarh Energy Ltd. P Power
24 Trans Damodar II 1 WB 47.32 23.03.15 Vested The Durgapur Projects Ltd. P Power
25 Sarshatolli II 1 WB 51.03 23.03.15 Vested CESC Ltd. P Power
7 388.73
26 Parbatpur Central II 1 JH 50.98 23.03.16 Allotted Steel Authority of India Ltd PSU(C) NRS
27-
28Utkal E & D III 2 ODI 171.37 02.05.16 Allotted NALCO PSU(C) NRS
3 222.35
29 Tubed III 1 JH 189.82 08.06.16 Allotted Damodar Valley Corporation PSU(C) Power
30 Talaipalli III 1 CH 861.25 08.09.15 Allotted NTPC Ltd. PSU(C) Power
31-
32
Chatti Bariatu, Chatti
Bariatu SouthIII 2 JH 390.96 08.09.15 Allotted NTPC Ltd. PSU(C) Power
33 Saharpur Jamarpani III 1 JH 524.00 13.08.15 Allotted UP Rajya Vidyut Utpadan Nigam Ltd. PSU(C) Power
34 Dulanga III 1 ODI 152.05 08.09.15 Allotted NTPC Ltd. PSU(C) Power
35 Naini III 1 ODI 270.00 13.08.15 Allotted The Singareni Collieries Co. Ltd. PSU(C) Power
36 Barjora (North) II 1 WB 56.57 31.03.15 Allotted WBPDCL PSU(C) Power
37 Khagra Joydev II 1 WB 103.80 31.03.15 Allotted Damodar Valley Corporation PSU(C) Power
38 Tadicherla-I III 1 Telangana 45.36 31.08.15 AllottedTelengana State Power Generation Corpn.
Ltd.PSU(S) Power
39 Gare Palma Sector-I III 1 CH 194.00 14.09.15 Allotted Gujarat State Electricity Corporation Limited PSU(S) Power
40-
41Gidhmuri & Paturia III 2 CH 257.83 13.10.15 Allotted Chhattisgarh State Power Generation Co Ltd PSU(S) Power
42 Parsa III 1 CH 184.26 08.09.15 Allotted Rajasthan Rajya Vidyut Utpadan Nigam Ltd PSU(S) Power
43 Gare Pelma Sector II III 1 CH 655.15 31.08.15 Allotted Maharashtra State Power Generation Co Ltd PSU(S) Power
44-
45
Parsa East & Kanta
BasanII 2 CH 450.97 31.03.15 Allotted Rajasthan Rajya Vidyut Utpadan Nigam Ltd PSU(S) Power
46 Gare Palma Sector-III III 1 CH 134.09 14.09.15 Allotted Chhattisgarh State Power Generation Co Ltd PSU(S) Power
47 Pachwara Central II 1 JH 239.75 31.03.15 Allotted Punjab State Power Corp. Ltd. PSU(S) Power
Table 6.7: Sectorwise List of captive coal blocks stand vested/allocated during 2018-19
TOTAL PRIVATE NRS
TOTAL PRIVATE POWER
TOTAL PSU NRS
72
~ Provisional Coal Statistics 2018-19 ~
Coal Controller's Organisation, 1,Council House Street, Kolkata, W.B., India
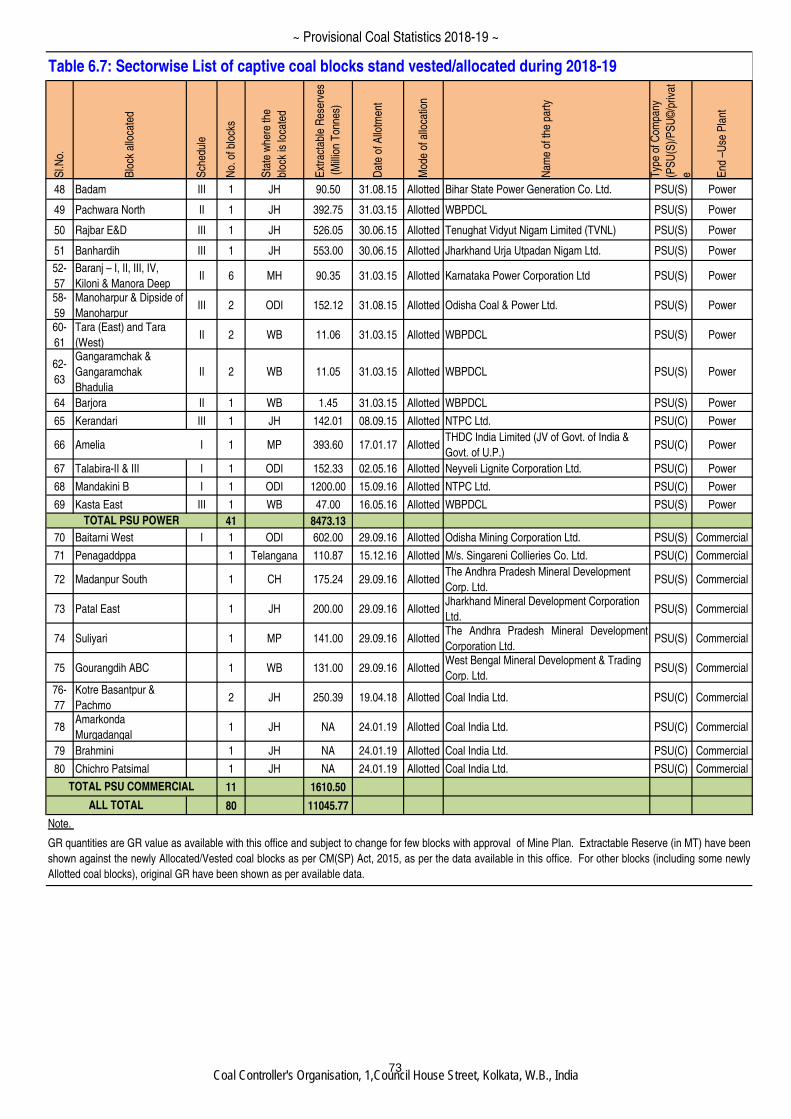
Sl.N
o.
Blo
ck a
lloca
ted
Sch
edul
e
No.
of b
lock
s
Sta
te w
here
the
bloc
k is
loca
ted
Ext
ract
able
Res
erve
s
(M
illio
n T
onne
s)
Dat
e of
Allo
tmen
t
Mod
e of
allo
catio
n
Nam
e of
the
part
y
Typ
e of
Com
pany
(PS
U(S
)/P
SU
©/p
rivat
e End
–U
se P
lant
Table 6.7: Sectorwise List of captive coal blocks stand vested/allocated during 2018-19
48 Badam III 1 JH 90.50 31.08.15 Allotted Bihar State Power Generation Co. Ltd. PSU(S) Power
49 Pachwara North II 1 JH 392.75 31.03.15 Allotted WBPDCL PSU(S) Power
50 Rajbar E&D III 1 JH 526.05 30.06.15 Allotted Tenughat Vidyut Nigam Limited (TVNL) PSU(S) Power
51 Banhardih III 1 JH 553.00 30.06.15 Allotted Jharkhand Urja Utpadan Nigam Ltd. PSU(S) Power
52-
57
Baranj – I, II, III, IV,
Kiloni & Manora DeepII 6 MH 90.35 31.03.15 Allotted Karnataka Power Corporation Ltd PSU(S) Power
58-
59
Manoharpur & Dipside of
ManoharpurIII 2 ODI 152.12 31.08.15 Allotted Odisha Coal & Power Ltd. PSU(S) Power
60-
61
Tara (East) and Tara
(West) II 2 WB 11.06 31.03.15 Allotted WBPDCL PSU(S) Power
62-
63
Gangaramchak &
Gangaramchak
Bhadulia
II 2 WB 11.05 31.03.15 Allotted WBPDCL PSU(S) Power
64 Barjora II 1 WB 1.45 31.03.15 Allotted WBPDCL PSU(S) Power
65 Kerandari III 1 JH 142.01 08.09.15 Allotted NTPC Ltd. PSU(C) Power
66 Amelia I 1 MP 393.60 17.01.17 AllottedTHDC India Limited (JV of Govt. of India &
Govt. of U.P.)PSU(C) Power
67 Talabira-II & III I 1 ODI 152.33 02.05.16 Allotted Neyveli Lignite Corporation Ltd. PSU(C) Power
68 Mandakini B I 1 ODI 1200.00 15.09.16 Allotted NTPC Ltd. PSU(C) Power
69 Kasta East III 1 WB 47.00 16.05.16 Allotted WBPDCL PSU(S) Power
41 8473.13
70 Baitarni West I 1 ODI 602.00 29.09.16 Allotted Odisha Mining Corporation Ltd. PSU(S) Commercial
71 Penagaddppa 1 Telangana 110.87 15.12.16 Allotted M/s. Singareni Collieries Co. Ltd. PSU(C) Commercial
72 Madanpur South 1 CH 175.24 29.09.16 AllottedThe Andhra Pradesh Mineral Development
Corp. Ltd.PSU(S) Commercial
73 Patal East 1 JH 200.00 29.09.16 AllottedJharkhand Mineral Development Corporation
Ltd.PSU(S) Commercial
74 Suliyari 1 MP 141.00 29.09.16 AllottedThe Andhra Pradesh Mineral Development
Corporation Ltd.PSU(S) Commercial
75 Gourangdih ABC 1 WB 131.00 29.09.16 AllottedWest Bengal Mineral Development & Trading
Corp. Ltd.PSU(S) Commercial
76-
77
Kotre Basantpur &
Pachmo2 JH 250.39 19.04.18 Allotted Coal India Ltd. PSU(C) Commercial
78Amarkonda
Murgadangal1 JH NA 24.01.19 Allotted Coal India Ltd. PSU(C) Commercial
79 Brahmini 1 JH NA 24.01.19 Allotted Coal India Ltd. PSU(C) Commercial
80 Chichro Patsimal 1 JH NA 24.01.19 Allotted Coal India Ltd. PSU(C) Commercial
11 1610.50
80 11045.77
Note.
GR quantities are GR value as available with this office and subject to change for few blocks with approval of Mine Plan. Extractable Reserve (in MT) have been
shown against the newly Allocated/Vested coal blocks as per CM(SP) Act, 2015, as per the data available in this office. For other blocks (including some newly
Allotted coal blocks), original GR have been shown as per available data.
TOTAL PSU POWER
TOTAL PSU COMMERCIAL
ALL TOTAL
73
~ Provisional Coal Statistics 2018-19 ~
Coal Controller's Organisation, 1,Council House Street, Kolkata, W.B., India
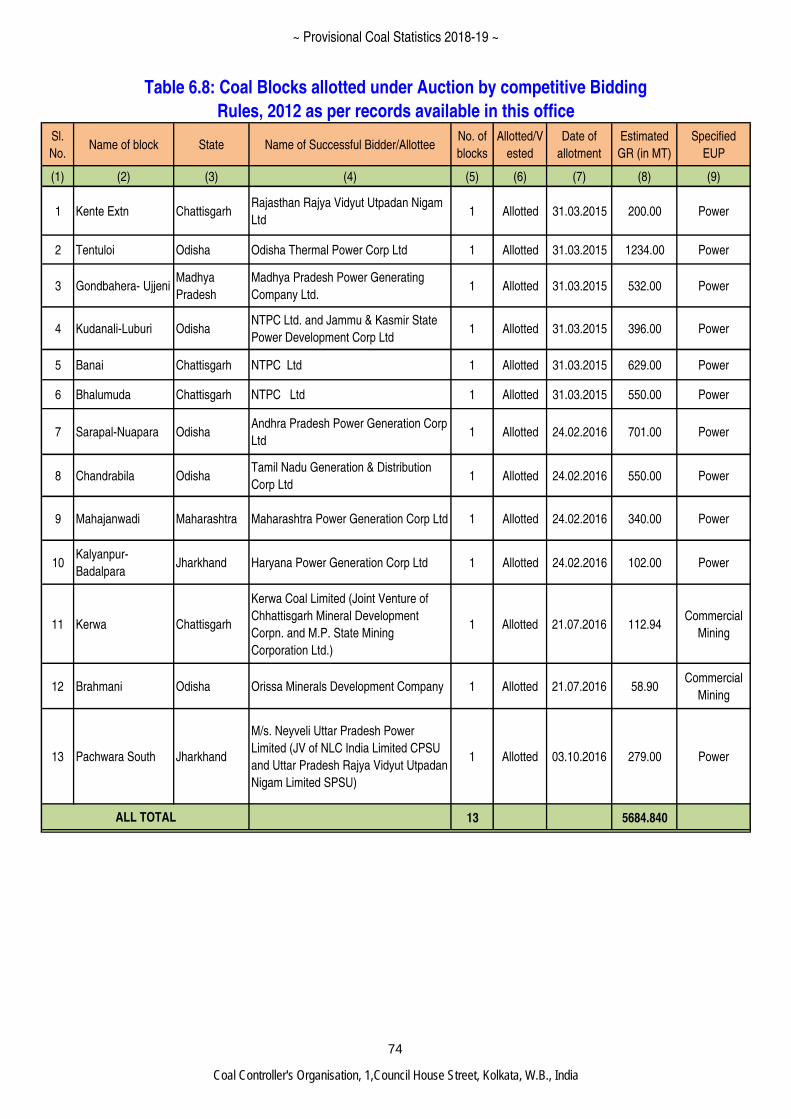
Sl.
No.Name of block State Name of Successful Bidder/Allottee
No. of
blocks
Allotted/V
ested
Date of
allotment
Estimated
GR (in MT)
Specified
EUP
(1) (2) (3) (4) (5) (6) (7) (8) (9)
1 Kente Extn ChattisgarhRajasthan Rajya Vidyut Utpadan Nigam
Ltd1 Allotted 31.03.2015 200.00 Power
2 Tentuloi Odisha Odisha Thermal Power Corp Ltd 1 Allotted 31.03.2015 1234.00 Power
3 Gondbahera- UjjeniMadhya
Pradesh
Madhya Pradesh Power Generating
Company Ltd.1 Allotted 31.03.2015 532.00 Power
4 Kudanali-Luburi OdishaNTPC Ltd. and Jammu & Kasmir State
Power Development Corp Ltd1 Allotted 31.03.2015 396.00 Power
5 Banai Chattisgarh NTPC Ltd 1 Allotted 31.03.2015 629.00 Power
6 Bhalumuda Chattisgarh NTPC Ltd 1 Allotted 31.03.2015 550.00 Power
7 Sarapal-Nuapara OdishaAndhra Pradesh Power Generation Corp
Ltd1 Allotted 24.02.2016 701.00 Power
8 Chandrabila OdishaTamil Nadu Generation & Distribution
Corp Ltd1 Allotted 24.02.2016 550.00 Power
9 Mahajanwadi Maharashtra Maharashtra Power Generation Corp Ltd 1 Allotted 24.02.2016 340.00 Power
10Kalyanpur-
BadalparaJharkhand Haryana Power Generation Corp Ltd 1 Allotted 24.02.2016 102.00 Power
11 Kerwa Chattisgarh
Kerwa Coal Limited (Joint Venture of
Chhattisgarh Mineral Development
Corpn. and M.P. State Mining
Corporation Ltd.)
1 Allotted 21.07.2016 112.94Commercial
Mining
12 Brahmani Odisha Orissa Minerals Development Company 1 Allotted 21.07.2016 58.90Commercial
Mining
13 Pachwara South Jharkhand
M/s. Neyveli Uttar Pradesh Power
Limited (JV of NLC India Limited CPSU
and Uttar Pradesh Rajya Vidyut Utpadan
Nigam Limited SPSU)
1 Allotted 03.10.2016 279.00 Power
13 5684.840
Table 6.8: Coal Blocks allotted under Auction by competitive Bidding
Rules, 2012 as per records available in this office
ALL TOTAL
74
~ Provisional Coal Statistics 2018-19 ~
Coal Controller's Organisation, 1,Council House Street, Kolkata, W.B., India
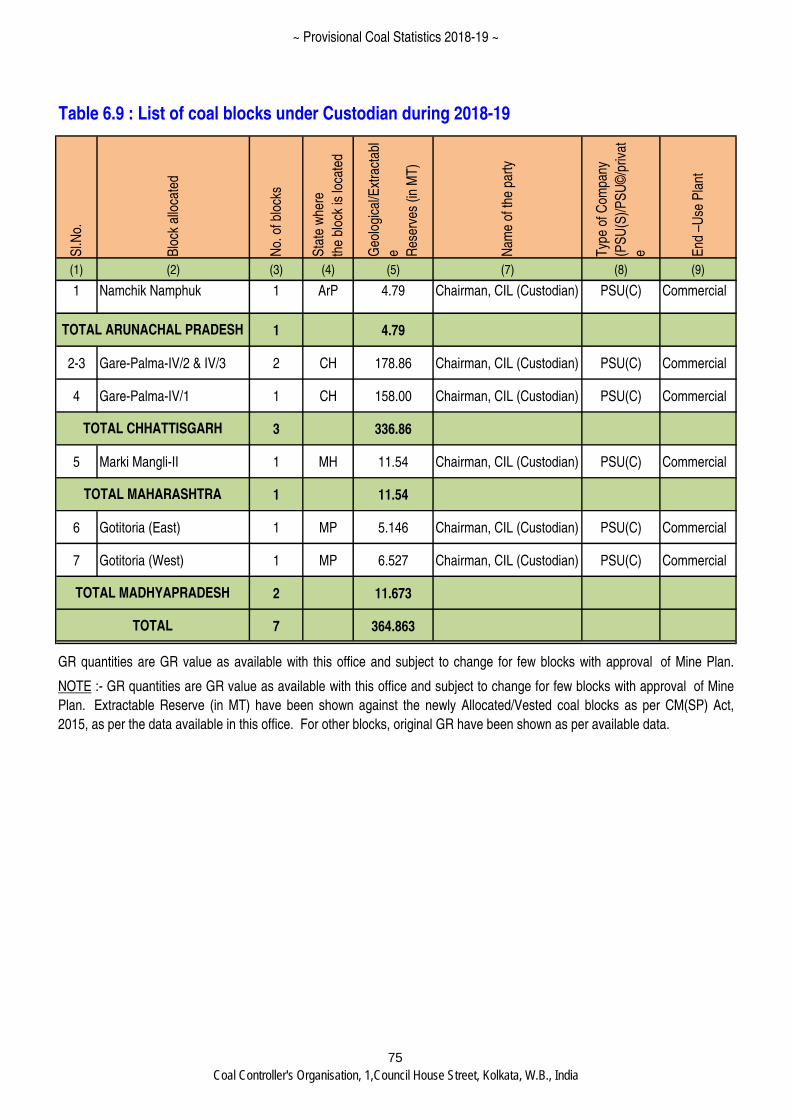
Sl.N
o.
Blo
ck a
lloca
ted
No.
of b
lock
s
Sta
te w
here
the
bloc
k is
loca
ted
Geo
logi
cal/E
xtra
ctab
l
e Res
erve
s (in
MT
)
Nam
e of
the
part
y
Typ
e of
Com
pany
(PS
U(S
)/P
SU
©/p
rivat
e End
–U
se P
lant
(1) (2) (3) (4) (5) (7) (8) (9)
1 Namchik Namphuk 1 ArP 4.79 Chairman, CIL (Custodian) PSU(C) Commercial
1 4.79
2-3 Gare-Palma-IV/2 & IV/3 2 CH 178.86 Chairman, CIL (Custodian) PSU(C) Commercial
4 Gare-Palma-IV/1 1 CH 158.00 Chairman, CIL (Custodian) PSU(C) Commercial
3 336.86
5 Marki Mangli-II 1 MH 11.54 Chairman, CIL (Custodian) PSU(C) Commercial
1 11.54
6 Gotitoria (East) 1 MP 5.146 Chairman, CIL (Custodian) PSU(C) Commercial
7 Gotitoria (West) 1 MP 6.527 Chairman, CIL (Custodian) PSU(C) Commercial
2 11.673
7 364.863
Table 6.9 : List of coal blocks under Custodian during 2018-19
TOTAL
NOTE :- GR quantities are GR value as available with this office and subject to change for few blocks with approval of Mine
Plan. Extractable Reserve (in MT) have been shown against the newly Allocated/Vested coal blocks as per CM(SP) Act,
2015, as per the data available in this office. For other blocks, original GR have been shown as per available data.
TOTAL ARUNACHAL PRADESH
TOTAL CHHATTISGARH
TOTAL MAHARASHTRA
TOTAL MADHYAPRADESH
GR quantities are GR value as available with this office and subject to change for few blocks with approval of Mine Plan.
Extractable Reserve (in MT) have been shown against the newly Allocated/Vested coal blocks as per CM(SP) Act, 2015, as
75
~ Provisional Coal Statistics 2018-19 ~
Coal Controller's Organisation, 1,Council House Street, Kolkata, W.B., India
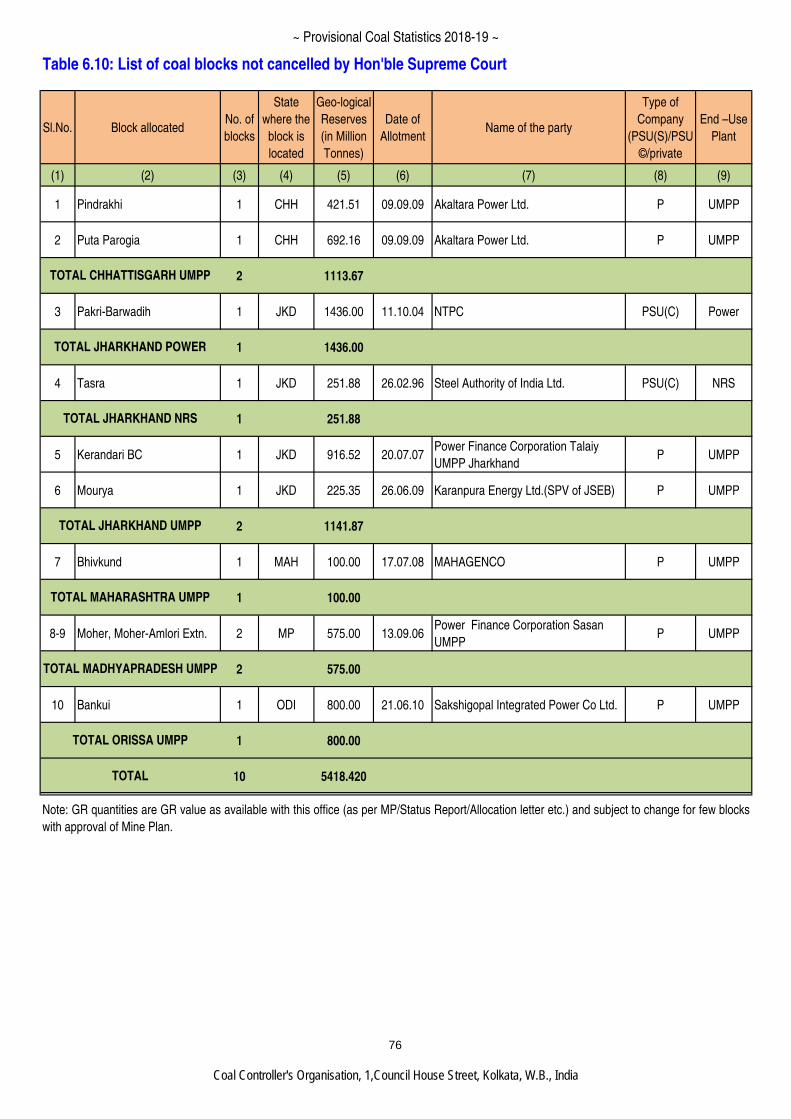
Sl.No. Block allocatedNo. of
blocks
State
where the
block is
located
Geo-logical
Reserves
(in Million
Tonnes)
Date of
AllotmentName of the party
Type of
Company
(PSU(S)/PSU
©/private
End –Use
Plant
(1) (2) (3) (4) (5) (6) (7) (8) (9)
1 Pindrakhi 1 CHH 421.51 09.09.09 Akaltara Power Ltd. P UMPP
2 Puta Parogia 1 CHH 692.16 09.09.09 Akaltara Power Ltd. P UMPP
2 1113.67
3 Pakri-Barwadih 1 JKD 1436.00 11.10.04 NTPC PSU(C) Power
1 1436.00
4 Tasra 1 JKD 251.88 26.02.96 Steel Authority of India Ltd. PSU(C) NRS
1 251.88
5 Kerandari BC 1 JKD 916.52 20.07.07Power Finance Corporation Talaiy
UMPP JharkhandP UMPP
6 Mourya 1 JKD 225.35 26.06.09 Karanpura Energy Ltd.(SPV of JSEB) P UMPP
2 1141.87
7 Bhivkund 1 MAH 100.00 17.07.08 MAHAGENCO P UMPP
1 100.00
8-9 Moher, Moher-Amlori Extn. 2 MP 575.00 13.09.06Power Finance Corporation Sasan
UMPPP UMPP
2 575.00
10 Bankui 1 ODI 800.00 21.06.10 Sakshigopal Integrated Power Co Ltd. P UMPP
1 800.00
10 5418.420
TOTAL ORISSA UMPP
TOTAL
Note: GR quantities are GR value as available with this office (as per MP/Status Report/Allocation letter etc.) and subject to change for few blocks
with approval of Mine Plan.
Table 6.10: List of coal blocks not cancelled by Hon'ble Supreme Court
TOTAL CHHATTISGARH UMPP
TOTAL JHARKHAND POWER
TOTAL JHARKHAND NRS
TOTAL JHARKHAND UMPP
TOTAL MAHARASHTRA UMPP
TOTAL MADHYAPRADESH UMPP
76
~ Provisional Coal Statistics 2018-19 ~
Coal Controller's Organisation, 1,Council House Street, Kolkata, W.B., India
77
Appendix - A
Concepts, Definitions and Practices
1. Coal: Coal is a combustible sedimentary rock
formed from ancient vegetation which has been
consolidated between other rock strata and
transformed by the combined effects of
microbial action, pressure and heat over a
considerable time period. This process is
commonly called „coalification‟. Coal occurs as
layers or seams, ranging in thickness from
millimeters to many tens of metres. It is
composed mostly of carbon (50–98 per cent),
hydrogen (3–13 per cent) and oxygen, and
smaller amounts of nitrogen, sulphur and other
elements. It also contains water and particles of
other inorganic matter. When burnt, coal
releases energy as heat which has a variety of
uses.
2. Classification of Coal
2.1 Coal refers to a whole range of combustible
sedimentary rock materials spanning a
continuous quality scale. For convenience, this
continuous series is often divided into two main
categories, namely Hard Coal and Brown
Coal. These are further divided into two
subcategories as given below.
Hard Coal
Anthracite
Bituminous coal
Coking coal
Other bituminous coal
Brown coal
Sub-bituminous coal
Lignite
2.2 In practice, hard coal is calculated as the
sum of anthracite and bituminous coals.
Anthracite is a high-rank, hard coal used mainly
for industrial and residential heat raising.
Bituminous coal is a medium-rank coal used for
gasification, industrial coking and heat raising
and residential heat raising. Bituminous coal
that can be used in the production of a coke
capable of supporting a blast furnace charge is
known as coking coal. Other bituminous coal,
not included under coking coal, is also
commonly known as thermal coal. This also
includes recovered slurries, middling and other
low-grade, higher-rank coal products not
further classified by type.
2.3 Classifying different types of coal into
practical categories for use at an international
level is difficult because divisions between coal
categories vary between classification systems,
both national and international, based on
calorific value, volatile matter content, fixed
carbon content, caking and coking properties,
or some combination of two or more of these
criteria.
2.4 Although the relative value of the coals
within a particular category depends on the
degree of dilution by moisture and ash and
contamination by sulphur, chlorine,
phosphorous and certain trace elements, these
factors do not affect the divisions between
categories.
2.5 The International Coal Classification of the
Economic Commission for Europe (UNECE)
recognizes two broad categories of coal:
i) Hard coal – Coal of gross calorific value
not less than 5700 kcal/kg (23.9 GJ/t) on an
ash-free but moist basis and with a mean
random reflectance of vitrinite of at least 0.6.
ii)
~ Provisional Coal Statistics 2018-19 ~
Coal Controller's Organisation, 1,Council House Street, Kolkata, W.B., India
78
iii) Brown coal - Non-agglomerating coal with
a gross calorific value less than 5700 kcal/kg
(23.9 GJ/t) containing more than 31% volatile
matter on a dry mineral matter free basis.
2.6 It should be stressed that the above
classification system is based on the inherent
qualities of the coal in question and not on the
final use of the coal. In this way the
classification system attempts to be objective
and simple to apply.
3. Classification of Coal in India
3.1 In India coal is broadly classified into two
types – Coking and Non-Coking. The former
constitute only a small part of the total coal
resources of the country. These two are further
subdivided as follows on the basis of certain
physical and chemical parameter as per the
requirement of the industry.
3.2 Coking Coal: Coking coal, when heated in
the absence of air, form coherent beads, free
from volatiles, with strong and porous mass,
called coke. Coking coal has coking properties
and is mainly used in steel making and
metallurgical industries.
3.3 Semi Coking Coal: Semi Coking Coal,
when heated in the absence of air, form
coherent beads not strong enough to be directly
fed into the blast furnace. Such coal is blended
with coking coal in adequate proportion to
make coke. Clearly, Semi Coking Coal has
comparatively less coking properties than
coking coal. It is mainly used as blendable coal
in steel making, merchant coke manufacturing
and other metallurgical industries.
3.4 Non-Coking Coal: Non-Coking Coal does
not have coking properties and is mainly used
for power generation. It is also used for
cement, fertilizer, glass, ceramic, paper,
chemical and brick manufacturing, and for other
heating purposes.
3.5 Washed Coal: Processing of coal through
water separation mechanism to improve the
quality of coal by removing denser material
(rocks) and high ash produces washed coal
which has less ash, higher moisture, better
sizing, better consistency, less abrasive, etc.
The washed coking coal is used in
manufacturing of hard coke for steel making.
Washed non-coking coal is used mainly for
power generation but is also used by cement,
sponge iron and other industrial plants.
3.6 Middlings and Rejects: In the process of
coal washing, apart from Clean Coal we also get
two by-products, namely, Middlings and
Rejects. Clean coal has low density whereas
rejects have high density. Middlings have
intermediate density. Rejects contain high ash,
mineral impurities, fraction of raw coal feed,
etc. and are used for Fluidized Bed Combustion
(FBC) Boilers for power generation, road
repairs, briquette (domestic fuel) making, land
filling, etc. Middlings are fraction of raw coal
feed having values of classificatory parameters
between that of clan coals and rejects. It is
used for power generation. It is also used by
domestic fuel plants, brick manufacturing units,
cement plants, industrial plants, etc.
3.7 Hard Coke: Solid product obtained from
carbonaisation of coal, used mainly in the iron &
steel industry.
4. Categorisation of Coal in India
4.1 In India, coking coal has been categorized
or graded on the basis of ash content as per
following scheme:
Grade Ash Content
Steel Gr I Ash content < 15%
Steel Gr II 15%<=Ash content<18%
Washery Gr. I 18%<=Ash content<21%.
Washery Gr. II 21%<=Ash content<24%
Washery Gr. III 24%<=Ash content<28%
Washery Gr. IV 28%<=Ash content<35%
Washery Gr. V 35%<=Ash content<42%
Washery Gr. VI 42%<=Ash content<49%
~ Provisional Coal Statistics 2018-19 ~
Coal Controller's Organisation, 1,Council House Street, Kolkata, W.B., India
79
4.2 In India, semi coking coal has been
categorized or graded on the basis of ash and
moisture content as per following scheme:
Grade Ash + Moisture content
Semi coking Gr. I less than 19%
Semi coking Gr.
II
Between 19% and
24%
4.3 In India, non-coking coal had been
categorized or graded on the basis of Useful
Heat Value (UHV) as per following scheme:
Grade Useful Heat Value
A UHV.> 6200 KCal/Kg
B 6200 >=UHV(KCal/Kg)>5600
C 5600 >=UHV(KCal/Kg)>4940
D 4940 >=UHV(KCal/Kg)>4200
E 4200 >=UHV(KCal/Kg)>3360
F 3360 >=UHV(KCal/Kg)>2400
G 2400 >=UHV(KCal/Kg)>1300
N.B 1: "Useful heat value" is defined as:
UHV = 8900- 138 (A + M)
Where UHV = Useful heat value in KCal/kg,
A = Ash content (%), M = Moisture content (%).
N.B 2: In the case of coal having moisture less
than 2 percent and volatile content less than 19
percent the useful heat value shall be the value
arrived as above reduced by 150 kilo calories
per kilogram for each 1 percent reduction in
volatile content below 19 percent fraction pro-
rata.
N.B 3: Both moisture and ash is determined
after equilibrating at 60 percent relative
humidity and 40 degree C temperature.
N.B 4: Ash percentage of coking coals and hard
coke shall be determined after air drying as per
IS1350 -1959. If the moisture so determined is
more than 2 per cent, the determination shall
be after equilibrating at 60 percent relative
humidity at 40 degree C temperature as per IS :
1350 - 1959.
4.4 In order to adopt the best international
practices, India decided to switch over from the
grading based on Useful Heat Value (UHV) to
the grading based on Gross Calorific Value
(GCV) and therefore on 16.01.2011 the Ministry
of Coal notified the switch over. As per the new
system, following nomenclature has been
introduced for gradation of non-coking coal.
Grades GCV Range (Kcal/Kg)
G1 GCV exceeding 7000
G2 GCV between 6701 and
7000
G3 GCV between 6401 and
6700
G4 GCV between 6101 and
6400
G5 GCV between 5801 and
6100
G6 GCV between 5501 and
5800
G7 GCV between 5201 and
5500
G8 GCV between 4901 and
5200
G9 GCV between 4601 and
4900
G10 GCV between 4301 and
4600
G11 GCV between 4001 and
4300
G12 GCV between 3700 and
4000
G13 GCV between 3400 and
3700
G14 GCV between 3101 and
3400
G15 GCV between 2801 and
3100
G16 GCV between 2501 and
2800
G17 GCV between 2201 and
2500
~ Provisional Coal Statistics 2018-19 ~
Coal Controller's Organisation, 1,Council House Street, Kolkata, W.B., India
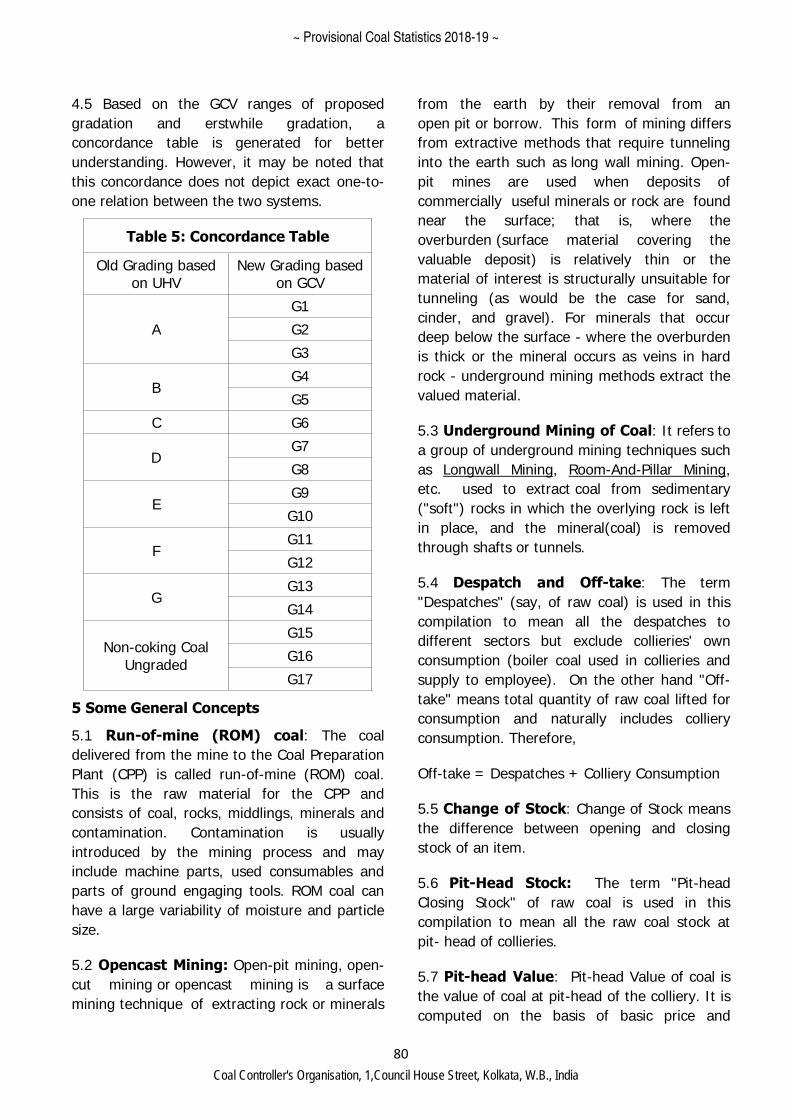
80
4.5 Based on the GCV ranges of proposed
gradation and erstwhile gradation, a
concordance table is generated for better
understanding. However, it may be noted that
this concordance does not depict exact one-to-
one relation between the two systems.
Table 5: Concordance Table
Old Grading based on UHV
New Grading based on GCV
A
G1
G2
G3
B G4
G5
C G6
D G7
G8
E G9
G10
F G11
G12
G G13
G14
Non-coking Coal Ungraded
G15
G16
G17
5 Some General Concepts
5.1 Run-of-mine (ROM) coal: The coal
delivered from the mine to the Coal Preparation
Plant (CPP) is called run-of-mine (ROM) coal.
This is the raw material for the CPP and
consists of coal, rocks, middlings, minerals and
contamination. Contamination is usually
introduced by the mining process and may
include machine parts, used consumables and
parts of ground engaging tools. ROM coal can
have a large variability of moisture and particle
size.
5.2 Opencast Mining: Open-pit mining, open-
cut mining or opencast mining is a surface
mining technique of extracting rock or minerals
from the earth by their removal from an
open pit or borrow. This form of mining differs
from extractive methods that require tunneling
into the earth such as long wall mining. Open-
pit mines are used when deposits of
commercially useful minerals or rock are found
near the surface; that is, where the
overburden (surface material covering the
valuable deposit) is relatively thin or the
material of interest is structurally unsuitable for
tunneling (as would be the case for sand,
cinder, and gravel). For minerals that occur
deep below the surface - where the overburden
is thick or the mineral occurs as veins in hard
rock - underground mining methods extract the
valued material.
5.3 Underground Mining of Coal: It refers to
a group of underground mining techniques such
as Longwall Mining, Room-And-Pillar Mining,
etc. used to extract coal from sedimentary
("soft") rocks in which the overlying rock is left
in place, and the mineral(coal) is removed
through shafts or tunnels.
5.4 Despatch and Off-take: The term
"Despatches" (say, of raw coal) is used in this
compilation to mean all the despatches to
different sectors but exclude collieries' own
consumption (boiler coal used in collieries and
supply to employee). On the other hand "Off-
take" means total quantity of raw coal lifted for
consumption and naturally includes colliery
consumption. Therefore,
Off-take = Despatches + Colliery Consumption
5.5 Change of Stock: Change of Stock means
the difference between opening and closing
stock of an item.
5.6 Pit-Head Stock: The term "Pit-head
Closing Stock" of raw coal is used in this
compilation to mean all the raw coal stock at
pit- head of collieries.
5.7 Pit-head Value: Pit-head Value of coal is
the value of coal at pit-head of the colliery. It is
computed on the basis of basic price and
~ Provisional Coal Statistics 2018-19 ~
Coal Controller's Organisation, 1,Council House Street, Kolkata, W.B., India
81
therefore it does not involve any cost of
loading, transportation from pit-head, Cess,
Royalty, Sales tax, Stowing Excise Duty etc.
This approach is followed by all non-captive
coal companies, viz., CIL Subsidiaries, Singareni
Collieries Companies Ltd. (SCCL), Jharkhand
State Mineral Development Corporation Ltd.
(JSMDCL) and Jammu & Kashmir Mineral Ltd.
(JKML).
5.7.1 In case of captive collieries, pit-head
value of coal depends upon their accounting
policy. If the costing of coal is done on no-
profit-no-loss basis then pit-head value is
calculated accordingly. This practice is found to
be followed in captive collieries of public sector
units.
5.7.2 On the other hand, if the captive colliery
is treated as independent commercial unit then
pit-head value is calculated on the basis of unit
value of realisation, which includes cost price
and profit/loss per unit but excludes any
transportation cost from pit-head, Cess,
Royalty, Sales tax, Stowing Excise Duty etc.
This is particularly followed in private captive
colliery which is in contract to supply coal to
any priority sector for which captive colliery is
permitted (Steel, Iron, Power, Cement, etc.).
5.7.3 Even there are private sector collieries
being managed by the parent company
engaged in manufacturing of Steel and Iron,
Power, Cement for which captive collieries are
allowed. Due to non-availability of value figures
from these companies, pit-head value of coal is
determined on the basis of nearest Coal India
Subsidiary price rate considering comparable
grade and location. Though this may not be a
correct price and would not depict a true
picture, yet we use it because this is one of the
acceptable estimates.
5.7.4 While using value data it is to be kept in
mind that these data are useful for macro-level
study or trend study. However, the quality of
coal has been deteriorating over the years,
quite inversely proportional to the open cast
production share in the total production. Thus
the comparison of unit value over the years
would not reflect correct picture of inflation
until this deteriorating effect of quality is not
considered and that effect is removed.
5.7.5 It may be concluded that, in India, unit
value (Rs.) of coal in terms per kilo calorie
useful heat value has been increasing more
rapidly than being exhibited by simple unit
value comparison over the years.
6. Commodity Classification
6.1 For export import data, the 8-digit codes of
Indian Trade Classification (based on
Harmonised Coding System) have been adopted
by DGCI&S in classifying the various grades of
coal and coal products. For Coking coal the only
8-digit code is “27011910” and all other codes
of coal are taken as non-coking coal (Mainly
pertains to remaining part of 2701, some parts
of 2702 & 2703). Similarly all items in 2704
group have been taken under coke. The effect
of retort carbon is negligible and included under
coke.
~ Provisional Coal Statistics 2018-19 ~
Coal Controller's Organisation, 1,Council House Street, Kolkata, W.B., India
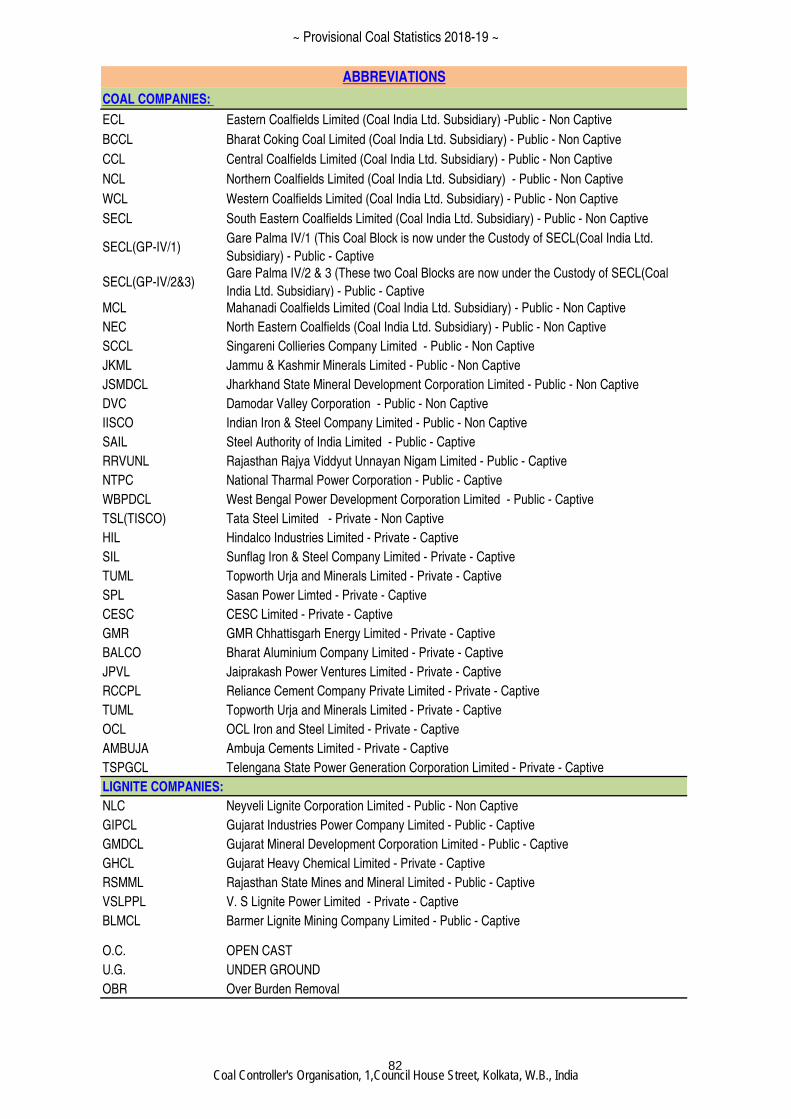
COAL COMPANIES:
ECL Eastern Coalfields Limited (Coal India Ltd. Subsidiary) -Public - Non Captive
BCCL Bharat Coking Coal Limited (Coal India Ltd. Subsidiary) - Public - Non Captive
CCL Central Coalfields Limited (Coal India Ltd. Subsidiary) - Public - Non Captive
NCL Northern Coalfields Limited (Coal India Ltd. Subsidiary) - Public - Non Captive
WCL Western Coalfields Limited (Coal India Ltd. Subsidiary) - Public - Non Captive
SECL South Eastern Coalfields Limited (Coal India Ltd. Subsidiary) - Public - Non Captive
SECL(GP-IV/1)Gare Palma IV/1 (This Coal Block is now under the Custody of SECL(Coal India Ltd.
Subsidiary) - Public - Captive
SECL(GP-IV/2&3)Gare Palma IV/2 & 3 (These two Coal Blocks are now under the Custody of SECL(Coal
India Ltd. Subsidiary) - Public - Captive
MCL Mahanadi Coalfields Limited (Coal India Ltd. Subsidiary) - Public - Non Captive
NEC North Eastern Coalfields (Coal India Ltd. Subsidiary) - Public - Non Captive
SCCL Singareni Collieries Company Limited - Public - Non Captive
JKML Jammu & Kashmir Minerals Limited - Public - Non Captive
JSMDCL Jharkhand State Mineral Development Corporation Limited - Public - Non Captive
DVC Damodar Valley Corporation - Public - Non Captive
IISCO Indian Iron & Steel Company Limited - Public - Non Captive
SAIL Steel Authority of India Limited - Public - Captive
RRVUNL Rajasthan Rajya Viddyut Unnayan Nigam Limited - Public - Captive
NTPC National Tharmal Power Corporation - Public - Captive
WBPDCL West Bengal Power Development Corporation Limited - Public - Captive
TSL(TISCO) Tata Steel Limited - Private - Non Captive
HIL Hindalco Industries Limited - Private - Captive
SIL Sunflag Iron & Steel Company Limited - Private - Captive
TUML Topworth Urja and Minerals Limited - Private - Captive
SPL Sasan Power Limted - Private - Captive
CESC CESC Limited - Private - Captive
GMR GMR Chhattisgarh Energy Limited - Private - Captive
BALCO Bharat Aluminium Company Limited - Private - Captive
JPVL Jaiprakash Power Ventures Limited - Private - Captive
RCCPL Reliance Cement Company Private Limited - Private - Captive
TUML Topworth Urja and Minerals Limited - Private - Captive
OCL OCL Iron and Steel Limited - Private - Captive
AMBUJA Ambuja Cements Limited - Private - Captive
TSPGCL Telengana State Power Generation Corporation Limited - Private - Captive
LIGNITE COMPANIES:
NLC Neyveli Lignite Corporation Limited - Public - Non Captive
GIPCL Gujarat Industries Power Company Limited - Public - Captive
GMDCL Gujarat Mineral Development Corporation Limited - Public - Captive
GHCL Gujarat Heavy Chemical Limited - Private - Captive
RSMML Rajasthan State Mines and Mineral Limited - Public - Captive
VSLPPL V. S Lignite Power Limited - Private - Captive
BLMCL Barmer Lignite Mining Company Limited - Public - Captive
O.C. OPEN CAST
U.G. UNDER GROUND
OBR Over Burden Removal
ABBREVIATIONS
82
~ Provisional Coal Statistics 2018-19 ~
Coal Controller's Organisation, 1,Council House Street, Kolkata, W.B., India
Related Documents