Provider-Perceived Barriers (from least to greatest) 5. Physical Access – Equipment Access – Building Access – Restroom Access 4. Appointments 3. Communication – Talking about Needs – Understanding Provider 2. Insurance Coverage 1. Transportation

Provider-Perceived Barriers (from least to greatest) 5. Physical Access –Equipment Access –Building Access –Restroom Access 4. Appointments 3. Communication.
Dec 14, 2015
Welcome message from author
This document is posted to help you gain knowledge. Please leave a comment to let me know what you think about it! Share it to your friends and learn new things together.
Transcript
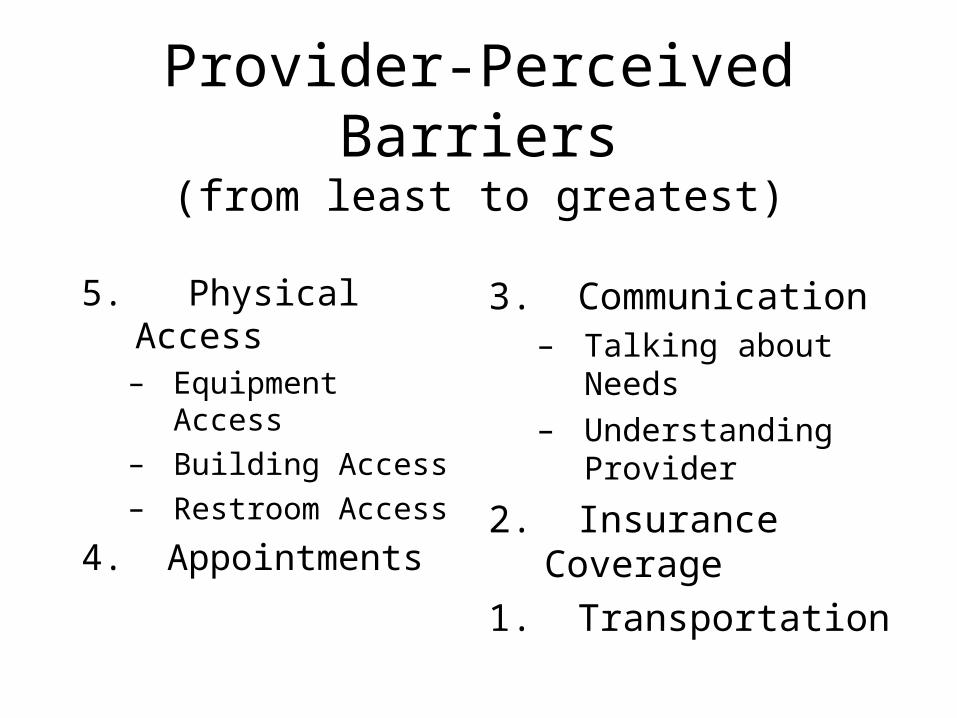
Provider-Perceived Barriers(from least to greatest)
5. Physical Access– Equipment Access
– Building Access
– Restroom Access
4. Appointments
3. Communication– Talking about Needs
– Understanding Provider
2. Insurance Coverage
1. Transportation
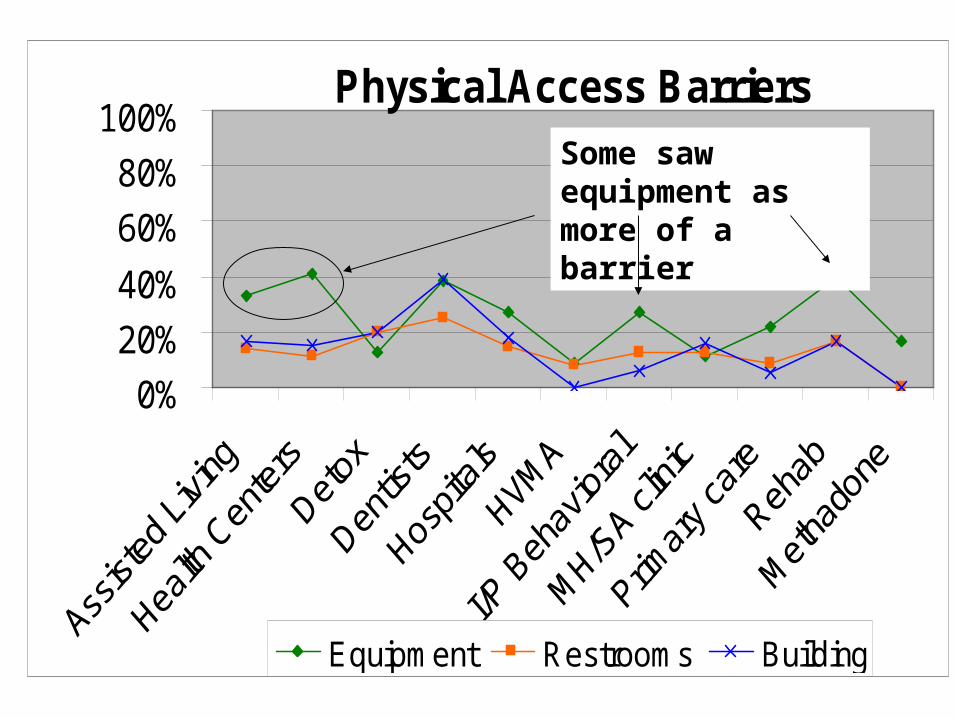
Physical Access Barriers
0%
20%
40%
60%
80%
100%
Equipment Restrooms Building
Some saw equipment as more of a barrier

Physical Access Barriers
• Building and Restrooms are very similar
• For the most part, equipment access is a greater barrier
• Exceptions:– Detox
– Hospital
– HVMA
– MH/SA
0%10%20%30%40%50%60%70%80%90%
100%
Assist
ed L
iving
Health
Cen
ters
Detox
Dentis
ts
Hospita
ls
HVMA
I/P B
ehav
iora
l
MH/S
A clini
c
Primar
y car
e
Rehab
Met
hado
ne
Equipment Restrooms Building

Communication Barriers
0%20%40%60%80%
100%
Communication Understanding
Treated the same by providers
Communication Barriers
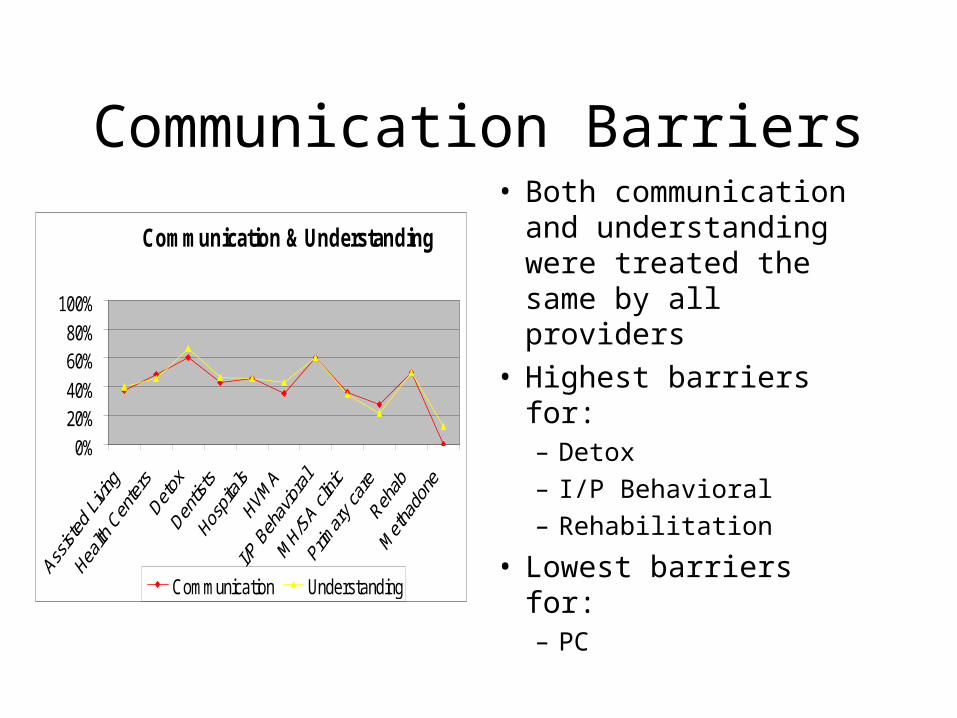
Communication & Understanding
0%
20%40%
60%80%
100%
Communication Understanding
• Both communication and understanding were treated the same by all providers
• Highest barriers for:– Detox
– I/P Behavioral
– Rehabilitation
• Lowest barriers for:– PC

Insurance Coverage
0%
20%
40%
60%
80%
100%
Good: all medical facilities
Bad: most non-medical services

Insurance Coverage
• Coverage is a low barrier for all basic traditional health services
• Lowest for Detox c/c to methadone
• I/P Behavioral easier to cover than MH/SA
0%10%20%30%40%50%60%70%80%90%
100%
Assist
ed L
ivg
Health
Cnt
rs
Detox
Dentis
ts
Hospit
als
HVMA
I/P B
ehav
iora
l
MH/S
A clin
ic
Primar
y ca
re
Rehab
Met
hado
ne
Coverage
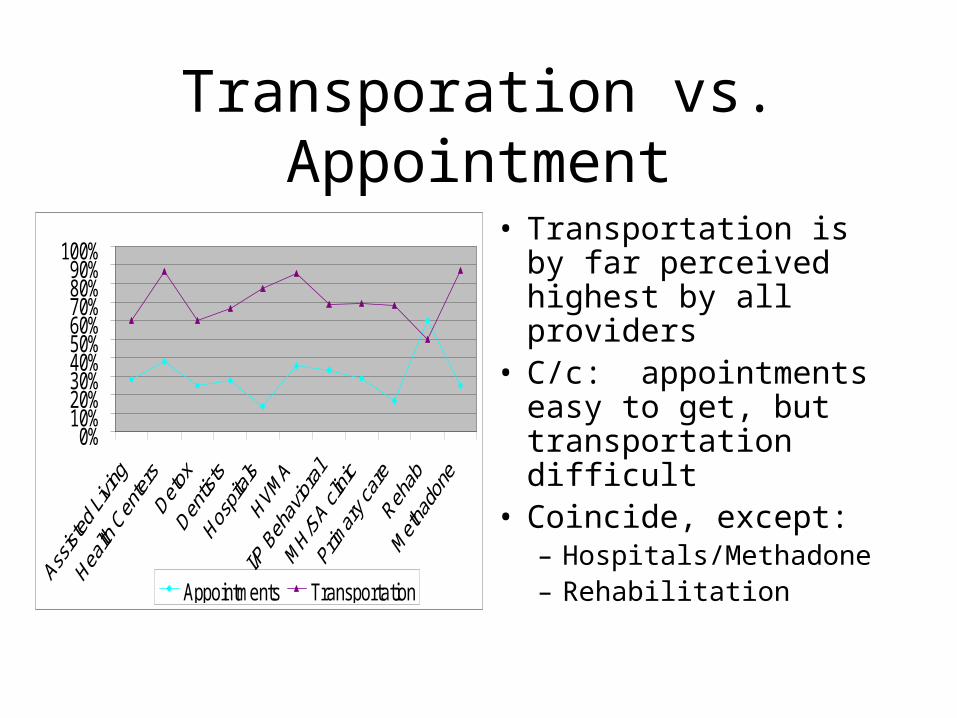
Transporation vs. Appointment
0%10%20%30%40%50%60%70%80%90%
100%
Appointments Transportation
• Transportation is by far perceived highest by all providers
• C/c: appointments easy to get, but transportation difficult
• Coincide, except:– Hospitals/Methadone– Rehabilitation

Major Barriers by Provider
0%
20%
40%
60%
80%
100%
Cover
age
Equip
men
t
Comm
unica
tion
Restro
oms
Appoin
tmen
ts
Under
stan
ding
Build
ing
Tran
spor
tatio
n
Dentists Hospitals
MH/SA clinic Primary care
Health Centers/HVMA

Major Barriers by Provider
• Follow Similar Pattern within each barrier
• PC is lowest overall• Dentist is highest,
followed by HC & HVMA
Major Barriers by Provider
0%10%20%30%40%50%60%70%80%90%
100%
Dentists Hospitals
MH/SA clinic Primary care
Health Centers/HVMA

Notable Differences:
1. Coverage• PC & Hospital are lower than others• Dentist, MH, & HC are higher
2. Understanding• PC is lower than all others
3. Building Access• Dentists are distinctly higher than others

Provider-Perceived Access Barriers
Hypothesis 3:
There are differences between providers and consumers in their
perceptions of access barriers

Overall Barriers: Consumer vs. Provider
0%
20%
40%
60%
80%
100%
TOTAL Providers TOTAL Consumers
•Providers higher than consumers
• Similar pattern!

Overall Barriers
Coverage Transportation
Talking About Needs
Appointments Understanding
Equipment Restrooms Building
Consumer Provider

Provider: Appointments vs. Transportation
0%20%40%60%80%
100%
Appointments Transportation
Big Gap!

Consumer: Appointments vs. Transportation
0%10%20%30%40%50%60%
Transportation Appointment
Much Closer!
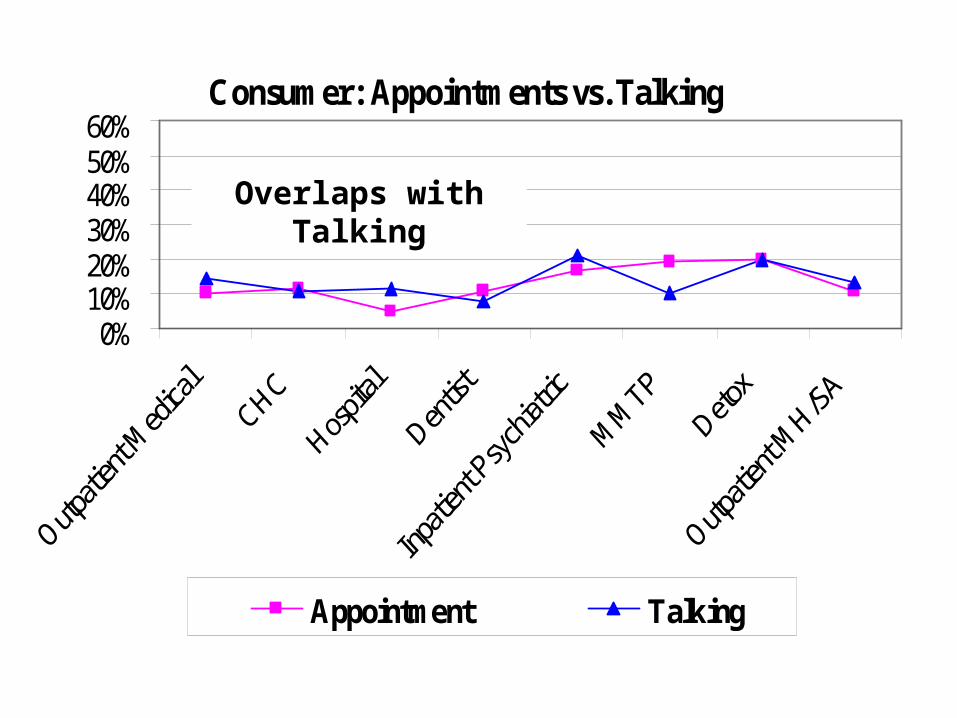
Consumer: Appointments vs. Talking
0%10%20%30%40%50%60%
Appointment Talking
Overlaps with Talking
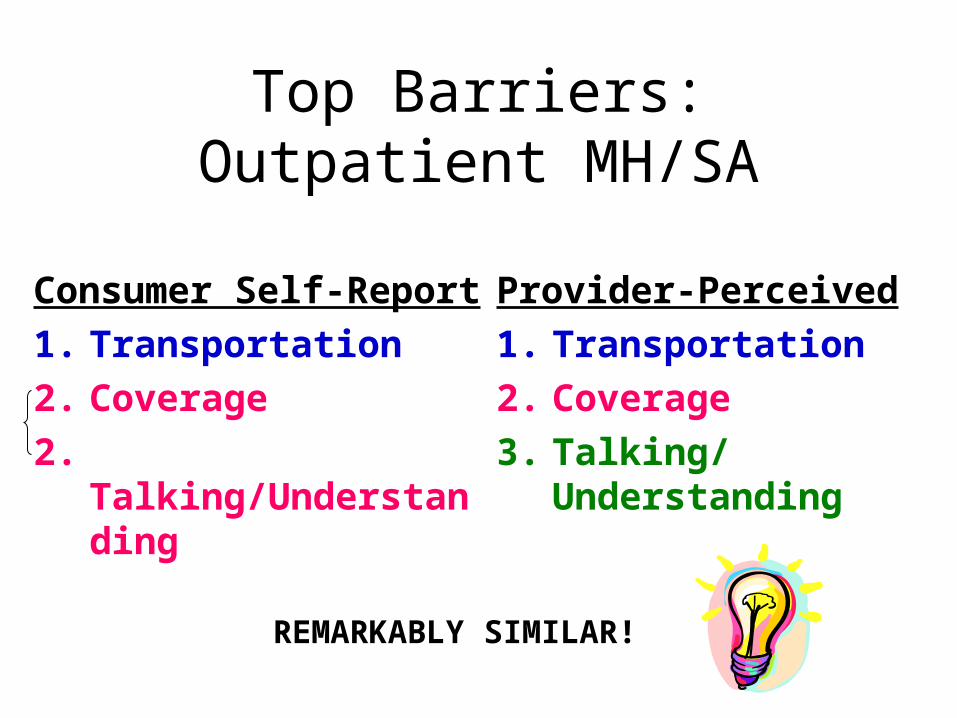
Top Barriers:Outpatient MH/SA
Consumer Self-Report
1. Transportation
2. Coverage
2. Talking/Understanding
Provider-Perceived
1. Transportation
2. Coverage
3. Talking/Understanding
REMARKABLY SIMILAR!

Top Barriers:Freestanding Detox
Consumer Self-Report
1. Coverage
2. Transportation
3. Appointments
3. Talking
Provider-Perceived
1. Talking/Understanding
2. Transportation
3. Appointments
•Logistics are bigger barriers for consumers than is Talking about their needs.

Top Barriers:Inpatient Psychiatric
Consumer Self-Report
1. Transportation
2. Talking
3. Appointments
3. Coverage
4. Understanding
Provider-Perceived
1. Transportation
2. Talking/Understanding
3. Appointments
3. Coverage
Very similar; consumers see Talking about needs as more of a barrier than Understanding provider.

Top Barriers:Dentists
Consumer Self-Report
1. Coverage!
2. Appointments
3. Transportation
3. Talking/Understanding
Provider-Perceived
1. Coverage
1. Transportation
2. Talking/Understanding
3. Equipment
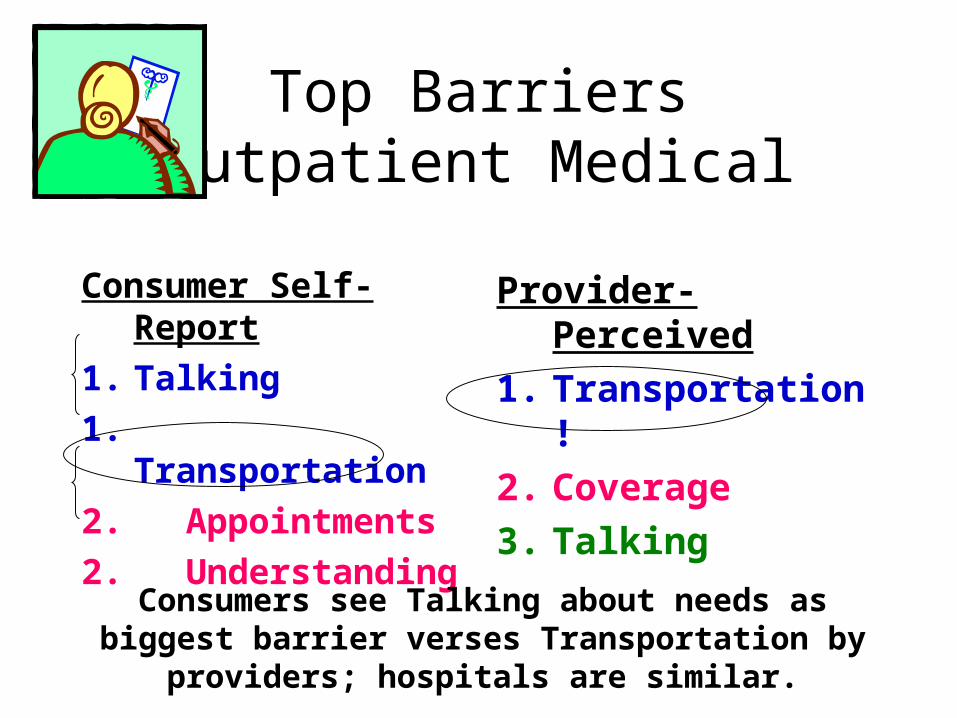
Top BarriersOutpatient Medical
Consumer Self-Report
1. Talking
1. Transportation
2. Appointments
2. Understanding
Provider-Perceived
1. Transportation!
2. Coverage
3. Talking
Consumers see Talking about needs as biggest barrier verses Transportation by providers; hospitals are similar.

Top BarriersHospitals
Consumer Self-Report
1. Talking/Understanding
2. Transportation
3. Equipment
4. Coverage
Provider-Perceived
1. Transportation!
2. Talking/Understanding
3. Coverage
4. Equipment

Top Barriers:CHC
Consumer
1. Transportation
2. Appointments
2. Talking/Understanding
2. Coverage
Provider
1. Transportation
2. Coverage
3. Talking/Understanding
4. Appointments
4. Equipment

Summary of Findings:Preliminary Results
• Barriers higher for providers vs. consumers• Similar pattern overall• Foremost barrier
– Provider = Transportation– Consumer not as clear
• Differences in perceptions– Importance of Appointments– Talking vs. Understanding
Related Documents