6488 Biochetnistty 1995, 34, 6488 6503 Proton NMR and Structural Features of a 24-Nucleotide RNA Hairpint.* Philip N. Borer,*,$ Yong Lin,s Sophia Wang,s Mark W. Roggenbuck,g Jonatha M. Crott,”.l Olke C. Uhlenbeck,” and Istvan Pelczers Chemistry Department. Syracuse University, Syracuse, New York 13244-41 00. and Department of Chemistry and Biochemistry. University of Colorado, Boulder, Colorado 80309 Received March 2. 1995@ ABS’rRACT: The three-dimensional conformation of a 24-nucleotide variant of the RNA binding sequence for the coat protein of bacteriophage R17 has been analyzed using NMK. molecular dynamics, and energy minimization. The imino proton spectrum is consistent with base pairing requirements for coat protein binding known from biochemical studies. All 185 of the nonexchangeable protons were assigned using a variety of homonuclear 2D and 3D NMR methods. Measurements of nuclear Overhauser enhancements and two-quantum correlations were made at 500 MHz. New procedures were developed to characterize as many resonances as possible, including deconvolution and path analysis methods. An average of 21 &stance constraints per residue were used in molecular dynamics calculations to obtain preliminary folded structures for residues 3-21. The unpaired A8 residue is stacked in the stem, and the entire region from G7 to CIS in the upper stem and loop appears to be flexible. Several of these residues have a large fraction of S-puckered ribose rings, rather than the N-forms characteristic of RNA duplexes. There is considerable variation in the low-energy loop conformations that satisfy the distance constraints at this preliminary level of refinement. The Shine-Dalgarno ribosome binding site is exposed, and only two apparently weak base pairs would have to break for the 16s ribosomal RNA to bind and the ribosome to initiate translation of the replicase gene. Although the loop form must be regarded as tentative, the known interaction sites with the coat protein are easily accessible from the major groove side of the loop. Hairpin loops are important RNA structural elements, providing sites for interactions with proteins and other nucleic acids and serving as nucleation sites for RNA folding (Noller, 1984; Witherell et al., 1991; Eguchi & Tomizawa, 1991; Jaeger et al., 1994). Despite this, relatively little detailed information has been available regarding such RNA struc- tures, with most of what is known being derived from X-ray crystal structures of tRNAs and small oligonucleotides. Recently, NMR’ spectroscopy has been applied to a variety of small RNA molecules, and solution conformations of + Thls work was supported by NIH Grants GM32691 (to P.N.B.) GM36944 (to O.C.U.) and GM12452 (postdoctoral fellowship to J.M.G.); I.P. acknowledges partial support from the EXXON Educa- tional Foundation. t Atomic coordinates for an averaged structure (file name IRHT) have been deposited with the Protein Data Bank, Brookhaven National Laboratories. Syracuse University. ‘I University of Colorado. .L Present address: Department of Molecular Biology and Microbi- ology, 10900 Euclid Ave.. School of Medicine, Case Westem Reserve University. Cleveland. OH 44106. @ Abstract published in Advcincr ACS Abstracts. May 1, 1995. I Abbreviations: Designations of individual protons begin with the letter signifying the base. followed by the chain position, a comma, and the atom number within the nucleoside, e.g., A4,2 = adenosine-4 H2 and (37.1’ = guanosine-7 Hl’. An NOE between two protons is indicated by a dash (-). e.g.. U6.1’47.8 indicates the NOE connecting U6,Hl’ and G7.H8. while A8.1’-8 is the intranucleotide NOE from A8,Hl’ to A8.H8. The abbreviation for purine nucleotides is R = A, G and for pyrimidines is Y = C. U. The ribose sugar pseudorotational states are classified into N and S families. with 3’-endo being one of the N puckers and 2’-endo falling in the S range. Spectroscopic and molecular dynamics and energy minimization abbreviations: NMR, nuclear magnetic resonance; 2D, two dimensional; 3D, three dimen- sional; NOE, nuclear Overhauser effect; COSY, correlation spectros- copy; TOCSY. total correlation spectroscopy: 24. double-quantum; DANTE. delays alternating with nutations for tailored excitation; MD, molecular dynamics; RMSD. root mean square deviation. 0006-2960/95/0434-6488$09.00/0 several KNA hairpins have been reported [reviewed by Moore (1993). Varani and Tinoco (1991). and Davis et al. (1993)l. The 3D structure of individual RNA hairpins is highly variable. Although stems are generally A form in character, local perturbations due to sequence or structural context are common. Loop conformations vary over a wide range. Some are highly structured. often containing nonca- nonical base pairs. with both stacking interactions and hydrogen bonds between the bases of the loop and the phosphodiester backbone contributing to overall stability. RNA hairpins offer binding sites for specific proteins because they are small and adopt distinct structures. Stem- loop formation is required for the binding of RNA by the iron-responsive element binding protein (Barton et al., 1990; Leibold et al., 1990), sarcin and ricin (Endo et al.. 1988). ribosomal proteins (Baughman & Nomura. 1984; Zengel & Lindahl. 1994: Freedman et al.. 1987: Climie & Friesen, 1987), and a number of phage coat proteins [reviewed in Witherell et al. (1991)]. One of the best characterized RNA-protein interactions involves the specific binding of a small hairpin loop by the coat protein of bacteriophage R17. Coat protein binding to this region of the phage genome, which includes the ribosome binding site for the replicase and its initiation codon. represses translation of the phage replicase gene and serves as the nucleation site for phage assembly (Bernardi & Spahr. 1972; Witherell et al., 1991). Recognition of RNA by the R17 coat protein includes both base-specific and phosphate backbone contacts as well as essential structural feature!, The minimal binding site is composed of a 16 nucleotide hairpin with a four-nucleotide loop and a stem interrupted by an unpaired (“bulged’) purine (Romaniuk et al., 1987; Lowary B Uhlenbeck, 1987; Wu & 0 1995 American Chemical Society

Welcome message from author
This document is posted to help you gain knowledge. Please leave a comment to let me know what you think about it! Share it to your friends and learn new things together.
Transcript
6488 Biochetnistty 1995, 34, 6488 6503
Proton NMR and Structural Features of a 24-Nucleotide RNA Hairpint.* Philip N. Borer,*,$ Yong Lin,s Sophia Wang,s Mark W. Roggenbuck,g Jonatha M. Crott,”.l Olke C . Uhlenbeck,” and
Istvan Pelczers
Chemistry Department. Syracuse University, Syracuse, New York 13244-41 00. and Department of Chemistry and Biochemistry. University of Colorado, Boulder, Colorado 80309
Received March 2. 1995@
ABS’rRACT: The three-dimensional conformation of a 24-nucleotide variant of the RNA binding sequence for the coat protein of bacteriophage R17 has been analyzed using NMK. molecular dynamics, and energy minimization. The imino proton spectrum is consistent with base pairing requirements for coat protein binding known from biochemical studies. All 185 of the nonexchangeable protons were assigned using a variety of homonuclear 2D and 3D NMR methods. Measurements of nuclear Overhauser enhancements and two-quantum correlations were made at 500 MHz. New procedures were developed to characterize as many resonances as possible, including deconvolution and path analysis methods. An average of 21 &stance constraints per residue were used in molecular dynamics calculations to obtain preliminary folded structures for residues 3-21. The unpaired A8 residue is stacked in the stem, and the entire region from G7 to CIS in the upper stem and loop appears to be flexible. Several of these residues have a large fraction of S-puckered ribose rings, rather than the N-forms characteristic of RNA duplexes. There is considerable variation in the low-energy loop conformations that satisfy the distance constraints at this preliminary level of refinement. The Shine-Dalgarno ribosome binding site is exposed, and only two apparently weak base pairs would have to break for the 16s ribosomal RNA to bind and the ribosome to initiate translation of the replicase gene. Although the loop form must be regarded as tentative, the known interaction sites with the coat protein are easily accessible from the major groove side of the loop.
Hairpin loops are important RNA structural elements, providing sites for interactions with proteins and other nucleic acids and serving as nucleation sites for RNA folding (Noller, 1984; Witherell et al., 1991; Eguchi & Tomizawa, 1991; Jaeger et al., 1994). Despite this, relatively little detailed information has been available regarding such RNA struc- tures, with most of what is known being derived from X-ray crystal structures of tRNAs and small oligonucleotides. Recently, NMR’ spectroscopy has been applied to a variety of small RNA molecules, and solution conformations of
+ Thls work was supported by NIH Grants GM32691 (to P.N.B.) GM36944 (to O.C.U.) and GM12452 (postdoctoral fellowship to J.M.G.); I.P. acknowledges partial support from the EXXON Educa- tional Foundation.
t Atomic coordinates for an averaged structure (file name IRHT) have been deposited with the Protein Data Bank, Brookhaven National Laboratories.
Syracuse University. ‘I University of Colorado. .L Present address: Department of Molecular Biology and Microbi-
ology, 10900 Euclid Ave.. School of Medicine, Case Westem Reserve University. Cleveland. OH 44106.
@ Abstract published in Advcincr ACS Abstracts. May 1, 1995. I Abbreviations: Designations of individual protons begin with the
letter signifying the base. followed by the chain position, a comma, and the atom number within the nucleoside, e.g., A4,2 = adenosine-4 H2 and (37.1’ = guanosine-7 Hl’. An NOE between two protons is indicated by a dash (-). e.g.. U6.1’47.8 indicates the NOE connecting U6,Hl’ and G7.H8. while A8.1’-8 is the intranucleotide NOE from A8,Hl’ to A8.H8. The abbreviation for purine nucleotides is R = A, G and for pyrimidines is Y = C. U. The ribose sugar pseudorotational states are classified into N and S families. with 3’-endo being one of the N puckers and 2’-endo falling in the S range. Spectroscopic and molecular dynamics and energy minimization abbreviations: NMR, nuclear magnetic resonance; 2D, two dimensional; 3D, three dimen- sional; NOE, nuclear Overhauser effect; COSY, correlation spectros- copy; TOCSY. total correlation spectroscopy: 24. double-quantum; DANTE. delays alternating with nutations for tailored excitation; MD, molecular dynamics; RMSD. root mean square deviation.
0006-2960/95/0434-6488$09.00/0
several KNA hairpins have been reported [reviewed by Moore (1993). Varani and Tinoco (1991). and Davis et al. (1993)l. The 3D structure of individual RNA hairpins is highly variable. Although stems are generally A form in character, local perturbations due to sequence or structural context are common. Loop conformations vary over a wide range. Some are highly structured. often containing nonca- nonical base pairs. with both stacking interactions and hydrogen bonds between the bases of the loop and the phosphodiester backbone contributing to overall stability.
RNA hairpins offer binding sites for specific proteins because they are small and adopt distinct structures. Stem- loop formation is required for the binding of RNA by the iron-responsive element binding protein (Barton et al., 1990; Leibold et al., 1990), sarcin and ricin (Endo et al.. 1988). ribosomal proteins (Baughman & Nomura. 1984; Zengel & Lindahl. 1994: Freedman et al.. 1987: Climie & Friesen, 1987), and a number of phage coat proteins [reviewed in Witherell et al. (1991)]. One of the best characterized RNA-protein interactions involves the specific binding of a small hairpin loop by the coat protein of bacteriophage R17. Coat protein binding to this region of the phage genome, which includes the ribosome binding site for the replicase and its initiation codon. represses translation of the phage replicase gene and serves as the nucleation site for phage assembly (Bernardi & Spahr. 1972; Witherell et al., 1991).
Recognition of RNA by the R17 coat protein includes both base-specific and phosphate backbone contacts as well as essential structural feature!, The minimal binding site is composed of a 16 nucleotide hairpin with a four-nucleotide loop and a stem interrupted by an unpaired (“bulged’) purine (Romaniuk et al., 1987; Lowary B Uhlenbeck, 1987; Wu &
0 1995 American Chemical Society

Structure of an RNA Hairpin
Uhlenbeck, 1987; Gott et al., 1993). The present investiga- tion was suggested by studies on a large number of RNA variants indicating that the specific interaction with the R17 coat protein is highly dependent upon the precise three- dimensional structure of its RNA binding site.
The present NMR studies have resulted in the assignment of 192 of the protons in the 24-mer hairpin, including all of the nonexchangeable protons. Several new methods have been developed and are reported in Materials and Methods. The NOE-derived distance constraints have been used in molecular dynamics and energy minimization calculations to produce structures consistent with the NMR data. It is likely that the loop region is in fast conformational exchange.
Biochemistry, Vol. 34, No. 19, 1995 6489
0.01% NaN3. D2O samples were prepared by lyophilizing two times from glass-distilled 99.8% D20 and then a third time from 99.96% D20. After the third evaporation, the vacuum was broken under Ar and the sample quickly transferred to a glove bag, where it was dissolved in 0.4 mL of 99.96% D20. One sample prepared in this way has been stable for several years, with only some exchange of H8 - D8 in the purines showing up in the NMR spectrum. To disrupt aggregates and ensure hairpin formation, the samples in NMR tubes were put through a heatingkooling protocol that is slightly different from that used in the native gel experiments. This protocol minimizes the chance that the NMR tube will break upon abrupt temperature changes, and ensures that the sample could be recovered if the tube did break. The outside of the NMR tube was carefully washed with detergent before beginning the process. A test tube with -15 mL of pure, RNase-free water was equilibrated in a bath at each of the temperatures indicated next. The NMR tube at room temperature was then equilibrated in the test tube at 60 "C, then at 90 OC for -5 min, and for about 30 s each in 60 OC water, room temperature water, and ice water.
NMR Experiments. All experiments were carried out at 500.1 MHz on a GN-500 spectrometer, equipped with a Nicolet- 1280 computer.
Exchangeable Proton Spectra. 1D experiments were done in H20 using a JRE Cjump-and-retum-echo) pulse combina- tion (Sklenfir & Bax 1987) to minimize excitation of the water signal. The carrier was positioned at the water resonance, and the excitation maximum was carefully adjusted to cover the region of exchangeable protons. Typical acquisition parameters were 8K* data points over a 12 kHz spectral range, 256 scans, and a 3 s relaxation delay. Data processing included exponential broadening by 3-5 Hz.
Acquisition in D20 Samples. The residual water signal was suppressed by DANTE presaturation (Morris & Free- man, 1978) using the main transmitter to minimize noise along the residual water ridge (Zuidenveg, 1986). The carrier was placed between the B and 1' regions, and the first side band of the DANTE sequence was utilized for suppression. The accurate position of the sideband was fine tuned by a trial and error procedure. A 0.5-4 s recovery delay was inserted after the presaturation pulse train. During this time protons close to the water signal partially recover, whle the HDO remains largely saturated. The residual HDO signal was usually removed from the spectrum through time domain filtering (Marion et al., 1989a) after relocation of the virtual carrier position (Marion et al., 1989b).
One-dimensional spectra were acquired with 8K* points, zero-filled to 16K*. Unapodized line widths were typically 5 3 Hz for AH2, and 5 8 Hz for H8, H6, H5, and Hl'. H5- H6 splittings were always clearly resolved, and many H1'- H2' coupling constants could be directly measured.
2D NOE spectra were acquired with an additional composite 180" pulse inserted in the middle of the mixing time period to clean the spectrum further (Zuiderweg, 1986). The read pulse was replaced by a spin- echo sandwich (Davis 1989) that reduces baseline distortion along the acquisition dimension ( tz) . Acquisition was started immediately after the 180" refocusing pulse of this sandwich, and the first two complex points were discarded during data processing. Optimal echo delay was fine tuned by a trial and error procedure prior to starting the data acquisition. The 2D NOE spectra were acquired in hypercomplex structure
2 0 NOE.
MATERIALS AND METHODS
RNA Synthesis and Purification. RNA was synthesized using T7 RNA polymerase and synthetic oligonucleotide templates according to the method of Milligan et al. (1987). The transcription reaction contained 40 mM Tris-HC1 (pH 8. l), 25 mM MgC12, 5 mM dithiothreitol, 1 mM spermidine, 4 mM each ATP, CTP, GTP, and UTP, 0.01% Triton X-100, 84 nM template, and 50 pglmL T7 RNA polymerase incubated at 37 "C for 5.5 h in a total volume of 100 mL. After addition of EDTA to 24 mM and dilution 2.5-fold with water, the transcription mixture was loaded onto a 30 mL DEAE-Fractogel column (Toyopearl 650S, Supelco) equili- brated with 175 mM triethylammonium bicarbonate (TEAB). The column was washed with 1.50 mL of 0.18 M TEAB and the RNA eluted batchwise with 1 M TEAB. The TEAB was removed using a rotary evaporator, and the residual salts were removed with three HPLC-grade methanol washes. The RNA was then dissolved in water, diluted 1:l with 50% fomamide, and purified to single nucleotide resolution via electrophoresis through denaturing 20% polyacrylamide gels. RNAs were visualized by UV shadowing and eluted in 50 mM potassium acetate (pH 6), 250 mM KC1, and 2 mM EDTA. Eluted RNA was diluted 2-fold and loaded onto a 10 mL DEAE-Fractogel column equilibrated with 20 mM sodium phosphate (pH 6.8). The column was washed with five column volumes of 20 mM sodium phosphate (pH 6.8) and 0.1 mM EDTA and then four column volumes of 20 mM sodium phosphate (pH 6.8). The RNA was then eluted with 20 mM sodium phosphate (pH 6.8) and 0.6 M NaCl and desalted and concentrated using a Centricon-3 membrane (Amicon).
Native Gel Electrophoresis. Dimerization kinetics were carried out in 5 mM sodium phosphate (pH 7), 25 mM NaCl, 50 pM EDTA, and 1.7 mM RNA. Reactions contained small amounts of uniformly 32P-labeled RNA for purposes of quantification. RNA samples were heated to 100 "C for 3 min and quickly cooled on ice before incubation. This treatment resulted in the presence of a single RNA species on a native gel which comigrated with the monomer band in lanes that contained only uniformly labeled RNA. RNA was incubated at 25 OC (or 15 "C), and aliquots were removed at the indicated times and run at 4 "C on 10% acrylamide native gels containing 200 mM sodium phosphate (pH 7), 50 mM NaC1, and 0.1 mM EDTA. Gels were dried and the bands quantified using a Molecular Dynamics phosphorimager.
NMR Sample Preparation. Samples were dissolved to 1.7 mM in 0.4 mL of H20 containing 25 mM NaC1,5 mM P043- buffer adjusted to pH 7.0 with NaOH, 50 pM EDTA, and

6490 Biochemistry, Vol. 34, No. 19, 1995
(Bax 1985), with the first point at half dwell time along the remote (t l) dimension. The latter ensures a high quality baseline and requires no correction of the first point (Bax et al., 1991). Acquisition parameters were 4K* x 400* data points in t2 and t l , respectively, 16 scans following two dummy scans. Processing included squared cosine apodiza- tion in both dimensions, zero-filling along the remote dimension to create a symmetric matrix (4K x 4K output size). This conservative apodization scheme does not give any resolution enhancement, as is commonly provided by Gaussian or sine bells shifted by <x/2. Overall recycling time was -15 s: 5 s relaxation delay, 5.3 s DANTE presat, 3.35 s recovery delay, and 1.36 s acquisition. Spectra at different mixing times were acquired in one continuous session of -9 days, in the order 50, 100, 300, 150 ms.
2Q COSY. Homonuclear 2D two-quantum (24) COSY spectra were acquired with excitation delays of 30, 50, 60, 100, and 200 ms at 25 "C (Mareci & Freeman, 1983; Braunschweiler et al., 1983). The pulse sequence consisted of DANTE presaturation followed by a short recovery delay (typically 0.5 s). MQ coherences after the tl evolution time were converted to detectable single-quantum coherences by a 90" read pulse, in order to retain both direct and remote correlation peaks. Sign discrimination along the tl (2Q) dimension was accomplished by incrementing the phase of the excitation sandwich by 45" and collecting data in a hypercomplex fashion. The spectral windows along t l and t2 were equal to save experiment time for a given spectral resolution. As a consequence, one-quarter of the full MQ dimension at each side was out of the window and aliased on the opposite edge. Such aliasing leads to negligible overlap of correlation regions for an RNA spectrum. Virtual shift of the carrier position along the MQ dimension was made in the time domain along t l (Marion et al., 1989b) in order to avoid separating regions of interest at opposite edges of the spectrum. Usual acquisition size was 2K* x 256*. Typical processing involved apodization with a slightly shifted cos4 along t 2 and cos2 along tl with at least one zero- fill in t l . Spectra were presented in DA mode (Le., phased pure dispersive along F2 and pure absorptive along F1, respectively) in order to take advantage of simplified peak structure and enhanced sensitivity (Pelczer et al., 1991a).
3 0 NOEDQ. A homonuclear three-dimensional experi- ment has been introduced (Pelczer et al., 1991b), which combines NOE coherence transfer with 'H-lH 2Q-COSY. This experiment is efficient in dispersing the resonances from otherwise crowded spectral regions, such as that for the RNA S protons. Extensive aliasing along the 2 4 dimension was used in order to reduce overall experiment time at a given resolution and signal-to-noise ratio. Multidimensional data processing and data analysis has been done with the NMRZ software (see below) using the z-ant format and processing strategy (Pelczer et al., 1992). More detailed description of the experimental circumstances and the assignment procedure will be given elsewhere (I. M. A. Nooren, K. Wang, P. Borer, and I. Pelczer, unpublished results).
NMR Data Processing. The data processing used the following software packages: NMFU and NMR2E software from New Methods Research, Inc. (E. Syracuse, NY) and Triad from Tripos Associates (St. Louis, MO) on SUN and Silicon Graphics workstations.
Diagonal Suppression. Suppression of in-phase diagonal resonances in the 2D NOE spectrum has been done using time domain filtering methodology. As a result, dynamic
Borer et al.
range is reduced to that of the cross peaks only. and artifacts such as t l ridges are reduced (Friedrichs et al., 1991; M.W.K.. and I.P., unpublished results). This procedure requires time domain rearrangement of the diagonal location in the mixed domain (Fdtl) data first (routine written by M.W.R.), followed by the filtering procedure (Marion et al.. 1989a). In order to avoid problems with filtering the first section of the time domain signal (Marion et al.. 1989a; Ni. 1992). an enhanced linear prediction method was used (1.P.. M.W.R., and B. G. Carter, unpublished results). A time domain filter with a Gaussian profile over f 6 4 points was used. After inverse rearrangement of the data, regular processing fol- lowed.
Deconvolution of Subspectra. Figure 3 displays the 1 ' 3 region with 35 H1' and H5 signals along the Fl axis and 115 S resonances along F1. Locating the cross peaks and making assignments would be difficult from this plot. Interpretation of the information in this and the B-1' and B-S regions is simplified by using diagonal low-point symmetrization (retaining original sign) and an iterative constrained deconvolution method that sharpens the reso- nances and suppresses noise (the nonsystematic variance in the data). The results with 6 Hz line width reduction are given in Figures 4, 5, and S2. It should be re-emphasiLed that the data shown in Figure 3 was not apodiLed by resolution-enhancement functions in common use. However, the inherent resolution of the spectrum is excellent. with clearly split H5H6 AX multiplets, and many resolved H1' doublets [e.g., see Borer and Levy (1994); SM on the GN- 500 is about 20-30% of that on 1995-model 600 or 750 MHz spectrometers]. Previous reports describe h s "decod' algorithm (Ni & Scheraga, 1989) and its application to the 24-mer spectra (Borer & Levy, 1994; Jeong et al., 1992, 1993; Levy et al., 1991; Pelczer & Szalma, 1991). A detailed description of the data processing protocol has been published (Borer & Levy, 1994). In addition to visually impressive comparisons, tests on 2D spectra synthesized with bi- Lorentzian peaks and pseudorandom noise indicate that the frequencies and intensities are accurately represented upon decozd deconvolution (Jeong et al., 1992, 1993). The symmetrized and deconvolved spectra also accurately re- produce expected multiplicities, coupling constants, NOE walks, and NOE buildup curves in measured spectra, as well as revealing small, easily rationalized features that would be difficult to discern in conventionally processed data (G.- w. Jeong, G. C. Levy, and P.N.B., unpublished results).
After the assignments have been made, it is easy to rationalize the paths followed by the NOE walks in Figures 4, 5, and S2 , but the decisions that led to these assignments were much easier to make with the enhanced spectrum. Contrary to conventional wisdom, carefully done sym- metrization almost never introduced spurious peaks in the spectra shown in this paper. It is more common, but still rare, for weak peaks diagonally related to a noise stripe to disappear on deconvolution. The volumes of virtually all of the peaks were within 5% before and after the extra data processing steps (Jeong, 1992; Jeong et al., 1993; Borer & Levy, 1994). Concerns that the data processing operations might introduce spurious peaks or eliminate real peaks were circumvented by carefully examining overlays of the sharp- ened and conventionally processed subspectra (Borer & Levy, 1994). Information for doubtful peaks was subse- quently eliminated by editing the peak list.

Structure of an RNA Hairpin
Assignment: Imino Protons. The five sharp resonances were easily assigned to the five contiguous lower-stem base pairs, as indicated in Results. The biochemical work indicates that base pairs must be present at G10 and G16 (Witherell et al., 1991), so it is likely that G10,l and G16,l are among the broad signals. Other candidates for the broad signals are Gl , l , G2,1, U12,3, U22,3, and U24,3. The stick display at the top of Figure 2 shows the ring-current predicted positions of several signals based upon data in Kearns and Shulman (1974). The calculated frequencies are reasonable, but in error by as much as 0.5 ppm (for U6,3). Two predictions are shown for G7,l; the more shielded position should result if the adjacent A8 stacks the same as an A in an A:U pair. As the measured signal occurs -1 ppm less shielded, it is likely that stacking of G7 with the A8 bulge is different than in an A:U pair. G10,l also has two predictions, depending on the stacking with A1 1 (A14 would not contribute much shielding in a conformation similar to a U11:A14 pair). A reasonable, though speculative, assign- ment identifies G16,l with the broad 12.7 ppm peak and G10,l with the peak at 11.4 ppm. If this is correct, G10 must stack rather well with A1 1, as it apparently does (see Folded Structure).
Assignment: B-I’ Protons. Although the frequencies of A4,2 and A1 8,2 were known with reasonable confidence from NOEs to the imino protons, the peculiarities of the sequence made it difficult to anchor the B-1’ NOE walk to particular 1’ protons as in common practice (e.g., Chou et al., 1989). This can be understood with reference to Figure 1 where the following NOE chains involving AH2 could be expected: C5,1’-A4,2-C21,1’, G19,1’-A18,2-G7, l’, and pos- sibly C9,1’-A8,2-C17,1’. The AH2 connects to two CH1’ in the first and third cases and to two GH1’ in the second. Therefore, the direction of the chain of NOE connectivities cannot be established by inspection of the AH2 connectivities to Hl’. The issue is clouded by two other facts: (i) each of the authentic B-1’ walk segments involving these H1’ quickly moves into the crowded region of the U6, C15, G16, C17, U20, C21, U22 cross peaks above and right of center in Figure 5 , and (ii) the presence of A4,2-U20,1’ and i to i AH2- 1’ NOEs that were not anticipated. To this one adds the problem of nonstandard A-family structure [it turns out that the G2,l’-8, G3,l’-8, G3,1’-A4,8, and U12,1’-C13,6 cross peaks are missing (dashed lines in Figure 5 ) ] . These unusual structural features were only suspected because of the seeming abundance of ends to the B-1’ NOE walk segments. Therefore, we examined graph theoretical solutions to chaining the B-1’ walk segments.
Path Analysis. An introduction to what we have termed path analysis has been published (Roggenbuck et al., 1990). In order to apply the method, it was necessary to locate each of the 65 resonance positions. This was done from a deconvolved 1D spectrum in order to obtain accurate integrals; the spectrum was acquired with a 20 s relaxation delay as TI relaxation times can be very long for RNA (data not shown; Wang et al., 1992). The B signals were numbered 1-30 and the 1’/5 from 31-65. The observed cross peaks were then used to build an approximate adjacency matrix, A, where a one designates a possible link between two proton resonance frequencies (Roggenbuck et al., 1990). For instance, the stippled box at the lower left of Figure 5 contains a cross peak occumng at the frequencies corresponding to base proton frequency 2 and H1‘ frequency 3 1. It is important to retain adjacencies where there might
Biochemistry, Vol. 34, No. 19, 1995 6491
be ambiguity, for instance, for nearly overlapping signals. The details of the procedure are not given here (Roggen-
buck, 1990; M.W.R. and P.N.B., unpublished results), but, in simple terms, a backtracking program was written to determine all possible unique B-1’ paths starting from each of the frequencies, after which they were ordered according to length. Any cross peak could be used only once in a path. The program also discarded chains involving AH2 or YH5, alternated between B and 1’ vertices, and discarded paths not consistent with the R and Y sequence. The RH8 are singlets, YH6 and H5 are doublets, and the six AH2 were guessed at by their very long TI relaxation times and the noise ridges they produce along the F1 dimension (TI > 10 s for the AH2 in deoxygenated, Ar saturated solution).
It was found that chains beginning with G1 or G2 and consistent with the sequence could not propagate all the way to U12 (the end of the loop as shown in Figure 1). However, paths starting at G3 or A4 could, and there were thousands of possible chains ending at U12. It was logical that there might be a break between U12 and C13, so we included a new dummy resonance in A as number 66 and gave it adjacencies to all other resonances. This allowed the growing chains to pass through a structure-induced break in the sequential connectivities and use the sequence constraints from the 3’-half of the molecule to restrict the number of possible paths. When D was included, the longest chains starting with A4 go all the way to A23 (but not chains starting at G3). There were 735 unique paths starting at A4 but only four at the full length. These were the four permutations involving two sets of heavily overlapped H1’ (38/39 and 53/ 54, given identical rows in A).
Before this longest path was accepted as providing the correct assignment, it was tested for consistency with other features in the spectrum and sequence that were not used in generating the B-1’ paths. These include the cross peaks to the AH2, the H8/6-H5 cross peak in N-Y dinucleotide sequences, and the abundance of close contacts in the loop. The light lines in Figure 1 provide a summary of these NOEs for which cross peaks can be found in Figure 5. These assignments are also confirmed by 1’-2’ and B-2’ NOE walks (Figures 4 and S2), as well as 2Q-COSY 1’-2’ correlations and a novel 3D homonuclear spectrum with two-quantum and NOE correlations (see below).
Assignment: 2‘-Protons. Transferring assignments from the B and 1’ protons to the S protons in RNA is often difficult due to the crowded nature of the S proton region. It is further complicated by the fact that the Hl’-H2’ coupling constants are often -1 Hz, and therefore many of the 1’-2’ cross peaks in COSY and TOCSY spectra cannot be observed. As a result, we explored the use of 2Q-COSY spectra as an alternative. Coherence transfer through small coupling constants is efficient (Dalvit et al., 1987) and is limited to one and two steps, so the magnetization is not spread out by isotropic mixing. Further, a 90” phase shift in the F2
direction produces a more intense central peak for medium and small coupling constants than would be obtained for partially overlapping antiphase peaks with pure absorption line shape (Pelczer et al., 1991a). Eighteen of the 24 correlations between 1’ and 2‘ were immediately recognized; the six missing correlations, G3, C5, G16, C17, U20, and U6 or G19, must have tiny Hl’-H2’ coupling constants or overlap other signals (K. Y. Wang, P.N.B., and I.P., unpublished results). Using this information, confirmed and extended by the 1’-2’ and B-2’ NOE walks shown in Figures

6492 Biochemistry, Vol. 34. No. 19, 1995
4 and S2, the 2' assignments were made. The 2Q-COSY spectrum also provided many of the 3' and 4' assignments.
Assignment: S Protons. The remaining S assignments were made using a 3D homonuclear NOE/2Q spectrum. This is an attractive alternative to 3D TOCSYNOE spectra (Mooren et al.. 1991; Piotto & Gorenstein. 1991: Radhakrish- nan et al.. 1992) because only one and two-step 2 4 transfers occur. and small coupling constants are less of a barrier to efficient coherence transfer. Only a brief outline will be given here and the details presented elsewhere (I. M. Nooren. K. Y. Wang. P.N.B.. & I.P., unpublished results). The central idea is that the 2D NOE spectrum is sorted into a set of planes by the 2 4 frequencies of J-coupled protons. For example. at the 2 4 frequency. FII , that is the sum of the normal 1Q frequencies d(C13.6) + d(C13.5). there will appear NOE correlations between C13.6 and/or C13,5 to other nearby protons. Thus. the sugar protons with NOEs to pyrimidine bases are easily identified. The large and nonvariable J-coupling from H5' to H5" provides an especially useful anchor for assigning the S protons; at the plane with FII = d(C13,5') + d(C13.5"). one will see strong NOEs to C13,4'. C13.3'. and perhaps to other neighboring protons. The 2'-3' 2Q correlations are also very useful since 3J2.3, = 4-7 Hz regardless of the sugar pucker. 3J1,2. is small for N-puckered sugars and large for S . while jJ3.4, exhibits the complementary behavior. Upon correlating the redundant information from the various regions. all of the S protons were assigned. Some tentative stereospecific 5'/5'' assign- ments have also been made based upon the relative distances to H3' and to H8/6/5. All of the I85 nonexchangeable proton assignments are given in Table 1. although most of the H5' and H.5" are not stereospecifically assigned.
Cotnparison with Heteronuclear Applications. Hetero- nuclear multidimensional correlation methods are very ef- ficient in many cases. Recent developments in isotope labeling of nucleic acids provide powerful and cost-effective alternatives to the procedures described here (Nikonowicz et al.. 1992; Batey et al.. 1992: Michnicka e t al.. 1993). Unambiguous assignments can be made using 3D and 4D methods adapted from protein structural studies (Nikonowicz & Pardi 1992: Nikonowicz et al.. 1992: Pardi & Nikonowicz. 1992; Hines et al.. 1993). J-coupling connectivity can be established between the base and the sugar in the same residue using simultaneous 13C and 15N labeling (Farmer et al., 1993; Hines et al.. 1993: Sklenk et al., 1993a,b). 'H- 13C-31P connectivities along the backbone of RNA are another promising method for sequence specific assignment (Heus et al.. 1994). Isotope labeling is not always easy, however, and can be costly, and the sensitivity of most methods establishing connectivity through long-range cou- plings is low.
Homonuclear 2D and 3D methods remain a viable and independent alternative. offering high sensitivity and relative simplicity in terms of technical requirements. Combining these methods with deconvolution and graph theoretical approaches will allow the solution of many problems in the size range of the 24-mer RNA reported here. Other 3D methods have also been shown to be efficient in applications to nucleic acids (Mooren et al.. 199 1 : Piotto & Gorenstein. 1991).
Recently jlP has also been used to establish interresidual connectivity through J-couplings in multidimensional ap- plications (Kellogg & Schweitzer 1993: Wang et al.. 1994). in analogy with extremely useful techniques in proteins (Bax
Borer et al.
B Grzesiek 1993: LeMaster 1994). Unfortunately phospho- rus has disadvantages, including (i) relatively small and variable couplings to protons of interest, (ii) unpleasant relaxation properties. with greatly increased broadening at higher field strength. and (iii) low chemical shift dispersion for most 31P resonances of nucleic acids. In spite of these difficulties. multiple coherence transfer 21) correlations (Kellogg et al.. 1992; Kellogg & Schweitzer 1993) and 3D techniques (Kellogg B Schweitzer 1993: Wang et al.. 1994) have been successfully applied both to DNA and RNA.
Modelitig. The structures were built using the molecular modeling program. Sybyl (l'ripos Assoc.). using the Tripos force field, in the following manner.
Stem Building. An A-form RNA stem was built, starting with the sequence
5 ' G G G A C U G A C G 3
B ' C C C U G A C U G C 5
which was altered to
7 0 9 1 0
G G G A C U G A C G
U A U C U G A C - G C 17 16 15
Residues 7. 8, 9. 16. and 17 were subjected to 400 steps of energy minimization, followed by 300 steps for the whole stem. Pseudoatoms were created for the 5'-5" proton Fairs, increasing the longest upper distance bound by 0.5 A for each constraint involving such a pair.
Loop Building. The stem conformation was fixed through- out loop building, except residues 10 and 15 were allowed to move. Loop residues were added in the order AI 1. U12, C13. A14. under the influence of all of the distance constraints, adding pseudoatoms and altering constraints to 5'/5" as needed. In order to extensively sample conforma- tional space. each new loop residue carried a distribution of backbone torsion angles selected randomly within f30" of A-family values (a = 62". B = 180". y = 47", E = 152", I; = 74", x = 166"). with a -'E sugar pucker. Each addition was followed by 100 steps of minimization. Finally. a covalent bond was formed from A14 to C15. The process was repeated 54 times. and 13 structures with proper covalent structures. chirality, and energies less than twice the lowest energy were selected for molecular dynamics. The loops had most of the bases located in the major groove. with these statistics for occurrence in the minor groove: AI 1, 46%; U12. 38%: C13. 15%: A14. 23%. Five of the structures had all bases in the minor groove.
Molecular Dynamics and Energy Mitiitnization Protocols. Each candidate hairpin molecule was subjected to two stages of MD. with a 0.5 fs step size and a "Boltzmann" distribution of initial velocities at the first temperature. Full NOE forces and van der Waals radii were used throughout. First stage: only residues 8- 16 were free to move. over a period of 6.06 ps. Three 20 fs steps increased the temperature in jumps of 200 K from 300 to 900 K. which was maintained for 4 ps and then dropped to 700 K for 0.5 ps, 500 K for 0.5 ps. and 300 K for 1 ps. Second stage: all residues were free. over a period of 7.04 ps. Two 20 fs steps increased the temperature in jumps of 100 K from 400 to 600 K. which was maintained for 4 ps and then dropped to 500 K for 1 ps. 400 K for 1 ps. and 300 K for 1 ps. The NOE distance constraints used harniunic potentials with B force constant

Structure of an RNA Hairpin Biochemistry, Vol. 34, No. 19, 1995 6493
5
12U 1 1. c 1 3 N/S
b6 5 u24 "fs
I '
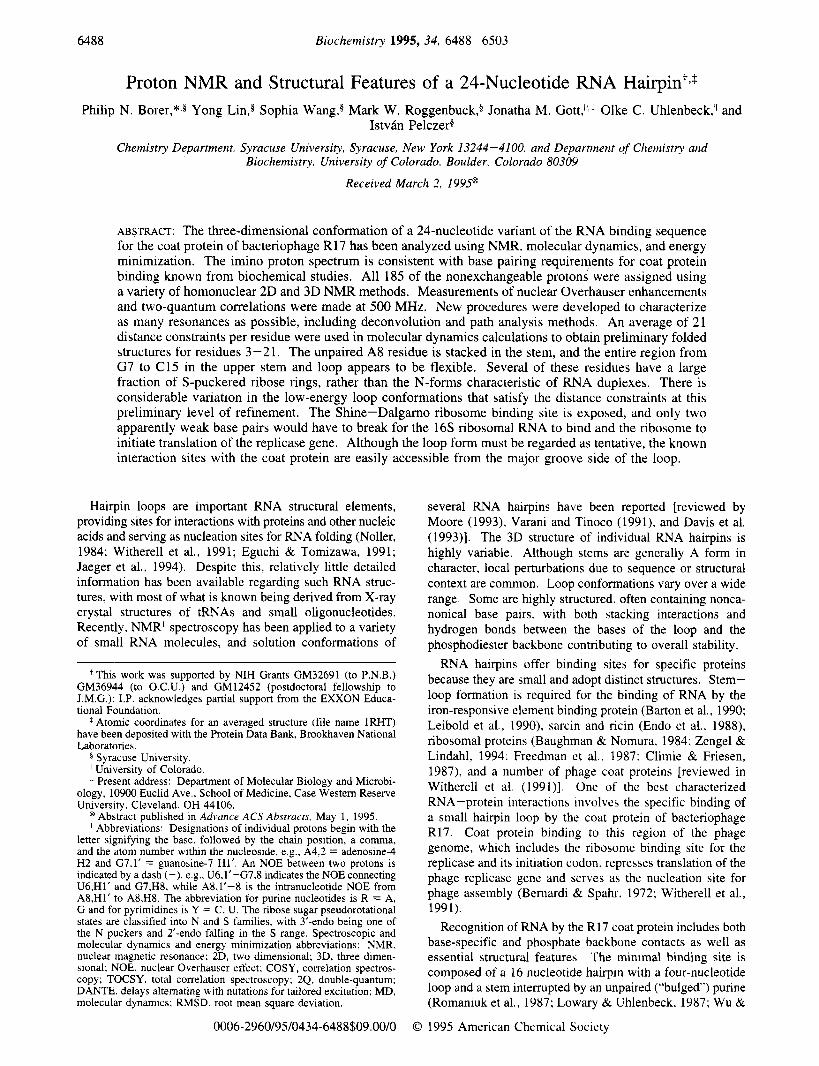
FIGURE 1: Sequence of the 24-mer, along with NOE connections found in the base-1' region of the spectrum that are not part of the standard B-I' walk. The approximate state of the ribose sugar pucker equilibrium is given by the N/S designations; small letters indicate a minor component.
of 20 kcal/mol*A2 (10 for the hydrogen-bond distance constraints). Again, chirality was checked, and seven structures with no distance violations greater than 2 A and very similar constraint violation energies were chosen for further examination. Finally, 40 steps of conjugate gradient energy minimization were performed with the force constant for the constraints reduced to 1% of their initial values.
RESULTS AND DISCUSSION
The subject for the present structure determination is a variant of the wild-type sequence which binds the R17 coat protein with high affinity (Figure 1) . The base-pairing arrangement is consistent with studies on variants of the binding sequence [reviewed in Witherell et al. (1991)l. In Figure 1, the AUG start codon is replaced by A 18-G 19-U20, and the Shine-Dalgarno ribosome binding sequence, AGGA, is replaced by A8-C9-GlO-A11. This particular sequence was chosen because it binds the coat protein with a higher affinity than the wild-type (Witherell et al., 1991) and is efficiently transcribed by T7 RNA polymerase.
Base Pairing. Figure 2 displays the imino proton region of the spectrum measured at 15 "C in H20, with the secure
- G3 /
07
f
14.0 13.0 PPM 12.0 11.0 10.0
FIGURE 2: NH region of the spectrum. Secure assignments are given above the sharp peaks. Ring-current calculated chemical shifts are given above the horizontal bar (see Materials and Methods).
assignments marked just above the sharp peaks. The sharp signals originate from the five uninterrupted base pairs in the lower stem (G3:C21 through G7:C17), each having nearly the same integral. 2D NOE spectra in H20 indicate that the peaks marked U20,3 and U6,3 have sharp, intense NOEs to protons at 7.82 (A4,2) and 7.03 ppm (A18,2) (data not shown; assignment details given in Materials and Methods). Additional NOEs that confirm the present assignment are those marked by the arcs on Figure 2 as well as G3,1-A4,2, G19,1-A4,2, G7,1-A18,2, and G7,1-A8,2. Thus the second- ary structure is consistent with that shown in Figure 1. No G7,1-A8,2 NOE is observed, but this distance is rather long, 4.7 A, in a standard A-family duplex (Arnott, 1973). NOEs to the broader signals were not observed because of fast exchange with water. The broad signals integrate to a total of approximately four protons.
Nonexchangeable Protons. The 25 "C 2D NOE spectrum of the 24-mer in D20 at 300 ms mixing time is typical of an RNA of this size (Figure S1, Supplementary Material). The spectrum has 30 resonances from RH8, AH2, and YH6, which we refer to as the base or B protons. The six AH2 have sharp lines and contribute strong noise stripes extending from the diagonal along the F1 direction. The next group of 35 protons are called 1' resonances although they also include the base YH5. There are 120 resonances from the H2',3',4',5',5'' sugar, S protons, crowded into the 5.1-3.8 ppm range.
Figure 3 shows the 1 ' 4 region for the spectrum processed with apodization and Fourier transform methods in routine use (see Materials and Methods), while Figure 4 shows the information enhanced by an additional deconvolution pro- cedure described in Materials and Methods. The 1'-2' NOE walk connects the sequential cross peaks in Figure 4 (distances in standard A-DNA: intranucleotide i,2' to i, 1' s 2.7 A; internucleotide i,2' to i+l,l' e 4.681; i to i cross peaks are identified on this and the following subspectra). Notice that the i to i peaks are usually more intense than the i to i+l peaks, as would be expected, and that several breaks in the chain of sequential connectivities occur. The i to i+l peaks are not usually observed in DNA because H2" introduces spin diffusion pathways that spread out the magnetization amonog other sugar protons (the i,l' to i+1,2' distance is = 4.1 A in B-DNA). The 'H-lH relaxation

6494 Biochemistry, Vol. 34, No. 19, 1995 Borer et al.
4.1
4.2
4.3
4.4
if 4.5 ii
4.6
4.7
4.8
4.9
5.0
6
P P .9..
9
l " " " " I " " " ' " I " " " I " ' " ' " I ' " " ' " ' I ' " " ' " ' I " " " " ' I " " " " ' I " ' " ' '
6.1 6.0 5.9 5.8 5.7 5.6 5.5 5.4 5.3
F2 PPM
FIGURE 3: 1'-S region of the 2D NOE spectrum after conventional apodization and FFT processing.
phenomena in RNA (NOE, T I , 7'2) are generally slower than in DNA (data not shown; Wang et al., 1992) due to the absence of the H2" and the short distances it would have to other protons. Further details of the l', S , and B assignments are given in Materials and Methods.
Figure 5 shows most of the B-1' region, with cross peaks from 28 B protons (of 30) to all 24 H1' and 7 H5 (of 11). The B-1' walk is also marked (standard distances: i,l' to i,8/6 E 3.7 A; i,l ' to i+1,8/6 c 4.1 A). Now, most of the walk occurs through i to i peaks and i to i+ 1 peaks of nearly equal intensity, as predicted from the standard distances. However, there are several missing or very weak peaks that indicate local deviations from standard A-family geometry.
An extract of the B-S region is given in Figure S2 of Supplementary Material. In it the sequential B-2' NOE walk occurs primarily through weaker i to i peaks and stronger i to i+l peaks (standard distances: i,2' to i,8/6 = 3.8 A; i,2' to i+1,8/6 = 1.8 A). There are no missing peaks in this path, although significant deviations in the weak-strong- we ak... pattern occur at A8-C9 and in the loop G10-All- U12-Cl3-Al4-Cl5. The assignments of the NH, B, l', and S protons are collected in Table 1, with further discussion of assignment procedures in Materials and Methods.
Distance Constraints. A total of 327 distance constraints were estimated from the 2D NOE spectrum. Most of the cross peaks partially overlap others, so it is difficult to
__ Table 1: Proton Assignments" residue HUH3 H8/H6 H5iH2 H1' H2' H3' H4' H5' H5"
~~
G1 7.627 5.958 4.811 4.883 4.468 4.417'' 4.261' G2 8.017 5.901 4.864 4.877 4.583 4.370' 4.453' G3 12.43 8.116 5.823 4.595 4.926 4.867 4.6W 4.276' A4 7.842 7.820 6.002 4.639 4.607 4.504 4.578' 4.130" c 5 7.414 5.258 5.372 4.318 4.307 4.419 4.490 4.050' U6 13.80 7.768 5.403 5.538 4.420 4.560 4.413 4.5321 4.084' G7 12.19 7.779 5.764 4.304 4.740 4.455 4.510r 4.145' A8 8.237 8.025 6.079 4.671 4.785 4.517 4.391' 4.183' c 9 7.445 5.318 5.472 4.365 4.345 4.412 4.35W 4.15W G10 11.3gb 7.584 5.696 4.590 4.554 4.430 4.446 4.15S Al l 8.025 7.943 5.784 4.474 4.550 4.439 4.373' 4.109' u12 7.532 5.422 5.646 4.158 4.436 4.133 4.181' 3.973' C13 7.595 5.832 5.807 4.203 4.532 4.265 3.943 3.868 A14 8.328 8.050 5.987 4.821 4.841 4.555 4.282' 4.200' C15 7.737 5.778 5.664 4.542 4.511 4.513 4.305 4.373 G16 12&Ib 7.745 5.687 4.630 4.467 4.502 4.451 4.204 C17 7.652 5.387 5.412 4.530 4.589 4.436 4.535 4.143 A18 7.995 7.034 5.863 4.676 4.726 4.478 4.554 4.150 G19 13.48 7.132 5.535 4.350 4.367 4.442 4.436' 4.033' U20 14.28 7.695 4.994 5.554 4.472 4.429 4.403 4.526' 4.053' c 2 1 7.750 5.548 5.611 4.585 4.417 4.315 4.489 4.076 u22 7.675 5.597 5.460 4.328 4.399 4.409 4.422 4.074 A23 8.150 7.605 5.818 4.570 4.599 4.222 4.402? 4.054' U24 7.502 5.248 5.630 4.065 4.154 4.594 4.282 4.022
' Measured at 25 OC; chemical shifts (in ppm) referenced to 4,4- dimethyl-4-silapentane-1 -sulfonate (0.000 ppm) with an accuracy of f0.002 ppm. Tentative assignment based on ring current estimates. Not stereospecifically assigned.

Structure of an RNA Hairpin Biochemistry, Vol. 34, No. 19, 1995 6495
4.1
4.2
4.3
4.4
E 4.5
L4
4.6 .
1 " " " " ' ~ " ~ ~ " ~ " I ~ " ~ ~ ~ ' " I " ' " ' ~ ~ ~ I " ~ ~ " ~ ~ ' I ~ ~ ~ ~ ~ ~ ~ " I " " " " ' I ~ " " ~ " ' I ' " " ~ 6.1 6.0 5.9 5.8 5.7 5.6 5.5 5.4 5.3
F2 PPM FlCiuKE 4: 1'- S region after syninietrization and -6 Hz deconvolution in I;Z and b ' ~ (see Materials and Methods). The 1'-2' NOE walk is marked with dashed lines connecting positions where cross peaks are missing: a circle denotes the end of a walk segment. In this and the following figures, the intraresidue ( i to i) cross peaks are marked by the residue name. e.g. . "A14' is the A14.2'-A14.1' cross peak.
4.7 1
integrate individual contributions accurately. Therefore, for the approximate structure reported here, four classes were identified: strung (intensity as high or hgher than the Y .5-6 at 50 ms mixing time; upper distance bound, 2.5 A), medium (medium or weak at 50 ms and medium or strong at 300 ms; upper bound, 3.3 A), weuk (absent or weak at 50 ms and weak or medium at 300 ms; upper bound. 5.5 A), and absent (clearly missing cross peaks between protons on neighboring residues at all mixing times; lower distance bound, 5.0 A). For the first three classes the lower bound was set at 1.8 A, while a 90 A upper bound was set for absent peaks. This classification of distance constraints is similar to that commonly used in determining folding of proteins (Clore & Gronenborn 1993), relying upon the number of constraints for its success rather than tight bounds. Nineteen hydrogen-bonding distance constraints were in- cluded for the stem base pairs. Figure 6 summarizes the constraints which are listed in Table S1 (Supplementary Material). There are 21 constraints per residue, on average. more than the 15 estimated by James and co-workers to be necessary for stable refinement of DNA structures (Weisz et al.. 1994). Further refinement will account for overlapping peaks and spin diffusion to increase the number of constraints and set more accurate lower and upper bound distance estimates (D Kerwood. and P.N.B.. unpublished results).
Sugar Pucker Equilibrium. It is possible to estimate the distribution of sugar puckers from the Hl'-H2' scalar coupling. If the region in Figure 5 is examined, there are several clearly split H1' signals for which J1f-2. can be estimated directly from the 2D NOE spectrum: G2 (7 Hz), U12 (6 Hz). C13 (5 Hz), and A14 (4 Hz). These values are consistent with -40-70% of the S-puckered states com- monly found in DNA duplexes, although other coupling constants must be measured to determine the distribution of pseudorotational states precisely (Rinkel & Altona. 1987). Several other features of the spectra, particularly the intensi- ties of the 2Q-COSY cross peaks. suggest that 20-30% S-puckering occurs at G7, A8, C9, G10, A l l , C15, and U24. The others must have nearly pure N-states commonly observed in KNA duplexes. The N and S annotations in Figure 1 indicate these results.
Structural Inferences. The bulge A8 base is stacked into the helical stem much of the time as evidenced by the normal stacking pattern for the G7-A8-C9 NOE chain and an A8.2- C17.1' cross peak. However. the A8.1'-C9,6 NOE is weak and there is a weak G7.2'-C9.5 NOE (boxed at the right of Figure 4). This might suggest that A8 could spend part of the time in a bulged-out conformation, but there is no corroborating evidence from G7.2'-C9.6 or G7,3'-C9,6 NOES (Figure S 2 ) . The unpaired A8 apparently provides an

6496 Biochemistry, Vol. 34, No. 19, 1995 Borer et al.
N
d 4
N
4.
FIGURE 5: Segment of the B-1’ region containing all 24 of the 1’ and 28 of the 30 B protons (8/6/2). The chemical shift coordinates of the lower-left comer are (8.377, 6.093 ppm) and the upper-right comer (7.330, 5.372 ppm).
-per-
~ ~ a s s ~ a s s ~ f ~ ” ’ t ~ ~ “ ” ~ ~ ~ ~ ~ v 4 4 a
FIGURE 6: Number of NOE constraints for each residue. The black bars indicate intranucleotide connectivities; light gray bars show sequential internucleotide connectivities; white bars show nonse- quential internucleotide connectivities; dark gray bars (top) show lower-bound constraints due to missing NOES, including both intranucleotide and internucleotide constraints.
atypically long A8,1’-C9,6 step or a kink that brings some G7 and C9 protons within -5 A. G7 and C9, the bases surrounding A8, exhibit mixed N/S sugar puckers, perhaps to accommodate the disruption in normal stacking and/or reflecting an average between a stacked and bulged-out conformation. On the strand opposite the bulge the C15- G16-C 17-A1 8 NOE steps appear almost normal, with the ribose ring equilibrium strongly favoring the N-forms of a standard A-family duplex.
The most striking characteristics in the loop segment (G10- C15) are the mixed populations of the sugar puckers and the involvement of A1 1,2 and A14,2 in multiple NOE contacts. These characteristics are summarized at the top of Figure 1 . The %S values estimated from J1~2’ are 60, 50, and 40%, respectively, for U12, C13 and A14; all the sugars from G7-Cl5 exhibit some degree of S pucker. The variation in the loop sugar conformations suggests that the hairpin segment may exhibit fast conformational fluctuations. This inference is supported by the fact that the G10,l and G16,l resonances must be broader than the five lower-stem iminos (Figure 2), indicating that the two upper-stem iminos are more open to solvent exchange. The NOE contacts from A1 1,2 and A14,2 to the H1’ are easily seen in Figure 5, and several weaker contacts to other sugar protons are recorded in Figure S2. The AH2 nonsequential NOE contacts suggest that A1 1,2 must point toward the A14 sugar, but the evidence for or against an A1 1,2-A14,2 NOE in the B-diagonal region is ambiguous due to large noise ridges (data not shown). There are missing cross peaks at U12,2’-C13,1’ and U12,l’- C13,6 (see Figures 4 and 5); however, weak U12,2’-C13,6 and U12,3’-C13,6 cross peaks are present (Figure S2), so there is not a radically extended conformation between U12 and C13.
The structure at the bottom of the stem must be unusual, but the results are hard to interpret because Gl-G2 and U22- A23-U24 are at the chain termini and have no Watson-
Structure of an RNA Hairpin
Crick pairing partners. The ribose of 6 2 is about 70% S. and there are several missing peaks from the NOE walks: G1.2’42.1’; G2,2’-G3,1’ (Figure 4); G2,1’-8; G3.1’-8; G3.1’- A4.8 (Figure 5); also the G3.2’4 peak is extremely weak (Figure SZ). In addition. there arc nonsequential NOEs that are difficult to explain. e.g.. G2.1’-U24,6 (in the box at the lower right of Figure 5). It niay be that the coniplications arise from an intermolecular complex forming around the G-rich termini (see Dimerization. below) or some other unusual structure. ‘lhe chain terminal regions are not included in the analysis of our preliminary model-building.
Some structural inferences may also be drawn from the cheniical shifts of protons that are atypically shielded or deshielded. While it is difficult to incorporate chemical shift information directly into model building, it can provide useful insights and an independent check on the quality of an NOE- derived structure. Figure 5 and Table 1 show that the bulge A8.1’. A8.8. A8,2 and loop A14.1’. A14.8. A14.2 protons are considerably less shielded than similar protons in base- paired parts of the stem. The average posiQons of these bases must be outside Lunes of high ring-current anisotropy. Likewise, G2.8. Ci2.1’, and G3,8 are in regions of unusually low magnetic shielding. On the other hand, several of the protons in the lower-stem region are strongly shielded. especially A18.2 and G19,8. The most highly shielded YH5 and H6 are in the base-paired stem; interestingly, on the base adjacent to the bulge. C9.5 and 0 . 6 are also strongly shielded. In the loop. it is notable that U12S and U12.6 are rather strongly shielded. while C 13.5 and C 15.5 are the least shielded of the YH5. We will refer back to these conclusions after introducing the NOE-derived model for the structure
Folded Structure: G3-C21. The following discussion focuses on the nonterminal residues since the terminal regions may be involved in an unusual structure. Figure 7a presents a model showing the overall morphology of the hairpin that is consistent with the distance constraints. Figure 7b shows an overlay of the base and sugar rings from seven low-energy structures from 13 ps MD trajectories (the structures have also been energy minimized, see Materials and Methods for details of‘ the refinement procedure). The ring atoms of residues 4-10 and 15-20 were used to prepare the best least-squares fit to the averaged structure. The mean KMSD fit for these atoms is 0.6 f 0.1 A. Figure 7c displays the constraint set that was used for one structure.
The five base pairs in the lower stem form an A-family structure. and the A8 bulge is stacked into the stem. A8 appears to kink the upper stem and loop toward the right in this fjgure. with the view in the upper region into the shallow minor groove. We emphasize the caution that the tipped orientation of the upper and lower regions is a long-range feature. for which there is no direct experimental measure- ment in the NOE data. Gel mobility experiments have also suggested that bulges result in bent RNA conformations (Riordan et al.. 1992). The stem and bulge regions appear to be well-defined as judged by Figure 7b and the KMSD values. However, the loop region is less well-defined. A1 1 is the most stably reflned of the loop residues. with the largest variations occurring in the positions of C13. A14. and C15.
Figure 8a shows details of the A8 bulge with a superposi- tion of the seven lowest-energy structures. and panel b gives the constraint set for one of the structures. There is no evidence for a bulged-out configuration for A8 in our short MD runs Panel c shows the base staclung. where it can be
Biochemistry, Vol. 34, No. 19, 1995 6497
seen that neither A8,8 nor A8.2 are in zones of high ring- current shielding in accord with the observations made at the end of the previous section; C9.6 and C9,5 should be highly shielded. as is also observed in the spectrum. The G7.2’-C9.5 NOE that appears to span the kink (see Structural Inferences) may arise from spin diffusion, since this distance is -5.5 in the structures shown. A likely pathway is via G7.2’-A8.8 (-2.0 A in the present structures) and A8,8-C9,5
The loop conformations occurring in our molecular dynamics study are quite variable. Five of the seven lowest- energy structures have all of the bases directed into the major groove with the “Ll” stacking pattern: GlO/All/U12 and C13/A14 (see Figure 9a). In the others, either A14 or U12 point into the minor groove. Another view of the loop is given in Figure 9b. with an overlay of the five L1 structures. It can be seen that G10 and A l l are well-defined, with considerable variation at C13 and A14. The structure shown in darkest outline has C13 and A14 completely unstacked, so there is variability even within the LI family. Figure 9c shows the 103 distance constraints used to define the loop structure. The seven lowest-energy structures have similar levels of constraint violation (480 kcal f 3%) and total energy (1850 kcal f 1%: the total energies drop to 530 f 1 % after the energy minimization described in Materials and Methods). If this variety in structure persists at higher refinement, it is likely that the forms are in fast exchange.
Animations of each MD trajectory were examined. The starting structures with L1 loops were never observed to lose any of the bases to the major groove. Toward the end of the 900 K portion of the first MD stage (see Materials and Methods). one structure converted from A l l in the minor groove to an L1 form. with the principal barrier being steric clash of the 6-amino group with G10. This clash was seen in each of the trajectories with A1 1 in the minor groove, so structures with A1 1 in the minor groove at the end of the dynamics were not considered further. Starting structures with more than one base in the minor groove (four instances) converted to having only one in the minor groove in three instances. It would appear that the L1 loop is the favored form. It is important to emphasize that the loop structures are not yet fully refined. and may be rapidly interconverting, so interpretations regarding functional consequences should be made with caution. Further refinement should resolve the issue of alternate loop forms.
It is useful to consider three possible sources of error in the NMR structure determination. The first concerns the choice of lower-bound constraints for absent NOEs, the second relates to the choice of upper distance bounds and spin diffusion, and the third regards the potential for averaging different conformations.
(i) The absent NOE constraints appear to contribute little to the structure determination. Only two of the fifteen 5 A lower-bound constraints were violated by more than 0.5 A, and these were for residues G2 and G3 where an unusual structure appears likely.
(ii) For typical MD structures in this study, the average of all violations was less than 0.3 A; there were no violations greater than 2.0 A. but 5-10% of the violations exceeded 1 .O A. In further refinement only about 1 % of the violations should be -0.5 A if a single average conformation is a reasonable approximation to the structure. Binning con- straints into strong. medium, and weak categories can also cause violations if the upper bounds are too restrictive. To
( 4 . 0 A).

6498 Biochemistry, Vol. 34, No. 19, 1995 Borer et al.
- -
e' FIGURE 7: Model of the hairpin showing G3-C21: (a) energy-minimized average of seven MD structures; (b) overlay of the base and sugar rings for the seven structures; (c) network of distance constraints for one of the structures. The view is into the minor groove of the upper stem and loop. Each panel is superimposable with the others.
assess the influence of potentially overrestrictive upper bounds, the constraints were relaxed and further MD calculations were performed. All intensities slightly above the strong/medium boundary at 300 ms mixing time were
moved to the medium bin (34 such changes were made); the upper bound was also relaxed to 3.5 A for all medium peaks. Intensities just above the mediudweak boundary were moved to the weak bin (75 such changes were made),

Structure of an RNA Hairpin Biochemistry, Vol. 34, No. 19, 1995 6499
C %
FIGURE 8: Detailed view of the region surrounding the A8 bulge: (a) superposition of seven low-energy structures showing only base and sugar rings, the top base pair is C9:G17 and G7:C17 is on the bottom; (b) network of constraints for one of the structures in (a); (c) view approximately normal to A8 showing the stacking pattern.
and the upper bound relaxed to 6.0 8, for all weak peaks. The MD protocol described in Materials and Methods was then repeated for the same starting structures that produced the seven low-energy structures in Figure 7b. An average of 1% of the violations were > 1.0 A, and 5% '0.5 A. All of the structures retained similar local geometries in the lower stem region, and four of the five L1 structures retained the same loop and upper stem morphologies. All of the structures still have A8 stacked in the stem, appearing to induce the kink alluded to previously. The primary differ- ences engendered by relaxing the constraints were long-range effects which cannot be justified or excluded on the basis of short-range distance measurements. While the number and severity of the violations is smaller, the structures are probably not more realistic than the set reported in Figures 7-10, as the choice of upper bounds for each bin is quite arbitrary. Altering the constraint list ex post facto to improve agreement is not d valid scientific approach. especially when the violations could be a consequence of rapid conforma- tional exchange. Further refinement, with proper accounting for spin diffusion, and the use of time-averaged restraints is in progress (D Kerwood, D.. and P.N.B.. unpublished results).
(iii) Conformational averaging of different loop forms should lead to violations of NOE constraints. This would provide a reasonable explanation of the large variability in
position for C13. A14. and C15, even though there should be a sufficient number of constraints to define this region. Whether averaging contributes substantially to the violations must await further refinement. If averaging ,does occur, the exchange lifetimes, t,,, are on the order of 200 ,us or less. (All of the B and 1' protons have full linewidths < 8 Hz = ~ 1 1 2 . Assuming that the line width in the absence of exchange is 5 Hz = v ~ / ~ ~ and that the difference in chemical shifts for two exchanging species in equal population is AVO = 100 Hz (0.2 ppm), rex
Biochemical Correlations. It is interesting to discuss the hairpin structure in terms of its function in (i) the initiation of translation of the replicase and (ii) the repression of replicase translation by the coat protein. Of course, there is the strong possibility that interaction with the coat protein, ribosome, or initiation factors will alter the conformation of the hairpin. This is especially true since the NMR evidence suggests flexibility and the potential for conformational exchange.
The Shine-Dalgarno (SD) sequence for ribosome binding is exposed and easily accessible (residues 8-11) and is aligned with the translation start codon (18-20) on the other side of the minor groove (Figure loa). It may be that the A8 bulge helps increase the exposure of the SD site (see also Figure 7). Both the major and minor groove hydrogen- bonding sites for the SD sequence are easily accessible in
2(v1,2 - v ~ / ~ ~ ) / ( ~ A v o ~ ) s 200 ps.)

6500 Biochemistry, Vol. 34, No. 19, 1995 Borer et al.
b
FIGURE 9: Loop conformation: (a) One of the L1 loops with all bases on the major groove side with GlO/All/u12 and C13/A14 stacking; (b) view of five L1 structures rotated by -90” about the horizontal axis of Figure 9a (this view is into the major groove side, with the bases pointed toward the viewer), the structure in dark outline has C13 and A14 unstacked; (c) the network of constraints for one of the L1 structures. Panels b and c are superimposable.
all of the low-energy structures. Strand invasion with base pair formation from the 3’-end of 16s ribosomal RNA should be especially favorable in this region, given these facts: (i) A8 and A1 1 are already unpaired, (ii) the G:C pairs at 9 and 10 are weak as judged by the breadth of their imino proton signals, and (iii) the mixed sugar puckers from 7 to 15 indicate conformational flexibility.
In the interaction with the R17 coat protein, base identity is critical at four positions within the hairpin: an A residue at position 14, a pyrimidine at 13, and purines at 8 and 1 1. Deletion of the “bulged” nucleotide in the stem (position 8) eliminates protein binding, as does substitution of pyrim- idines at this position (Carey et al., 1983; Romaniuk et al., 1987). Further studies, including substitution of modified purines at this position, led to the suggestion that the bulged A is intercalated into the helix (Wu & Uhlenbeck, 1987). This coincides with the NMR evidence as discussed in connection with Figure 8. Changing nucleotides within the loop (positions 1 1 - 14) also generally affects binding. For
example, replacement of the wild-type U at position 13 by a C increases the affinity by 50-fold (Lowary & Uhlenbeck, 1987), and specific UV cross links between the coat protein and both bromouridine (Gott et al., 1991) and iodouridine (Willis et al., 1993) residues at this position have been observed. Backbone elements are also involved in protein binding, as shown via thiophosphate substitution, circular permutation analysis, and ethylnitrosourea modification- interference studies (Milligan & Uhlenbeck, 1989; Gott et al., 1993). The largest effects are seen in the upper stem and loop, indicating that the backbone conformation in this region is important for binding. Protein binding was reduced 3- 10-fold by substitution of sulfur for nonbridging phos- phate oxygens 5’ to nucleotides at positions 9, 10, and 15 and increased 10-fold when a phosphorothioate was placed 5’ to position 11.
Figure 10b shows the positions of the critical bases in the seven MD structures. It can be seen that A8 and A l l are well-defined, while the orientations of C13 and A14 are

Structure of an RNA Hairpin Biochernistry, Vol. 34, No. 19, 1995 6501
AI I A I I
a
A I 1 AI I 1 (.i IO
FIGURE 10. Highlights of known interaction sites: (a) thc A8 bulge may increase the cxposure of the Shine-Dalgarno ribosome binding site (8- 1 I : see also Figure 7a): locations for the S D site and the replicase start codon ( I 8-20) are highlighted by the overlay of seven MD structures in dark outline; (b) sites known to affect binding of the R17 coat protein are highlighted in dark outline for the seven MD structures; thc phosphorus and nonbridging oxygens t’orm a V-shaped pattern. The vicw is into the major groove side of the loop, and the avcraged structure is shown in light outline in each panel.
highly variable. suggesting a capacity for conformational change upon interaction with the coat protein. The critical 0 - P - 0 groups are also shown in Figure lob, with the most variation occurring at C15. In the structures shown, a phosphate oxygen at 9, 10, and 15. as well as the bases A& A 1 I . and C 13, are easily accessible from the major groove side of the loop in the low-energy structures. A 14 is also in the major groove in all but one of the seven low-energy structures. ‘I’he oxygens at PI 1 are turned toward the minor groove in most of the structures.
A crystal structure of a related RNA-protein complex from bacteriophage MS2 was published while this paper was under revision (Valegard et al.. 1994). The interaction of the coat protein with a 19-mer RNA closely resembles the R17 coat protein/KNA complex (Witherell et al.. 199 1 ). The 19-mer hairpin follows the same general structural motif as our 24-mer, with a lower stem of five base pairs. a bulged A. an upper stem of two base pairs, and a loop with the same sequence as ours. The sequence in the upper and lower stems IS different. It is likely that the folded conformations
of the two molecules are similar in the absence of the coat protein. However. the crystal structure in the presence of the protein is substantially different. The bulged A is extruded from the stem, malung specific hydrogen-bonding and steric contacts with the protein. as does the base in the position equivalent to A14. The loop is different from the L 1 conformation. with U 12 located on the minor groove side. The base equivalent to A1 1 is strongly stacked on the upper stem as in our structure.
Thc contrast between the NMR and co-crystal structures emphasizes our view that this RNA hairpin is delicately poised between different folded forms. The NMR evidence suggests that residues 7-15 in our structure (-9 through -3 relative to the start codon) are especially flexible and adaptive toward conformational change. The “ground state” hairpin structure is probably closely related to our NMR structure. A free energy input from the coat protein or the ribosome initiation complex provides the impetus to alter the conformation. Having the ground state at a higher free energy than tor a less tlcxible hairpin facilitates the structural

6502 Biochemistry, Vol. 34, No. 19, 1995
ACKNOWLEDGMENT
Borer et al.
0 20 40 60 80
HOURS FIGURE 11: Dimerization kinetics as monitored by native gel electrophoresis: (0) 25 "C, 25 mM NaC1, 1.7 mM hairpin (slope = O.O92%/h, intercept = 2.2%); (A) same conditions but 15 "C; (e) same as immediately preceding but 50 mM NaCl; (D) same as immediately preceding but 3.4 mM hairpin.
change. Similar arguments have been advanced to explain the effects of flanlung DNA stability on actinomycin D induced enhancements of DNase I cleavage (Bishop et al., 1991) and the action of A h 1 restriction endonuclease and gilvocarcin A (Benight et al., 1995).
Dimerization. Frozen samples prepared at NMR concen- trations exhibit several bands on native gel electrophoresis (see Materials and Methods). However, when an NMR sample is heated above 90 OC and rapidly cooled on ice, -98% is converted to a form that migrates as the fastest band. This band has the same mobility as the 32P-labeled 24-mer at low concentration (C, = lo-* M). Slow aggrega- tion of the hairpin can be followed by native gel electro- phoresis (Figure 11). After 72 h at 25 "C, < 10% of the 1.7 mM NMR sample appears as a dimer. Increasing salt or strand concentration by a factor of 2 or decreasing the temperature to 15 "C increases the rate of dimer formation.
Conditions corresponding to the shallowest line in Figure 11 were chosen to conduct the present study. 2D NOE spectra were acquired at each of four mixing times without intemption (see Materials and Methods), with the data shown in this paper being the third in the series: 50, 100, 300, 150 ms. The 300 ms experiment ended after -160 h of acquisition. We can estimate from Figure 11 that <20% of the sample was present as the dimer. At the current level of refinement, even a full 20% error in the volume of a cross peak would have a negligible effect on a distance constraint (-4%) and the resulting MD structures. Only the strongest unique peaks from the dimer would be visible in the spectrum, and over the course of the acquisition we did not observe shifts in any resonances. However, some peaks appear that probably come from the dimer, e.g., the G2,l'- U24,6 peak boxed at the lower right of Figure 5 . The monomer-dimer equilibrium is being characterized further in our laboratory, but the evidence is against formation of a duplex-like structure, where residues 11 - 14 form an internal loop. It may be that a tetraplex-like structure forms around the terminal G-bases.
We gratefully acknowledge the contributions of Gwang- woo Jeong, Irene M. A. Nooren, KeYu Wang, Karl D. Bishop, George C. Levy, and John Milligan.
SUPPLEMENTARY MATERIAL AVAILABLE
Two figures showing further details of the NMR spectra and a table listing the distance constraints used in the molecular dynamics calculations (7 pages). Ordering infor- mation is given on any current masthead page.
REFERENCES Amott, S., & Hukins, D. W. L. (1973) Biochem. Biophys. Res.
Commun. 47, 1504. Batey, R. T., Inada, M., Kujawinski, E., Puglisi, J. D., &
Williamson, J. R. (1992) Nucleic Acids Res. 20, 4515-4523. Baughman, G., & Nomura, M. (1984) Proc. Natl. Acad. Sci. U.S.A.
81, 5389. Barton, H. A. Eisenstein, R. S . , Bomford, A., & Munro, H. (1990)
J. Biol. Chem. 265, 7000-7008. Bax, A. (1985) Bull. Magn. Reson. 7, 167-183. Bax, A., & Grzesiek, S . (1993) Acc. Chem. Res., 26, 131-138. Bax, A., Ikura, M., Kay, L. E., & Zhu, G. (1991) J. Magn. Reson.
91, 174-178. Benight, A. S . , Gallo, F. J., Paner, T. M., Bishop, K. D., Faldasz,
B. D., & Lane, M. J. (1995) Adv. Biophys. Chem. (in press). Bemardi, A., & Spahr, P. (1972) Proc. Natl. Acad. Sci. U S A . 69 ,
3033. Bishop, K. D., Borer, P. N., Huang, Y.-Q., & Lane, M. J. (1991)
Nucleic Acids Res. 19, 871-875. Braunschweiler, L., Bodenhausen, G., & Emst, R. R. (1983) Mol.
Phys. 48 , 535. Borer, P. N., & Levy, G. C. (1994) Methods Enzymol. 239, 257-
289. Carey, J., Lowary, P. T., & Uhlenbeck, 0. C. (1983) Biochemistry
22, 4723. Chou, S. H., Flynn, P., & Reid, B. R. (1989) Biochemistry 28,
2422-2435. Climie, S . C., & Friesen, J. D. (1987) J. Mol. Biol. 198, 371. Clore, G. M., & Gronenborn, A. M. (1993) in NMR of Proteins
(Clore, G. M., & Gronenborn, A. M., Eds.) pp 1-32, CRC Press, Boca Raton, FL.
Dalvit, C., Wright, P. E., & Rance, M. (1987) J. Magn. Reson. 71 , 539-543.
Davis, D. G. (1989) J. Magn. Reson. 81 , 603-607. Davis, P. W., Thurmes, W., & Tinoco, I., Jr. (1993) Nucleic Acids
Eguchi, Y., & Tomizawa, J. (1991) J . Mol. Biol. 220, 831. Endo, Y., Chan, Y.-L., Lin, A., Tsumgi, K., & Wool, I. G. (1988)
Farmer, B. T., 11, Muller, L., Nikonowicz, E. P., & Pardi, A. (1993)
Freedman, L. P., Zengel, J. M., Archer, R. H., & Lindahl, L. (1 987)
Friedrichs, M. S . , Metzler, W. J., & Mueller, L. (1991) J . Magn.
Gott, J. M., Willis, M. C., Koch, T. H., & Uhlenbeck, 0. C. (1991)
Gott, J. M., Pan, T., LeCuyer, K. A., & Uhlenbeck, 0. C. (1993)
Heus, H. A., Wijmenga, S . S . , van de Ven, F. J. M., & Hilbers, C.
Hines, J. V., Varani, G., Landry, S . M., & Tinoco, I., Jr. (1993) J.
Jaeger, L., Michel, F., & Westhof, E. (1994) J. Mol. Biol. 236,
Jeong, G.-w. (1992) Ph.D. Thesis, Syracuse University, Syracuse,
Jeong, G.-w., Borer, P. N., Wang, S . , & Levy, G. C. (1993) J .
Kearns, D. R., & Shulman, R. G. (1974) Acc. Chem. Res. 7, 33-
Kellogg, G. W., & Schweitzer, B. I. (1993) J. Biomol. NMR 3 ,
Res. 21, 537.
J. Biol. Chem. 263, 7917.
J. Am. Chem. SOC. 115, 11040-11041.
Proc. Natl. Acad. Sci. U.S.A. 84 , 6516.
Reson. 95, 178-183.
Biochemistry 30, 6290.
Biochemistry 32, 13399.
W. (1994) J. Am. Chem. SOC. 116, 4983-4984.
Am. Chem. SOC. 115, 11002-11003.
1271.
NY.
Magn. Reson. Ser. A 103, 123-134.
39.
577-595.

Structure of an RNA Hairpin
Kellogg, G. W., Szewczak, A. A.. & Moore, P. B. (1992) J. Am.
LeMaster, D. M. (1994) Prog. NMR Spectrosc. 26, 371 -419. Leibold, E. A.. Laudano. A., & Yu, Y. (1990) Nucleic Acids Res.
Levy. G. C.. Wang, S . , Kumar. P.. & Borer. P. N . (1991)
Lowary, P. T.. & Uhlenbeck, 0. C. (1987) Nucleic Acids Res. 15,
Mareci, T. H., & Freeman, R. (1983) J. Mugn. Reson. 51. 531. Marion. D., lkura, M., & Bax, A. (1989a) J . Mugn. Reson. 84.
Marion, D.. Kay, L. E., Sparks, S. W., Torchia, D. A,, & Bax, A.
Michnicka, M. J., Harper, J. W., & King, G. C. (1993) Biochemistry
Milligan. J. F., & Uhlenbeck, 0. C. (1989) Biochemistry 28. 2849. Milligan, J. F. Groebe, D. R., Witherell, D. R.. & Uhlenbeck. 0.
Moore. P. B. (1993) Curr. Opin. Struct. B i d . 3 , 340-344. Mooren. M. M. W., Hilbers, C. W., van der Marel, G. A,, van
Boom, J. H., & Wijmenga, S. S. (1991) J. Mugn. Reson. 94, 101-1 11.
Morris. G. A., & Freeman, R. (1978) J. Magn. Reson. 29, 433- 462.
Ni. F. (1992) J. Mugn. Reson. 100. 391 -400. Ni. F.. & Scheraga, H. (1989) J. Mugn. Reson. 82, 413. Nikonowicz, E. P.. & Pardi. A. (1992) J. Am. Chem. Soc. 114.
1082-1083. Nikonowicz, E. P., Sirr, Q., Legault, P., Jucker, F. M., Baer, L.
M., & Pardi, A. (1992) Nucleic Acids Res. 20, 4507-4513. Noller, H. F. (1984) Annu. Rev. Biochem. 53, 119. Pardi, A,, & Nikonowicz, E. P. (1992) J. Am. Chem. SOC. 114,
Pelczer, I.. & Szalma. S . (1991) Chem. Rev. 91, 1507-1524. Pelczer, I.. Bishop, K. D., Levy, G. C., & Borer, P. N. (1991a) J.
Pelczer, I., Bishop, K. D., Wang, K.-Y., & Borer, P. N. (1991b) J.
Chem. SOC. 114, 2727-2728.
18, 1819-1824.
Spectroscopy 3 , 22-29.
10483.
425-430.
(1989b) J. Am. Chem. SOC. 111, 1515-1517.
32, 395-400.
C. (1987) Nucleic Acids Res. 15, 8783.
9202.
Mugn. Reson. 91. 604-606.
Biornol. Struct. Dyn. 8, a160.
Biochemistry, Vol. 34, No. 19, 1995 6503
Pelczer, I., Hoch, J . C., Roggenbuck. M. W., Vaidyanathan, A., Leccarde. M. G., & Borer, P. N. (1992) 33rd Experimental NMR Conference, Asilomar, CA. poster WP 188.
Piotto, M. E.. & Gorenstein, D. G. (1991) J. Am. Chem. SOC. 113, 1438-1440.
Radhakrishnan, I., Patel, D. 1.. & Gao. X . (1992) Biochemistry 31, 2514-2523.
Rinkel, L. J., & Altona, C. (1987) J. Biomol. Struct. Dyn. 4, 621. Riordan, F. A,, Bhattacharya, A., McAteer, S., & Lilley, D. M. J.
(1992) J. Mol. Biol. 226, 305-310. Roggenbuck. M . W. (1990) Ph.D. Thesis, Syracuse University,
Syracuse, NY. Roggenbuck, M. W., Hyman, T. H., & Borer, P. N. (1990) in
Structure & Methods, Vol. 3: DNA & RNA (Sarma, R. H.. & Sarma. M. H., Eds.) pp 309-317, Adenine Press, Albany, NY.
Romaniuk. P. J., Lowary, P., Wu, H.-N., Stormo, G., & Uhlenbeck, 0. C. (1987) Biochemistry 26, 1563.
Sklenir, V.. & Bax, A. (1987) J. Mugn. Reson. 74, 469-479. Sklenir, V., Peterson, R. D., Rejante, M. R., & Feigon, J. (1993a)
Sklenh. V., Peterson, R. D., Rejante, M. R., Wang, E., & Feigon,
Valegird, K., Murray, J. B., Stockley, P. G., Stonehouse, N. J., &
Varani, G., & Tinoco. I. Jr. (1991) Q. Rev. Biophys. 24,479-532. Wang, A. C., Kim, S. G., Flynn, P. F., Chou, S.-H., Orban, J., &
Wang. K. Y., Goljer, I.. & Bolton, P. H. (1994) Biochemistry (in
Weisz, K., Shafer, R. H., Egan, W., & James, T. L. (1994)
Willis, M. C., Hicke. B. J., Uhlenbeck, 0. C., Cech, T. R., & Koch,
Witherell. G. W., Gott, J. M., & Uhlenbeck, 0. C. (1991) Prog.
Wu, H.-N.. & Uhlenbeck, 0. C. (1987) Biochemistry 26, 8221. Zengel, J. M., & Lindahl, L. (1994) Prog. Nucleic Acid Res. 47,
Zuiderweg. E. R. P. (1986) J. Magn. Reson. 70, 336-343.
J. Bioniol. NMR 3 , 721-727.
J . (1993b) J . Am. Chem. SOC. 115, 12181-12182.
Liljas, L. (1994) Nature 371, 623-626.
Reid, B. R. (1992) Biochemistry 31, 3940-3946.
press).
Biochemistry 33, 354-366.
T . H. (1993) Science 262, 1255.
Nucleic Acid Res. 40, 185.
331.
819504756
Related Documents