Revista Mexicana de Física ISSN: 0035-001X [email protected] Sociedad Mexicana de Física A.C. México Calvo del Castillo, H.; Millán, A.; Beneítez, P.; Ruvalcaba-Sil, J. L.; Calderón, T. Proton induced luminescence of minerals Revista Mexicana de Física, vol. 54, núm. 2, abril, 2008, pp. 93-99 Sociedad Mexicana de Física A.C. Distrito Federal, México Available in: http://www.redalyc.org/articulo.oa?id=57054202 How to cite Complete issue More information about this article Journal's homepage in redalyc.org Scientific Information System Network of Scientific Journals from Latin America, the Caribbean, Spain and Portugal Non-profit academic project, developed under the open access initiative

Welcome message from author
This document is posted to help you gain knowledge. Please leave a comment to let me know what you think about it! Share it to your friends and learn new things together.
Transcript
Revista Mexicana de Física
ISSN: 0035-001X
Sociedad Mexicana de Física A.C.
México
Calvo del Castillo, H.; Millán, A.; Beneítez, P.; Ruvalcaba-Sil, J. L.; Calderón, T.
Proton induced luminescence of minerals
Revista Mexicana de Física, vol. 54, núm. 2, abril, 2008, pp. 93-99
Sociedad Mexicana de Física A.C.
Distrito Federal, México
Available in: http://www.redalyc.org/articulo.oa?id=57054202
How to cite
Complete issue
More information about this article
Journal's homepage in redalyc.org
Scientific Information System
Network of Scientific Journals from Latin America, the Caribbean, Spain and Portugal
Non-profit academic project, developed under the open access initiative
INVESTIGACION REVISTA MEXICANA DE FISICA 54 (2) 93–99 ABRIL 2008
Proton induced luminescence of minerals
H. Calvo del Castilloa,b,d, A. Mill ana, P. Beneıtezc, J.L. Ruvalcaba-Silb, T. Calderon a
aDepto. Geologıa y Geoquımica, Universidad Autonoma de Madrid, Ctra. Colmenar, km. 15, 28049, Madrid, Spain.bInstituto de Fısica, Universidad Nacional Autonoma de Mexico, Circuito de la Investigacion Cientıfica s/n,
Ciudad Universitaria, Mexico D.F. 04510, Mexico.cDepartamento Quımica Fısica Aplicada. Universidad Autonoma de Madrid Cantoblanco, Madrid, Spain.
dCentre Europeen dArcheometrie – IPNAS, Universite de Liege, Allee du 6 Aout, BAT 15, 4000, Sart Tilman, Liege, Belgium.
Recibido el 23 de marzo de 2007; aceptado el 1 de febrero de 2008
This paper presents a summary of Ionoluminescence (IL) for several minerals commonly found in jewellery pieces and/or artefacts ofhistorical interest. Samples including silicates and non-silicates (native elements, halide, oxide, carbonate and phosphate groups) have beenexcited with a 1.8 MeV proton beam, and IL spectra in the range of 200- 900 nm have been collected for each one using a fiber optic coupledspectrometer. Light emissions have been related to Cr3+, Mn2+ and Pr3+ ions, as well as intrinsic defects in these minerals. Results showthe potential of IL for impurity characterization with high detection limits, local symmetry studies, and the study of the origin of minerals.
Keywords: Ionoluminescence; mineral; gemstone; light emission; defects; impurities.
En este trabajo se presenta un resumen sobre la Ionoluminiscencia (IL) de varios minerales de uso comun en piezas y/o artefactos de joyerıade interes historico. Las muestras estudiadas incluyen minerales del grupo de los silicatos y no silicatos (elementos nativos, haluros,oxidos,carbonatos y fosfatos) y fueron excitadas con un haz de protones de 1,8 Mev, siendo el espectro de IL recogido en el rango de 200-900 nmusando una fibraoptica acoplada a un espectrometro. Las emisiones de luz detectadas han sido relacionadas con la presencia diversos iones enestos minerales, tales como de Cr3+, Mn 2+ y Pr 3+ , ası como a la presencia de defectos intrınsecos . Los resultados obtenidos muestran elpotencial de IL para la caracterizacion de impurezas a bajo niveles de concentracion, el estudio de simetrıas locales y estudio de procedenciade minerales.
Descriptores: Ionoluminiscencia; mineral; emision de luz; defectos; impurezas.
PACS: 78.60.Hk, 91.60.Ed, 61.72.Ss, 29.27.-a, 87.66.-a, 82.80.-d
1. Introduction
Despite the frequent application of other luminescent tech-niques to minerals in Earth Sciences, covering issues thatgo from impurities characterization [1-2] to mineral explo-ration [3] or quaternary age dating [4-6], Ionoluminescence(IL) still remains a relatively underdeveloped technique fi,however, to determining the chemical valence state of opticalactive impurities, present inside a mineral lattice, and thus,contributing to the unravelling of the general mechanisms ofion beam interaction with matter.
Recent applications of IL to minerals include the follow-ing: impurity characterization of inorganic solids and micro-analysis of inclusions [7-8], damage caused on samples dur-ing proton irradiation for PIXE measurements [9], or studieson the relationship between emission wavelength and bond-ing distance inside mineral structures [10]. Recently Ionolu-minescence has been also proposed as a tool for distinguish-ing imitation from natural diamonds [11].
Most of the minerals examined in this work have previ-ously undergone other luminescent techniques [1-2,12-16],for it is fully believed that previous experience developed inimpurity characterization is to be very useful to the under-standing of IL, and will therefore contribute to the establish-ing of an IL data base.
This paper presents a rapid summary on IL for mineralcases usually found in jewellery and artefacts of historicalinterest, that emphasize the potential of the technique, in par-
ticular its ability to detect crystal defects and impurities atvery low concentrations (less than a fewµg/g).
2. Experimental
Twenty-one different mineral samples, including silicates andnon-silicates, were selected for this study (Table I). All nat-ural samples used were previously characterized by otherluminescence methods, atomic absorption spectroscopy andX-ray diffraction [1-2,12-16].
IL measurements were carried out at the Pelletron Ac-celerator of the Instituto de Fısica (Universidad NacionalAutonoma de Mexico). No sample preparation was required.A 1.8 MeV proton beam was impinged at 45◦ from the sam-ple surface for excitation, inside a vacuum chamber. Currentintensity varied from 150 nA to 2.8µA as different specieshave different sensitivity towards the luminescent process.Light emitted was collected at 90◦ by means of two optic fi-bres connected by a vacuum feedthrough: an inside-chamberone, 1mm in diameter and 1 m length and supplied with anOcean Optics 74UV lens, set at 2cm from the sample’s sur-face; and an outside-chamber one, 600µm in diameter and1 m in length, connected to the USB2000 Ocean Optics Spec-trometer. The spectrometer has an entrance aperture of 25µmwide by 1mm height and a grating corresponding to a spec-tral range from 200 to 900 nm. Thus, its optical resolution is0.8 nm. Measurements were taken for just a few seconds foreach sample and sample cooling was not carried out.

94 H. CALVO DEL CASTILLO, A. MILL AN, P. BENEITEZ, J.L. RUVALCABA-SIL, AND T. CALDERON
TABLE I. Mineral samples studied for this work.
Mineral General Composition Colours
Diamond C Yellow
Brown
Orange
Milk-white
Fluorite CaF2 Green, Dark
blue, light
blue, pink
and ultrapure
synthetic
colourless
Ruby Al2O3Red
Sapphire Blue, Pink
Calcite CaCO3 Colourless
Strontianite SrCO3 Colourless
Apatite Ca5(PO4)3(F,Cl,OH) Light yellow
Kyanite Al2SiO5(Fe3+) Colourless
Garnet Ca3Al2(SiO4)3 Green
Spodumene LiAl(Si2O6) Yellow
Emerald Be3Al2Si6O18Green
Aquamarine Light blue
Tourmaline (Elbaite) XY3Z6(Si6O18)(BO3)3(O,OH)3(OH,F) Pink
Quartz Amathyst SiO2 Purple
3. Results and discussion
a) Non-silicates
Diamond (Native elements)
As is well known, diamond is the high-pressure, stable poly-morph for carbon. Point defects in natural diamond have beenstudied for at least 30 years [1,13]. Its main impurities, Boronand Nitrogen, are responsible for its luminescence. The mainIL diamond emissions previously reported are a blue band(observed in natural and CVD synthetic diamonds), centredat about 430 nm, a 620 nm band related to N-V centres, anda 512 nm band also called “damage peak” for it occurs indiamond after hard irradiation [14,15].
IL emission bands for natural diamond detected in thiswork is displayed in [Fig. 1]. Our natural diamonds showedemission bands at 412-415 (N3centres), 430- 445 (A-bandand N-related centres), 502 (H3 centres) and 637 (N-V cen-tres) nm. However, this characterization should be taken withcaution, for research studies over the last 30 years point outthat regarding the complexity of the diamond defects, thisemission may well come from other kind of imperfections
found in its lattice. Further experimental work is thereforeneeded on this area. Spectra obtained for other diamond sam-ples are very similar.
Our attention was captured by the fact that all the naturaldiamond samples:
i) independently of their colour, showed a similar ILemission spectrum, suggesting the possibility of char-acterizing diamond natural samples by their IL spec-trum;
ii) the IL emission spectrum presented here is more com-plex and better defined than those previously reported,indicating the complexity of the traps related to thephenomenon; and
iii) all IL bands detected are related to N-impurities emis-sion centres.
Further studies need to be conducted for more definite results.
Fluorite (Halide)
Fluorite (CaF2) is present in nature in different colours dueto the impurities and defects that it contains. Its structure can
Rev. Mex. Fıs. 54 (2) (2008) 93–99

PROTON INDUCED LUMINESCENCE OF MINERALS 95
FIGURE 1. IL spectra for non-silicate minerals; (a) Yellow Dia-mond, (b) Green Fluorite.
be described as an FCC for calcium ions where fluorine ionsoccupy all the Td positions. Fluorite usually carries impuri-ties such as Y3+, Cs2+ substituting Ca2+ or rare earths suchas Eu2+, Eu3+, Pr3+ as well as intrinsic defects.
Figure 1b shows the IL spectrum detected for green fluo-rite. A broad emission band peaking at 250, 275, 300, 320,340, 380, 413, and 485 nm, extending from UV, can be ob-served. The strong UV emissions with maxima near 250,275, 300 and 420 nm have been detected elsewhere in previ-ous studies [18,19] and attributed to intrinsic defects (F3+ anF+ colour centres) [20]. This latter assumption seems to besupported, in our case, by the fact that these emissions havebeen also detected in an ultra-pure synthetic fluorite samplestudied here.
Ruby and Sapphire (Oxides)
Corundum (Al2O3) is present in nature as two gemstones;ruby (Al2O3: Cr3+) and sapphire (Al2O3: Fe2+, Ti4+).Colour and luminescence in ruby is due to the presence ofchromium while in sapphire, a charge transfer phenomenonbetween Fe2+ and Ti4+ is held responsible for both charac-teristics. Figures 2a, 2b and 2c show the IL spectra for a
natural sapphire, a treated pink one, and a ruby. The ex-pected Cr3+ emission at 695nm for the ruby was also de-tected for both the sapphires. This transition, due to the split-ting of the 2E level, comes along a non-cubic crystal fieldinside the lattice, and is superimposed on another band thatspans from 630 to 750 nm, related to the4T2 →4A2 tran-sition of Cr3+. Emission bands at 330 nm are due to thepresence of F+ colour centres detected in ruby and both sap-phires, respectively. F3+ centres were observed for the pinksapphire (290 nm).
FIGURE 2. IL spectra for non-silicate minerals; (a) Sapphire (b)Treated Pink Sapphire (c) Ruby.
Rev. Mex. Fıs. 54 (2) (2008) 93–99

96 H. CALVO DEL CASTILLO, A. MILL AN, P. BENEITEZ, J.L. RUVALCABA-SIL, AND T. CALDERON
FIGURE 3. IL spectra for non-silicate minerals; (a) Calcite, (b)Strontianite, (c) Apatite.
Calcite and Strontianite (Carbonates) [10]
Ionoluminescence emission representative of calcite(CaCO3) is shown in Fig. 3a. The different bands detectedhave been previously assigned to different Mn2+ transitions,from levels4F, 4D, 4P, 4G to level6S; the stronger feature isthe line near 610 nm assigned to4T1g →6S in calcite [11,12].The overall pattern for orthorhombic carbonates is similar tothat observed in rhombohedral ones; Mn2+ ions contributewith a red to orange emission, signals varying between line
features and broads bands. Emission spectra for a representa-tive strontianite sample (SrCO3) can be observed in Fig. 3b.Bands detected at 481, 491, 544, 578, 600, 643 and 658nm can be also related to different transitions of the Mn2+
ions. Orthorhombic and rhombohedral carbonates differ inthe coordination number of Mn2+ ions; while in orthorhom-bic carbonates Mn2+ is surrounded by nine oxygen ions ina distorted polyhedron (Oh symmetry), rhombohedral oneshave a six-fold coordination for this ion.
Apatite (Phosphate)
Apatite, (Ca5(PO4)3(F,Cl,OH)), belongs to the phosphategroup and has an economic interest as a potassium sourcefor fertilizers. It is also a main constituent of bones andteeth. The studied sample is from La Celia mine, in Murcia,Spain. Bands detected at 390, 485, 560, 600, 650, 703, 750and 810 nm are in good agreement with those previously re-ported for luminescence studies (excitation-emission) of thismineral. The most intense visible emission, even detectableby the naked-eye, is located in the 500-700 nm spectral range(Fig. 3c). This well-known red emission presents high quan-tum efficiency and can be attributed to1D2 →3H4 transitionPr 3+ [16,20].
b) Silicates
Kyanite
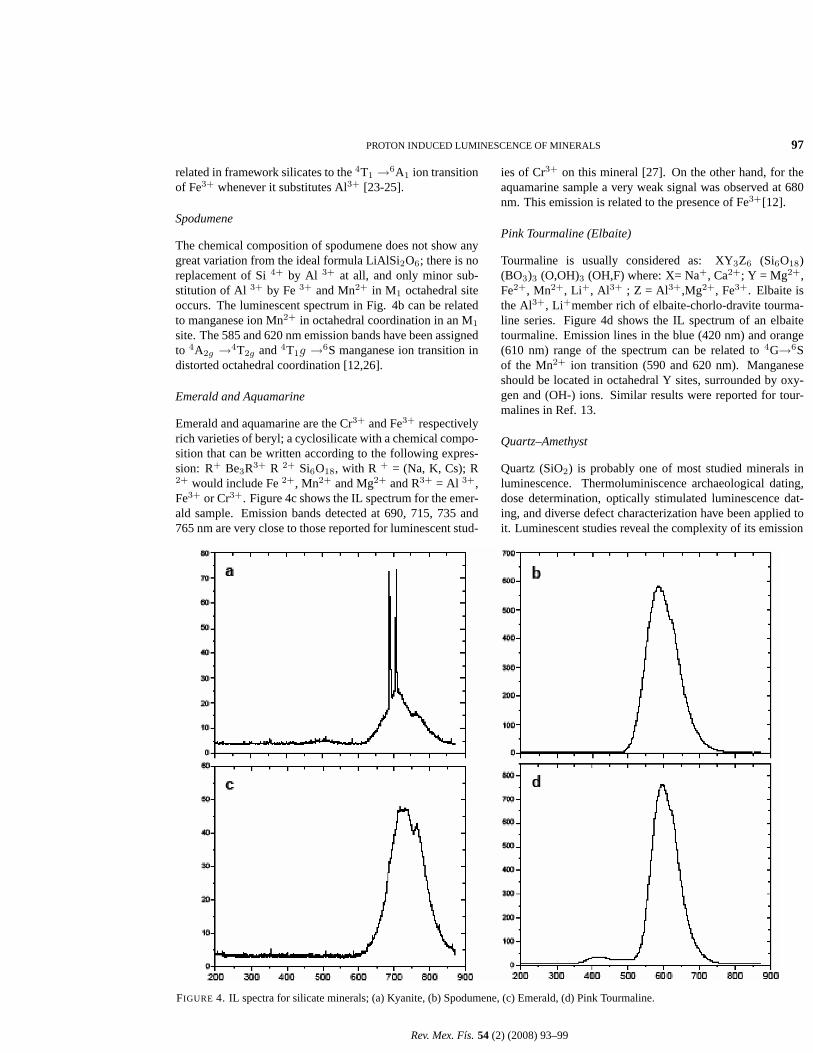
Even though Cr3+ has sometime been reported to be presentin kyanite [21], this mineral tends to have a composition thatmatches the chemical formula Al2SiO5 with apparently onlya very limited amount of Fe3+ being able to enter the struc-ture. Figure 4a represents its emission spectrum, obtainedduring the proton beam irradiation. The main feature to beseen is a broad band in near IR wavelength region spectrumfrom 600 to 800 nm, peaking at 690 nm and 710 nm. Theselast two bands correspond to the typical emission of Cr3+
ions in a nearly cubic intermediate crystal field [22]. Theformer two, instead, correspond respectively to the so-calledR1 and R2 lines associated with the two components of the2E→4A2 magnetic dipole transition in a predominantly cu-bic crystal field; whereas the low energy bands could be dueto either to phonon side bands, or R’ lines corresponding toCr3+ located in different crystal field sites. The broad bandappearing from 600-750 nm is associated with a4T2 → 4A2
transition of the Cr3+ ion, which happens to be thermallyactivated at room temperature.
Green Garnet (Grossular)
Although garnet (R2+3 R3+2 (SiO4)2; R2+= Ca, Mg, Fe, Mn
and R3+= Al, Fe, Mn, Cr) is an ideal structure for observ-ing efficient luminescent ions such as Cr3+, Mn2+ or Y3+,no sign of those ions has been detected whatsoever in oursample. In fact, the IL emission spectrum of grossular onlydisplays a weak, narrow band located at about 740 nm, that is
Rev. Mex. Fıs. 54 (2) (2008) 93–99
PROTON INDUCED LUMINESCENCE OF MINERALS 97
related in framework silicates to the4T1 →6A1 ion transitionof Fe3+ whenever it substitutes Al3+ [23-25].
Spodumene
The chemical composition of spodumene does not show anygreat variation from the ideal formula LiAlSi2O6; there is noreplacement of Si4+ by Al 3+ at all, and only minor sub-stitution of Al 3+ by Fe3+ and Mn2+ in M1 octahedral siteoccurs. The luminescent spectrum in Fig. 4b can be relatedto manganese ion Mn2+ in octahedral coordination in an M1site. The 585 and 620 nm emission bands have been assignedto 4A2g →4T2g and4T1g →6S manganese ion transition indistorted octahedral coordination [12,26].
Emerald and Aquamarine
Emerald and aquamarine are the Cr3+ and Fe3+ respectivelyrich varieties of beryl; a cyclosilicate with a chemical compo-sition that can be written according to the following expres-sion: R+ Be3R3+ R 2+ Si6O18, with R + = (Na, K, Cs); R2+ would include Fe2+, Mn2+ and Mg2+ and R3+ = Al 3+,Fe3+ or Cr3+. Figure 4c shows the IL spectrum for the emer-ald sample. Emission bands detected at 690, 715, 735 and765 nm are very close to those reported for luminescent stud-
ies of Cr3+ on this mineral [27]. On the other hand, for theaquamarine sample a very weak signal was observed at 680nm. This emission is related to the presence of Fe3+[12].
Pink Tourmaline (Elbaite)
Tourmaline is usually considered as: XY3Z6 (Si6O18)(BO3)3 (O,OH)3 (OH,F) where: X= Na+, Ca2+; Y = Mg2+,Fe2+, Mn2+, Li+, Al3+ ; Z = Al3+,Mg2+, Fe3+. Elbaite isthe Al3+, Li+member rich of elbaite-chorlo-dravite tourma-line series. Figure 4d shows the IL spectrum of an elbaitetourmaline. Emission lines in the blue (420 nm) and orange(610 nm) range of the spectrum can be related to4G→6Sof the Mn2+ ion transition (590 and 620 nm). Manganeseshould be located in octahedral Y sites, surrounded by oxy-gen and (OH-) ions. Similar results were reported for tour-malines in Ref. 13.
Quartz–Amethyst
Quartz (SiO2) is probably one of most studied minerals inluminescence. Thermoluminiscence archaeological dating,dose determination, optically stimulated luminescence dat-ing, and diverse defect characterization have been applied toit. Luminescent studies reveal the complexity of its emission
FIGURE 4. IL spectra for silicate minerals; (a) Kyanite, (b) Spodumene, (c) Emerald, (d) Pink Tourmaline.
Rev. Mex. Fıs. 54 (2) (2008) 93–99
98 H. CALVO DEL CASTILLO, A. MILL AN, P. BENEITEZ, J.L. RUVALCABA-SIL, AND T. CALDERON
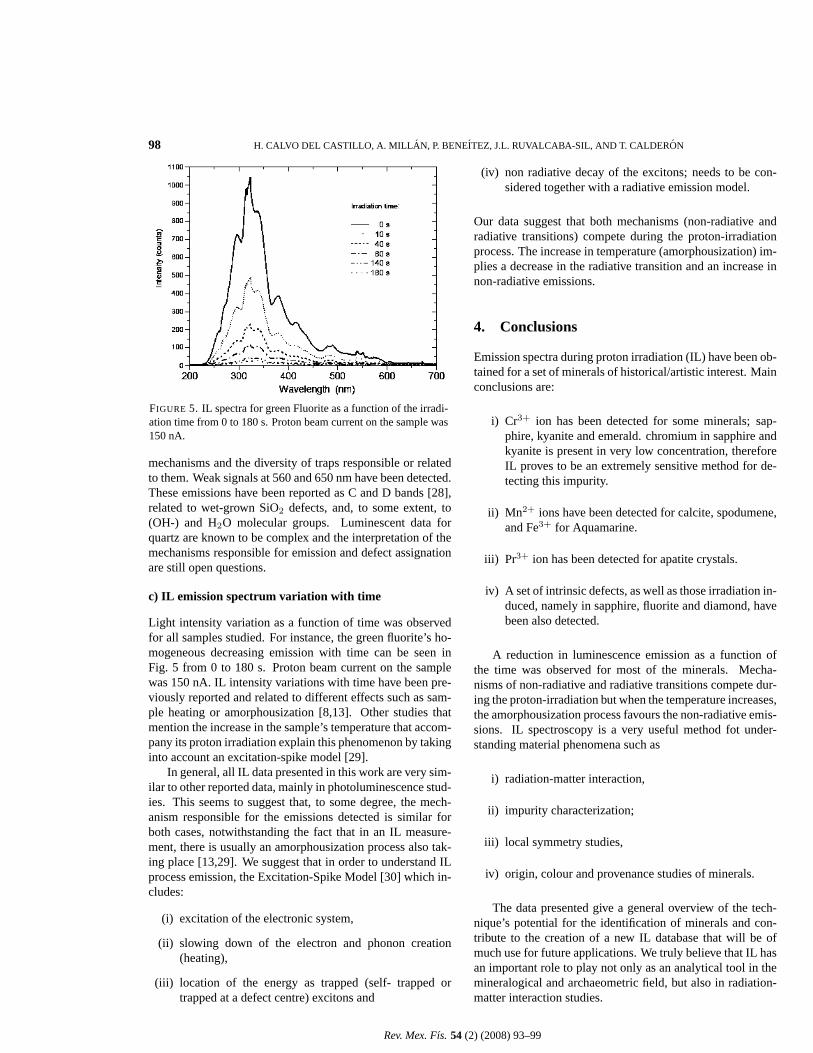
FIGURE 5. IL spectra for green Fluorite as a function of the irradi-ation time from 0 to 180 s. Proton beam current on the sample was150 nA.
mechanisms and the diversity of traps responsible or relatedto them. Weak signals at 560 and 650 nm have been detected.These emissions have been reported as C and D bands [28],related to wet-grown SiO2 defects, and, to some extent, to(OH-) and H2O molecular groups. Luminescent data forquartz are known to be complex and the interpretation of themechanisms responsible for emission and defect assignationare still open questions.
c) IL emission spectrum variation with time
Light intensity variation as a function of time was observedfor all samples studied. For instance, the green fluorite’s ho-mogeneous decreasing emission with time can be seen inFig. 5 from 0 to 180 s. Proton beam current on the samplewas 150 nA. IL intensity variations with time have been pre-viously reported and related to different effects such as sam-ple heating or amorphousization [8,13]. Other studies thatmention the increase in the sample’s temperature that accom-pany its proton irradiation explain this phenomenon by takinginto account an excitation-spike model [29].
In general, all IL data presented in this work are very sim-ilar to other reported data, mainly in photoluminescence stud-ies. This seems to suggest that, to some degree, the mech-anism responsible for the emissions detected is similar forboth cases, notwithstanding the fact that in an IL measure-ment, there is usually an amorphousization process also tak-ing place [13,29]. We suggest that in order to understand ILprocess emission, the Excitation-Spike Model [30] which in-cludes:
(i) excitation of the electronic system,
(ii) slowing down of the electron and phonon creation(heating),
(iii) location of the energy as trapped (self- trapped ortrapped at a defect centre) excitons and
(iv) non radiative decay of the excitons; needs to be con-sidered together with a radiative emission model.
Our data suggest that both mechanisms (non-radiative andradiative transitions) compete during the proton-irradiationprocess. The increase in temperature (amorphousization) im-plies a decrease in the radiative transition and an increase innon-radiative emissions.
4. Conclusions
Emission spectra during proton irradiation (IL) have been ob-tained for a set of minerals of historical/artistic interest. Mainconclusions are:
i) Cr3+ ion has been detected for some minerals; sap-phire, kyanite and emerald. chromium in sapphire andkyanite is present in very low concentration, thereforeIL proves to be an extremely sensitive method for de-tecting this impurity.
ii) Mn2+ ions have been detected for calcite, spodumene,and Fe3+ for Aquamarine.
iii) Pr3+ ion has been detected for apatite crystals.
iv) A set of intrinsic defects, as well as those irradiation in-duced, namely in sapphire, fluorite and diamond, havebeen also detected.
A reduction in luminescence emission as a function ofthe time was observed for most of the minerals. Mecha-nisms of non-radiative and radiative transitions compete dur-ing the proton-irradiation but when the temperature increases,the amorphousization process favours the non-radiative emis-sions. IL spectroscopy is a very useful method fot under-standing material phenomena such as
i) radiation-matter interaction,
ii) impurity characterization;
iii) local symmetry studies,
iv) origin, colour and provenance studies of minerals.
The data presented give a general overview of the tech-nique’s potential for the identification of minerals and con-tribute to the creation of a new IL database that will be ofmuch use for future applications. We truly believe that IL hasan important role to play not only as an analytical tool in themineralogical and archaeometric field, but also in radiation-matter interaction studies.
Rev. Mex. Fıs. 54 (2) (2008) 93–99
PROTON INDUCED LUMINESCENCE OF MINERALS 99
Acknowledgements
We wish to thank Dr. Ernesto Belmont from the IFUNAMand the Escuela de Gemologıa of the UAM for kindly per-mitting us some of the minerals used in this work. We alsowish to thank technicians K. Lopez and F. Jaimes for their
help at the Pelletron Accelerator of the IFUNAM during themeasurements, and Spanish Agencia Espanola de Coopera-cion Internacional Project AECI no A/9332/07, UAM- SCH,Mexico UNAM-DGAPA-PAPIIT IN403302 and IN216903,projects for financial support.
1. T. Calderon, A. Mill an, F. Jaque, and J. Garcıa-Sole, Nucl.Tracks Radiat. Meas. 17(1990) 557.
2. H.M. Rendell, M.R. Khanlary, P.D. Townsend, T. Calderon, andB.J. Luff, Mineral Magazine 57(1993) 217.
3. Gunnell and E. Mitchell,America Mineralogist18 (1993) 68.
4. H. Rendell, T. Calderon, A. Perez-Gonzalez, J. Gallardo, A.Mill an, and P.D. Townsend,Quaternary Geocronology13(1994) 429.
5. A.G. Wintle,Radiation Protection Dosimetry47 (1993) 627.
6. M.J. Aitken,Science-based Dating in Archaeology(Longman,London, 1990).
7. Y. Sha, P. Zhang, G. Wang, X. Zhang, and X. Wang,Nucl. Instr.& Meth. B189(2002) 408.
8. C. Yang, K.G. Malmqvist, M. Elfman, P. Kristiansson, J. Palon,A. Sjoland, and R.J. Utui,Nucl. Instr. & Meth. B130 (1997)746.
9. O. Enguitaet al., Nucl. Instr. & Meth. B219/220(2004) 53.
10. H. Calvo del Castilloet al., Nucl. Instr. & Meth. B249,1/2(2006) 217.
11. H. Calvo del Castillo, J.L. Ruvalcaba, and T. Calderon, Anal.Bioanal. Chem.387(2007) 869.
12. T. Calderonet al., Radiat. Meas.26 (1996) 719.
13. T. Calderon and R. Coy-Yull,Journ. Gemmology, XVIII (3)(1982) 217.
14. H.M. Rendell, M.R. Kahanlary, P.D. Townsend, T. Calderon,and B.J. Luff,Mineral Magazine57 (1993) 217.
15. T. Calderon, M.R. Khanlary, H.M. Rendell, and P.D. Townsend,Nucl. Tracks Rad. Meas.20 (1992) 475.
16. E. Cantelaret al., Jour. Alloy & Compounds323/324(2001)851.
17. A.M. Zaitsev,Optical properties of Diamond(Springer, Berlin,2001).
18. C.M. Subramanian and M.L. Mukherjee,J. Mater. Sci.22(1987) 473.
19. S.A. Holgate, T.H. Sloane, P.D. Townsend, P.D. White, andA.V. Chadwick,J. Phys. Condens. Matter6 (1994) 9255.
20. V.A. Skuratov, S.M. Abu Al Azm, and V.A. Altynov,Nucl. In-str. & Meth. B191(2002) 251.
21. W. Deer, R.A. Howie, and J. Zussman,The Rock Forming Min-erals(Prentice Hall, London, 1992).
22. A.N. Tarashchan,Luminescence of minerals(Naukova Dumka,Kiev, 1978).
23. J.E. Geake and G. Walker,Infrarred and Raman spectroscopyof lunar and terrestrial minerals(Academic Press, New York,1975) p. 73.
24. W.B. White, M. Masako, D.G. Linneham, T. Furukawa, andB.K. Chandrasekahr,Am. Mineral71 (1986) 1415.
25. A.A. Finch and J. Klein,Contrib. Mineral Petrol.135 (1999)234.
26. A.S. Marfunin, Spectroscopy, Luminsecence and RadiationCenters in Minerals(Springer, Berlin, 1979) p.196.
27. E.M. Flangen, D.W. Breck, N.R. Mumbach, and A.M. Taylor,Am. Mineral.52 (1967) 744.
28. H. Koyama,J. Appl. Phys.51 (1980) 2228.
29. N. Itoh and A.M. Stoneham,Nucl. Instr. & Meth. B146(1998)362.
30. G.H. Dieke,Spectra and Energy of Rare Earth Ions in Crystals(Wiley Interscience, New York, 1988).
Rev. Mex. Fıs. 54 (2) (2008) 93–99
Related Documents