Protocols for calibrating multibeam sonar Kenneth G. Foote, Dezhang Chu, and Terence R. Hammar Woods Hole Oceanographic Institution, Woods Hole, Massachusetts 02543 Kenneth C. Baldwin and Larry A. Mayer University of New Hampshire, Durham, New Hampshire 03824 Lawrence C. Hufnagle, Jr. Northwest Fisheries Science Center, NOAA-NMFS, Seattle, Washington98112-2097 J. Michael Jech Northeast Fisheries Science Center, NOAA-NMFS, Woods Hole, Massachusetts 02543 ~Received 16 July 2004; revised 13 January 2005; accepted 20 January 2005! Development of protocols for calibrating multibeam sonar by means of the standard-target method is documented. Particular systems used in the development work included three that provide the water-column signals, namely the SIMRAD SM2000/90- and 200-kHz sonars and RESON SeaBat 8101 sonar, with operating frequency of 240 kHz. Two facilities were instrumented specifically for the work: a sea well at the Woods Hole Oceanographic Institution and a large, indoor freshwater tank at the University of New Hampshire. Methods for measuring the transfer characteristics of each sonar, with transducers attached, are described and illustrated with measurement results. The principal results, however, are the protocols themselves. These are elaborated for positioning the target, choosing the receiver gain function, quantifying the system stability, mapping the directionality in the plane of the receiving array and in the plane normal to the central axis, measuring the directionality of individual beams, and measuring the nearfield response. General preparations for calibrating multibeam sonars and a method for measuring the receiver response electronically are outlined. Advantages of multibeam sonar calibration and outstanding problems, such as that of validation of the performance of multibeam sonars as configured for use, are mentioned. © 2005 Acoustical Society of America. @DOI: 10.1121/1.1869073# PACS numbers: 43.30.Xm, 43.58.Vb, 43.30.Yj, 43.30.Pc @WMC# Pages: 2013–2027 I. INTRODUCTION Multibeam sonar, with its simultaneous formation of multiple beams oriented differently in space, typically in a fan shape, 1 has a long history of application to the imaging of fixed structures. Chief among these has been imaging the seafloor to determine the bottom depth over relatively broad transects or swaths. The resulting data are typically geo- referenced and displayed as maps, while substantial efforts are made to avoid echoes, also called returns, from scatterers such as fish in the intervening water column. In other applications, particularly those relating to fish- eries, specialized multibeam sonars have been adapted to al- low collection of returns from the water column and display of data in real time on a screen, much like conventional sonar data. 2 The increased areal coverage provided by multi- beam sonars without compromise of spatial resolution makes them well suited for studies of fish behavior and vessel avoidance. A number of pioneering studies have looked at the behavior of pelagic fish schools during the passage of an acoustic survey vessel including, for example, Misund and Aglen, 3 using the SIMRAD SM600 sonar, with operating frequency of 34 kHz, and Gerlotto et al. 4,5 and Soria et al., 6 using a RESON SeaBat 6012, with operating frequency of 455 kHz. The behavior of pelagic fish schools during trawl- ing has also been observed with the SM600. 3 The swimming speed of fish has been measured using the Doppler function of the same sonar. 7 Migration of schools of herring ~Clupea harengus! in the North Sea has been observed, with con- comitant measurements of swimming speed, by both the Simrad SR240 and SA950 sonars, with operating frequencies of 24 and 95 kHz, respectively. 8 Migration behavior of schools of capelin ~Mallotus villosus! in the Barents Sea has also been observed with the SR240. 8 Some other applications of multibeam sonar to fish, as well as limitations in the use of the sonar, have been summarized by Reid. 9 The three-dimensional nature of multibeam sonar data has also encouraged application of modern visualization techniques, allowing the complex behavior of mid-water tar- gets to be explored interactively and in three dimensions. 10 The advantage of using multibeam sonar for mid-water target identification is also being explored by the military. 11 Predator-prey interactions are being studied by means of multibeam sonar. The movements of schools of herring in- duced by killer whales ~Orcinus orca! have been measured, 12 as have the interactions between juvenile herring and the Atlantic puffin ~Fratercula arctica!. 13 In both of these stud- ies, the RESON SeaBat 6012 sonar was used, with respective operating frequencies of 455 and 150 kHz. The behavior of Hawaiian spinner dolphins ~Stenella longirostris! and pelagic prey has been studied with the new SIMRAD MS2000 sonar, with 200-kHz operating frequency and 128 1.5-deg beams spanning a 150-deg sector. 14 The several fisheries applications mentioned here have succeeded because of the qualitative imaging capability of 2013 J. Acoust. Soc. Am. 117 (4), Pt. 1, April 2005 0001-4966/2005/117(4)/2013/15/$22.50 © 2005 Acoustical Society of America

Welcome message from author
This document is posted to help you gain knowledge. Please leave a comment to let me know what you think about it! Share it to your friends and learn new things together.
Transcript
Protocols for calibrating multibeam sonarKenneth G. Foote, Dezhang Chu, and Terence R. HammarWoods Hole Oceanographic Institution, Woods Hole, Massachusetts 02543
Kenneth C. Baldwin and Larry A. MayerUniversity of New Hampshire, Durham, New Hampshire 03824
Lawrence C. Hufnagle, Jr.Northwest Fisheries Science Center, NOAA-NMFS, Seattle, Washington 98112-2097
J. Michael JechNortheast Fisheries Science Center, NOAA-NMFS, Woods Hole, Massachusetts 02543
~Received 16 July 2004; revised 13 January 2005; accepted 20 January 2005!
Development of protocols for calibrating multibeam sonar by means of the standard-target methodis documented. Particular systems used in the development work included three that provide thewater-column signals, namely the SIMRAD SM2000/90- and 200-kHz sonars and RESON SeaBat8101 sonar, with operating frequency of 240 kHz. Two facilities were instrumented specifically forthe work: a sea well at the Woods Hole Oceanographic Institution and a large, indoor freshwatertank at the University of New Hampshire. Methods for measuring the transfer characteristics of eachsonar, with transducers attached, are described and illustrated with measurement results. Theprincipal results, however, are the protocols themselves. These are elaborated for positioning thetarget, choosing the receiver gain function, quantifying the system stability, mapping thedirectionality in the plane of the receiving array and in the plane normal to the central axis,measuring the directionality of individual beams, and measuring the nearfield response. Generalpreparations for calibrating multibeam sonars and a method for measuring the receiver responseelectronically are outlined. Advantages of multibeam sonar calibration and outstanding problems,such as that of validation of the performance of multibeam sonars as configured for use, arementioned. ©2005 Acoustical Society of America.@DOI: 10.1121/1.1869073#
PACS numbers: 43.30.Xm, 43.58.Vb, 43.30.Yj, 43.30.Pc@WMC# Pages: 2013–2027
ofagt
oaefoer
htoaynaltikse
fng
ol
ti
n-thecies
s
of
atationar-s.get
s ofin-
the
ctiver of
ar,ms
aveof
I. INTRODUCTION
Multibeam sonar, with its simultaneous formationmultiple beams oriented differently in space, typically infan shape,1 has a long history of application to the imaginof fixed structures. Chief among these has been imagingseafloor to determine the bottom depth over relatively brtransects or swaths. The resulting data are typically greferenced and displayed as maps, while substantial efare made to avoid echoes, also called returns, from scattsuch as fish in the intervening water column.
In other applications, particularly those relating to fiseries, specialized multibeam sonars have been adaptedlow collection of returns from the water column and displof data in real time on a screen, much like conventiosonar data.2 The increased areal coverage provided by mubeam sonars without compromise of spatial resolution mathem well suited for studies of fish behavior and vesavoidance. A number of pioneering studies have lookedthe behavior of pelagic fish schools during the passage oacoustic survey vessel including, for example, Misund aAglen,3 using the SIMRAD SM600 sonar, with operatinfrequency of 34 kHz, and Gerlottoet al.4,5 and Soriaet al.,6
using a RESON SeaBat 6012, with operating frequency455 kHz. The behavior of pelagic fish schools during trawing has also been observed with the SM600.3 The swimmingspeed of fish has been measured using the Doppler funcof the same sonar.7 Migration of schools of herring~Clupea
J. Acoust. Soc. Am. 117 (4), Pt. 1, April 2005 0001-4966/2005/117(4)/2
hedo-rtsers
-al-
l-esl
atand
f-
on
harengus! in the North Sea has been observed, with cocomitant measurements of swimming speed, by bothSimrad SR240 and SA950 sonars, with operating frequenof 24 and 95 kHz, respectively.8 Migration behavior ofschools of capelin~Mallotus villosus! in the Barents Sea haalso been observed with the SR240.8 Some other applicationsof multibeam sonar to fish, as well as limitations in the usethe sonar, have been summarized by Reid.9
The three-dimensional nature of multibeam sonar dhas also encouraged application of modern visualizatechniques, allowing the complex behavior of mid-water tgets to be explored interactively and in three dimension10
The advantage of using multibeam sonar for mid-water taridentification is also being explored by the military.11
Predator-prey interactions are being studied by meanmultibeam sonar. The movements of schools of herringduced by killer whales~Orcinus orca! have been measured,12
as have the interactions between juvenile herring andAtlantic puffin ~Fratercula arctica!.13 In both of these stud-ies, the RESON SeaBat 6012 sonar was used, with respeoperating frequencies of 455 and 150 kHz. The behavioHawaiian spinner dolphins~Stenella longirostris! and pelagicprey has been studied with the new SIMRAD MS2000 sonwith 200-kHz operating frequency and 128 1.5-deg beaspanning a 150-deg sector.14
The several fisheries applications mentioned here hsucceeded because of the qualitative imaging capability
2013013/15/$22.50 © 2005 Acoustical Society of America
nds
leire
nunt oy-
ltiois
fat tset
sot
dr,eshe
to
s
b
ae
raz
nr,onfo
olsary,esetedillea-cho
ra-wateringa-ork
ingis-
forys-are
ro-he. Inom-e-drsys,entp-ar-
le I.re-
the multibeam sonar in a high-signal, low-noise enviroment, supplemented by registration of the echo magnituCalibration is generally important for imaging applicationfor example, to define the limits of performancevis-a-vis thesignal-to-noise ratio and to ensure consistent, distortionperformance at high signal-to-noise ratios. In other desapplications beyond those of visualization,10 a quantitativecapability, hence calibration, is essential. This is true formerical determination of concentration densities of fish aother biological organisms. It is also true for measuremenbubble populations15 and particulate concentrations near hdrothermal vents,16 for example.
There are additional advantages to calibrating mubeam sonars. For example, sonar performance can be mtored, with the ready possibility of detecting changes in thWhile a multibeam sonar may be calibrated by the manuturer prior to shipping to a customer, the owner may wanconfirm its compliance with the specifications. Also, the uneeds to be able to check the state of the instrument anear to the time of application.
There are well-established procedures for calibratingnars. A dozen different basic approaches to measuringfrequency response function of sonar receivers were liste1983 by Urick.17 Given the complexity of multibeam sonaparticularly the large number of beams, use of any of thapproaches must be time consuming. At the same time, tcalibration procedures require measurements of parts ofsonar, with the inevitable compounding of errors, and usesecondary standards, such as hydrophones, themselvequiring calibration.
Fortunately, there is an alternative procedure availafor multibeam sonar, namely that of the standard target.18–20
This is widely used for calibrating scientific echo soundersultrasonic frequencies, and has already been used for msuring certain performance measures, including the ovesystem directionality, of the SIMRAD SM2000/200-kHmultibeam sonar21,22 and SM2000/90-kHz multibeamsonar.23
Recognizing the importance of developing simple astraightforward calibration procedures for multibeam sonaproject has been conducted with the aim of developing cvenient calibration protocols for multibeam sonars used
2014 J. Acoust. Soc. Am., Vol. 117, No. 4, Pt. 1, April 2005
-e.,
ssd
-df
-ni-.
c-oror
-hein
esehefre-
le
ta-ll
da-r
water-column measurement. Development of new protochas already been described in a series of preliminpublications.21,23,24 This development work is summarizedand the protocols are documented. It is believed that thare sufficiently detailed to serve as guides for the interesuser. It is believed further that the protocols collectively wenable multibeam sonars configured for water-column msurement to be used as an integrated set of scientific esounders.
In the following, the test multibeam sonars and calibtion targets are described, as are the seawater and freshfacilities and associated instrumentation used in developthe calibration protocols. Methods involving acoustic mesurements are reviewed, and results of the development ware summarized in the form of protocols. Some outstandproblems in multibeam sonar calibration are briefly dcussed.
II. MULTIBEAM SONARS AND TARGETS
Essential to the development of calibration protocolsmultibeam sonar was identification of appropriate sonar stems and specification of standard targets. Both subjectsaddressed.
A. Sonars
Three sonar systems were selected for their routine pvision of the water-column signal, which is otherwise texception in most commercial multibeam sonar systemsthis section, details are given on the transducer array geetries. While this information is not usually regarded as bing commercially confidential, it is not generally publisheeither, not even in proprietary literature provided to owneof such sonars. The information is valuable in several wae.g., for use in beamforming based on individual elemsignals~Sec. V A! and for other processing or analytical oerations, as in calculating nearfield–farfield transition chacteristics~Sec. V G!.
Some transducer specifications are compared in TabDifferences in particular configurations are sufficient toquire further elaboration in the text.
TABLE I. Comparison of three different multibeam sonars used in the calibration exercises.
Parameter SM2000/90 kHz SM2000/200 kHz RESON Seabat 8101
Operating frequency~kHz! 90 200 240Receiving array
No. of channels 80 80 176Radius~cm! 38.7 20.0 15.6Angular span~deg! 94.8 88.16 150
Displayed beamsNo. of beams 128 128 101Angular resolution~deg! 1.5 1.5 1.5
Displayed-beam signalsNo. of bits 8 8 8Dynamic range~dB! 48 48 48
Individual-channel signalsNo. of bits 12 12 8Dynamic range~dB! 72 72 48
Foote et al.: Protocols for calibrating multibeam sonar
thare
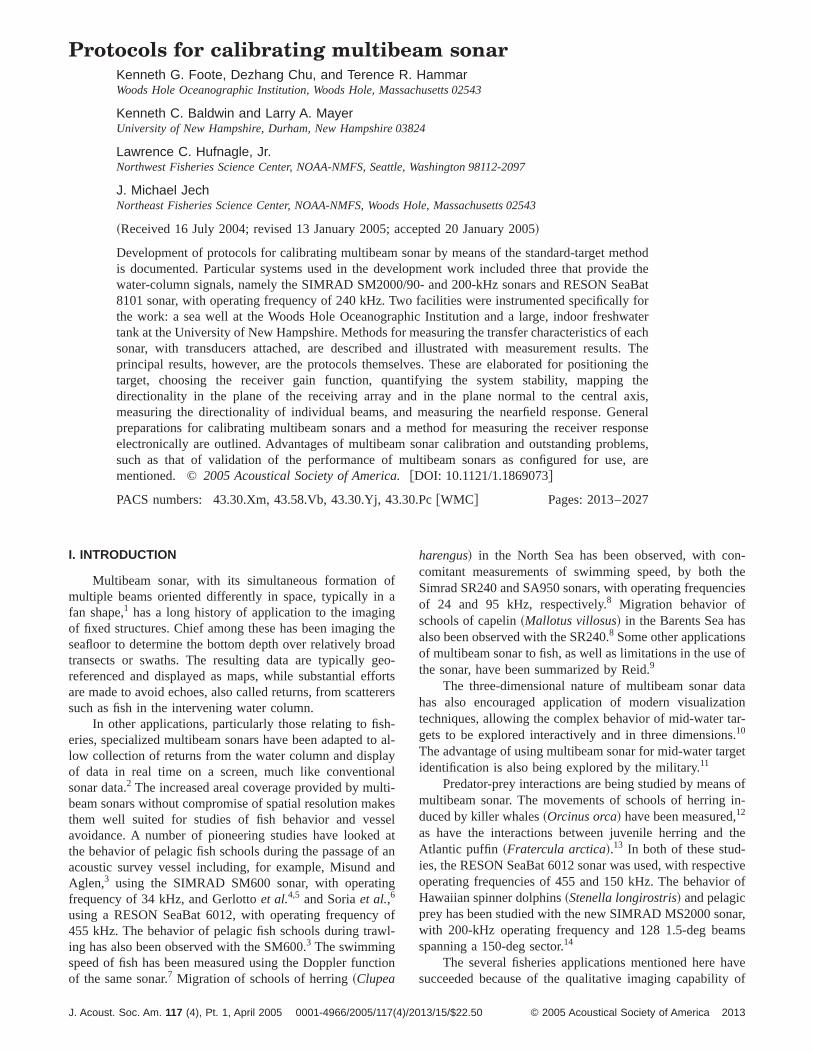
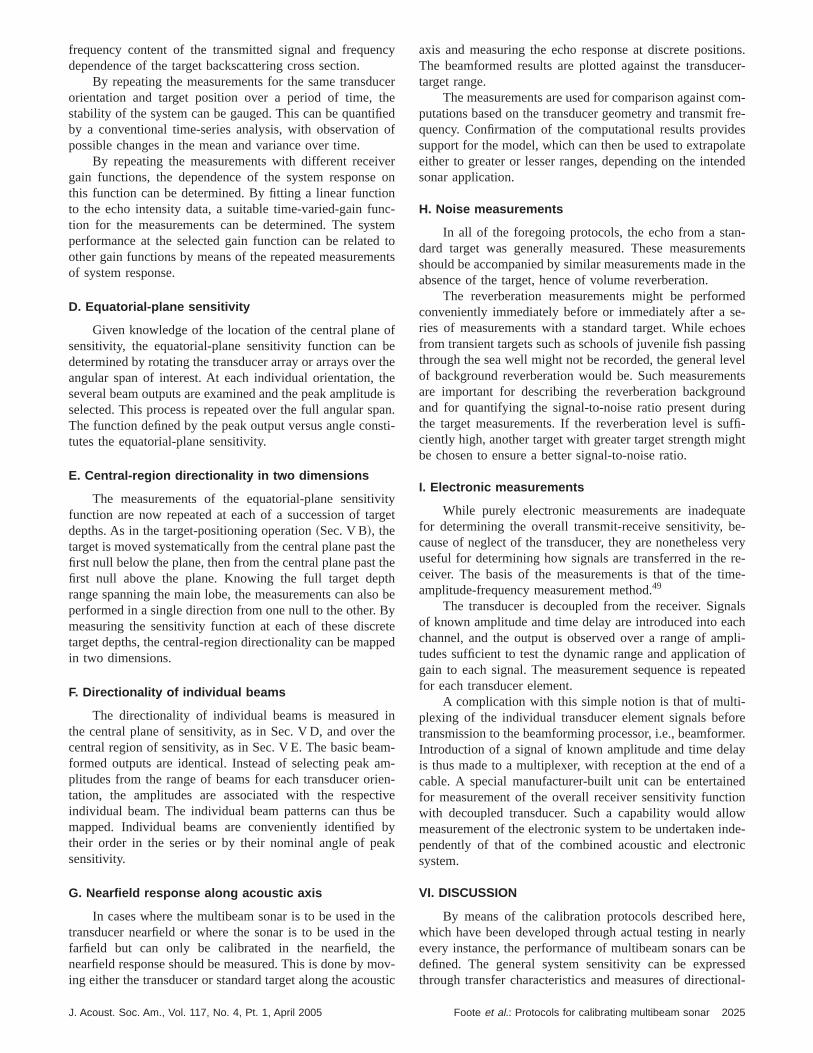
FIG. 1. Schematic diagram of the sea well as configured for calibration. For the transducer mountings, as indicated in Fig. 2, the equatorial plane isat planerunning through the arc of the receiving elements, withu50 or equivalentlyh50, thus coinciding with the horizontal plane. The polar planesperpendicular to the equatorial plane and contain the rotational axis of the transducer; for the particular configuration, they are vertical planes.
-icac
chg
thre
ham
rrthan
natsn
urmedeite-
r aa
aBatande thedes-dels
rvedf thesed.
Transducer-mounting convention: In all cases, the transducers were mounted with their active surfaces in the vertplane, as indicated in Fig. 1. Thus, the acoustic axis of ewas horizontally oriented.
Terminology: As indicated below, the elements of eareceiving array used in this study are arranged in a sinrow along a circular arc. The plane of this arc is calledequatorial plane. The perpendicular planes containing thetational axis of the transducer are called the polar planEach particular polar plane is distinguished by its azimutorientation, which may define an acoustic axis if the beaforming is done through postprocessing.
1. SIMRAD SM2000 Õ200-kHz multibeam sonar
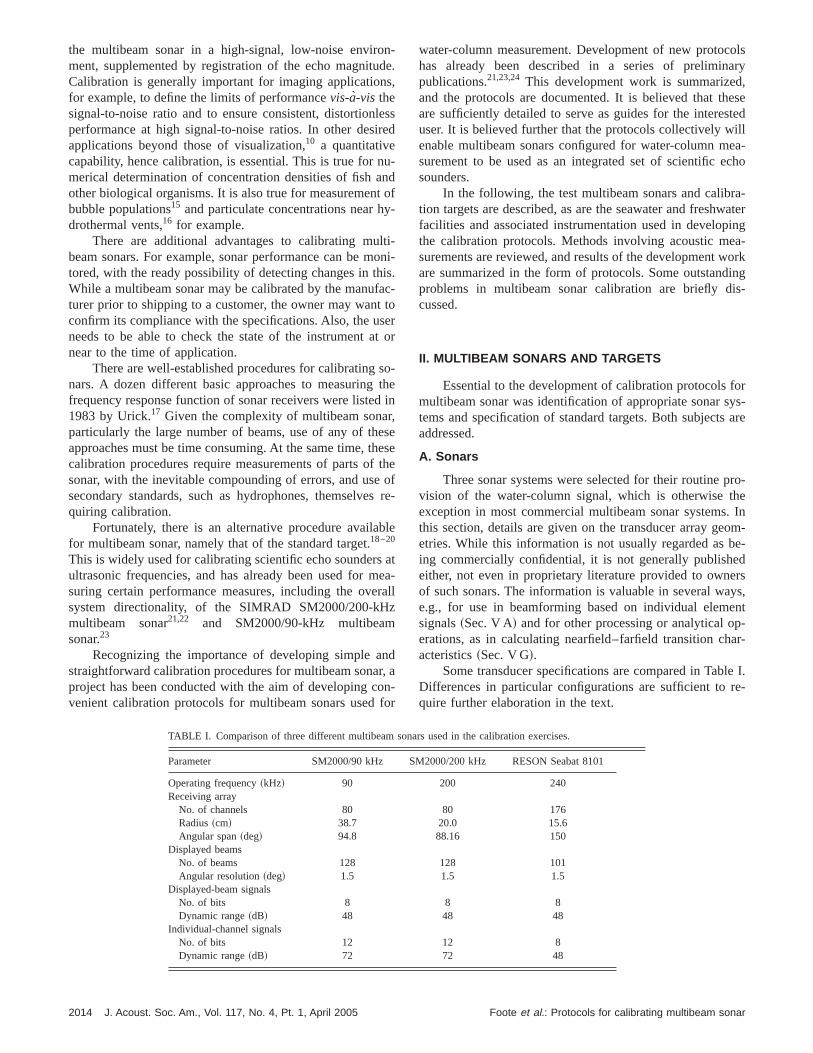
The SM2000 has two separate operating modes, refeto as imaging and echo-sounding. In the imaging mode,same transducer array is used in both signal transmissionecho reception. This array consists of 80 elements positiowith equal spacing on a circular arc~Fig. 2!, thus definingthe equatorial plane. Each element is rectangular, 2.5419.05 mm. Two versions are fabricated. For that of nomispan 120 deg, the radius to the outer faces of the elemen20.00 cm, and the interelement spacing is 1.12 deg, hespanning a total angular sector of 88.16 deg as measbetween the centers of the end elements. For that with nonal span 150 deg, the radius to the outer faces of thements is 10.85 cm, and the interelement spacing is 1.13spanning a total sector of 155 deg. In the associated digsignal processor, a total of 128 receive beams are formeach with beamwidth 1.5320 deg in the respective horizontal and vertical planes.
In the echo-sounding mode, the described transduceray is used only in reception. Transmission is effected by
J. Acoust. Soc. Am., Vol. 117, No. 4, Pt. 1, April 2005
alh
leeo-s.l-
edended
bylis
ceedi-
le-g,ald,
r-n
FIG. 2. Schematic diagrams of transducer-mounting plates for the Se8101 240-kHz multibeam sonar, SM2000/200-kHz multibeam sonar,SM2000/90-kHz multibeam sonar. The black rectangular areas designatprotective coverings of the external transmitter. The black curved areasignate the same for the receiving arrays. In the case of the SM2000 moin the imaging mode, the external transmitter is not used, and the cuarrays are used both for transmission and reception. In the case oSM2000 models in the echo-sounding mode, the external transmitter is u
2015Foote et al.: Protocols for calibrating multibeam sonar
cmnra
7rawd
8nab
bhie
nasa
teeceic,porotngn-c
hica
atlnaao.lgt
y
Hvesimtsiua
f thelar
inthe-3.8entseen
is-
1.5ter-
fre-25lse
esals,us,en-
tabitded
eiv-
derby
heto-egxistheing
nlying
3.11.5-
s inar-
choar,n.al-nalyn-a-re
external line array of 50 elements of total length 27.6oriented along the vertical, thus in the central polar plaperpendicular to the equatorial plane of the receiving ar~Fig. 2!, and thence forming a Mills cross.17 Each transmit-ting element is a narrow band of width 2.1 mm spanning 1deg of a circular arc of radius 44.45 mm. The entire arappears to be a half-cylinder. The elements are stackeda center-to-center distance of 5.6 mm. They are weighteamplitude, i.e., amplitude shaded.17 The computed nearfielddistance is 11 m.25 Through digital signal processing, 12receive beams are formed for the display, with nomibeamwidths 1.531.5 deg. The number of beams that canformed on an external processor is arbitrary.
The distinction between the two modes is recognizeda particular naming convention, which is adhered to in twork. For the general system, with optional use of eithmode, reference is made to the SM2000 multibeam soFor the particular configuration in which the external tranmitter is used, reference is made to the SM2000 multibeecho sounder.
The transmitted signal in both modes is typically a finior pulsed, sinusoid at 200 kHz. The duration may be spfied directly by the user or indirectly based on the specifirange. For target ranges of order 5–25 m, which are typin standard-target calibrations of high-frequency sonarspulse duration of 100ms was generally used. The pulse reetition frequency was determined automatically in accdance with the range, typically about 1 Hz or 1 ping/s. Nwithstanding the appearance of user control over the settithe sonar itself is configured internally with certain costraints that cannot be exceeded. In addition, the sonarneither accept nor generate an external trigger signal, wmay be regarded as highly inconvenient in many applitions.
The sonar displays echoes as received on 128 beover the total angular sector of 120 or 150 deg. Significanthe sonar can record either the raw complex echo sigfrom each of the 80 elements or the 128 beamformed signBeamforming performed within the sonar digital signal prcessor~DSP! uses a Hamming-type amplitude-weighting26
Beamforming performed through postprocessing externathe sonar DSP uses Chebyshev-type amplitude-weightin17
Other shading schemes may be implemented when usingindividual element outputs, and other apertures may alsodefined.
The data are digitized with 8-bit resolution for displaand with 12-bit resolution for recording purposes. The nomnal dynamic range of the recorded data is thus 72 dB.
2. SIMRAD SM2000 Õ90-kHz multibeam sonar
The architecture of this sonar, which operates at 90 kis similar to that of the 200-kHz sonar described aboSimilarly to the 200-kHz sonar, the 90-kHz sonar operateboth imaging and echo-sounding modes. The collocatedaging array~Fig. 2! also consists of 80 identical elemenspaced at intervals of 1.20 deg along a circular arc of rad38.74 cm measured to the outer face of the element
2016 J. Acoust. Soc. Am., Vol. 117, No. 4, Pt. 1, April 2005
ey
7yithin
le
ysrr.
-m
,i-dala
---s,
anch-
msy,lsls.-
to.hebe
i-
z,.
in-
snd
spanning 94.8 deg as measured between the centers oend elements. The dimensions of the individual rectanguelements are 5.08364.8 mm.
The external transmitter is a linear array 86.6 cmlength oriented perpendicularly to the equatorial plane ofreceiving array~Fig. 2!. This consists of 12 pairs of elements. Each element is rectangular with dimensions364.8 mm. The center-to-center distance between elemin a pair is 17.8 mm. The center-to-center distance betwpairs, aligned end-on, is 65.3 mm.
The digital signal processor forms 128 beams for dplay. The nominal beamwidths are 1.5320 deg in the imag-ing mode, without use of the external transmitter, and31.5 deg in the echo-sounding mode, with use of the exnal transmitter.
Transmit signals are pulsed sinusoids with a centerquency of 90 kHz. For nominal target ranges of order 5–m, which are used in standard-target calibrations, a puduration of 300ms was typically selected.
As with the 200-kHz sonar, the 90-kHz sonar providboth the beamformed signals and individual element signbut only one at a time depending on operator choice. Ththe user can choose to perform the beamforming indepdently of the sonar processor.
As with the 200-kHz multibeam sonar, the digitized daare displayed with 8-bit resolution, but recorded with 12-resolution. Thus, the nominal dynamic range of the recordata is 72 dB.
3. RESON SeaBat 8101 multibeam sonar at 240 kHz
This sonar consists of separate transmitting and recing transducer arrays~Fig. 2!. The transmitting array is alinear array of 36 elements conforming to a slender cylinof radius 2.5 mm, each 5.28 mm in length and separateda gap of 0.7 mm, hence with total length 21.46 cm. Ttransmitting array is oriented perpendicularly to the equarial plane of the receiving array. A swath exceeding 150 dis insonified. Shading is employed to reduce the on-atransmit signal strength, as this typically corresponds tonadir in bathymetric mapping exercises. The same shadachieves a one-way, received sidelobe level of about220dB, as computed.
The receiving array is composed of 176 elements evespaced on a circular arc of radius 15.6 cm. Each receivelement is rectangular, with height 16.88 mm and widthmm. The center-to-center distance subtends an arc ofdeg. The system forms 101 1.531.5-deg beams over an angular sector of 150 deg.
In contrast to the SM2000, the SeaBat 8101 operateonly one mode, with separate transmitting and receivingrays. Thus, it functions like the SM2000 multibeam esounder, but is referred to in this work as a multibeam sonconsistent with the manufacturer’s own naming conventio
Although the SeaBat 8101 does not support externtrigger operation, it does accept a synchronized clock sigfrom another computer. The computer that transmits the schronization signal can also accept motor-position informtion from the motor controller. The beamformed data a
Foote et al.: Protocols for calibrating multibeam sonar
y-
er
ndtu
ilitp
6%um.er
itO.2e
l o.1en
ef
riaetsu
ruls-
tu-rgepar-g 6gelylsotion
le
ea-ch
d.th-b,nd. Ittidalble.nts
forthef theer,of
edntsofheforbleo fa-
a-as-
digitized and stored with 8-bit resolution. The nominal dnamic range is thus 48 dB.
B. Standard targets
A number of standard targets were selected or devisIn every case these were based on the spherical form. Pciples of optimization of the diameter for both narrow-baand broadband sonars18,27–29were not applied in the presenwork. Rather, for reasons of convenience, a number of soptimal targets were chosen based on ready availabThese included spheres made of electrolytic-grade copwith diameters 23 and 60 mm, tungsten carbide withcobalt binder with diameters 20 and 38.1 mm, aluminwith diameter 60 mm, and titanium with diameter 47 mm
To achieve substantially higher target strengths, sevfocusing spheres30–33 were fabricated.34 Two of these werebased on spherical shells made of high-silicon bronze wexternal diameters 101.6 mm and shell thickness 3 mm.was outfitted with a movable piston plug, diameter 14mm, and the other with a simple shallow screw. Anothfocusing sphere was fabricated from a hollow rubber baldiameter 88.9 mm, with thickness varying from 1.7 to 2mm ~average 1.9 mm!. The three hollow spheres wervacuum-filled with the fluorocarbon liquid FS-5, also knowby the tradename Fluorlube.35
In some cases, the target strengths of the several sphwere either computed according to the respective theoriessolid elastic spheres,36,37 noting corrections,18 or the appro-priate limiting case as given by Goodman and Stern,38 or forspherical shells,38 assuming accepted values for the mateproperties. In other cases, the target strengths were dmined according to comparative measurements. The reare shown in Table II.
III. CALIBRATION FACILITIES AND THEIRINSTRUMENTATION
Both seawater and freshwater facilities were instmented for the work of developing calibration protocoEarlier preliminary reports34,39,40 are summarized and updated.
J. Acoust. Soc. Am., Vol. 117, No. 4, Pt. 1, April 2005
d.in-
b-y.er
al
hne2rf
resor
ler-lts
-.
A. Sea well
Iselin Dock at the Woods Hole Oceanographic Instition is a large dock supported by concrete pilings. Lareinforced concrete blocks have been removed from aticular area, exposing a sea well with rectangular openin313 m2 ~Fig. 1!. The hard bottom beneath this openinslopes from about 15 to 20 m. Another area approximat22–24 m from the transducer mounting apparatus is aeasily accessible for mounting equipment such as calibratargets.
The sea well is within about 700 m of the Woods Hopassage. Because of its high-tidal-current velocities,41 strati-fication is at most weak. Because of the performance of swell calibrations over quite short ranges, effects of sustratification are negligible.
Interestingly, the tidal current at Iselin Dock is rectifieThe flood occurs with substantial current towards the soueast, typically of the order of 1.5 knots. During the ebhowever, the water level falls or settles with very slight avariable current. The tidal range is typically of order 0.8 mhas been possible to perform measurements during bothstates, with those made during the flood being less varia
The sea well was equipped with a variety of instrumeand gear for deploying and rotating sonar transducers andsuspending and controlling targets at known positions intransducer beam. Because of the wide range of uses osea well, all mountings were made in a provisional mannbut with drilled holes or markings for future reassemblythe facility.
A standard, 6-m-long shipping container was providor configured as a laboratory for the electronic instrumeand computers during each calibration trial. Mains powerboth 110 and 220 V at 60 Hz was supplied by cable. Tlaboratory was placed immediately beside the sea welloperational convenience, specifically to minimize the cadistance to the transducers and rotation apparatus and tcilitate communication among the various participants.
1. Transducer-mounting system
During calibration trials, a 6-m-long steel-trussed tpered antenna tower weighing 150 kg was affixed to a m
z byomputedalvalues
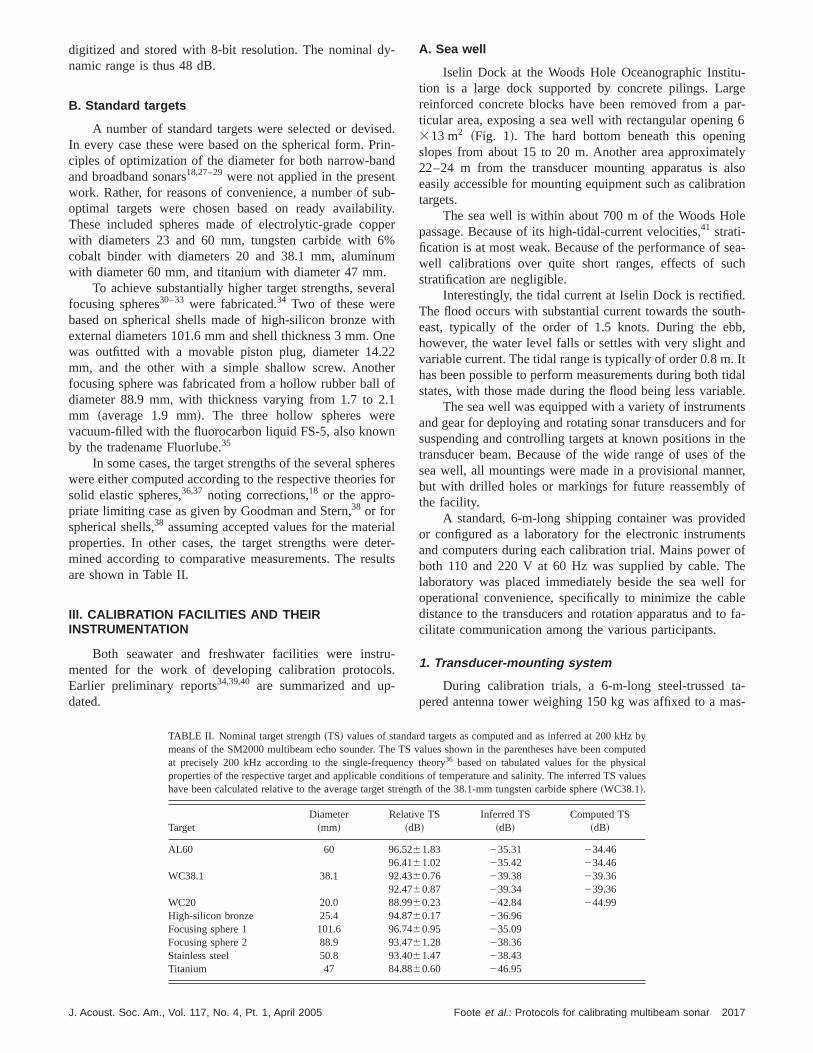
TABLE II. Nominal target strength~TS! values of standard targets as computed and as inferred at 200 kHmeans of the SM2000 multibeam echo sounder. The TS values shown in the parentheses have been cat precisely 200 kHz according to the single-frequency theory36 based on tabulated values for the physicproperties of the respective target and applicable conditions of temperature and salinity. The inferred TShave been calculated relative to the average target strength of the 38.1-mm tungsten carbide sphere~WC38.1!.
TargetDiameter
~mm!Relative TS
~dB!Inferred TS
~dB!Computed TS
~dB!
AL60 60 96.5261.83 235.31 234.4696.4161.02 235.42 234.46
WC38.1 38.1 92.4360.76 239.38 239.3692.4760.87 239.34 239.36
WC20 20.0 88.9960.23 242.84 244.99High-silicon bronze 25.4 94.8760.17 236.96Focusing sphere 1 101.6 96.7460.95 235.09Focusing sphere 2 88.9 93.4761.28 238.36Stainless steel 50.8 93.4061.47 238.43Titanium 47 84.8860.60 246.95
2017Foote et al.: Protocols for calibrating multibeam sonar
eicaenn
toTte
ng
dhns
oouivfe
unith
ne
ehoel
ysptnan
wadcso6
sutedoinbab
-migige
wthcmb
. I
hin
ialheeenthe
fors incur-
n-tedne
on-ry.1,
lineentedtly
to adedion,
ing-an
wellcksnalst
ver-n aele
er,
of
er-sh.e-da-ns-ntal
srailing
sive I-beam spanning the sea-well opening at the northwend. The tower was held securely in place by a mechanlock under gravity. The tower was strapped to the lower pof the I-beam mounting plate to resist the bending momcaused by the flooding tide when acting on the tower atransducer submerged at nominal 3-m depth.
An aluminum pipe is centrally mounted in the towerserve as a shaft for holding and rotating the transducer.shaft is guided by holes in the steel endplates and an inmediate plate added to reduce flexure. Low-friction beariare mounted at each hole.
The shaft is held by the rotation apparatus, describethe next section. A flange with six bolts is mounted on tlower end to serve as a universal coupling joint for the traducer plate.
Given significant differences in the shape and sizeeach of the multibeam sonar transducers, a separate ming plate was fabricated in aluminum to hold the respecttransducer in a secure manner. Longer mounting platesholding separate transmitting and receiving arrays were gerally braced with aluminum angle-brackets for stiffnessder flooding conditions. Examples of mounting plates wattached transducers are shown in Fig. 2.
In the case of separate transmitting and receiving traducer arrays, alignment of the several beams could befected by shimming one of the arrays relative to the othThis was done for the SM2000/90-kHz multibeam ecsounder to reduce effects of parallax given the relativshort range of the target.
2. Rotation apparatus
A commercial antenna motor made by M2-Antenna Stems, the MT1000 antenna azimuth positioner, was adato serve as a precision rotator. The apparatus was mouatop the central shaft of the tower, supporting both thrustradial loads.
In the course of adapting the rotator, the central gearreplaced by one made of marine bronze. The originalmotor was also replaced with an ac-motor with 14-bit ablute encoder and counter. The rotator can turn about a 3deg arc, thus achieving a nominal precision of60.01 deg,well within the design goal of60.05 deg.
The accuracy of the rotator was established by meaing the deflection of the beam of a laser pointer mounatop the central transducer-rotation shaft. Under commanrotations, the position of the center of the red laser spotthe bridge platform, for example, was determined to with65 mm at a nominal range of 11.7 m. This was found torepeatable over a period of days, hence with demonstraccuracy to within60.025 deg.
The alignment of the transducer at the end of the 6.5shaft with the rotator was confirmed by attaching an outrger to the rotator and dropping a plumb line from the outrger to a corresponding outrigger affixed to the shaft immdiately above the transducer plate, while the transducer towas held vertically by a mobile crane. The distance fromshaft centerline to the plumb bob centerline was 47.1Very small adjustments could be made to the alignmentexploiting the small degree of play in the flange coupling
2018 J. Acoust. Soc. Am., Vol. 117, No. 4, Pt. 1, April 2005
stalrttd
her-s
ine-
fnt-eorn--
s-f-
r.
y
-edtedd
s--0-
r-dedn
ele
---ere.yt
is estimated that the transducer could be aligned to wit60.5 mm over 4 m, or to within60.007 deg.
Rotator positions were sent in ASCII format via serlink, RS232, to the SM2000 and were recorded with tSM2000 raw data files. There was a five-ping delay betwthe actual rotator position and the ping that recordedposition.
3. Target-suspension and -positioning systems
A number of systems were procured or assembledsuspending standard targets and controlling their positionthe transducer beam. One system was adapted from thatrently used on board fisheries research vessels.19,20The targetwas held by each of three monofilament nylon lines conected to motorized fishing reels, with outriggers mounon barrier timbers, two on one side of the sea well and oon the opposite side. The position of the target was ctrolled by means of joysticks from the electronics laborato
In a second system, indicated schematically in Fig.the target was suspended by a central monofilamentspooled on a motorized fishing reel. A second monofilamnylon line was attached to the central line and threadthrough a block resting on the bottom of the sea well direcbelow the target to a second block. This was attachedsafety beam bordering the well, with lead weight suspenat the submerged end of the line to maintain constant tenswhatever the tidal state.
A third system was derived from the second by attachfour additional lines to the target.34 Each of these was tensioned by running the respective line through a block toattached weight. Each block was supported by the seabulkhead mounted along the long sides. The four blowere arranged at the corners of a square. This additiotensioning was obliquely upwards, offering stability againlateral, tidally induced currents.
The second system was most used in the trials. Thetical suspension line was run through a block mounted oplatform bridging the sea well to a motorized fishing re~Fig. 1!. A variable voltage motor was used to control thfishing reel. The line was run directly over a meter rulallowing depth adjustments to within60.5 mm. At a rangeof 11.7 m, this corresponds to an angular uncertainty60.003 deg.
B. Freshwater tank facility
The Chase Ocean Engineering Laboratory at the Univsity of New Hampshire~UNH! has a freshwater tank that inominally 12 by 18 m in plan view, with 6-m water deptModifications were made to this tank to facilitate the rquired acoustic measurements. These modifications funmentally concerned the placement and control of the traducer under test in the tank. There were three fundameissues to consider in achieving this goal:X-Y-Z transducer-positioning, rotation, and system integration.
1. X-Y-Z transducer-positioning system
The X-Y positioning in the plan view of the tank waaccomplished through the addition of an industrial crane-system spanning the 12-m width of the tank, and mov
Foote et al.: Protocols for calibrating multibeam sonar
-a
nth
ns
-ja
na
erediasaf tthll
a-uean-arcns.torcy
his
ft-lede-re-sig-
ive-theasro-
h acktor-as
o-tion.andar-
sur-nt.at
lin-theal
es,r to
agehout
bedofare
mf thele-m-
ibr
th
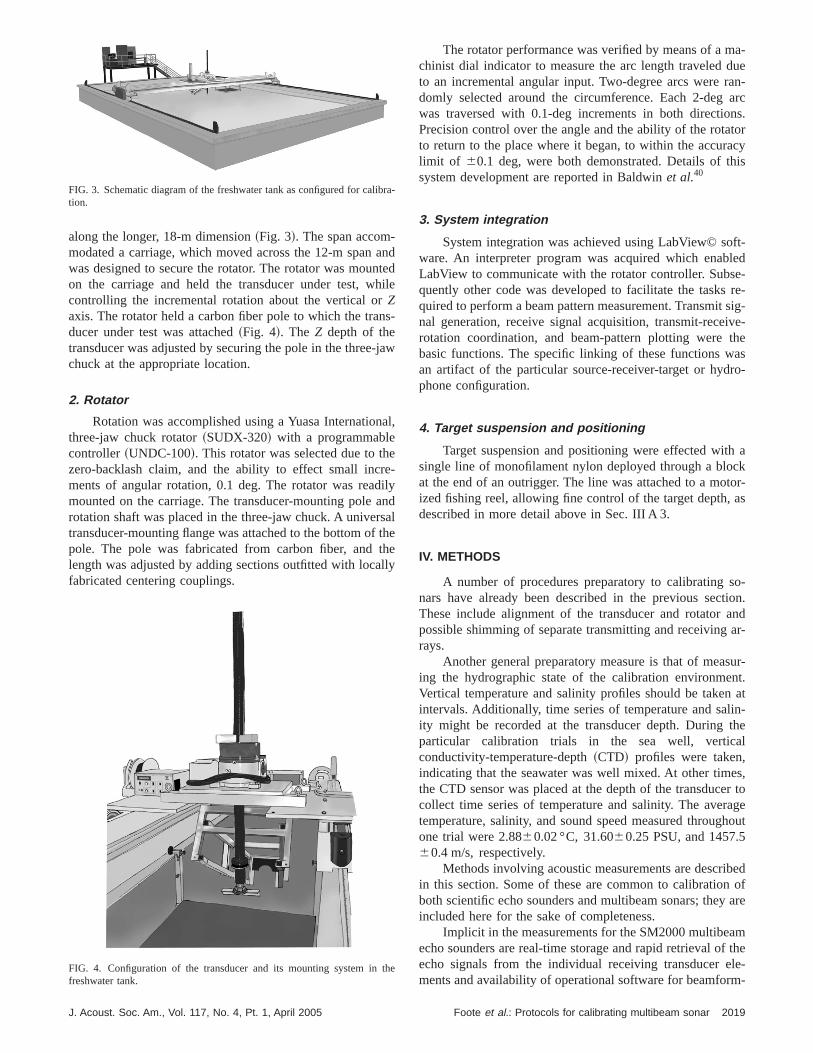
along the longer, 18-m dimension~Fig. 3!. The span accommodated a carriage, which moved across the 12-m spanwas designed to secure the rotator. The rotator was mouon the carriage and held the transducer under test, wcontrolling the incremental rotation about the vertical orZaxis. The rotator held a carbon fiber pole to which the traducer under test was attached~Fig. 4!. The Z depth of thetransducer was adjusted by securing the pole in the threechuck at the appropriate location.
2. Rotator
Rotation was accomplished using a Yuasa Internatiothree-jaw chuck rotator~SUDX-320! with a programmablecontroller~UNDC-100!. This rotator was selected due to thzero-backlash claim, and the ability to effect small incments of angular rotation, 0.1 deg. The rotator was reamounted on the carriage. The transducer-mounting polerotation shaft was placed in the three-jaw chuck. A univertransducer-mounting flange was attached to the bottom opole. The pole was fabricated from carbon fiber, andlength was adjusted by adding sections outfitted with locafabricated centering couplings.
FIG. 3. Schematic diagram of the freshwater tank as configured for caltion.
FIG. 4. Configuration of the transducer and its mounting system infreshwater tank.
J. Acoust. Soc. Am., Vol. 117, No. 4, Pt. 1, April 2005
ndedile
-
w
l,
-lyndl
heey
The rotator performance was verified by means of a mchinist dial indicator to measure the arc length traveled dto an incremental angular input. Two-degree arcs were rdomly selected around the circumference. Each 2-degwas traversed with 0.1-deg increments in both directioPrecision control over the angle and the ability of the rotato return to the place where it began, to within the accuralimit of 60.1 deg, were both demonstrated. Details of tsystem development are reported in Baldwinet al.40
3. System integration
System integration was achieved using LabView© soware. An interpreter program was acquired which enabLabView to communicate with the rotator controller. Subsquently other code was developed to facilitate the tasksquired to perform a beam pattern measurement. Transmitnal generation, receive signal acquisition, transmit-recerotation coordination, and beam-pattern plotting werebasic functions. The specific linking of these functions wan artifact of the particular source-receiver-target or hydphone configuration.
4. Target suspension and positioning
Target suspension and positioning were effected witsingle line of monofilament nylon deployed through a bloat the end of an outrigger. The line was attached to a moized fishing reel, allowing fine control of the target depth,described in more detail above in Sec. III A 3.
IV. METHODS
A number of procedures preparatory to calibrating snars have already been described in the previous secThese include alignment of the transducer and rotatorpossible shimming of separate transmitting and receivingrays.
Another general preparatory measure is that of meaing the hydrographic state of the calibration environmeVertical temperature and salinity profiles should be takenintervals. Additionally, time series of temperature and saity might be recorded at the transducer depth. Duringparticular calibration trials in the sea well, verticconductivity-temperature-depth~CTD! profiles were taken,indicating that the seawater was well mixed. At other timthe CTD sensor was placed at the depth of the transducecollect time series of temperature and salinity. The avertemperature, salinity, and sound speed measured througone trial were 2.8860.02 °C, 31.6060.25 PSU, and 1457.560.4 m/s, respectively.
Methods involving acoustic measurements are descriin this section. Some of these are common to calibrationboth scientific echo sounders and multibeam sonars; theyincluded here for the sake of completeness.
Implicit in the measurements for the SM2000 multibeaecho sounders are real-time storage and rapid retrieval oecho signals from the individual receiving transducer ements and availability of operational software for beamfor
a-
e
2019Foote et al.: Protocols for calibrating multibeam sonar
in
rbonb
tioa
sits
oft tin
umll
ure
bya
nre
anc
th7-2
r
uins
init
na
ina
tat
idd
al
blp
ofeld
bythetlyard
tion.hoas
ho-sionthe
zex-ned
inalledndrec-nits.ist-ctive
echoaxi-
ing. Algorithms for beamforming have been describedsome detail for multibeam sonar.21,22 These follow the gen-eral method.17,42
A. Target positioning and mapping central polarbeam pattern
A standard target can be placed at an essentially atrary position in the sonar beam by purely geometrical csiderations. Not all positions are equally favorable, it mustemphasized. It is generally desirable to avoid reverberafrom surfaces and possible extraneous scatterers in the wcolumn, e.g., fish and underwater moorings. It is also deable, if not absolutely necessary, to make measurementhe transducer farfield.
In practice it is easier to perform relative positioningthe target in the transducer beam by placing the target aapproximate depth of the centered transducer, then findthe coincident horizontal and equatorial planes of maximsensitivity by moving the standard target systematicathrough a series of depths and making multiple measments at each target depth. Beamforming is then performand the resulting data are fit in a least-squares sensequadratic or other nonlinear function. The beamformed ddescribe the central polar beam pattern.
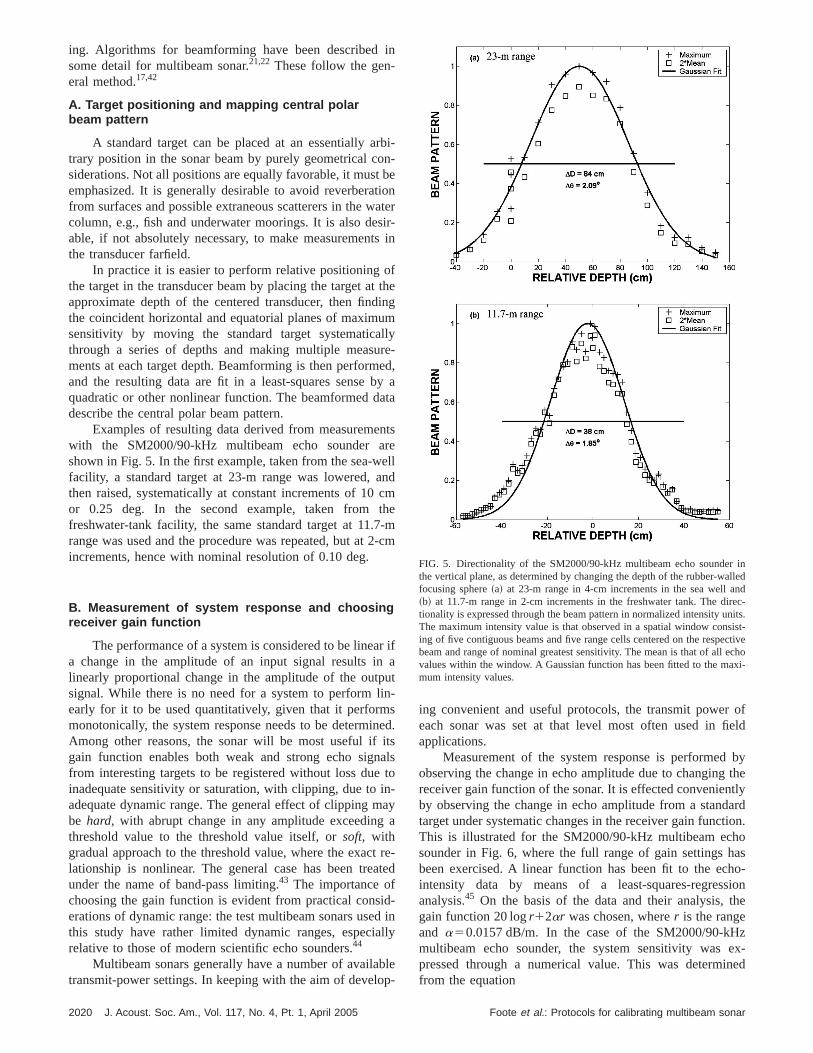
Examples of resulting data derived from measuremewith the SM2000/90-kHz multibeam echo sounder ashown in Fig. 5. In the first example, taken from the sea-wfacility, a standard target at 23-m range was lowered,then raised, systematically at constant increments of 10or 0.25 deg. In the second example, taken fromfreshwater-tank facility, the same standard target at 11.range was used and the procedure was repeated, but atincrements, hence with nominal resolution of 0.10 deg.
B. Measurement of system response and choosingreceiver gain function
The performance of a system is considered to be lineaa change in the amplitude of an input signal results inlinearly proportional change in the amplitude of the outpsignal. While there is no need for a system to perform learly for it to be used quantitatively, given that it performmonotonically, the system response needs to be determAmong other reasons, the sonar will be most useful ifgain function enables both weak and strong echo sigfrom interesting targets to be registered without loss dueinadequate sensitivity or saturation, with clipping, due toadequate dynamic range. The general effect of clipping mbe hard, with abrupt change in any amplitude exceedingthreshold value to the threshold value itself, orsoft, withgradual approach to the threshold value, where the exaclationship is nonlinear. The general case has been treunder the name of band-pass limiting.43 The importance ofchoosing the gain function is evident from practical conserations of dynamic range: the test multibeam sonars usethis study have rather limited dynamic ranges, especirelative to those of modern scientific echo sounders.44
Multibeam sonars generally have a number of availatransmit-power settings. In keeping with the aim of develo
2020 J. Acoust. Soc. Am., Vol. 117, No. 4, Pt. 1, April 2005
i--enterr-in
heg
ye-d,
ata
tselldmem-cm
ifat-
ed.sls
to-y
a
re-ed
-in
ly
e-
ing convenient and useful protocols, the transmit powereach sonar was set at that level most often used in fiapplications.
Measurement of the system response is performedobserving the change in echo amplitude due to changingreceiver gain function of the sonar. It is effected convenienby observing the change in echo amplitude from a standtarget under systematic changes in the receiver gain funcThis is illustrated for the SM2000/90-kHz multibeam ecsounder in Fig. 6, where the full range of gain settings hbeen exercised. A linear function has been fit to the ecintensity data by means of a least-squares-regresanalysis.45 On the basis of the data and their analysis,gain function 20 logr12ar was chosen, wherer is the rangeand a50.0157 dB/m. In the case of the SM2000/90-kHmultibeam echo sounder, the system sensitivity waspressed through a numerical value. This was determifrom the equation
FIG. 5. Directionality of the SM2000/90-kHz multibeam echo sounderthe vertical plane, as determined by changing the depth of the rubber-wfocusing sphere~a! at 23-m range in 4-cm increments in the sea well a~b! at 11.7-m range in 2-cm increments in the freshwater tank. The ditionality is expressed through the beam pattern in normalized intensity uThe maximum intensity value is that observed in a spatial window consing of five contiguous beams and five range cells centered on the respebeam and range of nominal greatest sensitivity. The mean is that of allvalues within the window. A Gaussian function has been fitted to the mmum intensity values.
Foote et al.: Protocols for calibrating multibeam sonar
0
redinaa
-
thcsbc
s.
ora
frelyd
rdamloyo
repde8.
nec-ho
de-thee
ermsde-, theele-thisg a
ity-
er-selyThisthe
ting
lara
nalr
mi-hem-
di-at-
ardeatpti
ea-ulti-
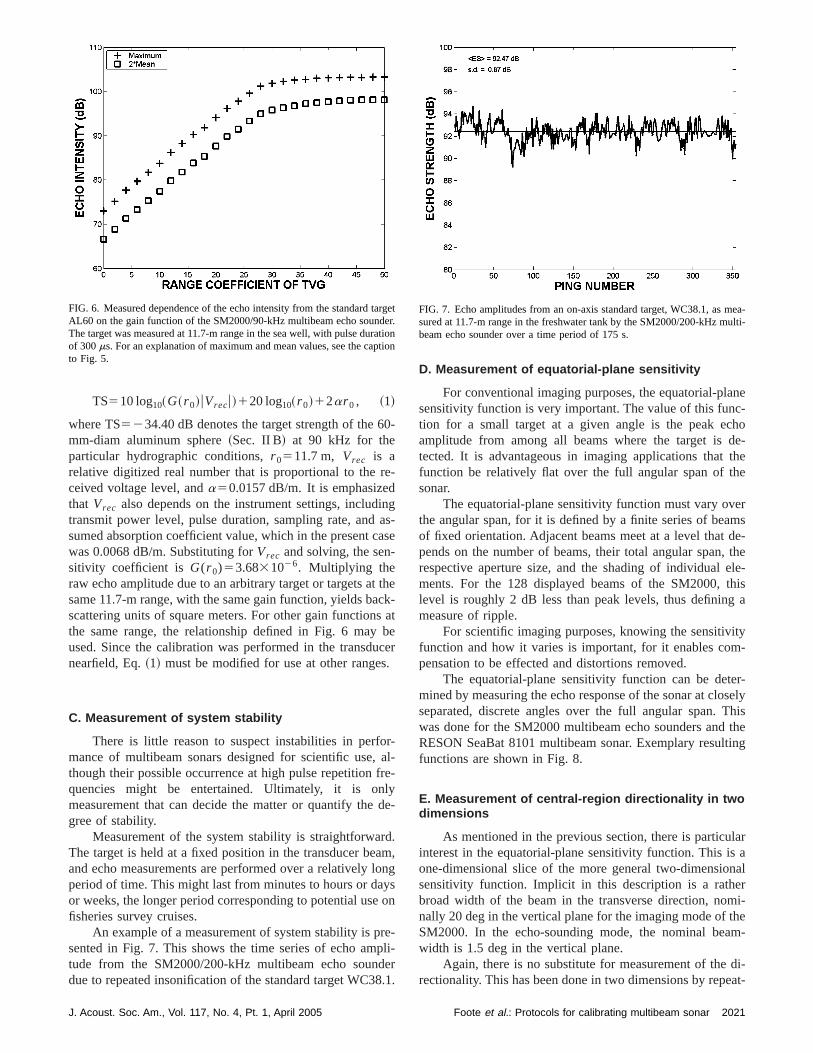
TS510 log10~G~r 0!uVrecu!120 log10~r 0!12ar 0 , ~1!
where TS5234.40 dB denotes the target strength of the 6mm-diam aluminum sphere~Sec. II B! at 90 kHz for theparticular hydrographic conditions,r 0511.7 m, Vrec is arelative digitized real number that is proportional to theceived voltage level, anda50.0157 dB/m. It is emphasizethat Vrec also depends on the instrument settings, includtransmit power level, pulse duration, sampling rate, andsumed absorption coefficient value, which in the present cwas 0.0068 dB/m. Substituting forVrec and solving, the sensitivity coefficient is G(r 0)53.6831026. Multiplying theraw echo amplitude due to an arbitrary target or targets atsame 11.7-m range, with the same gain function, yields bascattering units of square meters. For other gain functionthe same range, the relationship defined in Fig. 6 mayused. Since the calibration was performed in the transdunearfield, Eq.~1! must be modified for use at other range
C. Measurement of system stability
There is little reason to suspect instabilities in perfmance of multibeam sonars designed for scientific use,though their possible occurrence at high pulse repetitionquencies might be entertained. Ultimately, it is onmeasurement that can decide the matter or quantify thegree of stability.
Measurement of the system stability is straightforwaThe target is held at a fixed position in the transducer beand echo measurements are performed over a relativelyperiod of time. This might last from minutes to hours or daor weeks, the longer period corresponding to potential usefisheries survey cruises.
An example of a measurement of system stability is psented in Fig. 7. This shows the time series of echo amtude from the SM2000/200-kHz multibeam echo soundue to repeated insonification of the standard target WC3
FIG. 6. Measured dependence of the echo intensity from the standard tAL60 on the gain function of the SM2000/90-kHz multibeam echo sounThe target was measured at 11.7-m range in the sea well, with pulse durof 300ms. For an explanation of maximum and mean values, see the cato Fig. 5.
J. Acoust. Soc. Am., Vol. 117, No. 4, Pt. 1, April 2005
-
-
gs-se
ek-ateer
-l--
e-
.,
ngsn
-li-r1.
D. Measurement of equatorial-plane sensitivity
For conventional imaging purposes, the equatorial-plasensitivity function is very important. The value of this funtion for a small target at a given angle is the peak ecamplitude from among all beams where the target istected. It is advantageous in imaging applications thatfunction be relatively flat over the full angular span of thsonar.
The equatorial-plane sensitivity function must vary ovthe angular span, for it is defined by a finite series of beaof fixed orientation. Adjacent beams meet at a level thatpends on the number of beams, their total angular spanrespective aperture size, and the shading of individualments. For the 128 displayed beams of the SM2000,level is roughly 2 dB less than peak levels, thus defininmeasure of ripple.
For scientific imaging purposes, knowing the sensitivfunction and how it varies is important, for it enables compensation to be effected and distortions removed.
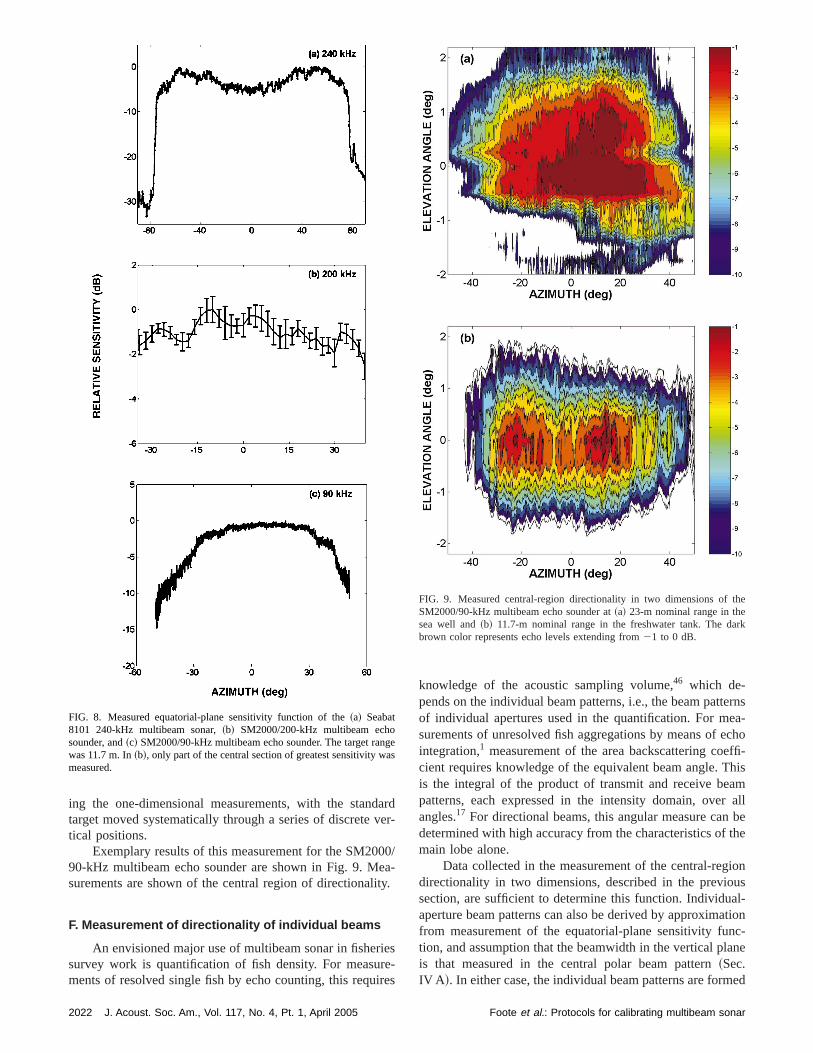
The equatorial-plane sensitivity function can be detmined by measuring the echo response of the sonar at closeparated, discrete angles over the full angular span.was done for the SM2000 multibeam echo sounders andRESON SeaBat 8101 multibeam sonar. Exemplary resulfunctions are shown in Fig. 8.
E. Measurement of central-region directionality in twodimensions
As mentioned in the previous section, there is particuinterest in the equatorial-plane sensitivity function. This isone-dimensional slice of the more general two-dimensiosensitivity function. Implicit in this description is a rathebroad width of the beam in the transverse direction, nonally 20 deg in the vertical plane for the imaging mode of tSM2000. In the echo-sounding mode, the nominal beawidth is 1.5 deg in the vertical plane.
Again, there is no substitute for measurement of therectionality. This has been done in two dimensions by repe
getr.ionon
FIG. 7. Echo amplitudes from an on-axis standard target, WC38.1, as msured at 11.7-m range in the freshwater tank by the SM2000/200-kHz mbeam echo sounder over a time period of 175 s.
2021Foote et al.: Protocols for calibrating multibeam sonar
ave
00eaty
iereire
ernsa-choffi-his
amallbe
the
ionusal-tion
nc-ne
ed
the
rk
ngas
ing the one-dimensional measurements, with the standtarget moved systematically through a series of discretetical positions.
Exemplary results of this measurement for the SM2090-kHz multibeam echo sounder are shown in Fig. 9. Msurements are shown of the central region of directionali
F. Measurement of directionality of individual beams
An envisioned major use of multibeam sonar in fishersurvey work is quantification of fish density. For measuments of resolved single fish by echo counting, this requ
FIG. 8. Measured equatorial-plane sensitivity function of the~a! Seabat8101 240-kHz multibeam sonar,~b! SM2000/200-kHz multibeam echosounder, and~c! SM2000/90-kHz multibeam echo sounder. The target rawas 11.7 m. In~b!, only part of the central section of greatest sensitivity wmeasured.
2022 J. Acoust. Soc. Am., Vol. 117, No. 4, Pt. 1, April 2005
rdr-
/-
.
s-s
knowledge of the acoustic sampling volume,46 which de-pends on the individual beam patterns, i.e., the beam pattof individual apertures used in the quantification. For mesurements of unresolved fish aggregations by means of eintegration,1 measurement of the area backscattering coecient requires knowledge of the equivalent beam angle. Tis the integral of the product of transmit and receive bepatterns, each expressed in the intensity domain, overangles.17 For directional beams, this angular measure candetermined with high accuracy from the characteristics ofmain lobe alone.
Data collected in the measurement of the central-regdirectionality in two dimensions, described in the previosection, are sufficient to determine this function. Individuaperture beam patterns can also be derived by approximafrom measurement of the equatorial-plane sensitivity fution, and assumption that the beamwidth in the vertical plais that measured in the central polar beam pattern~Sec.IV A !. In either case, the individual beam patterns are form
FIG. 9. Measured central-region directionality in two dimensions ofSM2000/90-kHz multibeam echo sounder at~a! 23-m nominal range in thesea well and~b! 11.7-m nominal range in the freshwater tank. The dabrown color represents echo levels extending from21 to 0 dB.
e
Foote et al.: Protocols for calibrating multibeam sonar
o
. 1eud.7-rra
eameldicle
thethe
ail-be
rans-f thecess-
altheoutcentsthee
bilitylosethe
ure-er-rebe
oe
ale
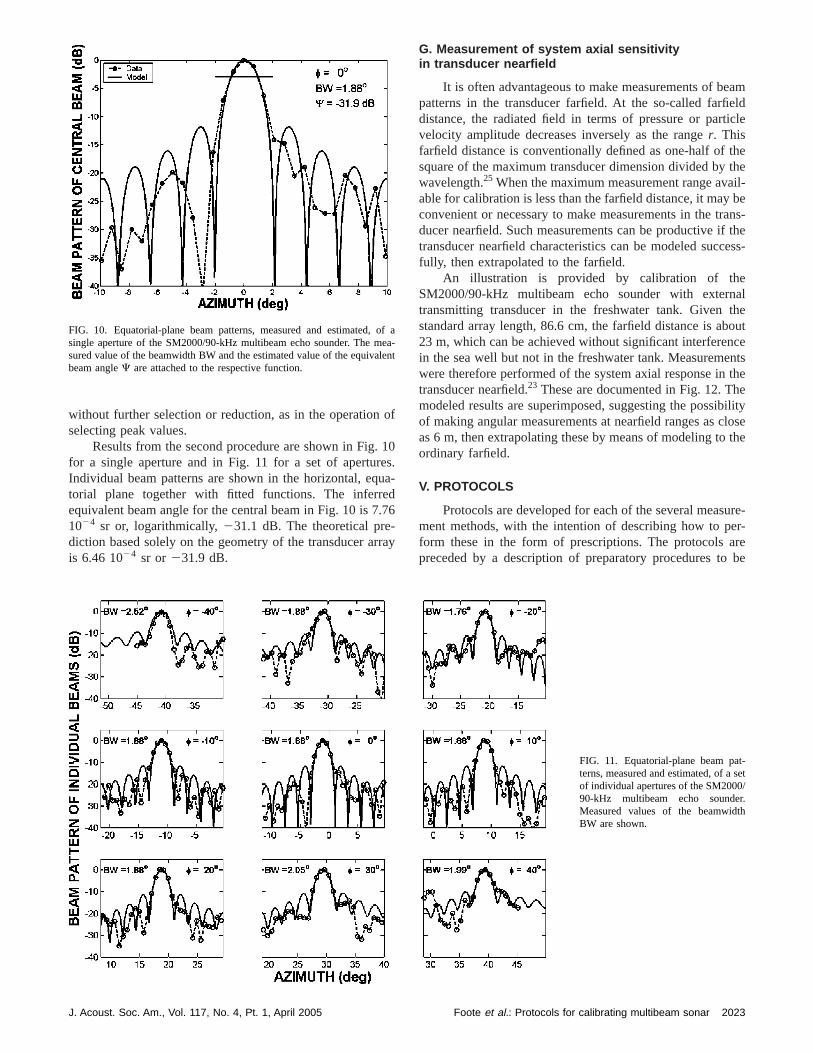
without further selection or reduction, as in the operationselecting peak values.
Results from the second procedure are shown in Figfor a single aperture and in Fig. 11 for a set of aperturIndividual beam patterns are shown in the horizontal, eqtorial plane together with fitted functions. The inferreequivalent beam angle for the central beam in Fig. 10 is 71024 sr or, logarithmically,231.1 dB. The theoretical prediction based solely on the geometry of the transducer ais 6.46 1024 sr or 231.9 dB.
FIG. 10. Equatorial-plane beam patterns, measured and estimated,single aperture of the SM2000/90-kHz multibeam echo sounder. The msured value of the beamwidth BW and the estimated value of the equivbeam angleC are attached to the respective function.
J. Acoust. Soc. Am., Vol. 117, No. 4, Pt. 1, April 2005
f
0s.a-
6
y
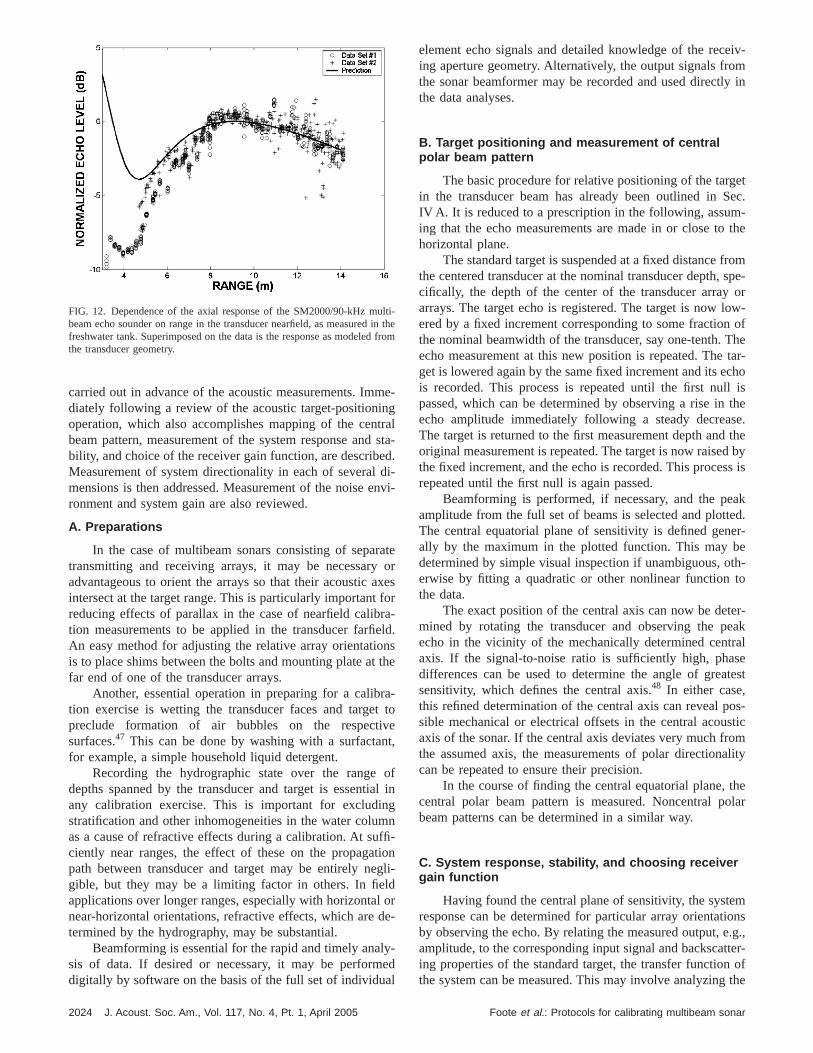
G. Measurement of system axial sensitivityin transducer nearfield
It is often advantageous to make measurements of bpatterns in the transducer farfield. At the so-called farfidistance, the radiated field in terms of pressure or partvelocity amplitude decreases inversely as the ranger. Thisfarfield distance is conventionally defined as one-half ofsquare of the maximum transducer dimension divided bywavelength.25 When the maximum measurement range avable for calibration is less than the farfield distance, it mayconvenient or necessary to make measurements in the tducer nearfield. Such measurements can be productive itransducer nearfield characteristics can be modeled sucfully, then extrapolated to the farfield.
An illustration is provided by calibration of theSM2000/90-kHz multibeam echo sounder with externtransmitting transducer in the freshwater tank. Givenstandard array length, 86.6 cm, the farfield distance is ab23 m, which can be achieved without significant interferenin the sea well but not in the freshwater tank. Measuremewere therefore performed of the system axial response intransducer nearfield.23 These are documented in Fig. 12. Thmodeled results are superimposed, suggesting the possiof making angular measurements at nearfield ranges as cas 6 m, then extrapolating these by means of modeling toordinary farfield.
V. PROTOCOLS
Protocols are developed for each of the several measment methods, with the intention of describing how to pform these in the form of prescriptions. The protocols apreceded by a description of preparatory procedures to
f aa-nt
t-et
/r.h
FIG. 11. Equatorial-plane beam paterns, measured and estimated, of a sof individual apertures of the SM200090-kHz multibeam echo soundeMeasured values of the beamwidtBW are shown.
2023Foote et al.: Protocols for calibrating multibeam sonar
mgtr
dedd
en
ra
axforaeln
t t
rativent
oiangmffitiog
ldl ode
lye
al
eiv-m
ly in
etec.-the
fromspe-or
ow-of
Thetar-chol isthe
se.the
d byss is
aked.er-eth-to
ter-eakralsetest
os-sticomality
theolar
mions.g.,
tter-ofthe
ulinf
carried out in advance of the acoustic measurements. Imdiately following a review of the acoustic target-positioninoperation, which also accomplishes mapping of the cenbeam pattern, measurement of the system response anbility, and choice of the receiver gain function, are describMeasurement of system directionality in each of severalmensions is then addressed. Measurement of the noiseronment and system gain are also reviewed.
A. Preparations
In the case of multibeam sonars consisting of sepatransmitting and receiving arrays, it may be necessaryadvantageous to orient the arrays so that their acousticintersect at the target range. This is particularly importantreducing effects of parallax in the case of nearfield calibtion measurements to be applied in the transducer farfiAn easy method for adjusting the relative array orientatiois to place shims between the bolts and mounting plate afar end of one of the transducer arrays.
Another, essential operation in preparing for a calibtion exercise is wetting the transducer faces and targepreclude formation of air bubbles on the respectsurfaces.47 This can be done by washing with a surfactafor example, a simple household liquid detergent.
Recording the hydrographic state over the rangedepths spanned by the transducer and target is essentany calibration exercise. This is important for excludistratification and other inhomogeneities in the water coluas a cause of refractive effects during a calibration. At suciently near ranges, the effect of these on the propagapath between transducer and target may be entirely negible, but they may be a limiting factor in others. In fieapplications over longer ranges, especially with horizontanear-horizontal orientations, refractive effects, which aretermined by the hydrography, may be substantial.
Beamforming is essential for the rapid and timely anasis of data. If desired or necessary, it may be performdigitally by software on the basis of the full set of individu
FIG. 12. Dependence of the axial response of the SM2000/90-kHz mbeam echo sounder on range in the transducer nearfield, as measuredfreshwater tank. Superimposed on the data is the response as modeledthe transducer geometry.
2024 J. Acoust. Soc. Am., Vol. 117, No. 4, Pt. 1, April 2005
e-
alsta-.
i-vi-
teoresr-d.she
-to
,
fl in
n-nli-
r-
-d
element echo signals and detailed knowledge of the recing aperture geometry. Alternatively, the output signals frothe sonar beamformer may be recorded and used directthe data analyses.
B. Target positioning and measurement of centralpolar beam pattern
The basic procedure for relative positioning of the targin the transducer beam has already been outlined in SIV A. It is reduced to a prescription in the following, assuming that the echo measurements are made in or close tohorizontal plane.
The standard target is suspended at a fixed distancethe centered transducer at the nominal transducer depth,cifically, the depth of the center of the transducer arrayarrays. The target echo is registered. The target is now lered by a fixed increment corresponding to some fractionthe nominal beamwidth of the transducer, say one-tenth.echo measurement at this new position is repeated. Theget is lowered again by the same fixed increment and its eis recorded. This process is repeated until the first nulpassed, which can be determined by observing a rise inecho amplitude immediately following a steady decreaThe target is returned to the first measurement depth andoriginal measurement is repeated. The target is now raisethe fixed increment, and the echo is recorded. This procerepeated until the first null is again passed.
Beamforming is performed, if necessary, and the peamplitude from the full set of beams is selected and plottThe central equatorial plane of sensitivity is defined genally by the maximum in the plotted function. This may bdetermined by simple visual inspection if unambiguous, oerwise by fitting a quadratic or other nonlinear functionthe data.
The exact position of the central axis can now be demined by rotating the transducer and observing the pecho in the vicinity of the mechanically determined centaxis. If the signal-to-noise ratio is sufficiently high, phadifferences can be used to determine the angle of greasensitivity, which defines the central axis.48 In either case,this refined determination of the central axis can reveal psible mechanical or electrical offsets in the central acouaxis of the sonar. If the central axis deviates very much frthe assumed axis, the measurements of polar directioncan be repeated to ensure their precision.
In the course of finding the central equatorial plane,central polar beam pattern is measured. Noncentral pbeam patterns can be determined in a similar way.
C. System response, stability, and choosing receivergain function
Having found the central plane of sensitivity, the systeresponse can be determined for particular array orientatby observing the echo. By relating the measured output, eamplitude, to the corresponding input signal and backscaing properties of the standard target, the transfer functionthe system can be measured. This may involve analyzing
ti-the
rom
Foote et al.: Protocols for calibrating multibeam sonar
nc
uchifie
o
veeonnctede
obt
thdepas
virg
thththsoByrep
inthm
amietibba
tht
heo
us
ions.cer-
om-t fre-eslateded
n-entsthe
ede-oes
singvel
entsnd
ingffi-
ght
atee-veryre-me-
alschpli-ofated
-ore
er.ayf aed
onownde-nic
re,arlyn besednal-
frequency content of the transmitted signal and frequedependence of the target backscattering cross section.
By repeating the measurements for the same transdorientation and target position over a period of time, tstability of the system can be gauged. This can be quantby a conventional time-series analysis, with observationpossible changes in the mean and variance over time.
By repeating the measurements with different receigain functions, the dependence of the system responsthis function can be determined. By fitting a linear functito the echo intensity data, a suitable time-varied-gain fution for the measurements can be determined. The sysperformance at the selected gain function can be relateother gain functions by means of the repeated measuremof system response.
D. Equatorial-plane sensitivity
Given knowledge of the location of the central planesensitivity, the equatorial-plane sensitivity function candetermined by rotating the transducer array or arrays overangular span of interest. At each individual orientation,several beam outputs are examined and the peak amplituselected. This process is repeated over the full angular sThe function defined by the peak output versus angle contutes the equatorial-plane sensitivity.
E. Central-region directionality in two dimensions
The measurements of the equatorial-plane sensitifunction are now repeated at each of a succession of tadepths. As in the target-positioning operation~Sec. V B!, thetarget is moved systematically from the central plane pastfirst null below the plane, then from the central plane pastfirst null above the plane. Knowing the full target deprange spanning the main lobe, the measurements can alperformed in a single direction from one null to the other.measuring the sensitivity function at each of these disctarget depths, the central-region directionality can be mapin two dimensions.
F. Directionality of individual beams
The directionality of individual beams is measuredthe central plane of sensitivity, as in Sec. V D, and overcentral region of sensitivity, as in Sec. V E. The basic beaformed outputs are identical. Instead of selecting peakplitudes from the range of beams for each transducer ortation, the amplitudes are associated with the respecindividual beam. The individual beam patterns can thusmapped. Individual beams are conveniently identifiedtheir order in the series or by their nominal angle of pesensitivity.
G. Nearfield response along acoustic axis
In cases where the multibeam sonar is to be used intransducer nearfield or where the sonar is to be used infarfield but can only be calibrated in the nearfield, tnearfield response should be measured. This is done by ming either the transducer or standard target along the aco
J. Acoust. Soc. Am., Vol. 117, No. 4, Pt. 1, April 2005
y
eredf
ron
-mtonts
fehee
isn.
ti-
tyet
ee
be
teed
e--
n-veeyk
ehe
v-tic
axis and measuring the echo response at discrete positThe beamformed results are plotted against the transdutarget range.
The measurements are used for comparison against cputations based on the transducer geometry and transmiquency. Confirmation of the computational results providsupport for the model, which can then be used to extrapoeither to greater or lesser ranges, depending on the intensonar application.
H. Noise measurements
In all of the foregoing protocols, the echo from a stadard target was generally measured. These measuremshould be accompanied by similar measurements made inabsence of the target, hence of volume reverberation.
The reverberation measurements might be performconveniently immediately before or immediately after a sries of measurements with a standard target. While echfrom transient targets such as schools of juvenile fish pasthrough the sea well might not be recorded, the general leof background reverberation would be. Such measuremare important for describing the reverberation backgrouand for quantifying the signal-to-noise ratio present durthe target measurements. If the reverberation level is suciently high, another target with greater target strength mibe chosen to ensure a better signal-to-noise ratio.
I. Electronic measurements
While purely electronic measurements are inadequfor determining the overall transmit-receive sensitivity, bcause of neglect of the transducer, they are nonethelessuseful for determining how signals are transferred in theceiver. The basis of the measurements is that of the tiamplitude-frequency measurement method.49
The transducer is decoupled from the receiver. Signof known amplitude and time delay are introduced into eachannel, and the output is observed over a range of amtudes sufficient to test the dynamic range and applicationgain to each signal. The measurement sequence is repefor each transducer element.
A complication with this simple notion is that of multiplexing of the individual transducer element signals beftransmission to the beamforming processor, i.e., beamformIntroduction of a signal of known amplitude and time delis thus made to a multiplexer, with reception at the end ocable. A special manufacturer-built unit can be entertainfor measurement of the overall receiver sensitivity functiwith decoupled transducer. Such a capability would allmeasurement of the electronic system to be undertaken ipendently of that of the combined acoustic and electrosystem.
VI. DISCUSSION
By means of the calibration protocols described hewhich have been developed through actual testing in neevery instance, the performance of multibeam sonars cadefined. The general system sensitivity can be expresthrough transfer characteristics and measures of directio
2025Foote et al.: Protocols for calibrating multibeam sonar
n
eehadnutingaerg
mti
ngententhresaly
os,aatuuflo
pol
araso
a
the
le,srenee
inreth
msetidith
lopar.theea-fieddedbleiver
ey,no-i-yofrry,en
on,00/rlyep-
ofell
linm,andK.ea-e interript.ard.nd
no-
y
y,
eJ.
eonar:vior6
n. J.
nnse-.
n-
ity. In addition, the stability can be quantified, and the conection between nearfield and farfield characteristics canestablished.
The standard-target calibration method, which has bextended to multibeam sonar, is useful for its absolute cacter. Multibeam sonars calibrated in this way can be usequantitative applications, for example, to estimate themerical density of fish aggregations through echo-counor echo-integration techniques. Visualization of fish aggretions by multibeam sonar, which is more often accomplishby uncalibrated systems, also benefits from a standard-tacalibration, for variations in angular sensitivity can be copensated, giving a more accurate impression of the relaconcentration densities.
Another practical advantage of calibration is makipossible intercomparability of measurements with differmultibeam sonars. Whether the several systems operathe same or different frequencies, the measurements caperformed in an absolute sense. Given knowledge ofbackscattering properties of the target, including the fquency dependence of target strength, if necessary theeral acoustic measurements can be converted to biologicother physical measures of density, opening the possibilitdirect comparison.
While the present work is directed to the calibrationmultibeam sonars used for water-column measurementcan also be applied to bathymetric multibeam sonars. Indition to measuring the range to the seafloor over a swthe backscattering properties of the same can be measand expressed in absolute units of surface scattering. Smeasurements are essential for characterizing the seaand detecting changes in this, for example, to observesible changes to the seafloor over time, as due to naturaman-made disturbances.
By quantifying the performance of multibeam sonconformity of manufactured units to their specifications cbe confirmed. In addition, the performances of differentnars can be compared.
A number of outstanding problems in multibeam soncalibration are identified. One is to generalize Eq.~1! to ar-bitrary operating conditions and ranges spanningnearfield–farfield transition region of the sonar transducAnother is to identify the causes of variability, for exampthose encountered in measurements of system stabilityready noted in Sec. IV C and observed in Fig. 8, as well aRef. 50. A third problem is to realize the electronic measuments described in Sec. V I in a rapid, automated manThis could be done through a computer-controlled timamplitude-frequency device. Another problem is extendthe calibration protocols to multibeam sonars as configufor use, for example, as mounted within a sonar dome onhull of a research vessel or on a fixed structure.
It is appreciated that rigorous calibration of multibeasonars as configured for use may be difficult. In such caconfirmation of the performance rather than measurementhe performance can be entertained. The problem of valtion is thus identified. Derivative procedures, possibly wrelaxed tolerances, could be very useful.
2026 J. Acoust. Soc. Am., Vol. 117, No. 4, Pt. 1, April 2005
-be
nr-in-g-
det
-ve
tatbee-ev-or
of
fit
d-h,redchors-or
,n-
r
er.,al-in-r.-gde
s,ofa-
VII. SUMMARY
The goal of the project documented here was to deveconvenient protocols for the calibration of multibeam sonThe protocols that have been developed, based onstandard-target method, will enable absolute physical msurements to be made with the sonar. Addressing identioutstanding issues will enable the protocols to be extenefficiently to sonars as configured for use. It will also enathe overall accuracy of echo signal processing in the receto be quantified.
ACKNOWLEDGMENTS
The following are thanked for their participation in onor more of the calibration trials: B. Doherty, K. W. DohertS. P. Liberatore, and M. Parmenter, Woods Hole Oceagraphic Institution; P. Lavoie, A. McLeod, and J. Millar, Unversity of New Hampshire; Y. Li, formerly at the Universitof New Brunswick, Canada; G. D. Melvin, DepartmentFish and Oceans, Canada; W. Michaels and D. A. PeNortheast Fisheries Science Center, Woods Hole. A. Bowand D. R. Yoerger, Woods Hole Oceanographic Institutiare thanked for allowing their 6000-m-depth-rated SM20200-kHz multibeam imaging sonar to be used in an eatrial. Several multibeam sonar manufacturers and their rresentatives are thanked for lending or arranging loanssonars for use in developing the calibration protocols, as was for participating in various trials. These include R. Aspand C. Smith, Kongsberg Simrad Mesotech, Port CoquitlaB.C., Canada; J. Condiotty, Simrad, Inc.; and S. JohnsonR. Morton, RESON, Inc. L. Bjørnø, J. Steensrup, and P.Eriksen are thanked for providing data on the RESON SBat 8101 sonar array. J. Doucette is thanked for assistancpreparing figures; S. Barkley, A. Norton, and M. Parmenare thanked for assistance in assembling the manuscSupport by the National Science Foundation through AwNo. OCE-0002664, NOAA through Grant NoNA97OG0241, and the Cooperative Institute for Climate aOcean Research~CICOR! through NOAA Contract No.NA17RJ1223 is acknowledged. This is Woods Hole Oceagraphic Institution Contribution No. 11178.
1H. Medwin and C. S. Clay,Fundamentals of Acoustical Oceanograph~Academic, Boston, 1998!.
2R. B. Mitson, Fisheries Sonar~Fishing News Books, Farnham, SurreEngland, 1983!.
3O. A. Misund and A. Aglen, ‘‘Swimming behavior of fish schools in thNorth Sea during acoustic surveying and pelagic trawl sampling,’’ ICESMar. Sci.49, 325–334~1992!.
4F. Gerlotto, P. Fre´on, M. Soria, P. H. Cottais, and L. Ronzier, ‘‘Exhaustivobservations of the 3D schools structure using multibeam sidescan spotential use for school classification, biomass estimation, and behastudies,’’ Council Meeting of the Int. Council Explor. Sea 1994/B:2~1994!.
5F. Gerlotto, M. Soria, and P. Fre´on, ‘‘From two dimensions to three: theuse of multibeam sonar for a new approach in fisheries acoustics,’’ CaFish. Aquat. Sci.56, 6–12~1999!.
6M. Soria, P. Fre´on, and F. Gerlotto, ‘‘Analysis of vessel influence ospatial behaviour of fish schools using a multi-beam sonar and coquences for biomass estimates by echo-sounder,’’ ICES J. Mar. Sci53,453–458~1996!.
7O. A. Misund, ‘‘Dynamics of moving masses: variability in packing de
Foote et al.: Protocols for calibrating multibeam sonar

S
ioys
s.
s
ndus
re
tesb
so
a-
alh
anm
y-
er
.a
ampp
dE
.ing
b
in
te
K.
re-Inst.
forust.
,’’
.ts,’’
d
,’’
op-ns
etEE
,’’ J.
J.
by
ngEE
r099
J.
c.
ts,’’
.,’’
icke-
ch,c.
sity, shape, and size among herring, sprat and saithe schools,’’ ICEMar. Sci.50, 145–160~1993!.
8M. T. Hafsteinsson and O. A. Misund, ‘‘Recording the migration behavof fish schools by multibeam sonar during conventional acoustic surveICES J. Mar. Sci.52, 915–924~1995!.
9D. G. Reid~ed.!, ‘‘Report on echo trace classification,’’ ICES Coop. ReRep.~238! ~2000!.
10L. Mayer, Y. Li, and G. Melvin, ‘‘3D visualization for pelagic fisherieresearch and assessment,’’ ICES J. Mar. Sci.59, 216–225~2002!.
11T. C. Gallaudet and C. P. de Moustier, ‘‘High-frequency volume aboundary acoustic backscatter fluctuations in shallow water,’’ J. AcoSoc. Am.114, 707–725~2003!.
12L. Nøttestad and B. E. Axelsen, ‘‘Herring schooling manoeuvres insponse to killer whale attacks,’’ Can. J. Zool.77, 1540–1546~1999!.
13B. E. Axelsen, T. Anker-Nilssen, P. Fossum, C. Kvamme, and L. Nøttad, ‘‘Pretty patterns but a simple strategy: predator-prey interactionstween juvenile herring and Atlantic puffins observed with multibeamnar,’’ Can. J. Zool.79, 1586–1596~2001!.
14K. Benoit-Bird and W. Au, ‘‘Hawaiian spinner dolphins aggregate midwter food resources through cooperative foraging,’’ J. Acoust. Soc. Am.114,2300 ~2003!.
15T. Weber, D. Bradley, R. L. Culver, and A. Lyons, ‘‘Inferring the verticturbulent diffusion coefficient from backscatter measurements witmultibeam sonar,’’ J. Acoust. Soc. Am.114, 2300~2003!.
16C. D. Jones, ‘‘Water-column measurements of hydrothermal vent flowparticulate concentration using multibeam sonar,’’ J. Acoust. Soc. A114, 2300–2301~2003!.
17R. J. Urick,Principles of Underwater Sound, 3rd ed.~McGraw–Hill, NewYork, 1983!.
18K. G. Foote, ‘‘Optimizing copper spheres for precision calibration of hdroacoustic equipment,’’ J. Acoust. Soc. Am.71, 742–747~1982!.
19K. G. Foote, ‘‘Maintaining precision calibrations with optimal coppspheres,’’ J. Acoust. Soc. Am.73, 1054–1063~1983!.
20K. G. Foote, H. P. Knudsen, G. Vestnes, D. N. MacLennan, and ESimmonds, ‘‘Calibration of acoustic instruments for fish density estimtion: a practical guide,’’ ICES Coop. Res. Rep. 144~1987!.
21D. Chu, K. G. Foote, and L. C. Hufnagle, Jr., ‘‘Measurement of multibesonar directivity patterns,’’ Proc. MTS/IEEE Oceans 2002 Conf.,1411–1414~2002!.
22N. A. Cochrane, Y. Li, and G. D. Melvin, ‘‘Quantification of a multibeamsonar for fisheries assessment applications,’’ J. Acoust. Soc. Am.114,745–758~2003!.
23D. Chu, K. G. Foote, L. C. Hufnagle, Jr., K. C. Baldwin, L. A. Mayer, anA. McLeod, ‘‘Calibrating a 90-kHz multibeam sonar,’’ Proc. MTS/IEEOceans 2003 Conf., pp. 1633–1636~2003!.
24K. G. Foote, D. Chu, K. C. Baldwin, L. A. Mayer, A. McLeod, L. CHufnagle, Jr., J. M. Jech, and W. Michaels, ‘‘Protocols for calibratmultibeam sonar,’’ J. Acoust. Soc. Am.114, 2307~2003!.
25G. C. Gaunaurd, ‘‘Sonar cross section of bodies partially insonifiedfinite sound beams,’’ IEEE J. Ocean. Eng.OE-10, 213–230~1985!.
26A. D. Poularikas, ‘‘Fourier transforms and the fast Fourier transform,’’The Electrical Engineering Handbook, 2nd edition, edited by R. C. Dorf~CRC, Boca Raton, FL, 1997!, pp. 287–298.
27K. G. Foote and D. N. MacLennan, ‘‘Comparison of copper and tungscarbide calibration spheres,’’ J. Acoust. Soc. Am.75, 612–616~1984!.
28K. G. Foote, P. R. Atkins, C. C. Bongiovanni, D. T. I. Francis, P.
J. Acoust. Soc. Am., Vol. 117, No. 4, Pt. 1, April 2005
J.
r,’’
t.
-
-e--
a
d.
J.-
.
y
n
Eriksen, M. Larsen, and T. Mortensen, ‘‘Measuring the frequencysponse function of a seven-octave-bandwidth echo sounder,’’ Proc.Acoust.21„1…, 88–95~1999!.
29K. G. Foote, D. T. I. Francis, H. Furset, and H. Hobæk, ‘‘Spherescalibrating high-frequency broadband echo sounders,’’ Acust. Acta Ac85, S186–S187 and J. Acoust. Soc. Am.105, 1112–1113~A! ~1999!.
30D. L. Folds, ‘‘Target strength of focused liquid-filled spherical reflectorsJ. Acoust. Soc. Am.49, 1596–1599~1971!.
31R. H. Wallace, H. V. Hillery, G. R. Barnard, B. M. Marks, and C. MMcKinney, ‘‘Experimental investigation of several passive sonar targeJ. Acoust. Soc. Am.57, 862–869~1975!.
32B. M. Marks and E. E. Mikeska, ‘‘Reflections from focused liquid-fillespherical reflectors,’’ J. Acoust. Soc. Am.59, 813–817~1976!.
33D. L. Folds and C. D. Loggins, ‘‘Target strength of liquid-filled spheresJ. Acoust. Soc. Am.73, 1147–1151~1983!.
34T. R. Hammar, K. G. Foote, and S. P. Liberatore, ‘‘Advances in develing a high-frequency sonar calibration facility,’’ Proc. MTS/IEEE Ocea2003 Conf., pp. 1622–1624~2003!.
35D. M. Deveau, ‘‘Fabrication, testing, and installation of fluid-filled targspheres for AUTEC’s passive sonar calibration system,’’ Proc. MTS/IEOceans 2000 Conf., pp. 1481–1487~2000!.
36J. J. Faran, Jr., ‘‘Sound scattering by solid cylinders and spheresAcoust. Soc. Am.23, 405–418~1951!.
37R. Hickling, ‘‘Analysis of echoes from a solid elastic sphere in water,’’Acoust. Soc. Am.34, 1582–1592~1962!.
38R. R. Goodman and R. Stern, ‘‘Reflection and transmission of soundelastic spherical shells,’’ J. Acoust. Soc. Am.34, 338–344~1962!.
39K. W. Doherty, T. R. Hammar, and K. G. Foote, ‘‘Transducer mountiand rotating system for calibrating sonars in a sea well,’’ Proc. MTS/IEOceans 2002 Conf., pp. 1407–1410~2002!.
40K. C. Baldwin, L. Mayer, A. McLeod, and J. Millar, ‘‘Acoustic transducecalibration system,’’ Proc. MTS/IEEE Oceans 2003 Conf., pp. 2093–2~2003!.
41R. F. Duncan and F. S. Blanchard,A Cruising Guide to the New EnglandCoast, 5th ed.~Dodd, Mead, New York, 1962!.
42C. W. Horton, Sr.,Signal Processing of Underwater Acoustic Waves~U.S.Government Printing Office, Washington, DC, 1969!.
43W. B. Davenport, Jr., ‘‘Signal-to-noise ratios in band-pass limiters,’’Appl. Phys.24, 720–727~1953!.
44H. Bodholt, H. Nes, and H. Solli, ‘‘A new echo-sounder system,’’ ProInst. Acoust.11„3…, 123–130~1989!.
45N. R. Draper and H. Smith,Applied Regression Analysis~Wiley, NewYork, 1966!.
46K. G. Foote, ‘‘Acoustic sampling volume,’’ J. Acoust. Soc. Am.90, 959–964 ~1991!.
47L. E. Ivey and C. M. Thompson, ‘‘Underwater transducer wetting agenJ. Acoust. Soc. Am.78, 389–394~1985!.
48D. Chu, K. C. Baldwin, K. G. Foote, Y. Li, L. A. Mayer, and G. DMelvin, ‘‘Multibeam sonar calibration: target localization in azimuthProc. MTS/IEEE Oceans 2001 Conf., pp. 2506–2510~2001!.
49H. P. Knudsen, ‘‘T-A-F: Time-amplitude-frequency: A special electronunit for measuring the TVG function in research echo-sounders,’’ Fisridir. Skr., Ser. Havunders.17, 529–541~1985!.
50D. Chu, K. G. Foote, T. R. Hammar, L. C. Hufnagle, Jr., and J. M. Je‘‘Calibrating a 90-kHz multibeam sonar: illustrating protocols,’’ ProMTS/IEEE Oceans 2004 Conf., pp. 438–442~2004!.
2027Foote et al.: Protocols for calibrating multibeam sonar
Related Documents