Protochlorophyll complexes with similar steady-state fluorescence characteristics can differ in fluorescence lifetimes. A model study in Triton X-100 Beata Mys ´liwa-Kurdziel a , Katalin Solymosi b , Jerzy Kruk a , Be ´la Bo ¨ddi b, * , Kazimierz Strzałka a a Department of Plant Physiology and Biochemistry, Faculty of Biochemistry, Biophysics and Biotechnology, Jagiellonian University, 30–387 Krako ´ w, ul. Gronostajowa 7, Poland b Department of Plant Anatomy, Eo ¨ tvo ¨ s University, 1117, Budapest, Pa ´ zma ´ny P. Se ´ta ´ ny 1/C, Hungary Received 19 June 2006; received in revised form 16 November 2006; accepted 24 November 2006 Available online 17 January 2007 Abstract The steady-state and time-resolved fluorescence characteristics of protochlorophyll (Pchl) dissolved in neat Triton X-100 and in Triton X-100 micelles were investigated, and the fluorescence lifetimes of different Pchl spectral forms were studied. Varying the concentration of Pchl or diluting the micellar solutions either with a buffer or with a micellar solution, 631–634, 645–655, 680–692 and above 700 nm emitting Pchl complexes were prepared, the ratios of which varied from one another. The fluorescence decay of the 631–634 nm emitting (monomeric) form had a mono-exponential character with a 5.4-ns fluorescence lifetime. The long-wavelength Pchl complexes (aggre- gates) had two fluorescence lifetime values within a range of 1.4–3.9 ns and 0.15–0.84 ns, which showed high variability in different envi- ronments. Depending on the conditions, either mono- or double-exponential fluorescence decay was found for a fluorescence band at 680–685 nm. These data show that despite their very similar steady-state fluorescence properties, Pchl complexes can differ in fluores- cence lifetimes, which may reflect different molecular structures, intrinsic geometries or different molecular interactions. This underlines the importance of complex spectroscopic analysis for a precise description of native and artificial chlorophyllous pigment forms. Ó 2006 Elsevier B.V. All rights reserved. Keywords: Fluorescence emission spectra; Fluorescence lifetime; Protochlorophyll; Protochlorophyll aggregation; Triton X-100; Micelles 1. Introduction Protochlorophyll (Pchl) is a natural porphyrin-type compound. Its porphyrin ring provides a number of elec- trophilic (the central Mg ion) and nucleophilic (C@O groups) binding sites, which determine the interactions of Pchl with its molecular environment. The porphyrin ring is esterified with phytol or with its unsaturated biosynthetic precursors. The hydrophobic phytol chain may interact with the non-polar molecules in its environment. Several plant species belonging to the Cucurbitaceae family accumulate Pchl in the inner seed coat. This pigment has been characterized for Cucurbita pepo [1,2], Luffa cyl- indrica [3] and Cyclanthera explodens [4,5]. The in vivo absorption and fluorescence spectra of the Pchl measured in these studies were of a complex character and revealed several spectral forms of accumulated Pchl depending on the plant species and the developmental stage of seeds. The maximum absorption of Pchl accumulated in C. pepo was found at 650 nm [2]. In the case of Cyclanthera explo- dens and L. cylindrica, it was observed at 671–675 nm [4,5], although, the fourth derivative spectrum also showed peaks at 630 and 650 nm [3]. The main fluorescence band was observed at around 695 nm in all studies. Pchl is also 1011-1344/$ - see front matter Ó 2006 Elsevier B.V. All rights reserved. doi:10.1016/j.jphotobiol.2006.11.003 * Corresponding author. Tel.: +36 1 20 90 555/8656; fax: +36 1 381 2166. E-mail address: [email protected] (B. Bo ¨ ddi). www.elsevier.com/locate/jphotobiol Journal of Photochemistry and Photobiology B: Biology 86 (2007) 262–271

Welcome message from author
This document is posted to help you gain knowledge. Please leave a comment to let me know what you think about it! Share it to your friends and learn new things together.
Transcript
www.elsevier.com/locate/jphotobiol
Journal of Photochemistry and Photobiology B: Biology 86 (2007) 262–271
Protochlorophyll complexes with similar steady-statefluorescence characteristics can differ in fluorescence lifetimes.
A model study in Triton X-100
Beata Mysliwa-Kurdziel a, Katalin Solymosi b, Jerzy Kruk a, Bela Boddi b,*,Kazimierz Strzałka a
a Department of Plant Physiology and Biochemistry, Faculty of Biochemistry, Biophysics and Biotechnology, Jagiellonian University, 30–387 Krakow, ul.
Gronostajowa 7, Polandb Department of Plant Anatomy, Eotvos University, 1117, Budapest, Pazmany P. Setany 1/C, Hungary
Received 19 June 2006; received in revised form 16 November 2006; accepted 24 November 2006Available online 17 January 2007
Abstract
The steady-state and time-resolved fluorescence characteristics of protochlorophyll (Pchl) dissolved in neat Triton X-100 and in TritonX-100 micelles were investigated, and the fluorescence lifetimes of different Pchl spectral forms were studied. Varying the concentrationof Pchl or diluting the micellar solutions either with a buffer or with a micellar solution, 631–634, 645–655, 680–692 and above 700 nmemitting Pchl complexes were prepared, the ratios of which varied from one another. The fluorescence decay of the 631–634 nm emitting(monomeric) form had a mono-exponential character with a 5.4-ns fluorescence lifetime. The long-wavelength Pchl complexes (aggre-gates) had two fluorescence lifetime values within a range of 1.4–3.9 ns and 0.15–0.84 ns, which showed high variability in different envi-ronments. Depending on the conditions, either mono- or double-exponential fluorescence decay was found for a fluorescence band at680–685 nm. These data show that despite their very similar steady-state fluorescence properties, Pchl complexes can differ in fluores-cence lifetimes, which may reflect different molecular structures, intrinsic geometries or different molecular interactions. This underlinesthe importance of complex spectroscopic analysis for a precise description of native and artificial chlorophyllous pigment forms.� 2006 Elsevier B.V. All rights reserved.
Keywords: Fluorescence emission spectra; Fluorescence lifetime; Protochlorophyll; Protochlorophyll aggregation; Triton X-100; Micelles
1. Introduction
Protochlorophyll (Pchl) is a natural porphyrin-typecompound. Its porphyrin ring provides a number of elec-trophilic (the central Mg ion) and nucleophilic (C@Ogroups) binding sites, which determine the interactions ofPchl with its molecular environment. The porphyrin ringis esterified with phytol or with its unsaturated biosyntheticprecursors. The hydrophobic phytol chain may interactwith the non-polar molecules in its environment.
1011-1344/$ - see front matter � 2006 Elsevier B.V. All rights reserved.
doi:10.1016/j.jphotobiol.2006.11.003
* Corresponding author. Tel.: +36 1 20 90 555/8656; fax: +36 1 3812166.
E-mail address: [email protected] (B. Boddi).
Several plant species belonging to the Cucurbitaceae
family accumulate Pchl in the inner seed coat. This pigmenthas been characterized for Cucurbita pepo [1,2], Luffa cyl-
indrica [3] and Cyclanthera explodens [4,5]. The in vivo
absorption and fluorescence spectra of the Pchl measuredin these studies were of a complex character and revealedseveral spectral forms of accumulated Pchl depending onthe plant species and the developmental stage of seeds.The maximum absorption of Pchl accumulated in C. pepo
was found at 650 nm [2]. In the case of Cyclanthera explo-
dens and L. cylindrica, it was observed at 671–675 nm [4,5],although, the fourth derivative spectrum also showedpeaks at 630 and 650 nm [3]. The main fluorescence bandwas observed at around 695 nm in all studies. Pchl is also
B. Mysliwa-Kurdziel et al. / Journal of Photochemistry and Photobiology B: Biology 86 (2007) 262–271 263
present in etiolated seedlings, mainly in prothylakoids oftheir etioplasts [6]. It has no direct role in chlorophyll(Chl) biosynthesis and it amounts to only a small percent-age of the total porphyrins of etiolated plants [6]. Recently,the presence of Pchl and protochlorophyllide (Pchlide), thenon-esterified Pchl, has been described in cabbage heads[7,8] and in the innermost leaves of the buds of 34 woodyplant species [9,10].
The absorption and fluorescence spectra of dark-grownleaves are complex (for a review see [11,12]). Resolution ofthe fluorescence spectra of etiolated leaves into Gaussiancomponents revealed several spectral forms of Pchl(ide)both in situ and in isolated etioplast inner membranes –EPIMs [13–15]. The high complexity of the spectra mea-sured in vivo, and the overlapping of individual gaussiancomponents makes it difficult to understand the molecularbackground of pigment–surrounding interaction, thereforestudies on different model systems are required.
Steady-state spectroscopic investigations of Pchl(ide)accumulated in natural systems provide no informationon dynamic changes of the system. Time-dependent pig-ment–environment interactions can be examined by ananalysis of fluorescence decay. The fluorescence lifetimeof Pchl(ide) has been measured in isolated EPIMs [16,17].Two fluorescence lifetime components (0.25 and around5 ns) were associated with the 655 nm emitting Pchlideform [17]. In addition, a single 5-ns component wasascribed to the 633 nm emitting Pchl(ide) form. A multiex-ponential fluorescence decay of Pchl(ide) has also beenobserved in experiments performed at 77 K in natural sys-tems [18]. The detailed analysis of the fluorescence lifetimesof individual Pchlide and Pchl spectral forms in naturalsystems was abortive. That is why, corresponding experi-ments need to be performed in different model systems.To our knowledge, the fluorescence lifetime of this pigmenthas been determined only for Pchlide dissolved in severalorganic solvents and for Pchlide in aqueous methanol [19].
Triton X-100 micelles have been widely used to studythe spectral properties of various chlorophyll type pig-ments like Chl, bacteriochlorophyll (BChl) and bacterio-pheophytin [20–25] (for a review see Scherz et al. [26]).Aggregation of Pchl or Pchlide has been investigated inorganic solvents [19,27–32], solid films [33–35] and in Tri-ton X-100 micelles [36]. The spectral properties of theaggregates were similar to the properties of pigment formsfound in vivo. Circular dichroism (CD) studies of Pchlsolid films indicate that the intrinsic geometries of theaggregates could be different despite their similar absorp-tion spectra [33].
In the present work, the fluorescence lifetime and fluo-rescence emission spectra were measured for Pchl dissolvedin neat Triton X-100 and in Triton X-100 micelles. Extend-ing the previous work [36], we aimed this investigation atstudying differences in the fluorescence decay characteris-tics of Pchl aggregates formed in different environmentsbut having similar absorption and fluorescence maxima.Micellar solutions were used because they provide a model
of the matrix where Pchlide–LPOR–NADPH ternary com-plexes are localized in vivo.
2. Materials and methods
2.1. Materials
Pchl was extracted from pumpkin seed coat (C. pepo,
convar. Stajer) with acetone and then purified by columnchromatography. Carotenoids were removed from theextract on aluminium oxide (90, basic) using acetone/hex-ane (90:10, v/v). Pchl bound to the column was eluted withacetone/hexane (increasing the volume percentage of hex-ane from 10% to 40%). The solvent was then evaporatedto dryness in a rotary evaporator and the Pchl dissolvedin acetone for storage at �30 �C. The purity of the pigmentwas examined by HPLC (Jasco UV-970 UV/Vis detector –440 or 630 nm detection – and Jasco PU-980 pump, Japan)on a reversed phase C18 column (Nucleosil 100), 5 lm,250 · 4.6 mm (Tracer Analitica, Spain) in acetonitrile/methanol/water (72:8:1 1.5 ml/min). All the solvents usedfor purification were of analytical or HPLC grade (Lab-scan, Ireland).
A micellar solution of Triton X-100 (Serva) was pre-pared by diluting the detergent with a Na2HPO4–KH2PO4
phosphate buffer (0.05 M, pH 7.2). The final concentrationof Triton X-100 was of 3.5 · 10�3 M, which is 10–14 timeshigher than the critical micellar concentration (CMC)[37,38]. The presence of ions in the buffer also modifiedthe theoretical CMC.
An aliquot of Pchl dissolved in diethyl ether (Lachema)was added to a given amount of Triton X-100 micellarsolution with continuous stirring. Diethyl ether was thenremoved by warming up the solution to 40 �C and usinga slight vacuum, following Boddi et al. [36]. Dependingon the desired final amount of Pchl in the Triton X-100micellar solution, either one portion of Pchl or two to threeportions of the same aliquot were added to the micellar sys-tem. The concentration of the stock solution of Pchl indiethyl ether varied between 1 · 10�4 and 1 · 10�3 M.The samples were used for fluorescence spectroscopy about30 min to 1 h after preparation. We did not observe anysignificant time-dependent changes in the shape of fluores-cence spectra, even with overnight incubation (data notshown).
To prepare a solution of Pchl in neat Triton X-100, aproper aliquot of Pchl in diethyl ether was evaporated todryness in a conical tube and kept under vacuum for 2 h.Then the film of the pigment was dissolved in neat TritonX-100.
2.2. Methods
Fluorescence emission spectra were recorded at 25 �Cwith a LS50B spectrofluorometer (Perkin–Elmer UK).They were measured with 440 and 480 nm excitation wave-lengths in the 580–780 nm region. The data collection
264 B. Mysliwa-Kurdziel et al. / Journal of Photochemistry and Photobiology B: Biology 86 (2007) 262–271
frequency was 0.5 nm. The spectra were corrected for anywavelength-dependent sensitivity of the detector. The emis-sion and excitation slits were 5 nm.
Fluorescence lifetime measurements were performedusing a multifrequency cross-correlation phase and modu-lation K2 fluorometer (ISS Instruments, USA), as describedin Mysliwa-Kurdziel et al. [19]. The samples were excited at440 or 480 nm using a 300 W Xenon lamp as light source.The fluorescence signal was measured through a 600 nm(or occasionally in some experiments through a 680 nm)cut-off filter for a set of 12–15 modulation frequenciesbetween 2 and 200 MHz. A scattering solution of glycogen(Merck) in water was used as a reference fluorescence life-time (0 ns). The maximal errors in the measured phaseshift and modulation were ±0.3 and ±0.006, respectively.Fluorescence lifetimes (s) and fractional intensities (f), i.e.fractional contribution of each fluorescence lifetime compo-nent to the total steady-state fluorescence, were calculatedfrom the phase shift and modulation using a mono- or mul-tiexponential model of fluorescence decay [39,40] by thenon-linear least-square program (ISS, USA), as describedin Mysliwa-Kurdziel et al. [17].
3. Results and discussion
3.1. Pchl dissolved in neat Triton X-100
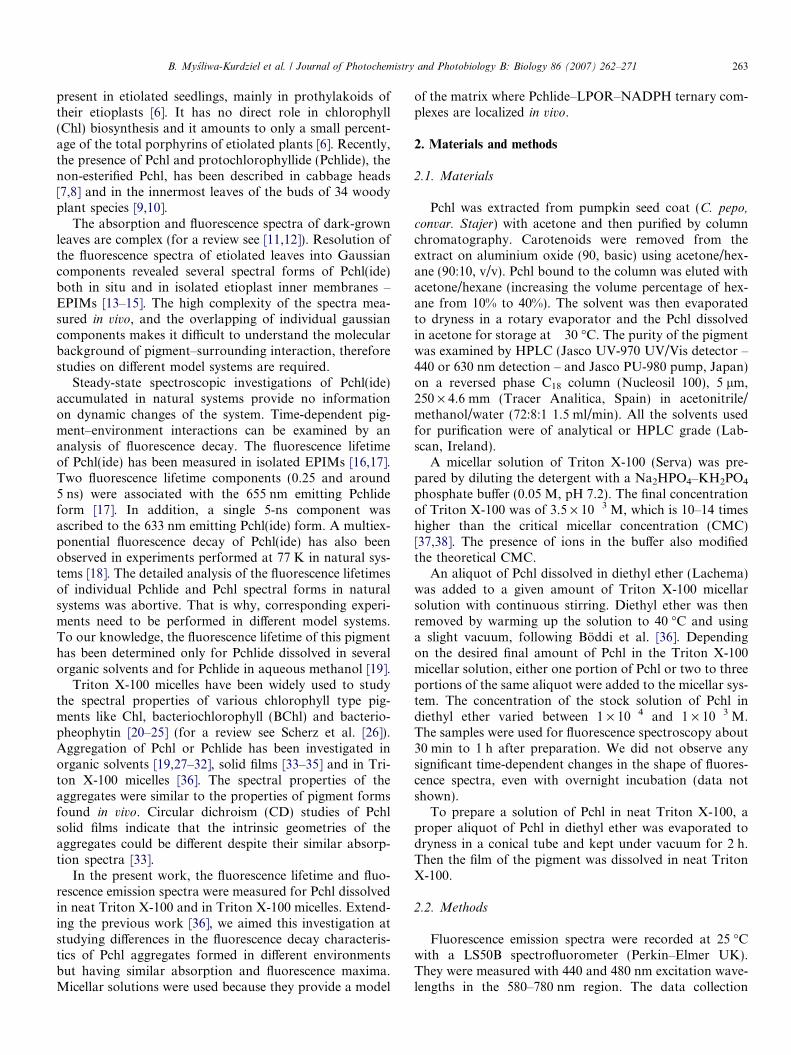
The fluorescence emission spectrum of 1.2 · 10�5 MPchl dissolved in the non-ionic detergent Triton X-100showed a maximum at 631 nm when excited at 440 nmand two bands: a main band at 680 nm and another oflower intensity at 631.5 nm when excited at 480 nm(Fig. 1).
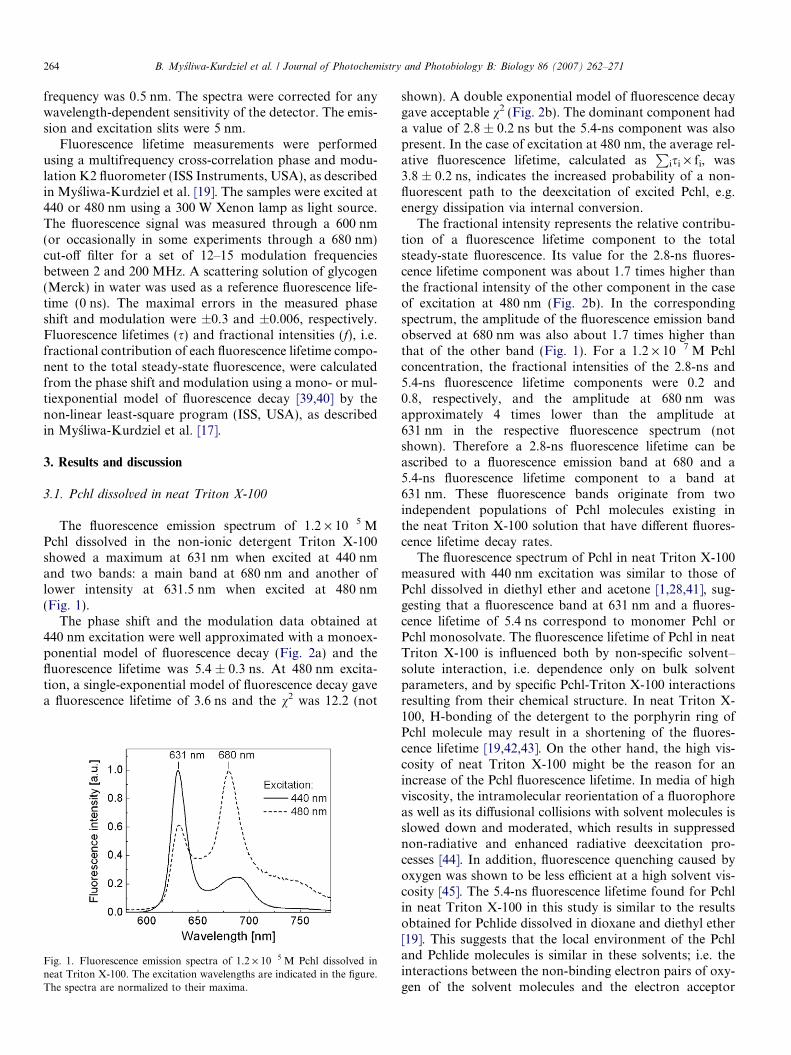
The phase shift and the modulation data obtained at440 nm excitation were well approximated with a monoex-ponential model of fluorescence decay (Fig. 2a) and thefluorescence lifetime was 5.4 ± 0.3 ns. At 480 nm excita-tion, a single-exponential model of fluorescence decay gavea fluorescence lifetime of 3.6 ns and the v2 was 12.2 (not
Fig. 1. Fluorescence emission spectra of 1.2 · 10�5 M Pchl dissolved inneat Triton X-100. The excitation wavelengths are indicated in the figure.The spectra are normalized to their maxima.
shown). A double exponential model of fluorescence decaygave acceptable v2 (Fig. 2b). The dominant component hada value of 2.8 ± 0.2 ns but the 5.4-ns component was alsopresent. In the case of excitation at 480 nm, the average rel-ative fluorescence lifetime, calculated as
Pisi · fi, was
3.8 ± 0.2 ns, indicates the increased probability of a non-fluorescent path to the deexcitation of excited Pchl, e.g.energy dissipation via internal conversion.
The fractional intensity represents the relative contribu-tion of a fluorescence lifetime component to the totalsteady-state fluorescence. Its value for the 2.8-ns fluores-cence lifetime component was about 1.7 times higher thanthe fractional intensity of the other component in the caseof excitation at 480 nm (Fig. 2b). In the correspondingspectrum, the amplitude of the fluorescence emission bandobserved at 680 nm was also about 1.7 times higher thanthat of the other band (Fig. 1). For a 1.2 · 10�7 M Pchlconcentration, the fractional intensities of the 2.8-ns and5.4-ns fluorescence lifetime components were 0.2 and0.8, respectively, and the amplitude at 680 nm wasapproximately 4 times lower than the amplitude at631 nm in the respective fluorescence spectrum (notshown). Therefore a 2.8-ns fluorescence lifetime can beascribed to a fluorescence emission band at 680 and a5.4-ns fluorescence lifetime component to a band at631 nm. These fluorescence bands originate from twoindependent populations of Pchl molecules existing inthe neat Triton X-100 solution that have different fluores-cence lifetime decay rates.
The fluorescence spectrum of Pchl in neat Triton X-100measured with 440 nm excitation was similar to those ofPchl dissolved in diethyl ether and acetone [1,28,41], sug-gesting that a fluorescence band at 631 nm and a fluores-cence lifetime of 5.4 ns correspond to monomer Pchl orPchl monosolvate. The fluorescence lifetime of Pchl in neatTriton X-100 is influenced both by non-specific solvent–solute interaction, i.e. dependence only on bulk solventparameters, and by specific Pchl-Triton X-100 interactionsresulting from their chemical structure. In neat Triton X-100, H-bonding of the detergent to the porphyrin ring ofPchl molecule may result in a shortening of the fluores-cence lifetime [19,42,43]. On the other hand, the high vis-cosity of neat Triton X-100 might be the reason for anincrease of the Pchl fluorescence lifetime. In media of highviscosity, the intramolecular reorientation of a fluorophoreas well as its diffusional collisions with solvent molecules isslowed down and moderated, which results in suppressednon-radiative and enhanced radiative deexcitation pro-cesses [44]. In addition, fluorescence quenching caused byoxygen was shown to be less efficient at a high solvent vis-cosity [45]. The 5.4-ns fluorescence lifetime found for Pchlin neat Triton X-100 in this study is similar to the resultsobtained for Pchlide dissolved in dioxane and diethyl ether[19]. This suggests that the local environment of the Pchland Pchlide molecules is similar in these solvents; i.e. theinteractions between the non-binding electron pairs of oxy-gen of the solvent molecules and the electron acceptor
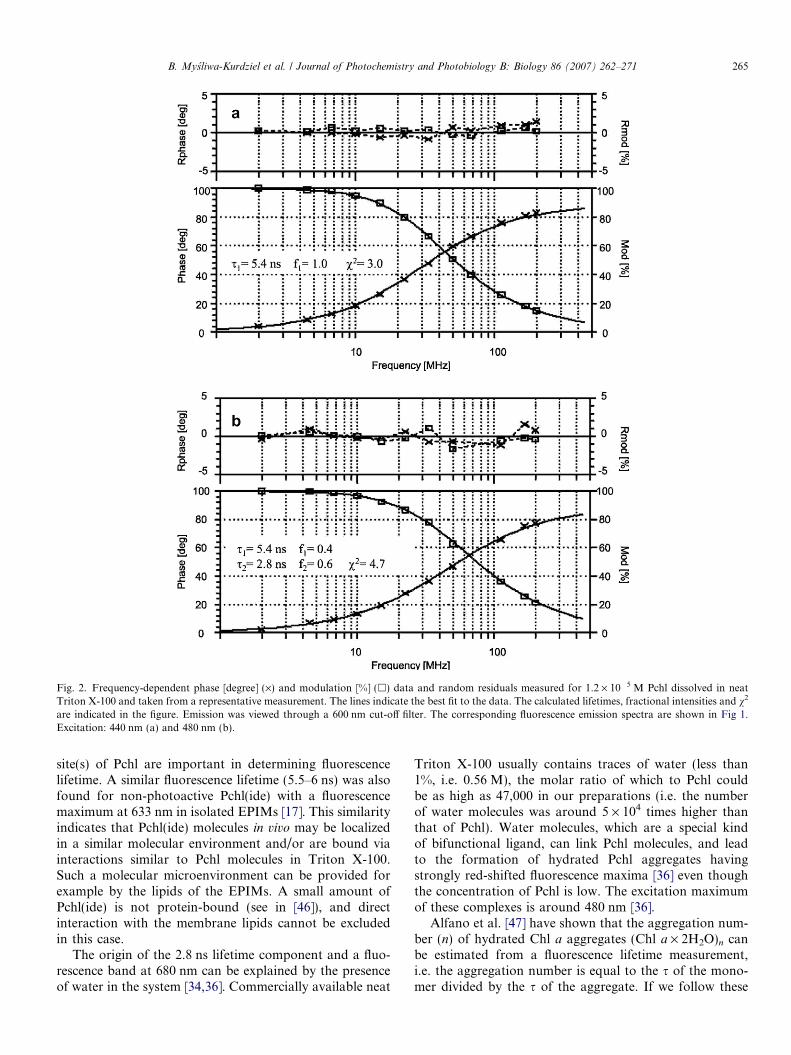
Fig. 2. Frequency-dependent phase [degree] (·) and modulation [%] (h) data and random residuals measured for 1.2 · 10�5 M Pchl dissolved in neatTriton X-100 and taken from a representative measurement. The lines indicate the best fit to the data. The calculated lifetimes, fractional intensities and v2
are indicated in the figure. Emission was viewed through a 600 nm cut-off filter. The corresponding fluorescence emission spectra are shown in Fig 1.Excitation: 440 nm (a) and 480 nm (b).
B. Mysliwa-Kurdziel et al. / Journal of Photochemistry and Photobiology B: Biology 86 (2007) 262–271 265
site(s) of Pchl are important in determining fluorescencelifetime. A similar fluorescence lifetime (5.5–6 ns) was alsofound for non-photoactive Pchl(ide) with a fluorescencemaximum at 633 nm in isolated EPIMs [17]. This similarityindicates that Pchl(ide) molecules in vivo may be localizedin a similar molecular environment and/or are bound viainteractions similar to Pchl molecules in Triton X-100.Such a molecular microenvironment can be provided forexample by the lipids of the EPIMs. A small amount ofPchl(ide) is not protein-bound (see in [46]), and directinteraction with the membrane lipids cannot be excludedin this case.
The origin of the 2.8 ns lifetime component and a fluo-rescence band at 680 nm can be explained by the presenceof water in the system [34,36]. Commercially available neat
Triton X-100 usually contains traces of water (less than1%, i.e. 0.56 M), the molar ratio of which to Pchl couldbe as high as 47,000 in our preparations (i.e. the numberof water molecules was around 5 · 104 times higher thanthat of Pchl). Water molecules, which are a special kindof bifunctional ligand, can link Pchl molecules, and leadto the formation of hydrated Pchl aggregates havingstrongly red-shifted fluorescence maxima [36] even thoughthe concentration of Pchl is low. The excitation maximumof these complexes is around 480 nm [36].
Alfano et al. [47] have shown that the aggregation num-ber (n) of hydrated Chl a aggregates (Chl a · 2H2O)n canbe estimated from a fluorescence lifetime measurement,i.e. the aggregation number is equal to the s of the mono-mer divided by the s of the aggregate. If we follow these
266 B. Mysliwa-Kurdziel et al. / Journal of Photochemistry and Photobiology B: Biology 86 (2007) 262–271
calculations for hydrated Pchl aggregates, we found that afluorescence lifetime of 2.8 ns could originate from dimersof Pchl.
3.2. Pchl in Triton X-100 micellar systems
The fluorescence properties of Pchl were investigated inTriton X-100 micelles in a range of Pchl concentrationsbetween 1.25 · 10�6 and 2.5 · 10�4 M. The concentrationof Triton X-100 was constant: 3.5 · 10�3 M, which is wellabove the CMC value for this detergent [37,38].
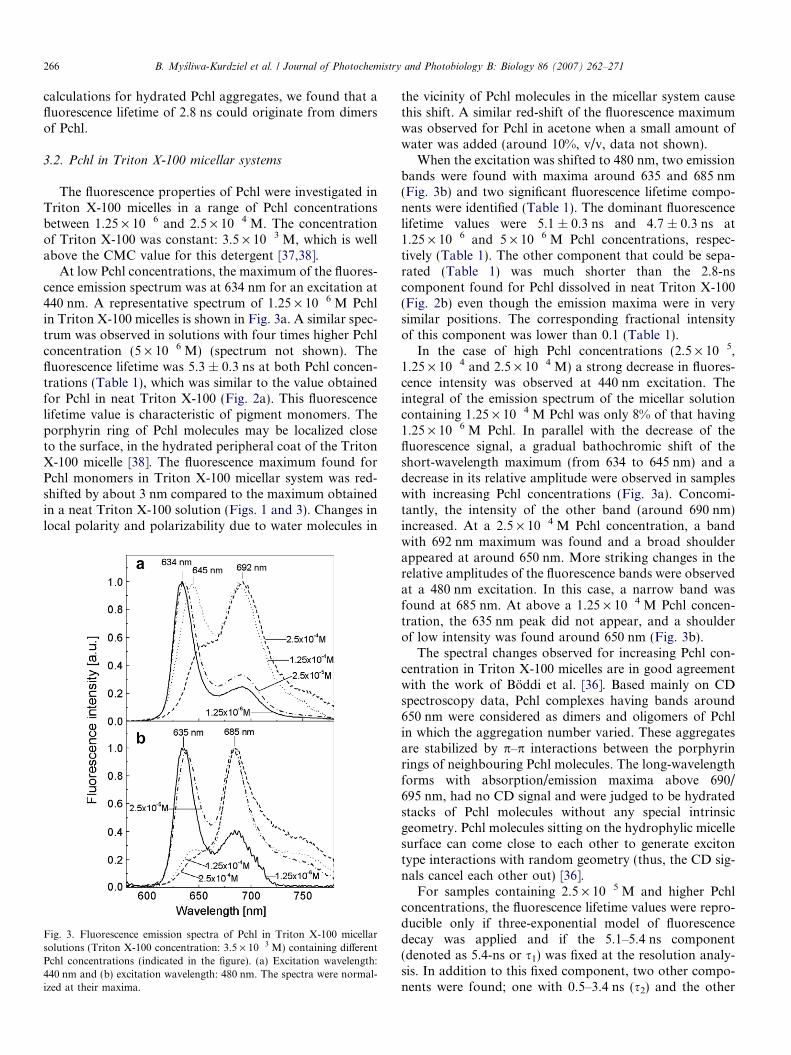
At low Pchl concentrations, the maximum of the fluores-cence emission spectrum was at 634 nm for an excitation at440 nm. A representative spectrum of 1.25 · 10�6 M Pchlin Triton X-100 micelles is shown in Fig. 3a. A similar spec-trum was observed in solutions with four times higher Pchlconcentration (5 · 10�6 M) (spectrum not shown). Thefluorescence lifetime was 5.3 ± 0.3 ns at both Pchl concen-trations (Table 1), which was similar to the value obtainedfor Pchl in neat Triton X-100 (Fig. 2a). This fluorescencelifetime value is characteristic of pigment monomers. Theporphyrin ring of Pchl molecules may be localized closeto the surface, in the hydrated peripheral coat of the TritonX-100 micelle [38]. The fluorescence maximum found forPchl monomers in Triton X-100 micellar system was red-shifted by about 3 nm compared to the maximum obtainedin a neat Triton X-100 solution (Figs. 1 and 3). Changes inlocal polarity and polarizability due to water molecules in
Fig. 3. Fluorescence emission spectra of Pchl in Triton X-100 micellarsolutions (Triton X-100 concentration: 3.5 · 10�3 M) containing differentPchl concentrations (indicated in the figure). (a) Excitation wavelength:440 nm and (b) excitation wavelength: 480 nm. The spectra were normal-ized at their maxima.
the vicinity of Pchl molecules in the micellar system causethis shift. A similar red-shift of the fluorescence maximumwas observed for Pchl in acetone when a small amount ofwater was added (around 10%, v/v, data not shown).
When the excitation was shifted to 480 nm, two emissionbands were found with maxima around 635 and 685 nm(Fig. 3b) and two significant fluorescence lifetime compo-nents were identified (Table 1). The dominant fluorescencelifetime values were 5.1 ± 0.3 ns and 4.7 ± 0.3 ns at1.25 · 10�6 and 5 · 10�6 M Pchl concentrations, respec-tively (Table 1). The other component that could be sepa-rated (Table 1) was much shorter than the 2.8-nscomponent found for Pchl dissolved in neat Triton X-100(Fig. 2b) even though the emission maxima were in verysimilar positions. The corresponding fractional intensityof this component was lower than 0.1 (Table 1).
In the case of high Pchl concentrations (2.5 · 10�5,1.25 · 10�4 and 2.5 · 10�4 M) a strong decrease in fluores-cence intensity was observed at 440 nm excitation. Theintegral of the emission spectrum of the micellar solutioncontaining 1.25 · 10�4 M Pchl was only 8% of that having1.25 · 10�6 M Pchl. In parallel with the decrease of thefluorescence signal, a gradual bathochromic shift of theshort-wavelength maximum (from 634 to 645 nm) and adecrease in its relative amplitude were observed in sampleswith increasing Pchl concentrations (Fig. 3a). Concomi-tantly, the intensity of the other band (around 690 nm)increased. At a 2.5 · 10�4 M Pchl concentration, a bandwith 692 nm maximum was found and a broad shoulderappeared at around 650 nm. More striking changes in therelative amplitudes of the fluorescence bands were observedat a 480 nm excitation. In this case, a narrow band wasfound at 685 nm. At above a 1.25 · 10�4 M Pchl concen-tration, the 635 nm peak did not appear, and a shoulderof low intensity was found around 650 nm (Fig. 3b).
The spectral changes observed for increasing Pchl con-centration in Triton X-100 micelles are in good agreementwith the work of Boddi et al. [36]. Based mainly on CDspectroscopy data, Pchl complexes having bands around650 nm were considered as dimers and oligomers of Pchlin which the aggregation number varied. These aggregatesare stabilized by p–p interactions between the porphyrinrings of neighbouring Pchl molecules. The long-wavelengthforms with absorption/emission maxima above 690/695 nm, had no CD signal and were judged to be hydratedstacks of Pchl molecules without any special intrinsicgeometry. Pchl molecules sitting on the hydrophylic micellesurface can come close to each other to generate excitontype interactions with random geometry (thus, the CD sig-nals cancel each other out) [36].
For samples containing 2.5 · 10�5 M and higher Pchlconcentrations, the fluorescence lifetime values were repro-ducible only if three-exponential model of fluorescencedecay was applied and if the 5.1–5.4 ns component(denoted as 5.4-ns or s1) was fixed at the resolution analy-sis. In addition to this fixed component, two other compo-nents were found; one with 0.5–3.4 ns (s2) and the other
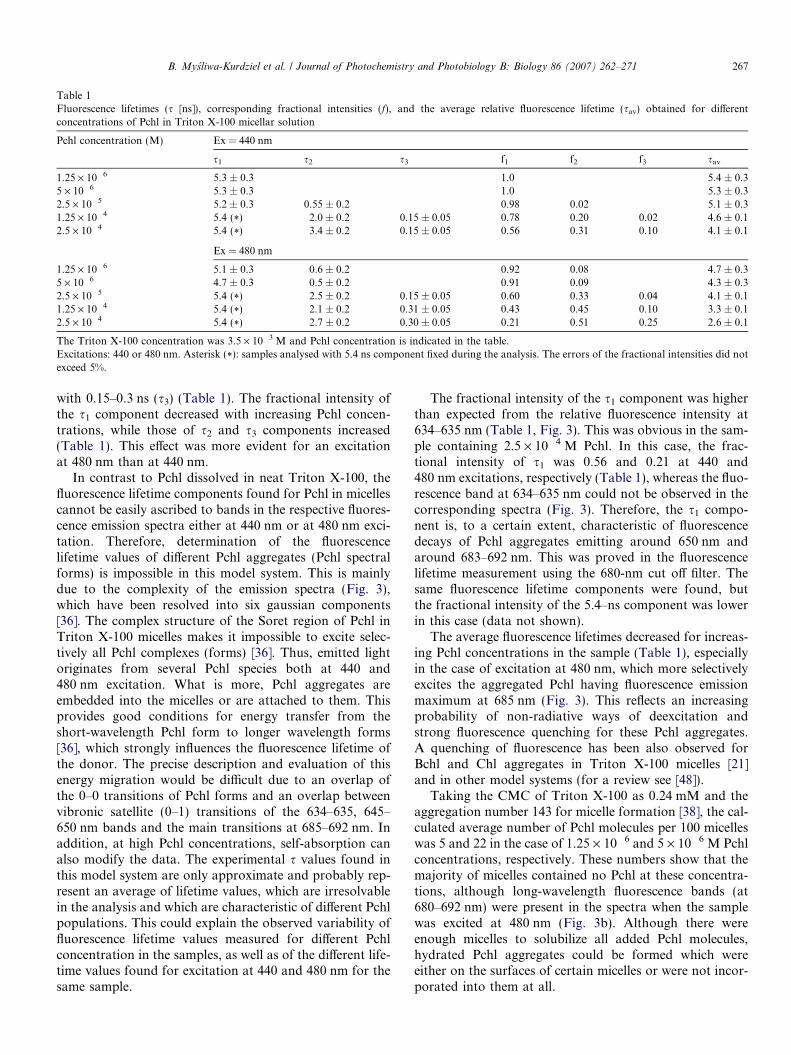
Table 1Fluorescence lifetimes (s [ns]), corresponding fractional intensities (f), and the average relative fluorescence lifetime (sav) obtained for differentconcentrations of Pchl in Triton X-100 micellar solution
Pchl concentration (M) Ex = 440 nm
s1 s2 s3 f1 f2 f3 sav
1.25 · 10�6 5.3 ± 0.3 1.0 5.4 ± 0.35 · 10�6 5.3 ± 0.3 1.0 5.3 ± 0.32.5 · 10�5 5.2 ± 0.3 0.55 ± 0.2 0.98 0.02 5.1 ± 0.31.25 · 10�4 5.4 (*) 2.0 ± 0.2 0.15 ± 0.05 0.78 0.20 0.02 4.6 ± 0.12.5 · 10�4 5.4 (*) 3.4 ± 0.2 0.15 ± 0.05 0.56 0.31 0.10 4.1 ± 0.1
Ex = 480 nm
1.25 · 10�6 5.1 ± 0.3 0.6 ± 0.2 0.92 0.08 4.7 ± 0.35 · 10�6 4.7 ± 0.3 0.5 ± 0.2 0.91 0.09 4.3 ± 0.32.5 · 10�5 5.4 (*) 2.5 ± 0.2 0.15 ± 0.05 0.60 0.33 0.04 4.1 ± 0.11.25 · 10�4 5.4 (*) 2.1 ± 0.2 0.31 ± 0.05 0.43 0.45 0.10 3.3 ± 0.12.5 · 10�4 5.4 (*) 2.7 ± 0.2 0.30 ± 0.05 0.21 0.51 0.25 2.6 ± 0.1
The Triton X-100 concentration was 3.5 · 10�3 M and Pchl concentration is indicated in the table.Excitations: 440 or 480 nm. Asterisk (*): samples analysed with 5.4 ns component fixed during the analysis. The errors of the fractional intensities did notexceed 5%.
B. Mysliwa-Kurdziel et al. / Journal of Photochemistry and Photobiology B: Biology 86 (2007) 262–271 267
with 0.15–0.3 ns (s3) (Table 1). The fractional intensity ofthe s1 component decreased with increasing Pchl concen-trations, while those of s2 and s3 components increased(Table 1). This effect was more evident for an excitationat 480 nm than at 440 nm.
In contrast to Pchl dissolved in neat Triton X-100, thefluorescence lifetime components found for Pchl in micellescannot be easily ascribed to bands in the respective fluores-cence emission spectra either at 440 nm or at 480 nm exci-tation. Therefore, determination of the fluorescencelifetime values of different Pchl aggregates (Pchl spectralforms) is impossible in this model system. This is mainlydue to the complexity of the emission spectra (Fig. 3),which have been resolved into six gaussian components[36]. The complex structure of the Soret region of Pchl inTriton X-100 micelles makes it impossible to excite selec-tively all Pchl complexes (forms) [36]. Thus, emitted lightoriginates from several Pchl species both at 440 and480 nm excitation. What is more, Pchl aggregates areembedded into the micelles or are attached to them. Thisprovides good conditions for energy transfer from theshort-wavelength Pchl form to longer wavelength forms[36], which strongly influences the fluorescence lifetime ofthe donor. The precise description and evaluation of thisenergy migration would be difficult due to an overlap ofthe 0–0 transitions of Pchl forms and an overlap betweenvibronic satellite (0–1) transitions of the 634–635, 645–650 nm bands and the main transitions at 685–692 nm. Inaddition, at high Pchl concentrations, self-absorption canalso modify the data. The experimental s values found inthis model system are only approximate and probably rep-resent an average of lifetime values, which are irresolvablein the analysis and which are characteristic of different Pchlpopulations. This could explain the observed variability offluorescence lifetime values measured for different Pchlconcentration in the samples, as well as of the different life-time values found for excitation at 440 and 480 nm for thesame sample.
The fractional intensity of the s1 component was higherthan expected from the relative fluorescence intensity at634–635 nm (Table 1, Fig. 3). This was obvious in the sam-ple containing 2.5 · 10�4 M Pchl. In this case, the frac-tional intensity of s1 was 0.56 and 0.21 at 440 and480 nm excitations, respectively (Table 1), whereas the fluo-rescence band at 634–635 nm could not be observed in thecorresponding spectra (Fig. 3). Therefore, the s1 compo-nent is, to a certain extent, characteristic of fluorescencedecays of Pchl aggregates emitting around 650 nm andaround 683–692 nm. This was proved in the fluorescencelifetime measurement using the 680-nm cut off filter. Thesame fluorescence lifetime components were found, butthe fractional intensity of the 5.4–ns component was lowerin this case (data not shown).
The average fluorescence lifetimes decreased for increas-ing Pchl concentrations in the sample (Table 1), especiallyin the case of excitation at 480 nm, which more selectivelyexcites the aggregated Pchl having fluorescence emissionmaximum at 685 nm (Fig. 3). This reflects an increasingprobability of non-radiative ways of deexcitation andstrong fluorescence quenching for these Pchl aggregates.A quenching of fluorescence has been also observed forBchl and Chl aggregates in Triton X-100 micelles [21]and in other model systems (for a review see [48]).
Taking the CMC of Triton X-100 as 0.24 mM and theaggregation number 143 for micelle formation [38], the cal-culated average number of Pchl molecules per 100 micelleswas 5 and 22 in the case of 1.25 · 10�6 and 5 · 10�6 M Pchlconcentrations, respectively. These numbers show that themajority of micelles contained no Pchl at these concentra-tions, although long-wavelength fluorescence bands (at680–692 nm) were present in the spectra when the samplewas excited at 480 nm (Fig. 3b). Although there wereenough micelles to solubilize all added Pchl molecules,hydrated Pchl aggregates could be formed which wereeither on the surfaces of certain micelles or were not incor-porated into them at all.
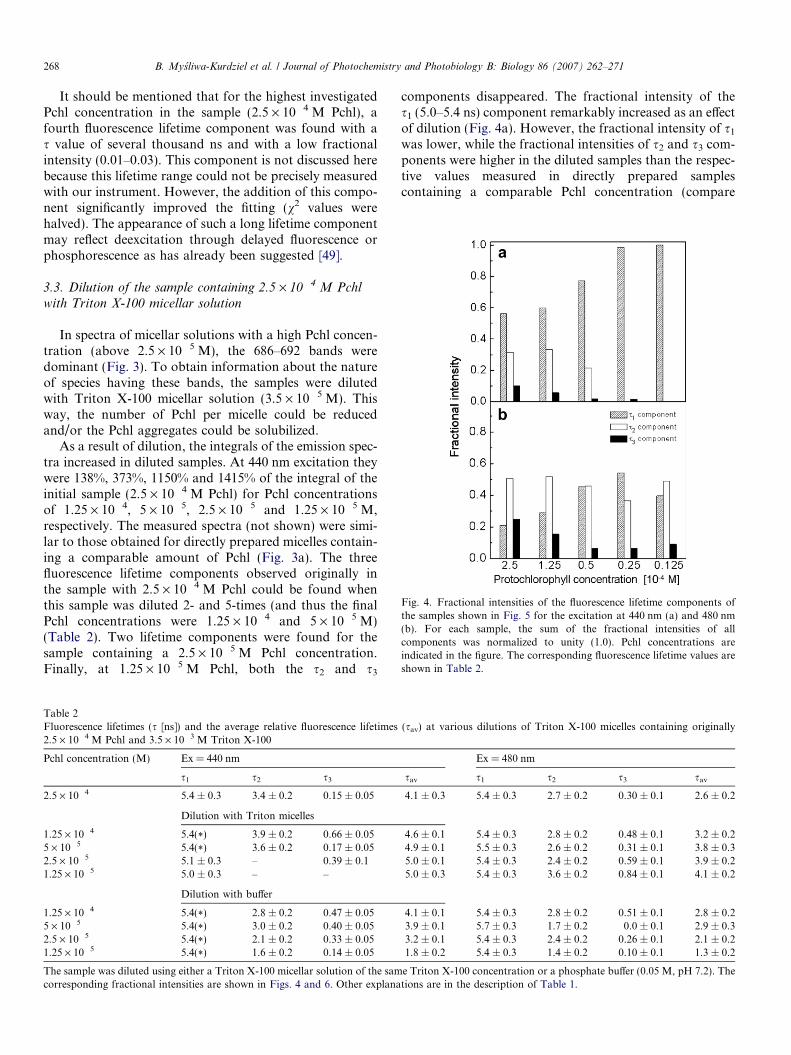
Fig. 4. Fractional intensities of the fluorescence lifetime components ofthe samples shown in Fig. 5 for the excitation at 440 nm (a) and 480 nm(b). For each sample, the sum of the fractional intensities of allcomponents was normalized to unity (1.0). Pchl concentrations areindicated in the figure. The corresponding fluorescence lifetime values areshown in Table 2.
268 B. Mysliwa-Kurdziel et al. / Journal of Photochemistry and Photobiology B: Biology 86 (2007) 262–271
It should be mentioned that for the highest investigatedPchl concentration in the sample (2.5 · 10�4 M Pchl), afourth fluorescence lifetime component was found with as value of several thousand ns and with a low fractionalintensity (0.01–0.03). This component is not discussed herebecause this lifetime range could not be precisely measuredwith our instrument. However, the addition of this compo-nent significantly improved the fitting (v2 values werehalved). The appearance of such a long lifetime componentmay reflect deexcitation through delayed fluorescence orphosphorescence as has already been suggested [49].
3.3. Dilution of the sample containing 2.5 · 10�4 M Pchl
with Triton X-100 micellar solution
In spectra of micellar solutions with a high Pchl concen-tration (above 2.5 · 10�5 M), the 686–692 bands weredominant (Fig. 3). To obtain information about the natureof species having these bands, the samples were dilutedwith Triton X-100 micellar solution (3.5 · 10�5 M). Thisway, the number of Pchl per micelle could be reducedand/or the Pchl aggregates could be solubilized.
As a result of dilution, the integrals of the emission spec-tra increased in diluted samples. At 440 nm excitation theywere 138%, 373%, 1150% and 1415% of the integral of theinitial sample (2.5 · 10�4 M Pchl) for Pchl concentrationsof 1.25 · 10�4, 5 · 10�5, 2.5 · 10�5 and 1.25 · 10�5 M,respectively. The measured spectra (not shown) were simi-lar to those obtained for directly prepared micelles contain-ing a comparable amount of Pchl (Fig. 3a). The threefluorescence lifetime components observed originally inthe sample with 2.5 · 10�4 M Pchl could be found whenthis sample was diluted 2- and 5-times (and thus the finalPchl concentrations were 1.25 · 10�4 and 5 · 10�5 M)(Table 2). Two lifetime components were found for thesample containing a 2.5 · 10�5 M Pchl concentration.Finally, at 1.25 · 10�5 M Pchl, both the s2 and s3
Table 2Fluorescence lifetimes (s [ns]) and the average relative fluorescence lifetimes2.5 · 10�4 M Pchl and 3.5 · 10�3 M Triton X-100
Pchl concentration (M) Ex = 440 nm
s1 s2 s3
2.5 · 10�4 5.4 ± 0.3 3.4 ± 0.2 0.15 ± 0.05
Dilution with Triton micelles
1.25 · 10�4 5.4(*) 3.9 ± 0.2 0.66 ± 0.055 · 10�5 5.4(*) 3.6 ± 0.2 0.17 ± 0.052.5 · 10�5 5.1 ± 0.3 – 0.39 ± 0.11.25 · 10�5 5.0 ± 0.3 – –
Dilution with buffer
1.25 · 10�4 5.4(*) 2.8 ± 0.2 0.47 ± 0.055 · 10�5 5.4(*) 3.0 ± 0.2 0.40 ± 0.052.5 · 10�5 5.4(*) 2.1 ± 0.2 0.33 ± 0.051.25 · 10�5 5.4(*) 1.6 ± 0.2 0.14 ± 0.05
The sample was diluted using either a Triton X-100 micellar solution of the samcorresponding fractional intensities are shown in Figs. 4 and 6. Other explana
components disappeared. The fractional intensity of thes1 (5.0–5.4 ns) component remarkably increased as an effectof dilution (Fig. 4a). However, the fractional intensity of s1
was lower, while the fractional intensities of s2 and s3 com-ponents were higher in the diluted samples than the respec-tive values measured in directly prepared samplescontaining a comparable Pchl concentration (compare
(sav) at various dilutions of Triton X-100 micelles containing originally
Ex = 480 nm
sav s1 s2 s3 sav
4.1 ± 0.3 5.4 ± 0.3 2.7 ± 0.2 0.30 ± 0.1 2.6 ± 0.2
4.6 ± 0.1 5.4 ± 0.3 2.8 ± 0.2 0.48 ± 0.1 3.2 ± 0.24.9 ± 0.1 5.5 ± 0.3 2.6 ± 0.2 0.31 ± 0.1 3.8 ± 0.35.0 ± 0.1 5.4 ± 0.3 2.4 ± 0.2 0.59 ± 0.1 3.9 ± 0.25.0 ± 0.3 5.4 ± 0.3 3.6 ± 0.2 0.84 ± 0.1 4.1 ± 0.2
4.1 ± 0.1 5.4 ± 0.3 2.8 ± 0.2 0.51 ± 0.1 2.8 ± 0.23.9 ± 0.1 5.7 ± 0.3 1.7 ± 0.2 0.0 ± 0.1 2.9 ± 0.33.2 ± 0.1 5.4 ± 0.3 2.4 ± 0.2 0.26 ± 0.1 2.1 ± 0.21.8 ± 0.2 5.4 ± 0.3 1.4 ± 0.2 0.10 ± 0.1 1.3 ± 0.2
e Triton X-100 concentration or a phosphate buffer (0.05 M, pH 7.2). Thetions are in the description of Table 1.
B. Mysliwa-Kurdziel et al. / Journal of Photochemistry and Photobiology B: Biology 86 (2007) 262–271 269
Fig. 4a with Table 1). This suggests an incomplete destruc-tion of the Pchl aggregates. Dilution caused a slow trans-formation of the micellar system and thus of Pchlspectral forms. Pchl aggregates in the diluted samplesmight have a different geometry than aggregates in thedirectly prepared samples with the same Pchl concentra-tion, which would relate to different energy migration effi-ciencies and thereby influence fluorescence lifetimes.
An incomplete destruction of Pchl aggregates emitting at685 nm was evident for both fluorescence spectra (Fig. 5)and fluorescence lifetimes (Table 2) recorded for an excita-tion at 480 nm. In the spectra, a band at around 683 nm wasdominant for all samples obtained via dilution, while thisband was not present in directly prepared samples contain-ing very low Pchl concentrations (compare Figs. 5 and 3b).The integral values of the spectra increased to 162%, 166%and 130% of the integral of the sample without dilutionin the case of final Pchl concentrations of 1.25 · 10�4,5 · 10�5, and 2.5 · 10�5 M, respectively. Then it decreasedto 68% of the integral of the initial sample for a 1.25 ·10�5 M final Pchl concentration. At 480 nm excitation,three lifetime components were well distinguishable for allPchl concentrations (Table 2, Fig. 4b). The fractional inten-sity of the s2 component was significant whatever the dilu-tion. It oscillated between 0.35 and 0.65 (Fig. 4b). Thevalues of the s2 and s3 components varied, but, just as at440 nm excitation, there was no trend in these changes.
3.4. Dilution of the sample containing 2.5 · 10�4 M Pchl
with a phosphate buffer
The changes in the fluorescence properties of Pchl formswere further analysed in experiments in which the samplecontaining originally 2.5 · 10�4 M Pchl in a micellar solu-tion of Triton X-100 (3.5 · 10�5 M) was diluted with aphosphate buffer (0.05 M, pH 7.2). In this case, not onlywas the pigment concentration decreased in a well-con-trolled way, but the micellar structure was also affected.
Fig. 5. Fluorescence emission spectra of Triton X-100 micellar solutions(Triton X-100 concentration: 3.5 · 10�3 M) containing originally2.5 · 10�4 M Pchl and diluted with Triton X-100 micellar solution ofthe same concentration. The final Pchl concentrations were 1.25 · 10�4,5 · 10�5 and 1.25 · 10�5 M. Excitation wavelength: 480 nm. The spectrawere normalized at their maxima.
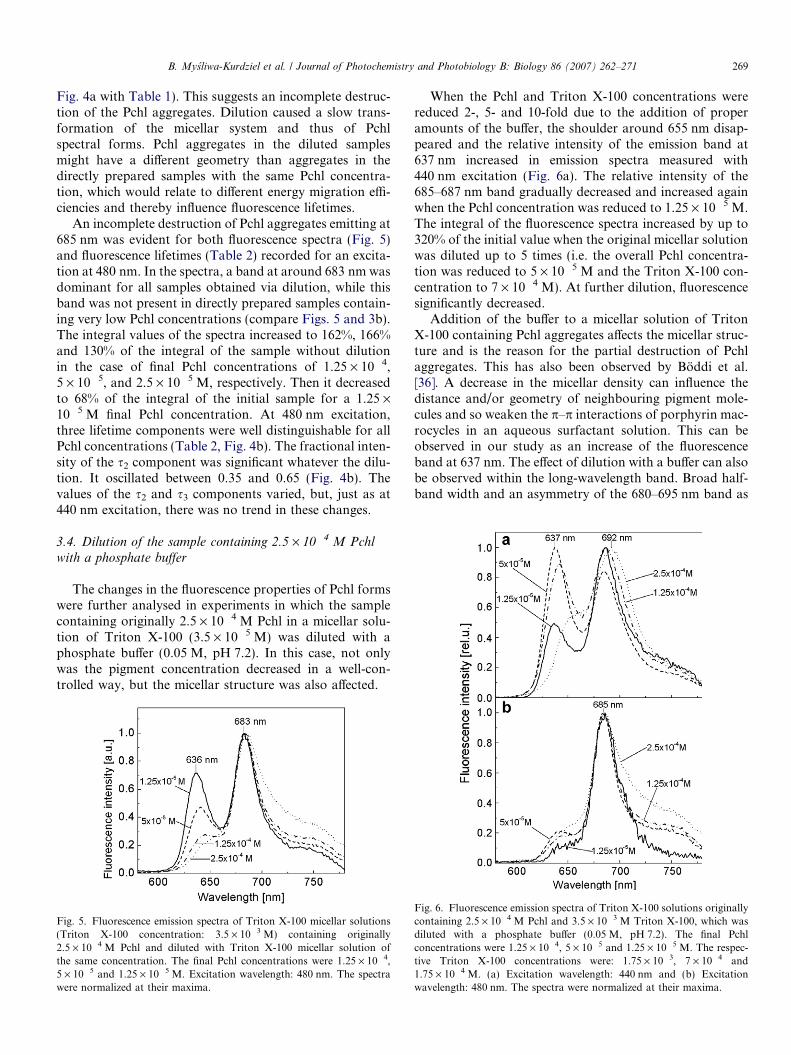
When the Pchl and Triton X-100 concentrations werereduced 2-, 5- and 10-fold due to the addition of properamounts of the buffer, the shoulder around 655 nm disap-peared and the relative intensity of the emission band at637 nm increased in emission spectra measured with440 nm excitation (Fig. 6a). The relative intensity of the685–687 nm band gradually decreased and increased againwhen the Pchl concentration was reduced to 1.25 · 10�5 M.The integral of the fluorescence spectra increased by up to320% of the initial value when the original micellar solutionwas diluted up to 5 times (i.e. the overall Pchl concentra-tion was reduced to 5 · 10�5 M and the Triton X-100 con-centration to 7 · 10�4 M). At further dilution, fluorescencesignificantly decreased.
Addition of the buffer to a micellar solution of TritonX-100 containing Pchl aggregates affects the micellar struc-ture and is the reason for the partial destruction of Pchlaggregates. This has also been observed by Boddi et al.[36]. A decrease in the micellar density can influence thedistance and/or geometry of neighbouring pigment mole-cules and so weaken the p–p interactions of porphyrin mac-rocycles in an aqueous surfactant solution. This can beobserved in our study as an increase of the fluorescenceband at 637 nm. The effect of dilution with a buffer can alsobe observed within the long-wavelength band. Broad half-band width and an asymmetry of the 680–695 nm band as
Fig. 6. Fluorescence emission spectra of Triton X-100 solutions originallycontaining 2.5 · 10�4 M Pchl and 3.5 · 10�3 M Triton X-100, which wasdiluted with a phosphate buffer (0.05 M, pH 7.2). The final Pchlconcentrations were 1.25 · 10�4, 5 · 10�5 and 1.25 · 10�5 M. The respec-tive Triton X-100 concentrations were: 1.75 · 10�3, 7 · 10�4 and1.75 · 10�4 M. (a) Excitation wavelength: 440 nm and (b) Excitationwavelength: 480 nm. The spectra were normalized at their maxima.
270 B. Mysliwa-Kurdziel et al. / Journal of Photochemistry and Photobiology B: Biology 86 (2007) 262–271
well as its shift towards short wavelengths at dilution(Fig. 6a) indicate some heterogeneity among aggregatedPchl complexes.
In a difference spectrum calculated between the originaland a 20-times buffer-diluted sample, a maximum aroundat 700 nm was observed (not shown), reflecting the existenceof some heterogeneity among Pchl aggregates. Dilutiondestroyed these aggregates with an emission maximum at700 nm; however, it did not destroy hydrated Pchl com-plexes which have an emission maximum at 685 nm.
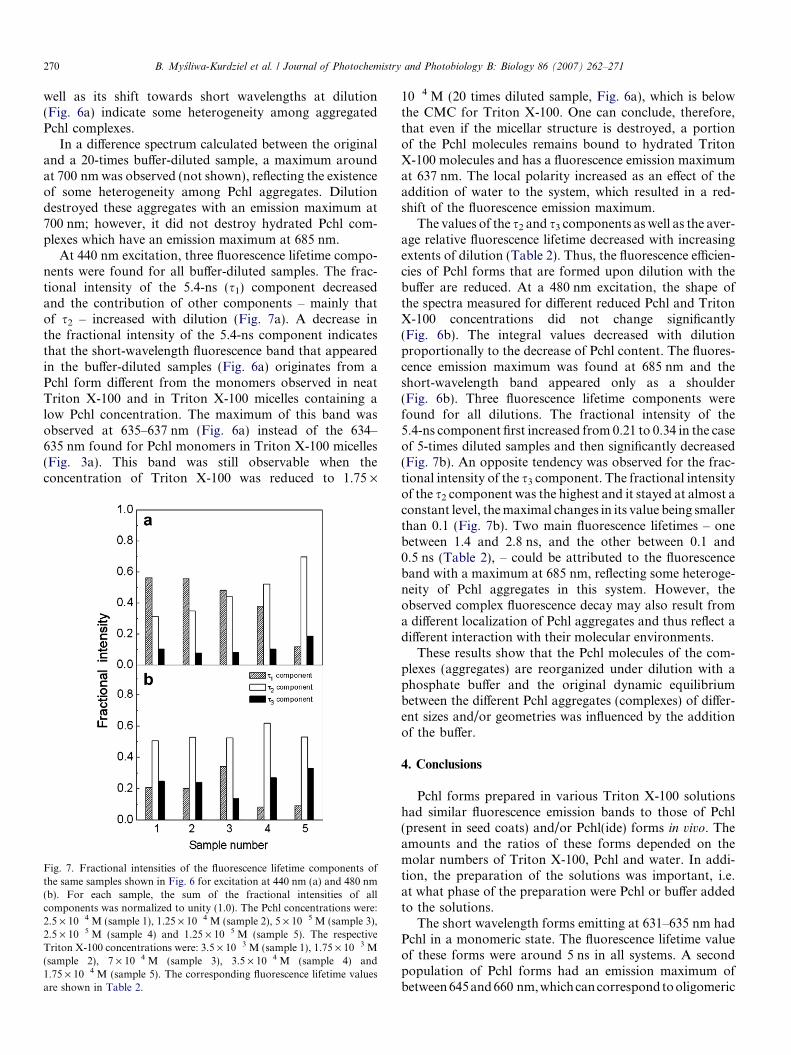
At 440 nm excitation, three fluorescence lifetime compo-nents were found for all buffer-diluted samples. The frac-tional intensity of the 5.4-ns (s1) component decreasedand the contribution of other components – mainly thatof s2 – increased with dilution (Fig. 7a). A decrease inthe fractional intensity of the 5.4-ns component indicatesthat the short-wavelength fluorescence band that appearedin the buffer-diluted samples (Fig. 6a) originates from aPchl form different from the monomers observed in neatTriton X-100 and in Triton X-100 micelles containing alow Pchl concentration. The maximum of this band wasobserved at 635–637 nm (Fig. 6a) instead of the 634–635 nm found for Pchl monomers in Triton X-100 micelles(Fig. 3a). This band was still observable when theconcentration of Triton X-100 was reduced to 1.75 ·
Fig. 7. Fractional intensities of the fluorescence lifetime components ofthe same samples shown in Fig. 6 for excitation at 440 nm (a) and 480 nm(b). For each sample, the sum of the fractional intensities of allcomponents was normalized to unity (1.0). The Pchl concentrations were:2.5 · 10�4 M (sample 1), 1.25 · 10�4 M (sample 2), 5 · 10�5 M (sample 3),2.5 · 10�5 M (sample 4) and 1.25 · 10�5 M (sample 5). The respectiveTriton X-100 concentrations were: 3.5 · 10�3 M (sample 1), 1.75 · 10�3 M(sample 2), 7 · 10�4 M (sample 3), 3.5 · 10�4 M (sample 4) and1.75 · 10�4 M (sample 5). The corresponding fluorescence lifetime valuesare shown in Table 2.
10�4 M (20 times diluted sample, Fig. 6a), which is belowthe CMC for Triton X-100. One can conclude, therefore,that even if the micellar structure is destroyed, a portionof the Pchl molecules remains bound to hydrated TritonX-100 molecules and has a fluorescence emission maximumat 637 nm. The local polarity increased as an effect of theaddition of water to the system, which resulted in a red-shift of the fluorescence emission maximum.
The values of the s2 and s3 components as well as the aver-age relative fluorescence lifetime decreased with increasingextents of dilution (Table 2). Thus, the fluorescence efficien-cies of Pchl forms that are formed upon dilution with thebuffer are reduced. At a 480 nm excitation, the shape ofthe spectra measured for different reduced Pchl and TritonX-100 concentrations did not change significantly(Fig. 6b). The integral values decreased with dilutionproportionally to the decrease of Pchl content. The fluores-cence emission maximum was found at 685 nm and theshort-wavelength band appeared only as a shoulder(Fig. 6b). Three fluorescence lifetime components werefound for all dilutions. The fractional intensity of the5.4-ns component first increased from 0.21 to 0.34 in the caseof 5-times diluted samples and then significantly decreased(Fig. 7b). An opposite tendency was observed for the frac-tional intensity of the s3 component. The fractional intensityof the s2 component was the highest and it stayed at almost aconstant level, the maximal changes in its value being smallerthan 0.1 (Fig. 7b). Two main fluorescence lifetimes – onebetween 1.4 and 2.8 ns, and the other between 0.1 and0.5 ns (Table 2), – could be attributed to the fluorescenceband with a maximum at 685 nm, reflecting some heteroge-neity of Pchl aggregates in this system. However, theobserved complex fluorescence decay may also result froma different localization of Pchl aggregates and thus reflect adifferent interaction with their molecular environments.
These results show that the Pchl molecules of the com-plexes (aggregates) are reorganized under dilution with aphosphate buffer and the original dynamic equilibriumbetween the different Pchl aggregates (complexes) of differ-ent sizes and/or geometries was influenced by the additionof the buffer.
4. Conclusions
Pchl forms prepared in various Triton X-100 solutionshad similar fluorescence emission bands to those of Pchl(present in seed coats) and/or Pchl(ide) forms in vivo. Theamounts and the ratios of these forms depended on themolar numbers of Triton X-100, Pchl and water. In addi-tion, the preparation of the solutions was important, i.e.at what phase of the preparation were Pchl or buffer addedto the solutions.
The short wavelength forms emitting at 631–635 nm hadPchl in a monomeric state. The fluorescence lifetime valueof these forms were around 5 ns in all systems. A secondpopulation of Pchl forms had an emission maximum ofbetween 645 and 660 nm, which can correspond to oligomeric
B. Mysliwa-Kurdziel et al. / Journal of Photochemistry and Photobiology B: Biology 86 (2007) 262–271 271
aggregates of Pchl. These oligomers appeared in dynamicstructures, their abundance being strongly influenced by themolar ratios of the micellar systems. They were only stablein directly prepared, undiluted samples. The formation ofthese complexes was stimulated by direct Pchl–Pchl, Pchl–Triton X-100 interactions and/or by the geometry given bythe micellar structures. Due to effective energy migrationand the dynamic nature of the micellar solution, the exact life-time values of these forms could not be identified.
Long wavelength emitting Pchl forms were present in allTriton X-100 containing solutions. They were identified ashydrated molecular stacks of Pchl, which cannot be effi-ciently solubilized either with abundant amounts of TritonX-100 micelles or with a buffer. Despite the similar steady-state characteristics of these aggregates, their fluorescencedecay can be mono- or double-exponential, depending onthe conditions (molecular environment, size/geometry ofthe aggregates, preparation of the samples).
Triton X-100 solutions proved to be good models ofPchl or Pchl(ide) containing native membrane systems.The dynamic structures induced in these solutions are goodmodels of the lipid environment present in EPIMs. Theseresults show that besides steady state fluorescence, fluores-cence lifetime measurements are needed for a precise char-acterization of Pchl or Pchl(ide) forms.
5. Abbreviations
BChl bacteriochlorophyllCD circular dichroismChl chlorophyllCMC critical micellar concentrationEPIMs etioplast inner membranesPchl protochlorophyllPchlide protochlorophyllidePchl(ide) undefined mixture of Pchl and Pchlide
Acknowledgements
This work was financed from the budget of the PolishMinistry of Science for the years 2005–2008 under theProject No: 2 P04 A 063 28 and by the Hungarian ScientificResearch Fund (OTKA), Grant number: T038003.B.M.-K. was the recipient of a Scholarship of the Rectorof the Jagiellonian University in the academic years2004–2006.
References
[1] C. Houssier, K. Sauer, Biochim. Biophys. Acta 172 (1969) 476–491.[2] B. Boddi, F. Lang, J. Soos, Plant Sci. Lett. 16 (1979) 75–79.[3] C. Sundqvist, H. Ryberg, Physiol. Plant. 59 (1983) 42–45.[4] H. Ryberg, C. Liljenberg, C. Sundqvist, Physiol. Plant. 50 (1980)
333–339.[5] C. Sundqvist, H. Ryberg, B. Boddi, F. Lang, Physiol. Plant. 48 (1980)
297–301.[6] B. Boddi, A. Lindsten, M. Ryberg, C. Sundqvist, Physiol. Plant. 76
(1989) 135–143.
[7] K. Solymosi, K. Martinez, C. Sundqvist, B. Boddi, Physiol. Plant. 121(2004) 520–529.
[8] J. Kruk, J. Photochem. Photobiol. B: Biol. 80 (2005) 187–194.[9] K. Solymosi, B. Boddi, Tree Physiol. 26 (2006) 1075–1085.
[10] K. Solymosi, K. Boka, B. Boddi, Tree Physiol. 26 (2006) 1087–1096.[11] W. Hendrich, B. Bereza, Photosynthetica 28 (1993) 1–16.[12] B. Boddi, Human Environ. Sci. 3 (1994) 39–55.[13] B. Boddi, M. Ryberg, C. Sundqvist, J. Photochem. Photobiol. B: Biol.
12 (1992) 389–401.[14] B. Boddi, M. Ryberg, C. Sundqvist, J. Photochem. Photobiol. 21
(1993) 125–133.[15] B. Boddi, F. Franck, J. Photochem. Photobiol. B: Biol. 41 (1997) 73–82.[16] A.C. van Bochove, W.T. Griffiths, R. van Grondelle, Photochem.
Photobiol. 39 (1984) 101–106.[17] B. Mysliwa-Kurdziel, F. Franck, K. Strzałka, Photochem. Photobiol.
70 (1999) 616–623.[18] B. Mysliwa-Kurdziel, M.R. Amirjani, K. Strzałka, C. Sundqvist,
Photochem. Photobiol. 78 (2003) 205–215.[19] B. Mysliwa-Kurdziel, J. Kruk, K. Strzałka, Photochem. Photobiol. 79
(2004) 62–67.[20] J. Gottstein,H.Scheer,Proc.Natl.Acad.Sci.USA80(1983)2231–2234.[21] A. Scherz, V. Rosenbach-Belkin, Proc. Natl. Acad. Sci. USA 86
(1989) 1505–1509.[22] A. Scherz, V. Rosenbach-Belkin, J.R.E. Fisher, Proc. Natl. Acad. Sci.
USA 87 (1990) 5430–5434.[23] A. Agostiano, L. Catucci, G. Colafemmina, M. Della Monica,
Biophys. Chem. 60 (1996) 17–27.[24] A. Agostiano, L. Catucci, G. Colafemmina, H. Scheer, J. Phys.
Chem. 106 (2002) 1446–1454.[25] A.K. Chibisov, T.D. Slavnova, H. Gorner, J. Photochem. Photobiol.
72 (2003) 11–16.[26] A. Scherz, V. Rosenbach-Belkin, J.R.E. Fisher, in: H. Scheer (Ed.),
Chlorophylls, CRC Press, Boca Raton, 1991, pp. 238–268.[27] C.J. Seliskar, B. Ke, Biochim. Biophys. Acta 153 (1968) 685–691.[28] C. Houssier, K. Sauer, Biochim. Biophys. Acta 172 (1969) 492–502.[29] M. Brouers, Photosynthetica 6 (1972) 415–423.[30] A. Rasquain, C. Houssier, C. Sironval, Biochim. Biophys. Acta 462
(1977) 622–641.[31] K. Kotzabasis, M. Senge, B. Seyfried, H. Senger, Photochem.
Photobiol. 52 (1990) 95–101.[32] J. Kruk, B. Mysliwa-Kurdziel, Chromatographia 60 (2004) 117–123.[33] B. Boddi, J. Soos, F. Lang, Biochim. Biophys. Acta 593 (1980) 158–
165.[34] B. Boddi, E. Rakasz, F. Lang, Photobiochem. Photobiophys. 5 (1983)
27–33.[35] B. Boddi, Y. Shioi, Biochim. Biophys. Acta 1015 (1990) 116–120.[36] B. Boddi, K. Kovacs, F. Lang, Biochim. Biophys. Acta 722 (1983)
320–326.[37] A. Helenius, K. Simons, Biochim. Biophys. Acta 415 (1975) 29–79.[38] R.J. Robson, E.A. Dennis, J. Phys. Chem. 81 (1977) 1075–1078.[39] J.R. Lakowicz, E. Gratton, G. Laczko, H. Cherek, M. Limkeman,
Biophys. J. 46 (1984) 463–477.[40] E. Gratton, D.M. Jameson, R.D. Hall, Annu. Rev. Biophys. Bioeng.
13 (1984) 105–124.[41] C. Houssier, K. Sauer, J. Am. Chem. Soc. 92 (1970) 779–791.[42] J.S. Connolly, E.B. Samuel, A.F. Janzen, Photochem. Photobiol. 36
(1982) 565–574.[43] J.S. Connolly, A.F. Janzen, E.B. Samuel, Photochem. Photobiol. 36
(1982) 559–563.[44] B. Valeur, Molecular Fluorescence Principles and Application, first
ed., Willey, New York, 2005.[45] M.R. Eftink, C.A. Ghiron, Photochem. Photobiol. 45 (1987) 745–748.[46] C. Sundqvist, C. Dahlin, Physiol. Plant. 100 (1997) 748–759.[47] A.J. Alfano, F.E. Lytle, M.S. Showell, F.K. Fong, J. Chem. Phys. 82
(1985) 758–764.[48] J.J. Katz, M.K. Bowman, T.J. Michalski, D.L. Worcester, in: H. Scheer
(Ed.), Chlorophylls, CRC Press, Boca Raton, 1991, pp. 212–235.[49] M. Brouers, Photosynthetica 9 (1975) 304–310.
Related Documents