Proteomics & Neurodegenerative Disorders Simonetta Sipione 9-21 Medical Sciences Building Email: [email protected] Genome Transcriptome Proteome Metabolome DNA mRNA proteins metabolites The full complement of proteins produced by a particular genome The full complement of expressed mRNA The complete complement of all small molecule (<1500 Da) metabolites found in a specific cell, organ or organism.

Welcome message from author
This document is posted to help you gain knowledge. Please leave a comment to let me know what you think about it! Share it to your friends and learn new things together.
Transcript

Proteomics
&
Neurodegenerative Disorders
Simonetta Sipione9-21 Medical Sciences Building
Email: [email protected]
Genome Transcriptome Proteome Metabolome
DNA mRNA proteins metabolites
The full complement of
proteins produced by a
particular genome
The full complement
of expressed mRNA
The complete complement of
all small molecule (<1500 Da)
metabolites found in a specific
cell, organ or organism.

Genome Transcriptome Proteome Metabolome
DNA mRNA proteins metabolites
Functional Genomics

Databases
Mathematical modeling
Analysis
Transcriptomics
Proteomics
Metabolomics
Geno
mics
Systems
Biology
Classical protein biochemistry
versus proteomics…

Proteomics Applications
Protein expression
profiling
Clinical proteomics Disease proteomics
Protein-protein interactions
Biomarkers
discovery
Drug
development
Disease
mechanisms
Proteomics Flow Chart
Biological Sample
Protein Separation
Preparation for
quantitation
Mass spectrometry
analysis
Data analysis
Protein identification
& quantification
2D-electrophoresis
Excision &
trypsin digestion
Liquid chromatography

Protein separation methods
Two-dimensional gel electrophoresis (2-DE)
One- and two-dimensional liquid chromatography
(1D-LC and 2D-LC)
Biological Sample
Protein Separation
Preparation for
quantitation
Mass spectrometry
analysis
Data analysis
Separation by 2D-electrophoresis
Maldi-TOF
Mass spectrometry
&
Trypsin digestion
Separation by 2D-electrophoresis
Isoelectric focusing(pH)
SD
S-P
AG
E
(siz
e)
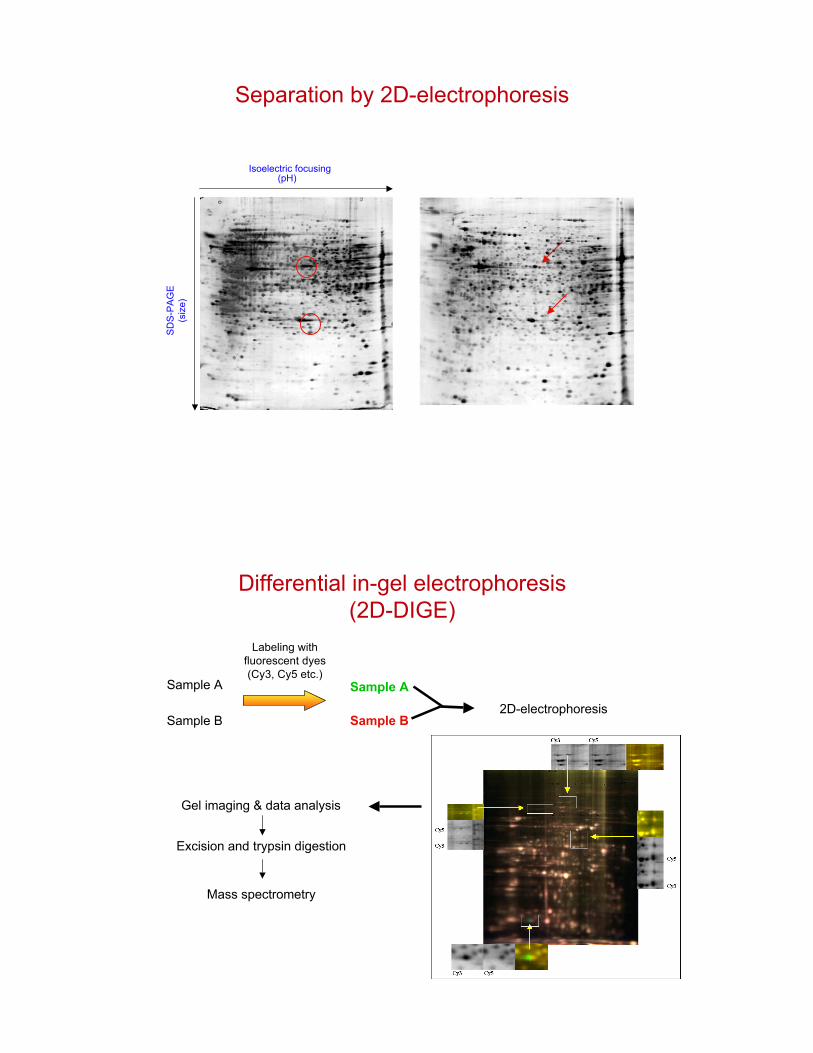
Sample A
Sample B
Labeling with
fluorescent dyes
(Cy3, Cy5 etc.)
Sample A
Sample B
Differential in-gel electrophoresis
(2D-DIGE)
2D-electrophoresis
Gel imaging & data analysis
Excision and trypsin digestion
Mass spectrometry

Separation by 1D and 2D liquid chromatography
Mass spectrometry
1D-LC: peptide mixture are separated based
on hydrophobicity.
2D-LC: isoelectric chromatography followed by
separation by hydrophobicity (MudPIT -
“multidimensional protein identification technology”)
Mass Spectrometry Techniques
Matrix-assisted laser desorption ionization
(MALDI) time-of-flight (TOF) mass
spectrometry (MS) (MALDI-TOF MS)
Electrospray ionization (ESI) MS (1D-LC and 2D-LC)
Biological Sample
Protein Separation
Preparation for
quantitation
Mass spectrometry
analysis
Data analysis

Mass Spectrometry Techniques
www.udel.edu/.../ websites/Lloyd/MALDI
MALDI-TOF MS
www.chm.bris.ac.uk/ ms/theory/esi-ionisation.html
Mass Spectrometry Techniques
ESI MS

Micro-Sequencing by Tandem Mass Spectrometry
(MS/MS)
• Ions of interest are selected in the first mass analyzer
• Collision Induced Dissociation (CID) is used to fragment the selected ions by colliding the ionswith gas (typically Argon for low energy CID)
• The second mass analyzer measures the fragment ions
• Fragmentation of peptides (amino acid chains) typically occurs along the peptide backbone. Eachresidue of the peptide chain successively fragments off, both in the N->C and C->N direction.
MALDI-MS
ESI-MSMS
Argon
Collision Cell
Sequence Nomenclature for Mass Ladder
H2NHC C
O
R1
HN
HC
R2
C
O
HN
HC
R3
C
O
HN CH
R4
C
O
OH
a1 a3a2 b3b2b1 c2c2c1
x1 x3x2 y3y2y1 z2z2z1
1598
14241166 965
723529401
TGPNLHGFGRR
GR FGRGFGR etc
Second Stage (fragmentation) Mass Spectrum
m/z75 2000
GDVEKGKKIFVQKC
AQCHTVEKGGKHKT
GPNLHGLFGRKTGQ
APGFTYTDANKNKGI
TWKEETLMEYLENP
KKYIPGTKMIFAGIKK
KTEREDLIAYLKKAT
NE
TGPNLHGLFGR
Protein Sequence
Data analysis and
database search
(MASCOT Engine)

AAT = !1-anti-trypsin ABC = !B-crystallin
Quantitative proteomics
Biological Sample
Protein Separation
Preparation for
quantitation
Mass spectrometry
analysis
Data analysis
ICAT

Sample A
Labeling of Cys with
ICAT reagent
Sample A“heavy”
Quantitative Proteomics:
Isotope-coded affinity tags (ICAT)
Digestion & LC/MS/MS separation
Sample B
2H2H2H
1H1H1H
+ +
Sample B“light”
Quantitative Proteomics:
Isotope-coded affinity tags (ICAT)

Analysis of protein interactions

In situ proteomics
MALDI-TOF MS
Matrix application
Frozen section MS images
Laser
Nature Medicine 7, 493 - 496 (2001)
In situ proteomics
Nature Medicine 7, 493 - 496 (2001)

Further reading
David DC, Hoerndli F, Gotz J. Functional Genomics meets neurodegenerative disorders.
Part I: transcriptomic and proteomic technology.
Prog Neurobiol. 2005 Jun;76(3):153-68.
Hoerndli F, David DC, Gotz J. Functional Genomics meets neurodegenerative disorders.
Part II: application and data integration.
Prog Neurobiol. 2005 Jun;76(3):169-88.
Related Documents