Proteomics Informatics – Overview of Mass spectrometry (Week 2) Ion Source Mass Analyz er Detect or mass/charge intensity

Proteomics Informatics – Overview of Mass spectrometry (Week 2) Ion Source Mass Analyzer Detector mass/charge intensity.
Dec 22, 2015
Welcome message from author
This document is posted to help you gain knowledge. Please leave a comment to let me know what you think about it! Share it to your friends and learn new things together.
Transcript

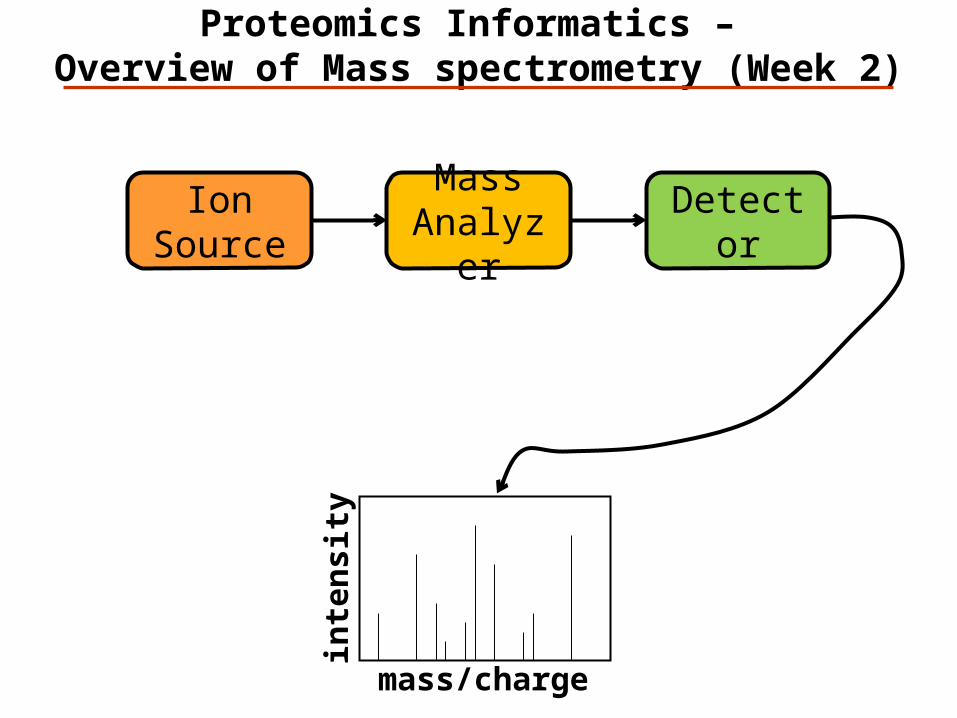
Proteomics Informatics – Overview of Mass spectrometry (Week 2)
Ion Source
Mass Analyzer
Detector
mass/charge
inte
nsi
ty
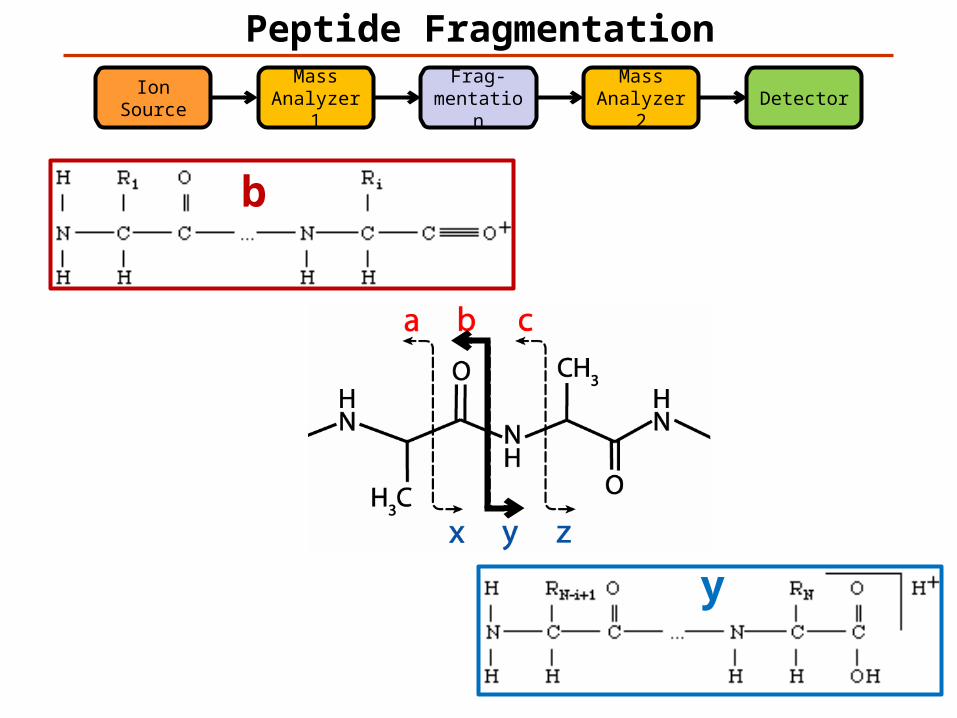
Peptide FragmentationMass
Analyzer 1Frag-
mentationDetector
Ion Source
Mass Analyzer 2
b
y
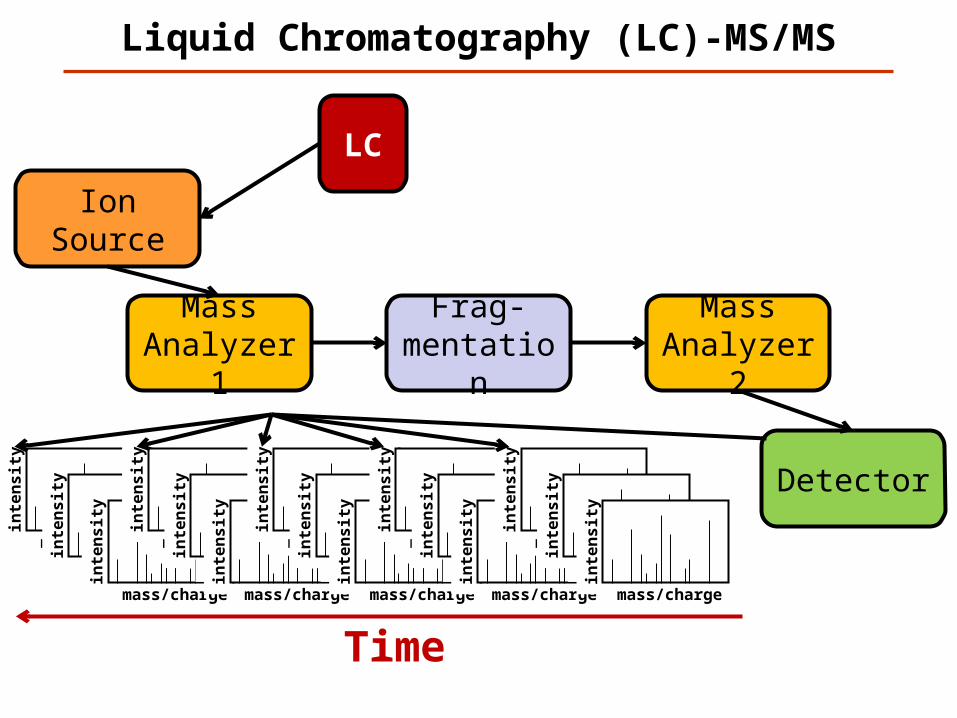
Liquid Chromatography (LC)-MS/MS
Mass Analyzer 1
Frag-mentation
Detector
inte
ns
ity
mass/charge
Ion Source
Mass Analyzer 2
LC
inte
ns
ity
mass/chargeinte
ns
ity
mass/charge
inte
ns
ity
mass/chargeinte
ns
ity
mass/chargeinte
ns
ity
mass/charge
Time
inte
ns
ity
mass/chargeinte
ns
ity
mass/chargeinte
ns
ity
mass/charge
inte
ns
ity
mass/chargeinte
ns
ity
mass/chargeinte
ns
ity
mass/charge
inte
ns
ity
mass/chargeinte
ns
ity
mass/chargeinte
ns
ity
mass/charge
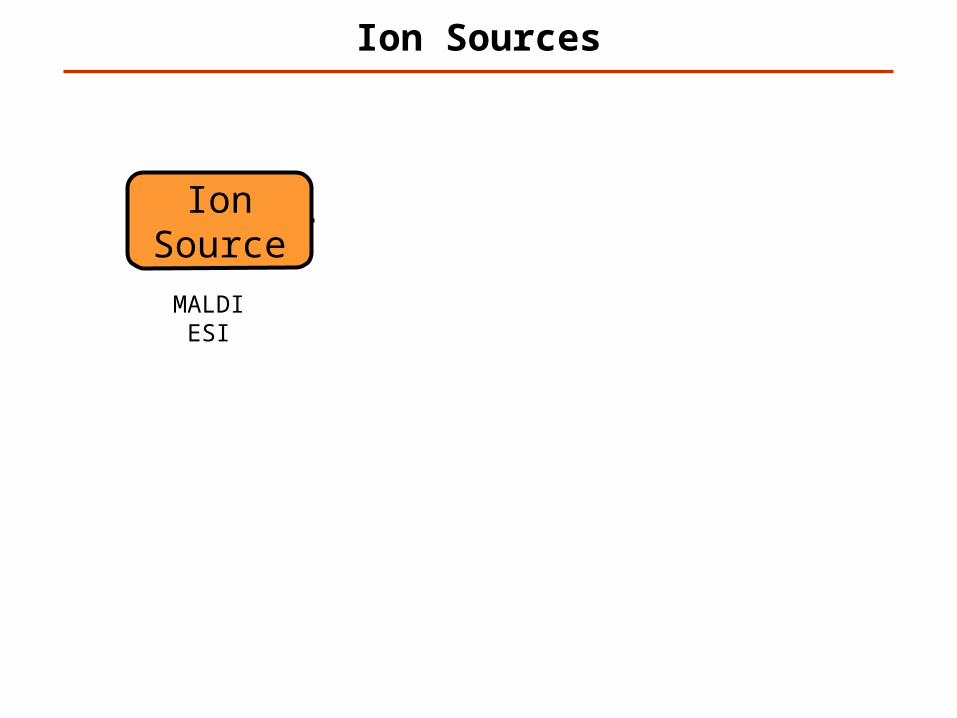
Ion Sources
Ion Source
Mass Analyzer
Detector
MALDIESI
mass/charge
inte
nsi
ty
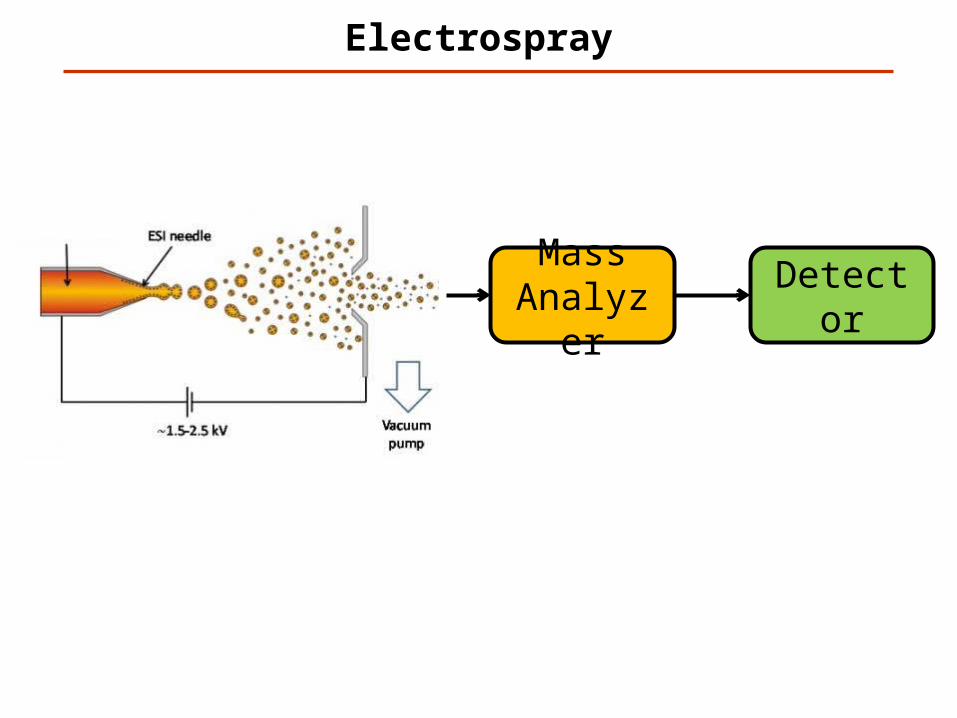
Electrospray
Mass Analyzer
Detector
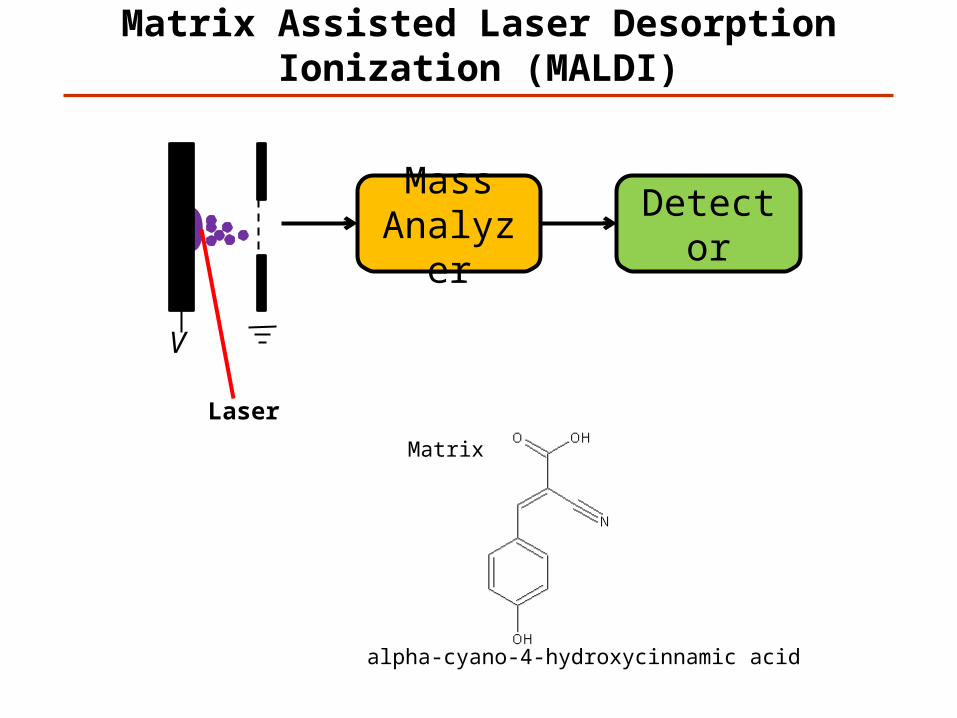
Matrix Assisted Laser Desorption Ionization (MALDI)
alpha-cyano-4-hydroxycinnamic acid
Matrix
Laser
V
Mass Analyzer
Detector
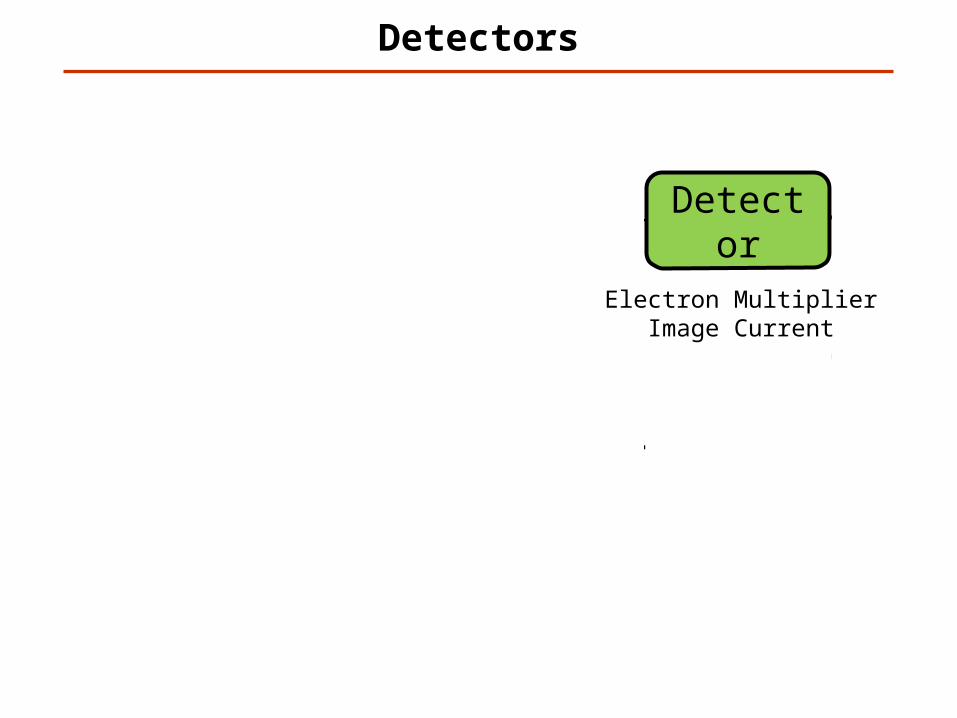
Detectors
Ion Source
Mass Analyzer
Detector
mass/charge
inte
nsi
tyElectron Multiplier
Image Current
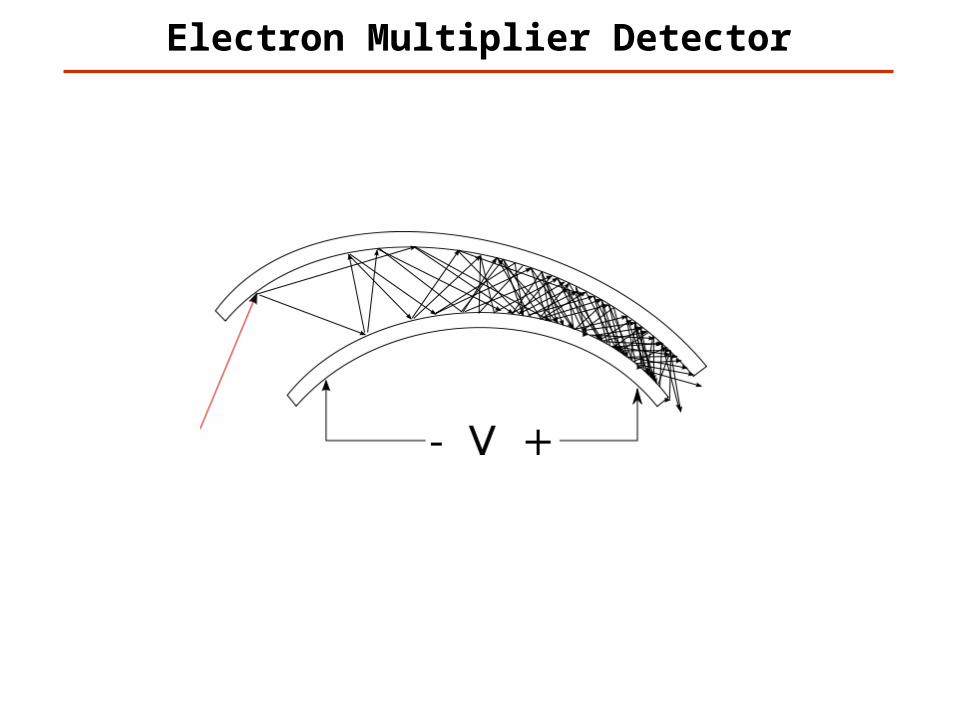
Electron Multiplier Detector
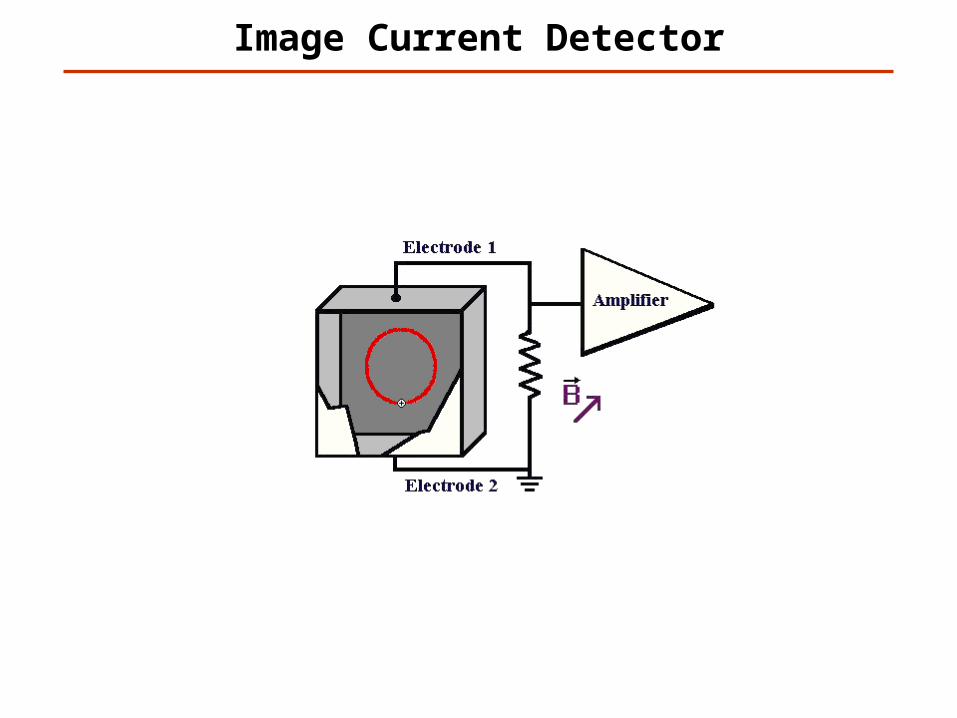
Image Current Detector
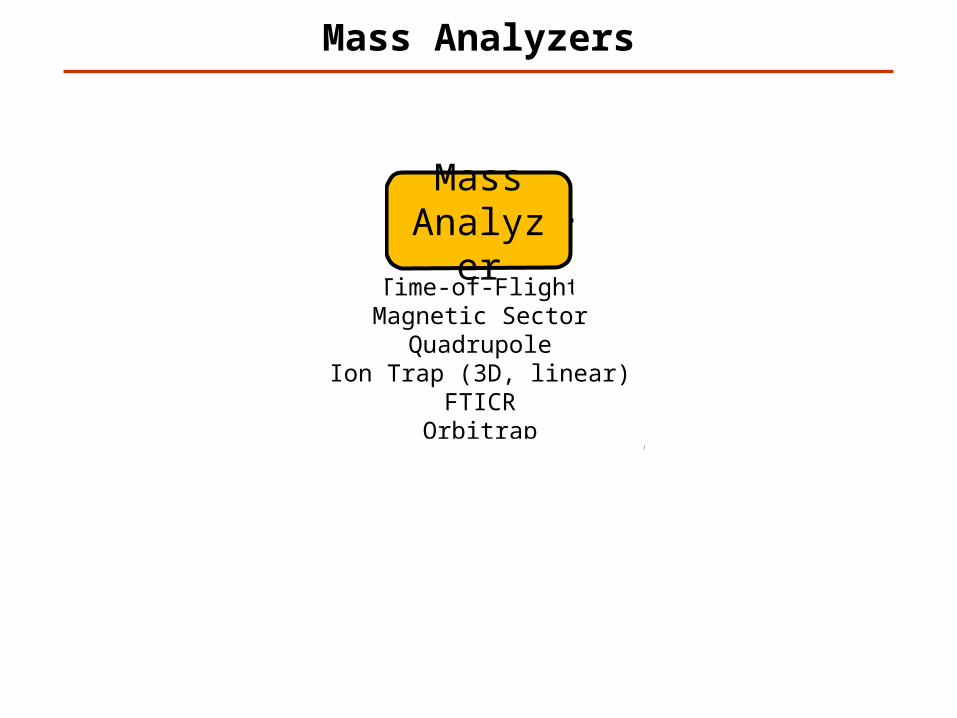
Mass Analyzers
Ion Source
Mass Analyzer
Detector
Time-of-FlightMagnetic Sector
QuadrupoleIon Trap (3D, linear)
FTICROrbitrap
mass/charge
inte
nsi
ty
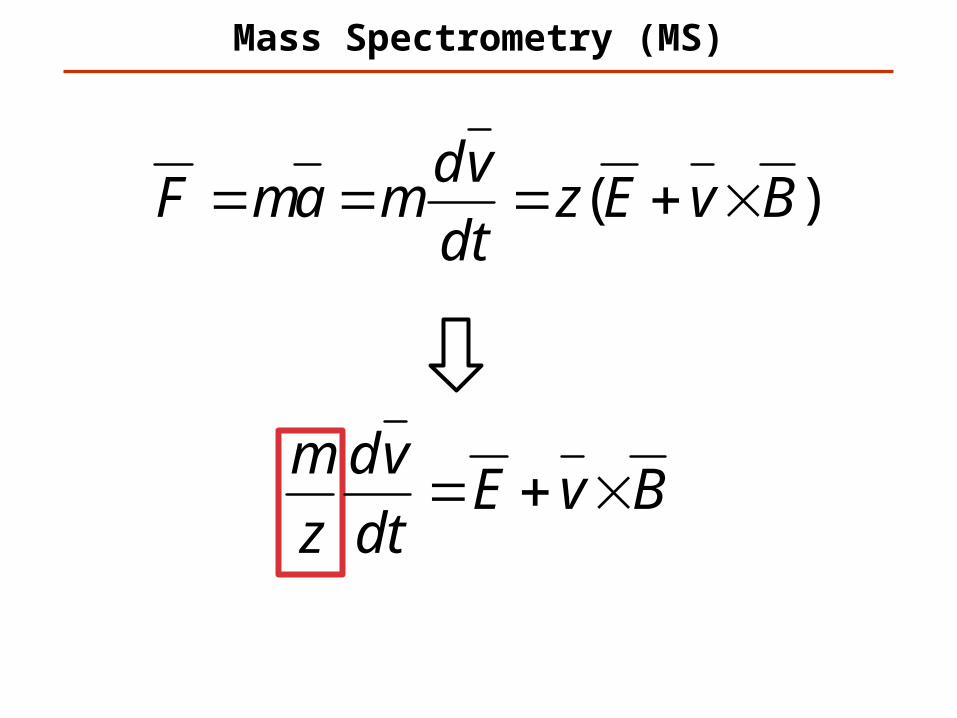
Mass Spectrometry (MS)
)( BvEzdt
vdmamF
BvEdt
vd
z
m
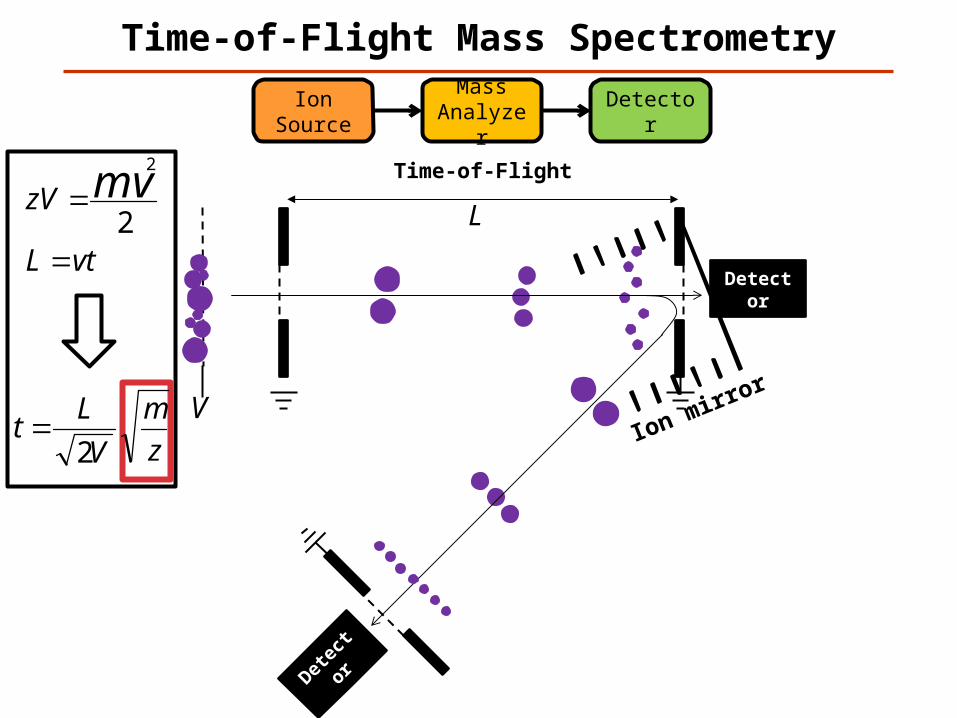
Time-of-Flight Mass Spectrometry
Ion Source
Mass Analyzer
Detector
Time-of-Flight
Detector
Detec
tor
Ion mirror
vtL
zV mv
2
2
L
z
m
V
Lt
2
V
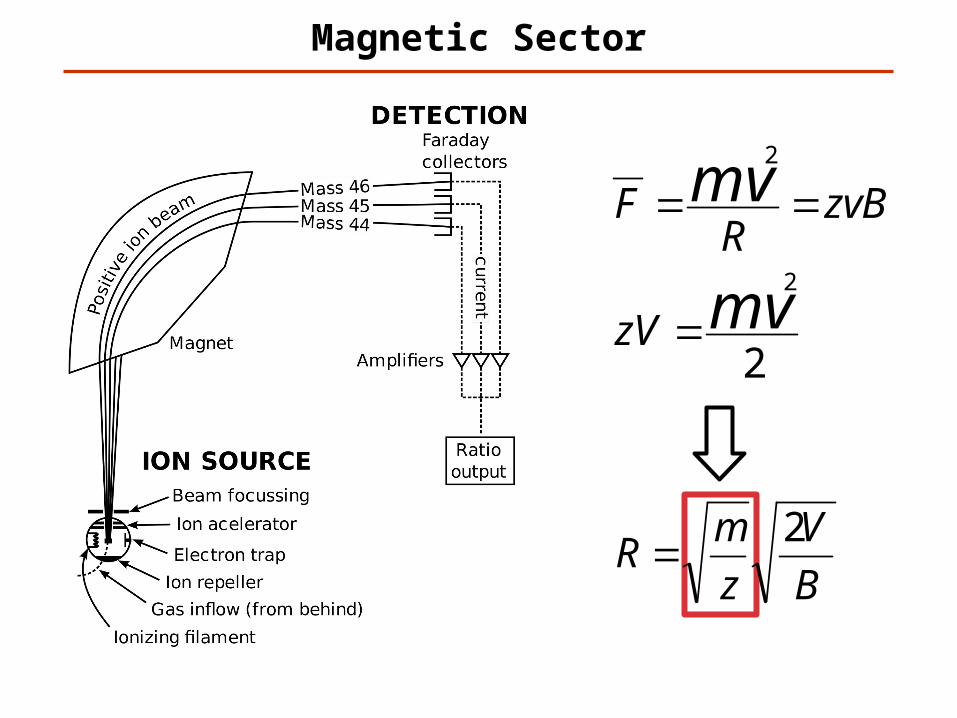
Magnetic Sector
2
2
2
mv
mv
zV
zvBR
F
B
V
z
mR
2
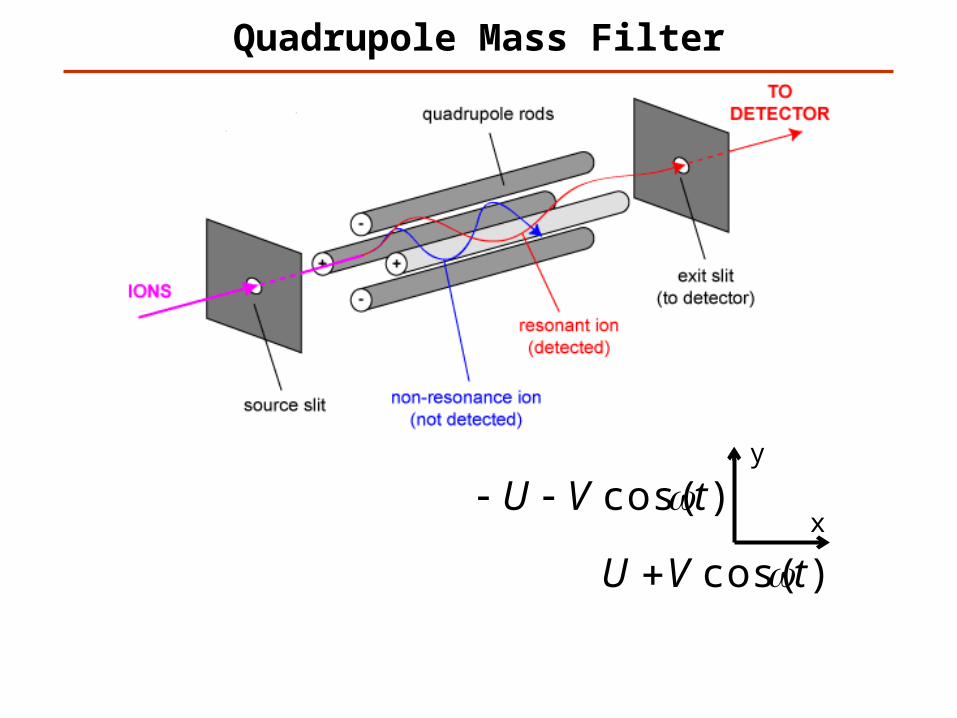
Quadrupole Mass Filter
y
x
)cos( tVU
)cos( tVU
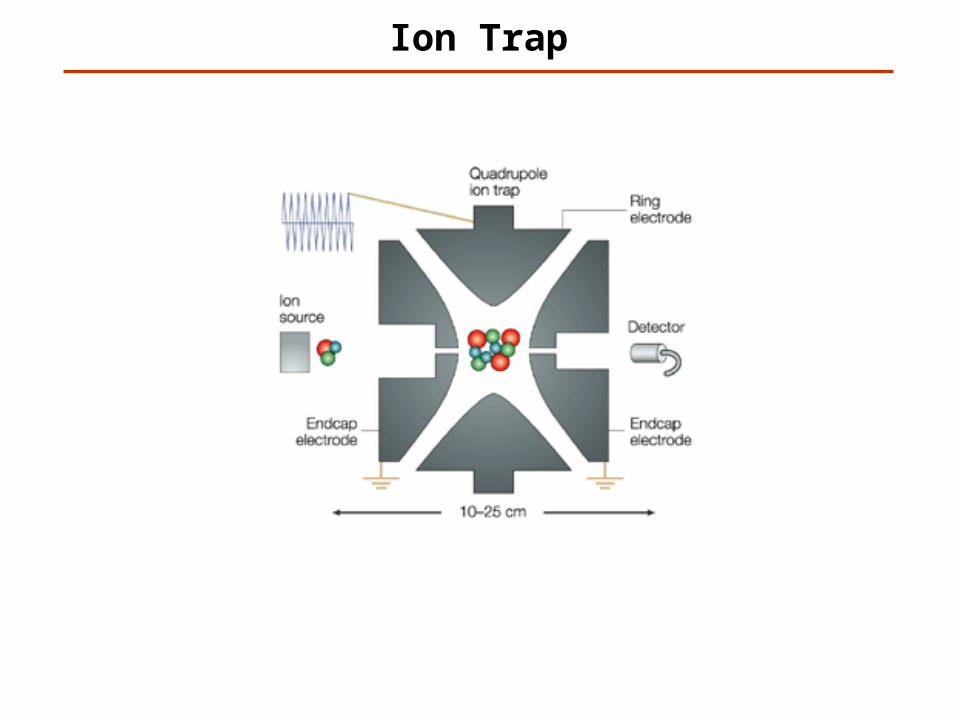
Ion Trap
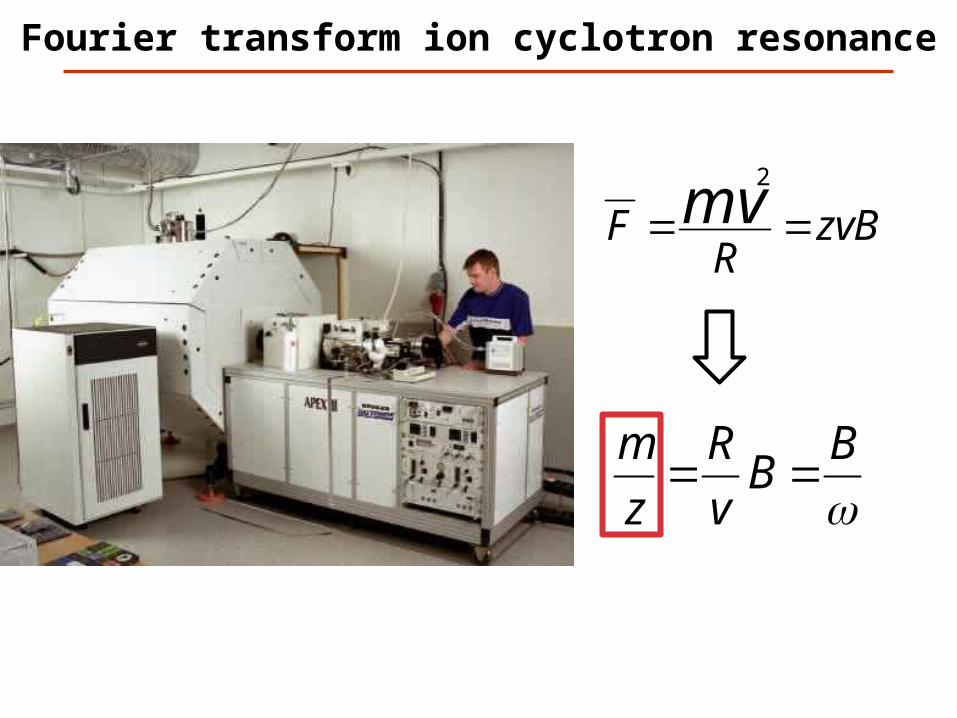
Fourier transform ion cyclotron resonance
zvBR
F mv 2
B
Bv
R
z
m

Orbitrap
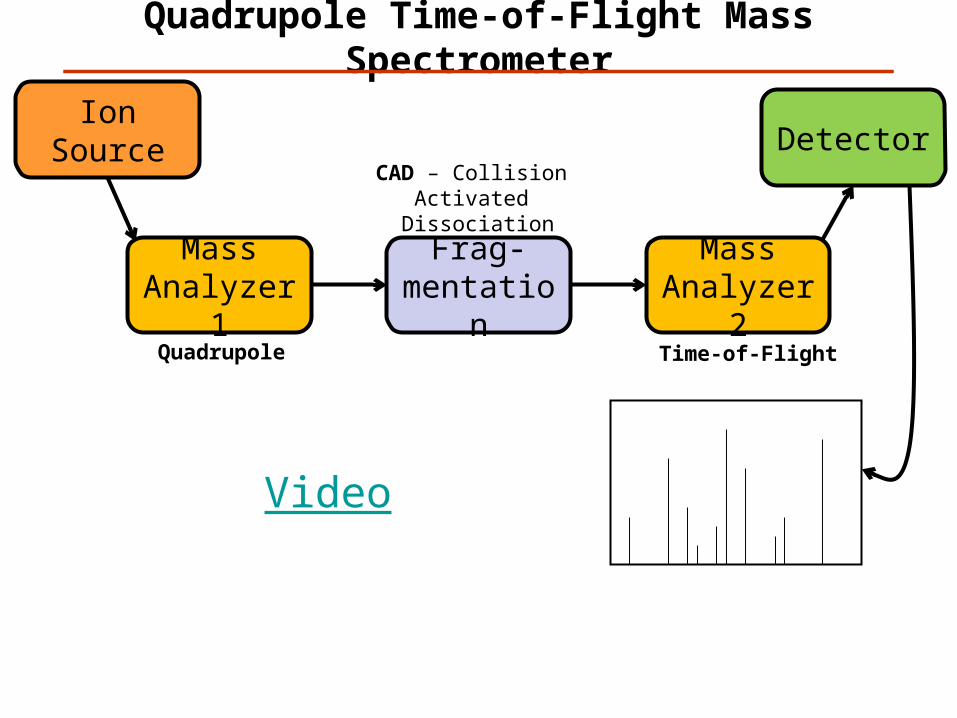
Quadrupole Time-of-Flight Mass Spectrometer
Video
Mass Analyzer 1
Frag-mentation
DetectorIon Source
Mass Analyzer 2
CAD – Collision Activated
Dissociation
Quadrupole Time-of-Flight
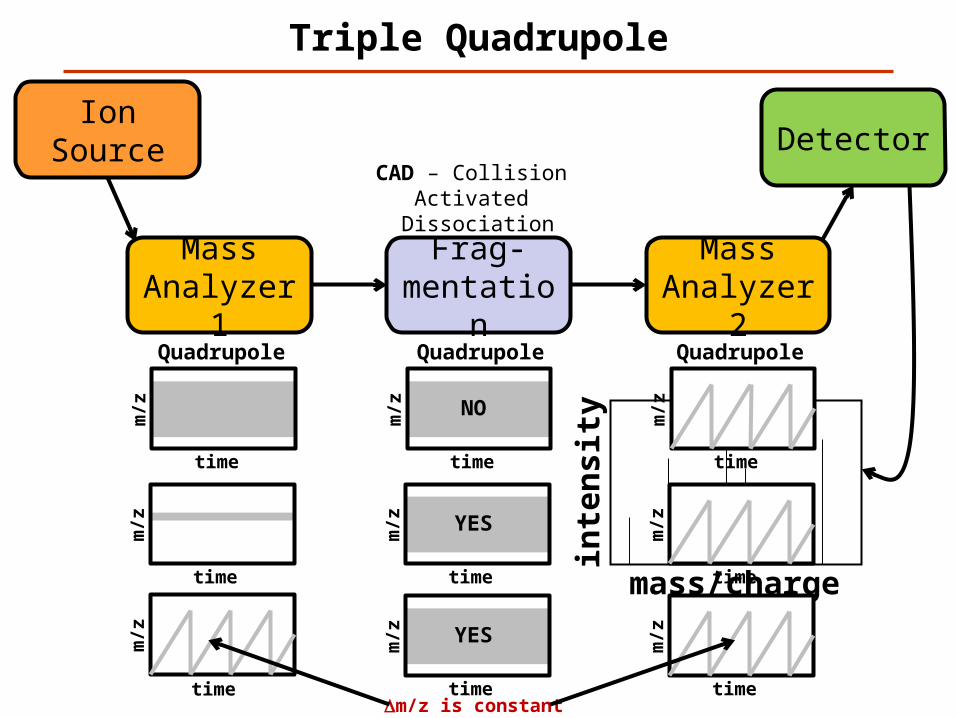
Triple Quadrupole
Mass Analyzer 1
Frag-mentation
Detector
mass/chargein
ten
sity
Ion Source
Mass Analyzer 2
CAD – Collision Activated
Dissociation
Quadrupole Quadrupole Quadrupole
time
m/z
time
m/z
time
m/z
time
m/z
time
m/z
time
m/z
NO
YES
time
m/z
time
m/z YESm/z
timeDm/z is constant
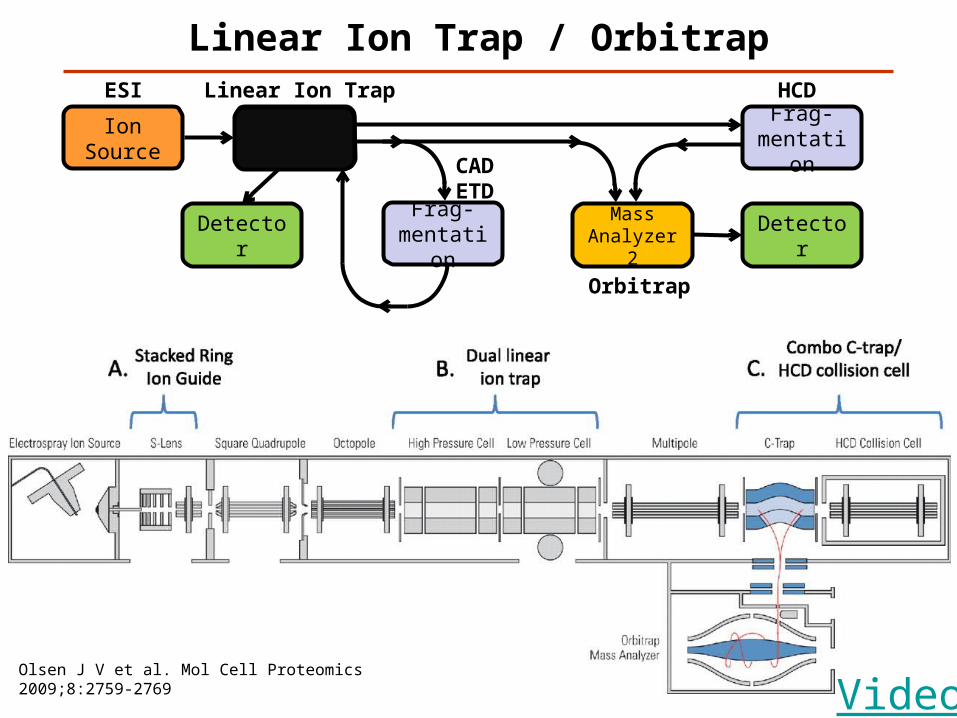
Linear Ion Trap / Orbitrap
Mass Analyzer 1
Frag-mentation
Detector
Ion Source
Mass Analyzer 2
ESI Linear Ion Trap
Orbitrap
CADETD
Olsen J V et al. Mol Cell Proteomics 2009;8:2759-2769
Frag-mentation
HCD
Detector
Video
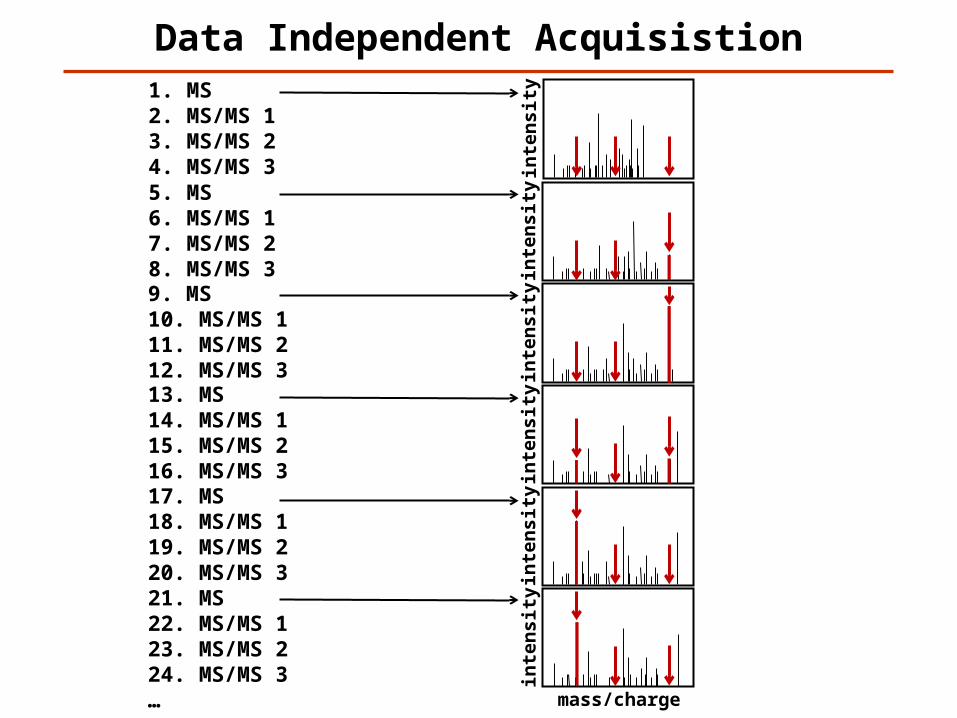
Data Independent Acquisistion
mass/charge
inte
nsi
ty1. MS2. MS/MS 13. MS/MS 24. MS/MS 3
mass/charge
inte
nsi
ty
mass/charge
inte
nsi
tyin
ten
sity
mass/charge
inte
nsi
ty
mass/charge
mass/charge
inte
nsi
ty
5. MS6. MS/MS 17. MS/MS 28. MS/MS 39. MS10. MS/MS 111. MS/MS 212. MS/MS 313. MS14. MS/MS 115. MS/MS 216. MS/MS 317. MS18. MS/MS 119. MS/MS 220. MS/MS 321. MS22. MS/MS 123. MS/MS 224. MS/MS 3…
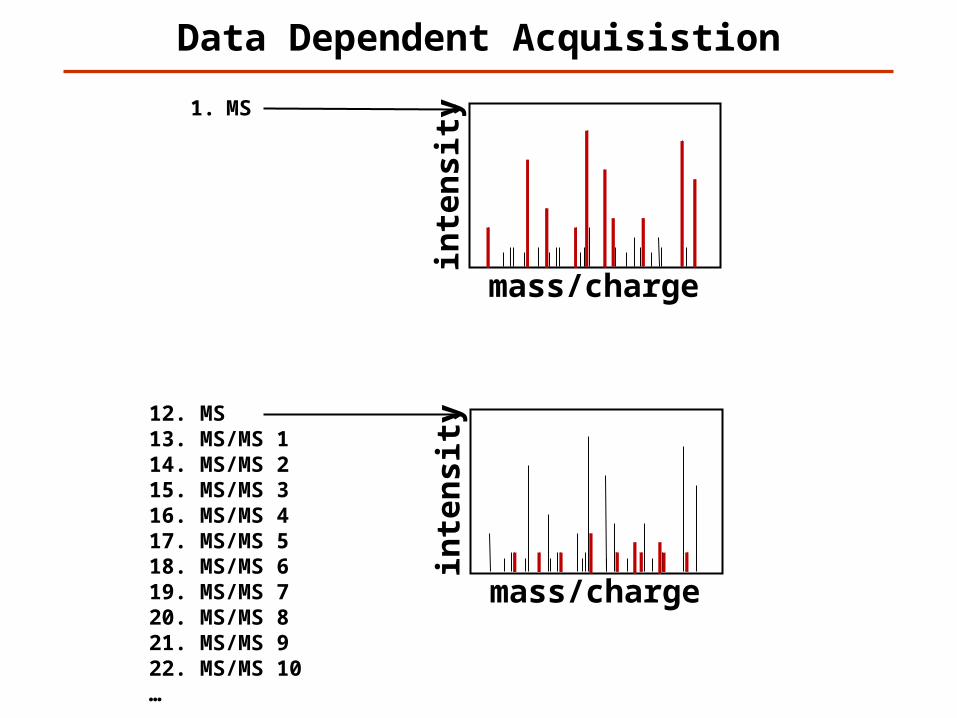
1. MS2. MS/MS 13. MS/MS 24. MS/MS 35. MS/MS 46. MS/MS 57. MS/MS 68. MS/MS 79. MS/MS 810. MS/MS 911. MS/MS 10
Data Dependent Acquisistion
mass/charge
inte
nsi
ty
mass/charge
inte
nsi
ty12. MS13. MS/MS 114. MS/MS 215. MS/MS 316. MS/MS 417. MS/MS 518. MS/MS 619. MS/MS 720. MS/MS 821. MS/MS 922. MS/MS 10…
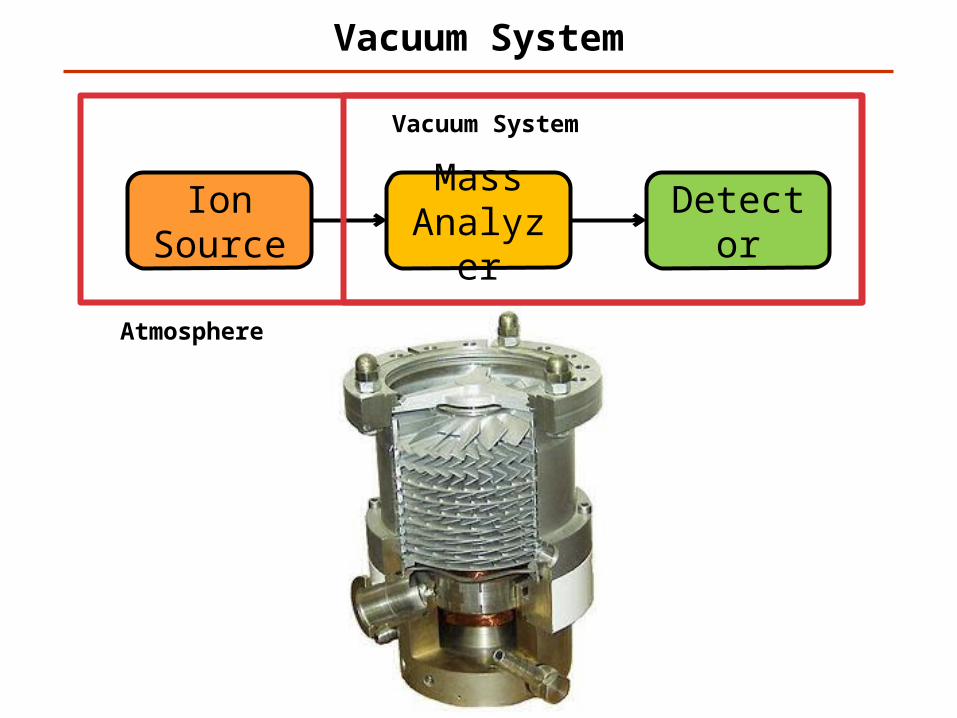
Vacuum System
Ion Source
Mass Analyzer
Detector
Vacuum System
Atmosphere
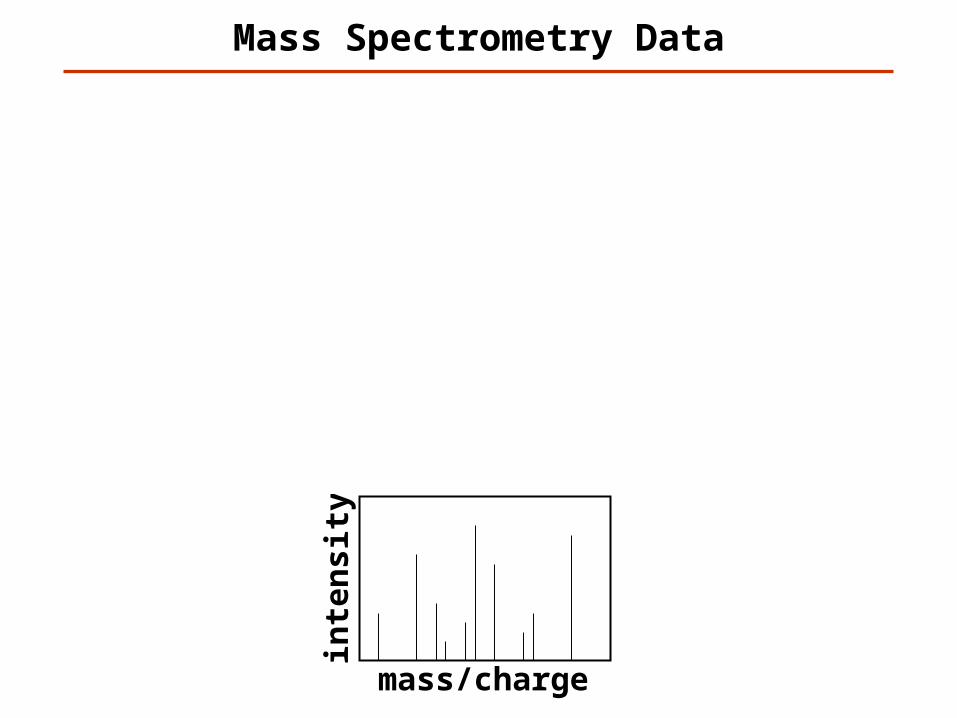
Mass Spectrometry Data
Ion Source
Mass Analyzer
Detector
mass/charge
inte
nsi
ty
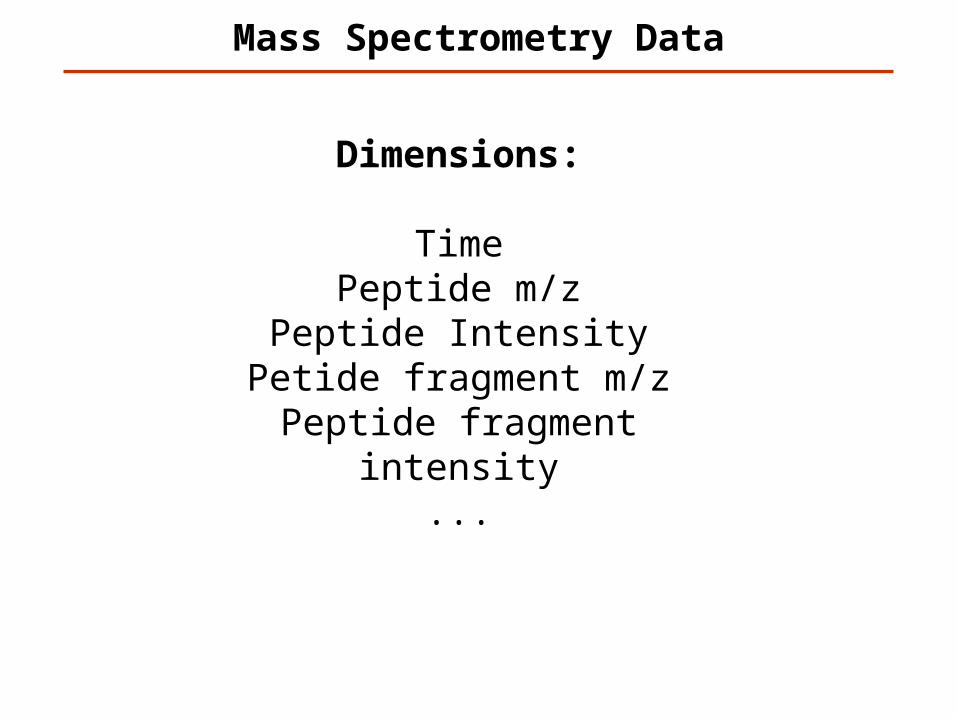
Mass Spectrometry Data
Dimensions:
TimePeptide m/z
Peptide IntensityPetide fragment m/z
Peptide fragment intensity
...
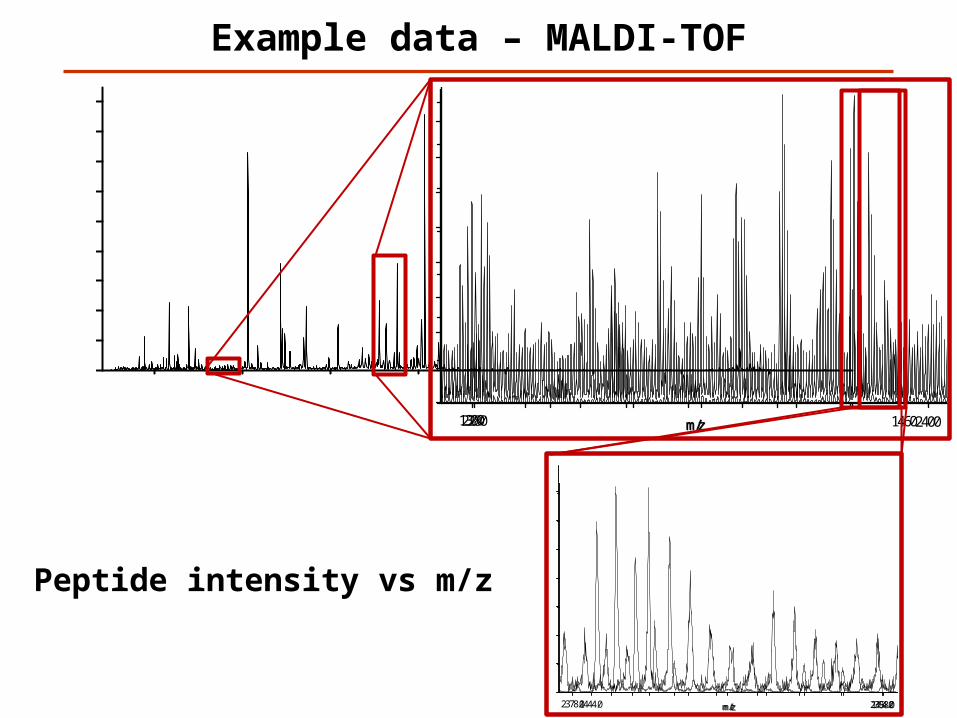
Example data – MALDI-TOF
m/z1000 4500
Inte
nsity
1800
0
D:\Users\Fenyo\Desktop\ATP.txt (15:42 02/03/11)Description: none available m/z2280 2400
Inte
nsi
ty
700
0
D:\Users\Fenyo\Desktop\ATP.txt (15:46 02/03/11)Description: none available
m/z1300 1460In
ten
sity
45
0
D:\Users\Fenyo\Desktop\ATP.txt (15:50 02/03/11)Description: none available
m/z1444.0 1458.0
Inte
nsi
ty
35
0
D:\Users\Fenyo\Desktop\ATP.txt (15:54 02/03/11)Description: none available
m/z2378.0 2394.0
Inte
nsi
ty
700
0
D:\Users\Fenyo\Desktop\ATP.txt (16:07 02/03/11)Description: none available
Peptide intensity vs m/z
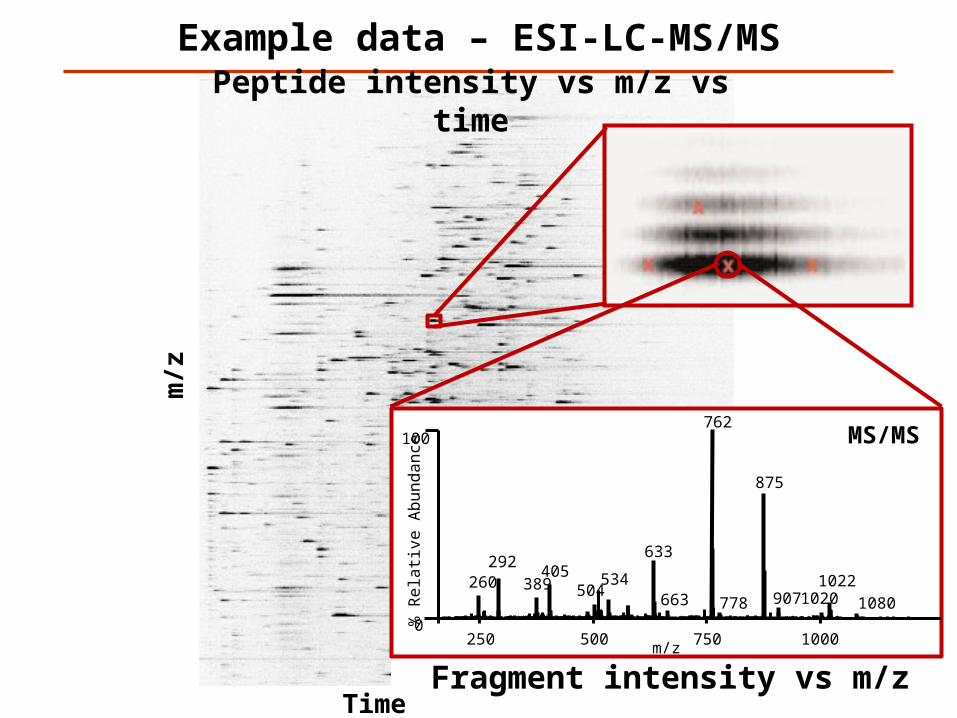
Fragment intensity vs m/z
Example data – ESI-LC-MS/MS
Time
m/z
m/z
% R
ela
tive
Ab
un
da
nce
100
0250 500 750 1000
[M+2H]2+
762
260 389 504
633
875
292405 534
9071020663 778 1080
1022
MS/MS
Peptide intensity vs m/z vs time
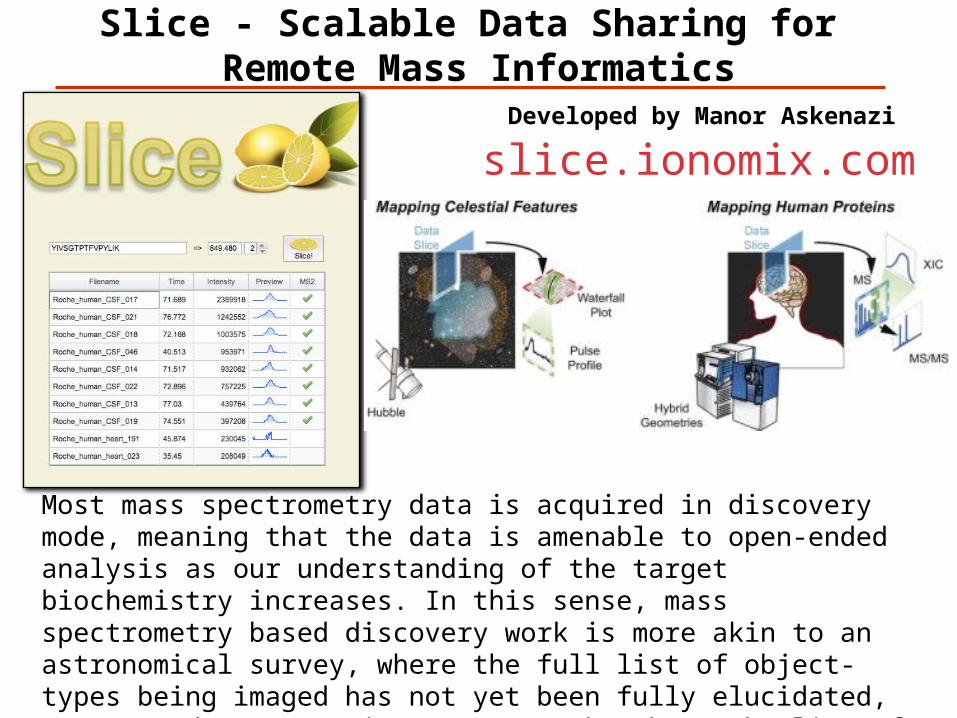
Slice - Scalable Data Sharing for Remote Mass Informatics
Most mass spectrometry data is acquired in discovery mode, meaning that the data is amenable to open-ended analysis as our understanding of the target biochemistry increases. In this sense, mass spectrometry based discovery work is more akin to an astronomical survey, where the full list of object-types being imaged has not yet been fully elucidated, as opposed to e.g. micro-array work, where the list of probes spotted onto the slide is finite and well understood.
slice.ionomix.comDeveloped by Manor Askenazi
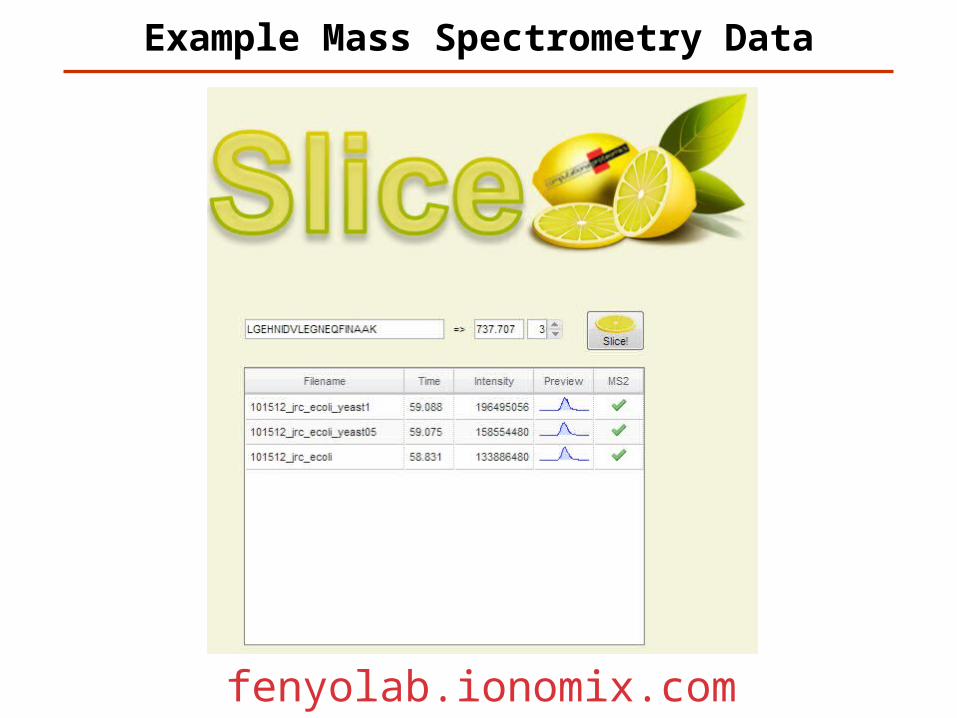
Example Mass Spectrometry Data
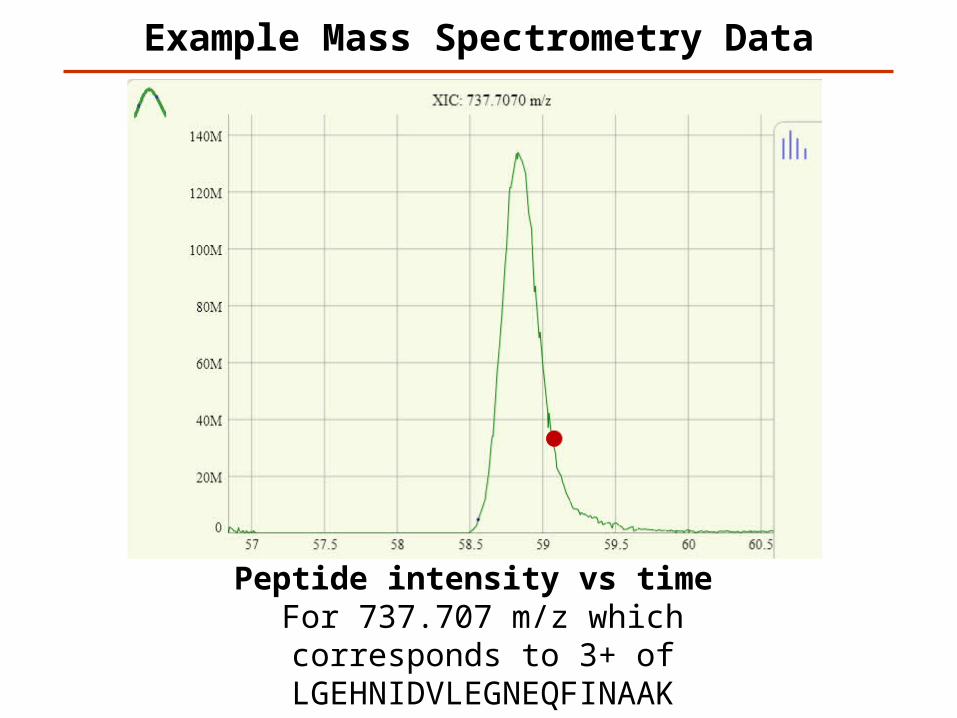
Peptide intensity vs time For 737.707 m/z which corresponds to
3+ of LGEHNIDVLEGNEQFINAAK
Example Mass Spectrometry Data
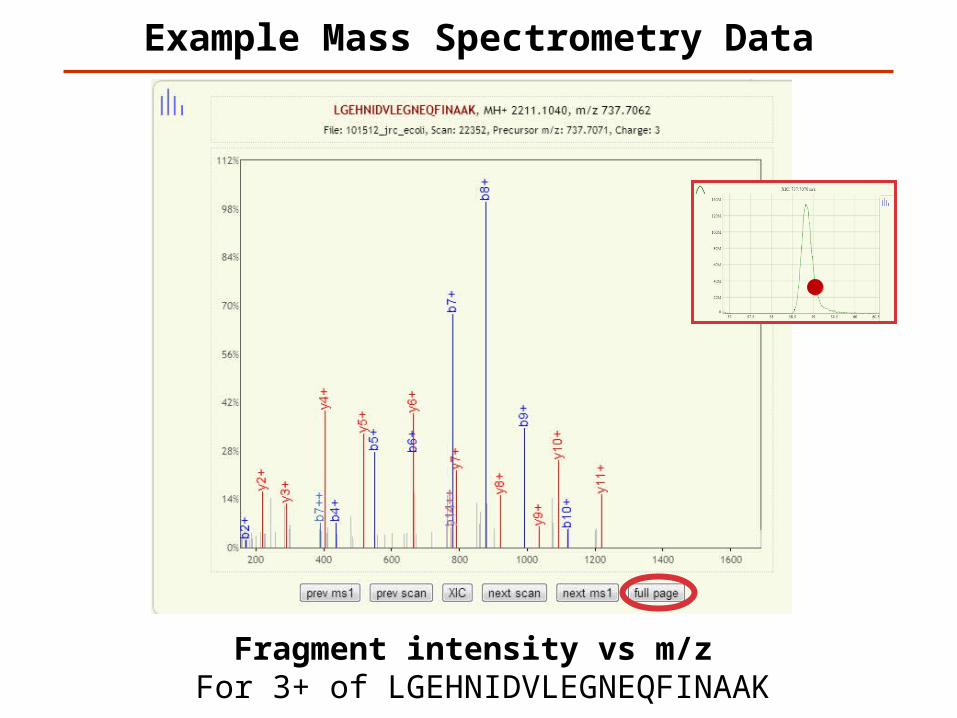
Fragment intensity vs m/z For 3+ of LGEHNIDVLEGNEQFINAAK
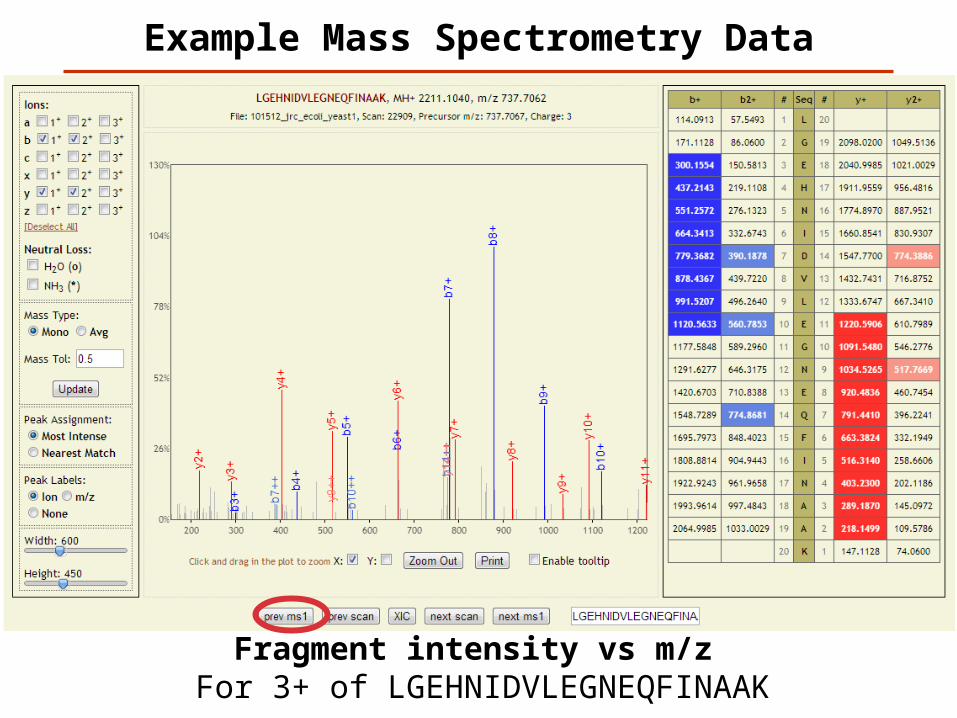
Example Mass Spectrometry Data
Fragment intensity vs m/z For 3+ of LGEHNIDVLEGNEQFINAAK
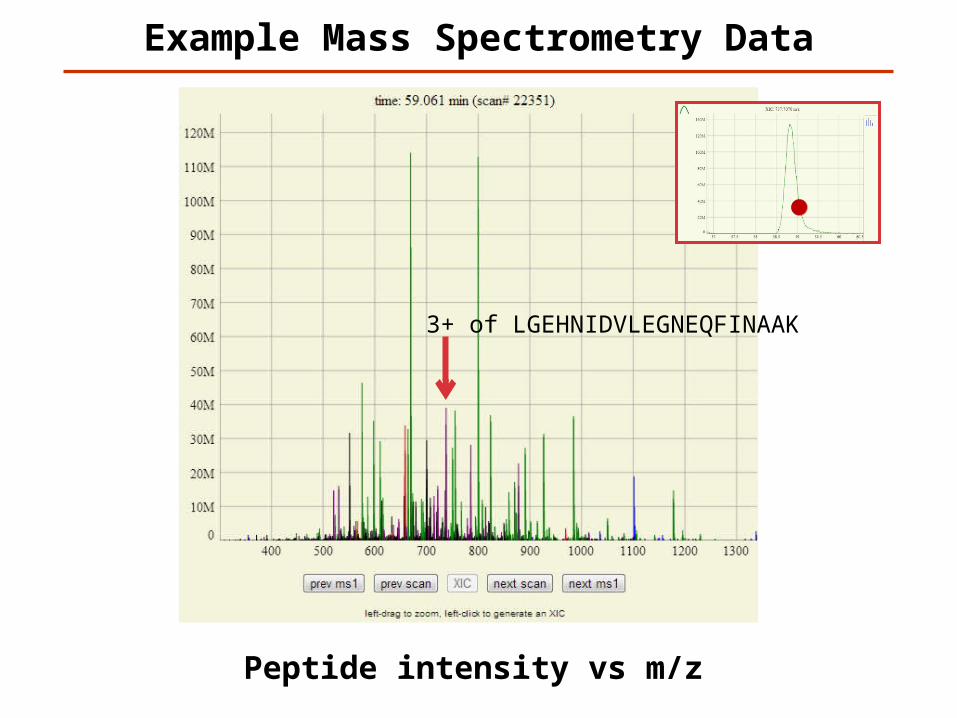
Example Mass Spectrometry Data
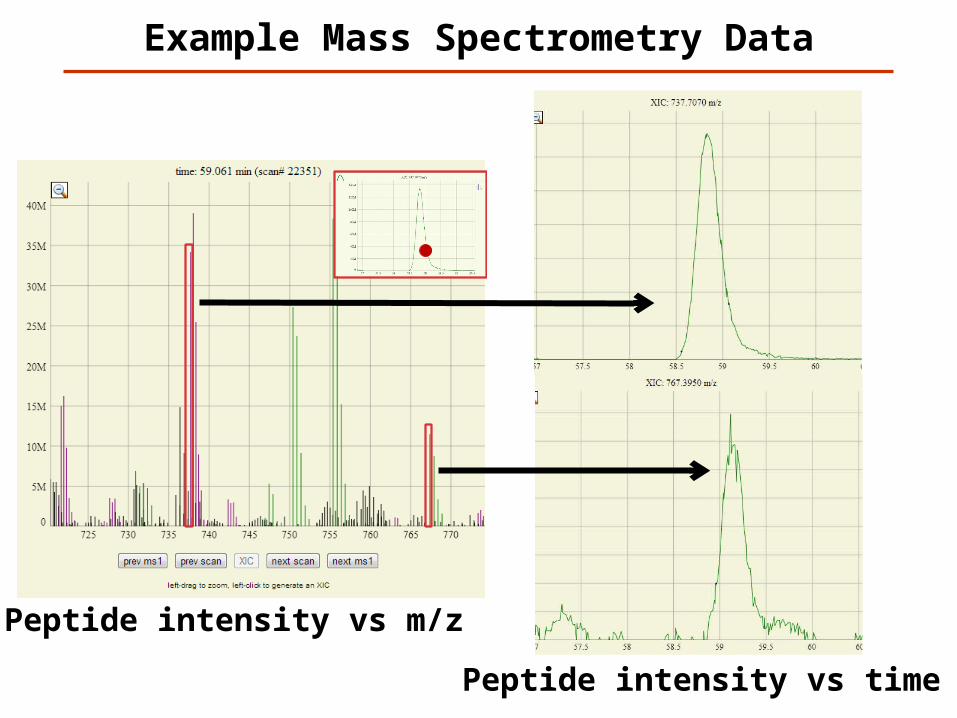
Peptide intensity vs m/z
3+ of LGEHNIDVLEGNEQFINAAK
Example Mass Spectrometry Data
Peptide intensity vs m/z
3+ of LGEHNIDVLEGNEQFINAAK
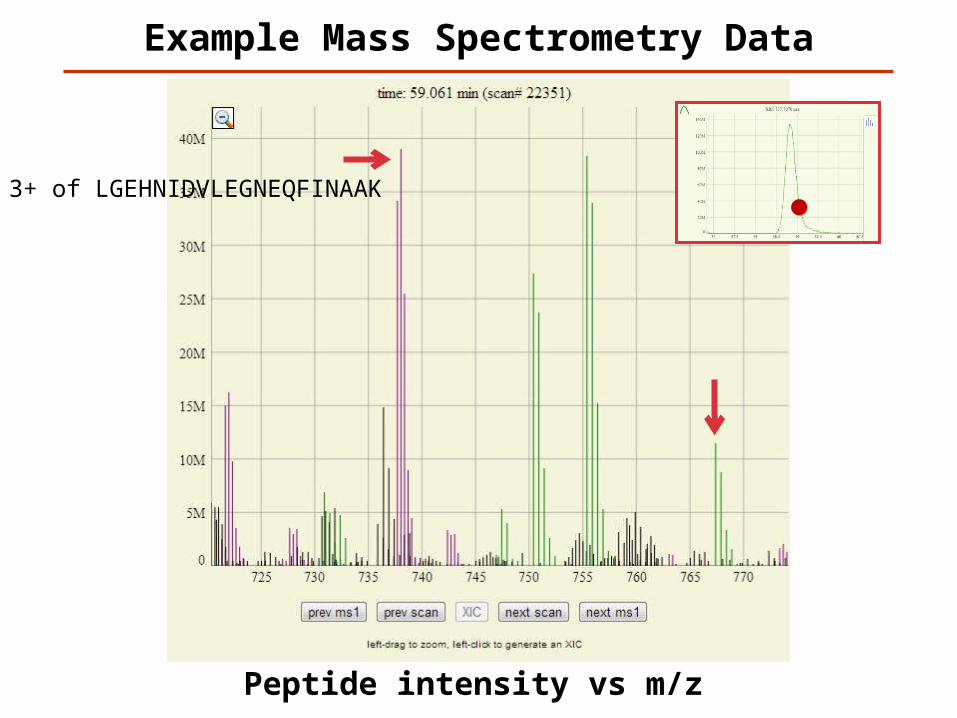
Example Mass Spectrometry Data
Peptide intensity vs m/z
Peptide intensity vs time
Example Mass Spectrometry Data
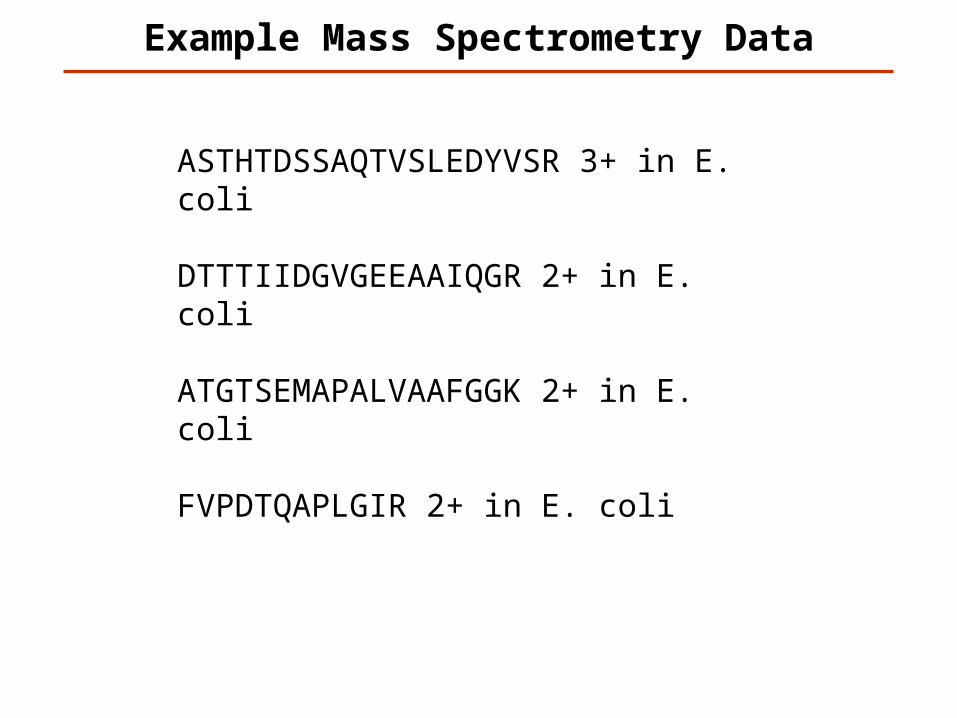
ASTHTDSSAQTVSLEDYVSR 3+ in E. coli
DTTTIIDGVGEEAAIQGR 2+ in E. coli
ATGTSEMAPALVAAFGGK 2+ in E. coli
FVPDTQAPLGIR 2+ in E. coli
Proteomics Informatics – Overview of Mass spectrometry (Week 2)
Ion Source
Mass Analyzer
Detector
mass/charge
inte
nsi
ty
Related Documents