Proteomic Screening of Human Targets of Viral microRNAs Reveals Functions Associated with Immune Evasion and Angiogenesis Amelia M. Gallaher 1 , Sudipto Das 2 , Zhen Xiao 2 , Thorkell Andresson 2 , Philippe Kieffer-Kwon 1 , Christine Happel 1 , Joseph Ziegelbauer 1 * 1 HIV and AIDS Malignancy Branch, National Cancer Institute, National Institutes of Health, Bethesda, Maryland, United States of America, 2 Laboratory of Proteomics and Analytical Technologies, Advanced Technology Program, SAIC-Frederick Inc., National Cancer Institute at Frederick, Frederick, Maryland, United States of America Abstract Kaposi’s sarcoma (KS) is caused by infection with Kaposi’s sarcoma-associated herpesvirus (KSHV). The virus expresses unique microRNAs (miRNAs), but the targets and functions of these miRNAs are not completely understood. In order to identify human targets of viral miRNAs, we measured protein expression changes caused by multiple KSHV miRNAs using pulsed stable labeling with amino acids in cell culture (pSILAC) in primary endothelial cells. This led to the identification of multiple human genes that are repressed at the protein level, but not at the miRNA level. Further analysis also identified that KSHV miRNAs can modulate activity or expression of upstream regulatory factors, resulting in suppressed activation of a protein involved in leukocyte recruitment (ICAM1) following lysophosphatidic acid treatment, as well as up-regulation of a pro-angiogenic protein (HIF1a), and up-regulation of a protein involved in stimulating angiogenesis (HMOX1). This study aids in our understanding of miRNA mechanisms of repression and miRNA contributions to viral pathogenesis. Citation: Gallaher AM, Das S, Xiao Z, Andresson T, Kieffer-Kwon P, et al. (2013) Proteomic Screening of Human Targets of Viral microRNAs Reveals Functions Associated with Immune Evasion and Angiogenesis. PLoS Pathog 9(9): e1003584. doi:10.1371/journal.ppat.1003584 Editor: Dirk P. Dittmer, University of North Carolina at Chapel Hill, United States of America Received February 1, 2013; Accepted July 14, 2013; Published September 5, 2013 This is an open-access article, free of all copyright, and may be freely reproduced, distributed, transmitted, modified, built upon, or otherwise used by anyone for any lawful purpose. The work is made available under the Creative Commons CC0 public domain dedication. Funding: This work was supported by the Intramural Research Program of the Center for Cancer Research, National Cancer Institute, National Institutes of Health and with federal funds from the National Cancer Institute under Contract HHSN261200800001E. The funders had no role in study design, data collection and analysis, decision to publish, or preparation of the manuscript. Competing Interests: The authors have declared that no competing interests exist. * E-mail: [email protected] Introduction At our current understanding, the herpesvirus family is the only viral family expressing multiple miRNAs. Kaposi’s sarcoma- associated herpesvirus (human herpesvirus 8) expresses 12 pre- miRNAs [1,2,3,4]. These miRNAs are encoded in the latency locus of the KSHV genome and all KSHV miRNAs are expressed during latency. This discovery presented the possibility that KSHV expresses miRNAs to modulate host gene expression by a mechanism that would avoid generating additional viral proteins, which could be detected by the host immune system. Although many groups have been successful in detecting viral miRNA expression, our understanding of the functions of the viral miRNAs has been limited due to the small number of validated miRNA target genes. Previously identified human targets include thrombospondin [4], BACH-1 [5,6], BCL-2 associated factor [7], MICB [8], musculoaponeurotic fibrosarcoma oncogene homolog [9], IkBa [10], Rbl2 [11], p21 [12], caspase 3 [13], TWEAKR [14], TGFbR2 [15], and other targets. These targets represent host genes involved in angiogenesis, transcription regulation, immune evasion, NF-kB regulation, epigenetic modifications, apoptosis and cell cycle regulation. Recently, a number of other host targets have been identified by purifying RNA-induced silencing complexes and analyzing associated nucleic acids [16] [17,18] in primary effusion cell lines, which represents a recent addition to the technologies used to identify miRNA targets. Gene expression studies to discover targets repressed by viral miRNAs in primary endothelial cells have been limited. Previous methods for miRNA target prediction include measuring changes at the mRNA level in response to miRNAs using microarrays and bioinformatic methods to search for limited sequence complementarity [4,7]. The human targets of miRNAs that will be detected depend on the expression profiling methods utilized and the mechanisms of miRNA-mediated repression [19]. If a miRNA is inhibiting gene expression by stimulating deadenylation and destabilization of the mRNA target, then gene expression microarrays can be successful in identifying targets. However, miRNAs may repress gene expression of some targets by inhibiting translation and mRNA expression profiling may miss miRNA targets that are repressed at the protein level, but not at the mRNA level. One method to detect these types of targets is by measuring changes in protein expression in the presence of specific miRNAs. Stable isotope labeling of amino acids in cell culture (SILAC) coupled with tandem mass spec- trometry has been used recently to study the effects of miRNAs on protein expression [20,21,22,23]. In this report, the pulsed SILAC method was employed to focus on changes in newly translated proteins in the presence of KSHV miRNAs. Here, we report the discovery of human targets of viral miRNAs using this technology in primary human endothelial cells, a relevant cell type for KSHV infection. We found that specific miRNAs can inhibit expression of a protein involved in immune response and can stimulate PLOS Pathogens | www.plospathogens.org 1 September 2013 | Volume 9 | Issue 9 | e1003584

Welcome message from author
This document is posted to help you gain knowledge. Please leave a comment to let me know what you think about it! Share it to your friends and learn new things together.
Transcript
Proteomic Screening of Human Targets of ViralmicroRNAs Reveals Functions Associated with ImmuneEvasion and AngiogenesisAmelia M. Gallaher1, Sudipto Das2, Zhen Xiao2, Thorkell Andresson2, Philippe Kieffer-Kwon1,
Christine Happel1, Joseph Ziegelbauer1*
1 HIV and AIDS Malignancy Branch, National Cancer Institute, National Institutes of Health, Bethesda, Maryland, United States of America, 2 Laboratory of Proteomics and
Analytical Technologies, Advanced Technology Program, SAIC-Frederick Inc., National Cancer Institute at Frederick, Frederick, Maryland, United States of America
Abstract
Kaposi’s sarcoma (KS) is caused by infection with Kaposi’s sarcoma-associated herpesvirus (KSHV). The virus expressesunique microRNAs (miRNAs), but the targets and functions of these miRNAs are not completely understood. In order toidentify human targets of viral miRNAs, we measured protein expression changes caused by multiple KSHV miRNAs usingpulsed stable labeling with amino acids in cell culture (pSILAC) in primary endothelial cells. This led to the identification ofmultiple human genes that are repressed at the protein level, but not at the miRNA level. Further analysis also identifiedthat KSHV miRNAs can modulate activity or expression of upstream regulatory factors, resulting in suppressed activation ofa protein involved in leukocyte recruitment (ICAM1) following lysophosphatidic acid treatment, as well as up-regulation of apro-angiogenic protein (HIF1a), and up-regulation of a protein involved in stimulating angiogenesis (HMOX1). This studyaids in our understanding of miRNA mechanisms of repression and miRNA contributions to viral pathogenesis.
Citation: Gallaher AM, Das S, Xiao Z, Andresson T, Kieffer-Kwon P, et al. (2013) Proteomic Screening of Human Targets of Viral microRNAs Reveals FunctionsAssociated with Immune Evasion and Angiogenesis. PLoS Pathog 9(9): e1003584. doi:10.1371/journal.ppat.1003584
Editor: Dirk P. Dittmer, University of North Carolina at Chapel Hill, United States of America
Received February 1, 2013; Accepted July 14, 2013; Published September 5, 2013
This is an open-access article, free of all copyright, and may be freely reproduced, distributed, transmitted, modified, built upon, or otherwise used by anyone forany lawful purpose. The work is made available under the Creative Commons CC0 public domain dedication.
Funding: This work was supported by the Intramural Research Program of the Center for Cancer Research, National Cancer Institute, National Institutes of Healthand with federal funds from the National Cancer Institute under Contract HHSN261200800001E. The funders had no role in study design, data collection andanalysis, decision to publish, or preparation of the manuscript.
Competing Interests: The authors have declared that no competing interests exist.
* E-mail: [email protected]
Introduction
At our current understanding, the herpesvirus family is the
only viral family expressing multiple miRNAs. Kaposi’s sarcoma-
associated herpesvirus (human herpesvirus 8) expresses 12 pre-
miRNAs [1,2,3,4]. These miRNAs are encoded in the latency
locus of the KSHV genome and all KSHV miRNAs are expressed
during latency. This discovery presented the possibility that
KSHV expresses miRNAs to modulate host gene expression by
a mechanism that would avoid generating additional viral
proteins, which could be detected by the host immune system.
Although many groups have been successful in detecting viral
miRNA expression, our understanding of the functions of the viral
miRNAs has been limited due to the small number of validated
miRNA target genes. Previously identified human targets include
thrombospondin [4], BACH-1 [5,6], BCL-2 associated factor [7],
MICB [8], musculoaponeurotic fibrosarcoma oncogene homolog
[9], IkBa [10], Rbl2 [11], p21 [12], caspase 3 [13], TWEAKR
[14], TGFbR2 [15], and other targets. These targets represent
host genes involved in angiogenesis, transcription regulation,
immune evasion, NF-kB regulation, epigenetic modifications,
apoptosis and cell cycle regulation.
Recently, a number of other host targets have been identified
by purifying RNA-induced silencing complexes and analyzing
associated nucleic acids [16] [17,18] in primary effusion cell lines,
which represents a recent addition to the technologies used to
identify miRNA targets. Gene expression studies to discover
targets repressed by viral miRNAs in primary endothelial cells have
been limited. Previous methods for miRNA target prediction
include measuring changes at the mRNA level in response to
miRNAs using microarrays and bioinformatic methods to search
for limited sequence complementarity [4,7]. The human targets of
miRNAs that will be detected depend on the expression profiling
methods utilized and the mechanisms of miRNA-mediated
repression [19]. If a miRNA is inhibiting gene expression by
stimulating deadenylation and destabilization of the mRNA target,
then gene expression microarrays can be successful in identifying
targets. However, miRNAs may repress gene expression of some
targets by inhibiting translation and mRNA expression profiling
may miss miRNA targets that are repressed at the protein level,
but not at the mRNA level. One method to detect these types of
targets is by measuring changes in protein expression in the
presence of specific miRNAs. Stable isotope labeling of amino
acids in cell culture (SILAC) coupled with tandem mass spec-
trometry has been used recently to study the effects of miRNAs on
protein expression [20,21,22,23]. In this report, the pulsed SILAC
method was employed to focus on changes in newly translated
proteins in the presence of KSHV miRNAs. Here, we report the
discovery of human targets of viral miRNAs using this technology
in primary human endothelial cells, a relevant cell type for KSHV
infection. We found that specific miRNAs can inhibit expression
of a protein involved in immune response and can stimulate
PLOS Pathogens | www.plospathogens.org 1 September 2013 | Volume 9 | Issue 9 | e1003584
expression of two proteins known to stimulate angiogenesis (a key
hallmark of Kaposi’s sarcoma).
Results
In order to identify the target genes repressed by KSHV
miRNAs, we measured the effects of KSHV miRNAs on protein
expression by introducing viral miRNAs into uninfected primary
endothelial cells (HUVEC). Primary cells were transfected with
either a control non-targeting miRNA mimic or a combination
of sixteen KSHV miRNA mimics (Figure S1). We transfected
miRNA mimics in the absence of viral infection to ensure that the
repression of newly synthesized proteins was not an indirect result
of infection or viral protein expression. After transfection, cells
were grown in media supplemented with two distinct mixtures
of stable medium-heavy or heavy amino acids. Using this pulsed
labeling approach we measured newly translated proteins from the
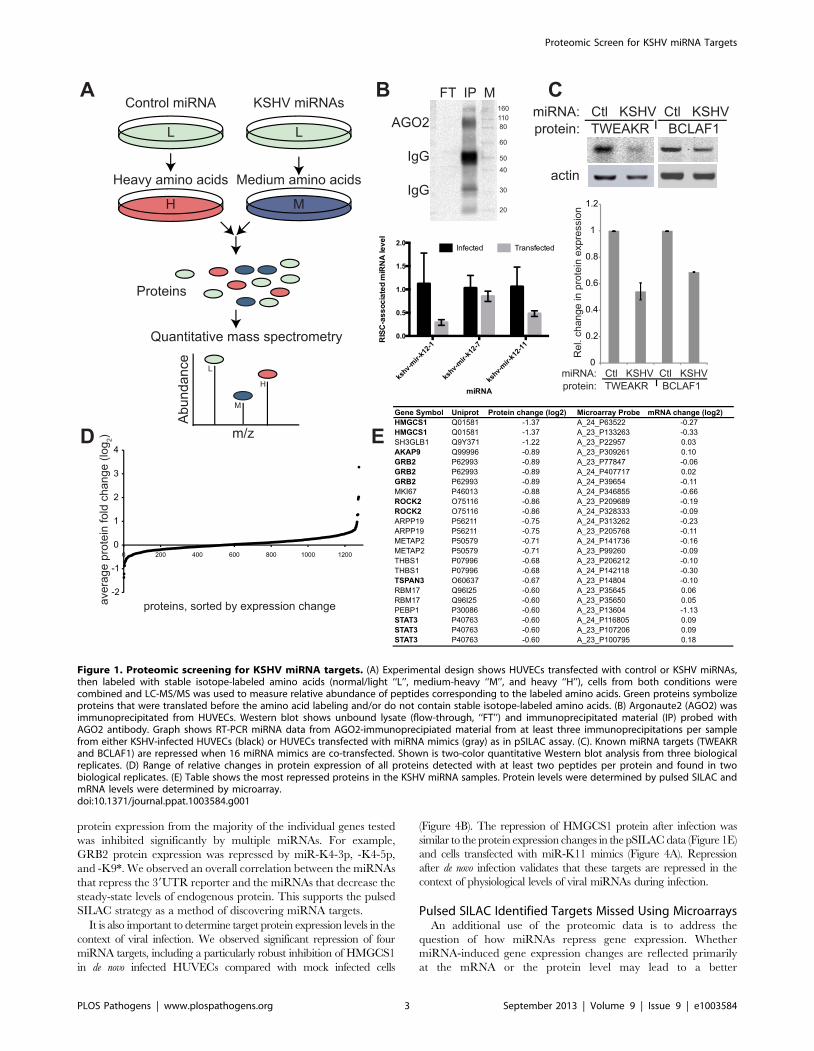
two conditions (Figure 1A) with mass spectrometry. The relative
amount of mature miRNAs in RNA-induced silencing complexes
was probed using Argonaute 2 immunoprecipitations, followed
by reverse-transcription and quantitative PCR (normalized to
human miR-21, which does not change upon KSHV infection
[24]). Transfected miRNA mimics were indeed associated with
the RNA-induced silencing complex (RISC) (Figure 1B) using
this assay. Before mass spectrometry analysis, the samples were
analyzed for expected repression of previously identified miRNA
targets (BCLAF1, TWEAKR) using quantitative Western blotting
(Figure 1C). Cells from the two labeling conditions were combined
in a 1:1 ratio, and proteins were extracted, fractionated and
analyzed by tandem mass spectrometry to calculate relative
changes in newly translated proteins due to the presence of KSHV
miRNAs. Fractionation of the protein samples was utilized to
improve coverage of a wide variety of proteins and to better detect
less abundant proteins. Both biological replicates were analyzed by
mass spectrometry twice, yielding two technical replicates for two
biological replicates. Mass spectrometry data was filtered for
proteins detected by at least two peptide pairs (medium-heavy and
heavy) per replicate and detected in both biological replicates.
There were 1276 proteins that met these stringent quality control
filters (Figure 1D) and the most down-regulated proteins in cells
containing KSHV miRNAs are shown in Figure 1E. It was
noteworthy that thrombospondin (THBS1), the first identified
target of KSHV miRNAs was strongly inhibited at the protein
level [4].
Enrichment of Seed-Matching Targets Corresponding toRepressed Proteins
Since sixteen miRNAs were introduced into HUVECs simul-
taneously during the SILAC assay, the analysis of potential
miRNA targets and protein expression was complex, even though
these experiments were biologically relevant to the expression of
all miRNAs during normal viral infection. Bioinformatic programs
are commonly used to identify complementary sequences between
miRNAs and their potential targets. We used TargetScan [25] to
search for seed-matching sequences in the 39 untranslated regions
(UTRs) of transcripts corresponding to proteins that were iden-
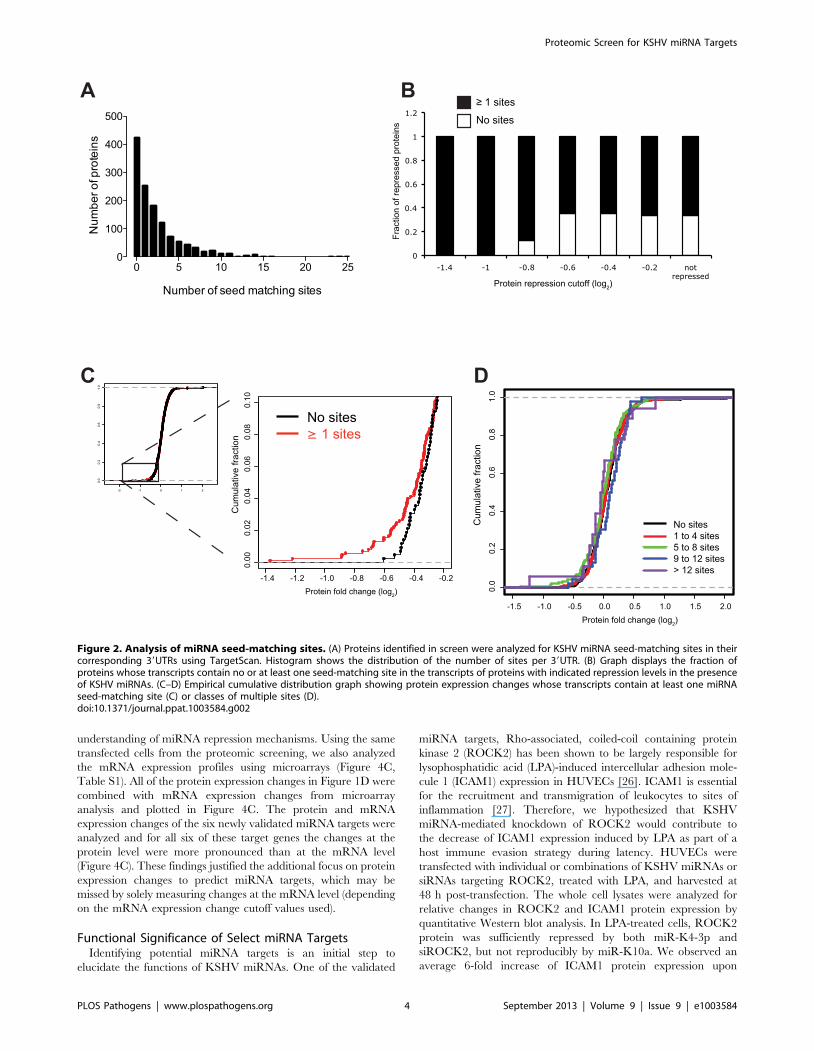
tified in the SILAC analysis. An initial analysis of genes included in
both the SILAC and TargetScan datasets separated the genes into
two sets, one with at least one TargetScan site (847 genes) and
another set of corresponding transcripts which did not have any
TargetScan sites (424 genes) (Figure 2A). This revealed that the
fraction of proteins containing at least one predicted miRNA
target site (in the corresponding transcript’s 39UTR) was larger in
the set of proteins that were strongly repressed (Figure 2B).
Approximately 60% of proteins that were not repressed (log2.0)
had at least one seed-matching site in their corresponding 39UTR,
suggesting an over 60% false positive rate of detection using seed
matching alone. However, those proteins whose transcripts have
seed-matching sites tend to have lower expression in the presence
of KSHV miRNAs, as do the proteins from mRNAs with multiple
seed-matching sites (Figure 2C–D).
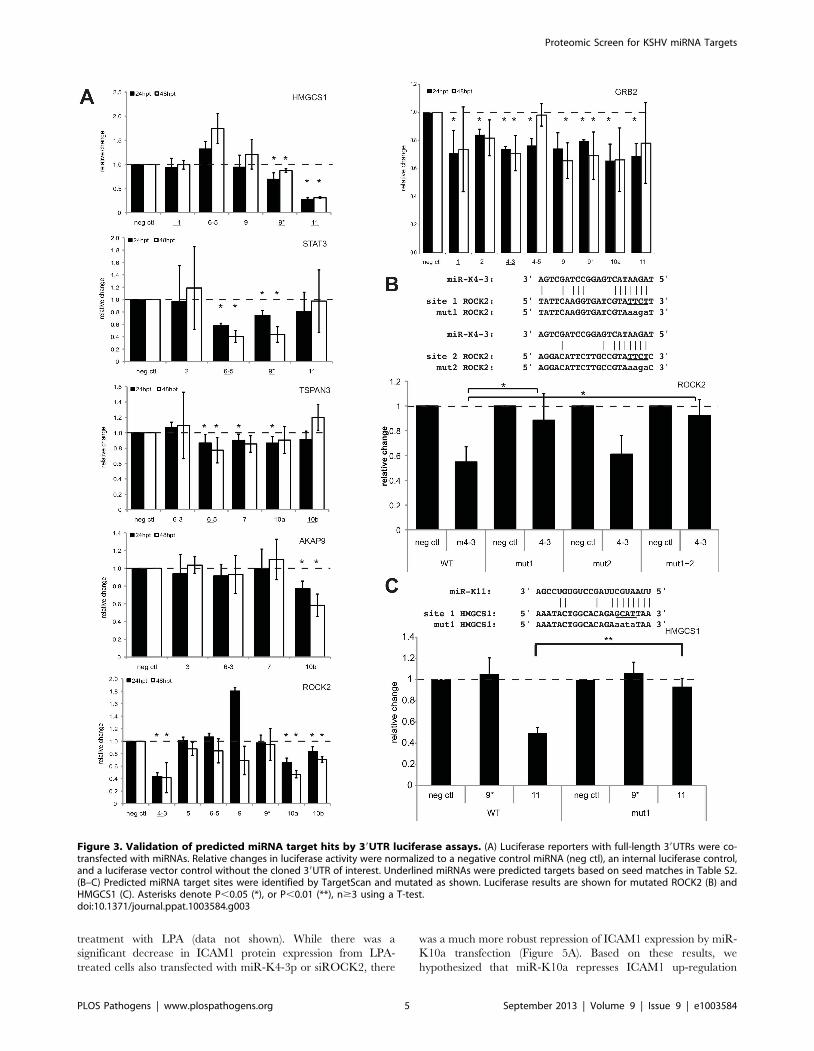
Pulsed SILAC Identifies KSHV miRNA TargetsRepressed proteins detected in the SILAC analysis can repre-
sent direct targets of KSHV miRNAs, as well as indirect targets. In
order to determine if these repressed genes are directly targeted
by KSHV miRNAs, we chose six genes based only on protein
expression changes to test in standard 39UTR luciferase reporter
assays. Using full 39 UTRs, we determined that all six of the
39UTR luciferase reporters tested (GRB2, ROCK2, STAT3,
HMGCS1, TSPAN3, AKAP9) are significantly inhibited by at
least one KSHV miRNA (Figure 3A), but TSPAN3 repression was
the weakest of the six 39UTRs tested. Interestingly, GRB2 was also
recently described as a target of KSHV miRNAs [17]. Addition-
ally, we mapped the specific site targeted by a KSHV miRNA
for two of these targets, ROCK2 and HMGCS1 (Figure 3B–C).
Luciferase reporters shown in Figure 3A contained 39UTRs
downstream of a firefly luciferase gene and reporters shown in
Figure 3B–C had 39UTRs downstream of a renilla luciferase gene.
Different transcription rates, half lives of luciferase enzymes, and
cloned 39UTR context may have been responsible for certain
variations in the repression of the same 39UTR in different
reporter plasmids. The mutation of predicted sites significantly
relieved miRNA-mediated repression for both miRNA targets
(Figure 3B–C). Together, these results suggest the 39UTRs of these
six genes identified in the SILAC screen contain sequences
targeted directly by KSHV miRNAs.
Using two-color quantitative Western blotting, we assayed sixteen
mature miRNAs for their ability to modulate endogenous protein
expression of four (of the six) luciferase-validated target genes in
primary endothelial cells. All four proteins tested, GRB2, ROCK2,
STAT3 (alpha and beta isoforms) and HMGCS1, were inhibited
significantly by at least one miRNA (Figure 4A). Furthermore, the
Author Summary
Kaposi’s sarcoma-associated herpesvirus is the virusassociated with multiple proliferative disorders, includingKaposi’s sarcoma, primary effusion lymphoma and multi-centric Castleman’s disease. This virus expresses smallnucleic acids (with sequences distinct from other organ-isms), called microRNAs, that can limit expression ofspecific genes. Currently, we only know a few validatedtargets of these viral microRNAs and the mechanisms ofmicroRNA-mediated repression are still being activelydebated. We used a method to look at protein expressionchanges induced by these viral microRNAs to betterunderstand microRNA targets and functions. The methodwe describe here found microRNA targets that are missedby other approaches. In addition to identifying previousmicroRNA targets and discovering new microRNA targets,we found the function of specific viral microRNAs to beassociated with immune evasion and the expansion ofblood vessel networks, a hallmark of Kaposi’s sarcoma. Theresults may be a resource for those studying microRNAsfrom other organisms, and furthermore, the microRNAfunctions described provide mechanistic insight into viralpathogenesis and immune evasion.
Proteomic Screen for KSHV miRNA Targets
PLOS Pathogens | www.plospathogens.org 2 September 2013 | Volume 9 | Issue 9 | e1003584
protein expression from the majority of the individual genes tested
was inhibited significantly by multiple miRNAs. For example,
GRB2 protein expression was repressed by miR-K4-3p, -K4-5p,
and -K9*. We observed an overall correlation between the miRNAs
that repress the 39UTR reporter and the miRNAs that decrease the
steady-state levels of endogenous protein. This supports the pulsed
SILAC strategy as a method of discovering miRNA targets.
It is also important to determine target protein expression levels in the
context of viral infection. We observed significant repression of four
miRNA targets, including a particularly robust inhibition of HMGCS1
in de novo infected HUVECs compared with mock infected cells
(Figure 4B). The repression of HMGCS1 protein after infection was
similar to the protein expression changes in the pSILAC data (Figure 1E)
and cells transfected with miR-K11 mimics (Figure 4A). Repression
after de novo infection validates that these targets are repressed in the
context of physiological levels of viral miRNAs during infection.
Pulsed SILAC Identified Targets Missed Using MicroarraysAn additional use of the proteomic data is to address the
question of how miRNAs repress gene expression. Whether
miRNA-induced gene expression changes are reflected primarily
at the mRNA or the protein level may lead to a better
Figure 1. Proteomic screening for KSHV miRNA targets. (A) Experimental design shows HUVECs transfected with control or KSHV miRNAs,then labeled with stable isotope-labeled amino acids (normal/light ‘‘L’’, medium-heavy ‘‘M’’, and heavy ‘‘H’’), cells from both conditions werecombined and LC-MS/MS was used to measure relative abundance of peptides corresponding to the labeled amino acids. Green proteins symbolizeproteins that were translated before the amino acid labeling and/or do not contain stable isotope-labeled amino acids. (B) Argonaute2 (AGO2) wasimmunoprecipitated from HUVECs. Western blot shows unbound lysate (flow-through, ‘‘FT’’) and immunoprecipitated material (IP) probed withAGO2 antibody. Graph shows RT-PCR miRNA data from AGO2-immunoprecipiated material from at least three immunoprecipitations per samplefrom either KSHV-infected HUVECs (black) or HUVECs transfected with miRNA mimics (gray) as in pSILAC assay. (C). Known miRNA targets (TWEAKRand BCLAF1) are repressed when 16 miRNA mimics are co-transfected. Shown is two-color quantitative Western blot analysis from three biologicalreplicates. (D) Range of relative changes in protein expression of all proteins detected with at least two peptides per protein and found in twobiological replicates. (E) Table shows the most repressed proteins in the KSHV miRNA samples. Protein levels were determined by pulsed SILAC andmRNA levels were determined by microarray.doi:10.1371/journal.ppat.1003584.g001
Proteomic Screen for KSHV miRNA Targets
PLOS Pathogens | www.plospathogens.org 3 September 2013 | Volume 9 | Issue 9 | e1003584
understanding of miRNA repression mechanisms. Using the same
transfected cells from the proteomic screening, we also analyzed
the mRNA expression profiles using microarrays (Figure 4C,
Table S1). All of the protein expression changes in Figure 1D were
combined with mRNA expression changes from microarray
analysis and plotted in Figure 4C. The protein and mRNA
expression changes of the six newly validated miRNA targets were
analyzed and for all six of these target genes the changes at the
protein level were more pronounced than at the mRNA level
(Figure 4C). These findings justified the additional focus on protein
expression changes to predict miRNA targets, which may be
missed by solely measuring changes at the mRNA level (depending
on the mRNA expression change cutoff values used).
Functional Significance of Select miRNA TargetsIdentifying potential miRNA targets is an initial step to
elucidate the functions of KSHV miRNAs. One of the validated
miRNA targets, Rho-associated, coiled-coil containing protein
kinase 2 (ROCK2) has been shown to be largely responsible for
lysophosphatidic acid (LPA)-induced intercellular adhesion mole-
cule 1 (ICAM1) expression in HUVECs [26]. ICAM1 is essential
for the recruitment and transmigration of leukocytes to sites of
inflammation [27]. Therefore, we hypothesized that KSHV
miRNA-mediated knockdown of ROCK2 would contribute to
the decrease of ICAM1 expression induced by LPA as part of a
host immune evasion strategy during latency. HUVECs were
transfected with individual or combinations of KSHV miRNAs or
siRNAs targeting ROCK2, treated with LPA, and harvested at
48 h post-transfection. The whole cell lysates were analyzed for
relative changes in ROCK2 and ICAM1 protein expression by
quantitative Western blot analysis. In LPA-treated cells, ROCK2
protein was sufficiently repressed by both miR-K4-3p and
siROCK2, but not reproducibly by miR-K10a. We observed an
average 6-fold increase of ICAM1 protein expression upon
Figure 2. Analysis of miRNA seed-matching sites. (A) Proteins identified in screen were analyzed for KSHV miRNA seed-matching sites in theircorresponding 39UTRs using TargetScan. Histogram shows the distribution of the number of sites per 39UTR. (B) Graph displays the fraction ofproteins whose transcripts contain no or at least one seed-matching site in the transcripts of proteins with indicated repression levels in the presenceof KSHV miRNAs. (C–D) Empirical cumulative distribution graph showing protein expression changes whose transcripts contain at least one miRNAseed-matching site (C) or classes of multiple sites (D).doi:10.1371/journal.ppat.1003584.g002
Proteomic Screen for KSHV miRNA Targets
PLOS Pathogens | www.plospathogens.org 4 September 2013 | Volume 9 | Issue 9 | e1003584
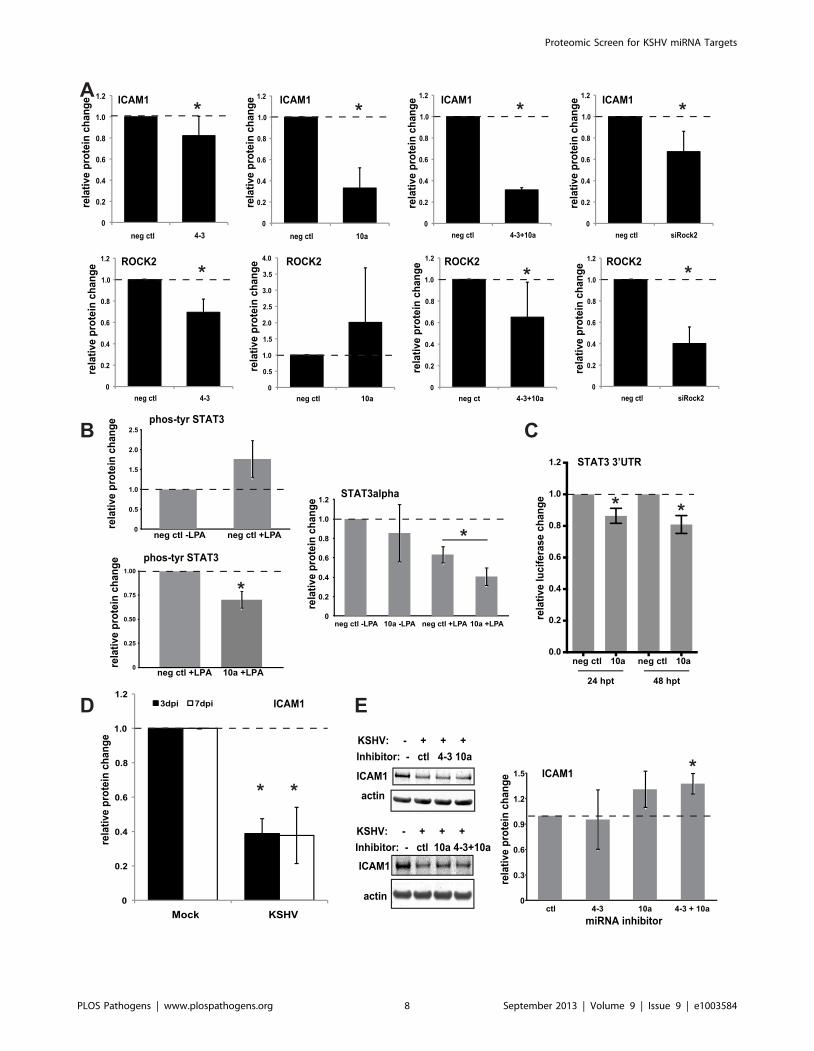
treatment with LPA (data not shown). While there was a
significant decrease in ICAM1 protein expression from LPA-
treated cells also transfected with miR-K4-3p or siROCK2, there
was a much more robust repression of ICAM1 expression by miR-
K10a transfection (Figure 5A). Based on these results, we
hypothesized that miR-K10a represses ICAM1 up-regulation
Figure 3. Validation of predicted miRNA target hits by 39UTR luciferase assays. (A) Luciferase reporters with full-length 39UTRs were co-transfected with miRNAs. Relative changes in luciferase activity were normalized to a negative control miRNA (neg ctl), an internal luciferase control,and a luciferase vector control without the cloned 39UTR of interest. Underlined miRNAs were predicted targets based on seed matches in Table S2.(B–C) Predicted miRNA target sites were identified by TargetScan and mutated as shown. Luciferase results are shown for mutated ROCK2 (B) andHMGCS1 (C). Asterisks denote P,0.05 (*), or P,0.01 (**), n$3 using a T-test.doi:10.1371/journal.ppat.1003584.g003
Proteomic Screen for KSHV miRNA Targets
PLOS Pathogens | www.plospathogens.org 5 September 2013 | Volume 9 | Issue 9 | e1003584
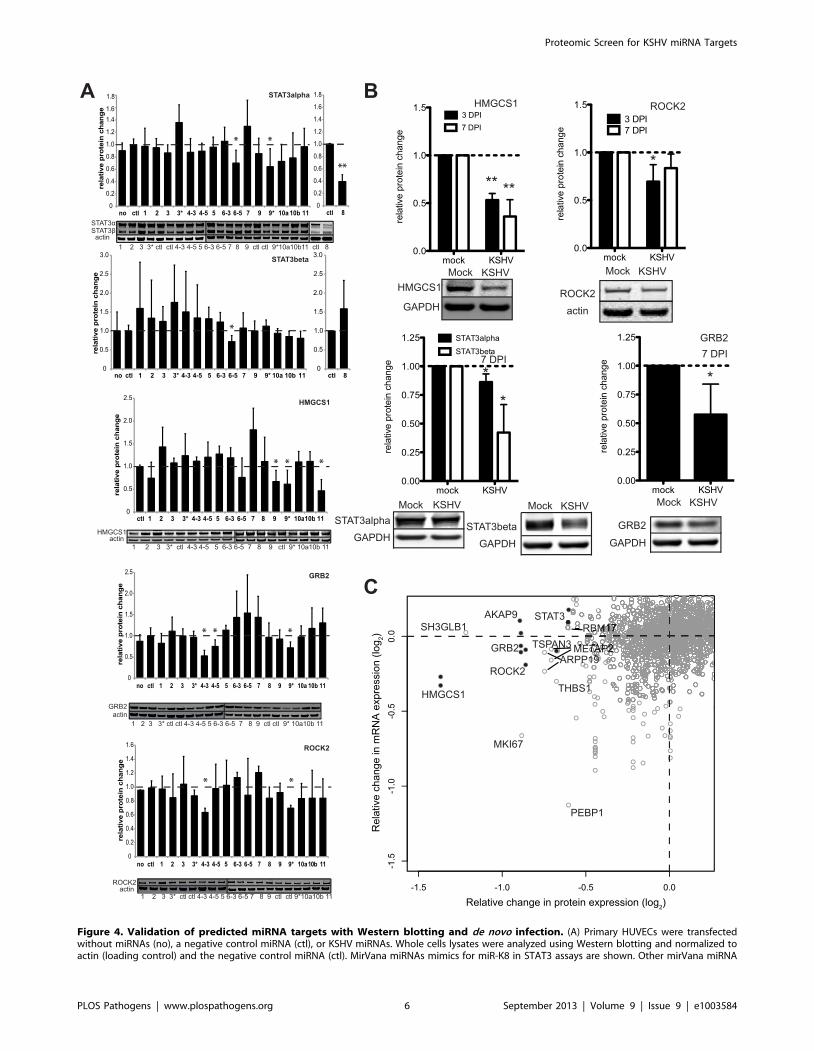
Figure 4. Validation of predicted miRNA targets with Western blotting and de novo infection. (A) Primary HUVECs were transfectedwithout miRNAs (no), a negative control miRNA (ctl), or KSHV miRNAs. Whole cells lysates were analyzed using Western blotting and normalized toactin (loading control) and the negative control miRNA (ctl). MirVana miRNAs mimics for miR-K8 in STAT3 assays are shown. Other mirVana miRNA
Proteomic Screen for KSHV miRNA Targets
PLOS Pathogens | www.plospathogens.org 6 September 2013 | Volume 9 | Issue 9 | e1003584
through a ROCK2-independent mechanism. It was known that
STAT3 can activate ICAM1 expression [28,29,30] and LPA
treatment induces STAT3 phosphorylation [31]. We confirmed an
increase in phospho-STAT3 (Tyr705) using Western blot analysis
upon LPA treatment and found decreased levels of phospho-
STAT3 (Tyr705) in the presence of miR-K10a (Figure 5B).
While repression of total STAT3 protein levels with miR-K10a
transfection in the absence of LPA was variable, STAT3 protein
levels were repressed in LPA-treated cells upon transfection
with miR-K10a mimics compared to control mimics. TargetScan
analysis found three potential miR-K10a binding sites in the
STAT3 39UTR (Table S2), and luciferase assays with the STAT3
39UTR confirmed direct repression by miR-K10a (Figure 5C).
This suggested a potential role of STAT3 in the repression of
ICAM1 in LPA-treated endothelial cells that is independent
of ROCK2. Additionally, we observed strong repression of
ICAM1 after de novo KSHV infection in HUVECs (Figure 5D).
To determine if KSHV miRNAs play a role in this repression,
HUVECs were transfected with miRNA inhibitors to miR-K4-3p
and miR-K10a, then infected with KSHV, and analyzed for
ICAM1 protein expression three days after infection. ICAM1
protein expression is modestly elevated (likely due to incomplete
inhibition of target miRNAs) in HUVECs transfected with miR-
K4-3p and miR-K10a inhibitors (Figure 5E). Together, these
results show that KSHV miRNAs decrease LPA-stimulated
ICAM1 expression and are at least partially responsible for
ICAM1 repression during KSHV infection in primary endothelial
cells, which could potentially minimize recruitment of leukocytes
to areas of KSHV infection.
Our initial focus was to identify direct miRNA target genes
by focusing on genes that were repressed in the presence of the
viral miRNAs. However, we were intrigued by the increased
protein production of heme oxygenase 1 (HMOX1, log2 = 2.03)
and biliverdin reductase (BLVRA, log2 = 1.99) in the presence of
KSHV miRNAs. These proteins are important factors in oxidative
stress and heme metabolism [32]. HMOX1 protein was previously
described to be upregulated upon infection with KSHV [33].
Because miRNAs usually work through suppressing gene expres-
sion, these results suggested that some KSHV miRNAs may work
through modulating protein expression of factors regulating
HMOX1 and BLVRA protein expression.
An analysis of promoters corresponding to the up-regulated
proteins (top 5%) revealed that HIF1a binding sites were enriched
in this set of up-regulated genes (p-value = 0.0005). Closer
inspection revealed both HMOX1 and BLVRA are transcription-
al targets of HIF1a [34,35]. We sought to determine if specific
miRNAs could influence HIF1a expression or activity. Inducing
hypoxia in 293 cells (also HUVECs, data not shown) with the
addition of a hypoxia mimic, cobalt chloride (data not shown), or
inducing hypoxia with incubation in 1% oxygen, showed that
miR-K7 can induce a 5-fold activation of endogenous HIF1aprotein levels (Figure 6A). We also observed that miR-K7 can
increase HIF1a transcriptional activity through assays using a
HIF-responsive luciferase reporter (Figure 6B). Quantitative PCR
data did not detect a significant change in HIF1a mRNA
levels (Figure 6C), suggesting transcription rates are not affected by
miR-K7. HIF1a protein is constitutively produced, but destroyed
in cells growing in normoxic conditions. We suspected that miR-
K7 might increase HIF1a protein levels by repressing an inhibitor
of HIF1a protein expression. We investigated the changes in
protein expression of four inhibitors of HIF1a, including hypoxia-
inducible factor 1-alpha inhibitor (HIF1AN), egl nine homolog 1
(PHD2/EGLN1), von Hippel-Lindau tumor suppressor (VHL),
and tumor protein p53 (TP53), but we did not detect significant
changes (Figure 6D). However, another protein, ring-box 1/E3
ubiquitin protein ligase (RBX1), has been shown to mediate
ubiquitination and degradation of HIF1a [36]. Protein levels of
RBX1 were modestly repressed in hypoxic cells transfected with
miR-K7 mimic compared to the negative control miRNA mimic
(Figure 6D). It was unknown if RBX1 is a direct target of miR-K7,
but RBX1 was found in miRNA target detection screens (CLIP
assays) in KSHV-infected cells [17,18]. These data suggested that
RBX1 may play a partial role in miR-K7 upregulation of HIF1aprotein levels during hypoxia, but it remains likely that up-
regulation of HIF1a is due to changes in expression of multiple
genes that remain to be determined. Taken together, these results
suggest miR-K7 may repress additional inhibitors of HIF1aprotein expression. In normoxia, HMOX1 protein expression was
not induced by miR-K7 (Figure 6E). Furthermore, the increase in
HMOX1 protein expression detected in the SILAC analysis (in
normoxia) was likely not due to increased HIF1a protein levels,
but rather repression of a repressor of HMOX1.
In addition to positive regulation by HIF1a, HMOX1 was also
known to be repressed by BTB and CNC homology 1, basic
leucine zipper transcription factor 1 (BACH1) which is a known
target of miR-K11 [5,6]. Under normoxia and miR-K11
expression, we observed an expected repression of BACH1 and
a robust 4.5-fold activation of HMOX1 protein expression
(Figure 6E). These results suggest up-regulation of HMOX1 by
miR-K11 is achieved by repression of BACH1 during normoxia.
In addition to determining the roles of miRNAs through the
study of individual target genes, the analysis of predicted target
gene functions could highlight cellular pathways and biological
processes that miRNAs regulate during infection. Furthermore,
repressed gene expression could be the result of direct or indirect
consequences of miRNAs, but both classes of targets may influence
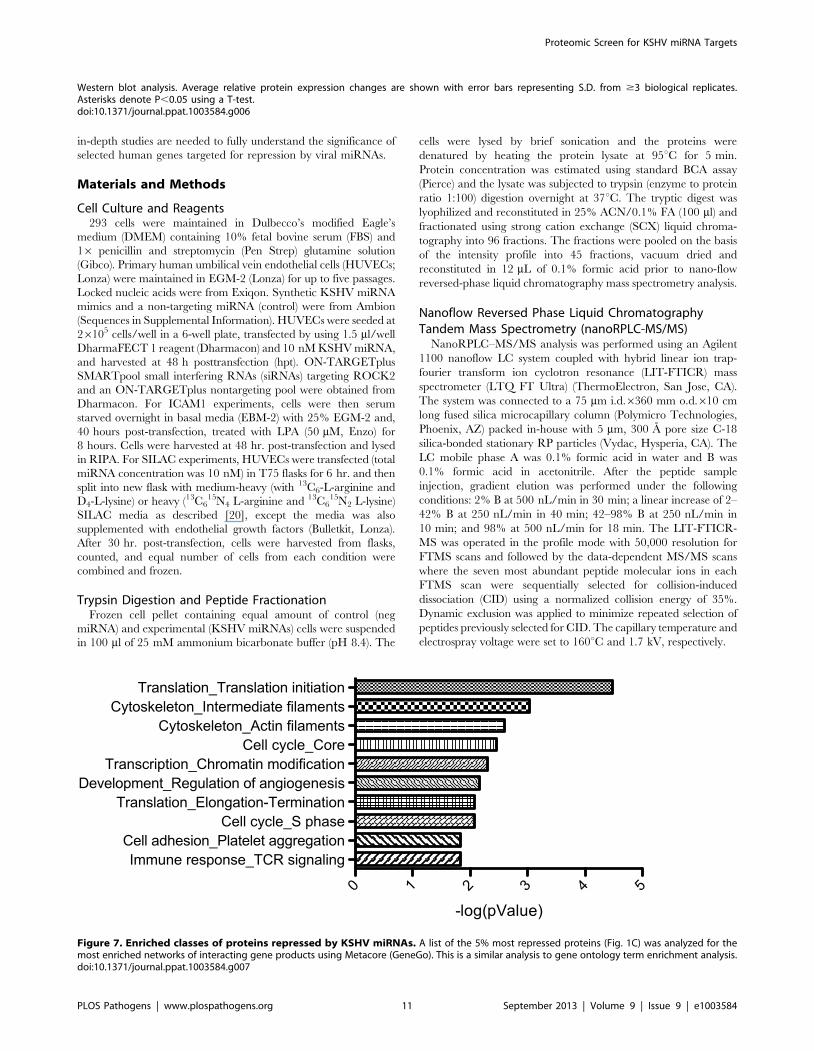
KSHV-infected cells. Analysis of the biological processes enriched
in the most repressed (five percent) proteins showed that many of
these repressed proteins are involved in translation, cytoskeleton,
cell cycle, chromatin modification and angiogenesis (Figure 7).
While it is currently unknown how many of these repressed
proteins are direct miRNA targets, this analysis points to certain
cellular functions important to KSHV pathogenesis that KSHV
miRNAs are targeting, directly or indirectly.
Discussion
In order to understand miRNA functions, it is critical to identify
their targets, so we can increase our knowledge of cellular
pathways that are important for infection and pathogenesis.
Genome-wide studies have been conducted analyzing the
Argonaute-associated mRNAs (CLIP assays) in B cells
mimic results are shown in Figure S2. Average relative protein expression changes are shown with error bars showing S.D. from $3 biologicalreplicates. (B) Primary HUVECs were de novo infected with KSHV (3 or 7 days post infection) and whole cell lysates were analyzed using Western blotanalysis as in (A). Asterisks denote P,0.05, n$3 using a T-test. (C) Plot showing average changes in protein expression on the horizontal axis fromSILAC data and mRNA changes from microarray data (vertical axis) from the same transfections. Gray open circles are gene products found in bothassays and black filled circles represent gene products from six validated targets (HMGCS1, STAT3, GRB2, ROCK2, AKAP9, TSPAN3). Multiple microarrayprobes are indicated for a subset of genes, yielding multiple vertically-aligned circles from multiple microarray probes, but one protein measurement(See Figure 1E for examples).doi:10.1371/journal.ppat.1003584.g004
Proteomic Screen for KSHV miRNA Targets
PLOS Pathogens | www.plospathogens.org 7 September 2013 | Volume 9 | Issue 9 | e1003584
Proteomic Screen for KSHV miRNA Targets
PLOS Pathogens | www.plospathogens.org 8 September 2013 | Volume 9 | Issue 9 | e1003584
[16,17,18], and the microarray and proteomic screening for
miRNA-induced gene expression changes in primary endothelial
cells from this report represent a complimentary dataset for
elucidating viral miRNA functions. Indeed, integration of miRNA
targets from CLIP methods and other expression studies will
continue to be useful for identifying miRNA target sites, as well
as >those CLIP hits that are repressed at the mRNA and/or
protein level. Compared with other approaches to discover
miRNA targets, current mass spectrometry methods are able to
query a lower number of gene products. Despite this limitation,
this current study has identified repression of multiple novel
and previously validated miRNA targets (THBS1, GRB2).
Additionally, gene expression studies can reveal direct and indirect
miRNA targets, both of which are important for virus-host
interactions. By inspecting gene expression changes at both the
mRNA and protein level, we have demonstrated that multiple
miRNA targets are likely missed using microarrays since the
miRNA target may only be repressed at the level of translation.
This finding is relevant given the conflicting reports about
the predominant mechanism and order of repression mechanisms
[37] that are utilized by miRNAs to modulate gene expression,
whether that be mRNA level repression [38] or translation
inhibition [39,40]. In this study, validated miRNA targets AKAP9,
STAT3, and GRB2 proteins were significantly repressed, but
microarray results indicated mRNA levels were not reduced in the
presence of KSHV miRNA mimics. The protein SH3-domain
GRB2-like endophilin B1 (SH3GLB1) was the second most
inhibited protein, but the mRNA levels were relatively unchanged
(log2 0.03). Interestingly, previous reports have shown that
SH3GLB1 functions as a tumor suppressor and pro-apoptotic
factor [41,42]. Given our findings, this proteomic method is clearly
an important start to discover novel miRNA targets. Furthermore,
we have also shown novel functions of viral miRNAs involved in
cellular pathways important to KSHV pathogenesis, including
ICAM1 repression, HMOX1 up-regulation and HIF1a up-
regulation.
Previous studies have indicated that ROCK2 is involved in
a pro-inflammatory pathway induced by lysophosphatidic acid
(LPA) that results in the up-regulation of intercellular adhesion
molecule 1 (ICAM1) on the surface of endothelial cells [26].
ICAM1 binds with lymphocyte function-associated antigen 1
(LFA-1) and leads to the recruitment and transmigration of
leukocytes. Interestingly, ICAM1 is downregulated from the cell
surface and degraded through a well-described mechanism by the
KSHV lytic protein, K5, which can cause a decrease in the
recruitment of helper T cells [27,43,44]. Furthermore, a previous
study [45] and this report have also shown a decrease in ICAM1
expression during latent de novo infection of endothelial cells.
We discovered that KSHV miRNAs, miR-K10a and miR-K4-
3p, repress ICAM1 expression after induction by LPA, likely
through ROCK2 and STAT3-associated pathways. Our data
indicate that miR-K10a may be inhibiting LPA induction of
ICAM1 by multiple mechanisms. First, the repression of a direct
or indirect miRNA target of miR-K10a may be partially
responsible for the decrease in LPA-induced STAT3 phosphor-
ylation. HITS-CLIP data [18] showed the kinase PTK2B/FAK as
a hit for miR-K10a alone, and, interestingly, PTK2B/FAK is
thought to be responsible for phosphorylation of STAT3 in LPA-
treated cells [31]. Although STAT3 protein levels can be repressed
by miR-K6-5p, unlike miR-K10a, it is not predicted to target the
kinase (PTK2B/FAK) and it remains to be determined if miR-K6-
5p can repress LPA-activation of ICAM1. Second, miR-K10a
may directly inhibit STAT3a total protein levels in LPA-treated
cells, as suggested by the results from the STAT3 39UTR
luciferase assays with miR-K10a. While others [45] have shown
that low levels of the KSHV protein K5 can still down-regulate
ICAM1 expression, we believe it is likely that during latent
infection, the inhibition of ICAM1 is also due to the viral miRNAs,
miR-K4-3p and miR-K10a. However, further studies are required
to further elucidate the contributions of viral protein and viral
miRNA-mediated repression of ICAM1.
HIF1a can activate transcription of VEGF and other factors
involved in angiogenesis [46], which raises the possibility that
KSHV miRNAs may influence the angiogenic environment in
KSHV-infected endothelial cells. Since miR-K7 increases HIF1aprotein levels, but did not inhibit some major repressors of HIF1a(Figure 6), this suggests miR-K7 is working through an alternative
pathway. We also observed a modest decrease in RBX1 when
HIF1a is upregulated and the combined data suggest that there
may be an underappreciated mechanism regulating HIF1aprotein levels. Others have reported an increase in HIF1a activity
with KSHV infection [47,48,49]. This increased activity is likely
due to contributions from both viral proteins and viral miRNAs.
Interestingly, analysis using MetaCore software reveals human
genes involved in translation initiation are enriched in the proteins
repressed by KSHV miRNAs in endothelial cells. This class of
translation initiation genes was also enriched in predicted miRNA
targets from both KSHV and EBV miRNAs in co-infected latent
BC1 cells [17,50]. By contrast, lytic viral infections have been
known to repress host translation inhibition [51] and others report
that translation is activated upon KSHV lytic reactivation [52].
Together, these results suggest KSHV may play a complex role in
influencing translation during latency and lytic infection. This
investigation into HIF1a regulation by miRNAs was raised by the
fact that the HIF1a transcriptional target heme oxygenase
(HMOX1) is strongly upregulated in this proteomic screen and
in KSHV infected cells in a previous report [33]. It was also found
that increased HMOX1 activity stimulated proliferation of
KSHV-infected endothelial cells [33]. Both heme oxygenase I
(HMOX1) and bilverdin reductase (BLVRA) are strongly up-
regulated in the presence of KSHV miRNAs in our study, and
both of these gene products can protect endothelial cells from
oxidative stress [53]. This also suggests certain KSHV miRNAs
may protect cells from oxidative stress, by inhibiting BACH1 from
repressing HMOX1 expression. Increased HMOX1 activity also
correlates with increased angiogenesis [54,55,56,57]. Taken
together, KSHV miRNA induction of HMOX1 can potentially
protect cells from oxidative stress and increase proliferation and
angiogenesis. In summary, the SILAC method revealed miRNA
targets and discovered ways in which KSHV miRNAs can
influence proliferation, angiogenesis, and immune evasion. More
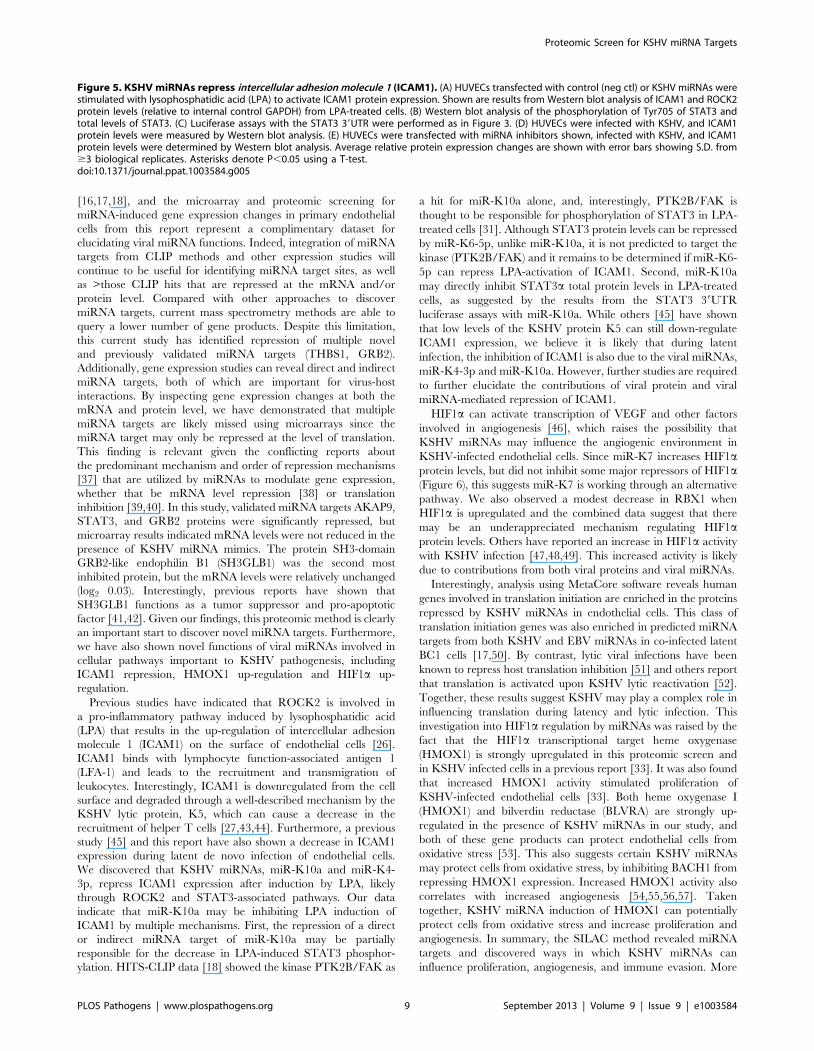
Figure 5. KSHV miRNAs repress intercellular adhesion molecule 1 (ICAM1). (A) HUVECs transfected with control (neg ctl) or KSHV miRNAs werestimulated with lysophosphatidic acid (LPA) to activate ICAM1 protein expression. Shown are results from Western blot analysis of ICAM1 and ROCK2protein levels (relative to internal control GAPDH) from LPA-treated cells. (B) Western blot analysis of the phosphorylation of Tyr705 of STAT3 andtotal levels of STAT3. (C) Luciferase assays with the STAT3 39UTR were performed as in Figure 3. (D) HUVECs were infected with KSHV, and ICAM1protein levels were measured by Western blot analysis. (E) HUVECs were transfected with miRNA inhibitors shown, infected with KSHV, and ICAM1protein levels were determined by Western blot analysis. Average relative protein expression changes are shown with error bars showing S.D. from$3 biological replicates. Asterisks denote P,0.05 using a T-test.doi:10.1371/journal.ppat.1003584.g005
Proteomic Screen for KSHV miRNA Targets
PLOS Pathogens | www.plospathogens.org 9 September 2013 | Volume 9 | Issue 9 | e1003584
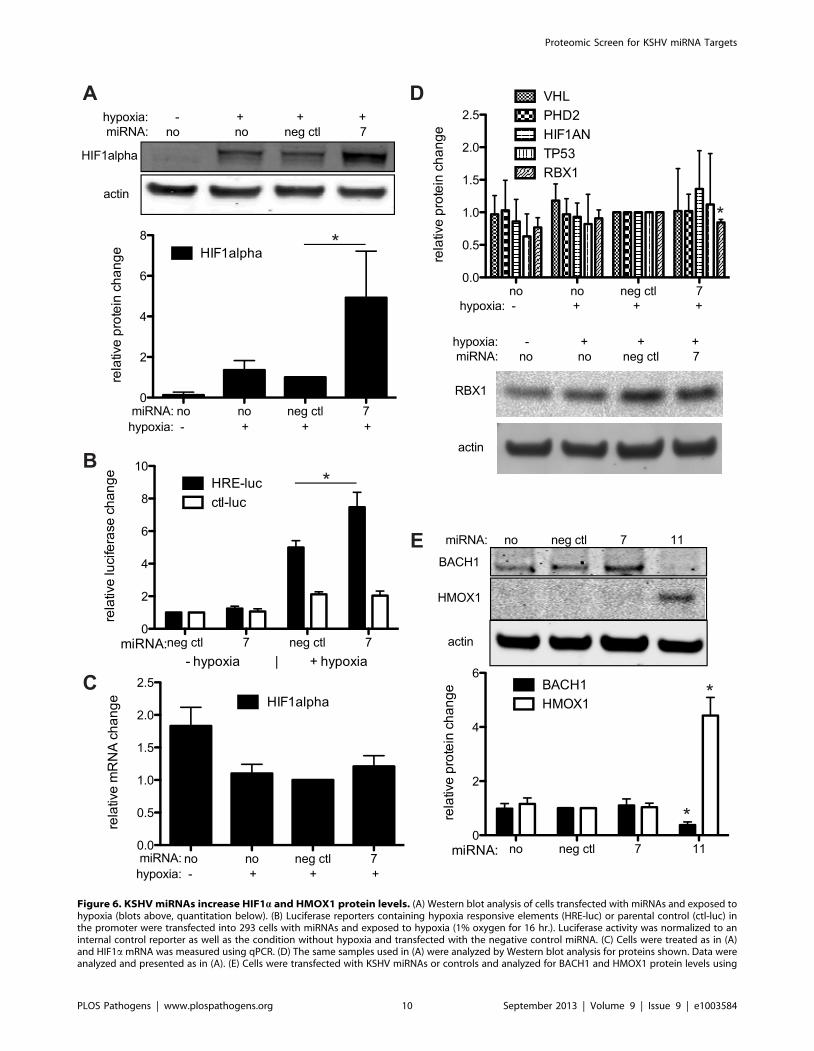
Figure 6. KSHV miRNAs increase HIF1a and HMOX1 protein levels. (A) Western blot analysis of cells transfected with miRNAs and exposed tohypoxia (blots above, quantitation below). (B) Luciferase reporters containing hypoxia responsive elements (HRE-luc) or parental control (ctl-luc) inthe promoter were transfected into 293 cells with miRNAs and exposed to hypoxia (1% oxygen for 16 hr.). Luciferase activity was normalized to aninternal control reporter as well as the condition without hypoxia and transfected with the negative control miRNA. (C) Cells were treated as in (A)and HIF1a mRNA was measured using qPCR. (D) The same samples used in (A) were analyzed by Western blot analysis for proteins shown. Data wereanalyzed and presented as in (A). (E) Cells were transfected with KSHV miRNAs or controls and analyzed for BACH1 and HMOX1 protein levels using
Proteomic Screen for KSHV miRNA Targets
PLOS Pathogens | www.plospathogens.org 10 September 2013 | Volume 9 | Issue 9 | e1003584
in-depth studies are needed to fully understand the significance of
selected human genes targeted for repression by viral miRNAs.
Materials and Methods
Cell Culture and Reagents293 cells were maintained in Dulbecco’s modified Eagle’s
medium (DMEM) containing 10% fetal bovine serum (FBS) and
16 penicillin and streptomycin (Pen Strep) glutamine solution
(Gibco). Primary human umbilical vein endothelial cells (HUVECs;
Lonza) were maintained in EGM-2 (Lonza) for up to five passages.
Locked nucleic acids were from Exiqon. Synthetic KSHV miRNA
mimics and a non-targeting miRNA (control) were from Ambion
(Sequences in Supplemental Information). HUVECs were seeded at
26105 cells/well in a 6-well plate, transfected by using 1.5 ml/well
DharmaFECT 1 reagent (Dharmacon) and 10 nM KSHV miRNA,
and harvested at 48 h posttransfection (hpt). ON-TARGETplus
SMARTpool small interfering RNAs (siRNAs) targeting ROCK2
and an ON-TARGETplus nontargeting pool were obtained from
Dharmacon. For ICAM1 experiments, cells were then serum
starved overnight in basal media (EBM-2) with 25% EGM-2 and,
40 hours post-transfection, treated with LPA (50 mM, Enzo) for
8 hours. Cells were harvested at 48 hr. post-transfection and lysed
in RIPA. For SILAC experiments, HUVECs were transfected (total
miRNA concentration was 10 nM) in T75 flasks for 6 hr. and then
split into new flask with medium-heavy (with 13C6-L-arginine and
D4-L-lysine) or heavy (13C615N4 L-arginine and 13C6
15N2 L-lysine)
SILAC media as described [20], except the media was also
supplemented with endothelial growth factors (Bulletkit, Lonza).
After 30 hr. post-transfection, cells were harvested from flasks,
counted, and equal number of cells from each condition were
combined and frozen.
Trypsin Digestion and Peptide FractionationFrozen cell pellet containing equal amount of control (neg
miRNA) and experimental (KSHV miRNAs) cells were suspended
in 100 ml of 25 mM ammonium bicarbonate buffer (pH 8.4). The
cells were lysed by brief sonication and the proteins were
denatured by heating the protein lysate at 95uC for 5 min.
Protein concentration was estimated using standard BCA assay
(Pierce) and the lysate was subjected to trypsin (enzyme to protein
ratio 1:100) digestion overnight at 37uC. The tryptic digest was
lyophilized and reconstituted in 25% ACN/0.1% FA (100 ml) and
fractionated using strong cation exchange (SCX) liquid chroma-
tography into 96 fractions. The fractions were pooled on the basis
of the intensity profile into 45 fractions, vacuum dried and
reconstituted in 12 mL of 0.1% formic acid prior to nano-flow
reversed-phase liquid chromatography mass spectrometry analysis.
Nanoflow Reversed Phase Liquid ChromatographyTandem Mass Spectrometry (nanoRPLC-MS/MS)
NanoRPLC–MS/MS analysis was performed using an Agilent
1100 nanoflow LC system coupled with hybrid linear ion trap-
fourier transform ion cyclotron resonance (LIT-FTICR) mass
spectrometer (LTQ FT Ultra) (ThermoElectron, San Jose, CA).
The system was connected to a 75 mm i.d.6360 mm o.d.610 cm
long fused silica microcapillary column (Polymicro Technologies,
Phoenix, AZ) packed in-house with 5 mm, 300 A pore size C-18
silica-bonded stationary RP particles (Vydac, Hysperia, CA). The
LC mobile phase A was 0.1% formic acid in water and B was
0.1% formic acid in acetonitrile. After the peptide sample
injection, gradient elution was performed under the following
conditions: 2% B at 500 nL/min in 30 min; a linear increase of 2–
42% B at 250 nL/min in 40 min; 42–98% B at 250 nL/min in
10 min; and 98% at 500 nL/min for 18 min. The LIT-FTICR-
MS was operated in the profile mode with 50,000 resolution for
FTMS scans and followed by the data-dependent MS/MS scans
where the seven most abundant peptide molecular ions in each
FTMS scan were sequentially selected for collision-induced
dissociation (CID) using a normalized collision energy of 35%.
Dynamic exclusion was applied to minimize repeated selection of
peptides previously selected for CID. The capillary temperature and
electrospray voltage were set to 160uC and 1.7 kV, respectively.
Western blot analysis. Average relative protein expression changes are shown with error bars representing S.D. from $3 biological replicates.Asterisks denote P,0.05 using a T-test.doi:10.1371/journal.ppat.1003584.g006
Figure 7. Enriched classes of proteins repressed by KSHV miRNAs. A list of the 5% most repressed proteins (Fig. 1C) was analyzed for themost enriched networks of interacting gene products using Metacore (GeneGo). This is a similar analysis to gene ontology term enrichment analysis.doi:10.1371/journal.ppat.1003584.g007
Proteomic Screen for KSHV miRNA Targets
PLOS Pathogens | www.plospathogens.org 11 September 2013 | Volume 9 | Issue 9 | e1003584
SILAC Data AnalysisThe raw LC-MS/MS data obtained from FT-LTQ was ana-
lyzed by MaxQuant (version 1.0.13.13) for peptide identification
and quantification. MS/MS peak list from individual RAW files
were generated using the Quant module of the MaxQuant
software and protein identification was performed using MAS-
COT against a decoy human database. Oxidation of methionine
was searched as a variable modification. The false discovery rate
was set at 1% for peptide and protein identification. Peptide peak
intensities were used to determine the relative abundance ratio of
‘‘heavy’’ labeled proteins to ‘‘medium’’ labeled proteins. Unla-
beled peptides were not used for further analysis. The ratio of
‘‘heavy’’ to ‘‘medium’’ proteins represents the fold change values
reported (Figure 1D-E, Tables S1, S2). Raw data files from
pSILAC from both technical replicates were combined and
then processed in MaxQuant to improve the coverage and the
number of peptides found per protein. The Spearman correlation
coefficient between protein expression changes for the two biolo-
gical replicates is 0.51 (and 0.43 Pearson correlation coefficient).
The Spearman correlation coefficient between mRNA expression
changes for the two biological replicates is 0.54 (and 0.57 Pearson
correlation coefficient). Due to the limited amount of sample
obtained from the primary cells, equal amount of heavy (H) and
medium (M) labeled cells were mixed prior to processing of the
samples. To verify that there was no labeling bias, an MA plot
(M = log2(H)2log2(M), A = K(log2(H)+log2(M)) was performed
followed by Lowess curve analysis on the transformed data. Figure
S4 shows that the Lowess regression line is almost straight around
zero horizontal line, demonstrating no labeling bias in the H and
M labeling.
MicroarraysRNA was purified using Tri reagent (Ambion) and RNA quality
was determined using a Bioanalyzer 2100 (Agilent). Agilent arrays
were performed and analyzed using Agilent Feature Extraction
Software and Genespring GX as previously [7]. HUVEC
microarray data was deposited to NCBI GEO database, accession
number GSE43640.
Western Blot AnalysisTotal cell protein was harvested from cell pellets by using
RIPA lysis buffer (Sigma) supplemented with 16 Halt protease
and phosphatase inhibitor cocktail (Thermo Scientific). Cells
were lysed on ice for 10 min, and cell debris was removed by
centrifugation at 13,000 rpm for 10 min. Nuclear extracts for
HIF1a blots were prepared using NE-PER (Pierce). The Li-Cor
Odyssey system was used for the detection and quantitation
of protein bands. The following primary antibodies were used:
rabbit anti-TWEAKR (4403, Cell Signaling), rabbit anti-BCLAF1
(Bethyl), goat anti-BACH1 (SC-14700, Santa Cruz), mouse
anti-GAPDH (sigma), anti-STAT3 (9132S, Cell Signaling),
rabbit anti-HMGCS1 (sc-33829, Santa Cruz), rabbit anti-GRB2
(3972S, Cell Signaling), rabbit anti-ICAM1 (4915, Cell Signaling),
rabbit anti-ROCK2 (sc-5561, Santa Cruz), mouse anti-HIF1a(NB100-105, Novus) and mouse anti-actin (AC-74, catalog
number A5316; Sigma) antibodies. The following secondary
antibodies conjugated to infrared (IR) fluorescing dyes were
obtained from Li-Cor: goat anti-rabbit antibody IR800CW, goat
anti-mouse antibody IR680, and goat anti-mouse antibody
IR800CW. Protein band intensities were calculated and back-
ground corrected using ImageStudio (Li-Cor). Results are
normalized to actin levels, relative to levels in mock-infected or
negative-control miRNA conditions.
Luciferase AssaysFull-length 39UTR assays were performed as previously
described [58]. Assays in Figure 3A used 39UTR firefly luciferase
reporters and were contransfected with a control renilla luciferase
reporter under the control of a thymidine kinase promoter. Assays
in Figure 3B–C used 39UTRs cloned into a dual luciferase
reporter. The 39UTRs were cloned downstream of the renilla
luciferase gene reporter. Luciferase values were normalized to an
internal luciferase reporter and to parental vectors lacking cloned
39UTRs. The hypoxia-inducible factor (HIF) luciferase reporter
has five HIF-responsive elements in the promoter upstream of
firefly luciferase reporter gene (Panomics). Mutations of the
predicted miRNA binding sites within the 39UTRs of ROCK2
and HMGCS1 were performed as previously described [58]
using the following primers and their reverse compliments: 59-
GCAGGCCTGCAAATACTGGCACAGAAATATAATCATA-
CACCTTATTAACGGTGA-39 for HMGCS1 and 59-CTATGA
AAGCAGTCATTATTCAAGGTGATCGTAAAGATCCAGT-
GAAAACAAGACTGAAATAT-3 for ROCK2 mut1 and 59-
TTACGCAGGACATTCTTGCCGTAAAGACATGATCCCA-
GATAAGTGTGTGT-39 for ROCK2 mut2.
Argonaute 2 (Ago2) Immunoprecipitation and miRNADetection
HUVECs were transfected as in SILAC experiments (mixture of
16 mimics, total concentration of mimics was 10 nM). Each Ago2
immunoprecipitation was performed from individual T75 flasks
using an Ago2 antibody (20 ml per 1 ml immunoprecipitation of
diluted lysate, Cell Signaling #2897), and the Magna RIP System
(Millipore). Purified RNA was subjected to TaqMan MicroRNA
Reverse Transcription Kit. Mature miRNA levels were deter-
mined using Taqman MicroRNA Assays and viral miRNAs were
normalized to human miR-21 levels using the DDCt method. Note
uninfected and untransfected HUVECs (control) had no detect-
able miR-K12-1, but displayed average threshold cycles of 35 for
miR-K12-7 and 37 cycles for miR-K12-11.
Sequence AnalysisUniprot IDs from pSILAC data, Agilent microarray probe IDs,
and TargetScan v5.0 Refseq IDs were mapped to Ensembl gene IDs.
Data integration was performed using Ensembl gene IDs. TargetS-
can sites ‘‘8mer’’, ‘‘7mer-m8’’, and ‘‘7mer-1A’’ were included, but
6mer sites were not included. Additional seed matching information
is provided in Table S2. Data similar to Table S2 was used to
calculate the number of seed matching sites per 39UTR. The
empirical cumulative distribution function (ecdf) was performed
using R (http://CRAN.R-project.org/). Promoter analysis of
hypoxia-inducible factor responsive elements was performed using
ExPlain (Biobase) using up-regulated (top 5%) proteins compared to
a control set of genes normally expressed in HUVECs.
Statistical AnalysisAt least three biological replicates were used for each analysis
and the mean and standard deviation were used in T-tests.
Changes were considered statistically significant when P,0.05.
Accession NumbersENSG00000134318
ENSG00000168610
ENSG00000140391
ENSG00000127914
ENSG00000112972
ENSG00000177885
Proteomic Screen for KSHV miRNA Targets
PLOS Pathogens | www.plospathogens.org 12 September 2013 | Volume 9 | Issue 9 | e1003584
Supporting Information
Figure S1 miRNA mimic sequences used in this study.
(DOC)
Figure S2 Luciferase and Western blotting with mirVana
microRNA mimics. (A–B) Luciferase reporters with full-length
39UTRs were co-transfected with miRNAs. Relative changes in
luciferase activity were normalized to a negative control miRNA
(neg ctl), an internal luciferase control, and a luciferase vector
control without the cloned 39UTR of interest. Asterisks denoted
P,0.05 (*), P,0.01 (**), n$3 using a T-test. (C) Primary
HUVECs were transfected without miRNAs (no), with a negative
control miRNA (ctl), or with KSHV miRNA mimics. Whole cells
lysates were analyzed using Western blotting and normalized to
actin (loading control) and the negative control miRNA (ctl).
Average relative protein expression changes are shown with error
bars showing S.D. from $3 biological replicates. Numbers shown
next to protein names reflect the weight (kilodalton) of each
protein.
(EPS)
Figure S3 Plots denote protein and mRNA expression changes
shown in Figure 4C, but gene products are separated into two
plots depending on if TargetScan detected a seed match site in the
corresponding 39UTR (‘‘with seeds’’ or ‘‘without seeds’’).
(EPS)
Figure S4 (A) MA Plots for SILAC biological replicates
(M = log2(H)2log2(M), A = K(log2(H)+log2(M)) was performed
followed by lowess curve analysis on the transformed data.
The lowess regression line (in red) is almost straight around 0,
demonstrating no labeling bias in the Heavy isotope and Medium
isotope labeling. (B) Histogram showing data from Figure 1D with
Gaussian fitted curve in red. Inset graph shows a magnified section
of repressed proteins.
(EPS)
Figure S5 Mass spectrometry spectra for three proteins
(HMGCS1, AKAP9, GRB2) mentioned in Figure 1. Each spectra
shows the relative abundance for the light, medium-heavy, and
heavy version of a specific peptide from each protein.
(EPS)
Table S1 Average fold changes (log2) from two biological
replicates for pSILAC or microarrays. The fold change values
reflect the difference from the KSHV miRNA samples versus
miRNA negative control samples. Gene products are identified
with Uniprot, Agilent microarray probe number, and official gene
symbol. RNA fold change was determined by microarray and
protein fold change was determined by pSILAC (nanoRPLC–
MS/MS).
(XLS)
Table S2 RNA and protein expression changes with seed
matching data. The microarray and pSILAC data from Table
S1 was integrated with output from TargetScan v5.0 (http://www.
targetscan.org/vert_50/). The transcript sequence bases with
predicted targets of KSHV miRNAs are shown with references
to the multiple sequence alignment (MSA_start) and the human
39UTR (UTR_start) sequences. The sequence files are available
on the TargetScan website.
(XLS)
Acknowledgments
We thank members of the Ziegelbauer laboratory for support, and Robert
Yarchoan for critical review of the manuscript. We also thank members of
Robert Yarchoan’s laboratory for hypoxia advice and support. We thank
Arthur Shaffer for microarray assistance.
Author Contributions
Conceived and designed the experiments: AMG JZ. Performed the
experiments: AMG SD TA ZX PKK CH JZ. Analyzed the data: AMG SD
TA ZX JZ. Contributed reagents/materials/analysis tools: PKK CH.
Wrote the paper: AMG TA JZ.
References
1. Cai X, Lu S, Zhang Z, Gonzalez CM, Damania B, et al. (2005) Kaposi’s
sarcoma-associated herpesvirus expresses an array of viral microRNAs in
latently infected cells. Proc Natl Acad Sci USA. pp. 5570–5575.
2. Grundhoff A, Sullivan CS, Ganem D (2006) A combined computational and
microarray-based approach identifies novel microRNAs encoded by human
gamma-herpesviruses. RNA 12: 733–750.
3. Pfeffer S, Sewer A, Lagos-Quintana M, Sheridan R, Sander C, et al. (2005)
Identification of microRNAs of the herpesvirus family. Nat Methods 2: 269–276.
4. Samols MA, Skalsky RL, Maldonado AM, Riva A, Lopez MC, et al. (2007)Identification of cellular genes targeted by KSHV-encoded microRNAs. PLoS
Pathog. 3: e65.
5. Skalsky RL, Samols MA, Plaisance KB, Boss IW, Riva A, et al. (2007) Kaposi’ssarcoma-associated herpesvirus encodes an ortholog of miR-155. J Virol 81:
12836–12845.
6. Gottwein E, Mukherjee N, Sachse C, Frenzel C, Majoros WH, et al. (2007) A
viral microRNA functions as an orthologue of cellular miR-155. Nature 450:1096–1099.
7. Ziegelbauer JM, Sullivan CS, Ganem D (2009) Tandem array-based expression
screens identify host mRNA targets of virus-encoded microRNAs. Nat Genet 41:130–134.
8. Nachmani D, Stern-Ginossar N, Sarid R, Mandelboim O (2009) Diverse
Herpesvirus MicroRNAs Target the Stress-Induced Immune Ligand MICB toEscape Recognition by Natural Killer Cells. Cell Host Microbe 5: 376–385.
9. Hansen A, Henderson S, Lagos D, Nikitenko L, Coulter E, et al. (2010) KSHV-
encoded miRNAs target MAF to induce endothelial cell reprogramming. Genes
Dev 24: 195–205.
10. Lei X, Bai Z, Ye F, Xie J, Kim CG, et al. (2010) Regulation of NF-kappaB
inhibitor IkappaBalpha and viral replication by a KSHV microRNA. Nat Cell
Biol 12: 193–199.
11. Lu F, Stedman W, Yousef M, Renne R, Lieberman PM (2010) Epigenetic
regulation of Kaposi’s sarcoma-associated herpesvirus latency by virus-encoded
microRNAs that target Rta and the cellular Rbl2-DNMT pathway. J Virol 84:2697–2706.
12. Gottwein E, Cullen BR (2010) A human herpesvirus microRNA inhibits p21
expression and attenuates p21-mediated cell cycle arrest. J Virol 84: 5229–5237.
13. Suffert G, Malterer G, Hausser J, Viiliainen J, Fender A, et al. (2011) Kaposi’s
sarcoma herpesvirus microRNAs target caspase 3 and regulate apoptosis. PLoS
Pathog 7: e1002405.
14. Abend JR, Uldrick T, Ziegelbauer JM (2010) Regulation of tumor necrosisfactor-like weak inducer of apoptosis receptor protein (TWEAKR) expression by
Kaposi’s sarcoma-associated herpesvirus microRNA prevents TWEAK-induced
apoptosis and inflammatory cytokine expression. J Virol 84: 12139–12151.
15. Lei X, Zhu Y, Jones T, Bai Z, Huang Y, et al. (2012) A Kaposi’s Sarcoma-
Associated Herpesvirus MicroRNA and Its Variants Target the Transforming
Growth Factor beta Pathway To Promote Cell Survival. J Virol 86: 11698–11711.
16. Dolken L, Malterer G, Erhard F, Kothe S, Friedel CC, et al. (2010) Systematic
analysis of viral and cellular microRNA targets in cells latently infected with
human gamma-herpesviruses by RISC immunoprecipitation assay. Cell Host
Microbe 7: 324–334.
17. Gottwein E, Corcoran DL, Mukherjee N, Skalsky RL, Hafner M, et al. (2011)
Viral MicroRNA Targetome of KSHV-Infected Primary Effusion Lymphoma
Cell Lines. Cell Host Microbe 10: 515–526.
18. Haecker I, Gay LA, Yang Y, Hu J, Morse AM, et al. (2012) Ago HITS-CLIP
expands understanding of Kaposi’s sarcoma-associated herpesvirus miRNA
function in primary effusion lymphomas. PLoS Pathog 8: e1002884.
19. Filipowicz W, Bhattacharyya SN, Sonenberg N (2008) Mechanisms of post-
transcriptional regulation by microRNAs: are the answers in sight? Nat Rev
Genet 9: 102–114.
20. Baek D, Villen J, Shin C, Camargo F, Gygi S, et al. (2008) The impact ofmicroRNAs on protein output. Nature 455: 64–71.
21. Selbach M, Schwanhausser B, Thierfelder N, Fang Z, Khanin R, et al. (2008)
Widespread changes in protein synthesis induced by microRNAs. Nature 455:58–63.
22. Vinther J, Hedegaard MM, Gardner PP, Andersen JS, Arctander P (2006)
Identification of miRNA targets with stable isotope labeling by amino acids incell culture. Nucleic Acids Res 34: e107.
Proteomic Screen for KSHV miRNA Targets
PLOS Pathogens | www.plospathogens.org 13 September 2013 | Volume 9 | Issue 9 | e1003584
23. Yang Y, Chaerkady R, Kandasamy K, Huang T-C, Selvan LDN, et al. (2010)
Identifying targets of miR-143 using a SILAC-based proteomic approach. Mol
BioSyst 6: 1873–1882.
24. Lagos D, Pollara G, Henderson S, Gratrix F, Fabani M, et al. (2010) miR-132
regulates antiviral innate immunity through suppression of the p300 transcrip-
tional co-activator. Nat Cell Biol 12: 513–519.
25. Lewis BP, Burge CB, Bartel DP (2005) Conserved seed pairing, often flanked by
adenosines, indicates that thousands of human genes are microRNA targets. Cell
120: 15–20.
26. Shimada H, Rajagopalan LE (2010) Rho kinase-2 activation in human
endothelial cells drives lysophosphatidic acid-mediated expression of cell
adhesion molecules via NF-kappaB p65. J Biol Chem 285: 12536–12542.
27. Manes TD, Hoer S, Muller WA, Lehner PJ, Pober JS (2010) Kaposi’s sarcoma-
associated herpesvirus K3 and K5 proteins block distinct steps in transendothe-
lial migration of effector memory CD4+ T cells by targeting different endothelial
proteins. J Immunol 184: 5186–5192.
28. Nishiyama A, Xin L, Sharov AA, Thomas M, Mowrer G, et al. (2009)
Uncovering early response of gene regulatory networks in ESCs by systematic
induction of transcription factors. Cell Stem Cell 5: 420–433.
29. Kesanakurti D, Chetty C, Rajasekhar Maddirela D, Gujrati M, Rao JS (2012)
Essential role of cooperative NF-kappaB and Stat3 recruitment to ICAM-1
intronic consensus elements in the regulation of radiation-induced invasion and
migration in glioma. Oncogene [Epub ahead of print] doi: 10.1038/
onc.2012.54.
30. Lee H, Deng J, Xin H, Liu Y, Pardoll D, et al. (2011) A requirement of STAT3
DNA binding precludes Th-1 immunostimulatory gene expression by NF-
kappaB in tumors. Cancer Res 71: 3772–3780.
31. Seo JH, Jeong KJ, Oh WJ, Sul HJ, Sohn JS, et al. (2010) Lysophosphatidic acid
induces STAT3 phosphorylation and ovarian cancer cell motility: their
inhibition by curcumin. Cancer Lett 288: 50–56.
32. Choi AM, Alam J (1996) Heme oxygenase-1: function, regulation, and
implication of a novel stress-inducible protein in oxidant-induced lung injury.
Am J Respir Cell Mol Biol 15: 9–19.
33. McAllister SC, Hansen SG, Ruhl RA, Raggo CM, DeFilippis VR, et al. (2004)
Kaposi sarcoma-associated herpesvirus (KSHV) induces heme oxygenase-1
expression and activity in KSHV-infected endothelial cells. Blood 103: 3465–
3473.
34. Yeligar SM, Machida K, Kalra VK (2010) Ethanol-induced HO-1 and NQO1
are differentially regulated by HIF-1alpha and Nrf2 to attenuate inflammatory
cytokine expression. J Biol Chem 285: 35359–35373.
35. Gibbs PE, Miralem T, Maines MD (2010) Characterization of the human
biliverdin reductase gene structure and regulatory elements: promoter activity is
enhanced by hypoxia and suppressed by TNF-alpha-activated NF-kappaB.
FASEB J 24: 3239–3254.
36. Kamura T, Koepp DM, Conrad MN, Skowyra D, Moreland RJ, et al. (1999)
Rbx1, a component of the VHL tumor suppressor complex and SCF ubiquitin
ligase. Science 284: 657–661.
37. Fukaya T, Tomari Y (2012) MicroRNAs Mediate Gene Silencing via Multiple
Different Pathways in Drosophila. Mol Cell 48: 825–836.
38. Guo H, Ingolia NT, Weissman JS, Bartel DP (2010) Mammalian
microRNAs predominantly act to decrease target mRNA levels. Nature 466:
835–840.
39. Bazzini AA, Lee MT, Giraldez AJ (2012) Ribosome profiling shows that miR-
430 reduces translation before causing mRNA decay in zebrafish. Science 336:
233–237.
40. Djuranovic S, Nahvi A, Green R (2012) miRNA-mediated gene silencing by
translational repression followed by mRNA deadenylation and decay. Science
336: 237–240.
41. Runkle KB, Meyerkord CL, Desai NV, Takahashi Y, Wang HG (2012) Bif-1
suppresses breast cancer cell migration by promoting EGFR endocyticdegradation. Cancer Biol Ther 13: 956–966.
42. Etxebarria A, Terrones O, Yamaguchi H, Landajuela A, Landeta O, et al.
(2009) Endophilin B1/Bif-1 stimulates BAX activation independently from itscapacity to produce large scale membrane morphological rearrangements. J Biol
Chem 284: 4200–4212.43. Coscoy L, Ganem D (2001) A viral protein that selectively downregulates
ICAM-1 and B7-2 and modulates T cell costimulation. J Clin Invest 107: 1599–
1606.44. Means RE, Lang SM, Jung JU (2007) The Kaposi’s sarcoma-associated
herpesvirus K5 E3 ubiquitin ligase modulates targets by multiple molecularmechanisms. J Virol 81: 6573–6583.
45. Tomescu C, Law WK, Kedes DH (2003) Surface downregulation of majorhistocompatibility complex class I, PE-CAM, and ICAM-1 following de novo
infection of endothelial cells with Kaposi’s sarcoma-associated herpesvirus.
J Virol 77: 9669–9684.46. Goto F, Goto K, Weindel K, Folkman J (1993) Synergistic effects of vascular
endothelial growth factor and basic fibroblast growth factor on the proliferationand cord formation of bovine capillary endothelial cells within collagen gels. Lab
Invest 69: 508–517.
47. Montaner S, Sodhi A, Pece S, Mesri EA, Gutkind JS (2001) The Kaposi’ssarcoma-associated herpesvirus G protein-coupled receptor promotes endothe-
lial cell survival through the activation of Akt/protein kinase B. Cancer Res 61:2641–2648.
48. Glaunsinger B, Ganem D (2004) Highly selective escape from KSHV-mediatedhost mRNA shutoff and its implications for viral pathogenesis. J Exp Med 200:
391–398.
49. Carroll PA, Kenerson HL, Yeung RS, Lagunoff M (2006) Latent Kaposi’ssarcoma-associated herpesvirus infection of endothelial cells activates hypoxia-
induced factors. J Virol 80: 10802–10812.50. Ramalingam D, Kieffer-Kwon P, Ziegelbauer JM (2012) Emerging Themes
from EBV and KSHV microRNA Targets. Viruses 4: 1687–1710.
51. Holland JJ, Peterson JA (1964) Nucleic acid and protein synthesis duringpoliovirus infection of human cells. J Mol Biol 8: 556–575.
52. Arias C, Walsh D, Harbell J, Wilson AC, Mohr I (2009) Activation of hosttranslational control pathways by a viral developmental switch. PLoS Pathog 5:
e1000334.53. Jansen T, Hortmann M, Oelze M, Opitz B, Steven S, et al. (2010) Conversion of
biliverdin to bilirubin by biliverdin reductase contributes to endothelial cell
protection by heme oxygenase-1-evidence for direct and indirect antioxidantactions of bilirubin. J Mol Cell Cardiol 49: 186–195.
54. Deramaudt BM, Braunstein S, Remy P, Abraham NG (1998) Gene transfer ofhuman heme oxygenase into coronary endothelial cells potentially promotes
angiogenesis. J Cell Biochem 68: 121–127.
55. Malaguarnera L, Pilastro MR, Quan S, Ghattas MH, Yang L, et al. (2002)Significance of heme oxygenase in prolactin-mediated cell proliferation and
angiogenesis in human endothelial cells. Int J Mol Med 10: 433–440.56. Abdel-Aziz MT, el-Asmar MF, el-Miligy D, Atta H, Shaker O, et al. (2003)
Retrovirus-mediated human heme oxygenase-1 (HO-1) gene transfer into ratendothelial cells: the effect of HO-1 inducers on the expression of cytokines.
Int J Biochem Cell Biol 35: 324–332.
57. Suzuki M, Iso-o N, Takeshita S, Tsukamoto K, Mori I, et al. (2003) Facilitatedangiogenesis induced by heme oxygenase-1 gene transfer in a rat model of
hindlimb ischemia. Biochem Biophys Res Commun 302: 138–143.58. Abend JR, Ramalingam D, Kieffer-Kwon P, Uldrick TS, Yarchoan R, et al.
(2012) KSHV microRNAs target two components of the TLR/IL-1R signaling
cascade, IRAK1 and MYD88, to reduce inflammatory cytokine expression.J Virol 86: 11663–11674.
Proteomic Screen for KSHV miRNA Targets
PLOS Pathogens | www.plospathogens.org 14 September 2013 | Volume 9 | Issue 9 | e1003584
Related Documents