Restorative Neurology and Neuroscience 21 (2003) 79–96 79 IOS Press Proteins in cerebrospinal fluid and blood: Barriers, CSF flow rate and source-related dynamics Hansotto Reiber Neurochemisches Labor der Neurologischen Klinik, Robert-Koch-Str. 40, Universit ¨ at G ¨ ottingen, D – 37075 G¨ ottingen, Germany Tel.: +49 551 39 66 19; Fax: +49 551 39 20 28; E-mail: [email protected] Abstract. Cerebrospinal fluid (CSF) routine analysis for diagnosis of neurological diseases is based on the concepts for discrim- ination of blood-derived and brain-derived immunoglobulin fractions in CSF. The actual molecular flux/CSF flow theory of the blood/CSF barrier function, which founded the hyperbolic discrimination lines in quotient diagrams, is derived from the laws of molecular diffusion combined with CSF flow rate. It emerged from this theory that the decrease of CSF flow rate is sufficient to explain quantitatively the increase of CSF protein concentrations as observed in many neurological diseases. With this concept of CSF flow rate as the modulator of the normal and pathological blood-CSF barrier function, we got for the first time a theoretical frame work to explain also quantitatively the dynamics of brain-derived proteins and their source related (neurons and glial cells or leptomeningal cells) differences. The review of the anatomical, physiological and biophysical knowledge points to the new interpretations: The changing albumin quotient is an indicator of changing CSF flow rate and not for a morphological “leakage” of the blood-brain barrier. As an application of these concepts the dynamics of brain-derived molecules in blood are discussed with two examples: beta trace protein, flowing with CSF into venous blood, and neuron-specific enolase, passing from tissue into blood the opposite direction of serum proteins, again a gradient-dependent protein diffusion across the intact blood vessel wall. Keywords: Blood-CSF barrier function, blood-brain barrier, Cerebrospinal fluid, CSF flow, brain-derived proteins, blood-derived proteins, protein dynamics, theory 1. Introduction For about hundred years protein analysis in CSF dealt with the blood-derived proteins, in particular with the immunoglobulins and their pathological intrathecal synthesis. Correspondingly, interpretation concepts re- ferred to various models of the blood-CSF barrier func- tion to discriminate an intrathecally synthesized frac- tion from a blood-derived fraction in CSF. The most prominent procedures used to identify an intrathecal IgG synthesis were linear functions [1–3]. The early observation of a different relation of the immunoglob- ulin CSF/serum quotient, QIgG, to the albumin quo- tient, QAlb, in the range of a blood CSF barrier dys- function [4] found a first, still linear response [3] soon followed by several nonlinear approaches using sig- moidal [5], exponential [6,7] or unspecified arbitrary curves [8]. The discovery of the hyperbolic function as a best empirical fit [9] was finally confirmed as the correct description by its biophysical derivation from laws of diffusion combined with CSF flow rate (molec- ular flux/CSF flow theory [10]). With the applica- tion in quotient diagrams for IgG, IgA and IgM and the description of disease-related immunoglobulin pat- terns [11,12] CSF analysis for diagnosis of neurological diseases gained sensitivity and specificity. The theoret- ical foundation of the hyperbolic discrimination func- tions between blood- and brain-derived protein frac- tions in CSF [10] contributed to a new view of the blood CSF barrier function: the pathological change of 0922-6028/03/$8.00 2003 – IOS Press. All rights reserved

Welcome message from author
This document is posted to help you gain knowledge. Please leave a comment to let me know what you think about it! Share it to your friends and learn new things together.
Transcript
Restorative Neurology and Neuroscience 21 (2003) 79–96 79IOS Press
Proteins in cerebrospinal fluid and blood:Barriers, CSF flow rate and source-relateddynamics
Hansotto ReiberNeurochemisches Labor der Neurologischen Klinik, Robert-Koch-Str. 40, Universitat Gottingen, D – 37075Gottingen, GermanyTel.: +49 551 39 66 19; Fax: +49 551 39 20 28; E-mail: [email protected]
Abstract. Cerebrospinal fluid (CSF) routine analysis for diagnosis of neurological diseases is based on the concepts for discrim-ination of blood-derived and brain-derived immunoglobulin fractions in CSF. The actual molecular flux/CSF flow theory of theblood/CSF barrier function, which founded the hyperbolic discrimination lines in quotient diagrams, is derived from the laws ofmolecular diffusion combined with CSF flow rate. It emerged from this theory that the decrease of CSF flow rate is sufficient toexplain quantitatively the increase of CSF protein concentrations as observed in many neurological diseases. With this concept ofCSF flow rate as the modulator of the normal and pathological blood-CSF barrier function, we got for the first time a theoreticalframe work to explain also quantitatively the dynamics of brain-derived proteins and their source related (neurons and glial cellsor leptomeningal cells) differences. The review of the anatomical, physiological and biophysical knowledge points to the newinterpretations: The changing albumin quotient is an indicator of changing CSF flow rate and not for a morphological “leakage”of the blood-brain barrier.As an application of these concepts the dynamics of brain-derived molecules in blood are discussed with two examples: beta traceprotein, flowing with CSF into venous blood, and neuron-specific enolase, passing from tissue into blood the opposite directionof serum proteins, again a gradient-dependent protein diffusion across the intact blood vessel wall.
Keywords: Blood-CSF barrier function, blood-brain barrier, Cerebrospinal fluid, CSF flow, brain-derived proteins, blood-derivedproteins, protein dynamics, theory
1. Introduction
For about hundred years protein analysis in CSFdealt with the blood-derivedproteins, in particular withthe immunoglobulins and their pathological intrathecalsynthesis. Correspondingly, interpretation concepts re-ferred to various models of the blood-CSF barrier func-tion to discriminate an intrathecally synthesized frac-tion from a blood-derived fraction in CSF. The mostprominent procedures used to identify an intrathecalIgG synthesis were linear functions [1–3]. The earlyobservation of a different relation of the immunoglob-ulin CSF/serum quotient, QIgG, to the albumin quo-tient, QAlb, in the range of a blood CSF barrier dys-function [4] found a first, still linear response [3] soon
followed by several nonlinear approaches using sig-moidal [5], exponential [6,7] or unspecified arbitrarycurves [8]. The discovery of the hyperbolic functionas a best empirical fit [9] was finally confirmed as thecorrect description by its biophysical derivation fromlaws of diffusion combined with CSF flow rate (molec-ular flux/CSF flow theory [10]). With the applica-tion in quotient diagrams for IgG, IgA and IgM andthe description of disease-related immunoglobulin pat-terns [11,12] CSF analysis for diagnosis of neurologicaldiseases gained sensitivity and specificity. The theoret-ical foundation of the hyperbolic discrimination func-tions between blood- and brain-derived protein frac-tions in CSF [10] contributed to a new view of theblood CSF barrier function: the pathological change of
0922-6028/03/$8.00 2003 – IOS Press. All rights reserved

80 H. Reiber / Proteins in cerebrospinal fluid and blood
CSF flow rate is sufficient to explain quantitatively thedynamics of blood-derived proteins in CSF.
Brain-derived proteins in CSF and blood, which areof increasing diagnostic relevance [13–19], present animportant extension of the basic CSF analysis program,in particular the observation that the dynamics of brain-derived proteins are, source-related, modified by CSFflow rate [19]. Neither a systematic investigation nor ageneral theoretical approach to describe the dynamicsof brain-derived proteins in CSF has been available sofar.With this recent decription of the dynamics of brain-derived proteins [19] the molecular flux/CSF flow the-ory [10] gained evidence as a valid concept to describethe normal and pathological protein dynamics in CSF.Subsequently this theory led to a new interpretation ofthe physiological observations regarding blood-brainand blood – CSF barrier functions.
Earlier ideas, still frequently referred to, explainedan increased protein concentration in CSF as a mor-phological “leakage” or “breakdown” of the barrier. Apart of this view is the misleading idea that the in-tact blood-brain barrier is impermeable for large pro-teins or for proteins at all. This is definitively wrong(see below).But the most crucial, wrong asumption isthat the local pathological molecular changes [20,21] atthe wall of some brain capillaries (blood-brain barrier)have a particular relevance for the pathological con-centration change in CSF (blood-CSF barrier dysfunc-tion). The empirical physiological observations jus-tifying this statement which might irritate some read-ers, are summarized below and in [10]. In contrastto the asumption that such a local molecular approachcounts for the observed changes in CSF the molecularflux/CSF flow theory [10] gives a much wider view ofthe blood-CSF barrier as a functional entity of diffu-sion and CSF flow rate. This “barrier-function” has tobe understood as a process, which by restricted molec-ular diffusion (including capillary walls among otherstructures) and associated biochemical and physiologi-cal processes maintain a dynamical blood/CSF concen-tration gradient. With this concept all different causesof increased CSF protein concentrations like inflamma-tion or mechanical blockade in the lumbar spinal canalgot a common interpretation.
In this contribution I summarize the anatomical,physiological and biophysical knowledge base for themolecular flux/CSF flow model, its relevance for thebarrier concepts regarding blood-derived proteins andthe relevance for the dynamics of brain-derived proteinsin CSF.
Based on this concept of diffusion and CSF flow, Ireport a first draft for the interpretation of the observed
dynamics of brain-derivedproteins in blood passing the“barriers” in the opposite direction.
2. Physiology
2.1. Origins of CSF proteins
The main fraction of proteins in the normal cere-brospinal fluid originates from blood, e.g. albuminwhich constitutes 35–80% of total protein in CSF [11].
About 20% of the protein in CSF are predomi-nantly brain-derived, but rarely brain-specific [22]. Forexample,90% of transthyretin in CSF originate fromchoroid plexus (Table 1) but is also synthesized inthe liver or, another example, the gamma monomer ofneuron-specific enolase is synthesized in erythrocytesand thrombocytes as well.
The basic feature of predominantly brain-derivedproteins is their higher concentration in CSF comparedto serum, inducing a net flux out of CSF comparedwith blood-derived proteins with a net flux into CSF(Table 1). The particular dynamics of the brain-derivedproteins depend on their sources which are either thebrain cells (neurons, glial cells) or the leptomeningealcells [19]. For some of the predominantly brain-derivedproteins their high blood concentration contributes anot negligible fraction to the CSF concentration (Ta-ble 1).
2.2. Physiology of CSF space
The CSF space (Fig. 1) involves the ventricles and thesubarachnoid space with its enlargements, the cisterns.The subarachnoid space between the arachnoidea andthe pia mater has a particular structure with trabeculaeconnecting the two meninges. CSF, flowing from theventricles into the cisterns, divides then into a corticaland lumbar subarachnoid space (Fig. 1). The CSF,including cells and proteins, leaves the subarachnoidspace through the arachnoid granulationsor villi, whichfunction like a valve, letting pass the whole unfilteredCSF(“bulk flow”) into the dural venous sinuses. Asshown by several investigators [23], the main, if notthe only, exit routes of bulk CSF are in the cortical andspinal subarachnoid spaces (arachnoid villi and spinalnerve roots).
H. Reiber / Proteins in cerebrospinal fluid and blood 81
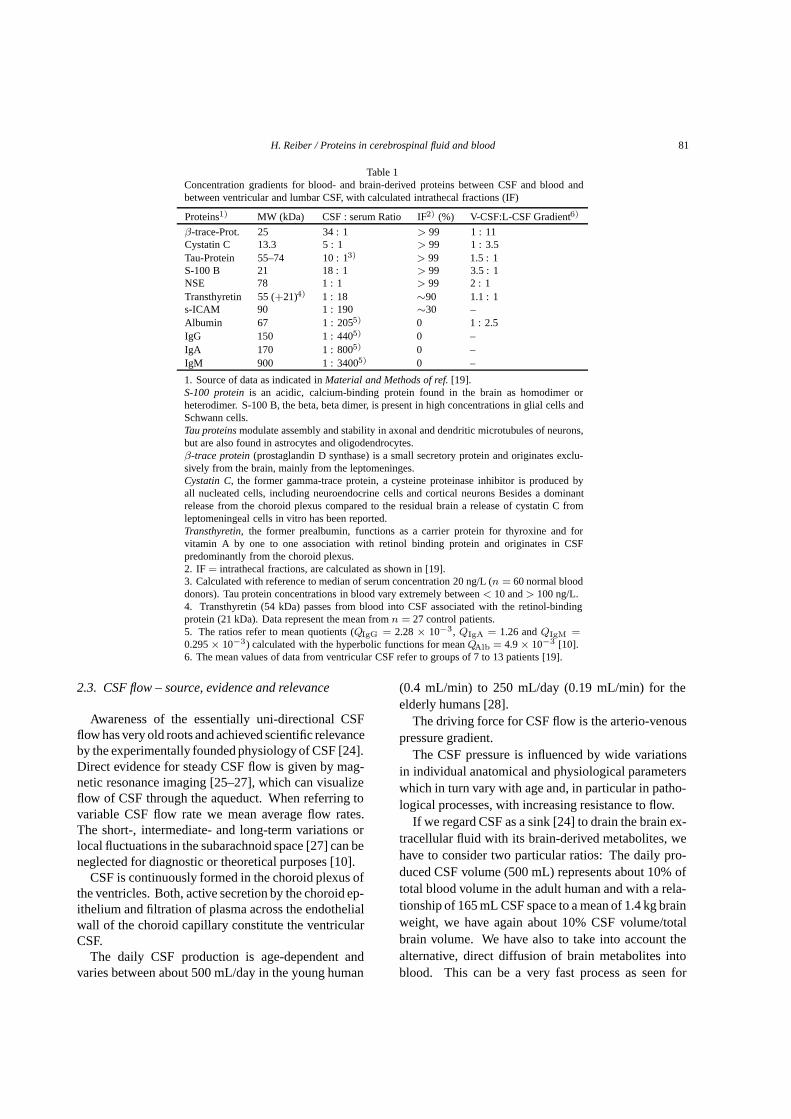
Table 1Concentration gradients for blood- and brain-derived proteins between CSF and blood andbetween ventricular and lumbar CSF, with calculated intrathecal fractions (IF)
Proteins1) MW (kDa) CSF : serum Ratio IF2) (%) V-CSF:L-CSF Gradient6)
β-trace-Prot. 25 34 : 1 > 99 1 : 11Cystatin C 13.3 5 : 1 > 99 1 : 3.5Tau-Protein 55–74 10 : 13) > 99 1.5 : 1S-100 B 21 18 : 1 > 99 3.5 : 1NSE 78 1 : 1 > 99 2 : 1Transthyretin 55 (+21)4) 1 : 18 ∼90 1.1 : 1s-ICAM 90 1 : 190 ∼30 –Albumin 67 1 : 2055) 0 1 : 2.5IgG 150 1 : 4405) 0 –IgA 170 1 : 8005) 0 –IgM 900 1 : 34005) 0 –
1. Source of data as indicated inMaterial and Methods of ref.[19].S-100 proteinis an acidic, calcium-binding protein found in the brain as homodimer orheterodimer. S-100 B, the beta, beta dimer, is present in high concentrations in glial cells andSchwann cells.Tau proteinsmodulate assembly and stability in axonal and dendritic microtubules of neurons,but are also found in astrocytes and oligodendrocytes.β-trace protein(prostaglandin D synthase) is a small secretory protein and originates exclu-sively from the brain, mainly from the leptomeninges.Cystatin C, the former gamma-trace protein, a cysteine proteinase inhibitor is produced byall nucleated cells, including neuroendocrine cells and cortical neurons Besides a dominantrelease from the choroid plexus compared to the residual brain a release of cystatin C fromleptomeningeal cells in vitro has been reported.Transthyretin, the former prealbumin, functions as a carrier protein for thyroxine and forvitamin A by one to one association with retinol binding protein and originates in CSFpredominantly from the choroid plexus.2. IF = intrathecal fractions, are calculated as shown in [19].3. Calculated with reference to median of serum concentration 20 ng/L (n = 60 normal blooddonors). Tau protein concentrations in blood vary extremely between< 10 and> 100 ng/L.4. Transthyretin (54 kDa) passes from blood into CSF associated with the retinol-bindingprotein (21 kDa). Data represent the mean fromn = 27 control patients.5. The ratios refer to mean quotients (QIgG = 2.28× 10⁻³, QIgA = 1.26 andQIgM =0.295× 10⁻³) calculated with the hyperbolic functions for meanQAlb = 4.9× 10⁻³ [10].6. The mean values of data from ventricular CSF refer to groups of 7 to 13 patients [19].
2.3. CSF flow – source, evidence and relevance
Awareness of the essentially uni-directional CSFflow has very old roots and achieved scientific relevanceby the experimentally founded physiology of CSF [24].Direct evidence for steady CSF flow is given by mag-netic resonance imaging [25–27], which can visualizeflow of CSF through the aqueduct. When referring tovariable CSF flow rate we mean average flow rates.The short-, intermediate- and long-term variations orlocal fluctuations in the subarachnoid space [27] can beneglected for diagnostic or theoretical purposes [10].
CSF is continuously formed in the choroid plexus ofthe ventricles. Both, active secretion by the choroid ep-ithelium and filtration of plasma across the endothelialwall of the choroid capillary constitute the ventricularCSF.
The daily CSF production is age-dependent andvaries between about 500 mL/day in the young human
(0.4 mL/min) to 250 mL/day (0.19 mL/min) for theelderly humans [28].
The driving force for CSF flow is the arterio-venouspressure gradient.
The CSF pressure is influenced by wide variationsin individual anatomical and physiological parameterswhich in turn vary with age and, in particular in patho-logical processes, with increasing resistance to flow.
If we regard CSF as a sink [24] to drain the brain ex-tracellular fluid with its brain-derived metabolites, wehave to consider two particular ratios: The daily pro-duced CSF volume (500 mL) represents about 10% oftotal blood volume in the adult human and with a rela-tionship of 165 mL CSF space to a mean of 1.4 kg brainweight, we have again about 10% CSF volume/totalbrain volume. We have also to take into account thealternative, direct diffusion of brain metabolites intoblood. This can be a very fast process as seen for
82 H. Reiber / Proteins in cerebrospinal fluid and blood
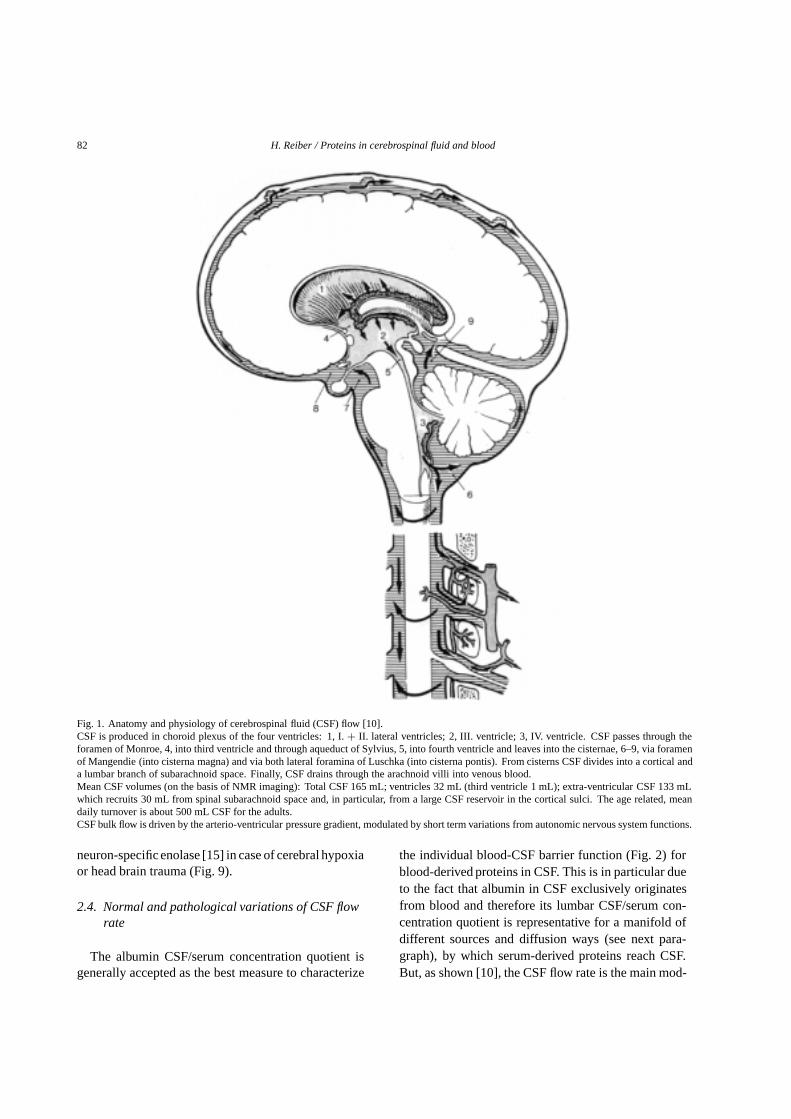
Fig. 1. Anatomy and physiology of cerebrospinal fluid (CSF) flow [10].CSF is produced in choroid plexus of the four ventricles: 1, I.+ II. lateral ventricles; 2, III. ventricle; 3, IV. ventricle. CSF passes through theforamen of Monroe, 4, into third ventricle and through aqueduct of Sylvius, 5, into fourth ventricle and leaves into the cisternae, 6–9, via foramenof Mangendie (into cisterna magna) and via both lateral foramina of Luschka (into cisterna pontis). From cisterns CSF divides into a cortical anda lumbar branch of subarachnoid space. Finally, CSF drains through the arachnoid villi into venous blood.Mean CSF volumes (on the basis of NMR imaging): Total CSF 165 mL; ventricles 32 mL (third ventricle 1 mL); extra-ventricular CSF 133 mLwhich recruits 30 mL from spinal subarachnoid space and, in particular, from a large CSF reservoir in the cortical sulci. The age related, meandaily turnover is about 500 mL CSF for the adults.CSF bulk flow is driven by the arterio-ventricular pressure gradient, modulated by short term variations from autonomic nervous system functions.
neuron-specificenolase [15] in case of cerebral hypoxiaor head brain trauma (Fig. 9).
2.4. Normal and pathological variations of CSF flowrate
The albumin CSF/serum concentration quotient isgenerally accepted as the best measure to characterize
the individual blood-CSF barrier function (Fig. 2) forblood-derived proteins in CSF. This is in particular dueto the fact that albumin in CSF exclusively originatesfrom blood and therefore its lumbar CSF/serum con-centration quotient is representative for a manifold ofdifferent sources and diffusion ways (see next para-graph), by which serum-derived proteins reach CSF.But, as shown [10], the CSF flow rate is the main mod-
H. Reiber / Proteins in cerebrospinal fluid and blood 83
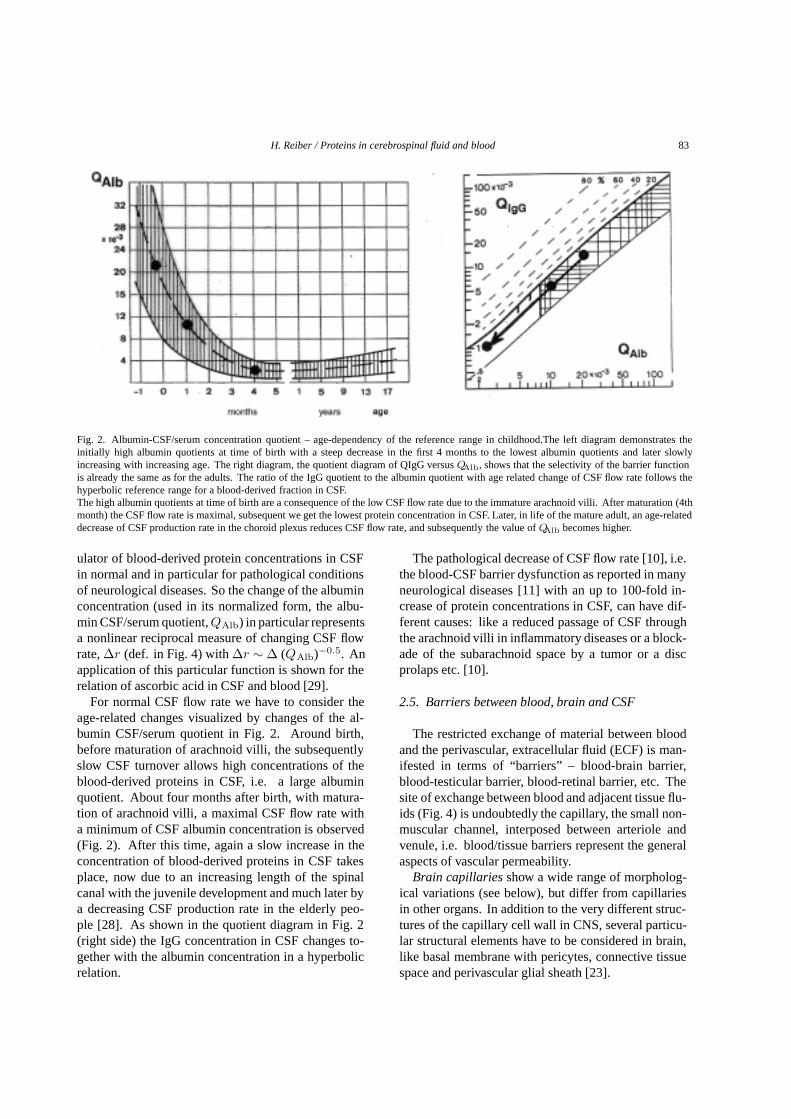
Fig. 2. Albumin-CSF/serum concentration quotient – age-dependency of the reference range in childhood.The left diagram demonstrates theinitially high albumin quotients at time of birth with a steep decrease in the first 4 months to the lowest albumin quotients and later slowlyincreasing with increasing age. The right diagram, the quotient diagram of QIgG versusQAlb, shows that the selectivity of the barrier functionis already the same as for the adults. The ratio of the IgG quotient to the albumin quotient with age related change of CSF flow rate follows thehyperbolic reference range for a blood-derived fraction in CSF.The high albumin quotients at time of birth are a consequence of the low CSF flow rate due to the immature arachnoid villi. After maturation (4thmonth) the CSF flow rate is maximal, subsequent we get the lowest protein concentration in CSF. Later, in life of the mature adult, an age-relateddecrease of CSF production rate in the choroid plexus reduces CSF flow rate, and subsequently the value ofQAlb becomes higher.
ulator of blood-derived protein concentrations in CSFin normal and in particular for pathological conditionsof neurological diseases. So the change of the albuminconcentration (used in its normalized form, the albu-min CSF/serum quotient,QAlb) in particular representsa nonlinear reciprocal measure of changing CSF flowrate,∆r (def. in Fig. 4) with∆r ∼ ∆ (QAlb)−0.5. Anapplication of this particular function is shown for therelation of ascorbic acid in CSF and blood [29].
For normal CSF flow rate we have to consider theage-related changes visualized by changes of the al-bumin CSF/serum quotient in Fig. 2. Around birth,before maturation of arachnoid villi, the subsequentlyslow CSF turnover allows high concentrations of theblood-derived proteins in CSF, i.e. a large albuminquotient. About four months after birth, with matura-tion of arachnoid villi, a maximal CSF flow rate witha minimum of CSF albumin concentration is observed(Fig. 2). After this time, again a slow increase in theconcentration of blood-derived proteins in CSF takesplace, now due to an increasing length of the spinalcanal with the juvenile development and much later bya decreasing CSF production rate in the elderly peo-ple [28]. As shown in the quotient diagram in Fig. 2(right side) the IgG concentration in CSF changes to-gether with the albumin concentration in a hyperbolicrelation.
The pathological decrease of CSF flow rate [10], i.e.the blood-CSF barrier dysfunction as reported in manyneurological diseases [11] with an up to 100-fold in-crease of protein concentrations in CSF, can have dif-ferent causes: like a reduced passage of CSF throughthe arachnoid villi in inflammatory diseases or a block-ade of the subarachnoid space by a tumor or a discprolaps etc. [10].
2.5. Barriers between blood, brain and CSF
The restricted exchange of material between bloodand the perivascular, extracellular fluid (ECF) is man-ifested in terms of “barriers” – blood-brain barrier,blood-testicular barrier, blood-retinal barrier, etc. Thesite of exchange between blood and adjacent tissue flu-ids (Fig. 4) is undoubtedly the capillary, the small non-muscular channel, interposed between arteriole andvenule, i.e. blood/tissue barriers represent the generalaspects of vascular permeability.
Brain capillariesshow a wide range of morpholog-ical variations (see below), but differ from capillariesin other organs. In addition to the very different struc-tures of the capillary cell wall in CNS, several particu-lar structural elements have to be considered in brain,like basal membrane with pericytes, connective tissuespace and perivascular glial sheath [23].

84 H. Reiber / Proteins in cerebrospinal fluid and blood
Fig. 3. Change of immunoglobulin concentration in CSF as a function of increasing albumin quotient (blood-CSF barrier dysfunction)- acomparison.The left diagram shows the means of the empirical data of immunoglobulin CSF/serum quotients [10] with increasing albumin quotientcharacterized by a hyperbolic function. For extreme values see also Table 2. The diagram on the right side represents an experimental approach,by which the serum of a patient is successively titrated into the CSF sample. The empirically measured data follow a 45◦ line. There is nomolecular size dependent discrimination as seen from the parallel lines of QIgG, QIgA and QIgM. This discrepancy to the empirical data (leftside) presents an argument against a “leakage” phenomenon, in which the molecular size-dependent discrimination (selectivity) would be lost.
The passage of dye-molecules from blood intobrain extracellular fluid is timely delayed, i.e. re-stricted, compared to the fast stain of extravascular,i.e.intercellular fluid of other tissues. In the originalexperiments by Ehrlich (Ref. in [24]), when the an-imal was injected intravenously with Evans blue dye(which is bound principally to albumin), the entireanimal turned blue with the exception of the brainwhich remained white. This led to the idea that cer-tain molecules do not pass the blood-brain barrier.It is meanwhile clear that all molecules as well aswhole cells [30] can pass from blood into brain. Theextent of protein transfer depends on the molecularsize-dependent diffusion [31]. Larger molecules havesteeper overall concentration gradients between bloodand CSF and a larger time delay for arrival in CSF(Fig. 5). In particular, for the relevant interpretation ofpathological processes which involve “barrier dysfunc-tions”, it is important to understand this dynamical na-ture of the barriers, not merely based on morphologicalchanges.
In general terms, a barrier function allows to sustaina biological systems individuality, i.e. it permits sin-gle compartments (cell, organ, circulation system) tomaintain an inner state different from its environment(e.g. extracellular fluid or blood). The barrier func-tion maintains concentration gradients against the dis-sipative forces which would otherwise lead the systeminto a chemical equilibrium (and death). But the steady
state of a gradient is not only the consequence of thethickness or tightness of structures which restrict themolecular diffusion, the actual gradient depends cru-cially on the connected consumption- or elimination-reactions, e.g., without the CSF flow (Fig. 4) the con-centrations of the serum proteins would equilibrate onboth sides of the barrier after some time and the gradi-ent would disappear (as observed shortly after death inthe corpse).
The non-linear nature of these relations in suchdynamic systems were first described as reaction-diffusion equations by Turing [32]. The molecularflux/CSF flow theory [10] represents a particular ap-plication of this concept to describe the non-linear dy-namics of the blood-CSF barrier function (Fig. 5).
The particular blood-CSF barrier function for pro-teinsincludes a manifold of diffusion pathways. Only afraction of them is directly connected with the capillarywall and associated structures, calledblood-brain bar-rier. A protein, like albumin, originating from bloodcan enter CSF in the ventricles, cisterns or lumbar andcortical subarachnoid space. Blood-derived proteinscan have passed very different structures at differentlocations [23] when they finally appear in lumbar CSF:
1. the choroid plexus with capillaries of the fenes-trated type and tight epithelial lining
2. the ventricular surface with a less tight ependymallayer (gap junctions) and correspondingly less re-
H. Reiber / Proteins in cerebrospinal fluid and blood 85
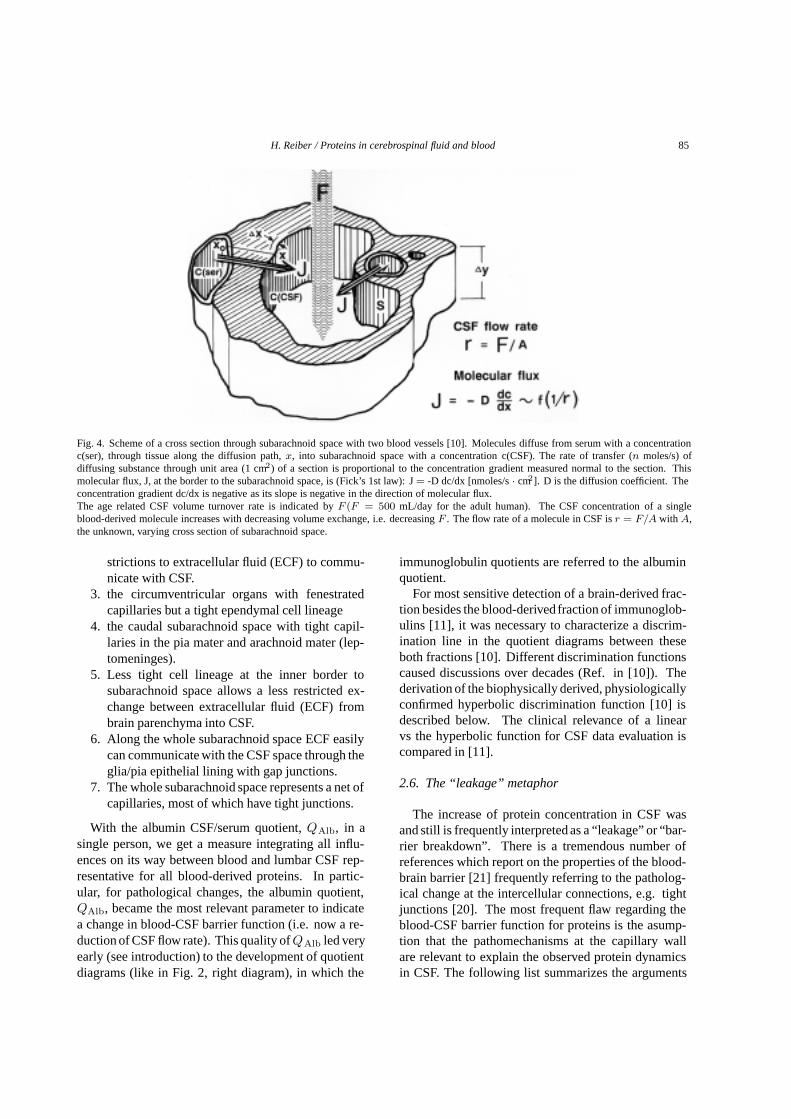
Fig. 4. Scheme of a cross section through subarachnoid space with two blood vessels [10]. Molecules diffuse from serum with a concentrationc(ser), through tissue along the diffusion path,x, into subarachnoid space with a concentration c(CSF). The rate of transfer (n moles/s) ofdiffusing substance through unit area (1 cm2) of a section is proportional to the concentration gradient measured normal to the section. Thismolecular flux, J, at the border to the subarachnoid space, is (Fick’s 1st law): J= -D dc/dx [nmoles/s· cm2]. D is the diffusion coefficient. Theconcentration gradient dc/dx is negative as its slope is negative in the direction of molecular flux.The age related CSF volume turnover rate is indicated byF (F = 500 mL/day for the adult human). The CSF concentration of a singleblood-derived molecule increases with decreasing volume exchange, i.e. decreasingF . The flow rate of a molecule in CSF isr = F/A with A,the unknown, varying cross section of subarachnoid space.
strictions to extracellular fluid (ECF) to commu-nicate with CSF.
3. the circumventricular organs with fenestratedcapillaries but a tight ependymal cell lineage
4. the caudal subarachnoid space with tight capil-laries in the pia mater and arachnoid mater (lep-tomeninges).
5. Less tight cell lineage at the inner border tosubarachnoid space allows a less restricted ex-change between extracellular fluid (ECF) frombrain parenchyma into CSF.
6. Along the whole subarachnoid space ECF easilycan communicate with the CSF space through theglia/pia epithelial lining with gap junctions.
7. The whole subarachnoid space represents a net ofcapillaries, most of which have tight junctions.
With the albumin CSF/serum quotient,QAlb, in asingle person, we get a measure integrating all influ-ences on its way between blood and lumbar CSF rep-resentative for all blood-derived proteins. In partic-ular, for pathological changes, the albumin quotient,QAlb, became the most relevant parameter to indicatea change in blood-CSF barrier function (i.e. now a re-duction of CSF flow rate). This quality ofQAlb led veryearly (see introduction) to the development of quotientdiagrams (like in Fig. 2, right diagram), in which the
immunoglobulin quotients are referred to the albuminquotient.
For most sensitive detection of a brain-derived frac-tion besides the blood-derived fraction of immunoglob-ulins [11], it was necessary to characterize a discrim-ination line in the quotient diagrams between theseboth fractions [10]. Different discrimination functionscaused discussions over decades (Ref. in [10]). Thederivation of the biophysically derived, physiologicallyconfirmed hyperbolic discrimination function [10] isdescribed below. The clinical relevance of a linearvs the hyperbolic function for CSF data evaluation iscompared in [11].
2.6. The “leakage” metaphor
The increase of protein concentration in CSF wasand still is frequently interpreted as a “leakage” or “bar-rier breakdown”. There is a tremendous number ofreferences which report on the properties of the blood-brain barrier [21] frequently referring to the patholog-ical change at the intercellular connections, e.g. tightjunctions [20]. The most frequent flaw regarding theblood-CSF barrier function for proteins is the asump-tion that the pathomechanisms at the capillary wallare relevant to explain the observed protein dynamicsin CSF. The following list summarizes the arguments

86 H. Reiber / Proteins in cerebrospinal fluid and blood
Fig. 5. Idealized protein concentration gradient between blood and CSF [10].The diffusion controlled protein transfer between blood and CSF is described by an idealized diffusion barrier (homogeneous and unique insteadof multistructural, inhomogeneous diffusionpath). The change of concentrationci (in blood as c(ser), normalized for c(ser)= 1, and in CSF as Q= c(CSF)/c(ser)), along the effective diffusion pathlength,x (xp, the value at the border to subarachnoid space for the single person), shows thesigmoidal curve, derived from Fick’s second law of diffusion. These curves represent steady states for three protein species of different molecularsize, like albumin (A), IgG (B) and IgM (C). The smaller molecules A has a larger “penetration depth”, i.e. higher mean concentration, in thetissue than the larger molecules B, and a steeper local gradient corresponding to a higher CSF concentration,QA.
which give evidence for the molecular flux/CSF flowtheory of the blood-CSF barrier function:
1. Figure 3 shows the most striking experiment in-dicating the discrepancy between the empiricalblood-CSF barrier dysfunction and the idea ofa “leakage” due to a “hole” or increasing pores,i.e. a massive extravasation of blood proteinsin the absence of a molecular size-dependenttransfer: On the left side of Fig. 3 the empiricalmean relation between two molecules of differ-ent size, e.g. IgG and albumin, follows a hyper-bolic function over a wide range of increasing al-bumin concentrations (decreasing flow rate) andthe empirical relation between the mean con-centration of IgG, IgA and IgM shows that themolecular size-related selectivity of the barrierfunction is maintained in spite of serious blood-CSF barrier dysfunction. The Table 2 givesa collection of single cases with CSF albuminquotients up to 73% of the serum concentration,but still with a molecular size-related selectivity.The alternative, hypothetical model of a “leak-age” is shown on the right side of Fig. 3. Ifsmall volumes of the blood of a patient are suc-cessively titrated into its CSF sample, we get alinear increase (45◦) of all proteins with a lossof molecular size-related selectivity.
Table 2Data sets of albumin- and immunoglobulin CSF/serum concentrationquotients from patients with an extreme blood-CSF barrier dysfunc-tion without an intrathecal humoral immune response
Disease QAlb QIgG QIgA QIgM
(·103) (·103) (·103) (·103)
Spinal tumor 172 93 67 15Spinal cyst 344 182 96 26Medullablastoma 627 425 347 161Bacterial meningitis∗ 731 646 466 352
∗Early phase before onset of humoral immune response.
2. The dynamics of the initial increase of proteinconcentrations in CSF of patients with a bac-terial meningitis (Table 3) clearly indicate theunchanged molecular size-dependent selectivityin spite of the barrier dysfunction. The smallermolecules reach faster the steady state than thelarger molecules [10]: Albumin reaches at thefirst day after start of clinical symptoms 50%,IgG 20%, IgA 10% and IgM 5%, respectively,of the concentrations at the second day. Ac-cording to the leakage model (Fig. 3, right side)the IgM concentration should increase relativelyfaster then albumin between normal and the firstday which is in contrast to the empirical data inTable 3.
H. Reiber / Proteins in cerebrospinal fluid and blood 87
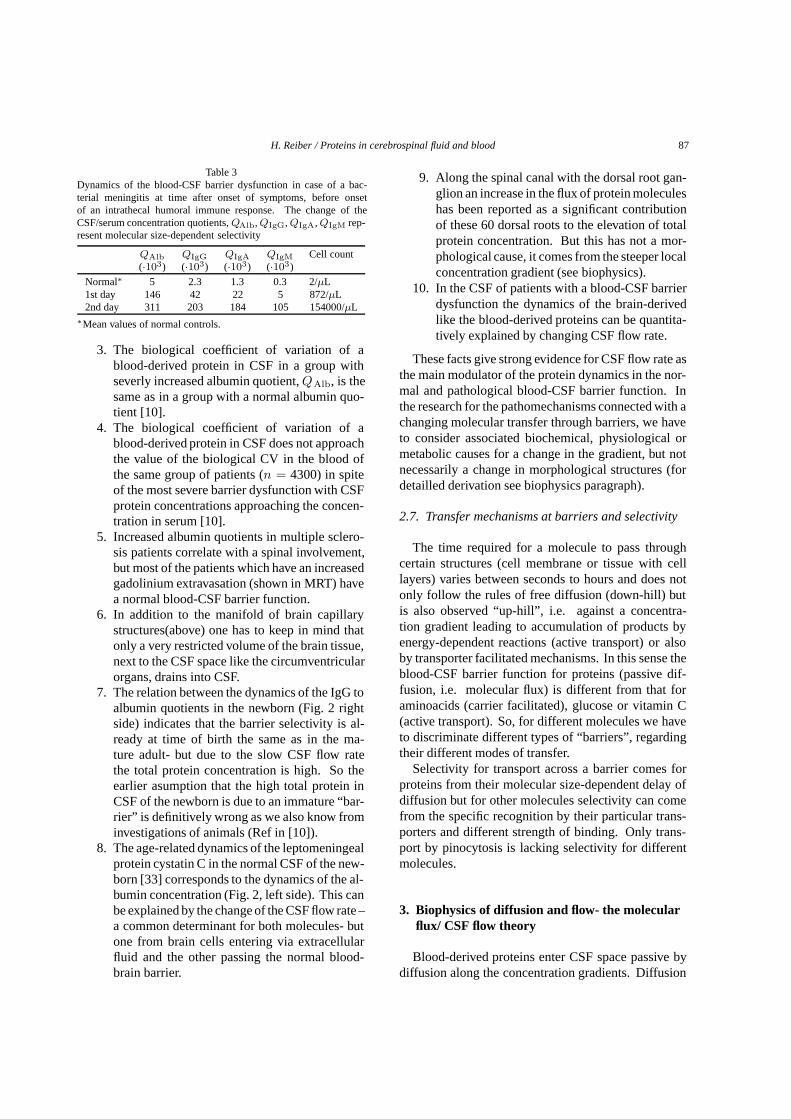
Table 3Dynamics of the blood-CSF barrier dysfunction in case of a bac-terial meningitis at time after onset of symptoms, before onsetof an intrathecal humoral immune response. The change of theCSF/serum concentration quotients,QAlb, QIgG, QIgA, QIgM rep-resent molecular size-dependent selectivity
QAlb QIgG QIgA QIgM Cell count(·103) (·103) (·103) (·103)
Normal∗ 5 2.3 1.3 0.3 2/µL1st day 146 42 22 5 872/µL2nd day 311 203 184 105 154000/µL
∗Mean values of normal controls.
3. The biological coefficient of variation of ablood-derived protein in CSF in a group withseverly increased albumin quotient,QAlb, is thesame as in a group with a normal albumin quo-tient [10].
4. The biological coefficient of variation of ablood-derived protein in CSF does not approachthe value of the biological CV in the blood ofthe same group of patients (n = 4300) in spiteof the most severe barrier dysfunction with CSFprotein concentrations approaching the concen-tration in serum [10].
5. Increased albumin quotients in multiple sclero-sis patients correlate with a spinal involvement,but most of the patients which have an increasedgadolinium extravasation (shown in MRT) havea normal blood-CSF barrier function.
6. In addition to the manifold of brain capillarystructures(above) one has to keep in mind thatonly a very restricted volume of the brain tissue,next to the CSF space like the circumventricularorgans, drains into CSF.
7. The relation between the dynamics of the IgG toalbumin quotients in the newborn (Fig. 2 rightside) indicates that the barrier selectivity is al-ready at time of birth the same as in the ma-ture adult- but due to the slow CSF flow ratethe total protein concentration is high. So theearlier asumption that the high total protein inCSF of the newborn is due to an immature “bar-rier” is definitively wrong as we also know frominvestigations of animals (Ref in [10]).
8. The age-related dynamics of the leptomeningealprotein cystatin C in the normal CSF of the new-born [33] corresponds to the dynamics of the al-bumin concentration (Fig. 2, left side). This canbe explained by the change of the CSF flow rate –a common determinant for both molecules- butone from brain cells entering via extracellularfluid and the other passing the normal blood-brain barrier.
9. Along the spinal canal with the dorsal root gan-glion an increase in the flux of protein moleculeshas been reported as a significant contributionof these 60 dorsal roots to the elevation of totalprotein concentration. But this has not a mor-phological cause, it comes from the steeper localconcentration gradient (see biophysics).
10. In the CSF of patients with a blood-CSF barrierdysfunction the dynamics of the brain-derivedlike the blood-derived proteins can be quantita-tively explained by changing CSF flow rate.
These facts give strong evidence for CSF flow rate asthe main modulator of the protein dynamics in the nor-mal and pathological blood-CSF barrier function. Inthe research for the pathomechanisms connected with achanging molecular transfer through barriers, we haveto consider associated biochemical, physiological ormetabolic causes for a change in the gradient, but notnecessarily a change in morphological structures (fordetailled derivation see biophysics paragraph).
2.7. Transfer mechanisms at barriers and selectivity
The time required for a molecule to pass throughcertain structures (cell membrane or tissue with celllayers) varies between seconds to hours and does notonly follow the rules of free diffusion (down-hill) butis also observed “up-hill”, i.e. against a concentra-tion gradient leading to accumulation of products byenergy-dependent reactions (active transport) or alsoby transporter facilitated mechanisms. In this sense theblood-CSF barrier function for proteins (passive dif-fusion, i.e. molecular flux) is different from that foraminoacids (carrier facilitated), glucose or vitamin C(active transport). So, for different molecules we haveto discriminate different types of “barriers”, regardingtheir different modes of transfer.
Selectivity for transport across a barrier comes forproteins from their molecular size-dependent delay ofdiffusion but for other molecules selectivity can comefrom the specific recognition by their particular trans-porters and different strength of binding. Only trans-port by pinocytosis is lacking selectivity for differentmolecules.
3. Biophysics of diffusion and flow- the molecularflux/ CSF flow theory
Blood-derived proteins enter CSF space passive bydiffusion along the concentration gradients. Diffusion
88 H. Reiber / Proteins in cerebrospinal fluid and blood
processes are described by Fick’s first and second law ofdiffusion. The second law with a differential equationof second order has no explicit, general solution. Thisis the reason why the history of physics of diffusionis characterized by the invention of implicit solutionsfor particular physical conditions, i.e. for particularmodels.
The model of Reiber (1994) [10] for the blood-CSFbarrier function (Figs 4–6) describes a diffusion systemwhere on one side of a restricted range (tissue) we havea quasi infinite source of solutes (blood) and at the otherside a solvent (CSF), which, most relevant, is the sourceof a steady elimination process by the flowing CSF.
Figure 4 shows these both determinants in aschematic cross section of the subarachnoid space withblood vessels.
The particular target for a mathematical treatment ofthis model was to describe the changing relation of CSFconcentrations of two blood derived molecule specieswith different molecular size, in the case of a changingelimination rate (CSF flow rate). For this purpose wehave to regard: 1) the non-linear concentration gradient(Fig. 5); 2) the relevance of the local concentrationgradient for the diffusion rate (molecular flux into CSF(Fick’s 1st law, J= -Di dci/dx); and 3) the changeof CSF concentration as source of the time dependentchange in the local gradient (Fick’s 2nd law, dc/dt=D(d2c/dx2).
The basic laws of diffusion, their application to themodel of blood CSF barrier function and the derivationof the hyperbolic function with the molecular flux/CSFflow theory are described in detail [10]. For the ex-tension of the application of the theory to integrate thebrain-derived proteins, I will outline the base of thetheory.
The concentration gradient of a protein betweenblood vessel and CSF (model in Fig. 4) is non-linear asshown in Fig. 5 for an idealized homogeneous medium.According to Fick’s 1st law the molecular flux intoCSF is determined by the local concentration gradient,∆c/∆x, as shown in the cross section through sub-arachnoid space (Fig. 4), or more correct as the differ-ential, dc/dx, the slope of the tangent of the non-linearconcentration gradient at the border to subarachnoidspace (Fig. 5).
As molecules in a diffusion process are not coupledto each other, it is always the local gradient which isrelevant for the local molecular flux, not the fictive,calculated overall gradient (Fig. 6, right diagram). Butthe local gradient depends on the overall gradient ina non-linear way (Fig. 5). This non-linear gradient is
a part of the experience each biochemist can have bywatching column chromatography: a sharp dye bandbecomes broader and broader with increasing time ofdiffusion and by densitometry one can show a concen-tration distribution like a Gaussian error curve. Thesame physical base leads to the curves in Fig. 5. Thesecurves represent steady states for three protein speciesof different molecular size,idealized as albumin (A),IgG (B) and IgM (C). The smaller molecules A havea larger “penetration depth”, i.e. higher mean con-centration, in the tissue than the larger molecules B(Fig. 5), a steeper local gradient at the border to CSFspace and a higher CSF concentration, QA than QB orQC. The differences are physically characterized by thediffusion coefficient, D, used in the equation of Fick’s1st law (legend of Fig. 4). The diffusion coefficientDi of a molecule i, represents a value which dependson its molecular size and on the properties of the sol-vent (e.g. viscosity) in which the molecule (solute) issolved. The variation of the value of Di along a diffu-sion path through tissue with different viscosities canbe neglected in our task as this change is relevant forall molecules (A, B, C) in a corresponding way.
Fick’s 1st law for molecular flux is a linear expressionof a local concentration gradient. Now under patho-logical conditions of a neurological disease, where theCSF protein concentration is increased, subsequentlythe local gradient changes as a function of concentra-tion or time. Exactly this is described by Fick’s secondlaw, a non-linear function, shown in the equation: dc/dt= D(d2c/dx2).
This means that in case of reduced CSF flow ratea molecule C in Fig. 6 (e.g. IgM), has a primarilyincreasing concentration in CSF fromQC to QD toQE with a subsequent increase in penetration depth,i.e. increasing mean protein concentration in the tissue(Fig. 6). With this increase of CSF concentration, alsothe local molecular flux J≈ dci/dx at the border to CSFspace changes: the local gradient dc/dx is increasing!,i.e. with primarily increasing CSF protein concentra-tion there is also secondarily a faster molecular flux,additionally increasing the CSF protein concentration.Correspondingly, also the concentration ratio betweentwo molecules of different size, likeQA toQB in Fig. 5,would change. This change of the gradient has now tobe described by Fick’s second law of diffusion.
By a mathematical procedure, based on introductionof a geometrical series, called error function comple-ment, erfc [10], I could derive a function which con-tained only the ratios of diffusion coefficients. Thisfunction in Eq. (1) describes the changing concentra-
H. Reiber / Proteins in cerebrospinal fluid and blood 89
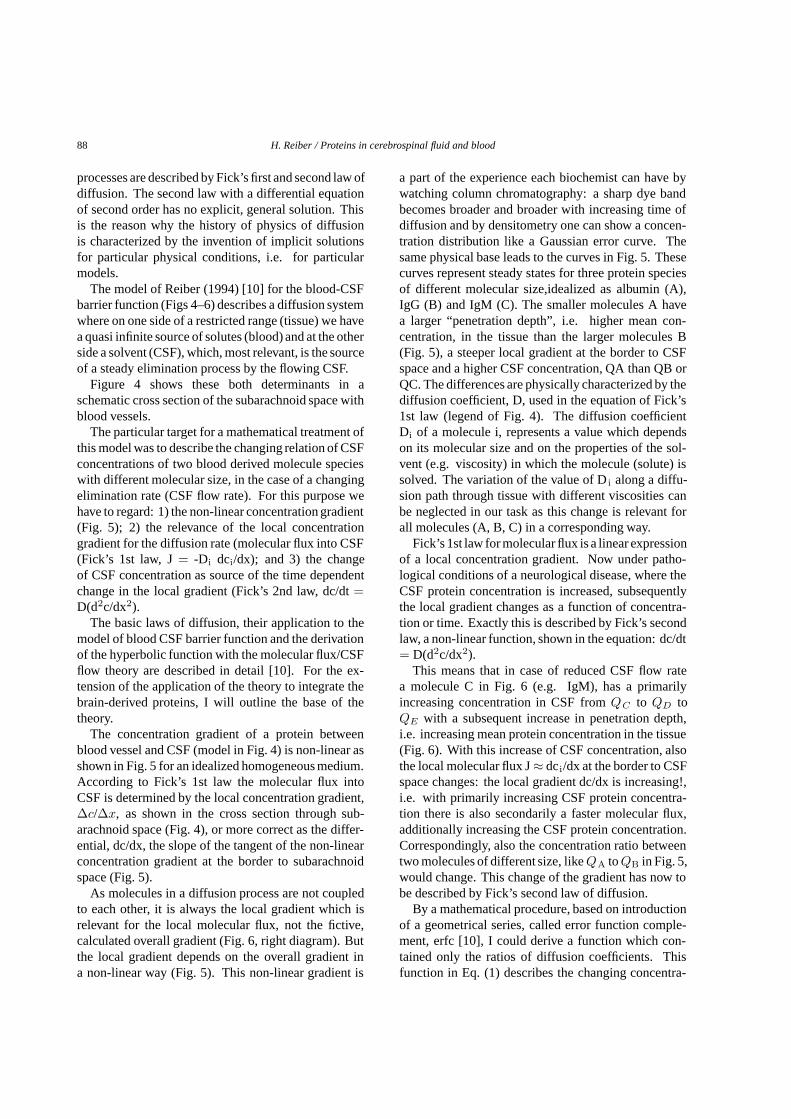
Fig. 6. Dynamics of blood-derived proteins between blood and CSF after pathological reduction of CSF flow rate.Comparison of non-linear (left side) and linear models of blood CSF protein concentration gradients. The blood protein concentration of asingle protein is normalized with maximal values C(ser)= 1. Corresponding CSF protein concentrations are given as dimensionless CSF/serumquotients (QC , QD, QE) with values between 0 and 1.x, represents the effective diffusion pathlength of the idealized barrier according tothe boundary conditions described in [10]. C, D, E represent the curves for the concentration distribution of the same protein (e.g. IgM) atdifferent times: before (to, curve C) and after (t1, t2, curve D and E) the onset of a disease with decreasing CSF flow rate and, subsequently,increasing concentration of IgM in CSF. The local concentration gradient, dc/dx, at the border to subarachnoid space (atx) and correspondinglythe molecular flux, J, increase in the non-linear model (left side) from C to E, but decrease in the linear model (right side) from C to E. In thiscase the decreasing fictive, calculated overall concentration gradient would be indentical with the local gradient dc/dx, but decreasing from C toE in contrast to the case in the left diagramm.
tion ratio of the two molecules, e.g. A and B in CSF inFig. 5, if the CSF flow rate changes (i.e. with increasingQA):
QB = (erfc z (DB/DA)0.5/erfc z) · QA (1)
I could also show that this function in Eq. (1) is ahyperbolic function [10], i.e. the corresponding con-centration values ofQB andQA fit the well known,explicit form of the hyperbolic function [9]:
QB = a/b · (Q2A + b2)0.5 − c (2)
This means that the concentration ratio of moleculesof different size diffusing through the same matter (e.g.plane sheet, slab) is generally characterized by a hy-perbolic function. The shape of this hyperbolic curveis determined only by the ratio of the square roots ofboth diffusion coefficients, in Eq. (1).
It is important to understand that this hyperbolicfunction is valid for the normal as well as for the patho-logical range of albumin quotients, i.e. still underpathological conditions the change of protein concen-trations in CSF follows the rules of diffusion with amolecular size-dependent discrimination (Fig. 3, leftdiagram).
The values of the actual parameters a, b, c of thisfunction in Eq. (2) for IgG, IgA or IgM are given in [10]with calculation examples in [11,12].
3.1. Physical, selfreferential feed back
Figure 6 shows the time dependent change with de-creasing CSF flow rate, the subsequent increase ofprotein concentration in CSF due to reduced volumeturnover and a subsequent increase in the steady stateconcentration in the tissue: the sigmoidal curve for theconcentration of molecule C at timetc, changes into acurve D at timetd and to E at timete. The particu-lar consequence of this increase of the concentration inthe tissue between blood and CSF in our model is thechange at the border to the CSF space: the local gradi-ent is increasing (increasing slope of tangents in Fig. 6,left side), in spite of the decreasing overall concentra-tion ratio between blood and CSF (Fig. 6, right side).The slope of the tangents is non-linearly increasing aslong as CCSF < Cser/2 or Q < 0.5 but decreases forthe rare case of quotientsQ > 0.5 (> 500 · 10−3).
As shown in Fig. 6, right side, for a wrong, lin-ear model the local concentration gradient would de-
90 H. Reiber / Proteins in cerebrospinal fluid and blood
crease with increasing CSF concentration and corre-spondingly the local molecular flux into CSF. In thissense of a negative feed back the barrier dysfunctionwould be a selflimiting event. This is in contradictionto observations, like the faster appearance of a blood-derived molecule in lumbar, before ventricular CSF(the higher lumbar CSF concentration corresponds to asteeper local gradient).
Figure 6 describes a difference between former linearbarrier models [35] and the actual molecular flux/CSFflow theory, which is aware of the physical, positivefeed back of increasing CSF concentration on the localconcentration gradient, inducing a faster molecular fluxwith increasing CSF concentration. This selfreferentialsystem (analog to autocatalytic processes in chemistry)is the cause of the observed non-linear relation, thehyperbolic function (e.g. in Fig. 3, left side). This is themain cause of increased molecular passage from bloodinto tissue and CSF- with or without any change at thelocal “microscopic” conditions of capillary walls: Thetransfer of molecules from blood into CSF can becomefaster just by reduced CSF flow rate without any changeof morphological structures!
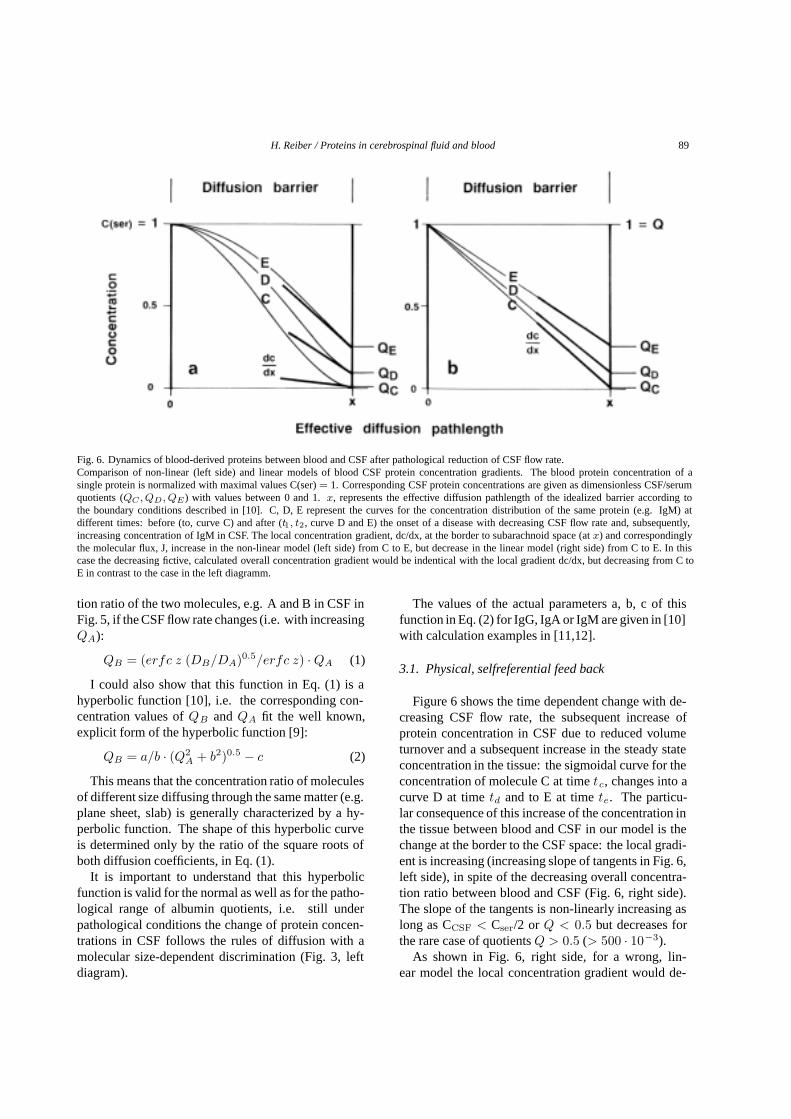
Figure 7 shows that this theory fits for all blood-derived proteins, like prothrombin or carcinoembryonicantigen in addition to the well known immunoglobulins.The only difference between the curves comes fromtheir different molecular size as to be expected fromEq. (1).
3.2. CSF flow and the rostro-caudal gradient
The concentrations of blood-derived proteins in CSFincrease between ventricles and lumbar subarachnoidspace (normal CSF flow rate) e.g. 2.5-fold for albumin(Table 1), due to the steady molecular flux of the pro-teins into CSF along its flow way As a consequence ofthe concentration-dependent positive feed back (Fick’s2nd law), the local concentration gradients must in-crease along the rostro caudal concentration gradient,too, i.e. the molecular flux into CSF increases non-linearly with increasing distance from the ventricles.This is consistent with the report that labeled proteinsfrom blood appear first in lumbar CSF and later in cis-ternal or ventricular CSF (Ref. in [10]). A correspond-ing set of albumin concentration values from a seriesof CSF samples extracted by lumbar puncture in serialfractions should show this non-linear increase to someextent [34].
4. Dynamics of brain-derived proteins in CSF
Table 1 and Figs 7 and 8 describe the main dif-ferences between brain-derived proteins and blood-derived proteins. The differences are best characterisedby the two concentration gradients: the CSF/bloodconcentration ratio (known as CSF/serum quotients)and the ventricular/lumbar CSF concentration gradient(rostro-caudal gradient).
We find largeCSF/serum concentration ratiosbe-tween 1:1 (NSE) and 34:1 (β-trace protein) comparedto 1:205 (albumin) or 1:3400 (IgM) for blood-derivedproteins in CSF. The calculated brain-derived intrathe-cal fraction (IF) is> 99% for tau protein, NSE, S-100B,Cystatin C orβ-trace protein, but 0% for the proteinswhich, under normal conditions, are exclusively blood-derived. Brain-derived proteins with a non-negligibleblood-derived fraction in CSF, like transthyretin, an-giotensin converting enzyme [19] or soluble intracellu-lar cell adhesion molecule (s-ICAM) have intermedi-ate CSF: serum ratios (1:18 to 1:190) with intrathecalfractions between about 90% to 30%, correspondingly(Table 1).
Theventricular to lumbar CSF concentration gradi-entsof brain-derived proteins show source-related dif-ferences.Proteins which are released from brain cells(NSE, S-100B and tau protein) have the highest con-centration in ventricular CSF steadily decreasing alongthe CSF flow path through the subarachnoid space(Table 1). Vice versa, proteins released from lep-tomeninges into CSF are increasing in concentrationalong the subarachnoid space up to 11-fold (β-traceprotein). This is higher than the rostro-caudal 2.5-fold increase of the albumin concentration. The gra-dient for transthyretin in Table 1 refers to the choroidplexus-derived fraction in CSF calculated from to-tal transthyretin in CSF by subtraction of the blood-derived fraction [19]. Already the concentration of totaltransthyretin is decreasing slightly between ventricularand lumbar CSF, in spite of the small but steady flux ofblood-derived molecules into CSF, as consequence ofthe overall blood/CSF gradient shown in Table 1.
With these data in Table 1 we are able to discriminatethree different groups according to their source, withdifferent consequences for the dynamics (Fig. 8):
1) proteins originating from neurons and glial cells,like tau protein, S-100 and neuronspecific eno-lase, which are primarily released into ventricu-lar and cisternal CSF,
H. Reiber / Proteins in cerebrospinal fluid and blood 91
Fig. 7. Blood-derived proteins and blood-CSF barrier dysfunction [12].The hyperbolic curves show the mean CSF/serum quotients,Q, of blood-derived proteins with different molecular size as a function of decreasingCSF flow rate. The decreasing flow rate or increasing blood-CSF barrier dysfunction is indicated by the increasing albumin CSF/serum quotient,QAlb. The theoretical, calculated blood-derived fraction of transthyretin (TT) is shown by the dashed line with 45◦ (TT passes the barrierassociated with the retinol binding protein [19] and has therefore a size similar to albumin). Empirical mean quotients for prothrombin (Proth.),carcinoembryonic antigen (CEA) (Reiber, unpublished) and immunoglobulins IgG, IgA, IgM [10] are shown together with their molecularweights (kDa).Hyperbolic functions are a consequence of non-linear interaction of molecular flux with CSF flow rate as derived from the laws of diffusion [10]with the general equation:QIgG = (erfc z (DIgG : DAlb)0.5/erfc z) · QAlb. This function shows that the relation depends only on theratio of diffusion coefficients (DIgG : DAlb), i.e. on the different size of the molecules. The hyperbolic functions for the single proteins arecharacterized empirically by three variables (a, b, c) in a more usual form of the hyperbolic function,QIgG = a/b((QAlb)2 + b2)0.5 − c.
2) proteins which are primarily released from lep-tomeninges into CSF, likeβ-trace protein andcystatin C and,
3) brain-derived proteins with a non-negligibleblood-derived fraction in CSF, like transthyretin,angiotensin converting enzyme [19] or the solu-ble intercellular adhesion molecule (s-ICAM).
For these three groups of brain-derived proteins thetheoretical concept, regarding diffusion and CSF flow,offers a quantitative description of the empirically ob-served dynamics.
The following summary articulates the differencesin the three different groups of brain-derived proteins.
1) CSF proteins from brain cellswhich enter CSFprimarily in the ventricular and cisternal spaces:
a) their concentration is decreasing between nor-mal ventricular and lumbar CSF (Table 1) in con-trast to the (non-linearly) increasing concentra-tions of blood-derived proteins along the rostro-caudal flow way.
b) their concentration does not vary with patholog-ically decreasing CSF flow rate, i.e. in cases
of a so-called blood CSF barrier dysfunction forblood-derived proteins (Fig. 8).
The first observation, the decreasing rostro-caudalgradient of neuronal and glial proteins, is easily ex-plained by the inversion of the tissue to CSF concen-tration gradient dc/dx between the ventricles and thecisternal to lumbar CSF spaces. Tau protein, NSE orS-100B, due to their neuronal or glial source, must havehigher concentrations in the tissue around the ventric-ular and cisternal CSF space than around the lumbarspace in the leptomeninges. With only a small local re-lease of neuronal or glial proteins, the outside/in gradi-ent in the range of ventricles is inverted to an inside/outgradient in lumbar CSF where the concentration in CSFis larger than in the surrounding tissue (leptomeninges).
The second observation, that protein concentrationsin lumbar CSF do not change with decreasing CSF flowrate, i.e. increasingQAlb (Fig. 8), again can be ex-plained by the laws of diffusion and by changing CSFflow rate. With decreasing CSF flow rate, i.e. reducedCSF volume turnover, the ventricular CSF concentra-tion of the brain cell-derived proteins is increasing but

92 H. Reiber / Proteins in cerebrospinal fluid and blood
Fig. 8. Dynamics of brain-derived proteins in lumbar CSF.The relative protein concentrations are shown as a function of the albumin CSF/serum concentration quotient,QAlb, increasing with blood CSFbarrier dysfunction, i.e. decreased CSF flow rate. The mean slopes for the predominantly leptomeningeal proteinsβ-trace and cystatin C arederived from the data in [19]. The lumbar concentration of glial and neuronal proteins which enter CSF in the ventricular and cisternal space,e.g. tau protein, neurospecific enolase and S-100 protein, are invariantly constant in cases of blood-CSF barrier dysfunctions, i.e reduced CSFflow rate [19].These dynamics of the brain derived proteins are derived from the laws of diffusion and CSF flow as shown in [19].
with increased ventricular CSF concentration there isdownstream also an increased concentration gradientfor a larger molecular flux inside/out. Both effectswhich can be described by the linear Fick’s 1st lawcompensate each other quantitatively, what keeps thelumbar CSF concentration constant.
At this point we hit the crucial difference betweenblood-derived (Fig. 7) and brain-derived (Fig. 8) pro-tein dynamics in CSF in case of pathologically decreas-ing flow rate: the increasing CSF concentration in caseof brain-derived proteins does not have a positive feedback on the local gradient as blood derived proteinsdo. In the first case we have a linear change (explainedmore detailled below forβ-trace protein in Fig. 8), inthe other case we have the hyperbolic relation (Fig. 7).Only in case of a linear relation, described by Fick’s1st law, we have this possibility for compensation de-scribed above for the concentration changes along therostro caudal flow way.
The observed empirical data [19] for NSE, S-100, tauprotein or choroid plexus-derived transthyretin fraction(summary in Fig. 8) are quantitatively explained by thetheoretical model in which CSF flow rate representsthe main modulator of CSF protein concentrations incases of neurological diseases with a blood-CSF barrierdysfunction.
2) CSF proteins from leptomeningeal cells, like β-trace protein or cystatin C, show:
a) An increasing concentration between normalventricular and lumbar CSF (similar to blood-derived proteins).
b) A linearly increasing concentration in CSF incase of pathologically decreasing CSF flow rate(Fig. 8) in contrast to a hyperbolic increase inblood derived proteins.
c) A particular modification is observed in inflam-matory meningeal processes [19].
a) The normal meanβ-trace protein concentration isincreasing from 1.5 mg/L in the ventricles to 16.6 mg/Lin the lumbar subarachnoid space (Table 1 and [19]).Obviously theβ-trace protein concentration is muchhigher in the leptomeninges than in the periventriculartissue, i.e., there is no inversion of the gradient dc/dxdownstream, which is different from the first group ofbrain-derived proteins.
This 11-fold rostro-caudal increase ofβ-trace pro-tein and a 3.5-fold increase of cystatin C concentra-tions (Table 1) under normal conditions are easily un-derstood: the steady release of proteins into CSF alongits flow path, is due to a local outside/in concentrationgradient at the border of the subarachnoid space.
b) The second observation, the linear increase ofβ-trace protein concentration in lumbar CSF in caseof pathologically decreasing CSF flow rate (Fig. 8), isthe simple consequence of a steady release of the pro-tein into CSF which, due to a slower volume turnoverrate, gains a higher protein concentration per volume.
H. Reiber / Proteins in cerebrospinal fluid and blood 93
This is similar to the primary concentration change ofblood-derived proteins. But in contrast to the blood-derived proteins with a secondary positive feed backmechanism increasing additionally the molecular flux,this can not happen for the leptomeningeal cell-derivedproteins,because it would mean that an increasing CSFconcentrationof leptomeningealproteins in ECF wouldinduce an increased release of these proteins from braincells. Such a positive feed back (like an autocatalyticprocess) would be an unphysiological destabilizationof the steady state of the cell.
c) A negative feed back loop, by which with in-creasing concentration the expression and release orthe kinetic activity of enzymes is inhibited, representsa common mechanism of metabolic control. Such acase seems to be realized by s-ICAM [19], a moleculespecies of the third group. This absence of a feed backin the cases of brain derived proteins explains why thedynamic of these proteins can be described by Fick’s1st law with a linear relation between molecular fluxand concentration gradient.
3) The third group of proteins with non-negligibleblood-derived fractionsin addition to brain-derivedfractions like transthyretin, soluble intercellular adhe-sion molecule (s-ICAM) as well as ACE represent amixture of different influences. In particular, in thisgroup it is important to decide whether a quotient orabsolute concentration of the brain-derived protein ispreferred for most sensitive evaluation with referenceto the albumin quotient [19]. The saturation like curveobserved for s-ICAM was a surprize. As an expla-nation, with increasing s-ICAM concentration in CSFthe stripping of the soluble part from the cell surfacecould be reduced by a negative feed back control (seeabove), approaching an equilibrium (saturation func-tion in [19]). The detection of a metabolic control ofCSF protein concentration as shown for the first timefor s-ICAM [19] would not have been possible withoutthe molecular flux/CSF flow model.
These findings from pathology give further evidencethat the molecular flux/CSF flow theory represents acomplete conceptual framework for explaining the dy-namics of both, the blood- and brain-derived proteinsin CSF.
5. Brain-derived proteins in blood
The so called marker proteins which allow to inves-tigate pathological brain processes by blood analysis,like S100 [18] or NSE [15] represent a relevant diag-
nostic approach. Yet there are no clear demonstrationshow and where particular brain- derived proteins, e.g.after a brain hypoxia [15] enter the blood. In principle,the laws of diffusion described above are relevant alsofor the way out of the brain and the arguments against aleakage model must be relevant, too :All proteins passa biological barrier, like blood vessel walls, accordingto the local concentration gradient and the size of themolecule (Table 1).
Quite frequent we are confronted with the questionwhether a certain brain-derived substance can becomea relevant marker molecule to be detected in blood.The answer has to consider the intrathecal concentra-tion (e.g. a main difference between S100 and NSE),the relative concentration change by the pathologicalprocess (release from cells, compensated by metabolicconsumption or re-uptake into other brain cells), themolecular size and the half life time in blood. Again,proteins or larger peptides are the best candidates for asuccessful application.
With three examples I want to shed some light on thecomplexity of this topic:
β-trace protein in blood(mean 0.5 mg/L) originatesprimarily from CSF flow into venous blood. A 34-foldhigher concentration (17 mg/L) in lumbar CSF will bediluted about 1:10 by flow of 500 mL CSF/day into5 L blood, i.e. a contribution of about 0.07 mg/L/hour. A half life time of guessed 4 hours forβ-tracein blood would reduce the concentration in blood by0.065 mg/L/hour. Under these conditions of such a lowhalf life time, the concentration of this leptomeningealprotein in blood could be maintained just by the CSFflow into blood. For any other protein in the Table1with much less steep gradients between CSF and blood,the CSF flow could not count solely for the blood con-centration. But, what happens with the blood concen-tration of β trace protein in blood in case of barrierdysfunction with a reduced flow rate but increased CSFconcentrations? The next example can shed some lighton this topic.
The Vitamin C concentration in CSF and bloodpresents an interesting example to answer the abovequestion: Ascorbic acid (vitamin C) is transferred in thechoroid plexus from blood into CSF against a concen-tration gradient, inducing a 6–12 fold higher ascorbateconcentration in CSF. With increasing barrier dysfunc-tion, i.e decreasing CSF flow rate, but unchanged vita-min C concentration in CSF, we observed a decreasingvitamin C concentration in blood [29]. The reportedcorrelation of the blood concentration of ascorbic acidwith the CSF flow rate,r, with ∆r ∼ ∆l (QAlb)−0.5

94 H. Reiber / Proteins in cerebrospinal fluid and blood
Fig. 9. Neuronspecific enolase (NSE) in blood: Dynamics of release from brain in different neurological diseases.a) Data from a patient after cardiac arrest hypoxia with a Glasgow-outcome scale score of 1 [15].b) Time course of NSE concentration in plasma in case of brain infarction and Glasgow-outcome scale score 2 [15]. The late increase of NSE inblood between day 2 and day 3 corresponds with a secondary edema preceeding the clinical symptoms by about a day.c) Time course of NSE concentration in blood after head trauma. The fast decrease in between 1 day corresponds to a benign clinical outcome.d) Data from a patient after electroconvulsive therapy. This occasional event is characterized by a fast decrease (in between 2 hours NSE valuesin blood are normal). Peak values have been observed up to 120 ng/mL. These reactions are seen only in about 10% of the treatment cycles (R.Thomas and H Reiber, unpublished results).
could be a helpful model for evaluation of the corre-sponding dynamic in blood.
Neuron-specific Enolase(NSE), the gamma, gammadimer of the ubiquiteous distributed glycolytic enzymeenolase, with a molecular weight of 78 kDa originatespredominantly from neurons and neuroendocrine cells.The large amount found in the brain, means that NSE
can be a very sensitive marker for fast neuronal degra-dation. Increased concentrations have been detected inCSF for different neurological diseases [36], in partic-ular in Creutzfeldt-Jakob disease [14]. But due to itshigh brain concentrations it is also easily detected inblood [15] with diagnostic relevance for the progno-sis of clinical outcomes after cerebral hypoxia, brain

H. Reiber / Proteins in cerebrospinal fluid and blood 95
infarction or head/brain trauma (Fig. 9 and [15]).With a CSF: serum concentration ratio of 1 : 1 (Ta-
ble 1) the intrathecal (brain-derived) fraction of NSEin CSF can be calculated to be still> 99% (the blood-derived fraction is smaller than 1% due to an interpo-lated molecular size-dependent CSF: blood gradient ofabout 1 : 200 for a theoretical, solely blood-derivedfraction). The concentration decreases between ven-tricular and lumbar CSF (2 : 1, Table 1). The mean NSEconcentration in lumbar CSF does not change with in-creasingQAlb in case of a blood-CSF barrier dysfunc-tion as shown [19], i.e. is invariant to reduced CSF flowrate. Anyway the dynamics in blood (Fig. 9) can not beexplained by a CSF related change of blood concentra-tions by CSF flow into venous blood as the pathologicalconcentrations in CSF [14,36] are not high enough tocount for the blood concentration after a1 : 10 dilution(see above). The increased NSE release from brain intoblood vessels can be interpreteed on the base of molec-ular diffusion due to a locally increased brain-bloodgradient via an intact barrier. There is no necessity topostulate a barrier dysfunction for the sudden increaseof NSE in blood. A certain evidence for this statementis also given from the observations in Fig. 9, that verydifferent causes like hypoxia, hemorrhage, secondarybrain edema and electroconvulsive treatment can causean increased NSE concentration in blood.
References
[1] W.W. Tourtellotte, On cerebrospinal fluid immunoglobulin-G (IgG) quotients in multiple sclerosis and other diseases.A review and a new formula to estimate the amount of IgGsynthesized per day by the central nervous system,J NeurolSci10 (1970), 279–304.
[2] H. Link and G. Tibbling, Principles of albumin and IgG dis-orders. Evaluation of IgG synthesis within the central nervoussystem in multiple sclerosis,Scan J Clin Lab Invest37 (1977),397–401.
[3] H. Reiber, The discrimination between different blood-CSFbarrier dysfunctions and inflammatory reactions of the CNSby a recent evaluation graph for the protein profile of CSF,JNeurol224 (1980), 89–99.
[4] K. Ganrot-Norlin, Relative concentrations of albumin and IgGin cerebrospinal fluid in health and in acute meningitis,ScandJ Infect Dis10 (1978), 57–60.
[5] H. Reiber, Evaluation of blood-cerebrospinal fluid barrier dys-functions in neurological diseases, in:The Blood-Brain Bar-rier in Health and Disease,A.J. Suckling, M.G. Rumsbyand M.W.B. Bradbury, eds, Ellis Horwood, Chichester, 1986,pp. 147–157.
[6] J.H.M. Souverijn, H.M.P. Serree, R. Peet, S.W. Grenzebachand G.W. Bruyn, Intrathecal immunoglobulin synthesis. Com-parison of various formulae with the “gold standard” of iso-electric focusing,J Neurol Sci102 (1991), 11–16.
[7] S. Ohman, J. Ernerudh, P. Forsberg, H. von Schenck and M.Vrethem, Improved formulae for the judgement of intrathe-cally produced IgA and IgM in the presence of blood-CSFbarrier damage,Ann Clin Biochem30 (1993), 454–462.
[8] C.B. Laurell, On the origin of major CSF proteins, in:Ad-vances in CSF Protein Research and Diagnosis,E.J. Thomp-son, ed., MTP Press Ltd, Lancaster, England, 1987, pp. 123–128.
[9] H. Reiber and K. Felgenhauer, Protein transfer at the blood-CSF barrier and the quantitation of the humoral immune re-sponse within the central nervous system,Clin. Chim. Acta163 (1987), 319–328.
[10] H. Reiber, Flow rate of cerebrospinal fluid (CSF) – a conceptcommon to normal blood-CSF barrier function and to dys-function in neurological diseases,J Neurol Sci122 (1994),189–203.
[11] H. Reiber and J.B. Peter, Cerebrospinal fluid analysis –disease-related data patterns and evaluation programs,J. Neu-rol. Sci.184 (2001), 101–122.
[12] H. Reiber, M. Otto, C. Trendelenburg and A. Wormek, Report-ing cerebrospinal fluid data – knowledge base and interpreta-tion software,Clin. Chem. Lab. Med.39 (2001), 324–332.
[13] M. Otto, J. Wiltfang, L. Cepek, M. Neumann, B. Mollenhauer,P. Steinacker, B. Ciesielcyk, W. Schulz-Schaeffer, H.A. Kret-zschmar and S. Poser, Tau Protein and 14-3-3 protein in thedifferential diagnosis of Creutzfeldt-Jakob disease,Neurology58 (2002), 192–198.
[14] I. Zerr, M. Bodemer and S. Racker et al., Cerebrospinalfluid concentration of neuron-specific enolase in diagnosis ofCreutzfeldt-Jakob disease,Lancet345 (1995), 1609–1610.
[15] H. Schaarschmidt, H. Prange and H. Reiber, Neuron-specificenolase concentrations in blood as a prognostic parameter incerebrovascular diseases,Stroke24 (1994), 558–565.
[16] F. Hulstaert, K. Blennow and A. Ivanoiu et al., Improveddiscrimination of AD patients usingβ-amyloid (1-42) and taulevels in CSF,Neurology52 (1999), 1555–1562.
[17] P. Lewczuk, H. Reiber and H. Tumani, Intercellular adhesionmolecule-1 in cerebrospinal fluid – the evaluation of blood-derived and brain-derived fractions in neurological diseases,J. Neuroimmunol.87 (1998), 156–161.
[18] B. Romner, T. Ingebrigtsen, P. Kongstad and S.E. Borge-sen, Traumatic braindamage: serum S-100 protein measure-ments related to neuroradiological findings,J Neurotrauma17(2000), 641–647.
[19] H. Reiber, Dynamic of brain proteins in cerebrospinal fluid,Clin Chim Acta310 (2001), 173–186.
[20] J.D. Huber, R.D. Egleton and T.P. Davis, Molecular physiol-ogy and pathophysiology of tight junctions in the blood-brainbarrier,Trends Neurosci.24 (2001), 719–725.
[21] L.L. Rubin and J.M. Staddon, The cell biology of the blood-brain barrier,Annu. Rev. Neurosci.22 (1999), 11–28.
[22] E.J. Thompson, (ed.),The CSF Proteins: A Biochemical Ap-proach,Amsterdam: Elsevier, 1988.
[23] R.M. Herndon and R.A. Brumback,The cerebrospinal fluid,Kluwer Acad Publishers, Boston, 1989.
[24] H. Davson,Physiology of the ocular and cerebrospinal fluids,Churchill, London, 1956.
[25] R.K. Parkkola, M.E.S. Komu, T.M.Aarimaa, M.S. Alanen andC. Thomsen, Cerebrospinal fluid flow in children with normaland dilated ventricles studied by MR-imaging,Acta Radiol.42 (2001), 33–38.
[26] D. Greitz and J. Hannerz, A proposed model of cerebrospinalfluid circulation: observations with radionuclide cisternogra-phy,Am J. Neuroradiol.17 (1996), 431–438.
96 H. Reiber / Proteins in cerebrospinal fluid and blood
[27] C. Strik, U. Klose, M. Erb, H. Strik and W. Grodd, Intracranialoscillations of cerebrospinal fluid and blood flows: Analysiswith magnetic resonance imaging,J. Mag. Res. Imaging15(2002), 251–258.
[28] C. May, S.A. Kays, J.R. Attack, M.B. Schapiro, R.P. Friedlandand S.I. Rapopport, Cerebrospinal fluid production is reducedin healthy aging,Neurology40 (1990), 500–503.
[29] H. Reiber, M. Ruff and M. Uhr, Ascorbate concentration inhuman cerebrospinal fluid (CSF) and serum. Intrathecal ac-cumulation and CSF flow rate,Clin. Chim. Acta217 (1993),163–173.
[30] P. Rieckmann and H.P. Hartung, Neuroimmunologie, in:Klin-ische Neurobiologie – Molekulare Pathogenese und Therapievon neurologischen Erkrankungen,T. Herdegen, T.-R. Tolleand M. Bahr, eds, Spektrum Akademischer Verlag, Heidel-berg, 1997.
[31] K. Felgenhauer, Protein size and cerebrospinal fluid composi-tion, Klin Wschr52 (1974), 1158–1164.
[32] A.M. Turing, The chemical basis of morphogenesis Phil,Trans. R. Soc. B.237 (1952), 37–72.
[33] A. Grubb and H. Lofberg, Human gamma-trace. Structure,function and clinical use of concentration measurements,Scan. J. Clin. Lab. Invest. Suppl.177 (1985), 7–13.
[34] S. Seyfert and A. Faulstich, Is the blood-CSF barrier alteredin disease?Acta Neurol Scand(2003), (in press).
[35] S.I. Rapoport, Passage of proteins from blood to cerebrospinalfluid, in: Neurobiology of Cerebrospinal Fluid,(Vol. 2), J.H.Wood, ed., Plenum Press, New York, 1983, pp. 233–245.
[36] C. Jacobi and H. Reiber, Clinical relevance of increasedneuron-specific enolase concentration in cerebrospinal fluid,Clin. Chim. Acta177 (1988), 49–54.
Related Documents