Protein Tyrosine Phosphorylation in Haematopoietic Cancers and the Functional Significance of Phospho- Lyn SH2 Domain By Lily Li Jin A thesis submitted in conformity with the requirements for the degree of Ph.D. in Molecular Genetics, Graduate Department of Molecular Genetics, in the University of Toronto © Copyright by Lily Li Jin (2015)

Welcome message from author
This document is posted to help you gain knowledge. Please leave a comment to let me know what you think about it! Share it to your friends and learn new things together.
Transcript

Protein Tyrosine Phosphorylation in Haematopoietic
Cancers and the Functional Significance of Phospho-
Lyn SH2 Domain
By
Lily Li Jin
A thesis submitted in conformity with the requirements for the degree of Ph.D. in
Molecular Genetics, Graduate Department of Molecular Genetics, in the University of
Toronto
© Copyright by Lily Li Jin (2015)
ii
Protein Tyrosine Phosphorylation in Haematopoietic Cancers
and the Functional Significance of Phospho-Lyn SH2 Domain
Lily Li Jin
2015
Ph.D. in Molecular Genetics
Graduate Department of Molecular Genetics
University of Toronto
Abstract
Protein-tyrosine phosphorylation (pY) is a minor but important protein post-translational
modification that modulates a wide range of cellular functions and is involved in cancer.
Dysregulation of tyrosine kinases (TKs) and protein-tyrosine phosphatases (PTPs) have
been observed in multiple myeloma (MM) and acute myeloid leukemia (AML) and is a
subject of study. Using recently developed mass spectrometry-based proteomics
techniques, quantitative PTP expression and cellular pY profiles were generated for MM
cell lines and mouse xenograft tumors, as well as primary AML samples. Integrated
comprehensive analyses on these data implicated a subset of TKs and PTPs in MM and
AML, with valuable insights gained on the dynamic regulation of pY in biological
systems. In particular, I propose a model that describes the cellular pY state as a
functional output of the total activated TKs and PTPs in the cell. My results show that the
global pY profile in the cancer models is quantitatively related to the cellular levels of
activated TKs and PTPs. Furthermore, the identity of the implicated TK/PTPs is system-

iii
dependent, demonstrating context-dependent regulation of pY. To further understand pY
regulation, I studied the phosphorylation of a conserved tyrosine in the Src homology 2
(SH2) domains of Src family kinases, which was frequently observed in human cancer
specimens and regulated in cancer-derived cell lines. Using the Lyn SH2 domain as a
model, I discovered that when this tyrosine (Y194) is phosphorylated, the domain has
reduced ability to interact in vitro with phosphopeptides and phosphoproteins. Sequence
analysis of the binding motifs revealed that phosphorylation at Y194 decreased the
selectivity of Lyn SH2 for the third residue C-terminal to the pY of the ligand. Together,
these data show that tyrosyl phosphorylation alters the substrate binding profile of Lyn
SH2 and may potentially affect Lyn kinase signaling. This may be a general mechanism
for all Src family kinases and represents another layer of the complexity of pY regulation.
iv
List of Abbreviations
AML acute myeloid leukemia
AP affinity purification
ATP adenosine triphosphate
CLL chronic lymphocytic leukemia
EGF epidermal growth factor
EGFR epidermal growth factor receptor
ESI electrospray ionization
FGFR3 fibroblast growth factor receptor 3
HER2 human epidermal growth factor receptor 2
HRG HER2/heregulin
IGF-1 insulin-like growth factor 1
IGF1R IGF-1 receptor
IL-6 interleukin 6
IMAC immobilized metal affinity chromatography
INSR insulin receptor
IP immunoprecipitation
IPI international protein index
ITD internal tandem duplication
Kd dissociation constants
KMS Kawasaki Medical School
LC MS/MS liquid chromatography tandem mass spectrometry
MAPK mitogen-activated protein kinase
v
MGUS monoclonal gammopathy of undetermined significance
MM multiple myeloma
MS mass spectrometry
nRTK non-receptor tyrosine kinase
NSCLC non-small cell lung cancer
PDGF platelet derived growth factor
PLSR partial least squares regression
PTB protein tyrosine binding
PTP protein tyrosine phosphatase
pY tyrosine phosphorylation
ROS reactive oxygen species
rt room temperature
RTK receptor tyrosine kinase
SA Streptavidin
SFK Src family kinases
SH2 Src homology 2
SILAC stable isotope labelling by amino acids in cell culture
SRM selected reaction monitoring
STAT signal transduction and activator of transcription
TK tyrosine kinase
XIC extracted ion current chromatography

vi
Table of Contents
List of Abbreviations ................................................................................................. iv
Table of Contents ....................................................................................................... vi
List of Tables .............................................................................................................. x
List of Figures ............................................................................................................ xi
List of Appendices .................................................................................................... xii
Chapter 1 Introduction .................................................................................................... 1
1.1 Protein Tyrosine Phosphorylation: Function and Dysregulation in
Haematopoietic Cancers ............................................................................................. 1
1.1.1 Enzymes and Domains Involved in pY-Mediated Functions ........................ 1
1.1.1.1 Tyrosine Kinases ..................................................................................... 2
1.1.1.2 Src Family Kinases ................................................................................. 3
1.1.1.3 Protein Tyrosine Phosphatases ............................................................... 4
1.1.1.4 Src Homology 2 Domain ........................................................................ 5
1.1.1.4.1 Structure and Functions of SH2 Domains ........................................... 5
1.1.1.4.2 Genetic Mutations of SH2 Domains in Human Diseases .................... 7
1.1.2 Biological Function of Phosphorylated Tyrosines ......................................... 9
1.1.3 Dysregulation of Protein Tyrosine Kinases and Phosphatases in
Haematopoietic Cancers ....................................................................................... 11
1.1.3.1 Multiple Myeloma ................................................................................ 11
1.1.3.2 Acute Myeloid Leukemia ..................................................................... 13
1.2 Mass Spectrometry Based Proteomics ................................................................ 15
1.2.1 Mass Spectrometry for Proteomics Studies ................................................. 16
vii
1.2.2 Label-Free Quantification by Mass Spectrometry ....................................... 16
1.2.2.1 Measurement by Intensity of MS1 Ion Current .................................... 17
1.2.2.2 Selected Reaction Monitoring ............................................................... 18
1.2.3 Peptide Enrichment ...................................................................................... 18
1.2.3.1 Enrichment of Tyrosyl Phosphorylated Peptides .................................. 18
1.2.3.2 Enrichment of Oxidized Cysteine-Containing Peptides (qPTPome) .... 19
1.3 Key Statistical Analysis Used in this Thesis ....................................................... 20
1.3.1 Partial Least Squares Regression ................................................................ 20
1.4 Specific Aim for this Thesis ............................................................................... 21
Chapter 2 Comprehensive Analysis of Protein Phosphotyrosine in Multiple Myeloma
....................................................................................................................................... 22
2.1 Abstract ............................................................................................................... 23
2.2 Introduction ......................................................................................................... 23
2.3 Western Analysis Showed Distinct Expression, Glycosylation, Phosphorylation
of pY Signaling Molecules in MM Samples ............................................................. 27
2.4 pY Profiling Revealed Distinctive Differences between MM Cultured Cell lines
and Xenograft Tumors .............................................................................................. 30
2.5 Co-Variance Analysis of PTP and pY Profiles Implicated a Subset of PTP in pY
Regulation ................................................................................................................. 39
2.6 Correlation Heatmap Revealed Regulation “Hotspots” ...................................... 42
2.7 Discussion and Conclusion ................................................................................. 46
2.8 Materials and Methods ........................................................................................ 54
viii
Chapter 3 Comprehensive Analysis of Protein Phosphotyrosine in Acute Myeloid
Leukemia ....................................................................................................................... 62
3.1 Abstract ............................................................................................................... 63
3.2 Introduction ......................................................................................................... 63
3.3 pY Profiling Revealed Distinctive Features in Patient Subgroups and Implicated
a Subset of TKs in pY Regulation ............................................................................ 66
3.4 Integrated Analysis of PTP Expression and Cellular pY Implicated PTPs in
AML pY Regulation ................................................................................................. 74
3.6 Discussion and Conclusion ................................................................................. 76
3.6 Materials and Methods ........................................................................................ 81
Chapter 4 Determination of the Functional Consequences of Tyrosine-Phosphorylation
of the Lyn SH2 Domain ................................................................................................ 84
4.1 Abstract ............................................................................................................... 85
4.2 Introduction ......................................................................................................... 85
4.3 A Conserved Tyrosine in SFK SH2 Domains Is Phosphorylated in Cancer
Samples and Cancer-Derived Cell Lines .................................................................. 86
4.4 SFK SH2 Domain Phosphorylation Is Regulated ............................................... 89
4.5 Lyn SH2 Domain Phosphorylation Modulates Its Binding to pY Peptides ........ 89
4.6 Lyn SH2 Domain Phosphorylation Modulates Its Binding to pY-Containing
Proteins ..................................................................................................................... 98
4.7 Discussion and Conclusion ............................................................................... 104
4.8 Materials and Methods ...................................................................................... 108
Chapter 5 Summary and Future Directions ................................................................ 117

ix
5.1 Summary and Future Directions of the Comprehensive Protein-pY Regulation
Analysis in MM Samples ........................................................................................ 117
5.2 Summary and Future Directions of the Comprehensive Protein-pY Regulation
Analysis in AML Samples ...................................................................................... 120
5.3 Summary and Future Directions of the Functional Study of Lyn Y194
Phosphorylation ...................................................................................................... 124
5.4 Concluding Remarks ......................................................................................... 125
Appendices .................................................................................................................. 127
References ................................................................................................................... 142

x
List of Tables
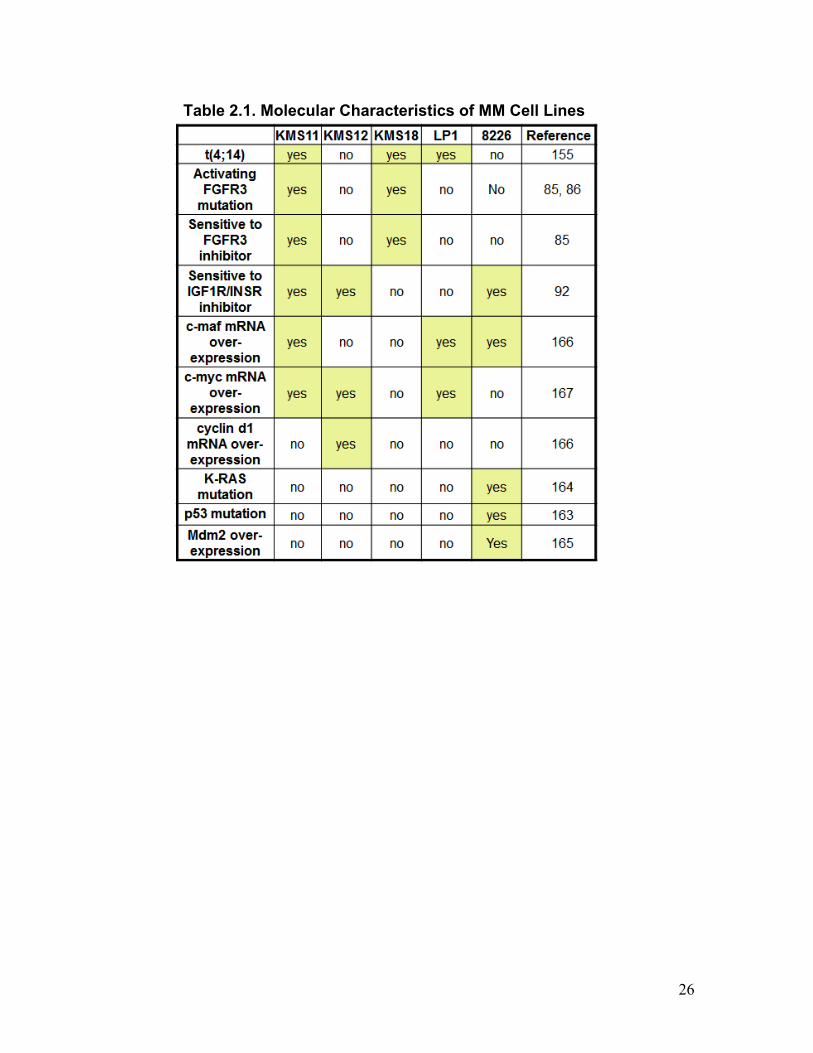
Table 2.1. Molecular characteristics of MM cell lines ..................................................... 27
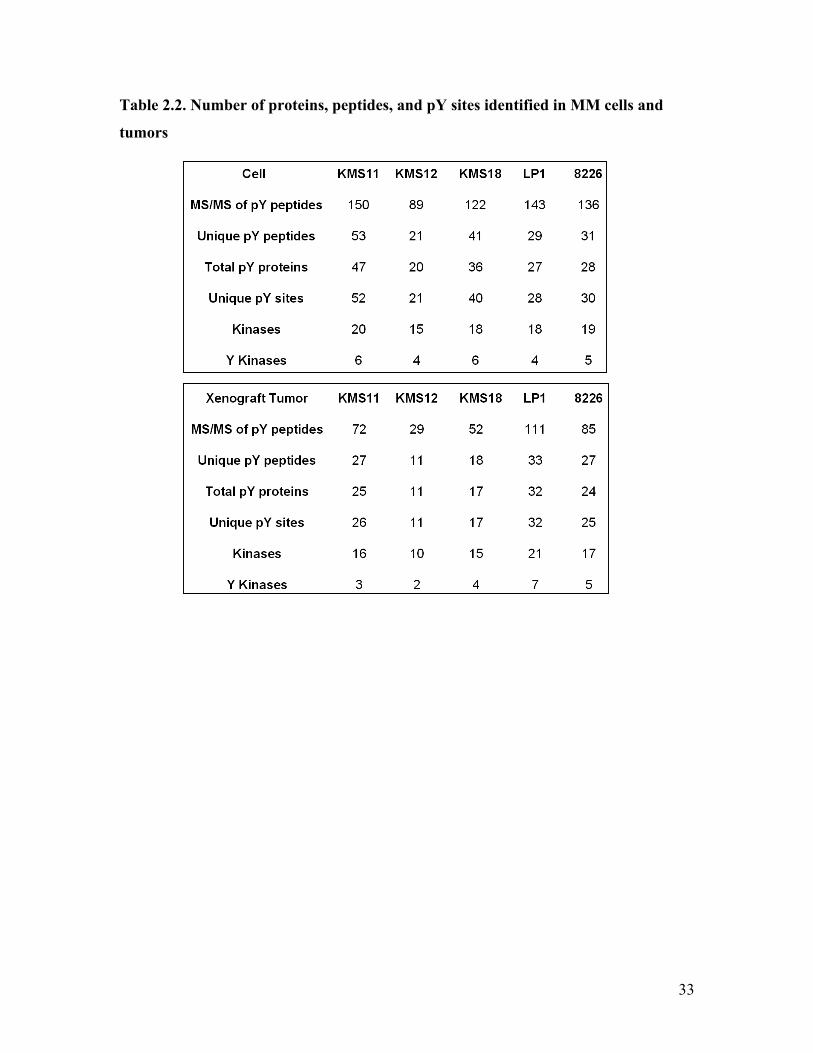
Table 2.2. Number of proteins, peptides, and pY sites identified in MM cells and tumors
........................................................................................................................................... 33
Table 2.3. Proteins and sites corresponding to regulation “Hotspots” ............................. 45
Table 3.1. AML patient information corresponding to primary samples ......................... 65
Table 3.2. Proteins and sites associated with boxed regions in Figure 3.2 B ................... 71
Table 4.1. Phosphopeptides bound to Lyn SH2 or pSH2 identified by AP-MS ............... 93
Table 4.2. SH2/pSH2-binding phosphoproteins identified by peptide AP ..................... 103
Table 4.3. Fold change of SH2 or PTB domain-containing proteins bound to Lyn SH2
and pSH2 ......................................................................................................................... 103
Table 5.1. Summary of PTPs and TKs implicated in MM and AML ............................. 123
xi
List of Figures
Figure 1.1. A proposed model for the regulation and functional effect of cellular pY ..... 21
Figure 2.1. MM cell lines have distinctive molecular features ......................................... 29
Figure 2.2. pY profile reveals difference between cell and tumor and an abundance of TK
A-loop phosphorylations ................................................................................................... 32
Figure 2.3. Quantitative pY profile distinguishes cell from tumor ................................... 36
Figure 2.4. Cellular pY variation can be predicted based on TK activation levels .......... 38
Figure 2.5. PTP expression profiles predict cellular pY ................................................... 41
Figure 2.6. PTP and TK activation is positively correlated with subsets of pY ............... 44
Figure 3.1. Characterization of pY in AML primary samples .......................................... 67
Figure 3.2. PTP expression and TK activation are correlated with cellular pY ............... 70
Figure 3.3. Cellular pY variation can be predicted based on PTP expression or TK
activation levels ................................................................................................................ 73
Figure 4.1. SFK SH2 domain phosphorylation was detected in AML, CLL, MM and is
regulated by phosphatase .................................................................................................. 88
Figure 4.2. Purification of phosphorylated Lyn SH2 domain ........................................... 91
Figure 4.3. Lyn pSH2 shows reduced affinity for pY peptides compared to SH2 ........... 95
Figure 4.4. Binding curves of Lyn SH2/pSH2 with phospho-peptide probes .................. 97
Figure 4.5. Lyn SH2 phosphorylation modulates its binding affinity for phosphoproteins
......................................................................................................................................... 101
xii
List of Appendices
Appendix Table 1. MS ion current intensities of pY peptides in MM samples .............. 127
Appendix Table 2. MS ion current intensities of PTP-derived peptides in MM samples
......................................................................................................................................... 129
Appendix Table 3. MS ion current intensities of pY peptides quantified in AML ........ 130
Appendix Table 4. MS ion current intensities of PTP-derived peptides in AML .......... 133
Appendix Table 5. Phosphoproteins bound to Lyn SH2 or pSH2 identified by AP-MS
......................................................................................................................................... 134

1
Chapter 1 Introduction
1.1 Protein Tyrosine Phosphorylation: Function and Dysregulation in
Haematopoietic Cancers
Protein tyrosine phosphorylation (pY) is defined by the addition of a covalently
bonded phosphate group to the hydroxyl of a tyrosine. It is a reversible protein
posttranslational modification that is involved in a plethora of cellular processes
including growth factor signaling, cell cycle progression, differentiation in development,
gene regulation and transcription, oncogenic transformation, angiogenesis, and apoptosis
(reviewed in 1, 2, 3). These biological functions are regulated through the concerted
action of tyrosine kinases (TKs), protein tyrosine phosphatases (PTPs), and scaffold
proteins, adaptors, among others (4, 5). Functional disruption of the regulatory molecules
can induce physiological consequences and is linked to cancer (6). Targeting some of the
dysregulated mechanisms has proven to be an effective clinical strategy (7, 8). Therefore,
understanding the regulation of pY in disease systems can have significant impacts and
lead to improvements in therapeutic treatment regimes.
1.1.1 Enzymes and Domains Involved in pY-Mediated Functions
The reversible phosphorylation of tyrosine is mediated by two classes of enzymes:
TKs that facilitate the attachment of the phosphate group and PTPs that remove it. The
reciprocal actions of TKs and PTPs are constantly regulated in cells to ensure appropriate
pY signaling. Through diverse regulation mechanisms, the phosphorylation and
dephosphorylation of cellular protein tyrosines are tightly controlled.
2
1.1.1.1 Tyrosine Kinases
TKs are enzymes that catalyze the transfer of the gamma phosphate of adenosine
triphosphate (ATP) to the amino acid tyrosine of a substrate protein. There are two
classes of TKs. Receptor tyrosine kinases (RTKs) are type I transmembrane proteins that
contain an N-terminal extracellular domain for ligand binding, a single transmembrane
region, and a C-terminal intracellular region that possesses the catalytic domain and
protein binding sites. The second class of TKs comprises non-receptor tyrosine kinases
(nRTKs) that reside in the cytoplasm. A total of 90 TKs are encoded by the human
genome, comprising a subset of the human “kinome”. Among the TKs, 58 (subdivided
into 20 classes) are RTKs and 32 are nRTKs (9).
The catalytic domains of TKs share similar features. They comprise of two lobes: a
larger C-terminal lobe composed primarily of α helices that participates in substrate
binding, and a smaller N-terminal lobe containing mainly β sheets and an α helix. The
two lobes form a deep cleft, or the active site, where ATP and substrates bind. There are
two polypeptide regions within the active site that are especially important for catalysis: a
glycine-rich region that is critical for ATP binding and a segment sandwiched between
the conserved sequences DFG and APE, termed the activation loop, or “A-loop”. For
TKs, the A-loop typically contains 1 to 3 tyrosines, which, upon phosphorylation,
stimulate the catalytic ability of the TK. These tyrosine sites are sometimes
autophosphorylation sites, providing a means for auto-activation (10, 11).
TKs phosphorylate their substrates through regulated protein-protein interactions
(4). The identity of the substrate is highly selective depending on the TK, and the
phosphorylation event itself is rigidly controlled. A large number of TKs only become
3
active and phosphorylate their substrates if triggered by a cellular event (12-14). Thus,
through controlling the activation of TKs, cellular tyrosine phosphorylations are regulated.
1.1.1.2 Src Family Kinases
Src family kinases (SFKs) comprise the largest family of nRTKs. There are eight
members of SFK in the human kinome: Src, Yes, Fyn, Fgr, Lck, Hck, Blk, and Lyn,
which share at least 85% sequence homology and almost identical structures (15). SFKs
possess several functional domains including a Src homology 2 (SH2) domain for protein
binding, substrate recognition, and intra-molecular interactions; a catalytic domain; and a
C-terminal tail region involved in auto-inhibitory regulation (15, 16).
The kinase activity of SFKs is intrinsically regulated by tyrosyl phosphorylations.
The classic regulation mechanisms of SFKs include 1) phosphorylation of a conserved
tyrosine within the A-loop of their catalytic domains (Src residue Y416), which enhances
their catalytic activities (17, 18); and 2) tyrosine-phosphorylation of the C-terminal tail
(Src residue Y527), which negatively regulates their enzymatic capabilities. As revealed
by the crystal structure of the inactive Src, the phosphorylated C-terminal tail binds intra-
molecularly to the SH2 domain, which maintains the protein in its inactive conformation
(19, 20). Interestingly, a study reported that a third phosphorylation (Y213) in the SH2
domain of Src was able to activate Src in the presence of the inhibitory C-terminal
phosphorylation, presumably by impeding the intra-molecular interactions between the
C-terminal tail and the SH2 domain (21).
SFKs are involved in a plethora of cellular processes due to their critical role in
mediating signal transduction downstream of a diverse range of cell surface receptors
(reviewed in 22, 23). Activated SFKs have the ability to promote survival and
4
proliferation in transformed cells, consequently, many members of this family are
deemed oncoproteins (23, 24). In haematopoietic systems, Lck/Yes-related novel protein
tyrosine kinase (Lyn) is highly expressed and plays important roles in modulating surface
receptor signaling (13, 25); as such, Lyn has been implicated in B cell cancers (i.e.
multiple myeloma) (26-28) and myeloid leukemic diseases (i.e. acute myeloid leukemia)
(29).
1.1.1.3 Protein Tyrosine Phosphatases
PTPs are enzymes that catalyze the removal of phosphate from phosphorylated
tyrosines in a polypeptide. They counteract the actions of TKs and both positively and
negatively regulate signal transduction and cellular functions (30). Aberrations in PTP
functioning are associated with a number of human disorders, in particular, cancer (31).
There are 107 PTP genes encoded by the human genome, including 38 “classical PTPs”
that exclusively target pY and dual-specific PTPs that hydrolyze both phospho-
serine/threonine and pY, comprising the human “PTPome”. The classical PTPs are
further divided into 21 receptors and 17 non-receptors, which are collectively called
cysteine-based PTPs because their enzymatic activity is entirely dependent on an
invariant Cys residue within the conserved “signature motif”, [I/V]HCSXGXGR[S/T]G,
in the catalytic cleft (32).
PTPs can be inactivated by oxidation. Reactive oxygen species (ROS), in particular
H2O2, reversibly oxidize the critical cysteine in the signature motif of the catalytic cleft.
Because of its uniquely low pKa (4.5-5.5 compared to around 8.5 for typical Cys), the
invariant Cys presents as a thiolate anion in the natural pH, allowing it to function as a
nucleophile that attacks the substrate phosphate moiety and facilitates catalysis. When
5
oxidized, this Cys no longer acts as a nucleophile, which leads to the suppression of
enzymatic activity (33). This mechanism modulates endogenous PTP activities (34).
Moreover, it was shown that H2O2 production was transiently elevated following RTK
activation; and that the rapid inactivation of PTP by H2O2 was required for full RTK
phosphorylation and signal transduction (34-37). Therefore, modulation of PTP activities
by ROS is one mechanism that regulates the dephosphorylation of cellular pY.
1.1.1.4 Src Homology 2 Domain
SH2 domains are modular protein structures approximately 100 amino acids in
length that bind pY-containing polypeptides with defined amino acid sequence motifs
(38). Evolutionarily, they emerge at around the same time as TKs, supporting their role as
modulators of cellular functions engaging pY (39). There are 120 SH2 domains encoded
by the human genome, all sharing similar tertiary structures. These structures allow
specific interactions between SH2 domains and phosphorylated proteins and confer
selectivity through defined mechanisms (40). Due to the ready reversibility of protein
tyrosine phosphorylation, these interactions are inherently dynamic and regulate a variety
of pY-mediated processes.
1.1.1.4.1 Structure and Functions of SH2 Domains
The tertiary structure of the SH2 domain consists of two antiparallel β-sheets,
flanked by two α-helices (41). As revealed by X-ray crystallographic studies, pY-
containing peptides bind in an extended β-strand conformation perpendicularly to the
central β-sheets, while the pY moiety inserts into a deep recognition pocket formed by
conserved residues from strands βB, βC, βD, helix αA, and a connection loop between
6
the βB/βC strands (a.k.a. BC or phosphate-binding loop) (41-43). Alteration of residues
surrounding the pY binding pocket affects the binding of pY-containing ligands (44, 45),
indicating the importance of the conserved residues in the interaction site. In addition to
the pY binding pocket, there are several positions in the SH2 domain that the pY-adjacent
residues can bind (40). Studies using degenerate peptide libraries delineated binding
specificities of more than 70 different human SH2 domains (46, 47). Moreover, small
pY-peptides containing only 5 residues can effectively block the binding of SH2 domains
to their interaction partners (48). These data illustrate that SH2-pY interaction is largely
defined by up to five amino acid residues C-terminal to the pY, which interact with
variable binding surfaces on the SH2 domain.
For the SFK SH2 domains, three residues lying immediately C-terminal to pY
(pY+1, +2, +3) of the ligand principally determine the binding specificity (38, 47, 49). In
particular, the amino acids at pY+1 and pY+2 positions overlay a flat surface formed by
the βD4-βD6 residues, while the hydrophobic pY+3 residue inserts into a large
hydrophobic pocket bounded by the bridging loops between βE/βF (EF loop) and βG/αB
(BG loop) (41, 43, 50). Structures of SFK SH2 domains revealed that the EF and BG
loops were critically positioned in respect to the ligand-binding, in particular the pY+3
binding, pocket, such that they control substrate accessibility and dictate SH2 domain
specificity (51). Indeed, mutation of a single residue on the EF loop can greatly influence
peptide binding specificity (51-53). For example, replacing a threonine with tryptophan in
the EF loop of Src SH2 domain changed its binding specificity (prefers the pYEEI motif)
to resemble that of Grb2 (prefers the pYxN motif) (52). Thus, small molecular alterations

7
of critical residues may influence the substrate selectivity of a SH2 domain, especially by
modulating the selectivity for residues lying C-terminally to the ligand pY.
In addition to interacting with phosphorylated ligands, SH2 domains themselves can
become phosphorylated. Evidence suggests that phosphorylation alters the binding
properties of SH2 domains. For instance, phosphorylation on Lck (Y192) impaired SH2
binding to pY-peptides/protein (54); and, S690 phosphorylation in the SH2 domain of the
p85α subunit of phosphoinositide 3-kinase (PI3K) reduced pY-protein binding and was
associated with the feedback inhibition of PI3K/protein kinase B (Akt) pathway (55). In
contrast, Tensin-3 SH2 domain phosphorylation increased substrate binding and
enhanced the biological activity of Tensin-3 (56). Therefore, modulating SH2 binding
through phosphorylation may be a general mechanism that controls SH2 functions.
1.1.1.4.2 Genetic Mutations of SH2 Domains in Human Diseases
Mutations in SH2 domains have been linked to more than 10 distinct clinical
disorders (57). These mutations typically affect conserved amino acids involved in
protein stability and folding or ligand binding. The vast majority of the mutations occur
in Bruton’s tyrosine kinase (Btk), SH2 domain containing 1A (SH2D1A), and protein
tyrosine phosphatase non-receptor 11 (Ptpn11), with only a few occurring in other
proteins (57). Missense mutations within the SH2 domain of Btk cause X-linked
agammaglobulinemia, with approximately two thirds of the mutations affecting residues
involved in phosphopeptide binding and specificity (57). For example, mutations of a
conserved arginine within the pY binding pocket in αA (R288Q, R288W) and amino
acids surrounding the hydrophobic pocket for binding the ligand pY+3 residue in αB and
the BG loop (Y334S, Y361C, L369F) reduced peptide binding 3 to 200 fold (58). Other

8
types of mutations include structural and functional mutations that alter the conformation
of Btk SH2 domain, which can result in an overall change in protein stability and kinase
activity (59-61). In comparison, mutations in SH2D1A SH2 domain are mostly structural,
leading to decreased half-life of the protein; and mutations in the phosphatase Ptpn11
alter the substrate binding profiles of the variant SH2 domain in the RASopathies Noonan
syndrome and LEOPARD syndrome (62-64).
Several proteins harbouring SH2 domain mutations induce neoplastic disorders. In
particular, the gain-of-function mutants of Ptpn11 and p85α activate oncogenic pathways
and promote transformations in multiple human cancers (65-68). Ptpn11 SH2 domain
mutation occurs in approximately 30% of myelodysplastic syndrome and 2% of leukemia
patients (57); and is highly implicated for juvenile myelomonocytic leukemia (69, 70) as
well as identified in pediatric leukemias such as B cell acute lymphoblastic leukemia and
acute myeloid leukemia (AML) (65). Most of the mutations affect residues located at the
N-terminal SH2 and PTP domain interaction interface, which stabilizes the self-inhibited
conformation of Ptpn11. Disruption of the interface leads to enzyme hyperactivation (65).
Likewise, mutations in p85α cluster in the inhibitory interaction interface between its C-
terminal SH2 and the C2 domain of the PI3K catalytic subunit p110α, causing aberrant
enzyme activation (68). This kind of mutation in p85α occurs in approximately 9% of
human glioblastomas (71). In comparison, non-sense mutations in the C-terminal SH2
domain of RasGAP result in a truncated and inactive version of the protein, and were
detected in three cases of basal cell carcinomas (72). Finally, SH2D1A SH2 domain
mutations cause X-linked lymphoproliferative disorder (73). Thus, modulation of SH2
function appears to be a mechanism associated with diverse cancer pathologies.
9
1.1.2 Biological Function of Phosphorylated Tyrosines
Phosphorylation of a tyrosine can regulate the function of a protein primarily by
two means: 1) by changing its binding properties with other biomolecules, or 2) by
modulating the activity of the protein, frequently through the induction of a
conformational change in the parent protein (3, 4, 6, 74). By using these modes of actions,
pY play pivotal roles in various cellular functions ranging from surface receptor signaling
to transcriptional activation.
First, pY can change the interaction profile of its parent protein by creating a
binding site for interacting partners. Protein domains, such as SH2 and protein tyrosine
binding (PTB) domains, can selectively bind pY-containing molecules by recognizing
specific sequence motifs surrounding the pY. The selective binding of SH2/PTB domains
to pY motifs is a key mechanism that controls the dynamic assembly, localization, and
regulation of pY-mediated functions (extensively reviewed in 74, 75, 76). Through these
modular domain-based interactions, TKs, PTPs, and adaptors are joined together to form
an intricate network of proteins that regulates complex cellular functions.
Biological processes that involve the alteration of protein binding by pY include the
signal transduction pathways following growth factor stimulation, cell adhesion via
integrin signaling, or the internalization of cell surface receptors (reviewed in 6, 74). In
growth factor stimulated signaling pathways, when a growth factor receptor, usually a TK
itself, is stimulated by an extracellular ligand, it becomes autophosphorylated in its
cytoplasmic region. This event creates binding sites for downstream molecules. These
downstream molecules, usually containing an SH2 or PTB domain, are thereby recruited
to the location of the receptor and subsequently initiate a signaling cascade (4, 77). For
10
example, in the epidermal growth factor receptor (EGFR) signaling pathway, binding of
epidermal growth factor (EGF) to the receptor leads to the activation and the
autophosphorylation of the cytoplasmic Y1068 or Y1086 residues of EGFR, which recruits
the SH2 domain-containing growth factor receptor-bound protein 2 (Grb2) and ultimately
triggers the rat sarcoma (Ras)-mediated cell survival and proliferation pathways (78, 79).
In these events, binding of Grb2 to EGFR was enabled through phosphorylation of
tyrosines.
Second, pY can stimulate or inhibit the function of its residing protein. A classical
example of this is the regulation of the SFKs through tyrosine-phosphorylations in the A-
loop, C-terminal tail, and SH2 domain (Section 1.1.1.2). Additionally, pY can obstruct
ATP binding; such is the case for cyclin dependent kinase 1 (Cdk1). Phosphorylation
within the glycine loop (Y15) in the ATP interaction site of Cdk1 interferes with the
binding of ATP and “shuts off” the protein (80).
A primary role of pY in cellular regulation is the involvement in transduction of
signals in response to extracellular stimuli such as growth factors, cytokines, or stress
(77). Upon stimulation, a chain of phosphorylation events take place that successively
relay signals from the plasma membrane throughout the cytoplasm, which may
consequently result in a change in the cytoskeleton arrangement, metabolism, or gene
expression of the cell (23, 77, 81). These cellular alterations affect cell cycle progression,
differentiation, apoptosis, as well as oncogenic transformation in human diseases (3).
Therefore, through the transduction of signals, pY plays pivotal roles in many aspects of
life. Examples of major pathways that relay pY-mediated signals include mitogen-
11
activated protein kinase (MAPK) and Janus kinase (JAK)-signal transduction and
activator of transcription (STAT) pathways (reviewed in 5, 6, 74, 77).
1.1.3 Dysregulation of Protein Tyrosine Kinases and Phosphatases in
Haematopoietic Cancers
1.1.3.1 Multiple Myeloma
Multiple myeloma (MM) is the second most prevalent blood cancer and makes up
1.3% of all new cancer cases and 1.8% of cancer deaths in Canada (82). It is a cancer of
the plasma B cells. MM is characterized by the over-proliferation of malignant B cells
(myeloma cells), excessive production of immunoglobulin proteins, and formation of
multiple lesions in large bone cavities, accompanied by symptoms like anaemia, fatigue,
bone or back pain in patients. Conventional treatment for MM consists of chemotherapy
combined with haematopoietic stem cell transplantation. However, treatment of MM is
usually complicated by drug resistance and relapse. As a result, MM continues to be
universally fatal (83). Therefore, improvement in therapies is necessary to achieve better
outcomes with patients.
Fibroblast growth factor receptor 3 (FGFR3) is an RTK that is dysregulated in 15%
of MM cases due to a t(4;14)(p16;q32) translocation that re-locates the FGFR3 gene in
close proximity to the IgH locus. As a result of this translocation, the FGFR3 gene is
frequently over-expressed, occasionally harbouring activating mutations (84).
Dependencies on FGFR3 activation have been demonstrated in MM cell lines carrying
activating mutations of this RTK, where a small molecule inhibitor of FGFR3 was able to
induce apoptosis and differentiation in the MM cell lines Kawasaki Medical School 11
12
(KMS11) and KMS18, which contain the respective Y373C and G384D substitutions in
FGFR3 (85). Y373C is located in the extracellular region and mediates ligand-
independent receptor dimerization, leading to the constitutive activation of FGFR3;
whereas, G384D FGFR3 was only activated when stimulated by a ligand, but was able to
induce aberrant MAPK, STAT1, and STAT3 phosphorylations (86). Moreover, Y373C,
but not G384D, mutant induced transformation in the NIH3T3 mouse embryo fibroblast
cell line (86). These data show that mutations in FGFR3 have different grades of
activation capabilities. Furthermore, inhibiting FGFR3 activation in a KMS11 xenograft
mouse model impeded tumor growth (85), suggesting FGFR3 as a “driving” kinase for
this type of MM. Consistent with the prominent role of FGFR3 in MM cell lines and
murine model, t(4;14) translocation is associated with more aggressive diseases and poor
prognosis in MM patients (84).
Cytokines in the blood and bone marrow microenvironment can activate TK
pathways and induce MM pathogenesis. The most prominently implicated cytokines are
interleukin 6 (IL-6) and insulin-like growth factor 1 (IGF-1). IL-6 binds and activates the
IL-6 receptor, which triggers the JAK-STAT pathway causing alterations in gene
transcription. Interestingly, a key player of the JAK-STAT pathway, STAT3, is
constitutively active in primary CD138-positive MM cells, and inhibition of STAT3 leads
to apoptosis in these cells (87). Additionally, IL-6 knock-out mice failed to develop B
cell cancers, suggesting an essential role of IL-6 in B cell neoplasms (88). On the other
hand, IGF-1 binds and activates the RTK IGF-1 receptor (IGF1R), which is ubiquitously
expressed in MM and the MM-related monoclonal gammopathy of undetermined
significance (MGUS), a condition that usually preceeds MM. One study reported the
13
observation of aberrantly high expressions of IGF1R in approximately 10% of MGUS
and MM (89). Moreover, a number of studies linked the over-expression of IGF-1 or
IGF1R to poor-prognostic subgroups (89-91). In addition, cultured MM cell lines are
sensitive to the inhibition of IGF1R and its related insulin receptor (INSR) by a small
molecule inhibitor, suggesting a dependency on these RTKs for myeloma cell survival
(92). Therefore, cytokine dysregulation may induce abnormalities of pY signaling and
contribute to MM pathology.
In addition to dysregulated TKs, two PTPs are implicated in MM: Ptpn6 (a.k.a.
Shp1) and Ptp4a3 (a.k.a. Prl-3). In 79.4% of primary MM samples, the expression of
Ptpn6 is suppressed by promoter hypermethylation. Although this was not linked to
patient survival, the restoration of Ptpn6 expression by a DNA methyltransferase
inhibitor was accompanied by decreased STAT3 phosphorylation in a cultured MM cell
line, implying a role of Ptpn6 in down-regulating the JAK-STAT pathway (93).
Moreover, the Ptpn6 protein is established as a negative regulator of growth factor
signaling and oncoproteins (94-98), and the PTPN6 gene is widely described as a tumor
suppressor gene (99, 100). As a result, loss of Ptpn6 function may encourage proliferation
and promote MM pathogenesis. In contrast, amplification of Ptp4a3 mRNA and protein
levels was observed in primary myeloma cells. This is associated with tumor cell
migration, invasion, and metastasis in other types of human cancers (e.g. gastric, colon,
rectal cancers, and melanoma) (101-103). However, the function of this amplification in
MM still needs clarification.
1.1.3.2 Acute Myeloid Leukemia

14
AML is the most frequent form of leukemia and comprises approximately 25% of
leukemic cases in Western society, with an incidence of 3.7 per 100,000 persons (104). It
is a cancer of the myeloid cells, marked by the presence of at least 20% maturation-
arrested myeloblasts in the blood stream and bone marrow (105). As a result of the
abnormal accumulation of myeloblasts, AML patients experience symptoms such as
fatigue, bone pain, fever, shortness of breath, easy bruising, and unusual bleeding.
Treatment for AML traditionally includes intensive chemotherapy and haematopoietic
stem cell transplantation, but, with a low success rate. Only approximately 35-40%
younger patients (< 60 years) and 5-10% older adults (> 60 years) are cured 5 years post-
diagnosis (106). Encouragingly, TK inhibitors are undergoing extensive clinical
development for AML; and some have demonstrated promising efficacy in clinical trials
(107, 108), providing a potential alternative for patients who fail to respond to
conventional therapy.
Dysregulation of RTKs (i.e. Flt3, Kit, Met, Mer, FGFR1) is extremely prevalent in
AML (109-112), with an estimated 40-60% of AML patients harbouring abnormalities in
RTK and another 15-25% with mutations in RTK downstream effectors (i.e. Ras, Jak2)
(109, 113). Among these, activating mutations in Fms-like tyrosine kinase 3 (Flt3) have
received highest attention for their role as an important molecular marker and prognostic
factor (114-117).
Flt3 is a transmembrane receptor primarily expressed in myeloid and lymphoid
progenitor cells; and involved in growth factor signaling and hematopoiesis (118-120).
Normally, Flt3 exists as an inactive, unphosphorylated, and monomeric protein. When
stimulated, Flt3 dimerizes through its juxtamembrane region and becomes
15
phosphorylated and active. Genomic alterations leading to the constitutive activation of
Flt3 have been described in its A-loop and the juxtamembrane regions, with the most
common type of mutation being the segmental duplication of several amino acids, or
internal tandem duplication (ITD), in the juxtamembrane domain, presenting in 15-35%
of AML cases (114-117). Flt3-ITD allows ligand-independent receptor dimerization and
activation. This mutation is associated with rapid disease progression, resistance to
therapy, and poorer patient outcomes compared to the patients without Flt3-ITD (121-
123).
Compared to TKs, dysregulation of PTP in AML is less frequent. The most
commonly observed abnormal PTP is the gain-of-function mutant of Ptpn11, primarily
through genetic alterations in its SH2 domain (Section 1.1.1.4.2), which was found in
about 5% of AML patients (62). Ptpn11 is described as an oncoprotein in many cancers
(67) and is associated with Flt3-ITD-induced proliferation in bone marrow progenitors
and primary AML samples (124). Besides Ptpn11, Ptpn7 is amplified in the blasts of
some AML patients, but the functional impact of this amplification has not been clarified
(125).
1.2 Mass Spectrometry Based Proteomics
Mass spectrometry (MS) based proteomics has been developed as a sensitive
method for the large-scale characterization of sample-derived peptides (126). Due to the
nature of MS, the identification and quantification of peptides can be achieved
simultaneously. MS analysis combined with advances in separation and purification
techniques of pY-containing or PTP-derived peptides has enabled global comprehensive
analysis on pY-mediated signaling networks.
16
1.2.1 Mass Spectrometry for Proteomics Studies
MS is an analytical method that measures the mass-to-charge ratio (m/z) of the
ionized analyte in its gas phase. In proteomics research, solutions containing peptides are
first resolved on a reverse-phase chromatography column (commonly packed with C18
resin) and volatilized by an ionization source, for example, electrospray ionization (ESI)
(127). The gas-phase analyte is then transferred into a coupled mass analyzer, which
alternates between a full MS scan that performs comprehensive analysis on the analyte
(MS1 analysis) and up to a set number of MS/MS scans (or MS2 analysis), which records
the fragmentation pattern of a small subset of the analyte ions automatically determined
by the computer. The fragmentation pattern (or MS2 spectrum) can be used to infer the
peptide identity. The recorded data is then searched automatically using one or a
combination of search algorithm(s), such as MASCOT (128), SEQUEST (129), and
X!Tandem (130), against a reference database to assign amino acid sequences to
fragmented ions (reviewed in 131). A typical experiment can generate a list with
thousands of peptides. This approach of coupling liquid chromatography separation to
mass spectrometry (LC-MS/MS) is a powerful technique in proteomics for analyzing
complex biological samples (126, 132, 133).
1.2.2 Label-Free Quantification by Mass Spectrometry
Quantification by MS can be achieved through either label-based (by incorporating
chemical labels or heavy isotopes) (134-136) or label-free approaches (137). The label-
free method is relatively low-cost and can be applied to analyzing primary tissue samples,
in contrast to the label-based method such as stable isotope labelling by amino acids in
17
cell culture (SILAC) (138). In both types of approaches, MS is relatively quantitative
because the extracted quantification information can only be used to compare the same
peptide across different samples, but not different peptides within the same sample. This
is because molecularly-distinct peptides respond differently to MS detection; as a result,
the extracted quantification/molar quantity ratio is characteristic for each peptide.
However, one can overcome this difficulty by applying pre-determined correction factors
to correlate the quantification information of two distinct peptides and compare their
relative molar quantities within the same sample, as described in my previous publication
(139).
1.2.2.1 Measurement by Intensity of MS1 Ion Current
One popular approach in label-free quantification is measurement by MS1 ion
current intensity (reviewed in 137). Specifically, the height or area under the peak of the
extracted ion current chromatography (XIC) of a peptide, generated as the peptide elutes
off the reverse-phase chromatography column, is used as a quantitative measure, due to
the observation that it is linearly related to the peptide quantity (140, 141). This is a
measurement of relative quantities and has a linear range of over three orders of
magnitude (138, 139). However, since the MS2 analysis samples a subset of ions in the
analyte, frequently, a peptide with an XIC is not associated with an MS2 spectrum such
that the peptide can not be positively identified. In this case, the MS1 chromatograph of
multiple samples may be aligned by elution time and cross-referenced to combine the
MS2 spectra libraries, assigning identifications to previously unidentified
chromatographic peaks, allowing the quantification of more peptide ions. This can be
18
done in proteomics software such as MaxQuant that automatically identifies and retrieves
quantification information for peptide ions (142).
1.2.2.2 Selected Reaction Monitoring
Selected reaction monitoring (SRM) is a method used in MS in which a precursor
ion, usually a peptide, with a specific m/z is selectively isolated from a complex sample,
fragmented, and monitored for a defined fragmentation reaction product (143, 144). The
precursor and fragment ion pair is collectively called a transition. Typically more than
one transition is monitored for each targeted peptide, and the co-presence of most of the
transition-defined fragments is required to positively identify the peptide. Moreover,
quantification by SRM MS can be achieved by measuring the intensities of the ion
currents of the product ions (143, 144). This type of MS analysis is usually carried out
with a triple-quadrupole mass spectrometer (e.g. Thermo Scientific TSQ Vantage) and
has the advantage that it eliminates signals form other ion species and increases detection
sensitivity (143, 144). I previously showed that low-level (< 1%) tyrosine
phosphorylations on the SFK Lyn can be sensitively and reproducibly quantified by SRM
MS, demonstrating the utilization of SRM in monitoring protein phosphorylations (139).
1.2.3 Peptide Enrichment
1.2.3.1 Enrichment of Tyrosyl Phosphorylated Peptides
Tyrosyl phosphorylated peptides are low abundance compared to other peptide
species in a biological sample due to three reasons: 1) phosphorylated proteins merely
compose 1-2% of total proteins in a whole cell lysate extract (3); 2) only a few sites are
phosphorylated on a phosphoprotein, leaving the majority of the protein-derived peptides
19
non-phosphorylated; 3) phosphorylation usually occurs at low stoichiometry (139), such
that the non-phosphorylated peptide is in excess of its phosphorylated counterpart. As a
result, pY-specific enrichment must be performed prior to MS analysis to facilitate the
complete sampling of the collection of pY-containing molecules. The most commonly
used methods for phosphopeptide enrichment are antibody-based affinity purification,
immobilized metal affinity chromatography (IMAC), and titanium dioxide
chromatography (145). For purification of tyrosyl phosphorylated peptides, antibody-
based affinity purification has been proven to be very effective (146). An experiment
using this approach may identify up to hundreds of pY sites in a biological system.
Examples of such studies include the identification of activated RTKs and their
phosphorylated substrates without the prior knowledge of the activated pathways (147),
and characterization of downstream pY sites in induced systems (148-150).
1.2.3.2 Enrichment of Oxidized Cysteine-Containing Peptides (qPTPome)
A method was recently developed by our lab in collaboration with the group of Dr.
Benjamin Neel (Ontario Cancer Institute, Toronto) for the purpose of quantifying the
expressed PTPome in a biological system (151). This method exploits the property that
the cysteine-containing catalytic site of all classical PTPs is highly conserved, such that
an antibody developed against the signature motif of Ptpn1, with the critical cysteine
irreversibly “hyperoxidized” to sulfonic acid (VHCSO3HSAG) (152), may effectively
isolate most, if not all, classical PTPs. In particular, cellular PTPs were converted to the
hyperoxidized state, protease-digested, and subjected to immunoprecipitation with the
antibody. This process was coupled to LC MS/MS or SRM to facilitate the quantitative
profiling of isolated peptides as a measure of PTP expression (the qPTPome method). As
20
demonstrated, this approach reliably identified and quantified classical PTPs in a number
of cell lines and tissues (151). This method, combined with the pY profiling techniques,
enables a novel and comprehensive type of analysis of pY regulation in biological
systems.
1.3 Key Statistical Analysis Used in this Thesis
1.3.1 Partial Least Squares Regression
Partial least squares regression (PLSR) is a statistical method to model a set of
response variables based on a large number of predictor variables (153). It attempts to
predict response variables from predictors by simultaneously decomposing the predictor
and response variables into a shared set of orthogonal factors, or components, such that
the amount of variation in the response variables explained by the variation in the
predictor variables is maximized. The underlying model of a PLSR analysis is: X=TPT+E;
Y=UQT+F, where X is an n by m matrix of predictors, Y is an n by p matrix of responses,
T and U are n by l matrices of projections of X and Y, respectively, and P and Q are the
respective m by l and p by l orthogonal loading matrices of X and Y. E and F are matrices
of error terms, assumed to be independent random normal variables that are identically
distributed. X and Y are decomposed so as to maximize the covariance between T and U.
A popular alternative to PLSR is principal component regression (PCR), in which,
instead of decomposing both the predictor and the response variables, the principal
components of the predictor variables are used as predicting factors (154). PCR creates
models that describe the variability in the predictor variables without considering the
variability of the responses. PLSR, however, takes into account the variability of both the
21
response and the predictor variables, therefore, may create models that can fit the
response variables with fewer components. For the purpose of this thesis, PLSR was used
because a specific relationship between the predictors (TKs, PTPs) and the responses
(cellular pY) was sought after, and it was essential to consider the variability of the
responses.
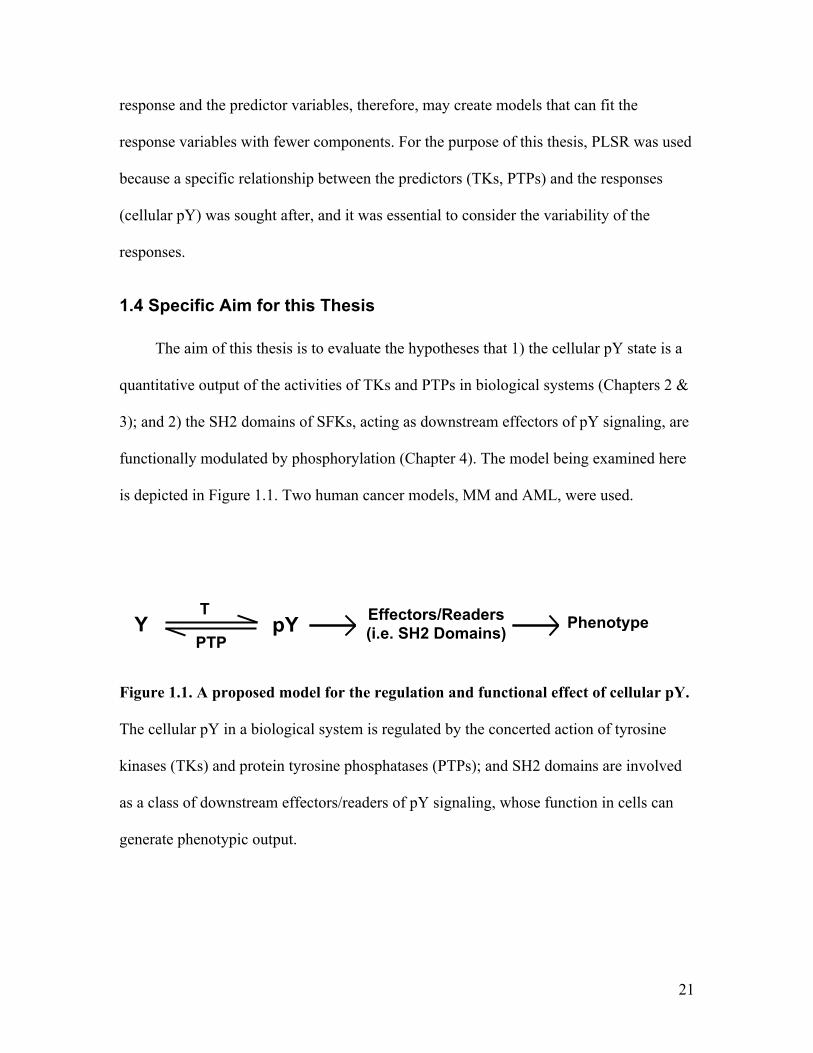
1.4 Specific Aim for this Thesis
The aim of this thesis is to evaluate the hypotheses that 1) the cellular pY state is a
quantitative output of the activities of TKs and PTPs in biological systems (Chapters 2 &
3); and 2) the SH2 domains of SFKs, acting as downstream effectors of pY signaling, are
functionally modulated by phosphorylation (Chapter 4). The model being examined here
is depicted in Figure 1.1. Two human cancer models, MM and AML, were used.
Figure 1.1. A proposed model for the regulation and functional effect of cellular pY.
The cellular pY in a biological system is regulated by the concerted action of tyrosine
kinases (TKs) and protein tyrosine phosphatases (PTPs); and SH2 domains are involved
as a class of downstream effectors/readers of pY signaling, whose function in cells can
generate phenotypic output.
Y pY TK PTP
Effectors/Readers (i.e. SH2 Domains) Phenotype

22
Chapter 2 Comprehensive Analysis of Protein Phosphotyrosine
in Multiple Myeloma
A part of the work described in this chapter has been published as:
Robert Karisch,1,2,* Minerva Fernandez,2 Paul Taylor,3 Carl Virtanen,2 Jonathan R. St-
Germain,3 Lily L. Jin,3 Isaac S. Harris,2 Jun Mori,4 Tak W. Mak,2 Yotis A. Senis,4 Arne
O¨ stman,5 Michael F. Moran,3 and Benjamin G. Neel1,2 (2011) Global proteomic
assessment of the classical protein-tyrosine phosphatome and “redoxome”. Cell. 146,
826-840
The published work include pY and PTP profiling data in MM cell lines (parts of Figure
2.3 A and 2.5 A that show data for cell lines) and the PLSR analysis in MM cell lines
using PTP expression as a predictor for cellular pY (Figure 2.4 A), as Figure 7 A-C in the
publication. The mouse xenograft tumors used in this study were raised by Zhihua Li1,2
and Dr. Suzanne Trudel1,2. The PTP profiling data was provided by Robert Karisch1,2 and
Jonathan St-Germain3, and the PLSR analysis shown in Figure 2.4 A was done by Dr.
Carl Virtanen2. All other biochemical experiments and bioinformatics analyses described
in this chapter were performed by Lily Jin.
1Department of Medical Biophysics, University of Toronto, Toronto M5G 2M9, ON,
Canada 2Campbell Family Cancer Research Institute, Ontario Cancer Institute and Princess
Margaret Hospital, University Health Network, Toronto, ON M5G 1L7, Canada 3Program in Molecular Structure and Function, Hospital For Sick Children, and
Department of Molecular Genetics and McLaughlin Centre for Molecular Medicine and
Banting and Best Department of Medical Research, University of Toronto, Toronto, ON
M5G 1L7, Canada 4Centre for Cardiovascular Sciences, Institute of Biomedical Research, School of Clinical
and Experimental Medicine, College of Medical and Dental Sciences, University of
Birmingham, Birmingham B15 2TT, UK 5Cancer Center Karolinska, Department of Pathology and Oncology, Karolinska Institute,
Stockholm 17176, Sweden
23
2.1 Abstract
The cellular pY and PTP expression profiles in five MM cell lines and their
corresponding mouse xenograft tumors were examined by MS in order to assess the
effect of the total activated TKs and expressed PTPs on the systemic pY output in the
MM cancer model. Biochemical and bioinformatics analyses revealed that distinctive
physiologies were associated with MM cultured cell lines and xenograft tumors, with
different sets of TKs and PTPs implicated in cells and tumors. These results also
demonstrate an association between the activity/expression of the enzymes (i.e.
TKs/PTPs) and the cellular pY profile, supporting a model wherein the global pY output
is dependent on the TK and PTP states in the biological system.
2.2 Introduction
MM is a fatal B cell cancer that arises from transformation during the development
of blood stem cells into normal plasma B cells. The pathogenesis of MM is
heterogeneous (83, 155). One of the most important prognostic factor and oncogenic
driving mechanism in MM is the upregulation and aberrant activation of FGFR3, which
results from a t(4;14)(p16;q32) chromosomal translocation seen in approximately 15% of
MM cases. Inhibiting FGFR3 in vitro and in pre-clinical models have demonstrated
promising anti-proliferative/antitumor effects (85, 156, 157), supporting the development
of FGFR3-targeted therapy for t(4;14)-positive MM. In the recent past, another RTK
IGF1R also emerged as a potential driving kinase in MM. IGF1R was shown as an
important autocrine and paracrine factor that affected MM growth, survival, and drug
resistance (92, 158, 159), which was also aberrantly expressed in MM with its expression
24
significantly linked to disease severity (89, 90). These data, combined with the
observation that the MAPK and PI3K/Akt signaling pathways downstream of RTKs are
frequently altered and aberrantly stimulated in MM (160-162), suggest a likely role of
disrupted pY signaling in MM pathogenesis. Given that MM is still largely incurable (83),
elucidating the regulation of protein pY signaling in MM is of great importance and will
likely reveal novel oncogenic drivers for therapeutic targeting.
Five established human primary tumor-derived MM cell lines representing
heterogeneous subtypes of MM have been selected for a comprehensive study on cellular
protein pY regulation. Three cell lines (KMS11, KMS18, LP1) contain t(4;14), among
which, two (KMS11, KMS18) harbour activating FGFR3 mutations. The FGFR3
mutations carried by KMS11 and KMS18 (Y373C and K650E, respectively) have
different grades of activation capabilities with Y373C producing a more active form of
FGFR3 (Section 1.1.3.1). Correspondingly, the growth rates of KMS11 and KMS18 cells
were reduced by a FGFR3 inhibitor, while the other cell lines were insensitive to the
inhibition (85). Comparatively, the proliferation of KMS11, KMS12, and RPMI8226 cell
lines were inhibited by an IGF1R/INSR inhibitor in vitro, while that of the other cell lines
were not (92). Interestingly, LP1 cells were not sensitive to either inhibitor, thus
representing a subtype with unknown oncogenic driving TKs. These varying responses to
TK inhibitions indicate that diverse pY-mediated mechanisms are associated with the
subtypes represented by the five cell lines. The molecular characteristics described here
are summarized in Table 2.1.
Additional molecular abnormalities have been reported for these cell lines. Somatic
mutations on the oncoproteins p53 (E285K) (163) and K-Ras (G12A) (164) were

25
detected in PRMI8226 with uncharacterized functional implications. Moreover, Mdm2
was up-regulated and promotes proliferation and survival in RPMI8226 cells (165).
Furthermore, gene expression studies identified mRNA over-expression of c-maf in
KMS11, LP1, and RPMI8226 (166); c-myc in KMS11, KMS12, and LP1 (167); and
cyclin d1 in KMS12 (166). These abnormalities provide another layer of dysregulation
that may contribute to MM pathogenesis, and were also summarized in Table 2.1.
MM cells, grown as suspending cells in tissue culture, develop into solid tumors
when injected into mice, suggesting different physiologies are associated with cultured
cells and xenografts. To gain a comprehensive understanding of MM cell and tumor
biology, the five selected cell lines were inoculated into mice to produce xenograft
tumors (by Zhihua Li and Suzanne Trudel, Ontario Cancer Institute, Toronto). The cell
lines and their corresponding tumors were analyzed by Western blots (Section 2.3) and
MS, which generated quantitative profiles of 109 unique pY-containing peptides,
encompassing 106 pY sites, and 36 PTPs across ten samples using label-free
quantification. A comparison of the proteomic signatures showed distinctive differences
between the tumors and cells. Integrated analysis revealed novel relationships between
the activated TKs, total expressed PTPs, and the cellular protein pY (Sections 2.4 - 2.6).
26
Table 2.1. Molecular Characteristics of MM Cell Lines
27
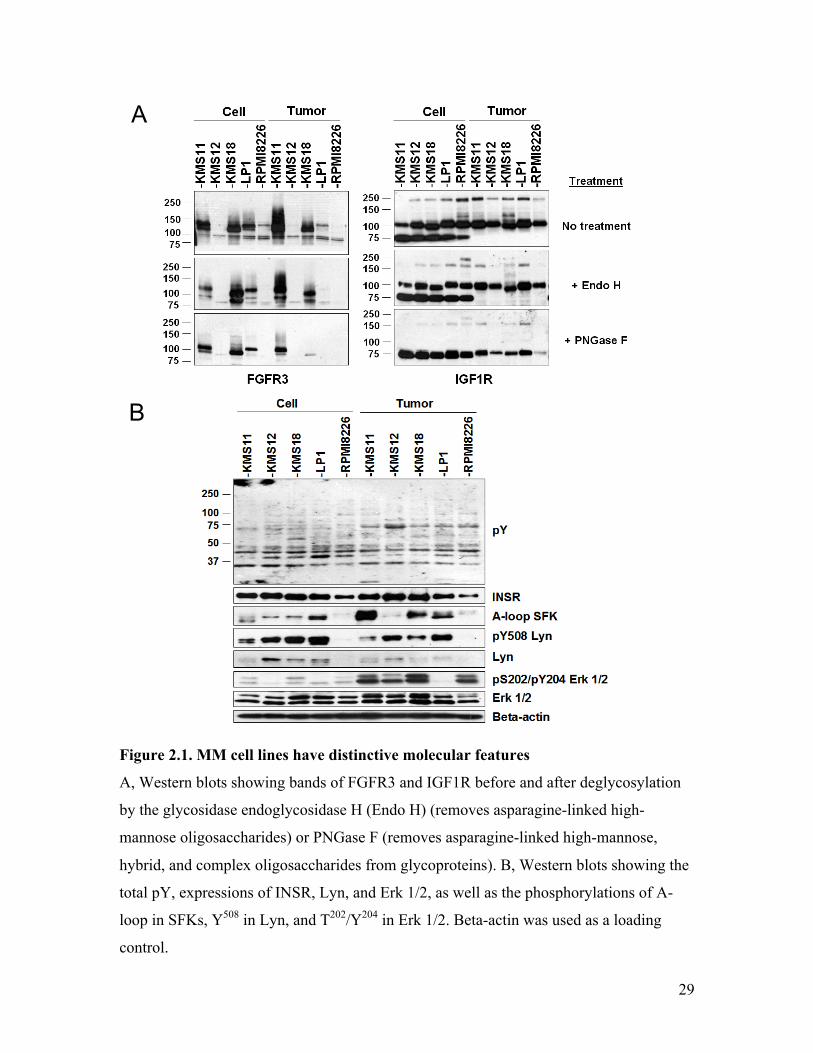
2.3 Western Analysis Showed Distinct Expression, Glycosylation,
Phosphorylation of pY Signaling Molecules in MM Samples
To characterize the MM samples, the expression/phosphorylation of key pY
signaling molecules were examined by Western blots (Figure 2.1), which revealed
distinctive molecular differences among the samples: the expression of FGFR3 and Lyn
(a SFK highly implicated in B cell disorders (25)), as well as the phosphorylation of Lyn
Y508 (inhibitory) and SFK A-loop (activating), were highly varied across MM cultured
cell lines and tumors. In particular, FGFR3 expression were consistent with the genotype,
where elevated levels were seen in the t(4;14)-positive samples with the highest
expressions coincided with FGFR3 activating mutations. Whereas, Lyn Y508 and SFK A-
loop phosphorylations, while showing fluctuations across different MM subtypes, was
generally decreased and increased, respectively, in tumors compared to the cultured cells,
suggesting increased SFK activities in the tumors. Moreover, although its expression was
uniform across the samples, the activating phosphorylation of Erk 1/2 was drastically
increased in the tumors. Because Erk 1/2 is a downstream effector of MAPK signaling
that controls growth and proliferation, this data suggests a tumor-specific up-regulation of
MAPK pathways. Unlike FGFR3/Lyn and like Erk 1/2, the IGF1R/INSR expression was
ubiquitous and mostly uniform across the MM samples. However, like FGFR3, IGF1R
was heavily asparagine (N)-glycosylated in MM (Figure 2.1 A). The fact that
glycosylated-IGF1R was resistant to Endo H but not PGNase F suggests that only hybrid
and complex, but not high-mannose, oligosaccharides were attached to IGF1R.
Interestingly, IGF1R appeared under-glycosylated in KMS18 (Figure 2.1 A right, note
the downshift of the 100 kDa band) and hyper-glycosylated in the tumors compared to

28
the cell lines (Figure 2.1 A right, note the disappearance of 75 kDa bands in Lanes 6-10
compared to Lanes 1-5). Glycosylation protects proteins from degradation and impacts
localization (168), therefore, altered glycosylation implies changes in stability and
localization of the RTKs. Finally, the global protein pY profile varied across the samples,
potentially as an output of the differentially regulated pY signaling molecules (Figure 2.1
B, pY blot). Taken together, these Western data show diverse features in pY signaling
molecules/effectors not only across the cell lines, but also between cultured cells and
their cognate tumors, suggesting that distinctive protein pY regulations are at play in
these MM samples.
29
Figure 2.1. MM cell lines have distinctive molecular features
A, Western blots showing bands of FGFR3 and IGF1R before and after deglycosylation
by the glycosidase endoglycosidase H (Endo H) (removes asparagine-linked high-
mannose oligosaccharides) or PNGase F (removes asparagine-linked high-mannose,
hybrid, and complex oligosaccharides from glycoproteins). B, Western blots showing the
total pY, expressions of INSR, Lyn, and Erk 1/2, as well as the phosphorylations of A-
loop in SFKs, Y508 in Lyn, and T202/Y204 in Erk 1/2. Beta-actin was used as a loading
control.
A
B
30
2.4 pY Profiling Revealed Distinctive Differences between MM
Cultured Cell lines and Xenograft Tumors
To gain an in-depth understanding of the pY regulation in MM, comprehensive
quantitative pY profiles were generated for the ten MM samples. To this end, cell- or
tumor-derived proteolytic peptides, equalized by total protein amounts, were enriched for
pY-containing molecules by immunoprecipitation. The enriched fractions were analyzed
by MS. The MS results were searched automatically against the human International
Protein Index (IPI) database (ftp://ftp.ebi.ac.uk/pub/databases/IPI/last_release/; v3.68;
87,061 FASTA entries) for peptide identifications (see flowchart in Figure 2.2 A). This
experiment was repeated once. A total of 109 unique pY peptides, corresponding to 106
pY sites, were identified across two replicates of ten MM samples.
The total numbers of MS/MS spectra for pY peptides, as well as unique pY peptides,
unique pY sites, proteins associated with pY peptides, and kinases identified in each MM
sample are shown in Table 2.2. In the case that the identified peptide sequence is
conserved in more than one protein, only one protein is counted to represent the group. A
comparison across the cell lines showed that KMS12 had the lowest incidences of
identifications, consistent with a phenotype that lacked an association with aberrant TK
activation, while the t(4;14)-positive cell lines contained significantly more incidences of
pY identifications. Curiously, the number of pY identifications in RPMI8226 were
comparable with that of the t(4;14)-positive cell lines. Since KRAS mutation was
observed in RPMI8226 cells (164), up-regulation of the MAPK pathways, which have
been implicated in MM (162), could be one potential mechanism that gives rise to the
high count of pY identifications. A comparison between the cell and their cognate tumor
31
samples revealed only 36-54% overlap between the unique pY sites identified (Figure 2.2
B), with generally more identifications observed in cultured cells than in tumors. Motif
analysis of the 106 total pY sites revealed an enrichment of the signature A-loop-
bounding sequences DFG…APE (Figure 2.2 C). Since phosphorylation of Y within the
A-loop suggests increased catalytic activity of the parent kinase (Section 1.1.1.1), this
observation implies an abundance of activated kinases in MM. Indeed, 22 out of 109
peptides correspond to phosphorylations within the A-loop of kinases (including TKs,
Serine/Threonine kinases, and dual-specific kinases). Among these, nine peptides,
representing seven proteins, were derived from TKs (refer to Figure 2.3 B).
32
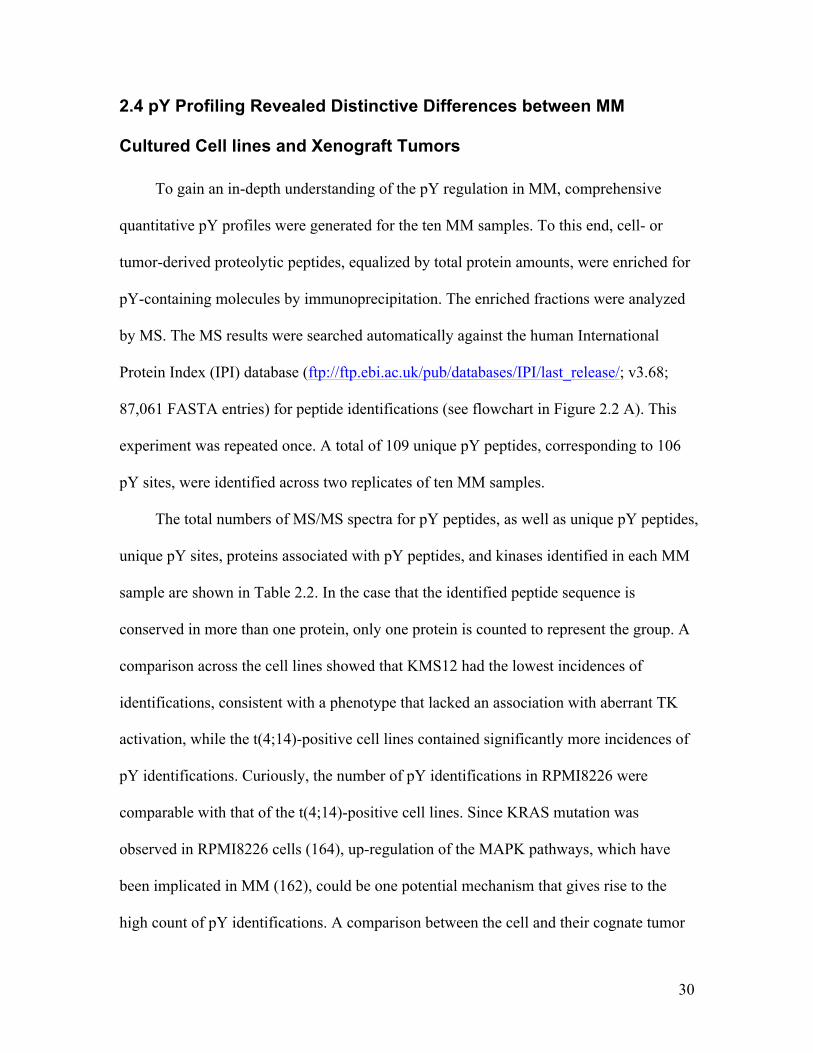
Figure 2.2. pY profile reveals difference between cell and tumor and an abundance
of TK A-loop phosphorylations
A, a flowchart showing schematic overview of experimental procedures. MM cells were
injected into mice to produce xenograft tumors by Zhihua Li (Ontario Cancer Institute)
and all other experiments were performed by Lily Jin. B, Venn diagrams of unique pY
sites identified in MM cell and tumor samples for each cell line. C, sequence logos
showing the abundance of surrounding residues (corresponding to the sizes of letters) of
106 pY sites identified in MM. The conserved A-loop-bounding sequences are
highlighted in red.
A B
C
33
Table 2.2. Number of proteins, peptides, and pY sites identified in MM cells and
tumors

34
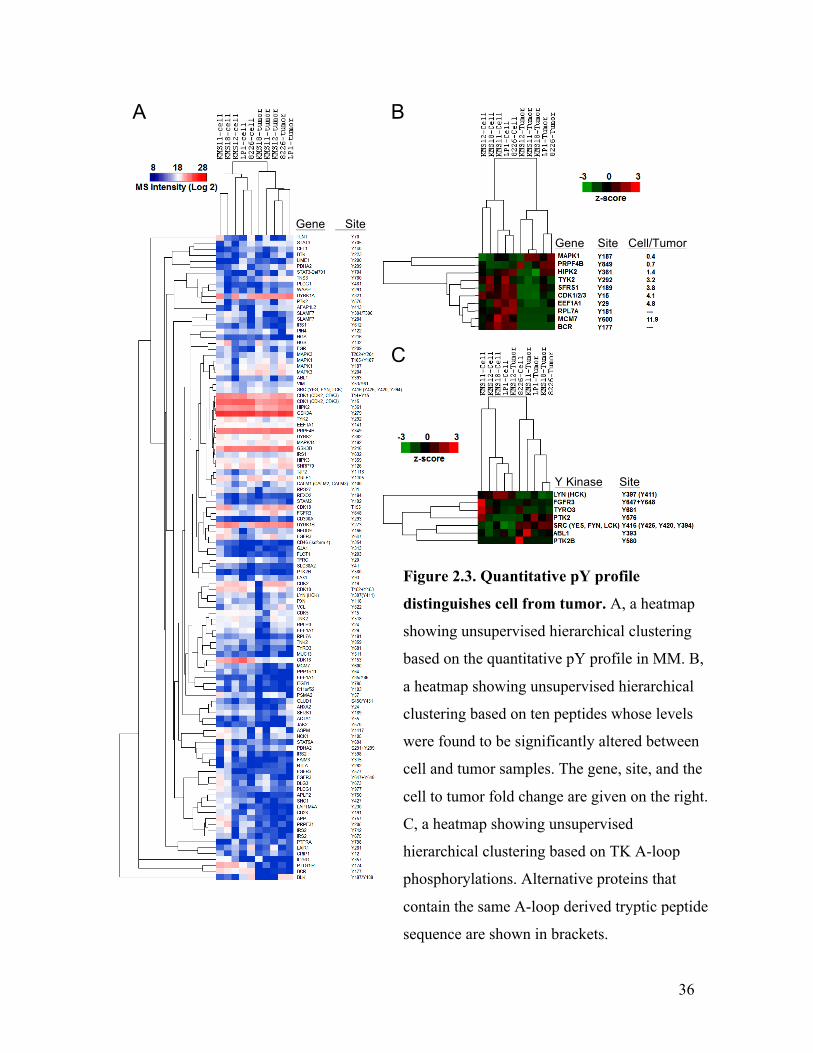
Next, I examined the quantitative profile of the identified pY peptides (raw
quantification data in Appendix Table 1). A heatmap based on the quantification levels of
the pY peptides was created. Unsupervised hierarchical clustering separated the cell and
tumor samples into two distinct groups according to the pY profiles (Figure 2.3 A),
suggesting distinguishable differences between the cells and tumors. A closer
examination revealed that a total of ten peptides were significantly different between the
cells and tumors, with paired Student’s t-test p value < 0.05 (Figure 2.3 B), which include
the MAPK1 pY187-containing peptide that is on average 2.8-fold higher in tumors and the
tyrosine kinase 2 (Tyk2) pY292-containing peptide that is on average 3.2-fold more
abundant in cells. Moreover, the inhibitory phosphorylation (Y15) in Cdk 1/2/3 was
significantly higher (on average by 4.1-fold; p < 0.01) in cells than in tumors. Since the
Cdk’s are essential for driving each phase of a cell cycle (169), this data suggests
enhanced cell cycle progression in the tumors. Together, these data indicate that pY
signaling may be differentially regulated in MM cells and tumors through the action of
different kinases, which may be reflected on downstream molecules (e.g. Cdk 1/2/3) as
effectors of the pY regulation.
Because of the noted abundance of A-loop pY in MM, and phosphorylated A-loop
represents the activations of its parent kinase, I hypothesized that the activated TKs in
MM dictate the overall cellular pY. If this were true, unsupervised hierarchical clustering
based on the levels of the A-loop pY along should separate the cells from tumors. To this
end, I generated a heatmap based on the quantitative profiles of TK A-loop pY in MM
samples (Figure 2.3 C). As the results indicate, the samples were clustered into two
distinct groups, mostly separating the cells from tumors, suggesting that the activation of
35
subsets of TKs was responsible for the different cell and tumor pY signature. However,
KMS12 tumor and RPMI8226 cells were clustered reciprocally with the cells and tumors,
respectively. The reason may be that high-level phosphorylation in the A-loops of FGFR3
and Lyn (or Hck, which contains the same A-loop-derived tryptic peptide sequence as
Lyn) in KMS12 tumor confers a cell-like signature, while the activation of Src (or Yes,
Fyn, Lck, which contain the same A-loop-derived tryptic peptide sequence as Src) and
low phosphorylation of FGFR3 in RPMI8226 cell render it more similar to tumors.
36
Gene Site
Y Kinase Site
A B
C
Gene Site Cell/Tumor
Figure 2.3. Quantitative pY profile
distinguishes cell from tumor. A, a heatmap
showing unsupervised hierarchical clustering
based on the quantitative pY profile in MM. B,
a heatmap showing unsupervised hierarchical
clustering based on ten peptides whose levels
were found to be significantly altered between
cell and tumor samples. The gene, site, and the
cell to tumor fold change are given on the right.
C, a heatmap showing unsupervised
hierarchical clustering based on TK A-loop
phosphorylations. Alternative proteins that
contain the same A-loop derived tryptic peptide
sequence are shown in brackets.
37
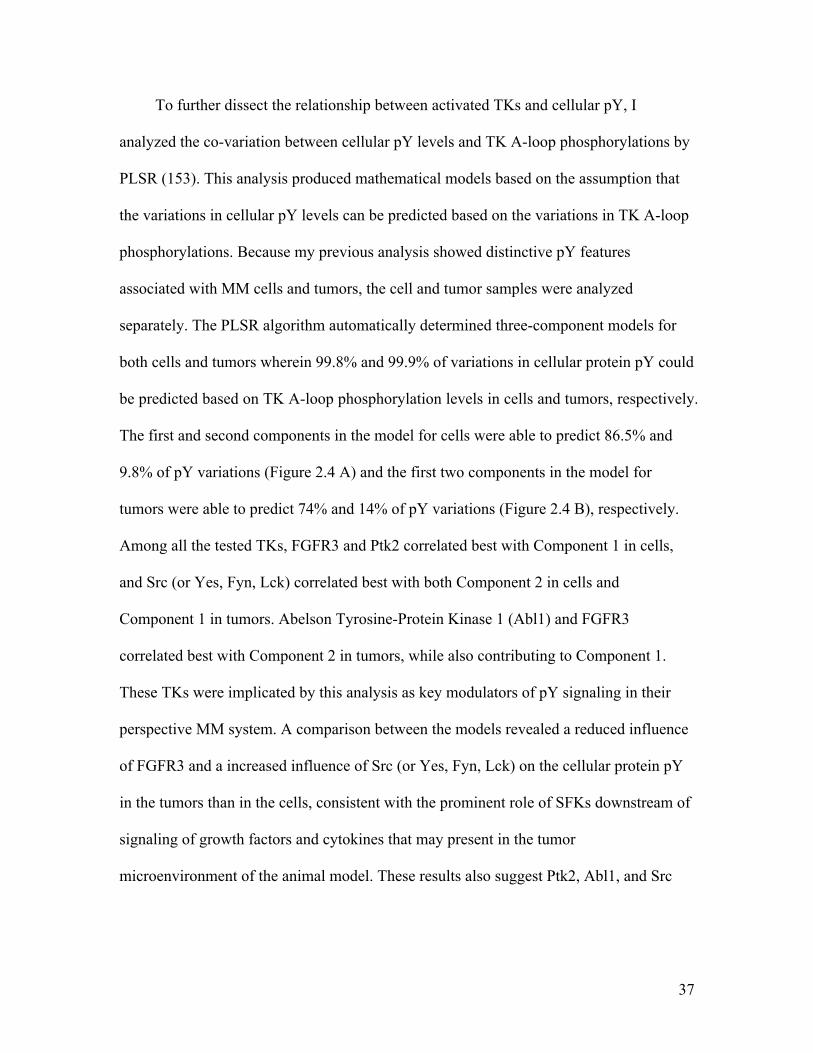
To further dissect the relationship between activated TKs and cellular pY, I
analyzed the co-variation between cellular pY levels and TK A-loop phosphorylations by
PLSR (153). This analysis produced mathematical models based on the assumption that
the variations in cellular pY levels can be predicted based on the variations in TK A-loop
phosphorylations. Because my previous analysis showed distinctive pY features
associated with MM cells and tumors, the cell and tumor samples were analyzed
separately. The PLSR algorithm automatically determined three-component models for
both cells and tumors wherein 99.8% and 99.9% of variations in cellular protein pY could
be predicted based on TK A-loop phosphorylation levels in cells and tumors, respectively.
The first and second components in the model for cells were able to predict 86.5% and
9.8% of pY variations (Figure 2.4 A) and the first two components in the model for
tumors were able to predict 74% and 14% of pY variations (Figure 2.4 B), respectively.
Among all the tested TKs, FGFR3 and Ptk2 correlated best with Component 1 in cells,
and Src (or Yes, Fyn, Lck) correlated best with both Component 2 in cells and
Component 1 in tumors. Abelson Tyrosine-Protein Kinase 1 (Abl1) and FGFR3
correlated best with Component 2 in tumors, while also contributing to Component 1.
These TKs were implicated by this analysis as key modulators of pY signaling in their
perspective MM system. A comparison between the models revealed a reduced influence
of FGFR3 and a increased influence of Src (or Yes, Fyn, Lck) on the cellular protein pY
in the tumors than in the cells, consistent with the prominent role of SFKs downstream of
signaling of growth factors and cytokines that may present in the tumor
microenvironment of the animal model. These results also suggest Ptk2, Abl1, and Src
38
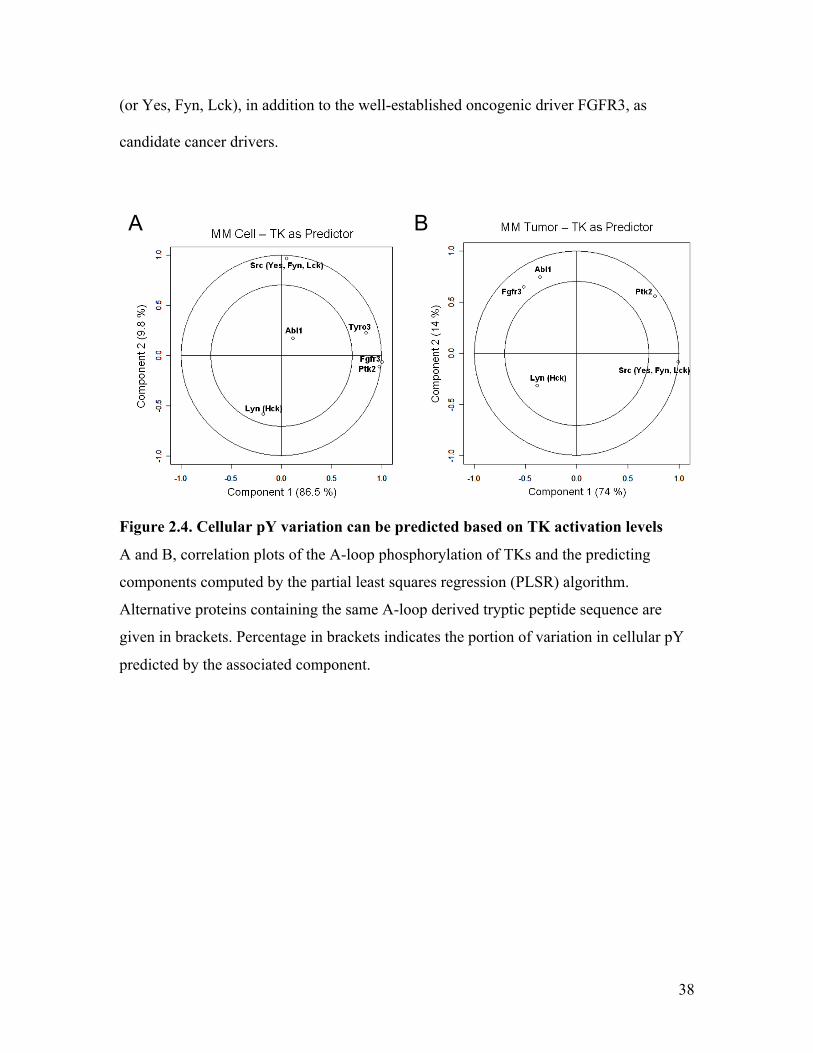
(or Yes, Fyn, Lck), in addition to the well-established oncogenic driver FGFR3, as
candidate cancer drivers.
Figure 2.4. Cellular pY variation can be predicted based on TK activation levels
A and B, correlation plots of the A-loop phosphorylation of TKs and the predicting
components computed by the partial least squares regression (PLSR) algorithm.
Alternative proteins containing the same A-loop derived tryptic peptide sequence are
given in brackets. Percentage in brackets indicates the portion of variation in cellular pY
predicted by the associated component.
A B
39
2.5 Co-Variance Analysis of PTP and pY Profiles Implicated a Subset
of PTP in pY Regulation
In order to assess the influence of negative enzymatic regulation on cellular pY and
develop a comprehensive understanding of pY regulation in MM, PTP expression
profiles in MM samples were produced in our lab through collaboration with Robert
Karisch, a former graduate student in Dr. Benjamin Neel’s lab (Ontario Cancer Institute,
Toronto), and by using the qPTPome method (151). The expression levels of a
complement of 36 classical PTPs were examined by SRM MS, among which, 24 were
found to be expressed in our samples (Appendix Table 2). Using the PTP expression
profile, I performed unsupervised hierarchical clustering to seek relationships among the
MM samples (Figure 2.5 A). Interesting, this analysis generally separated the cell and
tumor samples into two clusters, showing that, in addition to cellular pY and TK
activation, the regulation of PTP expressions was also different between cells and tumors.
The exceptions were LP1 tumor and KMS12 cell, which were clustered reciprocally with
the cell and tumor groups, respectively. Moreover, the cognate cell and tumor samples of
KMS12 and LP1 cell lines were paired up respectively (p < 0.05), indicating that the PTP
expressions in these cell lines were influenced more by the genotype than the growth
environment. This observation was not seen in the clusters based on pY or TK A-loop
phosphorylations, and may suggest that genotype exerts a heavier influence on PTP
expressions than on pY, which is more dynamic and responds quicker to environmental
stimuli.
To further dissect the relationship between PTPs and cellular pY, PLSR analysis
was applied to generate models wherein PTP expression levels were used as predictors
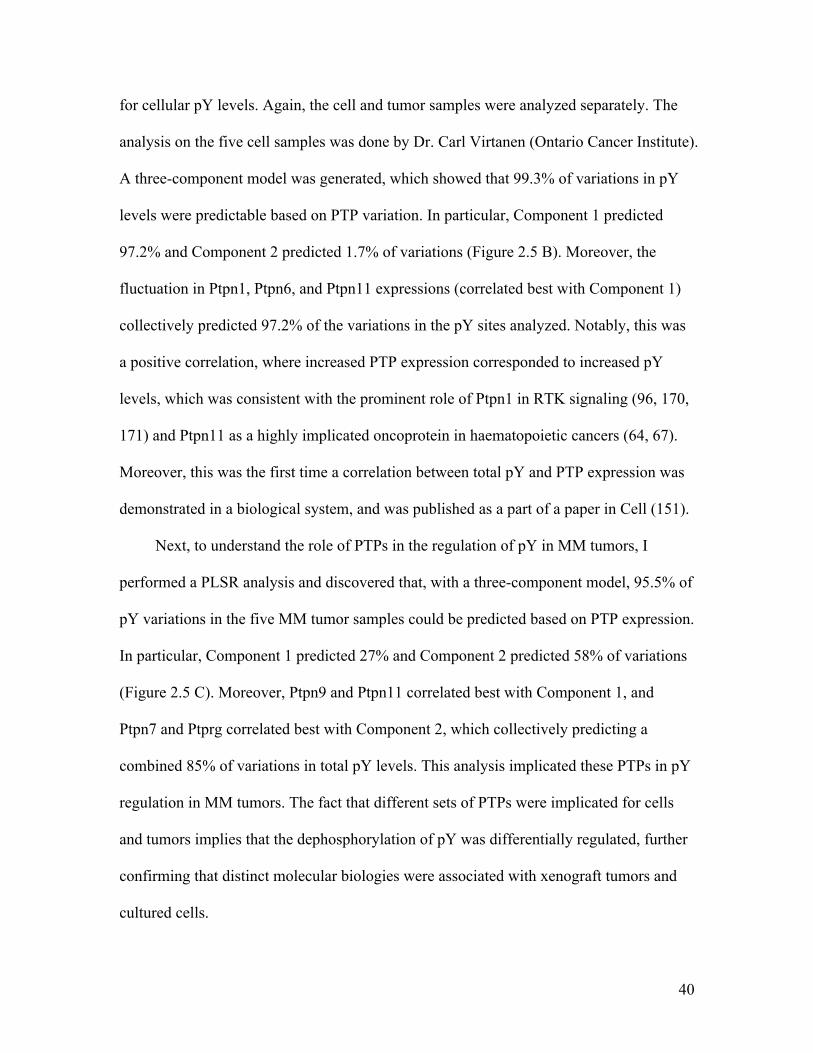
40
for cellular pY levels. Again, the cell and tumor samples were analyzed separately. The
analysis on the five cell samples was done by Dr. Carl Virtanen (Ontario Cancer Institute).
A three-component model was generated, which showed that 99.3% of variations in pY
levels were predictable based on PTP variation. In particular, Component 1 predicted
97.2% and Component 2 predicted 1.7% of variations (Figure 2.5 B). Moreover, the
fluctuation in Ptpn1, Ptpn6, and Ptpn11 expressions (correlated best with Component 1)
collectively predicted 97.2% of the variations in the pY sites analyzed. Notably, this was
a positive correlation, where increased PTP expression corresponded to increased pY
levels, which was consistent with the prominent role of Ptpn1 in RTK signaling (96, 170,
171) and Ptpn11 as a highly implicated oncoprotein in haematopoietic cancers (64, 67).
Moreover, this was the first time a correlation between total pY and PTP expression was
demonstrated in a biological system, and was published as a part of a paper in Cell (151).
Next, to understand the role of PTPs in the regulation of pY in MM tumors, I
performed a PLSR analysis and discovered that, with a three-component model, 95.5% of
pY variations in the five MM tumor samples could be predicted based on PTP expression.
In particular, Component 1 predicted 27% and Component 2 predicted 58% of variations
(Figure 2.5 C). Moreover, Ptpn9 and Ptpn11 correlated best with Component 1, and
Ptpn7 and Ptprg correlated best with Component 2, which collectively predicting a
combined 85% of variations in total pY levels. This analysis implicated these PTPs in pY
regulation in MM tumors. The fact that different sets of PTPs were implicated for cells
and tumors implies that the dephosphorylation of pY was differentially regulated, further
confirming that distinct molecular biologies were associated with xenograft tumors and
cultured cells.
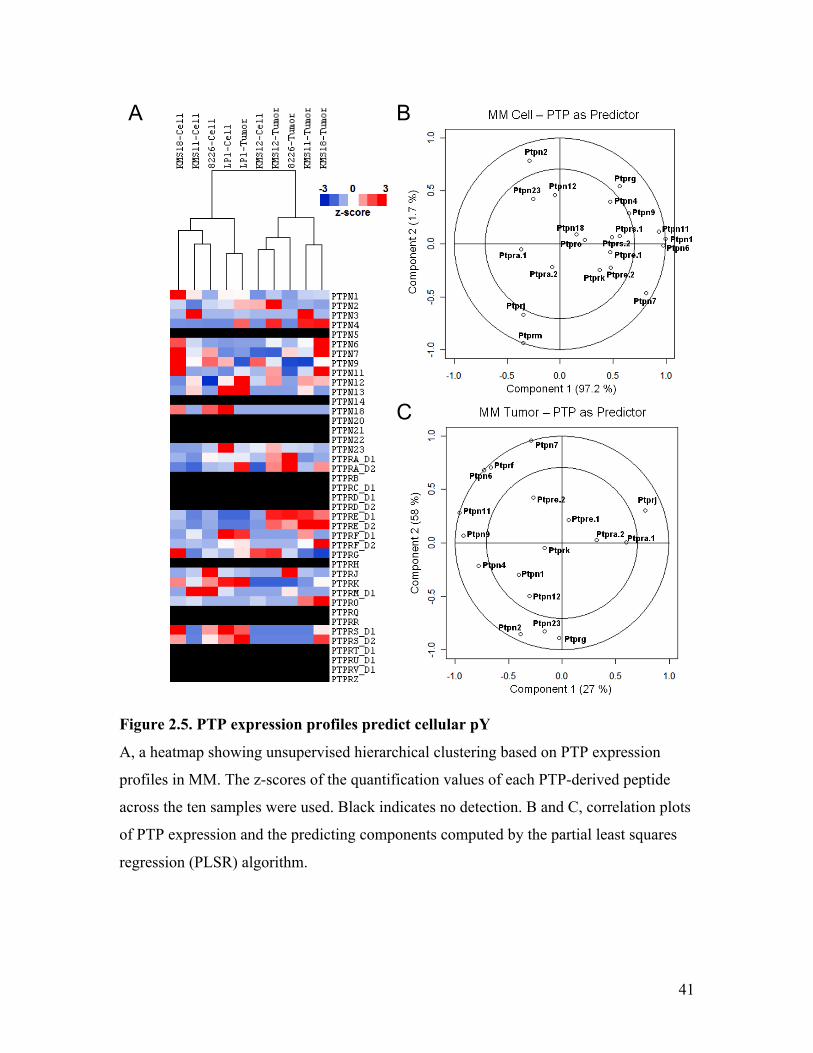
41
Figure 2.5. PTP expression profiles predict cellular pY
A, a heatmap showing unsupervised hierarchical clustering based on PTP expression
profiles in MM. The z-scores of the quantification values of each PTP-derived peptide
across the ten samples were used. Black indicates no detection. B and C, correlation plots
of PTP expression and the predicting components computed by the partial least squares
regression (PLSR) algorithm.
A B
C
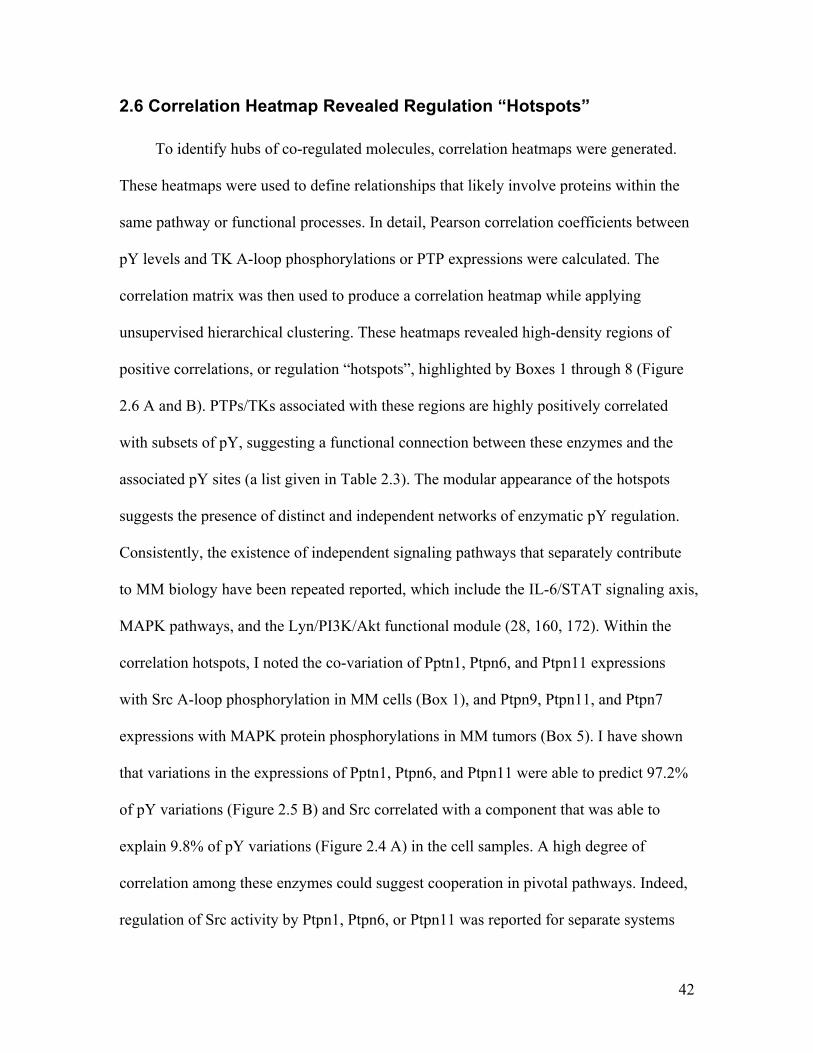
42
2.6 Correlation Heatmap Revealed Regulation “Hotspots”
To identify hubs of co-regulated molecules, correlation heatmaps were generated.
These heatmaps were used to define relationships that likely involve proteins within the
same pathway or functional processes. In detail, Pearson correlation coefficients between
pY levels and TK A-loop phosphorylations or PTP expressions were calculated. The
correlation matrix was then used to produce a correlation heatmap while applying
unsupervised hierarchical clustering. These heatmaps revealed high-density regions of
positive correlations, or regulation “hotspots”, highlighted by Boxes 1 through 8 (Figure
2.6 A and B). PTPs/TKs associated with these regions are highly positively correlated
with subsets of pY, suggesting a functional connection between these enzymes and the
associated pY sites (a list given in Table 2.3). The modular appearance of the hotspots
suggests the presence of distinct and independent networks of enzymatic pY regulation.
Consistently, the existence of independent signaling pathways that separately contribute
to MM biology have been repeated reported, which include the IL-6/STAT signaling axis,
MAPK pathways, and the Lyn/PI3K/Akt functional module (28, 160, 172). Within the
correlation hotspots, I noted the co-variation of Pptn1, Ptpn6, and Ptpn11 expressions
with Src A-loop phosphorylation in MM cells (Box 1), and Ptpn9, Ptpn11, and Ptpn7
expressions with MAPK protein phosphorylations in MM tumors (Box 5). I have shown
that variations in the expressions of Pptn1, Ptpn6, and Ptpn11 were able to predict 97.2%
of pY variations (Figure 2.5 B) and Src correlated with a component that was able to
explain 9.8% of pY variations (Figure 2.4 A) in the cell samples. A high degree of
correlation among these enzymes could suggest cooperation in pivotal pathways. Indeed,
regulation of Src activity by Ptpn1, Ptpn6, or Ptpn11 was reported for separate systems
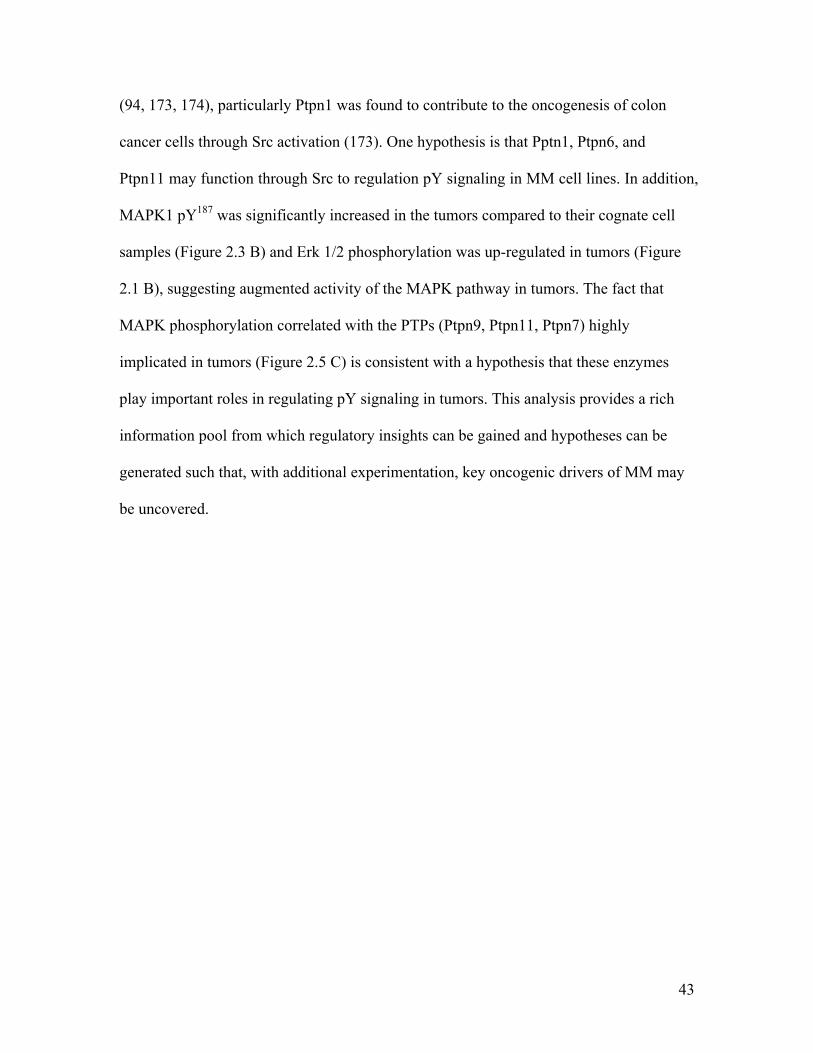
43
(94, 173, 174), particularly Ptpn1 was found to contribute to the oncogenesis of colon
cancer cells through Src activation (173). One hypothesis is that Pptn1, Ptpn6, and
Ptpn11 may function through Src to regulation pY signaling in MM cell lines. In addition,
MAPK1 pY187 was significantly increased in the tumors compared to their cognate cell
samples (Figure 2.3 B) and Erk 1/2 phosphorylation was up-regulated in tumors (Figure
2.1 B), suggesting augmented activity of the MAPK pathway in tumors. The fact that
MAPK phosphorylation correlated with the PTPs (Ptpn9, Ptpn11, Ptpn7) highly
implicated in tumors (Figure 2.5 C) is consistent with a hypothesis that these enzymes
play important roles in regulating pY signaling in tumors. This analysis provides a rich
information pool from which regulatory insights can be gained and hypotheses can be
generated such that, with additional experimentation, key oncogenic drivers of MM may
be uncovered.
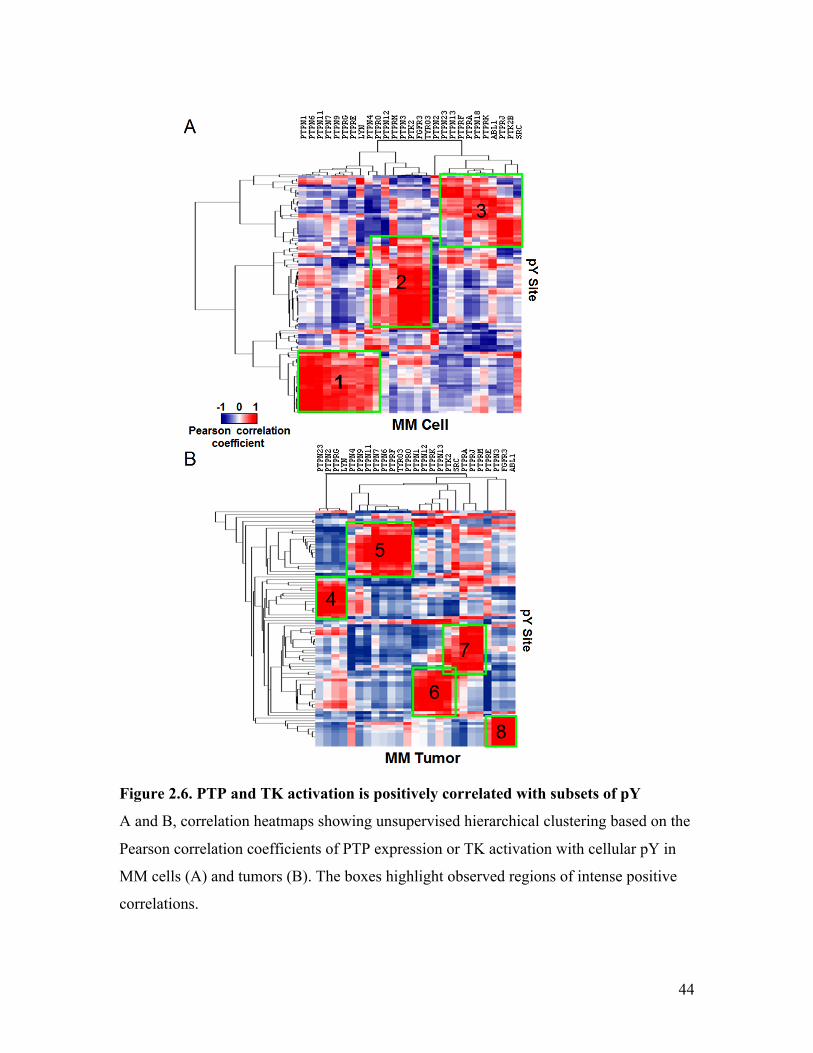
44
Figure 2.6. PTP and TK activation is positively correlated with subsets of pY
A and B, correlation heatmaps showing unsupervised hierarchical clustering based on the
Pearson correlation coefficients of PTP expression or TK activation with cellular pY in
MM cells (A) and tumors (B). The boxes highlight observed regions of intense positive
correlations.
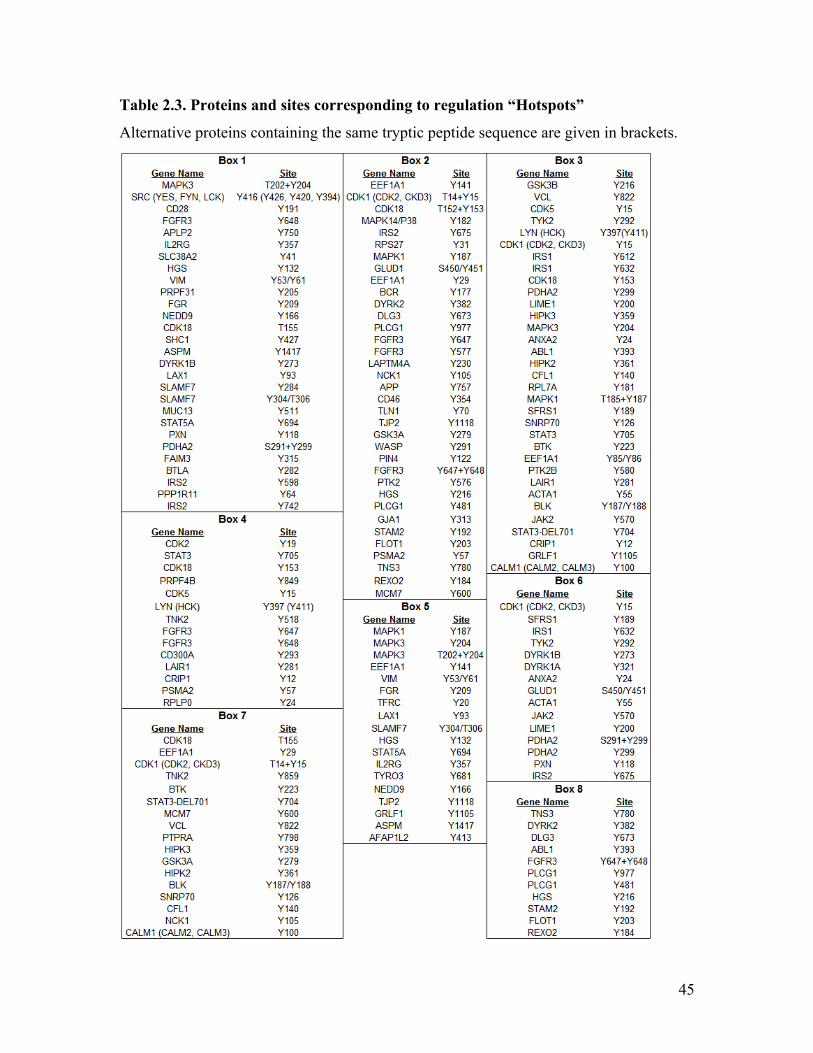
45
Table 2.3. Proteins and sites corresponding to regulation “Hotspots”
Alternative proteins containing the same tryptic peptide sequence are given in brackets.
46
2.7 Discussion and Conclusion
The biochemical and bioinformatics analyses described in this chapter aimed at
assessing the enzymatic influence of TKs and PTPs on systemic pY levels in a biological
system. MM, a haematopoietic cancer in many cases linked to dysregulation in pY
signaling, was used as a model disease. Five established MM cell lines were selected for
this study to represent different subtypes of MM. Initial examinations of the pY signaling
molecules and pY profiles revealed dramatic differences between the MM cultured cell
lines and their associated xenograft tumors (Figure 2.1 and Figure 2.3 A). These results
subsequently led to analyzing the cell samples and tumors as separate biological systems.
Co-variance between the activation/expression of the TKs/PTPs and cellular protein pY
gave rise to theoretical models, which demonstrated that close to 100% of pY variations
could be predicted based on fluctuations in TK activation (Figure 2.4 A and B) and PTP
expression (Figure 2.5 B and C) levels. These results show that cellular pY levels may be
subjected to systemic regulation by enzymes in a cell, supporting my model described in
Figure 1.1.
The impact of TK on cellular pY profile is widely appreciated. Prior studies have
demonstrated the application of using pY profiles for the identification of aberrantly
activated signaling pathways (147, 175) and TKs as biomarkers and drug targets in
cancer (176, 177). Moreover, phosphoproteomics was used to identify targets of kinase
inhibitors (178-180) and downstream effectors of mutant kinases (181, 182). These data
show that the effect of TK regulation/dysregulation is manifested in the cellular pY states.
As such, the pY profiles can be used to reverse-predict key functioning TKs in a cellular
system as demonstrated here. The bioinformatics approach used in my study implicated
47
FGFR3, Ptk2, and Src (or Yes, Fyn, Lck) in MM cell lines and Src (or Yes, Fyn, Lck),
Abl1, and FGFR3 in the corresponding xenograft tumors. Particularly, my analysis
showed that almost 100% of cellular pY variations in MM were predicted based on TK
activation levels, with a single component (Component 1) predicting 86.5% and 74% in
MM cells and tumors, respectively (Figure 2.4 A and B). Among the implicated TKs,
FGFR3 is a known prognosis factor in MM whose over-expression/mutation is linked to
aggressive diseases and poor patient outcomes (183). Consistently, I showed that the
FGFR3 activation level correlated best with Component 1 in the PLSR-generated model
for cells (Figure 2.4 A) and likely contribute to pY regulation in the tumors (Figure 2.4
B). The activation of Ptk2 (also known as FAK1) co-varied with that of FGFR3 in the
cells, suggesting Ptk2 may function with FGFR3, possibly as an immediate downstream
effector of FGFR3. Increased Ptk2 levels were found in a wide range of metastatic
diseases (184) and the over-expression of Ptk2 was associated with disease progression
and extramedullary infiltration in MM (185). My data provides a potential mechanistic
link between Ptk2 and its function in MM, which may be highly related to FGFR3
dysregulation. Another implicated enzyme, Src, is a well-established oncoprotein
associated with many transformed cell types (24, 186) and a target in MM (187). Integrin
β7 knockdown in myeloma cells led to the inhibition of both Ptk2 and Src
phosphorylation, which correlated with reduced cell adhesion and migration, as well as
altered bone marrow homing (188), suggesting a role for Ptk2 and Src in the disease
progression of MM. Additionally, Fyn was required downstream of IL-6 signaling in MM
cell lines (26), demonstrating a link between Fyn and cytokine signaling in tumor
microenvironment. Notably, Src (or Yes, Fyn, Lck) is highly implicated (correlated best
48
with Component 1) in the xenograft tumors (Figure 2.4 B), consistent with a role in
disease progression and tumor biology. Finally, although it is an established driver in
chronic myeloid leukemia (189), the BCR-ABL1 gene fusion was only detected in one
instance in a MM cell line (190) and the function of Abl1 in MM is still unclear. In
summary, my analysis represents a novel approach for examining cellular pY profiles to
identify the potential driving TKs in the system. Furthermore, this analysis shortlisted
TKs that may be key regulators in the MM systems examined.
In contrast, my data did not show a strong reference to IGF1R activation in MM,
however, the immediate downstream interactors of IGF1R, insulin receptor substrate
(IRS) 1 and IRS2, were found to be phosphorylated in my samples (see Appendix Table
1). Particularly, two Y sites in IRS1 (Y612, Y632) and three Y sites in IRS2 (Y742, Y675,
Y598) were phosphorylated, with the highest levels seen in KMS18 and LP1 samples. As
described before, KMS18 and LP1 cell lines were resistant to IGF1R inhibition (Table
2.1); and the IRS proteins were known to be involved in the feedback regulation of
IGF1R, reportedly through phosphorylation of serines (191). Therefore, the high
phosphorylation in the IRS proteins in KMS18 and LP1 may reflect the corresponding
suppression of IGF1R, which may explain the insensitivity of these cell lines to IGF1R
inhibition.
Using a similar co-variance analysis approach, the impact of PTP expression on
cellular pY was examined in the MM cell and tumor systems. This method generated
theoretical models wherein 99.3% and 95.5% of pY variations could be predicted by the
changes in PTP expressions in cells and tumors, respectively, which implicated Ptpn1,
Ptpn6, and Ptpn11 in cells and Ptprg, Ptpn23, Ptpn9, and Ptpn11 in tumors (Figure 2.5 B
49
and C). Markedly, a single component alone (refer to Figure 2.5 B, Component 1 that
correlated with Ptpn1, Ptpn6, and Ptpn11) in the model for cells predicted 97.2% of pY
variations. Astonishingly, a positive relationship between the PTP expressions and pY
levels was suggested by the models.
Although PTPs were traditionally regarded as negative regulators of pY, evidence
now shows that PTPs positively regulate a number of cellular processes in various
systems (192, 193). For example, Ptpn11 is a known oncoprotein upstream of the MAPK
signaling pathway and positively regulates cell growth and proliferation (192). Moreover,
Ptpn1 activates Src by dephosphorylating the inhibitory Src Y527 site in human breast
cancer cell lines (170); and Ptp4a1 (a.k.a. Prl-1) enhances cancer cell invasion and
migration by increasing Src and Erk 1/2 pathway activation (194). Mechanistically, PTPs
can promote the activation of signaling pathways by dephosphorylating inhibitory sites
on TKs or docking sites on RTKs for binding inhibitory biomolecules. Alternatively, it
can be part of the feedback regulation and up-regulated by upstream pY signaling. By
these means, PTPs can be positively correlated with protein pY and may serve as an
indicator for predicting the cellular pY levels.
I identified six PTPs that may play a key role in regulating protein pY homeostasis
in MM samples. Three of these PTPs were implicated in MM: Ptpn6 is a reported tumor
suppressor and is hypermethylated in primary myeloma samples (93); whereas Pptn1
participates in RTK signaling (195) and its depletion in the t(4;16)-pos/FGFR3mut KMS11
cell line can lead to increased FGFR3 phosphorylation and global pY levels, suggesting
Pptn1 as a key negative regulator of FGFR3 (151). This apparent contradiction with the
finding that Ptpn1 positively correlated with protein pY in MM (Figure 2.5 B) and
50
FGFR3 phosphorylations (Figure 2.6; Table 2.3 Box 1) reflects the complexity of cellular
pY regulation: one possible explanation is that MM cells attempt to overcome the effects
of the hyper-activated FGFR3 by stimulating the expression of its negative regulator
Ptpn1. Another implicated PTP, Ptpn11, is an established oncoprotein (62, 67) and
reportedly protects MM cells against dexamethasone-induced apoptosis by acting
downstream of IL-6 (196). Moreover, Ptpn11 is required for transforming oncogenic
FGFR3-expressing NIH 3T3 cells (197). Although the remaining three PTPs were not
implicated in MM, they were associated with other malignancies:, Ptprg is reportedly a
candidate tumor suppressor (198), whereas, Ptpn9 down-regulates RTK signaling in
breast cancer cells (199). In addition, Ptpn7 is genetically amplified and over-expressed
in myeloid malignancies (125). The role of these PTPs in MM still needs elucidation.
My results show that distinctive molecular characteristics were associated with MM
cells and tumors (Figure 2.1, 2.3, 2.5 A), in agreement with this, different sets of
TKs/PTPs in MM cells and tumors were implicated as potential key regulators of the
cellular protein pY (Figure 2.3 C and D, 2.4 B and C). These data imply that tumor-
specific biologies are at play when myeloma cells are exposed to the tumor
microenvironment of the animal model. In particular, increased Erk 1/2 (Figure 2.1 B)
and MAPK1 Y187 (paired Student’s t-test p value < 0.05) phosphorylations were observed
in the tumors compared to the cultured cell lines, and MAPK 1/3 phosphorylations were
highly correlated with the PTPs (Ptpn9, Ptpn11, Ptpn7) implicated in the tumors (Table
2.3; Figure 2.6 B, Box 5). These data imply that MAPK signaling may be important for
MM tumor development. Consistently, mutations of components of the MAPK signaling
pathway are common in human cancers (200) and inhibiting p38 MAPK hampered MM
51
cell growth in the bone marrow milieu (201), supporting a pro-proliferative role of
MAPK signaling in myeloma cells in the tumor microenvironment. In further agreement,
small molecule inhibitors targeting the MAPK signaling pathway have been assessed in
clinical trials and yielded encouraging results (202). Together, these data suggest a
dependency on the up-regulation of MAPK pathway for myeloma cells residing in the
tumor microenvironment, which is a phenomenon less preserved in the cultured cell lines.
In contrast to the MAPK signaling proteins, phosphorylation of the TK Tyk2 (Y292) was
significantly increased in the cultured cells (by 1.9 to 9.1-fold) compared to their cognate
tumors (paired Student’s t-test p value < 0.05). This site was shown to be downstream of
interferon α signaling (203). Also, Tyk2 protein itself was reportedly involved in the
signaling of cytokines such as interferon and IL-6 (204-206). The fact that Tyk2 pY292
was lower in the tumors suggested a tumor suppressing role for this phosphorylation.
Consistently, enhanced tumor growth and metastasis of breast cancer cells were observed
in Tyk2(-/-) mice (207). These data support a negative regulatory role for Tyk2 pY292 in
MM tumor growth, conceivably by down-regulating signaling of cytokines.
My correlation heatmaps showed distinctive regulation hotspots where subsets of
pY sites were highly positively correlated with sub-groups of enzymes (Figure 2.6).
These data show that there may be hubs of independent pY-mediated protein networks in
MM. Consistently, past studies indicate that distinct pY-signaling pathways may
individually contribute to MM cell survival. Particularly, while knocking-down or
activating one pathway did not seem to impact another pathway, silencing of at least two
pathways were required to severely reduce cell viability (28, 160, 172). These
observations suggest redundant pY signaling in MM that must be individually addressed

52
in order to achieve a therapeutic benefit. These redundant and non-overlapping pY
signaling networks may be captured by the regulation hotspots in the correlation
heatmaps. For example, the kinases whose activating phosphorylation were highly
correlated, such as MAPK3, Src (or Yes, Fyn, Lck), and dual-specificity Y-
phosphorylation regulated kinase 1B (DYRK1B) in Box 1 and Lyn (or Hck), Abl1,
PTK2B, MAPK1, and HIPK2/3 in Box 3 (Table 2.3), could represent key enzymes of
separate pY signaling axes in MM that may share related functional consequences (i.e.
MM cell proliferation and survival), while the other proteins associated with the hotspots
may be interactors or effectors of the perspective pathways. Further experimentations
should be carried out to figure out the interplays among these proteins, which may help to
unravel the complex pY-mediated networks in MM. Moreover, the difference between
the pY-signaling networks in MM cells and tumors should be noted here, which was
demonstrated by the apparently different nature of the hotspots recognized in cells and
tumors (refer to Figure 2.6, Table 2.3).
Finally, protein pY in the diverse MM subtypes represented by the selected cell
lines is likely differentially regulated by different sets of enzymes. This is reflected by the
multi-component models generated by the PLSR approach: each component may
represent an axis of pY regulation that is maintained in a certain MM subtype. Consistent
with this notion, FGFR3 is highly implicated in the MM cells, whose activation variation
was able to explain 86.5% of the systemic pY variation, reflecting the significant role of
FGFR3 in t(4;14)-positive cell lines. Along that line, Src (or Yes, Fyn, Lck), which
correlated best with Component 2 in the same model, may be a key regulator of pY
signaling in t(4;14)-negative cell lines. Therefore, even enzymes correlated with the more
53
minor components can be explored for their potential roles in MM subtypes wherein a
driving mechanism was still unidentified.
In conclusion, I showed a strong correlation between the activated TKs/expressed
PTPs and the cellular protein pY levels, suggesting a systemic influence of the state of
these enzymes on protein pY homeostasis in MM, in support of the model proposed in
Figure 1.1. In particular, the TKs FGFR3, Ptk2, and Src (or Yes, Fyn, Lck) and PTPs
Ptpn1, Ptpn6, and Ptpn11 in cultured cells, as well as the TKs Src (or Yes, Fyn, Lck),
Abl1, and FGFR3 and PTPs Ptpn7, Ptpn9, Ptpn11, and Ptprg in xenograft tumors were
implicated in their perspective systems as best protein-predictors and potential key
regulators of cellular pY levels. My analysis also implied that the enzymatic regulation of
protein pY in MM likely contains hubs of independent networks, which may represent
individual axis of pY signaling pathways (Figure 2.6). Lastly, my data showed distinctive
differences between the pY networks of the cultured MM cell lines and their cognate
xenograft tumors, consistent with the previous demonstration that the tumor
microenvironment altered the characteristics of myeloma cells and supported tumor
growth, proliferation, and drug resistance (208). In sum, this proteomics study
demonstrated a novel approach for analyzing protein pY regulation by enzymes on the
systemic level, which generated valuable insights into the enzymatic regulation of pY in
MM.
54
2.8 Materials and Methods
Materials
For Western blotting, anti-Lyn rabbit antibody was from AbD Serotec (Oxford,
UK); FGFR3 (B-9) and β-actin (C-4) antibodies were from Santa Cruz Biotechnology
(Santa Cruz, CA); anti-phosphotyrosine antibody, clone 4G10 was from Merck Millipore
(Billerica, MA); p44/42 MAPK (Erk 1/2), IGF-1 receptor β, insulin receptor β (mouse),
phospho-p44/42 MAPK (Thr202/Tyr204), phospho-Src family (Tyr416), and phospho-
Lyn (Tyr508) antibodies were from Cell Signaling Technology (Danvers, MA).
Stabilized goat anti-rabbit and anti-mouse horseradish peroxidase (HRP) conjugated
antibodies were obtained from Thermo Fisher Scientific (Waltham, MA). Fluor-S
MultiImager for imaging and Laemmli Sample Buffer (2 x) were ordered from Bio-Rad
Laboratories (Hercules, CA). Iscove’s modified dulbecco’s medium (IMDM) was
ordered from Life Technologies (Paisley, Scotland). For immunoprecipitation (IP), anti-
pY antibody (anti-pTyr-100, PhosphoScan Kit) for phosphopeptide purification was from
Cell Signaling Technology. For MS analysis, dithiothreitol (DTT) and trypsin-TPCK (1
mg/mL) for protease digests were purchased from Cell Signaling Technology. C-18
powder (Fluka silica gel 100 C-18-Reversed-phase) for peptide desalting was ordered
from Fluka Sigma Aldrich. Sep-Pak Classic C18 Cartridge for peptide purification were
purchased from Waters (Milford, MA). All other chemical reagents were purchased from
Sigma Aldrich, and aqueous solutions were prepared using Milli-Q grade water (Merck
Millipore).
Cell lines, Cell Culture and Xenograft Tumor
55
Human MM cell lines were maintained in IMDM medium, supplemented with 5%
fetal bovine serum (FBS). To obtain xenograft tumors, four to eight week old male
NOD/SCID (Nonobese diabetic/severe combined immune deficiency) mice were
inoculated subcutaneously over the two shoulders and two hips with 107 MM cells in 200
µL 50% matrigel basement membrane matrix (DB, Franklin Lakes, NJ) at each site. The
animal was sacrificed when tumors reached 1 cm. The harvested tumors were
immediately frozen on dry ice and stored at -80 °C until usage.
Non-Denaturing Cell and Tissue Lysis
To obtain non-denatured whole cell lysates, cultured MM cells were pelletted by
centrifugation (1 000 x g, 4 °C, 5 min), washed once with phosphate buffered saline (PBS)
pH 7, resuspended in NP-40 cell lysis buffer (50 mM Tris-HCl pH 8, 150 mM NaCl, 1%
NP-40, with 1.5 µM aprotinin, 20 µM leupeptin, and 0.4 mM AEBSF) at 250-300 µL
buffer per 107 cells, and inverted at 4°C for 30 min. For MM xenograft tumors, the tumor
tissue was homogenized in 0.5-1 mL NP-40 cell lysis buffer at room temperature (rt),
then mixed at 4 °C for 30 min. The lysates were centrifuged (15 000 x g, 4 °C, 10 min) to
remove non-soluble materials. Protein concentrations were obtained by Pierce BCA
protein assay (Pierce Thermo Scientific).
Denaturing Cell and Tissue Lysis
MM cells pelleted by centrifugation (1 000 x g, 5 min) were sonicated in urea lysis
buffer (20 mM HEPES pH 8, 9 M urea, 1 mM Na3VO4, 2.5 mM sodium pyrophosphate,
1 mM β-glycerophosphate) and inverted at 4°C for 30 min. For xenograft tumors, the
MM tumors were briefly homogenized in urea lysis buffer and inverted (4°C, 30 min).
56
The lysates were cleared by centrifugation (15 000 x g, 4 °C, 10 min) and the cleared
supernatant was subjected to trypsin digestion.
In Vitro Deglycosylation of Receptor Tyrosine Kinases
A total of 14 µg whole cell lysate proteins (see Non-Denaturing Cell and Tissue
Lysis) were diluted 1:5 into 10 µl Glycoprotein Denaturing Buffer (BioLabs) and heated
at 100 °C for 10 min for denaturation. The heated proteins were incubated with 1 µl
PNGase F or Endo H (both at 500,000 U/ml) at 37 °C for 1 h. An equal volume of 2 x
Laemmli Sample Buffer was added to stop the reaction and for subsequent analysis by
Western. A negative control was similarly prepared without the addition of PNGase F or
Endo H.
Western Blotting
Proteins separated by SDS-PAGE were electrophoretically transferred to an
Immobilon-P membrane (Millipore), which was blocked in 5% BSA with shaking (rt, 1
h), incubated first with the specified primary antibody in 1% BSA (4 °C, overnight), and
then with HRP conjugated antibody in 1% BSA (diluted 1:5000 from 1 mg/ml stock; rt, 1
h). Three washes in Tris buffered saline (TBS) supplemented with 1% Tween were
performed after each antibody incubation. The membrane was detected using Immun-Star
WesternC Kit (Bio-Rad Laboratories) by manufacturer’s protocol and imaged on film
(Clonex) or in the Fluor-S MultiImager (Bio-Rad Laboratories) for relative protein
quantifications.
Protein Digestion by Trypsin
57
Proteins dissolved in buffer were reduced by adding DTT to a final concentration of
20 mM (rt, 1 h), and then alkylated by adding iodoacetamide to a final concentration of
40 mM (rt, 30 min in the dark). A total of 2% trypsin (w/w) was added and the protein
solution was rotated (rt, overnight) to ensure complete digestion. For analysis by MS, the
tryptic peptides were further subjected to peptide desalting.
Peptide Desalting
For purification of 1-10 mg peptides, peptide containing solution was acidified to a
final concentration of 1% TFA and loaded onto a Sep-Pak Classic C18 Cartridge, pre-
conditioned with 5 ml 100% acetonitrile and 7 ml 0.1% TFA. The cartridge was washed
with 12 mL 0.1% TFA (in 1 ml, 5 ml, and 6 ml installments) and eluted serially with 10%,
20%, 30%, and 40% acetonitrile in 0.1% TFA (1.4 ml each). The eluate was frozen on
dry ice and lyophilized (rt, 48 h).
Enrichment of Peptides by pY Antibody
Desalted peptides were dissolved in 100 µL IAP buffer (50 mM MOPS pH 7.2, 10
mM sodium phosphate, 50 mM NaCl) and mixed with 10 µL anti-pTyr-100 beads (4 °C,
overnight with inversion). The beads were washed three times in IAP buffer, twice in
PBS, and then eluted into 30 µL 0.15% TFA, which was analyzed by mass spectrometry.
Mass Spectrometry Analysis
For comprehensive pY and PTP profiling in MM, enriched peptides were resolved
by reverse-phase chromatography with an automated nanoliter-scale LC system (Easy-
nLC, Proxeon Biosystems A/S, Odense, Denmark), using a 0-35% gradient of HPLC
buffer A (0.1% formic acid in HPLC water) to HPLC buffer B (0.1% formic acid in
58
acetonitrile) on a homemade C-18 analytical column (75 mm × 12 cm × 6 µm tip;
Proxeon), over 120 min at a flow rate of 250 nL/min. The analytical column was coupled
with a Thermo-Fisher LTQ-Orbitrap mass spectrometer (Thermo Scientific) for data
acquisition. For the full MS scan, the target value was 3,000,000 with 120 ms maximum
injection time and 70,000 resolution at m/z 400; for MS/MS, the ion target value was
1,000,000, with 120 ms maximum injection time and 17,500 resolution at m/z 400.
MS/MS spectra were generated by collision-induced dissociation (CID) with 35%
collision energy and obtained in a data-dependent manner by automatically switching
between a full MS scan and up to 10 MS/MS scans. A dynamic ion mass exclusion list
was maintained with a 20 s time window to avoid repeated sequencing of the same ion.
Peptide Identification and Quantification based on Mass Spectrometry Data
For pY profiling in MM, MS/MS spectra were extracted by BioWorks version 3.3
(Thermo Fisher Scientific) and searched using SEQUEST (Thermo; version 27, rev. 12)
and X! Tandem (www.thegpm.org; version 2006.04.01.2), against the international
protein index (IPI) HUMAN database (v3.68, downloaded from
ftp.ebi.ac.uk/pub/databases/IPI, 87,061 protein entries), allowing 2 missed cleavages by
trypsin, with 0.5 Da fragment ion mass tolerance and 0.02 Da parent ion tolerance.
Cysteine carboxyamidomethylation (C+57.02146) was indicated as a fixed modification,
while phosphorylation of Ser/Thr/Tyr (STY+79.96633 Da) and oxidation of Met
(M+15.99491 Da) were indicated as variable modifications. The peptide identity was
validated manually in Scaffold software (version Scaffold-01_06_05, Proteome Software
Inc., Portland, OR) and only considered acceptable if with greater than 95.0% probability
as specified by the PeptideProphet (209) and ProteinProphet (210) algorithms. For
59
manual quantification of pY peptide by MS ion current intensity, the ion current
chromatograph peak of a peptide was extracted by specifying its m/z value in Xcalibur
(Thermo Fisher Scientific, Version 2.0.7 release) and was subjected to curve smoothing
with BoxCar set to 7. The integrated peak area of XIC was calculated using the Toggle
Peak Detection function in Xcalibur with default settings and was used as quantification
measure of the peptide. Out of 109 peptides, the XIC for 75 peptides (68%) were found in
both biological replicates and their derived quantification values were averaged across the
replicates.
Motif Analysis of pY Sites
Peptide sequences containing the 15 flanking residues before and after the central
pY site of the complement of 106 pY sites identified in MM samples were submitted to
an online software Seq2Logo (211) (http://www.cbs.dtu.dk/biotools/Seq2Logo/), which
generated sequence logos with the size of the letters proportionally to the corresponding
residue frequency.
Generation of Heatmaps Based on Peptide Quantifications
For MM and AML samples, the peptide intensities, extracted manually in Xcalibur
or by MaxQuant, respectively, were compared to the maximum intensities of
corresponding peptides and expressed in a range between 0 and 1. A z-score was
calculated for each quantified values (including zeros). For both MM and AML data,
unsupervised clustering was performed with Cluster 3.0 software (Version 2.11) (212).
All heatmaps were visualized and exported as image files by Java Treeview (Version
1.1.5r2; http://jtreeview.sourceforge.net/).

60
For correlation heatmap, Pearson correlation coefficients of PTP expression or TK
phosphorylation levels against the phosphorylation levels of the pY sites in five cell and
five tumor samples were calculated in Microsoft Office Excel 2003
(http://www.microsoft.com/en-ca/default.aspx). Unsupervised clustering and heatmap
generation was performed using Cluster 3.0 as described above.
Partial Least Squares Regression (PLSR) Analysis
PLSR analysis was performed with the R (version 2.13.0; http://www.r-project.org/)
package PLS (http://mevik.net/work/software/pls.html). Prior to the analysis, the
profiling data were filtered to remove the PTPs or pY sites with fewer than three
measurements across all the samples. The PLSR algorithm uses the PTP expression or
TK A-loop phosphorylation levels as a predictor matrix X, and attempts to predict the
variations in cellular pY, represented as the response matrix Y. It simultaneously
decomposes the predictor and response matrices into a common set of orthogonal factors
and specific loadings using the formula: X = TPT; Y = UCT ~= TBCT, where T is the
score matrix, P is the loading matrix, B is a diagonal matrix of regression weights, and C
is a weight matrix. T and U were chosen in such a way to maximize their covariance.
“Leave-one-out’’ cross-validation automatically determined the optimal number of
components to use for the prediction. The R source code is given below:
library("pls")
Y<-read.table("PREDICTOR MATRIX TABLE", header=TRUE, sep="\t",dec=".")
Y<-as.matrix(Y)
X<-read.table("RESPONSE MATRIX TABLE", header=TRUE, sep="\t",dec=".")
X<-as.matrix(X)

61
plsrresults<-plsr(Y ~ X,validation="LOO")
corrplot(plsrresults, comps=1:2, labels="names", cex=0.7, font=2)

62
Chapter 3 Comprehensive Analysis of Protein Phosphotyrosine
in Acute Myeloid Leukemia
The work described in this chapter was included in a manuscript entitled:
“Phospho-proteomic analysis of the protein-phosphotyrosine landscape in acute myeloid
leukemia”
Jiefei Tong1,8*, Mohamed Helmy6*, Florence M.G. Cavalli2,8*, Lily Jin3,8, Jonathan St-
Germain3,8, Robert Karisch4,7, Paul Taylor1,8, Mark Minden7, Michael D. Taylor2,5,8,
Benjamin G. Neel4,7, Gary D. Bader3,6, and Michael F. Moran1,3,7,8
The pY profile in AML samples was generated by Dr. Jiefei Tong1,8 (Figure 3.1 A) and
the PTP profile was generated by Rob Karisch4,7 and Dr. Jiefei Tong1,8 (Figure 3.2 A).
The bioinformatics analyses in this chapter were performed independently by Lily Jin.
1Program in Molecular Structure & Function, Hospital for Sick Children, Toronto. 2Program in Developmental & Stem Cell Biology and Arthur and Sonia Labatt Brain
Tumour Research Centre, Hospital for Sick Children, Toronto. 3Department of Molecular Genetics, University of Toronto. 4Departmet of Medical Biophysics, University of Toronto. 5Department of Laboratory Medicine and Pathobiology, University of Toronto. 6The Donnelly Centre, University of Toronto. 7Princess Margaret Cancer Centre, Toronto. 8Peter Gilgan Centre for Research and Learning, Hospital For Sick Children, 686 Bay
Street, Toronto, ON, M5G 0A4, Canada.
*Equal contributions were made by these authors.
63
3.1 Abstract
To further dissect the relationship between activated TKs, expressed PTPs, and the
cellular pY, 12 human primary AML samples were obtained. MS-based proteomics
analysis generated a quantitative pY profile for the 12 samples and a PTP expression
profile for a subset (eight out of 12) of the samples. A collection of 219 unique pY sites
and 16 PTPs were quantified. Co-variance analysis showed a high degree of
correspondence between TK activation/PTP expression levels and the cellular pY, which
also implicated a subset of TKs and PTPs in pY regulation in AML.
3.2 Introduction
Dysregulation of pY signaling networks is common in cancer cells and is frequently
linked to somatic mutations and altered enzymatic functions. This is exemplified by AML,
a myeloid cancer with heterogeneous disease pathology often relating to mutations in pY
signaling molecules (Section 1.1.3.2). Inhibiting aberrantly activated TKs in AML have
demonstrated promising therapeutic potentials, implying the importance of pY signaling
in AML (213). Moreover, profiling of phosphoproteins in AML by reverse-phase protein
arrays defined protein signature groups that correlated with response and survival,
suggesting that AML may be stratified into prognostic groups with distinct
phosphorylation networks (214). Monitoring the signaling responses of single AML
cancer cells by multiparameter flow cytometry suggests extensive remodeling of the
signaling network at the single-cell level (215). These data provide a rationale for
performing proteomics studies and elucidating the molecular wirings of pY signaling in
AML.
64
The reciprocal actions of TKs and PTPs constitute important steps of pY regulation.
Given the critical relationships between pY signaling and cancer (7, 8, 24, 200) (Section
1.1), it is unsurprising that a number of TKs and PTPs are highly implicated in human
malignancies: TKs are well-established targets in neoplastic disorders and 37 PTPs were
linked to cancer with approximately half described as oncoproteins and the other half as
tumor suppressors (31). Flt3 with ITD mutation and Pptn11 are well-known positive
drivers and prognostic indicators in AML (Section 1.1.3.2). Additionally, distinct pY
patterns in primary samples and cell lines (214-216) and changes in PTP expressions (217)
have been reported for AML. These data combined with the demonstration that PTP
expression profiles affect cellular pY (151) make a curious case that how the activated
TKs and expressed PTPs impact cellular pY in AML. A model depicted in Figure 1.1 was
examined in this study using AML primary samples.
Twelve human AML primary samples were obtained and analyzed by MS (patient
information given in Table 3.1). Based on the MS analysis, quantitative pY profiles were
produced for the 12 samples; due to sample limitation, PTP profiles were only generated
for eight of the 12 samples. Integrated analysis of the pY and PTP profiles revealed
interesting insights into the pY-TK-PTP interplay and implicated a number of PTPs and
TKs in AML.
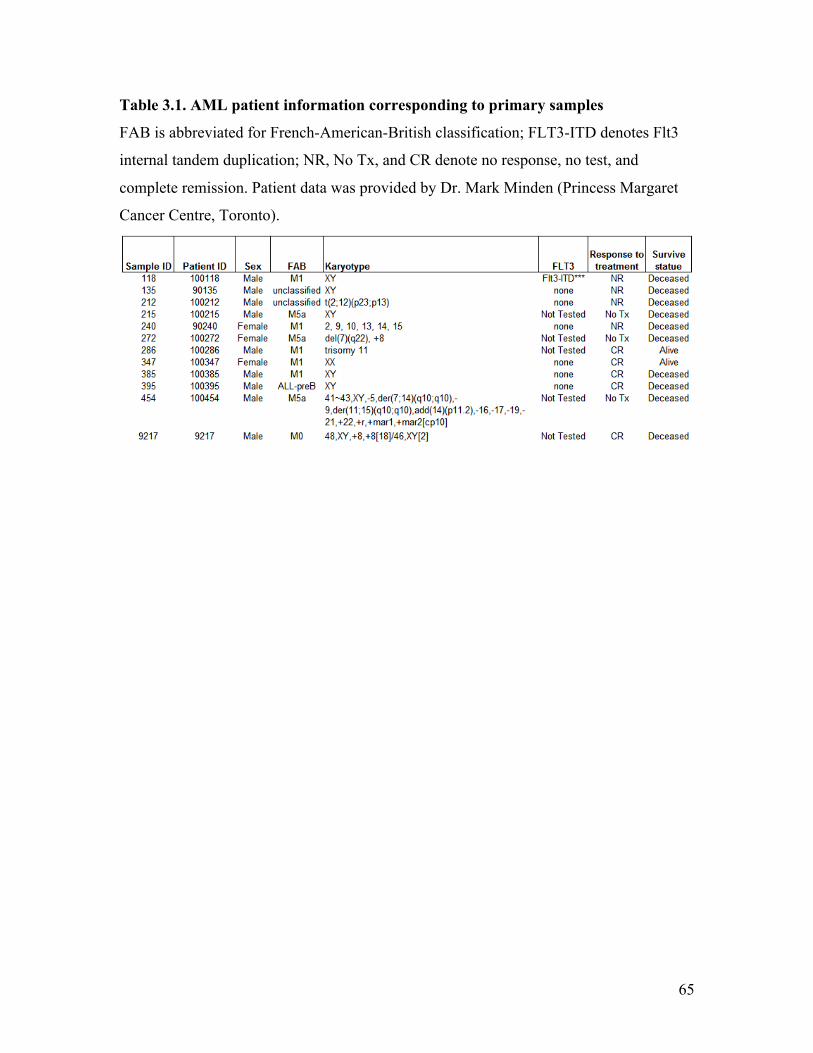
65
Table 3.1. AML patient information corresponding to primary samples
FAB is abbreviated for French-American-British classification; FLT3-ITD denotes Flt3
internal tandem duplication; NR, No Tx, and CR denote no response, no test, and
complete remission. Patient data was provided by Dr. Mark Minden (Princess Margaret
Cancer Centre, Toronto).
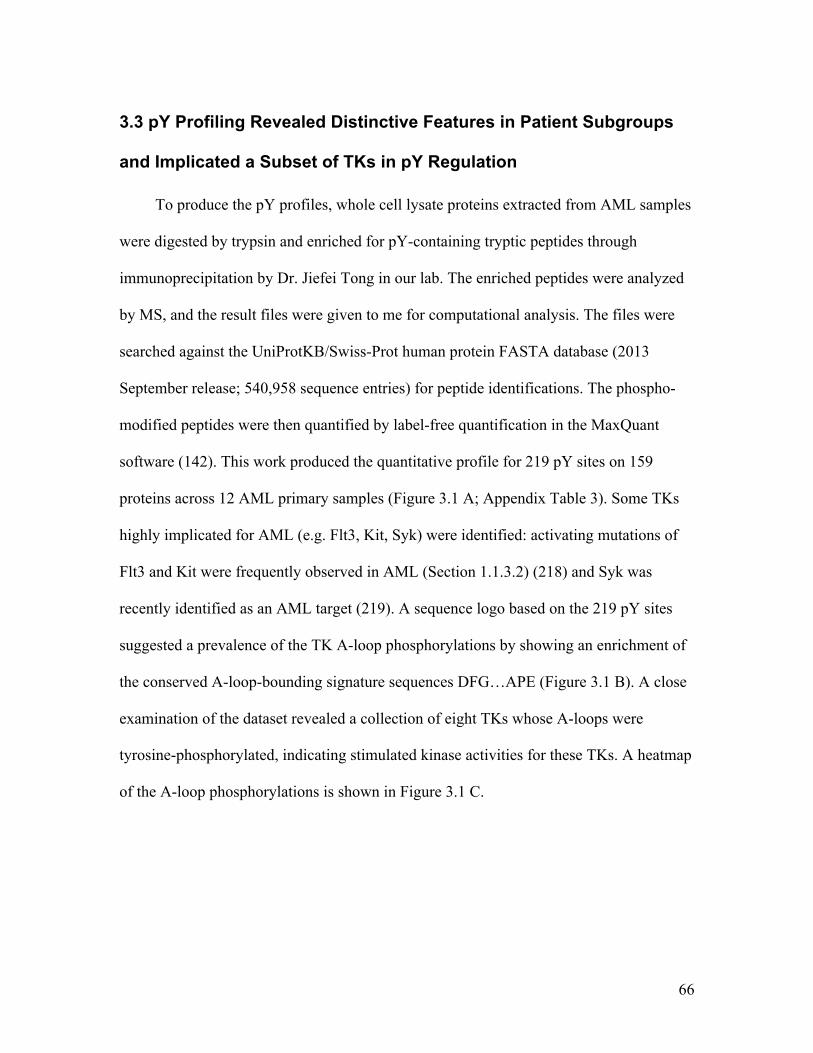
66
3.3 pY Profiling Revealed Distinctive Features in Patient Subgroups
and Implicated a Subset of TKs in pY Regulation
To produce the pY profiles, whole cell lysate proteins extracted from AML samples
were digested by trypsin and enriched for pY-containing tryptic peptides through
immunoprecipitation by Dr. Jiefei Tong in our lab. The enriched peptides were analyzed
by MS, and the result files were given to me for computational analysis. The files were
searched against the UniProtKB/Swiss-Prot human protein FASTA database (2013
September release; 540,958 sequence entries) for peptide identifications. The phospho-
modified peptides were then quantified by label-free quantification in the MaxQuant
software (142). This work produced the quantitative profile for 219 pY sites on 159
proteins across 12 AML primary samples (Figure 3.1 A; Appendix Table 3). Some TKs
highly implicated for AML (e.g. Flt3, Kit, Syk) were identified: activating mutations of
Flt3 and Kit were frequently observed in AML (Section 1.1.3.2) (218) and Syk was
recently identified as an AML target (219). A sequence logo based on the 219 pY sites
suggested a prevalence of the TK A-loop phosphorylations by showing an enrichment of
the conserved A-loop-bounding signature sequences DFG…APE (Figure 3.1 B). A close
examination of the dataset revealed a collection of eight TKs whose A-loops were
tyrosine-phosphorylated, indicating stimulated kinase activities for these TKs. A heatmap
of the A-loop phosphorylations is shown in Figure 3.1 C.
67
Figure 3.1. Characterization of pY in AML primary samples
A, a heatmap showing unsupervised hierarchical clustering based on the quantitative pY
profile in AML, with sample IDs labelled on top. B, sequence logo showing the
abundance of surrounding residues (corresponding to the sizes of letters) of 219 pY sites
identified in AML. The conserved A-loop-bounding sequences are highlighted in red. B,
a heatmap showing unsupervised hierarchical clustering based on TK A-loop
phosphorylations. The z-scores of the quantification values of each peptide across the
AML samples were used. Alternative proteins containing the same tryptic peptide
sequence are given in brackets. D, Bar graphs of the summed MS signal intensities of the
complement of cellular pY-containing peptides (top) and TK A-loop-derived
phosphopeptides (bottom). A Pearson’s correlation coefficient summarizing the
relationship between the top and bottom graphs is shown. ****p<0.0001.
A
Kinase Site
B
C
Group 1 Group 2
D Pearson’s coefficient=0.94****
68
Unsupervised hierarchical clustering based on either the total pY or TK A-loop
phosphorylations separated the AML samples into two groups (p < 0.01): generally a
group with high phosphorylations and a group with low phosphorylations. For pY-based
clusters (Figure 3.1 A), the low-phosphorylation group (Group 1) contained seven
samples, all of which had low TK A-loop phosphorylations (Figure 3.1 C and D; sample
IDs: 240, 385, 347, 286, 454, 395, 118). Comparatively, the high-phosphorylation group
(Group 2), which comprised five samples, had relatively highly phosphorylated TK A-
loops (Figure 3.1 C and D; sample IDs: 9217, 215, 272, 135, 212). Consistent with this, a
correlation heatmap of TK phosphorylation levels against 219 cellular pY sites showed a
largely positive relationship (Figure 3.2 B; judged by the overwhelming red color in TK-
associated lanes). Moreover, the Pearson correlation coefficient between the total MS
signals generated by the complement of pY peptides (containing 219 pY sites) and TK A-
loop-derived phosphopeptides was calculated to be 0.94 (p < 0.00001) (Figure 3.1 D).
These data show that TK A-loop phosphorylations positively correspond with the levels
of cellular pY.
The eight TKs identified in the AML samples were clustered into two groups based
on their A-loop phosphorylation levels (Figure 3.1 C): a group of five TKs (Btk, Fes, Tec,
Syk, and Fgr) that are generally highly phosphorylated in the high phosphorylation group
and a group of three TKs (Abl2, Lyn, and Lck) whose A-loop phosphorylation is
generally low except in one patient (sample ID: 9127). This type of grouping scheme was
reproduced in the correlation-based cluster where the groups of five and three TKs were
included in Groups B and A (Figure 3.2 B) of the TK-associated clusters, respectively.
These data further demonstrate a correspondence between cellular pY and TKs:
69
subgroups of TKs may be upstream of distinctive sets of pY sites and modulate pY
through distinct pathways. Boxes 4 and 5 in Figure 8 B highlight regions of intense
positive correlation where pY sites (listed in Table 3.2) are positively correlated with
clusters of phosphorylated TKs. These regions suggest a relationship in which the
implicated TKs are potential upstream regulators of the associated pY sites.
Taken together, these data indicate that TK activation/phosphorylation may
positively regulate the cellular pY levels. They also showed that distinctive pY features,
namely high or low overall phosphorylations, were associated with subgroups of AML
patients.
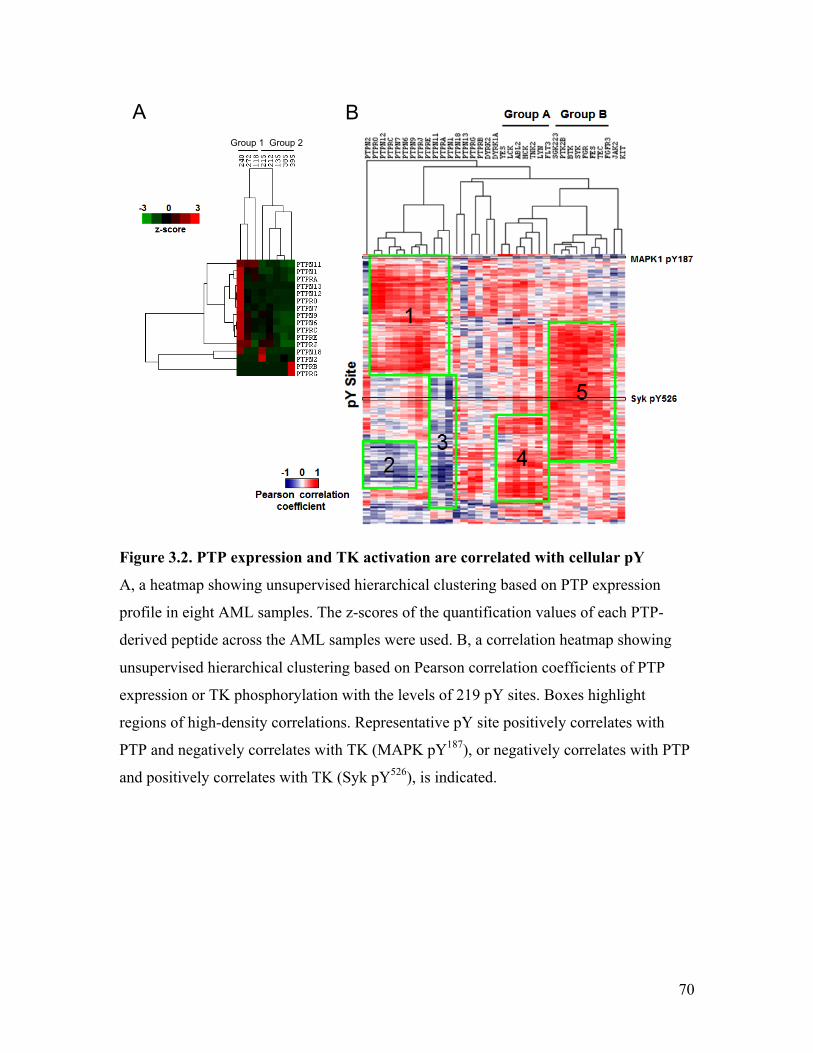
70
Figure 3.2. PTP expression and TK activation are correlated with cellular pY
A, a heatmap showing unsupervised hierarchical clustering based on PTP expression
profile in eight AML samples. The z-scores of the quantification values of each PTP-
derived peptide across the AML samples were used. B, a correlation heatmap showing
unsupervised hierarchical clustering based on Pearson correlation coefficients of PTP
expression or TK phosphorylation with the levels of 219 pY sites. Boxes highlight
regions of high-density correlations. Representative pY site positively correlates with
PTP and negatively correlates with TK (MAPK pY187), or negatively correlates with PTP
and positively correlates with TK (Syk pY526), is indicated.
B A Group 1 Group 2
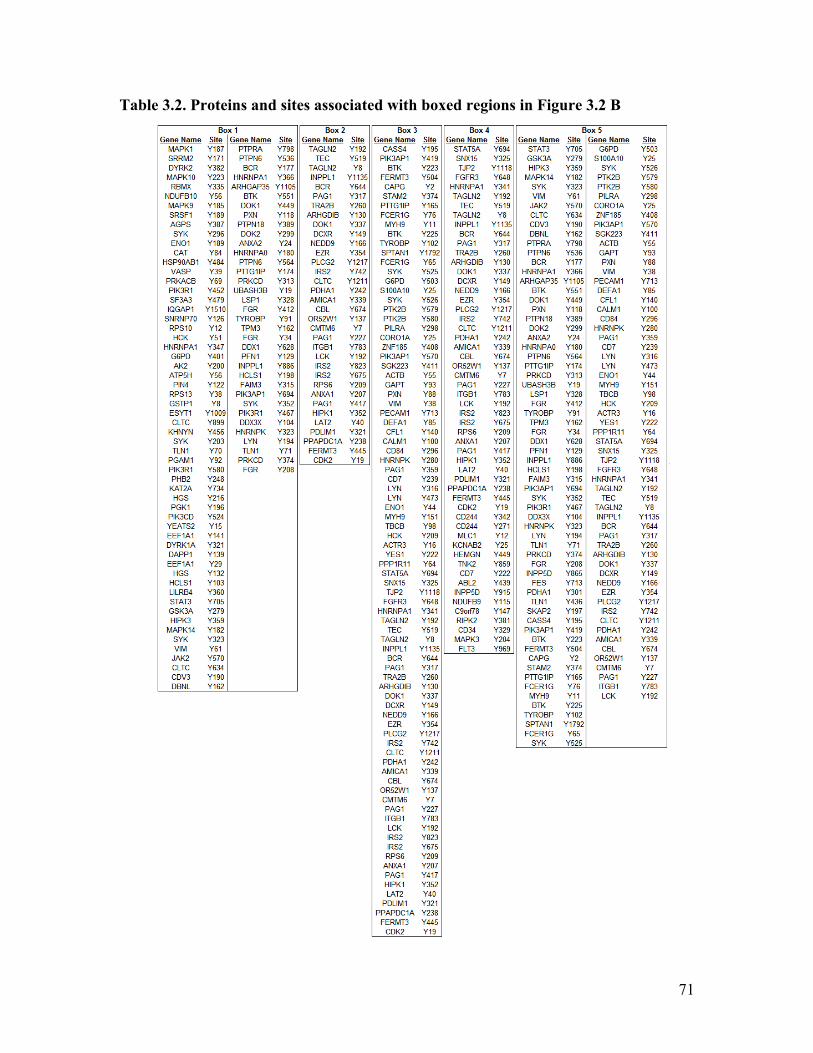
71
Table 3.2. Proteins and sites associated with boxed regions in Figure 3.2 B

72
Next, to quantitatively define the relationship between activated TKs and the
cellular pY, a PLSR analysis was performed. The algorithm automatically determined an
eight-component model that was able to predict 100% of variations of cellular pY based
on TK A-loop phosphorylation levels (as an indicator of TK activation), with the first
three components predicting 85.6% of the variations collectively. Figure 3.3 A shows the
correlation plot of TK A-loop phosphorylations with Components 1 and 2. As shown,
Syk, Fes, and Fgr correlated best with Component 1, predicting 46% of cellular pY
variations, and Abl2 and Lck (or Src, Yes, or Fyn that share the same A-loop tryptic
peptide sequence as Lck) correlated best with Component 2, predicting 29% of pY
variations. Notably, Syk, Fes, and Fgr belong to the collection of five TKs whose A-loops
are generally highly phosphorylated in the high phosphorylation group of patient samples;
and Abl2 and Lck belong to the class of three TKs that generally have low
phosphorylations in all the samples. These data indicate that two major axis of pY
regulation by different sets of TKs may be present; therefore, different pY regulation
schemes may possibly define AML subtypes. This analysis also implicates the TKs Syk,
Fes, Fgr, Abl2, and Lck (or Src, Yes, Fyn) as major pY modulators in AML, whose
activation levels were able to collectively predict 75% of pY variations.
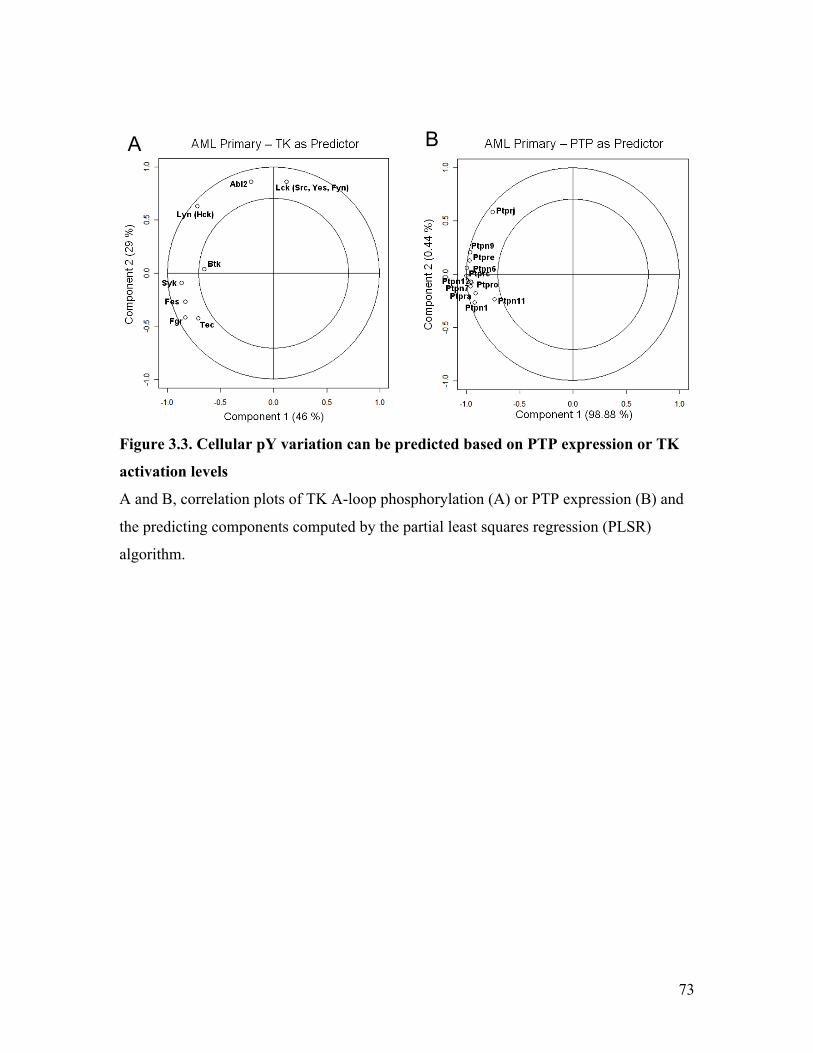
73
Figure 3.3. Cellular pY variation can be predicted based on PTP expression or TK
activation levels
A and B, correlation plots of TK A-loop phosphorylation (A) or PTP expression (B) and
the predicting components computed by the partial least squares regression (PLSR)
algorithm.
A B
74
3.4 Integrated Analysis of PTP Expression and Cellular pY Implicated
PTPs in AML pY Regulation
To gain a comprehensive overview of pY regulation in AML, the TK antagonist
enzyme PTPs were quantitatively analyzed in eight AML samples (a subset of the 12
primary samples). An expression profile of the entire collection of classical PTPs (the
expressed PTPome) was generated by the MS-based qPTPome method (151), through the
combined effort of Rob Karisch (Ontario Cancer Institute, Toronto) and Dr. Jiefei Tong
in our lab. A total of 16 PTPs were shown to be expressed, for which a quantitative
profile was generated across the eight samples by label-free quantification in MS
(Appendix Table 4). The generated profiles were passed on to me for bioinformatics
analysis. Unsupervised hierarchical clustering based on the quantitative PTP expression
profiles distinguished two patient subgroups, with Group 1 containing three samples that
expressed relatively higher levels of PTP compared to Group 2, which comprised five
samples (Figure 3.2 A). The fact that this grouping of patients share little commonality
with the clustering of patients based on pY or TK A-loop phosphorylations (compare
Figure 3.2 A to Figure 3.1 A and C) shows that PTPs are not simply negative regulators
of cellular pY, but whose regulation of cellular pY involves a more complicated inter-
relation. To visualize the relationship between PTP expression and cellular pY levels, a
correlation heatmap was created. An integrated heatmap showing correlations between
TK phosphorylation/PTP expression and the levels of 219 pY sites is presented in Figure
3.2 B. Clusters of positive and negative correlations are highlighted by Boxes 1 to 5 and
the list of associated pY sites are given in Table 3.2. The pY sites showing positive
correlations with TKs and negative correlations with PTPs may be subjects of the net
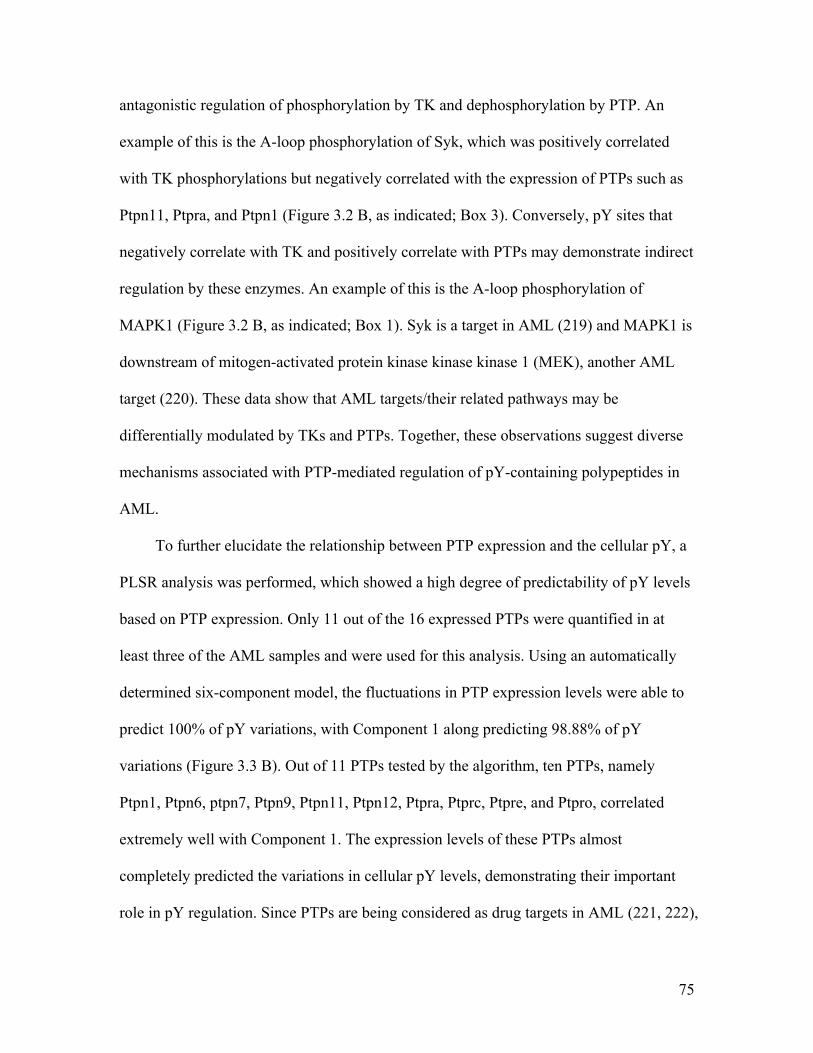
75
antagonistic regulation of phosphorylation by TK and dephosphorylation by PTP. An
example of this is the A-loop phosphorylation of Syk, which was positively correlated
with TK phosphorylations but negatively correlated with the expression of PTPs such as
Ptpn11, Ptpra, and Ptpn1 (Figure 3.2 B, as indicated; Box 3). Conversely, pY sites that
negatively correlate with TK and positively correlate with PTPs may demonstrate indirect
regulation by these enzymes. An example of this is the A-loop phosphorylation of
MAPK1 (Figure 3.2 B, as indicated; Box 1). Syk is a target in AML (219) and MAPK1 is
downstream of mitogen-activated protein kinase kinase kinase 1 (MEK), another AML
target (220). These data show that AML targets/their related pathways may be
differentially modulated by TKs and PTPs. Together, these observations suggest diverse
mechanisms associated with PTP-mediated regulation of pY-containing polypeptides in
AML.
To further elucidate the relationship between PTP expression and the cellular pY, a
PLSR analysis was performed, which showed a high degree of predictability of pY levels
based on PTP expression. Only 11 out of the 16 expressed PTPs were quantified in at
least three of the AML samples and were used for this analysis. Using an automatically
determined six-component model, the fluctuations in PTP expression levels were able to
predict 100% of pY variations, with Component 1 along predicting 98.88% of pY
variations (Figure 3.3 B). Out of 11 PTPs tested by the algorithm, ten PTPs, namely
Ptpn1, Ptpn6, ptpn7, Ptpn9, Ptpn11, Ptpn12, Ptpra, Ptprc, Ptpre, and Ptpro, correlated
extremely well with Component 1. The expression levels of these PTPs almost
completely predicted the variations in cellular pY levels, demonstrating their important
role in pY regulation. Since PTPs are being considered as drug targets in AML (221, 222),
76
this observation, combined with the previous notion that PTPs may modulate known
AML targets, builds up the rationale for targeting PTP in AML.
3.6 Discussion and Conclusion
Worldwide efforts have gone into defining genomic signatures for guiding the
development of personalized treatment for human cancers. This movement reflects the
acknowledgement that cancers frequently arise from genomic perturbations that change
gene dosage or function of the altered gene product (223). Prognostic gene expression
signatures were suggested for AML (224, 225); however, the utilization of cancer
genomics is limited in the clinic, partly due to a lack of supporting evidence and deep
mechanistic insights into the functions and interplay of various gene products suggested
by the signature (226). The low correspondence between mRNA levels and protein
abundances exacerbates the problem (227-230). To resolve the conundrum, proteomics
studies can be used to associate cancer gene products to functional consequences and
potentially to define cancer subclasses. Although identification of oncogenic signaling
pathways (231, 232)/therapeutic targets (233) and classification of cancer subtypes (234,
235) through phosphoproteomics have been demonstrated in the past, a relationship
between the total collection of cellular enzymes (i.e. TKs/PTPs) and phosphosites was
not comprehensively assessed until recently (151). Here I present the integrated analysis
of the expressed PTPs, activated TKs, and the cellular pY in 12 primary AML samples,
which shows a systemic impact of the expressed/activated enzymes on cellular pY sites
and provides novel insights into the collective regulation of pY by enzymes in AML.
The application of qPTPome combined with pY profiling, which showed a well-
correlated positive relationship between the expressed PTPome and the cellular pY, was
77
first demonstrated in MM cell lines (151). This analysis implicated Ptpn1, Ptpn6, and
Ptpn11 in MM cell pY regulation. The extended application of this method on MM
xenograft tumors showed a drastically different molecular relationship and implicated a
different set of PTPs in pY regulation in MM tumors (refer to Figure 2.5, compare B and
C), suggesting that different regulatory pathways through PTPs are utilized in
physiologically distinct systems. Consistent with this notion, the integrated analysis in
AML primary samples revealed features distinctive to that of MM and may be unique to
AML. Remarkably, the expression levels of ten out of the 11 PTPs tested by the PLSR
algorithm collectively predicted 98.88% of variations in cellular pY. This data implies a
high-degree of dependency for cellular pY on PTPs in AML, suggesting a significant role
of PTP in pY regulation. Since the dysregulation of pY is important for AML pathology
(Section 1.1.3.2), this observation provides a rationale for targeting PTPs in AML.
The ten PTPs implicated by PLSR analysis have all been connected to human
neoplasms. Besides Ptpn11, which is a well-established oncoprotein (62, 67), eight PTPs
(Ptpn1, Ptpn6, ptpn7, Ptpn9, Ptpn12, Ptpra, Ptprc, Ptpro) were reported as potential tumor
suppressors with four of these (Ptpn1, Ptpn6, Ptpn7, Ptpra) also described as potential
oncoproteins (31). Half of the PTPs were directly linked to AML: Ptpn11 is associated
with Flt3-ITD-induced proliferation in AML bone marrow progenitors and primary
samples (124), and the gain-of-function mutant of Ptpn11 was found in approximately
5% of AML cases (62). Genetic amplification of the PTPN7 gene was observed in a
subset of AML blasts (125). Moreover, the up-regulation (i.e. Ptprc, Ptpro) and
alternative splicing (i.e. Ptpn6) of PTP mRNAs in AML primary samples were reported
(217, 236). The tumor suppressor role of the PTPs was mainly attributed to their abilities
78
to down-regulate oncogenic pY signaling. For example, both Ptpn9 and Ptpn12 were
reported to negatively regulate HER2 and EFGR signaling in breast cancer cells (199,
237); and the over-expression of Ptprc led to reduced JAK/STAT-mediated cytokine-
induced signaling (238). Conversely, PTPs may be oncogenic through the stimulation of
the activation of Src or MAPK/AKT signaling pathways (i.e. Ptpra or Ptpn1, respectively)
(239-241). Probing into the functional mechanisms of the implicated PTPs in AML may
unveil key oncogenic pathways, identify disease markers, and find cancer-driving
enzymes that may facilitate therapeutic treatment of AML. Therefore, the approach
demonstrated in this study may serve as a screening methodology for identifying
candidate PTPs that may be targeted in AML.
The other side of pY regulation to PTP-mediated dephosphorylation is
phosphorylation by TKs. Indeed, my analysis of the 219 pY sites identified in AML
revealed a complement of eight TKs, whose increased activities are represented by the
phosphorylation of their activation loop tyrosines. These TKs demonstrate highly positive
correlations with the cellular pY levels (Figure 3.1 D and 3.2 B), and the variations in the
TK activation levels were able to collectively predict 75% of the variations in pY (Figure
3.2 D). These data indicate a major influence, albeit not as big as that of the PTPs, of the
activated TKs on cellular pY, and implicate five TKs, namely Syk, Fes, Fgr, Abl2, and
Lck (or Src, Yes, Fyn). Some of the implicated TKs (Abl2, Fgr, Lck, Src, Yes, Fyn) were
products of known oncogenes (24, 242) and Fes were shown to have both oncogenic and
tumor suppressing characteristics (243). Moreover, many of the TKs (Syk, Kit, Src, Lyn)
were reported as targets in AML (219, 244-247) with their oncogenic potentials possibly
imparted by their involvement downstream of key signaling pathways. In particular, Syk
79
and Fes are both involved downstream of Flt3 signaling associated with the Flt3-ITD
mutation (248, 249), and Syk was also downstream of mTOR proliferative signaling (219,
250). Additionally, Src promotes AML cell survival through STAT proteins (251) and
inhibition of Src and Kit kinases enhances targeting of AML stem cells by chemotherapy
(244). Furthermore, Fgr expression was related to early commitment and differentiation
events in the monocytic and granulocytic lineages of AML blasts (252), and Abl2 was
identified as a gene fusion partner of the ETV6/TEL oncogene in AML (253). Taken
together, these data are consistent with my discovery that these TKs may play important
roles in regulating cellular protein pY in AML on the systemic level. Therefore, this
study shows a generic approach for the discovery of candidate TKs as therapeutic targets
in cancer. This approach may also be useful for suggesting the responses of primary
AML tumors to TK inhibitors ex vivo.
The 12 AML samples were clustered into two groups based on cellular pY, a high
pY and a low pY group (Figure 3.1 A). The total level of pY seems to share a high
correlation with the total level of the TK activation in the system (Figure 3.1 D and 3.2 B).
These results suggest potential classification scheme based on cellular pY levels, which is
consistent with previous observation that phosphorylation signatures in AML can be used
to stratify patients into different prognostic groups (214).
In conclusion, the comprehensive analysis on 12 primary AML samples described
here demonstrates a systemic approach for assessing the influence of TKs/PTPs on
cellular pY. The TKs/PTPs implicated here may be critical for pY signaling in AML and
are candidate targets. Moreover, the results demonstrated in this chapter support the
model depicted in Figure 1.1 that describes cellular pY as a quantitative output of the

80
total expressed PTPs and activated TKs in the system. Therefore, this study, in addition to
the study on MM cell lines and xenografts (Chapter 2), provides another line of evidence
that TKs and PTPs systemically regulate the cellular collection of pY.
81
3.6 Materials and Methods
Materials
The sources of all materials used in this study are as specified in Section 2.8 under
“Materials”.
Patient Selection and Sample Preparation
PBMCs of diagnostic AML patient primary bone marrows were obtained from the
Princess Margaret Hospital leukemia repository, with REB approval. Cryopreserved
AML cell suspensions were stored in liquid nitrogen (2 x10⁷ cells per aliquot) until usage.
Denaturing Cell Lysis
Primary PBMCs from AML patients were sonicated in urea lysis buffer (20 mM
HEPES pH 8, 9 M urea, 1 mM Na3VO4, 2.5 mM sodium pyrophosphate, 1 mM β-
glycerophosphate) and inverted (4°C, 30 min). The non-soluble material was pelleted by
centrifugation (15,000 x g, 10 min) and the cleared supernatant was subjected to trypsin
digestion (see Section 2.8 Protein Digestion by Trypsin), peptide desalting (Section 2.8
Peptide Desalting), and anti-pY enrichment (Section 2.8 Enrichment of Peptides by pY
Antibody) prior to MS analysis.
Mass Spectrometry Analysis
For pY and PTP profiling in AML, the tryptic peptides were loaded onto a 50-cm
Easy-Spray column with a 75-µm inner diameter filled with 2 µm C18 resin (Thermo
Scientific), and eluted over 120 min at 250 nl/min in a 0 to 40% HPLC buffer A (0.1%
82
formic acid in HPLC water) to buffer B (0.1% formic acid in acetonitrile) gradient with
an EASY nLC 1000 chromatography system operating at 50 °C (Thermo Scientific),
which was connected through a nano-ESI set-up to a Q Exactive or Elite mass
spectrometer (Thermo Scientific). The resolution for MS and MS/MS scans and data
acquisition protocol were as described in Section 2.8 under “Mass Spectrometry
Analysis”.
Peptide Identification and Quantification based on Mass Spectrometry Data
For pY profiling in AML, the MS raw files were searched using the MaxQuant
software (142) (version 1.3.0.5; search engine: Andromeda). The peak list and peptide
identifications were obtained by using default parameters and minimum peptide length 5,
multiplicity 1, maximum charge 5, with carboxyamidomethylation (C+57.02146)
specified as fixed modification and oxidation (M+15.99491 Da), acetylation (protein N-
terminal+42.01056 Da), and phosphorylation (STY+79.96633 Da) as variable
modifications. The peak list was searched against the most recent UniProtKB/Swiss-Prot
human protein FASTA database (2013 September release; 540,958 sequence entries). For
PTP profiling data, carboxyamidomethylation (C+57.02146) and cysteine converting to
cysteic acid (C+47.9982) was used as variable modifications with no fixed modifications;
and the second peptide identification option was enabled in Andromeda. Modifications
on peptides were determined automatically by the software; and peptide/protein MS ion
current intensities as a measure of quantification was attained in MaxQuant using the
default parameters and selecting the “match between runs” and “label-free quantification”
options. The peptide levels were further normalized to the total peptide measurement by
BCA assay (Pierce; by following the manufacturer’s protocol).
83
Generation of Heatmaps Based on Peptide Quantifications
The log 2 MS ion current intensities, z-scores, and Pearson correlation coefficients,
as indicated by the heatmap legends, were calculated in Microsoft Office Excel 2003
(http://www.microsoft.com/en-ca/default.aspx). Unsupervised hierarchical clustering
were conducted by Cluster 3.0 and visualized by Java Treeview (Version 1.1.5r2;
http://jtreeview.sourceforge.net/).
Partial Least Squares Regression (PLSR) Analysis
For descriptions of the PLSR analysis, refer to Section 2.8 under “Partial Least
Squares Regression (PLSR) Analysis”.
84
Chapter 4 Determination of the Functional Consequences of
Tyrosine-Phosphorylation of the Lyn SH2 Domain
The work described in this chapter has been published as:
Lily Jin,1,4,* Leanne Wybenga-Groot,2,3,* Jiefei Tong,1 Paul Taylor,1 Mark Minden,5,6
Suzanne Trudel,5,6 C. Jane McGlade,2,3,5 and Michael F. Moran1,4,6 (2015) Tyrosine
phosphorylation of the Lyn SH2 domain modulates its binding affinity and specificity.
Mol Cell Proteomics. 14(3):695-706.
The pY profiles in primary AML and chronic lymphocytic leukemia samples were
generated by Dr. Jiefei Tong1,4,6. The protocol for purification of phosphorylated or
unphosphorylated Lyn SH2 domain was developed with the help of Dr. Jiefei Tong1,4,6
and Dr. Leanne Wybenga-Groot,2,3. All other experiments and computational analyses in
this chapter were performed by Lily Jin.
Programs in 1Molecular Structure and Function and 2Cell Biology, and 3The Arthur and
Sonia Labatt Brain Tumour Research Centre, The Hospital For Sick Children, 686 Bay
Street, Toronto, M5G 0A4, Canada
Departments of 4Molecular Genetics and 5Medical Biophysics, University of Toronto 6Princess Margaret Cancer Center, 610 University Avenue, M5G 2M9, Toronto, Canada
85
4.1 Abstract
SH2 domains bind pY-containing polypeptides and modulate cellular functions by
directing protein-protein interactions. Proteomics analysis conducted in our lab showed
frequent phosphorylation of SFK SH2 domains in blood system cancers such as AML,
chronic lymphocytic leukemia (CLL), and MM. To understand the functional impact of
SH2 domain phosphorylation, I carried out biochemical analysis using the SFK Lyn SH2
domain as a model and found that phosphorylation of the conserved residue Y194 alters
the affinity and specificity of Lyn SH2 domain to pY-containing proteins/peptides.
Analysis of the preferred binding motifs revealed a change in specificity of the SH2
domain for the pY+2/+3 residue of the ligand. These results present another layer of
regulation wherein protein-protein binding through SH2 domains is regulated by
upstream SH2 TKs and PTPs.
4.2 Introduction
SH2 domains are modular functional units of a protein that recognize specific pY-
containing motifs. They are found in various signaling molecules and are important for
signal transduction due to their ability to mediate protein-protein interactions (Section
1.1.1.4). Given the reversible nature of protein tyrosine phosphorylation (3), the
interactions of SH2 domains to pY-containing molecules are inherently dynamic,
comprising key steps through which the signaling networks within a cell are controlled
and regulated. In addition to binding proteins in trans, SH2 domains participate in
intramolecular interactions, with one example being the auto-regulation of SFKs (Section
1.1.1.2). Therefore, SH2 domains regulate signaling enzymes and are indispensible for
86
mediating signal transduction in response to extracellular stimuli. The structure of SH2
domains consists of conserved antiparallel β-sheets and two α-helices, which form
variable binding surfaces that recognize different pY motifs (Section 1.1.1.4.1). For SFKs,
the SH2 domains were found to bind most tightly to sequences containing the pYEEI
motif, in which the hydrophobic pY+3 residue inserts into a hydrophobic pocket bounded
by residues of the EF and BG loops; altering these residues can lead to changes in
substrate selectivity for the SFK SH2 domains (51-53). In addition to binding pY-
containing polypeptides, SH2 domains themselves can be phosphorylated (54-56), which
appeared to be a general mechanism for modulating the binding properties of SH2
domains. Here, I report the frequent phosphorylations of a conserved tyrosine within SFK
SH2 domains in the haematopoietic cancers AML, CLL, and MM, as well as other
cancers. In vitro binding studies using Lyn SH2 domain as a model indicate that this
phosphorylation affects phosphoprotein and phosphopeptide binding to Lyn SH2 domain.
These results suggest that SH2 domain phosphorylation may be a general mechanism for
modulating SFK functions and may constitute an additional layer in the regulation of pY-
mediated signaling.
4.3 A Conserved Tyrosine in SFK SH2 Domains Is Phosphorylated in
Cancer Samples and Cancer-Derived Cell Lines
To identify sites of protein tyrosine phosphorylations, the pY profiles for 12
primary AML (See Chapter 3) and five Revlimid-treated CLL patient samples were
generated. From these data, I observed that Lyn Y194, or the equivalent Hck Y209 and Lck
Y192, were phosphorylated in 11 out of the 12 AML samples (Figure 4.1 A). Moreover,
Lyn Y194, Lck Y192, or their equivalents Fgr Y209 or Blk Y188, were phosphorylated in five
87
CLL samples (Figure 4.1 B). Consistent with these results, published phosphoproteomic
studies reported the phosphorylation of Lyn Y194 or its equivalent SFK residues in non-
small cell lung cancer (NSCLC) cell lines and tumors, breast cancer specimens, and in
the cell lines of chronic myeloid leukemia (175, 254, 255). Together, these results show
that phosphorylation of Y194 in the SH2 domain of Lyn, or its equivalent in SFK family
members, is frequent in cancer and cancer-derived cell lines.
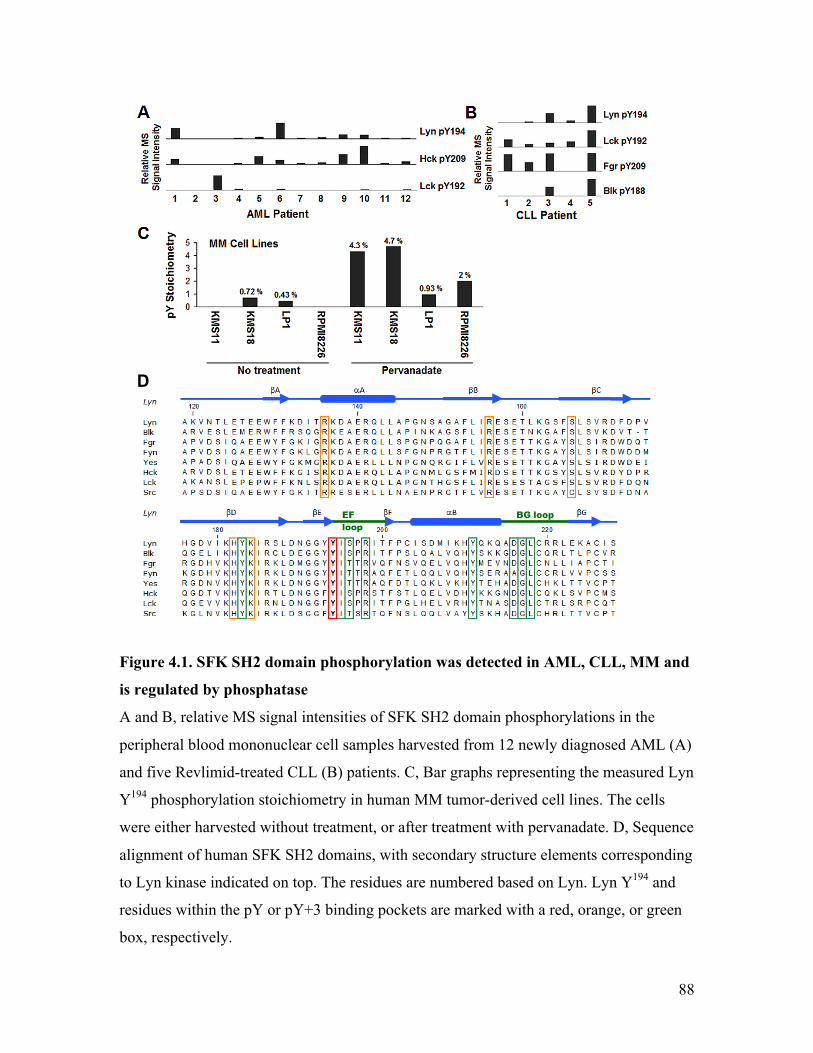
88
Figure 4.1. SFK SH2 domain phosphorylation was detected in AML, CLL, MM and
is regulated by phosphatase
A and B, relative MS signal intensities of SFK SH2 domain phosphorylations in the
peripheral blood mononuclear cell samples harvested from 12 newly diagnosed AML (A)
and five Revlimid-treated CLL (B) patients. C, Bar graphs representing the measured Lyn
Y194 phosphorylation stoichiometry in human MM tumor-derived cell lines. The cells
were either harvested without treatment, or after treatment with pervanadate. D, Sequence
alignment of human SFK SH2 domains, with secondary structure elements corresponding
to Lyn kinase indicated on top. The residues are numbered based on Lyn. Lyn Y194 and
residues within the pY or pY+3 binding pockets are marked with a red, orange, or green
box, respectively.
D
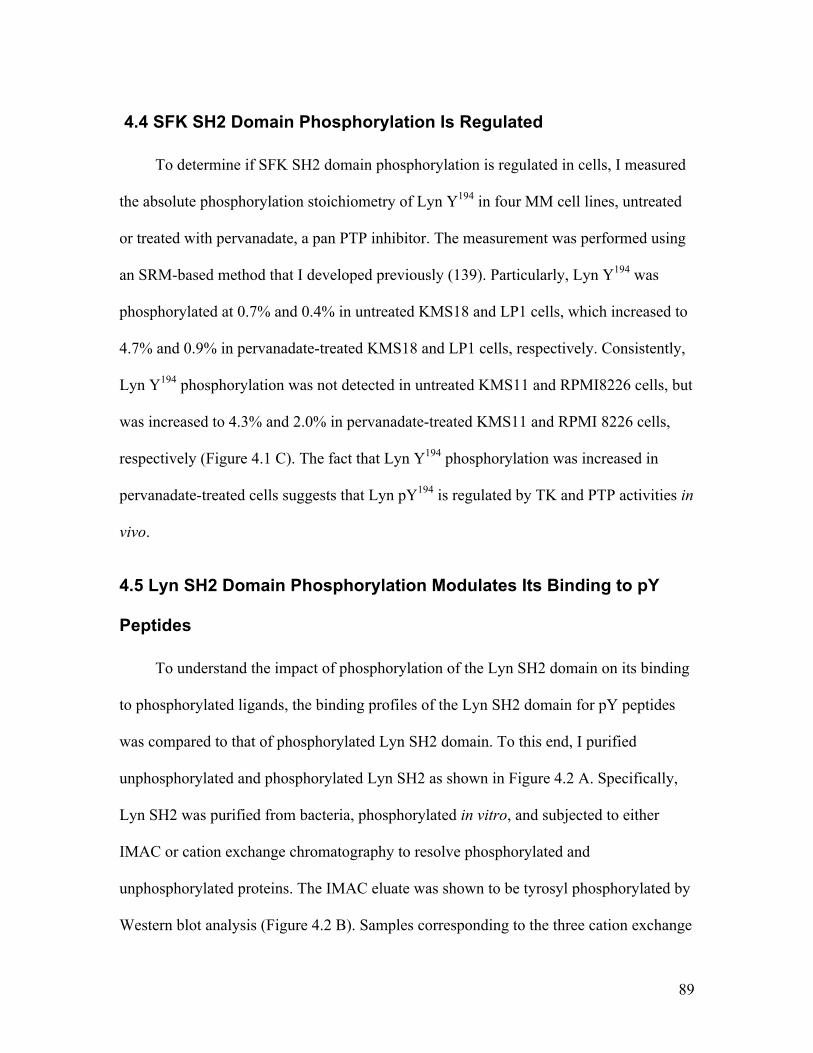
89
4.4 SFK SH2 Domain Phosphorylation Is Regulated
To determine if SFK SH2 domain phosphorylation is regulated in cells, I measured
the absolute phosphorylation stoichiometry of Lyn Y194 in four MM cell lines, untreated
or treated with pervanadate, a pan PTP inhibitor. The measurement was performed using
an SRM-based method that I developed previously (139). Particularly, Lyn Y194 was
phosphorylated at 0.7% and 0.4% in untreated KMS18 and LP1 cells, which increased to
4.7% and 0.9% in pervanadate-treated KMS18 and LP1 cells, respectively. Consistently,
Lyn Y194 phosphorylation was not detected in untreated KMS11 and RPMI8226 cells, but
was increased to 4.3% and 2.0% in pervanadate-treated KMS11 and RPMI 8226 cells,
respectively (Figure 4.1 C). The fact that Lyn Y194 phosphorylation was increased in
pervanadate-treated cells suggests that Lyn pY194 is regulated by TK and PTP activities in
vivo.
4.5 Lyn SH2 Domain Phosphorylation Modulates Its Binding to pY
Peptides
To understand the impact of phosphorylation of the Lyn SH2 domain on its binding
to phosphorylated ligands, the binding profiles of the Lyn SH2 domain for pY peptides
was compared to that of phosphorylated Lyn SH2 domain. To this end, I purified
unphosphorylated and phosphorylated Lyn SH2 as shown in Figure 4.2 A. Specifically,
Lyn SH2 was purified from bacteria, phosphorylated in vitro, and subjected to either
IMAC or cation exchange chromatography to resolve phosphorylated and
unphosphorylated proteins. The IMAC eluate was shown to be tyrosyl phosphorylated by
Western blot analysis (Figure 4.2 B). Samples corresponding to the three cation exchange
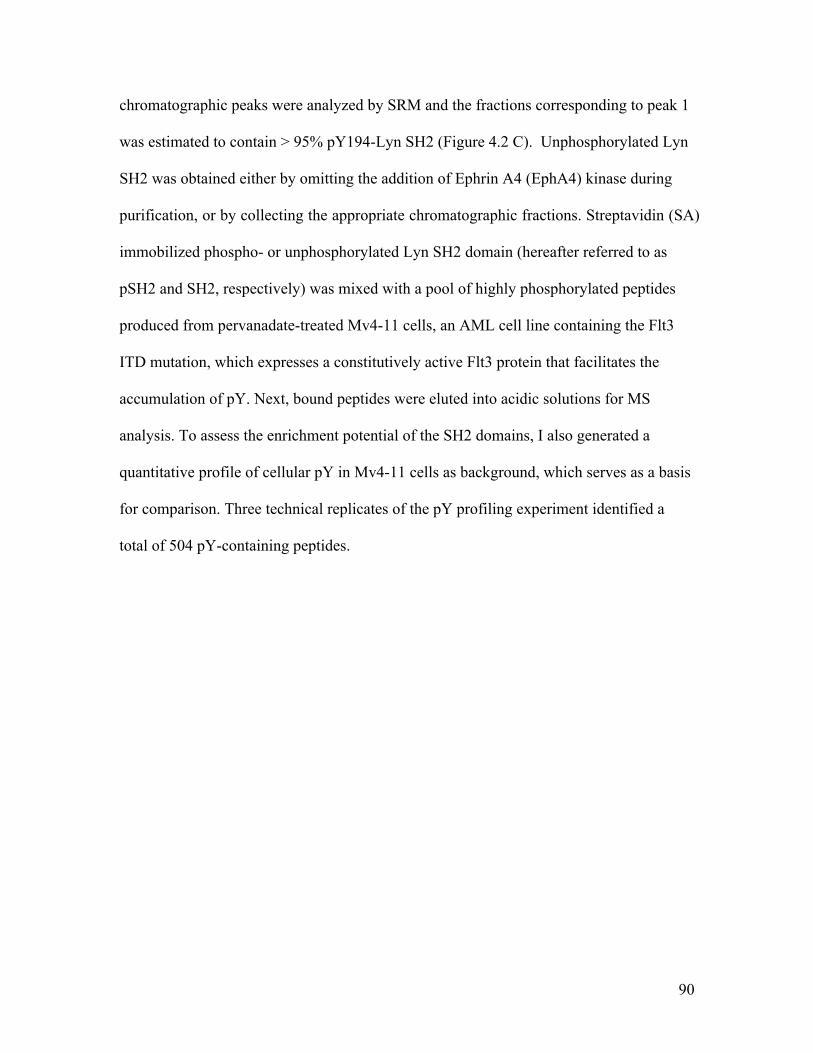
90
chromatographic peaks were analyzed by SRM and the fractions corresponding to peak 1
was estimated to contain > 95% pY194-Lyn SH2 (Figure 4.2 C). Unphosphorylated Lyn
SH2 was obtained either by omitting the addition of Ephrin A4 (EphA4) kinase during
purification, or by collecting the appropriate chromatographic fractions. Streptavidin (SA)
immobilized phospho- or unphosphorylated Lyn SH2 domain (hereafter referred to as
pSH2 and SH2, respectively) was mixed with a pool of highly phosphorylated peptides
produced from pervanadate-treated Mv4-11 cells, an AML cell line containing the Flt3
ITD mutation, which expresses a constitutively active Flt3 protein that facilitates the
accumulation of pY. Next, bound peptides were eluted into acidic solutions for MS
analysis. To assess the enrichment potential of the SH2 domains, I also generated a
quantitative profile of cellular pY in Mv4-11 cells as background, which serves as a basis
for comparison. Three technical replicates of the pY profiling experiment identified a
total of 504 pY-containing peptides.
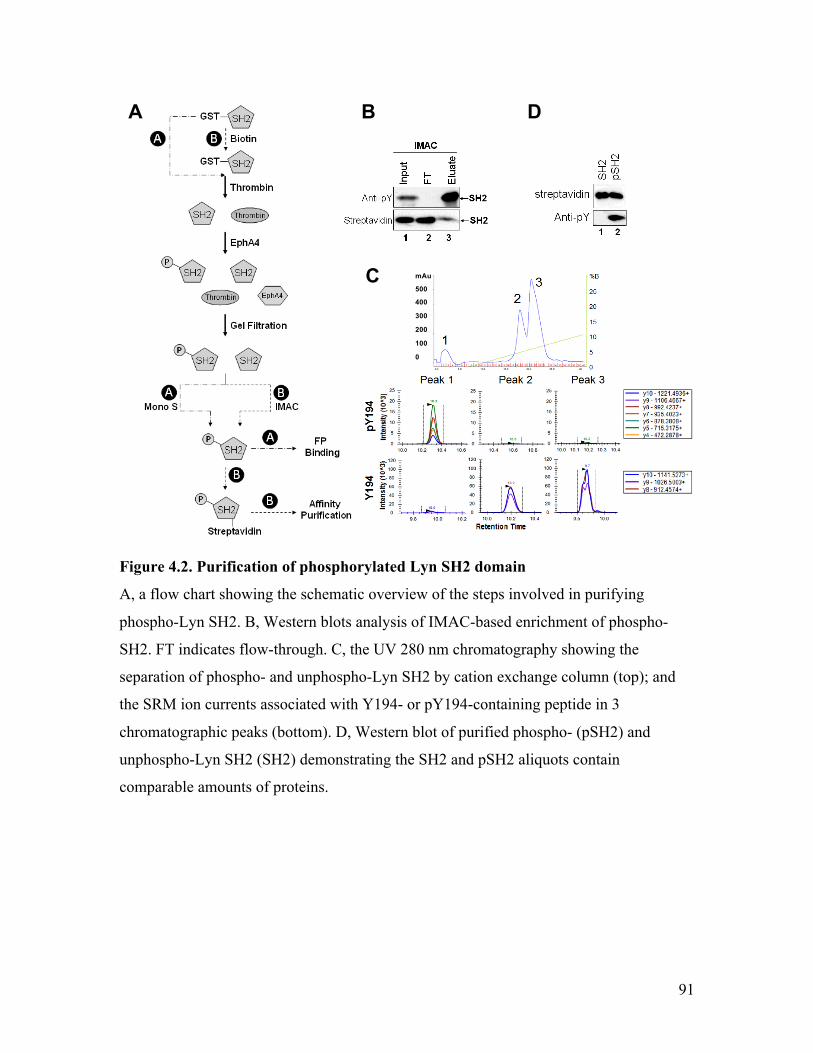
91
Figure 4.2. Purification of phosphorylated Lyn SH2 domain
A, a flow chart showing the schematic overview of the steps involved in purifying
phospho-Lyn SH2. B, Western blots analysis of IMAC-based enrichment of phospho-
SH2. FT indicates flow-through. C, the UV 280 nm chromatography showing the
separation of phospho- and unphospho-Lyn SH2 by cation exchange column (top); and
the SRM ion currents associated with Y194- or pY194-containing peptide in 3
chromatographic peaks (bottom). D, Western blot of purified phospho- (pSH2) and
unphospho-Lyn SH2 (SH2) demonstrating the SH2 and pSH2 aliquots contain
comparable amounts of proteins.
A B D
mAu
500
400
300
200
100
0
C
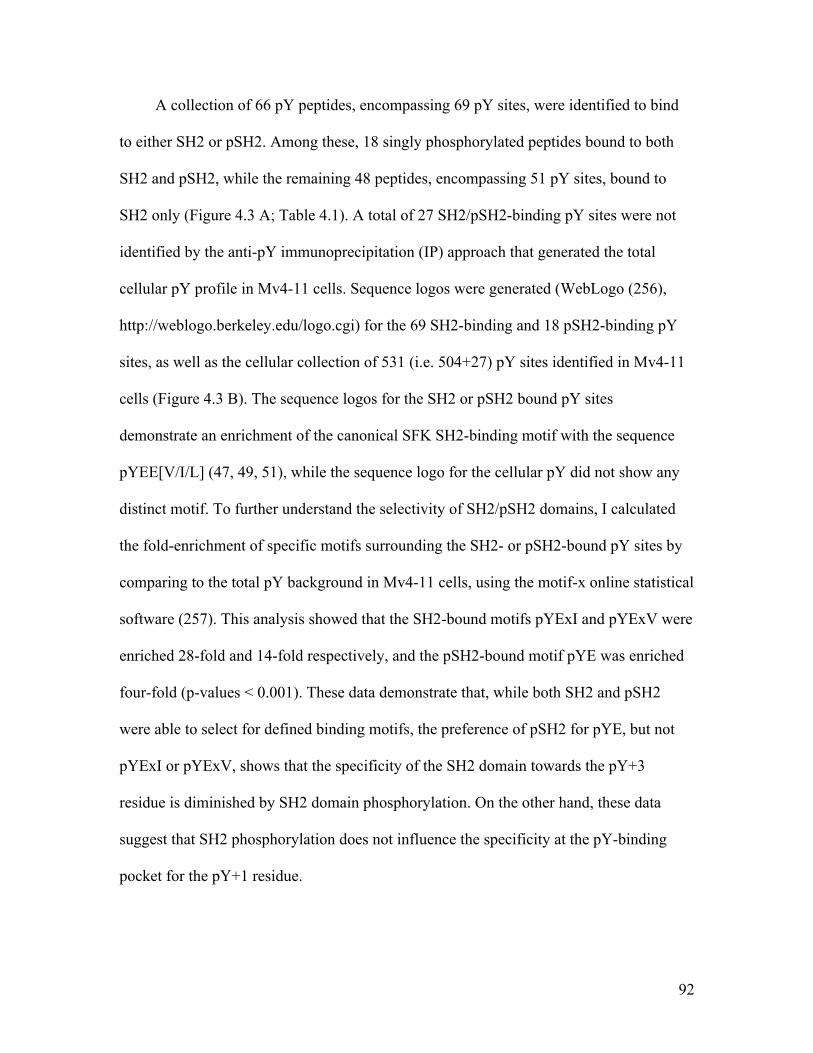
92
A collection of 66 pY peptides, encompassing 69 pY sites, were identified to bind
to either SH2 or pSH2. Among these, 18 singly phosphorylated peptides bound to both
SH2 and pSH2, while the remaining 48 peptides, encompassing 51 pY sites, bound to
SH2 only (Figure 4.3 A; Table 4.1). A total of 27 SH2/pSH2-binding pY sites were not
identified by the anti-pY immunoprecipitation (IP) approach that generated the total
cellular pY profile in Mv4-11 cells. Sequence logos were generated (WebLogo (256),
http://weblogo.berkeley.edu/logo.cgi) for the 69 SH2-binding and 18 pSH2-binding pY
sites, as well as the cellular collection of 531 (i.e. 504+27) pY sites identified in Mv4-11
cells (Figure 4.3 B). The sequence logos for the SH2 or pSH2 bound pY sites
demonstrate an enrichment of the canonical SFK SH2-binding motif with the sequence
pYEE[V/I/L] (47, 49, 51), while the sequence logo for the cellular pY did not show any
distinct motif. To further understand the selectivity of SH2/pSH2 domains, I calculated
the fold-enrichment of specific motifs surrounding the SH2- or pSH2-bound pY sites by
comparing to the total pY background in Mv4-11 cells, using the motif-x online statistical
software (257). This analysis showed that the SH2-bound motifs pYExI and pYExV were
enriched 28-fold and 14-fold respectively, and the pSH2-bound motif pYE was enriched
four-fold (p-values < 0.001). These data demonstrate that, while both SH2 and pSH2
were able to select for defined binding motifs, the preference of pSH2 for pYE, but not
pYExI or pYExV, shows that the specificity of the SH2 domain towards the pY+3
residue is diminished by SH2 domain phosphorylation. On the other hand, these data
suggest that SH2 phosphorylation does not influence the specificity at the pY-binding
pocket for the pY+1 residue.
93
Table 4.1. Phosphopeptides bound to Lyn SH2 or pSH2 identified by AP-MS
94
To examine the impact of Lyn SH2 phosphorylation on binding selectivity, the
relative amounts of the 18 pY peptides bound to both SH2 and pSH2 were extracted by
MaxQuant software (142) based on their MS XIC signal intensities. The average
quantification values across three replicates were used to generate a binding heatmap
(Figure 4.3 C), which showed increased bindings for SH2 compared to pSH2 (3 to 779-
fold increase) for all 18 pY peptides. This data indicates that these pY peptides have
preferences for unphosphorylated Lyn SH2. Moreover, it suggests that phosphorylation
of the SH2 domain reduces its affinity for pY peptides.
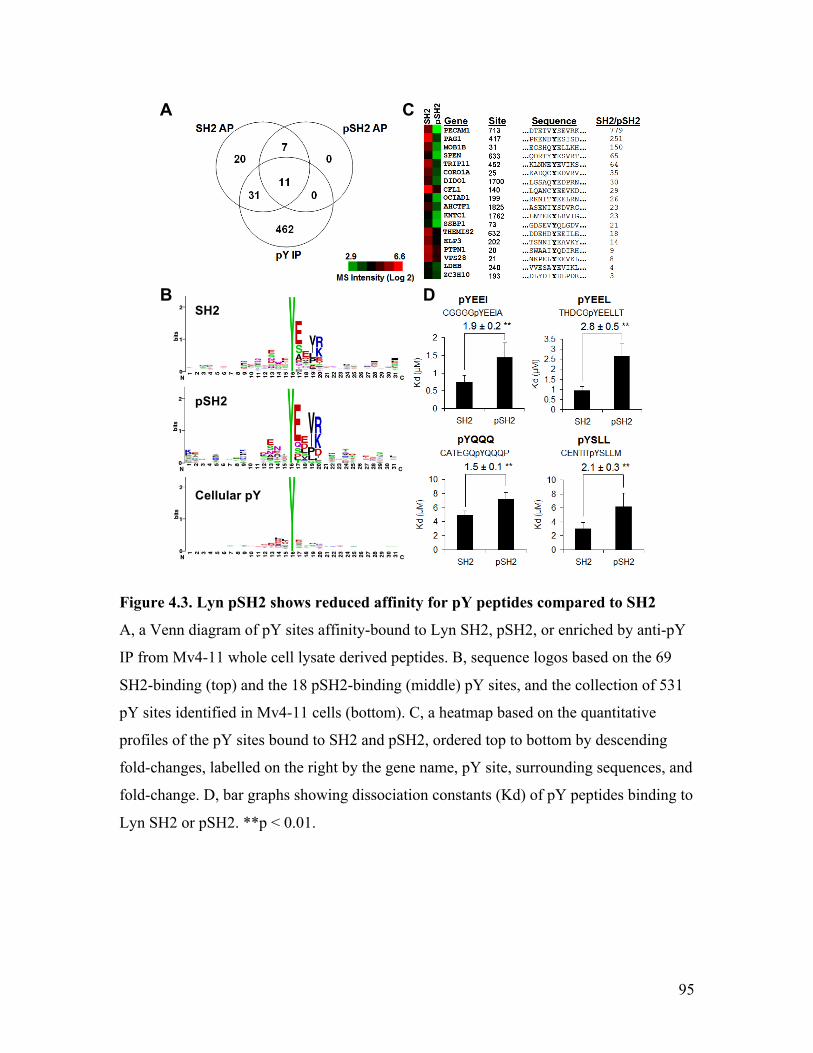
95
Figure 4.3. Lyn pSH2 shows reduced affinity for pY peptides compared to SH2
A, a Venn diagram of pY sites affinity-bound to Lyn SH2, pSH2, or enriched by anti-pY
IP from Mv4-11 whole cell lysate derived peptides. B, sequence logos based on the 69
SH2-binding (top) and the 18 pSH2-binding (middle) pY sites, and the collection of 531
pY sites identified in Mv4-11 cells (bottom). C, a heatmap based on the quantitative
profiles of the pY sites bound to SH2 and pSH2, ordered top to bottom by descending
fold-changes, labelled on the right by the gene name, pY site, surrounding sequences, and
fold-change. D, bar graphs showing dissociation constants (Kd) of pY peptides binding to
Lyn SH2 or pSH2. **p < 0.01.
A
B
C
D SH2
pSH2
Cellular pY
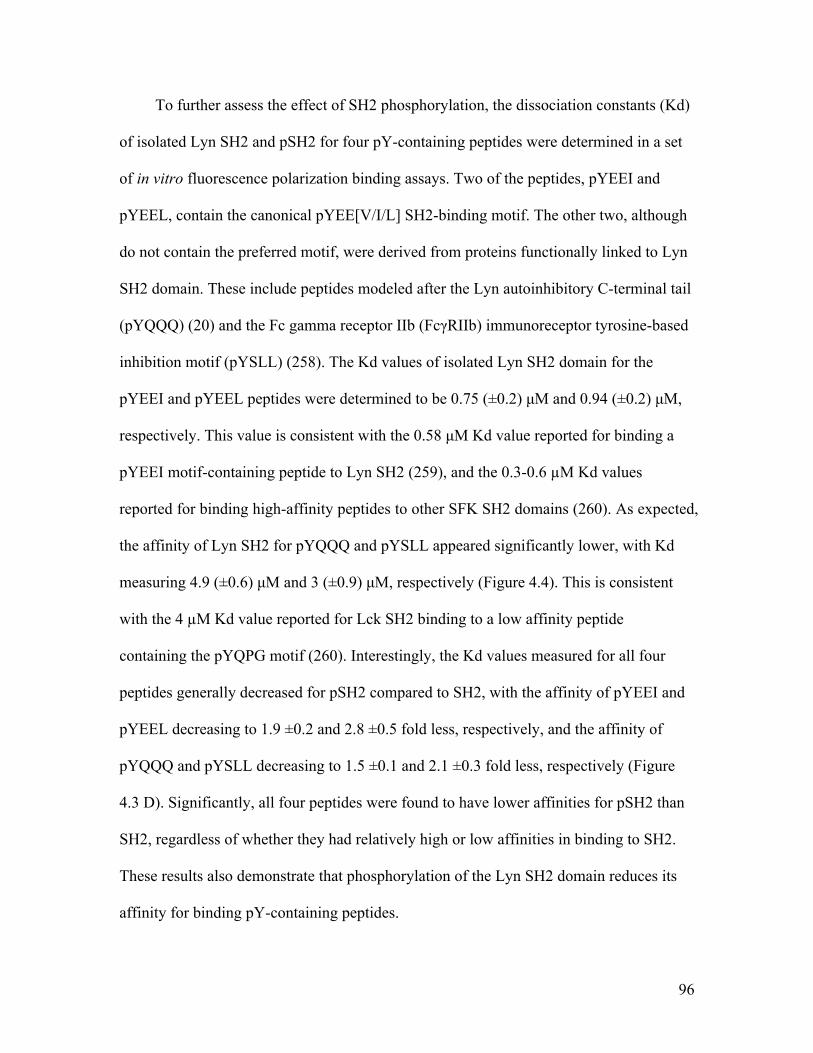
96
To further assess the effect of SH2 phosphorylation, the dissociation constants (Kd)
of isolated Lyn SH2 and pSH2 for four pY-containing peptides were determined in a set
of in vitro fluorescence polarization binding assays. Two of the peptides, pYEEI and
pYEEL, contain the canonical pYEE[V/I/L] SH2-binding motif. The other two, although
do not contain the preferred motif, were derived from proteins functionally linked to Lyn
SH2 domain. These include peptides modeled after the Lyn autoinhibitory C-terminal tail
(pYQQQ) (20) and the Fc gamma receptor IIb (FcγRIIb) immunoreceptor tyrosine-based
inhibition motif (pYSLL) (258). The Kd values of isolated Lyn SH2 domain for the
pYEEI and pYEEL peptides were determined to be 0.75 (±0.2) µM and 0.94 (±0.2) µM,
respectively. This value is consistent with the 0.58 µM Kd value reported for binding a
pYEEI motif-containing peptide to Lyn SH2 (259), and the 0.3-0.6 µM Kd values
reported for binding high-affinity peptides to other SFK SH2 domains (260). As expected,
the affinity of Lyn SH2 for pYQQQ and pYSLL appeared significantly lower, with Kd
measuring 4.9 (±0.6) µM and 3 (±0.9) µM, respectively (Figure 4.4). This is consistent
with the 4 µM Kd value reported for Lck SH2 binding to a low affinity peptide
containing the pYQPG motif (260). Interestingly, the Kd values measured for all four
peptides generally decreased for pSH2 compared to SH2, with the affinity of pYEEI and
pYEEL decreasing to 1.9 ±0.2 and 2.8 ±0.5 fold less, respectively, and the affinity of
pYQQQ and pYSLL decreasing to 1.5 ±0.1 and 2.1 ±0.3 fold less, respectively (Figure
4.3 D). Significantly, all four peptides were found to have lower affinities for pSH2 than
SH2, regardless of whether they had relatively high or low affinities in binding to SH2.
These results also demonstrate that phosphorylation of the Lyn SH2 domain reduces its
affinity for binding pY-containing peptides.
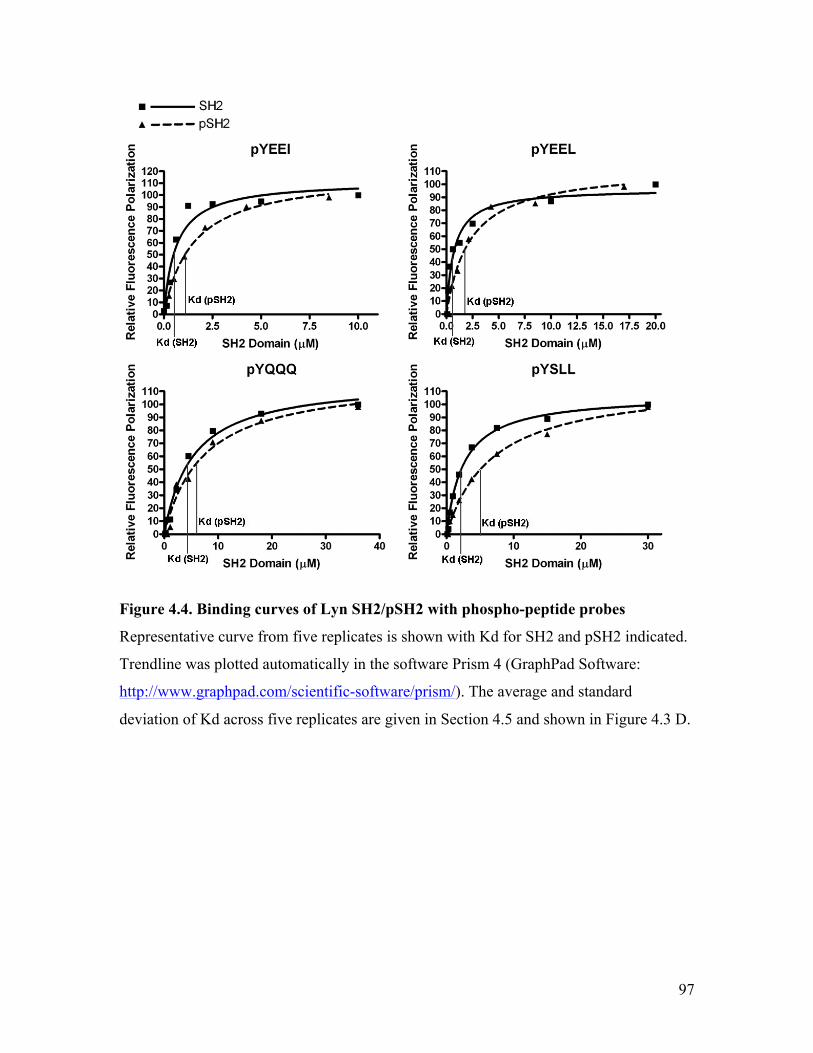
97
Figure 4.4. Binding curves of Lyn SH2/pSH2 with phospho-peptide probes
Representative curve from five replicates is shown with Kd for SH2 and pSH2 indicated.
Trendline was plotted automatically in the software Prism 4 (GraphPad Software:
http://www.graphpad.com/scientific-software/prism/). The average and standard
deviation of Kd across five replicates are given in Section 4.5 and shown in Figure 4.3 D.
98
4.6 Lyn SH2 Domain Phosphorylation Modulates Its Binding to pY-
Containing Proteins
To see if phosphorylation impacts Lyn SH2 binding to phosphoproteins, the binding
profiles of the Lyn SH2 domain and the phosphorylated Lyn SH2 domain for pY-
containing proteins was compared. Pervanadate-treated Mv4-11 whole cell lysates were
incubated with immobilized Lyn SH2 or pSH2 to affinity-purify pY-containing proteins.
The bound proteins were either analyzed by anti-pY Western or protease-digested for MS
analysis. Remarkably, Western blot analysis showed dramatic reduction in
phosphoprotein binding for pSH2 compared to SH2 (Figure 4.5 A; compare lanes 4 and
5). Moreover, the quantitative profiles generated by MS analysis identified 539 proteins
that were significantly enriched through affinity-binding to Lyn SH2 or pSH2, compared
to the streptavidin (SA)-only negative control; among which, 36 known Lyn interactors
(GeneCards (261), www.genecards.org) were included. The MS analysis also detected
166 pY sites on these proteins. The fact that a lower number of pY sites were identified
compared to the number of bound proteins implies the affinity-enrichment of protein
complexes, such that indirect SH2-binders were also recovered by this method.
Consistent with the peptide binding experiments described in Section 4.5, fewer proteins
bound pSH2 compared to SH2 (Figure 4.5 B), suggesting that the ability of Lyn SH2 to
bind native proteins was decreased by phosphorylation at Y194. This is consistent with
previous findings that phosphorylation of the equivalent tyrosine in the SH2 domain of
Lck reduced its ability to bind proteins derived from pervanadate-treated Jurkat T cells
(54).
99
Out of the 539 bound proteins, 394 bound selectively better (≥ two-fold) to either
SH2 or pSH2, exhibiting binding preferences (Appendix Table 5). Among which, 352
bound two-fold or better to SH2 and the other 42 bound two-fold or better to pSH2. I
used a hidden Markov model method (262) to predict direct binders of Lyn SH2 based on
their theoretical pY motifs. The database for theoretical pY motifs include the entire
collection of pY sites on the 394 differential proteins identified in this experiment and
catalogued in the PhosphoSitePlus online database (263) (www.phosphosite.org/),
amounting to a total of 1988 pY sites. As a result of this analysis, 66 of the 394 proteins
were predicted to bind directly to Lyn SH2, with 62 bind preferentially to SH2 and four
bind preferentially to pSH2. These 66 proteins were significantly enriched for proteins in
immune system process (g:Profiler (264) p value<0.001), including pathways in cellular
response to stimulus (42 proteins, p<0.01), signaling (41 proteins, p<0.001), and
regulation of immune system process (17 proteins, p<0.01). These data are consistent
with the prominent role of Lyn in B cell signaling (25). Among the predicted direct
binders, 16 were known Lyn interactors (Figure 4.5 C). This is a 15.8-fold enrichment (p
value<0.001) of Lyn interactors compared to a similar search against the complement of
catalogued human protein pY (PhosphoSitePlus, March 2015 download; 10240 pY
proteins) background. Comparison of the proteins and phosphopeptides captured by the
affinity purification method revealed 27 instances of overlap (20 predicted direct binders
including five know Lyn interactors), wherein a phosphopeptide and its parent native
protein were both enriched by binding SH2 or pSH2 (Table 4.2). These data suggest that
the 66 predicted interactors possibly interact with Lyn in vivo, likely through pY-
100
mediated binding to Lyn SH2 domain. However, these predictions still require
experimental validation.
Conceptually, proteins containing the pY moiety-binding SH2 or PTB domains
might bind pY194 of the pSH2 domain, thus demonstrating a preferred selectivity toward
pSH2 versus SH2. However, results of this experiment indicate that all SH2/PTB
domain-containing phosphoproteins bound Lyn SH2 at least 1.7-fold better than pSH2
(Table 4.3), implying that the major mode of interaction is mediated through the pY
motifs on the phosphoproteins and the Lyn SH2 domain, and that this interaction can be
disrupted by phosphorylation of Lyn SH2.
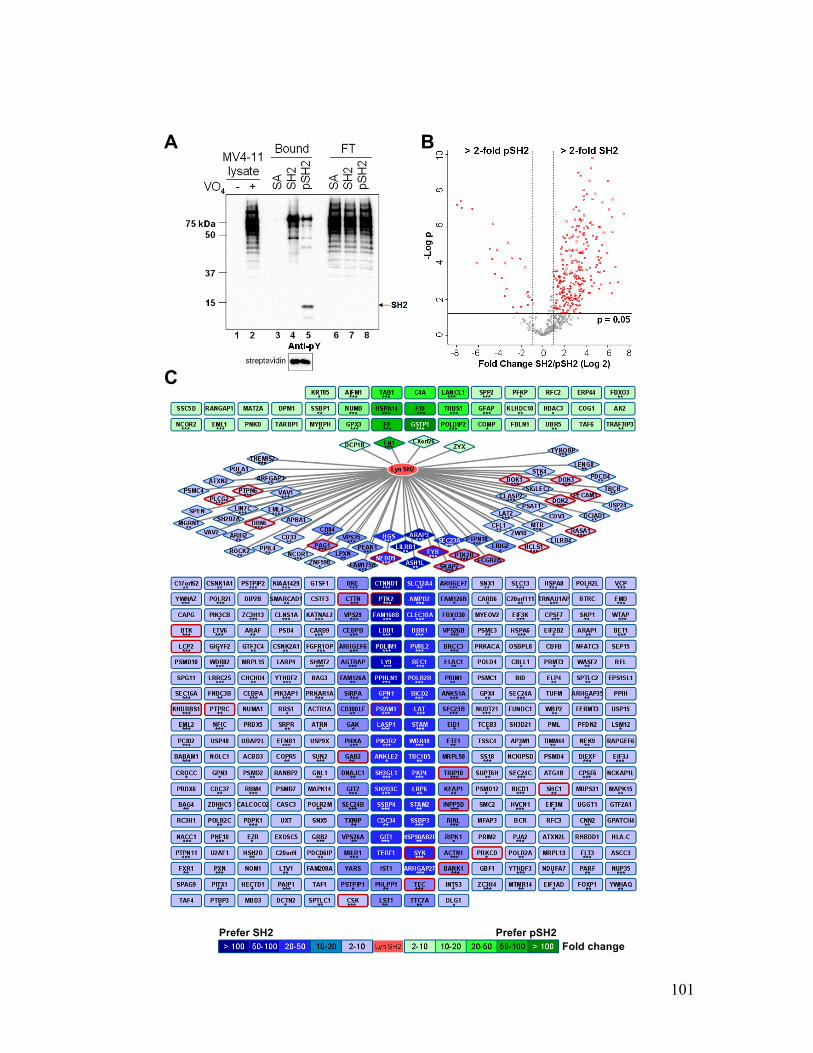
101
A B
C
Fold change Prefer SH2 Prefer pSH2
102
Figure 4.5. Lyn SH2 phosphorylation modulates its binding affinity for
phosphoproteins
A, an anti-pY Western blot showing differential binding of phosphoproteins to Lyn SH2
or pSH2. Untreated (Lane 1) or pervanadate-treated (Lane 2) Mv4-11 cells were lysed
and the whole cell lysate proteins were mixed with empty streptavidin (SA) beads (Lanes
3, 6), Lyn SH2 (Lanes 4, 7), or pSH2 (Lanes 5, 8) for affinity purification. The flow-
through (Lanes 6-8) and the bound proteins (Lanes 3-5) were indicated. Streptavidin blot
for biotin-labelled SH2 and pSH2 confirms equal loading of the proteins. B, a volcano
plot of log 10 Student’s t-test p-value (based on 6 replicates) against log 2 fold change of
abundances of protein bound to SH2 compared to pSH2. Horizontal line indicates
statistical significance cut-off. C, a schematic overview of proteins bound differentially
(2-fold or higher) to Lyn SH2 (blue) or pSH2 (green), with the darkness of color
indicating fold changes. Predicted direct Lyn-binders are in diamond-shaped nodes and
connected to Lyn SH2 by a line. Reported Lyn interactors are labelled in red. Asterisks
indicate the Student’s t-test significance levels: *p<0.05; **p<0.01; ***p<0.001.
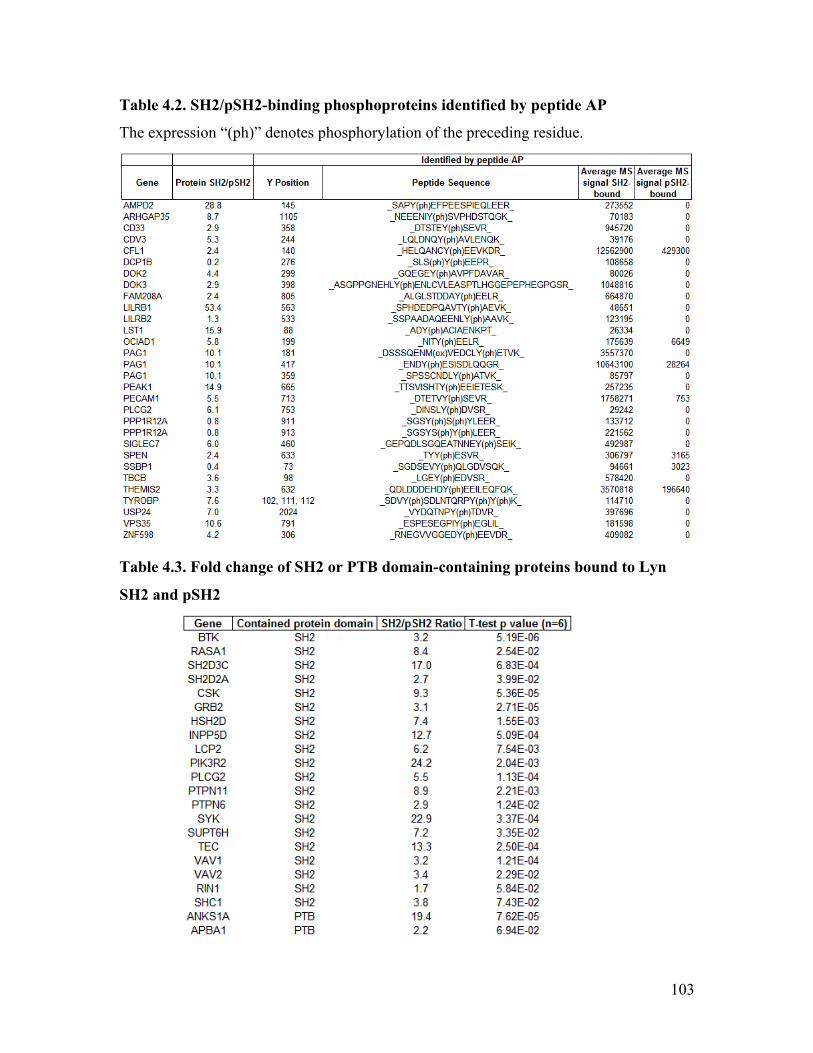
103
Table 4.2. SH2/pSH2-binding phosphoproteins identified by peptide AP
The expression “(ph)” denotes phosphorylation of the preceding residue.
Table 4.3. Fold change of SH2 or PTB domain-containing proteins bound to Lyn
SH2 and pSH2
104
4.7 Discussion and Conclusion
Through proteomics approaches, I discovered that a conserved tyrosine in the SH2
domain of Lyn and other SFKs was prevalently phosphorylated in AML/CLL primary
samples and MM cell lines. Phosphorylation of the equivalent tyrosine on SFKs was
observed in other cancer systems such as non-small cell lung cancer cell lines and tumors
(175) and human epidermal growth factor receptor 2 (HER2)-overexpressing breast
tumor specimens (254), suggesting potential important roles for this phosphorylation. For
this reason, I investigated the impact of pY on the binding behaviour of SH2 domain
using Lyn SH2 domain as a model. As a result, I found that Y194 phosphorylation within
the Lyn SH2 domain reduced its binding affinity and modulated its selectivity for
phosphopeptides and phosphoproteins.
I observed increased Lyn SH2 (Y194) phosphorylation in MM cells treated with
pervanadate, a phosphatase inhibitor, indicating that Lyn pY194 was regulated.
Consistently, other groups also observed the regulation of SH2 phosphorylation in SFKs;
and this was usually associated with functional consequences. In particular, induction of
Src phospho-Y213 was observed in vivo following platelet derived growth factor (PDGF)
or HER2/heregulin (HRG) stimulation (21, 254). While phosphorylation of Src Y213 by
PDGFR in vitro potentially abolished the binding of Src C-terminal autoinhibitory motif
and led to Src activation (21), HER2/HRG stimulated Src Y213 phosphorylation promoted
Src kinase activity as well as Fak Y861 phosphorylation (254). Moreover, pY213 in Src was
found to affect its localization, building a link between Y213 phosphorylation and breast
cancer metastasis (254). Additionally, stimulation of Jurkat T cells with anti-CD3
antibodies induced phosphorylation of Lck Y192 (265). Together, these observations with
105
my results propose a model where SFK SH2 phosphorylation influences substrate
selection, protein localization, and allosteric interactions with the kinase domain or the C-
terminal tail. In agreement with this, my results show altered affinity and selectivity of
Lyn SH2 for pY-containing molecules due to SH2 phosphorylation, suggesting a role of
SH2 phosphorylation in regulating the protein-protein interaction and downstream
signalling of SFKs.
Lyn Y194 is located on the EF loop, within the consensus sequence
G[G/W][Y/F/L]YI[S/T][P/T/S]R, which is conserved in SFK SH2 domains, but not in all
SH2 domains (40). The EF loop controls the accessibility and shape of the pY+3 pocket
(51), thus, to a modest degree, regulates substrate specificity (42). Therefore, it is
reasonable to speculate that Y194 phosphorylation modulates substrate recognition for the
pY+3 residue. Indeed, my results showed that phosphorylated Lyn SH2 had a preference
for pYE but not pYExI or pYExV motif, suggesting that phospho-Y194 abolished the
selectivity for pY+3 residue binding. The fact that phosphorylation only reduced the
affinity of Lyn SH2 binding to synthetic pY peptide by 1.5-2.8 fold may reflect that pY
contributes most energy to binding, and the C-terminal flanking residues of pY (the pY+
sites) contribute less. Combined, these data suggest that Lyn Y194 phosphorylation within
the EF loop modulates substrate selectivity for the pY+3 residue while modestly reducing
the binding affinity of pY-containing ligands.
Although my data showed a generally reduced binding of pSH2 to pY-containing
molecules, for a small subset of protein ligands, the binding was increased. This subset of
42 proteins includes significantly enriched biomolecules that are involved in degenerative
joint disease (F9, COMP), prolonged partial thromboplastin time (F10, F9, DPM1),
106
transport of gamma-carboxylated protein precursors from the endoplasmic reticulum to
the Golgi apparatus (F10, F9), and SMRT core complex (HDAC3, NCOR2) (g:Profiler p
value<0.05) (264). Among these, 4 of the 42 proteins (HDAC3, ZYX, GPX3, THBS1)
are products of known tumor suppressor genes (266-271). Particularly, ZYX was
predicted to interact directly with Lyn SH2 by my algorithm. The over-expression of
ZYX in Ewing tumor derived samples led to transformation events (269) potentially by
disrupting the actin polymerization process. Although a regulated interaction between
Lyn SH2 and ZYX has never been reported, my results provide a potential link between
Lyn and actin polymerization.
While my results showed increased affinity of Lyn SH2 for both high- and low-
affinity pY-peptides, phosphorylation of Src SH2 domain significantly reduced binding to
a low-affinity peptide (derived from the phosphorylated autoinhibitory C-terminal tail of
Src) without influencing binding to a high-affinity peptide (21). Furthermore,
phosphorylation of Lck SH2 reduced binding to a high-affinity peptide but without
influencing binding to a lower-affinity peptide (54). These conflicting observations
reflect that ligand-binding may be differentially modulated by SH2 phosphorylation for
SFKs, and this may serve as mechanism to control SFK substrate selection and regulate
the diverse roles of SFKs in various signaling events. Alternatively, these conflicting
results may simply be due to differences in material and methods in assessing SH2
domain-phosphopeptide interactions.
In conclusion, the modulation of Lyn SH2 binding specificities by phosphorylation
presents another layer of the complex regulation of pY signaling networks. This
mechanism is regulated by upstream TKs and PTPs, and may be a common mode of

107
modulation for SH2-containing proteins, including SFKs, to control their substrate
binding selectivity. Given the widespread nature of SH2-containing proteins and their
critical roles in signal transduction, this discovery may provide new insights into
understanding SH2-mediated signaling pathways.

108
4.8 Materials and Methods
Materials
For Western blotting, anti-phosphotyrosine antibody, clone 4G10 was from Merck
Millipore. Fluor-S MultiImager for imaging and Laemmli Sample Buffer (2 x) were
ordered from Bio-Rad Laboratories. For Lyn IP, agarose conjugated anti-Lyn mouse
monoclonal antibody was obtained from Santa Cruz Biotechnology. For GST fusion
protein purification, glutathione sepharose 4B beads were from Amersham Biosciences -
GE Healthcare Life Sciences (Piscataway, NJ). For affinity purification (AP),
Streptavidin (SA) Sepharose beads conjugate was ordered from Cell Signaling
Technology and Protein A agarose Fast Flow 50% (v/v) beads were from Sigma Aldrich
(St. Louis, MO). EZ-Link Sulfo-NHS-Biotin and Biotinylation Kits was from Pierce
Thermo Scientific (Rockford, IL). Thrombin and RPMI-1640 medium were ordered from
Life Technologies. PerfectPure C-18 Tip pipette tips (ZipTip) for mini-scale peptide
desalting were bought from Eppendorf AG (Hamburg, Germany). N-terminally Alexa
Fluor 488-labeled peptides with sequences CGGGGpYEEIA (pYEEI),
THDCGpYEELLT (pYEEL; corresponds to the MS4A6A pY242 motif),
CATEGQpYQQQP (pYQQQ; corresponds to the Lyn pY508 motif), and
CENTITpYSLLM (pYSLL; corresponds to the FcγRIIb pY292 motif), where pY
represents phosphorylated tyrosine, were synthesized in SPARC BioCentre (The Hospital
for Sick Children, Toronto, ON). Protein purification was performed with a HiLoad 26/60
Superdex 75 gel filtration column using the AKTA Fast Protein Liquid Chromatography
109
(FPLC) system manufactured by Amersham Biosciences. Sources of all other materials
were as specified in Section 2.8 under “Materials”.
Patient Selection and Sample Preparation
Treatment naive symptomatic CLL patients were given escalating doses of
Revlimid: 2.5 mg daily for 21 days in Cycle 1, and after a 7-day drug-free period, 5 mg
daily for 21 days in Cycle 2. Peripheral blood mononuclear cells (PBMCs) were collected
from patients on Day 8 of Cycle 2, 4 h after taking medication. CLL patient selection and
PBMC sample collection were described previously (272). For AML samples, see
Section 3.6 under “Patient Selection and Sample Preparation”.
Cell line
The Mv4-11 AML cell line were maintained in RPMI-1640 medium supplemented
with 5% FBS.
Strains
For gene expression, Escherichia coli BL21 (DE3) cells were grown in Lysogeny
broth (LB) medium (37 °C). Ampicillin (100 mg/mL) was supplemented for plasmid-
harbouring strains.
Constructs
Residues corresponding to the SH2 domain (124 to 231) of mouse Lyn kinase were
cloned into a pGEX expression vector by Leanne Wybenga-Groot (The Arthur and Sonia
Labatt Brain Tumour Research Centre, The Hospital For Sick Children). The GST-

110
EphA4 kinase construct containing residues 591-896 of the human EphA4 kinase was a
gift from Leanne Wybenga-Groot.
Treatment of Cultured Cells with Pervanadate
Equal volumes of 12 mM sodium vanadate (diluted from 100 mM stock, Cell
Signaling) and 12 mM H2O2 (diluted from 30% w/w stock, Sigma-Aldrich) were mixed
and incubated (rt, 15 min) to obtain 6 mM peroxovanadate solution. The solution was
immediately diluted 1:100 into sub-confluent cultures of MM or AML cells. The cells
were maintained in 0.06 mM peroxovanadate (37 °C, 10 min), then pelleted and
subjected to cell lysis.
Non-Denaturing Cell Lysis
To obtain non-denatured whole cell lysates, cultured AML cells were pelletted and
lysed in NP-40 cell lysis buffer as described in Section 2.8 under “Non-Denaturing Cell
and Tissue Lysis”.
Denaturing Cell Lysis
For AML/CLL primary samples, pelleted cells were sonicated in urea lysis buffer
(20 mM HEPES pH 8, 9 M urea, 1 mM Na3VO4, 2.5 mM sodium pyrophosphate, 1 mM
β-glycerophosphate) and inverted at 4°C for 30 min, then subjected to anti-pY
enrichment (see Section 2.8 Enrichment of Peptides by pY Antibody). To obtain lysate-
derived phosphopeptides, pervanadate-treated Mv4-11 cells were lysed by rocking (4 °C,
30 min) in urea-CHAPS lysis buffer (7 M urea, 4% CHAPS w/v in 50 mM Tris pH 7.5).
The non-soluble material was pelleted by centrifugation (15,000 x g, 10 min) and the
111
cleared supernatant was subjected to acetone precipitation as described below, trypsin
digestion (see Section 2.8 Protein Digestion by Trypsin), and peptide desalting (see
Section 2.8 Peptide Desalting) prior to usage in AP experiments.
Acetone Precipitation and Resuspension of Proteins
Proteins dissolved in urea-CHAPS lysis buffer were mixed with 4 x volume of cold
acetone (-20 °C, overnight) pelleted by centrifugation (18,000 x g, 10 min). The protein
pellet was exposed to air (rt, 30 min) to remove the acetone and then dissolved in 1 M
urea, 50 mM ammonium bicarbonate.
Immunoprecipitation (IP) of Lyn Kinase
For anti-Lyn IP, whole cell lysate proteins in NP-40 cell lysis buffer were pre-
cleared with protein A agarose beads (5 µl per mg protein; 4°C, 2 h with inversion), and
incubated with agarose conjugated anti-Lyn antibody (2 µg per mg protein; 4 °C, 4 h with
inversion). The beads were washed three times in NP-40 cell lysis buffer, then twice in
PBS. Proteins were trypsin-digested on beads (Section 2.8 Protein Digestion by Trypsin)
and desalted with a C-18 ZipTip by following the manufacturer’s protocol. The desalted
peptides were subjected to SRM MS analysis.
Measurement of Phosphorylation Stoichiometry by SRM MS
Lyn kinase-derived tryptic peptides were monitored by SRM MS using previously
defined transitions (139). The peak areas of the XICs corresponding to the SRM signals
of Lyn Y194 or pY194-containing peptides were used to calculate the absolute
phosphorylation stoichiometry as described previously (139).
112
Transformation of Protein Constructs into Bacteria
Plasmid DNAs harbouring the Lyn SH2 domain or EphA4 kinase sequences (0.1-
0.3 µg) were incubated with 100 µL competent BL21 cells on ice (30 min). The bacteria
were heat-shocked (42 °C, 45 s), incubated on ice (2 min), then mixed with 500 µL S.O.C.
medium (Life Technologies) and shaken at approximately 200 rpm (37 °C, 1 h). The
bacteria-containing medium was plated onto a LB plate supplemented with 100 mg/mL
ampicillin and incubated overnight (37 °C). Plasmid-harbouring colonies were selected
from the plate and verified by miniprep (PureLink Quick Plasmid Miniprep Kit, Life
Technologies; per manufacturer’s protocol) and sequencing.
Expression and Purification of Lyn SH2 and Phosphorylated Lyn SH2
Escherichia coli BL-21 cells containing the Lyn SH2 or EphA4 constructs were
grown in two to eight litres of LB media containing 100 µg/ml ampicillin (18 °C,
overnight; A600 = 0.6-0.8 and 0.25 mM IPTG induction). Cells were pelleted and
resuspended in lysis buffer (50 mM HEPES pH 7.5, 0.5 M NaCl, 10% glycerol, with 1.5
µM aprotinin, 20 µM leupeptin, and 0.4 mM AEBSF), followed by sonication on ice.
The cell lysate was cleared by centrifugation (10,000 x g, 30 min) and the supernatant
was mixed by nutation with glutathione-sepharose (0.5-1 ml resin per litre bacterial
culture; 4 °C, 1.5 h). Resin was washed 5 x with 20 ml wash buffer (50 mM HEPES pH
7.5, 0.5 M NaCl, 5% glycerol). For use in affinity purification (AP), resin-bound GST-
Lyn SH2 was biotinylated using the EZ-Link Sulfo-NHS-LC-Biotin kit (rt, 2 min). The
reaction was stopped by washing with TBS, pH 8. The GST tag was cleaved by thrombin
(50-100 U per litre bacterial culture; rt, overnight) in the presence of 10 mM CaCl2. Lyn
113
SH2 was eluted with 5-10 ml wash buffer. In vitro phosphorylation was carried out by
mixing with glutathione-sepharose-bound GST-EphA4 in kinase reaction buffer (25 mM
MOPS pH 7.2, 12.5 mM β-glycerophosphate, 20 mM MgCl2, 25 mM MnCl2, 5 mM
EGTA, 2 mM EDTA, 0.5 mM Na3VO4, 0.5 mM DTT, 2 mM ATP) at 20:1 protein to
kinase molar ratio (rt, overnight). Lyn SH2 was dissolved in GF buffer (25 mM HEPES
pH 7.5, 0.4 M NaCl, 1 mM DTT) and isolated using a HiLoad 26/60 Superdex 75 gel
filtration column (GE Healthcare Life Sciences). Unphospho- and phospho-Lyn SH2
were resolved either by immobilized metal affinity chromatography (IMAC)
(Phosphoprotein Enrichment Kit, CloneTech) by following the manufacturer’s
instructions, or on a mono S column (GE Healthcare) with a 0-20% gradient of Buffer A
(20 mM MOPS pH 6.5, 1 mM DTT) to Buffer B (20 mM MOPS pH 6.5, 1 M NaCl, 1
mM DTT).
Affinity Purification of Phosphorylated Peptides
A total of 3 mg Mv4-11 cell lysate-derived peptides (refer to Denaturing Cell Lysis)
were mixed with equal amounts of SA-bound Lyn SH2 or pSH2, in HEPES binding
buffer (25 mM HEPES pH 7.2, 12.5 mM β-glycerophosphate, 0.5 mM DTT; 4 h, 4 °C).
The beads were washed three times in the binding buffer and twice in 25 mM HEPES, pH
7.2; and eluted with 5 mM phenylphosphate in 0.15% TFA. The eluted peptides were
desalted using a C18 ziptip as per manufacturer’s protocols, and analyzed by the Orbitrap
Elite Hybrid Ion Trap-Orbitrap mass spectrometer (for specifications of the data
acquisition procedures see Section 3.6 Mass Spectrometry Analysis). This experiment
was repeated three times and the peptide quantification values were averaged across three
replicates. By manually excluding three phosphopeptides that constantly bound SA
114
negative control at high levels, 66 Lyn SH2/pSH2-binding phosphopeptides were
reported.
Affinity Purification of Phosphorylated Proteins
A total of 6 mg Mv4-11 lysate proteins (see Non-Denaturing Cell Lysis) were
mixed with equal amounts of SA-bound Lyn SH2 or pSH2 in NP-40 lysis buffer (4 °C, 4
h). The beads were washed three times in NP-40 lysis buffer and twice in 20 mM HEPES,
pH 7.2. Bound proteins were reduced, alkylated, and trypsin-digested on beads, then
eluted from the resin into 50 µl 0.15% TFA (for the trypsin digestion protocol, see
Section 2.8 Protein Digestion by Trypsin). The eluted peptides were desalted with a C18
ziptip, and analyzed by the Q Exactive Hybrid Quadrupole-Orbitrap mass spectrometer
(for specifications of the data acquisition protocol see Section 3.6 Mass Spectrometry
Analysis). Two biological repeats, each with three technical replicates, were conducted
and the protein levels were averaged across six replicates. The SH2- or pSH2-binding
proteins were defined as proteins significantly enriched in the SH2/pSH2-bound fractions,
whose levels elevated by at least 2.5 standard deviations compared to SA negative
controls (p-value < 0.0124).
SRM MS Analysis
Desalted peptides were loaded onto a homemade C-18 analytical column for
chromatographic separation using a 0 to 60% HPLC buffer A (0.1% formic acid in HPLC
water) to buffer B (0.1% formic acid in acetonitrile) gradient over 40 min (400 nL/min),
and sprayed into a TSQ Quantum Ultra triple quadrupole mass spectrometer (Thermo
Scientific) through positive-ion nano-ESI. Transitions were monitored with resolutions
115
for Q1 and Q3 set to 0.4 Da and 0.7 Da at full width at half maximum (FWHM),
respectively. The collision energy used to fragment the peptides was calculated with the
formula 3.41 + 0.034 x m/z, which was deduced empirically for optimal fragmentation
(139).
Fluorescence Polarization Binding Assay
Alexa Fluor 488-labeled synthetic peptides with sequences CGGGGpYEEIA
(pYEEI), THDCGpYEELLT (pYEEL), CATEGQpYQQQP (pYQQQ), or
CENTITpYSLLM (pYSLL), where pY denotes phosphorylated tyrosine, were dissolved
in FP binding buffer (25 mM HEPES pH 7.2, 150 mM NaCl, 0.5 mM DTT) to a
concentration of 10 µM and stored at -80 °C in dark. The peptides were mixed with serial
dilutions of Lyn SH2 or pSH2 in FP binding buffer to a final concentration of 1 µM. The
fluorescence polarization (FP) was measured in a flourometer (Analyst HT, Molecular
Devices). A binding curve was plotted by Prism 4 software (GraphPad Software) and the
dissociation constant (Kd) was calculated in the software by using curve-fitting and the
one-site-binding hypothesis. This experiment was repeated five times and the average Kd
for each peptide was reported.
Prediction of Direct Binders of Lyn SH2
The HHsuite software was used to implement a profile hidden Markov model
method (262). First, a matrix predictor model was generated based on the 69 Lyn
SH2/pSH2-bound pY sites. This model was used to search against a custom database of
1988 potential pY motifs on the 398 proteins that differentially bound to
unphosphorylated and phosphorylated Lyn SH2. The custom database was created by
116
joining the pY motifs on the 398 protein that was identified in my study with the
catalogued pY motifs from PhosphoSitePlus (263). The algorithm was performed with
default parameters and the following commands:
ffindex_build -s -f hhm.filelist databases/phosphosite_hhm_db
hhmake -i querySH2all.a3m
hhsearch -i data/ querySH2all.hhm -d databases/phosphosite_hhm_db -o
queryresults.txt -norealign -nopred –nodssp
Generation of Heatmaps Based on Peptide Quantifications
The log 2 MS intensities of the 18 phosphopeptides bound to both Lyn SH2 and
pSH2 were used to produce a heatmap. The peptides were arranged in descending order
based on their fold changes by comparing the quantities bound on SH2 to pSH2. The
heatmap was created in Cluster 3.0 and visualized by Java Treeview.
117
Chapter 5 Summary and Future Directions
The proteomics and biochemical studies described in this thesis attempt to answer
two generic questions: 1) how the enzymes TKs and PTPs regulate cellular protein pY on
the systemic level; and 2) how the SH2 domain of SFKs, as a downstream effector of pY
signaling in a cell, are functionally modulated by pY. Although the regulation of protein
pY sites by TKs and PTPs is historically appreciated (3, 11, 32), a systemic overview at
the impact of the total cellular collections of the expressed kinome and PTPome on the
cellular pY has not been possible until recently. This type of study was facilitated by the
emergence of new proteomics techniques that enabled the quantitative analysis of
comprehensive profiles of pY and PTPs in a cellular system (151, 273). Through
integrated analysis of the PTPs and cellular pY, I was able to gain insights into the
enzymatic regulation of pY and find evidence that supported my model of a systemic
regulation of pY by the complement of enzymes TKs and PTPs in the system (Figure 1.1).
Moreover, pY sites identified in the proteomics studies led to novel hypotheses and the
probing into the functional implications of the phosphorylation of a conserved Y site in
the SH2 domain of SFKs.
5.1 Summary and Future Directions of the Comprehensive Protein-pY
Regulation Analysis in MM Samples
To answer the first question I proposed in my thesis, I examined the quantitative pY
and PTP profiles in two disease models, MM and AML. For MM, five established human
primary tumor-derived cell lines, representing different MM subtypes, and their cognate
mice xenograft tumors were analyzed. Initial Western results showed distinctive features
118
across the cell lines as well as between cultured cells and their cognate tumors. The
tumor-cell difference was further confirmed by unsupervised hierarchical clustering
based on the quantitative pY profile in these samples, which led to the consideration of
cells and tumors as separate biological systems in subsequent analyses. Using the
collection of TK A-loop phosphorylations included in the pY profile as a representation
of activated TKs in the system, I showed that the levels of TK activation alone could
generally distinguish the cells from the tumors (with the exceptions of KMS12 tumor and
RPMI8226 cell), suggesting a systemic regulation of cellular pY by TKs. PLSR analysis
confirmed this notion by showing that almost 100% of pY variation could be predicted
based on the fluctuation in TK activation levels in both cell and tumor systems, while
implicating FGFR3, Ptk2, and Src (or Yes, Fyn, Lck) in cells, as well as Src (or Yes, Fyn,
Lck), Abl1, and FGFR3 in tumors as potential key regulators of pY signaling. Next, the
quantitative PTP expression profiles in these samples were examined. By using a similar
bioinformatics approach, I showed that the variations in PTP expression could almost
completely predict the pY variations in both cells and tumors, with Ptpn1, Ptpn6, and
Ptpn11 in cultured cells, and Ptpn7, Ptpn9, Ptpn11, and Ptprg in xenograft tumors
implicated as potential key PTP regulators of pY. Correlation heatmaps provided
additional evidence for a systemic influence of TKs/PTPs on cellular pY by showing
modular-based strong positive correlations between the TK and PTP enzymes and subsets
of pY. Together, these results support the initial hypothesis that the cellular protein pY is
a quantitative output of the actions of TKs and PTPs in the cellular system.
Future investigations may entail mechanistic elucidation of the functions of the
implicated TKs and PTPs in MM. Indeed, some of the highly implicated enzymes were
119
already well-characterized in MM such as FGFR3 (Section 1.1.3.1). However, the vast
majority of the enzymes implicated by this study were either previously not linked to
MM or with functional implications still unclear in MM biology. Some of these enzymes,
such as Ptpn11, although were highly implicated in other types of malignancies, were not
well characterized in MM. Given their prominent oncogenic (i.e. Ptpn11, Abl1) or tumor
suppressor (i.e. Ptpn6) roles, and the fact that they were suggested as potential key
regulators of pY in MM by this study, the role of these enzymes in MM are worth
investigating. Particularly, TKs and/or PTPs implicated by correlating with different
components in the multi-component model generated by PLSR analysis could be
investigated for their potential role in varying subtypes of MM. These enzymes may
mediate key oncogenic mechanisms in MM subtypes wherein an oncogenic driver is yet
unknown. Along this line, my study also identified candidate proteins that may be
functionally linked to the implicated enzymes (i.e. proteins whose pY sites are highly
correlated with the implicated enzymes in the samples; refer to Figure 2.6 and Table 2.3).
Probing at a link between these proteins and the enzymes may be a good starting point for
a functional study. Finally, these investigations may stem the discovery of novel pivotal
pathways that can be intercepted by therapeutic intervention.
Furthermore, the difference between MM tumor and cell biology can be explored in
more detail in order to identify molecular targets that may disrupt xenograft tumor
formation. In particular, the proteins associated with the pY sites whose levels were
significantly altered between cells and tumors (Figure 2.3 B) may be targets with
antitumor or protumor activities. Moreover, Abl1 was implicated by PLSR analysis
(correlated best with Component 2, Figure 2.4 B) in tumors and it would be interesting to
120
see what role it plays in MM tumor biology. Because the tumor microenvironment gives
rise to enhanced proliferation, survival, and drug resistance in myeloma cells,
understanding the tumor biology may help to develop better drugs that can alleviate
symptoms of MM and eventually lead to a cure.
Alternatively, some interesting points raised by this study could also be followed up
in future investigations. Since published reports and my data indicate the presence of
more than one independent axis of pY signaling in MM, it would be interesting to see if
other pY-mediated functional modules (besides the ones already reported) can be found
in MM. To this end, the highly co-varied enzymes and pY sites, highlighted by the
“hotspots” in the correlation heatmap (Figure 2.6), could be examined in knock-down or
over-expression studies to decipher their functional relationship and map out the
associated regulatory pathways. Additionally, machine learning could be applied to train
models using the known data which may be used to predict cellular pY levels based on
the enzymatic states of the collection of TKs and PTPs in novel samples. It would be
truly astonishing if cellular pY profile can be predicted solely based on TK and PTP
states in a system.
5.2 Summary and Future Directions of the Comprehensive Protein-pY
Regulation Analysis in AML Samples
For the second data chapter of my thesis, I set out to investigate the interplay
between cellular pY, TKs, and PTPs in another disease model, namely, AML. To this end,
12 primary samples from newly diagnosed AML patients were analyzed by MS, which
produced quantitative profiles of protein pY in the 12 samples and expressed PTPs in
eight of the 12 samples. Unsupervised hierarchical clustering based on the quantitative
121
pY profile showed the presence of two patient sub-groups: groups with relatively high
and low levels of overall phosphorylation. Furthermore, I demonstrated that the total
level of Y phosphorylation in the samples were highly correlated with the summed levels
of TK A-loop phosphorylations, indicating that the activation of TKs in AML may exert a
great influence on cellular pY. Consistently, PLSR analysis showed that, with an eight-
component model, 100% of pY variations in the 12 samples could be predicted, with the
first three components collectively predicting 85.6% of the variations. These analyses
implicated two axes of TK-mediated pY regulation in AML: one through Syk, Fes, and
Fgr activation, which collectively explained 46% of pY variations, while the other axis
involved Abl2 and Lck (or Src, Yes, or Fyn), whose activation predicted 29% of pY
variations. Next, the co-variance between PTP expression and cellular pY was examined
in eight corresponding AML samples, which revealed generally positive correlations
between PTP and cellular pY levels, as well as demonstrated that cellular pY levels were
highly predictable based on PTP expression levels, with a single component predicting
98.88% of pY variations in the resultant model. This analysis implicated ten PTPs (Ptpn1,
Ptpn6, ptpn7, Ptpn9, Ptpn11, Ptpn12, Ptpra, Ptprc, Ptpre, and Ptpro) in pY regulation in
AML. Finally, this study provides an additional line of evidence in support of the
proposed model that TKs/PTPs systemically modulate cellular pY levels. The fact that
this model was demonstrated in AML in addition to MM implies that the systemic
regulation of pY could be a general phenomenon in biological systems.
Future investigations should include elucidation of the functional significances of
the TKs and PTPs implicated in this study of AML. Out of the 15 enzymes implicated by
my analysis, Ptpn11 and the majority of the TKs are already under heavy investigation,
122
however, the functional significance of the TK Abl2 and PTPs Ptpn1, Ptpn6, ptpn7, Ptpn9,
Ptpn12, Ptpra, Ptprc, Ptpre, and Ptpro in AML still needs clarification. Although its close
relative Abl1 is a well-studied oncoprotein, the research on Abl2 has so far been only
focused on breast cancer, where it was found to promote invasion and suppress tumor
growth (242). The fact that ABL2 is genetically fused to the ETV6/TEL oncogene in an
AML cell line implies that it may have a cancer-promoting role in AML. Investigating
the role of Abl2 in AML would be interesting and may reveal Abl2 as an oncogenic
target. Moreover, my data showed an astonishingly high degree of predictability of
cellular pY levels based on PTP expression (Figure 3.3 B), with all of the implicated
PTPs highly correlated with Component 1 of the model that explained 99.88% of pY
variations, implying a great dependency of cellular pY on PTPs. However, the interaction
mode between these highly correlated PTPs is unclear. One hypothesis is that a single
PTP may be at the top of the regulation chain and the other PTPs are all downstream
effectors of that PTP. If this were true, disruption of one PTP may have a great
consequential effect on the other PTPs as well as the overall pY profile in AML cells.
This theory can be tested with knock-down experiments. Alternatively, the PTPs may not
be controlled by a single upstream PTP, but may share responsibilities downstream of
one or more pathways. In this case, knocking down each PTP may lead to varied partial
responses, and an examination of the nature of the responses may reveal the interaction
mode of the PTPs. For example, PTPs impacting non-overlapping subsets of pY-
protein/PTP effectors may be independent regulators; conversely, partial to complete
overlap in the sets of downstream effectors may indicate cooperation between the PTPs.
Additionally, the phenotypic consequence of PTP disruption should be assessed in order
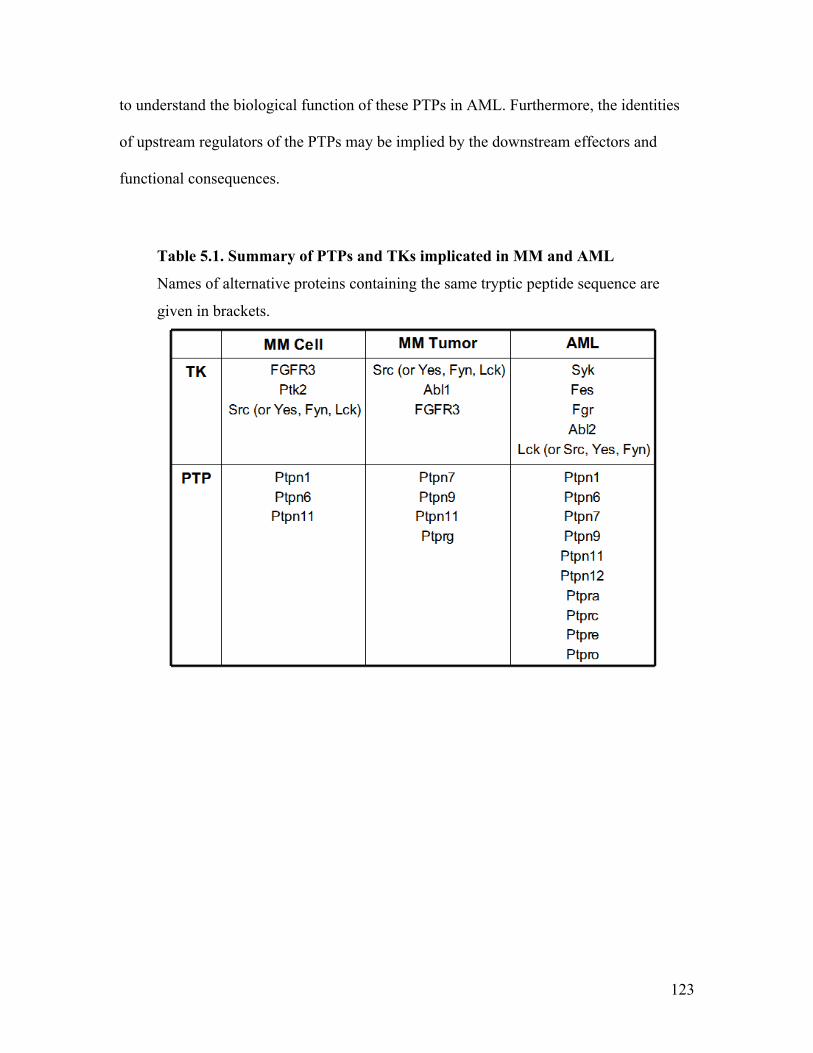
123
to understand the biological function of these PTPs in AML. Furthermore, the identities
of upstream regulators of the PTPs may be implied by the downstream effectors and
functional consequences.
Table 5.1. Summary of PTPs and TKs implicated in MM and AML
Names of alternative proteins containing the same tryptic peptide sequence are
given in brackets.
124
5.3 Summary and Future Directions of the Functional Study of Lyn
Y194 Phosphorylation
For the second question I proposed to answer with this thesis, I tested the binding
properties of SFK SH2 domain using Lyn SH2 as a model. The rationale for this study
was given by the observation that a conserved Y site (equivalent to Lyn Y194) in SFK
SH2 domains was prevalently phosphorylated in AML and CLL primary samples and
appeared to be regulated by phosphatase. Affinity purification using immobilized Lyn
SH2, unphosphorylated or phosphorylated at Y194, showed that Y194 phosphorylation
reduced Lyn SH2 binding to both phosphopeptides and phosphoproteins. These results
were confirmed by fluorescence polarization binding assays using designed pY-peptide
probes containing high-affinity and relatively low-affinity motifs for binding the Lyn
SH2 domain, which showed that, regardless of their relative affinities, binding of these
peptides were reduced by Y194 phosphorylation. Analysis of the SH2 and phospho-SH2
bound motifs showed a decreased selectivity for the pY+3 residue in the SH2-binding
ligands as a result of the Y194 phosphorylation, suggesting that pY194 changed the kinetics
of binding of the pY+3 residue. Therefore, my results indicate that tyrosine
phosphorylation of Lyn SH2 domain modulates its binding affinity and specificity, which
may be a general mode of regulation for all SFKs.
Future investigations should aim at placing the regulation through SH2 domain
phosphorylation of SFK into a biological context, in other words, the upstream events
that lead to SH2 domain phosphorylation and the downstream effectors as well as the
phenotypic output should be examined. Our lab initially identified Lyn Y194 as a site
preferentially phosphorylated in KMS12 mouse xenograft tumor compared to its cognate
125
cell line (139). This observation implies that Lyn pY194 could be downstream of the
various stimuli presented by the tumor microenvironment. Therefore, testing the impact
of cytokines highly implicated in MM (i.e. IL-6, FGF, or IGF-1) on Lyn Y194
phosphorylation state would be a good starting point for identifying the signaling
pathways that involve this phosphorylation. Alternatively, the proteins that I identified
would bind directly to Lyn SH2 or pSH2 in my study could be further explored for their
functional relationships to Lyn. These proteins are likely interaction partners that may be
upstream regulators or downstream effectors of Lyn. In particular, proteins that bound
differentially to Lyn SH2 and pSH2 may be involved in pathways that are modulated by
Lyn SH2 phosphorylation. Understanding their functional interplays may help to map out
the biological context of Lyn Y194 phosphorylation. Furthermore, site-directed
mutagenesis can also be used to substitute Lyn Y194 with a non-phosphorylatable residue,
such as phenylalanine. The phenotypic effect of this substitution could then be tested in
MM cells with cell assays, or in xenograft tumor systems to check its effect on MM
tumor development. Moreover, SH2 domain phosphorylation in other SFKs in various
normal and disease systems should be examined. Together, these data may draw a more
complete picture of the biological function of modulation through SFK SH2 domain
phosphorylations.
5.4 Concluding Remarks
Protein-tyrosine phosphorylation-mediated signaling, along with other regulated
physiological pathways, compose important aspects of life in that they control the growth,
division, and death decisions in the basic unit of all living organisms, the cell. It is a
process that must be tightly managed at all times to ensure that each cell carries out its

126
proper function within a multi-cellular organism. A disruption of this process can lead to
uncontrolled proliferation, which usually manifests as cancer in human beings. Returning
the pY signaling to its normal state in the diseased cells may restore the person back to
health. Proteomics studies allow a quick and comprehensive look at pY signaling and
related enzymatic states in a cell, which may help to decipher the regulatory pathways
and identify major disrupted enzymes in a disease system. Their coupled biochemical
studies, such as that demonstrated in Chapter 4, can help to gain mechanistic insights into
the regulation that may lay the foundation for therapeutic interventions. Together, these
studies serve to advance our current understanding of pY signaling and life, and may later
prove beneficial for finding a cure in the clinic.
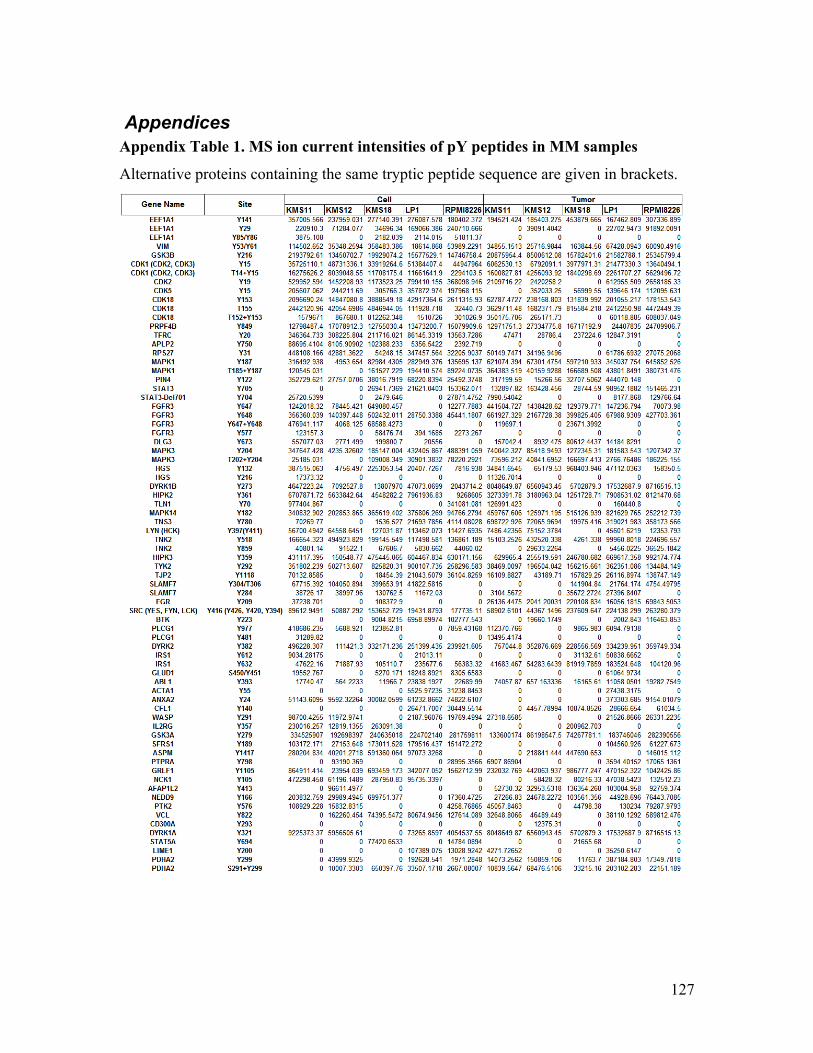
127
Appendices Appendix Table 1. MS ion current intensities of pY peptides in MM samples
Alternative proteins containing the same tryptic peptide sequence are given in brackets.
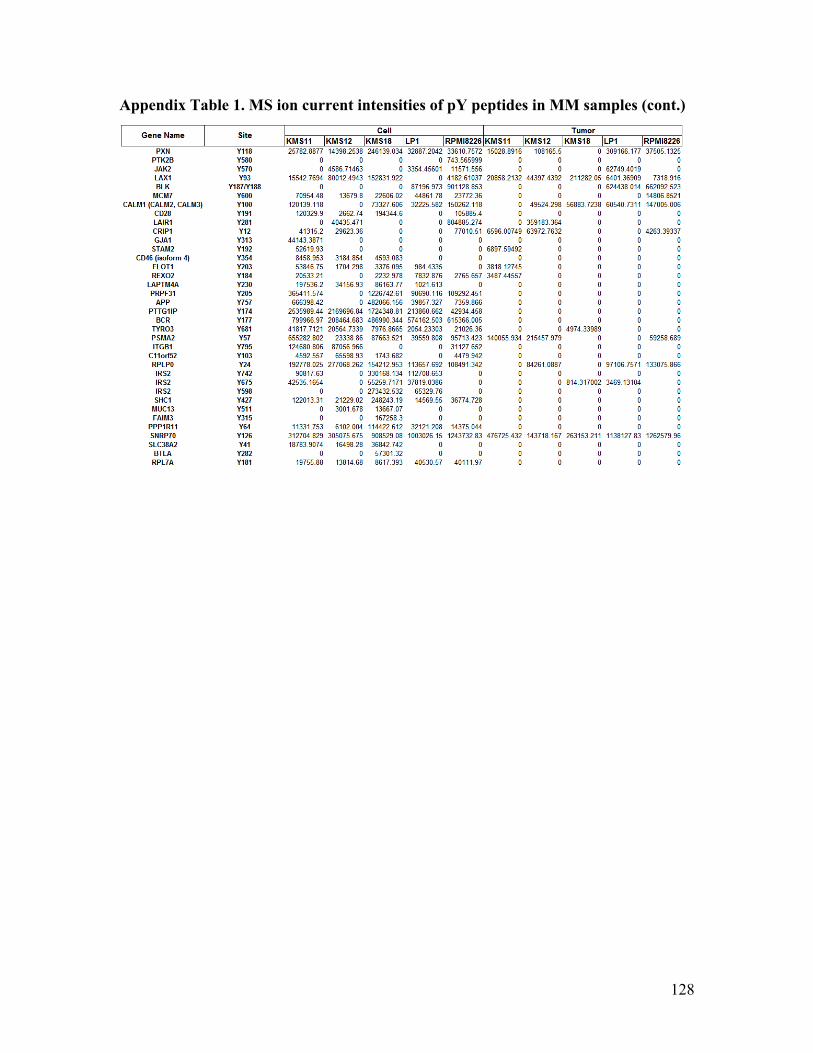
128
Appendix Table 1. MS ion current intensities of pY peptides in MM samples (cont.)
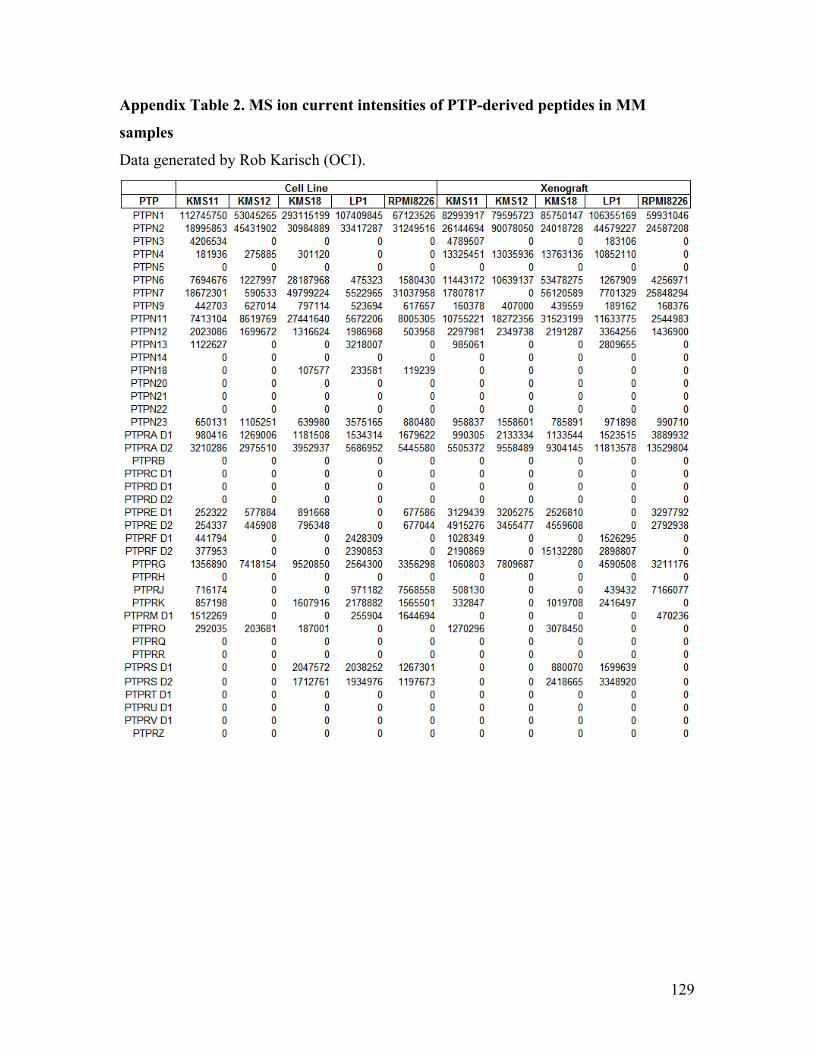
129
Appendix Table 2. MS ion current intensities of PTP-derived peptides in MM
samples
Data generated by Rob Karisch (OCI).
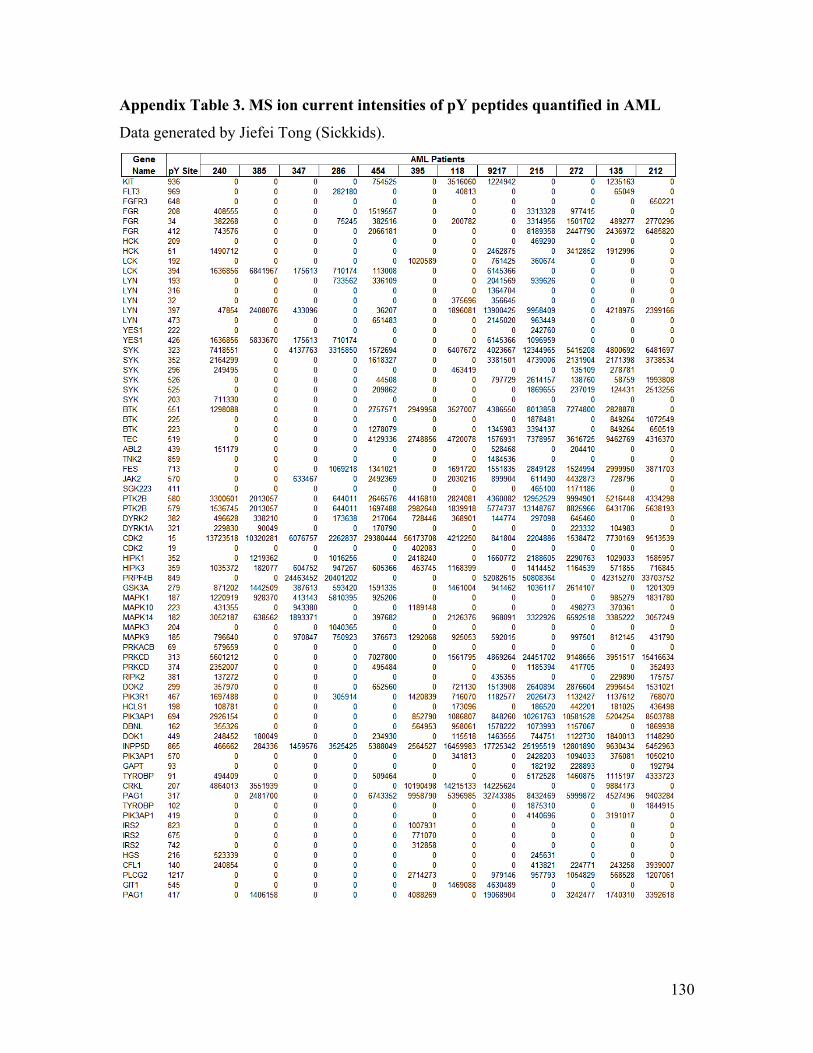
130
Appendix Table 3. MS ion current intensities of pY peptides quantified in AML
Data generated by Jiefei Tong (Sickkids).
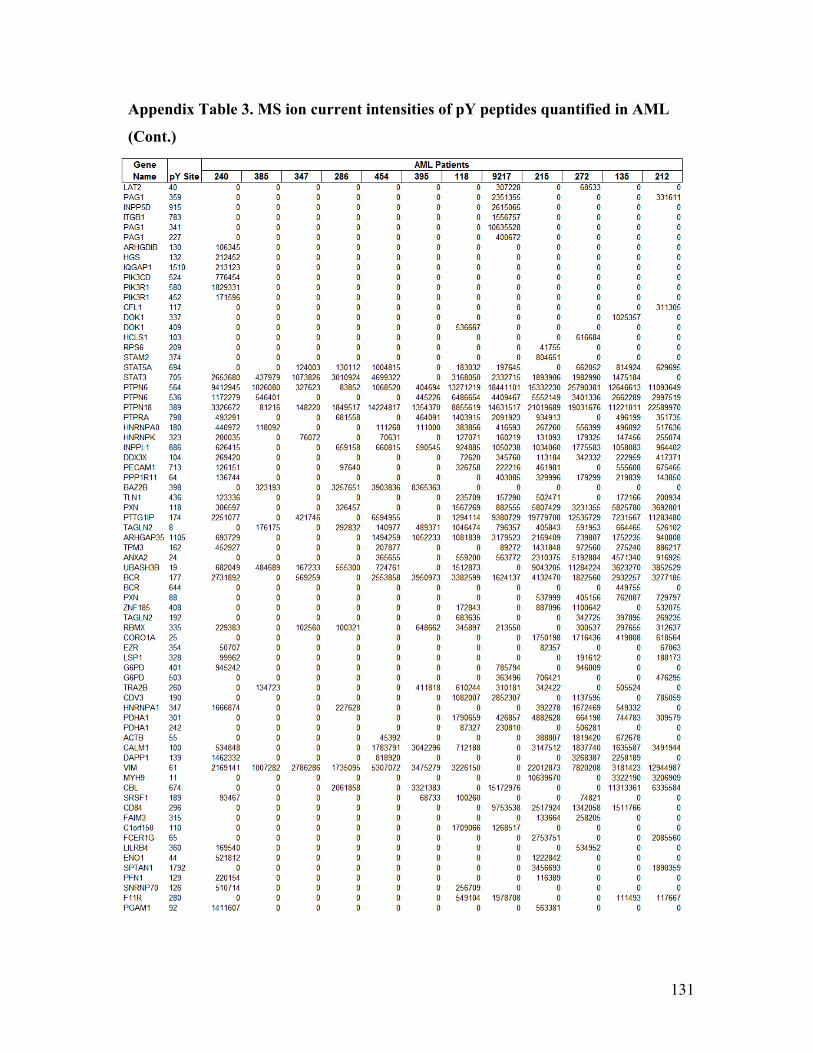
131
Appendix Table 3. MS ion current intensities of pY peptides quantified in AML
(Cont.)
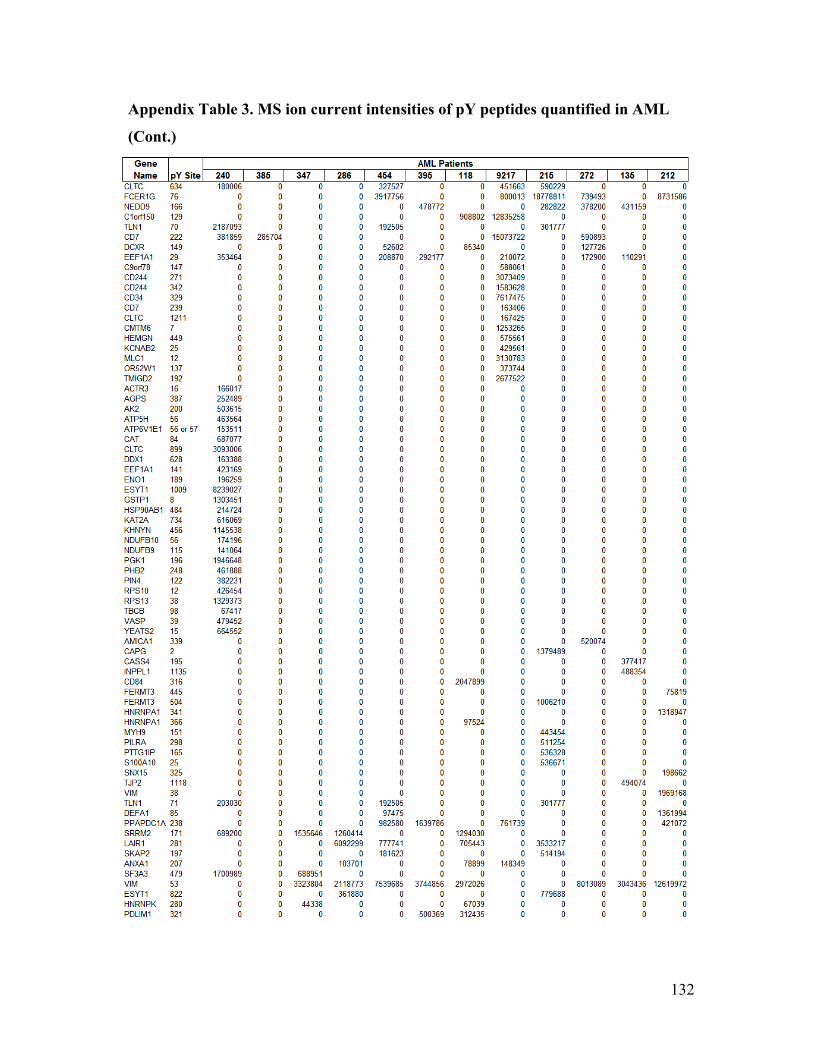
132
Appendix Table 3. MS ion current intensities of pY peptides quantified in AML
(Cont.)
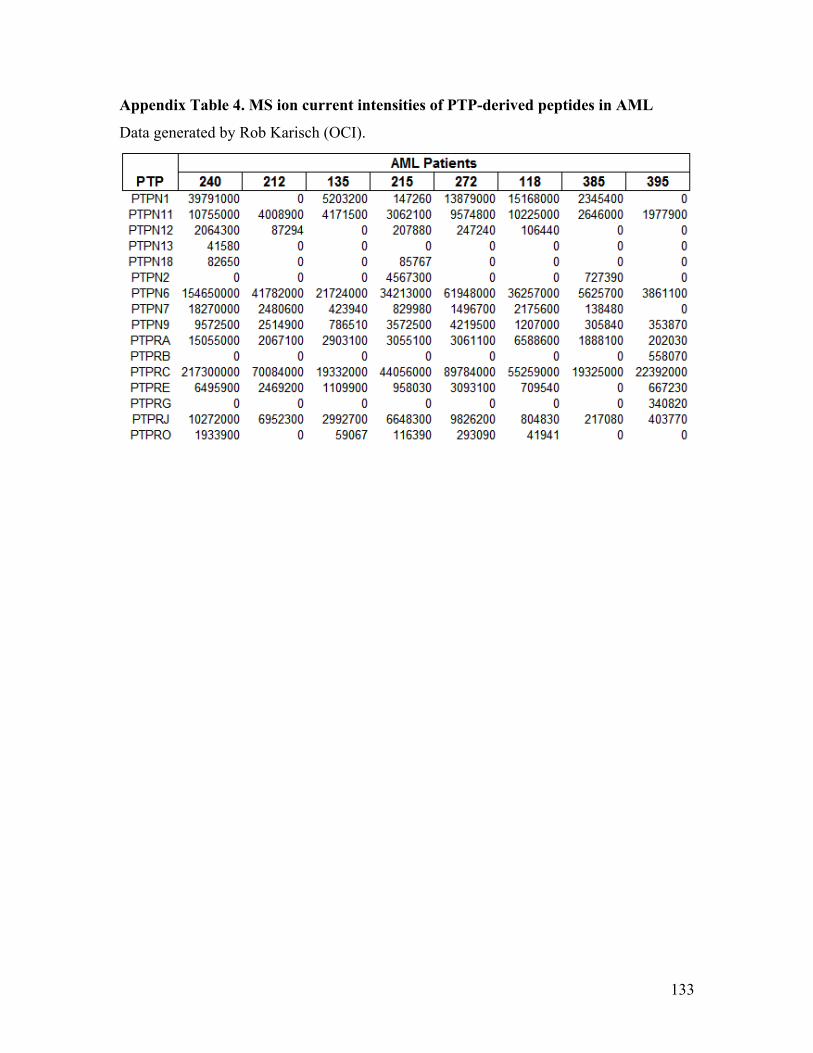
133
Appendix Table 4. MS ion current intensities of PTP-derived peptides in AML
Data generated by Rob Karisch (OCI).
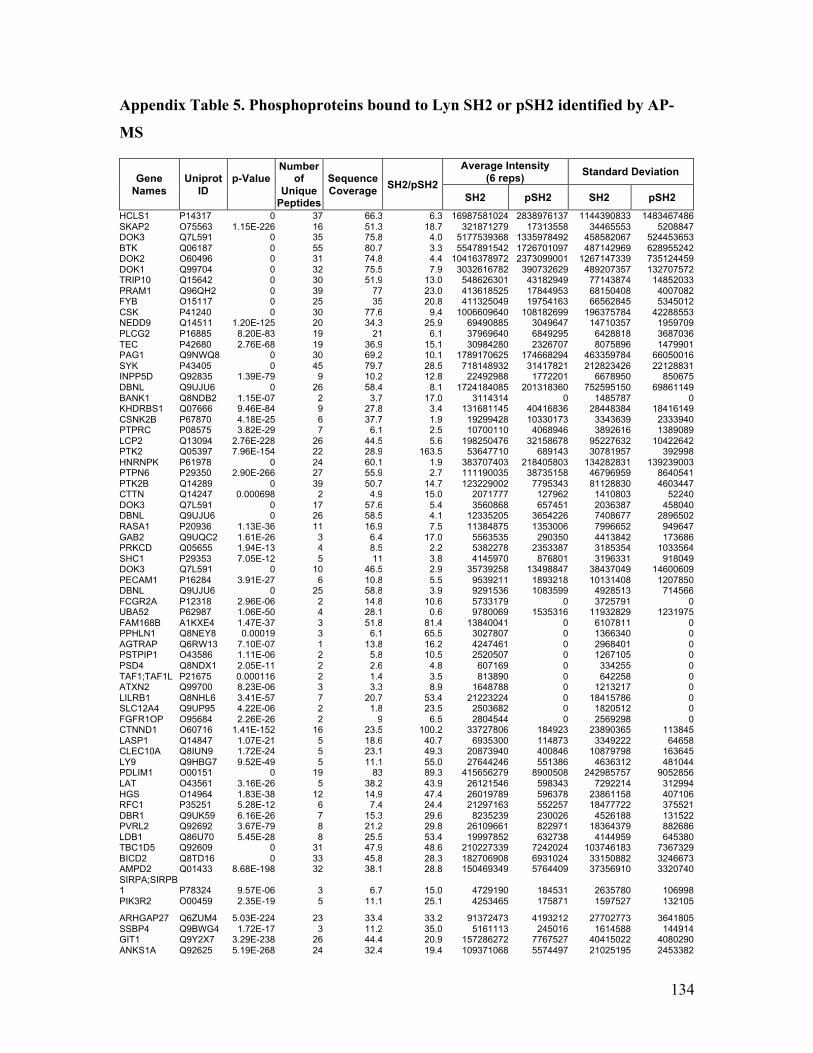
134
Appendix Table 5. Phosphoproteins bound to Lyn SH2 or pSH2 identified by AP-
MS
Gene Names
Uniprot ID
p-Value
Number of
Unique Peptides
Sequence Coverage SH2/pSH2
Average Intensity (6 reps) Standard Deviation
SH2 pSH2 SH2 pSH2 HCLS1 P14317 0 37 66.3 6.3 16987581024 2838976137 1144390833 1483467486 SKAP2 O75563 1.15E-226 16 51.3 18.7 321871279 17313558 34465553 5208847 DOK3 Q7L591 0 35 75.8 4.0 5177539368 1335978492 458582067 524453653 BTK Q06187 0 55 80.7 3.3 5547891542 1726701097 487142969 628955242 DOK2 O60496 0 31 74.8 4.4 10416378972 2373099001 1267147339 735124459 DOK1 Q99704 0 32 75.5 7.9 3032616782 390732629 489207357 132707572 TRIP10 Q15642 0 30 51.9 13.0 548626301 43182949 77143874 14852033 PRAM1 Q96QH2 0 39 77 23.0 413618525 17844953 68150408 4007082 FYB O15117 0 25 35 20.8 411325049 19754163 66562845 5345012 CSK P41240 0 30 77.6 9.4 1006609640 108182699 196375784 42288553 NEDD9 Q14511 1.20E-125 20 34.3 25.9 69490885 3049647 14710357 1959709 PLCG2 P16885 8.20E-83 19 21 6.1 37969640 6849295 6428818 3687036 TEC P42680 2.76E-68 19 36.9 15.1 30984280 2326707 8075896 1479901 PAG1 Q9NWQ8 0 30 69.2 10.1 1789170625 174668294 463359784 66050016 SYK P43405 0 45 79.7 28.5 718148932 31417821 212823426 22128831 INPP5D Q92835 1.39E-79 9 10.2 12.8 22492988 1772201 6678950 850675 DBNL Q9UJU6 0 26 58.4 8.1 1724184085 201318360 752595150 69861149 BANK1 Q8NDB2 1.15E-07 2 3.7 17.0 3114314 0 1485787 0 KHDRBS1 Q07666 9.46E-84 9 27.8 3.4 131681145 40416836 28448384 18416149 CSNK2B P67870 4.18E-25 6 37.7 1.9 19299428 10330173 3343639 2333940 PTPRC P08575 3.82E-29 7 6.1 2.5 10700110 4068946 3892616 1389089 LCP2 Q13094 2.76E-228 26 44.5 5.6 198250476 32158678 95227632 10422642 PTK2 Q05397 7.96E-154 22 28.9 163.5 53647710 689143 30781957 392998 HNRNPK P61978 0 24 60.1 1.9 383707403 218405803 134282831 139239003 PTPN6 P29350 2.90E-266 27 55.9 2.7 111190035 38735158 46796959 8640541 PTK2B Q14289 0 39 50.7 14.7 123229002 7795343 81128830 4603447 CTTN Q14247 0.000698 2 4.9 15.0 2071777 127962 1410803 52240 DOK3 Q7L591 0 17 57.6 5.4 3560868 657451 2036387 458040 DBNL Q9UJU6 0 26 58.5 4.1 12335205 3654226 7408677 2896502 RASA1 P20936 1.13E-36 11 16.9 7.5 11384875 1353006 7996652 949647 GAB2 Q9UQC2 1.61E-26 3 6.4 17.0 5563535 290350 4413842 173686 PRKCD Q05655 1.94E-13 4 8.5 2.2 5382278 2353387 3185354 1033564 SHC1 P29353 7.05E-12 5 11 3.8 4145970 876801 3196331 918049 DOK3 Q7L591 0 10 46.5 2.9 35739258 13498847 38437049 14600609 PECAM1 P16284 3.91E-27 6 10.8 5.5 9539211 1893218 10131408 1207850 DBNL Q9UJU6 0 25 58.8 3.9 9291536 1083599 4928513 714566 FCGR2A P12318 2.96E-06 2 14.8 10.6 5733179 0 3725791 0 UBA52 P62987 1.06E-50 4 28.1 0.6 9780069 1535316 11932829 1231975 FAM168B A1KXE4 1.47E-37 3 51.8 81.4 13840041 0 6107811 0 PPHLN1 Q8NEY8 0.00019 3 6.1 65.5 3027807 0 1366340 0 AGTRAP Q6RW13 7.10E-07 1 13.8 16.2 4247461 0 2968401 0 PSTPIP1 O43586 1.11E-06 2 5.8 10.5 2520507 0 1267105 0 PSD4 Q8NDX1 2.05E-11 2 2.6 4.8 607169 0 334255 0 TAF1;TAF1L P21675 0.000116 2 1.4 3.5 813890 0 642258 0 ATXN2 Q99700 8.23E-06 3 3.3 8.9 1648788 0 1213217 0 LILRB1 Q8NHL6 3.41E-57 7 20.7 53.4 21223224 0 18415786 0 SLC12A4 Q9UP95 4.22E-06 2 1.8 23.5 2503682 0 1820512 0 FGFR1OP O95684 2.26E-26 2 9 6.5 2804544 0 2569298 0 CTNND1 O60716 1.41E-152 16 23.5 100.2 33727806 184923 23890365 113845 LASP1 Q14847 1.07E-21 5 18.6 40.7 6935300 114873 3349222 64658 CLEC10A Q8IUN9 1.72E-24 5 23.1 49.3 20873940 400846 10879798 163645 LY9 Q9HBG7 9.52E-49 5 11.1 55.0 27644246 551386 4636312 481044 PDLIM1 O00151 0 19 83 89.3 415656279 8900508 242985757 9052856 LAT O43561 3.16E-26 5 38.2 43.9 26121546 598343 7292214 312994 HGS O14964 1.83E-38 12 14.9 47.4 26019789 596378 23861158 407106 RFC1 P35251 5.28E-12 6 7.4 24.4 21297163 552257 18477722 375521 DBR1 Q9UK59 6.16E-26 7 15.3 29.6 8235239 230026 4526188 131522 PVRL2 Q92692 3.67E-79 8 21.2 29.8 26109661 822971 18364379 882686 LDB1 Q86U70 5.45E-28 8 25.5 53.4 19997852 632738 4144959 645380 TBC1D5 Q92609 0 31 47.9 48.6 210227339 7242024 103746183 7367329 BICD2 Q8TD16 0 33 45.8 28.3 182706908 6931024 33150882 3246673 AMPD2 Q01433 8.68E-198 32 38.1 28.8 150469349 5764409 37356910 3320740 SIRPA;SIRPB1 P78324 9.57E-06 3 6.7 15.0 4729190 184531 2635780 106998 PIK3R2 O00459 2.35E-19 5 11.1 25.1 4253465 175871 1597527 132105
ARHGAP27 Q6ZUM4 5.03E-224 23 33.4 33.2 91372473 4193212 27702773 3641805 SSBP4 Q9BWG4 1.72E-17 3 11.2 35.0 5161113 245016 1614588 144914 GIT1 Q9Y2X7 3.29E-238 26 44.4 20.9 157286272 7767527 40415022 4080290 ANKS1A Q92625 5.19E-268 24 32.4 19.4 109371068 5574497 21025195 2453382
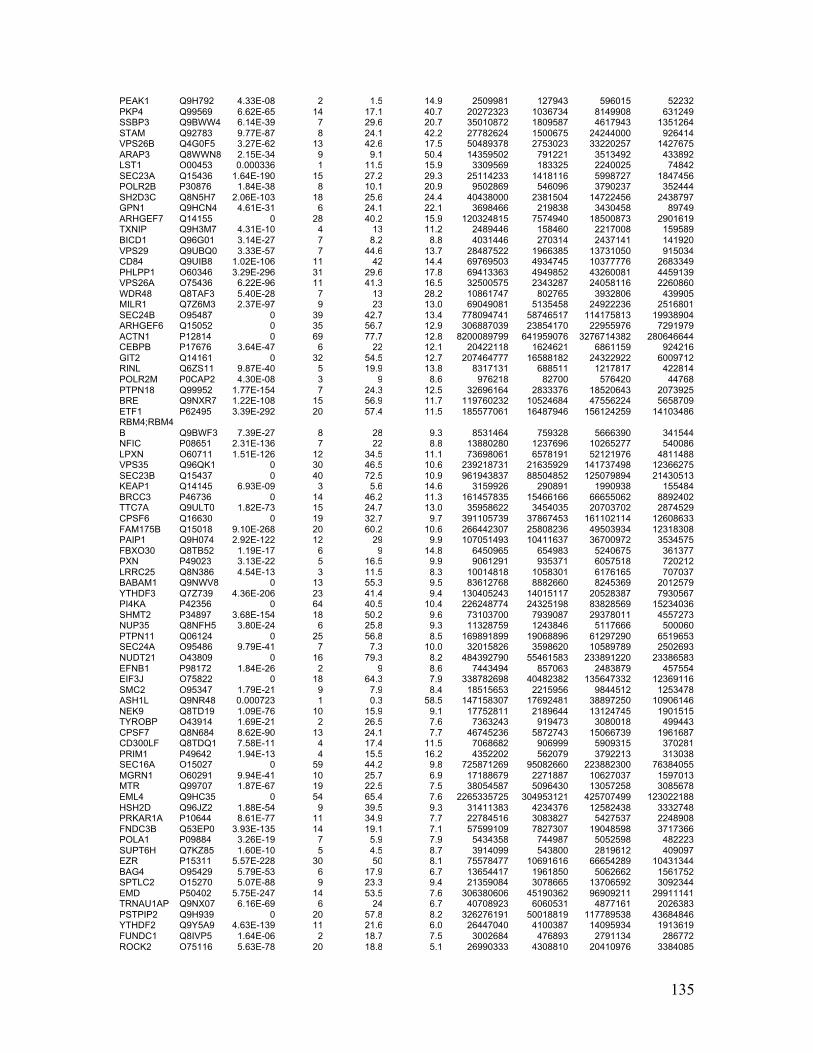
135
PEAK1 Q9H792 4.33E-08 2 1.5 14.9 2509981 127943 596015 52232 PKP4 Q99569 6.62E-65 14 17.1 40.7 20272323 1036734 8149908 631249 SSBP3 Q9BWW4 6.14E-39 7 29.6 20.7 35010872 1809587 4617943 1351264 STAM Q92783 9.77E-87 8 24.1 42.2 27782624 1500675 24244000 926414 VPS26B Q4G0F5 3.27E-62 13 42.6 17.5 50489378 2753023 33220257 1427675 ARAP3 Q8WWN8 2.15E-34 9 9.1 50.4 14359502 791221 3513492 433892 LST1 O00453 0.000336 1 11.5 15.9 3309569 183325 2240025 74842 SEC23A Q15436 1.64E-190 15 27.2 29.3 25114233 1418116 5998727 1847456 POLR2B P30876 1.84E-38 8 10.1 20.9 9502869 546096 3790237 352444 SH2D3C Q8N5H7 2.06E-103 18 25.6 24.4 40438000 2381504 14722456 2438797 GPN1 Q9HCN4 4.61E-31 6 24.1 22.1 3698466 219838 3430458 89749 ARHGEF7 Q14155 0 28 40.2 15.9 120324815 7574940 18500873 2901619 TXNIP Q9H3M7 4.31E-10 4 13 11.2 2489446 158460 2217008 159589 BICD1 Q96G01 3.14E-27 7 8.2 8.8 4031446 270314 2437141 141920 VPS29 Q9UBQ0 3.33E-57 7 44.6 13.7 28487522 1966385 13731050 915034 CD84 Q9UIB8 1.02E-106 11 42 14.4 69769503 4934745 10377776 2683349 PHLPP1 O60346 3.29E-296 31 29.6 17.8 69413363 4949852 43260081 4459139 VPS26A O75436 6.22E-96 11 41.3 16.5 32500575 2343287 24058116 2260860 WDR48 Q8TAF3 5.40E-28 7 13 28.2 10861747 802765 3932806 439905 MILR1 Q7Z6M3 2.37E-97 9 23 13.0 69049081 5135458 24922236 2516801 SEC24B O95487 0 39 42.7 13.4 778094741 58746517 114175813 19938904 ARHGEF6 Q15052 0 35 56.7 12.9 306887039 23854170 22955976 7291979 ACTN1 P12814 0 69 77.7 12.8 8200089799 641959076 3276714382 280646644 CEBPB P17676 3.64E-47 6 22 12.1 20422118 1624621 6861159 924216 GIT2 Q14161 0 32 54.5 12.7 207464777 16588182 24322922 6009712 RINL Q6ZS11 9.87E-40 5 19.9 13.8 8317131 688511 1217817 422814 POLR2M P0CAP2 4.30E-08 3 9 8.6 976218 82700 576420 44768 PTPN18 Q99952 1.77E-154 7 24.3 12.5 32696164 2833376 18520643 2073925 BRE Q9NXR7 1.22E-108 15 56.9 11.7 119760232 10524684 47556224 5658709 ETF1 P62495 3.39E-292 20 57.4 11.5 185577061 16487946 156124259 14103486 RBM4;RBM4B Q9BWF3 7.39E-27 8 28 9.3 8531464 759328 5666390 341544 NFIC P08651 2.31E-136 7 22 8.8 13880280 1237696 10265277 540086 LPXN O60711 1.51E-126 12 34.5 11.1 73698061 6578191 52121976 4811488 VPS35 Q96QK1 0 30 46.5 10.6 239218731 21635929 141737498 12366275 SEC23B Q15437 0 40 72.5 10.9 961943837 88504852 125079894 21430513 KEAP1 Q14145 6.93E-09 3 5.6 14.6 3159926 290891 1990938 155484 BRCC3 P46736 0 14 46.2 11.3 161457835 15466166 66655062 8892402 TTC7A Q9ULT0 1.82E-73 15 24.7 13.0 35958622 3454035 20703702 2874529 CPSF6 Q16630 0 19 32.7 9.7 391105739 37867453 161102114 12608633 FAM175B Q15018 9.10E-268 20 60.2 10.6 266442307 25808236 49503934 12318308 PAIP1 Q9H074 2.92E-122 12 29 9.9 107051493 10411637 36700972 3534575 FBXO30 Q8TB52 1.19E-17 6 9 14.8 6450965 654983 5240675 361377 PXN P49023 3.13E-22 5 16.5 9.9 9061291 935371 6057518 720212 LRRC25 Q8N386 4.54E-13 3 11.5 8.3 10014818 1058301 6176165 707037 BABAM1 Q9NWV8 0 13 55.3 9.5 83612768 8882660 8245369 2012579 YTHDF3 Q7Z739 4.36E-206 23 41.4 9.4 130405243 14015117 20528387 7930567 PI4KA P42356 0 64 40.5 10.4 226248774 24325198 83828569 15234036 SHMT2 P34897 3.68E-154 18 50.2 9.6 73103700 7939087 29378011 4557273 NUP35 Q8NFH5 3.80E-24 6 25.8 9.3 11328759 1243846 5117666 500060 PTPN11 Q06124 0 25 56.8 8.5 169891899 19068896 61297290 6519653 SEC24A O95486 9.79E-41 7 7.3 10.0 32015826 3598620 10589789 2502693 NUDT21 O43809 0 16 79.3 8.2 484392790 55461583 233891220 23386583 EFNB1 P98172 1.84E-26 2 9 8.6 7443494 857063 2483879 457554 EIF3J O75822 0 18 64.3 7.9 338782698 40482382 135647332 12369116 SMC2 O95347 1.79E-21 9 7.9 8.4 18515653 2215956 9844512 1253478 ASH1L Q9NR48 0.000723 1 0.3 58.5 147158307 17692481 38897250 10906146 NEK9 Q8TD19 1.09E-76 10 15.9 9.1 17752811 2189644 13124745 1901515 TYROBP O43914 1.69E-21 2 26.5 7.6 7363243 919473 3080018 499443 CPSF7 Q8N684 8.62E-90 13 24.1 7.7 46745236 5872743 15066739 1961687 CD300LF Q8TDQ1 7.58E-11 4 17.4 11.5 7068682 906999 5909315 370281 PRIM1 P49642 1.94E-13 4 15.5 16.2 4352202 562079 3792213 313038 SEC16A O15027 0 59 44.2 9.8 725871269 95082660 223882300 76384055 MGRN1 O60291 9.94E-41 10 25.7 6.9 17188679 2271887 10627037 1597013 MTR Q99707 1.87E-67 19 22.5 7.5 38054587 5096430 13057258 3085678 EML4 Q9HC35 0 54 65.4 7.6 2265335725 304953121 425707499 123022188 HSH2D Q96JZ2 1.88E-54 9 39.5 9.3 31411383 4234376 12582438 3332748 PRKAR1A P10644 8.61E-77 11 34.9 7.7 22784516 3083827 5427537 2248908 FNDC3B Q53EP0 3.93E-135 14 19.1 7.1 57599109 7827307 19048598 3717366 POLA1 P09884 3.26E-19 7 5.9 7.9 5434358 744987 5052598 482223 SUPT6H Q7KZ85 1.60E-10 5 4.5 8.7 3914099 543800 2819612 409097 EZR P15311 5.57E-228 30 50 8.1 75578477 10691616 66654289 10431344 BAG4 O95429 5.79E-53 6 17.9 6.7 13654417 1961850 5062662 1561752 SPTLC2 O15270 5.07E-88 9 23.3 9.4 21359084 3078665 13706592 3092344 EMD P50402 5.75E-247 14 53.5 7.6 306380606 45190362 96909211 29911141 TRNAU1AP Q9NX07 6.16E-69 6 24 6.7 40708923 6060531 4877161 2026383 PSTPIP2 Q9H939 0 20 57.8 8.2 326276191 50018819 117789538 43684846 YTHDF2 Q9Y5A9 4.63E-139 11 21.6 6.0 26447040 4100387 14095934 1913619 FUNDC1 Q8IVP5 1.64E-06 2 18.7 7.5 3002684 476893 2791134 286772 ROCK2 O75116 5.63E-78 20 18.8 5.1 26990333 4308810 20410976 3384085
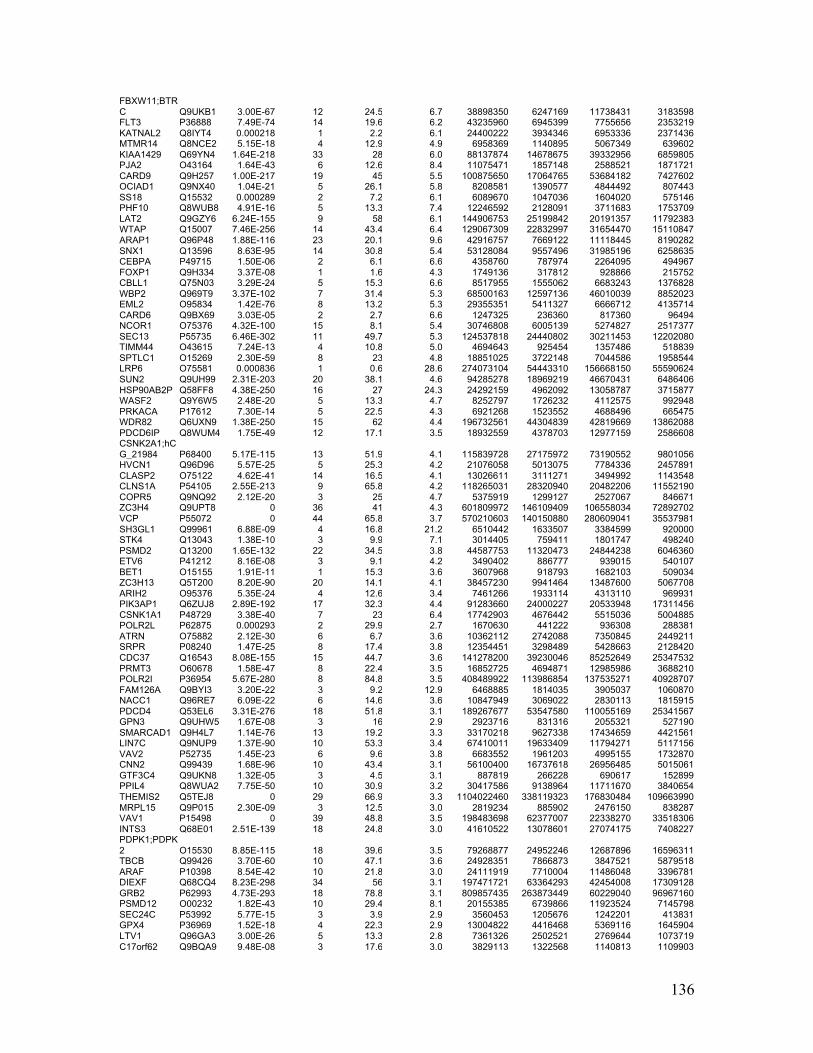
136
FBXW11;BTRC Q9UKB1 3.00E-67 12 24.5 6.7 38898350 6247169 11738431 3183598 FLT3 P36888 7.49E-74 14 19.6 6.2 43235960 6945399 7755656 2353219 KATNAL2 Q8IYT4 0.000218 1 2.2 6.1 24400222 3934346 6953336 2371436 MTMR14 Q8NCE2 5.15E-18 4 12.9 4.9 6958369 1140895 5067349 639602 KIAA1429 Q69YN4 1.64E-218 33 28 6.0 88137874 14678675 39332956 6859805 PJA2 O43164 1.64E-43 6 12.6 8.4 11075471 1857148 2588521 1871721 CARD9 Q9H257 1.00E-217 19 45 5.5 100875650 17064765 53684182 7427602 OCIAD1 Q9NX40 1.04E-21 5 26.1 5.8 8208581 1390577 4844492 807443 SS18 Q15532 0.000289 2 7.2 6.1 6089670 1047036 1604020 575146 PHF10 Q8WUB8 4.91E-16 5 13.3 7.4 12246592 2128091 3711683 1753709 LAT2 Q9GZY6 6.24E-155 9 58 6.1 144906753 25199842 20191357 11792383 WTAP Q15007 7.46E-256 14 43.4 6.4 129067309 22832997 31654470 15110847 ARAP1 Q96P48 1.88E-116 23 20.1 9.6 42916757 7669122 11118445 8190282 SNX1 Q13596 8.63E-95 14 30.8 5.4 53128084 9557496 31985196 6258635 CEBPA P49715 1.50E-06 2 6.1 6.6 4358760 787974 2264095 494967 FOXP1 Q9H334 3.37E-08 1 1.6 4.3 1749136 317812 928866 215752 CBLL1 Q75N03 3.29E-24 5 15.3 6.6 8517955 1555062 6683243 1376828 WBP2 Q969T9 3.37E-102 7 31.4 5.3 68500163 12597136 46010039 8852023 EML2 O95834 1.42E-76 8 13.2 5.3 29355351 5411327 6666712 4135714 CARD6 Q9BX69 3.03E-05 2 2.7 6.6 1247325 236360 817360 96494 NCOR1 O75376 4.32E-100 15 8.1 5.4 30746808 6005139 5274827 2517377 SEC13 P55735 6.46E-302 11 49.7 5.3 124537818 24440802 30211453 12202080 TIMM44 O43615 7.24E-13 4 10.8 5.0 4694643 925454 1357486 518839 SPTLC1 O15269 2.30E-59 8 23 4.8 18851025 3722148 7044586 1958544 LRP6 O75581 0.000836 1 0.6 28.6 274073104 54443310 156668150 55590624 SUN2 Q9UH99 2.31E-203 20 38.1 4.6 94285278 18969219 46670431 6486406 HSP90AB2P Q58FF8 4.38E-250 16 27 24.3 24292159 4962092 13058787 3715877 WASF2 Q9Y6W5 2.48E-20 5 13.3 4.7 8252797 1726232 4112575 992948 PRKACA P17612 7.30E-14 5 22.5 4.3 6921268 1523552 4688496 665475 WDR82 Q6UXN9 1.38E-250 15 62 4.4 196732561 44304839 42819669 13862088 PDCD6IP Q8WUM4 1.75E-49 12 17.1 3.5 18932559 4378703 12977159 2586608 CSNK2A1;hCG_21984 P68400 5.17E-115 13 51.9 4.1 115839728 27175972 73190552 9801056 HVCN1 Q96D96 5.57E-25 5 25.3 4.2 21076058 5013075 7784336 2457891 CLASP2 O75122 4.62E-41 14 16.5 4.1 13026611 3111271 3494992 1143548 CLNS1A P54105 2.55E-213 9 65.8 4.2 118265031 28320940 20482206 11552190 COPR5 Q9NQ92 2.12E-20 3 25 4.7 5375919 1299127 2527067 846671 ZC3H4 Q9UPT8 0 36 41 4.3 601809972 146109409 106558034 72892702 VCP P55072 0 44 65.8 3.7 570210603 140150880 280609041 35537981 SH3GL1 Q99961 6.88E-09 4 16.8 21.2 6510442 1633507 3384599 920000 STK4 Q13043 1.38E-10 3 9.9 7.1 3014405 759411 1801747 498240 PSMD2 Q13200 1.65E-132 22 34.5 3.8 44587753 11320473 24844238 6046360 ETV6 P41212 8.16E-08 3 9.1 4.2 3490402 886777 939015 540107 BET1 O15155 1.91E-11 1 15.3 3.6 3607968 918793 1682103 509034 ZC3H13 Q5T200 8.20E-90 20 14.1 4.1 38457230 9941464 13487600 5067708 ARIH2 O95376 5.35E-24 4 12.6 3.4 7461266 1933114 4313110 969931 PIK3AP1 Q6ZUJ8 2.89E-192 17 32.3 4.4 91283660 24000227 20533948 17311456 CSNK1A1 P48729 3.38E-40 7 23 6.4 17742903 4676442 5515036 5004885 POLR2L P62875 0.000293 2 29.9 2.7 1670630 441222 936308 288381 ATRN O75882 2.12E-30 6 6.7 3.6 10362112 2742088 7350845 2449211 SRPR P08240 1.47E-25 8 17.4 3.8 12354451 3298489 5428663 2128420 CDC37 Q16543 8.08E-155 15 44.7 3.6 141278200 39230046 85252649 25347532 PRMT3 O60678 1.58E-47 8 22.4 3.5 16852725 4694871 12985986 3688210 POLR2I P36954 5.67E-280 8 84.8 3.5 408489922 113986854 137535271 40928707 FAM126A Q9BYI3 3.20E-22 3 9.2 12.9 6468885 1814035 3905037 1060870 NACC1 Q96RE7 6.09E-22 6 14.6 3.6 10847949 3069022 2830113 1815915 PDCD4 Q53EL6 3.31E-276 18 51.8 3.1 189267677 53547580 110055169 25341567 GPN3 Q9UHW5 1.67E-08 3 16 2.9 2923716 831316 2055321 527190 SMARCAD1 Q9H4L7 1.14E-76 13 19.2 3.3 33170218 9627338 17434659 4421561 LIN7C Q9NUP9 1.37E-90 10 53.3 3.4 67410011 19633409 11794271 5117156 VAV2 P52735 1.45E-23 6 9.6 3.8 6683552 1961203 4995155 1732870 CNN2 Q99439 1.68E-96 10 43.4 3.1 56100400 16737618 26956485 5015061 GTF3C4 Q9UKN8 1.32E-05 3 4.5 3.1 887819 266228 690617 152899 PPIL4 Q8WUA2 7.75E-50 10 30.9 3.2 30417586 9138964 11711670 3840654 THEMIS2 Q5TEJ8 0 29 66.9 3.3 1104022460 338119323 176830484 109663990 MRPL15 Q9P015 2.30E-09 3 12.5 3.0 2819234 885902 2476150 838287 VAV1 P15498 0 39 48.8 3.5 198483698 62377007 22338270 33518306 INTS3 Q68E01 2.51E-139 18 24.8 3.0 41610522 13078601 27074175 7408227 PDPK1;PDPK2 O15530 8.85E-115 18 39.6 3.5 79268877 24952246 12687896 16596311 TBCB Q99426 3.70E-60 10 47.1 3.6 24928351 7866873 3847521 5879518 ARAF P10398 8.54E-42 10 21.8 3.0 24111919 7710004 11486048 3396781 DIEXF Q68CQ4 8.23E-298 34 56 3.1 197471721 63364293 42454008 17309128 GRB2 P62993 4.73E-293 18 78.8 3.1 809857435 263873449 60229040 96967160 PSMD12 O00232 1.82E-43 10 29.4 8.1 20155385 6739866 11923524 7145798 SEC24C P53992 5.77E-15 3 3.9 2.9 3560453 1205676 1242201 413831 GPX4 P36969 1.52E-18 4 22.3 2.9 13004822 4416468 5369116 1645904 LTV1 Q96GA3 3.00E-26 5 13.3 2.8 7361326 2502521 2769644 1073719 C17orf62 Q9BQA9 9.48E-08 3 17.6 3.0 3829113 1322568 1140813 1109903
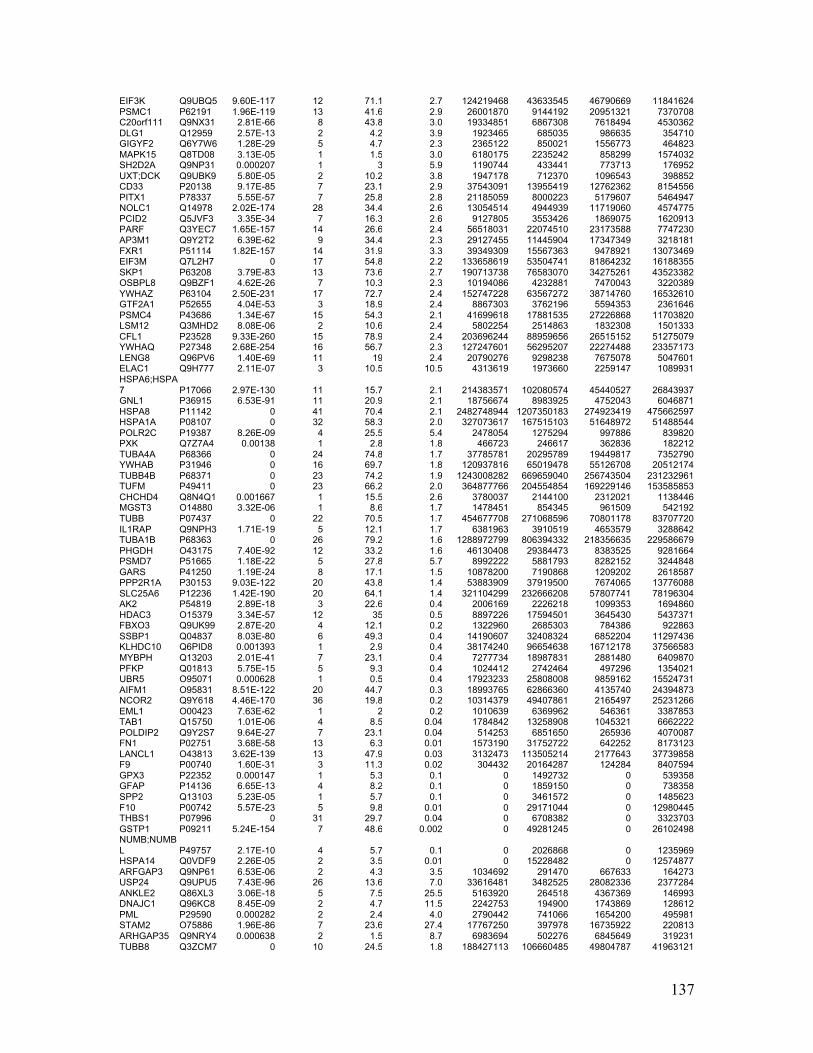
137
EIF3K Q9UBQ5 9.60E-117 12 71.1 2.7 124219468 43633545 46790669 11841624 PSMC1 P62191 1.96E-119 13 41.6 2.9 26001870 9144192 20951321 7370708 C20orf111 Q9NX31 2.81E-66 8 43.8 3.0 19334851 6867308 7618494 4530362 DLG1 Q12959 2.57E-13 2 4.2 3.9 1923465 685035 986635 354710 GIGYF2 Q6Y7W6 1.28E-29 5 4.7 2.3 2365122 850021 1556773 464823 MAPK15 Q8TD08 3.13E-05 1 1.5 3.0 6180175 2235242 858299 1574032 SH2D2A Q9NP31 0.000207 1 3 5.9 1190744 433441 773713 176952 UXT;DCK Q9UBK9 5.80E-05 2 10.2 3.8 1947178 712370 1096543 398852 CD33 P20138 9.17E-85 7 23.1 2.9 37543091 13955419 12762362 8154556 PITX1 P78337 5.55E-57 7 25.8 2.8 21185059 8000223 5179607 5464947 NOLC1 Q14978 2.02E-174 28 34.4 2.6 13054514 4944939 11719060 4574775 PCID2 Q5JVF3 3.35E-34 7 16.3 2.6 9127805 3553426 1869075 1620913 PARF Q3YEC7 1.65E-157 14 26.6 2.4 56518031 22074510 23173588 7747230 AP3M1 Q9Y2T2 6.39E-62 9 34.4 2.3 29127455 11445904 17347349 3218181 FXR1 P51114 1.82E-157 14 31.9 3.3 39349309 15567363 9478921 13073469 EIF3M Q7L2H7 0 17 54.8 2.2 133658619 53504741 81864232 16188355 SKP1 P63208 3.79E-83 13 73.6 2.7 190713738 76583070 34275261 43523382 OSBPL8 Q9BZF1 4.62E-26 7 10.3 2.3 10194086 4232881 7470043 3220389 YWHAZ P63104 2.50E-231 17 72.7 2.4 152747228 63567272 38714760 16532610 GTF2A1 P52655 4.04E-53 3 18.9 2.4 8867303 3762196 5594353 2361646 PSMC4 P43686 1.34E-67 15 54.3 2.1 41699618 17881535 27226868 11703820 LSM12 Q3MHD2 8.08E-06 2 10.6 2.4 5802254 2514863 1832308 1501333 CFL1 P23528 9.33E-260 15 78.9 2.4 203696244 88959656 26515152 51275079 YWHAQ P27348 2.68E-254 16 56.7 2.3 127247601 56295207 22274488 23357173 LENG8 Q96PV6 1.40E-69 11 19 2.4 20790276 9298238 7675078 5047601 ELAC1 Q9H777 2.11E-07 3 10.5 10.5 4313619 1973660 2259147 1089931 HSPA6;HSPA7 P17066 2.97E-130 11 15.7 2.1 214383571 102080574 45440527 26843937 GNL1 P36915 6.53E-91 11 20.9 2.1 18756674 8983925 4752043 6046871 HSPA8 P11142 0 41 70.4 2.1 2482748944 1207350183 274923419 475662597 HSPA1A P08107 0 32 58.3 2.0 327073617 167515103 51648972 51488544 POLR2C P19387 8.26E-09 4 25.5 5.4 2478054 1275294 997886 839820 PXK Q7Z7A4 0.00138 1 2.8 1.8 466723 246617 362836 182212 TUBA4A P68366 0 24 74.8 1.7 37785781 20295789 19449817 7352790 YWHAB P31946 0 16 69.7 1.8 120937816 65019478 55126708 20512174 TUBB4B P68371 0 23 74.2 1.9 1243008282 669659040 256743504 231232961 TUFM P49411 0 23 66.2 2.0 364877766 204554854 169229146 153585853 CHCHD4 Q8N4Q1 0.001667 1 15.5 2.6 3780037 2144100 2312021 1138446 MGST3 O14880 3.32E-06 1 8.6 1.7 1478451 854345 961509 542192 TUBB P07437 0 22 70.5 1.7 454677708 271068596 70801178 83707720 IL1RAP Q9NPH3 1.71E-19 5 12.1 1.7 6381963 3910519 4653579 3288642 TUBA1B P68363 0 26 79.2 1.6 1288972799 806394332 218356635 229586679 PHGDH O43175 7.40E-92 12 33.2 1.6 46130408 29384473 8383525 9281664 PSMD7 P51665 1.18E-22 5 27.8 5.7 8992222 5881793 8282152 3244848 GARS P41250 1.19E-24 8 17.1 1.5 10878200 7190868 1209202 2618587 PPP2R1A P30153 9.03E-122 20 43.8 1.4 53883909 37919500 7674065 13776088 SLC25A6 P12236 1.42E-190 20 64.1 1.4 321104299 232666208 57807741 78196304 AK2 P54819 2.89E-18 3 22.6 0.4 2006169 2226218 1099353 1694860 HDAC3 O15379 3.34E-57 12 35 0.5 8897226 17594501 3645430 5437371 FBXO3 Q9UK99 2.87E-20 4 12.1 0.2 1322960 2685303 784386 922863 SSBP1 Q04837 8.03E-80 6 49.3 0.4 14190607 32408324 6852204 11297436 KLHDC10 Q6PID8 0.001393 1 2.9 0.4 38174240 96654638 16712178 37566583 MYBPH Q13203 2.01E-41 7 23.1 0.4 7277734 18987831 2881480 6409870 PFKP Q01813 5.75E-15 5 9.3 0.4 1024412 2742464 497296 1354021 UBR5 O95071 0.000628 1 0.5 0.4 17923233 25808008 9859162 15524731 AIFM1 O95831 8.51E-122 20 44.7 0.3 18993765 62866360 4135740 24394873 NCOR2 Q9Y618 4.46E-170 36 19.8 0.2 10314379 49407861 2165497 25231266 EML1 O00423 7.63E-62 1 2 0.2 1010639 6369962 546361 3387853 TAB1 Q15750 1.01E-06 4 8.5 0.04 1784842 13258908 1045321 6662222 POLDIP2 Q9Y2S7 9.64E-27 7 23.1 0.04 514253 6851650 265936 4070087 FN1 P02751 3.68E-58 13 6.3 0.01 1573190 31752722 642252 8173123 LANCL1 O43813 3.62E-139 13 47.9 0.03 3132473 113505214 2177643 37739858 F9 P00740 1.60E-31 3 11.3 0.02 304432 20164287 124284 8407594 GPX3 P22352 0.000147 1 5.3 0.1 0 1492732 0 539358 GFAP P14136 6.65E-13 4 8.2 0.1 0 1859150 0 738358 SPP2 Q13103 5.23E-05 1 5.7 0.1 0 3461572 0 1485623 F10 P00742 5.57E-23 5 9.8 0.01 0 29171044 0 12980445 THBS1 P07996 0 31 29.7 0.04 0 6708382 0 3323703 GSTP1 P09211 5.24E-154 7 48.6 0.002 0 49281245 0 26102498 NUMB;NUMBL P49757 2.17E-10 4 5.7 0.1 0 2026868 0 1235969 HSPA14 Q0VDF9 2.26E-05 2 3.5 0.01 0 15228482 0 12574877 ARFGAP3 Q9NP61 6.53E-06 2 4.3 3.5 1034692 291470 667633 164273 USP24 Q9UPU5 7.43E-96 26 13.6 7.0 33616481 3482525 28082336 2377284 ANKLE2 Q86XL3 3.06E-18 5 7.5 25.5 5163920 264518 4367369 146993 DNAJC1 Q96KC8 8.45E-09 2 4.7 11.5 2242753 194900 1743869 128612 PML P29590 0.000282 2 2.4 4.0 2790442 741066 1654200 495981 STAM2 O75886 1.96E-86 7 23.6 27.4 17767250 397978 16735922 220813 ARHGAP35 Q9NRY4 0.000638 2 1.5 8.7 6983694 502276 6845649 319231 TUBB8 Q3ZCM7 0 10 24.5 1.8 188427113 106660485 49804787 41963121
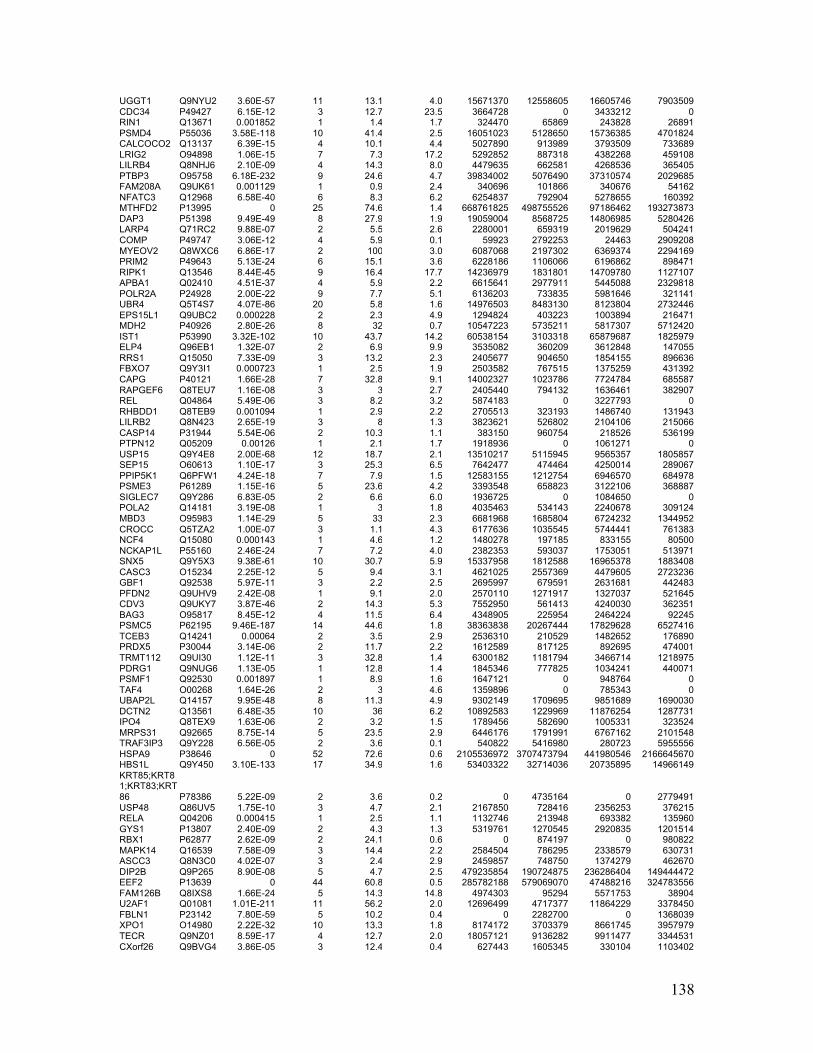
138
UGGT1 Q9NYU2 3.60E-57 11 13.1 4.0 15671370 12558605 16605746 7903509 CDC34 P49427 6.15E-12 3 12.7 23.5 3664728 0 3433212 0 RIN1 Q13671 0.001852 1 1.4 1.7 324470 65869 243828 26891 PSMD4 P55036 3.58E-118 10 41.4 2.5 16051023 5128650 15736385 4701824 CALCOCO2 Q13137 6.39E-15 4 10.1 4.4 5027890 913989 3793509 733689 LRIG2 O94898 1.06E-15 7 7.3 17.2 5292852 887318 4382268 459108 LILRB4 Q8NHJ6 2.10E-09 4 14.3 8.0 4479635 662581 4268536 365405 PTBP3 O95758 6.18E-232 9 24.6 4.7 39834002 5076490 37310574 2029685 FAM208A Q9UK61 0.001129 1 0.9 2.4 340696 101866 340676 54162 NFATC3 Q12968 6.58E-40 6 8.3 6.2 6254837 792904 5278655 160392 MTHFD2 P13995 0 25 74.6 1.4 668761825 498755526 97186462 193273873 DAP3 P51398 9.49E-49 8 27.9 1.9 19059004 8568725 14806985 5280426 LARP4 Q71RC2 9.88E-07 2 5.5 2.6 2280001 659319 2019629 504241 COMP P49747 3.06E-12 4 5.9 0.1 59923 2792253 24463 2909208 MYEOV2 Q8WXC6 6.86E-17 2 100 3.0 6087068 2197302 6369374 2294169 PRIM2 P49643 5.13E-24 6 15.1 3.6 6228186 1106066 6196862 898471 RIPK1 Q13546 8.44E-45 9 16.4 17.7 14236979 1831801 14709780 1127107 APBA1 Q02410 4.51E-37 4 5.9 2.2 6615641 2977911 5445088 2329818 POLR2A P24928 2.00E-22 9 7.7 5.1 6136203 733835 5981646 321141 UBR4 Q5T4S7 4.07E-86 20 5.8 1.6 14976503 8483130 8123804 2732446 EPS15L1 Q9UBC2 0.000228 2 2.3 4.9 1294824 403223 1003894 216471 MDH2 P40926 2.80E-26 8 32 0.7 10547223 5735211 5817307 5712420 IST1 P53990 3.32E-102 10 43.7 14.2 60538154 3103318 65879687 1825979 ELP4 Q96EB1 1.32E-07 2 6.9 9.9 3535082 360209 3612848 147055 RRS1 Q15050 7.33E-09 3 13.2 2.3 2405677 904650 1854155 896636 FBXO7 Q9Y3I1 0.000723 1 2.5 1.9 2503582 767515 1375259 431392 CAPG P40121 1.66E-28 7 32.8 9.1 14002327 1023786 7724784 685587 RAPGEF6 Q8TEU7 1.16E-08 3 3 2.7 2405440 794132 1636461 382907 REL Q04864 5.49E-06 3 8.2 3.2 5874183 0 3227793 0 RHBDD1 Q8TEB9 0.001094 1 2.9 2.2 2705513 323193 1486740 131943 LILRB2 Q8N423 2.65E-19 3 8 1.3 3823621 526802 2104106 215066 CASP14 P31944 5.54E-06 2 10.3 1.1 383150 960754 218526 536199 PTPN12 Q05209 0.00126 1 2.1 1.7 1918936 0 1061271 0 USP15 Q9Y4E8 2.00E-68 12 18.7 2.1 13510217 5115945 9565357 1805857 SEP15 O60613 1.10E-17 3 25.3 6.5 7642477 474464 4250014 289067 PPIP5K1 Q6PFW1 4.24E-18 7 7.9 1.5 12583155 1212754 6946570 684978 PSME3 P61289 1.15E-16 5 23.6 4.2 3393548 658823 3122106 368887 SIGLEC7 Q9Y286 6.83E-05 2 6.6 6.0 1936725 0 1084650 0 POLA2 Q14181 3.19E-08 1 3 1.8 4035463 534143 2240678 309124 MBD3 O95983 1.14E-29 5 33 2.3 6681968 1685804 6724232 1344952 CROCC Q5TZA2 1.00E-07 3 1.1 4.3 6177636 1035545 5744441 761383 NCF4 Q15080 0.000143 1 4.6 1.2 1480278 197185 833155 80500 NCKAP1L P55160 2.46E-24 7 7.2 4.0 2382353 593037 1753051 513971 SNX5 Q9Y5X3 9.38E-61 10 30.7 5.9 15337958 1812588 16965378 1883408 CASC3 O15234 2.25E-12 5 9.4 3.1 4621025 2557369 4479605 2723236 GBF1 Q92538 5.97E-11 3 2.2 2.5 2695997 679591 2631681 442483 PFDN2 Q9UHV9 2.42E-08 1 9.1 2.0 2570110 1271917 1327037 521645 CDV3 Q9UKY7 3.87E-46 2 14.3 5.3 7552950 561413 4240030 362351 BAG3 O95817 8.45E-12 4 11.5 6.4 4348905 225954 2464224 92245 PSMC5 P62195 9.46E-187 14 44.6 1.8 38363838 20267444 17829628 6527416 TCEB3 Q14241 0.00064 2 3.5 2.9 2536310 210529 1482652 176890 PRDX5 P30044 3.14E-06 2 11.7 2.2 1612589 817125 892695 474001 TRMT112 Q9UI30 1.12E-11 3 32.8 1.4 6300182 1181794 3466714 1218975 PDRG1 Q9NUG6 1.13E-05 1 12.8 1.4 1845346 777825 1034241 440071 PSMF1 Q92530 0.001897 1 8.9 1.6 1647121 0 948764 0 TAF4 O00268 1.64E-26 2 3 4.6 1359896 0 785343 0 UBAP2L Q14157 9.95E-48 8 11.3 4.9 9302149 1709695 9851689 1690030 DCTN2 Q13561 6.48E-35 10 36 6.2 10892583 1229969 11876254 1287731 IPO4 Q8TEX9 1.63E-06 2 3.2 1.5 1789456 582690 1005331 323524 MRPS31 Q92665 8.75E-14 5 23.5 2.9 6446176 1791991 6767162 2101548 TRAF3IP3 Q9Y228 6.56E-05 2 3.6 0.1 540822 5416980 280723 5955556 HSPA9 P38646 0 52 72.6 0.6 2105536972 3707473794 441980546 2166645670 HBS1L Q9Y450 3.10E-133 17 34.9 1.6 53403322 32714036 20735895 14966149 KRT85;KRT81;KRT83;KRT86 P78386 5.22E-09 2 3.6 0.2 0 4735164 0 2779491 USP48 Q86UV5 1.75E-10 3 4.7 2.1 2167850 728416 2356253 376215 RELA Q04206 0.000415 1 2.5 1.1 1132746 213948 693382 135960 GYS1 P13807 2.40E-09 2 4.3 1.3 5319761 1270545 2920835 1201514 RBX1 P62877 2.62E-09 2 24.1 0.6 0 874197 0 980822 MAPK14 Q16539 7.58E-09 3 14.4 2.2 2584504 786295 2338579 630731 ASCC3 Q8N3C0 4.02E-07 3 2.4 2.9 2459857 748750 1374279 462670 DIP2B Q9P265 8.90E-08 5 4.7 2.5 479235854 190724875 236286404 149444472 EEF2 P13639 0 44 60.8 0.5 285782188 579069070 47488216 324783556 FAM126B Q8IXS8 1.66E-24 5 14.3 14.8 4974303 95294 5571753 38904 U2AF1 Q01081 1.01E-211 11 56.2 2.0 12696499 4717377 11864229 3378450 FBLN1 P23142 7.80E-59 5 10.2 0.4 0 2282700 0 1368039 XPO1 O14980 2.22E-32 10 13.3 1.8 8174172 3703379 8661745 3957979 TECR Q9NZ01 8.59E-17 4 12.7 2.0 18057121 9136282 9911477 3344531 CXorf26 Q9BVG4 3.86E-05 3 12.4 0.4 627443 1605345 330104 1103402
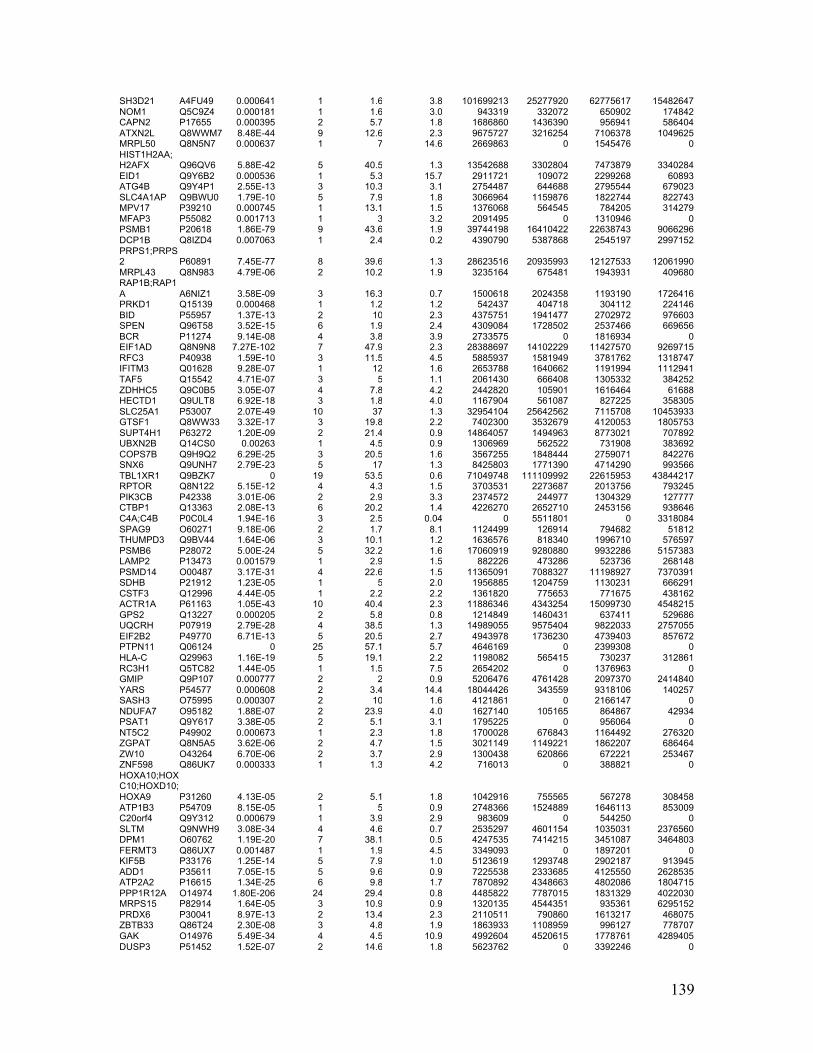
139
SH3D21 A4FU49 0.000641 1 1.6 3.8 101699213 25277920 62775617 15482647 NOM1 Q5C9Z4 0.000181 1 1.6 3.0 943319 332072 650902 174842 CAPN2 P17655 0.000395 2 5.7 1.8 1686860 1436390 956941 586404 ATXN2L Q8WWM7 8.48E-44 9 12.6 2.3 9675727 3216254 7106378 1049625 MRPL50 Q8N5N7 0.000637 1 7 14.6 2669863 0 1545476 0 HIST1H2AA;H2AFX Q96QV6 5.88E-42 5 40.5 1.3 13542688 3302804 7473879 3340284 EID1 Q9Y6B2 0.000536 1 5.3 15.7 2911721 109072 2299268 60893 ATG4B Q9Y4P1 2.55E-13 3 10.3 3.1 2754487 644688 2795544 679023 SLC4A1AP Q9BWU0 1.79E-10 5 7.9 1.8 3066964 1159876 1822744 822743 MPV17 P39210 0.000745 1 13.1 1.5 1376068 564545 784205 314279 MFAP3 P55082 0.001713 1 3 3.2 2091495 0 1310946 0 PSMB1 P20618 1.86E-79 9 43.6 1.9 39744198 16410422 22638743 9066296 DCP1B Q8IZD4 0.007063 1 2.4 0.2 4390790 5387868 2545197 2997152 PRPS1;PRPS2 P60891 7.45E-77 8 39.6 1.3 28623516 20935993 12127533 12061990 MRPL43 Q8N983 4.79E-06 2 10.2 1.9 3235164 675481 1943931 409680 RAP1B;RAP1A A6NIZ1 3.58E-09 3 16.3 0.7 1500618 2024358 1193190 1726416 PRKD1 Q15139 0.000468 1 1.2 1.2 542437 404718 304112 224146 BID P55957 1.37E-13 2 10 2.3 4375751 1941477 2702972 976603 SPEN Q96T58 3.52E-15 6 1.9 2.4 4309084 1728502 2537466 669656 BCR P11274 9.14E-08 4 3.8 3.9 2733575 0 1816934 0 EIF1AD Q8N9N8 7.27E-102 7 47.9 2.3 28388697 14102229 11427570 9269715 RFC3 P40938 1.59E-10 3 11.5 4.5 5885937 1581949 3781762 1318747 IFITM3 Q01628 9.28E-07 1 12 1.6 2653788 1640662 1191994 1112941 TAF5 Q15542 4.71E-07 3 5 1.1 2061430 666408 1305332 384252 ZDHHC5 Q9C0B5 3.05E-07 4 7.8 4.2 2442820 105901 1616464 61688 HECTD1 Q9ULT8 6.92E-18 3 1.8 4.0 1167904 561087 827225 358305 SLC25A1 P53007 2.07E-49 10 37 1.3 32954104 25642562 7115708 10453933 GTSF1 Q8WW33 3.32E-17 3 19.8 2.2 7402300 3532679 4120053 1805753 SUPT4H1 P63272 1.20E-09 2 21.4 0.9 14864057 1494963 8773021 707892 UBXN2B Q14CS0 0.00263 1 4.5 0.9 1306969 562522 731908 383692 COPS7B Q9H9Q2 6.29E-25 3 20.5 1.6 3567255 1848444 2759071 842276 SNX6 Q9UNH7 2.79E-23 5 17 1.3 8425803 1771390 4714290 993566 TBL1XR1 Q9BZK7 0 19 53.5 0.6 71049748 111109992 22615953 43844217 RPTOR Q8N122 5.15E-12 4 4.3 1.5 3703531 2273687 2013756 793245 PIK3CB P42338 3.01E-06 2 2.9 3.3 2374572 244977 1304329 127777 CTBP1 Q13363 2.08E-13 6 20.2 1.4 4226270 2652710 2453156 938646 C4A;C4B P0C0L4 1.94E-16 3 2.5 0.04 0 5511801 0 3318084 SPAG9 O60271 9.18E-06 2 1.7 8.1 1124499 126914 794682 51812 THUMPD3 Q9BV44 1.64E-06 3 10.1 1.2 1636576 818340 1996710 576597 PSMB6 P28072 5.00E-24 5 32.2 1.6 17060919 9280880 9932286 5157383 LAMP2 P13473 0.001579 1 2.9 1.5 882226 473286 523736 268148 PSMD14 O00487 3.17E-31 4 22.6 1.5 11365091 7088327 11198927 7370391 SDHB P21912 1.23E-05 1 5 2.0 1956885 1204759 1130231 666291 CSTF3 Q12996 4.44E-05 1 2.2 2.2 1361820 775653 771675 438162 ACTR1A P61163 1.05E-43 10 40.4 2.3 11886346 4343254 15099730 4548215 GPS2 Q13227 0.000205 2 5.8 0.8 1214849 1460431 637411 529686 UQCRH P07919 2.79E-28 4 38.5 1.3 14989055 9575404 9822033 2757055 EIF2B2 P49770 6.71E-13 5 20.5 2.7 4943978 1736230 4739403 857672 PTPN11 Q06124 0 25 57.1 5.7 4646169 0 2399308 0 HLA-C Q29963 1.16E-19 5 19.1 2.2 1198082 565415 730237 312861 RC3H1 Q5TC82 1.44E-05 1 1.5 7.5 2654202 0 1376963 0 GMIP Q9P107 0.000777 2 2 0.9 5206476 4761428 2097370 2414840 YARS P54577 0.000608 2 3.4 14.4 18044426 343559 9318106 140257 SASH3 O75995 0.000307 2 10 1.6 4121861 0 2166147 0 NDUFA7 O95182 1.88E-07 2 23.9 4.0 1627140 105165 864867 42934 PSAT1 Q9Y617 3.38E-05 2 5.1 3.1 1795225 0 956064 0 NT5C2 P49902 0.000673 1 2.3 1.8 1700028 676843 1164492 276320 ZGPAT Q8N5A5 3.62E-06 2 4.7 1.5 3021149 1149221 1862207 686464 ZW10 O43264 6.70E-06 2 3.7 2.9 1300438 620866 672221 253467 ZNF598 Q86UK7 0.000333 1 1.3 4.2 716013 0 388821 0 HOXA10;HOXC10;HOXD10;HOXA9 P31260 4.13E-05 2 5.1 1.8 1042916 755565 567278 308458 ATP1B3 P54709 8.15E-05 1 5 0.9 2748366 1524889 1646113 853009 C20orf4 Q9Y312 0.000679 1 3.9 2.9 983609 0 544250 0 SLTM Q9NWH9 3.08E-34 4 4.6 0.7 2535297 4601154 1035031 2376560 DPM1 O60762 1.19E-20 7 38.1 0.5 4247535 7414215 3451087 3464803 FERMT3 Q86UX7 0.001487 1 1.9 4.5 3349093 0 1897201 0 KIF5B P33176 1.25E-14 5 7.9 1.0 5123619 1293748 2902187 913945 ADD1 P35611 7.05E-15 5 9.6 0.9 7225538 2333685 4125550 2628535 ATP2A2 P16615 1.34E-25 6 9.8 1.7 7870892 4348663 4802086 1804715 PPP1R12A O14974 1.80E-206 24 29.4 0.8 4485822 7787015 1831329 4022030 MRPS15 P82914 1.64E-05 3 10.9 0.9 1320135 4544351 935361 6295152 PRDX6 P30041 8.97E-13 2 13.4 2.3 2110511 790860 1613217 468075 ZBTB33 Q86T24 2.30E-08 3 4.8 1.9 1863933 1108959 996127 778707 GAK O14976 5.49E-34 4 4.5 10.9 4992604 4520615 1778761 4289405 DUSP3 P51452 1.52E-07 2 14.6 1.8 5623762 0 3392246 0
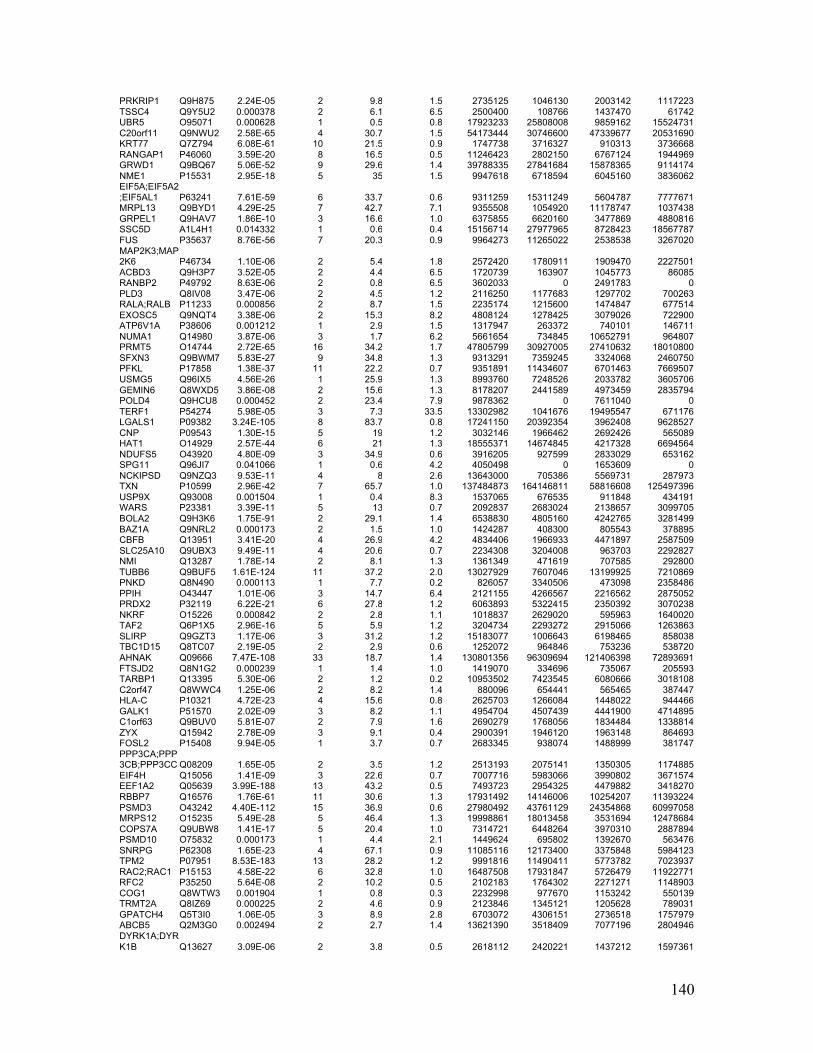
140
PRKRIP1 Q9H875 2.24E-05 2 9.8 1.5 2735125 1046130 2003142 1117223 TSSC4 Q9Y5U2 0.000378 2 6.1 6.5 2500400 108766 1437470 61742 UBR5 O95071 0.000628 1 0.5 0.8 17923233 25808008 9859162 15524731 C20orf11 Q9NWU2 2.58E-65 4 30.7 1.5 54173444 30746600 47339677 20531690 KRT77 Q7Z794 6.08E-61 10 21.5 0.9 1747738 3716327 910313 3736668 RANGAP1 P46060 3.59E-20 8 16.5 0.5 11246423 2802150 6767124 1944969 GRWD1 Q9BQ67 5.06E-52 9 29.6 1.4 39788335 27841684 15878365 9114174 NME1 P15531 2.95E-18 5 35 1.5 9947618 6718594 6045160 3836062 EIF5A;EIF5A2;EIF5AL1 P63241 7.61E-59 6 33.7 0.6 9311259 15311249 5604787 7777671 MRPL13 Q9BYD1 4.29E-25 7 42.7 7.1 9355508 1054920 11178747 1037438 GRPEL1 Q9HAV7 1.86E-10 3 16.6 1.0 6375855 6620160 3477869 4880816 SSC5D A1L4H1 0.014332 1 0.6 0.4 15156714 27977965 8728423 18567787 FUS P35637 8.76E-56 7 20.3 0.9 9964273 11265022 2538538 3267020 MAP2K3;MAP2K6 P46734 1.10E-06 2 5.4 1.8 2572420 1780911 1909470 2227501 ACBD3 Q9H3P7 3.52E-05 2 4.4 6.5 1720739 163907 1045773 86085 RANBP2 P49792 8.63E-06 2 0.8 6.5 3602033 0 2491783 0 PLD3 Q8IV08 3.47E-06 2 4.5 1.2 2116250 1177683 1297702 700263 RALA;RALB P11233 0.000856 2 8.7 1.5 2235174 1215600 1474847 677514 EXOSC5 Q9NQT4 3.38E-06 2 15.3 8.2 4808124 1278425 3079026 722900 ATP6V1A P38606 0.001212 1 2.9 1.5 1317947 263372 740101 146711 NUMA1 Q14980 3.87E-06 3 1.7 6.2 5661654 734845 10652791 964807 PRMT5 O14744 2.72E-65 16 34.2 1.7 47805799 30927005 27410632 18010800 SFXN3 Q9BWM7 5.83E-27 9 34.8 1.3 9313291 7359245 3324068 2460750 PFKL P17858 1.38E-37 11 22.2 0.7 9351891 11434607 6701463 7669507 USMG5 Q96IX5 4.56E-26 1 25.9 1.3 8993760 7248526 2033782 3605706 GEMIN6 Q8WXD5 3.86E-08 2 15.6 1.3 8178207 2441589 4973459 2835794 POLD4 Q9HCU8 0.000452 2 23.4 7.9 9878362 0 7611040 0 TERF1 P54274 5.98E-05 3 7.3 33.5 13302982 1041676 19495547 671176 LGALS1 P09382 3.24E-105 8 83.7 0.8 17241150 20392354 3962408 9628527 CNP P09543 1.30E-15 5 19 1.2 3032146 1966462 2692426 565089 HAT1 O14929 2.57E-44 6 21 1.3 18555371 14674845 4217328 6694564 NDUFS5 O43920 4.80E-09 3 34.9 0.6 3916205 927599 2833029 653162 SPG11 Q96JI7 0.041066 1 0.6 4.2 4050498 0 1653609 0 NCKIPSD Q9NZQ3 9.53E-11 4 8 2.6 13643000 705386 5569731 287973 TXN P10599 2.96E-42 7 65.7 1.0 137484873 164146811 58816608 125497396 USP9X Q93008 0.001504 1 0.4 8.3 1537065 676535 911848 434191 WARS P23381 3.39E-11 5 13 0.7 2092837 2683024 2138657 3099705 BOLA2 Q9H3K6 1.75E-91 2 29.1 1.4 6538830 4805160 4242765 3281499 BAZ1A Q9NRL2 0.000173 2 1.5 1.0 1424287 408300 805543 378895 CBFB Q13951 3.41E-20 4 26.9 4.2 4834406 1966933 4471897 2587509 SLC25A10 Q9UBX3 9.49E-11 4 20.6 0.7 2234308 3204008 963703 2292827 NMI Q13287 1.78E-14 2 8.1 1.3 1361349 471619 707585 292800 TUBB6 Q9BUF5 1.61E-124 11 37.2 2.0 13027929 7607046 13199925 7210869 PNKD Q8N490 0.000113 1 7.7 0.2 826057 3340506 473098 2358486 PPIH O43447 1.01E-06 3 14.7 6.4 2121155 4266567 2216562 2875052 PRDX2 P32119 6.22E-21 6 27.8 1.2 6063893 5322415 2350392 3070238 NKRF O15226 0.000842 2 2.8 1.1 1018837 2629020 595963 1640020 TAF2 Q6P1X5 2.96E-16 5 5.9 1.2 3204734 2293272 2915066 1263863 SLIRP Q9GZT3 1.17E-06 3 31.2 1.2 15183077 1006643 6198465 858038 TBC1D15 Q8TC07 2.19E-05 2 2.9 0.6 1252072 964846 753236 538720 AHNAK Q09666 7.47E-108 33 18.7 1.4 130801356 96309694 121406398 72893691 FTSJD2 Q8N1G2 0.000239 1 1.4 1.0 1419070 334696 735067 205593 TARBP1 Q13395 5.30E-06 2 1.2 0.2 10953502 7423545 6080666 3018108 C2orf47 Q8WWC4 1.25E-06 2 8.2 1.4 880096 654441 565465 387447 HLA-C P10321 4.72E-23 4 15.6 0.8 2625703 1266084 1448022 944466 GALK1 P51570 2.02E-09 3 8.2 1.1 4954704 4507439 4441900 4714895 C1orf63 Q9BUV0 5.81E-07 2 7.9 1.6 2690279 1768056 1834484 1338814 ZYX Q15942 2.78E-09 3 9.1 0.4 2900391 1946120 1963148 864693 FOSL2 P15408 9.94E-05 1 3.7 0.7 2683345 938074 1488999 381747 PPP3CA;PPP3CB;PPP3CC Q08209 1.65E-05 2 3.5 1.2 2513193 2075141 1350305 1174885 EIF4H Q15056 1.41E-09 3 22.6 0.7 7007716 5983066 3990802 3671574 EEF1A2 Q05639 3.99E-188 13 43.2 0.5 7493723 2954325 4479882 3418270 RBBP7 Q16576 1.76E-61 11 30.6 1.3 17931492 14146006 10254207 11393224 PSMD3 O43242 4.40E-112 15 36.9 0.6 27980492 43761129 24354868 60997058 MRPS12 O15235 5.49E-28 5 46.4 1.3 19998861 18013458 3531694 12478684 COPS7A Q9UBW8 1.41E-17 5 20.4 1.0 7314721 6448264 3970310 2887894 PSMD10 O75832 0.000173 1 4.4 2.1 1449624 695802 1392670 563476 SNRPG P62308 1.65E-23 4 67.1 0.9 11085116 12173400 3375848 5984123 TPM2 P07951 8.53E-183 13 28.2 1.2 9991816 11490411 5773782 7023937 RAC2;RAC1 P15153 4.58E-22 6 32.8 1.0 16487508 17931847 5726479 11922771 RFC2 P35250 5.64E-08 2 10.2 0.5 2102183 1764302 2271271 1148903 COG1 Q8WTW3 0.001904 1 0.8 0.3 2232998 977670 1153242 550139 TRMT2A Q8IZ69 0.000225 2 4.6 0.9 2123846 1345121 1205628 789031 GPATCH4 Q5T3I0 1.06E-05 3 8.9 2.8 6703072 4306151 2736518 1757979 ABCB5 Q2M3G0 0.002494 2 2.7 1.4 13621390 3518409 7077196 2804946 DYRK1A;DYRK1B Q13627 3.09E-06 2 3.8 0.5 2618112 2420221 1437212 1597361

141
EEF1A1;EEF1A1P5 P68104 0 21 61.3 1.1 1082415951 1042579709 157362550 422879353 MED15 Q96RN5 7.08E-09 1 2.3 1.3 941843 558199 491441 349635 TAF6 P49848 0.000144 2 3.5 0.4 1899667 1589496 1174362 1358158 ERP44 Q9BS26 1.43E-09 3 12.3 0.4 2451526 1769065 1495433 1423459 STIP1 P31948 7.86E-13 5 11.2 1.0 4699245 2201251 2861011 1419258 MAT2A P31153 3.76E-08 3 8.9 0.5 1515005 1390644 819683 799256 PRDX1 Q06830 8.83E-182 13 68.8 1.1 167798160 165169370 71657120 115128408 RPS6KA3;RPS6KA6;RPS6KA1;RPS6KA2 P51812 0.000549 2 3.4 0.6 1123388 666856 658183 346279

142
References
1 Machida, K., Mayer, B. J., and Nollau, P. (2003) Profiling the global tyrosine phosphorylation state. Mol Cell Proteomics. 2, 215-233 2 Blume-Jensen, P., Hunter, T. (2001) Oncogenic kinase signalling. Nature. 411, 355-365 3 Hunter, T. (1989) Protein modification: phosphorylation on tyrosine residues. Current Opinion in Cell Biology. 1, 1168-1181 4 Pawson, T., and Nash, P. (2003) Assembly of cell regulatory systems through protein interaction domains. Science. 300, 445-452 5 Pawson, T., and Kofler, M. (2009) Kinome signaling through regulated protein-protein interactions in normal and cancer cells. Curr Opin Cell Biol. 21, 147-153 6 Hunter, T. (2009) Tyrosine phosphorylation: thirty years and counting. Curr Opin Cell Biol. 21, 140-146 7 Arora, A., and Scholar, E. M. (2005) Role of tyrosine kinase inhibitors in cancer therapy. J Pharmacol Exp Ther. 315, 971-979 8 Zhang, J., Yang, P. L., and Gray, N. S. (2009) Targeting cancer with small molecule kinase inhibitors. Nat Rev Cancer. 9, 28-39 9 Robinson, D. R., Wu, Y. M., and Lin, S. F. (2000) The protein tyrosine kinase family of the human genome. Oncogene. 19, 5548-5557 10 Parsons, J. T., and Weber, M. J. (1989) Genetics of src: structure and functional organization of a protein tyrosine kinase. Curr Top Microbiol Immunol. 147, 79-127 11 Hubbard, S. R., and Till, J. H. (2000) Protein tyrosine kinase structure and function. Annu Rev Biochem. 69, 373-398 12 Rawlings, J. S., Rosler, K. M., and Harrison, D. A. (2004) The JAK/STAT signaling pathway. J Cell Sci. 117, 1281-1283 13 Nishizumi, H., Horikawa, K., Mlinaric-Rascan, I., and Yamamoto, T. (1998) A double-edged kinase Lyn: a positive and negative regulator for antigen receptor-mediated signals. J Exp Med. 187, 1343-1348 14 Sada, K., Minami, Y., and Yamamura, H. (1997) Relocation of Syk protein-tyrosine kinase to the actin filament network and subsequent association with Fak. Eur J Biochem. 248, 827-833 15 Brickell, P. M. (1992) The p60c-src family of protein-tyrosine kinases: structure, regulation, and function. Crit Rev Oncog. 3, 401-446 16 Boggon, T. J., and Eck, M. J. (2004) Structure and regulation of Src family kinases. Oncogene. 23, 7918-7927 17 Yamaguchi, H., and Hendrickson, W. A. (1996) Structural basis for activation of human lymphocyte kinase Lck upon tyrosine phosphorylation. Nature. 384, 484-489 18 Xu, W., Doshi, A., Lei, M., Eck, M. J., and Harrison, S. C. (1999) Crystal structures of c-Src reveal features of its autoinhibitory mechanism. Mol Cell. 3, 629-638 19 Xu, W., Harrison, S.C. and Eck , M.J. . (1997) Three-dimensional structure of the tyrosine kinase c-Src. Nature. 385, 595-602 20 Sicheri, F., and Kuriyan, J. (1997) Structures of Src-family tyrosine kinases. Curr Opin Struct Biol. 7, 777-785
143
21 Stover, D. R., Furet, P., and Lydon, N. B. (1996) Modulation of the SH2 binding specificity and kinase activity of Src by tyrosine phosphorylation within its SH2 domain. J Biol Chem. 271, 12481-12487 22 Ingley, E. (2008) Src family kinases: regulation of their activities, levels and identification of new pathways. Biochim Biophys Acta. 1784, 56-65 23 Parsons, S. J., and Parsons, J. T. (2004) Src family kinases, key regulators of signal transduction. Oncogene. 23, 7906-7909 24 Sen, B., and Johnson, F. M. (2011) Regulation of SRC family kinases in human cancers. J Signal Transduct. 2011, 865819 25 Xu, Y., Harder, K. W., Huntington, N. D., Hibbs, M. L., and Tarlinton, D. M. (2005) Lyn tyrosine kinase: accentuating the positive and the negative. Immunity. 22, 9-18 26 Hallek, M., Neumann, C., Schaffer, M., Danhauser-Riedl, S., von Bubnoff, N., de Vos, G., Druker, B. J., Yasukawa, K., Griffin, J. D., and Emmerich, B. (1997) Signal transduction of interleukin-6 involves tyrosine phosphorylation of multiple cytosolic proteins and activation of Src-family kinases Fyn, Hck, and Lyn in multiple myeloma cell lines. Exp Hematol. 25, 1367-1377 27 Ishikawa, H., Tsuyama, N., Abroun, S., Liu, S., Li, F. J., Taniguchi, O., and Kawano, M. M. (2002) Requirements of src family kinase activity associated with CD45 for myeloma cell proliferation by interleukin-6. Blood. 99, 2172-2178 28 Iqbal, M. S., Tsuyama, N., Obata, M., and Ishikawa, H. (2010) A novel signaling pathway associated with Lyn, PI 3-kinase and Akt supports the proliferation of myeloma cells. Biochem Biophys Res Commun. 392, 415-420 29 Dos Santos, C., Demur, C., Bardet, V., Prade-Houdellier, N., Payrastre, B., and Recher, C. (2008) A critical role for Lyn in acute myeloid leukemia. Blood. 111, 2269-2279 30 Tonks, N. K. (2006) Protein tyrosine phosphatases: from genes, to function, to disease. Nat Rev Mol Cell Biol. 7, 833-846 31 Julien, S. G., Dube, N., Hardy, S., and Tremblay, M. L. (2011) Inside the human cancer tyrosine phosphatome. Nat Rev Cancer. 11, 35-49 32 Alonso, A., Sasin, J., Bottini, N., Friedberg, I., Osterman, A., Godzik, A., Hunter, T., Dixon, J., and Mustelin, T. (2004) Protein tyrosine phosphatases in the human genome. Cell. 117, 699-711 33 Zhang, Z. Y. (2003) Mechanistic studies on protein tyrosine phosphatases. Prog Nucleic Acid Res Mol Biol. 73, 171-220 34 Meng, T. C., Fukada, T., and Tonks, N. K. (2002) Reversible oxidation and inactivation of protein tyrosine phosphatases in vivo. Mol Cell. 9, 387-399 35 Sundaresan, M., Yu, Z. X., Ferrans, V. J., Irani, K., and Finkel, T. (1995) Requirement for generation of H2O2 for platelet-derived growth factor signal transduction. Science. 270, 296-299 36 Meng, T. C., Buckley, D. A., Galic, S., Tiganis, T., and Tonks, N. K. (2004) Regulation of insulin signaling through reversible oxidation of the protein-tyrosine phosphatases TC45 and PTP1B. J Biol Chem. 279, 37716-37725 37 Singh, D. K., Kumar, D., Siddiqui, Z., Basu, S. K., Kumar, V., and Rao, K. V. (2005) The strength of receptor signaling is centrally controlled through a cooperative loop between Ca2+ and an oxidant signal. Cell. 121, 281-293
144
38 Songyang, Z., Shoelson, S. E., McGlade, J., Olivier, P., Pawson, T., Bustelo, X. R., Barbacid, M., Sabe, H., Hanafusa, H., Yi, T., and et al. (1994) Specific motifs recognized by the SH2 domains of Csk, 3BP2, fps/fes, GRB-2, HCP, SHC, Syk, and Vav. Mol Cell Biol. 14, 2777-2785 39 Li, W., Young, S. L., King, N., and Miller, W. T. (2008) Signaling properties of a non-metazoan Src kinase and the evolutionary history of Src negative regulation. J Biol Chem. 283, 15491-15501 40 Liu, B. A., Jablonowski, K., Raina, M., Arce, M., Pawson, T., and Nash, P. D. (2006) The human and mouse complement of SH2 domain proteins-establishing the boundaries of phosphotyrosine signaling. Mol Cell. 22, 851-868 41 Waksman, G., Kominos, D., Robertson, S. C., Pant, N., Baltimore, D., Birge, R. B., Cowburn, D., Hanafusa, H., Mayer, B. J., Overduin, M., Resh, M. D., Rios, C. B., Silverman, L., and Kuriyan, J. (1992) Crystal structure of the phosphotyrosine recognition domain SH2 of v-src complexed with tyrosine-phosphorylated peptides. Nature. 358, 646-653 42 Waksman, G., Kumaran, S., and Lubman, O. (2004) SH2 domains: role, structure and implications for molecular medicine. Expert Rev Mol Med. 6, 1-18 43 Waksman, G., Shoelson, S. E., Pant, N., Cowburn, D., and Kuriyan, J. (1993) Binding of a high affinity phosphotyrosyl peptide to the Src SH2 domain: crystal structures of the complexed and peptide-free forms. Cell. 72, 779-790 44 Bibbins, K. B., Boeuf, H., and Varmus, H. E. (1993) Binding of the Src SH2 domain to phosphopeptides is determined by residues in both the SH2 domain and the phosphopeptides. Mol Cell Biol. 13, 7278-7287 45 Mayer, B. J., Jackson, P. K., Van Etten, R. A., and Baltimore, D. (1992) Point mutations in the abl SH2 domain coordinately impair phosphotyrosine binding in vitro and transforming activity in vivo. Mol Cell Biol. 12, 609-618 46 Tinti, M., Kiemer, L., Costa, S., Miller, M. L., Sacco, F., Olsen, J. V., Carducci, M., Paoluzi, S., Langone, F., Workman, C. T., Blom, N., Machida, K., Thompson, C. M., Schutkowski, M., Brunak, S., Mann, M., Mayer, B. J., Castagnoli, L., and Cesareni, G. (2013) The SH2 domain interaction landscape. Cell Rep. 3, 1293-1305 47 Songyang, Z., Shoelson, S. E., Chaudhuri, M., Gish, G., Pawson, T., Haser, W. G., King, F., Roberts, T., Ratnofsky, S., Lechleider, R. J., and et al. (1993) SH2 domains recognize specific phosphopeptide sequences. Cell. 72, 767-778 48 Fantl, W. J., Escobedo, J. A., Martin, G. A., Turck, C. W., del Rosario, M., McCormick, F., and Williams, L. T. (1992) Distinct phosphotyrosines on a growth factor receptor bind to specific molecules that mediate different signaling pathways. Cell. 69, 413-423 49 Huang, H., Li, L., Wu, C., Schibli, D., Colwill, K., Ma, S., Li, C., Roy, P., Ho, K., Songyang, Z., Pawson, T., Gao, Y., and Li, S. S. (2008) Defining the specificity space of the human SRC homology 2 domain. Mol Cell Proteomics. 7, 768-784 50 Eck, M. J., Shoelson, S. E., and Harrison, S. C. (1993) Recognition of a high-affinity phosphotyrosyl peptide by the Src homology-2 domain of p56lck. Nature. 362, 87-91 51 Kaneko, T., Huang, H., Zhao, B., Li, L., Liu, H., Voss, C. K., Wu, C., Schiller, M. R., and Li, S. S. (2010) Loops govern SH2 domain specificity by controlling access to binding pockets. Sci Signal. 3, ra34

145
52 Kimber, M. S., Nachman, J., Cunningham, A. M., Gish, G. D., Pawson, T., and Pai, E. F. (2000) Structural basis for specificity switching of the Src SH2 domain. Mol Cell. 5, 1043-1049 53 Marengere, L. E., Songyang, Z., Gish, G. D., Schaller, M. D., Parsons, J. T., Stern, M. J., Cantley, L. C., and Pawson, T. (1994) SH2 domain specificity and activity modified by a single residue. Nature. 369, 502-505 54 Couture, C., Songyang, Z., Jascur, T., Williams, S., Tailor, P., Cantley, L. C., and Mustelin, T. (1996) Regulation of the Lck SH2 domain by tyrosine phosphorylation. J Biol Chem. 271, 24880-24884 55 Comb, W. C., Hutti, J. E., Cogswell, P., Cantley, L. C., and Baldwin, A. S. (2012) p85alpha SH2 domain phosphorylation by IKK promotes feedback inhibition of PI3K and Akt in response to cellular starvation. Mol Cell. 45, 719-730 56 Qian, X., Li, G., Vass, W. C., Papageorge, A., Walker, R. C., Asnaghi, L., Steinbach, P. J., Tosato, G., Hunter, K., and Lowy, D. R. (2009) The Tensin-3 protein, including its SH2 domain, is phosphorylated by Src and contributes to tumorigenesis and metastasis. Cancer Cell. 16, 246-258 57 Lappalainen, I., Thusberg, J., Shen, B., and Vihinen, M. (2008) Genome wide analysis of pathogenic SH2 domain mutations. Proteins. 72, 779-792 58 Tzeng, S. R., Pai, M. T., Lung, F. D., Wu, C. W., Roller, P. P., Lei, B., Wei, C. J., Tu, S. C., Chen, S. H., Soong, W. J., and Cheng, J. W. (2000) Stability and peptide binding specificity of Btk SH2 domain: molecular basis for X-linked agammaglobulinemia. Protein Sci. 9, 2377-2385 59 Mattsson, P. T., Lappalainen, I., Backesjo, C. M., Brockmann, E., Lauren, S., Vihinen, M., and Smith, C. I. (2000) Six X-linked agammaglobulinemia-causing missense mutations in the Src homology 2 domain of Bruton's tyrosine kinase: phosphotyrosine-binding and circular dichroism analysis. J Immunol. 164, 4170-4177 60 Hashimoto, S., Tsukada, S., Matsushita, M., Miyawaki, T., Niida, Y., Yachie, A., Kobayashi, S., Iwata, T., Hayakawa, H., Matsuoka, H., Tsuge, I., Yamadori, T., Kunikata, T., Arai, S., Yoshizaki, K., Taniguchi, N., and Kishimoto, T. (1996) Identification of Bruton's tyrosine kinase (Btk) gene mutations and characterization of the derived proteins in 35 X-linked agammaglobulinemia families: a nationwide study of Btk deficiency in Japan. Blood. 88, 561-573 61 Saffran, D. C., Parolini, O., Fitch-Hilgenberg, M. E., Rawlings, D. J., Afar, D. E., Witte, O. N., and Conley, M. E. (1994) Brief report: a point mutation in the SH2 domain of Bruton's tyrosine kinase in atypical X-linked agammaglobulinemia. N Engl J Med. 330, 1488-1491 62 Bentires-Alj, M., Paez, J. G., David, F. S., Keilhack, H., Halmos, B., Naoki, K., Maris, J. M., Richardson, A., Bardelli, A., Sugarbaker, D. J., Richards, W. G., Du, J., Girard, L., Minna, J. D., Loh, M. L., Fisher, D. E., Velculescu, V. E., Vogelstein, B., Meyerson, M., Sellers, W. R., and Neel, B. G. (2004) Activating mutations of the noonan syndrome-associated SHP2/PTPN11 gene in human solid tumors and adult acute myelogenous leukemia. Cancer Res. 64, 8816-8820 63 Muller, P. J., Rigbolt, K. T., Paterok, D., Piehler, J., Vanselow, J., Lasonder, E., Andersen, J. S., Schaper, F., and Sobota, R. M. (2013) Protein tyrosine phosphatase SHP2/PTPN11 mistargeting as a consequence of SH2-domain point mutations associated with Noonan Syndrome and leukemia. J Proteomics. 84, 132-147
146
64 Chan, G., Kalaitzidis, D., and Neel, B. G. (2008) The tyrosine phosphatase Shp2 (PTPN11) in cancer. Cancer Metastasis Rev. 27, 179-192 65 Liu, X., and Qu, C. K. (2011) Protein Tyrosine Phosphatase SHP-2 (PTPN11) in Hematopoiesis and Leukemogenesis. J Signal Transduct. 2011, 195239 66 Xu, R. (2007) Shp2, a novel oncogenic tyrosine phosphatase and potential therapeutic target for human leukemia. Cell Res. 17, 295-297 67 Mohi, M. G., and Neel, B. G. (2007) The role of Shp2 (PTPN11) in cancer. Curr Opin Genet Dev. 17, 23-30 68 Sun, M., Hillmann, P., Hofmann, B. T., Hart, J. R., and Vogt, P. K. (2010) Cancer-derived mutations in the regulatory subunit p85alpha of phosphoinositide 3-kinase function through the catalytic subunit p110alpha. Proc Natl Acad Sci U S A. 107, 15547-15552 69 Jakovljevic, G., Kardum-Skelin, I., Rogosic, S., and Nakic, M. (2010) Juvenile myelomonocytic leukemia with PTPN11 mutation in a 23-month-old girl. Coll Antropol. 34, 251-254 70 Kratz, C. P., Niemeyer, C. M., Castleberry, R. P., Cetin, M., Bergstrasser, E., Emanuel, P. D., Hasle, H., Kardos, G., Klein, C., Kojima, S., Stary, J., Trebo, M., Zecca, M., Gelb, B. D., Tartaglia, M., and Loh, M. L. (2005) The mutational spectrum of PTPN11 in juvenile myelomonocytic leukemia and Noonan syndrome/myeloproliferative disease. Blood. 106, 2183-2185 71 Parsons, D. W., Jones, S., Zhang, X., Lin, J. C., Leary, R. J., Angenendt, P., Mankoo, P., Carter, H., Siu, I. M., Gallia, G. L., Olivi, A., McLendon, R., Rasheed, B. A., Keir, S., Nikolskaya, T., Nikolsky, Y., Busam, D. A., Tekleab, H., Diaz, L. A., Jr., Hartigan, J., Smith, D. R., Strausberg, R. L., Marie, S. K., Shinjo, S. M., Yan, H., Riggins, G. J., Bigner, D. D., Karchin, R., Papadopoulos, N., Parmigiani, G., Vogelstein, B., Velculescu, V. E., and Kinzler, K. W. (2008) An integrated genomic analysis of human glioblastoma multiforme. Science. 321, 1807-1812 72 Friedman, E., Gejman, P. V., Martin, G. A., and McCormick, F. (1993) Nonsense mutations in the C-terminal SH2 region of the GTPase activating protein (GAP) gene in human tumours. Nat Genet. 5, 242-247 73 Sumegi, J., Huang, D., Lanyi, A., Davis, J. D., Seemayer, T. A., Maeda, A., Klein, G., Seri, M., Wakiguchi, H., Purtilo, D. T., and Gross, T. G. (2000) Correlation of mutations of the SH2D1A gene and epstein-barr virus infection with clinical phenotype and outcome in X-linked lymphoproliferative disease. Blood. 96, 3118-3125 74 Pawson, T. (2004) Specificity in signal transduction: from phosphotyrosine-SH2 domain interactions to complex cellular systems. Cell. 116, 191-203 75 Filippakopoulos, P., Muller, S., and Knapp, S. (2009) SH2 domains: modulators of nonreceptor tyrosine kinase activity. Curr Opin Struct Biol. 19, 643-649 76 Schlessinger, J., and Lemmon, M. A. (2003) SH2 and PTB domains in tyrosine kinase signaling. Sci STKE. 2003, RE12 77 Fischer, E. H. (1999) Cell signaling by protein tyrosine phosphorylation. Adv Enzyme Regul. 39, 359-369 78 Lowenstein, E. J., Daly, R. J., Batzer, A. G., Li, W., Margolis, B., Lammers, R., Ullrich, A., Skolnik, E. Y., Bar-Sagi, D., and Schlessinger, J. (1992) The SH2 and SH3 domain-containing protein GRB2 links receptor tyrosine kinases to ras signaling. Cell. 70, 431-442
147
79 Okutani, T., Okabayashi, Y., Kido, Y., Sugimoto, Y., Sakaguchi, K., Matuoka, K., Takenawa, T., and Kasuga, M. (1994) Grb2/Ash binds directly to tyrosines 1068 and 1086 and indirectly to tyrosine 1148 of activated human epidermal growth factor receptors in intact cells. J Biol Chem. 269, 31310-31314 80 Parker, L. L., and Piwnica-Worms, H. (1992) Inactivation of the p34cdc2-cyclin B complex by the human WEE1 tyrosine kinase. Science. 257, 1955-1957 81 Rhind, N., and Russell, P. (2012) Signaling pathways that regulate cell division. Cold Spring Harb Perspect Biol. 4 82 Gertz, M. A., and Dingli, D. (2014) How we manage autologous stem cell transplantation for patients with multiple myeloma. Blood. 124, 882-890 83 Kyle, R. A., and Rajkumar, S. V. (2008) Multiple myeloma. Blood. 111, 2962-2972 84 Chesi, M., Nardini, E., Brents, L. A., Schrock, E., Ried, T., Kuehl, W. M., and Bergsagel, P. L. (1997) Frequent translocation t(4;14)(p16.3;q32.3) in multiple myeloma is associated with increased expression and activating mutations of fibroblast growth factor receptor 3. Nat Genet. 16, 260-264 85 Trudel, S., Ely, S., Farooqi, Y., Affer, M., Robbiani, D. F., Chesi, M., and Bergsagel, P. L. (2004) Inhibition of fibroblast growth factor receptor 3 induces differentiation and apoptosis in t(4;14) myeloma. Blood. 103, 3521-3528 86 Ronchetti, D., Greco, A., Compasso, S., Colombo, G., Dell'Era, P., Otsuki, T., Lombardi, L., and Neri, A. (2001) Deregulated FGFR3 mutants in multiple myeloma cell lines with t(4;14): comparative analysis of Y373C, K650E and the novel G384D mutations. Oncogene. 20, 3553-3562 87 Bharti, A. C., Shishodia, S., Reuben, J. M., Weber, D., Alexanian, R., Raj-Vadhan, S., Estrov, Z., Talpaz, M., and Aggarwal, B. B. (2004) Nuclear factor-kappaB and STAT3 are constitutively active in CD138+ cells derived from multiple myeloma patients, and suppression of these transcription factors leads to apoptosis. Blood. 103, 3175-3184 88 Hilbert, D. M., Kopf, M., Mock, B. A., Kohler, G., and Rudikoff, S. (1995) Interleukin 6 is essential for in vivo development of B lineage neoplasms. J Exp Med. 182, 243-248 89 Chng, W. J., Gualberto, A., and Fonseca, R. (2006) IGF-1R is overexpressed in poor-prognostic subtypes of multiple myeloma. Leukemia. 20, 174-176 90 Bataille, R., Robillard, N., Avet-Loiseau, H., Harousseau, J. L., and Moreau, P. (2005) CD221 (IGF-1R) is aberrantly expressed in multiple myeloma, in relation to disease severity. Haematologica. 90, 706-707 91 Standal, T., Borset, M., Lenhoff, S., Wisloff, F., Stordal, B., Sundan, A., Waage, A., and Seidel, C. (2002) Serum insulinlike growth factor is not elevated in patients with multiple myeloma but is still a prognostic factor. Blood. 100, 3925-3929 92 Liang, S. B., Yang, X. Z., Trieu, Y., Li, Z., Zive, J., Leung-Hagesteijn, C., Wei, E., Zozulya, S., Coss, C. C., Dalton, J. T., Fantus, I. G., and Trudel, S. (2011) Molecular target characterization and antimyeloma activity of the novel, insulin-like growth factor 1 receptor inhibitor, GTx-134. Clin Cancer Res. 17, 4693-4704 93 Chim, C. S., Fung, T. K., Cheung, W. C., Liang, R., and Kwong, Y. L. (2004) SOCS1 and SHP1 hypermethylation in multiple myeloma: implications for epigenetic activation of the Jak/STAT pathway. Blood. 103, 4630-4635
148
94 Somani, A. K., Bignon, J. S., Mills, G. B., Siminovitch, K. A., and Branch, D. R. (1997) Src kinase activity is regulated by the SHP-1 protein-tyrosine phosphatase. J Biol Chem. 272, 21113-21119 95 Krautwald, S., Buscher, D., Kummer, V., Buder, S., and Baccarini, M. (1996) Involvement of the protein tyrosine phosphatase SHP-1 in Ras-mediated activation of the mitogen-activated protein kinase pathway. Mol Cell Biol. 16, 5955-5963 96 Johnson, K. J., Peck, A. R., Liu, C., Tran, T. H., Utama, F. E., Sjolund, A. B., Schaber, J. D., Witkiewicz, A. K., and Rui, H. (2010) PTP1B suppresses prolactin activation of Stat5 in breast cancer cells. Am J Pathol. 177, 2971-2983 97 Han, Y., Amin, H. M., Franko, B., Frantz, C., Shi, X., and Lai, R. (2006) Loss of SHP1 enhances JAK3/STAT3 signaling and decreases proteosome degradation of JAK3 and NPM-ALK in ALK+ anaplastic large-cell lymphoma. Blood. 108, 2796-2803 98 Wu, C., Sun, M., Liu, L., and Zhou, G. W. (2003) The function of the protein tyrosine phosphatase SHP-1 in cancer. Gene. 306, 1-12 99 Wu, C., Guan, Q., Wang, Y., Zhao, Z. J., and Zhou, G. W. (2003) SHP-1 suppresses cancer cell growth by promoting degradation of JAK kinases. J Cell Biochem. 90, 1026-1037 100 Hayslip, J., and Montero, A. (2006) Tumor suppressor gene methylation in follicular lymphoma: a comprehensive review. Mol Cancer. 5, 44 101 Saha, S., Bardelli, A., Buckhaults, P., Velculescu, V. E., Rago, C., St Croix, B., Romans, K. E., Choti, M. A., Lengauer, C., Kinzler, K. W., and Vogelstein, B. (2001) A phosphatase associated with metastasis of colorectal cancer. Science. 294, 1343-1346 102 Xing, X., Lian, S., Hu, Y., Li, Z., Zhang, L., Wen, X., Du, H., Jia, Y., Zheng, Z., Meng, L., Shou, C., and Ji, J. (2013) Phosphatase of regenerating liver-3 (PRL-3) is associated with metastasis and poor prognosis in gastric carcinoma. J Transl Med. 11, 309 103 Al-Aidaroos, A. Q., and Zeng, Q. (2010) PRL-3 phosphatase and cancer metastasis. J Cell Biochem. 111, 1087-1098 104 Deschler, B., and Lubbert, M. (2006) Acute myeloid leukemia: epidemiology and etiology. Cancer. 107, 2099-2107 105 Hasserjian, R. P. (2013) Acute myeloid leukemia: advances in diagnosis and classification. Int J Lab Hematol. 35, 358-366 106 Schiffer, C. A. (2003) Hematopoietic growth factors and the future of therapeutic research on acute myeloid leukemia. N Engl J Med. 349, 727-729 107 Fathi, A. T., and Chabner, B. A. (2011) FLT3 inhibition as therapy in acute myeloid leukemia: a record of trials and tribulations. Oncologist. 16, 1162-1174 108 Daver, N., and Cortes, J. (2012) Molecular targeted therapy in acute myeloid leukemia. Hematology. 17 Suppl 1, S59-62 109 Stirewalt, D. L., and Meshinchi, S. (2010) Receptor tyrosine kinase alterations in AML - biology and therapy. Cancer Treat Res. 145, 85-108 110 Lee, H., Kim, M., Lim, J., Kim, Y., Han, K., Cho, B. S., and Kim, H. J. (2013) Acute myeloid leukemia associated with FGFR1 abnormalities. Int J Hematol. 97, 808-812 111 Kentsis, A., Reed, C., Rice, K. L., Sanda, T., Rodig, S. J., Tholouli, E., Christie, A., Valk, P. J., Delwel, R., Ngo, V., Kutok, J. L., Dahlberg, S. E., Moreau, L. A., Byers, R. J., Christensen, J. G., Vande Woude, G., Licht, J. D., Kung, A. L., Staudt, L. M., and
149
Look, A. T. (2012) Autocrine activation of the MET receptor tyrosine kinase in acute myeloid leukemia. Nat Med. 18, 1118-1122 112 Lee-Sherick, A. B., Eisenman, K. M., Sather, S., McGranahan, A., Armistead, P. M., McGary, C. S., Hunsucker, S. A., Schlegel, J., Martinson, H., Cannon, C., Keating, A. K., Earp, H. S., Liang, X., Deryckere, D., and Graham, D. K. (2013) Aberrant Mer receptor tyrosine kinase expression contributes to leukemogenesis in acute myeloid leukemia. Oncogene 113 Davies, H., Bignell, G. R., Cox, C., Stephens, P., Edkins, S., Clegg, S., Teague, J., Woffendin, H., Garnett, M. J., Bottomley, W., Davis, N., Dicks, E., Ewing, R., Floyd, Y., Gray, K., Hall, S., Hawes, R., Hughes, J., Kosmidou, V., Menzies, A., Mould, C., Parker, A., Stevens, C., Watt, S., Hooper, S., Wilson, R., Jayatilake, H., Gusterson, B. A., Cooper, C., Shipley, J., Hargrave, D., Pritchard-Jones, K., Maitland, N., Chenevix-Trench, G., Riggins, G. J., Bigner, D. D., Palmieri, G., Cossu, A., Flanagan, A., Nicholson, A., Ho, J. W., Leung, S. Y., Yuen, S. T., Weber, B. L., Seigler, H. F., Darrow, T. L., Paterson, H., Marais, R., Marshall, C. J., Wooster, R., Stratton, M. R., and Futreal, P. A. (2002) Mutations of the BRAF gene in human cancer. Nature. 417, 949-954 114 Testa, U., and Pelosi, E. (2013) The Impact of FLT3 Mutations on the Development of Acute Myeloid Leukemias. Leuk Res Treatment. 2013, 275760 115 Al-Mawali, A., Gillis, D., and Lewis, I. (2013) Characteristics and Prognosis of Adult Acute Myeloid Leukemia with Internal Tandem Duplication in the FLT3 Gene. Oman Med J. 28, 432-440 116 Meshinchi, S., and Appelbaum, F. R. (2009) Structural and functional alterations of FLT3 in acute myeloid leukemia. Clin Cancer Res. 15, 4263-4269 117 Thiede, C., Steudel, C., Mohr, B., Schaich, M., Schakel, U., Platzbecker, U., Wermke, M., Bornhauser, M., Ritter, M., Neubauer, A., Ehninger, G., and Illmer, T. (2002) Analysis of FLT3-activating mutations in 979 patients with acute myelogenous leukemia: association with FAB subtypes and identification of subgroups with poor prognosis. Blood. 99, 4326-4335 118 Ray, R. J., Paige, C. J., Furlonger, C., Lyman, S. D., and Rottapel, R. (1996) Flt3 ligand supports the differentiation of early B cell progenitors in the presence of interleukin-11 and interleukin-7. Eur J Immunol. 26, 1504-1510 119 Piacibello, W., Fubini, L., Sanavio, F., Brizzi, M. F., Severino, A., Garetto, L., Stacchini, A., Pegoraro, L., and Aglietta, M. (1995) Effects of human FLT3 ligand on myeloid leukemia cell growth: heterogeneity in response and synergy with other hematopoietic growth factors. Blood. 86, 4105-4114 120 Mackarehtschian, K., Hardin, J. D., Moore, K. A., Boast, S., Goff, S. P., and Lemischka, I. R. (1995) Targeted disruption of the flk2/flt3 gene leads to deficiencies in primitive hematopoietic progenitors. Immunity. 3, 147-161 121 Kiyoi, H., Naoe, T., Nakano, Y., Yokota, S., Minami, S., Miyawaki, S., Asou, N., Kuriyama, K., Jinnai, I., Shimazaki, C., Akiyama, H., Saito, K., Oh, H., Motoji, T., Omoto, E., Saito, H., Ohno, R., and Ueda, R. (1999) Prognostic implication of FLT3 and N-RAS gene mutations in acute myeloid leukemia. Blood. 93, 3074-3080 122 Kottaridis, P. D., Gale, R. E., Frew, M. E., Harrison, G., Langabeer, S. E., Belton, A. A., Walker, H., Wheatley, K., Bowen, D. T., Burnett, A. K., Goldstone, A. H., and Linch, D. C. (2001) The presence of a FLT3 internal tandem duplication in patients with acute myeloid leukemia (AML) adds important prognostic information to cytogenetic risk
150
group and response to the first cycle of chemotherapy: analysis of 854 patients from the United Kingdom Medical Research Council AML 10 and 12 trials. Blood. 98, 1752-1759 123 Kottaridis, P. D., Gale, R. E., Langabeer, S. E., Frew, M. E., Bowen, D. T., and Linch, D. C. (2002) Studies of FLT3 mutations in paired presentation and relapse samples from patients with acute myeloid leukemia: implications for the role of FLT3 mutations in leukemogenesis, minimal residual disease detection, and possible therapy with FLT3 inhibitors. Blood. 100, 2393-2398 124 Nabinger, S. C., Li, X. J., Ramdas, B., He, Y., Zhang, X., Zeng, L., Richine, B., Bowling, J. D., Fukuda, S., Goenka, S., Liu, Z., Feng, G. S., Yu, M., Sandusky, G. E., Boswell, H. S., Zhang, Z. Y., Kapur, R., and Chan, R. J. (2013) The protein tyrosine phosphatase, Shp2, positively contributes to FLT3-ITD-induced hematopoietic progenitor hyperproliferation and malignant disease in vivo. Leukemia. 27, 398-408 125 Zanke, B., Squire, J., Griesser, H., Henry, M., Suzuki, H., Patterson, B., Minden, M., and Mak, T. W. (1994) A hematopoietic protein tyrosine phosphatase (HePTP) gene that is amplified and overexpressed in myeloid malignancies maps to chromosome 1q32.1. Leukemia. 8, 236-244 126 Aebersold, R., and Mann, M. (2003) Mass spectrometry-based proteomics. Nature. 422, 198-207 127 Fenn JB, M. M., Meng CK, Wong SF, Whitehouse CM. (1989) Electrospray ionization for mass spectrometry of large biomolecules. Science. 246, 64-71 128 Perkins, D. N., Pappin, D. J., Creasy, D. M., and Cottrell, J. S. (1999) Probability-based protein identification by searching sequence databases using mass spectrometry data. Electrophoresis. 20, 3551-3567 129 Eng, J. K., McCormack, A. L., and Yates, J. R. (1994) An approach to correlate tandem mass spectral data of peptides with amino acid sequences in a protein database. J Am Soc Mass Spectrom. 5, 976-989 130 Craig, R., and Beavis, R. C. (2004) TANDEM: matching proteins with tandem mass spectra. Bioinformatics. 20, 1466-1467 131 Chen, G., Pramanik, BN. (2008) LC-MS for protein characterization: current capabilities and future trends. Expert review of proteomics. 5, 435-444 132 Wysocki, V. H., Resing, K. A., Zhang, Q., and Cheng, G. (2005) Mass spectrometry of peptides and proteins. Methods. 35, 211-222 133 Lee, M. S., and Kerns, E. H. (1999) LC/MS applications in drug development. Mass Spectrom Rev. 18, 187-279 134 Mann, M. (2006) Functional and quantitative proteomics using SILAC. Nat Rev Mol Cell Biol. 7, 952-958 135 Kirkpatrick, D. S., Gerber, S. A., and Gygi, S. P. (2005) The absolute quantification strategy: a general procedure for the quantification of proteins and post-translational modifications. Methods. 35, 265-273 136 Smith, J. R., Olivier, M., and Greene, A. S. (2007) Relative quantification of peptide phosphorylation in a complex mixture using 18O labeling. Physiol Genomics. 31, 357-363 137 Wang, M., You, J., Bemis, K. G., Tegeler, T. J., and Brown, D. P. (2008) Label-free mass spectrometry-based protein quantification technologies in proteomic analysis. Brief Funct Genomic Proteomic. 7, 329-339
151
138 Asara, J. M., Christofk, H. R., Freimark, L. M., and Cantley, L. C. (2008) A label-free quantification method by MS/MS TIC compared to SILAC and spectral counting in a proteomics screen. Proteomics. 8, 994-999 139 Jin, L. L., Tong, J., Prakash, A., Peterman, S. M., St-Germain, J. R., Taylor, P., Trudel, S., and Moran, M. F. (2010) Measurement of protein phosphorylation stoichiometry by selected reaction monitoring mass spectrometry. J Proteome Res. 9, 2752-2761 140 Wang, G., Wu, W. W., Zeng, W., Chou, C. L., and Shen, R. F. (2006) Label-free protein quantification using LC-coupled ion trap or FT mass spectrometry: Reproducibility, linearity, and application with complex proteomes. J Proteome Res. 5, 1214-1223 141 Cutillas, P. R., and Vanhaesebroeck, B. (2007) Quantitative profile of five murine core proteomes using label-free functional proteomics. Mol Cell Proteomics. 6, 1560-1573 142 Cox, J., and Mann, M. (2008) MaxQuant enables high peptide identification rates, individualized p.p.b.-range mass accuracies and proteome-wide protein quantification. Nat Biotechnol. 26, 1367-1372 143 Lange, V., Picotti, P., Domon, B., and Aebersold, R. (2008) Selected reaction monitoring for quantitative proteomics: a tutorial. Mol Syst Biol. 4, 222 144 Wolf-Yadlin, A., Hautaniemi, S., Lauffenburger, D. A., and White, F. M. (2007) Multiple reaction monitoring for robust quantitative proteomic analysis of cellular signaling networks. Proc Natl Acad Sci U S A. 104, 5860-5865 145 Breitkopf, S. B., and Asara, J. M. (2012) Determining in vivo phosphorylation sites using mass spectrometry. Curr Protoc Mol Biol. Chapter 18, Unit18 19 11-27 146 Delom, F., and Chevet, E. (2006) Phosphoprotein analysis: from proteins to proteomes. Proteome Sci. 4, 15 147 Rush, J., Moritz, A., Lee, K. A., Guo, A., Goss, V. L., Spek, E. J., Zhang, H., Zha, X. M., Polakiewicz, R. D., and Comb, M. J. (2005) Immunoaffinity profiling of tyrosine phosphorylation in cancer cells. Nat Biotechnol. 23, 94-101 148 Gorla, L., Cantu, M., Micciche, F., Patelli, C., Mondellini, P., Pierotti, M. A., and Bongarzone, I. (2006) RET oncoproteins induce tyrosine phosphorylation changes of proteins involved in RNA metabolism. Cell Signal. 18, 2272-2282 149 Salomon AR, F. S., Brill LM, Brinker A, Phung QT, Ericson C, Sauer K, Brock A, Horn DM, Schultz PG, Peters EC. (2003) Profiling of tyrosine phosphorylation pathways in human cells using mass spectrometry. Proceedings of the National Academy of Sciences of the United States of America. 100, 443-448 150 St-Germain, J. R., Taylor, P., Tong, J., Jin, L. L., Nikolic, A., Stewart, II, Ewing, R. M., Dharsee, M., Li, Z., Trudel, S., and Moran, M. F. (2009) Multiple myeloma phosphotyrosine proteomic profile associated with FGFR3 expression, ligand activation, and drug inhibition. Proc Natl Acad Sci U S A. 106, 20127-20132 151 Karisch, R., Fernandez, M., Taylor, P., Virtanen, C., St-Germain, J. R., Jin, L. L., Harris, I. S., Mori, J., Mak, T. W., Senis, Y. A., Ostman, A., Moran, M. F., and Neel, B. G. (2011) Global proteomic assessment of the classical protein-tyrosine phosphatome and "redoxome". Cell. 146, 826-840
152
152 Persson, C., Kappert, K., Engstrom, U., Ostman, A., and Sjoblom, T. (2005) An antibody-based method for monitoring in vivo oxidation of protein tyrosine phosphatases. Methods. 35, 37-43 153 Abdi, H., and Williams, L. J. (2013) Partial least squares methods: partial least squares correlation and partial least square regression. Methods Mol Biol. 930, 549-579 154 Ergon, R. (2014) Principal component regression (PCR) and partial least squares regression (PLSR). In Mathematical and Statistical Methods in Food Science and Technology (Granato, D. and Ares, D., eds.), John Wiley & Sons, Ltd, Chichester, United Kingdom 155 Jernberg-Wiklund, H., and Nilsson, K. (2000) Multiple myeloma cell lines. In Human Cell Culture (Palsson, B. Ø. and Masters, J., eds.). pp. 81-155, Dordrecht, Netherlands 156 Hadari, Y., and Schlessinger, J. (2009) FGFR3-targeted mAb therapy for bladder cancer and multiple myeloma. J Clin Invest. 119, 1077-1079 157 Grand, E. K., Chase, A. J., Heath, C., Rahemtulla, A., and Cross, N. C. (2004) Targeting FGFR3 in multiple myeloma: inhibition of t(4;14)-positive cells by SU5402 and PD173074. Leukemia. 18, 962-966 158 Nilsson, K., Georgii-Hemming, P., Spets, H., and Jernberg-Wiklund, H. (1999) The control of proliferation, survival and apoptosis in human multiple myeloma cells in vitro. Curr Top Microbiol Immunol. 246, 325-332; discussion 333 159 Georgii-Hemming, P., Wiklund, H. J., Ljunggren, O., and Nilsson, K. (1996) Insulin-like growth factor I is a growth and survival factor in human multiple myeloma cell lines. Blood. 88, 2250-2258 160 Steinbrunn, T., Stuhmer, T., Gattenlohner, S., Rosenwald, A., Mottok, A., Unzicker, C., Einsele, H., Chatterjee, M., and Bargou, R. C. (2011) Mutated RAS and constitutively activated Akt delineate distinct oncogenic pathways, which independently contribute to multiple myeloma cell survival. Blood. 117, 1998-2004 161 Zollinger, A., Stuhmer, T., Chatterjee, M., Gattenlohner, S., Haralambieva, E., Muller-Hermelink, H. K., Andrulis, M., Greiner, A., Wesemeier, C., Rath, J. C., Einsele, H., and Bargou, R. C. (2008) Combined functional and molecular analysis of tumor cell signaling defines 2 distinct myeloma subgroups: Akt-dependent and Akt-independent multiple myeloma. Blood. 112, 3403-3411 162 Lentzsch, S., Chatterjee, M., Gries, M., Bommert, K., Gollasch, H., Dorken, B., and Bargou, R. C. (2004) PI3-K/AKT/FKHR and MAPK signaling cascades are redundantly stimulated by a variety of cytokines and contribute independently to proliferation and survival of multiple myeloma cells. Leukemia. 18, 1883-1890 163 Ikediobi, O. N., Davies, H., Bignell, G., Edkins, S., Stevens, C., O'Meara, S., Santarius, T., Avis, T., Barthorpe, S., Brackenbury, L., Buck, G., Butler, A., Clements, J., Cole, J., Dicks, E., Forbes, S., Gray, K., Halliday, K., Harrison, R., Hills, K., Hinton, J., Hunter, C., Jenkinson, A., Jones, D., Kosmidou, V., Lugg, R., Menzies, A., Mironenko, T., Parker, A., Perry, J., Raine, K., Richardson, D., Shepherd, R., Small, A., Smith, R., Solomon, H., Stephens, P., Teague, J., Tofts, C., Varian, J., Webb, T., West, S., Widaa, S., Yates, A., Reinhold, W., Weinstein, J. N., Stratton, M. R., Futreal, P. A., and Wooster, R. (2006) Mutation analysis of 24 known cancer genes in the NCI-60 cell line set. Mol Cancer Ther. 5, 2606-2612
153
164 Voutsina, A., Tzardi, M., Kalikaki, A., Zafeiriou, Z., Papadimitraki, E., Papadakis, M., Mavroudis, D., and Georgoulias, V. (2012) Combined analysis of KRAS and PIK3CA mutations, MET and PTEN expression in primary tumors and corresponding metastases in colorectal cancer. Mod Pathol. 26, 302-313 165 Teoh, G., Urashima, M., Ogata, A., Chauhan, D., DeCaprio, J. A., Treon, S. P., Schlossman, R. L., and Anderson, K. C. (1997) MDM2 protein overexpression promotes proliferation and survival of multiple myeloma cells. Blood. 90, 1982-1992 166 Mao, X., Cao, B., Wood, T. E., Hurren, R., Tong, J., Wang, X., Wang, W., Li, J., Jin, Y., Sun, W., Spagnuolo, P. A., MacLean, N., Moran, M. F., Datti, A., Wrana, J., Batey, R. A., and Schimmer, A. D. (2011) A small-molecule inhibitor of D-cyclin transactivation displays preclinical efficacy in myeloma and leukemia via phosphoinositide 3-kinase pathway. Blood. 117, 1986-1997 167 Shou, Y., Martelli, M. L., Gabrea, A., Qi, Y., Brents, L. A., Roschke, A., Dewald, G., Kirsch, I. R., Bergsagel, P. L., and Kuehl, W. M. (2000) Diverse karyotypic abnormalities of the c-myc locus associated with c-myc dysregulation and tumor progression in multiple myeloma. Proc Natl Acad Sci U S A. 97, 228-233 168 Schwarz, F., and Aebi, M. (2011) Mechanisms and principles of N-linked protein glycosylation. Curr Opin Struct Biol. 21, 576-582 169 Malumbres, M., and Barbacid, M. (2009) Cell cycle, CDKs and cancer: a changing paradigm. Nat Rev Cancer. 9, 153-166 170 Bjorge, J. D., Pang, A., and Fujita, D. J. (2000) Identification of protein-tyrosine phosphatase 1B as the major tyrosine phosphatase activity capable of dephosphorylating and activating c-Src in several human breast cancer cell lines. J Biol Chem. 275, 41439-41446 171 Valverde, A. M., and Gonzalez-Rodriguez, A. (2011) IRS2 and PTP1B: Two opposite modulators of hepatic insulin signalling. Arch Physiol Biochem. 117, 105-115 172 Chatterjee, M., Stuhmer, T., Herrmann, P., Bommert, K., Dorken, B., and Bargou, R. C. (2004) Combined disruption of both the MEK/ERK and the IL-6R/STAT3 pathways is required to induce apoptosis of multiple myeloma cells in the presence of bone marrow stromal cells. Blood. 104, 3712-3721 173 Zhu, S., Bjorge, J. D., and Fujita, D. J. (2007) PTP1B contributes to the oncogenic properties of colon cancer cells through Src activation. Cancer Res. 67, 10129-10137 174 Zhang, S. Q., Yang, W., Kontaridis, M. I., Bivona, T. G., Wen, G., Araki, T., Luo, J., Thompson, J. A., Schraven, B. L., Philips, M. R., and Neel, B. G. (2004) Shp2 regulates SRC family kinase activity and Ras/Erk activation by controlling Csk recruitment. Mol Cell. 13, 341-355 175 Rikova, K., Guo, A., Zeng, Q., Possemato, A., Yu, J., Haack, H., Nardone, J., Lee, K., Reeves, C., Li, Y., Hu, Y., Tan, Z., Stokes, M., Sullivan, L., Mitchell, J., Wetzel, R., Macneill, J., Ren, J. M., Yuan, J., Bakalarski, C. E., Villen, J., Kornhauser, J. M., Smith, B., Li, D., Zhou, X., Gygi, S. P., Gu, T. L., Polakiewicz, R. D., Rush, J., and Comb, M. J. (2007) Global survey of phosphotyrosine signaling identifies oncogenic kinases in lung cancer. Cell. 131, 1190-1203 176 Harsha, H. C., Jimeno, A., Molina, H., Mihalas, A. B., Goggins, M. G., Hruban, R. H., Schulick, R. D., Kamath, U., Maitra, A., Hidalgo, M., and Pandey, A. (2008) Activated epidermal growth factor receptor as a novel target in pancreatic cancer therapy. J Proteome Res. 7, 4651-4658
154
177 Yu, L. R., Issaq, H. J., and Veenstra, T. D. (2007) Phosphoproteomics for the discovery of kinases as cancer biomarkers and drug targets. Proteomics Clin Appl. 1, 1042-1057 178 Pan, C., Olsen, J. V., Daub, H., and Mann, M. (2009) Global effects of kinase inhibitors on signaling networks revealed by quantitative phosphoproteomics. Mol Cell Proteomics. 8, 2796-2808 179 Bose, R., Molina, H., Patterson, A. S., Bitok, J. K., Periaswamy, B., Bader, J. S., Pandey, A., and Cole, P. A. (2006) Phosphoproteomic analysis of Her2/neu signaling and inhibition. Proc Natl Acad Sci U S A. 103, 9773-9778 180 Godl, K., Wissing, J., Kurtenbach, A., Habenberger, P., Blencke, S., Gutbrod, H., Salassidis, K., Stein-Gerlach, M., Missio, A., Cotten, M., and Daub, H. (2003) An efficient proteomics method to identify the cellular targets of protein kinase inhibitors. Proc Natl Acad Sci U S A. 100, 15434-15439 181 Guha, U., Chaerkady, R., Marimuthu, A., Patterson, A. S., Kashyap, M. K., Harsha, H. C., Sato, M., Bader, J. S., Lash, A. E., Minna, J. D., Pandey, A., and Varmus, H. E. (2008) Comparisons of tyrosine phosphorylated proteins in cells expressing lung cancer-specific alleles of EGFR and KRAS. Proc Natl Acad Sci U S A. 105, 14112-14117 182 Huang, P. H., Mukasa, A., Bonavia, R., Flynn, R. A., Brewer, Z. E., Cavenee, W. K., Furnari, F. B., and White, F. M. (2007) Quantitative analysis of EGFRvIII cellular signaling networks reveals a combinatorial therapeutic strategy for glioblastoma. Proc Natl Acad Sci U S A. 104, 12867-12872 183 Chesi, M., Brents, L. A., Ely, S. A., Bais, C., Robbiani, D. F., Mesri, E. A., Kuehl, W. M., and Bergsagel, P. L. (2001) Activated fibroblast growth factor receptor 3 is an oncogene that contributes to tumor progression in multiple myeloma. Blood. 97, 729-736 184 McLean, G. W., Carragher, N. O., Avizienyte, E., Evans, J., Brunton, V. G., and Frame, M. C. (2005) The role of focal-adhesion kinase in cancer - a new therapeutic opportunity. Nat Rev Cancer. 5, 505-515 185 Wang, S. Y., Hao, H. L., Deng, K., Li, Y., Cheng, Z. Y., Lv, C., Liu, Z. M., Yang, J., and Pan, L. (2012) Expression levels of phosphatase and tensin homolog deleted on chromosome 10 (PTEN) and focal adhesion kinase in patients with multiple myeloma and their relationship to clinical stage and extramedullary infiltration. Leuk Lymphoma. 53, 1162-1168 186 Irby, R. B., Mao, W., Coppola, D., Kang, J., Loubeau, J. M., Trudeau, W., Karl, R., Fujita, D. J., Jove, R., and Yeatman, T. J. (1999) Activating SRC mutation in a subset of advanced human colon cancers. Nat Genet. 21, 187-190 187 Gertz, M. A. (2008) New targets and treatments in multiple myeloma: Src family kinases as central regulators of disease progression. Leuk Lymphoma. 49, 2240-2245 188 Neri, P., Ren, L., Azab, A. K., Brentnall, M., Gratton, K., Klimowicz, A. C., Lin, C., Duggan, P., Tassone, P., Mansoor, A., Stewart, D. A., Boise, L. H., Ghobrial, I. M., and Bahlis, N. J. (2011) Integrin beta7-mediated regulation of multiple myeloma cell adhesion, migration, and invasion. Blood. 117, 6202-6213 189 An, X., Tiwari, A. K., Sun, Y., Ding, P. R., Ashby, C. R., Jr., and Chen, Z. S. (2010) BCR-ABL tyrosine kinase inhibitors in the treatment of Philadelphia chromosome positive chronic myeloid leukemia: a review. Leuk Res. 34, 1255-1268 190 Breitkopf, S. B., Yuan, M., Pihan, G. A., and Asara, J. M. (2012) Detection of a rare BCR-ABL tyrosine kinase fusion protein in H929 multiple myeloma cells using
155
immunoprecipitation (IP)-tandem mass spectrometry (MS/MS). Proc Natl Acad Sci U S A. 109, 16190-16195 191 Shaw, L. M. (2011) The insulin receptor substrate (IRS) proteins: at the intersection of metabolism and cancer. Cell Cycle. 10, 1750-1756 192 Grossmann, K. S., Rosario, M., Birchmeier, C., and Birchmeier, W. The tyrosine phosphatase Shp2 in development and cancer. Adv Cancer Res. 106, 53-89 193 Matozaki, T., Murata, Y., Saito, Y., Okazawa, H., and Ohnishi, H. (2009) Protein tyrosine phosphatase SHP-2: a proto-oncogene product that promotes Ras activation. Cancer Sci. 100, 1786-1793 194 Luo, Y., Liang, F., and Zhang, Z. Y. (2009) PRL1 promotes cell migration and invasion by increasing MMP2 and MMP9 expression through Src and ERK1/2 pathways. Biochemistry. 48, 1838-1846 195 Zhang, S., and Zhang, Z. Y. (2007) PTP1B as a drug target: recent developments in PTP1B inhibitor discovery. Drug Discov Today. 12, 373-381 196 Chauhan, D., Pandey, P., Hideshima, T., Treon, S., Raje, N., Davies, F. E., Shima, Y., Tai, Y. T., Rosen, S., Avraham, S., Kharbanda, S., and Anderson, K. C. (2000) SHP2 mediates the protective effect of interleukin-6 against dexamethasone-induced apoptosis in multiple myeloma cells. J Biol Chem. 275, 27845-27850 197 Agazie, Y. M., Movilla, N., Ischenko, I., and Hayman, M. J. (2003) The phosphotyrosine phosphatase SHP2 is a critical mediator of transformation induced by the oncogenic fibroblast growth factor receptor 3. Oncogene. 22, 6909-6918 198 Shu, S. T., Sugimoto, Y., Liu, S., Chang, H. L., Ye, W., Wang, L. S., Huang, Y. W., Yan, P., and Lin, Y. C. (2010) Function and regulatory mechanisms of the candidate tumor suppressor receptor protein tyrosine phosphatase gamma (PTPRG) in breast cancer cells. Anticancer Res. 30, 1937-1946 199 Yuan, T., Wang, Y., Zhao, Z. J., and Gu, H. (2010) Protein-tyrosine phosphatase PTPN9 negatively regulates ErbB2 and epidermal growth factor receptor signaling in breast cancer cells. J Biol Chem. 285, 14861-14870 200 Dhillon, A. S., Hagan, S., Rath, O., and Kolch, W. (2007) MAP kinase signalling pathways in cancer. Oncogene. 26, 3279-3290 201 Hideshima, T., Akiyama, M., Hayashi, T., Richardson, P., Schlossman, R., Chauhan, D., and Anderson, K. C. (2003) Targeting p38 MAPK inhibits multiple myeloma cell growth in the bone marrow milieu. Blood. 101, 703-705 202 Chang-Yew Leow, C., Gerondakis, S., and Spencer, A. (2013) MEK inhibitors as a chemotherapeutic intervention in multiple myeloma. Blood Cancer J. 3, e105 203 Zheng, H., Hu, P., Quinn, D. F., and Wang, Y. K. (2005) Phosphotyrosine proteomic study of interferon alpha signaling pathway using a combination of immunoprecipitation and immobilized metal affinity chromatography. Mol Cell Proteomics. 4, 721-730 204 Velazquez, L., Fellous, M., Stark, G. R., and Pellegrini, S. (1992) A protein tyrosine kinase in the interferon alpha/beta signaling pathway. Cell. 70, 313-322 205 Minegishi, Y., Saito, M., Morio, T., Watanabe, K., Agematsu, K., Tsuchiya, S., Takada, H., Hara, T., Kawamura, N., Ariga, T., Kaneko, H., Kondo, N., Tsuge, I., Yachie, A., Sakiyama, Y., Iwata, T., Bessho, F., Ohishi, T., Joh, K., Imai, K., Kogawa, K., Shinohara, M., Fujieda, M., Wakiguchi, H., Pasic, S., Abinun, M., Ochs, H. D., Renner, E. D., Jansson, A., Belohradsky, B. H., Metin, A., Shimizu, N., Mizutani, S., Miyawaki, T.,
156
Nonoyama, S., and Karasuyama, H. (2006) Human tyrosine kinase 2 deficiency reveals its requisite roles in multiple cytokine signals involved in innate and acquired immunity. Immunity. 25, 745-755 206 Karaghiosoff, M., Neubauer, H., Lassnig, C., Kovarik, P., Schindler, H., Pircher, H., McCoy, B., Bogdan, C., Decker, T., Brem, G., Pfeffer, K., and Muller, M. (2000) Partial impairment of cytokine responses in Tyk2-deficient mice. Immunity. 13, 549-560 207 Zhang, Q., Sturgill, J. L., Kmieciak, M., Szczepanek, K., Derecka, M., Koebel, C., Graham, L. J., Dai, Y., Chen, S., Grant, S., Cichy, J., Shimoda, K., Gamero, A., Manjili, M., Bear, H., Conrad, D., and Larner, A. C. (2011) The role of Tyk2 in regulation of breast cancer growth. J Interferon Cytokine Res. 31, 671-677 208 Lemaire, M., Deleu, S., De Bruyne, E., Van Valckenborgh, E., Menu, E., and Vanderkerken, K. (2011) The microenvironment and molecular biology of the multiple myeloma tumor. Adv Cancer Res. 110, 19-42 209 Keller, A., Nesvizhskii, A. I., Kolker, E., and Aebersold, R. (2002) Empirical statistical model to estimate the accuracy of peptide identifications made by MS/MS and database search. Anal Chem. 74, 5383-5392 210 Nesvizhskii, A. I., Keller, A., Kolker, E., and Aebersold, R. (2003) A statistical model for identifying proteins by tandem mass spectrometry. Anal Chem. 75, 4646-4658 211 Thomsen, M. C., and Nielsen, M. (2012) Seq2Logo: a method for construction and visualization of amino acid binding motifs and sequence profiles including sequence weighting, pseudo counts and two-sided representation of amino acid enrichment and depletion. Nucleic Acids Res. 40, W281-287 212 Eisen, M. B., Spellman, P. T., Brown, P. O., and Botstein, D. (1998) Cluster analysis and display of genome-wide expression patterns. Proc Natl Acad Sci U S A. 95, 14863-14868 213 Lainey, E., Thepot, S., Bouteloup, C., Sebert, M., Ades, L., Tailler, M., Gardin, C., de Botton, S., Baruchel, A., Fenaux, P., Kroemer, G., and Boehrer, S. (2011) Tyrosine kinase inhibitors for the treatment of acute myeloid leukemia: delineation of anti-leukemic mechanisms of action. Biochem Pharmacol. 82, 1457-1466 214 Kornblau, S. M., Tibes, R., Qiu, Y. H., Chen, W., Kantarjian, H. M., Andreeff, M., Coombes, K. R., and Mills, G. B. (2009) Functional proteomic profiling of AML predicts response and survival. Blood. 113, 154-164 215 Irish, J. M., Hovland, R., Krutzik, P. O., Perez, O. D., Bruserud, O., Gjertsen, B. T., and Nolan, G. P. (2004) Single cell profiling of potentiated phospho-protein networks in cancer cells. Cell. 118, 217-228 216 Walters, D. K., Goss, V. L., Stoffregen, E. P., Gu, T. L., Lee, K., Nardone, J., McGreevey, L., Heinrich, M. C., Deininger, M. W., Polakiewicz, R., and Druker, B. J. (2006) Phosphoproteomic analysis of AML cell lines identifies leukemic oncogenes. Leuk Res. 30, 1097-1104 217 Kabir, N. N., Ronnstrand, L., and Kazi, J. U. (2013) Deregulation of protein phosphatase expression in acute myeloid leukemia. Med Oncol. 30, 517 218 Cairoli, R., Beghini, A., Grillo, G., Nadali, G., Elice, F., Ripamonti, C. B., Colapietro, P., Nichelatti, M., Pezzetti, L., Lunghi, M., Cuneo, A., Viola, A., Ferrara, F., Lazzarino, M., Rodeghiero, F., Pizzolo, G., Larizza, L., and Morra, E. (2006) Prognostic impact of c-KIT mutations in core binding factor leukemias: an Italian retrospective study. Blood. 107, 3463-3468
157
219 Hahn, C. K., Berchuck, J. E., Ross, K. N., Kakoza, R. M., Clauser, K., Schinzel, A. C., Ross, L., Galinsky, I., Davis, T. N., Silver, S. J., Root, D. E., Stone, R. M., DeAngelo, D. J., Carroll, M., Hahn, W. C., Carr, S. A., Golub, T. R., Kung, A. L., and Stegmaier, K. (2009) Proteomic and genetic approaches identify Syk as an AML target. Cancer Cell. 16, 281-294 220 Jain, N., Curran, E., Iyengar, N. M., Diaz-Flores, E., Kunnavakkam, R., Popplewell, L., Kirschbaum, M. H., Karrison, T., Erba, H. P., Green, M., Poire, X., Koval, G., Shannon, K., Reddy, P. L., Joseph, L., Atallah, E. L., Dy, P., Thomas, S. P., Smith, S. E., Doyle, L. A., Stadler, W. M., Larson, R. A., Stock, W., and Odenike, O. (2014) Phase II study of the oral MEK inhibitor selumetinib in advanced acute myelogenous leukemia: a University of Chicago phase II consortium trial. Clin Cancer Res. 20, 490-498 221 Arora, D., Kothe, S., van den Eijnden, M., Hooft van Huijsduijnen, R., Heidel, F., Fischer, T., Scholl, S., Tolle, B., Bohmer, S. A., Lennartsson, J., Isken, F., Muller-Tidow, C., and Bohmer, F. D. (2012) Expression of protein-tyrosine phosphatases in Acute Myeloid Leukemia cells: FLT3 ITD sustains high levels of DUSP6 expression. Cell Commun Signal. 10, 19 222 Scott, L. M., Lawrence, H. R., Sebti, S. M., Lawrence, N. J., and Wu, J. (2010) Targeting protein tyrosine phosphatases for anticancer drug discovery. Curr Pharm Des. 16, 1843-1862 223 Vogelstein, B., and Kinzler, K. W. (2004) Cancer genes and the pathways they control. Nat Med. 10, 789-799 224 Valk, P. J., Verhaak, R. G., Beijen, M. A., Erpelinck, C. A., Barjesteh van Waalwijk van Doorn-Khosrovani, S., Boer, J. M., Beverloo, H. B., Moorhouse, M. J., van der Spek, P. J., Lowenberg, B., and Delwel, R. (2004) Prognostically useful gene-expression profiles in acute myeloid leukemia. N Engl J Med. 350, 1617-1628 225 Bullinger, L., Dohner, K., Bair, E., Frohling, S., Schlenk, R. F., Tibshirani, R., Dohner, H., and Pollack, J. R. (2004) Use of gene-expression profiling to identify prognostic subclasses in adult acute myeloid leukemia. N Engl J Med. 350, 1605-1616 226 Chin, L., Andersen, J. N., and Futreal, P. A. (2011) Cancer genomics: from discovery science to personalized medicine. Nat Med. 17, 297-303 227 Varambally, S., Yu, J., Laxman, B., Rhodes, D. R., Mehra, R., Tomlins, S. A., Shah, R. B., Chandran, U., Monzon, F. A., Becich, M. J., Wei, J. T., Pienta, K. J., Ghosh, D., Rubin, M. A., and Chinnaiyan, A. M. (2005) Integrative genomic and proteomic analysis of prostate cancer reveals signatures of metastatic progression. Cancer Cell. 8, 393-406 228 Tian, Q., Stepaniants, S. B., Mao, M., Weng, L., Feetham, M. C., Doyle, M. J., Yi, E. C., Dai, H., Thorsson, V., Eng, J., Goodlett, D., Berger, J. P., Gunter, B., Linseley, P. S., Stoughton, R. B., Aebersold, R., Collins, S. J., Hanlon, W. A., and Hood, L. E. (2004) Integrated genomic and proteomic analyses of gene expression in Mammalian cells. Mol Cell Proteomics. 3, 960-969 229 Gygi, S. P., Rochon, Y., Franza, B. R., and Aebersold, R. (1999) Correlation between protein and mRNA abundance in yeast. Mol Cell Biol. 19, 1720-1730 230 Lu, P., Vogel, C., Wang, R., Yao, X., and Marcotte, E. M. (2007) Absolute protein expression profiling estimates the relative contributions of transcriptional and translational regulation. Nat Biotechnol. 25, 117-124
158
231 Deng, X., Kohanfars, M., Hsu, H. M., Souda, P., Capri, J., Whitelegge, J. P., and Chang, H. R. (2014) Combined phosphoproteomics and bioinformatics strategy in deciphering drug resistant related pathways in triple negative breast cancer. Int J Proteomics. 2014, 390781 232 Ali, N. A., Wu, J., Hochgrafe, F., Chan, H., Nair, R., Ye, S., Zhang, L., Lyons, R. J., Pinese, M., Lee, H. C., Armstrong, N., Ormandy, C. J., Clark, S. J., Swarbrick, A., and Daly, R. J. (2014) Profiling the tyrosine phosphoproteome of different mouse mammary tumour models reveals distinct, model-specific signalling networks and conserved oncogenic pathways. Breast Cancer Res. 16, 437 233 Yoshida, T., Zhang, G., Smith, M. A., Lopez, A. S., Bai, Y., Li, J., Fang, B., Koomen, J., Rawal, B., Fisher, K. J., Chen, A. Y., Kitano, M., Morita, Y., Yamaguchi, H., Shibata, K., Okabe, T., Okamoto, I., Nakagawa, K., and Haura, E. B. (2014) Tyrosine phosphoproteomics identifies both codrivers and cotargeting strategies for T790M-related EGFR-TKI resistance in non-small cell lung cancer. Clin Cancer Res. 20, 4059-4074 234 Casado, P., Alcolea, M. P., Iorio, F., Rodriguez-Prados, J. C., Vanhaesebroeck, B., Saez-Rodriguez, J., Joel, S., and Cutillas, P. R. (2013) Phosphoproteomics data classify hematological cancer cell lines according to tumor type and sensitivity to kinase inhibitors. Genome Biol. 14, R37 235 Lim, Y. P. (2005) Mining the tumor phosphoproteome for cancer markers. Clin Cancer Res. 11, 3163-3169 236 Beghini, A., Ripamonti, C. B., Peterlongo, P., Roversi, G., Cairoli, R., Morra, E., and Larizza, L. (2000) RNA hyperediting and alternative splicing of hematopoietic cell phosphatase (PTPN6) gene in acute myeloid leukemia. Hum Mol Genet. 9, 2297-2304 237 Sun, T., Aceto, N., Meerbrey, K. L., Kessler, J. D., Zhou, C., Migliaccio, I., Nguyen, D. X., Pavlova, N. N., Botero, M., Huang, J., Bernardi, R. J., Schmitt, E., Hu, G., Li, M. Z., Dephoure, N., Gygi, S. P., Rao, M., Creighton, C. J., Hilsenbeck, S. G., Shaw, C. A., Muzny, D., Gibbs, R. A., Wheeler, D. A., Osborne, C. K., Schiff, R., Bentires-Alj, M., Elledge, S. J., and Westbrook, T. F. (2011) Activation of multiple proto-oncogenic tyrosine kinases in breast cancer via loss of the PTPN12 phosphatase. Cell. 144, 703-718 238 Porcu, M., Kleppe, M., Gianfelici, V., Geerdens, E., De Keersmaecker, K., Tartaglia, M., Foa, R., Soulier, J., Cauwelier, B., Uyttebroeck, A., Macintyre, E., Vandenberghe, P., Asnafi, V., and Cools, J. (2012) Mutation of the receptor tyrosine phosphatase PTPRC (CD45) in T-cell acute lymphoblastic leukemia. Blood. 119, 4476-4479 239 Bentires-Alj, M., and Neel, B. G. (2007) Protein-tyrosine phosphatase 1B is required for HER2/Neu-induced breast cancer. Cancer Res. 67, 2420-2424 240 Julien, S. G., Dube, N., Read, M., Penney, J., Paquet, M., Han, Y., Kennedy, B. P., Muller, W. J., and Tremblay, M. L. (2007) Protein tyrosine phosphatase 1B deficiency or inhibition delays ErbB2-induced mammary tumorigenesis and protects from lung metastasis. Nat Genet. 39, 338-346 241 Harder, K. W., Moller, N. P., Peacock, J. W., and Jirik, F. R. (1998) Protein-tyrosine phosphatase alpha regulates Src family kinases and alters cell-substratum adhesion. J Biol Chem. 273, 31890-31900 242 Gil-Henn, H., Patsialou, A., Wang, Y., Warren, M. S., Condeelis, J. S., and Koleske, A. J. (2013) Arg/Abl2 promotes invasion and attenuates proliferation of breast cancer in vivo. Oncogene. 32, 2622-2630
159
243 Greer, P. A., Kanda, S., and Smithgall, T. E. (2012) The contrasting oncogenic and tumor suppressor roles of FES. Front Biosci (Schol Ed). 4, 489-501 244 Dos Santos, C., McDonald, T., Ho, Y. W., Liu, H., Lin, A., Forman, S. J., Kuo, Y. H., and Bhatia, R. (2013) The Src and c-Kit kinase inhibitor dasatinib enhances p53-mediated targeting of human acute myeloid leukemia stem cells by chemotherapeutic agents. Blood. 122, 1900-1913 245 Okamoto, M., Hayakawa, F., Miyata, Y., Watamoto, K., Emi, N., Abe, A., Kiyoi, H., Towatari, M., and Naoe, T. (2007) Lyn is an important component of the signal transduction pathway specific to FLT3/ITD and can be a therapeutic target in the treatment of AML with FLT3/ITD. Leukemia. 21, 403-410 246 Paschka, P., Marcucci, G., Ruppert, A. S., Mrozek, K., Chen, H., Kittles, R. A., Vukosavljevic, T., Perrotti, D., Vardiman, J. W., Carroll, A. J., Kolitz, J. E., Larson, R. A., and Bloomfield, C. D. (2006) Adverse prognostic significance of KIT mutations in adult acute myeloid leukemia with inv(16) and t(8;21): a Cancer and Leukemia Group B Study. J Clin Oncol. 24, 3904-3911 247 Nakao, M., Yokota, S., Iwai, T., Kaneko, H., Horiike, S., Kashima, K., Sonoda, Y., Fujimoto, T., and Misawa, S. (1996) Internal tandem duplication of the flt3 gene found in acute myeloid leukemia. Leukemia. 10, 1911-1918 248 Voisset, E., Lopez, S., Chaix, A., Georges, C., Hanssens, K., Prebet, T., Dubreuil, P., and De Sepulveda, P. (2010) FES kinases are required for oncogenic FLT3 signaling. Leukemia. 24, 721-728 249 Puissant, A., Fenouille, N., Alexe, G., Pikman, Y., Bassil, C. F., Mehta, S., Du, J., Kazi, J. U., Luciano, F., Ronnstrand, L., Kung, A. L., Aster, J. C., Galinsky, I., Stone, R. M., DeAngelo, D. J., Hemann, M. T., and Stegmaier, K. (2014) SYK is a critical regulator of FLT3 in acute myeloid leukemia. Cancer Cell. 25, 226-242 250 Carnevale, J., Ross, L., Puissant, A., Banerji, V., Stone, R. M., DeAngelo, D. J., Ross, K. N., and Stegmaier, K. (2013) SYK regulates mTOR signaling in AML. Leukemia. 27, 2118-2128 251 Ozawa, Y., Williams, A. H., Estes, M. L., Matsushita, N., Boschelli, F., Jove, R., and List, A. F. (2008) Src family kinases promote AML cell survival through activation of signal transducers and activators of transcription (STAT). Leuk Res. 32, 893-903 252 Willman, C. L., Stewart, C. C., Longacre, T. L., Head, D. R., Habbersett, R., Ziegler, S. F., and Perlmutter, R. M. (1991) Expression of the c-fgr and hck protein-tyrosine kinases in acute myeloid leukemic blasts is associated with early commitment and differentiation events in the monocytic and granulocytic lineages. Blood. 77, 726-734 253 Iijima, Y., Ito, T., Oikawa, T., Eguchi, M., Eguchi-Ishimae, M., Kamada, N., Kishi, K., Asano, S., Sakaki, Y., and Sato, Y. (2000) A new ETV6/TEL partner gene, ARG (ABL-related gene or ABL2), identified in an AML-M3 cell line with a t(1;12)(q25;p13) translocation. Blood. 95, 2126-2131 254 Vadlamudi, R. K., Sahin, A. A., Adam, L., Wang, R. A., and Kumar, R. (2003) Heregulin and HER2 signaling selectively activates c-Src phosphorylation at tyrosine 215. FEBS Lett. 543, 76-80 255 Goss, V. L., Lee, K. A., Moritz, A., Nardone, J., Spek, E. J., MacNeill, J., Rush, J., Comb, M. J., and Polakiewicz, R. D. (2006) A common phosphotyrosine signature for the Bcr-Abl kinase. Blood. 107, 4888-4897

160
256 Crooks, G. E., Hon, G., Chandonia, J. M., and Brenner, S. E. (2004) WebLogo: a sequence logo generator. Genome Res. 14, 1188-1190 257 Chou, M. F., and Schwartz, D. (2011) Biological sequence motif discovery using motif-x. Curr Protoc Bioinformatics. Chapter 13, Unit 13 15-24 258 Koncz, G., Pecht, I., Gergely, J., and Sarmay, G. (1999) Fcgamma receptor-mediated inhibition of human B cell activation: the role of SHP-2 phosphatase. Eur J Immunol. 29, 1980-1989 259 Whiting, R. J., Payne, C. J., Satiaputra, J., Kucera, N., Qiu, T. W., Irtegun, S., Gunn, N. J., Slavova-Azmanova, N. S., Mulhern, T. D., and Ingley, E. (2012) Targeting Lyn tyrosine kinase through protein fusions encompassing motifs of Cbp (Csk-binding protein) and the SOCS box of SOCS1. Biochem J. 442, 611-620 260 Ladbury, J. E., Lemmon, M. A., Zhou, M., Green, J., Botfield, M. C., and Schlessinger, J. (1995) Measurement of the binding of tyrosyl phosphopeptides to SH2 domains: a reappraisal. Proc Natl Acad Sci U S A. 92, 3199-3203 261 Safran, M., Dalah, I., Alexander, J., Rosen, N., Iny Stein, T., Shmoish, M., Nativ, N., Bahir, I., Doniger, T., Krug, H., Sirota-Madi, A., Olender, T., Golan, Y., Stelzer, G., Harel, A., and Lancet, D. (2010) GeneCards Version 3: the human gene integrator. Database (Oxford). 2010, baq020 262 Remmert, M., Biegert, A., Hauser, A., and Soding, J. (2011) HHblits: lightning-fast iterative protein sequence searching by HMM-HMM alignment. Nat Methods. 9, 173-175 263 Hornbeck, P. V., Kornhauser, J. M., Tkachev, S., Zhang, B., Skrzypek, E., Murray, B., Latham, V., and Sullivan, M. (2012) PhosphoSitePlus: a comprehensive resource for investigating the structure and function of experimentally determined post-translational modifications in man and mouse. Nucleic Acids Res. 40, D261-270 264 Reimand, J., Arak, T., and Vilo, J. (2011) g:Profiler--a web server for functional interpretation of gene lists (2011 update). Nucleic Acids Res. 39, W307-315 265 Soula, M., Rothhut, B., Camoin, L., Guillaume, J. L., Strosberg, D., Vorherr, T., Burn, P., Meggio, F., Fischer, S., and Fagard, R. (1993) Anti-CD3 and phorbol ester induce distinct phosphorylated sites in the SH2 domain of p56lck. J Biol Chem. 268, 27420-27427 266 Zhao, M., Sun, J., and Zhao, Z. (2013) TSGene: a web resource for tumor suppressor genes. Nucleic Acids Res. 41, D970-976 267 Spurling, C. C., Godman, C. A., Noonan, E. J., Rasmussen, T. P., Rosenberg, D. W., and Giardina, C. (2008) HDAC3 overexpression and colon cancer cell proliferation and differentiation. Mol Carcinog. 47, 137-147 268 Summers, A. R., Fischer, M. A., Stengel, K. R., Zhao, Y., Kaiser, J. F., Wells, C. E., Hunt, A., Bhaskara, S., Luzwick, J. W., Sampathi, S., Chen, X., Thompson, M. A., Cortez, D., and Hiebert, S. W. (2013) HDAC3 is essential for DNA replication in hematopoietic progenitor cells. J Clin Invest. 123, 3112-3123 269 Amsellem, V., Kryszke, M. H., Hervy, M., Subra, F., Athman, R., Leh, H., Brachet-Ducos, C., and Auclair, C. (2005) The actin cytoskeleton-associated protein zyxin acts as a tumor suppressor in Ewing tumor cells. Exp Cell Res. 304, 443-456 270 Firlej, V., Mathieu, J. R., Gilbert, C., Lemonnier, L., Nakhle, J., Gallou-Kabani, C., Guarmit, B., Morin, A., Prevarskaya, N., Delongchamps, N. B., and Cabon, F. (2011)

161
Thrombospondin-1 triggers cell migration and development of advanced prostate tumors. Cancer Res. 71, 7649-7658 271 Barrett, C. W., Ning, W., Chen, X., Smith, J. J., Washington, M. K., Hill, K. E., Coburn, L. A., Peek, R. M., Chaturvedi, R., Wilson, K. T., Burk, R. F., and Williams, C. S. (2012) Tumor suppressor function of the plasma glutathione peroxidase gpx3 in colitis-associated carcinoma. Cancer Res. 73, 1245-1255 272 Chen, C. I., Bergsagel, P. L., Paul, H., Xu, W., Lau, A., Dave, N., Kukreti, V., Wei, E., Leung-Hagesteijn, C., Li, Z. H., Brandwein, J., Pantoja, M., Johnston, J., Gibson, S., Hernandez, T., Spaner, D., and Trudel, S. (2011) Single-agent lenalidomide in the treatment of previously untreated chronic lymphocytic leukemia. J Clin Oncol. 29, 1175-1181 273 Smith, J., Figeys, D. (2008) Recent developments in mass spectrometry-based quantitative phosphoproteomics. Biochemistry and cell biology 86, 137-148
Related Documents