Protein Structure Protein Structure Databases Databases Databases of three dimensional Databases of three dimensional structures of proteins, where structures of proteins, where structure has been solved using X- structure has been solved using X- ray crystallography or nuclear ray crystallography or nuclear magnetic resonance (NMR) techniques magnetic resonance (NMR) techniques Protein Databases: Protein Databases: PDB (protein data bank) PDB (protein data bank) Swiss-Prot Swiss-Prot PIR PIR (Protein Information Resource) SCOP (Structural Classification of SCOP (Structural Classification of Proteins) Proteins)

Protein Structure Databases Databases of three dimensional structures of proteins, where structure has been solved using X-ray crystallography or nuclear.
Dec 20, 2015
Welcome message from author
This document is posted to help you gain knowledge. Please leave a comment to let me know what you think about it! Share it to your friends and learn new things together.
Transcript
Protein Structure Protein Structure DatabasesDatabases
Databases of three dimensional structures Databases of three dimensional structures of proteins, where structure has been of proteins, where structure has been solved using X-ray crystallography or solved using X-ray crystallography or nuclear magnetic resonance (NMR) nuclear magnetic resonance (NMR) techniquestechniques
Protein Databases:Protein Databases: PDB (protein data bank)PDB (protein data bank) Swiss-ProtSwiss-Prot PIR PIR (Protein Information Resource) SCOP (Structural Classification of Proteins)SCOP (Structural Classification of Proteins)
Protein Structure Protein Structure DatabasesDatabases
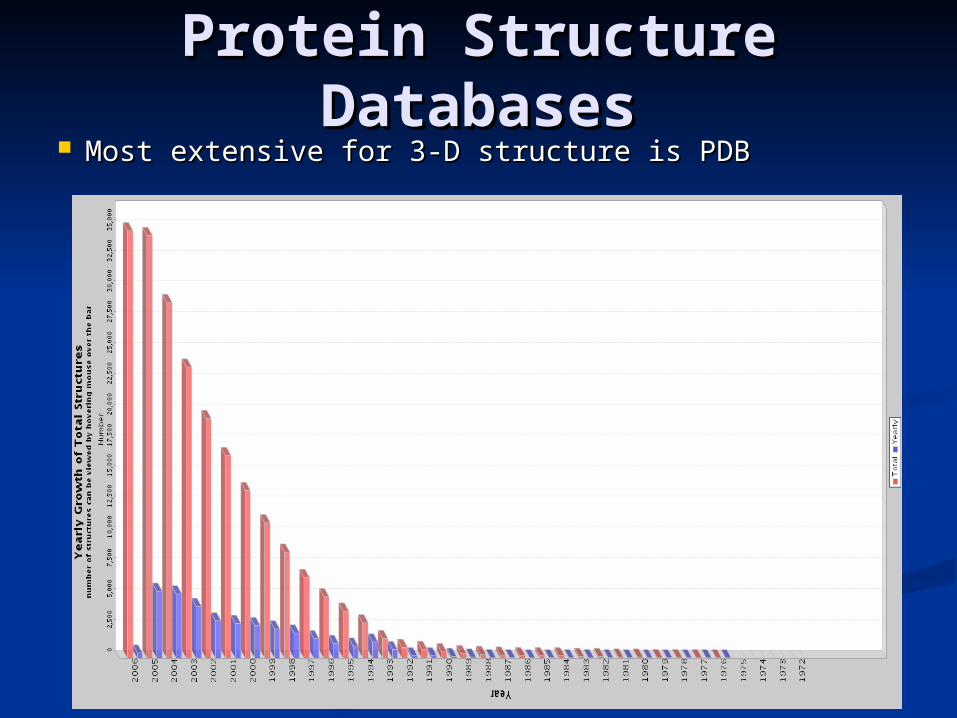
Most extensive for 3-D structure is PDBMost extensive for 3-D structure is PDB

Visualization of ProteinsVisualization of Proteins A number of programs convert atomic A number of programs convert atomic
coordinates of 3-d structures into views of coordinates of 3-d structures into views of the moleculethe molecule
allow the user to manipulate the molecule allow the user to manipulate the molecule by rotation, zooming, etc.by rotation, zooming, etc.
Critical in drug design -- yields insight Critical in drug design -- yields insight into how the protein might interact with into how the protein might interact with ligands at active sitesligands at active sites

Visualization of ProteinsVisualization of Proteins
Most popular programs for viewing 3-D Most popular programs for viewing 3-D structures:structures:
Protein explorer: Protein explorer: http://www.umass.edu/microbio/chime/pe/protexpl/frntdoorhttp://www.umass.edu/microbio/chime/pe/protexpl/frntdoor.htm.htm
Rasmol: http://www.umass.edu/microbio/rasmol/ Rasmol: http://www.umass.edu/microbio/rasmol/ Chime: http://www.umass.edu/microbio/chime/ Chime: http://www.umass.edu/microbio/chime/ Cn3D: http://www.ncbi.nlm.nih.gov/Structure/ Cn3D: http://www.ncbi.nlm.nih.gov/Structure/ Mage: Mage:
http://kinemage.biochem.duke.edu/website/kinhome.html http://kinemage.biochem.duke.edu/website/kinhome.html Swiss 3D viewer: http://www.expasy.ch/spdbv/mainpage.html Swiss 3D viewer: http://www.expasy.ch/spdbv/mainpage.html
Alignment of Protein Alignment of Protein StructureStructure
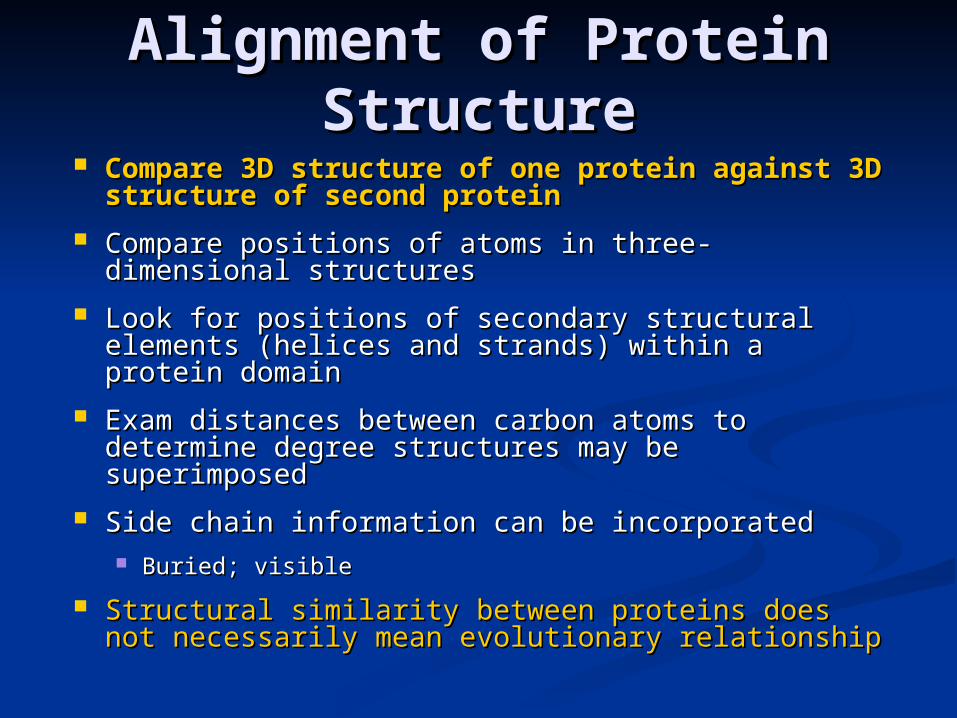
Compare 3D structure of one protein against Compare 3D structure of one protein against 3D structure of second protein3D structure of second protein
Compare positions of atoms in three-dimensional Compare positions of atoms in three-dimensional structuresstructures
Look for positions of secondary structural Look for positions of secondary structural elements (helices and strands) within a protein elements (helices and strands) within a protein domain domain
Exam distances between carbon atoms to Exam distances between carbon atoms to determine degree structures may be superimposeddetermine degree structures may be superimposed
Side chain information can be incorporatedSide chain information can be incorporated Buried; visibleBuried; visible
Structural similarity between proteins does not Structural similarity between proteins does not necessarily mean evolutionary relationshipnecessarily mean evolutionary relationship

Alignment of Protein Alignment of Protein StructureStructure

T
Simple case – two closely related proteins with the same number of amino acids.
Structure alignment
Find a transformationto achieve the best superposition

TransformationsTransformations
Translation
Translation and Rotation -- Rigid Motion (Euclidian space)
txx
'
txRx
'
Types ofTypes ofStructure Structure
ComparisonComparison
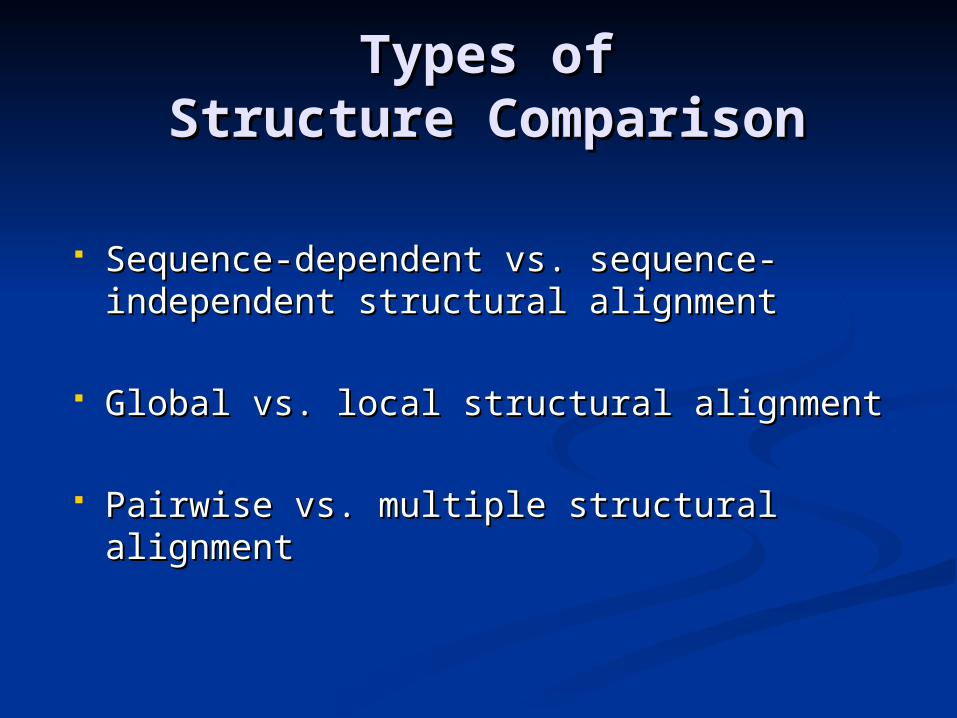
Sequence-dependent vs. sequence-Sequence-dependent vs. sequence-independent structural alignmentindependent structural alignment
Global vs. local structural alignmentGlobal vs. local structural alignment
Pairwise vs. multiple structural Pairwise vs. multiple structural alignmentalignment

1234567ASCRKLE¦¦¦¦¦¦¦ASCRKLE
1
2
3 45 6
7
1
2
34 5
6 7
Minimize rmsd of distances 1-1,...,7-7
N
i
iyixN
rmsd 2))()((1
Sequence-dependent Structure Comparison
1
2
3 45 6
71
2
3
4 56
7
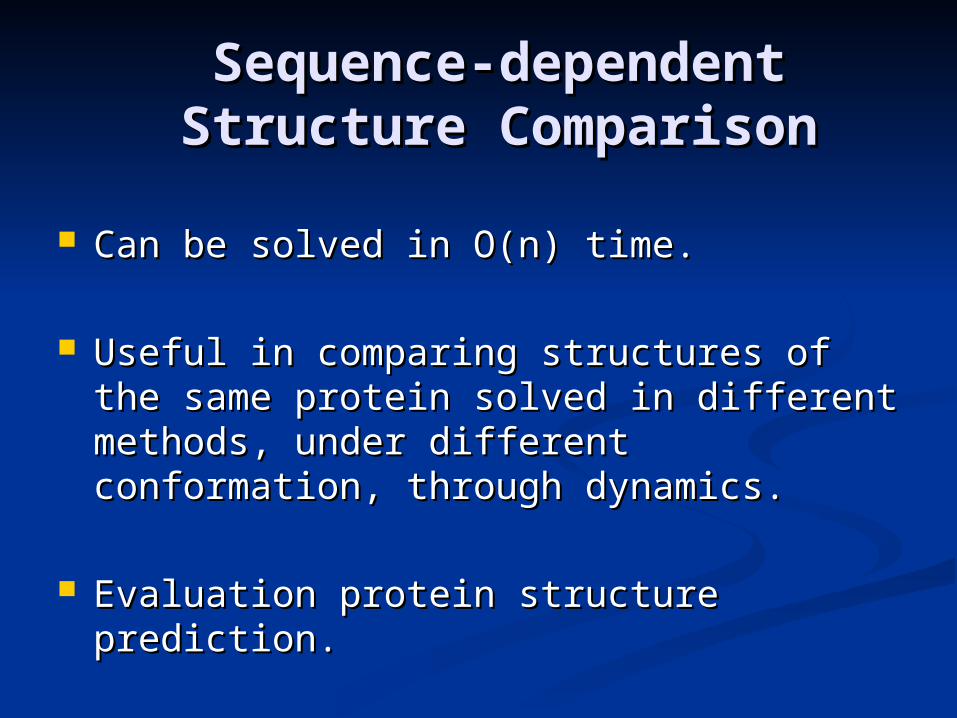
Sequence-dependent Sequence-dependent Structure ComparisonStructure Comparison
Can be solved in O(n) time.Can be solved in O(n) time.
Useful in comparing structures of the Useful in comparing structures of the same protein solved in different methods, same protein solved in different methods, under different conformation, through under different conformation, through dynamics.dynamics.
Evaluation protein structure prediction.Evaluation protein structure prediction.
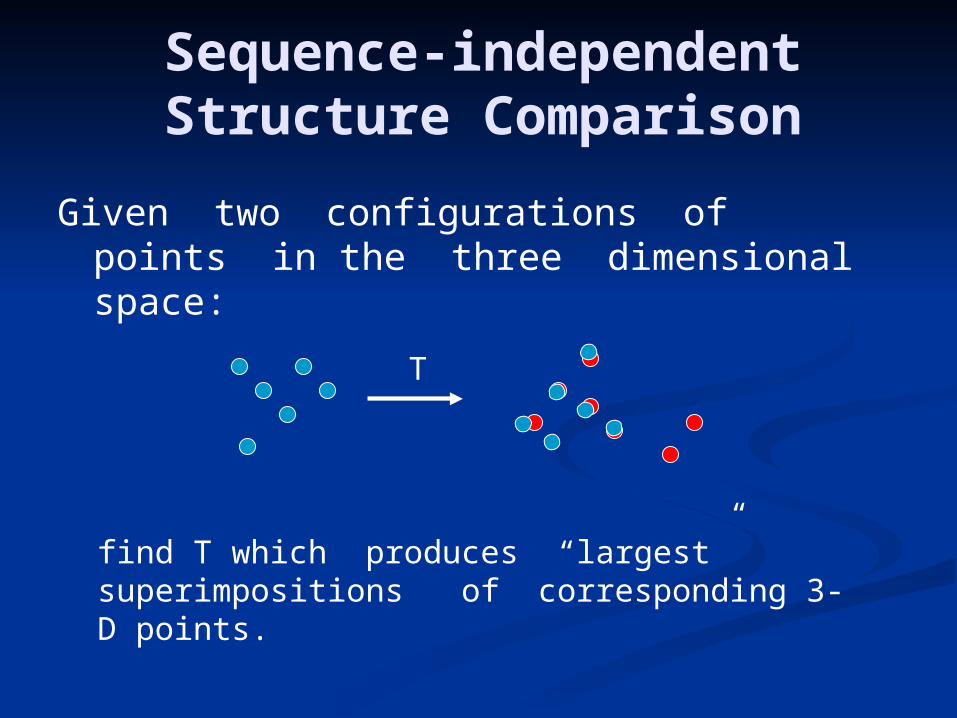
Sequence-independent Structure Comparison
Given two configurations of points in the three dimensional space:
find T which produces “largest” superimpositions of corresponding 3-D points.
T
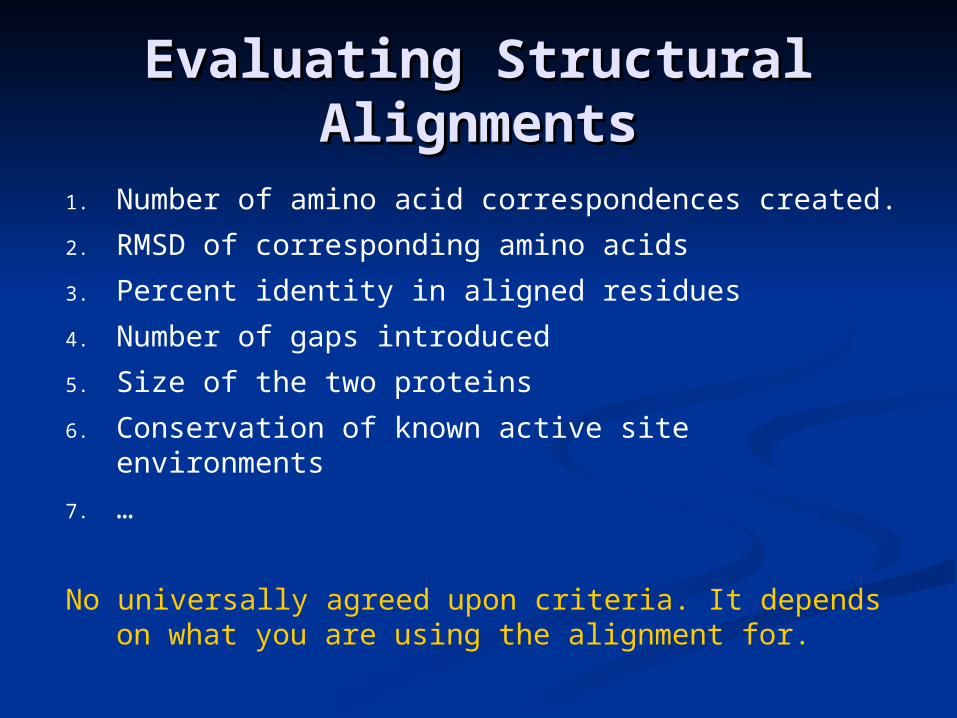
Evaluating Structural Evaluating Structural AlignmentsAlignments
1. Number of amino acid correspondences created.
2. RMSD of corresponding amino acids
3. Percent identity in aligned residues
4. Number of gaps introduced
5. Size of the two proteins
6. Conservation of known active site environments
7. …
No universally agreed upon criteria. It depends on what you are using the alignment for.
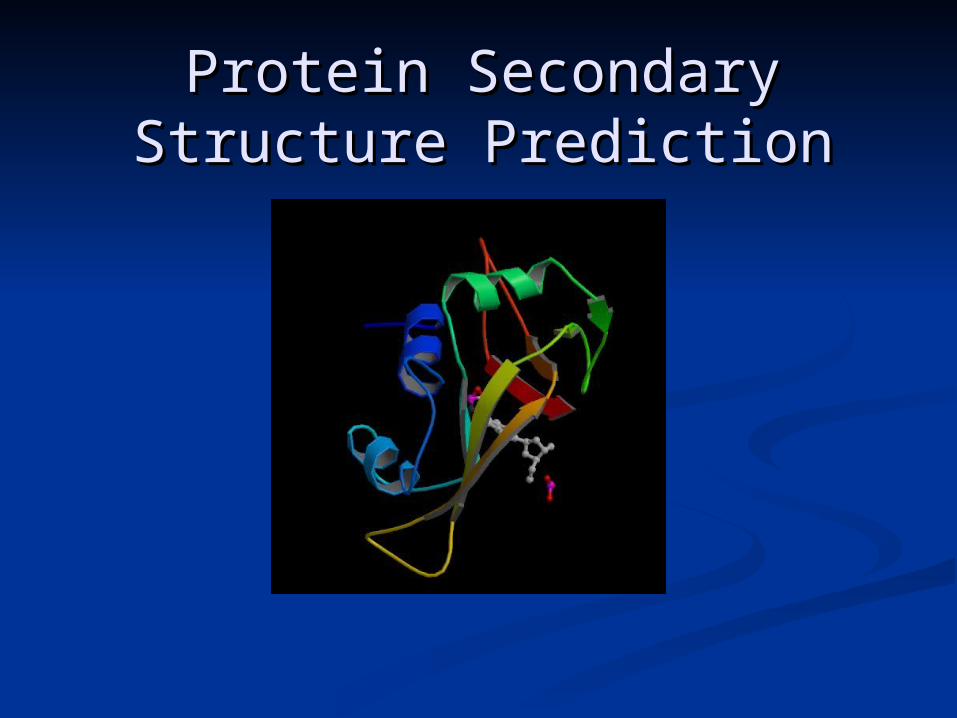
Protein Secondary Structure Protein Secondary Structure PredictionPrediction

Why secondary structure Why secondary structure prediction?prediction?
Accurate secondary structure prediction Accurate secondary structure prediction can be an important information for the can be an important information for the tertiary structure predictiontertiary structure prediction
Protein function predictionProtein function prediction Protein classificationProtein classification Predicting structural changePredicting structural change An easier problem than 3D structure An easier problem than 3D structure
prediction (more than 40 years of history).prediction (more than 40 years of history).
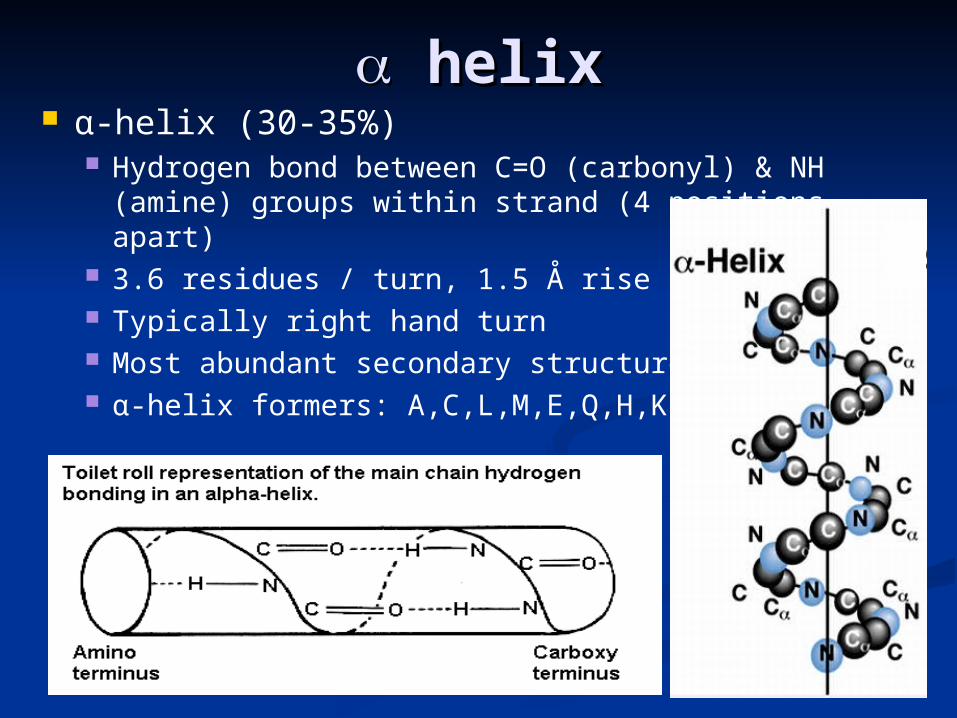
helixhelix α-helix (30-35%)
Hydrogen bond between C=O (carbonyl) & NH (amine) groups within strand (4 positions apart)
3.6 residues / turn, 1.5 Å rise / residue Typically right hand turn Most abundant secondary structure α-helix formers: A,C,L,M,E,Q,H,K
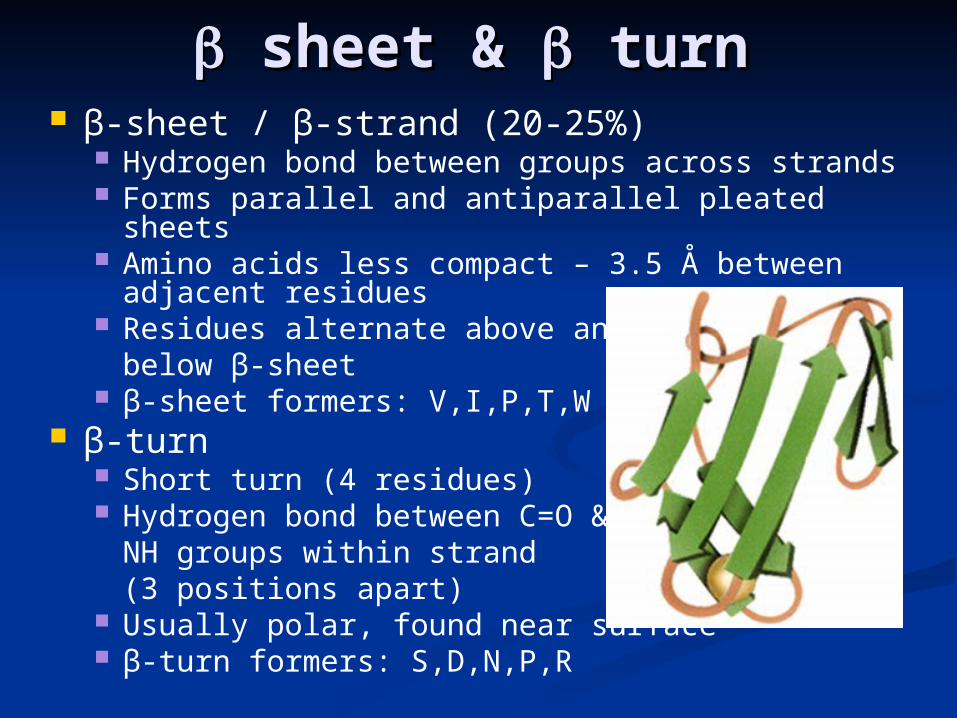
sheet & sheet & turn turn β-sheet / β-strand (20-25%)
Hydrogen bond between groups across strands Forms parallel and antiparallel pleated sheets Amino acids less compact – 3.5 Å between
adjacent residues Residues alternate above and
below β-sheet β-sheet formers: V,I,P,T,W
β-turn Short turn (4 residues) Hydrogen bond between C=O &
NH groups within strand (3 positions apart)
Usually polar, found near surface β-turn formers: S,D,N,P,R
Others Loop
Regions between α-helices and β-sheets On the surface, vary in length and 3D
configurations Do not have regular periodic structures Loop formers: small polar residues
Coil (40-50%) Generally speaking, anything besides α-
helix, β-sheet, β-turn
Assigning Secondary Assigning Secondary StructureStructure
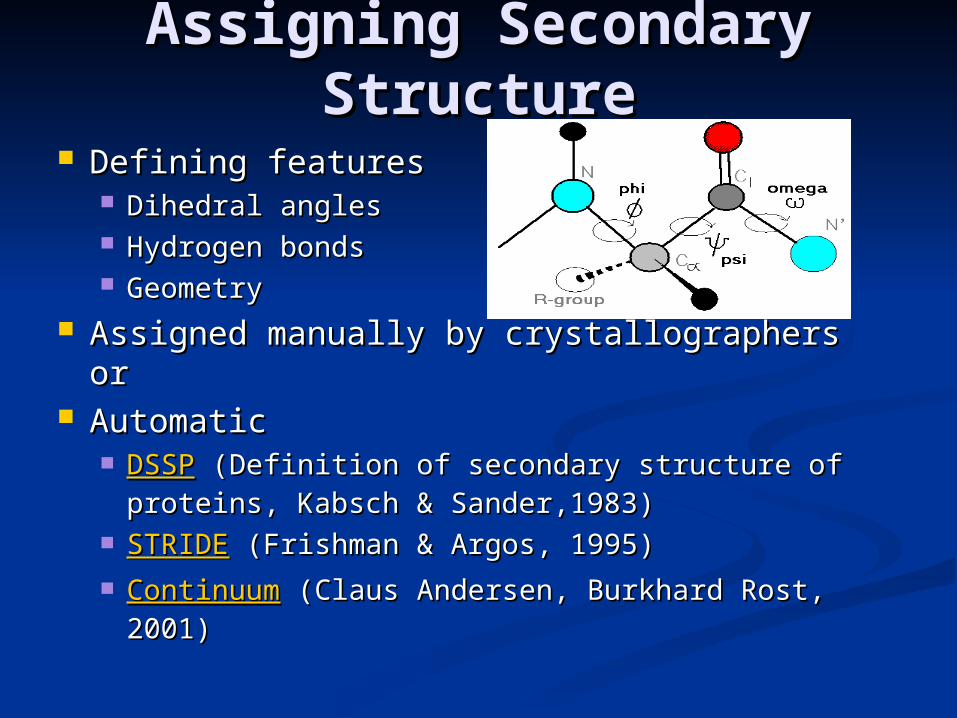
Defining featuresDefining features Dihedral anglesDihedral angles Hydrogen bondsHydrogen bonds GeometryGeometry
Assigned manually by crystallographers orAssigned manually by crystallographers or AutomaticAutomatic
DSSPDSSP (Definition of secondary structure of (Definition of secondary structure of proteins, Kabsch & Sander,1983)proteins, Kabsch & Sander,1983)
STRIDESTRIDE (Frishman & Argos, 1995) (Frishman & Argos, 1995) ContinuumContinuum (Claus Andersen, Burkhard Rost, (Claus Andersen, Burkhard Rost,
2001)2001)

Definition of secondary Definition of secondary structure of proteins structure of proteins
(DSSP)(DSSP) The DSSP codeThe DSSP code
H = alpha helix H = alpha helix B = residue in isolated beta-bridge B = residue in isolated beta-bridge E = extended strand, participates in beta E = extended strand, participates in beta
ladder ladder G = 3-helix (3/10 helix) G = 3-helix (3/10 helix) I = 5 helix (pi helix) I = 5 helix (pi helix) T = hydrogen bonded turn T = hydrogen bonded turn S = bend S = bend
CASP StandardCASP Standard H = (H, G, I), E = (E, B), C = (T, S)H = (H, G, I), E = (E, B), C = (T, S)
Secondary Structure Secondary Structure PredictionPrediction
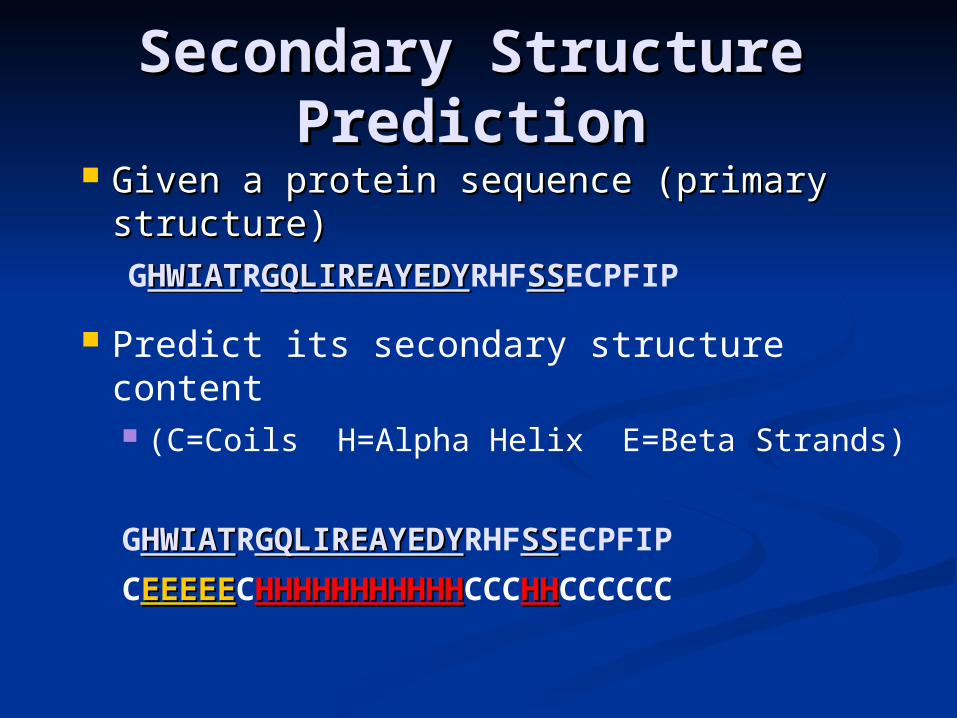
Given a protein sequence (primary Given a protein sequence (primary structure) structure) GHWIATHWIATRGQLIREAYEDYGQLIREAYEDYRHFSSSSECPFIP
Predict its secondary structure content (C=Coils H=Alpha Helix E=Beta Strands)
GHWIATHWIATRGQLIREAYEDYGQLIREAYEDYRHFSSSSECPFIP
CEEEEEEEEEECHHHHHHHHHHHHHHHHHHHHHHCCCHHHHCCCCCC

AlgorithmAlgorithm
Chou-Fasman MethodChou-Fasman Method
Examining windows of 5 - 6 Examining windows of 5 - 6 residues to predict structureresidues to predict structure
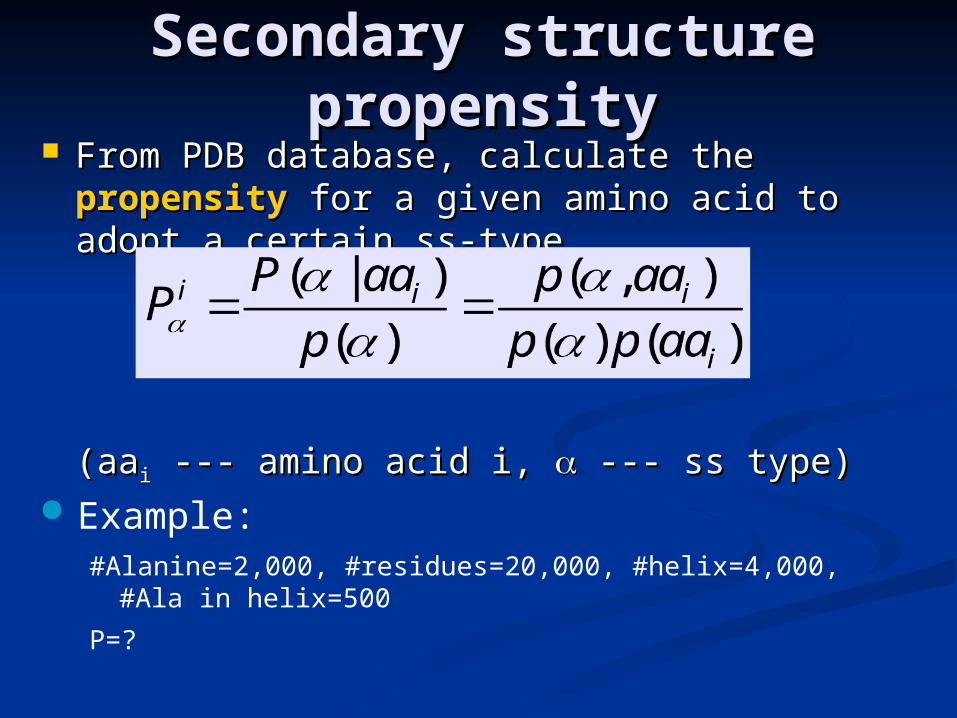
From PDB database, calculate the From PDB database, calculate the propensitypropensity for a given amino acid to adopt a for a given amino acid to adopt a certain ss-typecertain ss-type
(aa(aaii --- amino acid i, --- amino acid i, --- ss type) --- ss type) Example:
#Alanine=2,000, #residues=20,000, #helix=4,000, #Ala in helix=500
P=?
Secondary structure Secondary structure propensitypropensity
Secondary structure Secondary structure propensitypropensity
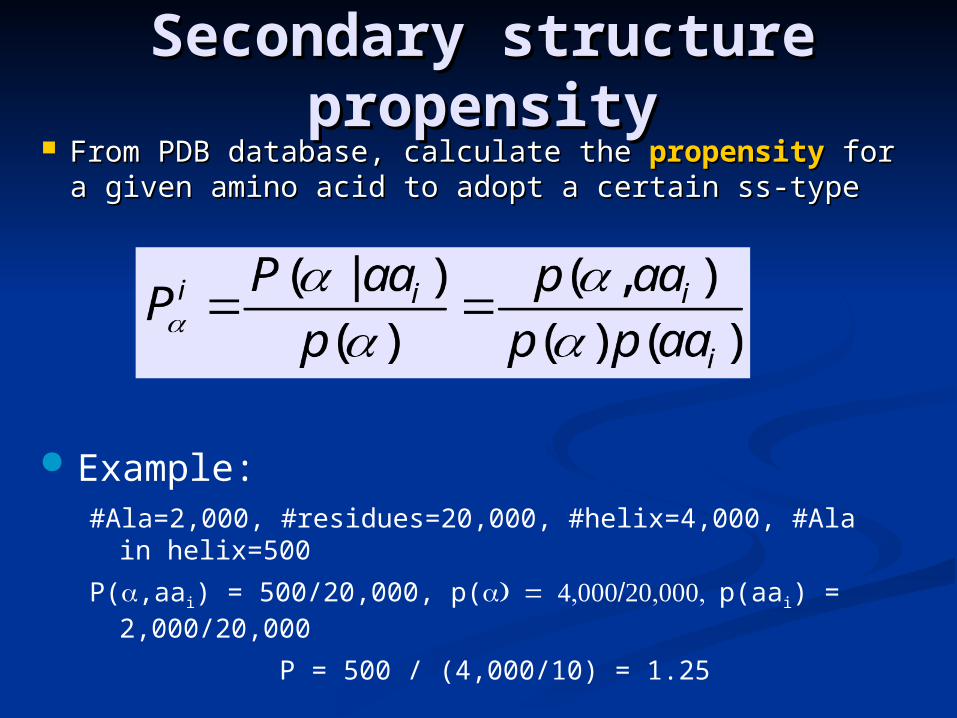
From PDB database, calculate the From PDB database, calculate the propensitypropensity for a for a given amino acid to adopt a certain ss-typegiven amino acid to adopt a certain ss-type
Example:#Ala=2,000, #residues=20,000, #helix=4,000, #Ala in helix=500
P(,aai) = 500/20,000, p(p(aai) = 2,000/20,000
P = 500 / (4,000/10) = 1.25
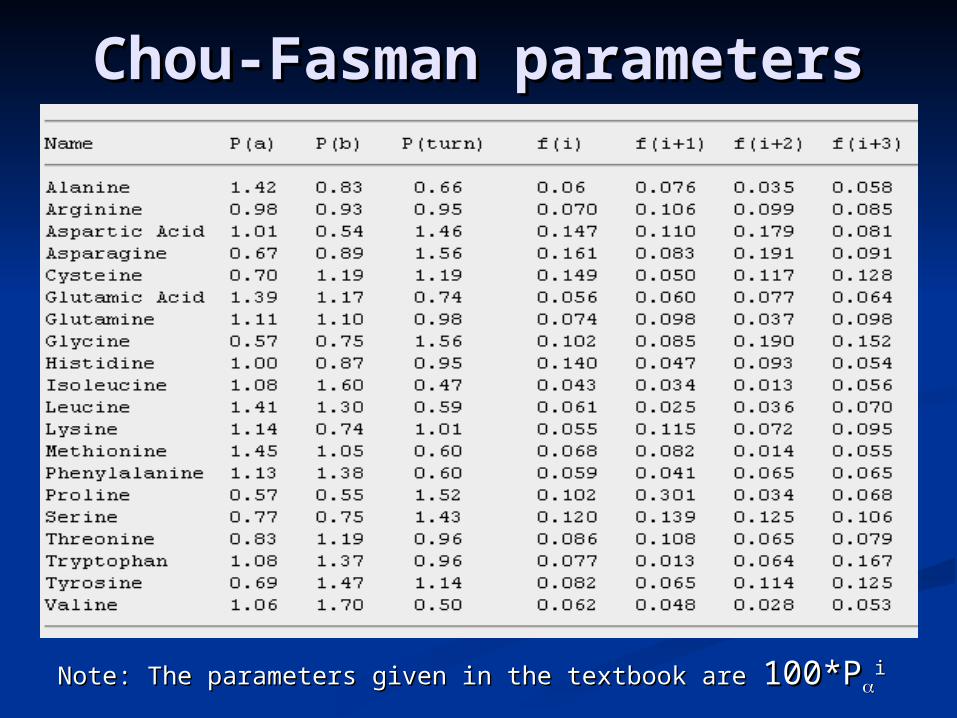
Chou-Fasman Chou-Fasman parametersparameters
Note: The parameters given in the textbook are Note: The parameters given in the textbook are 100*P100*Pii

Chou-Chou-FasmanFasman algorithm algorithm Helix:Helix:
Scan through the peptide and identify regions Scan through the peptide and identify regions where 4 out of 6 contiguous residues have P(H) > where 4 out of 6 contiguous residues have P(H) > 1.00. That region is declared an alpha-helix. 1.00. That region is declared an alpha-helix.
Extend the helix in both directions until a set of Extend the helix in both directions until a set of four contiguous residues that have an average P(H) four contiguous residues that have an average P(H) < 1.00 is reached. That is declared the end of the < 1.00 is reached. That is declared the end of the helix. helix.
If the segment defined by this procedure is longer If the segment defined by this procedure is longer than 5 residues and the average P(H) > P(E) for than 5 residues and the average P(H) > P(E) for that segment, the segment can be assigned as a that segment, the segment can be assigned as a helix. helix.
Repeat this procedure to locate all of the helical Repeat this procedure to locate all of the helical regions in the sequence. regions in the sequence.
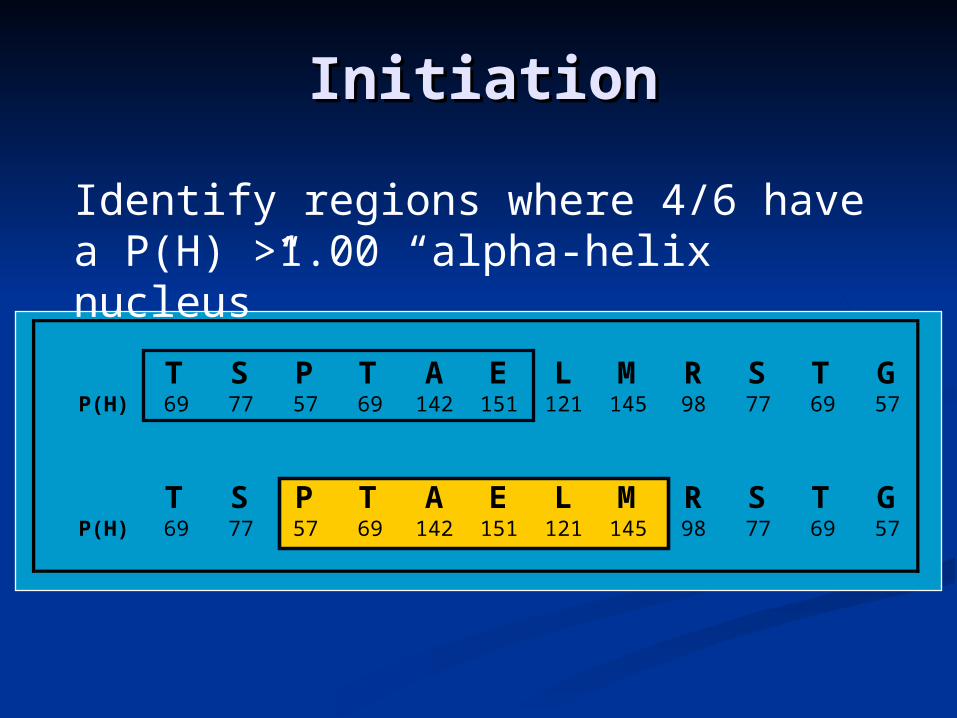
T S P T A E L M R S T GP(H) 69 77 57 69 142 151 121 145 98 77 69 57
T S P T A E L M R S T GP(H) 69 77 57 69 142 151 121 145 98 77 69 57
InitiationInitiation
Identify regions where 4/6 have a P(H) >1.00 “alpha-helix nucleus”
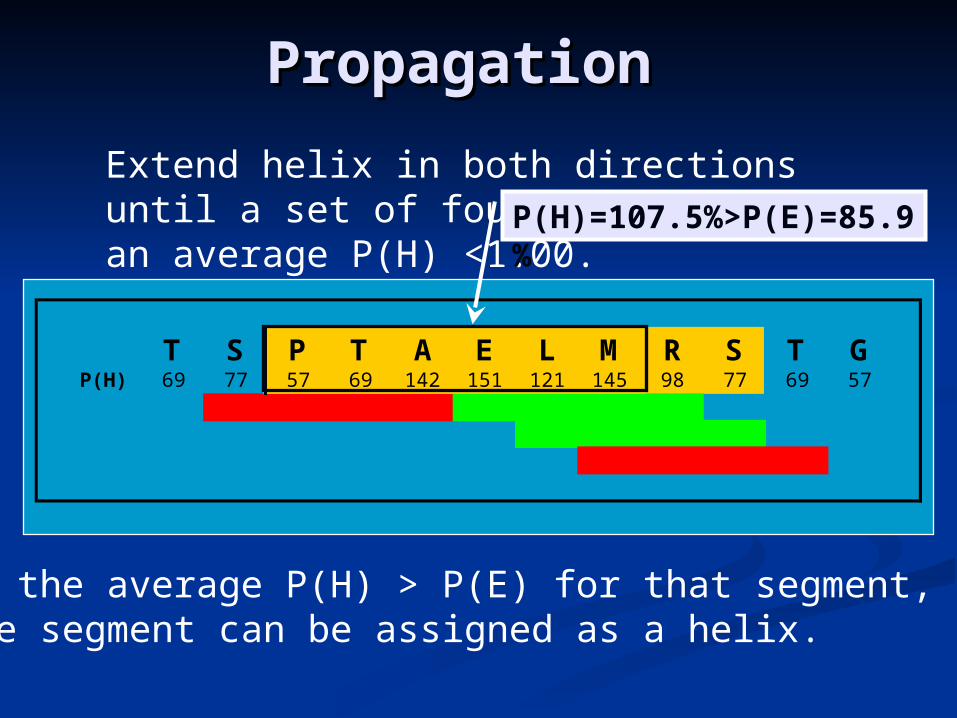
PropagationPropagation
Extend helix in both directions until a set of four residues have an average P(H) <1.00.
T S P T A E L M R S T GP(H) 69 77 57 69 142 151 121 145 98 77 69 57
If the average P(H) > P(E) for that segment, the segment can be assigned as a helix.
P(H)=107.5%>P(E)=85.9%
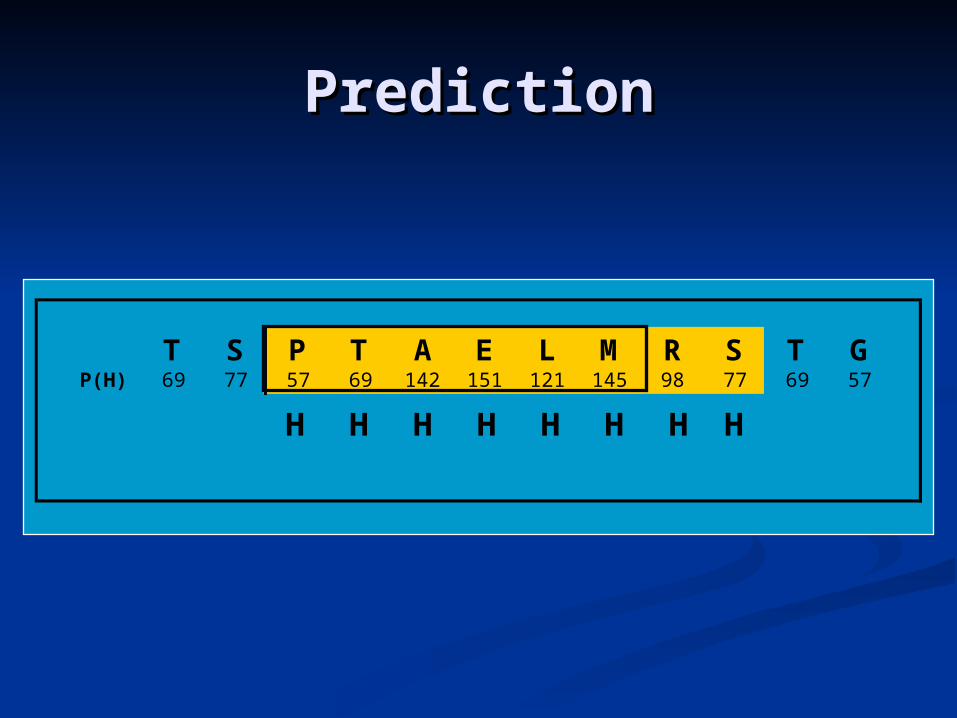
PredictionPrediction
T S P T A E L M R S T GP(H) 69 77 57 69 142 151 121 145 98 77 69 57
H H HH H H HH
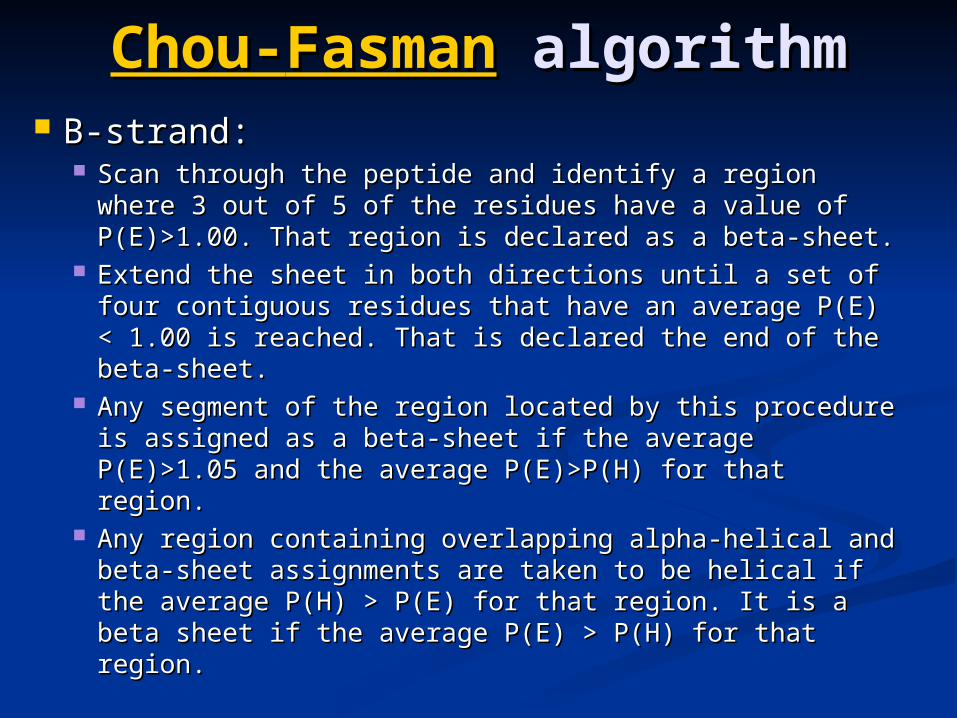
Chou-Chou-FasmanFasman algorithm algorithm B-strand:B-strand:
Scan through the peptide and identify a region where Scan through the peptide and identify a region where 3 out of 5 of the residues have a value of P(E)>1.00. 3 out of 5 of the residues have a value of P(E)>1.00. That region is declared as a beta-sheet. That region is declared as a beta-sheet.
Extend the sheet in both directions until a set of four Extend the sheet in both directions until a set of four contiguous residues that have an average P(E) < 1.00 contiguous residues that have an average P(E) < 1.00 is reached. That is declared the end of the beta-sheet. is reached. That is declared the end of the beta-sheet.
Any segment of the region located by this procedure Any segment of the region located by this procedure is assigned as a beta-sheet if the average P(E)>1.05 is assigned as a beta-sheet if the average P(E)>1.05 and the average P(E)>P(H) for that region. and the average P(E)>P(H) for that region.
Any region containing overlapping alpha-helical and Any region containing overlapping alpha-helical and beta-sheet assignments are taken to be helical if the beta-sheet assignments are taken to be helical if the average P(H) > P(E) for that region. It is a beta sheet average P(H) > P(E) for that region. It is a beta sheet if the average P(E) > P(H) for that region. if the average P(E) > P(H) for that region.
Chou-Chou-FasmanFasman algorithm algorithm
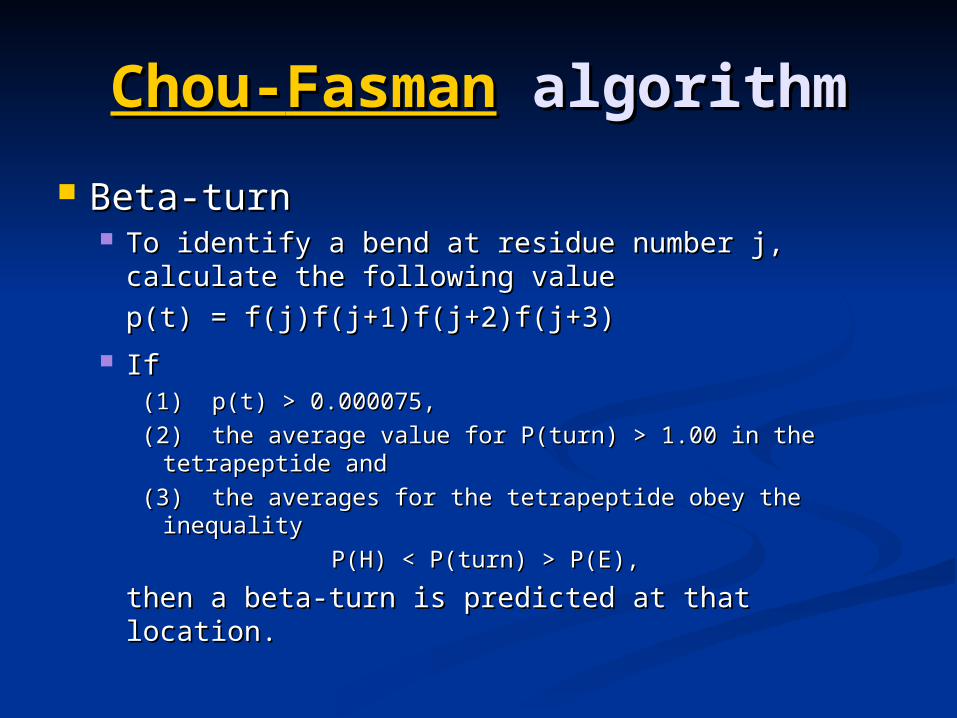
Beta-turnBeta-turn To identify a bend at residue number j, To identify a bend at residue number j,
calculate the following value calculate the following value
p(t) = f(j)f(j+1)f(j+2)f(j+3) p(t) = f(j)f(j+1)f(j+2)f(j+3)
If If (1) p(t) > 0.000075,(1) p(t) > 0.000075,
(2) the average value for P(turn) > 1.00 in the (2) the average value for P(turn) > 1.00 in the tetrapeptide andtetrapeptide and
(3) the averages for the tetrapeptide obey the (3) the averages for the tetrapeptide obey the inequality inequality
P(H) < P(turn) > P(E), P(H) < P(turn) > P(E),
then a beta-turn is predicted at that location. then a beta-turn is predicted at that location.
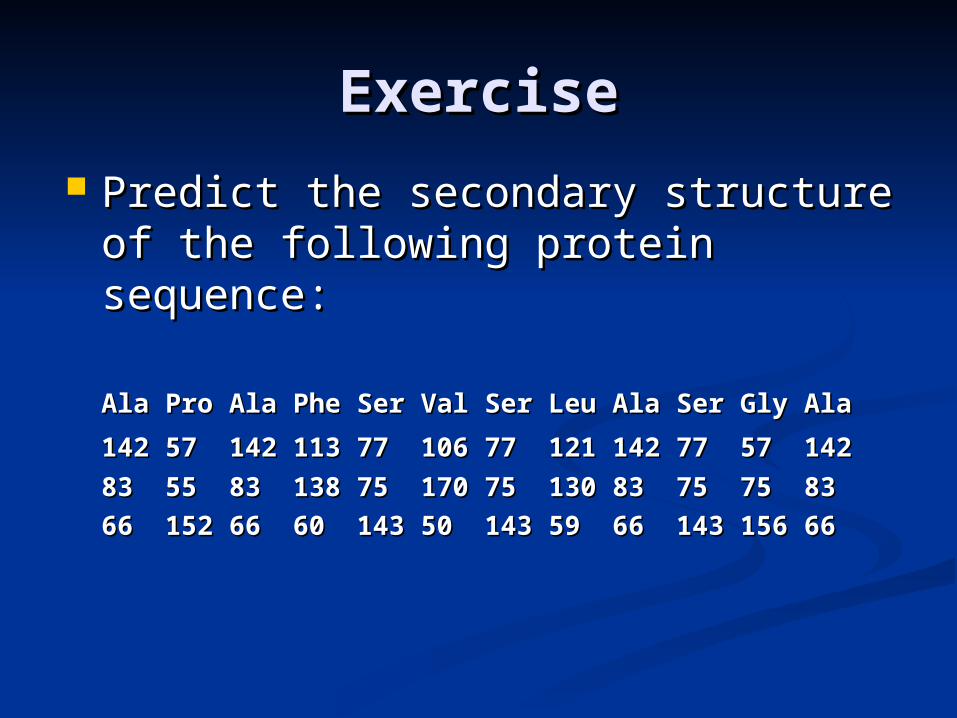
ExerciseExercise Predict the secondary structure of Predict the secondary structure of
the following protein sequence:the following protein sequence:
Ala Pro Ala Phe Ser Val Ser Leu Ala Ser Gly AlaAla Pro Ala Phe Ser Val Ser Leu Ala Ser Gly Ala
142 57 142 113 77 106 77 121 142 77 57 142142 57 142 113 77 106 77 121 142 77 57 142
83 55 83 138 75 170 75 130 83 75 75 8383 55 83 138 75 170 75 130 83 75 75 83
66 152 66 60 143 50 143 59 66 143 156 66 66 152 66 60 143 50 143 59 66 143 156 66
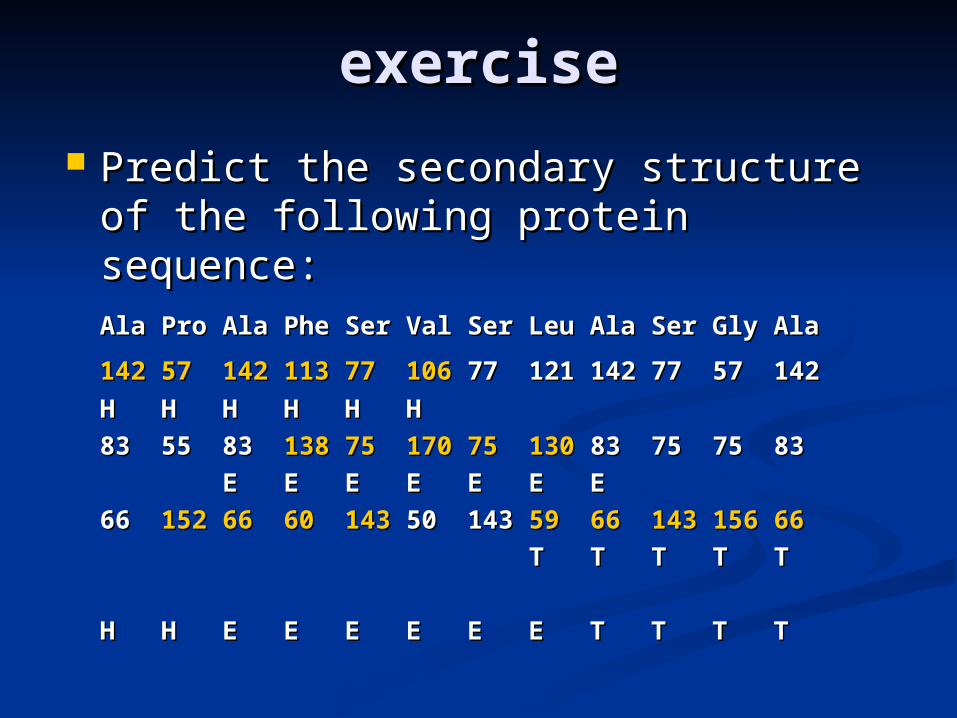
exerciseexercise
Predict the secondary structure of Predict the secondary structure of the following protein sequence:the following protein sequence:Ala Pro Ala Phe Ser Val Ser Leu Ala Ser Gly AlaAla Pro Ala Phe Ser Val Ser Leu Ala Ser Gly Ala
142 57 142 113 77 106142 57 142 113 77 106 77 121 142 77 57 142 77 121 142 77 57 142
H H H H H H H H H H H H
83 55 83 83 55 83 138 75 170 75 130138 75 170 75 130 83 75 75 83 83 75 75 83
E E E E E E EE E E E E E E
66 66 152 66 60 143152 66 60 143 50 143 50 143 59 66 143 156 6659 66 143 156 66
T T T T TT T T T T
H H E E E E E E T T T TH H E E E E E E T T T T

Prediction Methods Single sequence
Examine single protein sequence Base prediction on
Statistics – composition of amino acids Neural networks – patterns of amino acids
Multiple sequence alignment First create MSA
Use sequences from PSI-BLAST, CLUSTALW, etc… Align sequence with related proteins in family
Predict secondary structure based on consensus/profile
Generally improves prediction 8-9%

AccuracyAccuracyaccuracyaccuracy
Statistical method (single sequence)Statistical method (single sequence)1974 Chou & Fasman1974 Chou & Fasman ~50-53%~50-53%19781978 Garnier Garnier 63% 63%
Statistical method (Multiple seqs)Statistical method (Multiple seqs)19871987 Zvelebil Zvelebil 66%66%19931993 Yi & Lander Yi & Lander 68%68%
Neural networkNeural network19881988 QianQian & & SejnowskiSejnowski 64.3%64.3%19931993 RostRost & Sander & Sander 70.8-72.0%70.8-72.0%19971997 Frishman & Argos Frishman & Argos <75% <75% 19991999 Cuff & Barton Cuff & Barton 72.9%72.9%19991999 Jones Jones 76.5%76.5%20002000 Petersen et al. Petersen et al. 77.9%77.9%

Neural networkNeural network
Input signals are summed
and turned into zero or one
J1
J2
J3
J4
Feed-forward multilayer network
Input layer Hidden layer Output layer
neurons
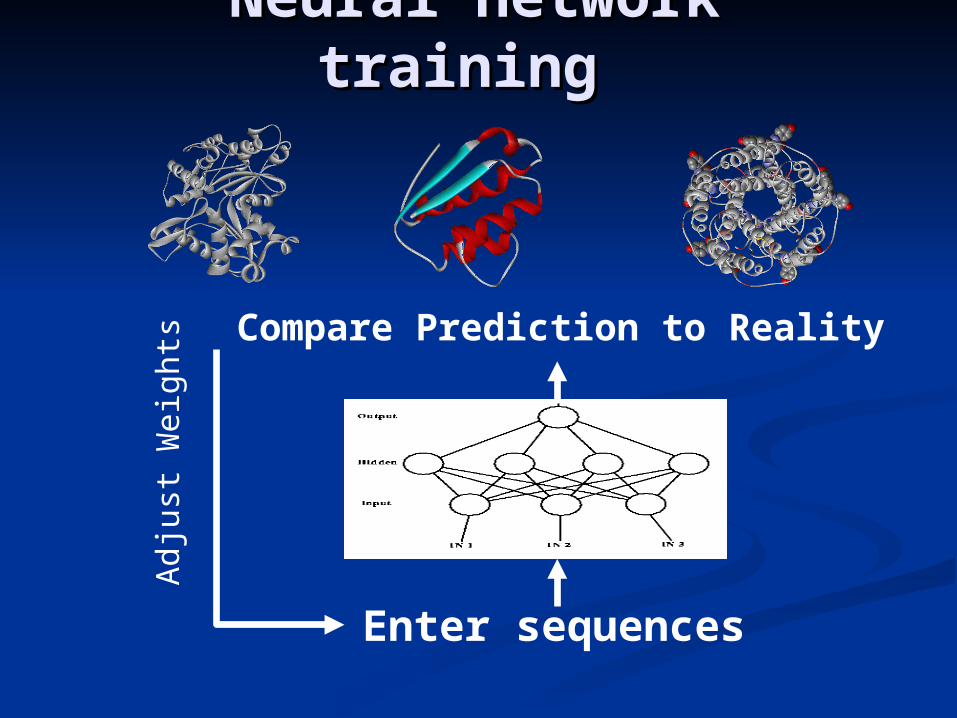
Enter sequences
Compare Prediction to Reality
Adj
ust W
eigh
ts
Neural network Neural network training training

Neural net for secondary Neural net for secondary structurestructure
ACDEFGHIKLMNPQRSTVWY.
H
E
L
D (L)
R (E)
Q (E)
G (E)
F (E)
V (E)
P (E)
A (H)
A (H)
Y (H)
V (E)
K (E)
K (E)
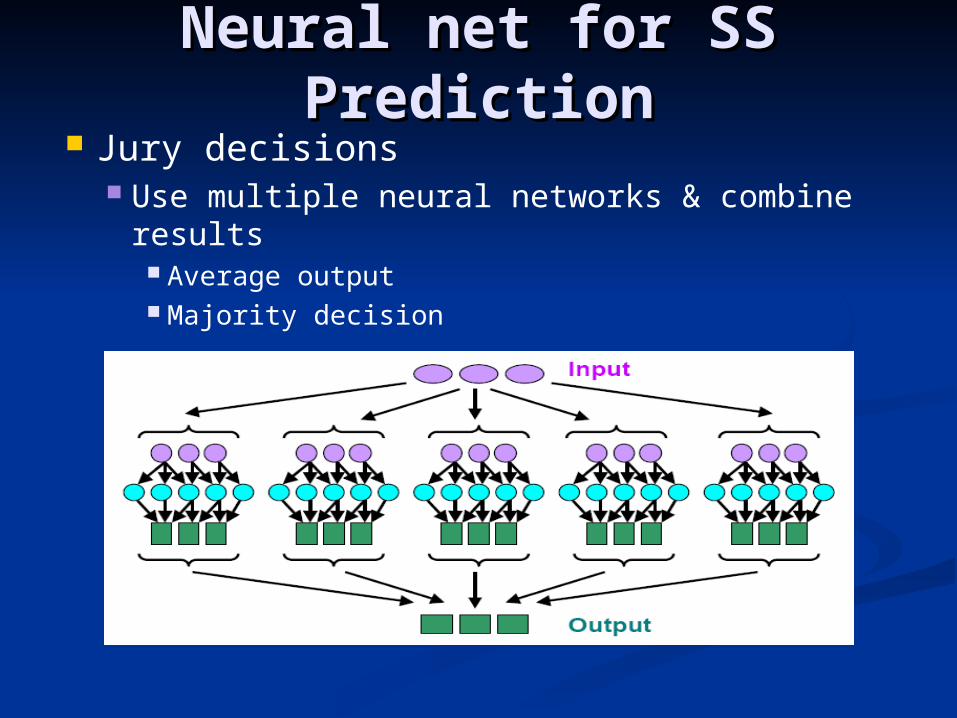
Neural net for SS Neural net for SS PredictionPrediction
Jury decisions Use multiple neural networks & combine
results Average output Majority decision

Neural net for SS Neural net for SS PredictionPrediction
JPRED [Cuff+ 1998] Finds consensus from PHD, PREDATOR,
DSC, NNSSP, etc…
Related Documents


