1 Protein NMR spectroscopy Jana Sticht AG Freund, FU Berlin 11.09.2014

Welcome message from author
This document is posted to help you gain knowledge. Please leave a comment to let me know what you think about it! Share it to your friends and learn new things together.
Transcript
1
Protein NMR spectroscopy
Jana Sticht AG Freund, FU Berlin
11.09.2014
2
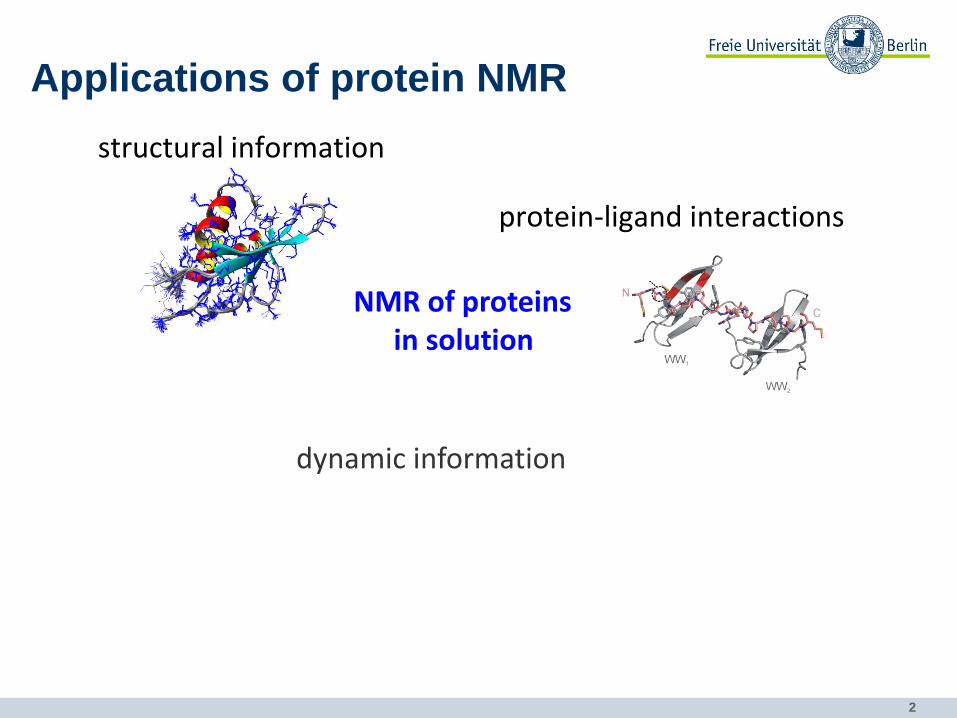
Applications of protein NMR
• dynamic information
NMR of proteins in solution
protein-ligand interactions
structural information
3
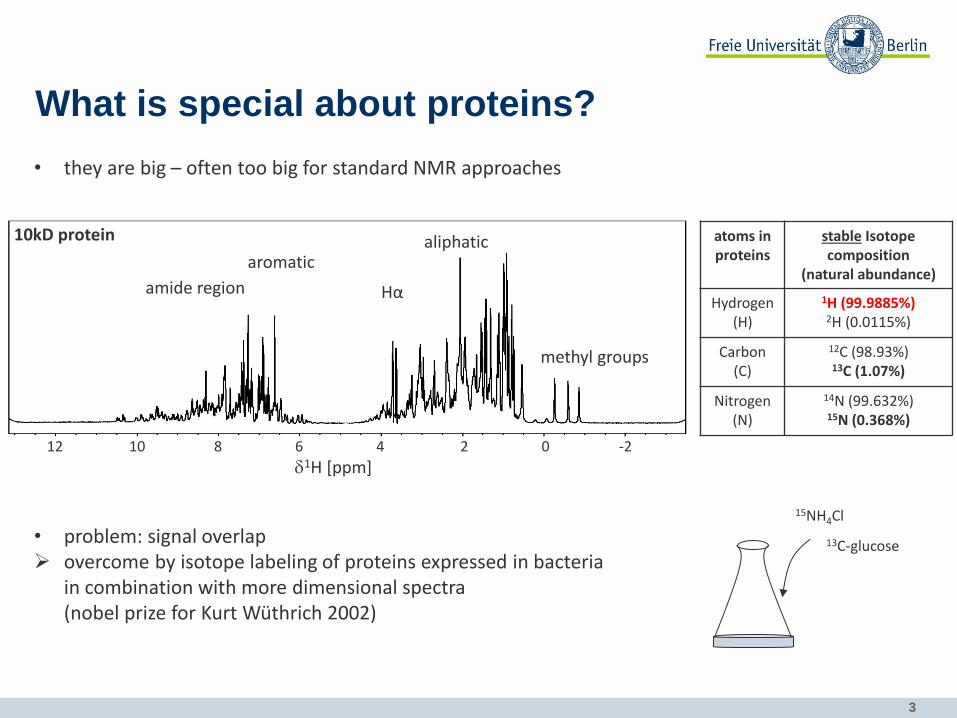
What is special about proteins?
• they are big – often too big for standard NMR approaches
atoms in proteins
stable Isotope composition
(natural abundance)
Hydrogen (H)
1H (99.9885%) 2H (0.0115%)
Carbon (C)
12C (98.93%) 13C (1.07%)
Nitrogen (N)
14N (99.632%) 15N (0.368%)
12 12 10 8 6 4 2 0 -2
d1H [ppm]
methyl groups
aliphatic
Hα
aromatic
amide region
10kD protein
• problem: signal overlap overcome by isotope labeling of proteins expressed in bacteria
in combination with more dimensional spectra (nobel prize for Kurt Wüthrich 2002)
15NH4Cl
13C-glucose
4
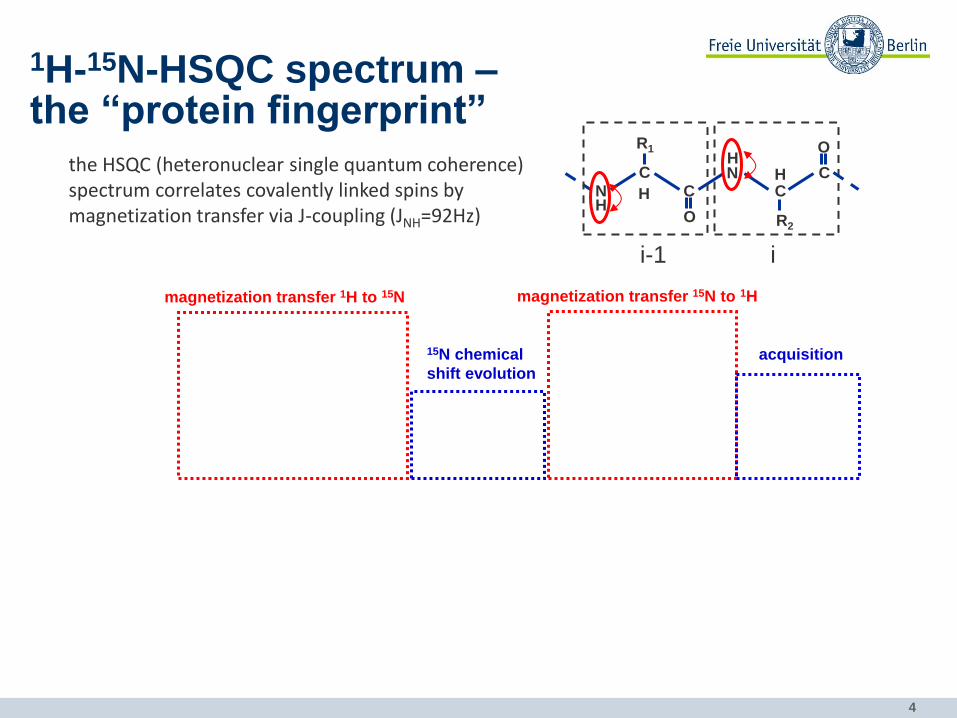
the HSQC (heteronuclear single quantum coherence) spectrum correlates covalently linked spins by magnetization transfer via J-coupling (JNH=92Hz)
magnetization transfer 15N to 1H
15N chemical
shift evolution
acquisition
N H
C
C
O
N
C
H
R2
H
R1
i i-1
O
C
H
1H-15N-HSQC spectrum – the “protein fingerprint”
magnetization transfer 1H to 15N
5
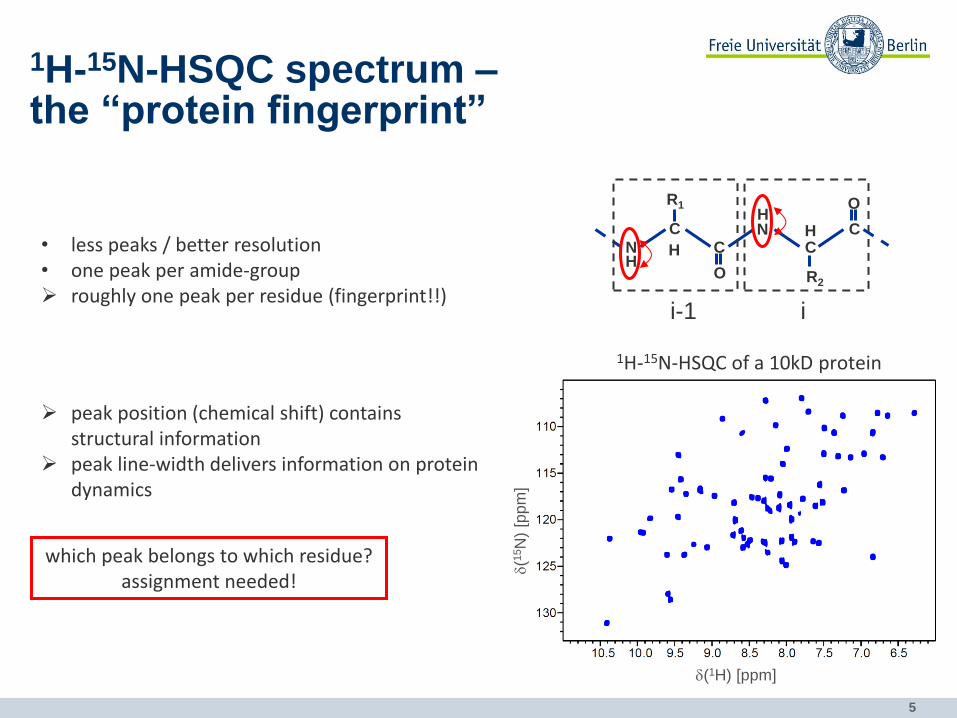
1H-15N-HSQC spectrum – the “protein fingerprint”
• less peaks / better resolution • one peak per amide-group roughly one peak per residue (fingerprint!!)
N H
C
C
O
N C
H
R2
H
R1
i i-1
O
C
H
d(1H) [ppm]
d(1
5N
) [p
pm
]
1H-15N-HSQC of a 10kD protein
peak position (chemical shift) contains structural information
peak line-width delivers information on protein dynamics
which peak belongs to which residue? assignment needed!
6
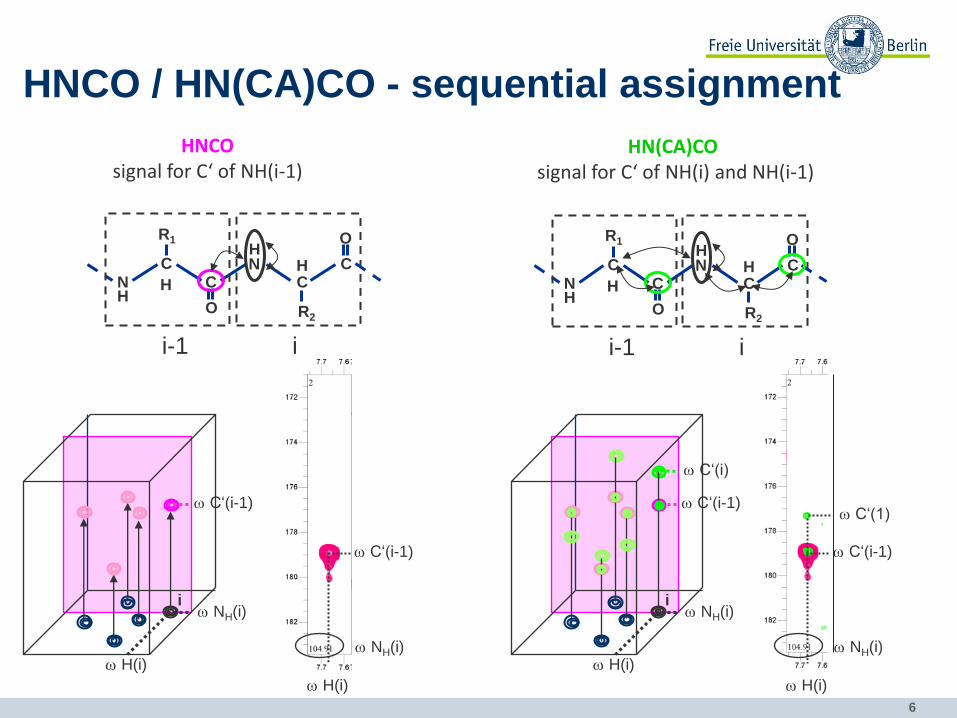
HNCO / HN(CA)CO - sequential assignment
N H
C
C
O
N C
H
R2
H
R1
HNCO signal for C‘ of NH(i-1)
i i-1
O
C
H
i
w H(i)
w NH(i)
w C‘(i-1)
w NH(i)
w H(i)
w C‘(i-1)
N H
C
C
O
N
C
H
R2
H
R1
HN(CA)CO signal for C‘ of NH(i) and NH(i-1)
i i-1
O
C
H
i
w H(i)
w NH(i)
w C‘(i-1)
w C‘(i)
w NH(i)
w H(i)
w C‘(i-1)
w C‘(1)
7
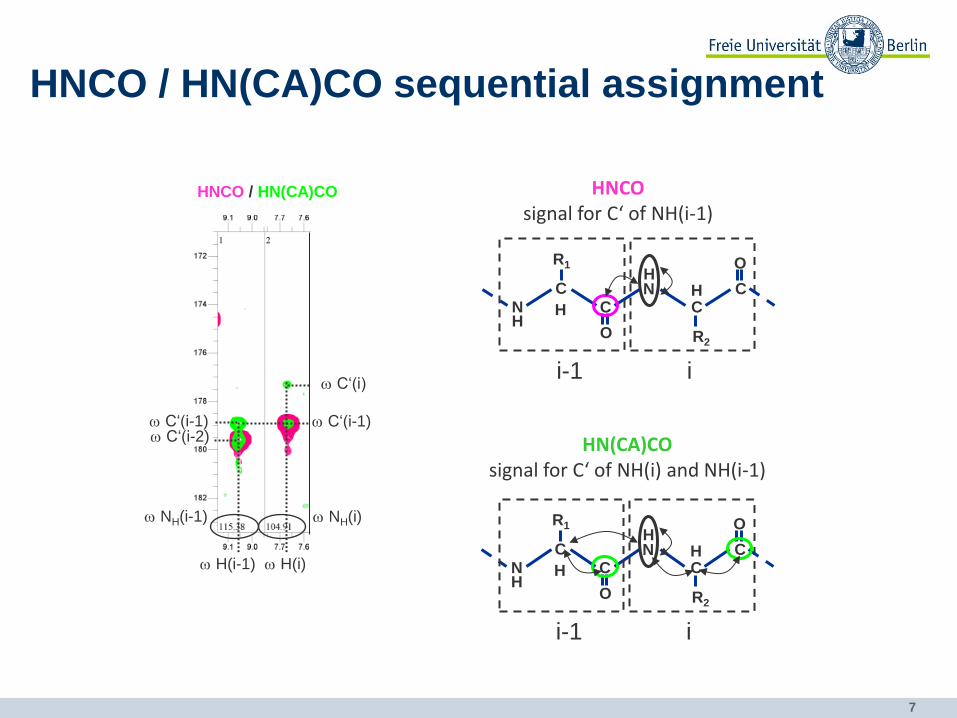
HNCO / HN(CA)CO sequential assignment
w NH(i)
w H(i)
w C‘(i-1)
w C‘(i)
w NH(i-1)
w C‘(i-1) w C‘(i-2)
HNCO / HN(CA)CO
w H(i-1)
N H
C
C
O
N
C
H
R2
H
R1
HNCO signal for C‘ of NH(i-1)
i i-1
O
C
H
N H
C
C
O
N C
H
R2
H
R1
HN(CA)CO signal for C‘ of NH(i) and NH(i-1)
i i-1
O
C
H
8
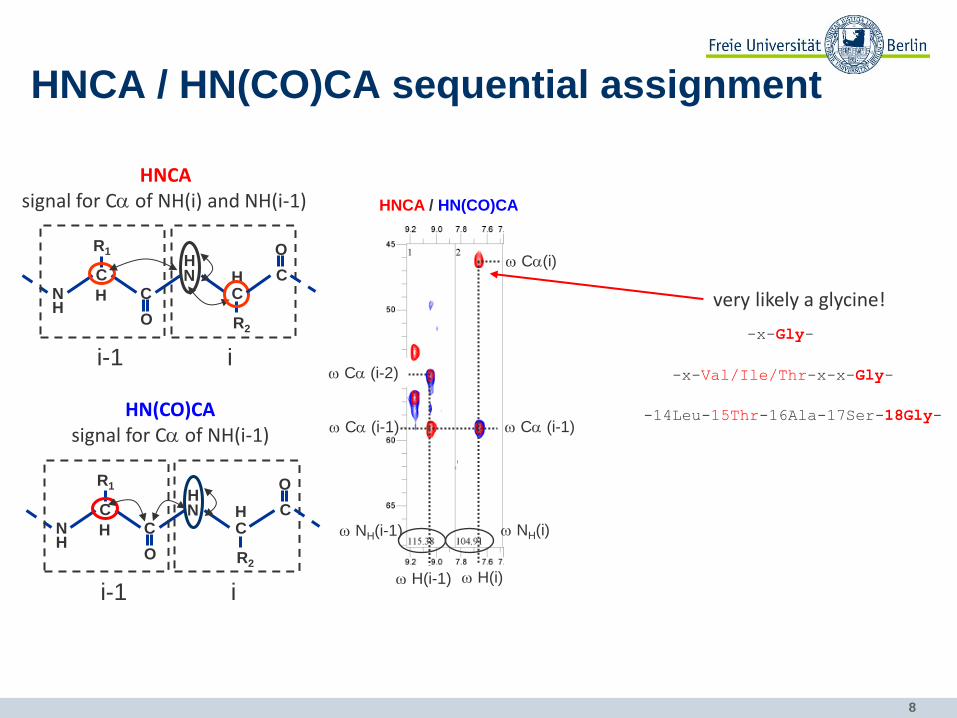
HNCA / HN(CO)CA sequential assignment
N H
C
C
O
N C
H
R2
H
R1
HNCA signal for Ca of NH(i) and NH(i-1)
i i-1
O
C
H
HN(CO)CA signal for Ca of NH(i-1)
N H
C
C
O
N C
H
R2
H
R1
i i-1
O
C
H w NH(i)
w H(i)
w Ca (i-1)
w Ca(i)
HNCA / HN(CO)CA
w H(i-1)
w Ca (i-1)
w Ca (i-2)
w NH(i-1)
very likely a glycine!
-x-Gly-
-x-Val/Ile/Thr-x-x-Gly-
-14Leu-15Thr-16Ala-17Ser-18Gly-
9
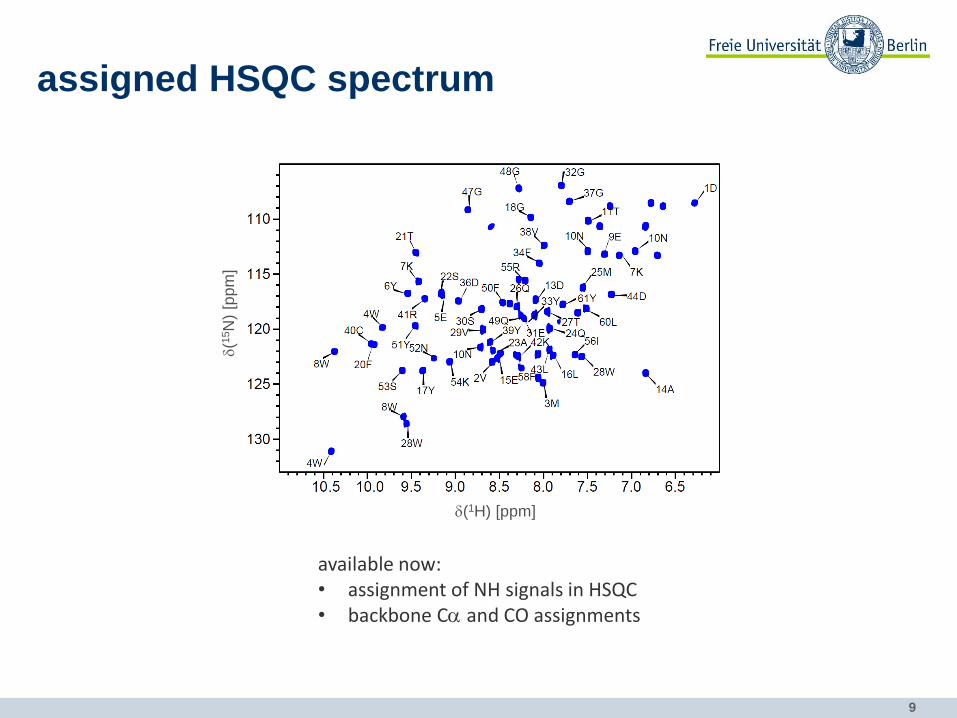
assigned HSQC spectrum
available now: • assignment of NH signals in HSQC • backbone Ca and CO assignments
d(1H) [ppm]
d(1
5N
) [p
pm
]
10
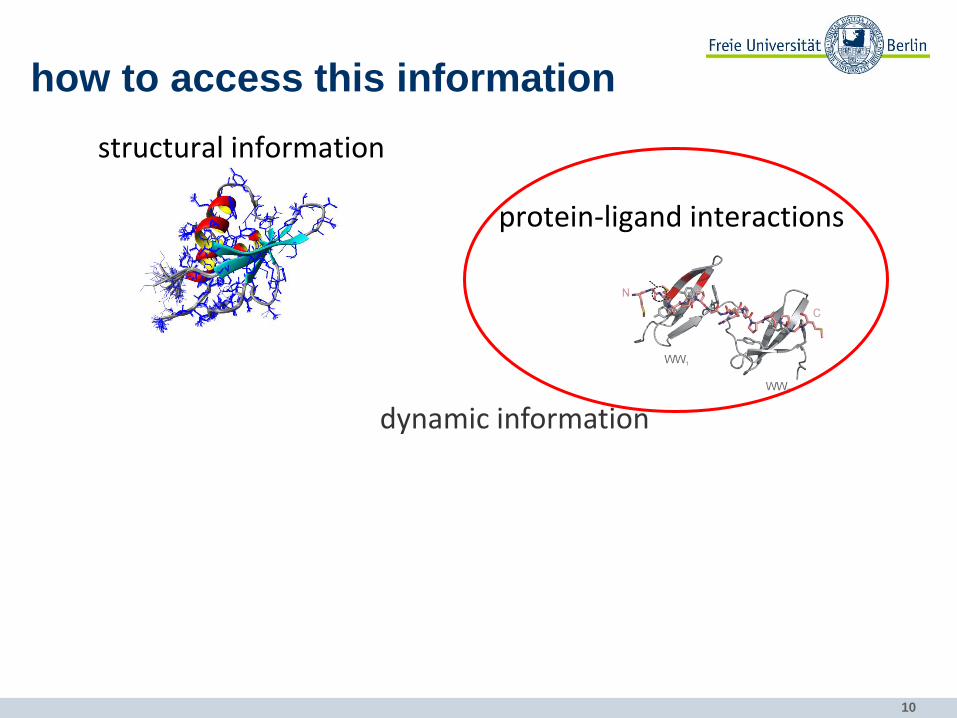
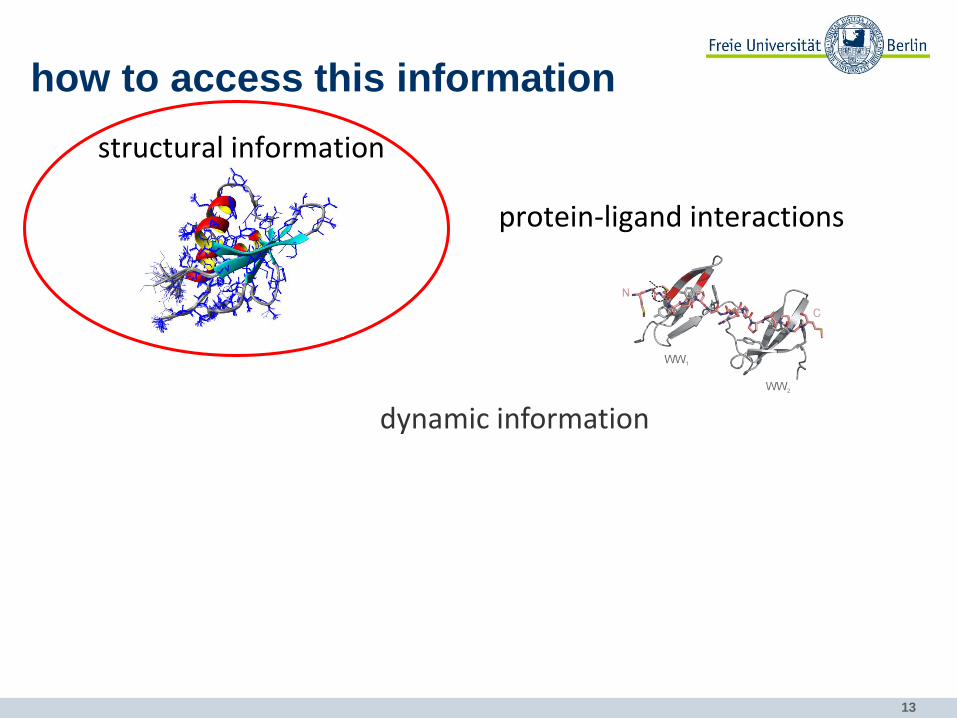
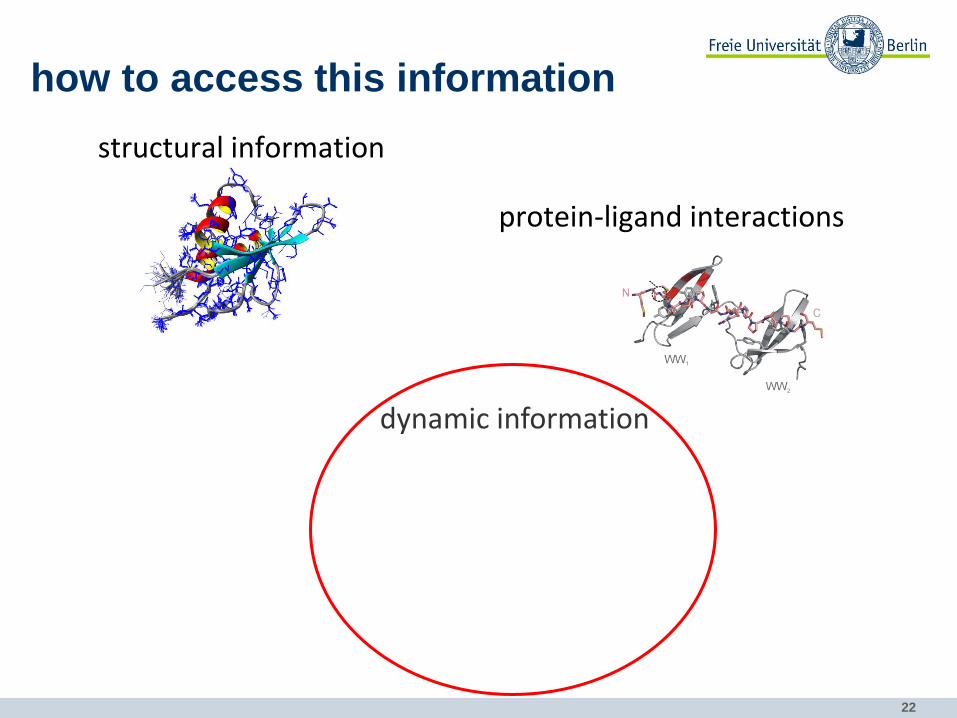
how to access this information
• dynamic information
protein-ligand interactions
structural information
11
d1H [ppm]
d15N
[p
pm
]
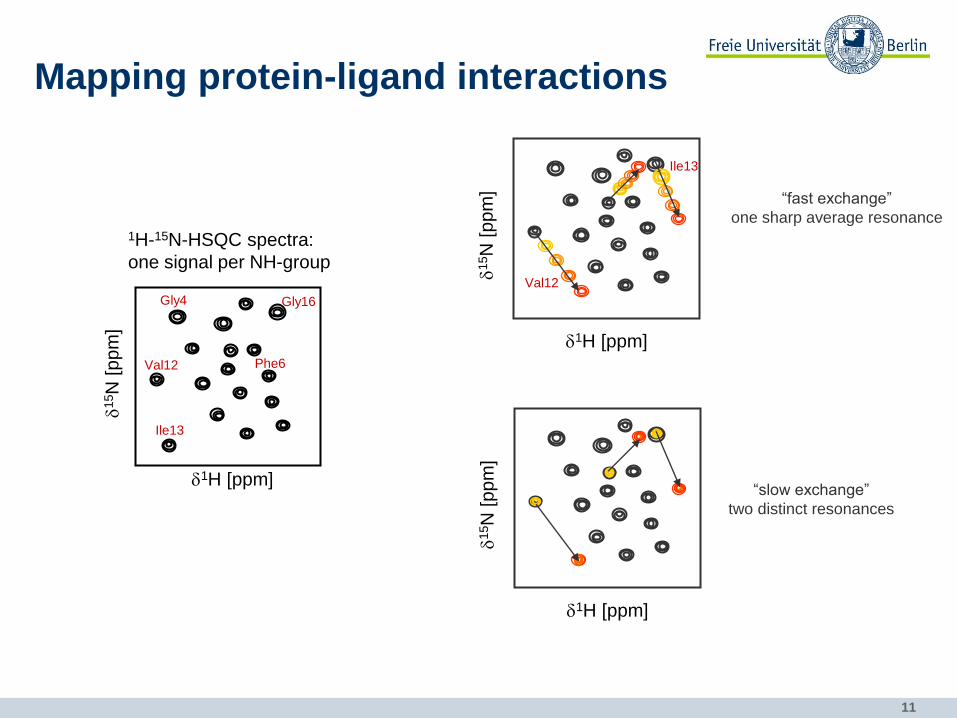
1H-15N-HSQC spectra:
one signal per NH-group
Gly16
Val12
Ile13
Gly4
Phe6
Mapping protein-ligand interactions
Val12
Ile13
d1H [ppm]
d15N
[p
pm
]
“fast exchange”
one sharp average resonance
d1H [ppm]
d15N
[p
pm
] “slow exchange”
two distinct resonances
12
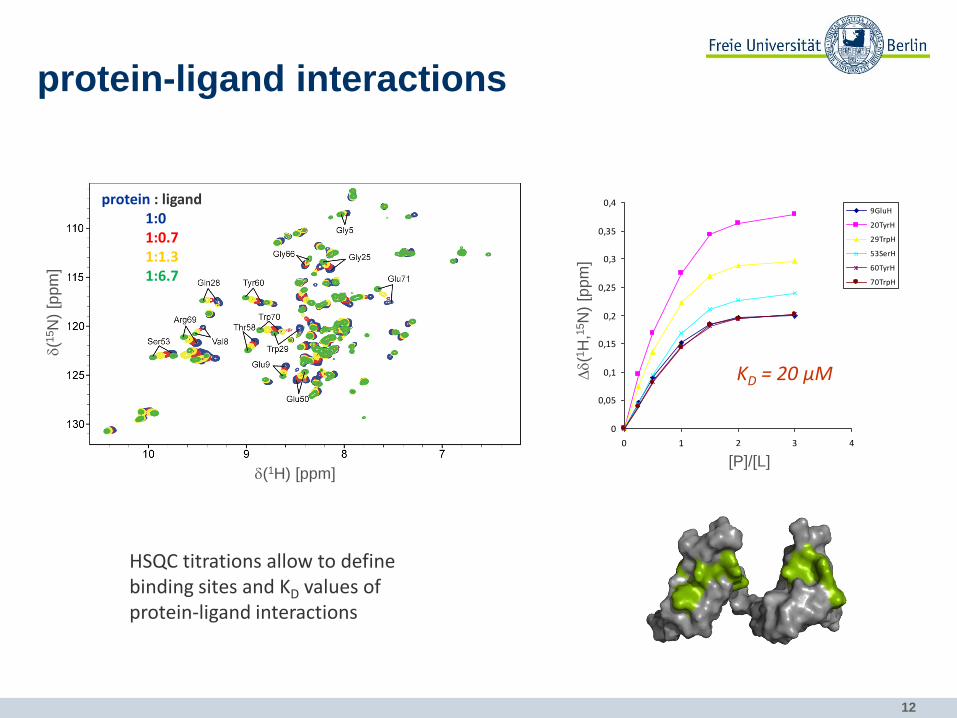
protein-ligand interactions
HSQC titrations allow to define binding sites and KD values of protein-ligand interactions
0
0,05
0,1
0,15
0,2
0,25
0,3
0,35
0,4
0 1 2 3 4
ratio: [P]/[L]
com
bin
ed c
hem
ical
sh
ift
9GluH
20TyrH
29TrpH
53SerH
60TyrH
70TrpH
KD = 20 µM Dd(1
H,1
5N
) [p
pm
]
[P]/[L] d(1H) [ppm]
d(1
5N
) [p
pm
]
protein : ligand 1:0 1:0.7 1:1.3 1:6.7
13
how to access this information
• dynamic information
solution NMR
protein-ligand interactions
structural information
14
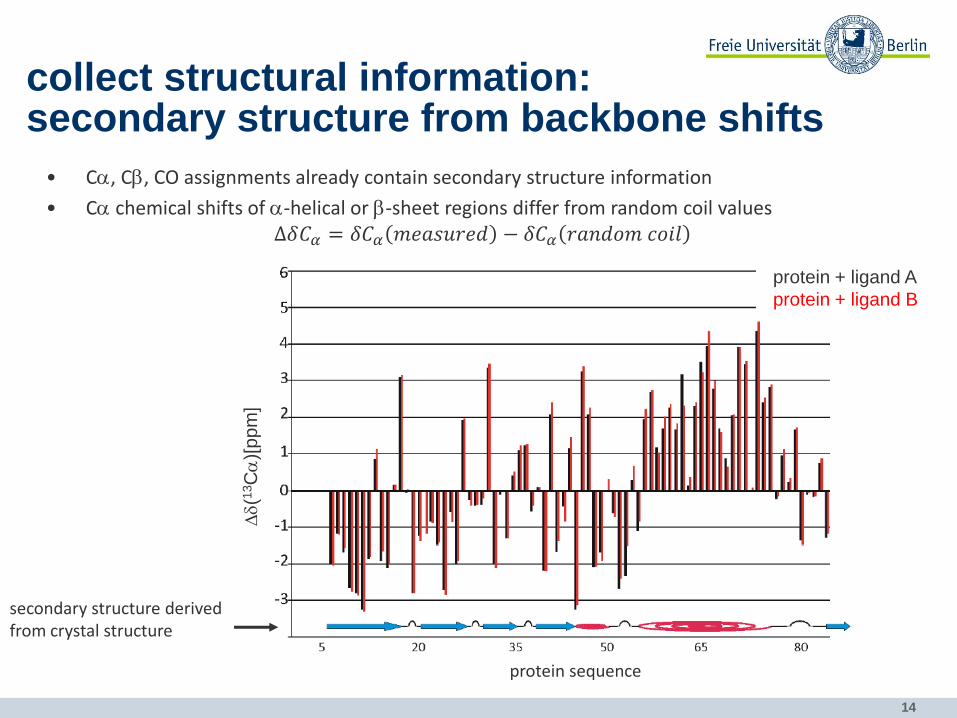
collect structural information: secondary structure from backbone shifts
• Ca, Cb, CO assignments already contain secondary structure information
• Ca chemical shifts of a-helical or b-sheet regions differ from random coil values ∆𝛿𝐶𝛼 = 𝛿𝐶𝛼 𝑚𝑒𝑎𝑠𝑢𝑟𝑒𝑑 − 𝛿𝐶𝛼 𝑟𝑎𝑛𝑑𝑜𝑚 𝑐𝑜𝑖𝑙
Dd(1
3C
a)[
pp
m]
protein sequence
protein + ligand A
protein + ligand B
secondary structure derived from crystal structure
15
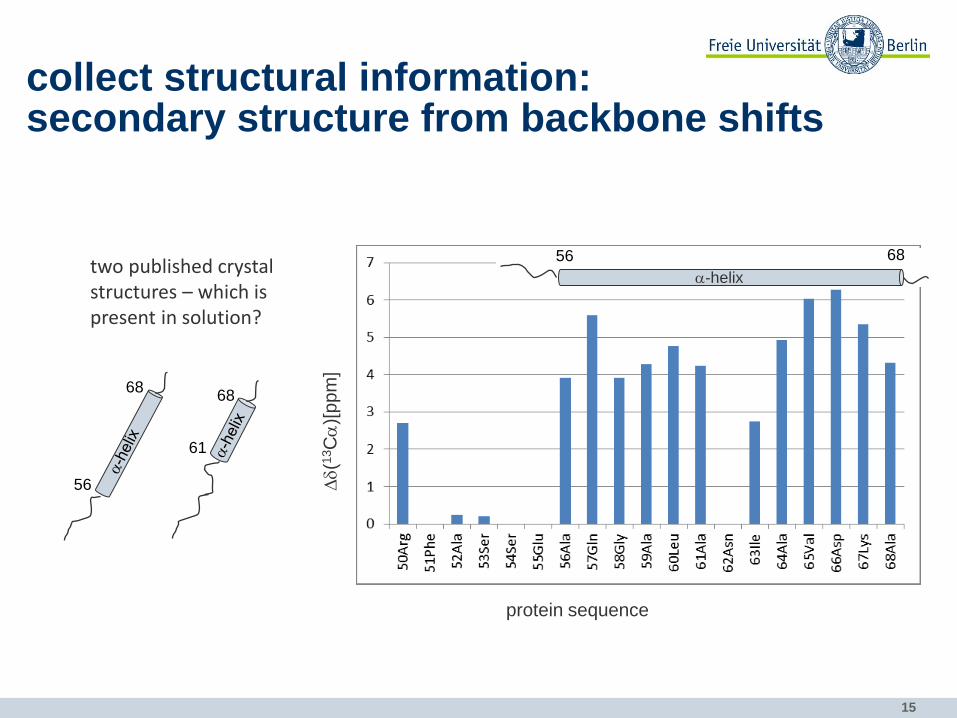
two published crystal structures – which is present in solution?
61
68
56
68
collect structural information: secondary structure from backbone shifts
Dd(1
3C
a)[
pp
m]
protein sequence
a-helix
56 68
16
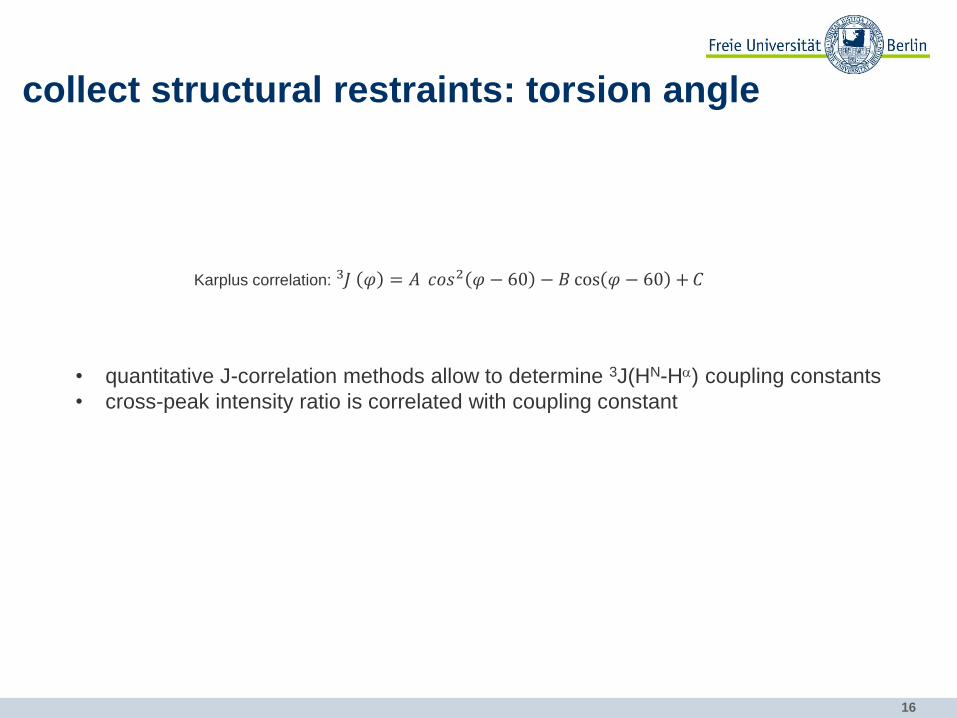
collect structural restraints: torsion angle
• quantitative J-correlation methods allow to determine 3J(HN-Ha) coupling constants
• cross-peak intensity ratio is correlated with coupling constant
Karplus correlation: 𝐽 𝜑 = 𝐴 𝑐𝑜𝑠2 𝜑 − 60 − 𝐵 cos 𝜑 − 60 +3 𝐶
17
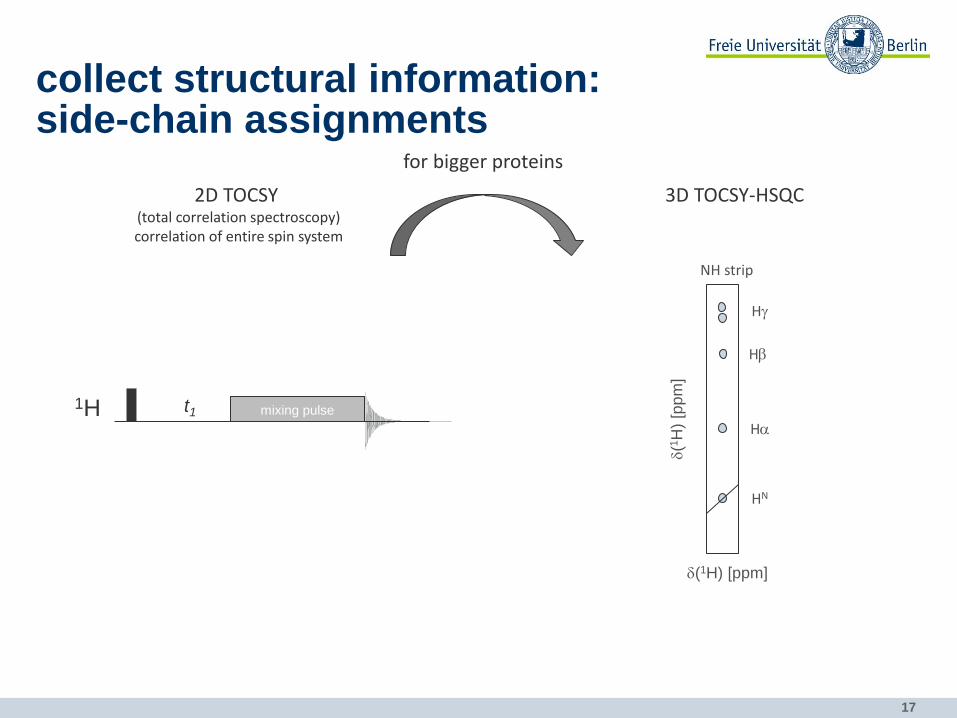
collect structural information: side-chain assignments
2D TOCSY (total correlation spectroscopy) correlation of entire spin system
3D TOCSY-HSQC
for bigger proteins
d(1H) [ppm]
d(1
H)
[pp
m]
HN
Ha
NH strip
Hb
Hg
t1 mixing pulse 1H
18
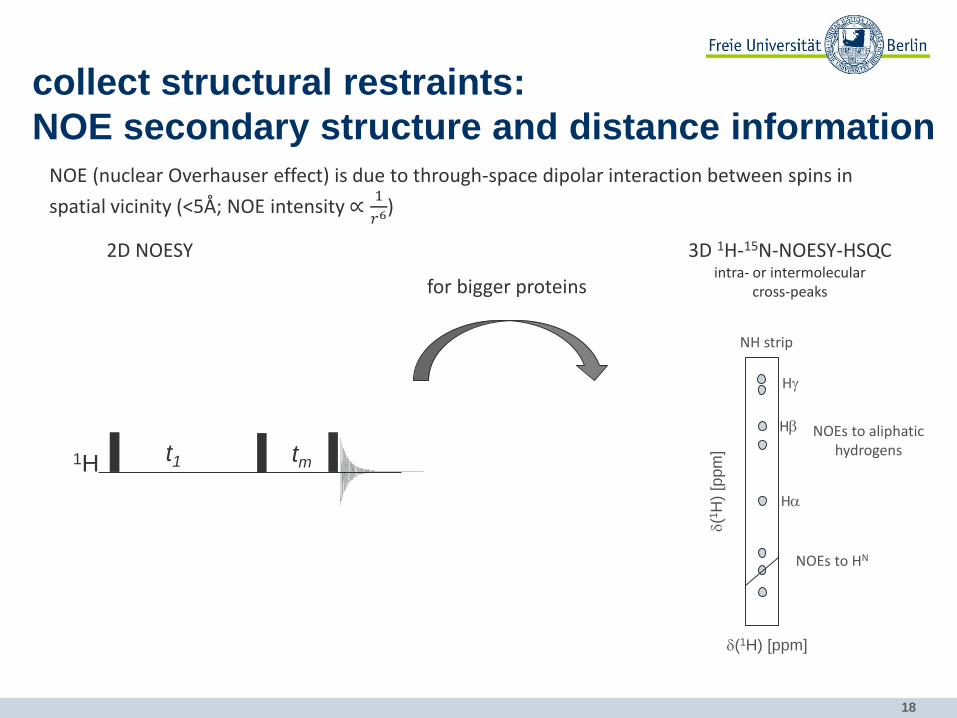
collect structural restraints:
NOE secondary structure and distance information NOE (nuclear Overhauser effect) is due to through-space dipolar interaction between spins in
spatial vicinity (<5Å; NOE intensity ∝1
𝑟6)
2D NOESY
t1 tm 1H
for bigger proteins
3D 1H-15N-NOESY-HSQC intra- or intermolecular
cross-peaks
d(1H) [ppm]
d(1
H)
[pp
m]
NOEs to HN
NOEs to aliphatic hydrogens
NH strip
Ha
Hb
Hg
19
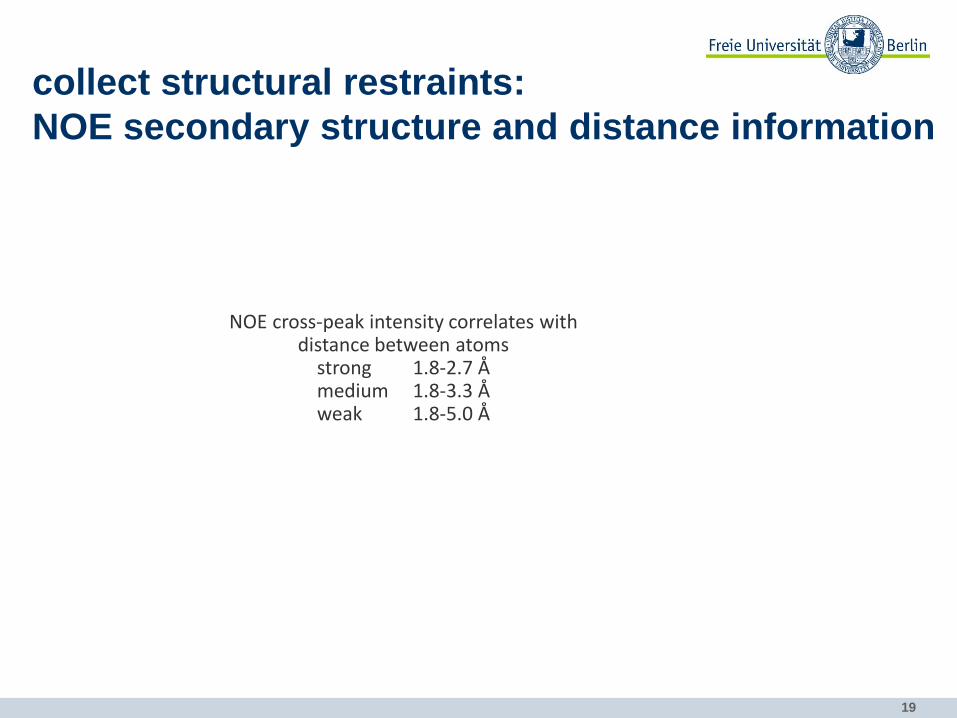
NOE cross-peak intensity correlates with distance between atoms
strong 1.8-2.7 Å medium 1.8-3.3 Å weak 1.8-5.0 Å
collect structural restraints:
NOE secondary structure and distance information
20
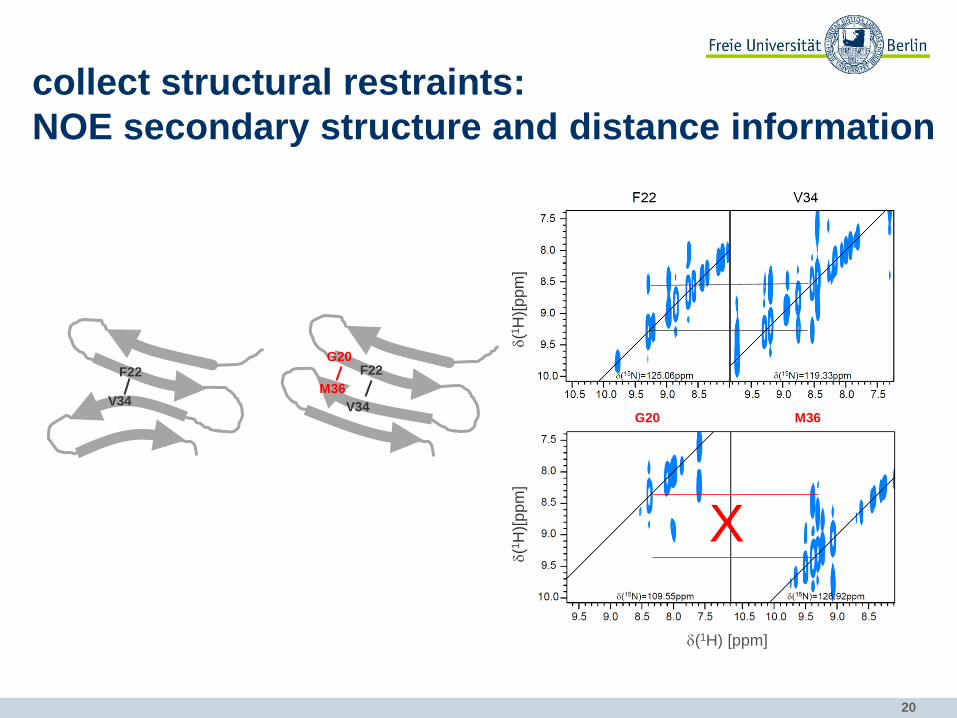
F22
V34 M36
G20 F22
V34
d(1
H)[
pp
m]
d(1
H)[
pp
m]
d(1H) [ppm]
X
G20 M36
collect structural restraints:
NOE secondary structure and distance information
21
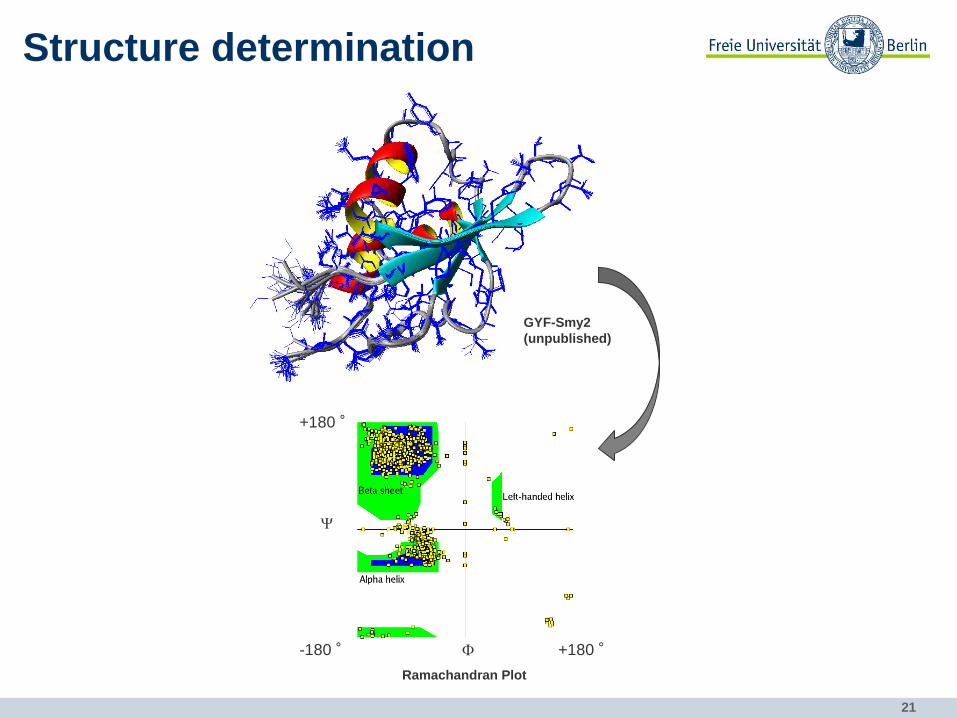
Structure determination
GYF-Smy2
(unpublished)
F
Y
+180 ° -180 °
+180 °
Ramachandran Plot
22
how to access this information
• dynamic information
solution NMR
protein-ligand interactions
structural information
23
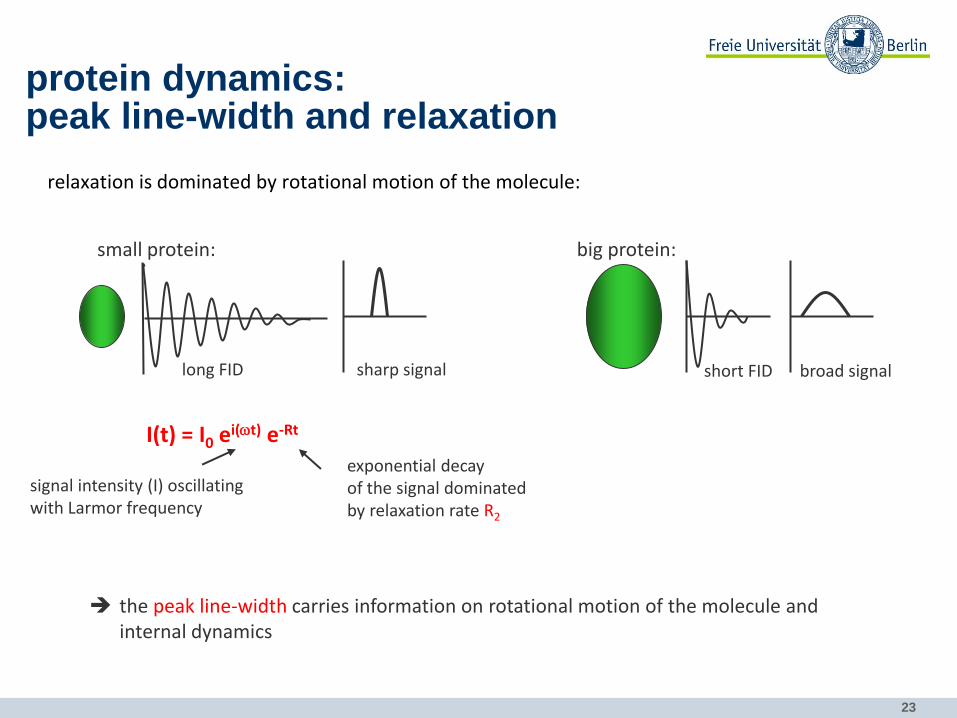
protein dynamics: peak line-width and relaxation
relaxation is dominated by rotational motion of the molecule:
small protein:
long FID sharp signal
big protein:
short FID broad signal
the peak line-width carries information on rotational motion of the molecule and internal dynamics
I(t) = I0 ei(wt) e-Rt
signal intensity (I) oscillating with Larmor frequency
exponential decay of the signal dominated by relaxation rate R2
24
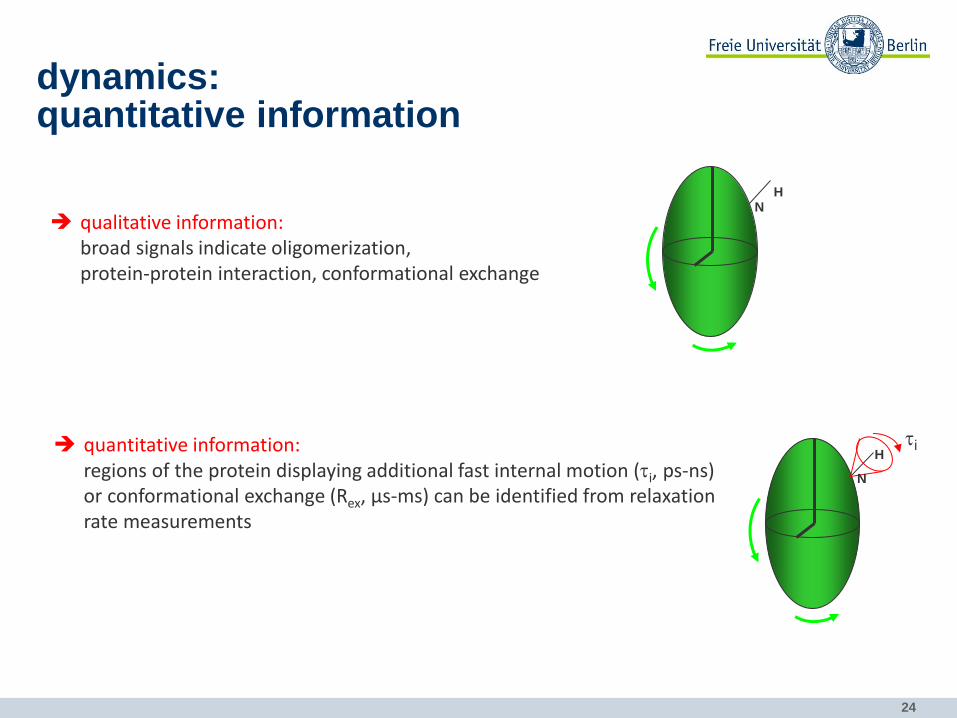
dynamics: quantitative information
qualitative information: broad signals indicate oligomerization, protein-protein interaction, conformational exchange
N H
quantitative information: regions of the protein displaying additional fast internal motion (ti, ps-ns) or conformational exchange (Rex, µs-ms) can be identified from relaxation rate measurements
ti
N
H
25
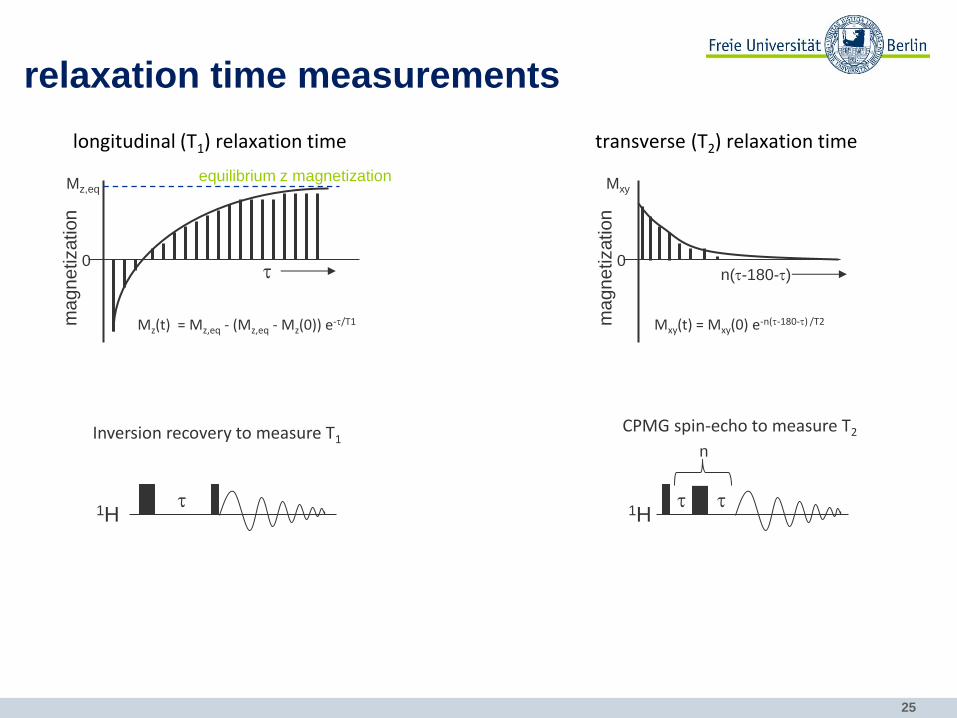
relaxation time measurements
t
ma
gn
etization
0
equilibrium z magnetization Mz,eq
Mz(t) = Mz,eq - (Mz,eq - Mz(0)) e-t/T1
Inversion recovery to measure T1
1H t
Mxy(t) = Mxy(0) e-n(t-180-t) /T2
CPMG spin-echo to measure T2
1H t t
n
n(t-180-t)
ma
gn
etization
0
Mxy
longitudinal (T1) relaxation time transverse (T2) relaxation time
26
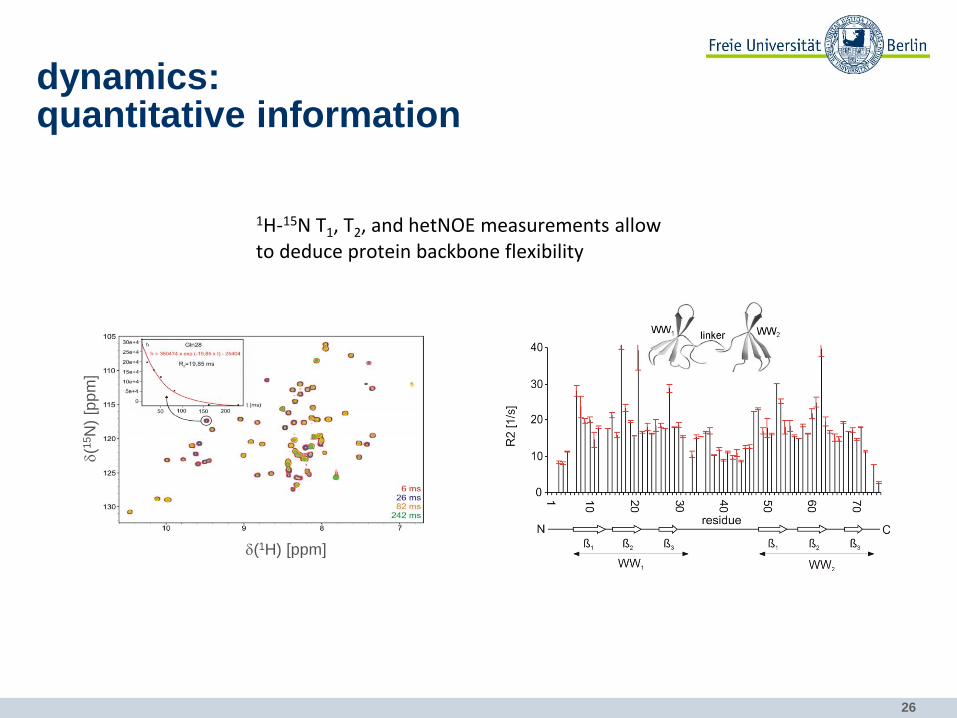
dynamics: quantitative information
d(1H) [ppm]
d(1
5N
) [p
pm
]
1H-15N T1, T2, and hetNOE measurements allow to deduce protein backbone flexibility
27
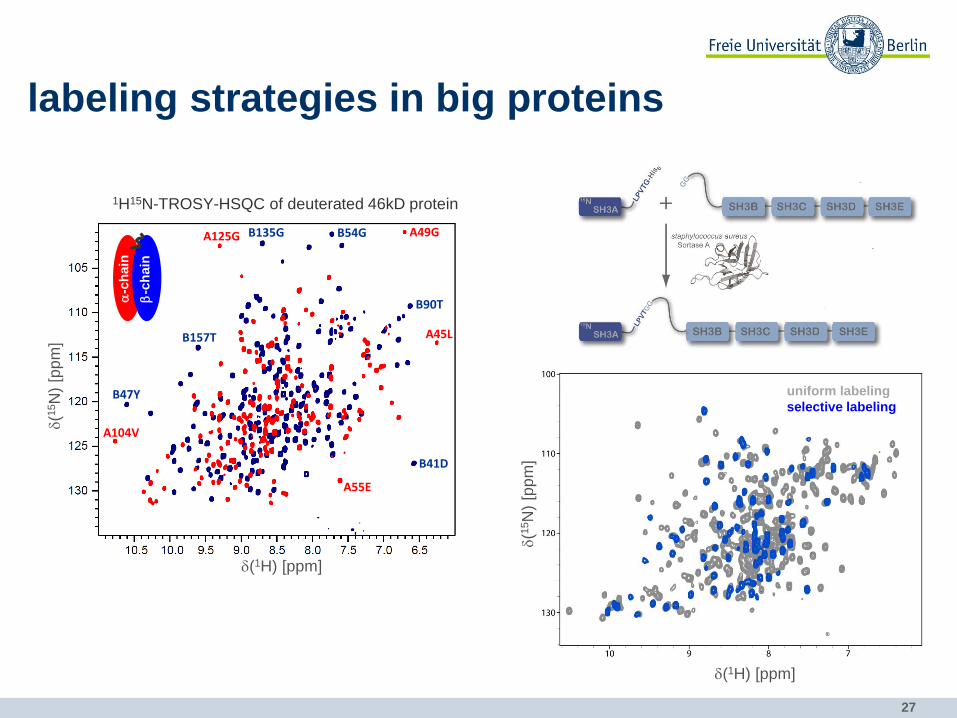
labeling strategies in big proteins
d(1H) [ppm]
d(1
5N
) [p
pm
]
uniform labeling
selective labeling
problems: • too many signals • broad lines due to fast relaxation
A125G B135G B54G A49G
B47Y
A104V
B90T
A45L
B41D
A55E
B157T
b-c
hain
a-c
hain
1H15N-TROSY-HSQC of deuterated 46kD protein
d(1H) [ppm]
d(1
5N
) [p
pm
]
28
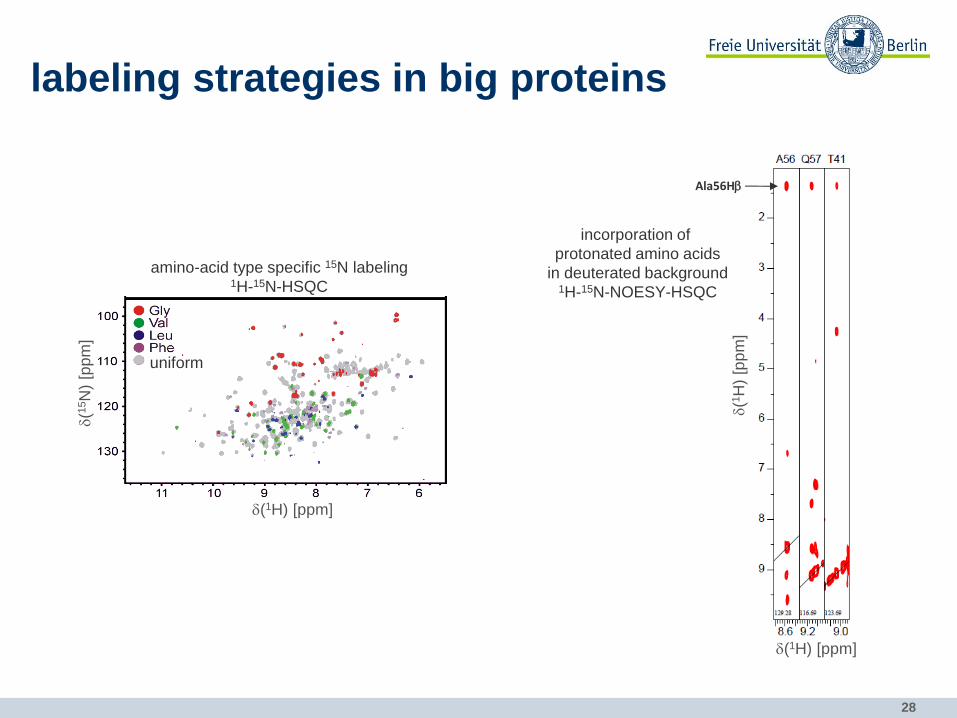
labeling strategies in big proteins d(1
5N
) [p
pm
]
uniform
amino-acid type specific 15N labeling 1H-15N-HSQC
d(1H) [ppm]
incorporation of
protonated amino acids
in deuterated background 1H-15N-NOESY-HSQC
Ala56Hb
d(1H) [ppm]
d(1
H)
[pp
m]
29
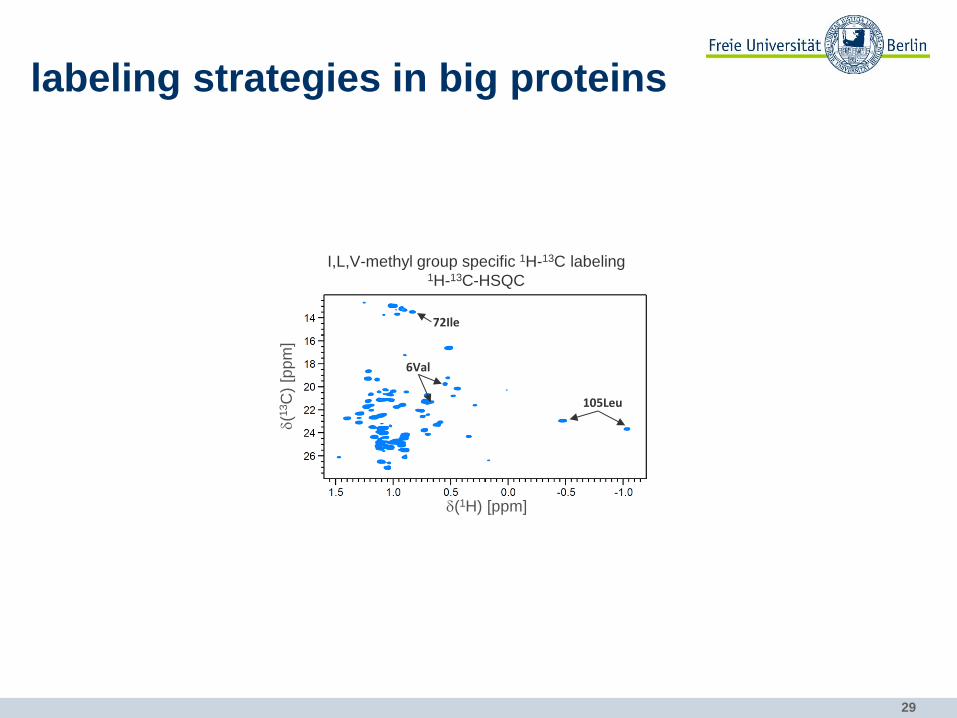
labeling strategies in big proteins
d(1H) [ppm]
d(1
3C
) [p
pm
]
I,L,V-methyl group specific 1H-13C labeling 1H-13C-HSQC
105Leu
72Ile
6Val
30
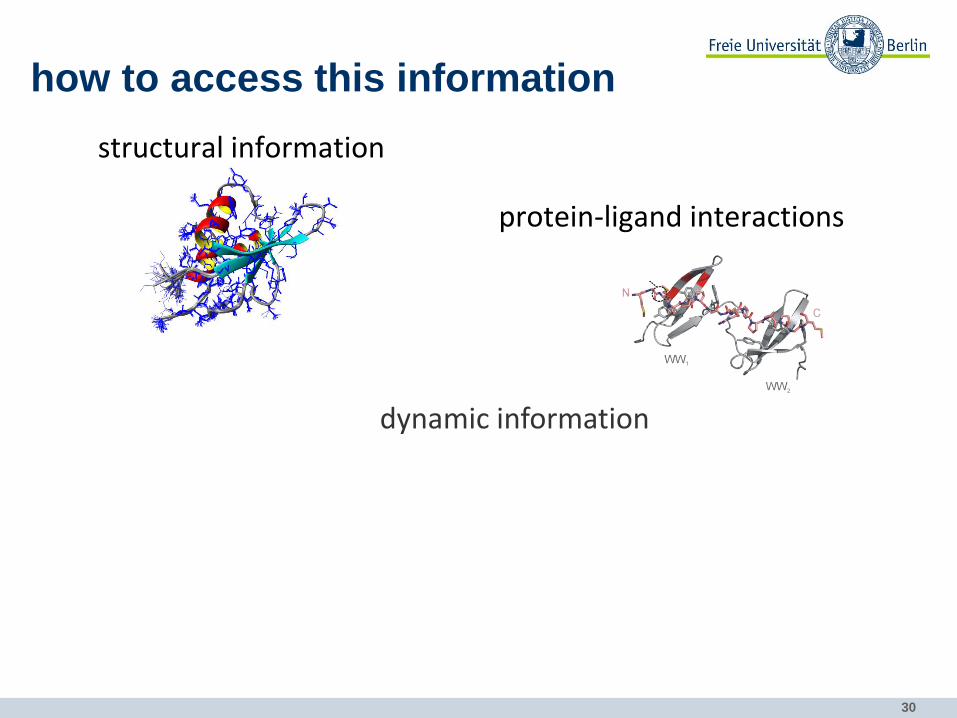
how to access this information
• dynamic information
protein-ligand interactions
structural information
31
Acknowledgements
Marek Wieczorek
Zeina El Habre
Fabian Gerth
Stefan Klippel
Dr. Andreas Schlundt
Prof. Christian Freund
AG Proteinbiochemie, FU Berlin
Dr. Andreas Schäfer
Bettina Zeisig
NMR facility, FU Berlin
Dr. Peter Schmieder
Monika Beerbaum
NMR facility, FMP Berlin
Related Documents