Protein Metabolism in Human Obesity: Relationship with Glucose and Lipid Metabolism and with Visceral Adipose Tissue* ANNA SOLINI, ENZO BONORA, RICCARDO BONADONNA, PIETRO CASTELLINO, AND RALPH A. DEFRONZO Department of Internal Medicine, University of Ferrara (A.S.), Ferrara; the Division of Endocrinology and Metabolic Diseases, University of Verona (E.B., R.B.), Verona; and the Department of Internal Medicine, University of Catania (P.C.), Catania, Italy; and the Diabetes Division, University of Texas Health Science Center (R.A.D.), San Antonio, Texas 78226 ABSTRACT It is controversial whether metabolic disorders of human obesity include protein metabolism. Even less information is available con- cerning the effect of fat distribution on protein metabolism. Therefore, a comprehensive evaluation of glucose, lipid, and protein metabolism was performed in 11 obese nondiabetic and 9 normal women whose body composition and regional fat distribution were determined. [1- 14 C]Leucine and [3- 3 H]glucose were infused in the postabsorptive state and during an euglycemic hyperinsulinemic (35– 40 mU/mL) clamp combined with indirect calorimetry for assessment of leucine flux, oxidation, and nonoxidative disposal, glucose turnover and ox- idation, and lipid oxidation. Fat-free mass (FFM) was estimated by a bolus of 3 H 2 O. Subcutaneous abdominal and visceral adipose tissues were determined by nuclear magnetic resonance imaging. During the clamp, obese women had lower glucose turnover (4.51 6 0.41 vs. 6.63 6 0.40 mg/minzkg FFM; P , 0.05), with a defect in both oxidation (3.27 6 0.22 vs. 3.89 6 0.21) and nonoxidative disposal (1.24 6 0.27 vs. 2.74 6 0.41; P , 0.005), whereas lipid oxidation was higher during the clamp (0.49 6 0.15 vs. 0.17 6 0.09 mg/minzkg FFM). There was no difference in leucine flux (basal, 2.23 6 0.17 vs. 2.30 6 0.29; clamp, 2.06 6 0.19 vs. 2.10 6 0.24 mmol/minzkg FFM), oxidation (basal, 0.37 6 0.04 vs. 0.36 6 0.05; clamp, 0.34 6 0.04 vs. 0.39 6 0.06) and nonoxidative leucine disposal (basal, 1.86 6 0.17 vs. 1.94 6 0.26; clamp, 1.72 6 0.20 vs. 1.71 6 0.19) in the two groups. In obese women, basal leucine oxidation was directly related with glucose oxidation and inversely to lipid oxidation (both P , 0.05), whereas visceral adipose tissue was inversely related to leucine flux both in the basal state and during the clamp (P , 0.05). In conclusion, in human obesity, 1) rates of protein metabolism in the basal state and in the range of insulin concentrations encountered after a meal are normal; 2) protein oxidation is positively related to glucose oxidation and negatively related to lipid oxidation; and 3) visceral adipose tissue is inversely related to all parameters of protein metabolism. (J Clin Endocrinol Metab 82: 2552–2558, 1997) I T IS WELL established that human obesity is accompanied by abnormalities in both glucose and lipid metabolism (1–5). However, it is controversial whether protein metabo- lism also is disturbed in overweight individuals. Indeed, some researchers have reported that obese individuals have an increased rate of basal leucine turnover (6 – 8), whereas others have found similar rates of basal leucine turnover in nonobese and obese subjects (9 –12). Conflicting reports also have appeared about the effect of insulin on protein anab- olism. Some studies have indicated that the insulin resistance of obesity extends to protein metabolism (6, 13), whereas others reports have challenged this conclusion (8, 12). In recent years the important role of central, especially visceral, adipose tissue in the disturbance of glucose and lipid metabolism has been emphasized by several research- ers, including ourselves (3, 5, 14, 15). In contrast, few studies have examined the relationships between body fat distribu- tion and protein metabolism, and their results are conflicting (6 – 8). The aim of the present study was to understand whether the insulin resistance of obesity extends to protein metabo- lism and, if so, whether this disturbance is related to abnor- malities in glucose or lipid metabolism. In addition, we tried to clarify the putative relationship between protein metab- olism and the amount of visceral fat. Subjects and Methods Subjects Twenty nondiabetic paid volunteers were selected for this study after being recruited through newspaper advertising. The purpose was to find 2 groups of 10 –12 premenopausal women with a body mass index (BMI) of 27 or less, which was used as a cut-off for obesity according to conventional criteria (16). Eleven obese women (mean age, 36 6 2 yr; mean BMI, 29 6 2 kg/m 2 ) were compared to nine lean women (mean age, 37 6 2 yr; mean BMI, 22 6 1 kg/m 2 ). None had any evidence of renal, hepatic, cardiovascular, or other major organ system disease by routine history, physical examination, and laboratory screening test. There was no family history of diabetes, and no subject was taking any medication, including oral contraceptives. Menstrual cycles were nor- mal, and there was no clinical evidence suggestive of polycystic ovary syndrome. No subjects were participating in any strenuous exercise or were excessive sedentary. The purpose, nature, and potential risks of the study were explained Received January 22, 1997. Revision received April 7, 1997. Accepted May 13, 1997. Address all correspondence and requests for reprints to: Anna Solini, M.D., Department of Internal Medicine II, University of Ferrara, Via Savonarola 9, I-44100 Ferrara, Italy; or to: Ralph A. DeFronzo, M.D., Diabetes Division, Department of Internal Medicine, University of Texas Health Science Center, 7703 Floyd Curl Drive, San Antonio, Texas 78226. *This work was supported by grants from the Italian National Re- search Council (to A.S. and E.B.); NIH Grant AM-24092; Clinical Re- search Center Grant MOI-RR-01346 the General Research, Education, and Clinical Center; and the V.A. Medical Research Center. 0021-972X/97/$03.00/0 Vol. 82, No. 8 Journal of Clinical Endocrinology and Metabolism Printed in U.S.A. Copyright © 1997 by The Endocrine Society 2552

Welcome message from author
This document is posted to help you gain knowledge. Please leave a comment to let me know what you think about it! Share it to your friends and learn new things together.
Transcript

Protein Metabolism in Human Obesity: Relationshipwith Glucose and Lipid Metabolism and with VisceralAdipose Tissue*
ANNA SOLINI, ENZO BONORA, RICCARDO BONADONNA, PIETRO CASTELLINO,AND RALPH A. DEFRONZO
Department of Internal Medicine, University of Ferrara (A.S.), Ferrara; the Division of Endocrinologyand Metabolic Diseases, University of Verona (E.B., R.B.), Verona; and the Department of InternalMedicine, University of Catania (P.C.), Catania, Italy; and the Diabetes Division, University of TexasHealth Science Center (R.A.D.), San Antonio, Texas 78226
ABSTRACTIt is controversial whether metabolic disorders of human obesity
include protein metabolism. Even less information is available con-cerning the effect of fat distribution on protein metabolism. Therefore,a comprehensive evaluation of glucose, lipid, and protein metabolismwas performed in 11 obese nondiabetic and 9 normal women whosebody composition and regional fat distribution were determined.[1-14C]Leucine and [3-3H]glucose were infused in the postabsorptivestate and during an euglycemic hyperinsulinemic (35–40 mU/mL)clamp combined with indirect calorimetry for assessment of leucineflux, oxidation, and nonoxidative disposal, glucose turnover and ox-idation, and lipid oxidation. Fat-free mass (FFM) was estimated by abolus of 3H2O. Subcutaneous abdominal and visceral adipose tissueswere determined by nuclear magnetic resonance imaging. During theclamp, obese women had lower glucose turnover (4.51 6 0.41 vs.6.63 6 0.40 mg/minzkg FFM; P , 0.05), with a defect in both oxidation(3.27 6 0.22 vs. 3.89 6 0.21) and nonoxidative disposal (1.24 6 0.27
vs. 2.74 6 0.41; P , 0.005), whereas lipid oxidation was higher duringthe clamp (0.49 6 0.15 vs. 0.17 6 0.09 mg/minzkg FFM). There wasno difference in leucine flux (basal, 2.23 6 0.17 vs. 2.30 6 0.29; clamp,2.06 6 0.19 vs. 2.10 6 0.24 mmol/minzkg FFM), oxidation (basal,0.37 6 0.04 vs. 0.36 6 0.05; clamp, 0.34 6 0.04 vs. 0.39 6 0.06) andnonoxidative leucine disposal (basal, 1.86 6 0.17 vs. 1.94 6 0.26;clamp, 1.72 6 0.20 vs. 1.71 6 0.19) in the two groups. In obese women,basal leucine oxidation was directly related with glucose oxidationand inversely to lipid oxidation (both P , 0.05), whereas visceraladipose tissue was inversely related to leucine flux both in the basalstate and during the clamp (P , 0.05). In conclusion, in humanobesity, 1) rates of protein metabolism in the basal state and in therange of insulin concentrations encountered after a meal are normal;2) protein oxidation is positively related to glucose oxidation andnegatively related to lipid oxidation; and 3) visceral adipose tissue isinversely related to all parameters of protein metabolism. (J ClinEndocrinol Metab 82: 2552–2558, 1997)
IT IS WELL established that human obesity is accompaniedby abnormalities in both glucose and lipid metabolism
(1–5). However, it is controversial whether protein metabo-lism also is disturbed in overweight individuals. Indeed,some researchers have reported that obese individuals havean increased rate of basal leucine turnover (6–8), whereasothers have found similar rates of basal leucine turnover innonobese and obese subjects (9–12). Conflicting reports alsohave appeared about the effect of insulin on protein anab-olism. Some studies have indicated that the insulin resistanceof obesity extends to protein metabolism (6, 13), whereasothers reports have challenged this conclusion (8, 12).
In recent years the important role of central, especiallyvisceral, adipose tissue in the disturbance of glucose andlipid metabolism has been emphasized by several research-
ers, including ourselves (3, 5, 14, 15). In contrast, few studieshave examined the relationships between body fat distribu-tion and protein metabolism, and their results are conflicting(6–8).
The aim of the present study was to understand whetherthe insulin resistance of obesity extends to protein metabo-lism and, if so, whether this disturbance is related to abnor-malities in glucose or lipid metabolism. In addition, we triedto clarify the putative relationship between protein metab-olism and the amount of visceral fat.
Subjects and MethodsSubjects
Twenty nondiabetic paid volunteers were selected for this study afterbeing recruited through newspaper advertising. The purpose was to find2 groups of 10–12 premenopausal women with a body mass index (BMI)of 27 or less, which was used as a cut-off for obesity according toconventional criteria (16). Eleven obese women (mean age, 36 6 2 yr;mean BMI, 29 6 2 kg/m2) were compared to nine lean women (meanage, 37 6 2 yr; mean BMI, 22 6 1 kg/m2). None had any evidence ofrenal, hepatic, cardiovascular, or other major organ system disease byroutine history, physical examination, and laboratory screening test.There was no family history of diabetes, and no subject was taking anymedication, including oral contraceptives. Menstrual cycles were nor-mal, and there was no clinical evidence suggestive of polycystic ovarysyndrome. No subjects were participating in any strenuous exercise orwere excessive sedentary.
The purpose, nature, and potential risks of the study were explained
Received January 22, 1997. Revision received April 7, 1997. AcceptedMay 13, 1997.
Address all correspondence and requests for reprints to: Anna Solini,M.D., Department of Internal Medicine II, University of Ferrara, ViaSavonarola 9, I-44100 Ferrara, Italy; or to: Ralph A. DeFronzo, M.D.,Diabetes Division, Department of Internal Medicine, University of TexasHealth Science Center, 7703 Floyd Curl Drive, San Antonio, Texas 78226.
*This work was supported by grants from the Italian National Re-search Council (to A.S. and E.B.); NIH Grant AM-24092; Clinical Re-search Center Grant MOI-RR-01346 the General Research, Education,and Clinical Center; and the V.A. Medical Research Center.
0021-972X/97/$03.00/0 Vol. 82, No. 8Journal of Clinical Endocrinology and Metabolism Printed in U.S.A.Copyright © 1997 by The Endocrine Society
2552

to all subjects, and written informed consent was obtained before theirparticipation. The experimental protocol was approved by the institu-tional review board of the University of Texas Health Science Center, theGeneral Clinical Research Center, and the research and developmentcommittees of the V.A. Hospital, and the radiation safety and radioactivedrug and research committees of the University of Texas Health ScienceCenter and V.A. Hospital, respectively.
Metabolic studies
Each subject participated in three different studies that were carriedout in random order at the Clinical Research Center of the University ofTexas Health Science Center. All studies began at 0800 h after a 12-hovernight fast. The studies were separated by 1–2 weeks.
Study 1. In this study, fat mass and fat-free mass (FFM) were estimatedby a bolus injection of 80 mCi 3H2O (17, 18), as previously described (5).
Study 2. In this study the euglycemic insulin clamp technique (19) wasused in combination with high performance liquid chromatography-purified tritiated glucose infusion (20) and indirect calorimetry (21) toexamine glucose and lipid metabolism (total, oxidative, and nonoxida-tive glucose disposal, and lipid oxidation) in the basal and insulin-stimulated state. Briefly, at 0800 h, a primed-constant infusion of d-[3-3H]glucose (DuPont-New England Nuclear, Boston, MA) was startedand continued for 150 min. The tritiated glucose infusion rate was 0.15mCi/min, and the ratio of the prime to constant infusion was 100:1.During the last 50 min of tracer equilibration, samples were drawn every10 min for the determination of plasma glucose, insulin, and free fattyacid (FFA) concentrations and plasma glucose radioactivity. At the endof the 150-min tracer equilibration period (time zero), the infusion oftritiated glucose was discontinued, and a euglycemic hyperinsulinemicclamp was started. Insulin was administered as a primed-continuousinfusion (20 mU/m2zmin), and a glucose infusion was periodically ad-justed to maintain the arterialized plasma glucose concentration at thebasal level for 240 min. One hundred and twenty minutes after the startof the insulin clamp the 3-[3H]glucose infusion was resumed at the rateof 0.40 mCi/min and continued until the end of the study. Using thisapproach an excessive dilution of tracer by cold glucose was avoided,and a steady state plateau of plasma glucose specific activity wasachieved during the last hour of the study (coefficient of variation, 5.5 60.5%). Blood samples for the determination of plasma glucose specificactivity and plasma insulin and FFA concentrations were collected at180, 190, 200, 210, 220, 230, and 240 min.
Study 3. In this study, parameters of protein metabolism were deter-mined by employing the euglycemic insulin clamp in combination withradiolabeled leucine and indirect calorimetry, as previously described(22). Briefly, a primed (16- to 22-mCi bolus)-continuous (0.20 mCi/min)infusion of [1-14C]leucine (Amersham, Greenfield, IL) was administeredalong with a priming dose of [14C]bicarbonate (4 mCi). After 2 h ofisotope equilibration, blood samples were drawn at 10-min intervalsfrom 120–180 min for the determination of basal leucine and a-ketoiso-caproate (a-KIC) specific activities and plasma insulin and substrateconcentrations. After that, a prime-continuous infusion of human in-sulin was administered at the rate of 20 mU/m2zmin for an additional180 min to raise and maintain the plasma insulin concentration by 30mU/mL above baseline for 180 min. Urine was collected separatelyduring the basal and insulin periods, and the urinary nitrogen concen-tration was measured.
Indirect calorimetry. In studies 2 and 3, the carbon dioxide and oxygencontents of the expired air were continuously measured by a DeltatracMetabolic Monitor (Sensormedic, Anaheim, CA) in the last hour of thebasal periods and the insulin infusion periods. In study 3, the total 14CO2output was calculated from the product of the CO2 specific activity(disintegrations per min/mmol) and the carbon dioxide output (milli-moles per min), as measured by indirect calorimetry (21).
Analytical determinations
The plasma glucose concentration was determined by the glucoseoxidase method. For the determination of glucose specific activity, theplasma was deproteinized according to the Somogyi procedure (23). The
plasma insulin concentration was determined by RIA (24), and theplasma FFA concentration was determined by a microfluorimetricmethod (25). Urinary nitrogen concentration was measured by theKjeldhal method (26).
The plasma leucine concentration was determined using an aminoacid analyzer (System 6300, Beckman Instruments, Fullerton, CA), aspreviously described (22). Plasma a-KIC specific activity was measuredusing a modification of the method previously described by Nissen etal. (27). Plasma (1 mL) was loaded in duplicate on a Dowex 50 G cationexchange resin column (Bio-Rad Laboratories, Richmond, CA), and thefree a-ketoacid fraction was eluted with 4 mL 0.01 n HCl in 50-mLculture tubes. Methylene chloride (35 mL) was added, and after shakingvigorously for 1 min, the tube was centrifuged for 5 min at 2000 rpm toextract the free a-ketoacid fraction from plasma. After decantation of thesupernatant, the a-ketoacid was extracted in 350 mL 0.2 mol/L NaH2PO4at pH 7. After a brief centrifugation, 200 mL of the supernatant wereinjected into a high performance liquid chromatographic system. Theabsorbance of KIC was monitored at 206 nm. Radioactivity eluting withthe KIC peak was measured by scintillation counting. The intra- andinterassay variations for the determination of [14C]leucine specific ac-tivity were 4 6 2% and 5 6 2%, respectively. More than 98% of theradioactivity collected in the amino acid fraction was in the leucine peakafter separation by ion exchange chromatography. The inter- and in-traassay variations for the determination of [14C]KIC specific activitywere 5 6 2% and 5 6 4%. The recovery of [14C]KIC was 69 6 3%.
Anthropometric measurements
Weight (to the nearest 0.1 kg) and height (to the nearest 0.5 cm) weremeasured while the subjects were fasting and wearing only their un-dergarments. BMI was computed as weight divided by height squared.The following circumferences were recorded (to the nearest 0.5 cm) witha plastic tape measure while the subjects were standing: waist (widestdiameter between the xiphoid process of the sternum and the iliac crest)and hip (widest diameter over the greater trochanters). The ratio of waistto hip circumference (WHR) was then calculated and used as an indexof body fat distribution. A higher WHR was interpreted to represent apredominance of central adiposity, whereas a lower value indicated apredominance of peripheral adiposity.
Subcutaneous abdominal adipose tissue area (SAT) and visceral ab-dominal adipose tissue area (VAT) were quantitated by nuclear mag-netic resonance imaging, as previously described (28), and used asindicators of the amounts of sc and visceral abdominal fat. As reportedby Kvist et al. (29), VAT area is strongly correlated with total visceral fatvolume (r 5 .0.95).
Calculations
Glucose metabolism. A steady state plateau of plasma tritiated glucosespecific activity was achieved both during the last 50 min of the basalperiod and during the last hour of insulin clamp in each of the subjectswho participated in the study. Therefore, in both basal (250 to 0 min)and insulin-stimulated (180–240 min) states, the rate of total glucoseappearance equals the rate of total glucose disposal (milligrams per min)and was computed according to the equation: tracer infusion rate (dis-integrations per min) divided by steady state plasma tritiated glucosespecific activity (disintegrations per min/mg). As in the postabsorptivestate the only input of glucose into the body is from the liver, the basalrate of the hepatic glucose production (HGP) equals the rate of totalglucose appearance. During the insulin/glucose infusion, HGP wascomputed as the difference between the isotopically determined rate ofglucose appearance and exogenous glucose infusion rate (20).
Protein metabolism. Whole body leucine flux was calculated with a sto-chastic model for protein metabolism. The analysis assumes near-steadystate conditions. The validity and assumptions of the model have beenpreviously discussed in detail by Waterlow et al. (30) and Golden andWaterlow (31). Briefly, the model generates the following equations inwhich total leucine turnover or flux, Q 5 S 1 C 5 B 1 I, where S is thetotal rate of leucine incorporation into protein (or nonoxidative leucinedisposal), C is the rate of leucine oxidation (LeuOx), B is the rate ofleucine release from protein (endogenous leucine appearance), and I isthe rate of exogenous leucine input. To calculate rates of leucine turnover
PROTEIN METABOLISM IN OBESITY 2553
and oxidation, we employed the plasma a-KIC (the transaminated prod-uct of leucine) specific activity, because it has been suggested that it mayprovide a better estimation of the specific activity in the intracellularmixing pool (32). The rate of leucine turnover (Q) is calculated as follows:Q 5 F/KIC sp act, where F is the infusion rate of [14C]leucine, and KICsp act is the specific radioactivity of a-KIC in the plasma compartmentunder steady state conditions. The LeuOx rate is calculated as follows:C 5 O/(K 3 KIC sp act), where O is the rate of appearance of 14CO2 inthe expired air (disintegrations per min), and K is a correction factor(0.81) that takes into account the incomplete recovery of labeled 14CO2from the bicarbonate pool. An estimate of the rate of leucine incorpo-ration into protein (S) can be calculated as follows: S 5 Q 2 C. Anestimate of the rate of leucine release into the plasma space from en-dogenous protein (B) can be calculated as follows: B 5 Q 2 I. Whensubjects are in the postabsorptive state, leucine intake (I) 5 0, and B 5Q. The net leucine balance, which represents the net flux of leucine intoand out of proteins, was calculated as the nonoxidative leucine disposalminus the endogenous leucine flux.
Statistical analysis
Comparison of data in the basal and insulinized states within a groupwas performed using Student’s t test for paired data. Comparisonsbetween obese and nonobese women were performed using Student’st test for unpaired data. Simple (Pearson’s) correlations coefficients werecalculated with standard formulas. Stepwise multiple regression anal-yses were performed to evaluate independent associations among vari-ables. Although a Gaussian distribution has not been demonstrated formany biological parameters assessed in the present study, all values areexpressed as the mean 6 se to be consistent and to allow comparisonwith most previously published data in this field. With this experimentaldesign, we had approximately a 75% chance of detecting a 20% differ-ence at the 0.05 level of significance for the main parameters of leucinemetabolism.
ResultsBody composition (study 1) and other anthropometricmeasurements
Fat mass was 37.3 6 3.4 kg in obese women and 20.5 6 1.2kg in nonobese women (P , 0.001). As expected, the obesegroup also had a higher FFM (51.2 6 1.8 vs. 40.8 6 2.1 kg; P ,0.005). WHR was slightly, although not significantly, higherin obese (0.88 6 0.02) vs. nonobese women (0.83 6 0.02). VATand SAT were higher in obese women ([VAT, 128.9 6 18.6vs. 58.7 6 11.9 cm2 (P , 0.005); SAT, 431 6 35 vs. 180 6 10cm2 (P , 0.001)].
Glucose/lipid metabolism (study 2)
Plasma glucose, insulin, and FFA concentrations in the basalstate and during insulin infusion are reported in Table 1.
In the basal state, total glucose metabolism, which is
mainly due to HGP, was similar in the two groups (135 6 6in obese vs. 120 6 4 mg/min in controls). During the clamp,the rate of whole body glucose uptake, glucose oxidation,and nonoxidative glucose disposal were reduced in obesewomen, as depicted in Fig. 1. Suppression of HGP duringinsulin infusion was slightly, although not significantly, im-paired in obese vs. nonobese women (24.8 6 9.5 vs. 9.83 6 9.3mg/min; P 5 NS).
The rates of basal lipid oxidation were similar in obese andnonobese women (1.18 6 0.11 and 1.25 6 0.13 mg/minzkgFFM). During the insulin clamp, suppression of lipid oxida-tion was slightly impaired in obese subjects (0.49 6 0.15 vs.0.17 6 0.09 mg/minzkg FFM; P 5 NS).
Protein metabolism (study 3)
The total plasma amino acid concentration in the basalstate and during the last hour of insulin infusion are reportedin Table 2 together with plasma leucine, tyrosine, and valineconcentrations.
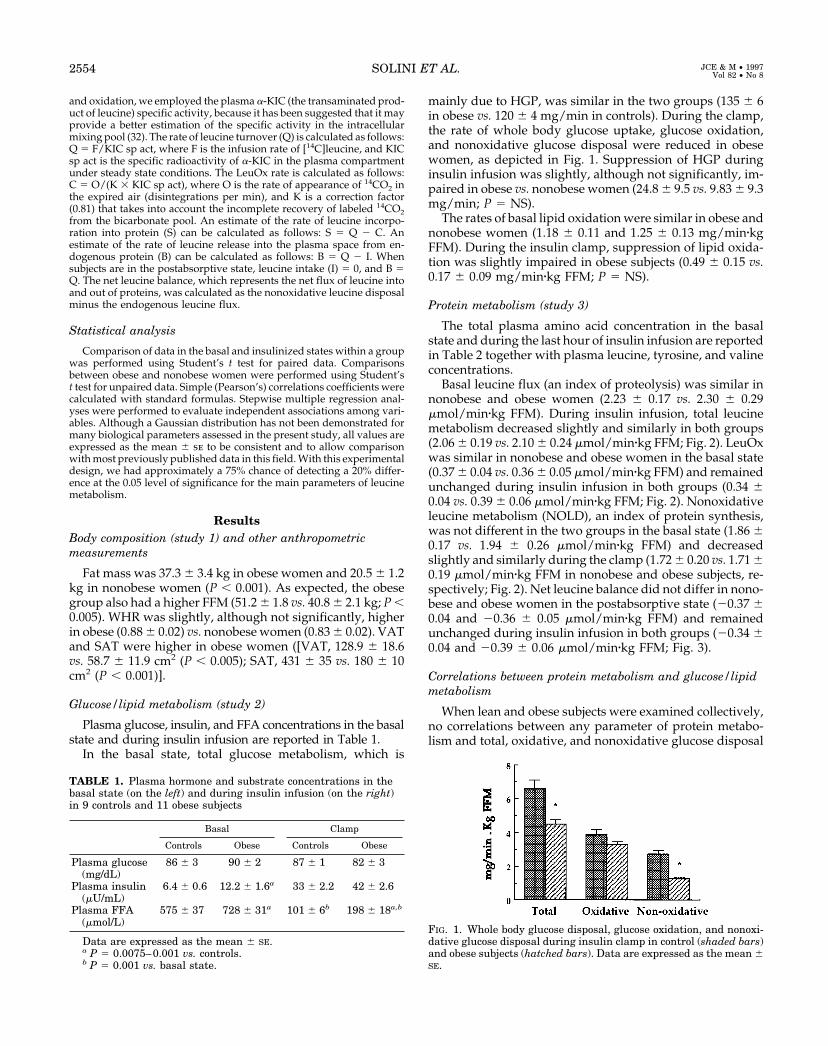
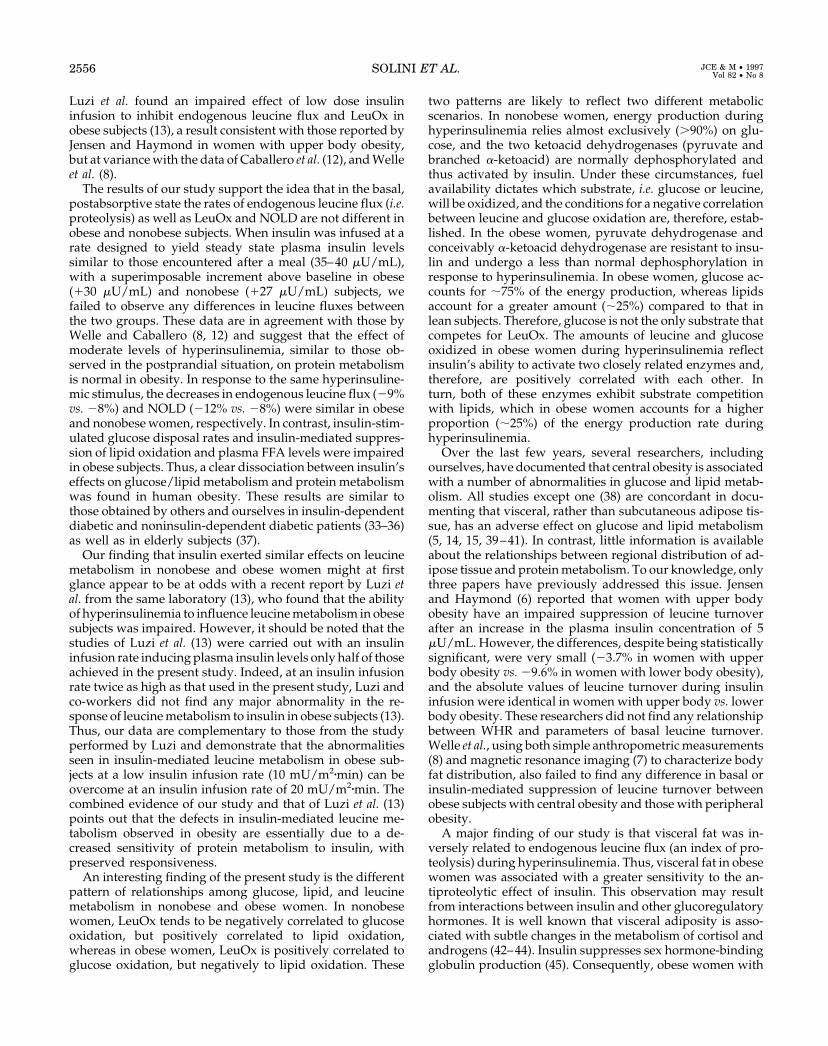
Basal leucine flux (an index of proteolysis) was similar innonobese and obese women (2.23 6 0.17 vs. 2.30 6 0.29mmol/minzkg FFM). During insulin infusion, total leucinemetabolism decreased slightly and similarly in both groups(2.06 6 0.19 vs. 2.10 6 0.24 mmol/minzkg FFM; Fig. 2). LeuOxwas similar in nonobese and obese women in the basal state(0.37 6 0.04 vs. 0.36 6 0.05 mmol/minzkg FFM) and remainedunchanged during insulin infusion in both groups (0.34 60.04 vs. 0.39 6 0.06 mmol/minzkg FFM; Fig. 2). Nonoxidativeleucine metabolism (NOLD), an index of protein synthesis,was not different in the two groups in the basal state (1.86 60.17 vs. 1.94 6 0.26 mmol/minzkg FFM) and decreasedslightly and similarly during the clamp (1.72 6 0.20 vs. 1.71 60.19 mmol/minzkg FFM in nonobese and obese subjects, re-spectively; Fig. 2). Net leucine balance did not differ in nono-bese and obese women in the postabsorptive state (20.37 60.04 and 20.36 6 0.05 mmol/minzkg FFM) and remainedunchanged during insulin infusion in both groups (20.34 60.04 and 20.39 6 0.06 mmol/minzkg FFM; Fig. 3).
Correlations between protein metabolism and glucose/lipidmetabolism
When lean and obese subjects were examined collectively,no correlations between any parameter of protein metabo-lism and total, oxidative, and nonoxidative glucose disposal
TABLE 1. Plasma hormone and substrate concentrations in thebasal state (on the left) and during insulin infusion (on the right)in 9 controls and 11 obese subjects
Basal Clamp
Controls Obese Controls Obese
Plasma glucose(mg/dL)
86 6 3 90 6 2 87 6 1 82 6 3
Plasma insulin(mU/mL)
6.4 6 0.6 12.2 6 1.6a 33 6 2.2 42 6 2.6
Plasma FFA(mmol/L)
575 6 37 728 6 31a 101 6 6b 198 6 18a,b
Data are expressed as the mean 6 SE.a P 5 0.0075–0.001 vs. controls.b P 5 0.001 vs. basal state.
FIG. 1. Whole body glucose disposal, glucose oxidation, and nonoxi-dative glucose disposal during insulin clamp in control (shaded bars)and obese subjects (hatched bars). Data are expressed as the mean 6SE.
2554 SOLINI ET AL. JCE & M • 1997Vol 82 • No 8

rates or lipid oxidation rate was observed either in the basalstate or during insulin infusion. In nonobese women, weobserved a trend to a negative correlation between LeuOxand glucose oxidation during the insulin clamp (r 5 0.638;P 5 0.064). In this group, LeuOx during the insulin clampwas strongly correlated with lipid oxidation (r 5 0.735; P ,0.05). In obese women, basal LeuOx was directly correlatedwith basal glucose oxidation (r 5 0.624; P , 0.05). Protein and
lipid oxidation were inversely related in the basal state (r 520.614; P , 0.05).
Correlations between protein metabolism and total andregional fat
When nonobese and obese women were examined collec-tively, total fat mass as well as FFM were not significantlycorrelated with any parameter of protein metabolism. In thewhole group, WHR, VAT, and SAT were not correlated toany parameter of protein metabolism (data not shown).
In obese women, we observed inverse relationships be-tween VAT and total, oxidative, and nonoxidative leucinedisposal rates during insulin infusion (r 5 20.610, P , 0.05;r 5 20.409, P 5 0.15; and r 5 20.624, P , 0.05). In bothnonobese and obese women, SAT was not correlated to anyparameter of protein metabolism. When the data were an-alyzed by stepwise regression analysis, in obese women,VAT was inversely related to total leucine disposal duringinsulin infusion independently of total adiposity, SAT, andbasal plasma insulin concentration (F 5 5.345; P , 0.05). Withthe same statistical approach, VAT was inversely related toNOLD during the insulin clamp in obese women (F 5 5.753;P , 0.05).
Discussion
Studies from a number of laboratories, including our own,have demonstrated that human obesity is characterized by avariety of abnormalities in glucose and lipid metabolism(1–5). Consistent with previous studies, we found that obesewomen manifested diminished rates of total, oxidative, andnonoxidative glucose disposal and an increased rate of lipidoxidation during insulin infusion. In this study, we used aninsulin infusion rate not ideal to detect impairment in insulineffects on HGP and lipid oxidation. Despite this, we founddifferences in these parameters between obese and nonobesewomen, which did not achieve statistical significance be-cause of the small sample size. Plasma FFA levels also werehigher in obese women both in the basal state and duringinsulin clamp. These results confirm the presence in humanobesity of an insulin-resistant state involving both glucoseand lipid metabolism.
With respect to protein metabolism, the few studies thathave been published have yielded conflicting results (6–13).
TABLE 2. Plasma amino acid concentrations in the basal stateand during insulin infusion in obese and control subjects
Controls (n 5 9) Obese (n 5 11)
Basal Clamp Basal Clamp
Leucine 83 6 5 58 6 4b 95 6 5 74 6 4a,b
Valine 127 6 9 107 6 10b 163 6 7a 135 6 6a,b
Tyrosine 43 6 3 34 6 3b 48 6 4 45 6 2a
Total aminoacids
2414 6 131 2294 6 147 2401 6 89 2401 6 129
a P 5 0.03–0.007 vs. controls.b P 5 0.000 vs. basal state.
FIG. 2. Total leucine flux, leucine turnover, and nonoxidative leucinedisposal in the basal state (upper panel) and during insulin infusion(lower panel) in control (shaded bars) and obese (hatched bars) sub-jects. NOLD, an index of protein synthesis, represents the differencebetween the total leucine flux (an index of proteolysis) and LeuOx.Data are expressed as the mean 6 SE.
FIG. 3. Net leucine balance in the basal state and during insulininfusion in control (shaded bars) and obese (hatched bars) subjects.The net leucine balance represents the difference between the flux ofleucine into proteins (nonoxidative leucine disposal) and out of pro-teins (endogenous leucine flux). Data are expressed as the mean 6 SE.
PROTEIN METABOLISM IN OBESITY 2555
Luzi et al. found an impaired effect of low dose insulininfusion to inhibit endogenous leucine flux and LeuOx inobese subjects (13), a result consistent with those reported byJensen and Haymond in women with upper body obesity,but at variance with the data of Caballero et al. (12), and Welleet al. (8).
The results of our study support the idea that in the basal,postabsorptive state the rates of endogenous leucine flux (i.e.proteolysis) as well as LeuOx and NOLD are not different inobese and nonobese subjects. When insulin was infused at arate designed to yield steady state plasma insulin levelssimilar to those encountered after a meal (35–40 mU/mL),with a superimposable increment above baseline in obese(130 mU/mL) and nonobese (127 mU/mL) subjects, wefailed to observe any differences in leucine fluxes betweenthe two groups. These data are in agreement with those byWelle and Caballero (8, 12) and suggest that the effect ofmoderate levels of hyperinsulinemia, similar to those ob-served in the postprandial situation, on protein metabolismis normal in obesity. In response to the same hyperinsuline-mic stimulus, the decreases in endogenous leucine flux (29%vs. 28%) and NOLD (212% vs. 28%) were similar in obeseand nonobese women, respectively. In contrast, insulin-stim-ulated glucose disposal rates and insulin-mediated suppres-sion of lipid oxidation and plasma FFA levels were impairedin obese subjects. Thus, a clear dissociation between insulin’seffects on glucose/lipid metabolism and protein metabolismwas found in human obesity. These results are similar tothose obtained by others and ourselves in insulin-dependentdiabetic and noninsulin-dependent diabetic patients (33–36)as well as in elderly subjects (37).
Our finding that insulin exerted similar effects on leucinemetabolism in nonobese and obese women might at firstglance appear to be at odds with a recent report by Luzi etal. from the same laboratory (13), who found that the abilityof hyperinsulinemia to influence leucine metabolism in obesesubjects was impaired. However, it should be noted that thestudies of Luzi et al. (13) were carried out with an insulininfusion rate inducing plasma insulin levels only half of thoseachieved in the present study. Indeed, at an insulin infusionrate twice as high as that used in the present study, Luzi andco-workers did not find any major abnormality in the re-sponse of leucine metabolism to insulin in obese subjects (13).Thus, our data are complementary to those from the studyperformed by Luzi and demonstrate that the abnormalitiesseen in insulin-mediated leucine metabolism in obese sub-jects at a low insulin infusion rate (10 mU/m2zmin) can beovercome at an insulin infusion rate of 20 mU/m2zmin. Thecombined evidence of our study and that of Luzi et al. (13)points out that the defects in insulin-mediated leucine me-tabolism observed in obesity are essentially due to a de-creased sensitivity of protein metabolism to insulin, withpreserved responsiveness.
An interesting finding of the present study is the differentpattern of relationships among glucose, lipid, and leucinemetabolism in nonobese and obese women. In nonobesewomen, LeuOx tends to be negatively correlated to glucoseoxidation, but positively correlated to lipid oxidation,whereas in obese women, LeuOx is positively correlated toglucose oxidation, but negatively to lipid oxidation. These
two patterns are likely to reflect two different metabolicscenarios. In nonobese women, energy production duringhyperinsulinemia relies almost exclusively (.90%) on glu-cose, and the two ketoacid dehydrogenases (pyruvate andbranched a-ketoacid) are normally dephosphorylated andthus activated by insulin. Under these circumstances, fuelavailability dictates which substrate, i.e. glucose or leucine,will be oxidized, and the conditions for a negative correlationbetween leucine and glucose oxidation are, therefore, estab-lished. In the obese women, pyruvate dehydrogenase andconceivably a-ketoacid dehydrogenase are resistant to insu-lin and undergo a less than normal dephosphorylation inresponse to hyperinsulinemia. In obese women, glucose ac-counts for ;75% of the energy production, whereas lipidsaccount for a greater amount (;25%) compared to that inlean subjects. Therefore, glucose is not the only substrate thatcompetes for LeuOx. The amounts of leucine and glucoseoxidized in obese women during hyperinsulinemia reflectinsulin’s ability to activate two closely related enzymes and,therefore, are positively correlated with each other. Inturn, both of these enzymes exhibit substrate competitionwith lipids, which in obese women accounts for a higherproportion (;25%) of the energy production rate duringhyperinsulinemia.
Over the last few years, several researchers, includingourselves, have documented that central obesity is associatedwith a number of abnormalities in glucose and lipid metab-olism. All studies except one (38) are concordant in docu-menting that visceral, rather than subcutaneous adipose tis-sue, has an adverse effect on glucose and lipid metabolism(5, 14, 15, 39–41). In contrast, little information is availableabout the relationships between regional distribution of ad-ipose tissue and protein metabolism. To our knowledge, onlythree papers have previously addressed this issue. Jensenand Haymond (6) reported that women with upper bodyobesity have an impaired suppression of leucine turnoverafter an increase in the plasma insulin concentration of 5mU/mL. However, the differences, despite being statisticallysignificant, were very small (23.7% in women with upperbody obesity vs. 29.6% in women with lower body obesity),and the absolute values of leucine turnover during insulininfusion were identical in women with upper body vs. lowerbody obesity. These researchers did not find any relationshipbetween WHR and parameters of basal leucine turnover.Welle et al., using both simple anthropometric measurements(8) and magnetic resonance imaging (7) to characterize bodyfat distribution, also failed to find any difference in basal orinsulin-mediated suppression of leucine turnover betweenobese subjects with central obesity and those with peripheralobesity.
A major finding of our study is that visceral fat was in-versely related to endogenous leucine flux (an index of pro-teolysis) during hyperinsulinemia. Thus, visceral fat in obesewomen was associated with a greater sensitivity to the an-tiproteolytic effect of insulin. This observation may resultfrom interactions between insulin and other glucoregulatoryhormones. It is well known that visceral adiposity is asso-ciated with subtle changes in the metabolism of cortisol andandrogens (42–44). Insulin suppresses sex hormone-bindingglobulin production (45). Consequently, obese women with
2556 SOLINI ET AL. JCE & M • 1997Vol 82 • No 8
large amounts of visceral fat, who are especially hyperinsu-linemic (40, 41), have lower concentrations of sex hormone-binding globulin and higher concentrations of free andro-gens (46, 47). Furthermore, some evidence suggests thathyperinsulinemia may modulate steroidogenesis, causing anincrease in the production of dehydroepiandrosterone andtestosterone (48, 49). It is possible that increased levels ofanabolic steroid hormones are responsible, therefore, for theenhanced antiproteolytic effect of insulin in women withvisceral obesity. Alternatively, it could be hypothesized thatthe higher levels of FFA (3, 5) and the increased rate of lipidoxidation (5) that are characteristic of individuals with vis-ceral obesity exert a protein-sparing effect, as suggested byprevious studies (50–52). The negative correlation betweenlipid and LeuOx in obese women is consistent with thishypothesis. A third possibility is that the amount of visceralfat is negatively related to protein metabolism as a result ofchanges in muscle capillarization and fiber composition inindividuals with central obesity (39, 53). Indeed, a correlationbetween muscle fiber composition and protein turnover hasbeen described (54). All of these hypotheses need to be ad-equately addressed with specific studies.
Although we have examined only women, so that wecannot a priori extend our results to men, our findings suggestthat in human obesity, 1) rates of protein metabolism (pro-teolysis, protein oxidation, and protein synthesis), both in thebasal state and in the range of insulin concentrations en-countered after a meal, are normal; 2) protein oxidation ispositively correlated with glucose oxidation and negativelyrelated to lipid oxidation; and 3) the amount of visceraladipose tissue is negatively correlated to all parameters ofprotein metabolism.
Acknowledgments
We thank Anna Crowder, Christopher Carroll, and Ronald Klein fortheir excellent technical support, and Rita Mirabelli, Debra Mitchell, andBarbara Washington for their skillful nursing assistance.
References
1. DeFronzo RA, Soman V, Sherwin RS, Hendler R, Felig P. 1978 Insulinbinding to monocytes and insulin action in human obesity, starvation andrefeeding. J Clin Invest. 62:204–213.
2. Kolterman OG, Insel J, Saekow M, Olefsky JM. 1980 Mechanisms of insulinresistance in human obesity. Evidence for receptor and post-receptor defects.J Clin Invest. 65:1272–1284.
3. Jensen MD, Haymond MW, Rizza RA, Cryer PE, Miles JM. 1989 Influenceof body fat distribution on free fatty acid metabolism in obesity. J Clin Invest.83:1168–1173.
4. Bonadonna RC, Groop L, Kraemer N, Ferrannini E, Del Prato S, DeFronzoRA. 1990 Obesity and insulin resistance in humans: a dose-response study.Metabolism. 39:452–459.
5. Bonora E, Del Prato S, Bonadonna RC, et al. 1992 Total body fat content andfat topography are differently associated with in vivo glucose metabolism innon-obese and obese non-diabetic women. Diabetes. 41:1151–1159.
6. Jensen MD, Haymond MW. 1991 Protein metabolism in obesity: effects ofbody fat distribution and hyperinsulinemia on leucine turnover. Am J ClinNutr. 53:172–176.
7. Welle S, Barnard RR, Statt A, Amatruda JM. 1992 Increased protein turnoverin obese women. Metabolism. 41:1028–1034.
8. Welle S, Statt M, Barnard R, Amatruda J. 1994 Differential effect of insulin onwhole-body proteolysis and glucose metabolism in normal-weight, obese andreduced-obese women. Metabolism. 43:441–445.
9. Nair KS, Garrow JS, Ford C, Mahler RF, Halliday D. 1983 Effect of poordiabetic control and obesity on whole body protein metabolism in man. Dia-betologia. 25:400–403.
10. Nair KS, Halliday D, Ford GC, Heels S, Garrow JS. 1987 Failure of carbo-hydrate to spare leucine oxidation in obese subjects. Int J Obesity. 11:537–544.
11. Bruce AC, McNurlan MA, McHardy KC, et al. 1990 Nutrient oxidation pat-terns and protein metabolism in lean and obese subjects. Int J Obesity.14:631–676.
12. Caballero B, Wurtman RJ. 1991 Differential effects of insulin resistance onleucine and glucose kinetics in obesity. Metabolism. 40:51–58.
13. Luzi L, Castellino P, DeFronzo RA. 1996 Insulin and hyperaminoacidemiaregulate by a different mechanism leucine turnover and oxidation in obesity.Am J Physiol 270:E273–E281.
14. Bjorntorp P. 1991 Metabolic implications of body fat distribution. DiabetesCare. 14:1132–1143.
15. Kissebah, AH, Krakower, GR. 1994 Regional adiposity and morbidity. PhysiolRev. 74:761–811.
16. Van Itallie T. 1985 Health implications of overweight and obesity in the UnitedStates. Ann Intern Med. 103:938–988.
17. Siri WE. 1961 Body composition from fluid spaces and density: analysis ofmethods. In: Brozek J, Henschel A, eds. Techniques for measuring body com-position. Washington DC: National Academy of Science, National ResearchCouncil; 223–244.
18. Sheng HP, Huggins RA. 1979 A review of body composition studies withemphasis on total body water and fat. Am J Clin Nutr. 32:630–647.
19. De Fronzo RA, Tobin JD, Andres R. 1979 Glucose clamp technique: a methodfor quantifying insulin secretion and resistance. Am J Physiol 237:E214–E223.
20. Bonadonna R, Del Prato S, Bonora E, Gulli G, Solini A, DeFronzo RA. 1993The effects of physiologic hyperinsulinemia on the intracellular metabolicpartition of plasma glucose. Am J Physiol 265:E943–E953.
21. Simonson DC, DeFronzo RA. 1990 Indirect calorimetry: methodological andinterpretative problems. Am J Physiol 258:E399–E412.
22. Castellino P, Luzi L, Simonson DC, Haymond M, DeFronzo RA. 1987 Effectof insulin and plasma amino acid concentrations on leucine metabolism inman: the role of substrate availability on estimates of whole body proteinsynthesis. J Clin Invest. 80:1784–1793.
23. Somogyi M. 1945 Determination of blood sugar. J Biol Chem. 160:69–73.24. Hales CN, Randle PJ. 1946 Immunoassay of insulin with insulin antibody
precipitate. Biochem J. 88:137–146.25. Miles JR, Glassock J, Aikens J, Gerich J, Haymond M. 1983 A microfluoro-
metric method of free fatty acids in plasma. J Lipid Res. 24:96–99.26. Hawk PD. 1947 Kjeldahl method. In: Practical physiological chemistry, 12th
ed. Blakiston: Toronto; 814–822.27. Nissen SL, Van Huisen C, Haymond MW. 1982 Measurements of branched
chain amino acids and branched chained alpha ketoacids in plasma by highperformance liquid chromatography. J Chromatogr. 232:170–175.
28. Lancaster JL, Ghiatas AA, Alyassin A, Kilcoyne RF, Bonora E, DeFronzo RA.1991 Measurement of abdominal fat with TI weighted magnetic resonanceimages. J Magnetic Resonance Imaging. 1:363–369.
29. Kvist H, Chowdhury B, Grangard U, Tylen U, Sjostrom L. 1988 Total andvisceral adipose tissue volumes derived from measurements with computedtomography in adult men and women: predictive equations. Am J Clin Nutr.48:1351–1361.
30. Waterlow JC, Garlick PJ, Millward DJ. 1978 Protein turnover in mammaliantissues and in the whole body. New York: Elsevier/North Holland.
31. Golden MHN, Waterlow JC. 1977 Total protein synthesis in the elderly people:a comparison of results with 15N-glycine and 14C-leucine. Cli Sci Mol Med.53:277–288.
32. Matthews DE, Schwartz HP, Yang RD, Mot KJ, Young VR, Bier DM. 1980Relationship of plasma leucine and alpha-ketoisocaproate during a[1-13C]leucine infusion in man: a method for measuring human intracellularleucine tracer enrichment. Metabolism. 31:1105–1112.
33. Tessari P, Nosadini R, Trevisan R, et al. 1986 Defective suppression by insulinof leucine and a-KIC metabolism in type I diabetes. J Clin Invest. 77:1797–1804.
34. Luzi L, Castellino P, Simonson DC, Petrides AS, DeFronzo RA. 1990 Leucinemetabolism in IDDM: the role of insulin and substrate availability. Diabetes.39:38–48.
35. Luzi L, Petrides AS, DeFronzo RA. 1993 Different sensitivity of glucose andamino acid metabolism to insulin in NIDDM. Diabetes. 42:1868–1877.
36. Fugakawa NK, Minaker KL, Rowe JM, et al. 1985 Insulin-mediated reductionof whole body protein breakdown. J Clin Invest. 76:2306–2311.
37. Fugakawa NK, Minaker KL, Young VR, Matthews DE, Bier DM, Rowe JW.1989 Leucine metabolism in aging humans: effect of insulin and substrateavailability. Am J Physiol 256:E288–E294.
38. Abate N, Garg A, Peshock RM, Stray-Gundersen J, Grundy S. 1995 Rela-tionships of generalized and regional adiposity to insulin sensitivity in men.J Clin Invest. 96:88–98.
39. Krotkiewski M, Bjorntorp P. 1986 Muscle tissue in obesity with differentdistribution of adipose tissue. Effects of physical training. Int J Obesity.10:331–341.
40. Despres JP, Nadeau A, Tremblay A, et al. 1989 Role of deep abdominal fat inthe association between regional adipose tissue distribution and glucose tol-erance in obese women. Diabetes. 38:304–309.
41. Fujioka S, Matsuzawa Y, Tokunaga K, Tarui S. 1987 Contribution of intra-abdominal fat accumulation to the impairment of glucose and lipid metabo-lism in human obesity. Metabolism. 36:54–59.
42. Kirschner MA, Samojlik E, Drejka M, Szmal E, Shneider G, Ertel N. 1990
PROTEIN METABOLISM IN OBESITY 2557

Androgen-estrogen metabolism in women with upper-body versus lower-bodyobesity. J Clin Endocrinol Metab. 70:473–479.
43. Marin P, Darin N, Amemiya T, Andersson B, Jern S, Bjorntorp P. 1992Cortisol secretion in relation to body fat distribution in obese premenopausalwomen. Metabolism. 41:882–886.
44. Williams DP, Boyden TW, Pamenter RW, Lohman TG, Going SB. 1993Relationship of body fat percentage and fat distribution with dehydroepi-androsterone sulfate in premenopausal females. J Clin Endocrinol Metab.77:80–85.
45. Plymate SR, Matej LA, Jones LA, Friedl KE. 1988 Inhibition of sex hormonebinding globulin (SHBG) production in the human hepatoma (Hep G2) cell lineby insulin and prolactin. J Clin Endocrinol Metab. 67:460–464.
46. Evans DJ, Hoffmann RG, Kalkhoff RK, Kissebah AH. 1983 Relationship ofandrogenic activity to body fat topography, fat cell morphology and metabolicaberrations in premenopausal women. J Clin Endocrinol Metab. 57:304–310.
47. De Pergola G, Triggiani V, Giorgino F, et al. 1994 The free testosterone todehydroepiandrosterone sulphate molar ratio as a marker of visceral fat ac-cumulation in premenopausal obese women. Int J Obesity. 18:659–664.
48. Micic D, Popovic V, Nesovic M, et al. 1988 Androgen levels during sequential
insulin euglycemic clamp studies in patients with polycistic ovary disease. JSteroid Biochem. 31:995–999.
49. Stuart CA, Nagamani M. 1990 Insulin infusion acutely augments ovarianandrogen production in normal women. Fertil Steril. 54:788–792.
50. Jeejeebhoy KN, Anderson GH, Nakhooda AF, Greenberg GR, Sanderson I,Marliss EB. 1976 Metabolic studies in parenteral nutrition with lipid in man.Comparison with glucose. J Clin Invest. 57:125–136.
51. Tessari P, Nissen SL, Miles JM, Haymond MW. 1986 Inverse relationship ofleucine flux and oxidation to free fatty acid availability in vivo. J Clin Invest.77:575–581.
52. Ferrannini E, Barrett EJ, Bevilacqua S, et al. 1986 Effect of free fatty acids onblood amino acid level in humans. Am J Physiol 250:E686–E694.
53. Lillioja S, Young AA, Culter CL, et al. 1987 Skeletal muscle capillary densityand fiber type are possible determinants of in vivo insulin resistance in man.J Clin Invest. 80:415–424.
54. Garlick PJ, Maltin CA, Baillie AGS, Delday MI, Grubb DA. 1989 Fiber-typecomposition of nine rat muscles. II. Relationship to protein turnover. Am JPhysiol 257:E828–E832.
2558 SOLINI ET AL. JCE & M • 1997Vol 82 • No 8
Related Documents