Protein level affects the relative lysine requirement of growing rainbow trout (Oncorhynchus mykiss) fry Noelie Bodin 1 , Bernadette Govaerts 2 , Tarik Abboudi 1 , Christel Detavernier 3 , Sarah De Saeger 3 , Yvan Larondelle 1 and Xavier Rollin 1 * 1 Laboratoire de Pisciculture M. Huet, Unite ´ de Biochimie de la Nutrition, Universite ´ catholique de Louvain, Route de Blocry 2, B-1348 Louvain-la-Neuve, Belgium 2 Institut de statistique, Universite ´ catholique de Louvain, Voie du roman pays 20, B-1348 Louvain-la-Neuve, Belgium 3 Laboratorium voor Bromatologie, Universiteit Gent, Harelbekestraat 72, B-9000, Gent, Belgium (Received 18 April 2008 – Revised 9 October 2008 – Accepted 13 October 2008 – First published online 13 January 2009) The effect of two digestible protein levels (310 and 469 g/kg DM) on the relative lysine (Lys; g Lys/kg DM or g Lys/100 g protein) and the absol- ute Lys (g Lys intake/kg 0·75 per d) requirements was studied in rainbow trout fry using a dose – response trial. At each protein level, sixteen iso- energetic (22 – 23 MJ digestible energy/kg DM) diets were tested, involving a full range (2 – 70 g/kg DM) of sixteen Lys levels. Each diet was given to one group of sixty rainbow trout fry (mean initial body weight 0·78 g) reared at 158C for 31 feeding d. The Lys requirements were estimated based on the relationships between weight, protein, and Lys gains (g/kg 0·75 per d) and Lys concentration (g/kg DM or g/100 g protein) or Lys intake (g/kg 0·75 per d), using the broken-line model (BLM) and the non-linear four-parameter saturation kinetics model (SKM-4). Both the model and the response criterion chosen markedly impacted the relative Lys requirement. The relative Lys requirement for Lys gain of rainbow trout estimated with the BLM (and SKM-4 at 90% of the maximum response) increased from 16·8 (19·6) g/kg DM at a low protein level to 23·4 (24·5) g/kg DM at a high protein level. However, the dietary protein content affected neither the absolute Lys requirement nor the relative Lys requirement expressed as g Lys/100 g protein nor the Lys requirement for maintenance (21 mg Lys/kg 0·75 per d). Growth requirements: Lysine requirement: Protein level: Rainbow trout fry Precise indispensable amino acid (AA) requirement values are necessary for elaborating balanced aquafeeds that ensure both cost-effectiveness and minimal environmental impact. This necessity has been heightened by the increasing use of plant protein sources to replace fishmeal in aquafeeds. Large variations in relative indispensable AA requirement estimates for different salmonid species and within species alike still subsist in the literature (1) . Even for lysine (Lys), which is often the first limiting AA in plant proteins, the published rela- tive requirement estimates vary greatly, from 1·3 to 2·9 % of the diet (1) . Plausible causes of the variation are the units used to express the requirement (2 – 4) , diet composition (4) , laboratory variance (5) , overfeeding (2,3) , response criterion (1) and experi- mental design, statistical analysis and model choice (6) . Basal diet composition (1) and, more specifically, the influence of dietary protein level on the requirement of the first limiting indispensable AA has not yet been examined for fish. The implications are far-reaching, especially when one considers that diet formulators may choose to increase or decrease the dietary protein level for a wide variety of reasons. They may wish to achieve maximum growth performance, decrease environmental impact, increase cost-effectiveness, or to adapt the diet to the life stage of the fish. Also, the protein level in the diet may be affected by the use of large amounts of plant protein sources which may contain lower pro- tein concentrations than fishmeal. In warm-blooded terrestrial animals, it has been reported for a long time that relative AA requirements are related to dietary protein concentration (7 – 17) . In general, the requirement for an AA expressed as a percentage of the diet increased as dietary protein concentration increased up to the level of protein required for maximum growth (18) . For instance, Brinegar et al. (9) showed that the mimimum level of Lys which produced the maximum weight gain, considered as the Lys requirement, in swine, was 6 g/kg in a 10·6 % protein diet and 12 g/kg in a 22 % protein diet. This difference in the requirements almost disappeared when the requirements were expressed in terms of their proportion to the protein in the diets. However, the AA requirement expressed as a per- centage of the diet has also been reported to remain constant or even to decrease slightly when expressed as a percentage of dietary protein (11 – 14,19 – 21) . This situation is usually observed under conditions of optimal and supra-optimal protein intakes or concentrations in the diets (14) . For example, * Corresponding author: Dr Xavier Rollin, fax þ32 10459846, email [email protected] Abbreviations: AA, amino acid; BLM, broken-line model; HP, high protein; LP, low protein; Lys, lysine; MBW, metabolic body weight; PPV, protein productive value; SKM-4, saturation kinetics model with four parameters. British Journal of Nutrition (2009), 102, 37–53 doi:10.1017/S0007114508158986 q The Authors 2009 British Journal of Nutrition

Welcome message from author
This document is posted to help you gain knowledge. Please leave a comment to let me know what you think about it! Share it to your friends and learn new things together.
Transcript
Protein level affects the relative lysine requirement of growing rainbow trout
(Oncorhynchus mykiss) fry
Noelie Bodin1, Bernadette Govaerts2, Tarik Abboudi1, Christel Detavernier3, Sarah De Saeger3,
Yvan Larondelle1 and Xavier Rollin1*1Laboratoire de Pisciculture M. Huet, Unite de Biochimie de la Nutrition, Universite catholique de Louvain, Route de Blocry 2,
B-1348 Louvain-la-Neuve, Belgium2Institut de statistique, Universite catholique de Louvain, Voie du roman pays 20, B-1348 Louvain-la-Neuve, Belgium3Laboratorium voor Bromatologie, Universiteit Gent, Harelbekestraat 72, B-9000, Gent, Belgium
(Received 18 April 2008 – Revised 9 October 2008 – Accepted 13 October 2008 – First published online 13 January 2009)
The effect of two digestible protein levels (310 and 469 g/kg DM) on the relative lysine (Lys; g Lys/kg DM or g Lys/100 g protein) and the absol-
ute Lys (g Lys intake/kg0·75 per d) requirements was studied in rainbow trout fry using a dose–response trial. At each protein level, sixteen iso-
energetic (22–23 MJ digestible energy/kg DM) diets were tested, involving a full range (2–70 g/kg DM) of sixteen Lys levels. Each diet was given
to one group of sixty rainbow trout fry (mean initial body weight 0·78 g) reared at 158C for 31 feeding d. The Lys requirements were estimated
based on the relationships between weight, protein, and Lys gains (g/kg0·75 per d) and Lys concentration (g/kg DM or g/100 g protein) or Lys intake
(g/kg0·75 per d), using the broken-line model (BLM) and the non-linear four-parameter saturation kinetics model (SKM-4). Both the model and the
response criterion chosen markedly impacted the relative Lys requirement. The relative Lys requirement for Lys gain of rainbow trout estimated
with the BLM (and SKM-4 at 90 % of the maximum response) increased from 16·8 (19·6) g/kg DM at a low protein level to 23·4 (24·5) g/kg DM at
a high protein level. However, the dietary protein content affected neither the absolute Lys requirement nor the relative Lys requirement expressed
as g Lys/100 g protein nor the Lys requirement for maintenance (21 mg Lys/kg0·75 per d).
Growth requirements: Lysine requirement: Protein level: Rainbow trout fry
Precise indispensable amino acid (AA) requirement values arenecessary for elaborating balanced aquafeeds that ensure bothcost-effectiveness and minimal environmental impact. Thisnecessity has been heightened by the increasing use ofplant protein sources to replace fishmeal in aquafeeds. Largevariations in relative indispensable AA requirement estimatesfor different salmonid species and within species alike stillsubsist in the literature(1). Even for lysine (Lys), which isoften the first limiting AA in plant proteins, the published rela-tive requirement estimates vary greatly, from 1·3 to 2·9 % of thediet(1). Plausible causes of the variation are the units used toexpress the requirement(2 – 4), diet composition(4), laboratoryvariance(5), overfeeding(2,3), response criterion(1) and experi-mental design, statistical analysis and model choice(6). Basaldiet composition(1) and, more specifically, the influenceof dietary protein level on the requirement of the first limitingindispensable AA has not yet been examined for fish.The implications are far-reaching, especially when oneconsiders that diet formulators may choose to increase ordecrease the dietary protein level for a wide variety of reasons.They may wish to achieve maximum growth performance,decrease environmental impact, increase cost-effectiveness, or
to adapt the diet to the life stage of the fish. Also, theprotein level in the diet may be affected by the use of largeamounts of plant protein sources which may contain lower pro-tein concentrations than fishmeal.
In warm-blooded terrestrial animals, it has been reported fora long time that relative AA requirements are related to dietaryprotein concentration(7 – 17). In general, the requirement for anAA expressed as a percentage of the diet increased as dietaryprotein concentration increased up to the level of proteinrequired for maximum growth(18). For instance, Brinegaret al. (9) showed that the mimimum level of Lys whichproduced the maximum weight gain, considered as the Lysrequirement, in swine, was 6 g/kg in a 10·6 % protein dietand 12 g/kg in a 22 % protein diet. This difference in therequirements almost disappeared when the requirementswere expressed in terms of their proportion to the protein inthe diets. However, the AA requirement expressed as a per-centage of the diet has also been reported to remain constantor even to decrease slightly when expressed as a percentageof dietary protein(11 – 14,19 – 21). This situation is usuallyobserved under conditions of optimal and supra-optimalprotein intakes or concentrations in the diets(14). For example,
*Corresponding author: Dr Xavier Rollin, fax þ32 10459846, email [email protected]
Abbreviations: AA, amino acid; BLM, broken-line model; HP, high protein; LP, low protein; Lys, lysine; MBW, metabolic body weight; PPV, protein productive
value; SKM-4, saturation kinetics model with four parameters.
British Journal of Nutrition (2009), 102, 37–53 doi:10.1017/S0007114508158986q The Authors 2009
British
Journal
ofNutrition
Bressani & Mertz(12) demonstrated that the Lys requirementexpressed as a percentage of the diet remained essentiallyconstant in the range of 16–40 % protein, i.e. above optimalprotein level for rats(22).
The main objective of the present study was to determinethe effect of the dietary protein level on the relative and absol-ute Lys requirements of rainbow trout fry. Two secondaryobjectives were to examine the influence of the modelchoice and the response criterion on the Lys requirement esti-mate. Both a linear model and a non-linear model were fittedto the data to estimate the Lys requirements. The broken-linemodel (BLM) of Robbins et al. (23) was chosen because it isthe most widely used method of evaluating dose–responsedata in nutrient requirement studies in fish(6) includingLys(2). On the other hand, the saturation kinetics model(24)
with four parameters (SKM-4) was also selected in the presentstudy because we used a wide range(25) of Lys concentrationsof about three times the requirement without observing anyinhibition in the response of trout fry(1,6,26). The main responsecriteria studied were gains in body weight, protein and Lys.The total Lys requirement was expressed in both absolute(g Lys/kg metabolic body weight (MBW) per d) and in rela-tive (g Lys/kg dry diet (DM) or g/100 g protein) terms.
Materials and methods
Two experiments were undertaken. The first was designed toestablish the response of protein and Lys gains to Lys intakefor a wide range of Lys intakes at two different proteinlevels. The second experiment was a digestibility trial per-formed with two diets obtained by blending diets of experi-ment one. The two diets differed in their protein level andcontained the optimal Lys level found with the first experi-ment. The second experiment was necessary to evaluate thedigestibility of proteins and energy in the two basal dietsand the relative and absolute Lys requirements on a digestiblebasis.
Experimental diets
Thirty-two isoenergetic experimental diets were formulatedto contain sixteen Lys levels and two protein levels, givinga 16 £ 2 factorial design. For the low-protein (LP) andhigh-protein (HP) diets the targeted crude protein levelswere of 300 and 450 g crude protein/kg DM, respectively.For diets LP0 to LP15, the targeted Lys levels in g/kg dietDM were of 2, 4, 6, 8, 10, 12, 14, 16, 18, 20, 22, 24, 26,33, 40, 47 and for diets HP0 to HP15, the total targeted Lyslevels in g/kg diet DM were of 2, 6, 9, 12, 15, 18, 21, 24,27, 30, 33, 36, 39, 50, 60, 70. The AA diet profile followedthe National Research Council recommendations(27), exceptfor Lys. Wheat gluten provided the main protein source.A mixture of non-essential crystalline AA was added inorder to compensate for the reduction in Lys and to maintainthe same digestible N and total crystalline AA levels for alldiets. The experimental diets were produced as previouslyreported(28). In particular, the crystalline AA mixtures werecoated with 1 % agar, as described by Mambrini &Kaushik(29), to hinder leakage, delay its digestive absorptionand optimise its use for protein accretion. After extrusion,the experimental diets were stored at 2208C. The ingredients
and proximate compositions of the diets are shown in Tables 1and 2. The AA composition was analysed once for the follow-ing eight diets: LP0, LP5, LP10, LP15, HP0, HP5, HP10 andHP15 (Table 3). Because the AA levels in the eight analyseddiets were very close to the formulated levels, it followed thatthe diets had the formulated concentration of all AA and inparticular of Lys.
Fish and feeding
The Animal Welfare Commission of the Universite catholiquede Louvain approved the experiment in accordance with theEC directive concerning vertebrate laboratory animals.
Rainbow trout eyed embryonic eggs of domesticated originwere supplied to our laboratory hatchery (M. Huet Fish CultureLaboratory, Universite catholique de Louvain, Louvain-la-Neuve, Belgium) by a commercial fish farm (La Fontaineaux Truites, Gerouville, Belgium) and then reared to the
Table 1. Composition of the low-protein (LP) and high-protein (HP)experimental diets used for determining the effect of diet digestibleprotein on lysine (Lys) requirements and retention efficiencies inrainbow trout fry
(Mean values and standard deviations)
Diets. . . LP0 to LP15 HP0 to HP15
Mean SD Mean SD
Components (g/kg diet)Wheat gluten meal§ 127·5 192L-Amino acid mixturek 209·1 312·5Cod liver oil{ 205 205Glucose** 148·4 0Dextrin§ 180 160·5Soya lecithin†† 40 40Vitamin mix‡‡ 10 10Mineral mix§§ 40 40Agar§ 10 10Carboxymethylcellulose§ 20 20a-Cellulose§ 10 10
Analysed chemical composition and digestible valuesDM (g/kg diet)kk 919·5 4·2 932·7 8·1Crude protein (g/kg DM){{ 316·4 3·4 474·7 1·4DP (g/kg DM){{ 309·9 0·6 468·8 0·2Ash (g/kg DM)kk 31·1 3·2 32·3 1·3Energy (kJ/g DM){{ 23·7 0·04 24·2 0·06DE (kJ/g DM){{ 21·8 0·15 23·0 0·04DP/DE (g/kJ) 14·2 20·4
DE; digestible energy; DP, digestible protein.§Sigma (St Louis, MO, USA): wheat gluten meal g5004; dextrin (from corn) d2256;
agar a5306; carboxymethylcellulose c4888; a-cellulose c8002.kFor composition, see Table 2.{Federa (Brussels, Belgium).**Merck (Darmstadt, Germany) 8337·5000.††Cereal (Beerzel, Belgium).‡‡Supplied the following (to provide g/kg premix): retinyl acetate (1 500 000 IU/g),
0·67; ascorbic acid, 120; cholecalciferol (4 000 000 IU/g), 0·1; tocopheryl acetate(1 000 IU/g), 34·2; phylloquinone, 2·2; thiamin, 5·6; riboflavin, 12; pyridoxine, 4·5;calcium-panthotenate, 14·1; p-aminobenzoic acid, 40; vitamin B12, 0·03; niacin,30; biotin, 0·1; choline chloride, 300; folic acid, 1·5; inositol, 50; canthaxanthin, 7;butylated hydroxytoluene, 1·5; butylated hydroxyanisole, 1·5; a-cellulose, 323·8.
§§Supplied the following (to provide g/kg mixture): CaHPO4·2H2O, 117·28;CaHPO4, 165·28; Ca(PO4)2·H2O, 236·03; NaHCO3, 100·44; Na2SO3, 0·011; KCl,108·61; NaCl, 143·49; KI, 0·218; MgCl2, 101·88; MnSO4·H2O, 1·75; FeSO4·7H2-
O, 13·51; CuSO4·5H2O, 0·435; ZnSO4·7H2O, 10·88.kkGrowth trial diets LP 0, 5 10 and 15 and HP 0, 5 10 and 15 were analysed in
duplicates.{{Digestibility trial diets LP and HP (26 g Lys/kg DM) were tested or analysed
in duplicates.
N. Bodin et al.38
British
Journal
ofNutrition
beginning of the experiment. After hatching, the fry were kept ina single tank and fed, to slight excess by an automatic feeder, anAquaBio Joosen-Luyckx (Turnhout, Belgium) commercial dietup to the start of the experiment. The daily mortality rate alwaysstayed below 0·1 %.
After 36 h of feed deprivation and immediately prior to theexperimental phase, the rainbow trout fry (mean initial body
weight 0·78 (SD 0·01) g) were randomly distributed betweenthirty-four indoor aquaria (0·4 £ 0·24 £ 0·2 m) of 15 litres.There were sixty fish per aquarium and each experimentaldiet was randomly allocated to one aquarium (n 1). Thus, foreach dietary protein level (LP and HP), there was one aquariumfor every tested dietary Lys concentration. To serve as initialsamples, the fish of two randomly chosen aquaria were weighed,anaesthetised with excess ethylene glycol monophenylether, counted and kept frozen (2208C) until chemical analysis.Optimum conditions were maintained throughout the entireexperiment as the aquaria were continuously aerated andsupplied with freshwater (1 l/min) at 14·5–15·58C. The fishwere exposed to a photoperiod of 8 h of darkness and 16 h oflight (100 lux measured at the water surface).
The fish were fed for 31 d, twice daily, at 09.00 and22.00 hours, for three periods of 11, 10 and 10 d each. Theduration of the experiment was chosen to ensure a triplingin body weight for the groups receiving a slightly sub-optimalLys level (LP6 and HP6 and above). The fish were carefullyfed manually to apparent satiety, which allowed the amountof feed distributed to each aquarium to be recorded aftereach meal. During the meals, it was ensured that the fishate the pellets within a maximum of 15 s of contact with thewater in order to minimise the leaching of nutrients into thewater. Mortality, if present, was recorded daily. At the endof the experiment and after 72 h of food deprivation, the fishin each aquarium were weighed together, anaesthetised withexcess ethylene glycol monophenyl ether, counted andfrozen (2208C). Initial and final fish whole bodies werefreeze-dried, homogenised (Grindomix GM 200; Retsch,Haan, Germany) and kept frozen (2208C) until chemicalanalysis.
Table 3. Crude protein (g nitrogen £ 6·25/kg) and amino acid (g/kg DM) content analysed in reference diets for rainbow trout fry
Diets. . . LP0 LP5 LP10 LP15 HP0 HP5 HP10 HP15 Recommended values§
g N £ 6·25/kg 323 313 319 302 477 474 477 458g/kg DM
Arg 21·3 22·1 21·1 19·4 32·1 39·4 31·9 29·0 15His 10·1 10·9 10·4 9·5 15·1 18·2 15·0 15·2 7Ile 14·5 14·9 14·5 13·4 20·2 24·9 21·4 20·9 9Leu 22·3 22·4 23·9 21·4 24·1 33·4 30·2 28·5 14Lys 1·9 13·5 23·3 44·4 2·4 22·9 33·8 73·6 18Met 11·4 11·5 11·4 10·8 17·3 19·1 17·4 17·3 10kCys 1·5 1·8 1·2 1·1 3·0 2·8 2·8 2·6Phe 14·7 16·0 15·2 14·0 21·4 26·1 22·8 22·2 18{Tyr 11·1 12·1 11·4 10·8 16·9 21·4 17·3 17·7Thr 15·2 16·7 15·7 14·5 23·5 27·8 23·1 23·7 8Trp** 3·0 3·0 3·0 3·0 4·5 4·5 4·5 4·5 2Val 16·5 17·5 16·5 15·6 24·2 29·7 24·3 24·9 12Asp 32·4 30·0 25·7 19·8 48·2 51·0 40·0 31·6 –Glu 69·7 67·2 61·1 47·7 100·2 108·5 87·7 72·8 –Ala 23·3 21·2 18·2 13·4 35·6 36·3 28·3 21·5 –Gly 25·4 23·7 21·4 15·5 38·5 39·5 31·7 25·1 –Pro 22·2 22·9 18·5 19·0 31·9 36·6 26·6 22·2 –Ser 14·5 15·4 12·8 9·2 23·0 23·1 19·3 15·2 –Total IAA 203·1 268·6 242·9 278·5 145·2 163·8 169·1 179·5Total DAA 277·5 295·0 233·6 188·4 187·5 180·4 157·6 124·5100 £ NIAA:Ntotal 42·3 47·7 51·0 59·6 43·6 47·6 51·8 59·0
DAA, dispensable amino acid; HP, high-protein diet; IAA, indispensable amino acid; LP, low-protein diet.§ According to the National Research Council(27).kMethionine þ cystine.{Phenylalanine þ tyrosine.** Tryptophan could not be determined with the amino acid analysis method used. Values presented are calculated from the ingredients.
Table 2. Composition of L-amino acid mixtures (g/kg DM) used in thelow-protein (LP) and high-protein (HP) experimental diets§
Diets. . . LP0 to LP15 HP0 to HP15
Arg 16·6 25·3His 7·3 11·2Ile 9·8 15·0Leu 16·8 25·7Lys.HCl 0–56·6 0–84·9Met 9·3 14·2Cys 0 0Phe 8·4 12·8Tyr 7·3 11·1Thr 12·3 18·8Trp 2·9 4·5Val 11·9 18·2Ala 10·5–18·3 16·2–27·9Asp 7·9–13·8 12·3–21·1Asn.H2O 9·8–15·7 15·1–24·0Glu 1·4–9·9 0·2–12·9Gln 1·4–9·9 0·2–12·9Gly 12·2–21·5 8·9–32·7Pro 1·4–7·2 0·06–8·7Ser 4·6–10·1 7·2–15·5Sum 208·7–209·1 311·9–312·5
§Ajinomoto Ltd (Tokyo, Japan).
Protein level and trout lysine requirements 39
British
Journal
ofNutrition
Digestibility trial
A digestibility trial permitted the assessment of nutrient appar-ent digestibility for the experimental diets. LP diets werereground and mixed together in proportions so as to obtain aLys concentration of 26 g Lys/kg DM. The same procedurewas carried out with the HP diets in order to obtain one dietwith a Lys level of 26 g Lys/kg DM. Chromic oxide servedas the indigestible marker and was added at 10 g/kg in bothdiets. The diets were pelleted using a pellet mill (5 mm diam-eter) and stored at 2208C.
Four groups of thirteen rainbow trout, weighing an averageof 320 g per fish, were randomly allocated to four circulartanks with a water temperature of 14·4–15·88C and a waterflow of 4 l/min. The two diets (LP and HP) were each dis-pensed in two randomly chosen tanks. After an adaptationperiod of 3 d to the respective experimental diets and a fastingperiod of 4 d, the fish were under experiment for 16 d. Faeceswere collected continuously with a rotating automatic faecescollector system(30) that ensures minimum contact of thefaeces with the water. The exiting water carrying the faeceswas filtered directly and continuously. Once a day we col-lected faeces from the trays and then fed the fish. Feed wascollected in a basket for 1 h after feeding to prevent it fromcontaminating the faeces produced during that day. All thefaeces collected per tank were mixed together, freeze-dried,ground and stored at 2208C until analysis.
Sampling and chemical analysis
For the dose–response trial, the diets and fish were analysedfor DM, crude protein (N £ 6·25), crude ash and AA content(Tables 1 and 3). Proximate analyses of the samples were con-ducted as previously reported(31). The same analyses were per-formed for the diets and faeces of the digestibility trial, as wellas the determination of chromium III (trivalent) that involvesdigestion of organic matter, solubilisation of chromium anddetermination of chromium by simple photometry(32,33).The crude energy content of the diets and of the faeces wasdetermined with a bomb calorimeter (1241 Oxygen BombCalorimeter; Parr Instrument Company, IL, USA).
Calculations
The initial variables that were obtained or measured directlyduring and after the experiment were the following: DI is thedry diet intake per fish (g DM/fish) during the experimentalperiod; NI is the N intake per fish (g N/fish); LysI is the Lysintake (g/kg MBW per d); n is the mean number of fish peraquarium, obtained by summing the number of fish per aquariumat the beginning and at the end of the experiment and then divid-ing by 2; Wf and Wi are the average final and initial fresh bodyweights (g) per fish; feedingd is the number of feeding days (31for the present experiment); Nf and Ni are the mean N contents ofthe whole-body fry at the end and at the beginning of the exper-imental period (g N/g); mean MBW (in kg0·75/fish) was calcu-lated as ((Wf/1000)0·75 þ (Wi/1000)0·75)/2; Lysf and Lysi
are the Lys contents (in g/g total AA) of the whole-body fishproteins at the end and at the beginning of the experiment,respectively.
The following response criteria were calculated:
Daily growth coefficient ðg1=3 per d; £ 1000Þ
¼ 1000 £ ðW1=3f 2 W
1=3i Þ=feedingd:
Feed efficiency ðg=g DMÞ ¼ ðWf 2 WiÞ=DI:
Protein productive value ðPPVÞ ð%Þ
¼ ðWf £ Nf 2 Wi £ NiÞ=NI:
Feed intake ðgDM=kg MBW per dÞ ¼ DI=ðMBW £ feedingdÞ:
Body weight gain ðg=kg MBW per dÞ
¼ ðWf 2 WiÞ=ðMBW £ feedingdÞ:
Protein gain ðg=kg MBW per dÞ ¼
6·25 £ ðWf £ Nf 2 Wi £ NiÞ=ðMBW £ feedingdÞ:
Protein in weight gain ðg=kgÞ ¼
ð1000 £ protein gainÞ=body weight gain:
Fat gain ðg=kg MBW per dÞ ¼
ðWf £ LIPf 2 Wi £ LIPiÞ=ðMBW £ feedingdÞ:
LIP is the lipid content in g/g body weight and it wascalculated as:
LIP ¼ 1 2 water content ðg=g body weightÞ
2 ash ðg=g body weightÞ2 protein content ðgN
£ 6·25=g body weightÞ:
Fat in weight gain ðg=kgÞ ¼
ð1000 £ fat gainÞ=body weight gain:
Lys gain ðg Lys=kg MBW per dÞ
¼ 6·25 £ ðWf £ Nf £ Lysf 2 Wi £ Ni £ LysiÞ=ðMBW
£ feedingdÞ:
Lys retention efficiency above maintenance ¼ the slope ofthe linear relationship between Lys gain and Lys intake atmarginal dietary Lys concentrations (#10 g/kg DM)(34,35).
Lys retention efficiency ð%Þ ¼ 100 £ ðLys gain=LysIÞ:
E is the Lys maintenance requirement in g/kg MBW per d.It was calculated as the x-intercept of the linear relationshipbetween Lys intake (g Lys/kg MBW per d) and Lys gain
N. Bodin et al.40
British
Journal
ofNutrition
(g Lys/kg MBW per d).
Lys efficiency of utilisation ð%Þ ¼
100 £ ððLys gain þ EÞ=LysIÞ:
Data analysis
The linear model used was the BLM of Robbins et al. (23):
Y ¼ P þ U £ ðX 2 RÞ £ Z þ 1;
where Y is the response criterion; P is the plateau value; R isthe requirement; X is the independent variable (Lys dietaryconcentration in g/kg DM or Lys intake in g/kg MBWper d); U is the slope of the line; Z is a categorical variablewhich equals 1 when X , R and equals 0 otherwise; 1 is theerror term.
The x-intercept, I, is calculated as R 2 P/U. The Lys effi-ciency of utilisation was modelled with an inverse BLMwhich differs from the BLM in that Z equals 1 when X . Rand equals 0 otherwise.
The non-linear model used was the SKM-4(24,36,37):
Y ¼ ðððb £ knÞ þ ðymax £ XnÞÞ=ðkn þ XnÞÞ þ 1;
where X is the independent variable (Lys intake or Lys dietaryconcentration); Y is the response criterion; b is the intercepton the y-axis (for x ¼ 0); k is the concentration for ymax/2;n is the apparent kinetic order; ymax is the maximum response;1 is the error term.
Three particular intake levels of interest are the intake atmaximum slope (Xms), the intake of maximum efficiency(Xme), and the intake of zero response (I) which is only poss-ible to calculate if b , 0(36):
Xms ¼ k £ ððn � 1Þ=ðn þ 1ÞÞ1=n;
Xme ¼ k £ ðn � 1Þ1=n;
I ¼ k £ ð2b=ymaxÞ1=n;
The Lys requirement was estimated at 0·95ymax and0·90ymax
(38).Lys retention efficiency was modelled with the polynomial
model of Heger & Frydrych(39):
Y ¼ a £ X21 þ b þ c £ X þ d £ X2 þ 1;
where a, b, c and d are unknown coefficients.Lys efficiency of utilisation was modelled with a composite
model based on the BLM(23) and the inverse exponentialmodel(38).
Y ¼ ða þ b £ X £ expð2c £ XÞÞ £ ðZ 2 1Þ2 þ d £ Z þ 1;
where a, b, c and d are unknown coefficients; Z is a categori-cal variable applied separately for each Lys dose, it equals 1when X is less than the breakpoint and equals 0 otherwise.
The model parameters were estimated by a classical leastsquares method for linear models and by iterative leastsquares procedures for non-linear and composite models.Calculations were carried out with the R statistical softwarepackage version 2.5.0 (University of Auckland, Auckland,New Zealand) and JMP statistical software package version
7 (SAS Institute, Cary, NC, USA)(40). The level of significancechosen was P,0·05. Models involving the two protein levels(HP and LP) were always estimated independently. Modelparameters comparison was done with a Student’s t test forclassical cases and through bootstrap procedures when classi-cal tests were not directly available. This was, for example,the case in the estimation of the difference between the Lysrequirement for HP and LP protein levels: a bootstrap pro-cedure(41) on models residuals was applied to build 95 % CIon this difference.
Results
Digestibility trial
The proximate analyses of the experimental LP and HPdiets for the digestibility trial (26 g Lys/kg DM) are foundin Table 1. LP and HP diets did not have significantlydifferent apparent digestible coefficient (ADC) valuesfor Lys (mean 99·3 (SE 0·12) %) or for ash (mean 53·2(SE 0·68) %). Because the Lys apparent digestible coefficientvalue was 99 %, the Lys of the LP and HP diets was con-sidered completely absorbed and available for the trout fryin the present experiment. The apparent digestible coeffi-cient values were significantly different for crude protein(98·0 (SE 0·09) % for LP; 98·7 (SE 0·09) % for HP), DM(88·4 (SE 0·35) % for LP; 91·8 (SE 0·35) % for HP), andcrude energy (92·0 (SE 0·32) % for LP; 94·9 (SE 0·32) %for HP). Thus, digestible protein and digestible energy con-tents were of about 310 g/kg DM and 22 MJ/kg DM for LPdiets and 469 g/kg DM and 23 MJ/kg DM for HP diets(Table 1). The differences in digestible energy contentwere considered minor, and the differences in digestibleprotein content were adequate for the purpose of theexperiment.
Dose–response trial
In the dose–response trial, fry fed LP6 to LP15 diets or HP5to HP15 diets increased their mean initial body weight (0·78 g/fish) by a factor of at least three by the end of the experiment(Table 4), thus showing good growth rates despite high con-centrations of crystalline AA in the diets (66·4 % of crude pro-tein for both LP and HP diets). A high mean mortality ofthirteen fish per aquarium (22 %) was observed for the twodiets with the lowest Lys concentrations at both proteinlevels (LP0, LP1, HP0, HP1). For the diets LP2 to LP15and HP2 to HP15 the average mortality was of only one fishper aquarium (1·7 %).
Body weight gain, daily growth coefficient, feed efficiency,PPV, DM intake, protein gain and Lys gain (Table 4) were allplotted against the Lys dietary concentration and were fittedwith the SKM-4 non-linear model (best fit model, seeTable 5 for parameter values for body weight gain, proteingain and Lys gain). The ymax parameter was found to besignificantly different between LP and HP diets for all criteria.For body weight gain, protein gain and Lys gain, the HP dietshad a significantly greater ymax and inversely, for DM intakeand PPV, it was the LP diets that had a significantly higherymax (results not shown).
Protein level and trout lysine requirements 41
British
Journal
ofNutrition
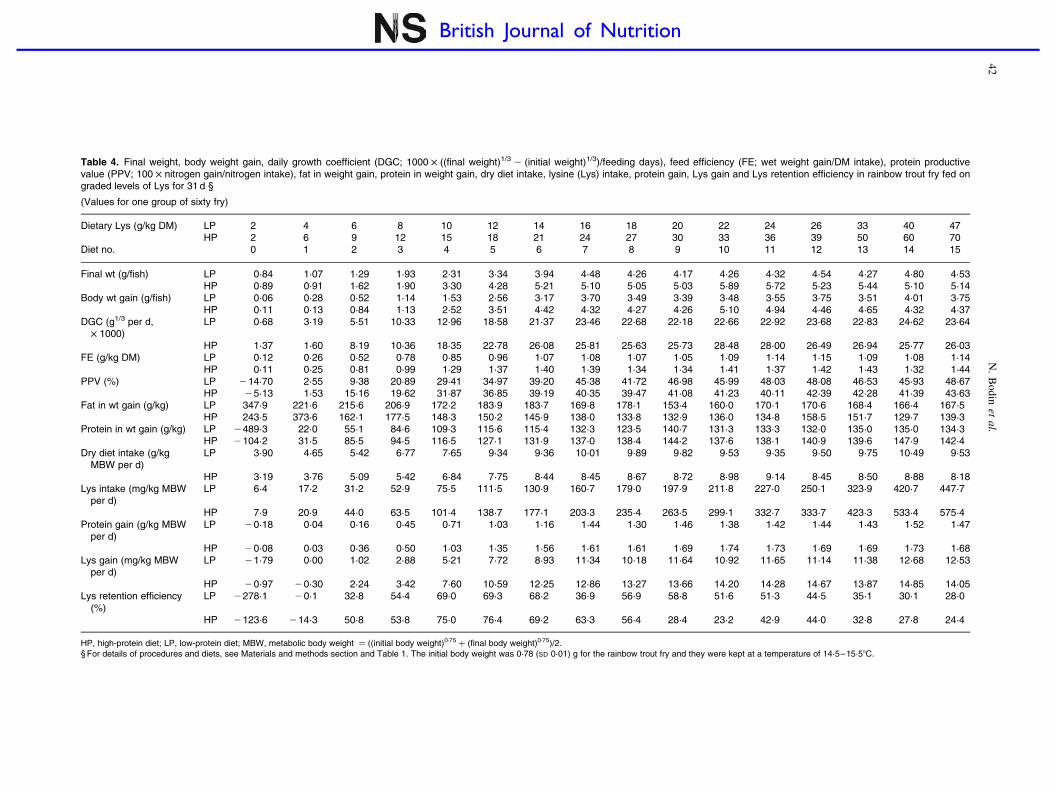
Table 4. Final weight, body weight gain, daily growth coefficient (DGC; 1000 £ ((final weight)1/3 2 (initial weight)1/3)/feeding days), feed efficiency (FE; wet weight gain/DM intake), protein productivevalue (PPV; 100 £ nitrogen gain/nitrogen intake), fat in weight gain, protein in weight gain, dry diet intake, lysine (Lys) intake, protein gain, Lys gain and Lys retention efficiency in rainbow trout fry fed ongraded levels of Lys for 31 d §
(Values for one group of sixty fry)
Dietary Lys (g/kg DM) LP 2 4 6 8 10 12 14 16 18 20 22 24 26 33 40 47HP 2 6 9 12 15 18 21 24 27 30 33 36 39 50 60 70
Diet no. 0 1 2 3 4 5 6 7 8 9 10 11 12 13 14 15
Final wt (g/fish) LP 0·84 1·07 1·29 1·93 2·31 3·34 3·94 4·48 4·26 4·17 4·26 4·32 4·54 4·27 4·80 4·53HP 0·89 0·91 1·62 1·90 3·30 4·28 5·21 5·10 5·05 5·03 5·89 5·72 5·23 5·44 5·10 5·14
Body wt gain (g/fish) LP 0·06 0·28 0·52 1·14 1·53 2·56 3·17 3·70 3·49 3·39 3·48 3·55 3·75 3·51 4·01 3·75HP 0·11 0·13 0·84 1·13 2·52 3·51 4·42 4·32 4·27 4·26 5·10 4·94 4·46 4·65 4·32 4·37
DGC (g1/3 per d,£ 1000)
LP 0·68 3·19 5·51 10·33 12·96 18·58 21·37 23·46 22·68 22·18 22·66 22·92 23·68 22·83 24·62 23·64
HP 1·37 1·60 8·19 10·36 18·35 22·78 26·08 25·81 25·63 25·73 28·48 28·00 26·49 26·94 25·77 26·03FE (g/kg DM) LP 0·12 0·26 0·52 0·78 0·85 0·96 1·07 1·08 1·07 1·05 1·09 1·14 1·15 1·09 1·08 1·14
HP 0·11 0·25 0·81 0·99 1·29 1·37 1·40 1·39 1·34 1·34 1·41 1·37 1·42 1·43 1·32 1·44PPV (%) LP 214·70 2·55 9·38 20·89 29·41 34·97 39·20 45·38 41·72 46·98 45·99 48·03 48·08 46·53 45·93 48·67
HP 25·13 1·53 15·16 19·62 31·87 36·85 39·19 40·35 39·47 41·08 41·23 40·11 42·39 42·28 41·39 43·63Fat in wt gain (g/kg) LP 347·9 221·6 215·6 206·9 172·2 183·9 183·7 169·8 178·1 153·4 160·0 170·1 170·6 168·4 166·4 167·5
HP 243·5 373·6 162·1 177·5 148·3 150·2 145·9 138·0 133·8 132·9 136·0 134·8 158·5 151·7 129·7 139·3Protein in wt gain (g/kg) LP 2489·3 22·0 55·1 84·6 109·3 115·6 115·4 132·3 123·5 140·7 131·3 133·3 132·0 135·0 135·0 134·3
HP 2104·2 31·5 85·5 94·5 116·5 127·1 131·9 137·0 138·4 144·2 137·6 138·1 140·9 139·6 147·9 142·4Dry diet intake (g/kgMBW per d)
LP 3·90 4·65 5·42 6·77 7·65 9·34 9·36 10·01 9·89 9·82 9·53 9·35 9·50 9·75 10·49 9·53
HP 3·19 3·76 5·09 5·42 6·84 7·75 8·44 8·45 8·67 8·72 8·98 9·14 8·45 8·50 8·88 8·18Lys intake (mg/kg MBWper d)
LP 6·4 17·2 31·2 52·9 75·5 111·5 130·9 160·7 179·0 197·9 211·8 227·0 250·1 323·9 420·7 447·7
HP 7·9 20·9 44·0 63·5 101·4 138·7 177·1 203·3 235·4 263·5 299·1 332·7 333·7 423·3 533·4 575·4Protein gain (g/kg MBWper d)
LP 20·18 0·04 0·16 0·45 0·71 1·03 1·16 1·44 1·30 1·46 1·38 1·42 1·44 1·43 1·52 1·47
HP 20·08 0·03 0·36 0·50 1·03 1·35 1·56 1·61 1·61 1·69 1·74 1·73 1·69 1·69 1·73 1·68Lys gain (mg/kg MBWper d)
LP 21·79 0·00 1·02 2·88 5·21 7·72 8·93 11·34 10·18 11·64 10·92 11·65 11·14 11·38 12·68 12·53
HP 20·97 20·30 2·24 3·42 7·60 10·59 12·25 12·86 13·27 13·66 14·20 14·28 14·67 13·87 14·85 14·05Lys retention efficiency(%)
LP 2278·1 20·1 32·8 54·4 69·0 69·3 68·2 36·9 56·9 58·8 51·6 51·3 44·5 35·1 30·1 28·0
HP 2123·6 214·3 50·8 53·8 75·0 76·4 69·2 63·3 56·4 28·4 23·2 42·9 44·0 32·8 27·8 24·4
HP, high-protein diet; LP, low-protein diet; MBW, metabolic body weight ¼ ((initial body weight)0·75 þ (final body weight)0·75)/2.§For details of procedures and diets, see Materials and methods section and Table 1. The initial body weight was 0·78 (SD 0·01) g for the rainbow trout fry and they were kept at a temperature of 14·5–15·58C.
N.
Bo
din
etal.
42
British Journal of Nutrition
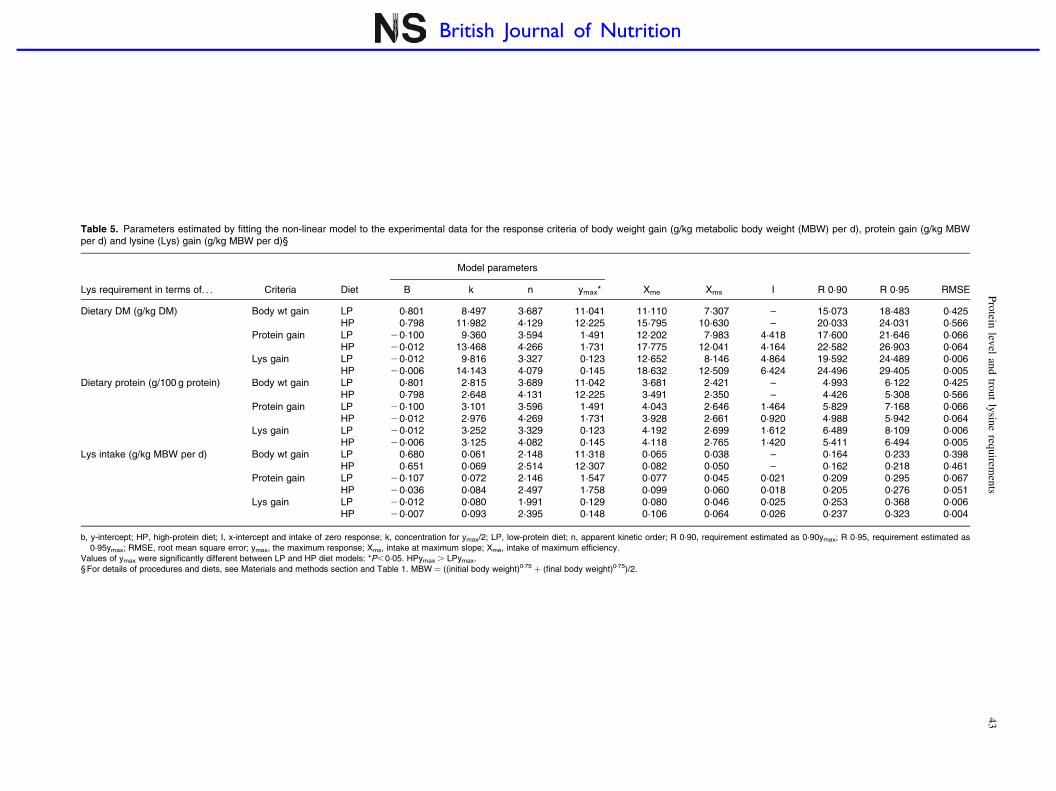
Table 5. Parameters estimated by fitting the non-linear model to the experimental data for the response criteria of body weight gain (g/kg metabolic body weight (MBW) per d), protein gain (g/kg MBWper d) and lysine (Lys) gain (g/kg MBW per d)§
Model parameters
Lys requirement in terms of. . . Criteria Diet B k n ymax* Xme Xms I R 0·90 R 0·95 RMSE
Dietary DM (g/kg DM) Body wt gain LP 0·801 8·497 3·687 11·041 11·110 7·307 – 15·073 18·483 0·425HP 0·798 11·982 4·129 12·225 15·795 10·630 – 20·033 24·031 0·566
Protein gain LP 20·100 9·360 3·594 1·491 12·202 7·983 4·418 17·600 21·646 0·066HP 20·012 13·468 4·266 1·731 17·775 12·041 4·164 22·582 26·903 0·064
Lys gain LP 20·012 9·816 3·327 0·123 12·652 8·146 4·864 19·592 24·489 0·006HP 20·006 14·143 4·079 0·145 18·632 12·509 6·424 24·496 29·405 0·005
Dietary protein (g/100 g protein) Body wt gain LP 0·801 2·815 3·689 11·042 3·681 2·421 – 4·993 6·122 0·425HP 0·798 2·648 4·131 12·225 3·491 2·350 – 4·426 5·308 0·566
Protein gain LP 20·100 3·101 3·596 1·491 4·043 2·646 1·464 5·829 7·168 0·066HP 20·012 2·976 4·269 1·731 3·928 2·661 0·920 4·988 5·942 0·064
Lys gain LP 20·012 3·252 3·329 0·123 4·192 2·699 1·612 6·489 8·109 0·006HP 20·006 3·125 4·082 0·145 4·118 2·765 1·420 5·411 6·494 0·005
Lys intake (g/kg MBW per d) Body wt gain LP 0·680 0·061 2·148 11·318 0·065 0·038 – 0·164 0·233 0·398HP 0·651 0·069 2·514 12·307 0·082 0·050 – 0·162 0·218 0·461
Protein gain LP 20·107 0·072 2·146 1·547 0·077 0·045 0·021 0·209 0·295 0·067HP 20·036 0·084 2·497 1·758 0·099 0·060 0·018 0·205 0·276 0·051
Lys gain LP 20·012 0·080 1·991 0·129 0·080 0·046 0·025 0·253 0·368 0·006HP 20·007 0·093 2·395 0·148 0·106 0·064 0·026 0·237 0·323 0·004
b, y-intercept; HP, high-protein diet; I, x-intercept and intake of zero response; k, concentration for ymax/2; LP, low-protein diet; n, apparent kinetic order; R 0·90, requirement estimated as 0·90ymax; R 0·95, requirement estimated as0·95ymax; RMSE, root mean square error; ymax, the maximum response; Xms, intake at maximum slope; Xme, intake of maximum efficiency.
Values of ymax were significantly different between LP and HP diet models: *P,0·05. HPymax . LPymax.§For details of procedures and diets, see Materials and methods section and Table 1. MBW ¼ ((initial body weight)0·75 þ (final body weight)0·75)/2.
Pro
teinlev
elan
dtro
ut
lysin
ereq
uirem
ents
43
British Journal of Nutrition
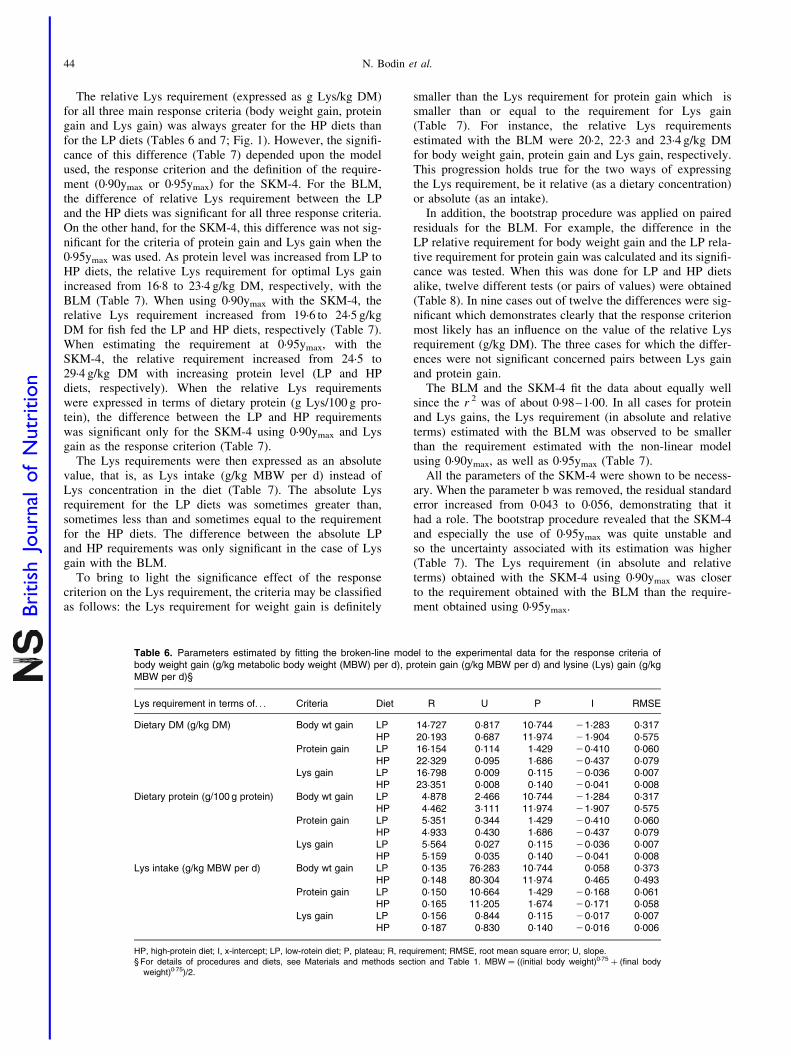
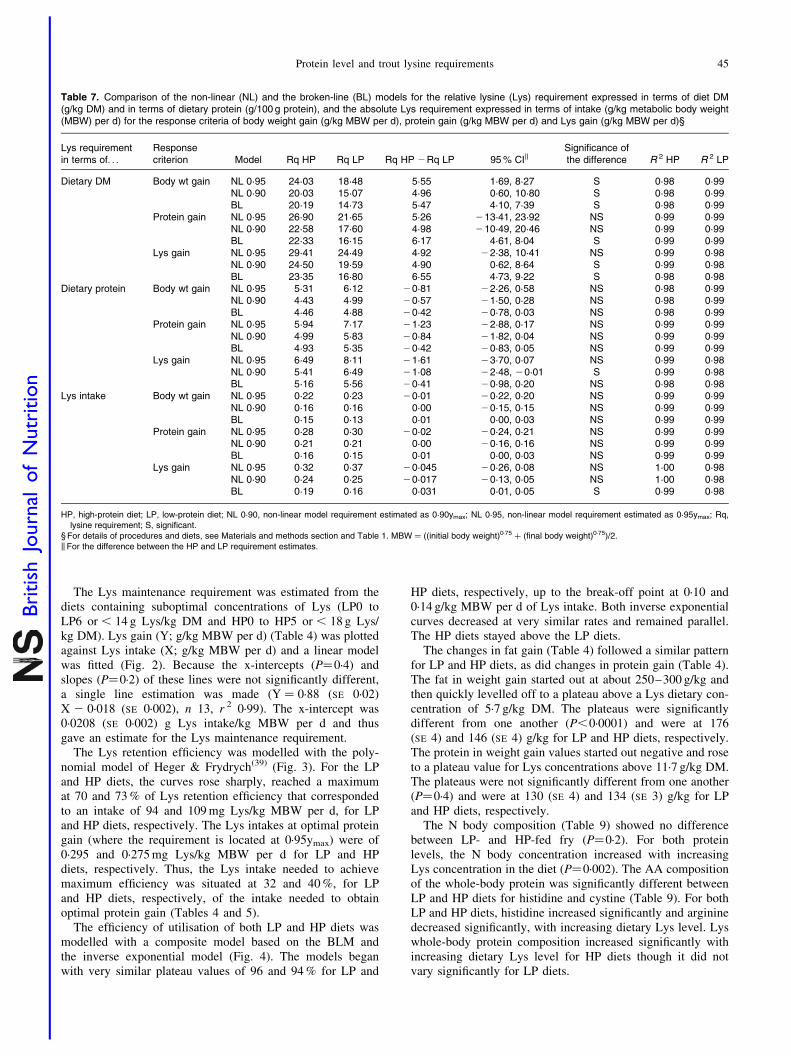
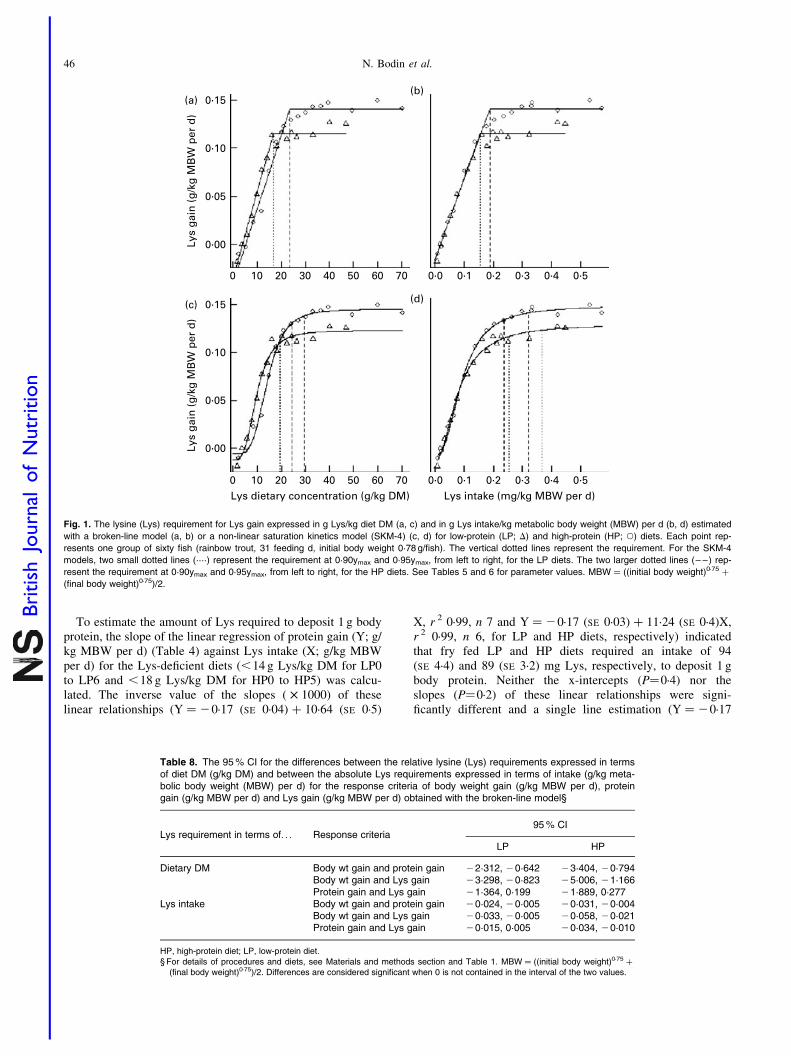
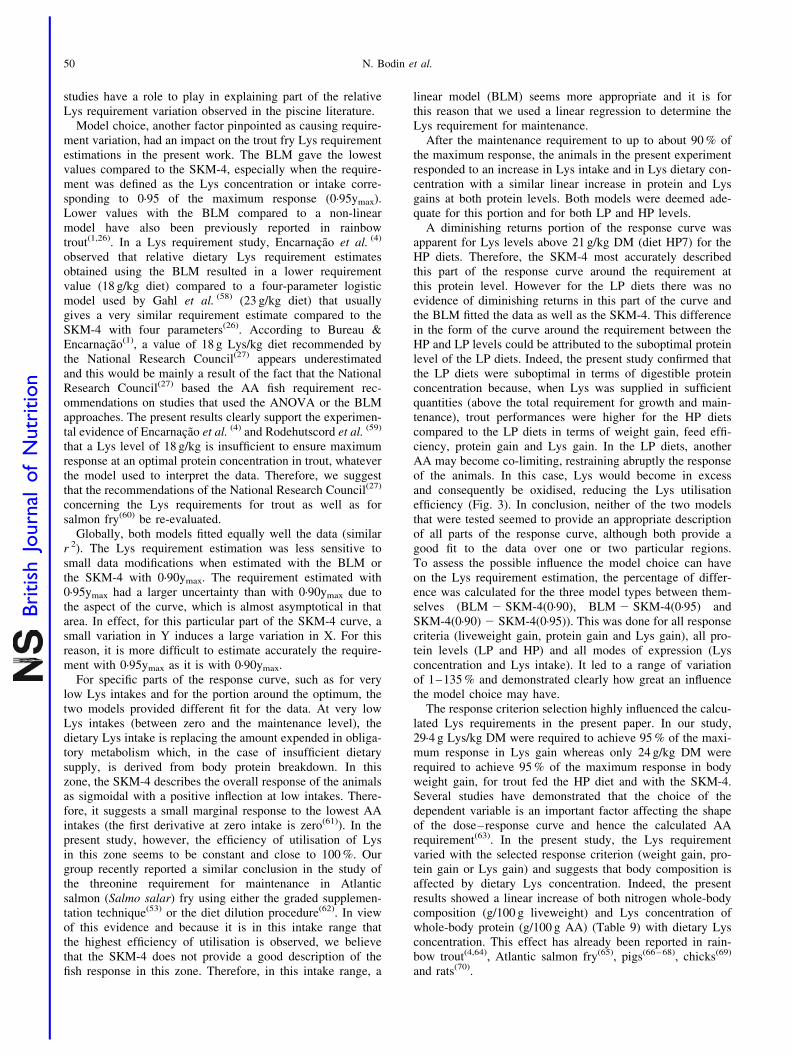
The relative Lys requirement (expressed as g Lys/kg DM)for all three main response criteria (body weight gain, proteingain and Lys gain) was always greater for the HP diets thanfor the LP diets (Tables 6 and 7; Fig. 1). However, the signifi-cance of this difference (Table 7) depended upon the modelused, the response criterion and the definition of the require-ment (0·90ymax or 0·95ymax) for the SKM-4. For the BLM,the difference of relative Lys requirement between the LPand the HP diets was significant for all three response criteria.On the other hand, for the SKM-4, this difference was not sig-nificant for the criteria of protein gain and Lys gain when the0·95ymax was used. As protein level was increased from LP toHP diets, the relative Lys requirement for optimal Lys gainincreased from 16·8 to 23·4 g/kg DM, respectively, with theBLM (Table 7). When using 0·90ymax with the SKM-4, therelative Lys requirement increased from 19·6 to 24·5 g/kgDM for fish fed the LP and HP diets, respectively (Table 7).When estimating the requirement at 0·95ymax, with theSKM-4, the relative requirement increased from 24·5 to29·4 g/kg DM with increasing protein level (LP and HPdiets, respectively). When the relative Lys requirementswere expressed in terms of dietary protein (g Lys/100 g pro-tein), the difference between the LP and HP requirementswas significant only for the SKM-4 using 0·90ymax and Lysgain as the response criterion (Table 7).
The Lys requirements were then expressed as an absolutevalue, that is, as Lys intake (g/kg MBW per d) instead ofLys concentration in the diet (Table 7). The absolute Lysrequirement for the LP diets was sometimes greater than,sometimes less than and sometimes equal to the requirementfor the HP diets. The difference between the absolute LPand HP requirements was only significant in the case of Lysgain with the BLM.
To bring to light the significance effect of the responsecriterion on the Lys requirement, the criteria may be classifiedas follows: the Lys requirement for weight gain is definitely
smaller than the Lys requirement for protein gain which issmaller than or equal to the requirement for Lys gain(Table 7). For instance, the relative Lys requirementsestimated with the BLM were 20·2, 22·3 and 23·4 g/kg DMfor body weight gain, protein gain and Lys gain, respectively.This progression holds true for the two ways of expressingthe Lys requirement, be it relative (as a dietary concentration)or absolute (as an intake).
In addition, the bootstrap procedure was applied on pairedresiduals for the BLM. For example, the difference in theLP relative requirement for body weight gain and the LP rela-tive requirement for protein gain was calculated and its signifi-cance was tested. When this was done for LP and HP dietsalike, twelve different tests (or pairs of values) were obtained(Table 8). In nine cases out of twelve the differences were sig-nificant which demonstrates clearly that the response criterionmost likely has an influence on the value of the relative Lysrequirement (g/kg DM). The three cases for which the differ-ences were not significant concerned pairs between Lys gainand protein gain.
The BLM and the SKM-4 fit the data about equally wellsince the r 2 was of about 0·98–1·00. In all cases for proteinand Lys gains, the Lys requirement (in absolute and relativeterms) estimated with the BLM was observed to be smallerthan the requirement estimated with the non-linear modelusing 0·90ymax, as well as 0·95ymax (Table 7).
All the parameters of the SKM-4 were shown to be necess-ary. When the parameter b was removed, the residual standarderror increased from 0·043 to 0·056, demonstrating that ithad a role. The bootstrap procedure revealed that the SKM-4and especially the use of 0·95ymax was quite unstable andso the uncertainty associated with its estimation was higher(Table 7). The Lys requirement (in absolute and relativeterms) obtained with the SKM-4 using 0·90ymax was closerto the requirement obtained with the BLM than the require-ment obtained using 0·95ymax.
Table 6. Parameters estimated by fitting the broken-line model to the experimental data for the response criteria ofbody weight gain (g/kg metabolic body weight (MBW) per d), protein gain (g/kg MBW per d) and lysine (Lys) gain (g/kgMBW per d)§
Lys requirement in terms of. . . Criteria Diet R U P I RMSE
Dietary DM (g/kg DM) Body wt gain LP 14·727 0·817 10·744 21·283 0·317HP 20·193 0·687 11·974 21·904 0·575
Protein gain LP 16·154 0·114 1·429 20·410 0·060HP 22·329 0·095 1·686 20·437 0·079
Lys gain LP 16·798 0·009 0·115 20·036 0·007HP 23·351 0·008 0·140 20·041 0·008
Dietary protein (g/100 g protein) Body wt gain LP 4·878 2·466 10·744 21·284 0·317HP 4·462 3·111 11·974 21·907 0·575
Protein gain LP 5·351 0·344 1·429 20·410 0·060HP 4·933 0·430 1·686 20·437 0·079
Lys gain LP 5·564 0·027 0·115 20·036 0·007HP 5·159 0·035 0·140 20·041 0·008
Lys intake (g/kg MBW per d) Body wt gain LP 0·135 76·283 10·744 0·058 0·373HP 0·148 80·304 11·974 0·465 0·493
Protein gain LP 0·150 10·664 1·429 20·168 0·061HP 0·165 11·205 1·674 20·171 0·058
Lys gain LP 0·156 0·844 0·115 20·017 0·007HP 0·187 0·830 0·140 20·016 0·006
HP, high-protein diet; I, x-intercept; LP, low-rotein diet; P, plateau; R, requirement; RMSE, root mean square error; U, slope.§ For details of procedures and diets, see Materials and methods section and Table 1. MBW ¼ ((initial body weight)0·75 þ (final body
weight)0·75)/2.
N. Bodin et al.44
British
Journal
ofNutrition
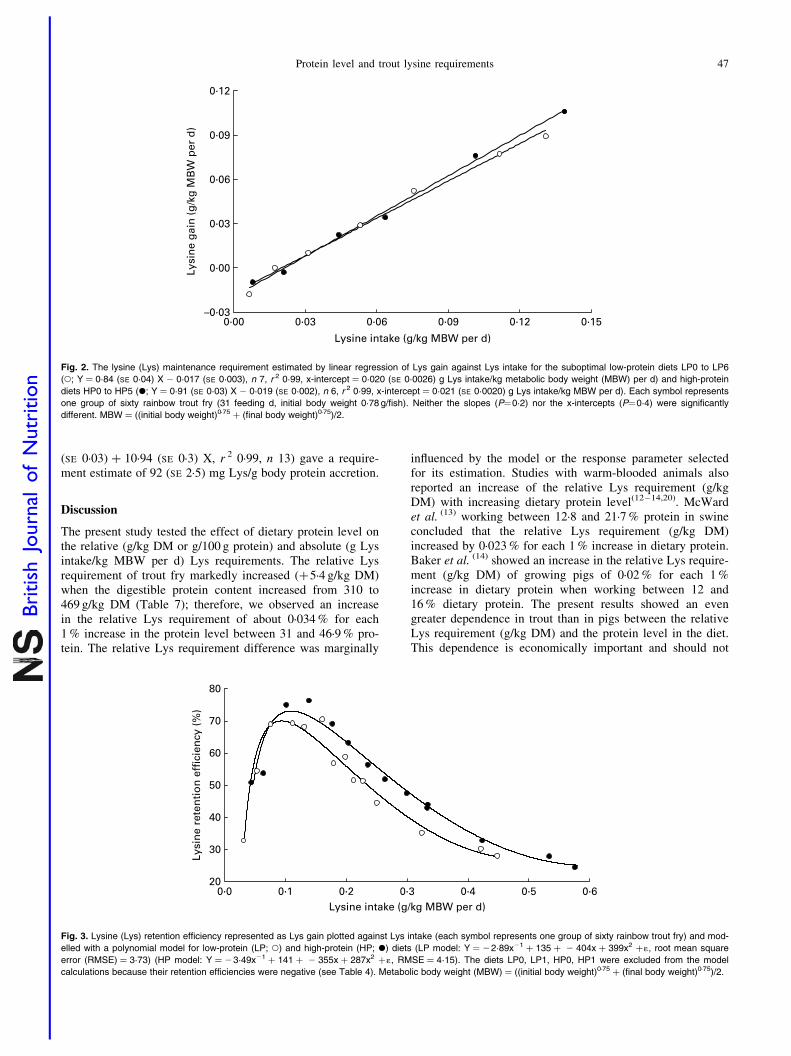
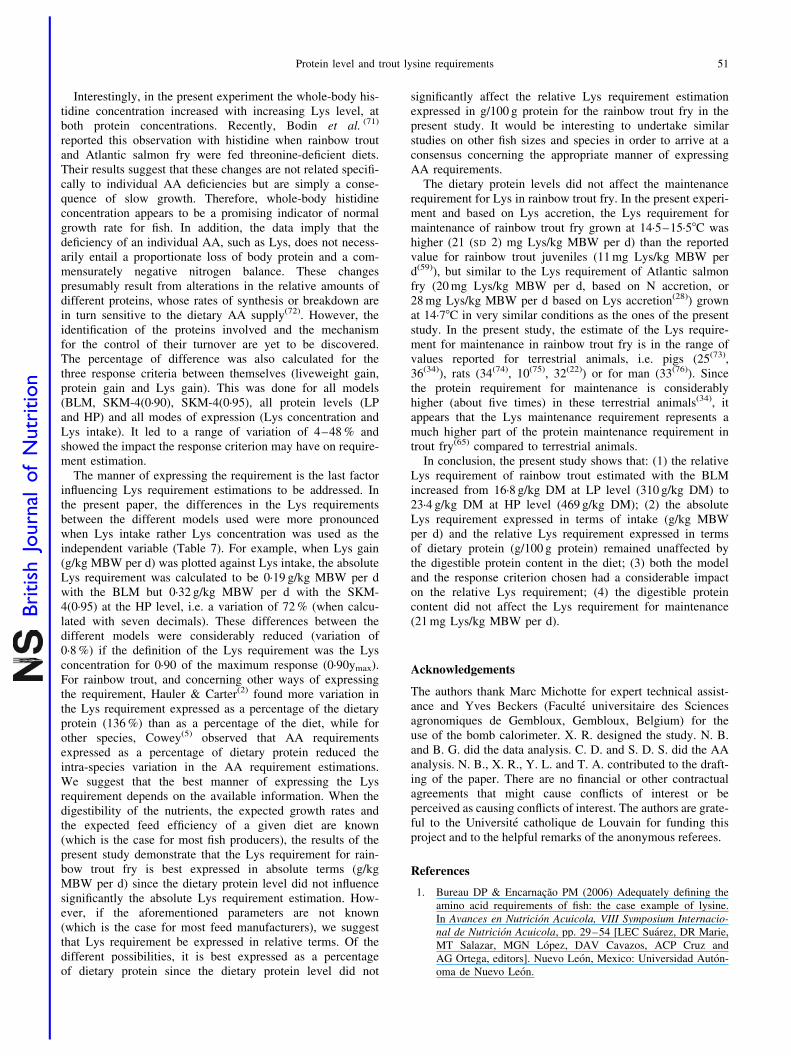
The Lys maintenance requirement was estimated from thediets containing suboptimal concentrations of Lys (LP0 toLP6 or , 14 g Lys/kg DM and HP0 to HP5 or , 18 g Lys/kg DM). Lys gain (Y; g/kg MBW per d) (Table 4) was plottedagainst Lys intake (X; g/kg MBW per d) and a linear modelwas fitted (Fig. 2). Because the x-intercepts (P¼0·4) andslopes (P¼0·2) of these lines were not significantly different,a single line estimation was made (Y ¼ 0·88 (SE 0·02)X 2 0·018 (SE 0·002), n 13, r 2 0·99). The x-intercept was0·0208 (SE 0·002) g Lys intake/kg MBW per d and thusgave an estimate for the Lys maintenance requirement.
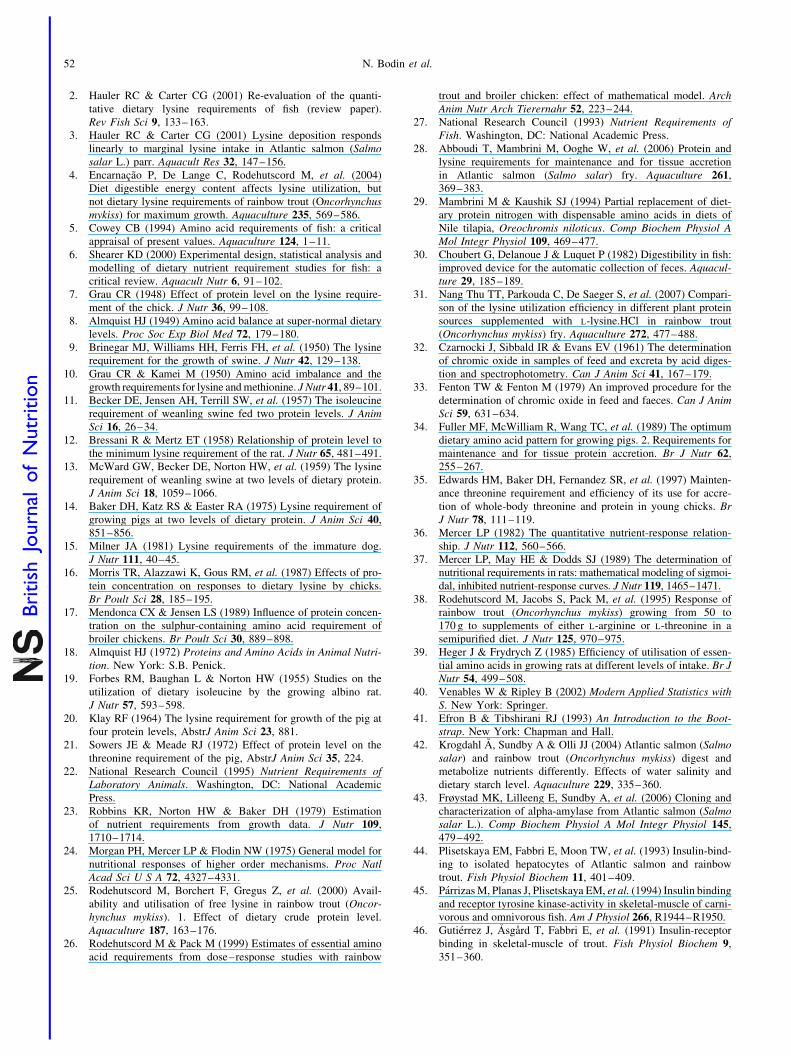
The Lys retention efficiency was modelled with the poly-nomial model of Heger & Frydrych(39) (Fig. 3). For the LPand HP diets, the curves rose sharply, reached a maximumat 70 and 73 % of Lys retention efficiency that correspondedto an intake of 94 and 109 mg Lys/kg MBW per d, for LPand HP diets, respectively. The Lys intakes at optimal proteingain (where the requirement is located at 0·95ymax) were of0·295 and 0·275 mg Lys/kg MBW per d for LP and HPdiets, respectively. Thus, the Lys intake needed to achievemaximum efficiency was situated at 32 and 40 %, for LPand HP diets, respectively, of the intake needed to obtainoptimal protein gain (Tables 4 and 5).
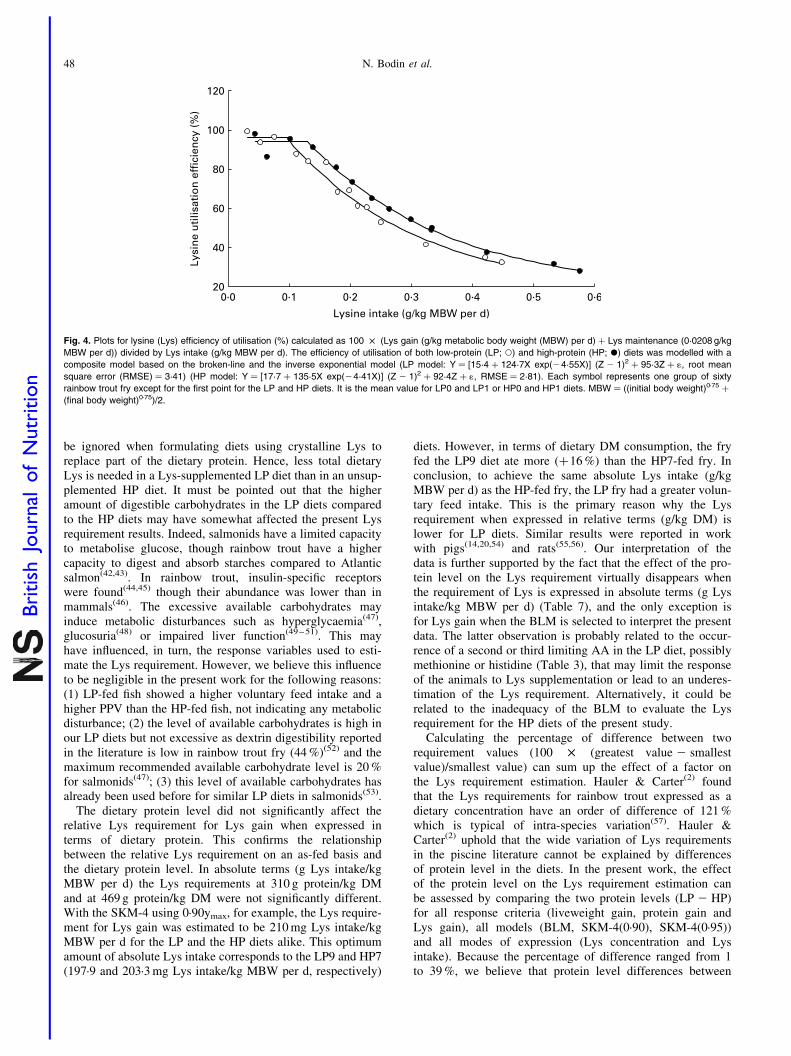
The efficiency of utilisation of both LP and HP diets wasmodelled with a composite model based on the BLM andthe inverse exponential model (Fig. 4). The models beganwith very similar plateau values of 96 and 94 % for LP and
HP diets, respectively, up to the break-off point at 0·10 and0·14 g/kg MBW per d of Lys intake. Both inverse exponentialcurves decreased at very similar rates and remained parallel.The HP diets stayed above the LP diets.
The changes in fat gain (Table 4) followed a similar patternfor LP and HP diets, as did changes in protein gain (Table 4).The fat in weight gain started out at about 250–300 g/kg andthen quickly levelled off to a plateau above a Lys dietary con-centration of 5·7 g/kg DM. The plateaus were significantlydifferent from one another (P,0·0001) and were at 176(SE 4) and 146 (SE 4) g/kg for LP and HP diets, respectively.The protein in weight gain values started out negative and roseto a plateau value for Lys concentrations above 11·7 g/kg DM.The plateaus were not significantly different from one another(P¼0·4) and were at 130 (SE 4) and 134 (SE 3) g/kg for LPand HP diets, respectively.
The N body composition (Table 9) showed no differencebetween LP- and HP-fed fry (P¼0·2). For both proteinlevels, the N body concentration increased with increasingLys concentration in the diet (P¼0·002). The AA compositionof the whole-body protein was significantly different betweenLP and HP diets for histidine and cystine (Table 9). For bothLP and HP diets, histidine increased significantly and argininedecreased significantly, with increasing dietary Lys level. Lyswhole-body protein composition increased significantly withincreasing dietary Lys level for HP diets though it did notvary significantly for LP diets.
Table 7. Comparison of the non-linear (NL) and the broken-line (BL) models for the relative lysine (Lys) requirement expressed in terms of diet DM(g/kg DM) and in terms of dietary protein (g/100 g protein), and the absolute Lys requirement expressed in terms of intake (g/kg metabolic body weight(MBW) per d) for the response criteria of body weight gain (g/kg MBW per d), protein gain (g/kg MBW per d) and Lys gain (g/kg MBW per d)§
Lys requirementin terms of. . .
Responsecriterion Model Rq HP Rq LP Rq HP 2Rq LP 95% CIk
Significance ofthe difference R 2 HP R 2 LP
Dietary DM Body wt gain NL 0·95 24·03 18·48 5·55 1·69, 8·27 S 0·98 0·99NL 0·90 20·03 15·07 4·96 0·60, 10·80 S 0·98 0·99BL 20·19 14·73 5·47 4·10, 7·39 S 0·98 0·99
Protein gain NL 0·95 26·90 21·65 5·26 213·41, 23·92 NS 0·99 0·99NL 0·90 22·58 17·60 4·98 210·49, 20·46 NS 0·99 0·99BL 22·33 16·15 6·17 4·61, 8·04 S 0·99 0·99
Lys gain NL 0·95 29·41 24·49 4·92 22·38, 10·41 NS 0·99 0·98NL 0·90 24·50 19·59 4·90 0·62, 8·64 S 0·99 0·98BL 23·35 16·80 6·55 4·73, 9·22 S 0·98 0·98
Dietary protein Body wt gain NL 0·95 5·31 6·12 20·81 22·26, 0·58 NS 0·98 0·99NL 0·90 4·43 4·99 20·57 21·50, 0·28 NS 0·98 0·99BL 4·46 4·88 20·42 20·78, 0·03 NS 0·98 0·99
Protein gain NL 0·95 5·94 7·17 21·23 22·88, 0·17 NS 0·99 0·99NL 0·90 4·99 5·83 20·84 21·82, 0·04 NS 0·99 0·99BL 4·93 5·35 20·42 20·83, 0·05 NS 0·99 0·99
Lys gain NL 0·95 6·49 8·11 21·61 23·70, 0·07 NS 0·99 0·98NL 0·90 5·41 6·49 21·08 22·48, 20·01 S 0·99 0·98BL 5·16 5·56 20·41 20·98, 0·20 NS 0·98 0·98
Lys intake Body wt gain NL 0·95 0·22 0·23 20·01 20·22, 0·20 NS 0·99 0·99NL 0·90 0·16 0·16 0·00 20·15, 0·15 NS 0·99 0·99BL 0·15 0·13 0·01 0·00, 0·03 NS 0·99 0·99
Protein gain NL 0·95 0·28 0·30 20·02 20·24, 0·21 NS 0·99 0·99NL 0·90 0·21 0·21 0·00 20·16, 0·16 NS 0·99 0·99BL 0·16 0·15 0·01 0·00, 0·03 NS 0·99 0·99
Lys gain NL 0·95 0·32 0·37 20·045 20·26, 0·08 NS 1·00 0·98NL 0·90 0·24 0·25 20·017 20·13, 0·05 NS 1·00 0·98BL 0·19 0·16 0·031 0·01, 0·05 S 0·99 0·98
HP, high-protein diet; LP, low-protein diet; NL 0·90, non-linear model requirement estimated as 0·90ymax; NL 0·95, non-linear model requirement estimated as 0·95ymax; Rq,lysine requirement; S, significant.
§ For details of procedures and diets, see Materials and methods section and Table 1. MBW ¼ ((initial body weight)0·75 þ (final body weight)0·75)/2.kFor the difference between the HP and LP requirement estimates.
Protein level and trout lysine requirements 45
British
Journal
ofNutrition
To estimate the amount of Lys required to deposit 1 g bodyprotein, the slope of the linear regression of protein gain (Y; g/kg MBW per d) (Table 4) against Lys intake (X; g/kg MBWper d) for the Lys-deficient diets (,14 g Lys/kg DM for LP0to LP6 and ,18 g Lys/kg DM for HP0 to HP5) was calcu-lated. The inverse value of the slopes ( £ 1000) of theselinear relationships (Y ¼ 20·17 (SE 0·04) þ 10·64 (SE 0·5)
X, r 2 0·99, n 7 and Y ¼ 20·17 (SE 0·03) þ 11·24 (SE 0·4)X,r 2 0·99, n 6, for LP and HP diets, respectively) indicatedthat fry fed LP and HP diets required an intake of 94(SE 4·4) and 89 (SE 3·2) mg Lys, respectively, to deposit 1 gbody protein. Neither the x-intercepts (P¼0·4) nor theslopes (P¼0·2) of these linear relationships were signi-ficantly different and a single line estimation (Y ¼ 20·17
Fig. 1. The lysine (Lys) requirement for Lys gain expressed in g Lys/kg diet DM (a, c) and in g Lys intake/kg metabolic body weight (MBW) per d (b, d) estimated
with a broken-line model (a, b) or a non-linear saturation kinetics model (SKM-4) (c, d) for low-protein (LP; D) and high-protein (HP; W) diets. Each point rep-
resents one group of sixty fish (rainbow trout, 31 feeding d, initial body weight 0·78 g/fish). The vertical dotted lines represent the requirement. For the SKM-4
models, two small dotted lines (····) represent the requirement at 0·90ymax and 0·95ymax, from left to right, for the LP diets. The two larger dotted lines (– –) rep-
resent the requirement at 0·90ymax and 0·95ymax, from left to right, for the HP diets. See Tables 5 and 6 for parameter values. MBW ¼ ((initial body weight)0·75 þ
(final body weight)0·75)/2.
Table 8. The 95% CI for the differences between the relative lysine (Lys) requirements expressed in termsof diet DM (g/kg DM) and between the absolute Lys requirements expressed in terms of intake (g/kg meta-bolic body weight (MBW) per d) for the response criteria of body weight gain (g/kg MBW per d), proteingain (g/kg MBW per d) and Lys gain (g/kg MBW per d) obtained with the broken-line model§
Lys requirement in terms of. . . Response criteria95% CI
LP HP
Dietary DM Body wt gain and protein gain 22·312, 20·642 23·404, 20·794Body wt gain and Lys gain 23·298, 20·823 25·006, 21·166Protein gain and Lys gain 21·364, 0·199 21·889, 0·277
Lys intake Body wt gain and protein gain 20·024, 20·005 20·031, 20·004Body wt gain and Lys gain 20·033, 20·005 20·058, 20·021Protein gain and Lys gain 20·015, 0·005 20·034, 20·010
HP, high-protein diet; LP, low-protein diet.§ For details of procedures and diets, see Materials and methods section and Table 1. MBW ¼ ((initial body weight)0·75 þ
(final body weight)0·75)/2. Differences are considered significant when 0 is not contained in the interval of the two values.
N. Bodin et al.46
British
Journal
ofNutrition
(SE 0·03) þ 10·94 (SE 0·3) X, r 2 0·99, n 13) gave a require-ment estimate of 92 (SE 2·5) mg Lys/g body protein accretion.
Discussion
The present study tested the effect of dietary protein level onthe relative (g/kg DM or g/100 g protein) and absolute (g Lysintake/kg MBW per d) Lys requirements. The relative Lysrequirement of trout fry markedly increased (þ5·4 g/kg DM)when the digestible protein content increased from 310 to469 g/kg DM (Table 7); therefore, we observed an increasein the relative Lys requirement of about 0·034 % for each1 % increase in the protein level between 31 and 46·9 % pro-tein. The relative Lys requirement difference was marginally
influenced by the model or the response parameter selectedfor its estimation. Studies with warm-blooded animals alsoreported an increase of the relative Lys requirement (g/kgDM) with increasing dietary protein level(12 – 14,20). McWardet al. (13) working between 12·8 and 21·7 % protein in swineconcluded that the relative Lys requirement (g/kg DM)increased by 0·023 % for each 1 % increase in dietary protein.Baker et al. (14) showed an increase in the relative Lys require-ment (g/kg DM) of growing pigs of 0·02 % for each 1 %increase in dietary protein when working between 12 and16 % dietary protein. The present results showed an evengreater dependence in trout than in pigs between the relativeLys requirement (g/kg DM) and the protein level in the diet.This dependence is economically important and should not
Fig. 2. The lysine (Lys) maintenance requirement estimated by linear regression of Lys gain against Lys intake for the suboptimal low-protein diets LP0 to LP6
(W; Y ¼ 0·84 (SE 0·04) X 2 0·017 (SE 0·003), n 7, r 2 0·99, x-intercept ¼ 0·020 (SE 0·0026) g Lys intake/kg metabolic body weight (MBW) per d) and high-protein
diets HP0 to HP5 (X; Y ¼ 0·91 (SE 0·03) X 2 0·019 (SE 0·002), n 6, r 2 0·99, x-intercept ¼ 0·021 (SE 0·0020) g Lys intake/kg MBW per d). Each symbol represents
one group of sixty rainbow trout fry (31 feeding d, initial body weight 0·78 g/fish). Neither the slopes (P¼0·2) nor the x-intercepts (P¼0·4) were significantly
different. MBW ¼ ((initial body weight)0·75 þ (final body weight)0·75)/2.
Fig. 3. Lysine (Lys) retention efficiency represented as Lys gain plotted against Lys intake (each symbol represents one group of sixty rainbow trout fry) and mod-
elled with a polynomial model for low-protein (LP; W) and high-protein (HP; X) diets (LP model: Y ¼ 22·89x21 þ 135 þ 2 404x þ 399x2 þ1, root mean square
error (RMSE) ¼ 3·73) (HP model: Y ¼ 23·49x21 þ 141 þ 2 355x þ 287x2 þ1, RMSE ¼ 4·15). The diets LP0, LP1, HP0, HP1 were excluded from the model
calculations because their retention efficiencies were negative (see Table 4). Metabolic body weight (MBW) ¼ ((initial body weight)0·75 þ (final body weight)0·75)/2.
Protein level and trout lysine requirements 47
British
Journal
ofNutrition
be ignored when formulating diets using crystalline Lys toreplace part of the dietary protein. Hence, less total dietaryLys is needed in a Lys-supplemented LP diet than in an unsup-plemented HP diet. It must be pointed out that the higheramount of digestible carbohydrates in the LP diets comparedto the HP diets may have somewhat affected the present Lysrequirement results. Indeed, salmonids have a limited capacityto metabolise glucose, though rainbow trout have a highercapacity to digest and absorb starches compared to Atlanticsalmon(42,43). In rainbow trout, insulin-specific receptorswere found(44,45) though their abundance was lower than inmammals(46). The excessive available carbohydrates mayinduce metabolic disturbances such as hyperglycaemia(47),glucosuria(48) or impaired liver function(49 – 51). This mayhave influenced, in turn, the response variables used to esti-mate the Lys requirement. However, we believe this influenceto be negligible in the present work for the following reasons:(1) LP-fed fish showed a higher voluntary feed intake and ahigher PPV than the HP-fed fish, not indicating any metabolicdisturbance; (2) the level of available carbohydrates is high inour LP diets but not excessive as dextrin digestibility reportedin the literature is low in rainbow trout fry (44 %)(52) and themaximum recommended available carbohydrate level is 20 %for salmonids(47); (3) this level of available carbohydrates hasalready been used before for similar LP diets in salmonids(53).
The dietary protein level did not significantly affect therelative Lys requirement for Lys gain when expressed interms of dietary protein. This confirms the relationshipbetween the relative Lys requirement on an as-fed basis andthe dietary protein level. In absolute terms (g Lys intake/kgMBW per d) the Lys requirements at 310 g protein/kg DMand at 469 g protein/kg DM were not significantly different.With the SKM-4 using 0·90ymax, for example, the Lys require-ment for Lys gain was estimated to be 210 mg Lys intake/kgMBW per d for the LP and the HP diets alike. This optimumamount of absolute Lys intake corresponds to the LP9 and HP7(197·9 and 203·3 mg Lys intake/kg MBW per d, respectively)
diets. However, in terms of dietary DM consumption, the fryfed the LP9 diet ate more (þ16 %) than the HP7-fed fry. Inconclusion, to achieve the same absolute Lys intake (g/kgMBW per d) as the HP-fed fry, the LP fry had a greater volun-tary feed intake. This is the primary reason why the Lysrequirement when expressed in relative terms (g/kg DM) islower for LP diets. Similar results were reported in workwith pigs(14,20,54) and rats(55,56). Our interpretation of thedata is further supported by the fact that the effect of the pro-tein level on the Lys requirement virtually disappears whenthe requirement of Lys is expressed in absolute terms (g Lysintake/kg MBW per d) (Table 7), and the only exception isfor Lys gain when the BLM is selected to interpret the presentdata. The latter observation is probably related to the occur-rence of a second or third limiting AA in the LP diet, possiblymethionine or histidine (Table 3), that may limit the responseof the animals to Lys supplementation or lead to an underes-timation of the Lys requirement. Alternatively, it could berelated to the inadequacy of the BLM to evaluate the Lysrequirement for the HP diets of the present study.
Calculating the percentage of difference between tworequirement values (100 £ (greatest value 2 smallestvalue)/smallest value) can sum up the effect of a factor onthe Lys requirement estimation. Hauler & Carter(2) foundthat the Lys requirements for rainbow trout expressed as adietary concentration have an order of difference of 121 %which is typical of intra-species variation(57). Hauler &Carter(2) uphold that the wide variation of Lys requirementsin the piscine literature cannot be explained by differencesof protein level in the diets. In the present work, the effectof the protein level on the Lys requirement estimation canbe assessed by comparing the two protein levels (LP 2 HP)for all response criteria (liveweight gain, protein gain andLys gain), all models (BLM, SKM-4(0·90), SKM-4(0·95))and all modes of expression (Lys concentration and Lysintake). Because the percentage of difference ranged from 1to 39 %, we believe that protein level differences between
Fig. 4. Plots for lysine (Lys) efficiency of utilisation (%) calculated as 100 £ (Lys gain (g/kg metabolic body weight (MBW) per d) þ Lys maintenance (0·0208 g/kg
MBW per d)) divided by Lys intake (g/kg MBW per d). The efficiency of utilisation of both low-protein (LP; W) and high-protein (HP; X) diets was modelled with a
composite model based on the broken-line and the inverse exponential model (LP model: Y ¼ [15·4 þ 124·7X exp(24·55X)] (Z 2 1)2 þ 95·3Z þ 1, root mean
square error (RMSE) ¼ 3·41) (HP model: Y ¼ [17·7 þ 135·5X exp(24·41X)] (Z 2 1)2 þ 92·4Z þ 1, RMSE ¼ 2·81). Each symbol represents one group of sixty
rainbow trout fry except for the first point for the LP and HP diets. It is the mean value for LP0 and LP1 or HP0 and HP1 diets. MBW ¼ ((initial body weight)0·75 þ
(final body weight)0·75)/2.
N. Bodin et al.48
British
Journal
ofNutrition
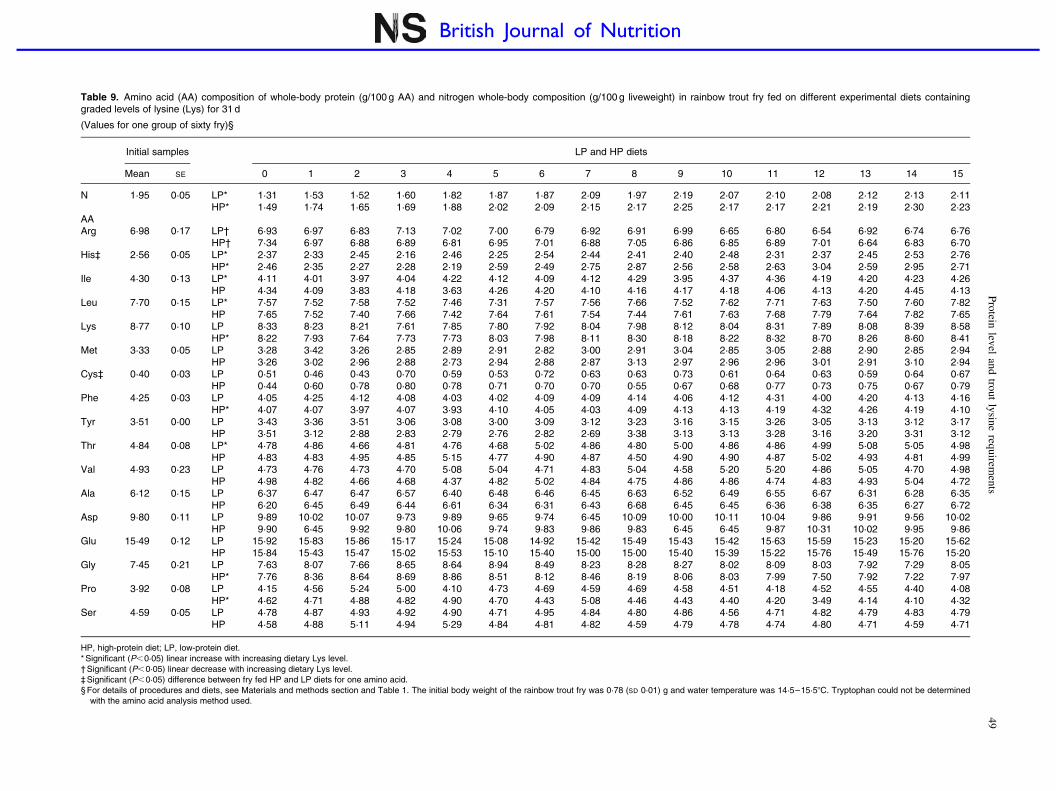
Table 9. Amino acid (AA) composition of whole-body protein (g/100 g AA) and nitrogen whole-body composition (g/100 g liveweight) in rainbow trout fry fed on different experimental diets containinggraded levels of lysine (Lys) for 31 d
(Values for one group of sixty fry)§
Initial samples LP and HP diets
Mean SE 0 1 2 3 4 5 6 7 8 9 10 11 12 13 14 15
N 1·95 0·05 LP* 1·31 1·53 1·52 1·60 1·82 1·87 1·87 2·09 1·97 2·19 2·07 2·10 2·08 2·12 2·13 2·11HP* 1·49 1·74 1·65 1·69 1·88 2·02 2·09 2·15 2·17 2·25 2·17 2·17 2·21 2·19 2·30 2·23
AAArg 6·98 0·17 LP† 6·93 6·97 6·83 7·13 7·02 7·00 6·79 6·92 6·91 6·99 6·65 6·80 6·54 6·92 6·74 6·76
HP† 7·34 6·97 6·88 6·89 6·81 6·95 7·01 6·88 7·05 6·86 6·85 6·89 7·01 6·64 6·83 6·70His‡ 2·56 0·05 LP* 2·37 2·33 2·45 2·16 2·46 2·25 2·54 2·44 2·41 2·40 2·48 2·31 2·37 2·45 2·53 2·76
HP* 2·46 2·35 2·27 2·28 2·19 2·59 2·49 2·75 2·87 2·56 2·58 2·63 3·04 2·59 2·95 2·71Ile 4·30 0·13 LP* 4·11 4·01 3·97 4·04 4·22 4·12 4·09 4·12 4·29 3·95 4·37 4·36 4·19 4·20 4·23 4·26
HP 4·34 4·09 3·83 4·18 3·63 4·26 4·20 4·10 4·16 4·17 4·18 4·06 4·13 4·20 4·45 4·13Leu 7·70 0·15 LP* 7·57 7·52 7·58 7·52 7·46 7·31 7·57 7·56 7·66 7·52 7·62 7·71 7·63 7·50 7·60 7·82
HP 7·65 7·52 7·40 7·66 7·42 7·64 7·61 7·54 7·44 7·61 7·63 7·68 7·79 7·64 7·82 7·65Lys 8·77 0·10 LP 8·33 8·23 8·21 7·61 7·85 7·80 7·92 8·04 7·98 8·12 8·04 8·31 7·89 8·08 8·39 8·58
HP* 8·22 7·93 7·64 7·73 7·73 8·03 7·98 8·11 8·30 8·18 8·22 8·32 8·70 8·26 8·60 8·41Met 3·33 0·05 LP 3·28 3·42 3·26 2·85 2·89 2·91 2·82 3·00 2·91 3·04 2·85 3·05 2·88 2·90 2·85 2·94
HP 3·26 3·02 2·96 2·88 2·73 2·94 2·88 2·87 3·13 2·97 2·96 2·96 3·01 2·91 3·10 2·94Cys‡ 0·40 0·03 LP 0·51 0·46 0·43 0·70 0·59 0·53 0·72 0·63 0·63 0·73 0·61 0·64 0·63 0·59 0·64 0·67
HP 0·44 0·60 0·78 0·80 0·78 0·71 0·70 0·70 0·55 0·67 0·68 0·77 0·73 0·75 0·67 0·79Phe 4·25 0·03 LP 4·05 4·25 4·12 4·08 4·03 4·02 4·09 4·09 4·14 4·06 4·12 4·31 4·00 4·20 4·13 4·16
HP* 4·07 4·07 3·97 4·07 3·93 4·10 4·05 4·03 4·09 4·13 4·13 4·19 4·32 4·26 4·19 4·10Tyr 3·51 0·00 LP 3·43 3·36 3·51 3·06 3·08 3·00 3·09 3·12 3·23 3·16 3·15 3·26 3·05 3·13 3·12 3·17
HP 3·51 3·12 2·88 2·83 2·79 2·76 2·82 2·69 3·38 3·13 3·13 3·28 3·16 3·20 3·31 3·12Thr 4·84 0·08 LP* 4·78 4·86 4·66 4·81 4·76 4·68 5·02 4·86 4·80 5·00 4·86 4·86 4·99 5·08 5·05 4·98
HP 4·83 4·83 4·95 4·85 5·15 4·77 4·90 4·87 4·50 4·90 4·90 4·87 5·02 4·93 4·81 4·99Val 4·93 0·23 LP 4·73 4·76 4·73 4·70 5·08 5·04 4·71 4·83 5·04 4·58 5·20 5·20 4·86 5·05 4·70 4·98
HP 4·98 4·82 4·66 4·68 4·37 4·82 5·02 4·84 4·75 4·86 4·86 4·74 4·83 4·93 5·04 4·72Ala 6·12 0·15 LP 6·37 6·47 6·47 6·57 6·40 6·48 6·46 6·45 6·63 6·52 6·49 6·55 6·67 6·31 6·28 6·35
HP 6·20 6·45 6·49 6·44 6·61 6·34 6·31 6·43 6·68 6·45 6·45 6·36 6·38 6·35 6·27 6·72Asp 9·80 0·11 LP 9·89 10·02 10·07 9·73 9·89 9·65 9·74 6·45 10·09 10·00 10·11 10·04 9·86 9·91 9·56 10·02
HP 9·90 6·45 9·92 9·80 10·06 9·74 9·83 9·86 9·83 6·45 6·45 9·87 10·31 10·02 9·95 9·86Glu 15·49 0·12 LP 15·92 15·83 15·86 15·17 15·24 15·08 14·92 15·42 15·49 15·43 15·42 15·63 15·59 15·23 15·20 15·62
HP 15·84 15·43 15·47 15·02 15·53 15·10 15·40 15·00 15·00 15·40 15·39 15·22 15·76 15·49 15·76 15·20Gly 7·45 0·21 LP 7·63 8·07 7·66 8·65 8·64 8·94 8·49 8·23 8·28 8·27 8·02 8·09 8·03 7·92 7·29 8·05
HP* 7·76 8·36 8·64 8·69 8·86 8·51 8·12 8·46 8·19 8·06 8·03 7·99 7·50 7·92 7·22 7·97Pro 3·92 0·08 LP 4·15 4·56 5·24 5·00 4·10 4·73 4·69 4·59 4·69 4·58 4·51 4·18 4·52 4·55 4·40 4·08
HP* 4·62 4·71 4·88 4·82 4·90 4·70 4·43 5·08 4·46 4·43 4·40 4·20 3·49 4·14 4·10 4·32Ser 4·59 0·05 LP 4·78 4·87 4·93 4·92 4·90 4·71 4·95 4·84 4·80 4·86 4·56 4·71 4·82 4·79 4·83 4·79
HP 4·58 4·88 5·11 4·94 5·29 4·84 4·81 4·82 4·59 4·79 4·78 4·74 4·80 4·71 4·59 4·71
HP, high-protein diet; LP, low-protein diet.* Significant (P,0·05) linear increase with increasing dietary Lys level.†Significant (P,0·05) linear decrease with increasing dietary Lys level.‡Significant (P,0·05) difference between fry fed HP and LP diets for one amino acid.§For details of procedures and diets, see Materials and methods section and Table 1. The initial body weight of the rainbow trout fry was 0·78 (SD 0·01) g and water temperature was 14·5–15·58C. Tryptophan could not be determined
with the amino acid analysis method used.
Pro
teinlev
elan
dtro
ut
lysin
ereq
uirem
ents
49
British Journal of Nutrition
studies have a role to play in explaining part of the relativeLys requirement variation observed in the piscine literature.
Model choice, another factor pinpointed as causing require-ment variation, had an impact on the trout fry Lys requirementestimations in the present work. The BLM gave the lowestvalues compared to the SKM-4, especially when the require-ment was defined as the Lys concentration or intake corre-sponding to 0·95 of the maximum response (0·95ymax).Lower values with the BLM compared to a non-linearmodel have also been previously reported in rainbowtrout(1,26). In a Lys requirement study, Encarnacao et al. (4)
observed that relative dietary Lys requirement estimatesobtained using the BLM resulted in a lower requirementvalue (18 g/kg diet) compared to a four-parameter logisticmodel used by Gahl et al. (58) (23 g/kg diet) that usuallygives a very similar requirement estimate compared to theSKM-4 with four parameters(26). According to Bureau &Encarnacao(1), a value of 18 g Lys/kg diet recommended bythe National Research Council(27) appears underestimatedand this would be mainly a result of the fact that the NationalResearch Council(27) based the AA fish requirement rec-ommendations on studies that used the ANOVA or the BLMapproaches. The present results clearly support the experimen-tal evidence of Encarnacao et al. (4) and Rodehutscord et al. (59)
that a Lys level of 18 g/kg is insufficient to ensure maximumresponse at an optimal protein concentration in trout, whateverthe model used to interpret the data. Therefore, we suggestthat the recommendations of the National Research Council(27)
concerning the Lys requirements for trout as well as forsalmon fry(60) be re-evaluated.
Globally, both models fitted equally well the data (similarr 2). The Lys requirement estimation was less sensitive tosmall data modifications when estimated with the BLM orthe SKM-4 with 0·90ymax. The requirement estimated with0·95ymax had a larger uncertainty than with 0·90ymax due tothe aspect of the curve, which is almost asymptotical in thatarea. In effect, for this particular part of the SKM-4 curve, asmall variation in Y induces a large variation in X. For thisreason, it is more difficult to estimate accurately the require-ment with 0·95ymax as it is with 0·90ymax.
For specific parts of the response curve, such as for verylow Lys intakes and for the portion around the optimum, thetwo models provided different fit for the data. At very lowLys intakes (between zero and the maintenance level), thedietary Lys intake is replacing the amount expended in obliga-tory metabolism which, in the case of insufficient dietarysupply, is derived from body protein breakdown. In thiszone, the SKM-4 describes the overall response of the animalsas sigmoidal with a positive inflection at low intakes. There-fore, it suggests a small marginal response to the lowest AAintakes (the first derivative at zero intake is zero(61)). In thepresent study, however, the efficiency of utilisation of Lysin this zone seems to be constant and close to 100 %. Ourgroup recently reported a similar conclusion in the study ofthe threonine requirement for maintenance in Atlanticsalmon (Salmo salar) fry using either the graded supplemen-tation technique(53) or the diet dilution procedure(62). In viewof this evidence and because it is in this intake range thatthe highest efficiency of utilisation is observed, we believethat the SKM-4 does not provide a good description of thefish response in this zone. Therefore, in this intake range, a
linear model (BLM) seems more appropriate and it is forthis reason that we used a linear regression to determine theLys requirement for maintenance.
After the maintenance requirement to up to about 90 % ofthe maximum response, the animals in the present experimentresponded to an increase in Lys intake and in Lys dietary con-centration with a similar linear increase in protein and Lysgains at both protein levels. Both models were deemed ade-quate for this portion and for both LP and HP levels.
A diminishing returns portion of the response curve wasapparent for Lys levels above 21 g/kg DM (diet HP7) for theHP diets. Therefore, the SKM-4 most accurately describedthis part of the response curve around the requirement atthis protein level. However for the LP diets there was noevidence of diminishing returns in this part of the curve andthe BLM fitted the data as well as the SKM-4. This differencein the form of the curve around the requirement between theHP and LP levels could be attributed to the suboptimal proteinlevel of the LP diets. Indeed, the present study confirmed thatthe LP diets were suboptimal in terms of digestible proteinconcentration because, when Lys was supplied in sufficientquantities (above the total requirement for growth and main-tenance), trout performances were higher for the HP dietscompared to the LP diets in terms of weight gain, feed effi-ciency, protein gain and Lys gain. In the LP diets, anotherAA may become co-limiting, restraining abruptly the responseof the animals. In this case, Lys would become in excessand consequently be oxidised, reducing the Lys utilisationefficiency (Fig. 3). In conclusion, neither of the two modelsthat were tested seemed to provide an appropriate descriptionof all parts of the response curve, although both provide agood fit to the data over one or two particular regions.To assess the possible influence the model choice can haveon the Lys requirement estimation, the percentage of differ-ence was calculated for the three model types between them-selves (BLM 2 SKM-4(0·90), BLM 2 SKM-4(0·95) andSKM-4(0·90) 2 SKM-4(0·95)). This was done for all responsecriteria (liveweight gain, protein gain and Lys gain), all pro-tein levels (LP and HP) and all modes of expression (Lysconcentration and Lys intake). It led to a range of variationof 1–135 % and demonstrated clearly how great an influencethe model choice may have.
The response criterion selection highly influenced the calcu-lated Lys requirements in the present paper. In our study,29·4 g Lys/kg DM were required to achieve 95 % of the maxi-mum response in Lys gain whereas only 24 g/kg DM wererequired to achieve 95 % of the maximum response in bodyweight gain, for trout fed the HP diet and with the SKM-4.Several studies have demonstrated that the choice of thedependent variable is an important factor affecting the shapeof the dose–response curve and hence the calculated AArequirement(63). In the present study, the Lys requirementvaried with the selected response criterion (weight gain, pro-tein gain or Lys gain) and suggests that body composition isaffected by dietary Lys concentration. Indeed, the presentresults showed a linear increase of both nitrogen whole-bodycomposition (g/100 g liveweight) and Lys concentration ofwhole-body protein (g/100 g AA) (Table 9) with dietary Lysconcentration. This effect has already been reported in rain-bow trout(4,64), Atlantic salmon fry(65), pigs(66 – 68), chicks(69)
and rats(70).
N. Bodin et al.50
British
Journal
ofNutrition
Interestingly, in the present experiment the whole-body his-tidine concentration increased with increasing Lys level, atboth protein concentrations. Recently, Bodin et al. (71)
reported this observation with histidine when rainbow troutand Atlantic salmon fry were fed threonine-deficient diets.Their results suggest that these changes are not related specifi-cally to individual AA deficiencies but are simply a conse-quence of slow growth. Therefore, whole-body histidineconcentration appears to be a promising indicator of normalgrowth rate for fish. In addition, the data imply that thedeficiency of an individual AA, such as Lys, does not necess-arily entail a proportionate loss of body protein and a com-mensurately negative nitrogen balance. These changespresumably result from alterations in the relative amounts ofdifferent proteins, whose rates of synthesis or breakdown arein turn sensitive to the dietary AA supply(72). However, theidentification of the proteins involved and the mechanismfor the control of their turnover are yet to be discovered.The percentage of difference was also calculated for thethree response criteria between themselves (liveweight gain,protein gain and Lys gain). This was done for all models(BLM, SKM-4(0·90), SKM-4(0·95), all protein levels (LPand HP) and all modes of expression (Lys concentration andLys intake). It led to a range of variation of 4–48 % andshowed the impact the response criterion may have on require-ment estimation.
The manner of expressing the requirement is the last factorinfluencing Lys requirement estimations to be addressed. Inthe present paper, the differences in the Lys requirementsbetween the different models used were more pronouncedwhen Lys intake rather Lys concentration was used as theindependent variable (Table 7). For example, when Lys gain(g/kg MBW per d) was plotted against Lys intake, the absoluteLys requirement was calculated to be 0·19 g/kg MBW per dwith the BLM but 0·32 g/kg MBW per d with the SKM-4(0·95) at the HP level, i.e. a variation of 72 % (when calcu-lated with seven decimals). These differences between thedifferent models were considerably reduced (variation of0·8 %) if the definition of the Lys requirement was the Lysconcentration for 0·90 of the maximum response (0·90ymax).For rainbow trout, and concerning other ways of expressingthe requirement, Hauler & Carter(2) found more variation inthe Lys requirement expressed as a percentage of the dietaryprotein (136 %) than as a percentage of the diet, while forother species, Cowey(5) observed that AA requirementsexpressed as a percentage of dietary protein reduced theintra-species variation in the AA requirement estimations.We suggest that the best manner of expressing the Lysrequirement depends on the available information. When thedigestibility of the nutrients, the expected growth rates andthe expected feed efficiency of a given diet are known(which is the case for most fish producers), the results of thepresent study demonstrate that the Lys requirement for rain-bow trout fry is best expressed in absolute terms (g/kgMBW per d) since the dietary protein level did not influencesignificantly the absolute Lys requirement estimation. How-ever, if the aforementioned parameters are not known(which is the case for most feed manufacturers), we suggestthat Lys requirement be expressed in relative terms. Of thedifferent possibilities, it is best expressed as a percentageof dietary protein since the dietary protein level did not
significantly affect the relative Lys requirement estimationexpressed in g/100 g protein for the rainbow trout fry in thepresent study. It would be interesting to undertake similarstudies on other fish sizes and species in order to arrive at aconsensus concerning the appropriate manner of expressingAA requirements.
The dietary protein levels did not affect the maintenancerequirement for Lys in rainbow trout fry. In the present experi-ment and based on Lys accretion, the Lys requirement formaintenance of rainbow trout fry grown at 14·5–15·58C washigher (21 (SD 2) mg Lys/kg MBW per d) than the reportedvalue for rainbow trout juveniles (11 mg Lys/kg MBW perd(59)), but similar to the Lys requirement of Atlantic salmonfry (20 mg Lys/kg MBW per d, based on N accretion, or28 mg Lys/kg MBW per d based on Lys accretion(28)) grownat 14·78C in very similar conditions as the ones of the presentstudy. In the present study, the estimate of the Lys require-ment for maintenance in rainbow trout fry is in the range ofvalues reported for terrestrial animals, i.e. pigs (25(73),36(34)), rats (34(74), 10(75), 32(22)) or for man (33(76)). Sincethe protein requirement for maintenance is considerablyhigher (about five times) in these terrestrial animals(34), itappears that the Lys maintenance requirement represents amuch higher part of the protein maintenance requirement introut fry(65) compared to terrestrial animals.
In conclusion, the present study shows that: (1) the relativeLys requirement of rainbow trout estimated with the BLMincreased from 16·8 g/kg DM at LP level (310 g/kg DM) to23·4 g/kg DM at HP level (469 g/kg DM); (2) the absoluteLys requirement expressed in terms of intake (g/kg MBWper d) and the relative Lys requirement expressed in termsof dietary protein (g/100 g protein) remained unaffected bythe digestible protein content in the diet; (3) both the modeland the response criterion chosen had a considerable impacton the relative Lys requirement; (4) the digestible proteincontent did not affect the Lys requirement for maintenance(21 mg Lys/kg MBW per d).
Acknowledgements
The authors thank Marc Michotte for expert technical assist-ance and Yves Beckers (Faculte universitaire des Sciencesagronomiques de Gembloux, Gembloux, Belgium) for theuse of the bomb calorimeter. X. R. designed the study. N. B.and B. G. did the data analysis. C. D. and S. D. S. did the AAanalysis. N. B., X. R., Y. L. and T. A. contributed to the draft-ing of the paper. There are no financial or other contractualagreements that might cause conflicts of interest or beperceived as causing conflicts of interest. The authors are grate-ful to the Universite catholique de Louvain for funding thisproject and to the helpful remarks of the anonymous referees.
References
1. Bureau DP & Encarnacao PM (2006) Adequately defining the
amino acid requirements of fish: the case example of lysine.
In Avances en Nutricion Acuicola, VIII Symposium Internacio-
nal de Nutricion Acuicola, pp. 29–54 [LEC Suarez, DR Marie,
MT Salazar, MGN Lopez, DAV Cavazos, ACP Cruz and
AG Ortega, editors]. Nuevo Leon, Mexico: Universidad Auton-
oma de Nuevo Leon.
Protein level and trout lysine requirements 51
British
Journal
ofNutrition
2. Hauler RC & Carter CG (2001) Re-evaluation of the quanti-
tative dietary lysine requirements of fish (review paper).
Rev Fish Sci 9, 133–163.
3. Hauler RC & Carter CG (2001) Lysine deposition responds
linearly to marginal lysine intake in Atlantic salmon (Salmo
salar L.) parr. Aquacult Res 32, 147–156.
4. Encarnacao P, De Lange C, Rodehutscord M, et al. (2004)
Diet digestible energy content affects lysine utilization, but
not dietary lysine requirements of rainbow trout (Oncorhynchus
mykiss) for maximum growth. Aquaculture 235, 569–586.
5. Cowey CB (1994) Amino acid requirements of fish: a critical
appraisal of present values. Aquaculture 124, 1–11.
6. Shearer KD (2000) Experimental design, statistical analysis and
modelling of dietary nutrient requirement studies for fish: a
critical review. Aquacult Nutr 6, 91–102.
7. Grau CR (1948) Effect of protein level on the lysine require-
ment of the chick. J Nutr 36, 99–108.
8. Almquist HJ (1949) Amino acid balance at super-normal dietary
levels. Proc Soc Exp Biol Med 72, 179–180.
9. Brinegar MJ, Williams HH, Ferris FH, et al. (1950) The lysine
requirement for the growth of swine. J Nutr 42, 129–138.
10. Grau CR & Kamei M (1950) Amino acid imbalance and the
growth requirements for lysine and methionine. J Nutr 41, 89–101.
11. Becker DE, Jensen AH, Terrill SW, et al. (1957) The isoleucine
requirement of weanling swine fed two protein levels. J Anim
Sci 16, 26–34.
12. Bressani R & Mertz ET (1958) Relationship of protein level to
the minimum lysine requirement of the rat. J Nutr 65, 481–491.
13. McWard GW, Becker DE, Norton HW, et al. (1959) The lysine
requirement of weanling swine at two levels of dietary protein.
J Anim Sci 18, 1059–1066.
14. Baker DH, Katz RS & Easter RA (1975) Lysine requirement of
growing pigs at two levels of dietary protein. J Anim Sci 40,
851–856.
15. Milner JA (1981) Lysine requirements of the immature dog.
J Nutr 111, 40–45.
16. Morris TR, Alazzawi K, Gous RM, et al. (1987) Effects of pro-
tein concentration on responses to dietary lysine by chicks.
Br Poult Sci 28, 185–195.
17. Mendonca CX & Jensen LS (1989) Influence of protein concen-
tration on the sulphur-containing amino acid requirement of
broiler chickens. Br Poult Sci 30, 889–898.
18. Almquist HJ (1972) Proteins and Amino Acids in Animal Nutri-
tion. New York: S.B. Penick.
19. Forbes RM, Baughan L & Norton HW (1955) Studies on the
utilization of dietary isoleucine by the growing albino rat.
J Nutr 57, 593–598.
20. Klay RF (1964) The lysine requirement for growth of the pig at
four protein levels, AbstrJ Anim Sci 23, 881.
21. Sowers JE & Meade RJ (1972) Effect of protein level on the
threonine requirement of the pig, AbstrJ Anim Sci 35, 224.
22. National Research Council (1995) Nutrient Requirements of
Laboratory Animals. Washington, DC: National Academic
Press.
23. Robbins KR, Norton HW & Baker DH (1979) Estimation
of nutrient requirements from growth data. J Nutr 109,
1710–1714.
24. Morgan PH, Mercer LP & Flodin NW (1975) General model for
nutritional responses of higher order mechanisms. Proc Natl
Acad Sci U S A 72, 4327–4331.
25. Rodehutscord M, Borchert F, Gregus Z, et al. (2000) Avail-
ability and utilisation of free lysine in rainbow trout (Oncor-
hynchus mykiss). 1. Effect of dietary crude protein level.
Aquaculture 187, 163–176.
26. Rodehutscord M & Pack M (1999) Estimates of essential amino
acid requirements from dose–response studies with rainbow
trout and broiler chicken: effect of mathematical model. Arch
Anim Nutr Arch Tierernahr 52, 223–244.
27. National Research Council (1993) Nutrient Requirements of
Fish. Washington, DC: National Academic Press.
28. Abboudi T, Mambrini M, Ooghe W, et al. (2006) Protein and
lysine requirements for maintenance and for tissue accretion
in Atlantic salmon (Salmo salar) fry. Aquaculture 261,
369–383.
29. Mambrini M & Kaushik SJ (1994) Partial replacement of diet-
ary protein nitrogen with dispensable amino acids in diets of
Nile tilapia, Oreochromis niloticus. Comp Biochem Physiol A
Mol Integr Physiol 109, 469–477.
30. Choubert G, Delanoue J & Luquet P (1982) Digestibility in fish:
improved device for the automatic collection of feces. Aquacul-
ture 29, 185–189.
31. Nang Thu TT, Parkouda C, De Saeger S, et al. (2007) Compari-
son of the lysine utilization efficiency in different plant protein
sources supplemented with L-lysine.HCl in rainbow trout
(Oncorhynchus mykiss) fry. Aquaculture 272, 477–488.
32. Czarnocki J, Sibbald IR & Evans EV (1961) The determination
of chromic oxide in samples of feed and excreta by acid diges-
tion and spectrophotometry. Can J Anim Sci 41, 167–179.
33. Fenton TW & Fenton M (1979) An improved procedure for the
determination of chromic oxide in feed and faeces. Can J Anim
Sci 59, 631–634.
34. Fuller MF, McWilliam R, Wang TC, et al. (1989) The optimum
dietary amino acid pattern for growing pigs. 2. Requirements for
maintenance and for tissue protein accretion. Br J Nutr 62,
255–267.
35. Edwards HM, Baker DH, Fernandez SR, et al. (1997) Mainten-
ance threonine requirement and efficiency of its use for accre-
tion of whole-body threonine and protein in young chicks. Br
J Nutr 78, 111–119.
36. Mercer LP (1982) The quantitative nutrient-response relation-
ship. J Nutr 112, 560–566.
37. Mercer LP, May HE & Dodds SJ (1989) The determination of
nutritional requirements in rats: mathematical modeling of sigmoi-
dal, inhibited nutrient-response curves. J Nutr 119, 1465–1471.
38. Rodehutscord M, Jacobs S, Pack M, et al. (1995) Response of
rainbow trout (Oncorhynchus mykiss) growing from 50 to
170 g to supplements of either L-arginine or L-threonine in a
semipurified diet. J Nutr 125, 970–975.
39. Heger J & Frydrych Z (1985) Efficiency of utilisation of essen-
tial amino acids in growing rats at different levels of intake. Br J
Nutr 54, 499–508.
40. Venables W & Ripley B (2002) Modern Applied Statistics with
S. New York: Springer.
41. Efron B & Tibshirani RJ (1993) An Introduction to the Boot-
strap. New York: Chapman and Hall.
42. Krogdahl A, Sundby A & Olli JJ (2004) Atlantic salmon (Salmo
salar) and rainbow trout (Oncorhynchus mykiss) digest and
metabolize nutrients differently. Effects of water salinity and
dietary starch level. Aquaculture 229, 335–360.
43. Frøystad MK, Lilleeng E, Sundby A, et al. (2006) Cloning and
characterization of alpha-amylase from Atlantic salmon (Salmo
salar L.). Comp Biochem Physiol A Mol Integr Physiol 145,
479–492.
44. Plisetskaya EM, Fabbri E, Moon TW, et al. (1993) Insulin-bind-
ing to isolated hepatocytes of Atlantic salmon and rainbow
trout. Fish Physiol Biochem 11, 401–409.
45. Parrizas M, Planas J, Plisetskaya EM, et al. (1994) Insulin binding
and receptor tyrosine kinase-activity in skeletal-muscle of carni-
vorous and omnivorous fish. Am J Physiol 266, R1944–R1950.
46. Gutierrez J, Asgard T, Fabbri E, et al. (1991) Insulin-receptor
binding in skeletal-muscle of trout. Fish Physiol Biochem 9,
351–360.
N. Bodin et al.52
British
Journal
ofNutrition
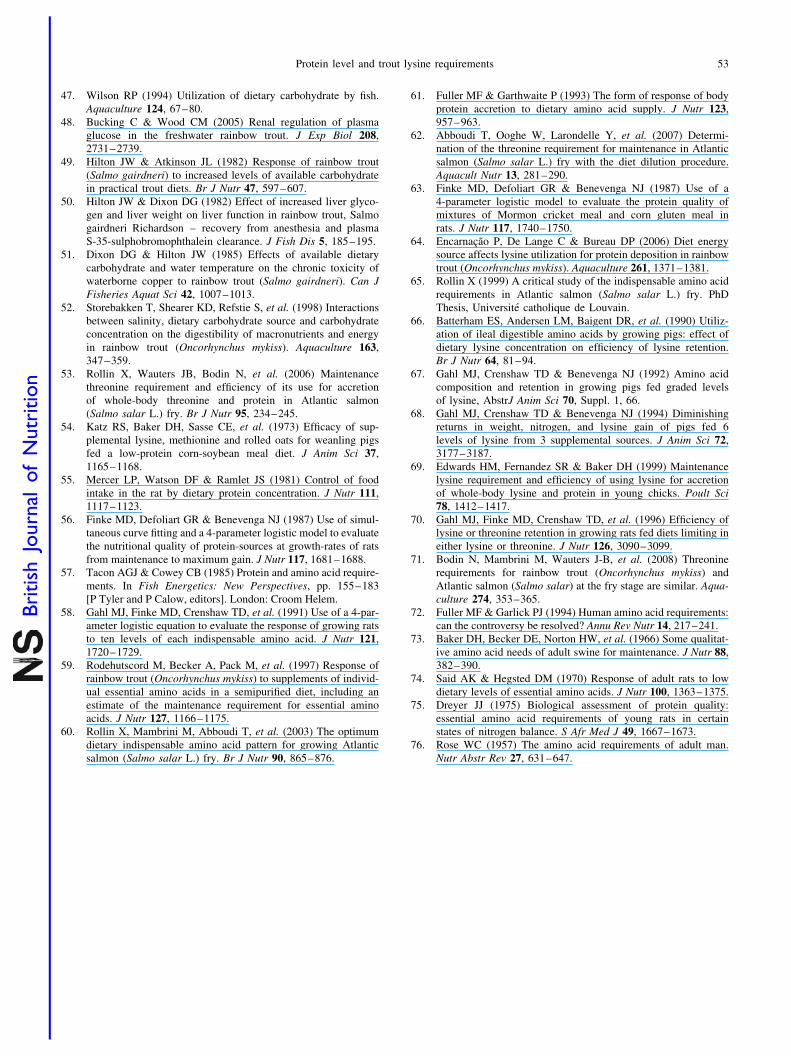
47. Wilson RP (1994) Utilization of dietary carbohydrate by fish.
Aquaculture 124, 67–80.
48. Bucking C & Wood CM (2005) Renal regulation of plasma
glucose in the freshwater rainbow trout. J Exp Biol 208,
2731–2739.
49. Hilton JW & Atkinson JL (1982) Response of rainbow trout
(Salmo gairdneri) to increased levels of available carbohydrate
in practical trout diets. Br J Nutr 47, 597–607.
50. Hilton JW & Dixon DG (1982) Effect of increased liver glyco-
gen and liver weight on liver function in rainbow trout, Salmo
gairdneri Richardson – recovery from anesthesia and plasma
S-35-sulphobromophthalein clearance. J Fish Dis 5, 185–195.
51. Dixon DG & Hilton JW (1985) Effects of available dietary
carbohydrate and water temperature on the chronic toxicity of
waterborne copper to rainbow trout (Salmo gairdneri). Can J
Fisheries Aquat Sci 42, 1007–1013.
52. Storebakken T, Shearer KD, Refstie S, et al. (1998) Interactions
between salinity, dietary carbohydrate source and carbohydrate
concentration on the digestibility of macronutrients and energy
in rainbow trout (Oncorhynchus mykiss). Aquaculture 163,
347–359.
53. Rollin X, Wauters JB, Bodin N, et al. (2006) Maintenance
threonine requirement and efficiency of its use for accretion
of whole-body threonine and protein in Atlantic salmon
(Salmo salar L.) fry. Br J Nutr 95, 234–245.
54. Katz RS, Baker DH, Sasse CE, et al. (1973) Efficacy of sup-
plemental lysine, methionine and rolled oats for weanling pigs
fed a low-protein corn-soybean meal diet. J Anim Sci 37,
1165–1168.
55. Mercer LP, Watson DF & Ramlet JS (1981) Control of food
intake in the rat by dietary protein concentration. J Nutr 111,
1117–1123.
56. Finke MD, Defoliart GR & Benevenga NJ (1987) Use of simul-
taneous curve fitting and a 4-parameter logistic model to evaluate
the nutritional quality of protein-sources at growth-rates of rats
from maintenance to maximum gain. J Nutr 117, 1681–1688.
57. Tacon AGJ & Cowey CB (1985) Protein and amino acid require-
ments. In Fish Energetics: New Perspectives, pp. 155–183
[P Tyler and P Calow, editors]. London: Croom Helem.
58. Gahl MJ, Finke MD, Crenshaw TD, et al. (1991) Use of a 4-par-
ameter logistic equation to evaluate the response of growing rats
to ten levels of each indispensable amino acid. J Nutr 121,
1720–1729.
59. Rodehutscord M, Becker A, Pack M, et al. (1997) Response of
rainbow trout (Oncorhynchus mykiss) to supplements of individ-
ual essential amino acids in a semipurified diet, including an
estimate of the maintenance requirement for essential amino
acids. J Nutr 127, 1166–1175.
60. Rollin X, Mambrini M, Abboudi T, et al. (2003) The optimum
dietary indispensable amino acid pattern for growing Atlantic
salmon (Salmo salar L.) fry. Br J Nutr 90, 865–876.
61. Fuller MF & Garthwaite P (1993) The form of response of body
protein accretion to dietary amino acid supply. J Nutr 123,
957–963.
62. Abboudi T, Ooghe W, Larondelle Y, et al. (2007) Determi-
nation of the threonine requirement for maintenance in Atlantic
salmon (Salmo salar L.) fry with the diet dilution procedure.
Aquacult Nutr 13, 281–290.
63. Finke MD, Defoliart GR & Benevenga NJ (1987) Use of a
4-parameter logistic model to evaluate the protein quality of
mixtures of Mormon cricket meal and corn gluten meal in
rats. J Nutr 117, 1740–1750.
64. Encarnacao P, De Lange C & Bureau DP (2006) Diet energy
source affects lysine utilization for protein deposition in rainbow
trout (Oncorhynchus mykiss). Aquaculture 261, 1371–1381.
65. Rollin X (1999) A critical study of the indispensable amino acid
requirements in Atlantic salmon (Salmo salar L.) fry. PhD
Thesis, Universite catholique de Louvain.
66. Batterham ES, Andersen LM, Baigent DR, et al. (1990) Utiliz-
ation of ileal digestible amino acids by growing pigs: effect of
dietary lysine concentration on efficiency of lysine retention.
Br J Nutr 64, 81–94.
67. Gahl MJ, Crenshaw TD & Benevenga NJ (1992) Amino acid
composition and retention in growing pigs fed graded levels
of lysine, AbstrJ Anim Sci 70, Suppl. 1, 66.
68. Gahl MJ, Crenshaw TD & Benevenga NJ (1994) Diminishing
returns in weight, nitrogen, and lysine gain of pigs fed 6
levels of lysine from 3 supplemental sources. J Anim Sci 72,
3177–3187.
69. Edwards HM, Fernandez SR & Baker DH (1999) Maintenance
lysine requirement and efficiency of using lysine for accretion
of whole-body lysine and protein in young chicks. Poult Sci
78, 1412–1417.
70. Gahl MJ, Finke MD, Crenshaw TD, et al. (1996) Efficiency of
lysine or threonine retention in growing rats fed diets limiting in
either lysine or threonine. J Nutr 126, 3090–3099.
71. Bodin N, Mambrini M, Wauters J-B, et al. (2008) Threonine
requirements for rainbow trout (Oncorhynchus mykiss) and
Atlantic salmon (Salmo salar) at the fry stage are similar. Aqua-
culture 274, 353–365.
72. Fuller MF & Garlick PJ (1994) Human amino acid requirements:
can the controversy be resolved? Annu Rev Nutr 14, 217–241.
73. Baker DH, Becker DE, Norton HW, et al. (1966) Some qualitat-
ive amino acid needs of adult swine for maintenance. J Nutr 88,
382–390.
74. Said AK & Hegsted DM (1970) Response of adult rats to low
dietary levels of essential amino acids. J Nutr 100, 1363–1375.
75. Dreyer JJ (1975) Biological assessment of protein quality:
essential amino acid requirements of young rats in certain
states of nitrogen balance. S Afr Med J 49, 1667–1673.
76. Rose WC (1957) The amino acid requirements of adult man.
Nutr Abstr Rev 27, 631–647.
Protein level and trout lysine requirements 53
British
Journal
ofNutrition
Related Documents