1/18/18 1 Protein Evolution and Similarity Searching Establishing Homology Biol4230 Tues, Jan 23, 2018 Bill Pearson [email protected] 4-2818 Pinn 6-057 Goals of today’s lecture: • a quick overview of protein structure • why search for homologs? • understand why and how homology is inferred; the meaning of “expectation value” • significance => homology, but no-significance ≠> non-homology • understand sequence similarity, and why protein comparison is more sensitive than DNA sequence comparison fasta.bioch.virginia.edu/biol4230 1 To learn more: • Pevsner, Ch. 3 • Recombinant DNA, Ch. 12 • Pearson, (2000) “Protein Evolution and Sequence Comparison” ISMB2000 tutorial (collab) • Koonin and Galperin (2003) Sequence – Evolution – Function www.ncbi.nlm.nih.gov/bookshelf/br.fcgi?book=sef Chapter 4, section 4.2, Principles of sequence similarity searches (collab) • Doolittle (1981) “Similar amino acid sequences: Chance or common ancestry” Science 214:149-159 • Computer exercises http://fasta.bioch.virginia.edu/biol4230/blast_demo.html 2 fasta.bioch.virginia.edu/biol4230

Protein Evolution and Similarity Searching … 1 Protein Evolution and Similarity Searching Establishing Homology Biol4230 Tues, Jan 23, 2018 Bill Pearson [email protected] 4-2818 Pinn6-057
May 19, 2018
Welcome message from author
This document is posted to help you gain knowledge. Please leave a comment to let me know what you think about it! Share it to your friends and learn new things together.
Transcript

1/18/18
1
Protein Evolution and Similarity SearchingEstablishing Homology
Biol4230 Tues, Jan 23, 2018Bill Pearson [email protected] 4-2818 Pinn 6-057
Goals of today’s lecture:• a quick overview of protein structure• why search for homologs?• understand why and how homology is inferred; the
meaning of “expectation value”• significance => homology, but no-significance ≠>
non-homology• understand sequence similarity, and why protein
comparison is more sensitive than DNA sequence comparison
fasta.bioch.virginia.edu/biol4230 1
To learn more:• Pevsner, Ch. 3• Recombinant DNA, Ch. 12• Pearson, (2000) “Protein Evolution and Sequence
Comparison” ISMB2000 tutorial (collab)• Koonin and Galperin (2003) Sequence – Evolution –
Function www.ncbi.nlm.nih.gov/bookshelf/br.fcgi?book=sef Chapter 4, section 4.2, Principles of sequence similarity searches (collab)
• Doolittle (1981) “Similar amino acid sequences: Chance or common ancestry” Science 214:149-159
• Computer exerciseshttp://fasta.bioch.virginia.edu/biol4230/blast_demo.html
2fasta.bioch.virginia.edu/biol4230

1/18/18
2
Homology, similarity, and protein structure
• Central dogma: DNA è RNA è proteins• Mutations and rearrangements in DNA cause
changes in protein structure• Genome sequences (DNA) determine protein
sequence• Protein sequence determines protein structure
– we cannot (accurately) predict structure from sequence• Protein structure determines protein function
– we cannot (accurately) predict function from structure• Biologists (and physicians) care about function
fasta.bioch.virginia.edu/biol4230 3
From sequence to structure
fasta.bioch.virginia.edu/biol4230 4
DNA
mRNA
protein (sequence) protein (structure, 1XW6)
LOCUS NM_000561 1266 bp mRNA linear PRI 25-MAY-2014DEFINITION Homo sapiens glutathione S-transferase mu 1 (GSTM1), transcript
variant 1, mRNA.ACCESSION NM_000561
>ref|NP_000552.2| GSTM1 (human)MPMILGYWDIRGLAHAIRLLLEYTDSSYEEKKYTMGDAPDYDRSQWLNEKFKLGLDFPNLPYLIDGAHKITQSNAILCYIARKHNLCGETEEEKIRVDILENQTMDNHMQLGMICYNPEFEKLKPKYLEELPEKLKLYSEFLGKRPWFAGNKITFVDFLVYDVLDLHRIFEPKCLDAFPNLKDFISRFEGLEKISAYMKSSRFLPRPVFSKMAVWGNK

1/18/18
3
From sequence to structure
fasta.bioch.virginia.edu/biol4230 5
protein (sequence)protein (structure, 1XW6)
>ref|NP_000552.2| GSTM1 (human)MPMILGYWDIRGLAHAIRLLLEYTDSSYEEKKYTMGDAPDYDRSQWLNEKFKLGLDFPNLPYLIDGAHKITQSNAILCYIARKHNLCGETEEEKIRVDILENQTMDNHMQLGMICYNPEFEKLKPKYLEELPEKLKLYSEFLGKRPWFAGNKITFVDFLVYDVLDLHRIFEPKCLDAFPNLKDFISRFEGLEKISAYMKSSRFLPRPVFSKMAVWGNK
• Protein 3-D structures contain simpler, regularly repeating patterns of H-bonding called secondary structure:– alpha-helices– beta-strands (beta-sheets)
• Many proteins are build from evolutionarily mobile (structurally compact) domains (modules)
50 100 150 200P09488
GST_N GST_C
Why do we search? How well do we search?
• Why search?– identify "similar" proteins (similar sequence?, similar
structure?, similar function?)– what level of sequence similarity guarantees structural
or functional similarity?• How well do we search?
– sensitivity: do we find all similar structures? functions?– specificity (selectivity): do all sequences this similar
have similar structure? function?
fasta.bioch.virginia.edu/biol4230 6
Is there a one-to-one mapping from sequence to structure? yesIs there a one-to-one mapping from structure to function? no
Homologous proteins (proteins that evolved from a common ancestor) always have similar structures, and
sometimes have similar functions.

1/18/18
4
Why do we search?
• (1993 – individual genes) Hereditary non-polyposis colon cancer (HNPCC). Is MSH2 related to an existing gene with known function? – if related, is it likely to have the same function?
• (2015 – whole genomes) I've isolated a new bacteria that makes a revolutionary antibiotic– which bacterial genes produce the antibiotic?– are those genes found in other bacteria?
fasta.bioch.virginia.edu/biol4230 7
(1993) MSH2 homolog in E. coli?
fasta.bioch.virginia.edu/biol4230 8

1/18/18
5
(1993) MSH2 homolog in E. coli?
fasta.bioch.virginia.edu/biol4230 9
Which of these proteins have the same structureWhich have the same function?
(1993) MSH2 homolog in E. coli?
fasta.bioch.virginia.edu/biol4230 10
Are all parts of the alignment
equally similar?

1/18/18
6
(2015) what is YCGG_ECOLI?
fasta.bioch.virginia.edu/biol4230 11
The best scores are: s-w bits E(459565) %_id %_simalensp|P75995.2|YCGG_ECOLI Uncharacterized protein YcgG [Es ( 507) 2518 985.5 0 1.000 1.000 507sp|P21514.2|YAHA_ECOLI Cyclic di-GMP phosphodiesterase ( 362) 512 204.4 2.5e-51 0.442 0.725 251sp|P76446.1|RTN_ECOLI Protein Rtn [Escherichia coli K-1 ( 518) 443 177.4 4.7e-43 0.297 0.631 444sp|P76261.2|ADRB_ECOLI Putative cyclic-di-GMP phosphodi ( 532) 409 164.2 4.7e-39 0.277 0.579 523sp|P76129.4|DOSP_ECOLI Oxygen sensor protein DosP; Dire ( 799) 370 148.9 2.8e-34 0.349 0.689 238sp|Q9I310.1|Y1727_PSEAE Uncharacterized signaling prote ( 685) 362 145.8 2e-33 0.353 0.689 235sp|P55552.1|Y4LL_RHISN Uncharacterized protein y4lL [Si ( 827) 359 144.6 5.7e-33 0.344 0.652 250sp|P32701.2|YJCC_ECOLI Putative cyclic-di-GMP phosphodi ( 528) 351 141.6 2.9e-32 0.314 0.675 277sp|Q9HYT3.1|Y3311_PSEAE Uncharacterized signaling prote ( 783) 350 141.1 6e-32 0.343 0.695 239sp|Q55434.1|PHY2_SYNY3 Phytochrome-like protein cph2; B (1276) 346 139.4 3.1e-31 0.367 0.676 256sp|Q9ABX9.1|Y091_CAUCR Uncharacterized signaling protei ( 809) 337 136.1 2.1e-30 0.380 0.662 237sp|P77334.1|GMR_ECOLI Cyclic di-GMP phosphodiesterase G ( 661) 332 134.2 6.4e-30 0.340 0.685 235sp|O34311.2|YKOW_BACSU Signaling protein YkoW [Bacillus ( 800) 310 125.5 3e-27 0.307 0.641 251sp|P64830.1|Y1392_MYCBO Uncharacterized protein Mb1392c ( 307) 297 120.7 3.3e-26 0.343 0.628 239sp|P37649.3|YHJK_ECOLI Protein YhjK [Escherichia coli K ( 662) 283 115.1 3.5e-24 0.313 0.647 249sp|P75800.1|YLIE_ECOLI Putative cyclic di-GMP phosphodi ( 782) 271 110.4 1.1e-22 0.293 0.636 239sp|Q8EJM6.1|PDEB_SHEON Cyclic di-GMP phosphodiesterase ( 856) 267 108.8 3.6e-22 0.294 0.664 235sp|Q9KU26.1|MBAA_VIBCH Biofilm architecture maintenance ( 791) 242 99.1 2.8e-19 0.252 0.646 254sp|Q9JMT8.1|YUAB_ECOLI Uncharacterized HTH-type transcr ( 353) 237 97.3 4.2e-19 0.249 0.635 241sp|P77172.1|YFGF_ECOLI Cyclic di-GMP phosphodiesterase ( 747) 240 98.3 4.5e-19 0.280 0.628 261sp|Q9KVL2.1|CDPA_VIBCH Cyclic di-GMP phosphodiesterase ( 829) 166 69.5 2.4e-10 0.250 0.621 232sp|O35014.1|YKUI_BACSU Uncharacterized EAL-domain conta ( 407) 137 58.3 2.6e-07 0.246 0.560 232sp|P37646.3|YHJH_ECOLI Cyclic di-GMP phosphodiesterase ( 255) 125 53.8 3.9e-06 0.296 0.653 98sp|P14203.1|YUXH_BACSU Uncharacterized protein YuxH [Ba ( 409) 103 45.1 0.0026 0.278 0.538 169sp|P75990.1|YCGF_ECOLI Blue light- and temperature-regu ( 403) 93 41.2 0.037 0.247 0.614 166sp|P13518.2|CSRD_ECOLI RNase E specificity factor CsrD; ( 646) 92 40.7 0.085 0.198 0.563 222
Probably a di-GMP-phosphodiesterase
12
Protein Evolution and Sequence SimilaritySimilarity Searching I
• What is Homology and how do we recognize it?• How do we measure sequence similarity –
alignments and scoring matrices?• DNA vs protein comparison
Similarity Searching II• Alignment algorithms• What are the problems?
– missed homologs (false negatives, sensitivity)– ?false positives? (specificity)
• What do the statistics mean?• How can we change behavior (scoring matrices)
fasta.bioch.virginia.edu/biol4230

1/18/18
7
Homologues share a common ancestor
13
chemical evolution
prokaryotes/eukaryotes
plants/animals
vertebrates/arthopods
self-replicating systems
4,2896,530
18,000
time
(bilio
ns o
f yea
rs)
hum
an
hors
e
fish
inse
ct
worm
whea
t
yeas
t
E. c
oli
-0.1
-1.0
-2.0
-3.0
-4.0
fasta.bioch.virginia.edu/biol4230
When do we infer homology?
14
Bovine trypsin (5ptp)Structure: E()< 10-23;
RMSD 0.0 ASequence: E()< 10-84
100% 223/223
S. griseus trypsin (1sgt)E()< 10-14 RMSD 1.6 AE()< 10-19 36%; 226/223
S. griseus protease A (2sga)E()< 10-4; RMSD 2.6 AE()< 2.6 25%; 199/181
Homology <=> structural similarity? sequence similarity
fasta.bioch.virginia.edu/biol4230

1/18/18
8
When can we infer non-homology?
15
Subtilisin (1sbt)E() >100E()<280; 25% 159/275
Cytochrome c4 (1etp)E() > 100E()<5.5; 23% 171/190
Non-homologous proteins havedifferent structures
Bovine trypsin (5ptp)Structure: E()<10-23
RMSD 0.0 ASequence: E()<10-84
100% 223/223
fasta.bioch.virginia.edu/biol4230
Homology is confusing I:Homology defined Three(?) Ways
• Proteins/genes/DNA that share a common ancestor
• Specific positions/columns in a multiple sequence alignment that have a 1:1 relationship over evolutionary history– sequences are 50% homologous ???
• Specific (morphological/functional) characters that share a recent divergence (clade)– bird/bat/butterfly wings are/are not homologous
16fasta.bioch.virginia.edu/biol4230

1/18/18
9
Single origin Multiple origins
present
past
Homology is confusing II:Are All Sequences Homologous?
No Homology without excess similarity
fasta.bioch.virginia.edu/biol4230 17
Homology from sequence similarity
• Sequences are inferred to share a common ancestor based on statistically significant excesssimilarity. Any evidence of excess similarity can be used to infer homology
• Lack of sequence evidence cannot be used to infer non-homology.– Proteins with different structures are non-
homologous• There are always two alternative hypotheses:
homology (common ancestry), or independence –one must weigh the evidence for each hypothesis (independence is the null hypothesis).
18fasta.bioch.virginia.edu/biol4230
1/18/18
10
19
+----------+------+------+---------------------------+---------------------------+------------+| expect | %_id | alen | E coli descr | Human descr | sp_name |+----------+------+------+---------------------------+---------------------------+------------+| 2.7e-206 | 53.8 | 944 | glycine decarboxylase, P | Glycine dehydrogenase [de | GCSP_HUMAN || 1.2e-176 | 59.5 | 706 | methylmalonyl-CoA mutase | Methylmalonyl-CoA mutase, | MUTA_HUMAN || 3.8e-176 | 50.6 | 803 | glycogen phosphorylase [E | Glycogen phosphorylase, l | PHS1_HUMAN || 9.9e-173 | 55.6 | 1222 | B12-dependent homocystein | 5-methyltetrahydrofolate- | METH_HUMAN || 1.8e-165 | 41.8 | 1031 | carbamoyl-phosphate synth | Carbamoyl-phosphate synth | CPSM_HUMAN || 5.6e-159 | 65.7 | 542 | glucosephosphate isomeras | Glucose-6-phosphate isome | G6PI_HUMAN || 8.1e-143 | 53.7 | 855 | aconitate hydrase 1 [Esch | Iron-responsive element b | IRE1_HUMAN || 2.5e-134 | 73.0 | 459 | membrane-bound ATP syntha | ATP synthase beta chain, | ATPB_HUMAN || 3.3e-121 | 55.8 | 550 | succinate dehydrogenase, | Succinate dehydrogenase [ | DHSA_HUMAN || 1.5e-113 | 60.6 | 401 | putative aminotransferase | Cysteine desulfurase, mit | NFS1_HUMAN || 4.4e-111 | 60.9 | 460 | fumarase C= fumarate hydr | Fumarate hydratase, mitoc | FUMH_HUMAN || 1.5e-109 | 56.1 | 474 | succinate-semialdehyde de | Succinate semialdehyde de | SSDH_HUMAN || 3.6e-106 | 44.7 | 789 | maltodextrin phosphorylas | Glycogen phosphorylase, m | PHS2_HUMAN || 1.4e-102 | 53.1 | 484 | NAD+-dependent betaine al | Aldehyde dehydrogenase, E | DHAG_HUMAN || 3.8e-98 | 53.0 | 449 | pyridine nucleotide trans | NAD(P) transhydrogenase, | NNTM_HUMAN || 5.8e-96 | 49.9 | 489 | glycerol kinase [Escheric | Glycerol kinase, testis s | GKP2_HUMAN || 2.1e-95 | 66.8 | 328 | glyceraldehyde-3-phosphat | Glyceraldehyde 3-phosphat | G3P2_HUMAN || 5.0e-91 | 62.5 | 368 | alcohol dehydrogenase cla | Alcohol dehydrogenase cla | ADHX_HUMAN || 6.7e-91 | 56.5 | 393 | protein chain elongation | Elongation factor Tu, mit | EFTU_HUMAN || 9.5e-91 | 56.6 | 392 | protein chain elongation | Elongation factor Tu, mit | EFTU_HUMAN || 2.2e-89 | 59.1 | 369 | methionine adenosyltransf | S-adenosylmethionine synt | METK_HUMAN || 6.5e-88 | 53.3 | 422 | enolase [Escherichia coli | Alpha enolase (2-phospho- | ENOA_HUMAN || 9.2e-88 | 43.3 | 536 | NAD-linked malate dehydro | NADP-dependent malic enzy | MAOX_HUMAN || 7.3e-86 | 55.5 | 389 | 2-amino-3-ketobutyrate Co | 2-amino-3-ketobutyrate co | KBL_HUMAN || 5.2e-83 | 44.4 | 543 | degrades sigma32, integra | AFG3-like protein 2 (Para | AF32_HUMAN |+----------+------+------+---------------------------+---------------------------+------------+
E. coli proteins vs Human – Ancient Protein Domains
fasta.bioch.virginia.edu/biol4230
20
Protein Evolution and Sequence SimilaritySimilarity Searching I
• What is Homology and how do we recognize it?• How do we measure sequence similarity –
alignments and scoring matrices?• DNA vs protein comparison
Similarity Searching II• Alignment algorithms• What are the problems?
– missed homologs (false negatives, sensitivity)– ?false positives? (specificity)
• What do the statistics mean?• How can we change behavior (scoring matrices)
fasta.bioch.virginia.edu/biol4230

1/18/18
11
21
z-sc obs
E()
< 20 9 0:=
22 1 0:= one = represents 23 library sequences
24 2 0:=
26 1 0:=
28 3 3:*
30 8 18:*
32 49 71:===*
34 145 192:======= *
36 342 395:=============== *
38 567 653:========================= *
40 882 911:=======================================*
42 1120 1114:================================================*
44 1274 1229:=====================================================*==
46 1367 1251:======================================================*=====
48 1299 1198:====================================================*====
50 1140 1093:===============================================*==
52 1049 961:=========================================*====
54 869 821:===================================*==
56 607 686:=========================== *
58 471 563:===================== *
60 419 456:===================*
62 336 366:===============*
64 263 291:============*
66 214 230:=========*
68 177 181:=======*
70 143 142:======*
72 124 111:====*=
74 85 86:===*
76 63 67:==*
78 47 52:==*
80 45 41:=*
82 33 31:=*
84 29 25:=*
86 20 19:*
88 19 15:* inset = represents 1 library sequences
90 16 11:*
92 18 9:* :========*=========
94 9 7:* :======*==
96 7 5:* :====*==
98 4 4:* :===*
100 13 3:* :==*==========
102 5 2:* :=*===
104 2 2:* :=*
106 5 1:* :*====
108 4 1:* :*===
110 2 1:* :*=
112 5 1:* :*====
114 6 1:* :*=====
116 2 0:= *==
118 1 0:= *=
>120 30 0:== *==============================
Query: atp6_human.aa ATP synthase a chain - 226 aaLibrary: PIR1 Annotated (rel. 66)
5190103 residues in 13351 sequences
fasta.bioch.virginia.edu/biol4230
22
Inferring Homology from Statistical Significance
• Real UNRELATED sequences have similarity scores that are indistinguishable fromRANDOM sequences
• If a similarity is NOT RANDOM, then it must be NOT UNRELATED
• Therefore, NOT RANDOM (statistically significant) similarity must reflect RELATEDsequences
fasta.bioch.virginia.edu/biol4230

1/18/18
12
23
The best scores are: ( len) s-w bits E(13351) %_id %_sim alensp|P00846|ATP6_HUMAN ATP synthase a chain (AT ( 226) 1400 325.8 5.8e-90 1.000 1.000 226sp|P00847|ATP6_BOVIN ATP synthase a chain (AT ( 226) 1157 270.5 2.5e-73 0.779 0.951 226sp|P00848|ATP6_MOUSE ATP synthase a chain (AT ( 226) 1118 261.7 1.2e-70 0.757 0.916 226sp|P00849|ATP6_XENLA ATP synthase a chain (AT ( 226) 745 176.8 4.0e-45 0.533 0.847 229sp|P00851|ATP6_DROYA ATP synthase a chain (AT ( 224) 473 115.0 1.7e-26 0.378 0.721 222sp|P00854|ATP6_YEAST ATP synthase a chain pre ( 259) 428 104.7 2.3e-23 0.353 0.694 232sp|P00852|ATP6_EMENI ATP synthase a chain pre ( 256) 365 90.4 4.8e-19 0.304 0.691 230sp|P14862|ATP6_COCHE ATP synthase a chain (AT ( 257) 353 87.7 3.2e-18 0.313 0.650 214sp|P68526|ATP6_TRITI ATP synthase a chain (AT ( 386) 309 77.6 5.1e-15 0.289 0.651 235sp|P05499|ATP6_TOBAC ATP synthase a chain (AT ( 395) 309 77.6 5.2e-15 0.283 0.635 233sp|P07925|ATP6_MAIZE ATP synthase a chain (AT ( 291) 283 71.7 2.3e-13 0.311 0.667 180sp|P0AB98|ATP6_ECOLI ATP synthase a chain (AT ( 271) 178 47.9 3.2e-06 0.233 0.585 236sp|P0C2Y5|ATPI_ORYSA Chloroplast ATP synth (A ( 247) 144 40.1 0.00062 0.242 0.580 231sp|P06452|ATPI_PEA Chloroplast ATP synthase a ( 247) 143 39.9 0.00072 0.250 0.586 232sp|P27178|ATP6_SYNY3 ATP synthase a chain (AT ( 276) 142 39.7 0.00095 0.265 0.571 170sp|P06451|ATPI_SPIOL Chloroplast ATP synthase ( 247) 138 38.8 0.0016 0.242 0.580 231sp|P08444|ATP6_SYNP6 ATP synthase a chain (AT ( 261) 127 36.3 0.0095 0.263 0.557 167sp|P69371|ATPI_ATRBE Chloroplast ATP synthase ( 247) 126 36.0 0.01 0.221 0.571 231sp|P06289|ATPI_MARPO Chloroplast ATP synthase ( 248) 126 36.0 0.011 0.240 0.575 167sp|P30391|ATPI_EUGGR Chloroplast ATP synthase ( 251) 123 35.4 0.017 0.257 0.579 214
sp|P19568|TLCA_RICPR ADP,ATP carrier protein ( 498) 122 35.0 0.043 0.243 0.579 152sp|P24966|CYB_TAYTA Cytochrome b ( 379) 113 33.0 0.13 0.234 0.532 158sp|P03892|NU2M_BOVIN NADH-ubiquinone oxidored ( 347) 107 31.7 0.31 0.261 0.479 211sp|P68092|CYB_STEAT Cytochrome b ( 379) 104 31.0 0.54 0.277 0.547 137sp|P03891|NU2M_HUMAN NADH-ubiquinone oxidored ( 347) 103 30.8 0.58 0.201 0.537 149sp|P00156|CYB_HUMAN Cytochrome b ( 380) 102 30.5 0.74 0.268 0.585 205sp|P15993|AROP_ECOLI Aromatic amino acid tr ( 457) 103 30.7 0.78 0.234 0.622 111sp|P24965|CYB_TRANA Cytochrome b ( 379) 101 30.3 0.87 0.234 0.563 158sp|P29631|CYB_POMTE Cytochrome b ( 308) 99 29.9 0.95 0.274 0.584 113sp|P24953|CYB_CAPHI Cytochrome b ( 379) 99 29.8 1.2 0.236 0.564 140
Query: atp6_human.aa ATP synthase a chain - 226 aaLibrary: 5190103 residues in 13351 sequences
fasta.bioch.virginia.edu/biol4230
24
>sp|P00846|ATP6_HUMAN ATP synthase subunit a; F-ATPase protein 6; Length=226vs:>sp|P0AB98|ATP6_ECOLI ATP synthase subunit a; ATP synthase F0 subunit; Length=271Score = 47.9 bits (178), Expect = 3e-06Identities = 55/199 (27%), Positives = 113/199 (56%), Gaps = 37/199 (18%)
Query 8 SFIAPTILGLPAAVLIILFPPLLIPTSKYLINNRLITTQQWLIKLTSKQMMTMHNTKGRTWSLML 72S +LGL ++++LF + + + ++ T + +I + + + M++ K + + +
Sbjct 45 SMFFSVVLGL---LFLVLFRSVAKKATSG-VPGKFQTAIELVIGFVNGSVKDMYHGKSKLIAPLA 105
Query 73 VSLIIFIATTNLLGLLP---------HSF-------TPTTQLSMNLAMAIPLWAGTVIMGFRSKI 121+++ +++ NL+ LLP H + P+ +++ L+MA+ ++ +++ F S
Sbjct 106 LTIFVWVFLMNLMDLLPIDLLPYIAEHVLGLPALRVVPSADVNVTLSMALGVF---ILILFYSIK 167
Query 122 KNALAHFLPQGTPTPL-----IPMLVIIETISLLIQPMALAVRLTANITAGHLLMHLIGSATLAM 181+ F + T P+ IP+ +I+E +SLL +P++L +RL N+ AG L+ LI
Sbjct 168 MKGIGGFTKELTLQPFNHWAFIPVNLILEGVSLLSKPVSLGLRLFGNMYAGELIFILIAGLLPWW 232
Query 182 STINLPSTLIIFTILILLTILEIAVALIQAYVFTLLVSLYL 222S L IF ILI+ +QA++F +L +YL
Sbjct 233 SQWILNVPWAIFHILIIT---------LQAFIFMVLTIVYL 264
fasta.bioch.virginia.edu/biol4230

1/18/18
13
25
The PAM250 matrix
Cys 12Ser 0 2Thr -2 1 3Pro -1 1 0 6Ala -2 1 1 1 2Gly -3 1 0 -1 1 5Asn -4 1 0 -1 0 0 2Asp -5 0 0 -1 0 1 2 4Glu -5 0 0 -1 0 0 1 3 4Gln -5 -1 -1 0 0 -1 1 2 2 4His -3 -1 -1 0 -1 -2 2 1 1 3 6Arg -4 0 -1 0 -2 -3 0 -1 -1 1 2 6Lys -5 0 0 -1 -1 -2 1 0 0 1 0 3 5Met -5 -2 -1 -2 -1 -3 -2 -3 -2 -1 -2 0 0 6Ile -2 -1 0 -2 -1 -3 -2 -2 -2 -2 -2 -2 -2 2 5Leu -6 -3 -2 -3 -2 -4 -3 -4 -3 -2 -2 -3 -3 4 2 6Val -2 -1 0 -1 0 -1 -2 -2 -2 -2 -2 -2 -2 2 4 2 4Phe -4 -3 -3 -5 -4 -5 -4 -6 -5 -5 -2 -4 -5 0 1 2 -1 9Tyr 0 -3 -3 -5 -3 -5 -2 -4 -4 -4 0 -4 -4 -2 -1 -1 -2 7 10Trp -8 -2 -5 -6 -6 -7 -4 -7 -7 -5 -3 2 -3 -4 -5 -2 -6 0 0 17
C S T P A G N D E Q H R K M I L V F Y W
fasta.bioch.virginia.edu/biol4230
Scoring Matrix summary:(1) Used to produce alignment score(2) Identities always positive, but some (rare,
conserved) more positive than others.(3) Similar amino-acids also positive(4) Most aligned pairs get negative scores
26
>sp|P00846|ATP6_HUMAN ATP synthase subunit a; F-ATPase protein 6 vs:>sp|P30391|ATPI_EUGGR ATP synthase subunit a, chloroplastic; ATP synthase F0 subLength=251
Score = 35.4 bits (123), Expect = 0.02Identities = 55/182 (30%), Positives = 101/182 (55%), Gaps = 32/182 (17%)
Query 21 VLIILFPPLLIPTSKYLINNRLITTQQWLIKLTSKQMMTMHNTK-GRT----WSLMLVSLIIFIA 80+LII F L I T+K L + +Q +I+L ++ + + T+ G W + ++ +FI
Sbjct 50 ILIIGF--LSIYTTKNL--TLVPANKQIFIELVTEFITDISKTQIGEKEYSKWVPYIGTMFLFIF 110
Query 81 TTNLLG-LLPHSFT--PTTQL---SMNLAMAIPLWAGTVIMGFRSKI-KNALAHFLPQGTPTPLI 138+N G L+P P +L + ++ L T + F + + K L +F PTP++
Sbjct 111 VSNWSGALIPWKIIELPNGELGAPTNDINTTAGLAILTSLAYFYAGLNKKGLTYFKKYVQPTPIL 175
Query 139 PMLVIIETISLLIQPMALAVRLTANITAGHLLMHLIGSATLAMSTINLPSTLIIFTILILLTILE 203+ I+E + +P++L+ RL NI A L++ ++ S +P LI+ LI+L ++
Sbjct 176 LPINILEDFT---KPLSLSFRLFGNILADELVVAVLVSL--------VP--LIVPVPLIFLGLF- 226
Query 204 IAVALIQAYVFTLLVSLYL 222+ IQA +F L Y+
Sbjct 227 --TSGIQALIFATLSGSYI 243
fasta.bioch.virginia.edu/biol4230

1/18/18
14
27
The best scores are: ( len) s-w bits E(13351) %_id %_sim alensp|P00846|ATP6_HUMAN ATP synthase a chain (AT ( 226) 1400 325.8 5.8e-90 1.000 1.000 226sp|P00847|ATP6_BOVIN ATP synthase a chain (AT ( 226) 1157 270.5 2.5e-73 0.779 0.951 226sp|P00848|ATP6_MOUSE ATP synthase a chain (AT ( 226) 1118 261.7 1.2e-70 0.757 0.916 226sp|P00849|ATP6_XENLA ATP synthase a chain (AT ( 226) 745 176.8 4.0e-45 0.533 0.847 229sp|P00851|ATP6_DROYA ATP synthase a chain (AT ( 224) 473 115.0 1.7e-26 0.378 0.721 222sp|P00854|ATP6_YEAST ATP synthase a chain pre ( 259) 428 104.7 2.3e-23 0.353 0.694 232sp|P00852|ATP6_EMENI ATP synthase a chain pre ( 256) 365 90.4 4.8e-19 0.304 0.691 230sp|P14862|ATP6_COCHE ATP synthase a chain (AT ( 257) 353 87.7 3.2e-18 0.313 0.650 214sp|P68526|ATP6_TRITI ATP synthase a chain (AT ( 386) 309 77.6 5.1e-15 0.289 0.651 235sp|P05499|ATP6_TOBAC ATP synthase a chain (AT ( 395) 309 77.6 5.2e-15 0.283 0.635 233sp|P07925|ATP6_MAIZE ATP synthase a chain (AT ( 291) 283 71.7 2.3e-13 0.311 0.667 180sp|P0AB98|ATP6_ECOLI ATP synthase a chain (AT ( 271) 178 47.9 3.2e-06 0.233 0.585 236sp|P0C2Y5|ATPI_ORYSA Chloroplast ATP synth (A ( 247) 144 40.1 0.00062 0.242 0.580 231sp|P06452|ATPI_PEA Chloroplast ATP synthase a ( 247) 143 39.9 0.00072 0.250 0.586 232sp|P27178|ATP6_SYNY3 ATP synthase a chain (AT ( 276) 142 39.7 0.00095 0.265 0.571 170sp|P06451|ATPI_SPIOL Chloroplast ATP synthase ( 247) 138 38.8 0.0016 0.242 0.580 231sp|P08444|ATP6_SYNP6 ATP synthase a chain (AT ( 261) 127 36.3 0.0095 0.263 0.557 167sp|P69371|ATPI_ATRBE Chloroplast ATP synthase ( 247) 126 36.0 0.01 0.221 0.571 231sp|P06289|ATPI_MARPO Chloroplast ATP synthase ( 248) 126 36.0 0.011 0.240 0.575 167sp|P30391|ATPI_EUGGR Chloroplast ATP synthase ( 251) 123 35.4 0.017 0.257 0.579 214
sp|P19568|TLCA_RICPR ADP,ATP carrier protein ( 498) 122 35.0 0.043 0.243 0.579 152sp|P24966|CYB_TAYTA Cytochrome b ( 379) 113 33.0 0.13 0.234 0.532 158sp|P03892|NU2M_BOVIN NADH-ubiquinone oxidored ( 347) 107 31.7 0.31 0.261 0.479 211sp|P68092|CYB_STEAT Cytochrome b ( 379) 104 31.0 0.54 0.277 0.547 137sp|P03891|NU2M_HUMAN NADH-ubiquinone oxidored ( 347) 103 30.8 0.58 0.201 0.537 149sp|P00156|CYB_HUMAN Cytochrome b ( 380) 102 30.5 0.74 0.268 0.585 205sp|P15993|AROP_ECOLI Aromatic amino acid tr ( 457) 103 30.7 0.78 0.234 0.622 111sp|P24965|CYB_TRANA Cytochrome b ( 379) 101 30.3 0.87 0.234 0.563 158sp|P29631|CYB_POMTE Cytochrome b ( 308) 99 29.9 0.95 0.274 0.584 113sp|P24953|CYB_CAPHI Cytochrome b ( 379) 99 29.8 1.2 0.236 0.564 140
Query: atp6_human.aa ATP synthase a chain - 226 aaLibrary: 5190103 residues in 13351 sequences
fasta.bioch.virginia.edu/biol4230
28
The best scores are: ( len) s-w bits E(13351) %_id %_sim alensp|P0AB98|ATP6_ECOLI ATP synthase a chain (AT ( 271) 1774 416.8 3.e-117 1.000 1.000 271sp|P06451|ATPI_SPIOL Chloroplast ATP synthase ( 247) 274 70.4 5.8e-13 0.270 0.616 211sp|P69371|ATPI_ATRBE Chloroplast ATP synthase ( 247) 271 69.7 9.3e-13 0.270 0.607 211sp|P08444|ATP6_SYNP6 ATP synthase a chain (AT ( 261) 271 69.7 9.9e-13 0.267 0.600 240sp|P06452|ATPI_PEA Chloroplast ATP synthase a ( 247) 266 68.5 2.1e-12 0.274 0.614 223sp|P30391|ATPI_EUGGR Chloroplast ATP synthase ( 251) 265 68.3 2.5e-12 0.298 0.596 225sp|P0C2Y5|ATPI_ORYSA Chloroplast ATP synthase ( 247) 260 67.2 5.4e-12 0.259 0.603 239sp|P27178|ATP6_SYNY3 ATP synthase a chain (AT ( 276) 260 67.1 6.1e-12 0.264 0.578 258sp|P06289|ATPI_MARPO Chloroplast ATP synthase ( 248) 250 64.8 2.7e-11 0.261 0.621 211sp|P07925|ATP6_MAIZE ATP synthase a chain (AT ( 291) 215 56.7 8.7e-09 0.259 0.578 232sp|P68526|ATP6_TRITI ATP synthase a chain (AT ( 386) 209 55.3 3.1e-08 0.259 0.603 239sp|P00854|ATP6_YEAST ATP synthase a chain pre ( 259) 204 54.2 4.5e-08 0.235 0.578 277sp|P05499|ATP6_TOBAC ATP synthase a chain (AT ( 395) 189 50.7 7.8e-07 0.220 0.582 268sp|P00846|ATP6_HUMAN ATP synthase a chain (AT ( 226) 178 48.2 2.5e-06 0.237 0.589 236sp|P00852|ATP6_EMENI ATP synthase a chain pre ( 256) 178 48.2 2.8e-06 0.209 0.590 244sp|P00849|ATP6_XENLA ATP synthase a chain (AT ( 226) 173 47.1 5.5e-06 0.261 0.630 165sp|P00847|ATP6_BOVIN ATP synthase a chain (AT ( 226) 172 46.8 6.5e-06 0.233 0.581 236sp|P14862|ATP6_COCHE ATP synthase a chain (AT ( 257) 171 46.6 8.7e-06 0.204 0.608 265sp|P00848|ATP6_MOUSE ATP synthase a chain (AT ( 226) 166 45.5 1.7e-05 0.259 0.617 193sp|P00851|ATP6_DROYA ATP synthase a chain (AT ( 224) 139 39.2 0.0013 0.225 0.549 253
sp|P24962|CYB_STELO Cytochrome b ( 379) 125 35.9 0.021 0.223 0.575 193sp|P09716|US17_HCMVA Hypothetical protein HVL ( 293) 109 32.3 0.21 0.260 0.565 131sp|P68092|CYB_STEAT Cytochrome b ( 379) 109 32.2 0.27 0.211 0.562 194sp|P24960|CYB_ODOHE Cytochrome b ( 379) 104 31.1 0.61 0.210 0.555 200sp|P03887|NU1M_BOVIN NADH-ubiquinone oxidored ( 318) 98 29.7 1.3 0.287 0.545 167sp|P24992|CYB_ANTAM Cytochrome b ( 379) 99 29.9 1.4 0.192 0.565 193
Query: atp6_ecoli.aa ATP synthase a - 271 aaLibrary: 5190103 residues in 13351 sequences
fasta.bioch.virginia.edu/biol4230
Similarity score (and significance) depends on the query perspective

1/18/18
15
Homology is Transitive
(on domains)
29
Human mito
E. coli
Euglena chloro.SynechocystisCyanobacteriaMarch. chloro.
Spinach chloro.Tobacco chloro. 0.007 : 10-13
0.001 : 10-13
0.0007 : 10-12
0.007 : 10-11
0.006 : 10-13
0.001 : 10-13
0.02 : 10-12
10-6 : 10-117
Pea chloro.
10-90 : 10-6
Bovine mitoMouse mito
Frog mitoDros. mito
10-23 : 10-8
10-18 : 10-5
0.0006 : 10-12
10-1 : /10-6
10-13 : 10-9
10-15 : 10-8
Rice chloro.
10-70 : 10-5
10-73 : 10-6
10-45 : 10-6
10-26 : 0.0013
Yeast mito.
Cochliobolus mito.Aspergillus mito.
Corn mito.Wheat mito.
vs human : E. coli
vs human : E. colifasta.bioch.virginia.edu/biol4230
The best scores are: s-w bits E(454402) %_id %_sim alenKAT2B_HUMAN Histone acetyltransferase KAT2B ( 832) 3820 1456. 0 1.000 1.000 832KAT2A_HUMAN Histone acetyltransferase KAT2A ( 837) 2747 1049. 0 0.721 0.870 813GCN5_SCHPO Histone acetyltransferase gcn5 ( 454) 867 334.7 3e-90 0.483 0.768 354GCN5_YEAST Histone acetyltransferase GCN5 ( 439) 792 306.2 1.1e-81 0.469 0.760 354GCN5_ORYSJ Histone acetyltransferase GCN5 ( 511) 760 294.0 5.9e-78 0.436 0.755 376GCN5_ARATH Histone acetyltransferase GCN5; ( 568) 719 278.4 3.3e-73 0.434 0.740 369BPTF_HUMAN Nucleosome-remodeling factor sub (3046) 286 113.6 7.6e-23 0.495 0.804 97NU301_DROME Nucleosome-remodeling factor su (2669) 276 109.8 9.1e-22 0.511 0.819 94CECR2_HUMAN Cat eye syndrome critical regio (1484) 232 93.2 5e-17 0.371 0.790 105BRD4_HUMAN Bromodomain-containing protein 4 (1362) 214 86.4 5.2e-15 0.379 0.698 116BRD4_MOUSE Bromodomain-containing protein 4 (1400) 214 86.4 5.3e-15 0.379 0.698 116BAZ2A_HUMAN Bromodomain adjacent to zinc fi (1905) 211 85.2 1.7e-14 0.382 0.683 123BAZ2A_XENLA Bromodomain adjacent to zinc fi (1698) 206 83.3 5.5e-14 0.350 0.684 117FSH_DROME Homeotic protein female sterile; (2038) 205 82.9 8.8e-14 0.341 0.667 129BAZ2A_MOUSE Bromodomain adjacent to zinc fi (1889) 204 82.5 1e-13 0.368 0.680 125BRDT_MACFA Bromodomain testis-specific prot ( 947) 197 80.0 3e-13 0.367 0.697 109BRD3_HUMAN Bromodomain-containing protein 3 ( 726) 194 78.9 4.9e-13 0.362 0.664 116
Homology and Domains –Histone acetyltransferase KAT2B
30fasta.bioch.virginia.edu/biol4230
1/18/18
16
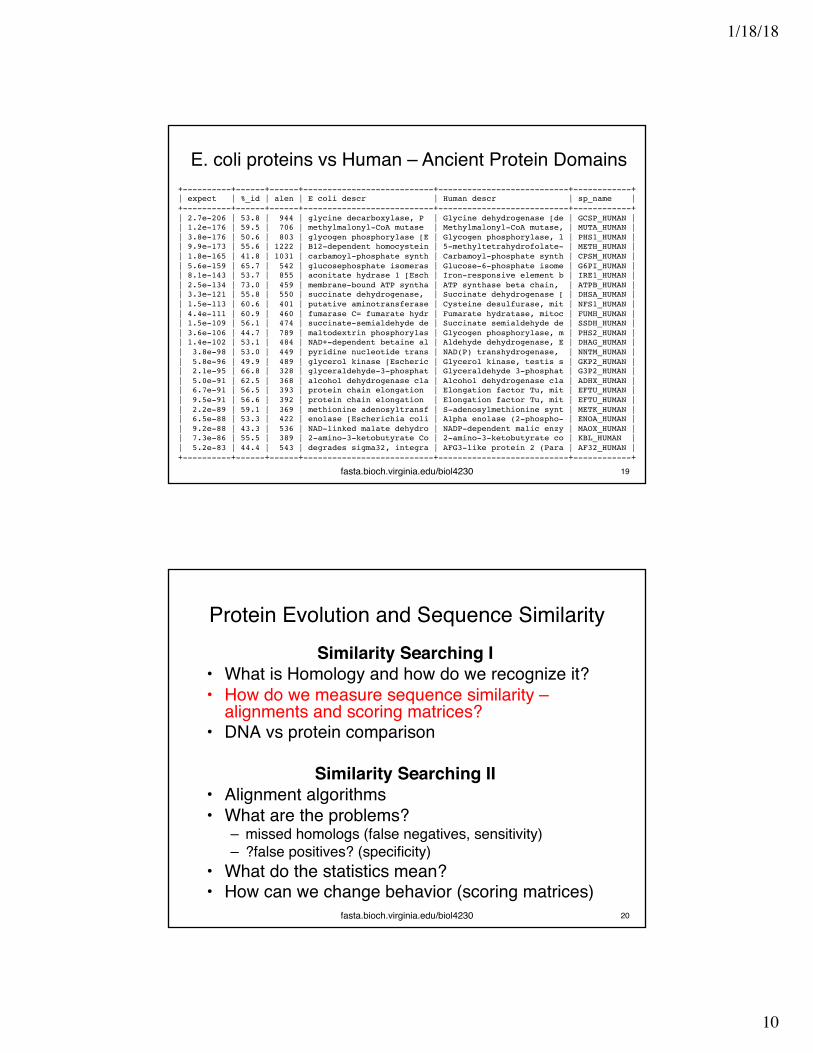
Homology and Domains –Histone acetyltransferase KAT2B
31
200 400 600 800
200 400 600 800
GNAT_dom Bromodomai
200 400 600 800
200 400 600 800
GNAT_dom Bromodomai
200 400 600 800
200 400
GNAT_dom Bromodomai
1000 2000 3000
200 400 600 800
200 400
GNAT_dom Bromodomain
KAT2B_HUMAN Histone acetyltransferase KAT2B E()< 0 832
KAT2A_HUMAN Histone acetyltransferase KAT2B E()< 0 813
GCN5_YEAST Histone acetyltransferase GCN5 1.1e-81 354
GCN5_ARATH Histone acetyltransferase GCN5 3.3e-73 369
BPTF_HUMAN Nucleosome-remodeling factor 7.6e-23 97
fasta.bioch.virginia.edu/biol4230
32
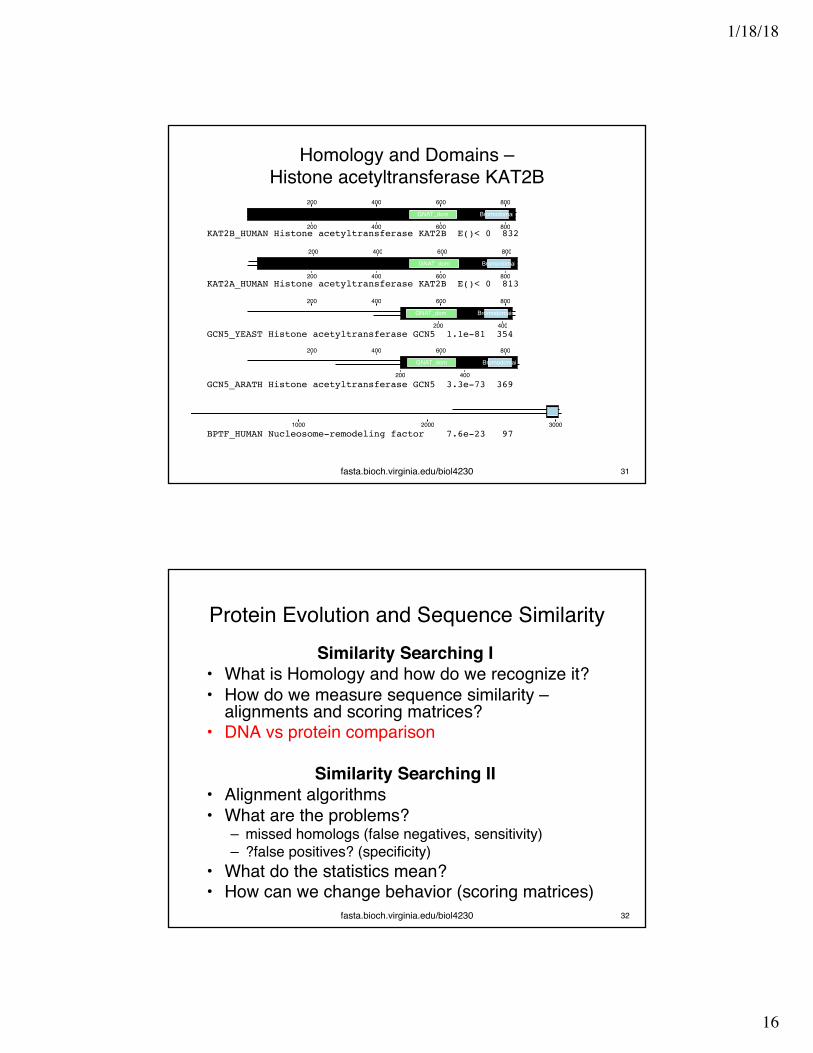
Protein Evolution and Sequence SimilaritySimilarity Searching I
• What is Homology and how do we recognize it?• How do we measure sequence similarity –
alignments and scoring matrices?• DNA vs protein comparison
Similarity Searching II• Alignment algorithms• What are the problems?
– missed homologs (false negatives, sensitivity)– ?false positives? (specificity)
• What do the statistics mean?• How can we change behavior (scoring matrices)
fasta.bioch.virginia.edu/biol4230

1/18/18
17
33
The best scores are: DNA tfastx3 prot.E(188,018) E(187,524) E(331,956)
DMGST D.melanogaster GST1-1 1.3e-164 4.1e-109 1.0e-109MDGST1 M.domestica GST-1 gene 2e-77 3.0e-95 1.9e-76LUCGLTR Lucilia cuprina GST 1.5e-72 5.2e-91 3.3e-73MDGST2A M.domesticus GST-2 mRNA 9.3e-53 1.4e-77 1.6e-62MDNF1 M.domestica nf1 gene. 10 4.6e-51 2.8e-77 2.2e-62MDNF6 M.domestica nf6 gene. 10 2.8e-51 4.2e-77 3.1e-62MDNF7 M.domestica nf7 gene. 10 6.1e-47 9.2e-77 6.7e-62AGGST15 A.gambiae GST mRNA 3.1e-58 4.2e-76 4.3e-61CVU87958 Culicoides GST 1.8e-41 4.0e-73 3.6e-58AGG3GST11 A.gambiae GST1-1 mRNA 1.5e-46 2.8e-55 1.1e-43BMO6502 Bombyx mori GST mRNA 1.1e-23 8.8e-50 5.7e-40AGSUGST12 A.gambiae GST1-1 gene 2.3e-16 4.5e-46 5.1e-37MOTGLUSTRA Manduca sexta GST 5.7e-07 2.5e-30 8.0e-25RLGSTARGN R.legominosarum gstA 0.0029 3.2e-13 1.4e-10HUMGSTT2A H. sapiens GSTT2 0.32 3.3e-10 2.0e-09HSGSTT1 H.sapiens GSTT1 mRNA 7.2 8.4e-13 3.6e-10ECAE000319 E. coli hypothet. prot. — 4.7e-10 1.1e-09MYMDCMA Methyl. dichlorometh. DH — 1.1e-09 6.9e-07BCU19883 Burkholderia maleylacetate red.— 1.2e-09 1.1e-08NFU43126 Naegleria fowleri GST — 3.2e-07 0.0056SP505GST Sphingomonas paucim — 1.8e-06 0.0002EN1838 H. sapiens maleylaceto. iso. — 2.1e-06 5.9e-06HSU86529 Human GSTZ1 — 3.0e-06 8.0e-06SYCCPNC Synechocystis GST — 1.2e-05 9.5e-06HSEF1GMR H.sapiens EF1g mRNA — 9.0e-05 0.00065
DNA vs protein sequence comparison
fasta.bioch.virginia.edu/biol4230
Detectable homologs to human enzymes(DNA vs protein comparison)
●
●
●
● ●● ● ●0
20
40
60
80
100
050
010
0015
0020
0025
0030
00
Divergence time (Mya)
quer
ies
dete
ctin
g ho
mol
ogs
●
SSEARCH prot:protBLASTP prot:protFASTX DNA:protBLASTX DNA:protBLASTN DNA:DNA
humanmou
seD. re
rio
D. mela
no.
yeas
tA. th
aliana
P. fal
ciparu
m
E. coli
fasta.bioch.virginia.edu/biol4230 34

1/18/18
18
Why is protein comparison more sensitive?• Larger alphabet: 20 aa vs 4 nt, means long
alignments less likely by chance• similarity scoring matrix
– proteins have BLOSUM62: L ~ (V,I)– DNA typically match/mismatch A ≠ G– in 3rd codon position, DNA mismatch can be amino
acid identity• Smaller databases• Better statistics
– for proteins, E() < 0.001 is 1/1000 (unrelated looks like random)
– for DNA, E() < 10-10 a more reliable threshold (unrelated doesn't always look random)
fasta.bioch.virginia.edu/biol4230 35
Computer lab:fasta.bioch.virginia.edu/biol4230/blast_demo.html
• Significant hits are homologous• Non-significant hits? Homologous or not?• Are all aligned residues homologous• Are unaligned residues non-homologous• Are domains really missing?• Run a search from the command line
36fasta.bioch.virginia.edu/biol4230
Related Documents