Protein and mineral characterisation of rendered meat and bone meal M. Buckley a,⇑ , K.E.H. Penkman a , T.J. Wess b,1 , S. Reaney c , M.J. Collins a a BioArCh Departments of Biology, Archaeology and Chemistry, University of York, Wentworth Way, York YO10 5DD, United Kingdom b School of Optometry and Vision Sciences, Cardiff University, Maindy Road, Cathays, Cardiff, CF24 4LU, United Kingdom c Vetinary Laboratory Agency, West House, Station Road, Thirsk, North Yorkshire YO7 1PZ, United Kingdom article info Article history: Received 8 July 2011 Received in revised form 23 December 2011 Accepted 23 February 2012 Available online 14 March 2012 Keywords: Collagen Osteocalcin MBM MALDI Species identification abstract We report the characterisation of meat and bone meal (MBM) standards (Set B-EFPRA) derived from cat- tle, sheep, pig and chicken, each rendered at four different temperatures (133, 137, 141 and 145 °C). The standards, prepared for an EU programme STRATFEED (to develop new methodologies for the detection and quantification of illegal addition of mammalian tissues in feeding stuffs), have been widely circulated and used to assess a range of methods for identification of the species composition of MBM. The overall state of mineral alteration and protein preservation as a function of temperature was monitored using small angle X-ray diffraction (SAXS), amino acid composition and racemization analyses. Progressive increases in protein damage and mineral alteration in chicken and cattle standards was observed. In the case of sheep and pig, there was greater damage to the proteins and alteration of the minerals at the lowest treatment temperature (133 °C), suggesting that the thermal treatments must have been com- promised in some way. This problem has probably impacted upon the numerous studies which tested methods against these heat treatments. We use protein mass spectrometric methods to explore if ther- mostable proteins could be used to identify rendered MBM. In more thermally altered samples, so-called ‘thermostable’ proteins such as osteocalcin which has been proposed as a ideal target to speciate MBM were no longer detectable, but the structural protein type I collagen could be used to differentiate all four species, even in the most thermally altered samples. Ó 2012 Elsevier Ltd. All rights reserved. 1. Introduction Meat and bone meal (MBM) is a component of animal feed, gen- erated from the low-value components of animal carcasses and used to supply essential amino acids to lactating and fast-growing animals. Current EU legislation restricts the use of MBM in animal feeds, and microscopy (EC152/2009, ANNEX VI) is currently the only official method approved by the European Commission for the detection of illegal MBM in animal feed. One aspect of the EU funded STRATFEED project (G6RD-2000-CT-00414), which ex- plored new methodologies for the detection of mammalian tissues in feedstuffs, was the preparation of a series of standard MBM sam- ples. These samples of cattle, sheep, pig and chicken meals (133, 137, 141 or 145 °C) were each prepared in a pilot plant owned by Prosper de Mulder (UK). These standards have now been widely circulated and used in 19 different reports (Google Scholar, 3/12/ 2011) for assessing methods for speciation of MBM. Here we report a characterisation of the proteins in these sam- ples using amino acid composition and racemization analysis, al- lied with protein massspectrometry. In addition to conventional protein mass spectrometry methods, osteocalcin analyses are pre- sented which have recently been reported as a potential species marker in MBM (Balizs et al., 2011), to make appropriate compar- isons to other identified proteins in the higher rendering tempera- tures. In addition we examine changes in the mineral phase of bone using small angle X-ray spectroscopy (SAXS), as the poorly crystalline apatite undergoes diagenetic changes with heating (Etok et al., 2007; Wess et al., 2002; Zizak et al., 2003). There has been much interest in the use of proteins as species- specific markers in processed foods (Muldoon, Onisk, Brown, & Stave, 2004), including MBM (Kim et al., 2004, 2005) and for sub- fossil samples in archaeology and palaeontology (Curry, 1988; Nielsen-Marsh, 2002). This is largely due to their greater resilience to hydrolytic degradation than DNA. Some initial studies have fo- cused on particular soft tissue proteins such as troponin, due to their proposed thermostability and abundance in foods derived from meat (Chen, Hsieh & Bridgman, 1998). However, the proteins protected by the mineral phase of bone have more recently been considered a more logical source of robust biomarkers, particularly the two dominant bone proteins, type I collagen (Buckley, Collins, Thomas-Oates, & Wilson, 2009; Ocan~a et al., 2004) and the most 0308-8146/$ - see front matter Ó 2012 Elsevier Ltd. All rights reserved. http://dx.doi.org/10.1016/j.foodchem.2012.02.167 ⇑ Corresponding author. Present address: Faculty of Life Sciences, Manchester Interdisciplinary Biocentre, 131 Princess Street, University of Manchester, Man- chester M1 7DN, United Kingdom. Tel.: +44 (0) 161 3065175. E-mail address: [email protected] (M. Buckley). 1 Tel.: +44 (0) 29 2087 0117. Food Chemistry 134 (2012) 1267–1278 Contents lists available at SciVerse ScienceDirect Food Chemistry journal homepage: www.elsevier.com/locate/foodchem

Welcome message from author
This document is posted to help you gain knowledge. Please leave a comment to let me know what you think about it! Share it to your friends and learn new things together.
Transcript
Food Chemistry 134 (2012) 1267–1278
Contents lists available at SciVerse ScienceDirect
Food Chemistry
journal homepage: www.elsevier .com/locate / foodchem
Protein and mineral characterisation of rendered meat and bone meal
M. Buckley a,⇑, K.E.H. Penkman a, T.J. Wess b,1, S. Reaney c, M.J. Collins a
a BioArCh Departments of Biology, Archaeology and Chemistry, University of York, Wentworth Way, York YO10 5DD, United Kingdomb School of Optometry and Vision Sciences, Cardiff University, Maindy Road, Cathays, Cardiff, CF24 4LU, United Kingdomc Vetinary Laboratory Agency, West House, Station Road, Thirsk, North Yorkshire YO7 1PZ, United Kingdom
a r t i c l e i n f o a b s t r a c t
Article history:Received 8 July 2011Received in revised form 23 December 2011Accepted 23 February 2012Available online 14 March 2012
Keywords:CollagenOsteocalcinMBMMALDISpecies identification
0308-8146/$ - see front matter � 2012 Elsevier Ltd. Ahttp://dx.doi.org/10.1016/j.foodchem.2012.02.167
⇑ Corresponding author. Present address: FacultyInterdisciplinary Biocentre, 131 Princess Street, Unichester M1 7DN, United Kingdom. Tel.: +44 (0) 161 3
E-mail address: [email protected] (M.1 Tel.: +44 (0) 29 2087 0117.
We report the characterisation of meat and bone meal (MBM) standards (Set B-EFPRA) derived from cat-tle, sheep, pig and chicken, each rendered at four different temperatures (133, 137, 141 and 145 �C). Thestandards, prepared for an EU programme STRATFEED (to develop new methodologies for the detectionand quantification of illegal addition of mammalian tissues in feeding stuffs), have been widely circulatedand used to assess a range of methods for identification of the species composition of MBM. The overallstate of mineral alteration and protein preservation as a function of temperature was monitored usingsmall angle X-ray diffraction (SAXS), amino acid composition and racemization analyses. Progressiveincreases in protein damage and mineral alteration in chicken and cattle standards was observed. Inthe case of sheep and pig, there was greater damage to the proteins and alteration of the minerals atthe lowest treatment temperature (133 �C), suggesting that the thermal treatments must have been com-promised in some way. This problem has probably impacted upon the numerous studies which testedmethods against these heat treatments. We use protein mass spectrometric methods to explore if ther-mostable proteins could be used to identify rendered MBM. In more thermally altered samples, so-called‘thermostable’ proteins such as osteocalcin which has been proposed as a ideal target to speciate MBMwere no longer detectable, but the structural protein type I collagen could be used to differentiate all fourspecies, even in the most thermally altered samples.
� 2012 Elsevier Ltd. All rights reserved.
1. Introduction
Meat and bone meal (MBM) is a component of animal feed, gen-erated from the low-value components of animal carcasses andused to supply essential amino acids to lactating and fast-growinganimals. Current EU legislation restricts the use of MBM in animalfeeds, and microscopy (EC152/2009, ANNEX VI) is currently theonly official method approved by the European Commission forthe detection of illegal MBM in animal feed. One aspect of the EUfunded STRATFEED project (G6RD-2000-CT-00414), which ex-plored new methodologies for the detection of mammalian tissuesin feedstuffs, was the preparation of a series of standard MBM sam-ples. These samples of cattle, sheep, pig and chicken meals (133,137, 141 or 145 �C) were each prepared in a pilot plant ownedby Prosper de Mulder (UK). These standards have now been widelycirculated and used in 19 different reports (Google Scholar, 3/12/2011) for assessing methods for speciation of MBM.
ll rights reserved.
of Life Sciences, Manchesterversity of Manchester, Man-065175.Buckley).
Here we report a characterisation of the proteins in these sam-ples using amino acid composition and racemization analysis, al-lied with protein massspectrometry. In addition to conventionalprotein mass spectrometry methods, osteocalcin analyses are pre-sented which have recently been reported as a potential speciesmarker in MBM (Balizs et al., 2011), to make appropriate compar-isons to other identified proteins in the higher rendering tempera-tures. In addition we examine changes in the mineral phase ofbone using small angle X-ray spectroscopy (SAXS), as the poorlycrystalline apatite undergoes diagenetic changes with heating(Etok et al., 2007; Wess et al., 2002; Zizak et al., 2003).
There has been much interest in the use of proteins as species-specific markers in processed foods (Muldoon, Onisk, Brown, &Stave, 2004), including MBM (Kim et al., 2004, 2005) and for sub-fossil samples in archaeology and palaeontology (Curry, 1988;Nielsen-Marsh, 2002). This is largely due to their greater resilienceto hydrolytic degradation than DNA. Some initial studies have fo-cused on particular soft tissue proteins such as troponin, due totheir proposed thermostability and abundance in foods derivedfrom meat (Chen, Hsieh & Bridgman, 1998). However, the proteinsprotected by the mineral phase of bone have more recently beenconsidered a more logical source of robust biomarkers, particularlythe two dominant bone proteins, type I collagen (Buckley, Collins,Thomas-Oates, & Wilson, 2009; Ocan~a et al., 2004) and the most
1268 M. Buckley et al. / Food Chemistry 134 (2012) 1267–1278
abundant non-collagenous protein (NCP) osteocalcin (Balizs et al.,2011). This characterisation of the protein components in MBMaims to identify the most appropriate sources of species biomark-ers, whilst the amino acid racemization and mineral characterisa-tion studies illustrate the states of alteration at increasingrendering temperature.
2. Materials and methods
2.1. Preparation of MBM
2.1.1. GeneralAs part of the STRATFEED project, which looked at new method-
ologies for the detection of mammalian tissues in feedstuffs, a pro-tocol was followed to ensure the quality, origin, and processingdetails would be fully documented and this was supported byEuropean Fat Processors and Renderers Association (EFPRA). Thesesamples were produced in a pilot plant owned by Prosper de Mul-der (UK) where batches of cattle, sheep, pig and chicken mealswere ground through a 50 mm plate grinder and heated in an ovenat 100 �C. The cooker was vented for 10 min and the temperatureraised to one of the focus test temperatures starting with the com-monly used temperature (133, 137, 141 or 145 �C), under 3 barpressure. After 20 min, the pressure was released, and when themoisture level of 5–10% was reached, the MBM was dischargedfrom the cooker, pressed and ground. This resulted in the creationof a set of 16 standard samples (MBM of four species rendered atfour temperatures) called Set B-EFPRA (Garrido-Varo et al., 2005).Temperatures were raised during grinding but these temperatureswere not monitored; on one occasion a sample (of avian MBM)caught fire in the drying shed after grinding.
However, despite several other studies being carried out onthem as part of the STRATFEED project, the standards themselveshad not been analysed to establish if their amino acid composi-tions, and in particular the extent of amino acid degradation (rac-emization), were consistent with their gradually increasingrendering temperatures (Liardon & Hurrel, 1983).
2.1.2. EU standardised sedimentation of MBM samplesThe MBM sample was ground in a mill (mesh size 2 mm) to pro-
duce particles of approximate size 1.5–1.7 mm. The ground samplewas then added to a conical settlement beaker in 50 ml tetrachlo-roethylene (TCE) and the bone particles allowed to separate fromthe remaining tissues and organic material for 1 min stirringrepeatedly. The sediment was left to stand for 5 min and then sep-arated by removing the solvent, leaving the sediment at the bot-tom of the beaker. The sediment was taken out and dried.
2.2. Lipid removal
Pieces of unheated cattle, chicken and duck bone were lipid-ex-tracted in chloroform/methanol (83/17%) for 2 h, the soluble lipidsremoved and the bone shards allowed to dry before being groundto a fine powder with a liquid nitrogen grinder (Spexmill 6750)using a 5 min pre-cooling phase followed by three repetitions of2 min grinding and 2 min cooling steps. Since the MBM samplesdid not pellet with centrifugation in chloroform/methanol, theMBM samples (supplied as a powder) were lipid-extracted with2 ml 100% hexane (being constantly mixed for 15 min). The sam-ples were then centrifuged at 13,000 x g and the soluble lipidsremoved and discarded. A further 2 ml 100% hexane was thenadded to the pellet, vortexed and constantly mixed for 2 h. Thelipid-extracted samples were then centrifuged once more and thesupernatants discarded.
2.3. Amino acid analyses
Chiral amino acid analysis was conducted to establish the ex-tent of protein degradation. The bone particles within MBM aredominated by collagen (I). Racemization of peptide bound Asx(Asp and Asn) occurs via the formation of a cyclic succinimidylintermediate (Asu) and is therefore constrained in inflexible struc-tures, such as the extended polyproline helix of type I collagen (vanDuin & Collins, 1998). Consequently, as observed by Collins et al.(2009), the extent of Asx racemization in the ‘acid-insoluble’fraction of bone (i.e. triple helical collagen) could be expected tobe minimal, while the ‘acid-soluble’ fraction of bone, and proteinsfrom partly degraded connective tissues, could be expected toshow higher levels of racemization. Comparison of Asx racemiza-tion between sedimented and unsedimented MBM should high-light the overall differences between MBM in general, with (lessracemised) collagen remaining in the bone chips.
Amino acid composition and racemization analyses were car-ried out on unprocessed MBM, bone chips obtained on sedimenta-tion of MBM, and on acid-soluble and acid insoluble fractions ofboth. Samples of MBM prepared from cattle, pig, sheep and chickenat a range of increasing rendering temperature (133, 137, 141 and145 �C) were analysed in order to investigate the thermal stabilityof the dominant proteins.
Amino acid composition and racemization analysis was carriedout as follows:
‘Total’ fraction: Approximately 1 mg sample (bone and MBM)powder (‘total’ hydrolysable amino acid fraction) was treated with100 ll 7 M HCl under N2 at 110 �C for 18 h to demineralise thehydroxyapatite and hydrolyse peptide bonds. Samples were thendried with a centrifugal evaporator.
‘Acid soluble fraction’: Approximately 5 mg of bone mineral wasdemineralised with 200 ll 0.6 M HCl for 4 h, and following centri-fugation at 13,000 x g, the 200 ll supernatant dried with a centrif-ugal evaporator. The sample was then hydrolysed with 100 ll 6 MHCl under N2 at 110 �C for 18 h and dried by centrifugalevaporation.
‘Acid insoluble fraction’: The acid-insoluble residue from micro-centrifugation was washed five times with distilled and deionisedwater (ddH2O) and lyophilised. One milligram lyophilised residuewas measured and then hydrolysed with 100 ll 6 M HCl underN2 at 110 �C for 18 h and dried by centrifugal evaporation.
All three fractions for each sample were then separated andanalysed by RP-HPLC using fluorescence detection following amodification of the method of Kaufman and Manley (1998) inwhich pre-column derivatisation (with o-phthaldialdehyde (OPA)together with the chiral thiol, N-isobutyryl-L-cysteine (IBLC)) isused to yield fluorescent diastereomeric derivatives of chiral pri-mary amino acids) that are separated by a C18 stationary phase.Following a tenfold dilution in 0.01 mM L-homo-arginine, a 2 lLsample was injected and mixed online with 2.2 mL of derivitisingreagent (260 mM IBLC and 170 mM OPA in 1 M potassium boratebuffer, adjusted to pH 10.4 with potassium hydroxide pellets).The amino acids were separated on a C18 HyperSil BDS column(5 ± 250 mm) at 25 �C with a gradient elution of three solvents: so-dium acetate buffer (solvent A; 23 mM sodium acetate trihydrate,1.5 mM sodium azide, 1.3 mM EDTA, adjusted to pH 6.00 ± 0.01with 10% acetic acid and sodium hydroxide), methanol (solventC) and acetonitrile (solvent D). The L and D isomers of ten aminoacids were routinely analysed. During preparative hydrolysis bothasparagine and glutamine undergo rapid irreversible deamidationto aspartic acid and glutamic acid, respectively (Hill, 1965), makingit not possible to distinguish between the acidic amino acids andtheir amide derivatives (hereafter reported together as Asx andGlx respectively). Principal component analyses using a non-normalised classical classification type were created in XLstat.
M. Buckley et al. / Food Chemistry 134 (2012) 1267–1278 1269
2.4. Osteocalcin analysis
2.4.1. GeneralCattle and chicken MBM samples treated at 133, 137, 141 and
145 �C were defatted with hexane and demineralised with EDTA.For controls, samples of powdered bone from the four species; cat-tle, sheep, pig and chicken, were also defatted and demineralisedfor analysis.
Osteocalcin was also isolated from aliquots of defatted MBMsamples following the method described by Buckley et al. (2008),producing OC-containing C18 fractions. In brief, 50 mg of bonepowder were subject to demineralisation in 1 ml 0.5 M sodiumEDTA (pH 8.2) for 24 h with constant mixing. Following demineral-isation, the samples were centrifuged at 15,000 x g for 10 min, thesupernatant collected and the pellet discarded. The 100 mg C18 so-lid phase extraction (SPE) column (Amersham Biosciences) usedfor OC purification was prepared with 1 bed volume of methanol,followed by 1 bed volume of 90% acetonitrile (ACN), 0.1% trifluoro-acetic acid (TFA) (v/v) and subsequently by one bed volume of 5%ACN, 0.1% TFA (v/v). The demineralised supernatant from eachsample was then applied to a prepared column and allowed to passthrough under gravity. Once the meniscus of the sample reachedthe solid phase of the column, two bed volumes of 5% ACN, 0.1%TFA (v/v) were applied in order to wash the unbound peptides fromthe column. Following these washes, a stepped gradient was ap-plied consisting of the following concentrations of ACN in 0.1%TFA (v/v) in order: 26%, 32%, 36%, 40%, and collected in 2 ml plasticmicrofuge tubes. These fractions were determined as the optimumfor OC retrieval with the 36% fractions found to yield the mostpurified and concentrated OC (Ostrom et al., 2000; Buckley et al.,2008). The 36% fractions were then dried overnight in a centrifugalevaporator and resuspended with 10 ml of 1% n-octyl-glucopyran-oside in 50 mM Tris buffer pH 7.4. The resuspended fractions werediluted tenfold into 5% ACN, 0.1% TFA, and 0.5 ml spotted onto aMALDI target plate (Applied Biosystems). Then 0.5 ll of a-cyano-4-hydroxycinnamic acid matrix solution (1% in ACN/H2O 1:1 v:v)was applied to the sample spot whilst still wet and allowed toair dry. The target plate was then loaded into the AB 4700 massspectrometer and each sample was analysed by MALDI-TOF-MSin linear mode. Each spectrum was acquired using a mass/charge(m/z) range of 900–6000, where the expected m/z value for the bo-vine OC MH+ ion is 5721.
2.4.2. Gelatine removal by ultrafiltrationTo reduce the potential suppression effects on the isolation of
OC, high molecular-weight gelatine was removed from one aliquotof each chicken MBM sample (chosen due to availability of com-plete genome sequence) prior to OC isolation using ultrafiltration.2 ml EDTA solubilised proteins were added to Millipore 4 ml10 kDa molecular weight cut-off (MWCO) ultrafiltration unitsand centrifuged at 5000 x g for 30 min. 4 ml 50 mM ammoniumbicarbonate was added and centrifuged and this step repeated.The filtrates were then applied to the C18 SPE cartridges for OCisolation.
2.4.3. SPE-MALDI-MS analysis of osteocalcinFractions eluted from the C18 SPE were diluted tenfold into 5%
acetonitrile (ACN)/0.1% trifluoroacetic acid (TFA) and 0.5 ll spottedonto an Applied Biosystems 192 well MALDI target plate. 0.5 ll ofa-cyano hydroxycinnamic acid (Fluka) solution (1% w/v in dilu-ent = 50% ACN, 50% H2O, 0.1% TFA, and this solution diluted four-fold in diluent) was applied to the sample spot whilst still wetand allowed to air dry. The target plate was then loaded into an Ap-plied Biosystems 4700 mass spectrometer and one aliquot of eachof the samples was directly analysed by MALDI-TOF-MS using thelinear detector with an m/z range 900-6000. The spectra were then
noise filtered in Applied Biosytems Data Explorer (Noise RemovalStd. Dev = 2) on all spectra resulting from MBM samples. The m/zvalues of peaks observed in samples were searched against possi-ble non-specific cleavage products of chicken OC (UniProt Acces-sion No. P02822) and chicken collagen (I) (UniProt Accession No.P02457 for a1 chain and P02467 for a2 chain) using the FindPepttool (http://www.expasy.ch/tools/findpept.html). Another aliquotof each of the samples was subject to LC-MALDI in order to furtherinvestigate peptides present in the expected OC fractions.
2.4.4. LC-MALDI-MS analysis of osteocalcinThree microliters of the diluted sample is applied to an Ultimate
nanoLC (LC Packings) using a Dionex 0.2 � 50 mm PSDVB monolithcolumn with a 1–50% (solvent B in A) continuous gradient in20 min (solvent A = 2% ACN, 98% H2O, 0.1% HFBA; solventB = 100% ACN, 0.1% HFBA) at a flow rate of 3.0 ll/min. Six secondfractions were plated onto a 180 spot MALDI target plate simulta-neously with matrix solution (6 mg/ml a-cyano hydroxycinnamicacid (Sigma), 26 ll/ml of 5 mg/ml ammonium citrate (Sigma) in60% ACN/40% H2O) using a Dionex Probot sample spotter. Follow-ing the gradient, the concentration of solvent B (in A) was raised to85% in preparation for the following sample. The MALDI analysiswas carried out using both linear detector mode (m/z range 900–6000 for OC M+H+ screening) and reflectron detector mode (m/zrange 900–4400 for peptide analysis). Following reflectron detec-tor mode, the 15 MS peaks of greatest S/N (above 40) were selectedfor product ion tandem MS (MS/MS) analysis. The resulting prod-uct ion spectra were then collectively converted to peak lists byApplied Biosystems’ 4000 Explorer version 3.6 with a S/N cut-offof 15, and searched against the UniProt database (31st January2007) by Mascot version 2.2. ‘No enzyme’ was selected and thevariable modifications of oxidation of methionine, hydroxylationof proline and lysine, and the deamidation of glutamine and aspar-agine were included. Mass tolerances of 0.5 Da were applied toboth precursor and fragment ions. 254,609 protein sequences weresearched against with a 99% significance (p = 0.01) threshold. Sig-nificant peptide matches (Mascot ‘bold red’ matches; matches pre-sented in bold represent their first match, and those presented inred represent the top ranking peptide) were selected for in eachprotein match and Mascot’s ‘standard scoring’ was applied to eachsearch.
2.5. Characterisation of the acid-insoluble residue
2.5.1. GeneralThe acid-insoluble pellet obtained on centrifugation of the sam-
ples resulting from 4 h demineralisation with 0.6 M HCl at 4 �C wasrinsed five times with 2 ml ddH2O until the pH reached neutral.The rinsed pellet was then freeze-dried overnight before weighingto determine the dry weight. One micro gram of the acid-insolublepellet was then resuspended in 80 ll 50 mM ammonium bicarbon-ate and gelatinised for 3 h at 65 �C. Following gelatinisation, thesample was centrifuged for 15 min at 13,000 x g and an aliquot ofthe supernatant removed for tryptic digestion.
2.5.2. LC-MALDI-MS analysis of acid-insoluble residueOne micro liter of 1 lg/ll trypsin was added to 9 lL of the acid-
insoluble pellet and incubated at 37 �C for 18 h. A 3 lL aliquot wasanalysed by LC-MALDI, with database searches carried out usingMascot’s MudPIT scoring as well as standard scoring. With stan-dard scoring, the protein score is the sum of the ion scores of allthe non-duplicate peptides; where there are duplicate peptides,the highest scoring peptide is used. For MudPIT scoring, the scorefor each peptide is not the absolute score but the amount that itis beyond its threshold. Therefore, peptides with a score belowthe threshold do not count towards the protein score. The average
1270 M. Buckley et al. / Food Chemistry 134 (2012) 1267–1278
of the thresholds used is added to the score. For each peptide, thethreshold is the homology threshold if it exists; otherwise it is theidentity threshold. MudPIT scoring thus reduces the amount ofhigh scoring protein matches that consist entirely of poorlymatched peptides. By default, MudPIT scoring is generally consid-ered more appropriate for searches with greater than 1000 spectra(Matrix Science).
2.6. Mineral characterisation
For SAXS analysis, 1.5 mg of raw MBM sample was loaded into aspecially designed sample carriage between two mica sheets witha spacing of 0.2 mm and then attached to a stage that allowedaccurate positioning of the sample. The stage was mounted intoa vacuum chamber of the NanoSTAR (Bruker AXS, Karlsruhe)X-ray facility at Cardiff University, which uses a SAXS sample-to-detector distance of 1.25 m. The data collection procedure usedfollowed that described in detailed by Wess et al. (2002). The datacollected was corrected for camera distortions, a background im-age subtracted, and images were analysed using in-house software.The two-dimensional detector output was converted into spheri-cally averaged one-dimensional profiles. Hence values for crystalthickness (T) of the smallest dimension can be determined fromthe SAXS data. A detailed procedure for these calculations isdescribed elsewhere (Fratzl, Paris, Klaushofer, & Landis, 1996).
3. Results
3.1. Amino acid analyses
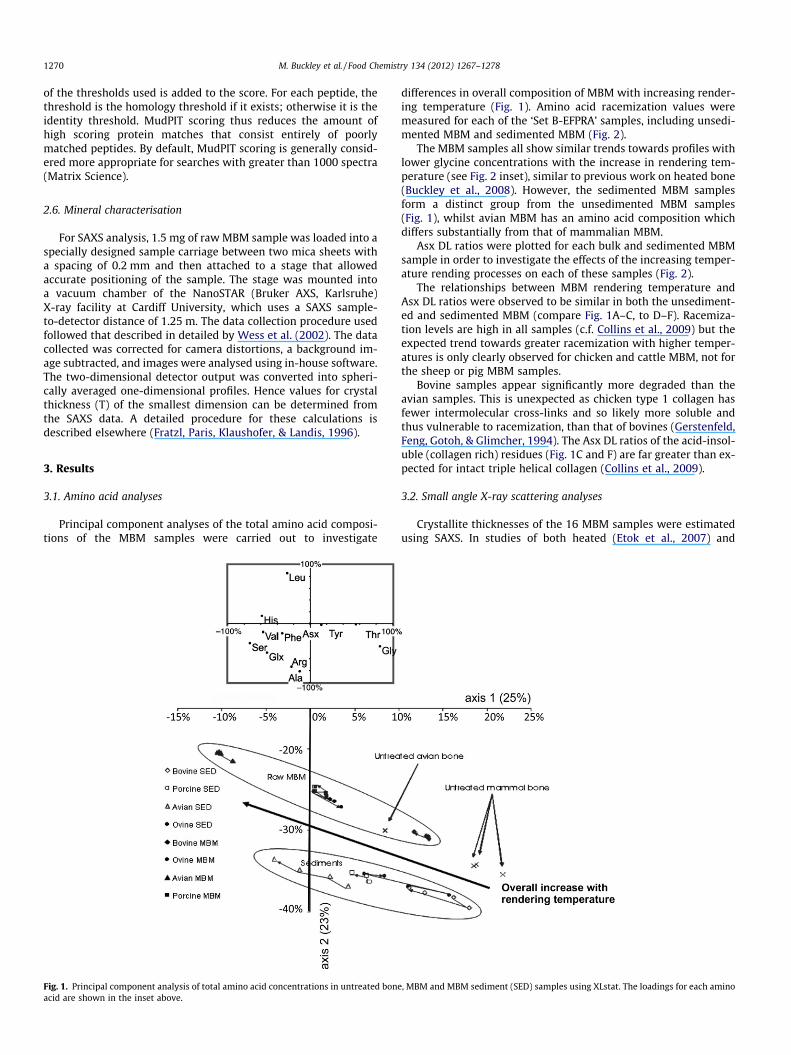
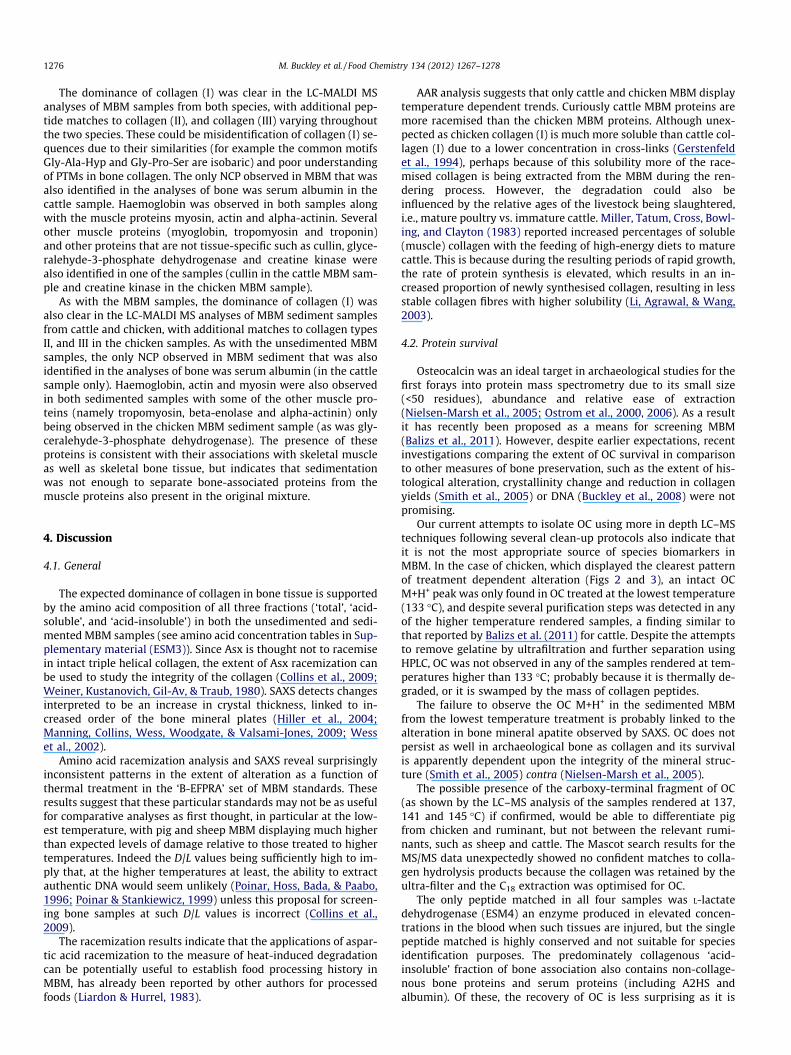
Principal component analyses of the total amino acid composi-tions of the MBM samples were carried out to investigate
Fig. 1. Principal component analysis of total amino acid concentrations in untreated boneacid are shown in the inset above.
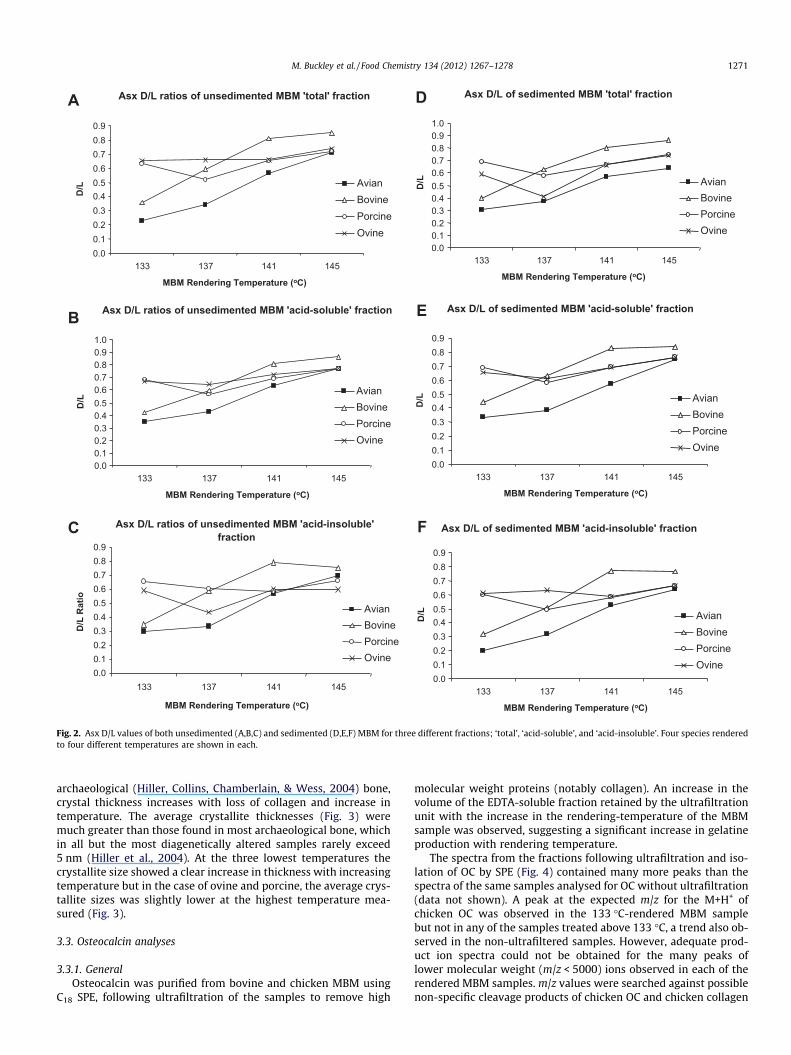
differences in overall composition of MBM with increasing render-ing temperature (Fig. 1). Amino acid racemization values weremeasured for each of the ‘Set B-EFPRA’ samples, including unsedi-mented MBM and sedimented MBM (Fig. 2).
The MBM samples all show similar trends towards profiles withlower glycine concentrations with the increase in rendering tem-perature (see Fig. 2 inset), similar to previous work on heated bone(Buckley et al., 2008). However, the sedimented MBM samplesform a distinct group from the unsedimented MBM samples(Fig. 1), whilst avian MBM has an amino acid composition whichdiffers substantially from that of mammalian MBM.
Asx DL ratios were plotted for each bulk and sedimented MBMsample in order to investigate the effects of the increasing temper-ature rending processes on each of these samples (Fig. 2).
The relationships between MBM rendering temperature andAsx DL ratios were observed to be similar in both the unsediment-ed and sedimented MBM (compare Fig. 1A–C, to D–F). Racemiza-tion levels are high in all samples (c.f. Collins et al., 2009) but theexpected trend towards greater racemization with higher temper-atures is only clearly observed for chicken and cattle MBM, not forthe sheep or pig MBM samples.
Bovine samples appear significantly more degraded than theavian samples. This is unexpected as chicken type 1 collagen hasfewer intermolecular cross-links and so likely more soluble andthus vulnerable to racemization, than that of bovines (Gerstenfeld,Feng, Gotoh, & Glimcher, 1994). The Asx DL ratios of the acid-insol-uble (collagen rich) residues (Fig. 1C and F) are far greater than ex-pected for intact triple helical collagen (Collins et al., 2009).
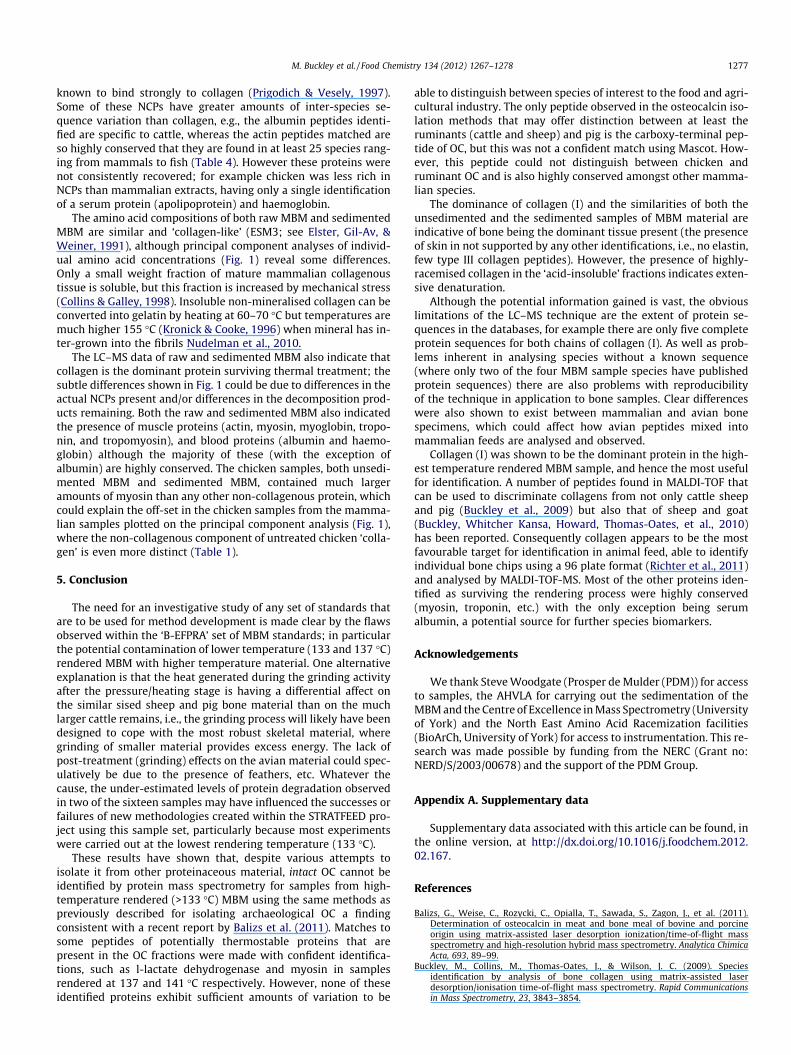
3.2. Small angle X-ray scattering analyses
Crystallite thicknesses of the 16 MBM samples were estimatedusing SAXS. In studies of both heated (Etok et al., 2007) and
, MBM and MBM sediment (SED) samples using XLstat. The loadings for each amino
0.000.100.200.300.400.500.600.700.800.901.00
133 137 141 143
MBM Rendering Temperature (oC)
D/L
Rat
io
Asx D/L ratios of unsedimented MBM 'total' fraction
0.00.10.20.30.40.50.60.70.80.9
133 137 141 145
MBM Rendering Temperature (oC)
D/L Avian
BovinePorcineOvine
Asx D/L ratios of unsedimented MBM 'acid-soluble' fraction
0.00.10.20.30.40.50.60.70.80.91.0
133 137 141 145
MBM Rendering Temperature (oC)
D/L
AvianBovinePorcineOvine
Asx D/L ratios of sedimented MBM 'acid-
0.000.100.200.300.400.500.600.700.800.90
133 137 141 143
MBM Rendering Temperature (oC)
Asx D/L ratios of unsedimented MBM 'acid-insoluble' fraction
0.00.10.20.30.40.50.60.70.80.9
133 137 141 145
MBM Rendering Temperature (oC)
D/L
Rat
io
B
F
Asx D/L of sedimented MBM 'total' fraction
0.00.10.20.30.40.50.60.70.80.91.0
133 137 141 145
MBM Rendering Temperature (oC)
D/L Avian
BovinePorcineOvine
Asx D/L of sedimented MBM 'acid-soluble' fraction
0.00.10.20.30.40.50.60.70.80.9
133 137 141 145
MBM Rendering Temperature (oC)
D/L Avian
BovinePorcineOvine
Asx D/L of sedimented MBM 'acid-insoluble' fraction
0.00.10.20.30.40.50.60.70.80.9
133 137 141 145
MBM Rendering Temperature (oC)
D/L Avian
BovinePorcineOvine
A D
E
C F
AvianBovinePorcineOvine
Fig. 2. Asx D/L values of both unsedimented (A,B,C) and sedimented (D,E,F) MBM for three different fractions; ‘total’, ‘acid-soluble’, and ‘acid-insoluble’. Four species renderedto four different temperatures are shown in each.
M. Buckley et al. / Food Chemistry 134 (2012) 1267–1278 1271
archaeological (Hiller, Collins, Chamberlain, & Wess, 2004) bone,crystal thickness increases with loss of collagen and increase intemperature. The average crystallite thicknesses (Fig. 3) weremuch greater than those found in most archaeological bone, whichin all but the most diagenetically altered samples rarely exceed5 nm (Hiller et al., 2004). At the three lowest temperatures thecrystallite size showed a clear increase in thickness with increasingtemperature but in the case of ovine and porcine, the average crys-tallite sizes was slightly lower at the highest temperature mea-sured (Fig. 3).
3.3. Osteocalcin analyses
3.3.1. GeneralOsteocalcin was purified from bovine and chicken MBM using
C18 SPE, following ultrafiltration of the samples to remove high
molecular weight proteins (notably collagen). An increase in thevolume of the EDTA-soluble fraction retained by the ultrafiltrationunit with the increase in the rendering-temperature of the MBMsample was observed, suggesting a significant increase in gelatineproduction with rendering temperature.
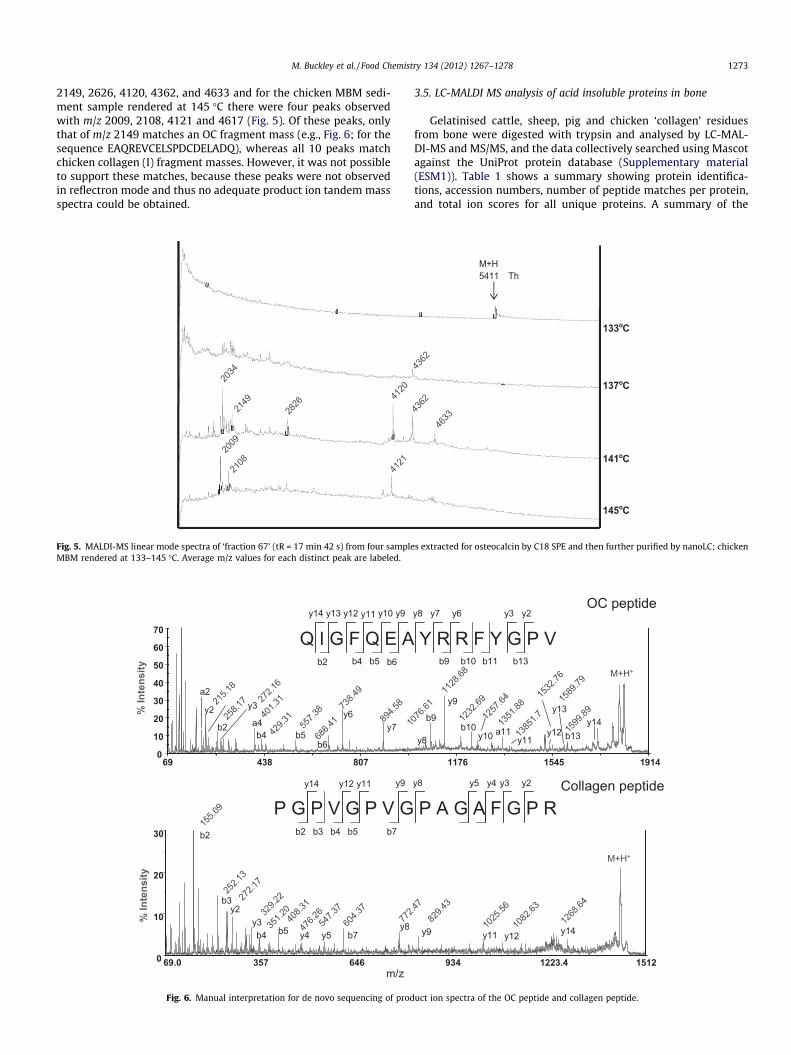
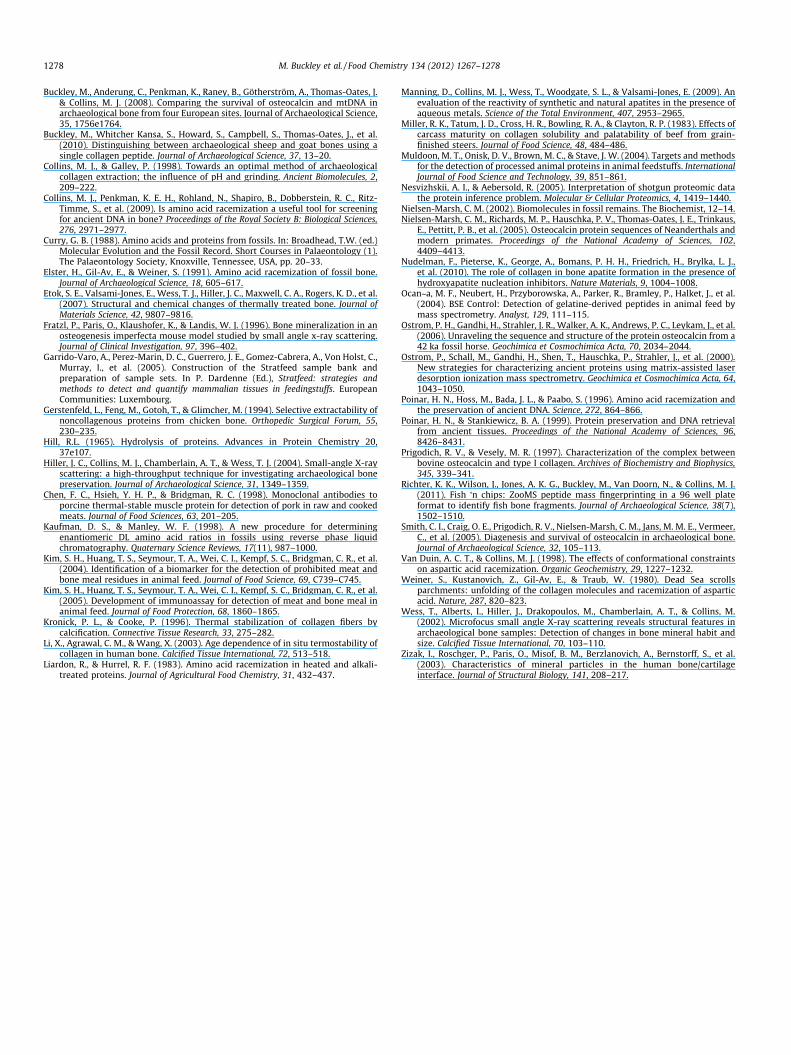
The spectra from the fractions following ultrafiltration and iso-lation of OC by SPE (Fig. 4) contained many more peaks than thespectra of the same samples analysed for OC without ultrafiltration(data not shown). A peak at the expected m/z for the M+H+ ofchicken OC was observed in the 133 �C-rendered MBM samplebut not in any of the samples treated above 133 �C, a trend also ob-served in the non-ultrafiltered samples. However, adequate prod-uct ion spectra could not be obtained for the many peaks oflower molecular weight (m/z < 5000) ions observed in each of therendered MBM samples. m/z values were searched against possiblenon-specific cleavage products of chicken OC and chicken collagen
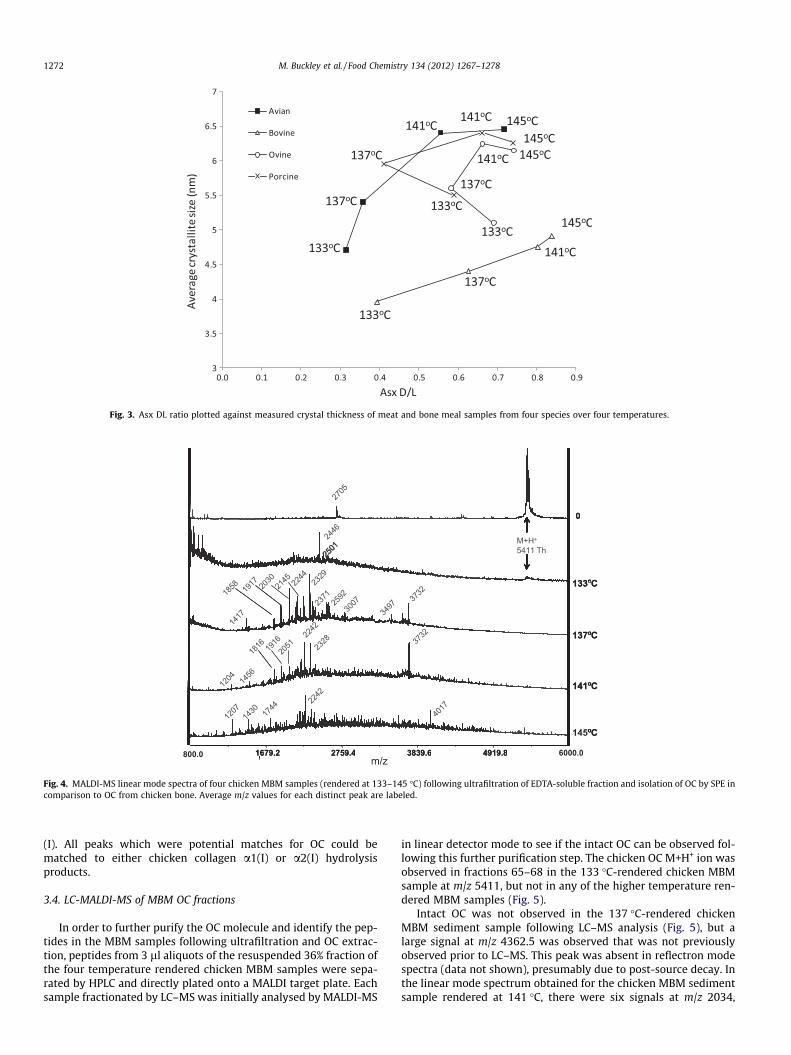
Fig. 3. Asx DL ratio plotted against measured crystal thickness of meat and bone meal samples from four species over four temperatures.
2705
27
0000
446
010101M+H+24
4
2501
2501
2501 5411 Th222
133oC133oC8 17 030
145
2329
2244
133133o
1858 19
17 203
214
712322
92 7321
2371
2592
007
9737
3
417
2 230
034
97
224214
1
373222
4137oC137oC
6 16 1 328 3
1816 19
1620
51 232
1 2
204 45
6
141oC141oC212
04 145
4 2242
712
07 430
1744
240
1712 14 1 4
145oCoC
1679 2 2759 4 3839 6 4919 8 6000 01679 2 2759 4 3839 6 4919 8 6000 01679.2 2759.4 3839.6 4919.8 6000.01679.2 2759.4 3839.6 4919.8800.0m/zm/z
Fig. 4. MALDI-MS linear mode spectra of four chicken MBM samples (rendered at 133–145 �C) following ultrafiltration of EDTA-soluble fraction and isolation of OC by SPE incomparison to OC from chicken bone. Average m/z values for each distinct peak are labeled.
1272 M. Buckley et al. / Food Chemistry 134 (2012) 1267–1278
(I). All peaks which were potential matches for OC could bematched to either chicken collagen a1(I) or a2(I) hydrolysisproducts.
3.4. LC-MALDI-MS of MBM OC fractions
In order to further purify the OC molecule and identify the pep-tides in the MBM samples following ultrafiltration and OC extrac-tion, peptides from 3 ll aliquots of the resuspended 36% fraction ofthe four temperature rendered chicken MBM samples were sepa-rated by HPLC and directly plated onto a MALDI target plate. Eachsample fractionated by LC–MS was initially analysed by MALDI-MS
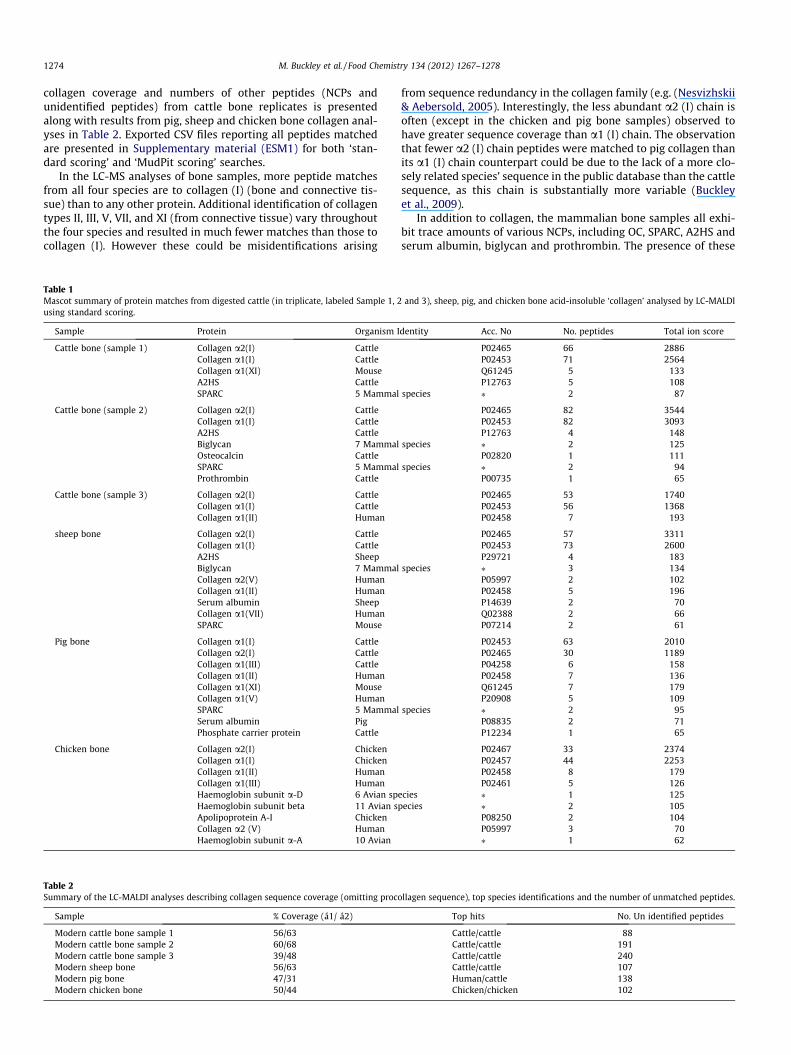
in linear detector mode to see if the intact OC can be observed fol-lowing this further purification step. The chicken OC M+H+ ion wasobserved in fractions 65–68 in the 133 �C-rendered chicken MBMsample at m/z 5411, but not in any of the higher temperature ren-dered MBM samples (Fig. 5).
Intact OC was not observed in the 137 �C-rendered chickenMBM sediment sample following LC–MS analysis (Fig. 5), but alarge signal at m/z 4362.5 was observed that was not previouslyobserved prior to LC–MS. This peak was absent in reflectron modespectra (data not shown), presumably due to post-source decay. Inthe linear mode spectrum obtained for the chicken MBM sedimentsample rendered at 141 �C, there were six signals at m/z 2034,
M. Buckley et al. / Food Chemistry 134 (2012) 1267–1278 1273
2149, 2626, 4120, 4362, and 4633 and for the chicken MBM sedi-ment sample rendered at 145 �C there were four peaks observedwith m/z 2009, 2108, 4121 and 4617 (Fig. 5). Of these peaks, onlythat of m/z 2149 matches an OC fragment mass (e.g., Fig. 6; for thesequence EAQREVCELSPDCDELADQ), whereas all 10 peaks matchchicken collagen (I) fragment masses. However, it was not possibleto support these matches, because these peaks were not observedin reflectron mode and thus no adequate product ion tandem massspectra could be obtained.
4121
2009
2034
4120
2149
2826
2108
Fig. 5. MALDI-MS linear mode spectra of ‘fraction 67’ (tR = 17 min 42 s) from four sampleMBM rendered at 133–145 �C. Average m/z values for each distinct peak are labeled.
438 807
10
20
30
40
50
60
70
% In
tens
ity
738.4
9
894.5
840
1.31
258.1
7
557.3
81
686.4
1
215.1
8
429.3
1y7
y6y2
Q I G F Q E A
y3
a4b4 b5
b6
a2
b2
y14 y13 y12 y11 y10 y9
b2 b4 b5 b6
69.0 357 6460
10
20
30
% In
tens
ity
272.1
7
329.2
2
604.3
777
240
8.31
155.0
9
547.3
7
m/z
P G P V G P V Gy12 y11 y9
b3 b5 b7
y8b7y5y4
476.2
6y3
y2
690
b2
b325
2.13
351.2
0
b4 b5
b4b2
y14
272.1
6
Fig. 6. Manual interpretation for de novo sequencing of prod
3.5. LC-MALDI MS analysis of acid insoluble proteins in bone
Gelatinised cattle, sheep, pig and chicken ‘collagen’ residuesfrom bone were digested with trypsin and analysed by LC-MAL-DI-MS and MS/MS, and the data collectively searched using Mascotagainst the UniProt protein database (Supplementary material(ESM1)). Table 1 shows a summary showing protein identifica-tions, accession numbers, number of peptide matches per protein,and total ion scores for all unique proteins. A summary of the
M+H5411 Th
4362
145
133oC
137oC
141oC
oC
4362
4633
s extracted for osteocalcin by C18 SPE and then further purified by nanoLC; chicken
1176 1545 1914
1128
.68
1232
.69
076.6
1
1351
.88
1599
.89
M+H+
b13a11b10
y9
b9
y10y8
Y R R F Y G P V
y11y12
y13y14
y8 y7 y6 y3 y2
b9 b10 b11 b13
934 1223.4 1512
.47
1268
.64
1025
.56
1082
.63
P A G A F G P Ry8 y5 y3 y2
y12
M+H+
y982
9.43
y14y11
y4
OC peptide
Collagen peptide
1532
.76
1589
.79
1385
1.71257
.64
uct ion spectra of the OC peptide and collagen peptide.
1274 M. Buckley et al. / Food Chemistry 134 (2012) 1267–1278
collagen coverage and numbers of other peptides (NCPs andunidentified peptides) from cattle bone replicates is presentedalong with results from pig, sheep and chicken bone collagen anal-yses in Table 2. Exported CSV files reporting all peptides matchedare presented in Supplementary material (ESM1) for both ‘stan-dard scoring’ and ‘MudPit scoring’ searches.
In the LC-MS analyses of bone samples, more peptide matchesfrom all four species are to collagen (I) (bone and connective tis-sue) than to any other protein. Additional identification of collagentypes II, III, V, VII, and XI (from connective tissue) vary throughoutthe four species and resulted in much fewer matches than those tocollagen (I). However these could be misidentifications arising
Table 1Mascot summary of protein matches from digested cattle (in triplicate, labeled Sample 1, 2using standard scoring.
Sample Protein Organism I
Cattle bone (sample 1) Collagen a2(I) CattleCollagen a1(I) CattleCollagen a1(XI) MouseA2HS CattleSPARC 5 Mammal
Cattle bone (sample 2) Collagen a2(I) CattleCollagen a1(I) CattleA2HS CattleBiglycan 7 MammalOsteocalcin CattleSPARC 5 MammalProthrombin Cattle
Cattle bone (sample 3) Collagen a2(I) CattleCollagen a1(I) CattleCollagen a1(II) Human
sheep bone Collagen a2(I) CattleCollagen a1(I) CattleA2HS SheepBiglycan 7 MammalCollagen a2(V) HumanCollagen a1(II) HumanSerum albumin SheepCollagen a1(VII) HumanSPARC Mouse
Pig bone Collagen a1(I) CattleCollagen a2(I) CattleCollagen a1(III) CattleCollagen a1(II) HumanCollagen a1(XI) MouseCollagen a1(V) HumanSPARC 5 MammalSerum albumin PigPhosphate carrier protein Cattle
Chicken bone Collagen a2(I) ChickenCollagen a1(I) ChickenCollagen a1(II) HumanCollagen a1(III) HumanHaemoglobin subunit a-D 6 Avian spHaemoglobin subunit beta 11 Avian sApolipoprotein A-I ChickenCollagen a2 (V) HumanHaemoglobin subunit a-A 10 Avian
Table 2Summary of the LC-MALDI analyses describing collagen sequence coverage (omitting proco
Sample % Coverage (á1/ á2)
Modern cattle bone sample 1 56/63Modern cattle bone sample 2 60/68Modern cattle bone sample 3 39/48Modern sheep bone 56/63Modern pig bone 47/31Modern chicken bone 50/44
from sequence redundancy in the collagen family (e.g. (Nesvizhskii& Aebersold, 2005). Interestingly, the less abundant a2 (I) chain isoften (except in the chicken and pig bone samples) observed tohave greater sequence coverage than a1 (I) chain. The observationthat fewer a2 (I) chain peptides were matched to pig collagen thanits a1 (I) chain counterpart could be due to the lack of a more clo-sely related species’ sequence in the public database than the cattlesequence, as this chain is substantially more variable (Buckleyet al., 2009).
In addition to collagen, the mammalian bone samples all exhi-bit trace amounts of various NCPs, including OC, SPARC, A2HS andserum albumin, biglycan and prothrombin. The presence of these
and 3), sheep, pig, and chicken bone acid-insoluble ‘collagen’ analysed by LC-MALDI
dentity Acc. No No. peptides Total ion score
P02465 66 2886P02453 71 2564Q61245 5 133P12763 5 108
species ⁄ 2 87
P02465 82 3544P02453 82 3093P12763 4 148
species ⁄ 2 125P02820 1 111
species ⁄ 2 94P00735 1 65
P02465 53 1740P02453 56 1368P02458 7 193
P02465 57 3311P02453 73 2600P29721 4 183
species ⁄ 3 134P05997 2 102P02458 5 196P14639 2 70Q02388 2 66P07214 2 61
P02453 63 2010P02465 30 1189P04258 6 158P02458 7 136Q61245 7 179P20908 5 109
species ⁄ 2 95P08835 2 71P12234 1 65
P02467 33 2374P02457 44 2253P02458 8 179P02461 5 126
ecies ⁄ 1 125pecies ⁄ 2 105
P08250 2 104P05997 3 70⁄ 1 62
llagen sequence), top species identifications and the number of unmatched peptides.
Top hits No. Un identified peptides
Cattle/cattle 88Cattle/cattle 191Cattle/cattle 240Cattle/cattle 107Human/cattle 138Chicken/chicken 102
M. Buckley et al. / Food Chemistry 134 (2012) 1267–1278 1275
NCPs is consistent with their reported associations with bone col-lagen (I) and bone mineral. Interestingly, the only avian sample(chicken) did not result in any matches to any of these NCPs, withthe only non-collagenous proteins identified being to the bloodprotein haemoglobin. This could reflect differences in tissue struc-ture, where the greater relative abundance of haemoglobin wasmasking the presence of the other NCPs in the MALDI-MSanalysis.
3.6. Acid-insoluble proteins in MBM
In order to compare the proteins surviving in MBM to those sur-viving in its sedimented components, samples of cattle and chicken
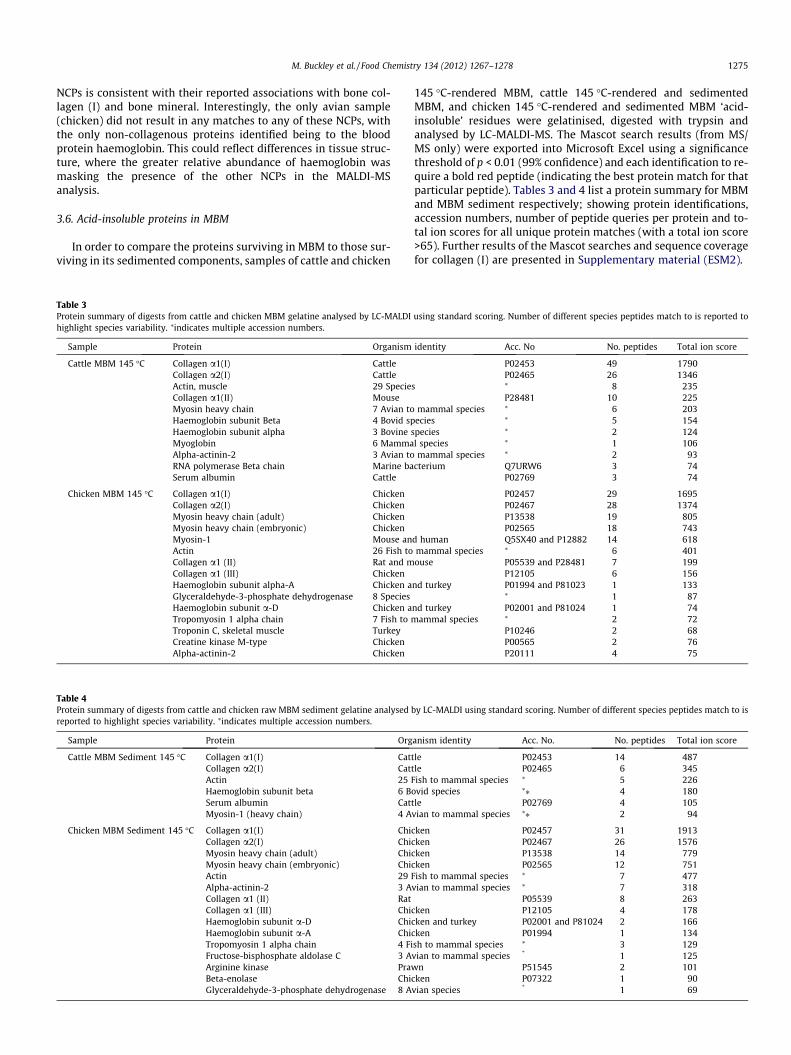
Table 3Protein summary of digests from cattle and chicken MBM gelatine analysed by LC-MALDIhighlight species variability. ⁄indicates multiple accession numbers.
Sample Protein Organism
Cattle MBM 145 �C Collagen a1(I) CattleCollagen a2(I) CattleActin, muscle 29 SpecieCollagen a1(II) MouseMyosin heavy chain 7 Avian toHaemoglobin subunit Beta 4 Bovid spHaemoglobin subunit alpha 3 Bovine sMyoglobin 6 MammaAlpha-actinin-2 3 Avian toRNA polymerase Beta chain Marine baSerum albumin Cattle
Chicken MBM 145 �C Collagen a1(I) ChickenCollagen a2(I) ChickenMyosin heavy chain (adult) ChickenMyosin heavy chain (embryonic) ChickenMyosin-1 Mouse anActin 26 Fish toCollagen a1 (II) Rat and mCollagen a1 (III) ChickenHaemoglobin subunit alpha-A Chicken aGlyceraldehyde-3-phosphate dehydrogenase 8 SpeciesHaemoglobin subunit a-D Chicken aTropomyosin 1 alpha chain 7 Fish to mTroponin C, skeletal muscle TurkeyCreatine kinase M-type ChickenAlpha-actinin-2 Chicken
Table 4Protein summary of digests from cattle and chicken raw MBM sediment gelatine analysedreported to highlight species variability. ⁄indicates multiple accession numbers.
Sample Protein Org
Cattle MBM Sediment 145 �C Collagen a1(I) CatCollagen a2(I) CatActin 25 FHaemoglobin subunit beta 6 BSerum albumin CatMyosin-1 (heavy chain) 4 A
Chicken MBM Sediment 145 �C Collagen a1(I) ChiCollagen a2(I) ChiMyosin heavy chain (adult) ChiMyosin heavy chain (embryonic) ChiActin 29 FAlpha-actinin-2 3 ACollagen a1 (II) RatCollagen a1 (III) ChiHaemoglobin subunit a-D ChiHaemoglobin subunit a-A ChiTropomyosin 1 alpha chain 4 FiFructose-bisphosphate aldolase C 3 AArginine kinase PrawBeta-enolase ChiGlyceraldehyde-3-phosphate dehydrogenase 8 A
145 �C-rendered MBM, cattle 145 �C-rendered and sedimentedMBM, and chicken 145 �C-rendered and sedimented MBM ‘acid-insoluble’ residues were gelatinised, digested with trypsin andanalysed by LC-MALDI-MS. The Mascot search results (from MS/MS only) were exported into Microsoft Excel using a significancethreshold of p < 0.01 (99% confidence) and each identification to re-quire a bold red peptide (indicating the best protein match for thatparticular peptide). Tables 3 and 4 list a protein summary for MBMand MBM sediment respectively; showing protein identifications,accession numbers, number of peptide queries per protein and to-tal ion scores for all unique protein matches (with a total ion score>65). Further results of the Mascot searches and sequence coveragefor collagen (I) are presented in Supplementary material (ESM2).
using standard scoring. Number of different species peptides match to is reported to
identity Acc. No No. peptides Total ion score
P02453 49 1790P02465 26 1346
s ⁄ 8 235P28481 10 225
mammal species ⁄ 6 203ecies ⁄ 5 154pecies ⁄ 2 124l species ⁄ 1 106mammal species ⁄ 2 93
cterium Q7URW6 3 74P02769 3 74
P02457 29 1695P02467 28 1374P13538 19 805P02565 18 743
d human Q5SX40 and P12882 14 618mammal species ⁄ 6 401ouse P05539 and P28481 7 199
P12105 6 156nd turkey P01994 and P81023 1 133
⁄ 1 87nd turkey P02001 and P81024 1 74
ammal species ⁄ 2 72P10246 2 68P00565 2 76P20111 4 75
by LC-MALDI using standard scoring. Number of different species peptides match to is
anism identity Acc. No. No. peptides Total ion score
tle P02453 14 487tle P02465 6 345
ish to mammal species ⁄ 5 226ovid species ⁄⁄ 4 180tle P02769 4 105vian to mammal species ⁄⁄ 2 94
cken P02457 31 1913cken P02467 26 1576cken P13538 14 779cken P02565 12 751ish to mammal species ⁄ 7 477
vian to mammal species ⁄ 7 318P05539 8 263
cken P12105 4 178cken and turkey P02001 and P81024 2 166cken P01994 1 134sh to mammal species ⁄ 3 129vian to mammal species * 1 125
n P51545 2 101cken P07322 1 90vian species * 1 69
1276 M. Buckley et al. / Food Chemistry 134 (2012) 1267–1278
The dominance of collagen (I) was clear in the LC-MALDI MSanalyses of MBM samples from both species, with additional pep-tide matches to collagen (II), and collagen (III) varying throughoutthe two species. These could be misidentification of collagen (I) se-quences due to their similarities (for example the common motifsGly-Ala-Hyp and Gly-Pro-Ser are isobaric) and poor understandingof PTMs in bone collagen. The only NCP observed in MBM that wasalso identified in the analyses of bone was serum albumin in thecattle sample. Haemoglobin was observed in both samples alongwith the muscle proteins myosin, actin and alpha-actinin. Severalother muscle proteins (myoglobin, tropomyosin and troponin)and other proteins that are not tissue-specific such as cullin, glyce-ralehyde-3-phosphate dehydrogenase and creatine kinase werealso identified in one of the samples (cullin in the cattle MBM sam-ple and creatine kinase in the chicken MBM sample).
As with the MBM samples, the dominance of collagen (I) wasalso clear in the LC-MALDI MS analyses of MBM sediment samplesfrom cattle and chicken, with additional matches to collagen typesII, and III in the chicken samples. As with the unsedimented MBMsamples, the only NCP observed in MBM sediment that was alsoidentified in the analyses of bone was serum albumin (in the cattlesample only). Haemoglobin, actin and myosin were also observedin both sedimented samples with some of the other muscle pro-teins (namely tropomyosin, beta-enolase and alpha-actinin) onlybeing observed in the chicken MBM sediment sample (as was gly-ceralehyde-3-phosphate dehydrogenase). The presence of theseproteins is consistent with their associations with skeletal muscleas well as skeletal bone tissue, but indicates that sedimentationwas not enough to separate bone-associated proteins from themuscle proteins also present in the original mixture.
4. Discussion
4.1. General
The expected dominance of collagen in bone tissue is supportedby the amino acid composition of all three fractions (‘total’, ‘acid-soluble’, and ‘acid-insoluble’) in both the unsedimented and sedi-mented MBM samples (see amino acid concentration tables in Sup-plementary material (ESM3)). Since Asx is thought not to racemisein intact triple helical collagen, the extent of Asx racemization canbe used to study the integrity of the collagen (Collins et al., 2009;Weiner, Kustanovich, Gil-Av, & Traub, 1980). SAXS detects changesinterpreted to be an increase in crystal thickness, linked to in-creased order of the bone mineral plates (Hiller et al., 2004;Manning, Collins, Wess, Woodgate, & Valsami-Jones, 2009; Wesset al., 2002).
Amino acid racemization analysis and SAXS reveal surprisinglyinconsistent patterns in the extent of alteration as a function ofthermal treatment in the ‘B-EFPRA’ set of MBM standards. Theseresults suggest that these particular standards may not be as usefulfor comparative analyses as first thought, in particular at the low-est temperature, with pig and sheep MBM displaying much higherthan expected levels of damage relative to those treated to highertemperatures. Indeed the D/L values being sufficiently high to im-ply that, at the higher temperatures at least, the ability to extractauthentic DNA would seem unlikely (Poinar, Hoss, Bada, & Paabo,1996; Poinar & Stankiewicz, 1999) unless this proposal for screen-ing bone samples at such D/L values is incorrect (Collins et al.,2009).
The racemization results indicate that the applications of aspar-tic acid racemization to the measure of heat-induced degradationcan be potentially useful to establish food processing history inMBM, has already been reported by other authors for processedfoods (Liardon & Hurrel, 1983).
AAR analysis suggests that only cattle and chicken MBM displaytemperature dependent trends. Curiously cattle MBM proteins aremore racemised than the chicken MBM proteins. Although unex-pected as chicken collagen (I) is much more soluble than cattle col-lagen (I) due to a lower concentration in cross-links (Gerstenfeldet al., 1994), perhaps because of this solubility more of the race-mised collagen is being extracted from the MBM during the ren-dering process. However, the degradation could also beinfluenced by the relative ages of the livestock being slaughtered,i.e., mature poultry vs. immature cattle. Miller, Tatum, Cross, Bowl-ing, and Clayton (1983) reported increased percentages of soluble(muscle) collagen with the feeding of high-energy diets to maturecattle. This is because during the resulting periods of rapid growth,the rate of protein synthesis is elevated, which results in an in-creased proportion of newly synthesised collagen, resulting in lessstable collagen fibres with higher solubility (Li, Agrawal, & Wang,2003).
4.2. Protein survival
Osteocalcin was an ideal target in archaeological studies for thefirst forays into protein mass spectrometry due to its small size(<50 residues), abundance and relative ease of extraction(Nielsen-Marsh et al., 2005; Ostrom et al., 2000, 2006). As a resultit has recently been proposed as a means for screening MBM(Balizs et al., 2011). However, despite earlier expectations, recentinvestigations comparing the extent of OC survival in comparisonto other measures of bone preservation, such as the extent of his-tological alteration, crystallinity change and reduction in collagenyields (Smith et al., 2005) or DNA (Buckley et al., 2008) were notpromising.
Our current attempts to isolate OC using more in depth LC–MStechniques following several clean-up protocols also indicate thatit is not the most appropriate source of species biomarkers inMBM. In the case of chicken, which displayed the clearest patternof treatment dependent alteration (Figs 2 and 3), an intact OCM+H+ peak was only found in OC treated at the lowest temperature(133 �C), and despite several purification steps was detected in anyof the higher temperature rendered samples, a finding similar tothat reported by Balizs et al. (2011) for cattle. Despite the attemptsto remove gelatine by ultrafiltration and further separation usingHPLC, OC was not observed in any of the samples rendered at tem-peratures higher than 133 �C; probably because it is thermally de-graded, or it is swamped by the mass of collagen peptides.
The failure to observe the OC M+H+ in the sedimented MBMfrom the lowest temperature treatment is probably linked to thealteration in bone mineral apatite observed by SAXS. OC does notpersist as well in archaeological bone as collagen and its survivalis apparently dependent upon the integrity of the mineral struc-ture (Smith et al., 2005) contra (Nielsen-Marsh et al., 2005).
The possible presence of the carboxy-terminal fragment of OC(as shown by the LC–MS analysis of the samples rendered at 137,141 and 145 �C) if confirmed, would be able to differentiate pigfrom chicken and ruminant, but not between the relevant rumi-nants, such as sheep and cattle. The Mascot search results for theMS/MS data unexpectedly showed no confident matches to colla-gen hydrolysis products because the collagen was retained by theultra-filter and the C18 extraction was optimised for OC.
The only peptide matched in all four samples was L-lactatedehydrogenase (ESM4) an enzyme produced in elevated concen-trations in the blood when such tissues are injured, but the singlepeptide matched is highly conserved and not suitable for speciesidentification purposes. The predominately collagenous ‘acid-insoluble’ fraction of bone association also contains non-collage-nous bone proteins and serum proteins (including A2HS andalbumin). Of these, the recovery of OC is less surprising as it is
M. Buckley et al. / Food Chemistry 134 (2012) 1267–1278 1277
known to bind strongly to collagen (Prigodich & Vesely, 1997).Some of these NCPs have greater amounts of inter-species se-quence variation than collagen, e.g., the albumin peptides identi-fied are specific to cattle, whereas the actin peptides matched areso highly conserved that they are found in at least 25 species rang-ing from mammals to fish (Table 4). However these proteins werenot consistently recovered; for example chicken was less rich inNCPs than mammalian extracts, having only a single identificationof a serum protein (apolipoprotein) and haemoglobin.
The amino acid compositions of both raw MBM and sedimentedMBM are similar and ‘collagen-like’ (ESM3; see Elster, Gil-Av, &Weiner, 1991), although principal component analyses of individ-ual amino acid concentrations (Fig. 1) reveal some differences.Only a small weight fraction of mature mammalian collagenoustissue is soluble, but this fraction is increased by mechanical stress(Collins & Galley, 1998). Insoluble non-mineralised collagen can beconverted into gelatin by heating at 60–70 �C but temperatures aremuch higher 155 �C (Kronick & Cooke, 1996) when mineral has in-ter-grown into the fibrils Nudelman et al., 2010.
The LC–MS data of raw and sedimented MBM also indicate thatcollagen is the dominant protein surviving thermal treatment; thesubtle differences shown in Fig. 1 could be due to differences in theactual NCPs present and/or differences in the decomposition prod-ucts remaining. Both the raw and sedimented MBM also indicatedthe presence of muscle proteins (actin, myosin, myoglobin, tropo-nin, and tropomyosin), and blood proteins (albumin and haemo-globin) although the majority of these (with the exception ofalbumin) are highly conserved. The chicken samples, both unsedi-mented MBM and sedimented MBM, contained much largeramounts of myosin than any other non-collagenous protein, whichcould explain the off-set in the chicken samples from the mamma-lian samples plotted on the principal component analysis (Fig. 1),where the non-collagenous component of untreated chicken ‘colla-gen’ is even more distinct (Table 1).
5. Conclusion
The need for an investigative study of any set of standards thatare to be used for method development is made clear by the flawsobserved within the ‘B-EFPRA’ set of MBM standards; in particularthe potential contamination of lower temperature (133 and 137 �C)rendered MBM with higher temperature material. One alternativeexplanation is that the heat generated during the grinding activityafter the pressure/heating stage is having a differential affect onthe similar sised sheep and pig bone material than on the muchlarger cattle remains, i.e., the grinding process will likely have beendesigned to cope with the most robust skeletal material, wheregrinding of smaller material provides excess energy. The lack ofpost-treatment (grinding) effects on the avian material could spec-ulatively be due to the presence of feathers, etc. Whatever thecause, the under-estimated levels of protein degradation observedin two of the sixteen samples may have influenced the successes orfailures of new methodologies created within the STRATFEED pro-ject using this sample set, particularly because most experimentswere carried out at the lowest rendering temperature (133 �C).
These results have shown that, despite various attempts toisolate it from other proteinaceous material, intact OC cannot beidentified by protein mass spectrometry for samples from high-temperature rendered (>133 �C) MBM using the same methods aspreviously described for isolating archaeological OC a findingconsistent with a recent report by Balizs et al. (2011). Matches tosome peptides of potentially thermostable proteins that arepresent in the OC fractions were made with confident identifica-tions, such as l-lactate dehydrogenase and myosin in samplesrendered at 137 and 141 �C respectively. However, none of theseidentified proteins exhibit sufficient amounts of variation to be
able to distinguish between species of interest to the food and agri-cultural industry. The only peptide observed in the osteocalcin iso-lation methods that may offer distinction between at least theruminants (cattle and sheep) and pig is the carboxy-terminal pep-tide of OC, but this was not a confident match using Mascot. How-ever, this peptide could not distinguish between chicken andruminant OC and is also highly conserved amongst other mamma-lian species.
The dominance of collagen (I) and the similarities of both theunsedimented and the sedimented samples of MBM material areindicative of bone being the dominant tissue present (the presenceof skin in not supported by any other identifications, i.e., no elastin,few type III collagen peptides). However, the presence of highly-racemised collagen in the ‘acid-insoluble’ fractions indicates exten-sive denaturation.
Although the potential information gained is vast, the obviouslimitations of the LC–MS technique are the extent of protein se-quences in the databases, for example there are only five completeprotein sequences for both chains of collagen (I). As well as prob-lems inherent in analysing species without a known sequence(where only two of the four MBM sample species have publishedprotein sequences) there are also problems with reproducibilityof the technique in application to bone samples. Clear differenceswere also shown to exist between mammalian and avian bonespecimens, which could affect how avian peptides mixed intomammalian feeds are analysed and observed.
Collagen (I) was shown to be the dominant protein in the high-est temperature rendered MBM sample, and hence the most usefulfor identification. A number of peptides found in MALDI-TOF thatcan be used to discriminate collagens from not only cattle sheepand pig (Buckley et al., 2009) but also that of sheep and goat(Buckley, Whitcher Kansa, Howard, Thomas-Oates, et al., 2010)has been reported. Consequently collagen appears to be the mostfavourable target for identification in animal feed, able to identifyindividual bone chips using a 96 plate format (Richter et al., 2011)and analysed by MALDI-TOF-MS. Most of the other proteins iden-tified as surviving the rendering process were highly conserved(myosin, troponin, etc.) with the only exception being serumalbumin, a potential source for further species biomarkers.
Acknowledgements
We thank Steve Woodgate (Prosper de Mulder (PDM)) for accessto samples, the AHVLA for carrying out the sedimentation of theMBM and the Centre of Excellence in Mass Spectrometry (Universityof York) and the North East Amino Acid Racemization facilities(BioArCh, University of York) for access to instrumentation. This re-search was made possible by funding from the NERC (Grant no:NERD/S/2003/00678) and the support of the PDM Group.
Appendix A. Supplementary data
Supplementary data associated with this article can be found, inthe online version, at http://dx.doi.org/10.1016/j.foodchem.2012.02.167.
References
Balizs, G., Weise, C., Rozycki, C., Opialla, T., Sawada, S., Zagon, J., et al. (2011).Determination of osteocalcin in meat and bone meal of bovine and porcineorigin using matrix-assisted laser desorption ionization/time-of-flight massspectrometry and high-resolution hybrid mass spectrometry. Analytica ChimicaActa, 693, 89–99.
Buckley, M., Collins, M., Thomas-Oates, J., & Wilson, J. C. (2009). Speciesidentification by analysis of bone collagen using matrix-assisted laserdesorption/ionisation time-of-flight mass spectrometry. Rapid Communicationsin Mass Spectrometry, 23, 3843–3854.
1278 M. Buckley et al. / Food Chemistry 134 (2012) 1267–1278
Buckley, M., Anderung, C., Penkman, K., Raney, B., Götherström, A., Thomas-Oates, J.& Collins, M. J. (2008). Comparing the survival of osteocalcin and mtDNA inarchaeological bone from four European sites. Journal of Archaeological Science,35, 1756e1764.
Buckley, M., Whitcher Kansa, S., Howard, S., Campbell, S., Thomas-Oates, J., et al.(2010). Distinguishing between archaeological sheep and goat bones using asingle collagen peptide. Journal of Archaeological Science, 37, 13–20.
Collins, M. J., & Galley, P. (1998). Towards an optimal method of archaeologicalcollagen extraction; the influence of pH and grinding. Ancient Biomolecules, 2,209–222.
Collins, M. J., Penkman, K. E. H., Rohland, N., Shapiro, B., Dobberstein, R. C., Ritz-Timme, S., et al. (2009). Is amino acid racemization a useful tool for screeningfor ancient DNA in bone? Proceedings of the Royal Society B: Biological Sciences,276, 2971–2977.
Curry, G. B. (1988). Amino acids and proteins from fossils. In: Broadhead, T.W. (ed.)Molecular Evolution and the Fossil Record. Short Courses in Palaeontology (1).The Palaeontology Society, Knoxville, Tennessee, USA, pp. 20–33.
Elster, H., Gil-Av, E., & Weiner, S. (1991). Amino acid racemization of fossil bone.Journal of Archaeological Science, 18, 605–617.
Etok, S. E., Valsami-Jones, E., Wess, T. J., Hiller, J. C., Maxwell, C. A., Rogers, K. D., et al.(2007). Structural and chemical changes of thermally treated bone. Journal ofMaterials Science, 42, 9807–9816.
Fratzl, P., Paris, O., Klaushofer, K., & Landis, W. J. (1996). Bone mineralization in anosteogenesis imperfecta mouse model studied by small angle x-ray scattering.Journal of Clinical Investigation, 97, 396–402.
Garrido-Varo, A., Perez-Marin, D. C., Guerrero, J. E., Gomez-Cabrera, A., Von Holst, C.,Murray, I., et al. (2005). Construction of the Stratfeed sample bank andpreparation of sample sets. In P. Dardenne (Ed.), Stratfeed: strategies andmethods to detect and quantify mammalian tissues in feedingstuffs. EuropeanCommunities: Luxembourg.
Gerstenfeld, L., Feng, M., Gotoh, T., & Glimcher, M. (1994). Selective extractability ofnoncollagenous proteins from chicken bone. Orthopedic Surgical Forum, 55,230–235.
Hill, R.L. (1965). Hydrolysis of proteins. Advances in Protein Chemistry 20,37e107.
Hiller, J. C., Collins, M. J., Chamberlain, A. T., & Wess, T. J. (2004). Small-angle X-rayscattering: a high-throughput technique for investigating archaeological bonepreservation. Journal of Archaeological Science, 31, 1349–1359.
Chen, F. C., Hsieh, Y. H. P., & Bridgman, R. C. (1998). Monoclonal antibodies toporcine thermal-stable muscle protein for detection of pork in raw and cookedmeats. Journal of Food Sciences, 63, 201–205.
Kaufman, D. S., & Manley, W. F. (1998). A new procedure for determiningenantiomeric DL amino acid ratios in fossils using reverse phase liquidchromatography. Quaternary Science Reviews, 17(11), 987–1000.
Kim, S. H., Huang, T. S., Seymour, T. A., Wei, C. I., Kempf, S. C., Bridgman, C. R., et al.(2004). Identification of a biomarker for the detection of prohibited meat andbone meal residues in animal feed. Journal of Food Science, 69, C739–C745.
Kim, S. H., Huang, T. S., Seymour, T. A., Wei, C. I., Kempf, S. C., Bridgman, C. R., et al.(2005). Development of immunoassay for detection of meat and bone meal inanimal feed. Journal of Food Protection, 68, 1860–1865.
Kronick, P. L., & Cooke, P. (1996). Thermal stabilization of collagen fibers bycalcification. Connective Tissue Research, 33, 275–282.
Li, X., Agrawal, C. M., & Wang, X. (2003). Age dependence of in situ termostability ofcollagen in human bone. Calcified Tissue International, 72, 513–518.
Liardon, R., & Hurrel, R. F. (1983). Amino acid racemization in heated and alkali-treated proteins. Journal of Agricultural Food Chemistry, 31, 432–437.
Manning, D., Collins, M. J., Wess, T., Woodgate, S. L., & Valsami-Jones, E. (2009). Anevaluation of the reactivity of synthetic and natural apatites in the presence ofaqueous metals. Science of the Total Environment, 407, 2953–2965.
Miller, R. K., Tatum, J. D., Cross, H. R., Bowling, R. A., & Clayton, R. P. (1983). Effects ofcarcass maturity on collagen solubility and palatability of beef from grain-finished steers. Journal of Food Science, 48, 484–486.
Muldoon, M. T., Onisk, D. V., Brown, M. C., & Stave, J. W. (2004). Targets and methodsfor the detection of processed animal proteins in animal feedstuffs. InternationalJournal of Food Science and Technology, 39, 851–861.
Nesvizhskii, A. I., & Aebersold, R. (2005). Interpretation of shotgun proteomic datathe protein inference problem. Molecular & Cellular Proteomics, 4, 1419–1440.
Nielsen-Marsh, C. M. (2002). Biomolecules in fossil remains. The Biochemist, 12–14.Nielsen-Marsh, C. M., Richards, M. P., Hauschka, P. V., Thomas-Oates, J. E., Trinkaus,
E., Pettitt, P. B., et al. (2005). Osteocalcin protein sequences of Neanderthals andmodern primates. Proceedings of the National Academy of Sciences, 102,4409–4413.
Nudelman, F., Pieterse, K., George, A., Bomans, P. H. H., Friedrich, H., Brylka, L. J.,et al. (2010). The role of collagen in bone apatite formation in the presence ofhydroxyapatite nucleation inhibitors. Nature Materials, 9, 1004–1008.
Ocan~a, M. F., Neubert, H., Przyborowska, A., Parker, R., Bramley, P., Halket, J., et al.(2004). BSE Control: Detection of gelatine-derived peptides in animal feed bymass spectrometry. Analyst, 129, 111–115.
Ostrom, P. H., Gandhi, H., Strahler, J. R., Walker, A. K., Andrews, P. C., Leykam, J., et al.(2006). Unraveling the sequence and structure of the protein osteocalcin from a42 ka fossil horse. Geochimica et Cosmochimica Acta, 70, 2034–2044.
Ostrom, P., Schall, M., Gandhi, H., Shen, T., Hauschka, P., Strahler, J., et al. (2000).New strategies for characterizing ancient proteins using matrix-assisted laserdesorption ionization mass spectrometry. Geochimica et Cosmochimica Acta, 64,1043–1050.
Poinar, H. N., Hoss, M., Bada, J. L., & Paabo, S. (1996). Amino acid racemization andthe preservation of ancient DNA. Science, 272, 864–866.
Poinar, H. N., & Stankiewicz, B. A. (1999). Protein preservation and DNA retrievalfrom ancient tissues. Proceedings of the National Academy of Sciences, 96,8426–8431.
Prigodich, R. V., & Vesely, M. R. (1997). Characterization of the complex betweenbovine osteocalcin and type I collagen. Archives of Biochemistry and Biophysics,345, 339–341.
Richter, K. K., Wilson, J., Jones, A. K. G., Buckley, M., Van Doorn, N., & Collins, M. J.(2011). Fish ‘n chips: ZooMS peptide mass fingerprinting in a 96 well plateformat to identify fish bone fragments. Journal of Archaeological Science, 38(7),1502–1510.
Smith, C. I., Craig, O. E., Prigodich, R. V., Nielsen-Marsh, C. M., Jans, M. M. E., Vermeer,C., et al. (2005). Diagenesis and survival of osteocalcin in archaeological bone.Journal of Archaeological Science, 32, 105–113.
Van Duin, A. C. T., & Collins, M. J. (1998). The effects of conformational constraintson aspartic acid racemization. Organic Geochemistry, 29, 1227–1232.
Weiner, S., Kustanovich, Z., Gil-Av, E., & Traub, W. (1980). Dead Sea scrollsparchments: unfolding of the collagen molecules and racemization of asparticacid. Nature, 287, 820–823.
Wess, T., Alberts, I., Hiller, J., Drakopoulos, M., Chamberlain, A. T., & Collins, M.(2002). Microfocus small angle X-ray scattering reveals structural features inarchaeological bone samples: Detection of changes in bone mineral habit andsize. Calcified Tissue International, 70, 103–110.
Zizak, I., Roschger, P., Paris, O., Misof, B. M., Berzlanovich, A., Bernstorff, S., et al.(2003). Characteristics of mineral particles in the human bone/cartilageinterface. Journal of Structural Biology, 141, 208–217.
Related Documents